Federated Municipal High Yield Advantage Fund
Established 1987
A Portfolio of Federated Municipal Securities Income Trust
ANNUAL SHAREHOLDER REPORT
August 31, 2010
Class A Shares
Class B Shares
Class C Shares
Class F Shares
FINANCIAL HIGHLIGHTS
SHAREHOLDER EXPENSE EXAMPLE
MANAGEMENT'S DISCUSSION OF FUND PERFORMANCE
PORTFOLIO OF INVESTMENTS SUMMARY TABLE
PORTFOLIO OF INVESTMENTS
STATEMENT OF ASSETS AND LIABILITIES
STATEMENT OF OPERATIONS
STATEMENT OF CHANGES IN NET ASSETS
NOTES TO FINANCIAL STATEMENTS
REPORT OF INDEPENDENT REGISTERED PUBLIC ACCOUNTING FIRM
BOARD OF TRUSTEES AND TRUST OFFICERS
EVALUATION AND APPROVAL OF ADVISORY CONTRACT
VOTING PROXIES ON FUND PORTFOLIO SECURITIES
QUARTERLY PORTFOLIO SCHEDULE

Financial Highlights - Class A Shares1
(For a Share Outstanding Throughout Each Period)
| Year Ended August 31 | 20102 | 2009 | 2008 | 2007 | 2006 |
| Net Asset Value, Beginning of Period | $7.76 | $8.72 | $9.58 | $10.02 | $10.05 |
| Income From Investment Operations: |
| Net investment income | 0.49 | 0.49 | 0.50 | 0.51 | 0.50 |
| Net realized and unrealized gain (loss) on investments, futures contracts and swap contracts | 0.83 | (0.96) | (0.86) | (0.45) | (0.04) |
| TOTAL FROM INVESTMENT OPERATIONS | 1.32 | (0.47) | (0.36) | 0.06 | 0.46 |
| Less Distributions: |
| Distributions from net investment income | (0.49) | (0.49) | (0.50) | (0.50) | (0.49) |
| Net Asset Value, End of Period | $8.59 | $7.76 | $8.72 | $9.58 | $10.02 |
| Total Return3 | 17.42% | (4.87)% | (3.86)% | 0.48% | 4.80% |
| Ratios to Average Net Assets: |
| Net expenses | 0.77% | 0.79%4 | 0.81%4,5 | 1.15%5 | 1.26%5 |
| Net investment income | 5.93% | 6.65% | 5.50% | 5.05% | 4.98% |
| Expense waiver/reimbursement6 | 0.28% | 0.29% | 0.28% | 0.29% | 0.19% |
| Supplemental Data: |
| Net assets, end of period (000 omitted) | $229,217 | $180,422 | $208,302 | $231,817 | $235,204 |
| Portfolio turnover | 18% | 24% | 34% | 47% | 20% |
| 1 | The Fund is the successor to the Federated Municipal High Yield Advantage Fund, Inc. (“Predecessor Fund”). The Predecessor Fund was reorganized into the Fund, a series of Federated Municipal Securities Income Trust, as of the close of business on November 10, 2006. Please see the Fund's Prospectus and Statement of Additional Information for further information regarding the reorganization. |
| 2 | Beginning with the year ended August 31, 2010, the Fund was audited by KPMG LLP. The previous years were audited by another independent registered public accounting firm. |
| 3 | Based on net asset value, which does not reflect the sales charge, redemption fee or contingent deferred sales charge, if applicable. |
| 4 | The net expense ratio is calculated without reduction for expense offset arrangements. The net expense ratios are 0.79% and 0.81%, after taking into account these expense reductions for the years ended August 31, 2009 and 2008, respectively. |
| 5 | Includes interest and trust expenses related to the Fund's participation in certain inverse floater structures of 0.03%, 0.37% and 0.38% for the years ended August 31, 2008, 2007 and 2006, respectively. |
| 6 | This expense decrease is reflected in both the net expense and net investment income ratios shown above. |
See Notes which are an integral part of the Financial Statements
Annual Shareholder ReportFinancial Highlights - Class B Shares1
(For a Share Outstanding Throughout Each Period)
| Year Ended August 31 | 20102 | 2009 | 2008 | 2007 | 2006 |
| Net Asset Value, Beginning of Period | $7.75 | $8.71 | $9.57 | $10.01 | $10.05 |
| Income From Investment Operations: |
| Net investment income | 0.44 | 0.45 | 0.44 | 0.43 | 0.42 |
| Net realized and unrealized gain (loss) on investments, futures contracts and swap contracts | 0.82 | (0.97) | (0.87) | (0.45) | (0.04) |
| TOTAL FROM INVESTMENT OPERATIONS | 1.26 | (0.52) | (0.43) | (0.02) | 0.38 |
| Less Distributions: |
| Distributions from net investment income | (0.42) | (0.44) | (0.43) | (0.42) | (0.42) |
| Net Asset Value, End of Period | $8.59 | $7.75 | $8.71 | $9.57 | $10.01 |
| Total Return3 | 16.69% | (5.59)% | (4.59)% | (0.27)% | 3.91% |
| Ratios to Average Net Assets: |
| Net expenses | 1.53% | 1.54%4 | 1.56%4,5 | 1.91%5 | 2.02%5 |
| Net investment income | 5.19% | 5.90% | 4.74% | 4.28% | 4.23% |
| Expense waiver/reimbursement6 | 0.28% | 0.29% | 0.28% | 0.29% | 0.19% |
| Supplemental Data: |
| Net assets, end of period (000 omitted) | $36,952 | $41,094 | $58,798 | $80,957 | $106,124 |
| Portfolio turnover | 18% | 24% | 34% | 47% | 20% |
| 1 | The Fund is the successor to the Federated Municipal High Yield Advantage Fund, Inc. (“Predecessor Fund”). The Predecessor Fund was reorganized into the Fund, a series of Federated Municipal Securities Income Trust, as of the close of business on November 10, 2006. Please see the Fund's Prospectus and Statement of Additional Information for further information regarding the reorganization. |
| 2 | Beginning with the year ended August 31, 2010, the Fund was audited by KPMG LLP. The previous years were audited by another independent registered public accounting firm. |
| 3 | Based on net asset value, which does not reflect the sales charge, redemption fee or contingent deferred sales charge, if applicable. |
| 4 | The net expense ratio is calculated without reduction for expense offset arrangements. The net expense ratios are 1.54% and 1.56%, after taking into account these expense reductions for the years ended August 31, 2009 and 2008, respectively. |
| 5 | Includes interest and trust expenses related to the Fund's participation in certain inverse floater structures of 0.03%, 0.37% and 0.38% for the years ended August 31, 2008, 2007 and 2006, respectively. |
| 6 | This expense decrease is reflected in both the net expense and net investment income ratios shown above. |
See Notes which are an integral part of the Financial Statements
Annual Shareholder ReportFinancial Highlights - Class C Shares1
(For a Share Outstanding Throughout Each Period)
| Year Ended August 31 | 20102 | 2009 | 2008 | 2007 | 2006 |
| Net Asset Value, Beginning of Period | $7.75 | $8.72 | $9.57 | $10.01 | $10.05 |
| Income From Investment Operations: |
| Net investment income | 0.43 | 0.44 | 0.43 | 0.43 | 0.42 |
| Net realized and unrealized gain (loss) on investments, futures contracts and swap contracts | 0.83 | (0.97) | (0.85) | (0.45) | (0.04) |
| TOTAL FROM INVESTMENT OPERATIONS | 1.26 | (0.53) | (0.42) | (0.02) | 0.38 |
| Less Distributions: |
| Distributions from net investment income | (0.42) | (0.44) | (0.43) | (0.42) | (0.42) |
| Net Asset Value, End of Period | $8.59 | $7.75 | $8.72 | $9.57 | $10.01 |
| Total Return3 | 16.69% | (5.69)% | (4.48)% | (0.27)% | 3.91% |
| Ratios to Average Net Assets: |
| Net expenses | 1.53% | 1.54%4 | 1.56%4,5 | 1.90%5 | 2.01%5 |
| Net investment income | 5.18% | 5.91% | 4.75% | 4.30% | 4.23% |
| Expense waiver/reimbursement6 | 0.28% | 0.29% | 0.28% | 0.29% | 0.19% |
| Supplemental Data: |
| Net assets, end of period (000 omitted) | $52,785 | $40,630 | $48,495 | $56,448 | $52,875 |
| Portfolio turnover | 18% | 24% | 34% | 47% | 20% |
| 1 | The Fund is the successor to the Federated Municipal High Yield Advantage Fund, Inc. (“Predecessor Fund”). The Predecessor Fund was reorganized into the Fund, a series of Federated Municipal Securities Income Trust, as of the close of business on November 10, 2006. Please see the Fund's Prospectus and Statement of Additional Information for further information regarding the reorganization. |
| 2 | Beginning with the year ended August 31, 2010, the Fund was audited by KPMG LLP. The previous years were audited by another independent registered public accounting firm. |
| 3 | Based on net asset value, which does not reflect the sales charge, redemption fee or contingent deferred sales charge, if applicable. |
| 4 | The net expense ratio is calculated without reduction for expense offset arrangements. The net expense ratios are 1.54% and 1.56%, after taking into account these expense reductions for the years ended August 31, 2009 and 2008, respectively. |
| 5 | Includes interest and trust expenses related to the Fund's participation in certain inverse floater structures of 0.03%, 0.37% and 0.38% for the years ended August 31, 2008, 2007and 2006, respectively. |
| 6 | This expense decrease is reflected in both the net expense and net investment income ratios shown above. |
See Notes which are an integral part of the Financial Statements
Annual Shareholder ReportFinancial Highlights - Class F Shares1
(For a Share Outstanding Throughout Each Period)
| Year Ended August 31 | 20102 | 2009 | 2008 | 2007 | 2006 |
| Net Asset Value, Beginning of Period | $7.76 | $8.72 | $9.58 | $10.02 | $10.05 |
| Income From Investment Operations: |
| Net investment income | 0.49 | 0.49 | 0.50 | 0.51 | 0.50 |
| Net realized and unrealized gain (loss) on investments, futures contracts and swap contracts | 0.83 | (0.96) | (0.86) | (0.45) | (0.04) |
| TOTAL FROM INVESTMENT OPERATIONS | 1.32 | (0.47) | (0.36) | 0.06 | 0.46 |
| Less Distributions: |
| Distributions from net investment income | (0.49) | (0.49) | (0.50) | (0.50) | (0.49) |
| Net Asset Value, End of Period | $8.59 | $7.76 | $8.72 | $9.58 | $10.02 |
| Total Return3 | 17.42% | (4.87)% | (3.86)% | 0.48% | 4.80% |
| Ratios to Average Net Assets: |
| Net expenses | 0.77% | 0.79%4 | 0.81%4,5 | 1.15%5 | 1.26%5 |
| Net investment income | 5.93% | 6.66% | 5.50% | 5.05% | 4.98% |
| Expense waiver/reimbursement6 | 0.28% | 0.29% | 0.28% | 0.29% | 0.19% |
| Supplemental Data: |
| Net assets, end of period (000 omitted) | $200,948 | $162,315 | $190,686 | $208,724 | $186,648 |
| Portfolio turnover | 18% | 24% | 34% | 47% | 20% |
| 1 | The Fund is the successor to the Federated Municipal High Yield Advantage Fund, Inc. (“Predecessor Fund”). The Predecessor Fund was reorganized into the Fund, a series of Federated Municipal Securities Income Trust, as of the close of business on November 10, 2006. Please see the Fund's Prospectus and Statement of Additional Information for further information regarding the reorganization. |
| 2 | Beginning with the year ended August 31, 2010, the Fund was audited by KPMG LLP. The previous years were audited by another independent registered public accounting firm. |
| 3 | Based on net asset value, which does not reflect the sales charge, redemption fee or contingent deferred sales charge, if applicable. |
| 4 | The net expense ratio is calculated without reduction for expense offset arrangements. The net expense ratios are 0.79% and 0.81%, after taking into account these expense reductions for the years ended August 31, 2009 and 2008, respectively. |
| 5 | Includes interest and trust expenses related to the Fund's participation in certain inverse floater structures of 0.03%, 0.37% and 0.38% for the years ended August 31, 2008, 2007 and 2006, respectively. |
| 6 | This expense decrease is reflected in both the net expense and net investment income ratios shown above. |
See Notes which are an integral part of the Financial Statements
Annual Shareholder ReportShareholder Expense Example (unaudited)
As a shareholder of the Fund, you incur two types of costs: (1) transaction costs, including sales charges (loads) on purchase or redemption payments; and (2) ongoing costs, including management fees and to the extent applicable, distribution (12b-1) fees and/or shareholder services fees and other Fund expenses. This Example is intended to help you to understand your ongoing costs (in dollars) of investing in the Fund and to compare these costs with the ongoing costs of investing in other mutual funds. It is based on an investment of $1,000 invested at the beginning of the period and held for the entire period from March 1, 2010 to August 31, 2010.
The first section of the table below provides information about actual account values and actual expenses. You may use the information in this section, together with the amount you invested, to estimate the expenses that you incurred over the period. Simply divide your account value by $1,000 (for example, an $8,600 account value divided by $1,000 = 8.6), then multiply the result by the number in the first section under the heading entitled “Expenses Paid During Period” to estimate the expenses attributable to your investment during this period.
HYPOTHETICAL EXAMPLE FOR COMPARISON PURPOSES
The second section of the table below provides information about hypothetical account values and hypothetical expenses based on the Fund's actual expense ratio and an assumed rate of return of 5% per year before expenses, which is not the Fund's actual return. Thus, you should not use the hypothetical account values and expenses to estimate the actual ending account balance or your expenses for the period. Rather, these figures are required to be provided to enable you to compare the ongoing costs of investing in the Fund with other funds. To do so, compare this 5% hypothetical example with the 5% hypothetical examples that appear in the shareholder reports of the other funds.
Annual Shareholder Report| Beginning Account Value 3/1/2010 | Ending Account Value 8/31/2010 | Expenses Paid During Period1 |
| Actual: |
| Class A Shares | $1,000 | $1,069.40 | $4.02 |
| Class B Shares | $1,000 | $1,065.40 | $7.91 |
| Class C Shares | $1,000 | $1,065.30 | $7.91 |
| Class F Shares | $1,000 | $1,069.40 | $4.02 |
| Hypothetical (assuming a 5% return before expenses): |
| Class A Shares | $1,000 | $1,021.32 | $3.92 |
| Class B Shares | $1,000 | $1,017.54 | $7.73 |
| Class C Shares | $1,000 | $1,017.54 | $7.73 |
| Class F Shares | $1,000 | $1,021.32 | $3.92 |
| 1 | Expenses are equal to the Fund's annualized net expense ratios, multiplied by the average account value over the period, multiplied by 184/365 (to reflect the one-half-year period). The annualized net expense ratios are as follows: |
| Class A Shares | 0.77% |
| Class B Shares | 1.52% |
| Class C Shares | 1.52% |
| Class F Shares | 0.77% |
Performance data quoted represents past performance which is no guarantee of future results. Investment return and principal value will fluctuate so that an investor's shares, when redeemed, may be worth more or less than their original cost. Mutual fund performance changes over time and current performance may be lower or higher than what is stated. For current to the most recent month-end performance and after-tax returns, visit FederatedInvestors.com or call 1-800-341-7400.
Management's Discussion of Fund Performance (unaudited)
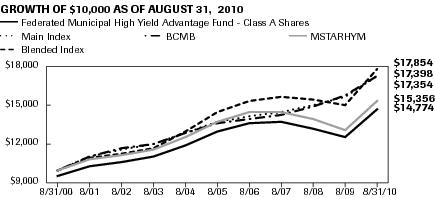
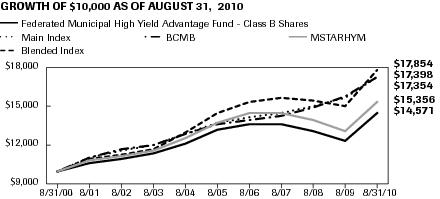
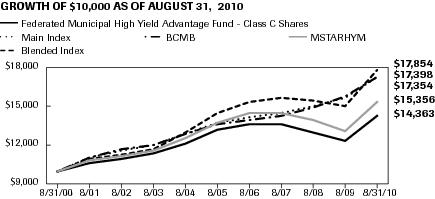
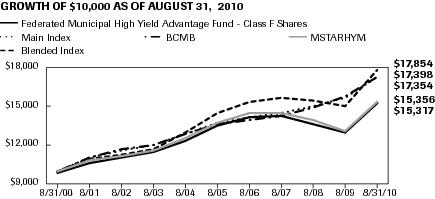
The Fund's total returns, based on net asset value, for the 12-month reporting period ended August 31, 2010 were 17.42% for Class A Shares and Class F Shares, and 16.69% for Class B Shares and Class C Shares.1The total return of the S&P/Investortools Municipal Bond Index (Main Index),2 a broad-based securities market index, was 10.19% and the total return for the Morningstar High Yield Municipal Funds Category (MSTARHYM),3 a competitive benchmark for the Fund, was 17.12% during the same period. At the end of the reporting period, the Fund's 12-month yield for Class A Shares was 5.66% versus 5.11% for the MSTARHYM.
| 1 | As of the close of business on November 10, 2006, the Federated Municipal High Yield Advantage Fund, Inc. (“Predecessor Fund”) was reorganized into the Fund. The Fund is a series of Federated Municipal Securities Income Trust, and is the successor to the Predecessor Fund. Prior to the reorganization, the Fund had no investment operations. Performance, expense and other information presented in the Annual Shareholder Report for periods prior to the close of business on November 10, 2006, refers to performance, expenses and other information of the Predecessor Fund, which are the performance, expenses, and other information of the Fund for the relevant period as a result of the reorganization. |
| 2 | The Fund's investment advsier has elected to change the Fund's broad-based securities market index to the Main Index from the Barclays Capital Municipal Bond Index (BCMB). The Main Index is more representative of the securities in which the Fund invests. The Main Index is a broad, comprehensive, market value-weighted index following approximately 55,000 bond issues that are exempt from U.S. federal income taxes or subject to the alternative minimum tax (AMT). Eligibility criteria for inclusion in the Main Index include, but are not limited to: the bond issuer must be a state (including the Commonwealth of Puerto Rico and U.S. territories) or a local government or agency where interest on the bond is exempt from U.S. federal income taxes or subject to the AMT; the bond must be held by a mutual fund for which Standard & Poor's Securities Evaluations, Inc. provides prices; it must be denominated in U.S. dollars and have a minimum par amount of $2 million; and the bond must have a minimum term to maturity and/or call date greater than or equal to one calendar month. The Main Index is rebalanced monthly. The total return of the BCMB was 9.78% for the 12-month reporting period. The BCMB is an unmanaged market value-weighted index for the long-term, tax-exempt bond market. To be included in the BCMB, bonds must have a minimum credit rating of Baa, an outstanding par value of at least $7 million and be issued as part of a transaction of at least $75 million. The bonds must be fixed rate, have an issue date after December 31, 1990, and must be at least one year from their maturity date. The BCMB includes both zero coupon bonds and bond subject to the AMT. Neither the Main Index nor BCMB are adjusted to reflect sales charges, expenses and other fees that the Securities and Exchange Commission (SEC) requires to be reflected in the Fund's performance. It is not possible to invest directly in an index. |
| 3 | Morningstar figures represent the average of the total returns reported by all the mutual funds designated by Morningstar as falling into the respective category indicated. Funds designated within the MSTARHYM include those that invest at least 50% of assets in high-income municipal securities that are not rated or that are rated by a major agency such as Standard & Poor's or Moody's Investor Service at the level of BBB (considered part of the high yield universe within the municipal industry) and below. They do not reflect sales charges. |
The following discussion focuses on the performance of the Fund's Class A Shares. The 17.42% total return of the Class A Shares for the reporting period consisted of 6.72% of tax-exempt dividends and reinvestments and 10.70% of price appreciation in the net asset value of the shares.7
| 4 | Investment-grade securities are securities that are rated at least “BBB” or unrated securities of a comparable quality. Noninvestment-grade securities are securities that are not rated at least “BBB” or unrated securities of a comparable quality. Credit ratings are an indication of the risk that a security will default. They do not protect a security from credit risk. Lower-rated bonds typically offer higher yields to help compensate investors for the increased risk associated with them. Among these risks are lower creditworthiness, greater price volatility, more risk to principal and income than with higher-rated securities and increased possibilities of default. |
| 5 | Bond prices are sensitive to changes in interest rates and a rise in interest rates can cause a decline in their prices. |
| 6 | Duration is a measure of a security's price sensitivity to changes in interest rates. Securities with longer durations are more sensitive to changes in interest rates than securities with shorter durations. |
| 7 | Income may be subject to state and local taxes, and the AMT. |
During the 12-month reporting period, the pace of recovery in output and employment slowed with tight credit, modest income growth and lower housing wealth being major contributors to this economic environment. Yields on nominal Treasury coupon securities fell noticeably during the period, and Treasury auctions were generally well received. The pace of economic recovery was more modest than had been anticipated and inflation remained subdued. To help support economic recovery the Federal Reserve Board (the “Fed”) kept constant its holdings of securities at the current levels by reinvesting principal payments from agency debt and mortgage-backed securities in longer term Treasury securities and rolling over its holdings of Treasury debt as it matured. The Fed maintained the target range for the federal funds rate between 0.00% and 0.25% during the entire period.
The combined fiscal and monetary stimuli drove an impressive rebound in the valuation of risky assets. Tax-exempt municipal credit spreads declined significantly as the spread between 20 year BBB-rated and AAA-rated tax-exempt municipal bonds declined by 57 basis points during the reporting period. This extensive normalization of the tax-exempt municipal market from the market disruptions in 2008 resulted from several positive technical factors. Significant federal financial support programs for state governments were put in place to stimulate local economies and boost confidence. The Build America Bonds program reduced the supply of tax-exempt municipal bonds issued helping to create a shortage of tax-exempt bonds available in the market. Ongoing strong demand for yield from investors as money market rates remained very low, the expectations of higher marginal tax rates and strong mutual fund flows led to solid demand for tax-exempt debt. These factors helped to create the supply and demand imbalance that enabled the tax-exempt municipal market to recover and provide positive returns during the period.
The credit fundamentals of the tax-exempt municipal bond market have shown continued deterioration in such credit factors as pension funding requirements, real estate values and revenue growth.
Although credit remained relatively weak, tax-exempt municipal high yield bonds performed well during the period as liquidity returned to the market.
Annual Shareholder ReportDuring the 12-month reporting period, lower investment-grade and noninvestment-grade tax-exempt municipal debt outperformed due to tightening of credit spreads. This helped the Fund's performance because of the Fund's holdings in lower investment-grade, tax-exempt municipal bonds (bonds rated BBB or unrated bonds of comparable quality), and noninvestmentgrade, tax-exempt municipal bonds, which averaged nearly 73% of the Fund's portfolio. Over the course of the reporting period the Fund increased its allocation to BBB-rated and non-investment-grade bonds in order to take advantage of credit spreads which were wider than historic averages. The Fund's exposure to non-rated bonds decreased, as a number of non-rated pre-refunded bonds were sold; although these pre-refunded bonds were non-rated, they were actually high-quality bonds, so their sale benefitted the Fund.
Security Selection
On an historical basis, inverse floating rate securities typically have higher yields due to the leverage of the security. These securities, however, typically are more sensitive to changes in interest rates and credit spreads. Individual securities saw both positive and negative price movement for idiosyncratic reasons. As a result, the Fund's allocation to inverse floating rate securities during the 12-month reporting period had a positive contribution to the Fund's performance.
Maturity and Yield Curve
During the 12-month reporting period, the Fund primarily purchased securities on the longer end of the tax-exempt municipal bond yield curve (20-30 year maturity bonds), but also made selective purchases in the short and intermediate areas of the yield curve. The Fund's heavy position in bonds maturing in 15 years or more helped the Fund's absolute returns as interest rates fell along the yield curve and longer bonds outperformed shorter bonds.
Duration
As determined at the end of the 12-month reporting period, the Fund's dollar-weighted average duration was 7.70 years. Duration management remained a significant component of the Fund's investment strategy. The shorter a fund's duration is, relative to an index, the less its net asset value will react as interest rates change. As rates fell, the Fund's longer duration relative to the Main Index contributed to positive relative Fund performance.
Sector
During the 12-month reporting period, the Fund was overweight, as compared to the Main Index, in hospitals, senior care and industrial development bonds, all of which outperformed and helped the Fund's performance. In general, the Fund's allocation to riskier sectors contributed positively to its performance during the reporting period.
| 8 | Credit ratings pertain only to the securities in the portfolio and do not protect Fund shares against market risk. |
GROWTH OF A $10,000 INVESTMENT - CLASS A SHARES
The graph below illustrates the hypothetical investment of $10,0001 in Federated Municipal High Yield Advantage Fund2 (Class A Shares) (the “Fund”) from August 31, 2000 to August 31, 2010, compared to the S&P/Investortools Municipal Bond Index (Main Index),3 Barclays Capital Municipal Bond Index (BCMB),3 S&P/Investortools 25% A and Higher/25% BBB/50% High Yield, all 3-Year Plus Sub-Index, a custom blended index (Blended Index),3 and the Morningstar High Yield Municipal Funds Category Average (MSTARHYM).4
| Average Annual Total Returns5 for the Period Ended 8/31/2010 |
| 1 Year | 12.08% |
| 5 Years | 1.56% |
| 10 Years | 3.98% |
Performance data quoted represents past performance which is no guarantee of future results. Investment return and principal value will fluctuate so that an investor's shares, when redeemed, may be worth more or less than their original cost. Mutual fund performance changes over time and current performance may be lower or higher than what is stated. For current to the most recent month-end performance and after-tax returns, visit FederatedInvestors.com or call 1-800-341-7400. Returns shown do not reflect the deduction of taxes that a shareholder would pay on Fund distributions or the redemption of Fund shares. Mutual funds are not obligations of or guaranteed by any bank and are not federally insured. Total returns shown include the maximum sales charge of 4.50% as applicable.
Annual Shareholder Report| 1 | Represents a hypothetical investment of $10,000 in the Fund after deducting the maximum sales charge of 4.50% ($10,000 investment minus $450 sales charge = $9,550). The Fund's performance assumes the reinvestment of all dividends and distributions. The Main Index, BCMB, Blended Index and MSTARHYM have been adjusted to reflect reinvestment of dividends on securities in the indexes and the average. |
| 2 | Federated Municipal High Yield Advantage Fund, Inc. (“Predecessor Fund”) was reorganized into Federated Municipal High Yield Advantage Fund (“Fund”), a series of Federated Municipal Securities Income Trust, as of the close of business on November 10, 2006. Prior to the reorganization, the Fund had no investment operations. The Fund is the successor to the Predecessor Fund. The information presented for periods prior to the close of business on November 10, 2006, refers to the performance of the predecessor Fund, which after the reorganization is the Fund's performance as a result of the reorganization. |
| 3 | The Fund's investment adviser has elected to change the Fund's broad-based securities market index to the Main Index from the BCMB. The Main Index is more representative of the securities in which the Fund invests. The Main Index is a broad, comprehensive, market value-weighted index composed of approximately 55,000 bond issues that are exempt from U.S. federal income taxes or subject to AMT. Eligibility criteria for inclusion in the Main Index include, but are not limited to: the bond issuer must be a state (including the Commonwealth of Puerto Rico and U.S. territories) or a local government or a state or local government entity where interest on the bond is exempt from U.S. federal income taxes or subject to the AMT; the bond must be held by a mutual fund for which Standard & Poor's Securities Evaluations, Inc. provides prices; it must be denominated in U.S. dollars and have a minimum par amount of $2 million; and the bond must have a minimum term to maturity and/or call date greater than or equal to one calendar month. The Main Index is rebalanced monthly. The BCMB is an unmanaged market value-weighted index for the long-term, tax-exempt bond market. To be included in the BCMB, bonds must have a minimum credit rating of Baa, an outstanding par value of at least $7 million and be issued as part of a transaction of at least $75 million. The bonds must be fixed rate, have an issue date after December 31, 1990, and must be at least one year from their maturity date. The BCMB includes both zero coupon bonds and bonds subject to the AMT. The Blended Index is a custom blended index that represents, by market weighting, 25% of the A-rated and higher component of the Main Index, 25% of the BBB-rated component of the Main Index and 50% of the below investment grade (bonds with ratings of less than BBB-/Baa3) component of the Main Index, all with remaining maturities of three years or more. Neither the Main Index, BCMB nor Blended Index are adjusted to reflect sales charges, expenses and other fees that the SEC requires to be reflected in the Fund's performance. The Main Index, BCMB and Blended Index are unmanaged, and, unlike the Fund, are not affected by cash flows. It is not possible to invest directly in an index. |
| 4 | Morningstar figures represent the average of the total returns reported by all the mutual funds designated by Morningstar as falling into the respective category indicated. Funds designated within the MSTARHYM include those that invest at least 50% of assets in high-income municipal securities that are not rated or that are rated by a major agency such as Standard & Poor's or Moody's Investor Service at a level of BBB (considered part of the high yield universe within the municipal industry) and below. They do not reflect sales charges. |
| 5 | Total returns quoted reflect all applicable sales charges. |
GROWTH OF A $10,000 INVESTMENT - CLASS B SHARES
The graph below illustrates the hypothetical investment of $10,0001 in Federated Municipal High Yield Advantage Fund2 (Class B Shares) (the “Fund”) from August 31, 2000 to August 31, 2010, compared to the S&P/Investortools Municipal Bond Index (Main Index),3 Barclays Capital Municipal Bond Index (BCMB),3 S&P/Investortools 25% A and Higher/25% BBB/50% High Yield, all 3-Year Plus Sub-Index, a custom blended index (Blended Index),3 and the Morningstar High Yield Municipal Funds Category Average (MSTARHYM).4
| Average Annual Total Returns5 for the Period Ended 8/31/2010 |
| 1 Year | 11.19% |
| 5 Years | 1.40% |
| 10 Years | 3.82% |
Performance data quoted represents past performance which is no guarantee of future results. Investment return and principal value will fluctuate so that an investor's shares, when redeemed, may be worth more or less than their original cost. Mutual fund performance changes over time and current performance may be lower or higher than what is stated. For current to the most recent month-end performance and after-tax returns, visit FederatedInvestors.com or call 1-800-341-7400. Returns shown do not reflect the deduction of taxes that a shareholder would pay on Fund distributions or the redemption of Fund shares. Mutual funds are not obligations of or guaranteed by any bank and are not federally insured. Total returns shown include the maximum contingent deferred sales charge of 5.50% as applicable.
Annual Shareholder Report| 1 | Represents a hypothetical investment of $10,000 in the Fund. The maximum contingent deferred sales charge is 5.50% on any redemption less than one year from the purchase date. The Fund's performance assumes the reinvestment of all dividends and distributions. The Main Index, BCMB, Blended Index and MSTARHYM have been adjusted to reflect reinvestment of dividends on securities in the indexes and the average. |
| 2 | Federated Municipal High Yield Advantage Fund, Inc. (“Predecessor Fund”) was reorganized into Federated Municipal High Yield Advantage Fund (“Fund“), a series of Federated Municipal Securities Income Trust, as of the close of business on November 10, 2006. Prior to the reorganization, the Fund had no investment operations. The Fund is the successor to the Predecessor Fund. The information presented for periods prior to the close of business on November 10, 2006, refers to the performance of the predecessor Fund, which after the reorganization is the Fund's performance as a result of the reorganization. |
| 3 | The Fund's investment adviser has elected to change the Fund's broad-based securities market index to the Main Index from the BCMB. The Main Index is more representative of the securities in which the Fund invests. The Main Index is a broad, comprehensive, market value-weighted index composed of approximately 55,000 bond issues that are exempt from U.S. federal income taxes or subject to AMT. Eligibility criteria for inclusion in the Main Index include, but are not limited to: the bond issuer must be a state (including the Commonwealth of Puerto Rico and U.S. territories) or a local government or a state or local government entity where interest on the bond is exempt from U.S. federal income taxes or subject to the AMT; the bond must be held by a mutual fund for which Standard & Poor's Securities Evaluations, Inc. provides prices; it must be denominated in U.S. dollars and have a minimum par amount of $2 million; and the bond must have a minimum term to maturity and/or call date greater than or equal to one calendar month. The Main Index is rebalanced monthly. The BCMB is an unmanaged market value-weighted index for the long-term, tax-exempt bond market. To be included in the BCMB, bonds must have a minimum credit rating of Baa, an outstanding par value of at least $7 million and be issued as part of a transaction of at least $75 million. The bonds must be fixed rate, have an issue date after December 31, 1990, and must be at least one year from their maturity date. The BCMB includes both zero coupon bonds and bonds subject to the AMT. The Blended Index is a custom blended index that represents, by market weighting, 25% of the A-rated and higher component of the Main Index, 25% of the BBB-rated component of the Main Index and 50% of the below investment grade (bonds with ratings of less than BBB-/Baa3) component of the Main Index, all with remaining maturities of three years or more. Neither the Main Index, BCMB nor Blended Index are adjusted to reflect sales charges, expenses and other fees that the SEC requires to be reflected in the Fund's performance. The Main Index, BCMB and Blended Index are unmanaged, and, unlike the Fund, are not affected by cash flows. It is not possible to invest directly in an index. |
| 4 | Morningstar figures represent the average of the total returns reported by all the mutual funds designated by Morningstar as falling into the respective category indicated. Funds designated within the MSTARHYM include those that invest at least 50% of assets in high-income municipal securities that are not rated or that are rated by a major agency such as Standard & Poor's or Moody's Investor Service at a level of BBB (considered part of the high yield universe within the municipal industry) and below. They do not reflect sales charges. |
| 5 | Total returns quoted reflect all applicable contingent deferred sales charges. |
GROWTH OF A $10,000 INVESTMENT - CLASS C SHARES
The graph below illustrates the hypothetical investment of $10,0001 in Federated Municipal High Yield Advantage Fund2 (Class C Shares) (the “Fund”) from August 31, 2000 to August 31, 2010, compared to the S&P/Investortools Municipal Bond Index (Main Index),3 Barclays Capital Municipal Bond Index (BCMB),3 S&P/Investortools 25% A and Higher/25% BBB/50% High Yield, all 3-Year Plus Sub-Index, a custom blended index (Blended Index),3 and the Morningstar High Yield Municipal Funds Category Average (MSTARHYM).4
| Average Annual Total Returns5 for the Period Ended 8/31/2010 |
| 1 Year | 15.69% |
| 5 Years | 1.72% |
| 10 Years | 3.69% |
Performance data quoted represents past performance which is no guarantee of future results. Investment return and principal value will fluctuate so that an investor's shares, when redeemed, may be worth more or less than their original cost. Mutual fund performance changes over time and current performance may be lower or higher than what is stated. For current to the most recent month-end performance and after-tax returns, visit FederatedInvestors.com or call 1-800-341-7400. Returns shown do not reflect the deduction of taxes that a shareholder would pay on Fund distributions or the redemption of Fund shares. Mutual funds are not obligations of or guaranteed by any bank and are not federally insured. Total returns shown include the maximum contingent deferred sales charge of 1.00% as applicable.
Annual Shareholder Report| 1 | Represents a hypothetical investment of $10,000 in the Fund. The maximum contingent deferred sales charge is 1.00% on any redemption less than one year from the purchase date. The Fund's performance assumes the reinvestment of all dividends and distributions. The Main Index, BCMB, Blended Index and MSTARHYM have been adjusted to reflect reinvestment of dividends on securities in the indexes and the average. |
| 2 | Federated Municipal High Yield Advantage Fund, Inc. (“Predecessor Fund”) was reorganized into Federated Municipal High Yield Advantage Fund (“Fund”), a series of Federated Municipal Securities Income Trust, as of the close of business on November 10, 2006. Prior to the reorganization, the Fund had no investment operations. The Fund is the successor to the Predecessor Fund. The information presented for periods prior to the close of business on November 10, 2006, refers to the performance of the predecessor Fund, which after the reorganization is the Fund's performance as a result of the reorganization. |
| 3 | The Fund's investment adviser has elected to change the Fund's broad-based securities market index to the Main Index from the BCMB. The Main Index is more representative of the securities in which the Fund invests. The Main Index is a broad, comprehensive, market value-weighted index composed of approximately 55,000 bond issues that are exempt from U.S. federal income taxes or subject to AMT. Eligibility criteria for inclusion in the Main Index include, but are not limited to: the bond issuer must be a state (including the Commonwealth of Puerto Rico and U.S. territories) or a local government or a state or local government entity where interest on the bond is exempt from U.S. federal income taxes or subject to the AMT; the bond must be held by a mutual fund for which Standard & Poor's Securities Evaluations, Inc. provides prices; it must be denominated in U.S. dollars and have a minimum par amount of $2 million; and the bond must have a minimum term to maturity and/or call date greater than or equal to one calendar month. The Main Index is rebalanced monthly. The BCMB is an unmanaged market value-weighted index for the long-term, tax-exempt bond market. To be included in the BCMB, bonds must have a minimum credit rating of Baa, an outstanding par value of at least $7 million and be issued as part of a transaction of at least $75 million. The bonds must be fixed rate, have an issue date after December 31, 1990, and must be at least one year from their maturity date. The BCMB includes both zero coupon bonds and bonds subject to the AMT. The Blended Index is a custom blended index that represents, by market weighting, 25% of the A-rated and higher component of the Main Index, 25% of the BBB-rated component of the Main Index and 50% of the below investment grade (bonds with ratings of less than BBB-/Baa3) component of the Main Index, all with remaining maturities of three years or more. Neither the Main Index, BCMB nor Blended Index are adjusted to reflect sales charges, expenses and other fees that the SEC requires to be reflected in the Fund's performance. The Main Index, BCMB and Blended Index are unmanaged, and, unlike the Fund, are not affected by cash flows. It is not possible to invest directly in an index. |
| 4 | Morningstar figures represent the average of the total returns reported by all the mutual funds designated by Morningstar as falling into the respective category indicated. Funds designated within the MSTARHYM include those that invest at least 50% of assets in high-income municipal securities that are not rated or that are rated by a major agency such as Standard & Poor's or Moody's Investor Service at a level of BBB (considered part of the high yield universe within the municipal industry) and below. They do not reflect sales charges. |
| 5 | Total returns quoted reflect all applicable contingent deferred sales charges. |
GROWTH OF A $10,000 INVESTMENT - CLASS F SHARES
The graph below illustrates the hypothetical investment of $10,0001 in Federated Municipal High Yield Advantage Fund2 (Class F Shares) (the “Fund”) from August 31, 2000 to August 31, 2010, compared to the S&P/Investortools Municipal Bond Index (Main Index),3 Barclays Capital Municipal Bond Index (BCMB),3 S&P/Investortools 25% A and Higher/25% BBB/50% High Yield, all 3-Year Plus Sub-Index, a custom blended index (Blended Index),3 and the Morningstar High Yield Municipal Funds Category Average (MSTARHYM).4
| Average Annual Total Returns5 for the Period Ended 8/31/2010 |
| 1 Year | 15.23% |
| 5 Years | 2.29% |
| 10 Years | 4.35% |
Performance data quoted represents past performance which is no guarantee of future results. Investment return and principal value will fluctuate so that an investor's shares, when redeemed, may be worth more or less than their original cost. Mutual fund performance changes over time and current performance may be lower or higher than what is stated. For current to the most recent month-end performance and after-tax returns, visit FederatedInvestors.com or call 1-800-341-7400. Returns shown do not reflect the deduction of taxes that a shareholder would pay on Fund distributions or the redemption of Fund shares. Mutual funds are not obligations of or guaranteed by any bank and are not federally insured. Total returns shown include the maximum sales charge of 1.00% and the 1.00% contingent deferred sales charge as applicable.
Annual Shareholder Report| 1 | Represents a hypothetical investment of $10,000 in the Fund after deducting the maximum sales charge of 1.00% ($10,000 investment minus $100 sales charge = $9,900). The Fund's performance assumes the reinvestment of all dividends and distributions. The Main Index, BCMB, Blended Index and MSTARHYM have been adjusted to reflect reinvestment of dividends on securities in the indexes and the average. |
| 2 | Federated Municipal High Yield Advantage Fund, Inc. (“Predecessor Fund”) was reorganized into Federated Municipal High Yield Advantage Fund (“Fund”), a series of Federated Municipal Securities Income Trust, as of the close of business on November 10, 2006. Prior to the reorganization, the Fund had no investment operations. The Fund is the successor to the Predecessor Fund. The information presented for periods prior to the close of business on November 10, 2006, refers to the performance of the predecessor Fund, which after the reorganization is the Fund's performance as a result of the reorganization. |
| 3 | The Fund's investment adviser has elected to change the Fund's broad-based securities market index to the Main Index from the BCMB. The Main Index is more representative of the securities in which the Fund invests. The Main Index is a broad, comprehensive, market value-weighted index composed of approximately 55,000 bond issues that are exempt from U.S. federal income taxes or subject to AMT. Eligibility criteria for inclusion in the Main Index include, but are not limited to: the bond issuer must be a state (including the Commonwealth of Puerto Rico and U.S. territories) or a local government or a state or local government entity where interest on the bond is exempt from U.S. federal income taxes or subject to the AMT; the bond must be held by a mutual fund for which Standard & Poor's Securities Evaluations, Inc. provides prices; it must be denominated in U.S. dollars and have a minimum par amount of $2 million; and the bond must have a minimum term to maturity and/or call date greater than or equal to one calendar month. The Main Index is rebalanced monthly. The BCMB is an unmanaged market value-weighted index for the long-term, tax-exempt bond market. To be included in the BCMB, bonds must have a minimum credit rating of Baa, an outstanding par value of at least $7 million and be issued as part of a transaction of at least $75 million. The bonds must be fixed rate, have an issue date after December 31, 1990, and must be at least one year from their maturity date. The BCMB includes both zero coupon bonds and bonds subject to the AMT. The Blended Index is a custom blended index that represents, by market weighting, 25% of the A-rated and higher component of the Main Index, 25% of the BBB-rated component of the Main Index and 50% of the below investment grade (bonds with ratings of less than BBB-/Baa3) component of the Main Index, all with remaining maturities of three years or more. Neither the Main Index, BCMB nor Blended Index are adjusted to reflect sales charges, expenses and other fees that the SEC requires to be reflected in the Fund's performance. The Main Index, BCMB and Blended Index are unmanaged, and, unlike the Fund, are not affected by cash flows. It is not possible to invest directly in an index. |
| 4 | Morningstar figures represent the average of the total returns reported by all the mutual funds designated by Morningstar as falling into the respective category indicated. Funds designated within the MSTARHYM include those that invest at least 50% of assets in high-income municipal securities that are not rated or that are rated by a major agency such as Standard & Poor's or Moody's Investor Service at a level of BBB (considered part of the high yield universe within the municipal industry) and below. They do not reflect sales charges. |
| 5 | Total returns quoted reflect all applicable sales charges and contingent deferred sales charges. |
Portfolio of Investments Summary Table (unaudited)
At August 31, 2010 the Fund's sector composition1 was as follows:
| Sector Composition | Percentage of Total Net Assets |
| Hospital | 15.1% |
| Industrial Development Bond/Pollution Control Revenue | 12.2% |
| Special Tax | 12.0% |
| Senior Care | 10.9% |
| Electric & Gas | 8.9% |
| Education | 6.5% |
| Transportation | 5.3% |
| Tobacco | 4.8% |
| Government Obligation - State | 4.4% |
| Pre-refunded | 3.8% |
| Other2 | 13.8% |
| Other Assets and Liabilities — Net3 | 2.3% |
| TOTAL | 100.0% |
| 1 | Sector classifications, and the assignment of holdings to such sectors, are based upon the economic sector and/or revenue source of the underlying obligor, as determined by the Fund's Adviser. For securities that have been enhanced by a third-party, including bond insurers and banks, sector classifications are based upon the economic sector and/or revenue source of the underlying obligor, as determined by the Fund's Adviser. Pre-refunded securities are those whose debt service is paid from escrowed assets, usually U.S. government securities. |
| 2 | For purposes of this table, sector classifications constitute 83.9% of the Fund's total net assets. Remaining sectors have been aggregated under the designation “Other”. |
| 3 | Assets, other than investments in securities, less liabilities. See Statement of Assets and Liabilities. |
Portfolio of Investments
August 31, 2010
| Principal Amount | Value |
| MUNICIPAL BONDS – 95.4% |
| Alabama – 1.2% |
| $2,000,000 | Courtland, AL IDB, Solid Waste Disposal Revenue Refunding Bonds (Series 2005B), 5.20% (International Paper Co.), 6/1/2025 | 1,957,520 |
| 2,000,000 | Huntsville, AL Special Care Facilities Financing Authority, Retirement Facility Revenue Bonds (Series 2007), 5.50% (Redstone Village)/(Original Issue Yield: 5.60%), 1/1/2043 | 1,590,020 |
| 835,000 | Selma, AL IDB, Gulf Opportunity Zone Bonds (Series 2010A), 5.80% (International Paper Co.), 5/1/2034 | 879,756 |
| 2,100,000 | Sylacauga, AL Health Care Authority, Revenue Bonds (Series 2005A), 6.00% (Coosa Valley Medical Center)/(Original Issue Yield: 6.05%), 8/1/2035 | 1,838,298 |
| TOTAL | 6,265,594 |
| Alaska – 0.3% |
| 1,000,000 | Alaska Industrial Development and Export Authority, Community Provider Revenue Bonds (Series 2007C), 6.00% (Boys & Girls Home & Family Services, Inc.), 12/1/2036 | 595,080 |
| 1,195,000 | Alaska Industrial Development and Export Authority, Power Revenue Bonds, 5.875% (Upper Lynn Canal Regional Power Supply System)/(Original Issue Yield: 6.00%), 1/1/2032 | 1,133,720 |
| TOTAL | 1,728,800 |
| Arizona – 1.8% |
| 4,000,000 | Maricopa County, AZ Pollution Control Corp., Refunding PCRBs (Series 2003A), 6.25% (Public Service Co., NM), 1/1/2038 | 4,198,320 |
| 1,500,000 | Maricopa County, AZ Pollution Control Corp., Refunding PCRBs (Series 2009A), 7.25% (El Paso Electric Co.), 2/1/2040 | 1,728,360 |
| 1,385,000 | Pima County, AZ IDA, PCRBs (Series 2009A), 4.95% (Tucson Electric Power Co.), 10/1/2020 | 1,466,119 |
| 2,000,000 | Pima County, AZ IDA, Revenue Bonds (Series 2008B), 5.75% (Tucson Electric Power Co.), 9/1/2029 | 2,068,320 |
| TOTAL | 9,461,119 |
| California – 7.0% |
| 2,000,000 | California Infrastructure & Economic Development Bank, Revenue Bonds (Series 2008), 5.25% (Walt Disney Family Museum)/(Original Issue Yield: 5.50%), 2/1/2038 | 2,058,040 |
| 2,500,000 | 1,2 | California PCFA, Solid Waste Disposal Revenue Bonds (Series 2002B), 5.00% (Waste Management, Inc.), 7/1/2027 | 2,530,850 |
| 1,000,000 | 1,2 | California PCFA, Solid Waste Disposal Revenue Bonds (Series 2005A-2), 5.40% (Waste Management, Inc.), 4/1/2025 | 1,028,790 |
| 2,500,000 | California State, Various Purpose UT GO Bonds, 5.25%, 10/1/2029 | 2,671,125 |
| 2,500,000 | California State, Various Purpose UT GO Bonds, 6.00% (Original Issue Yield: 6.10%), 4/1/2038 | 2,787,050 |
| Principal Amount | Value |
| $1,200,000 | 1,2 | California Statewide CDA, MFH Revenue Bonds (Series 1999X), 6.65% (Magnolia City Lights Project), 7/1/2039 | 1,161,504 |
| 2,000,000 | California Statewide CDA, Revenue Bonds (Series 2007A), 5.125% (Front Porch at Walnut Village), 4/1/2037 | 1,866,720 |
| 950,000 | 1 | California Statewide CDA, Revenue Bonds, 6.625% (Tehiyah Day School), 11/1/2031 | 704,833 |
| 2,000,000 | Chula Vista, CA, COP, 5.50% (Original Issue Yield: 5.88%), 3/1/2033 | 2,022,120 |
| 2,000,000 | Golden State Tobacco Securitization Corp., CA, Enhanced Tobacco Settlement Asset-Backed Bonds (Series 2005A), 5.00% (California State), 6/1/2045 | 1,920,320 |
| 530,000 | Golden State Tobacco Securitization Corp., CA, Tobacco Settlement Asset-Backed Bonds (Series 2007A-1), 5.75%, 6/1/2047 | 395,030 |
| 6,000,000 | Golden State Tobacco Securitization Corp., CA, Tobacco Settlement Asset-Backed Revenue Bonds (Series 2007A-1), 5.125% (Original Issue Yield: 5.27%), 6/1/2047 | 4,039,380 |
| 750,000 | Golden State Tobacco Securitization Corp., CA, Tobacco Settlement Revenue Bonds (Series 2003A-2), 7.90% (United States Treasury PRF 6/1/2013@100), 6/1/2042 | 894,240 |
| 1,000,000 | Los Angeles, CA Regional Airport Improvement Corp., Facilities Sublease Refunding Revenue Bonds (Series 2002B), 7.50% (American Airlines, Inc.)/(Original Issue Yield: 7.929%), 12/1/2024 | 1,011,740 |
| 2,000,000 | Los Angeles, CA Regional Airport Improvement Corp., Lease Revenue Bonds, Series C, 7.50% (American Airlines, Inc.)/(Original Issue Yield: 7.929%), 12/1/2024 | 2,022,100 |
| 2,500,000 | M-S-R Energy Authority, CA, Gas Revenue Bonds (Series 2009A), 7.00% (Citigroup, Inc. GTD), 11/1/2034 | 3,071,175 |
| 995,000 | Oxnard, CA Community Facilities District No. 3, Special Tax Bonds (Series 2005), 5.00% (Seabridge at Mandalay Bay)/(Original Issue Yield: 5.22%), 9/1/2035 | 879,879 |
| 2,000,000 | Riverside County, CA Redevelopment Agency, Tax Allocation Bonds (Series 2010D), 6.00% (Desert Communities Redevelopment Project Area)/(Original Issue Yield: 6.02%), 10/1/2037 | 2,067,120 |
| 1,500,000 | Riverside County, CA Redevelopment Agency, Tax Allocation Bonds (Series 2010E), 6.50% (Interstate 215 Corridor Redevelopment Project Area )/(Original Issue Yield: 6.53%), 10/1/2040 | 1,542,315 |
| 349,000 | 3 | San Bernardino County, CA Housing Authority, Subordinated Revenue Bonds, 7.25% (Glen Aire Park & Pacific Palms), 4/15/2042 | 175,781 |
| 1,000,000 | San Diego, CA Public Facilities Authority, Lease Revenue Refunding Bonds (Series 2010A), 5.25% (San Diego, CA)/(Original Issue Yield: 5.37%), 3/1/2040 | 1,017,120 |
| 1,000,000 | Western Hills Water District, CA, Special Tax Revenue Bonds, 6.875% (Diablo Grande Community Facilities No. 1)/(Original Issue Yield: 6.954%), 9/1/2031 | 649,600 |
| TOTAL | 36,516,832 |
| Principal Amount | Value |
| Colorado – 4.3% |
| $2,000,000 | Beacon Point, CO Metropolitan District, Revenue Bonds (Series 2005A), 6.25% (Original Issue Yield: 6.375%), 12/1/2035 | 1,870,140 |
| 536,000 | Castle Oaks, CO Metropolitan District, LT GO Bonds (Series 2005), 6.125%, 12/1/2035 | 423,306 |
| 785,000 | Colorado Educational & Cultural Facilities Authority, Charter School Revenue Bonds (Series 2007A), 5.70% (Windsor Charter Academy)/(Original Issue Yield: 5.70%), 5/1/2037 | 705,856 |
| 835,000 | Colorado Educational & Cultural Facilities Authority, Charter School Revenue Bonds (Series 2007A), 5.75% (Northeast Academy Charter School), 5/15/2037 | 717,574 |
| 1,000,000 | Colorado Educational & Cultural Facilities Authority, Charter School Revenue Bonds (Series 2007A), 6.00% (Monument Academy Charter School), 10/1/2037 | 980,280 |
| 1,610,000 | Colorado Educational & Cultural Facilities Authority, Revenue Refunding Bonds (Series A), 7.125% (Denver Academy)/(Original Issue Yield: 7.375%), 11/1/2028 | 1,679,375 |
| 1,000,000 | Colorado Health Facilities Authority, Health & Residential Care Facilities Revenue Bonds (Series 2007), 5.30% (Volunteers of America Care Facilities), 7/1/2037 | 817,040 |
| 2,000,000 | Colorado Springs Urban Renewal Authority, Tax Increment Revenue Bonds (Series 2007), 7.00% (University Village Colorado), 12/1/2029 | 1,845,280 |
| 1,000,000 | Conservatory Metropolitan District, CO, LT GO Bonds, 7.55% (United States Treasury PRF 12/1/2013@102), 12/1/2032 | 1,236,100 |
| 1,335,000 | Conservatory Metropolitan District, CO, Refunding & Improvement LT GO Bonds, 5.125% (Radian Asset Assurance, Inc. INS), 12/1/2037 | 1,048,215 |
| 450,000 | Eagle County, CO Air Terminal Corp., Airport Terminal Project Revenue Improvement Bonds (Series 2006B), 5.25%, 5/1/2020 | 431,942 |
| 1,000,000 | Granby Ranch, CO Metropolitan District, LT GO Bonds (Series 2006), 6.75%, 12/1/2036 | 858,690 |
| 500,000 | Maher Ranch, CO Metropolitan District No. 4, LT GO Bonds (Series 2006), 7.00% (United States Treasury PRF 12/1/2013@102), 12/1/2036 | 604,215 |
| 1,000,000 | Maher Ranch, CO Metropolitan District No. 4, LT GO Bonds, 7.875% (United States Treasury PRF 12/1/2013@102), 12/1/2033 | 1,235,390 |
| 2,235,000 | Northwest, CO Metropolitan District No. 3, LT GO Bonds (Series 2005), 6.25%, 12/1/2035 | 1,794,951 |
| 2,000,000 | Public Authority for Colorado Energy, Natural Gas Purchase Revenue Bonds (Series 2008), 6.25% (Merrill Lynch & Co., Inc. GTD)/(Original Issue Yield: 6.63%), 11/15/2028 | 2,255,180 |
| 1,500,000 | Southlands, CO Metropolitan District No. 1, LT GO Bonds (Series 2004), 7.125% (United States Treasury PRF 12/1/2014@100)/(Original Issue Yield: 7.18%), 12/1/2034 | 1,880,325 |
| 2,000,000 | Three Springs Metropolitan District No. 3, CO, Property Tax Supported Revenue Bonds (Series 2010), 7.75%, 12/1/2039 | 2,044,280 |
| TOTAL | 22,428,139 |
| Principal Amount | Value |
| Connecticut – 0.2% |
| $1,000,000 | Connecticut Development Authority, Airport Facility Revenue Bonds, 7.95% (Bombardier, Inc.), 4/1/2026 | 1,085,210 |
| Delaware – 0.4% |
| 1,905,000 | Delaware EDA, Gas Facilities Refunding Bonds, 5.40% (Delmarva Power and Light Co.), 2/1/2031 | 1,991,201 |
| District of Columbia – 1.1% |
| 25,000,000 | 4 | District of Columbia Tobacco Settlement Financing Corp., Tobacco Settlement Asset-Backed Bonds (Series 2006) (Original Issue Yield: 6.25%), 6/15/2046 | 763,250 |
| 6,300,000 | 4 | Metropolitan Washington, DC Airports Authority, Second Senior Lien Convertible Capital Appreciation Revenue Bonds (Series 2009C), 6.50% (Dulles Toll Road)/(Assured Guaranty Corp. INS)/(Original Issue Yield: 6.50%), 10/1/2041 | 4,912,866 |
| TOTAL | 5,676,116 |
| Florida – 6.1% |
| 3,000,000 | Alachua County, FL, IDRB (Series 2007A), 5.875% (North Florida Retirement Village, Inc,), 11/15/2042 | 2,705,310 |
| 1,430,000 | Arborwood, FL Community Development District, Capital Improvement Revenue Bonds (Series 2005A), 5.35%, 5/1/2036 | 866,551 |
| 1,000,000 | Ave Maria Stewardship Community District, FL, Capital Improvement Revenue Bonds (Series 2006A), 5.125% (Original Issue Yield: 5.15%), 5/1/2038 | 795,430 |
| 109,219 | 3 | Capital Trust Agency, FL, Housing Revenue Notes, 5.95% (Atlantic Housing Foundation Properties), 1/15/2039 | 43,685 |
| 785,000 | East Homestead, FL Community Development District, Special Assessment Revenue Bonds (Series 2005), 5.45%, 5/1/2036 | 713,518 |
| 180,000 | Fishhawk Community Development District II, Special Assessment Revenue Bonds (Series 2004B), 7.04% (Original Issue Yield: 7.087%), 11/1/2014 | 177,813 |
| 3,000,000 | Grand Bay at Doral Community Development District, FL, Special Assessment Bonds (Series 2007B), 6.00%, 5/1/2017 | 1,140,000 |
| 1,000,000 | Greater Orlando, FL Aviation Authority, Special Purpose Airport Facilities Revenue Bonds (Series 2005), 6.50% (Jet Blue Airways Corp.)/(Original Issue Yield: 6.811%), 11/15/2036 | 976,530 |
| 990,000 | Lakes by the Bay South Community Development District, FL, Special Assessment Revenue Bonds (Series 2004A), 6.25% (Original Issue Yield: 6.277%), 5/1/2034 | 963,686 |
| 2,000,000 | Lee County, FL IDA, Health Care Facilities Revenue Bond (Series A), 6.75% (Cypress Cove at Healthpark)/(Original Issue Yield: 6.98%), 10/1/2032 | 1,757,520 |
| 820,000 | Mediterra North Community Development District, FL, Capital Improvement Revenue Bonds (Series A), 6.80%, 5/1/2031 | 826,298 |
| 1,000,000 | Miami Beach, FL Health Facilities Authority, Hospital Revenue Bonds (Series 2001A), 6.70% (Mt. Sinai Medical Center, FL)/(Original Issue Yield: 6.80%), 11/15/2019 | 1,026,130 |
| Principal Amount | Value |
| $2,000,000 | Miami-Dade County, FL Water & Sewer Authority, Water & Sewer System Revenue Bonds (Series 2010), 5.00% (Original Issue Yield: 5.05%), 10/1/2034 | 2,123,600 |
| 1,000,000 | Midtown Miami, FL Community Development District, Special Assessment Bonds (Series 2004A), 6.25% (Original Issue Yield: 6.30%), 5/1/2037 | 989,650 |
| 2,000,000 | Orange County, FL, Health Facilities Authority, Hospital Revenue Bonds (Series 2008C), 5.25% (Orlando Health, Inc.)/(Original Issue Yield: 5.42%), 10/1/2035 | 2,039,480 |
| 3,000,000 | Orlando & Orange County Expressway Authority, FL, Revenue Bonds (Series 2010A), 5.00%, 7/1/2040 | 3,125,220 |
| 600,000 | Orlando, FL Urban Community Development District, Capital Improvement Revenue Bonds, 6.25%, 5/1/2034 | 545,694 |
| 2,000,000 | 1,2 | Palm Beach County, FL, Tax-Exempt Revenue Bonds (Series 2005A), 6.75% (G-Star School of the Arts for Motion Pictures and Broadcasting Charter School), 5/15/2035 | 1,893,180 |
| 1,000,000 | Reunion East Community Development District, FL, Special Assessment Bonds (Series 2002A), 7.375%, 5/1/2033 | 751,180 |
| 1,000,000 | South Lake County, FL Hospital District, Revenue Bonds (Series 2009A), 6.25% (South Lake Hospital, Inc.)/(Original Issue Yield: 6.30%), 4/1/2039 | 1,055,470 |
| 1,200,000 | South Lake County, FL Hospital District, Revenue Bonds, 6.625% (South Lake Hospital, Inc.), 10/1/2023 | 1,254,600 |
| 700,000 | 3 | Tern Bay, FL Community Development District, Capital Improvement Revenue Bonds (Series 2005), 5.00%, 5/1/2015 | 209,860 |
| 1,675,000 | Tolomato Community Development District, FL, Special Assessment Revenue Bonds (Series 2006), 5.40%, 5/1/2037 | 1,351,390 |
| 1,000,000 | Tolomato Community Development District, FL, Special Assessment Revenue Bonds (Series 2007), 6.55% (Original Issue Yield: 6.60%), 5/1/2027 | 796,920 |
| 960,000 | Verandah East, FL Community Development District, Capital Improvement Revenue Bonds (Series 2006A), 5.40%, 5/1/2037 | 457,786 |
| 805,000 | Verandah West, FL Community Development District, Capital Improvement Revenue Bonds (Series 2003A), 6.625% (Original Issue Yield: 6.75%), 5/1/2033 | 806,586 |
| 1,630,000 | Volusia County, FL Education Facility Authority, Educational Facilities Refunding Revenue Bonds (Series 2005), 5.00% (Embry-Riddle Aeronautical University, Inc.)/(Radian Asset Assurance, Inc. INS), 10/15/2025 | 1,645,289 |
| 485,000 | Winter Garden Village at Fowler Groves Community Development District, FL, Special Assessment Bonds (Series 2006), 5.65%, 5/1/2037 | 468,132 |
| TOTAL | 31,506,508 |
| Georgia – 2.2% |
| 4,000,000 | Atlanta, GA Water & Wastewater, Revenue Bonds (Series 2009A), 6.25% (Original Issue Yield: 6.38%), 11/1/2039 | 4,559,480 |
| Principal Amount | Value |
| $770,000 | Atlanta, GA, Tax Allocation Bonds (Series 2005B), 5.60% (Eastside Tax Allocation District)/(Original Issue Yield: 5.65%), 1/1/2030 | 781,642 |
| 1,045,000 | Atlanta, GA, Tax Allocation Bonds (Series 2006), 5.50% (Princeton Lakes), 1/1/2031 | 963,271 |
| 1,000,000 | Augusta, GA Airport, General Passenger Facilities Charge Revenue Bonds, Series A, 5.15%, 1/1/2035 | 956,250 |
| 750,000 | Augusta, GA Airport, General Passenger Facilities Charge Revenue Bonds, Series B, 5.35%, 1/1/2028 | 728,663 |
| 1,780,000 | Augusta, GA HFA, MFH Refunding Revenue Bonds, 6.55% (Forest Brook Apartments), 12/1/2030 | 1,666,561 |
| 750,000 | Fulton County, GA Residential Care Facilities, Revenue Bonds (Series 2004A), 6.00% (Canterbury Court), 2/15/2022 | 737,197 |
| 1,000,000 | Medical Center Hospital Authority, GA, Revenue Refunding Bonds (Series 2007), 5.25% (Spring Harbor at Green Island), 7/1/2037 | 836,640 |
| TOTAL | 11,229,704 |
| Guam – 0.5% |
| 500,000 | Guam Government LO (Section 30), Bonds (Series 2009A), 5.75% (Original Issue Yield: 6.00%), 12/1/2034 | 525,945 |
| 1,000,000 | Guam Government, GO Bonds (Series 2009A), 7.00% (Original Issue Yield: 7.18%), 11/15/2039 | 1,115,290 |
| 1,000,000 | Guam Government, UT GO Bonds (Series 2007A), 5.25% (Original Issue Yield: 5.45%), 11/15/2037 | 960,760 |
| TOTAL | 2,601,995 |
| Hawaii – 1.5% |
| 2,000,000 | Hawaii State Airport System, Revenue Bonds (Series 2010A), 5.00% (Original Issue Yield: 5.12%), 7/1/2039 | 2,068,980 |
| 2,000,000 | Hawaii State Department of Budget & Finance, Special Purpose Revenue Bonds (Series 2009), 6.50% (Hawaiian Electric Co., Inc.), 7/1/2039 | 2,222,500 |
| 1,000,000 | Hawaii State Department of Budget & Finance, Special Purpose Revenue Bonds (Series A), 7.00% (Kahala Nui)/(Original Issue Yield: 7.00%), 11/15/2012 | 1,063,090 |
| 1,000,000 | Hawaii State Department of Budget & Finance, Special Purpose Revenue Bonds (Series A), 8.00% (Kahala Nui)/(Original Issue Yield: 8.175%), 11/15/2033 | 1,072,430 |
| 1,000,000 | Hawaii State Department of Budget & Finance, Special Purpose Senior Living Revenue Bonds (Series A), 9.00% (15 Craigside)/ (Original Issue Yield: 9.15%), 11/15/2044 | 1,159,690 |
| TOTAL | 7,586,690 |
| Illinois – 2.5% |
| 415,000 | DuPage County, IL, Special Tax Bonds (Series 2006), 5.625% (Naperville Campus LLC), 3/1/2036 | 340,412 |
| Principal Amount | Value |
| $1,000,000 | Illinois Finance Authority, MFH Revenue Bonds (Series 2007), 6.10% (Dekalb Supportive Living Facility), 12/1/2041 | 838,120 |
| 1,000,000 | Illinois Finance Authority, Revenue Bonds (Series 2005A), 5.625% (Friendship Village of Schaumburg)/(Original Issue Yield: 5.70%), 2/15/2037 | 830,880 |
| 1,250,000 | Illinois Finance Authority, Revenue Bonds (Series 2005A), 6.00% (Landing at Plymouth Place)/(Original Issue Yield: 6.04%), 5/15/2037 | 1,098,350 |
| 1,500,000 | Illinois Finance Authority, Revenue Bonds (Series 2005A), 6.25% (Smith Village), 11/15/2035 | 1,312,470 |
| 1,000,000 | Illinois Finance Authority, Revenue Bonds (Series 2010), 7.25% (Friendship Village of Schaumburg)/(Original Issue Yield: 7.375%), 2/15/2045 | 1,040,860 |
| 600,000 | Illinois Finance Authority, Revenue Bonds (Series 2010B) (Clare at Water Tower)/(Original Issue Yield: 5.00%), 5/15/2050 | 7,602 |
| 1,400,000 | Illinois Finance Authority, Revenue Bonds {Series 2010A}, 6.125% (Clare at Water Tower), 5/15/2041 | 929,992 |
| 1,000,000 | Illinois Finance Authority, Solid Waste Disposal Revenue Bonds, 5.05% (Waste Management, Inc.), 8/1/2029 | 1,002,620 |
| 1,200,000 | Illinois Finance Authority, Water Facilities Revenue Bonds (Series 2009), 5.25% (American Water Capital Corp.), 10/1/2039 | 1,227,792 |
| 2,250,000 | Illinois State, UT GO Bonds (Series 2006), 5.00%, 1/1/2027 | 2,315,588 |
| 1,000,000 | Quad Cities, IL Regional EDA, MFH Revenue Bonds (Series 2006), 6.00% (Heritage Woods of Moline SLF), 12/1/2041 | 826,060 |
| 1,500,000 | Will-Kankakee, IL Regional Development Authority, MFH Revenue Bonds (Series 2007), 7.00% (Senior Estates Supportive Living), 12/1/2042 | 1,426,470 |
| TOTAL | 13,197,216 |
| Indiana – 2.2% |
| 1,000,000 | Goshen, IN, Revenue Bonds (Series 1998), 5.75% (Greencroft Obligated Group)/(Original Issue Yield: 5.87%), 8/15/2028 | 917,210 |
| 2,000,000 | Indiana Health & Educational Facility Financing Authority, Hospital Revenue Bonds (Series 2007), 5.50% (Community Foundation of Northwest Indiana), 3/1/2037 | 2,003,240 |
| 730,000 | Indiana Health Facility Financing Authority, Hospital Revenue Bonds Series (2001A), 6.375% (Community Foundation of Northwest Indiana)/(Original Issue Yield: 6.68%), 8/1/2031 | 743,782 |
| 2,000,000 | Indiana Health Facility Financing Authority, Revenue Refunding Bonds (Series 1998), 5.625% (Greenwood Village South Project)/(Original Issue Yield: 5.802%), 5/15/2028 | 1,726,740 |
| 1,305,000 | Indiana State Finance Authority (Environmental Improvement Bonds), Revenue Refunding Bonds (Series 2010), 6.00% (United States Steel Corp.), 12/1/2026 | 1,381,173 |
| 1,000,000 | Jasper County, IN, Refunding PCRBs (Series 2003), 5.70% (Northern Indiana Public Service Company)/(AMBAC Assurance Corporation INS), 7/1/2017 | 1,136,210 |
| Principal Amount | Value |
| $1,000,000 | South Bend, IN, EDRBs (Series 1999A), 6.25% (Southfield Village)/(Original Issue Yield: 6.375%), 11/15/2029 | 947,630 |
| 1,355,000 | St. Joseph County, IN Hospital Authority, Health Facilities Revenue Bonds (Series 2005), 5.375% (Madison Center Obligated Group), 2/15/2034 | 515,578 |
| 2,000,000 | Vigo County, IN Hospital Authority, Hospital Revenue Bond (Series 2007), 5.80% (Union Hospital)/(Original Issue Yield: 5.82%), 9/1/2047 | 1,884,440 |
| TOTAL | 11,256,003 |
| Iowa – 0.6% |
| 1,715,000 | Iowa Finance Authority, Senior Living Facility Revenue Refunding Bonds (Series 2007A), 5.50% (Deerfield Retirement Community, Inc.), 11/15/2037 | 1,198,133 |
| 1,785,000 | Wapello County, IA, Revenue Bonds, 6.25% (Ottumwa Regional Health Center)/(United States Treasury PRF 10/1/2012@100)/(Original Issue Yield: 6.40%), 10/1/2022 | 1,967,177 |
| TOTAL | 3,165,310 |
| Kansas – 1.3% |
| 1,100,000 | Labette County, KS, Hospital Refunding & Improvement Revenue Bonds (Series 2007A), 5.75% (Labette Health), 9/1/2037 | 1,080,772 |
| 1,025,000 | Manhattan, KS IDRB, Industrial Revenue Bonds (Series 1999), 7.00% (Farrar Corp. Project), 8/1/2014 | 1,024,897 |
| 1,000,000 | Manhattan, KS IDRB, Industrial Revenue Bonds (Series 2007), 5.50% (Farrar Corp. Project)/(Original Issue Yield: 5.55%), 8/1/2021 | 847,200 |
| 2,015,000 | Norwich, KS, Industrial Revenue Bonds (Series 2006), 5.90% (Farrar Corp. Project), 8/1/2021 | 1,783,577 |
| 2,000,000 | Olathe, KS, Senior Living Facility Revenue Bonds (Series 2006A), 6.00% (Catholic Care Campus, Inc.), 11/15/2038 | 1,842,300 |
| 165,000 | Sedgwick & Shawnee Counties, KS, SFM Revenue Bonds (Series 1997A-1), 6.95% (GNMA Home Mortgage Program COL), 6/1/2029 | 176,410 |
| TOTAL | 6,755,156 |
| Kentucky – 0.4% |
| 2,000,000 | Kentucky EDFA, Hospital System Refunding Revenue Bonds, 5.875% (Appalachian Regional Health Center)/(Original Issue Yield: 5.92%), 10/1/2022 | 1,830,120 |
| 435,000 | Kentucky EDFA, Revenue Bonds (Series 2000A), 6.625% (Norton Healthcare, Inc.)/(Original Issue Yield: 6.97%), 10/1/2028 | 439,950 |
| TOTAL | 2,270,070 |
| Louisiana – 1.9% |
| 1,000,000 | De Soto Parish, LA Environmental Improvement Authority, Revenue Bonds, Series A, 5.00% (International Paper Co.), 11/1/2018 | 1,014,570 |
| Principal Amount | Value |
| $981,000 | Lakeshore Villages Master Community Development District, LA, Special Assessment Bonds (Series 2007), 5.25% (Original Issue Yield: 5.378%), 7/1/2017 | 539,648 |
| 2,000,000 | Louisiana State Citizens Property Insurance Corp., Assessment Revenue Bonds (Series 2006C), 6.125% (Assured Guaranty Corp. INS)/(Original Issue Yield: 6.33%), 6/1/2025 | 2,292,000 |
| 2,000,000 | St. James Parish, LA, Solid Waste Disposal Revenue Bonds, 7.70% (IMC Phosphates Co.)/(Original Issue Yield: 7.75%), 10/1/2022 | 2,000,460 |
| 4,000,000 | St. John the Baptist Parish, LA, Revenue Bonds (Series 2007A), 5.125% (Marathon Oil Corp.)/(Assured Guaranty Corp. INS), 6/1/2037 | 3,985,800 |
| TOTAL | 9,832,478 |
| Maine – 0.3% |
| 1,500,000 | Portland, ME, General Airport Revenue Bonds (Series 2010), 5.00% (Original Issue Yield: 5.13%), 1/1/2040 | 1,548,465 |
| Maryland – 0.9% |
| 555,000 | Baltimore, MD, Special Obligation Revenue Bonds (Series 2008A), 7.00% (East Baltimore Research Park), 9/1/2038 | 574,897 |
| 2,385,000 | Maryland State Economic Development Corp., Revenue Bonds (Series B), 5.75% (Ports America Chesapeake, Inc.)/(Original Issue Yield: 5.875%), 6/1/2035 | 2,497,119 |
| 395,000 | Maryland State Health & Higher Educational Facilities Authority, Revenue Bonds (Series 2007A), 5.25% (King Farm Presbyterian Retirement Community), 1/1/2027 | 337,563 |
| 1,100,000 | Maryland State Health & Higher Educational Facilities Authority, Revenue Bonds (Series 2007A), 5.30% (King Farm Presbyterian Retirement Community)/(Original Issue Yield: 5.35%), 1/1/2037 | 815,452 |
| 500,000 | Maryland State IDFA, EDRBs (Series 2005A), 6.00% (Our Lady of Good Counsel High School), 5/1/2035 | 500,150 |
| TOTAL | 4,725,181 |
| Massachusetts – 1.9% |
| 1,500,000 | Massachusetts Development Finance Agency, Revenue Bonds (Series 2007A), 5.75% (Linden Ponds, Inc.), 11/15/2042 | 1,097,025 |
| 500,000 | 1,2 | Massachusetts Development Finance Agency, Senior Living Facility Revenue Bonds (Series 2009A), 7.75% (The Groves in Lincoln)/(Original Issue Yield: 7.90%), 6/1/2039 | 531,370 |
| 1,000,000 | 1,2 | Massachusetts Development Finance Agency, Senior Living Facility Revenue Bonds (Series 2009A), 7.875% (The Groves in Lincoln)/(Original Issue Yield: 8.00%), 6/1/2044 | 1,064,300 |
| 2,000,000 | Massachusetts HEFA, Revenue Bonds (Series 1998D), 5.25% (Jordan Hospital )/(Original Issue Yield: 5.53%), 10/1/2023 | 1,846,480 |
| 2,000,000 | Massachusetts HEFA, Revenue Bonds (Series 1999A), 5.75% (Caritas Christi Obligated Group)/(Original Issue Yield: 5.80%), 7/1/2028 | 1,964,840 |
| Principal Amount | Value |
| $2,000,000 | Massachusetts HEFA, Revenue Bonds (Series 2002B), 9.20% (Civic Investments)/(United States Treasury PRF 12/15/2012@102), 12/15/2031 | 2,410,420 |
| 1,000,000 | Massachusetts HEFA, Revenue Bonds (Series 2003E), 6.75% (Jordan Hospital)/(Original Issue Yield: 7.00%), 10/1/2033 | 1,005,010 |
| TOTAL | 9,919,445 |
| Michigan – 3.6% |
| 1,000,000 | Dearborn, MI Economic Development Corp., Revenue Refunding Bonds, 7.125% (Henry Ford Village)/(Original Issue Yield: 7.25%), 11/15/2043 | 990,430 |
| 4,000,000 | Detroit, MI Water Supply System, Second Lien Refunding Revenue Bonds (Series 2006C), 5.00% (Assured Guaranty Municipal Corp. INS), 7/1/2033 | 3,986,240 |
| 2,000,000 | Detroit, MI, UT GO Bonds (Series 2008-A), 5.00% (Assured Guaranty Corp. INS), 4/1/2028 | 1,958,700 |
| 1,000,000 | Iron River, MI Hospital Finance Authority, Hospital Revenue & Refunding Bonds (Series 2008), 6.50% (Iron County Community Hospitals, Inc.)/(Original Issue Yield: 6.61%), 5/15/2033 | 948,840 |
| 2,500,000 | Kent Hospital Finance Authority, MI, Revenue Bonds (Series 2005A), 6.25% (Metropolitan Hospital), 7/1/2040 | 2,395,650 |
| 3,165,000 | Michigan State Hospital Finance Authority, Refunding Revenue Bonds, 5.75% (Henry Ford Health System, MI)/(Original Issue Yield: 6.00%), 11/15/2039 | 3,279,067 |
| 5,000,000 | Michigan Tobacco Settlement Finance Authority, Tobacco Settlement Asset-Backed Bonds (Series 2007A), 6.00% (Original Issue Yield: 6.25%), 6/1/2048 | 3,790,700 |
| 1,500,000 | Plymouth, MI Educational Center Charter School, Public School Academy Revenue Refunding Bonds, Series 2005, 5.625%, 11/1/2035 | 1,343,400 |
| TOTAL | 18,693,027 |
| Minnesota – 2.9% |
| 1,000,000 | Baytown Township, MN, Lease Revenue Bonds (Series 2008A), 7.00% (St. Croix Preparatory Academy)/(Original Issue Yield: 7.05%), 8/1/2038 | 1,019,350 |
| 4,000,000 | Becker, MN, PCRBs (Series 2000-A), 8.50% (Northern States Power Co., MN), 4/1/2030 | 4,384,240 |
| 1,300,000 | Meeker County, MN, Gross Revenue Hospital Facilities Bonds (Series 2007), 5.75% (Meeker County Memorial Hospital), 11/1/2037 | 1,305,941 |
| 1,000,000 | Pine City, MN Lease Revenue, Lease Revenue Bonds (Series 2006A), 6.25% (Lakes International Language Academy), 5/1/2035 | 940,220 |
| 500,000 | Ramsey, MN, Lease Revenue Bonds (Series 2004A), 6.75% (Pact Charter School), 12/1/2033 | 500,990 |
| 1,000,000 | St. Paul, MN Housing & Redevelopment Authority, Refunding Revenue Bonds (Series 2003A), 7.00% (Achieve Language Academy), 12/1/2032 | 1,007,620 |
| Principal Amount | Value |
| $1,900,000 | St. Paul, MN Housing & Redevelopment Authority, Revenue Bonds (Series 2002B), 7.00% (Upper Landing Project)/(Original Issue Yield: 7.05%), 3/1/2029 | 1,907,695 |
| 1,865,000 | Winona, MN Port Authority, Lease Revenue Bonds (Series 2007A), 6.00% (Bluffview Montessori School Project), 11/1/2027 | 1,597,149 |
| 2,920,000 | Winona, MN Port Authority, Lease Revenue Bonds (Series 2007A), 6.15% (Bluffview Montessori School Project), 11/1/2037 | 2,387,567 |
| TOTAL | 15,050,772 |
| Missouri – 2.5% |
| 2,590,000 | Cass County, MO, Hospital Revenue Bonds (Series 2007), 5.625% (Cass Medical Center), 5/1/2038 | 2,446,100 |
| 2,445,000 | 1,2 | Kansas City, MO IDA, MFH Revenue Bonds, 6.90% (Woodbridge Apartments Project), 8/1/2030 | 2,272,456 |
| 1,000,000 | Kirkwood, MO IDA, Retirement Community Revenue Bonds (Series 2010A), 8.25% (Aberdeen Heights Project)/(Original Issue Yield: 8.40%), 5/15/2039 | 1,052,990 |
| 3,000,000 | Kirkwood, MO IDA, Retirement Community Revenue Bonds (Series 2010A), 8.25% (Aberdeen Heights Project)/(Original Issue Yield: 8.50%), 5/15/2045 | 3,090,150 |
| 3,000,000 | Missouri Development Finance Board, Infrastructure Facilities Revenue Bonds (Series 2005A), 5.00% (Branson, MO), 6/1/2035 | 2,872,470 |
| 1,000,000 | St. Joseph, MO IDA, Healthcare Revenue Bonds, 7.00% (Living Community St. Joseph Project), 8/15/2032 | 962,090 |
| 500,000 | West Plains, MO IDA, Hospital Revenue Bonds, 6.75% (Ozarks Medical Center)/(Original Issue Yield: 6.78%), 11/15/2024 | 499,955 |
| TOTAL | 13,196,211 |
| Nevada – 1.8% |
| 1,000,000 | Clark County, NV Improvement District, Special Assessment Revenue Refunding Bonds (Series 2006B), 5.30% (Southern Highlands SID No.121-B)/(Original Issue Yield: 5.33%), 12/1/2029 | 818,880 |
| 4,000,000 | Clark County, NV School District, LT GO Building Bonds (Series 2008A), 5.00%, 6/15/2025 | 4,397,160 |
| 935,000 | Clark County, NV, LO Improvement Bonds (Series 2003), 6.375% (Mountains Edge SID No. 142)/(Original Issue Yield: 6.40%), 8/1/2023 | 919,226 |
| 865,000 | Clark County, NV, Local Improvement Bonds (Series 2001), 6.875% (Summerlin-South SID No. 132)/(Original Issue Yield: 6.92%), 2/1/2021 | 850,771 |
| 490,000 | Clark County, NV, Special Assessment Revenue Bonds (Series 2005), 5.00% (Summerlin-Mesa SID No. 151), 8/1/2025 | 351,403 |
| 1,275,000 | Henderson, NV, LO Improvement Bonds, 5.30% (Inspirada Local Improvement District No. T-18)/(Original Issue Yield: 5.33%), 9/1/2035 | 625,515 |
| 485,000 | Las Vegas, NV, Local Improvement Special Assessment Bonds (Series 2004), 6.00% (Providence SID No. 607), 6/1/2019 | 460,891 |
| Principal Amount | Value |
| $920,000 | North Las Vegas, NV SID No. 60, Subordinate LT Obligation Refunding Bonds (Series 2006B), 5.10% (Aliante SID No. 60), 12/1/2022 | 796,398 |
| TOTAL | 9,220,244 |
| New Hampshire – 0.7% |
| 500,000 | New Hampshire Business Finance Authority, Refunding PCRBs (Series 1997A), 7.125% TOBs (United Illuminating Co.), Mandatory Tender 2/1/2012 | 524,870 |
| 3,000,000 | Strafford County, NH, 6.50% TANs, 12/31/2010 | 3,014,790 |
| TOTAL | 3,539,660 |
| New Jersey – 2.4% |
| 1,800,000 | New Jersey EDA, Kapkowski Road Landfill Revenue Bonds, 6.50% (New Jersey Metromall Urban Renewal, Inc.)/(Original Issue Yield: 6.55%), 4/1/2018 | 1,937,412 |
| 1,550,000 | New Jersey EDA, Revenue Bonds (Series 1997A), 5.875% (Host Marriott Corp.), 12/1/2027 | 1,380,554 |
| 2,000,000 | New Jersey EDA, Revenue Bonds, 6.25% (Continental Airlines, Inc.), 9/15/2019 | 1,960,020 |
| 3,000,000 | New Jersey EDA, Revenue Bonds, Series 2004, 5.50% (NJ Dedicated Cigarette Excise Tax), 6/15/2016 | 3,160,560 |
| 1,000,000 | New Jersey EDA, Revenue Bonds, Series 2004, 5.75% (NJ Dedicated Cigarette Excise Tax)/(Original Issue Yield: 5.93%), 6/15/2034 | 984,620 |
| 1,000,000 | New Jersey EDA, Special Facilities Revenue Bonds (Series 2000), 7.20% (Continental Airlines, Inc.)/(Original Issue Yield: 7.25%), 11/15/2030 | 1,006,590 |
| 142,710 | 5 | New Jersey Health Care Facilities Financing Authority, Revenue Bonds, 6.50% (Pascack Valley Hospital Association)/(Original Issue Yield: 6.72%), 7/1/2023 | 1 |
| 2,000,000 | New Jersey Health Care Facilities Financing Authority, Revenue Bonds, 6.625% (Palisades Medical Center)/(Original Issue Yield: 6.67%), 7/1/2031 | 1,895,760 |
| TOTAL | 12,325,517 |
| New Mexico – 1.0% |
| 850,000 | Bernalillo County, NM MFH, Refunding Housing Revenue Bonds (Series 2001C), 7.50% (Valencia Retirement)/(SunAmerica, Inc. GTD), 12/1/2021 | 842,240 |
| 2,340,000 | Dona Ana County, NM, MFH Revenue Bonds (Series 2001A), 7.00% (Montana Meadows Apartments), 12/1/2030 | 2,343,112 |
| 2,000,000 | Farmington, NM, PCR Revenue Refunding Bonds (Series 2010E), 5.90% (Public Service Co., NM), 6/1/2040 | 2,073,300 |
| TOTAL | 5,258,652 |
| New York – 7.0% |
| 2,445,000 | Brookhaven, NY IDA, Senior Residential Housing Revenue Bonds, 6.25% (Woodcrest Estates), 12/1/2023 | 2,412,261 |
| Principal Amount | Value |
| $1,495,000 | Brooklyn Arena Local Development Corporation, NY, Pilot Revenue Bonds (Series 2009), 6.375% (Original Issue Yield: 6.476%), 7/15/2043 | 1,598,828 |
| 2,750,000 | Chautauqua County, NY IDA, Exempt Facility Revenue Bonds (Series 2009), 5.875% (NRG Energy, Inc.), 4/1/2042 | 2,861,348 |
| 2,000,000 | Nassau County, NY IDA, Continuing Care Retirement Community Fixed Rate Revenue Bonds (Series 2007A), 6.70% (Amsterdam at Harborside), 1/1/2043 | 2,018,160 |
| 2,475,000 | New York City Liberty Development Corp., Revenue Bonds (Series 2005), 5.25% (Goldman Sachs Group, Inc.), 10/1/2035 | 2,603,601 |
| 2,000,000 | New York City Liberty Development Corp., Second Priority Liberty Revenue Refunding Bonds (Series 2010 Class 2), 5.625% (One Bryant Park LLC), 7/15/2047 | 2,076,420 |
| 6,000,000 | 1,2 | New York City, NY IDA, Liberty Revenue Bonds (Series A), 6.50% (7 World Trade Center LLC), 3/1/2035 | 6,005,160 |
| 2,000,000 | 1,2 | New York City, NY IDA, Liberty Revenue Bonds (Series B), 6.75% (7 World Trade Center LLC), 3/1/2015 | 2,036,680 |
| 2,000,000 | New York City, NY IDA, Pilot Revenue Bonds (Series 2009A), 7.00% (Yankee Stadium LLC)/(Assured Guaranty Corp. INS)/(Original Issue Yield: 0.00%), 3/1/2049 | 2,366,380 |
| 1,000,000 | New York City, NY IDA, Special Facilities Revenue Bonds (Series 2006), 5.125% (Jet Blue Airways Corp.)/(Original Issue Yield: 5.35%), 5/15/2030 | 854,170 |
| 1,500,000 | New York City, NY IDA, Special Facility Revenue Bonds (Series 2002), 7.625% (British Airways)/(Original Issue Yield: 7.976%), 12/1/2032 | 1,522,035 |
| 5,500,000 | New York City, NY IDA, Special Facility Revenue Bonds (Series 2005), 8.00% (American Airlines, Inc.)/(Original Issue Yield: 8.095%), 8/1/2028 | 5,853,650 |
| 300,000 | New York State Dormitory Authority, Revenue Bonds (Series 2005), 5.00% (Rochester General Hospital)/(Radian Asset Assurance, Inc. INS), 12/1/2035 | 282,360 |
| 3,000,000 | 1,2 | Triborough Bridge & Tunnel Authority, NY, DRIVERs (Series 3063), 11.157%, 5/15/2016 | 4,050,390 |
| TOTAL | 36,541,443 |
| North Carolina – 0.8% |
| 2,335,000 | North Carolina Eastern Municipal Power Agency, Power System Revenue Bonds (Series 2009C), 5.00%, 1/1/2026 | 2,523,038 |
| 500,000 | North Carolina Medical Care Commission, Health Care Facilities Revenue Bonds (Series 2005A), 5.65% (Pennybyrn at Maryfield)/(Original Issue Yield: 5.85%), 10/1/2025 | 431,630 |
| 1,200,000 | North Carolina Medical Care Commission, Health Care Housing Revenue Bonds (Series 2004A), 5.80% (Arc of North Carolina Projects), 10/1/2034 | 1,223,160 |
| TOTAL | 4,177,828 |
| Principal Amount | Value |
| Ohio – 3.7% |
| $9,655,000 | Buckeye Tobacco Settlement Financing Authority, OH, Tobacco Settlement Asset-Backed Bonds (Series 2007A), 6.50%, 6/1/2047 | 7,701,214 |
| 1,500,000 | Cleveland-Cuyahoga County, OH Port Authority, Special Assessment Tax-Increment Revenue Bonds, 7.35% (University Heights, OH Public Parking Garage), 12/1/2031 | 1,515,615 |
| 2,910,000 | Ohio State Air Quality Development Authority, Revenue Bonds (Series 2009A), 5.70% (FirstEnergy Solutions Corp.), 8/1/2020 | 3,281,083 |
| 3,000,000 | Ohio State Higher Educational Facility Commission, Higher Education Facility Revenue Bonds (Series 2006), 5.00% (Kenyon College, OH), 7/1/2041 | 3,074,490 |
| 2,355,000 | Ohio State Higher Educational Facility Commission, Hospital Facilities Revenue Bonds (Series 2010), 5.75% (Summa Health System)/(Original Issue Yield: 5.92%), 11/15/2040 | 2,419,998 |
| 1,500,000 | Port Authority for Columbiana County, OH, Solid Waste Facility Revenue Bonds (Series 2004A), 7.25% (Apex Environmental LLC)/(Original Issue Yield: 7.30%), 8/1/2034 | 1,278,615 |
| TOTAL | 19,271,015 |
| Oklahoma – 1.2% |
| 2,530,000 | Jackson County, OK Hospital Authority, Hospital Revenue Refunding Bonds, 7.30% (Jackson County Memorial Hospital, OK)/(Original Issue Yield: 7.40%), 8/1/2015 | 2,532,378 |
| 1,000,000 | Oklahoma County, OK Finance Authority, Retirement Facility Revenue Bonds (Series 2005), 6.00% (Concordia Life Care Community)/(Original Issue Yield: 6.15%), 11/15/2038 | 925,930 |
| 1,000,000 | Oklahoma County, OK Finance Authority, Retirement Facility Revenue Bonds (Series 2005), 6.125% (Concordia Life Care Community), 11/15/2025 | 988,790 |
| 2,000,000 | Tulsa, OK Industrial Authority, Senior Living Community Revenue Bonds (Series 2010A), 7.25% (Montereau, Inc.)/(Original Issue Yield: 7.50%), 11/1/2045 | 2,017,660 |
| TOTAL | 6,464,758 |
| Oregon – 0.6% |
| 1,000,000 | Clackamas County, OR Hospital Facilities Authority, Refunding Gross Revenue Bonds (Series 2005), 5.125% (Willamette Falls Hospital), 4/1/2026 | 941,880 |
| 1,000,000 | 1,2 | Cow Creek Band of Umpqua Tribe of Indians, Tax-Exempt Tax Revenue Bonds (Series 2006C), 5.625%, 10/1/2026 | 802,370 |
| 1,000,000 | Yamhill County, OR Hospital Authority, Revenue Bonds, 7.00% (Friendsview Retirement Community)/(United States Treasury PRF 12/1/2013@101)/(Original Issue Yield: 7.125%), 12/1/2034 | 1,201,630 |
| TOTAL | 2,945,880 |
| Pennsylvania – 6.7% |
| 1,215,000 | Allegheny County, PA HDA, Health Care Facilities Revenue Bonds (Series 1998), 5.875% (Villa St. Joseph of Baden, Inc.)/(Original Issue Yield: 6.02%), 8/15/2018 | 1,189,849 |
| Principal Amount | Value |
| $1,800,000 | 1,2 | Allegheny County, PA IDA, Cargo Facilities Lease Revenue Bonds (Series 1999), 6.625% (AFCO Cargo PIT LLC Project)/(Original Issue Yield: 6.75%), 9/1/2024 | 1,615,392 |
| 1,120,000 | Allegheny County, PA IDA, Charter School Revenue Bonds (Series 2004A), 7.50% (Propel Schools)/(Original Issue Yield: 7.75%), 12/15/2029 | 1,144,416 |
| 865,000 | Allegheny County, PA IDA, Environmental Improvement Refunding Revenue Bonds (Series 2005), 5.50% (United States Steel Corp.), 11/1/2016 | 890,881 |
| 2,000,000 | Allegheny County, PA IDA, Environmental Improvement Revenue Refunding Bonds (Series 2009), 6.875% (United States Steel Corp.), 5/1/2030 | 2,198,740 |
| 2,000,000 | Carbon County, PA IDA, Refunding Revenue Bonds, 6.70% (Panther Creek Partners Project), 5/1/2012 | 2,012,580 |
| 1,500,000 | Centre County, PA Hospital Authority, Hospital Revenue Bonds, 6.25% (Mount Nittany Medical Center)/(Assured Guaranty Corp. INS)/(Original Issue Yield: 6.30%), 11/15/2044 | 1,585,320 |
| 1,500,000 | Chartiers Valley, PA Industrial & Commercial Development Authority, First Mortgage Revenue Refunding Bonds (Series 1999), 6.375% (Asbury Health Center)/(Original Issue Yield: 6.52%), 12/1/2024 | 1,510,080 |
| 1,500,000 | Chester County, PA IDA, Revenue Bonds (Series 2007A), 6.375% (Avon Grove Charter School)/(Original Issue Yield: 6.45%), 12/15/2037 | 1,497,885 |
| 1,500,000 | Clarion County, PA IDA, Water Facility Revenue Refunding Bonds (Series 2009), 5.50% (Pennsylvania American Water Co.), 12/1/2039 | 1,585,605 |
| 2,000,000 | Cumberland County, PA Municipal Authority, Retirement Community Revenue Bonds (Series 2002A), 7.25% (Wesley Affiliated Services, Inc. Obligated Group)/(United States Treasury PRF 1/1/2013@101)/ (Original Issue Yield: 7.50%), 1/1/2035 | 2,314,680 |
| 3,000,000 | Harrisburg, PA Authority, Water Revenue Refunding Bonds (Series 2008), 5.25% (Original Issue Yield: 5.35%), 7/15/2031 | 3,063,780 |
| 1,500,000 | Monroe County, PA Hospital Authority, Hospital Revenue Bonds (Series 2007), 5.125% (Pocono Medical Center)/(Original Issue Yield: 5.20%), 1/1/2037 | 1,507,545 |
| 4,000,000 | Pennsylvania EDFA, Exempt Facilities Revenue Bonds (Series 2009), 7.00% (Allegheny Energy Supply Company LLC), 7/15/2039 | 4,573,480 |
| 900,000 | Philadelphia Authority for Industrial Development, Senior Living Revenue Bonds (Series 2005A), 5.625% (PresbyHomes Germantown/Morrisville), 7/1/2035 | 794,457 |
| 4,000,000 | Philadelphia, PA Gas Works, Revenue Bonds (Ninth Series 1998 General Ordinance), 5.25% (Original Issue Yield: 5.28%), 8/1/2040 | 4,087,920 |
| 4,000,000 | Sayre, PA, Health Care Facilities Authority, Revenue Bonds, 1.189% (Guthrie Healthcare System, PA), 12/1/2031 | 2,509,320 |
| Principal Amount | Value |
| $660,000 | Washington County, PA Redevelopment Authority, Redevelopment Bonds (Series 2006A), 5.45% (Victory Centre Project-Tanger Outlet Development), 7/1/2035 | 605,425 |
| TOTAL | 34,687,355 |
| Puerto Rico – 1.4% |
| 3,000,000 | Puerto Rico Highway and Transportation Authority, Highway Revenue Refunding Bonds (Series AA-2), 5.30%, 7/1/2035 | 3,113,880 |
| 4,000,000 | Puerto Rico Sales Tax Financing Corp., Sales Tax Revenue Bonds (First Subordinate Series 2009A), 6.00% (Original Issue Yield: 6.25%), 8/1/2042 | 4,381,160 |
| TOTAL | 7,495,040 |
| Rhode Island – 0.9% |
| 4,000,000 | Rhode Island State Health and Educational Building Corp., Hospital Financing Revenue Bonds (Series 2009A), 7.00% (Lifespan Obligated Group)/(Assured Guaranty Corp. INS), 5/15/2039 | 4,740,640 |
| South Carolina – 0.9% |
| 6,000,000 | 1,4,6 | Connector 2000 Association, Inc., SC, Capital Appreciation Senior Revenue Bonds (Series 1998B) (Original Issue Yield: 5.80%), 1/1/2025 | 420,600 |
| 7,750,000 | 1,4,6 | Connector 2000 Association, Inc., SC, Toll Road Capital Appreciation Revenue Bonds (Series 1998A) (Original Issue Yield: 5.85%), 1/1/2034 | 321,393 |
| 735,000 | Lancaster County, SC, Assessment Revenue Bonds (Series 2006), 5.45% (Sun City Carolina Lakes Improvement District), 12/1/2037 | 627,859 |
| 1,000,000 | Myrtle Beach, SC, Tax Increment Bonds (Series 2006A), 5.25% (Myrtle Beach Air Force Base Redevelopment Project Area)/(Original Issue Yield: 5.27%), 10/1/2026 | 731,810 |
| 750,000 | Myrtle Beach, SC, Tax Increment Bonds (Series 2006A), 5.30% (Myrtle Beach Air Force Base Redevelopment Project Area)/(Original Issue Yield: 5.325%), 10/1/2035 | 491,460 |
| 2,000,000 | South Carolina Jobs-EDA, Refunding & Improvement Revenue Bonds (Series 2009), 5.75% (Palmetto Health Alliance)/(Original Issue Yield: 5.90%), 8/1/2039 | 2,057,460 |
| TOTAL | 4,650,582 |
| South Dakota – 0.5% |
| 2,605,000 | Educational Enhancement Funding Corp., SD, Tobacco Revenue Bonds (Series 2002B), 6.50%, 6/1/2032 | 2,620,890 |
| Tennessee – 1.0% |
| 3,000,000 | Elizabethton, TN Health & Educational Facilities Board, First Mortgage Hospital Revenue Refunding & Improvement Bonds (Series 2000B), 8.00% (Mountain States Health Alliance)/(United States Treasury PRF 7/1/2012@103), 7/1/2033 | 3,381,450 |
| 1,000,000 | Johnson City, TN Health & Education Facilities Board, Hospital First Mortgage Revenue Bonds (Series 2006A), 5.50% (Mountain States Health Alliance), 7/1/2036 | 1,011,840 |
| Principal Amount | Value |
| $1,000,000 | Johnson City, TN Health & Education Facilities Board, Hospital Refunding Bonds (Series 2010A), 5.625% (Mountain States Health Alliance)/(Original Issue Yield: 5.90%), 7/1/2030 | 1,038,560 |
| TOTAL | 5,431,850 |
| Texas – 7.5% |
| 2,000,000 | ABIA Development Corp., TX, Airport Facilities Revenue Bonds (Series 1999), 7.25% (Aero Austin LP)/(Original Issue Yield: 7.50%), 1/1/2025 | 642,100 |
| 1,000,000 | Austin, TX Convention Center Enterprises, Inc., Convention Center Hotel Second Tier Revenue Refunding Bonds (Series 2006B), 5.75%, 1/1/2024 | 951,650 |
| 1,000,000 | Austin, TX Convention Center Enterprises, Inc., Convention Center Hotel Second Tier Revenue Refunding Bonds (Series 2006B), 5.75%, 1/1/2034 | 923,960 |
| 755,000 | Bexar County, HFDC, Revenue Bonds (Series 2010), 6.20% (Army Retirement Residence Foundation), 7/1/2045 | 784,196 |
| 1,000,000 | Brazos River Authority, TX, Refunding PCRBs (Series 1994A), 5.40% (Texas Competitive Electric Holdings Co. LLC), 5/1/2029 | 400,000 |
| 2,380,000 | Brazos River Authority, TX, Refunding PCRBs (Series 2001C), 5.75% TOBs (Texas Competitive Electric Holdings Co. LLC), Mandatory Tender 11/1/2011 | 2,272,900 |
| 5,000,000 | Brazos River Authority, TX, Refunding PCRBs (Series 2001D-1), 8.25% (Texas Competitive Electric Holdings Co. LLC), 5/1/2033 | 2,425,050 |
| 1,000,000 | Brazos River Authority, TX, Refunding PCRBs (Series 2003A), 6.75% TOBs (Texas Competitive Electric Holdings Co. LLC), Mandatory Tender 4/1/2013 | 750,000 |
| 715,000 | Brazos River Authority, TX, Refunding PCRBs (Series 2003C), 6.75% (Texas Competitive Electric Holdings Co. LLC)/(Original Issue Yield: 6.77%), 10/1/2038 | 314,607 |
| 2,000,000 | Cass County, TX IDC, Environmental Improvement Revenue Bonds (Series 2009A), 9.50% (International Paper Co.), 3/1/2033 | 2,574,740 |
| 4,000,000 | Decatur, TX Hospital Authority, Hospital Revenue Bonds (Series 2004A), 7.125% (Wise Regional Health System), 9/1/2034 | 4,052,240 |
| 2,000,000 | Harris County, TX HFDC, Hospital Revenue Refunding Bonds (Series 2008B), 7.25% (Memorial Hermann Healthcare System)/(Original Issue Yield: 7.30%), 12/1/2035 | 2,317,080 |
| 765,000 | HFDC of Central Texas, Inc., Retirement Facility Revenue Bonds (Series 2006A), 5.50% (Village at Gleannloch Farms, Inc.), 2/15/2027 | 681,271 |
| 1,265,000 | HFDC of Central Texas, Inc., Retirement Facility Revenue Bonds (Series 2006A), 5.50% (Village at Gleannloch Farms, Inc.), 2/15/2037 | 1,037,793 |
| 1,000,000 | HFDC of Central Texas, Inc., Retirement Facility Revenue Bonds (Series 2006A), 5.75% (Legacy at Willow Bend), 11/1/2036 | 844,540 |
| 1,000,000 | Houston, TX Airport System, Special Facilities Revenue Bonds (Series 2001), 7.00% (Continental Airlines, Inc.), 7/1/2029 | 1,007,360 |
| Principal Amount | Value |
| $2,000,000 | Kerrville, TX HFDC, Hospital Revenue Bonds, 5.375% (Sid Peterson Memorial Hospital), 8/15/2035 | 1,921,660 |
| 4,000,000 | Lufkin, TX HFDC, Revenue Refunding and Improvement Bonds (Series 2009), 6.25% (Memorial Health System of East Texas)/(Original Issue Yield: 6.50%), 2/15/2037 | 4,124,200 |
| 1,000,000 | Matagorda County, TX Navigation District No. 1, PCRBs (Series 2001A), 6.30% (AEP Texas Central Co.), 11/1/2029 | 1,111,600 |
| 1,000,000 | Mission, TX Economic Development Corp., Solid Waste Disposal Revenue Bonds (Series 2007A), 5.20% (Allied Waste North America, Inc.)/(Original Issue Yield: 5.30%), 4/1/2018 | 1,009,250 |
| 2,000,000 | 4 | North Texas Tollway Authority, Capital Appreciation Refunding Bonds (Series 2008 First Tier-I), 6.20% (Assured Guaranty Corp. INS)/(Original Issue Yield: 6.20%), 1/1/2042 | 1,706,640 |
| 230,000 | Port of Corpus Christi, TX IDC, Revenue Refunding Bonds (Series C), 5.40% (Valero Energy Corp.), 4/1/2018 | 230,000 |
| 2,000,000 | 7 | Tarrant County, TX Cultural Education Facilities Finance Corp., Hospital Revenue Bonds (Series 2006), 6.375% (Doctors Hospital)/(Original Issue Yield: 6.60%), 11/1/2036 | 770,740 |
| 200,000 | Tarrant County, TX Cultural Education Facilities Finance Corp., Revenue Bonds, Series 2006A, 6.00% (Northwest Senior Housing Corp. Edgemere Project), 11/15/2026 | 205,072 |
| 1,150,000 | Tarrant County, TX Cultural Education Facilities Finance Corp., Revenue Bonds, Series 2006A, 6.00% (Northwest Senior Housing Corp. Edgemere Project), 11/15/2036 | 1,137,891 |
| 900,000 | Tarrant County, TX HFDC, Revenue Bonds (Series 1998C), 5.75% (Bethesda Living Center)/(Original Issue Yield: 5.89%), 8/15/2018 | 865,827 |
| 1,000,000 | Tarrant County, TX HFDC, Revenue Bonds (Series 1998C), 5.75% (Bethesda Living Center)/(Original Issue Yield: 5.97%), 8/15/2028 | 881,660 |
| 2,000,000 | 3 | Texas State Affordable Housing Corp., MFH Revenue Bonds (Junior Series 2002B), 8.00% (American Housing Foundation)/(Original Issue Yield: 8.365%), 3/1/2032 | 99,820 |
| 2,000,000 | Texas State Public Finance Authority Charter School Finance Corporation, Education Revenue Bonds (Series 2010A), 6.20% (Cosmos Foundation, Inc. ), 2/15/2040 | 2,069,300 |
| 1,000,000 | Tom Green County, TX HFDC, Hospital Revenue Bonds, 6.75% (Shannon Health System)/(Original Issue Yield: 6.85%), 5/15/2021 | 1,023,720 |
| TOTAL | 39,136,867 |
| Utah – 0.7% |
| 800,000 | Spanish Fork City, UT, Charter School Revenue Bonds (Series 2006), 5.55% (American Leadership Academy), 11/15/2026 | 713,424 |
| 1,750,000 | Spanish Fork City, UT, Charter School Revenue Bonds (Series 2006), 5.70% (American Leadership Academy), 11/15/2036 | 1,496,898 |
| 1,315,000 | 1,2 | Utah State Charter School Finance Authority, Charter School Revenue Bonds (Series 2007A), 6.00% (Channing Hall), 7/15/2037 | 1,169,600 |
| TOTAL | 3,379,922 |
| Principal Amount | Value |
| Virginia – 2.3% |
| $675,000 | Broad Street CDA, VA, Revenue Bonds, 7.10% (Original Issue Yield: 7.15%), 6/1/2016 | 681,480 |
| 1,000,000 | Broad Street CDA, VA, Revenue Bonds, 7.50% (Original Issue Yield: 7.625%), 6/1/2033 | 962,970 |
| 1,500,000 | Chesterfield County, VA EDA, Refunding PCRBs (Series 2009A), 5.00% (Virginia Electric & Power Co.), 5/1/2023 | 1,660,965 |
| 1,470,000 | Henrico County, VA EDA, Residential Care Facility Revenue Refunding Bonds, 6.70% (Virginia United Methodist Homes, Inc.)/(Original Issue Yield: 6.80%), 6/1/2027 | 1,472,675 |
| 1,500,000 | Peninsula Port Authority, VA, Residential Care Facility Revenue Bonds (Series 2003A), 7.375% (Virginia Baptist Homes Obligated Group)/(United States Treasury PRF 12/1/2013@100)/(Original Issue Yield: 7.625%), 12/1/2032 | 1,787,430 |
| 1,500,000 | Peninsula Town Center CDA, VA, Special Obligation Bonds (Series 2007), 6.35%, 9/1/2028 | 1,512,615 |
| 1,000,000 | Peninsula Town Center CDA, VA, Special Obligation Bonds (Series 2007), 6.45%, 9/1/2037 | 994,940 |
| 4,250,000 | Tobacco Settlement Financing Corp., VA, Tobacco Settlement Asset-Backed Bonds (Series 2007B-1), 5.00% (Original Issue Yield: 5.12%), 6/1/2047 | 2,855,703 |
| TOTAL | 11,928,778 |
| Washington – 1.4% |
| 3,000,000 | Tobacco Settlement Authority, WA, Tobacco Settlement Asset Backed Revenue Bonds, 6.625% (Original Issue Yield: 6.875%), 6/1/2032 | 3,020,130 |
| 1,500,000 | 1,2 | Washington State Health Care Facilities Authority, Revenue Bonds (Series 2007A), 6.25% (Virginia Mason Medical Center)/(Original Issue Yield: 6.375%), 8/15/2042 | 1,570,425 |
| 2,000,000 | 1,2 | Washington State, UT GO Bonds (ROLs II-R11609), 11.50571%, 1/1/2016 | 2,651,060 |
| TOTAL | 7,241,615 |
| West Virginia – 1.3% |
| 640,000 | Ohio County, WV County Commission, Special District Excise Tax Revenue Refunding & Improvement Bonds (Series 2006A), 5.625% (Fort Henry Economic Opportunity Development District), 3/1/2036 | 623,520 |
| 1,000,000 | Ohio County, WV County Commission, Tax Increment Revenue Bonds (Series 2005A), 5.625% (Fort Henry Centre Tax Increment Financing District No. 1), 6/1/2034 | 917,310 |
| 1,000,000 | Ohio County, WV County Commission, Tax Increment Revenue Bonds (Series 2007A), 5.85% (Fort Henry Centre Tax Increment Financing District No. 1), 6/1/2034 | 944,830 |
| 4,000,000 | West Virginia EDA, Solid Waste Disposal Facilities Revenue Refunding Bonds (Series 2010A), 5.375% (Appalachian Power Co.), 12/1/2038 | 4,083,440 |
| TOTAL | 6,569,100 |
| Principal Amount | Value |
| Wisconsin – 3.3% |
| $735,000 | Badger, WI Tobacco Asset Securitization Corp., Asset-Backed Revenue Bonds, 6.125% (United States Treasury PRF)/(Original Issue Yield: 6.35%), 6/1/2027 | 788,236 |
| 750,000 | Milwaukee, WI Redevelopment Authority, Redevelopment Education Revenue Bonds (Series 2005A), 5.75% (Milwaukee Science Education Consortium, Inc.)/(Original Issue Yield: 5.93%), 8/1/2035 | 717,472 |
| 5,335,000 | Wisconsin State General Fund Appropriation, Revenue Bonds (Series 2009A), 5.75% (Wisconsin State)/(Original Issue Yield: 5.950%), 5/1/2033 | 6,067,229 |
| 1,400,000 | Wisconsin State HEFA, Revenue Bonds (Series 2004), 6.125% (Eastcastle Place, Inc.)/(Original Issue Yield: 6.25%), 12/1/2034 | 1,243,256 |
| 1,000,000 | Wisconsin State HEFA, Revenue Bonds (Series 2004A), 6.75% (Beaver Dam Community Hospitals, Inc.)/(Original Issue Yield: 6.95%), 8/15/2034 | 1,013,060 |
| 2,000,000 | Wisconsin State HEFA, Revenue Bonds (Series 2006A), 5.25% (Wheaton Franciscan HealthCare), 8/15/2031 | 1,957,660 |
| 1,250,000 | Wisconsin State HEFA, Revenue Bonds, 5.80% (Beaver Dam Community Hospitals, Inc.), 8/15/2028 | 1,187,175 |
| 500,000 | Wisconsin State HEFA, Revenue Bonds, 6.625% (Tomah Memorial Hospital, Inc.)/(Original Issue Yield: 6.875%), 7/1/2028 | 504,295 |
| 1,000,000 | Wisconsin State HEFA, Revenue Bonds, Series 2006A, 5.375% (Marshfield Clinic), 2/15/2034 | 1,005,360 |
| 2,000,000 | 1,2 | Wisconsin State, UT GO Bonds (ROLs II-R11604), 10.69904%, 5/1/2016 | 2,642,680 |
| TOTAL | 17,126,423 |
| Wyoming – 0.7% |
| 2,000,000 | Sweetwater County, WY PCRB, Solid Waste Disposal Refunding Revenue Bonds (Series 2005), 5.60% (FMC Corp.), 12/1/2035 | 2,003,140 |
| 1,500,000 | Teton County, WY Hospital District, Hospital Revenue Bonds, 6.75% (St. John's Medical Center)/(Original Issue Yield: 7.00%), 12/1/2027 | 1,501,650 |
| TOTAL | 3,504,790 |
| TOTAL MUNICIPAL BONDS (IDENTIFIED COST $518,119,142) | 495,946,091 |
| CORPORATE BONDS – 1.2% |
| Multi State – 1.2% |
| 1,500,000 | 1,2 | Charter Mac Equity Issuer Trust, Pfd., 7.60%, 12/15/2010 | 1,516,470 |
| 2,000,000 | 1 | Muni Mae TE Bond Subsidiary LLC, Pfd., 7.75%, 6/30/2050 | 1,620,040 |
| 4,000,000 | 1 | Non-Profit Preferred Funding Trust I, Partnership, 9/15/2037 | 2,998,000 |
| TOTAL CORPORATE BONDS (IDENTIFIED COST $7,489,570) | 6,134,510 |
| Principal Amount | Value |
| SHORT-TERM MUNICIPALS – 1.1%;8 |
| Pennsylvania – 1.1% |
| $4,200,000 | Pennsylvania State Higher Education Facilities Authority, (Series 2007B) Weekly VRDNs (La Salle University)/(Citizens Bank of Pennsylvania LOC), 0.450%, 9/1/2010 | 4,200,000 |
| 1,700,000 | Philadelphia, PA Authority for Industrial Development, (Series 2007A) Daily VRDNs (Fox Chase Cancer Center)/(Citizens Bank of Pennsylvania LOC), 0.400%, 9/1/2010 | 1,700,000 |
| TOTAL SHORT-TERM MUNICIPALS (AT AMORTIZED COST) | 5,900,000 |
| TOTAL INVESTMENTS — 97.7% (IDENTIFIED COST $531,508,712)9 | 507,980,601 |
| OTHER ASSETS AND LIABILITIES - NET — 2.3%10 | 11,921,844 |
| TOTAL NET ASSETS — 100% | $519,902,445 |
Securities that are subject to the federal alternative minimum tax (AMT) represent 12.6% of the Fund's portfolio as calculated based upon total market value (percentage is unaudited).
| 1 | Denotes a restricted security that either: (a) cannot be offered for public sale without first being registered, or being able to take advantage of an exemption from registration, under the Securities Act of 1933; or (b) is subject to a contractual restriction on public sales. At August 31, 2010, these restricted securities amounted to $40,607,543, which represented 7.8% of total net assets. |
| 2 | Denotes a restricted security that may be resold without restriction to “qualified institutional buyers” as defined in Rule 144A under the Securities Act of 1933 and that the Fund has determined to be liquid under criteria established by the Fund's Board of Trustees. At August 31, 2010, these liquid restricted securities amounted to $34,542,677, which represented 6.6% of total net assets. |
| 3 | Non-income producing security. |
| 4 | Zero coupon bond, reflects effective rate at time of purchase. |
| 5 | Obligor had filed for bankruptcy. On September 30, 2008, a Notice of Initial Distribution was received and a portion of the bond was redeemed at par. The market value of the remaining par was adjusted to reflect the expected value of future cash flows. |
| 6 | On June 24, 2010, obligor filed for bankruptcy protection. |
| 7 | Partial payment received on scheduled semi-annual interest payment date of May 1, 2010. |
| 8 | Current rate and next reset date shown on Variable Rate Demand Notes. |
| 9 | The cost of investments for federal tax purposes amounts to $532,828,328. |
| 10 | Assets, other than investments in securities, less liabilities. See Statement of Assets and Liabilities. |
Note: The categories of investments are shown as a percentage of total net assets at August 31, 2010.
Various inputs are used in determining the value of the Fund's investments. These inputs are summarized in the three broad levels listed below:
Level 1 — quoted prices in active markets for identical securities
Level 2 — other significant observable inputs (including quoted prices for similar securities, interest rates, prepayment speeds, credit risk, etc.)
Level 3 — significant unobservable inputs (including the Fund's own assumptions in determining the fair value of investments)
Annual Shareholder ReportAs of August 31, 2010, all investments of the Fund utilized Level 2 inputs in valuing the Fund's assets carried at fair value.
The following acronyms are used throughout this portfolio:
| AMBAC | — American Municipal Bond Assurance Corporation |
| CDA | — Community Development Authority |
| COL | — Collateralized |
| COP | — Certificate of Participation |
| DRIVERs | — Derivative Inverse Tax-Exempt Receipts |
| EDA | — Economic Development Authority |
| EDFA | — Economic Development Finance Authority |
| EDRBs | — Economic Development Revenue Bonds |
| GNMA | — Government National Mortgage Association |
| GO | — General Obligation |
| GTD | — Guaranteed |
| HDA | — Hospital Development Authority |
| HEFA | — Health and Education Facilities Authority |
| HFA | — Housing Finance Authority |
| HFDC | — Health Facility Development Corporation |
| IDA | — Industrial Development Authority |
| IDB | — Industrial Development Bond |
| IDC | — Industrial Development Corporation |
| IDFA | — Industrial Development Finance Authority |
| IDRB | — Industrial Development Revenue Bond |
| INS | — Insured |
| LO | — Limited Obligation |
| LOC | — Letter of Credit |
| LT | — Limited Tax |
| MFH | — Multi-Family Housing |
| PCFA | — Pollution Control Finance Authority |
| PCR | — Pollution Control Revenue |
| PCRBs | — Pollution Control Revenue Bonds |
| PRF | — Prerefunded |
| SFM | — Single Family Mortgage |
| SID | — Special Improvement District |
| TANs | — Tax Anticipation Notes |
| TOBs | — Tender Option Bonds |
| UT | — Unlimited Tax |
| VRDNs | — Variable Rate Demand Notes |
See Notes which are an integral part of the Financial Statements
Annual Shareholder ReportStatement of Assets and Liabilities
August 31, 2010
| Assets: |
| Total investments in securities, at value (identified cost $531,508,712) | $507,980,601 |
| Cash | 82,962 |
| Income receivable | 8,788,347 |
| Receivable for shares sold | 2,246,990 |
| Receivable for investments sold | 1,567,854 |
| TOTAL ASSETS | 520,666,754 |
| Liabilities: |
| Payable for shares redeemed | $534,238 |
| Payable for shareholder services fee (Note 5) | 105,228 |
| Payable for distribution services fee (Note 5) | 56,190 |
| Payable for transfer and dividend disbursing agent fees and expenses | 35,372 |
| Accrued expenses | 33,281 |
| TOTAL LIABILITIES | 764,309 |
| Net assets for 60,503,721 shares outstanding | $519,902,445 |
| Net Assets Consist of: |
| Paid-in capital | $601,195,811 |
| Net unrealized depreciation of investments | (23,528,111) |
| Accumulated net realized loss on investments, futures contracts and swap contracts | (59,034,641) |
| Undistributed net investment income | 1,269,386 |
| TOTAL NET ASSETS | $519,902,445 |
| Net Asset Value, Offering Price and Redemption Proceeds Per Share: |
| Class A Shares: |
| Net asset value per share ($229,217,277÷26,671,900 shares outstanding), $0.001 par value, 500,000,000 shares authorized | $8.59 |
| Offering price per share (100/95.50 of $8.59) | $8.99 |
| Redemption proceeds per share | $8.59 |
| Class B Shares: |
| Net asset value per share ($36,952,190÷4,302,324 shares outstanding), $0.001 par value, 500,000,000 shares authorized | $8.59 |
| Offering price per share | $8.59 |
| Redemption proceeds per share (94.50/100 of $8.59) | $8.12 |
| Class C Shares: |
| Net asset value per share ($52,784,939÷6,145,640 shares outstanding), $0.001 par value, 500,000,000 shares authorized | $8.59 |
| Offering price per share | $8.59 |
| Redemption proceeds per share (99.00/100 of $8.59) | $8.50 |
| Class F Shares: |
| Net asset value per share ($200,948,039÷23,383,857 shares outstanding), $0.001 par value, 500,000,000 shares authorized | $8.59 |
| Offering price per share (100/99.00 of $8.59) | $8.68 |
| Redemption proceeds per share (99.00/100 of $8.59) | $8.50 |
See Notes which are an integral part of the Financial Statements
Annual Shareholder ReportStatement of Operations
Year Ended August 31, 2010
| Investment Income: |
| Interest | $31,542,224 |
| Expenses: |
| Investment adviser fee (Note 5) | $2,821,856 |
| Administrative personnel and services fee (Note 5) | 366,627 |
| Custodian fees | 23,730 |
| Transfer and dividend disbursing agent fees and expenses | 296,289 |
| Directors'/Trustees' fees | 2,331 |
| Auditing fees | 23,531 |
| Legal fees | 1,296 |
| Portfolio accounting fees | 124,107 |
| Distribution services fee — Class B Shares (Note 5) | 293,370 |
| Distribution services fee — Class C Shares (Note 5) | 351,988 |
| Shareholder services fee — Class A Shares (Note 5) | 503,338 |
| Shareholder services fee — Class B Shares (Note 5) | 97,790 |
| Shareholder services fee — Class C Shares (Note 5) | 117,330 |
| Shareholder services fee — Class F Shares (Note 5) | 448,814 |
| Account administration fee — Class A Shares | 2,406 |
| Account administration fee — Class F Shares | 1,392 |
| Share registration costs | 61,453 |
| Printing and postage | 47,624 |
| Insurance premiums | 5,155 |
| Miscellaneous | 6,379 |
| TOTAL EXPENSES | 5,596,806 |
| Waivers (Note 5): |
| Waiver of investment adviser fee | $(1,302,074) |
| Waiver of administrative personnel and services fee | (8,721) |
| TOTAL WAIVERS | (1,310,795) |
| Net expenses | 4,286,011 |
| Net investment income | 27,256,213 |
| Realized and Unrealized Gain (Loss) on Investments: |
| Net realized loss on investments | (4,647,021) |
| Net change in unrealized appreciation of investments | 51,699,531 |
| Net realized and unrealized gain on investments | 47,052,510 |
| Change in net assets resulting from operations | $74,308,723 |
See Notes which are an integral part of the Financial Statements
Annual Shareholder ReportStatement of Changes in Net Assets
| Year Ended August 31 | 2010 | 2009 |
| Increase (Decrease) in Net Assets |
| Operations: |
| Net investment income | $27,256,213 | $26,541,615 |
| Net realized loss on investments | (4,647,021) | (18,677,396) |
| Net change in unrealized appreciation/depreciation of investments | 51,699,531 | (38,408,904) |
| CHANGE IN NET ASSETS RESULTING FROM OPERATIONS | 74,308,723 | (30,544,685) |
| Distributions to Shareholders: |
| Distributions from net investment income |
| Class A Shares | (11,920,940) | (11,295,374) |
| Class B Shares | (2,011,270) | (2,597,913) |
| Class C Shares | (2,393,810) | (2,258,270) |
| Class F Shares | (10,593,663) | (10,408,272) |
| CHANGE IN NET ASSETS RESULTING FROM DISTRIBUTIONS TO SHAREHOLDERS | (26,919,683) | (26,559,829) |
| Share Transactions: |
| Proceeds from sale of shares | 120,222,929 | 58,786,889 |
| Net asset value of shares issued to shareholders in payment of distributions declared | 20,737,218 | 18,894,566 |
| Cost of shares redeemed | (92,907,304) | (102,396,750) |
| CHANGE IN NET ASSETS RESULTING FROM SHARE TRANSACTIONS | 48,052,843 | (24,715,295) |
| Change in net assets | 95,441,883 | (81,819,809) |
| Net Assets: |
| Beginning of period | 424,460,562 | 506,280,371 |
| End of period (including undistributed net investment income of $1,269,386 and $1,067,169, respectively) | $519,902,445 | $424,460,562 |
See Notes which are an integral part of the Financial Statements
Annual Shareholder ReportNotes to Financial Statements
August 31, 2010
Federated Municipal Securities Income Trust (the “Trust”) is registered under the Investment Company Act of 1940, as amended (the “Act”), as an open-end management investment company. The Trust consists of five portfolios. The financial statements included herein are only those of Federated Municipal High Yield Advantage Fund (the “Fund”), a non-diversified portfolio. The financial statements of the other portfolios are presented separately. The assets of each portfolio are segregated and a shareholder's interest is limited to the portfolio in which shares are held. Each portfolio pays its own expenses. The Fund offers four classes of shares: Class A Shares, Class B Shares, Class C Shares and Class F Shares. All shares of the Fund have equal rights with respect to voting, except on class-specific matters. The investment objective of the Fund is to provide a high level of current income which is generally exempt from federal regular income tax. Interest income from the Fund's investments may be subject to the federal AMT for individuals and corporations and state and local taxes.
2. Significant Accounting Policies
The following is a summary of significant accounting policies consistently followed by the Fund in the preparation of its financial statements. These policies are in conformity with U.S. generally accepted accounting principles (GAAP).
Investment Valuation
In calculating its net asset value (NAV), the Fund generally values investments as follows:
- Fixed-income securities acquired with remaining maturities greater than 60 days are fair valued using price evaluations provided by a pricing service approved by the Board of Trustees (the “Trustees”).
- Fixed-income securities acquired with remaining maturities of 60 days or less are valued at their cost (adjusted for the accretion of any discount or amortization of any premium).
- Shares of other mutual funds are valued based upon their reported NAVs.
- Derivative contracts listed on exchanges are valued at their reported settlement or closing price.
- Over-the-counter (OTC) derivative contracts are fair valued using price evaluations provided by a pricing service approved by the Trustees.
If the Fund cannot obtain a price or price evaluation from a pricing service for an investment, the Fund may attempt to value the investment based upon the mean of bid and asked quotations or fair value the investment based on price evaluations, from one or more dealers. If any price, quotation, price evaluation or other pricing source is not readily available when the NAV is calculated, the Fund uses the fair value of the investment determined in accordance with the procedures described below. There can be no assurance that the Fund could purchase or sell an investment at the price used to calculate the Fund's NAV.
Fair Valuation and Significant Events Procedures
The Trustees have authorized the use of pricing services to provide evaluations of the current fair value of certain investments for purposes of calculating the NAV. Factors considered by pricing services in evaluating an investment include the yields or prices of investments of comparable quality, coupon, maturity, call rights and other potential prepayments, terms and type, reported transactions, indications as to values from dealers and general market conditions. Some pricing services provide a single price evaluation reflecting the bid-side of Annual Shareholder ReportThe Trustees also have adopted procedures requiring an investment to be priced at its fair value whenever the Adviser determines that a significant event affecting the value of the investment has occurred between the time as of which the price of the investment would otherwise be determined and the time as of which the NAV is computed. An event is considered significant if there is both an affirmative expectation that the investment's value will change in response to the event and a reasonable basis for quantifying the resulting change in value. Examples of significant events that may occur after the close of the principal market on which a security is traded, or after the time of a price evaluation provided by a pricing service or a dealer, include:
- With respect to price evaluations of fixed-income securities determined before the close of regular trading on the NYSE, actions by the Federal Reserve Open Market Committee and other significant trends in U.S. fixed-income markets;
- Political or other developments affecting the economy or markets in which an issuer conducts its operations or its securities are traded; and
- Announcements concerning matters such as acquisitions, recapitalizations, litigation developments, a natural disaster affecting the issuer's operations or regulatory changes or market developments affecting the issuer's industry.
The Fund may seek to obtain more current quotations or price evaluations from alternative pricing sources. If a reliable alternative pricing source is not available, the Fund will determine the fair value of the investment using another method approved by the Trustees.
Investment Income, Gains and Losses, Expenses and Distributions
Investment transactions are accounted for on a trade-date basis. Realized gains and losses from investment transactions are recorded on an identified-cost basis. Interest income and expenses are accrued daily. Distributions to shareholders are recorded on the ex-dividend date. Distributions of net investment income are declared and paid monthly. Non-cash dividends included in dividend income, if any, are recorded at fair value. Investment income, realized and unrealized gains and losses, and certain fund-level expenses are allocated to each class based on relative average daily net assets, except that each class may bear certain expenses unique to that class such as account administration, distribution services and shareholder services fees. Dividends are declared separately for each class. No class has preferential dividend rights; differences in per share dividend rates are generally due to differences in separate class expenses.
Premium and Discount Amortization
All premiums and discounts on fixed-income securities are amortized/accreted for financial statement purposes.
Annual Shareholder ReportIt is the Fund's policy to comply with the Subchapter M provision of the Internal Revenue Code and to distribute to shareholders each year substantially all of its income. Accordingly, no provision for federal income tax is necessary. As of and during the year ended August 31, 2010, the Fund did not have a liability for any uncertain tax positions. The Fund recognizes interest and penalties, if any, related to tax liabilities as income tax expense in the Statement of Operations. As of August 31, 2010, tax years 2007 through 2010 remain subject to examination by the Fund's major tax jurisdictions, which include the United States of America and the Commonwealth of Massachusetts.
When-Issued and Delayed Delivery Transactions
The Fund may engage in when-issued or delayed delivery transactions. The Fund records when-issued securities on the trade date and maintains security positions such that sufficient liquid assets will be available to make payment for the securities purchased. Securities purchased on a when-issued or delayed delivery basis are marked to market daily and begin earning interest on the settlement date. Losses may occur on these transactions due to changes in market conditions or the failure of counterparties to perform under the contract.
Restricted Securities
The Fund may purchase securities which are considered restricted. Restricted securities are securities that either: (a) cannot be offered for public sale without first being registered, or being able to take advantage of an exemption from registration, under the Securities Act of 1933; or (b) are subject to contractual restrictions on public sales. In some cases, when a security cannot be offered for public sale without first being registered, the issuer of the restricted security has agreed to register such securities for resale, at the issuer's expense, either upon demand by the Fund or in connection with another registered offering of the securities. Many such restricted securities may be resold in the secondary market in transactions exempt from registration. Restricted securities may be determined to be liquid under criteria established by the Trustees. The Fund will not incur any registration costs upon such resales. The Fund's restricted securities are valued at the price provided by dealers in the secondary market or, if no market prices are available, at the fair value as determined in accordance with procedures established by and under the general supervision of the Trustees.
Annual Shareholder Report| Security | Acquisition Date | Acquisition Cost | Market Value |
| California Statewide CDA, Revenue Bonds, 6.625% (Tehiyah Day School), 11/1/2031 | 7/13/2001 | $950,000 | $704,833 |
| Connector 2000 Association, Inc., SC, Capital Appreciation Senior Revenue Bonds (Series 1998B) (Original Issue Yield: 5.80%), 1/1/2025 | 3/30/2000 | $925,320 | $420,600 |
| Connector 2000 Association, Inc., SC, Toll Road Capital Appreciation Revenue Bonds (Series 1998A) (Original Issue Yield: 5.85%), 1/1/2034 | 1/28/1998 | $978,515 | $321,393 |
| Muni Mae TE Bond Subsidiary LLC, Pfd., 7.75%, 6/30/2050 | 5/31/2000 | $2,000,000 | $1,620,040 |
| Non-Profit Preferred Funding Trust I, Partnership, 9/15/2037 | 10/26/2006-2/16/2007 | $3,989,000 | $2,998,000 |
Other
The preparation of financial statements in conformity with GAAP requires management to make estimates and assumptions that affect the amounts of assets, liabilities, expenses and revenues reported in the financial statements. Actual results could differ from those estimated.
3. Shares of Beneficial Interest
The following tables summarize share activity:
| Year Ended August 31 | 2010 | 2009 | |
| Class A Shares: | Shares | Amount | Shares | Amount |
| Shares sold | 8,282,792 | $68,683,951 | 4,572,221 | $33,365,001 |
| Shares issued to shareholders in payment of distributions declared | 1,142,618 | 9,403,962 | 1,161,022 | 8,552,181 |
| Shares redeemed | (6,011,277) | (49,676,591) | (6,364,314) | (46,544,485) |
| NET CHANGE RESULTING FROM CLASS A SHARE TRANSACTIONS | 3,414,133 | $28,411,322 | (631,071) | $(4,627,303) |
| Year Ended August 31 | 2010 | 2009 | |
| Class B Shares: | Shares | Amount | Shares | Amount |
| Shares sold | 489,668 | $4,054,754 | 546,182 | $3,996,747 |
| Shares issued to shareholders in payment of distributions declared | 187,749 | 1,542,567 | 228,946 | 1,686,552 |
| Shares redeemed | (1,675,273) | (13,815,500) | (2,222,419) | (16,391,073) |
| NET CHANGE RESULTING FROM CLASS B SHARE TRANSACTIONS | (997,856) | $(8,218,179) | (1,447,291) | $(10,707,774) |
| Year Ended August 31 | 2010 | 2009 | |
| Class C Shares: | Shares | Amount | Shares | Amount |
| Shares sold | 1,653,071 | $13,655,467 | 1,172,202 | $8,655,785 |
| Shares issued to shareholders in payment of distributions declared | 222,751 | 1,833,073 | 209,227 | 1,539,440 |
| Shares redeemed | (970,542) | (8,021,435) | (1,705,544) | (12,519,203) |
| NET CHANGE RESULTING FROM CLASS C SHARE TRANSACTIONS | 905,280 | $7,467,105 | (324,115) | $(2,323,978) |
| Year Ended August 31 | 2010 | 2009 | |
| Class F Shares: | Shares | Amount | Shares | Amount |
| Shares sold | 4,084,624 | $33,828,757 | 1,741,109 | $12,769,356 |
| Shares issued to shareholders in payment of distributions declared | 966,773 | 7,957,616 | 966,353 | 7,116,393 |
| Shares redeemed | (2,590,504) | (21,393,778) | (3,652,798) | (26,941,989) |
| NET CHANGE RESULTING FROM CLASS F SHARE TRANSACTIONS | 2,460,893 | $20,392,595 | (945,336) | $(7,056,240) |
| NET CHANGE RESULTING FROM FUND SHARE TRANSACTIONS | 5,782,450 | $48,052,843 | (3,347,813) | $(24,715,295) |
The timing and character of income and capital gain distributions are determined in accordance with income tax regulations, which may differ from GAAP. These differences are due in part to the expiration of capital loss carryforwards, differing treatments for partnership income and gains and discount accretion/premium amortization on debt securities.
For the year ended August 31, 2010, permanent differences identified and reclassified among the components of net assets were as follows:
| Increase (Decrease) | ||
| Paid-In Capital | Undistributed Net Investment Income (Loss) | Accumulated Net Realized Gain (Loss) |
| $(3,907,651) | $(134,313) | $4,041,964 |
Net investment income (loss), net realized gains (losses) and net assets were not affected by this reclassification.
The tax character of distributions as reported on the Statement of Changes in Net Assets for the years ended August 31, 2010 and 2009, was as follows:
| 2010 | 2009 |
| Tax-exempt income | $26,837,001 | $26,541,545 |
| Ordinary income | $82,682 | $18,284 |
| Undistributed tax-exempt income | $1,270,542 |
| Net unrealized depreciation | $(24,847,727) |
| Capital loss carryforwards and deferrals | $(57,716,181) |
The difference between book-basis and tax-basis net unrealized appreciation/depreciation
is attributable to differing treatments for the deferral of losses on wash sales, discount
accretion/premium amortization on debt securities, open defaulted securities and partnership adjustments.
At August 31, 2010, the cost of investments for federal tax purposes was $532,828,328. The net unrealized depreciation of investments for federal tax purposes was $24,847,727. This consists of net unrealized appreciation from investments for those securities having an excess of value over cost of $20,948,178 and net unrealized depreciation from investments for those securities having an excess of cost over value of $45,795,905.
At August 31, 2010, the Fund had a capital loss carryforward of $57,262,300 which will reduce the Fund's taxable income arising from future net realized gains on investments, if any, to the extent permitted by the Code and thus will reduce the amount of distributions to shareholders which would otherwise be necessary to relieve the Fund of any liability for federal income tax. Pursuant to the Code, such capital loss carryforward will expire as follows:
| Expiration Year | Expiration Amount |
| 2011 | $5,101,855 |
| 2012 | $ 3,341,471 |
| 2013 | $ 7,976,021 |
| 2014 | $ 1,161,133 |
| 2017 | $20,198,309 |
| 2018 | $19,483,511 |
Capital loss carryforwards of $3,907,651 expired during the year ended August 31, 2010.
Under current tax regulations, capital losses on securities transactions realized after October 31 may be deferred and treated as occurring on the first day of the following fiscal year. As of August 31, 2010, for federal income tax purposes, post-October losses of $453,881 were deferred to September 1, 2010.
5. Investment Adviser Fee and Other Transactions with Affiliates
Investment Adviser Fee
Federated Investment Management Company is the Fund's investment adviser (the “Adviser”). The advisory agreement between the Fund and the Adviser provides for an annual fee equal to 0.60% of the Fund's average daily net assets. Subject to the terms described in the Expense Limitation note, the Adviser may voluntarily choose to waive any portion of its fee. For the year ended August 31, 2010, the Adviser waived $1,302,074 of its fee.
Annual Shareholder ReportAdministrative Fee
Federated Administrative Services (FAS), under the Administrative Services Agreement, provides the Fund with administrative personnel and services. The fee paid to FAS is based on the average aggregate daily net assets of certain Federated funds as specified below:
| Administrative Fee | Average Aggregate Daily Net Assets of the Federated Funds |
| 0.150% | on the first $5 billion |
| 0.125% | on the next $5 billion |
| 0.100% | on the next $10 billion |
| 0.075% | on assets in excess of $20 billion |
The administrative fee received during any fiscal year shall be at least $150,000 per portfolio and $40,000 per each additional class of Shares. Subject to the terms described in the Expense Limitation note, FAS may voluntarily choose to waive any portion of its fee. For the year ended August 31, 2010, the net fee paid to FAS was 0.076% of average daily net assets of the Fund. FAS waived $8,721 of its fee.
Distribution Services Fee
The Fund has adopted a Distribution Plan (the “Plan”) pursuant to Rule 12b-1 under the Act. Under the terms of the Plan, the Fund will compensate Federated Securities Corp. (FSC), the principal distributor, from the daily net assets of the Fund's Class A Shares, Class B Shares, Class C Shares and Class F Shares to finance activities intended to result in the sale of these shares. The Plan provides that the Fund may incur distribution expenses at the following percentages of average daily net assets annually, to compensate FSC:
| Share Class Name | Percentage of Average Daily Net Assets of Class |
| Class A Shares | 0.05% |
| Class B Shares | 0.75% |
| Class C Shares | 0.75% |
| Class F Shares | 0.05% |
Subject to the terms described in the Expense Limitation note, FSC may voluntarily choose to waive any portion of its fee. When FSC receives fees, it may pay some or all of them to financial intermediaries whose customers purchase shares. For the year ended August 31, 2010, FSC retained $79,530 of fees paid by the Fund. For the year ended August 31, 2010, the Fund's Class A Shares and Class F Shares did not incur a distribution services fee; however, they may begin to incur this fee upon approval of the Trustees.
Annual Shareholder ReportFront-end sales charges and contingent deferred sales charges (CDSC) do not represent expenses of the Fund. They are deducted from the proceeds of sales of Fund shares prior to investment or from redemption proceeds prior to remittance, as applicable. For the year ended August 31, 2010, FSC retained $319,673 in sales charges from the sale of Class A Shares. FSC also retained $39 of CDSC relating to redemptions of Class A Shares, $513 related to redemptions of Class C Shares, and $4,667 relating to redemptions of Class F Shares.
Shareholder Services Fee
The Fund may pay fees (Service Fees) up to 0.25% of the average daily net assets of the Fund's Class A Shares, Class B Shares, Class C Shares and Class F Shares to financial intermediaries or to Federated Shareholder Services Company (FSSC) for providing services to shareholders and maintaining shareholder accounts. Subject to the terms described in the Expense Limitation note, FSSC may voluntarily reimburse the Fund for Service Fees. For the year ended August 31, 2010, FSSC received $1,871 of fees paid by the Fund.
Interfund Transactions
During the year ended August 31, 2010, the Fund engaged in purchase and sale transactions with funds that have a common investment adviser (or affiliated investment advisers),
common Directors/Trustees, and/or common Officers. These purchase and sale transactions complied with Rule 17a-7 under the Act and amounted to $187,765,000 and $185,415,000, respectively.
Expense Limitation
The Adviser and its affiliates (which may include FSC, FAS and FSSC) have voluntarily agreed to waive their fees and/or reimburse expenses so that the total annual fund operating expenses (as shown in the financial highlights) paid by the Fund's Class A Shares, Class B Shares, Class C Shares and Class F Shares (after the voluntary waivers and reimbursements) will not exceed 0.89%, 1.64%, 1.64% and 0.89% (the “Fee Limit”), respectively, through the later of (the “Termination Date”): (a) October 31, 2011; or (b) the date of the Fund's next effective Prospectus. While the Adviser and its affiliates currently do not anticipate terminating or increasing these arrangements prior to the Termination Date, these arrangements may only be terminated or the Fee Limit increased prior to the Termination Date with the agreement of the Fund's Trustees. As part of the foregoing commitment, for the period through December 31, 2010, the Fee Limit will be 0.79% for Class A Shares, 1.54% for Class B Shares, 1.54% for Class C Shares and 0.79% for Class F Shares. The Adviser previously agreed to maintain the management fee at 0.3233% for the period ending December 31, 2010, and this obligation will expire on that date. Accordingly, the management fee waivers will be reduced, and the management fee for the Fund will increase, after December 31, 2010, subject to the Fee Limit for each class of Shares reflected above.
General
Certain Officers and Trustees of the Fund are Officers and Directors or Trustees of the above companies.
Annual Shareholder ReportAlthough the Fund has a diversified portfolio, the Fund has 41.1% of its portfolio invested in lower rated and comparable quality unrated high-yield securities. Investments in higher yield securities may be subject to a greater degree of credit risk and the risk tends to be more sensitive to economic conditions than higher rated securities. The risk of loss due to default by the issuer may be significantly greater for the holders of high yielding securities because such securities are generally unsecured and often subordinated to other creditors of the issuer.
Purchases and sales of investments, excluding long-term U.S. government securities and short-term obligations, for the year ended August 31, 2010, were as follows:
| Purchases | $129,793,711 |
| Sales | $82,837,704 |
The Fund participates in a $100,000,000 unsecured, uncommitted revolving line of credit (LOC) agreement with PNC Bank. The LOC was made available for extraordinary or emergency purposes, primarily for financing redemption payments. Borrowings are charged interest at a rate offered to the Fund by PNC Bank at the time of the borrowing. As of August 31, 2010, there were no outstanding loans. During the year ended August 31, 2010, the Fund did not utilize the LOC.
Pursuant to an Exemptive Order issued by the Securities and Exchange Commission, the Fund, along with other funds advised by subsidiaries of Federated Investors, Inc., may participate in an interfund lending program. This program provides an alternative credit facility allowing the funds to borrow from other participating affiliated funds. As of August 31, 2010, there were no outstanding loans. During the year ended August 31, 2010, the program was not utilized.
Since October 2003, Federated Investors, Inc. and related entities (collectively, “Federated”), and various Federated sponsored mutual funds (“Federated Funds”) have been named as defendants in several class action lawsuits now pending in the United States District Court for the District of Maryland. The lawsuits were purportedly filed on behalf of people who purchased, owned and/or redeemed shares of certain Federated Funds during specified periods beginning November 1, 1998. The suits are generally similar in alleging that Federated engaged in illegal and improper trading practices including market timing and late trading in concert with certain institutional traders, which allegedly caused financial injury to the mutual fund shareholders. Federated without admitting the validity of any claim has reached a preliminary settlement with the Plaintiffs in these cases. Any settlement would have to be approved by the Court. Federated entities have also been named as defendants in several additional lawsuits that are now pending in the United States District Court for the Western District of Pennsylvania. These lawsuits have been consolidated into a single action alleging excessive advisory fees involving one of the Federated Funds. The Board of the Federated Funds retained the law firm of Dickstein Shapiro LLP to represent the Federated Funds in these lawsuits. Federated and the Federated Funds, and their respective counsel, have been defending this litigation, and none of the Federated Funds remains a defendant in any of the lawsuits. Additional lawsuits based upon similar allegations may be filed in the future. The Annual Shareholder Report11. Change in Independent Registered Public Accounting Firm
On May 14, 2010, the Fund's Trustees, upon the recommendation of the Audit Committee, appointed KPMG LLP (KPMG) as the Fund's independent registered public accounting firm. On the same date, the Fund's previous independent registered public accounting firm, Ernst & Young LLP (E&Y) resigned. The previous reports issued by E&Y on the Fund's financial statements for the fiscal years ended August 31, 2008 and August 31, 2009, contained no adverse opinion or disclaimer of opinion nor were they qualified or modified as to uncertainty, audit scope or accounting principles. During the Fund's fiscal years August 31, 2008 and August 31, 2009 and the interim period commencing September 1, 2009 and ending May 14, 2010,: (i) there were no disagreements with E&Y on any matter of accounting principles or practices, financial statement disclosure or auditing scope or procedure, which disagreements, if not resolved to the satisfaction of E&Y, would have caused it to make reference to the subject matter of the disagreements in connection with its reports on the financial statements for such years; and (ii) there were no reportable events of the kind described in Item 304(a) (1) (v) of Regulation S-K under the Securities Exchange Act of 1934, as amended.
As indicated above, the Fund has appointed KPMG as the independent registered public accounting firm to audit the Fund's financial statements for the fiscal year ending August 31, 2010. During the Fund's fiscal years ended August 31, 2008 and August 31, 2009, and the interim period commencing September 1, 2009 and ending May 14, 2010, neither the Fund nor anyone on its behalf has consulted KPMG on items which: (i) concerned the application of accounting principles to a specified transaction, either completed or proposed, or the type of audit opinion that might be rendered on the Fund's financial statements or (ii) concerned the subject of a disagreement (as defined in paragraph (a) (1) (iv) of Item 304 of Regulation S-K) or reportable events (as described in paragraph (a) (1) (v) of said Item 304).
Management has evaluated subsequent events through the date the financial statements were issued, and determined that no events have occurred that require additional disclosure.
13. Federal Tax Information (unaudited)
For the year ended August 31, 2010, 99.69% of the distributions from net investment income is exempt from federal income tax, other than the federal AMT.
Annual Shareholder ReportReport of Independent Registered Public Accounting Firm
TO THE BOARD OF TRUSTEES OF federated municipal securities income trust AND SHAREHOLDERS OF federated municipal high yield advantage fund:
We have audited the accompanying statement of assets and liabilities, including the portfolio of investments, of Federated Municipal High Yield Advantage Fund (the “Fund”), a portfolio of Federated Municipal Securities Income Trust, as of August 31, 2010, and the related statement of operations, the statements of changes in net assets, and the financial highlights for the year then ended. These financial statements and financial highlights are the responsibility of the Fund's management. Our responsibility is to express an opinion on these financial statements and financial highlights based on our audit. The statement of changes in net assets for the year ended August 31, 2009 and the financial highlights for the periods presented prior to September 1, 2009, were audited by other independent registered public accountants whose report thereon dated October 20, 2009, expressed an unqualified opinion on those statements.
We conducted our audit in accordance with the standards of the Public Company Accounting Oversight Board (United States). Those standards require that we plan and perform the audit to obtain reasonable assurance about whether the financial statements and financial highlights are free of material misstatement. An audit includes examining, on a test basis, evidence supporting the amounts and disclosures in the financial statements. Our procedures included confirmation of securities owned as of August 31, 2010 by correspondence with the custodian and brokers or by other appropriate auditing procedures. An audit also includes assessing the accounting principles used and significant estimates made by management, as well as evaluating the overall financial statement presentation. We believe that our audit provides a reasonable basis for our opinion.
In our opinion, the financial statements and financial highlights referred to above present fairly, in all material respects, the financial position of Federated Municipal High Yield Advantage Fund as of August 31, 2010, and the results of its operations, the changes in its net assets, and the financial highlights for the year then ended, in conformity with U.S. generally accepted accounting principles.

Boston, Massachusetts
October 25, 2010
Board of Trustees and Trust Officers
The Board of Trustees is responsible for managing the Trust's business affairs and for exercising all the Trust's powers except those reserved for the shareholders. The following tables give information about each Trustee and the senior officers of the Fund. Where required, the tables separately list Trustees who are “interested persons” of the Fund (i.e., “Interested” Trustees) and those who are not (i.e., “Independent” Trustees). Unless otherwise noted, the address of each person listed is Federated Investors Tower, 1001 Liberty Avenue, Pittsburgh, PA 15222. The address of all Independent Trustees listed is 4000 Ericsson Drive, Warrendale, PA 15086-7561; Attention: Mutual Fund Board. As of December 31, 2009, the Trust comprised 5 portfolio(s), and the Federated Fund Family consisted of 43 investment companies (comprising 145 portfolios). Unless otherwise noted, each Officer is elected annually. Unless otherwise noted, each Trustee oversees all portfolios in the Federated Fund Family and serves for an indefinite term. The Fund's Statement of Additional Information includes additional information about Trust Trustees and is available, without charge and upon request, by calling 1-800-341-7400.
Interested TRUSTEES Background
| Name Birth Date Positions Held with Trust Date Service Began | Principal Occupation(s) for Past Five Years, Other Directorships Held and Previous Position(s) |
| John F. Donahue* Birth Date: July 28, 1924 Trustee Began serving: August 1990 | Principal Occupations: Director or Trustee of the Federated Fund Family; Chairman and Director, Federated Investors, Inc.; Chairman of the Federated Fund Family's Executive Committee. Previous Positions: Chairman of the Federated Fund Family; Trustee, Federated Investment Management Company; Chairman and Director, Federated Investment Counseling. |
| J. Christopher Donahue* Birth Date: April 11, 1949 President and Trustee Began serving: August 1990 | Principal Occupations: Principal Executive Officer and President of the Federated Fund Family; Director or Trustee of some of the Funds in the Federated Fund Family; President, Chief Executive Officer and Director, Federated Investors, Inc.; Chairman and Trustee, Federated Investment Management Company; Trustee, Federated Investment Counseling; Chairman and Director, Federated Global Investment Management Corp.; Chairman, Federated Equity Management Company of Pennsylvania and Passport Research, Ltd. (investment advisory subsidiary of Federated); Trustee, Federated Shareholder Services Company; Director, Federated Services Company. Previous Positions: President, Federated Investment Counseling; President and Chief Executive Officer, Federated Investment Management Company, Federated Global Investment Management Corp. and Passport Research, Ltd. |
| * | Family relationships and reasons for “interested” status: John F. Donahue is the father of J. Christopher Donahue; both are “interested” due to their beneficial ownership of shares of Federated Investors, Inc. and the positions they hold with Federated and its subsidiaries. |
INDEPENDENT TRUSTEES Background
| Name Birth Date Positions Held with Trust Date Service Began | Principal Occupation(s) for Past Five Years, Other Directorships Held, Previous Position(s) and Qualifications |
| John T. Conroy, Jr., Ph.D. Birth Date: June 23, 1937 Trustee Began serving: August 1991 | Principal Occupations: Director or Trustee of the Federated Fund Family; Chairman of the Board, Investment Properties Corporation; Partner or Trustee in private real estate ventures in Southwest Florida; Assistant Professor in Theology, Blessed Edmund Rice School for Pastoral Ministry. Previous Positions: President, Investment Properties Corporation; Senior Vice President, John R. Wood and Associates, Inc., Realtors; President, Naples Property Management, Inc. and Northgate Village Development Corporation. Qualifications: Business management and director experience. |
| Nicholas P. Constantakis, CPA Birth Date: September 3, 1939 Trustee Began serving: February 1998 | Principal Occupation: Director or Trustee of the Federated Fund Family. Other Directorship Held: Director and Chairman of the Audit Committee, Michael Baker Corporation (architecture, engineering and construction services). Previous Position: Partner, Andersen Worldwide SC. Qualifications: Public accounting and director experience. |
| John F. Cunningham Birth Date: March 5, 1943 Trustee Began serving: June 1999 | Principal Occupation: Director or Trustee of the Federated Fund Family. Other Directorships Held: Chairman, President and Chief Executive Officer, Cunningham & Co., Inc. (strategic business consulting); Trustee Associate, Boston College. Previous Positions: Director, Redgate Communications and EMC Corporation (computer storage systems); Chairman of the Board and Chief Executive Officer, Computer Consoles, Inc.; President and Chief Operating Officer, Wang Laboratories; Director, First National Bank of Boston; Director, Apollo Computer, Inc. Qualifications: Business management and director experience. |
| Maureen Lally-Green Birth Date: July 5, 1949 Trustee Began serving: August 2009 | Principal Occupations: Director or Trustee of the Federated Fund Family; Director, Office of Church Relations, Diocese of Pittsburgh; Adjunct Professor of Law, Duquesne University School of Law. Other Directorships Held: Director, Auberle; Trustee, St. Francis University; Director, Ireland Institute of Pittsburgh; Director, UPMC Mercy Hospital; Regent, St. Vincent Seminary; Director, Epilepsy Foundation of Western and Central Pennsylvania; Director, Saint Thomas More Society, Allegheny County; Director, Carlow University. Previous Position: Pennsylvania Superior Court Judge. Qualifications: Legal and director experience. |
| Name Birth Date Positions Held with Trust Date Service Began | Principal Occupation(s) for Past Five Years, Other Directorships Held, Previous Position(s) and Qualifications |
| Peter E. Madden Birth Date: March 16, 1942 Trustee Began serving: August 1991 | Principal Occupation: Director or Trustee, and Chairman of the Board of Directors or Trustees, of the Federated Fund Family. Other Directorship Held: Board of Overseers, Babson College. Previous Positions: Representative, Commonwealth of Massachusetts General Court; President, Chief Operating Officer and Director, State Street Bank and Trust Company and State Street Corporation (retired); Director, VISA USA and VISA International; Chairman and Director, Massachusetts Bankers Association; Director, Depository Trust Corporation; Director, The Boston Stock Exchange. Qualifications: Business management, mutual fund services and director experience. |
| Charles F. Mansfield, Jr. Birth Date: April 10, 1945 Trustee Began serving: January 1999 | Principal Occupations: Director or Trustee and Chairman of the Audit Committee of the Federated Fund Family; Management Consultant. Previous Positions: Chief Executive Officer, PBTC International Bank; Partner, Arthur Young & Company (now Ernst & Young LLP); Chief Financial Officer of Retail Banking Sector, Chase Manhattan Bank; Senior Vice President, HSBC Bank USA (formerly, Marine Midland Bank); Vice President, Citibank; Assistant Professor of Banking and Finance, Frank G. Zarb School of Business, Hofstra University; Executive Vice President, DVC Group, Inc. (marketing, communications and technology). Qualifications: Banking, business management, public accounting and director experience. |
| R. James Nicholson Birth Date: February 4, 1938 Trustee Began serving: January 2008 | Principal Occupations: Director or Trustee of the Federated Fund Family; Senior Counsel, Brownstein Hyatt Farber Schrek, P.C.; Former Secretary of the U.S. Dept. of Veterans Affairs; Former U.S. Ambassador to the Holy See; Former Chairman of the Republican National Committee. Other Directorships Held: Director, Horatio Alger Association; Director, The Daniels Fund. Previous Positions: Colonel, U.S. Army Reserve; Partner, Calkins, Kramer, Grimshaw and Harring, P.C.; General Counsel, Colorado Association of Housing and Building; Chairman and CEO, Nicholson Enterprises, Inc. (real estate holding company); Chairman and CEO, Renaissance Homes of Colorado. Qualifications: Legal, government, business management and mutual fund director experience. |
| Name Birth Date Positions Held with Trust Date Service Began | Principal Occupation(s) for Past Five Years, Other Directorships Held, Previous Position(s) and Qualifications |
| Thomas M. O'Neill Birth Date: June 14, 1951 Trustee Began serving: October 2006 | Principal Occupations: Director or Trustee of the Federated Fund Family; Sole Proprietor, Navigator Management Company (investment and strategic consulting). Other Directorships Held: Board of Overseers, Children's Hospital of Boston; Visiting Committee on Athletics, Harvard College. Previous Positions: Chief Executive Officer and President, Managing Director and Chief Investment Officer, Fleet Investment Advisors; President and Chief Executive Officer, Aeltus Investment Management, Inc.; General Partner, Hellman, Jordan Management Co., Boston, MA; Chief Investment Officer, The Putnam Companies, Boston, MA; Credit Analyst and Lending Officer, Fleet Bank; Director and Consultant, EZE Castle Software (investment order management software); Director, Midway Pacific (lumber). Qualifications: Business management, mutual fund, director and investment experience. |
| John S. Walsh Birth Date: November 28, 1957 Trustee Began serving: June 1999 | Principal Occupations: Director or Trustee of the Federated Fund Family; President and Director, Heat Wagon, Inc. (manufacturer of construction temporary heaters); President and Director, Manufacturers Products, Inc. (distributor of portable construction heaters); President, Portable Heater Parts, a division of Manufacturers Products, Inc. Previous Position: Vice President, Walsh & Kelly, Inc. Qualifications: Business management and director experience. |
| James F. Will Birth Date: October 12, 1938 Trustee Began serving: April 2006 | Principal Occupations: Director or Trustee of the Federated Fund Family; formerly, Vice Chancellor and President, Saint Vincent College. Other Directorships Held: Trustee, Saint Vincent College; Alleghany Corporation. Previous Positions: Chairman, President and Chief Executive Officer, Armco, Inc.; President and Chief Executive Officer, Cyclops Industries; President and Chief Operating Officer, Kaiser Steel Corporation. Qualifications: Business management, education and director experience. |
| Name Birth Date Positions Held with Trust Date Service Began | Principal Occupation(s) for Past Five Years and Previous Position(s) |
| John W. McGonigle Birth Date: October 26, 1938 Executive Vice President and Secretary Began serving: August 1990 | Principal Occupations: Executive Vice President and Secretary of the Federated Fund Family; Vice Chairman, Executive Vice President, Secretary and Director, Federated Investors, Inc. Previous Positions: Trustee, Federated Investment Management Company and Federated Investment Counseling; Director, Federated Global Investment Management Corp., Federated Services Company and Federated Securities Corp. |
| Richard A. Novak Birth Date: December 25, 1963 Treasurer Began serving: January 2006 | Principal Occupations: Principal Financial Officer and Treasurer of the Federated Fund Family; Senior Vice President, Federated Administrative Services; Financial and Operations Principal for Federated Securities Corp., Edgewood Services, Inc. and Southpointe Distribution Services, Inc. Previous Positions: Controller of Federated Investors, Inc.; Vice President, Finance of Federated Services Company; held various financial management positions within The Mercy Hospital of Pittsburgh; Auditor, Arthur Andersen & Co. |
| Richard B. Fisher Birth Date: May 17, 1923 Vice Chairman Began serving: August 2002 | Principal Occupations: Vice Chairman or Vice President of some of the Funds in the Federated Fund Family; Vice Chairman, Federated Investors, Inc.; Chairman, Federated Securities Corp. Previous Positions: President and Director or Trustee of some of the Funds in the Federated Fund Family; Executive Vice President, Federated Investors, Inc.; Director and Chief Executive Officer, Federated Securities Corp. |
| Brian P. Bouda Birth Date: February 28, 1947 Senior Vice President and Chief Compliance Officer Began serving: August 2004 | Principal Occupations: Senior Vice President and Chief Compliance Officer of the Federated Fund Family; Vice President and Chief Compliance Officer of Federated Investors, Inc. and Chief Compliance Officer of its subsidiaries. Mr. Bouda joined Federated in 1999 and is a member of the American Bar Association and the State Bar Association of Wisconsin. |
| J. Scott Albrecht Birth Date: June 1, 1960 VICE PRESIDENT Began serving: November 1999 | Principal Occupations: J. Scott Albrecht is Vice President of the Fund. Mr. Albrecht joined Federated in 1989. He became a Senior Vice President of the Fund's Adviser in January 2005 and served as a Vice President of the Fund's Adviser from 1994 through 2004. He has been a Senior Portfolio Manager since 1997 and was a Portfolio Manager from 1994 to 1996. Mr. Albrecht has received the Chartered Financial Analyst designation and an M.S. in Public Management from Carnegie Mellon University. |
Evaluation and Approval of Advisory Contract - May 2010
Federated Municipal High Yield Advantage Fund (the “Fund”)
The Fund's Board reviewed the Fund's investment advisory contract at meetings held in May 2010. The Board's decision regarding the contract reflects the exercise of its business judgment on whether to continue the existing arrangements.
In this connection, the Federated funds' Board had previously appointed a Senior Officer, whose duties include specified responsibilities relating to the process by which advisory fees are to be charged to a Federated fund. The Senior Officer has the authority to retain consultants, experts, or staff as may be reasonably necessary to assist in the performance of his duties, reports directly to the Board, and may be terminated only with the approval of a majority of the independent members of the Board. The Senior Officer prepared and furnished to the Board an independent, written evaluation that covered topics discussed below. The Board considered that evaluation, along with other information, in deciding to approve the advisory contract.
During its review of the contract, the Board considered compensation and benefits received by the Adviser. This included the fees received for services provided to the Fund by other entities in the Federated organization and research services (if any) received by the Adviser from brokers that execute Federated fund trades, as well as advisory fees. The Board is also familiar with and considered judicial decisions concerning allegedly excessive investment advisory fees, which have indicated that the following factors may be relevant to an Adviser's fiduciary duty with respect to its receipt of compensation from a fund: the nature and quality of the services provided by the Adviser, including the performance of the fund; the Adviser's cost of providing the services; the extent to which the Adviser may realize “economies of scale” as a fund grows larger; any indirect benefits that may accrue to the Adviser and its affiliates as a result of the Adviser's relationship with a fund; performance and expenses of comparable funds; and the extent to which the independent Board members are fully informed about all facts the Board deems relevant bearing on the Adviser's services and fees. The Board further considered management fees (including any components thereof) charged to institutional and other clients of the Adviser for what might be viewed as like services, and the cost to the Adviser and its affiliates of supplying services pursuant to the management fee agreements, excluding any intra-corporate profit and profit margins of the Adviser and its affiliates for supplying such services. The Board was aware of these factors and was guided by them in its review of the Fund's advisory contract to the extent it considered them to be appropriate and relevant, as discussed further below.
Annual Shareholder ReportThe Senior Officer reviewed reports compiled by Federated, using data supplied by independent fund ranking organizations, regarding the performance of, and fees charged by, other mutual funds, noting his view that comparisons to fund peer groups are relevant in judging the reasonableness of proposed fees.
The Fund's performance fell below the median of the relevant peer group for the one-year, three-year and five-year periods covered by the report. The Board discussed the Fund's performance with the Adviser and recognized the efforts being undertaken by the Adviser. The Board will continue to monitor these efforts and the performance of the Fund.
The Board also received financial information about Federated, including reports on the compensation and benefits Federated derived from its relationships with the Federated funds. These reports covered not only the fees under the advisory contracts, but also fees received by Federated's subsidiaries for providing other services to the Federated funds under separate contracts (e.g., for serving as the Federated funds' administrator). The reports also discussed any indirect benefit Federated may derive from its receipt of research services from brokers who execute Federated fund trades. In addition, the Board considered the fact that, in order for a fund to be competitive in the marketplace, Federated and its affiliates frequently waived fees and/or reimbursed expenses and have disclosed to fund investors and/or indicated to Annual Shareholder ReportFederated furnished reports, requested by the Senior Officer, that reported revenues on a fund-by-fund basis and made estimates of the allocation of expenses on a fund-by-fund basis, using allocation methodologies specified by the Senior Officer. The Senior Officer noted that, although they may apply consistent allocation processes, the inherent difficulties in allocating costs (and the unavoidable arbitrary aspects of that exercise) and the lack of consensus on how to allocate those costs may render such allocation reports unreliable. The allocation reports were considered in the analysis by the Board but were determined to be of limited use.
The Board and the Senior Officer also reviewed a report compiled by Federated comparing profitability information for Federated to other publicly held fund management companies. In this regard, the Senior Officer noted the limited availability of such information, but nonetheless concluded that Federated's profit margins did not appear to be excessive and the Board agreed.
The Senior Officer's evaluation also discussed the notion of possible realization of “economies of scale” as a fund grows larger. The Board considered in this regard that the Adviser has made significant and long-term investments in areas that support all of the Federated funds, such as personnel and processes for the portfolio management, compliance, and risk management functions; and systems technology; and that the benefits of these efforts (as well as any economies, should they exist) were likely to be enjoyed by the fund complex as a whole. Finally, the Board also noted the absence of any applicable regulatory or industry guidelines on this subject, which (as discussed in the Senior Officer's evaluation) is compounded by the lack of any common industry practice or general pattern with respect to structuring fund advisory fees with “breakpoints” that serve to reduce the fee as the fund attains a certain size. The Senior Officer did not recommend institution of breakpoints in pricing Federated's fund advisory services at this time.
It was noted in the materials for the Board meeting that for the period covered by the report, the Fund's investment advisory fee, after waivers and expense reimbursements, if any, was below the median of the relevant peer group. The Board reviewed the fees and other expenses of the Fund with the Adviser and was satisfied that the overall expense structure of the Fund remained competitive.
The Senior Officer's evaluation noted his belief that the information and observations contained in his evaluation supported a finding that the proposed management fees are reasonable, and that Federated appeared to provide appropriate administrative services to the Fund for the fees paid. Under these Annual Shareholder ReportIn its decision to continue an existing investment advisory contract, the Board was mindful of the potential disruptions of the Fund's operations and various risks, uncertainties and other effects that could occur as a result of a decision to terminate or not renew an advisory contract. In particular, the Board recognized that many shareholders have invested in the Fund on the strength of the Adviser's industry standing and reputation and with the expectation that the Adviser will have a continuing role in providing advisory services to the Fund. Thus, the Board's approval of the advisory contract reflected the fact that it is the shareholders who have effectively selected the Adviser by virtue of having invested in the Fund.
The Board based its decision to approve the advisory contract on the totality of the circumstances and relevant factors and with a view to past and future long-term considerations. Not all of the factors and considerations identified above were necessarily relevant to the Fund, nor did the Board consider any one of them to be determinative. With respect to the factors that were relevant, the Board's decision to approve the contract reflects its determination that Federated's performance and actions provided a satisfactory basis to support the decision to continue the existing arrangements.
Annual Shareholder ReportVoting Proxies on Fund Portfolio Securities
A description of the policies and procedures that the Fund uses to determine how to vote proxies, if any, relating to securities held in the Fund's portfolio is available, without charge and upon request, by calling 1-800-341-7400. A report on “Form N-PX” of how the Fund voted any such proxies during the most recent 12-month period ended June 30 is available from Federated's website at FederatedInvestors.com. To access this information from the “Products” section of the website, click on the “Prospectuses and Regulatory Reports” link under “Related Information,” then select the appropriate link opposite the name of the Fund; or select the name of the Fund and from the Fund's page, click on the “Prospectuses and Regulatory Reports” link. Form N-PX filings are also available at the SEC's website at www.sec.gov.
Quarterly Portfolio Schedule
The Fund files with the SEC a complete schedule of its portfolio holdings, as of the close of the first and third quarters of its fiscal year, on “Form N-Q.” These filings are available on the SEC's website at www.sec.gov and may be reviewed and copied at the SEC's Public Reference Room in Washington, DC. (Call 1-800-SEC-0330 for information on the operation of the Public Reference Room.) You may also access this information from the “Products” section of Federated's website at FederatedInvestors.com by clicking on “Portfolio Holdings” under “Related Information,” then selecting the appropriate link opposite the name of the Fund; or select the name of the Fund and from the Fund's page, click on the “Portfolio Holdings” link.
Annual Shareholder ReportMutual funds are not bank deposits or obligations, are not guaranteed by any bank and are not insured or guaranteed by the U.S. government, the Federal Deposit Insurance Corporation, the Federal Reserve Board or any other government agency. Investment in mutual funds involves investment risk, including the possible loss of principal.
This Report is authorized for distribution to prospective investors only when preceded or accompanied by the Fund's Prospectus, which contains facts concerning its objective and policies, management fees, expenses and other information.

Federated Municipal High Yield Advantage Fund
Federated Investors Funds
4000 Ericsson Drive
Warrendale, PA 15086-7561
Contact us at FederatedInvestors.com
or call 1-800-341-7400.
Federated Securities Corp., Distributor
Cusip 313923864
Cusip 313923856
Cusip 313923849
Cusip 313923831
G01091-01 (10/10)
Federated is a registered mark of Federated Investors, Inc.
2010 © Federated Investors, Inc.
Federated Michigan Intermediate Municipal Trust
Established 1991
A Portfolio of Federated Municipal Securities Income Trust
ANNUAL SHAREHOLDER REPORT
August 31, 2010
Class A Shares
FINANCIAL HIGHLIGHTS
SHAREHOLDER EXPENSE EXAMPLE
MANAGEMENT'S DISCUSSION OF FUND PERFORMANCE
PORTFOLIO OF INVESTMENTS SUMMARY TABLE
PORTFOLIO OF INVESTMENTS
STATEMENT OF ASSETS AND LIABILITIES
STATEMENT OF OPERATIONS
STATEMENT OF CHANGES IN NET ASSETS
NOTES TO FINANCIAL STATEMENTS
REPORT OF INDEPENDENT REGISTERED PUBLIC ACCOUNTING FIRM
BOARD OF TRUSTEES AND TRUST OFFICERS
EVALUATION AND APPROVAL OF ADVISORY CONTRACT
VOTING PROXIES ON FUND PORTFOLIO SECURITIES
QUARTERLY PORTFOLIO SCHEDULE
Financial Highlights - Class A Shares
(For a Share Outstanding Throughout Each Period)
| Year Ended August 31 | 2010 | 2009 | 2008 | 2007 | 2006 |
| Net Asset Value, Beginning of Period | $10.80 | $10.84 | $10.84 | $11.03 | $11.23 |
| Income From Investment Operations: |
| Net investment income | 0.40 | 0.42 | 0.45 | 0.46 | 0.45 |
| Net realized and unrealized gain (loss) on investments and futures contracts | 0.47 | (0.04) | (0.00)1 | (0.19) | (0.20) |
| TOTAL FROM INVESTMENT OPERATIONS | 0.87 | 0.38 | 0.45 | 0.27 | 0.25 |
| Less Distributions: |
| Distributions from net investment income | (0.40) | (0.42) | (0.45) | (0.46) | (0.45) |
| Net Asset Value, End of Period | $11.27 | $10.80 | $10.84 | $10.84 | $11.03 |
| Total Return2 | 8.25% | 3.69% | 4.19% | 2.49% | 2.33% |
| Ratios to Average Net Assets: |
| Net expenses | 0.54% | 0.54% | 0.53% | 0.50% | 0.50% |
| Net investment income | 3.66% | 3.98% | 4.10% | 4.21% | 4.10% |
| Expense waiver3 | 0.35% | 0.31% | 0.32% | 0.34% | 0.32% |
| Supplemental Data: |
| Net assets, end of period (000 omitted) | $160,614 | $164,536 | $155,117 | $151,877 | $167,329 |
| Portfolio turnover | 21% | 12% | 13% | 17% | 22% |
| 1 | Represents less than $0.01. |
| 2 | Based on net asset value, which does not reflect the sales charge, redemption fee or contingent deferred sales charge, if applicable. |
| 3 | This expense decrease is reflected in both the net expense and net investment income ratios shown above. |
See Notes which are an integral part of the Financial Statements
Annual Shareholder ReportShareholder Expense Example (unaudited)
As a shareholder of the Fund, you incur two types of costs: (1) transaction costs, including sales charges (“loads”) on purchase or redemption payments; and (2) ongoing costs, including management fees and to the extent applicable, distribution (12b-1) fees and/or shareholder services fees and other Fund expenses. This Example is intended to help you to understand your ongoing costs (in dollars) of investing in the Fund and to compare these costs with the ongoing costs of investing in other mutual funds. It is based on an investment of $1,000 invested at the beginning of the period and held for the entire period from March 1, 2010 to August 31, 2010.
The first section of the table below provides information about actual account values and actual expenses. You may use the information in this section, together with the amount you invested, to estimate the expenses that you incurred over the period. Simply divide your account value by $1,000 (for example, an $8,600 account value divided by $1,000 = 8.6), then multiply the result by the number in the first section under the heading entitled “Expenses Paid During Period” to estimate the expenses attributable to your investment during this period.
HYPOTHETICAL EXAMPLE FOR COMPARISON PURPOSES
The second section of the table below provides information about hypothetical account values and hypothetical expenses based on the Fund's actual expense ratio and an assumed rate of return of 5% per year before expenses, which is not the Fund's actual return. Thus, you should not use the hypothetical account values and expenses to estimate the actual ending account balance or your expenses for the period. Rather, these figures are required to be provided to enable you to compare the ongoing costs of investing in the Fund with other funds. To do so, compare this 5% hypothetical example with the 5% hypothetical examples that appear in the shareholder reports of the other funds.
Annual Shareholder Report| Beginning Account Value 3/1/2010 | Ending Account Value 8/31/2010 | Expenses Paid During Period1 |
| Actual | $1,000 | $1,046.30 | $2.79 |
| Hypothetical (assuming a 5% return before expenses) | $1,000 | $1,022.48 | $2.75 |
| 1 | Expenses are equal to the Fund's annualized net expense ratio of 0.54%, multiplied by the average account value over the period, multiplied by 184/365 (to reflect the one-half-year period). |
Performance data quoted represents past performance which is no guarantee of future results. Investment return and principal value will fluctuate so that an investor's shares, when redeemed, may be worth more or less than their original cost. Mutual fund performance changes over time and current performance may be lower or higher than what is stated. For current to the most recent month-end performance and after-tax returns, visit FederatedInvestors.com or call 1-800-341-7400.
Management's Discussion of Fund
Performance (unaudited)
The Fund's total return, based on net asset value, for the 12-month reporting period ended August 31, 2010, was 8.25%. The total return of the S&P/Investortools Municipal Bond Intermediate Index (“Intermediate Index”),1 a broad-based securities market index, was 9.87% for the same period. The Fund's total return reflected actual cash flows, transaction costs and other expenses which were not reflected in the total return of the Intermediate Index.
| 1 | The Fund's investment adviser has elected to change the fund's broad-based securities market index to the Intermediate Index from the Barclays Capital 7-Year Municipal Bond Index (BC7MB). The Intermediate Index is more representative of the securities in which the Fund invests. The Intermediate Index consists of bonds in the S&P/Investortools Municipal Bond Index (“Main Index”) with a minimum maturity of 3 years and a maximum maturity of up to, but not including, 15 years as measured from the monthly rebalancing date of the Main Index. The Main Index is a broad, comprehensive, market value-weighted index composed of approximately 55,000 bond issues that are exempt from U.S. federal income taxes or subject to the alternative minimum tax (AMT). Eligibility criteria for inclusion in the Main Index include, but are not limited to: the bond issuer must be a state (including the Commonwealth of Puerto Rico and U.S. territories) or a local government or a state or local government entity where interest on the bond is exempt from U.S. federal income taxes or subject to the AMT; the bond must be held by a mutual fund for which Standard & Poor's Securities Evaluations, Inc. provides prices; it must be denominated in U.S. dollars and have a minimum par amount of $2 million; and the bond must have a minimum term to maturity and/or call date greater than or equal to one calendar month. The Main Index is rebalanced monthly. The total return of the BC7MB was 9.44% for the 12-month reporting period. The BC7MB is an unmanaged market value-weighted index for the long-term, tax-exempt bond market. To be included in the index, bonds must have a minimum credit rating of at Baa3, an outstanding par value of at least $7 million and be issued as part of a transaction of at least $75 million. The bonds must have an issue date after December 31, 1990 and a maturity range of six to eight years. The BC7MB includes both zero coupon bonds and bonds subject to the alternative minimum tax. Neither the Intermediate Index nor the BC7MB are adjusted to reflect sales charges, expenses and other fees that the Securities and Exchange Commission (SEC) requires to be reflected in the Fund's performance. It is not possible to invest directly in an index. |
The 8.25% total return for the reporting period consisted of 3.90% of tax-exempt dividends and 4.35% of price appreciation in the net asset value of the shares.4
During the 12-month reporting period, the pace of recovery in output and employment slowed with tight credit, modest income growth and lower housing wealth being major contributors to this economic environment. Yields on nominal Treasury coupon securities fell noticeably during the period, and Treasury auctions were generally well received. The pace of economic recovery was more modest than had been anticipated and inflation remained subdued. To help support economic recovery the Federal Reserve Board (the “Fed”) kept constant its holdings of securities at the current levels by reinvesting principal payments from agency debt and mortgage backed securities in longer term Treasury securities and rolling over its holdings of Treasury debt as it matured. The Fed maintained the target range for the federal funds rate between 0.00% and 0.25% during the entire period.
| 2 | Duration is a measure of a security's price sensitivity to changes in interest rates. Securities with longer durations are more sensitive to changes in interest rates than securities with shorter durations. |
| 3 | Bond prices are sensitive to changes in interest rates and a rise in interest rates can cause a decline in their prices. |
| 4 | Income may be subject to the federal alternative minimum tax for individuals or corporations. |
During the 12-month reporting period, the Michigan tax-exempt municipal market reflected the national market. According to Municipal Market Data, yields on Michigan bonds fell over the course of the period, as the overall yield curve fell and spreads on Michigan credits tightened. The Bond Buyer reported that issuance of Michigan municipal bonds for the first eight months of 2010 was in line with the same period in 2009, however a significant portion of these were taxable BABs, resulting in a net decline in the issuance of tax-exempt bonds.
The economic and fiscal situations in Michigan remained weak as the state continued to be particularly hard hit by the recession, but Michigan's economy began to improve with the natural economy during the period. The state grappled with the fallout of the bankruptcies of GM and Chrysler and other large declines in the manufacturing sector. The state's unemployment rate at the end of July stood at 13.1%, second only to Nevada, but with the domestic auto industry starting to regain its footing during the period, Michigan payrolls began to expand again in 2010. Home prices remained weak. Both the state and local governments have had to confront declining revenues and budget deficits.
Despite the weak economic and fiscal situation in Michigan, the state saw its rating raised by two of the ratings agencies as a result of recalibrations of their ratings systems. In April, Moody's Investors Service revised the rating on the state's general obligation debt from Aa3 to Aa2 and Fitch Ratings revised its rating from A+ to AA-. S&P's rating of AA- remained unchanged. All three ratings carried stable outlooks.
Annual Shareholder ReportAs determined at the end of the 12-month reporting period, the Fund's dollar-weighted average duration was 4.7 years. Duration management was a significant component of the Fund's investment strategy. The Fund's duration was maintained short of the duration of the Intermediate Index during the 12-month reporting period. With falling rates, the Fund's relatively short duration had a slight negative impact on the Fund's performance relative to the Intermediate Index.
Throughout the yield curve, bonds with longer maturities outperformed bonds with shorter maturities during the reporting period. Since the Fund had a larger concentration of bonds in shorter maturities relative to the Intermediate Index, yield curve positioning was a net detractor to the Fund's performance.
During the 12-month reporting period, the Fund was overweight, as compared to the Intermediate Index, in hospital and industrial revenue bonds, which were among the best-performing sectors. Likewise, the Fund was underweight pre-refunded and water and sewer bonds, which underperformed. Thus, sector selection was positive contributor to the Fund's performance versus the Intermediate Index.
The Fund maintained a high-quality portfolio, with over 90% of the portfolio rated in one of the three highest rating categories (AAA, AA and A) throughout the 12-month reporting period.5 High-quality, tax-exempt municipal bonds underperformed lower quality bonds, as spreads tightened on the latter, driving their prices down. Consequently, credit quality contributed to the Fund's underperformance versus the Intermediate Index.6
| 5 | Credit ratings pertain only to the securities in the portfolio and do not protect the Fund shares against market risk. |
| 6 | Investment-grade securities are securities that are rated at least BBB (i.e., in one of the four highest rating categories) or unrated securities of a comparable quality. Noninvestment-grade securities are securities that are not rated at least BBB or unrated securities of a comparable quality. Credit ratings are an indication of the risk that a security will default. They do not protect a security from credit risk. Lower-rated bonds typically offer higher yields to help compensate investors for the increased risk associated with them. Among these risks are lower creditworthiness, greater price volatility, more risk to principal and income than with higher-rated securities and increased possibilities of default. |
GROWTH OF A $10,000 INVESTMENT - CLASS A SHARES
The graph below illustrates the hypothetical investment of $10,0001 in the Federated Michigan Intermediate Municipal Trust (Class A Shares) (the “Fund”) from August 31, 2000 to August 31, 2010, compared to the S&P/Investortools Municipal Bond Intermediate Index (Intermediate Index),2 the Barclays Capital 7-Year Municipal Bond Index (BC7MB)2 and S&P/Investortools Municipal Bond MI, Investment Grade, 3-15 Years Sub-Index (Michigan (3-15) Index).2
| Average Annual Total Returns3 for the Period Ended 8/31/2010 | |
| 1 Year | 5.04% |
| 5 Years | 3.53% |
| 10 Years | 4.47% |
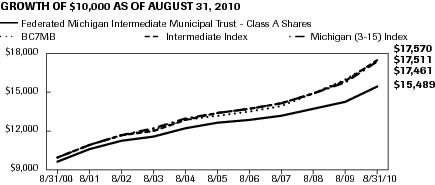
Performance data quoted represents past performance which is no guarantee of future results. Investment return and principal value will fluctuate so that an investor's shares, when redeemed, may be worth more or less than their original cost. Mutual fund performance changes over time and current performance may be lower or higher than what is stated. For current to the most recent month-end performance and after-tax returns, visit FederatedInvestors.com or call 1-800-341-7400. Returns shown do not reflect the deduction of taxes that a shareholder would pay on Fund distributions or the redemption of Fund shares. Mutual funds are not obligations of or guaranteed by any bank and are not federally insured. Total returns shown include the maximum sales charge of 3.00%.
Annual Shareholder Report| 1 | Represents a hypothetical investment of $10,000 in the Fund after deducting the maximum sales charge of 3.00% ($10,000 investment minus $300 sales charge = $9,700). The Fund's performance assumes the reinvestment of all dividends and distributions. The Intermediate Index, BC7MB and Michigan (3-15) Index have been adjusted to reflect reinvestment of dividends on securities in the indexes. |
| 2 | The Fund's investment adviser has elected to change the Fund's broad-based securities market index to the Intermediate Index from the BC7MB. The Intermediate Index is more representative of the securities in which the Fund invests. The Intermediate Index consists of bonds in the S&P/Investortools Municipal Bond Index (“Main Index”) with a minimum maturity of 3 years and a maximum maturity of up to, but not including, 15 years as measured from the Rebalancing Date of the Main Index. The Main Index is a broad, comprehensive, market value-weighted index composed of approximately 55,000 bond issues that are exempt from U.S. federal income taxes or subject to the alternative minimum tax (AMT). Eligibility criteria for inclusion in the Main Index include, but are not limited to: the bond issuer must be a state (including the Commonwealth of Puerto Rico and U.S. territories) or a local government or a state or local government entity where interest on the bond is exempt from U.S. federal income taxes or subject to the AMT; the bond must be held by a mutual fund for which Standard & Poor's Securities Evaluations, Inc. provides prices; it must be denominated in U.S. dollars and have a minimum par amount of $2 million; and the bond must have a minimum term to maturity and/or call date greater than or equal to one calendar month. The Main Index is rebalanced monthly. The BC7MB is an unmanaged market value-weighted index for the long-term, tax-exempt bond market. To be included in the index, bonds must have a minimum credit rating of at Baa3, an outstanding par value of at least $7 million and be issued as part of a transaction of at least $75 million. The bonds must have an issue date after December 31, 1990, and a maturity range of six to eight years. The BC7MB include both zero coupon bonds and bonds subject to the AMT. The Michigan (3-15) Index represents, by market weighting, the portion of the Intermediate Index composed solely of bonds issued by the State of Michigan or local governments or state or local government entities within Michigan that are rated BBB-/Baa3 or higher with remaining maturities of between 3 and 15 years. Neither the Intermediate Index, BC7MB, nor Michigan (3-15) Index are adjusted to reflect sales charges, expenses and other fees that the SEC requires to be reflected in the Fund's performance. The Intermediate Index, BC7MB and Michigan (3-15) Index are unmanaged and, unlike the Fund, are not affected by cash flows. It is not possible to invest directly in an index. |
| 3 | Total returns quoted reflect all applicable sales charges. |
Portfolio of Investments Summary Table (unaudited)
At August 31, 2010, the Fund's sector composition1 was as follows:
| Sector Composition | Percentage of Total Net Assets |
| General Obligation - Local | 36.4% |
| Hospital | 14.0% |
| Education | 8.5% |
| Water Sewer | 8.1% |
| General Obligation - State | 6.0% |
| Special Tax | 5.5% |
| Industrial Development Bond/Pollution Control Revenue Bond | 5.2% |
| Pre-refunded | 4.7% |
| Transportation | 4.5% |
| Multi-Family Housing | 2.0% |
| Other2 | 4.0% |
| Other Assets and Liabilities — Net3 | 1.1% |
| TOTAL | 100.0% |
| 1 | Sector classifications, and the assignment of holdings to such sectors, are based upon the economic sector and/or revenue source of the underlying obligor, as determined by the Fund's adviser. For securities that have been enhanced by a third-party, including bond insurers and banks, sector classifications are based upon the economic sector and/or revenue source of the underlying obligor, as determined by the Fund's Adviser. Pre-refunded securities are those whose debt service is paid from escrowed assets, usually U.S. government securities. |
| 2 | For purposes of this table, sector classifications constitute 94.9% of the Fund's total net assets. Remaining sectors have been aggregated under the designation “Other.” |
| 3 | Assets, other than investments in securities, less liabilities. See Statement of Assets and Liabilities. |
Portfolio of Investments
August 31, 2010
| Principal Amount | Value |
| MUNICIPAL BONDS – 98.4% |
| Michigan – 98.4% |
| $1,000,000 | Allendale, MI Public School District, UT GO Bonds, 5.00% (Assured Guaranty Municipal Corp. INS), 5/1/2021 | 1,119,350 |
| 500,000 | Anchor Bay, MI School District, Refunding UT GO Bonds (Series III), 5.50% (Q-SBLF GTD), 5/1/2014 | 536,225 |
| 1,000,000 | Anchor Bay, MI School District, Refunding UT GO Bonds (Series III), 5.50% (Q-SBLF GTD), 5/1/2017 | 1,066,770 |
| 1,300,000 | Ann Arbor, MI Public School District, School Building & Site UT GO Bonds, 5.00% (National Public Finance Guarantee Corporation INS), 5/1/2019 | 1,460,446 |
| 955,000 | Ann Arbor, MI, Court and Police Facilities LT GO Capital Improvement Bonds, 4.75%, 5/1/2025 | 1,061,750 |
| 1,125,000 | Armada, MI Area Schools, School Building & Site UT GO Bonds, 5.00% (National Public Finance Guarantee Corporation INS), 5/1/2021 | 1,259,190 |
| 1,000,000 | Avondale, MI School District, Refunding UT GO Bonds (Series 20009), 4.50% (Q-SBLF GTD)/(Assured Guaranty Corp. INS), 5/1/2018 | 1,104,250 |
| 1,000,000 | Battle Creek, MI School District, School Building & Site UT GO Bonds, 5.00% (Assured Guaranty Municipal Corp. INS), 5/1/2022 | 1,111,880 |
| 725,000 | Berkley, MI School District, Refunding UT GO Bonds (Series 2009), 5.00% (Q-SBLF GTD)/(Assured Guaranty Corp. INS), 5/1/2019 | 854,101 |
| 1,000,000 | Brandon School District, MI, UT GO School Building and Site Bonds, 5.00% (Assured Guaranty Municipal Corp. INS), 5/1/2019 | 1,123,420 |
| 1,215,000 | Bridgeport Spaulding, MI Community School District, UT GO Bonds, 5.50% (Q-SBLF GTD), 5/1/2015 | 1,296,126 |
| 100,000 | Canton Charter Township, MI, LT GO Bonds, 5.00% (Assured Guaranty Municipal Corp. INS), 4/1/2014 | 113,836 |
| 1,000,000 | Central Michigan University Board of Trustees, General Revenue Refunding Bonds (Series 2009), 5.00%, 10/1/2023 | 1,119,960 |
| 1,245,000 | Charlevoix, MI Public School District, Refunding UT GO Bonds, 5.25% (Q-SBLF GTD), 5/1/2016 | 1,303,789 |
| 500,000 | Chippewa Valley, MI Schools, UT GO Refunding Bonds, 5.00% (Q-SBLF GTD)/(Assured Guaranty Municipal Corp. INS), 5/1/2014 | 569,105 |
| 515,000 | Coldwater, MI Electric Utility, Revenue Refunding Bonds, 4.50% (Syncora Guarantee, Inc. INS), 8/1/2011 | 530,342 |
| 570,000 | Coldwater, MI Electric Utility, Revenue Refunding Bonds, 4.50% (Syncora Guarantee, Inc. INS), 8/1/2013 | 611,764 |
| 1,400,000 | Coopersville, MI Public Schools, School Building & Site UT GO Bonds, 5.00% (Assured Guaranty Municipal Corp. INS), 5/1/2021 | 1,544,088 |
| 1,250,000 | Coopersville, MI Public Schools, School Building & Site UT GO Bonds, 5.00% (Assured Guaranty Municipal Corp. INS), 5/1/2022 | 1,370,662 |
| Principal Amount | Value |
| $1,000,000 | Cornell Township MI, Economic Development Corp., Refunding Revenue Bonds, 5.875% (MeadWestvaco Corp.)/(United States Treasury PRF 5/1/2012@100), 5/1/2018 | 1,087,040 |
| 1,500,000 | Detroit, MI Sewage Disposal System, Revenue Refunding Bonds, 5.50% (National Public Finance Guarantee Corporation INS), 7/1/2016 | 1,677,105 |
| 1,000,000 | Detroit, MI Water Supply System, Revenue Bonds Series A, 5.00% (Assured Guaranty Municipal Corp. INS), 7/1/2015 | 1,102,570 |
| 1,000,000 | Detroit, MI Water Supply System, Senior Lien Revenue Bonds (Series 2005-B), 5.50% (Berkshire Hathaway Assurance Corp. INS)/(FGIC INS), 7/1/2020 | 1,159,700 |
| 2,000,000 | Detroit, MI Water Supply System, Senior Lien Revenue Bonds (Series 2006A), 5.00% (Assured Guaranty Municipal Corp. INS), 7/1/2018 | 2,183,420 |
| 1,000,000 | Detroit, MI, UT GO Bonds (Series 1999A), 5.00% (Assured Guaranty Municipal Corp. INS)/(Original Issue Yield: 5.16%), 4/1/2019 | 1,005,160 |
| 2,000,000 | Detroit, MI, UT GO Bonds (Series 2008-A), 5.00% (Assured Guaranty Corp. INS), 4/1/2021 | 2,073,980 |
| 1,120,000 | Detroit, MI, UT GO Bonds, Series B, 5.00% (Assured Guaranty Municipal Corp. INS), 4/1/2015 | 1,180,346 |
| 1,000,000 | Detroit/Wayne County, MI Stadium Authority, Revenue Bonds, 5.25% (FGIC and National Public Finance Guarantee Corporation INS)/(Original Issue Yield: 5.55%), 2/1/2011 | 1,002,340 |
| 2,000,000 | Dickinson County, MI Economic Development Corp., Refunding PCRBs (Series 2004A), 4.80% (International Paper Co.), 11/1/2018 | 2,021,320 |
| 1,925,000 | East Grand Rapids, MI Public School District, Refunding UT GO Bonds (Series 2001), 5.50% (Q-SBLF GTD), 5/1/2019 | 1,979,766 |
| 1,000,000 | Eastern Michigan University Board of Regents, General Revenue Bonds (Series 2009C), 5.00% (Assured Guaranty Corp. INS), 2/15/2023 | 1,114,760 |
| 250,000 | Essexville-Hampton, MI Public Schools, UT GO Refunding Bonds, 4.00% (Q-SBLF GTD)/(Assured Guaranty Municipal Corp. INS), 5/1/2014 | 271,597 |
| 1,000,000 | Ferris State University, MI, General Revenue Bonds (Series 2009), 5.00% (Assured Guaranty Corp. INS), 10/1/2020 | 1,157,740 |
| 1,415,000 | Grand Rapids, MI Sanitary Sewer System, Improvement Revenue Bonds (Series 2008), 5.00%, 1/1/2023 | 1,601,978 |
| 1,575,000 | Howell, MI Public Schools, Refunding UT GO Bonds, 5.25% (Q-SBLF GTD), 5/1/2017 | 1,614,139 |
| 1,000,000 | Kalamazoo, MI Public Schools, Refunding Building & Site UT GO Bonds, 5.00% (Assured Guaranty Municipal Corp. INS), 5/1/2018 | 1,139,290 |
| 1,000,000 | Kalamazoo, MI Regional Educational Services Agency, UT GO School Building and Site Bonds, 5.00%, 5/1/2019 | 1,160,540 |
| 450,000 | Kalamazoo, MI Water Revenue, Revenue Refunding Bonds, 5.00% (AMBAC Assurance Corporation INS), 9/1/2014 | 515,264 |
| Principal Amount | Value |
| $510,000 | Kalamazoo, MI Water Revenue, Revenue Refunding Bonds, 5.00% (AMBAC Assurance Corporation INS), 9/1/2015 | 590,504 |
| 1,785,000 | Kent County, MI Airport Revenue, LT GO Airport Revenue Bonds (Series 2007), 5.00% (Gerald R. Ford International Airport), 1/1/2021 | 1,969,962 |
| 1,345,000 | Kent County, MI, Capital Improvement LT GO Bonds (Series 2004A), 5.00%, 12/1/2020 | 1,529,171 |
| 1,750,000 | Kent County, MI, LT GO Bonds (Series 2009), 5.00%, 1/1/2025 | 1,973,283 |
| 600,000 | Kent Hospital Finance Authority, MI, Revenue Refunding Bonds (Series B), 5.00% (Spectrum Health), 7/15/2011 | 619,722 |
| 1,700,000 | Lake Superior State University, MI, General Revenue Bonds, 5.50% (AMBAC Assurance Corporation INS), 11/15/2021 | 1,735,071 |
| 2,275,000 | Lakeview, MI Public School District, Refunding UT GO Bonds, 5.00% (National Public Finance Guarantee Corporation INS), 5/1/2017 | 2,644,028 |
| 1,000,000 | Lansing, MI School District, Refunding School Building & Site UT GO Bonds, 5.00% (Q-SBLF GTD), 5/1/2020 | 1,106,650 |
| 1,200,000 | Marysville, MI Public School District, School Building & Site UT GO Bonds (Series 2007), 5.00% (Assured Guaranty Municipal Corp. INS), 5/1/2022 | 1,331,976 |
| 1,225,000 | Michigan Municipal Bond Authority, 5.75% (Grand Rapids, MI), 5/1/2023 | 1,405,467 |
| 1,000,000 | Michigan Municipal Bond Authority, Revenue Bonds (Series 2005B), 5.00% (Detroit, MI City School District)/(Assured Guaranty Municipal Corp. INS), 6/1/2015 | 1,131,340 |
| 1,000,000 | Michigan Municipal Bond Authority, Revenue Bonds (Series 2007B), 5.00% (AMBAC Assurance Corporation INS), 12/1/2013 | 1,052,250 |
| 2,000,000 | Michigan Municipal Bond Authority, Revenue Bonds (Series 2010), 5.00% (Clean Water Revolving Fund), 10/1/2027 | 2,315,600 |
| 1,525,000 | Michigan Municipal Bond Authority, Revenue Bonds, 5.00% (Clean Water Revolving Fund), 10/1/2017 | 1,837,457 |
| 55,000 | Michigan State Building Authority, Facilities Program Refunding Revenue Bonds (Series 2001I), 5.50% (United States Treasury PRF 10/15/2011@100), 10/15/2019 | 58,198 |
| 945,000 | Michigan State Building Authority, Facilities Program Refunding Revenue Bonds (Series 2001I), 5.50%, 10/15/2019 | 981,609 |
| 1,000,000 | Michigan State Building Authority, Facilities Program Revenue Bonds (Series 2009II), 5.00% (Assured Guaranty Corp. INS), 10/15/2022 | 1,123,970 |
| 2,000,000 | 1 | Michigan State Building Authority, Revenue Bonds (Series 2006 IA), 4.77% (FGIC and National Public Finance Guarantee Corporation INS)/(Original Issue Yield: 4.77%), 10/15/2021 | 1,199,900 |
| 1,000,000 | Michigan State Building Authority, Revenue Refunding Bonds (Series 2009I), 5.25% (Michigan State)/(Assured Guaranty Corp. INS), 10/15/2024 | 1,123,480 |
| 1,000,000 | Michigan State Building Authority, Revenue Refunding Bonds (Series I), 5.00% TOBs (AMBAC Assurance Corporation INS), Mandatory Tender 10/15/2011 | 1,042,360 |
| Principal Amount | Value |
| $2,000,000 | Michigan State Comprehensive Transportation Fund, Refunding Bonds (Series 2009), 5.25%, 5/15/2019 | 2,385,020 |
| 950,000 | Michigan State Comprehensive Transportation Fund, Revenue Refunding Bonds (Series A), 5.50% (Assured Guaranty Municipal Corp. INS), 5/15/2011 | 982,822 |
| 1,000,000 | Michigan State Department of Transportation, Grant Anticipation Bonds, 4.25% (Assured Guaranty Municipal Corp. INS), 9/15/2012 | 1,066,220 |
| 2,485,000 | Michigan State Department of Transportation, Grant Anticipation Bonds, 5.25% (Assured Guaranty Municipal Corp. INS), 9/15/2021 | 2,834,167 |
| 1,275,000 | Michigan State Hospital Finance Authority, Hospital Revenue & Refunding Bonds (Series 2007A), 5.00% (Oakwood Obligated Group), 7/15/2018 | 1,359,571 |
| 1,000,000 | Michigan State Hospital Finance Authority, Hospital Revenue and Refunding Bonds (Series 2006A), 5.00% (Henry Ford Health System, MI), 11/15/2021 | 1,034,950 |
| 2,000,000 | Michigan State Hospital Finance Authority, Hospital Revenue Bonds (Series 2006A), 5.00% (MidMichigan Obligated Group), 4/15/2026 | 2,039,820 |
| 1,300,000 | Michigan State Hospital Finance Authority, Refunding Revenue Bonds (Series 2002A), 5.50% (Crittenton Hospital Medical Center), 3/1/2016 | 1,345,513 |
| 1,000,000 | Michigan State Hospital Finance Authority, Refunding Revenue Bonds (Series 2010 F-3), 2.625% TOBs (Ascension Health Credit Group), Mandatory Tender 6/30/2014 | 1,032,710 |
| 750,000 | Michigan State Hospital Finance Authority, Refunding Revenue Bonds, 5.00% (Sparrow Obligated Group, MI), 11/15/2022 | 788,018 |
| 930,000 | Michigan State Hospital Finance Authority, Revenue Bonds (Series 1993P), 5.375% (Sisters of Mercy Health System)/(United States Treasury COL)/(Original Issue Yield: 5.55%)/(National Public Finance Guarantee Corporation INS), 8/15/2014 | 1,013,523 |
| 2,000,000 | Michigan State Hospital Finance Authority, Revenue Bonds (Series 2005C), 5.00% (McLaren Health Care Corp.), 8/1/2020 | 2,110,320 |
| 3,500,000 | Michigan State Hospital Finance Authority, Revenue Bonds (Series 2006A), 5.00% (Trinity Healthcare Credit Group), 12/1/2026 | 3,628,905 |
| 2,000,000 | Michigan State Hospital Finance Authority, Revenue Bonds (Series 2010B), 5.00% (Ascension Health Credit Group), 11/15/2024 | 2,176,740 |
| 530,000 | Michigan State Hospital Finance Authority, Revenue Refunding Bonds (Series A), 5.00% (Oakwood Obligated Group), 7/15/2011 | 542,736 |
| 250,000 | Michigan State Hospital Finance Authority, Revenue Refunding Bonds (Series A), 5.00% (Henry Ford Health System, MI), 11/15/2014 | 270,923 |
| 500,000 | Michigan State Hospital Finance Authority, Revenue Refunding Bonds (Series A), 5.00% (Henry Ford Health System, MI), 11/15/2025 | 505,355 |
| 1,000,000 | Michigan State Hospital Finance Authority, Revenue Refunding Bonds (Series A), 5.00% (Oakwood Obligated Group), 7/15/2025 | 1,015,570 |
| 250,000 | Michigan State Hospital Finance Authority, Revenue Refunding Bonds, 5.00% (Sparrow Obligated Group, MI), 11/15/2012 | 266,153 |
| Principal Amount | Value |
| $500,000 | Michigan State Hospital Finance Authority, Revenue Refunding Bonds, 5.00% (Sparrow Obligated Group, MI), 11/15/2017 | 547,375 |
| 450,000 | Michigan State Hospital Financial Authority, Revenue Bonds (Series A), 4.15% (Holland Community Hospital), 1/1/2012 | 463,018 |
| 3,500,000 | 1 | Michigan State House of Representatives, COPs, 5.29% (AMBAC Assurance Corporation INS)/(Capitol Outlook LLC)/(United States Treasury COL)/(Original Issue Yield: 5.29%), 8/15/2022 | 2,330,125 |
| 500,000 | Michigan State Housing Development Authority, MFH Revenue Bonds (Series 2007D), 3.75%, 10/1/2011 | 508,340 |
| 2,000,000 | Michigan State Housing Development Authority, MFH Revenue Bonds (Series 2010A), 4.375%, 10/1/2025 | 2,021,080 |
| 195,000 | Michigan State Housing Development Authority, MFH Revenue Bonds (Series B), 4.00% (Assured Guaranty Municipal Corp. INS), 10/1/2012 | 200,478 |
| 145,000 | Michigan State Housing Development Authority, MFH Revenue Bonds (Series B), 4.00% (Assured Guaranty Municipal Corp. INS)/(Go of Authority LOC), 4/1/2012 | 148,274 |
| 210,000 | Michigan State Housing Development Authority, MFH Revenue Bonds (Series B), 4.05% (Assured Guaranty Municipal Corp. INS), 10/1/2013 | 217,604 |
| 100,000 | Michigan State Housing Development Authority, MFH Revenue Bonds (Series B), 4.05% (Assured Guaranty Municipal Corp. INS), 4/1/2013 | 103,130 |
| 500,000 | Michigan State South Central Power Agency, Power Supply Revenue Refunding Bonds, 4.50% (AMBAC Assurance Corporation INS), 11/1/2011 | 520,570 |
| 1,000,000 | Michigan State Strategic Fund, Ltd Obligation Refunding Revenue Bonds, 7.00% (Detroit Edison Co.)/(AMBAC Assurance Corporation INS), 5/1/2021 | 1,263,030 |
| 820,000 | Michigan State Strategic Fund, Revenue Bonds (Series 2004), 5.00% (NSF International), 8/1/2013 | 868,749 |
| 2,000,000 | Michigan State Strategic Fund, Revenue Bonds, 4.25% TOBs (Republic Services, Inc.), Mandatory Tender 4/1/2014 | 2,034,860 |
| 145,000 | Michigan State Strategic Fund, Revenue Bonds, 5.30% (Porter Hills Presbyterian Village, Inc.)/(Original Issue Yield: 5.422%), 7/1/2018 | 145,086 |
| 1,000,000 | Michigan State Strategic Fund, Solid Disposal LT Obligation Refunding Revenue Bonds (Series 2002), 4.625% (Waste Management, Inc.), 12/1/2012 | 1,032,920 |
| 1,000,000 | Michigan State Strategic Fund, Solid Waste Refunding Limited Obligation Revenue Bonds, 4.50% (Waste Management, Inc.), 12/1/2013 | 1,038,680 |
| 2,600,000 | Michigan State Trunk Line, Refunding Revenue Bonds (Series 2009), 5.00%, 11/1/2020 | 3,047,148 |
| 2,000,000 | Michigan State Trunk Line, Refunding Revenue Bonds (Series 2009), 5.00%, 11/1/2022 | 2,290,800 |
| 1,000,000 | Michigan State Trunk Line, Revenue Bonds (Series 2001A), 5.50% (United States Treasury PRF 11/1/2011@100), 11/1/2018 | 1,057,720 |
| Principal Amount | Value |
| $1,000,000 | Michigan State Trunk Line, Revenue Bonds, 5.00% (FGIC and National Public Finance Guarantee Corporation INS), 11/1/2014 | 1,150,720 |
| 1,000,000 | Michigan State Trunk Line, Revenue Bonds, 5.00% (National Public Finance Guarantee Corporation INS), 9/1/2014 | 1,136,220 |
| 1,700,000 | Michigan State, COP (Series A), 5.00% TOBs (National Public Finance Guarantee Corporation INS), Mandatory Tender 9/1/2011 | 1,718,326 |
| 2,000,000 | Michigan State, Environmental Program & Refunding UT GO Bonds (Series 2008A), 5.00%, 5/1/2016 | 2,332,000 |
| 1,000,000 | Michigan Strategic Fund, LT Obligation Refunding Revenue Bonds (Series 2008ET-2), 5.50% TOBs (Detroit Edison Co.), Mandatory Tender 8/1/2016 | 1,135,280 |
| 1,360,000 | Michigan Strategic Fund, LT Obligation Revenue Refunding Bonds (Series C), 5.65% (Detroit Edison Co.), 9/1/2029 | 1,367,466 |
| 2,000,000 | Michigan Technological University Board of Control, General Revenue & Revenue Refunding Bonds (Series 2008), 5.25% (Assured Guaranty Corp. INS), 10/1/2018 | 2,399,920 |
| 1,075,000 | Mount Clemens, MI Community School District, UT GO Bonds, 5.50% (United States Treasury PRF 11/1/2011@100), 5/1/2012 | 1,139,865 |
| 500,000 | Northview Michigan Public School District, Refunding UT GO Bonds, 5.00% (Assured Guaranty Municipal Corp. INS), 5/1/2019 | 578,390 |
| 1,500,000 | Oakland County, MI EDC, Revenue Bonds (Series 2009), 4.00% (Cranbrook Educational Community), 11/1/2021 | 1,580,490 |
| 525,000 | Ovid Elsie, MI Area Schools, UT GO Refunding Bonds, 4.00% (Q-SBLF GTD)/(Assured Guaranty Municipal Corp. INS), 5/1/2015 | 579,463 |
| 1,000,000 | Regents of University of Michigan, General Revenue Bonds (Series 2010C), 4.00%, 4/1/2022 | 1,109,550 |
| 550,000 | Rochester Hills, MI, Refunding UT GO Bonds (Series 2010), 4.50%, 4/1/2021 | 635,008 |
| 1,130,000 | Romulus, MI Tax Increment Finance Authority, Recreation Center LT GO Bonds, 5.00% (Assured Guaranty Municipal Corp. INS), 11/1/2022 | 1,255,859 |
| 1,100,000 | Roseville, MI Community Schools, School Building & Site Refunding UT GO Bonds, 5.00% (Assured Guaranty Municipal Corp. INS), 5/1/2021 | 1,213,212 |
| 2,000,000 | Saginaw, MI Hospital Finance Authority, Revenue Bonds, (Series F), 6.50% (Covenant Medical Center, Inc.)/(Original Issue Yield: 6.645%), 7/1/2030 | 2,021,620 |
| 675,000 | South Lyon, MI Community School District, UT GO Bonds (Series II), 5.25% (United States Treasury PRF 5/1/2014@100), 5/1/2018 | 784,991 |
| 1,130,000 | Taylor, MI Building Authority, Refunding LT GO Bonds, 5.00% (National Public Finance Guarantee Corporation INS), 12/1/2015 | 1,297,997 |
| 1,350,000 | Thornapple Kellogg, MI School District, School Building & Site Refunding UT GO Bonds, 5.00% (National Public Finance Guarantee Corporation INS), 5/1/2022 | 1,489,927 |
| 2,000,000 | Troy, MI City School District, School Building & Site UT GO Bonds, 5.00% (National Public Finance Guarantee Corporation INS), 5/1/2020 | 2,237,900 |
| Principal Amount | Value |
| $450,000 | Troy, MI, Refunding UT GO Bonds (Series 2010), 4.00%, 10/1/2020 | 501,538 |
| 500,000 | Utica, MI Community Schools, School Building and Site Refunding UT GO Bonds, 5.00% (National Public Finance Guarantee Corporation INS), 5/1/2017 | 585,140 |
| 1,625,000 | Warren Woods, MI Public Schools, School Building & Site UT GO Bonds, 5.00% (Assured Guaranty Municipal Corp. INS), 5/1/2018 | 1,843,952 |
| 750,000 | Warren, MI Consolidated School District, UT GO Refunding Bonds, 5.00% (Assured Guaranty Municipal Corp. INS), 5/1/2016 | 873,757 |
| 2,000,000 | Wayne State University, MI, General Revenue Refunding Bonds (Series 2008), 5.00% (Assured Guaranty Municipal Corp. INS), 11/15/2019 | 2,322,880 |
| 1,000,000 | Western Michigan University, General Revenue Refunding Bonds (Series 2009), 5.25% (Assured Guaranty Corp. INS), 11/15/2019 | 1,179,660 |
| 25,000 | Whitehall, MI District Schools, UT GO Bonds, 5.50% (United States Treasury PRF 11/1/2011@100), 5/1/2016 | 26,519 |
| 600,000 | Wyandotte, MI Electric Authority, Revenue Bonds (Series A), 4.50% (National Public Finance Guarantee Corporation INS), 10/1/2011 | 621,090 |
| 600,000 | Wyandotte, MI Electric Authority, Revenue Bonds (Series A), 5.00% (National Public Finance Guarantee Corporation INS), 10/1/2012 | 639,228 |
| 2,350,000 | Ypsilanti, MI School District, UT GO Bonds, 5.00% (National Public Finance Guarantee Corporation INS), 5/1/2023 | 2,570,007 |
| 2,190,000 | Ypsilanti, MI School District, UT GO Refunding Bonds (Series 2009), 5.00% (Q-SBLF GTD)/(Assured Guaranty Corp. INS), 5/1/2017 | 2,497,367 |
| TOTAL MUNICIPAL BONDS (IDENTIFIED COST $149,353,997) | 158,040,472 |
| SHORT-TERM MUNICIPALS – 0.5%;2 |
| Michigan – 0.5% |
| 800,000 | Michigan State Hospital Finance Authority, (Series 2007) Weekly VRDNs (Henry Ford Health System, MI)/(JPMorgan Chase Bank, N.A. LOC), 0.280%, 9/1/2010 (AT AMORTIZED COST) | 800,000 |
| TOTAL INVESTMENTS — 98.9% (IDENTIFIED COST $150,153,997)3 | 158,840,472 |
| OTHER ASSETS AND LIABILITIES - NET — 1.1%4 | 1,773,779 |
| TOTAL NET ASSETS — 100% | $160,614,251 |
Securities that are subject to the federal alternative minimum tax (AMT) represent 5.7% of the Fund's portfolio as calculated based upon total market value (percentage is unaudited).
| 1 | Zero coupon bond, reflects effective rate at time of purchase. |
| 2 | Current rate and next reset date shown for Variable Rate Demand Notes. |
| 3 | The cost of investments for federal tax purposes amounts to $150,146,772. |
| 4 | Assets, other than investments in securities, less liabilities. See Statement of Assets and Liabilities. |
Various inputs are used in determining the value of the Fund's investments. These inputs are summarized in the three broad levels listed below:
Level 1 — quoted prices in active markets for identical securities
Level 2 — other significant observable inputs (including quoted prices for similar securities, interest rates, prepayment speeds, credit risk, etc.)
Level 3 — significant unobservable inputs (including the Fund's own assumptions in determining the fair value of investments)
The inputs or methodology used for valuing securities are not an indication of the risk associated with investing in those securities.
As of August 31, 2010, all investments of the Fund utilized Level 2 inputs in valuing the Fund's assets carried at fair value.
The following acronyms are used throughout this portfolio:
| AMBAC | — American Municipal Bond Assurance Corporation |
| COL | — Collateralized |
| COP | — Certificate of Participation |
| EDC | — Economic Development Commission |
| FGIC | — Financial Guaranty Insurance Company |
| GO | — General Obligation |
| GTD | — Guaranteed |
| INS | — Insured |
| LOC | — Letter of Credit |
| LT | — Limited Tax |
| MFH | — Multi-Family Housing |
| PCRBs | — Pollution Control Revenue Bonds |
| PRF | — Prerefunded |
| Q-SBLF | — Qualified School Bond Loan Fund |
| TOBs | — Tender Option Bonds |
| UT | — Unlimited Tax |
| VRDNs | — Variable Rate Demand Notes |
See Notes which are an integral part of the Financial Statements
Annual Shareholder ReportStatement of Assets and Liabilities
August 31, 2010
| Assets: |
| Total investments in securities, at value (identified cost $150,153,997) | $158,840,472 |
| Cash | 5,367 |
| Income receivable | 2,167,192 |
| Receivable for shares sold | 276,034 |
| TOTAL ASSETS | 161,289,065 |
| Liabilities: |
| Payable for shares redeemed | $315,693 |
| Income distribution payable | 278,177 |
| Payable for shareholder services fee (Note 5) | 29,562 |
| Payable for portfolio accounting fees | 28,305 |
| Accrued expenses | 23,077 |
| TOTAL LIABILITIES | 674,814 |
| Net assets for 14,246,526 shares outstanding | $160,614,251 |
| Net Assets Consist of: |
| Paid-in capital | $153,022,635 |
| Net unrealized appreciation of investments | 8,686,475 |
| Accumulated net realized loss on investments and futures contracts | (1,094,921) |
| Undistributed net investment income | 62 |
| TOTAL NET ASSETS | $160,614,251 |
| Net Asset Value, Offering Price and Redemption Proceeds Per Share: |
| Net asset value per share ($160,614,251 ÷ 14,246,526 shares outstanding), no par value, unlimited shares authorized | $11.27 |
| Offering price per share (100/97.00 of $11.27) | $11.62 |
| Redemption proceeds per share | $11.27 |
See Notes which are an integral part of the Financial Statements
Annual Shareholder ReportStatement of Operations
Year Ended August 31, 2010
| Investment Income: |
| Interest | $6,849,838 |
| Expenses: |
| Investment adviser fee (Note 5) | $651,254 |
| Administrative personnel and services fee (Note 5) | 150,000 |
| Custodian fees | 11,779 |
| Transfer and dividend disbursing agent fees and expenses | 66,559 |
| Directors'/Trustees' fees | 1,895 |
| Auditing fees | 20,500 |
| Legal fees | 2,924 |
| Portfolio accounting fees | 101,796 |
| Shareholder services fee (Note 5) | 366,086 |
| Account administration fee | 24,222 |
| Share registration costs | 22,932 |
| Printing and postage | 22,744 |
| Insurance premiums | 4,587 |
| Miscellaneous | 2,074 |
| TOTAL EXPENSES | 1,449,352 |
| Waivers (Note 5): |
| Waiver of investment adviser fee | $(538,833) |
| Waiver of administrative personnel and services fee | (23,371) |
| TOTAL WAIVERS | (562,204) |
| Net expenses | 887,148 |
| Net investment income | 5,962,690 |
| Realized and Unrealized Gain on Investments: |
| Net realized gain on investments | 975,763 |
| Net change in unrealized appreciation of investments | 5,999,550 |
| Net realized and unrealized gain on investments | 6,975,313 |
| Change in net assets resulting from operations | $12,938,003 |
See Notes which are an integral part of the Financial Statements
Annual Shareholder ReportStatement of Changes in Net Assets
| Year Ended August 31 | 2010 | 2009 |
| Increase (Decrease) in Net Assets |
| Operations: |
| Net investment income | $5,962,690 | $6,371,136 |
| Net realized gain (loss) on investments | 975,763 | (915,758) |
| Net change in unrealized appreciation/depreciation of investments | 5,999,550 | 437,828 |
| CHANGE IN NET ASSETS RESULTING FROM OPERATIONS | 12,938,003 | 5,893,206 |
| Distributions to Shareholders: |
| Distributions from net investment income | (5,986,764) | (6,380,325) |
| Share Transactions: |
| Proceeds from sale of shares | 31,531,607 | 23,813,399 |
| Proceeds from shares issued in connection with the tax-free transfer of assets from Fifth Third Michigan Municipal Bond Fund | — | 38,521,678 |
| Net asset value of shares issued to shareholders in payment of distributions declared | 2,616,977 | 3,340,239 |
| Cost of shares redeemed | (45,021,397) | (55,769,377) |
| CHANGE IN NET ASSETS RESULTING FROM SHARE TRANSACTIONS | (10,872,813) | 9,905,939 |
| Change in net assets | (3,921,574) | 9,418,820 |
| Net Assets: |
| Beginning of period | 164,535,825 | 155,117,005 |
| End of period (including undistributed net investment income of $62 and $25,858, respectively) | $160,614,251 | $164,535,825 |
See Notes which are an integral part of the Financial Statements
Annual Shareholder ReportNotes to Financial Statements
August 31, 2010
Federated Municipal Securities Income Trust (the “Trust”) is registered under the Investment Company Act of 1940, as amended (the “Act”), as an open-end management investment company. The Trust consists of five portfolios. The financial statements included herein are only those of Federated Michigan Intermediate Municipal Trust (the “Fund”), a non-diversified portfolio. The financial statements of the other portfolios are presented separately. The assets of each portfolio are segregated and a shareholder's interest is limited to the portfolio in which shares are held. Each portfolio pays its own expenses. The Fund offers one class of shares: Class A Shares. The investment objective of the Fund is to provide current income exempt from federal regular income tax and the personal income taxes imposed by the state of Michigan and Michigan municipalities. Interest income from the Fund's investments may be subject to the federal alternative minimum tax (AMT) for individuals and corporations.
On November 21, 2008, the Fund received assets from Fifth Third Michigan Municipal Bond Fund as the result of a tax-free reorganization, as follows:
| Shares of the Fund Issued | Fifth Third Michigan Municipal Bond Fund Net Assets Received | Unrealized Appreciation1 | Net Assets of the Fund Immediately Prior to Combination | Net Assets of the Fund Immediately After Combination |
| 3,672,228 | $38,521,678 | $39,485 | $138,381,074 | $176,902,752 |
| 1 | Unrealized Appreciation is included in the Fifth Third Michigan Municipal Bond Fund Net Assets Received amount shown above. |
2. Significant Accounting Policies
The following is a summary of significant accounting policies consistently followed by the Fund in the preparation of its financial statements. These policies are in conformity with U.S. generally accepted accounting principles (GAAP).
Investment Valuation
In calculating its net asset value (NAV), the Fund generally values investments as follows:
- Fixed-income securities acquired with remaining maturities greater than 60 days are fair valued using price evaluations provided by a pricing service approved by the Board of Trustees (the “Trustees”).
- Fixed-income securities acquired with remaining maturities of 60 days or less are valued at their cost (adjusted for the accretion of any discount or amortization of any premium).
- Derivative contracts listed on exchanges are valued at their reported settlement or closing price.
- Over-the-counter (OTC) derivative contracts are fair valued using price evaluations provided by a pricing service approved by the Trustees.
- Shares of other mutual funds are valued based upon their reported NAVs.
Fair Valuation and Significant Events Procedures
The Trustees have authorized the use of pricing services to provide evaluations of the current fair value of certain investments for purposes of calculating the NAV. Factors considered by pricing services in evaluating an investment include the yields or prices of investments of comparable quality, coupon, maturity, call rights and other potential prepayments, terms and type, reported transactions, indications as to values from dealers and general market conditions. Some pricing services provide a single price evaluation reflecting the bid-side of the market for an investment (a “bid” evaluation). Other pricing services offer both bid evaluations and price evaluations indicative of a price between the prices bid and asked for the investment (a “mid” evaluation). The Fund normally uses bid evaluations for U.S. Treasury and Agency securities, mortgage-backed securities and municipal securities. The Fund normally uses mid evaluations for other types of fixed-income securities and OTC derivative contracts. In the event that market quotations and price evaluations are not available for an investment, the fair value of the investment is determined in accordance with procedures adopted by the Trustees.
The Trustees also have adopted procedures requiring an investment to be priced at its fair value whenever the Adviser determines that a significant event affecting the value of the investment has occurred between the time as of which the price of the investment would otherwise be determined and the time as of which the NAV is computed. An event is considered significant if there is both an affirmative expectation that the investment's value will change in response to the event and a reasonable basis for quantifying the resulting change in value. Examples of significant events that may occur after the close of the principal market on which a security is traded, or after the time of a price evaluation provided by a pricing service or a dealer, include:
- With respect to price evaluations of fixed-income securities determined before the close of regular trading on the NYSE, actions by the Federal Reserve Open Market Committee and other significant trends in U.S. fixed-income markets;
- Political or other developments affecting the economy or markets in which an issuer conducts its operations or its securities are traded; and
- Announcements concerning matters such as acquisitions, recapitalizations, litigation developments, a natural disaster affecting the issuer's operations or regulatory changes or market developments affecting the issuer's industry.
The Fund may seek to obtain more current quotations or price evaluations from alternative pricing sources. If a reliable alternative pricing source is not available, the Fund will determine the fair value of the investment using another method approved by the Trustees.
Annual Shareholder ReportInvestment transactions are accounted for on a trade-date basis. Realized gains and losses from investment transactions are recorded on an identified-cost basis. Interest income and expenses are accrued daily. Distributions to shareholders are recorded on the ex-dividend date. Distributions of net investment income are declared daily and paid monthly. Non-cash dividends included in dividend income, if any, are recorded at fair value.
Premium and Discount Amortization
All premiums and discounts on fixed-income securities are amortized/accreted for financial statement purposes.
Federal Taxes
It is the Fund's policy to comply with the Subchapter M provision of the Internal Revenue Code and to distribute to shareholders each year substantially all of its income. Accordingly, no provision for federal income tax is necessary. As of and during the year ended August 31, 2010, the Fund did not have a liability for any uncertain tax positions. The Fund recognizes interest and penalties, if any, related to tax liabilities as income tax expense in the Statement of Operations. As of August 31, 2010, tax years 2007 through 2010 remain subject to examination by the Fund's major tax jurisdictions, which include the United States of America and the Commonwealth of Massachusetts.
When-Issued and Delayed Delivery Transactions
The Fund may engage in when-issued or delayed delivery transactions. The Fund records when-issued securities on the trade date and maintains security positions such that sufficient liquid assets will be available to make payment for the securities purchased. Securities purchased on a when-issued or delayed delivery basis are marked to market daily and begin earning interest on the settlement date. Losses may occur on these transactions due to changes in market conditions or the failure of counterparties to perform under the contract.
Other
The preparation of financial statements in conformity with GAAP requires management to make estimates and assumptions that affect the amounts of assets, liabilities, expenses and revenues reported in the financial statements. Actual results could differ from those estimated.
3. Shares of Beneficial Interest
The following table summarizes share activity:
| Year Ended August 31 | 2010 | 2009 |
| Shares sold | 2,883,620 | 2,247,858 |
| Proceeds from shares issued in connection with the tax-free transfer of assets from Fifth Third Michigan Municipal Bond Fund | — | 3,672,228 |
| Shares issued to shareholders in payment of distributions declared | 238,946 | 315,912 |
| Shares redeemed | (4,113,505) | (5,307,210) |
| NET CHANGE RESULTING FROM FUND SHARE TRANSACTIONS | (990,939) | 928,788 |
The timing and character of income and capital gain distributions are determined in accordance with income tax regulations, which may differ from GAAP. These differences are due to differing treatments for discount accretion/premium amortization on debt securities.
Annual Shareholder Report| Increase (Decrease) | |
| Undistributed Net Investment Income (Loss) | Accumulated Net Realized Gain (Loss) |
| $(1,722) | $1,722 |
Net investment income (loss), net realized gains (losses) and net assets were not affected by this reclassification.
The tax character of distributions as reported on the Statement of Changes in Net Assets for the years ended August 31, 2010 and 2009, was as follows:
| 2010 | 2009 |
| Tax-exempt income | $5,986,764 | $6,380,325 |
As of August 31, 2010, the components of distributable earnings on a tax basis were as follows:
| Undistributed tax-exempt income | $62 |
| Net unrealized appreciation | $8,693,700 |
| Capital loss carry forwards and deferrals | $(1,102,146) |
The difference between book-basis and tax-basis net unrealized appreciation/depreciation is attributable to differing treatments for discount accretion/premium amortization on debt securities.
At August 31, 2010, the cost of investments for federal tax purposes was $150,146,772. The net unrealized appreciation of investments for federal tax purposes was $8,693,700. This consists of net unrealized appreciation from investments for those securities having an excess of value over cost of $8,745,246 and net unrealized depreciation from investments for those securities having an excess of cost over value of $51,546.
At August 31, 2010, the Fund had a capital loss carry forward of $1,102,146 which will reduce the Fund's taxable income arising from future net realized gains on investments, if any, to the extent permitted by the Code and thus will reduce the amount of distributions to shareholders which would otherwise be necessary to relieve the Fund of any liability for federal income tax. Pursuant to the Code, such capital loss carry forward will expire as follows:
| Expiration Year | Expiration Amount |
| 2013 | $743,429 |
| 2014 | $279,176 |
| 2016 | $10,927 |
| 2017 | $68,614 |
The Fund used capital loss carry forwards of $128,908 to offset taxable gains realized during the year ended August 31, 2010.
Annual Shareholder ReportInvestment Adviser Fee
Federated Investment Management Company is the Fund's investment adviser (the “Adviser”). The advisory agreement between the Fund and the Adviser provides for an annual fee equal to 0.40% of the Fund's average daily net assets. Subject to the terms described in the Expense Limitation note, the Adviser may voluntarily choose to waive any portion of its fee. For the year ended August 31, 2010, the Adviser voluntarily waived $538,833 of its fee.
Administrative Fee
Federated Administrative Services (FAS), under the Administrative Services Agreement, provides the Fund with administrative personnel and services. The fee paid to FAS is based on the average aggregate daily net assets of certain Federated funds as specified below:
| Administrative Fee | Average Aggregate Daily Net Assets of the Federated Funds |
| 0.150% | on the first $5 billion |
| 0.125% | on the next $5 billion |
| 0.100% | on the next $10 billion |
| 0.075% | on assets in excess of $20 billion |
The administrative fee received during any fiscal year shall be at least $150,000 per portfolio and $40,000 per each additional class of Shares. Subject to the terms described in the Expense Limitation note, FAS may voluntarily choose to waive any portion of its fee. For the year ended August 31, 2010, FAS waived $23,371 of its fee. The net fee paid to FAS was 0.078% of average daily net assets of the Fund.
Shareholder Services Fee
The Fund may pay fees (“Service Fees”) up to 0.25% of the average daily net assets of the Fund's Class A Shares to financial intermediaries or to Federated Shareholder Services Company (FSSC) for providing services to shareholders and maintaining shareholder accounts. Subject to the terms described in the Expense Limitation note, FSSC may reimburse the Fund for Service Fees. For the year ended August 31, 2010, FSSC received $2,137 of fees paid by the Fund.
Interfund Transactions
During the year ended August 31, 2010, the Fund engaged in purchase and sale transactions with funds that have a common investment adviser (or affiliated investment advisers), common Directors/Trustees and/or common Officers. These purchase and sale transactions complied with Rule 17a-7 under the Act and amounted to $40,509,353 and $41,630,000, respectively.
Expense Limitation
The Adviser and its affiliates (which may include FAS and FSSC) have voluntarily agreed to waive their fees and/or reimburse expenses so that the total annual fund operating expenses (as shown in the financial highlights) (excluding Acquired Fund Fees and Expenses, if any) paid by the Fund's Class A Shares (after the voluntary waivers and reimbursements) will not exceed 0.54% (the “Fee Limit”) through the later of (the “Termination Date”): (a) October 31, Annual Shareholder ReportGeneral
Certain Officers and Trustees of the Fund are Officers and Directors or Trustees of the above companies.
Purchases and sales of investments, excluding long-term U.S. government securities and short-term obligations, for the year ended August 31, 2010, were as follows:
| Purchases | $33,102,930 |
| Sales | $44,890,571 |
Since the Fund invests a substantial portion of its assets in issuers located in one state, it will be more susceptible to factors adversely affecting issuers of that state than would be a comparable tax-exempt mutual fund that invests nationally. In order to reduce the credit risk associated with such factors, at August 31, 2010, 50.4% of the securities in the Portfolio of Investments were backed by letters of credit or bond insurance of various financial institutions and financial guaranty assurance agencies. The largest percentage of investments insured by or supported (backed) by a letter of credit from any one institution or agency was 19.2% of total investments.
The Fund participates in a $100,000,000 unsecured, uncommitted revolving line of credit (LOC) agreement with PNC Bank. The LOC was made available for extraordinary or emergency purposes, primarily for financing redemption payments. Borrowings are charged interest at a rate offered to the Fund by PNC Bank at the time of the borrowing. As of August 31, 2010, there were no outstanding loans. During the year ended August 31, 2010, the Fund did not utilize the LOC.
Pursuant to an Exemptive Order issued by the Securities and Exchange Commission, the Fund, along with other funds advised by subsidiaries of Federated Investors, Inc., may participate in an interfund lending program. This program provides an alternative credit facility allowing the funds to borrow from other participating affiliated funds. As of August 31, 2010, there were no outstanding loans. During the year ended August 31, 2010, the program was not utilized.
Since October 2003, Federated Investors, Inc. and related entities (collectively, “Federated”), and various Federated sponsored mutual funds (“Federated Funds”) have been named as defendants in several class action lawsuits now pending in the United States District Court for the District of Maryland. The lawsuits were purportedly filed on behalf of people who purchased, owned and/or redeemed shares of certain Federated Funds during specified periods beginning November 1, 1998. The suits are generally similar in alleging that Federated engaged in illegal and improper trading practices including market timing and late trading in Annual Shareholder ReportManagement has evaluated subsequent events through the date the financial statements were issued, and determined that no events have occurred that require additional disclosure.
12. Federal Tax Information (unaudited)
For the year ended August 31, 2010, 100% of the distributions from net investment income is exempt from federal income tax, other than the federal AMT.
Annual Shareholder ReportReport of Independent Registered Public Accounting Firm
TO THE BOARD OF TRUSTEES OF federated municipal securities income trust AND SHAREHOLDERS OF federated michigan intermediate municipal TRUST:
We have audited the accompanying statement of assets and liabilities, including the portfolio of investments, of Federated Michigan Intermediate Municipal Trust (the “Fund”), a portfolio of Federated Municipal Securities Income Trust, as of August 31, 2010, and the related statement of operations for the year then ended, the statements of changes in net assets for each of the years in the two-year period then ended, and the financial highlights for each of the years in the five-year period then ended. These financial statements and financial highlights are the responsibility of the Fund's management. Our responsibility is to express an opinion on these financial statements and financial highlights based on our audits.
We conducted our audits in accordance with the standards of the Public Company Accounting Oversight Board (United States). Those standards require that we plan and perform the audit to obtain reasonable assurance about whether the financial statements and financial highlights are free of material misstatement. An audit includes examining, on a test basis, evidence supporting the amounts and disclosures in the financial statements. Our procedures included confirmation of securities owned as of August 31, 2010, by correspondence with the custodian and brokers or by other appropriate auditing procedures. An audit also includes assessing the accounting principles used and significant estimates made by management, as well as evaluating the overall financial statement presentation. We believe that our audits provide a reasonable basis for our opinion.
In our opinion, the financial statements and financial highlights referred to above present fairly, in all material respects, the financial position of Federated Michigan Intermediate Municipal Trust as of August 31, 2010, and the results of its operations for the year then ended, the changes in its net assets for each of the years in the two-year period then ended, and the financial highlights for each of the years in the five-year period then ended, in conformity with U.S. generally accepted accounting principles.

Boston, Massachusetts
October 25, 2010
Board of Trustees and Trust Officers
The Board of Trustees is responsible for managing the Trust's business affairs and for exercising all the Trust's powers except those reserved for the shareholders. The following tables give information about each Trustee and the senior officers of the Fund. Where required, the tables separately list Trustees who are “interested persons” of the Fund (i.e., “Interested” Trustees) and those who are not (i.e., “Independent” Trustees). Unless otherwise noted, the address of each person listed is Federated Investors Tower, 1001 Liberty Avenue, Pittsburgh, PA 15222. The address of all Independent Trustees listed is 4000 Ericsson Drive, Warrendale, PA 15086-7561; Attention: Mutual Fund Board. As of December 31, 2009, the Trust comprised five portfolio(s), and the Federated Fund Family consisted of 43 investment companies (comprising 145 portfolios). Unless otherwise noted, each Officer is elected annually. Unless otherwise noted, each Trustee oversees all portfolios in the Federated Fund Family and serves for an indefinite term. The Fund's Statement of Additional Information includes additional information about Trust Trustees and is available, without charge and upon request, by calling 1-800-341-7400.
Interested TRUSTEES Background
| Name Birth Date Positions Held with Trust Date Service Began | Principal Occupation(s) for Past Five Years, Other Directorships Held and Previous Position(s) |
| John F. Donahue* Birth Date: July 28, 1924 Trustee Began serving: August 1990 | Principal Occupations: Director or Trustee of the Federated Fund Family; Chairman and Director, Federated Investors, Inc.; Chairman of the Federated Fund Family's Executive Committee. Previous Positions: Chairman of the Federated Fund Family; Trustee, Federated Investment Management Company; Chairman and Director, Federated Investment Counseling. |
| J. Christopher Donahue* Birth Date: April 11, 1949 President and Trustee Began serving: August 1990 | Principal Occupations: Principal Executive Officer and President of the Federated Fund Family; Director or Trustee of some of the Funds in the Federated Fund Family; President, Chief Executive Officer and Director, Federated Investors, Inc.; Chairman and Trustee, Federated Investment Management Company; Trustee, Federated Investment Counseling; Chairman and Director, Federated Global Investment Management Corp.; Chairman, Federated Equity Management Company of Pennsylvania and Passport Research, Ltd. (investment advisory subsidiary of Federated); Trustee, Federated Shareholder Services Company; Director, Federated Services Company. Previous Positions: President, Federated Investment Counseling; President and Chief Executive Officer, Federated Investment Management Company, Federated Global Investment Management Corp. and Passport Research, Ltd. |
| * | Family relationships and reasons for “interested” status: John F. Donahue is the father of J. Christopher Donahue; both are “interested” due to their beneficial ownership of shares of Federated Investors, Inc. and the positions they hold with Federated and its subsidiaries. |
INDEPENDENT TRUSTEES Background
| Name Birth Date Positions Held with Trust Date Service Began | Principal Occupation(s) for Past Five Years, Other Directorships Held, Previous Position(s) and Qualifications |
| John T. Conroy, Jr., Ph.D. Birth Date: June 23, 1937 Trustee Began serving: August 1991 | Principal Occupations: Director or Trustee of the Federated Fund Family; Chairman of the Board, Investment Properties Corporation; Partner or Trustee in private real estate ventures in Southwest Florida; Assistant Professor in Theology, Blessed Edmund Rice School for Pastoral Ministry. Previous Positions: President, Investment Properties Corporation; Senior Vice President, John R. Wood and Associates, Inc., Realtors; President, Naples Property Management, Inc. and Northgate Village Development Corporation. Qualifications: Business management and director experience. |
| Nicholas P. Constantakis, CPA Birth Date: September 3, 1939 Trustee Began serving: February 1998 | Principal Occupation: Director or Trustee of the Federated Fund Family. Other Directorship Held: Director and Chairman of the Audit Committee, Michael Baker Corporation (architecture, engineering and construction services). Previous Position: Partner, Andersen Worldwide SC. Qualifications: Public accounting and director experience. |
| John F. Cunningham Birth Date: March 5, 1943 Trustee Began serving: July 1999 | Principal Occupation: Director or Trustee of the Federated Fund Family. Other Directorships Held: Chairman, President and Chief Executive Officer, Cunningham & Co., Inc. (strategic business consulting); Trustee Associate, Boston College. Previous Positions: Director, Redgate Communications and EMC Corporation (computer storage systems); Chairman of the Board and Chief Executive Officer, Computer Consoles, Inc.; President and Chief Operating Officer, Wang Laboratories; Director, First National Bank of Boston; Director, Apollo Computer, Inc. Qualifications: Business management and director experience. |
| Maureen Lally-Green Birth Date: July 5, 1949 Trustee Began serving: August 2009 | Principal Occupations: Director or Trustee of the Federated Fund Family; Director, Office of Church Relations, Diocese of Pittsburgh; Adjunct Professor of Law, Duquesne University School of Law. Other Directorships Held: Director, Auberle; Trustee, St. Francis University; Director, Ireland Institute of Pittsburgh; Director, UPMC Mercy Hospital; Regent, St. Vincent Seminary; Director, Epilepsy Foundation of Western and Central Pennsylvania; Director, Saint Thomas More Society, Allegheny County; Director, Carlow University. Previous Position: Pennsylvania Superior Court Judge. Qualifications: Legal and director experience. |
| Name Birth Date Positions Held with Trust Date Service Began | Principal Occupation(s) for Past Five Years, Other Directorships Held, Previous Position(s) and Qualifications |
| Peter E. Madden Birth Date: March 16, 1942 Trustee Began serving: August 1991 | Principal Occupation: Director or Trustee, and Chairman of the Board of Directors or Trustees, of the Federated Fund Family. Other Directorship Held: Board of Overseers, Babson College. Previous Positions: Representative, Commonwealth of Massachusetts General Court; President, Chief Operating Officer and Director, State Street Bank and Trust Company and State Street Corporation (retired); Director, VISA USA and VISA International; Chairman and Director, Massachusetts Bankers Association; Director, Depository Trust Corporation; Director, The Boston Stock Exchange. Qualifications: Business management, mutual fund services and director experience. |
| Charles F. Mansfield, Jr. Birth Date: April 10, 1945 Trustee Began serving: January 1999 | Principal Occupations: Director or Trustee and Chairman of the Audit Committee of the Federated Fund Family; Management Consultant. Previous Positions: Chief Executive Officer, PBTC International Bank; Partner, Arthur Young & Company (now Ernst & Young LLP); Chief Financial Officer of Retail Banking Sector, Chase Manhattan Bank; Senior Vice President, HSBC Bank USA (formerly, Marine Midland Bank); Vice President, Citibank; Assistant Professor of Banking and Finance, Frank G. Zarb School of Business, Hofstra University; Executive Vice President, DVC Group, Inc. (marketing, communications and technology). Qualifications: Banking, business management, public accounting and director experience. |
| R. James Nicholson Birth Date: February 4, 1938 Trustee Began serving: January 2008 | Principal Occupations: Director or Trustee of the Federated Fund Family; Senior Counsel, Brownstein Hyatt Farber Schrek, P.C.; Former Secretary of the U.S. Dept. of Veterans Affairs; Former U.S. Ambassador to the Holy See; Former Chairman of the Republican National Committee. Other Directorships Held: Director, Horatio Alger Association; Director, The Daniels Fund. Previous Positions: Colonel, U.S. Army Reserve; Partner, Calkins, Kramer, Grimshaw and Harring, P.C.; General Counsel, Colorado Association of Housing and Building; Chairman and CEO, Nicholson Enterprises, Inc. (real estate holding company); Chairman and CEO, Renaissance Homes of Colorado. Qualifications: Legal, government, business management and mutual fund director experience. |
| Name Birth Date Positions Held with Trust Date Service Began | Principal Occupation(s) for Past Five Years, Other Directorships Held, Previous Position(s) and Qualifications |
| Thomas M. O'Neill Birth Date: June 14, 1951 Trustee Began serving: October 2006 | Principal Occupations: Director or Trustee of the Federated Fund Family; Sole Proprietor, Navigator Management Company (investment and strategic consulting). Other Directorships Held: Board of Overseers, Children's Hospital of Boston; Visiting Committee on Athletics, Harvard College. Previous Positions: Chief Executive Officer and President, Managing Director and Chief Investment Officer, Fleet Investment Advisors; President and Chief Executive Officer, Aeltus Investment Management, Inc.; General Partner, Hellman, Jordan Management Co., Boston, MA; Chief Investment Officer, The Putnam Companies, Boston, MA; Credit Analyst and Lending Officer, Fleet Bank; Director and Consultant, EZE Castle Software (investment order management software); Director, Midway Pacific (lumber). Qualifications: Business management, mutual fund, director and investment experience. |
| John S. Walsh Birth Date: November 28, 1957 Trustee Began serving: July 1999 | Principal Occupations: Director or Trustee of the Federated Fund Family; President and Director, Heat Wagon, Inc. (manufacturer of construction temporary heaters); President and Director, Manufacturers Products, Inc. (distributor of portable construction heaters); President, Portable Heater Parts, a division of Manufacturers Products, Inc. Previous Position: Vice President, Walsh & Kelly, Inc. Qualifications: Business management and director experience. |
| James F. Will Birth Date: October 12, 1938 Trustee Began serving: April 2006 | Principal Occupations: Director or Trustee of the Federated Fund Family; formerly, Vice Chancellor and President, Saint Vincent College. Other Directorships Held: Trustee, Saint Vincent College; Alleghany Corporation. Previous Positions: Chairman, President and Chief Executive Officer, Armco, Inc.; President and Chief Executive Officer, Cyclops Industries; President and Chief Operating Officer, Kaiser Steel Corporation. Qualifications: Business management, education and director experience. |
| Name Birth Date Positions Held with Trust Date Service Began | Principal Occupation(s) for Past Five Years and Previous Position(s) |
| John W. McGonigle Birth Date: October 26, 1938 EXECUTIVE VICE PRESIDENT AND SECRETARY Began serving: August 1990 | Principal Occupations: Executive Vice President and Secretary of the Federated Fund Family; Vice Chairman, Executive Vice President, Secretary and Director, Federated Investors, Inc. Previous Positions: Trustee, Federated Investment Management Company and Federated Investment Counseling; Director, Federated Global Investment Management Corp., Federated Services Company and Federated Securities Corp. |
| Richard A. Novak Birth Date: December 25, 1963 TREASURER Began serving: January 2006 | Principal Occupations: Principal Financial Officer and Treasurer of the Federated Fund Family; Senior Vice President, Federated Administrative Services; Financial and Operations Principal for Federated Securities Corp., Edgewood Services, Inc. and Southpointe Distribution Services, Inc. Previous Positions: Controller of Federated Investors, Inc.; Vice President, Finance of Federated Services Company; held various financial management positions within The Mercy Hospital of Pittsburgh; Auditor, Arthur Andersen & Co. |
| Richard B. Fisher Birth Date: May 17, 1923 VICE CHAIRMAN Began serving: August 2002 | Principal Occupations: Vice Chairman or Vice President of some of the Funds in the Federated Fund Family; Vice Chairman, Federated Investors, Inc.; Chairman, Federated Securities Corp. Previous Positions: President and Director or Trustee of some of the Funds in the Federated Fund Family; Executive Vice President, Federated Investors, Inc.; Director and Chief Executive Officer, Federated Securities Corp. |
| Brian P. Bouda Birth Date: February 28, 1947 SENIOR VICE PRESIDENT AND CHIEF COMPLIANCE OFFICER Began serving: August 2004 | Principal Occupations: Senior Vice President and Chief Compliance Officer of the Federated Fund Family; Vice President and Chief Compliance Officer of Federated Investors, Inc. and Chief Compliance Officer of its subsidiaries. Mr. Bouda joined Federated in 1999 and is a member of the American Bar Association and the State Bar Association of Wisconsin. |
| Deborah A. Cunningham Birth Date: September 15, 1959 CHIEF INVESTMENT OFFICER Began serving: May 2004 | Principal Occupations: Deborah A. Cunningham was named Chief Investment Officer of money market products in 2004, serves as a Senior Portfolio Manager and is a Vice President of the Trust. Ms. Cunningham was named an Executive Vice President of the Fund's Adviser in 2009. She joined Federated in 1981 and was a Senior Vice President of the Fund's Adviser from 1997 to 2009. Ms. Cunningham has received the Chartered Financial Analyst designation and holds an M.S.B.A. in Finance from Robert Morris College. |
| Mary Jo Ochson Birth Date: September 12, 1953 CHIEF INVESTMENT OFFICER Began serving: May 2004 | Principal Occupations: Mary Jo Ochson was named Chief Investment Officer of tax-exempt, fixed-income products in 2004 and Chief Investment Officer of Tax-Free Money Markets in 2010 and is a Vice President of the Trust . She joined Federated in 1982 and has been a Senior Portfolio Manager and a Senior Vice President of the Fund's Adviser since 1996. Ms. Ochson has received the Chartered Financial Analyst designation and holds an M.B.A. in Finance from the University of Pittsburgh. |
| Name Birth Date Positions Held with Trust Date Service Began | Principal Occupation(s) for Past Five Years and Previous Position(s) |
| J. Scott Albrecht Birth Date: June 1, 1960 VICE PRESIDENT Began serving: November 1998 | Principal Occupations: J. Scott Albrecht is Vice President of the Trust. Mr. Albrecht joined Federated in 1989. He became a Senior Vice President of the Fund's Adviser in January 2005 and served as a Vice President of the Fund's Adviser from 1994 through 2004. He has been a Senior Portfolio Manager since 1997 and was a Portfolio Manager from 1994 to 1996. Mr. Albrecht has received the Chartered Financial Analyst designation and an M.S. in Public Management from Carnegie Mellon University. |
Evaluation and Approval of Advisory Contract - May 2010
Federated Michigan Intermediate Municipal Trust (the “Fund”)
The Fund's Board reviewed the Fund's investment advisory contract at meetings held in May 2010. The Board's decision regarding the contract reflects the exercise of its business judgment on whether to continue the existing arrangements.
In this connection, the Federated funds' Board had previously appointed a Senior Officer, whose duties include specified responsibilities relating to the process by which advisory fees are to be charged to a Federated fund. The Senior Officer has the authority to retain consultants, experts, or staff as may be reasonably necessary to assist in the performance of his duties, reports directly to the Board, and may be terminated only with the approval of a majority of the independent members of the Board. The Senior Officer prepared and furnished to the Board an independent, written evaluation that covered topics discussed below. The Board considered that evaluation, along with other information, in deciding to approve the advisory contract.
During its review of the contract, the Board considered compensation and benefits received by the Adviser. This included the fees received for services provided to the Fund by other entities in the Federated organization and research services (if any) received by the Adviser from brokers that execute Federated fund trades, as well as advisory fees. The Board is also familiar with and considered judicial decisions concerning allegedly excessive investment advisory fees, which have indicated that the following factors may be relevant to an Adviser's fiduciary duty with respect to its receipt of compensation from a fund: the nature and quality of the services provided by the Adviser, including the performance of the fund; the Adviser's cost of providing the services; the extent to which the Adviser may realize “economies of scale” as a fund grows larger; any indirect benefits that may accrue to the Adviser and its affiliates as a result of the Adviser's relationship with a fund; performance and expenses of comparable funds; and the extent to which the independent Board members are fully informed about all facts the Board deems relevant bearing on the Adviser's services and fees. The Board further considered management fees (including any components thereof) charged to institutional and other clients of the Adviser for what might be viewed as like services, and the cost to the Adviser and its affiliates of supplying services pursuant to the management fee agreements, excluding any intra-corporate profit and profit margins of the Adviser and its affiliates for supplying such services. The Board was aware of these factors and was guided by them in its review of the Fund's advisory contract to the extent it considered them to be appropriate and relevant, as discussed further below.
Annual Shareholder ReportThe Senior Officer reviewed reports compiled by Federated, using data supplied by independent fund ranking organizations, regarding the performance of, and fees charged by, other mutual funds, noting his view that comparisons to fund peer groups are relevant in judging the reasonableness of proposed fees.
The Fund's performance fell below the median of the relevant peer group for the one-year, three-year and five-year periods covered by the report. The Board discussed the Fund's performance with the Adviser and recognized the efforts being undertaken by the Adviser. The Board will continue to monitor these efforts and the performance of the Fund.
The Board also received financial information about Federated, including reports on the compensation and benefits Federated derived from its relationships with the Federated funds. These reports covered not only the fees under the advisory contracts, but also fees received by Federated's subsidiaries for providing other services to the Federated funds under separate contracts (e.g., for serving as the Federated funds' administrator). The reports also discussed any indirect benefit Federated may derive from its receipt of research services from brokers who execute Federated fund trades. In addition, the Board considered the fact that, in order for a fund to be competitive in the marketplace, Federated and its affiliates frequently waived fees and/or Annual Shareholder ReportFederated furnished reports, requested by the Senior Officer, that reported revenues on a fund-by-fund basis and made estimates of the allocation of expenses on a fund-by-fund basis, using allocation methodologies specified by the Senior Officer. The Senior Officer noted that, although they may apply consistent allocation processes, the inherent difficulties in allocating costs (and the unavoidable arbitrary aspects of that exercise) and the lack of consensus on how to allocate those costs may render such allocation reports unreliable. The allocation reports were considered in the analysis by the Board but were determined to be of limited use.
The Board and the Senior Officer also reviewed a report compiled by Federated comparing profitability information for Federated to other publicly held fund management companies. In this regard, the Senior Officer noted the limited availability of such information, but nonetheless concluded that Federated's profit margins did not appear to be excessive and the Board agreed.
The Senior Officer's evaluation also discussed the notion of possible realization of “economies of scale” as a fund grows larger. The Board considered in this regard that the Adviser has made significant and long-term investments in areas that support all of the Federated funds, such as personnel and processes for the portfolio management, compliance, and risk management functions; and systems technology; and that the benefits of these efforts (as well as any economies, should they exist) were likely to be enjoyed by the fund complex as a whole. Finally, the Board also noted the absence of any applicable regulatory or industry guidelines on this subject, which (as discussed in the Senior Officer's evaluation) is compounded by the lack of any common industry practice or general pattern with respect to structuring fund advisory fees with “breakpoints” that serve to reduce the fee as the fund attains a certain size. The Senior Officer did not recommend institution of breakpoints in pricing Federated's fund advisory services at this time.
It was noted in the materials for the Board meeting that for the period covered by the report, the Fund's investment advisory fee, after waivers and expense reimbursements, if any, was below the median of the relevant peer group. The Board reviewed the fees and other expenses of the Fund with the Adviser and was satisfied that the overall expense structure of the Fund remained competitive.
The Senior Officer's evaluation noted his belief that the information and observations contained in his evaluation supported a finding that the proposed management fees are reasonable, and that Federated appeared to provide appropriate administrative services to the Fund for the fees paid. Under these Annual Shareholder ReportIn its decision to continue an existing investment advisory contract, the Board was mindful of the potential disruptions of the Fund's operations and various risks, uncertainties and other effects that could occur as a result of a decision to terminate or not renew an advisory contract. In particular, the Board recognized that many shareholders have invested in the Fund on the strength of the Adviser's industry standing and reputation and with the expectation that the Adviser will have a continuing role in providing advisory services to the Fund. Thus, the Board's approval of the advisory contract reflected the fact that it is the shareholders who have effectively selected the Adviser by virtue of having invested in the Fund.
The Board based its decision to approve the advisory contract on the totality of the circumstances and relevant factors and with a view to past and future long-term considerations. Not all of the factors and considerations identified above were necessarily relevant to the Fund, nor did the Board consider any one of them to be determinative. With respect to the factors that were relevant, the Board's decision to approve the contract reflects its determination that Federated's performance and actions provided a satisfactory basis to support the decision to continue the existing arrangements.
Annual Shareholder ReportVoting Proxies on Fund Portfolio Securities
A description of the policies and procedures that the Fund uses to determine how to vote proxies, if any, relating to securities held in the Fund's portfolio is available, without charge and upon request, by calling 1-800-341-7400. A report on “Form N-PX” of how the Fund voted any such proxies during the most recent 12-month period ended June 30 is available from Federated's website at FederatedInvestors.com. To access this information from the “Products” section of the website, click on the “Prospectuses and Regulatory Reports” link under “Related Information,” then select the appropriate link opposite the name of the Fund; or select the name of the Fund and from the Fund's page, click on the “Prospectuses and Regulatory Reports” link. Form N-PX filings are also available at the SEC's website at www.sec.gov.
Quarterly Portfolio Schedule
The Fund files with the SEC a complete schedule of its portfolio holdings, as of the close of the first and third quarters of its fiscal year, on “Form N-Q.” These filings are available on the SEC's website at www.sec.gov and may be reviewed and copied at the SEC's Public Reference Room in Washington, DC. (Call 1-800-SEC-0330 for information on the operation of the Public Reference Room.) You may also access this information from the “Products” section of Federated's website at FederatedInvestors.com by clicking on “Portfolio Holdings” under “Related Information,” then selecting the appropriate link opposite the name of the Fund; or select the name of the Fund and from the Fund's page, click on the “Portfolio Holdings” link.
Annual Shareholder ReportMutual funds are not bank deposits or obligations, are not guaranteed by any bank and are not insured or guaranteed by the U.S. government, the Federal Deposit Insurance Corporation, the Federal Reserve Board or any other government agency. Investment in mutual funds involves investment risk, including the possible loss of principal.
This Report is authorized for distribution to prospective investors only when preceded or accompanied by the Trust's Prospectus, which contains facts concerning its objective and policies, management fees, expenses and other information.

Federated Michigan Intermediate Municipal Trust
Federated Investors Funds
4000 Ericsson Drive
Warrendale, PA 15086-7561
Contact us at FederatedInvestors.com
or call 1-800-341-7400.
Federated Securities Corp., Distributor
Cusip 313923302
G01106-03 (10/10)
Federated is a registered mark of Federated Investors, Inc.
2010 © Federated Investors, Inc.
Federated New York Municipal Income Fund
Established 1992
A Portfolio of Federated Municipal Securities Income Trust
ANNUAL SHAREHOLDER REPORT
August 31, 2010
Class A Shares
Class B Shares
FINANCIAL HIGHLIGHTS
SHAREHOLDER EXPENSE EXAMPLE
MANAGEMENT'S DISCUSSION OF FUND PERFORMANCE
PORTFOLIO OF INVESTMENTS SUMMARY TABLE
PORTFOLIO OF INVESTMENTS
STATEMENT OF ASSETS AND LIABILITIES
STATEMENT OF OPERATIONS
STATEMENT OF CHANGES IN NET ASSETS
NOTES TO FINANCIAL STATEMENTS
REPORT OF INDEPENDENT REGISTERED PUBLIC ACCOUNTING FIRM
BOARD OF TRUSTEES AND TRUST OFFICERS
EVALUATION AND APPROVAL OF ADVISORY CONTRACT
VOTING PROXIES ON FUND PORTFOLIO SECURITIES
QUARTERLY PORTFOLIO SCHEDULE
Financial Highlights - Class A Shares
(For a Share Outstanding Throughout Each Period)
| Year Ended August 31 | 2010 | 2009 | 2008 | 2007 | 2006 |
| Net Asset Value, Beginning of Period | $9.71 | $9.98 | $10.36 | $10.73 | $10.83 |
| Income From Investment Operations: |
| Net investment income | 0.38 | 0.41 | 0.43 | 0.44 | 0.45 |
| Net realized and unrealized gain (loss) on investments, futures contracts and swap contracts | 0.61 | (0.27) | (0.38) | (0.37) | (0.10) |
| TOTAL FROM INVESTMENT OPERATIONS | 0.99 | 0.14 | 0.05 | 0.07 | 0.35 |
| Less Distributions: |
| Distributions from net investment income | (0.38) | (0.41) | (0.43) | (0.44) | (0.45) |
| Net Asset Value, End of Period | $10.32 | $9.71 | $9.98 | $10.36 | $10.73 |
| Total Return1 | 10.41% | 1.68% | 0.53% | 0.57% | 3.30%2 |
| Ratios to Average Net Assets: |
| Net expenses | 0.76% | 0.76% | 0.76%3 | 0.80%4 | 0.70% |
| Net investment income | 3.82% | 4.40% | 4.25% | 4.09% | 4.19% |
| Expense waiver/reimbursement5 | 0.98% | 1.02% | 0.89% | 0.85% | 1.06% |
| Supplemental Data: |
| Net assets, end of period (000 omitted) | $31,644 | $29,334 | $32,288 | $36,867 | $26,962 |
| Portfolio turnover | 26% | 12% | 20% | 21% | 37% |
| 1 | Based on net asset value, which does not reflect the sales charge, redemption fee or contingent deferred sales charge, if applicable. |
| 2 | During the period, the Fund's Class A Shares were reimbursed by an affiliated shareholder services provider, which had an impact of 0.03% on the total return. |
| 3 | The net expense ratio is calculated without reduction for expense offset arrangements. The net expense ratio for the year ended August 31, 2008 is 0.76% after taking into account these expense reductions. |
| 4 | Includes 0.04% of interest and trust expenses related to the Fund's participation in certain inverse floater structures. |
| 5 | This expense decrease is reflected in both the net expense and net investment income ratios shown above. |
See Notes which are an integral part of the Financial Statements
Annual Shareholder ReportFinancial Highlights - Class B Shares
(For a Share Outstanding Throughout Each Period)
| Year Ended August 31 | 2010 | 2009 | 2008 | 2007 | 2006 |
| Net Asset Value, Beginning of Period | $9.71 | $9.98 | $10.36 | $10.73 | $10.83 |
| Income From Investment Operations: |
| Net investment income | 0.31 | 0.34 | 0.36 | 0.36 | 0.36 |
| Net realized and unrealized gain (loss) on investments, futures contracts and swap contracts | 0.61 | (0.27) | (0.38) | (0.37) | (0.10) |
| TOTAL FROM INVESTMENT OPERATIONS | 0.92 | 0.07 | (0.02) | (0.01) | 0.26 |
| Less Distributions: |
| Distributions from net investment income | (0.31) | (0.34) | (0.36) | (0.36) | (0.36) |
| Net Asset Value, End of Period | $10.32 | $9.71 | $9.98 | $10.36 | $10.73 |
| Total Return1 | 9.58% | 0.91% | (0.23)% | (0.19)% | 2.47% |
| Ratios to Average Net Assets: |
| Net expenses | 1.52% | 1.52% | 1.52%2 | 1.56%3 | 1.51% |
| Net investment income | 3.07% | 3.65% | 3.50% | 3.33% | 3.38% |
| Expense waiver/reimbursement4 | 0.92% | 0.96% | 0.70% | 0.60% | 0.78% |
| Supplemental Data: |
| Net assets, end of period (000 omitted) | $9,362 | $10,511 | $12,936 | $15,951 | $19,512 |
| Portfolio turnover | 26% | 12% | 20% | 21% | 37% |
| 1 | Based on net asset value, which does not reflect the sales charge, redemption fee or contingent deferred sales charge, if applicable. |
| 2 | The net expense ratio is calculated without reduction for expense offset arrangements. The net expense ratio for the year ended August 31, 2008 is 1.52% after taking into account these expense reductions. |
| 3 | Includes 0.04% of interest and trust expenses related to the Fund's participation in certain inverse floater structures. |
| 4 | This expense decrease is reflected in both the net expense and net investment income ratios shown above. |
See Notes which are an integral part of the Financial Statements
Annual Shareholder ReportShareholder Expense Example (unaudited)
As a shareholder of the Fund, you incur two types of costs: (1) transaction costs, including sales charges (loads) on purchase or redemption payments; and (2) ongoing costs, including management fees and to the extent applicable, distribution (12b-1) fees and/or shareholder services fees and other Fund expenses. This Example is intended to help you to understand your ongoing costs (in dollars) of investing in the Fund and to compare these costs with the ongoing costs of investing in other mutual funds. It is based on an investment of $1,000 invested at the beginning of the period and held for the entire period from March 1, 2010 to August 31, 2010.
The first section of the table below provides information about actual account values and actual expenses. You may use the information in this section, together with the amount you invested, to estimate the expenses that you incurred over the period. Simply divide your account value by $1,000 (for example, an $8,600 account value divided by $1,000 = 8.6), then multiply the result by the number in the first section under the heading entitled “Expenses Paid During Period” to estimate the expenses attributable to your investment during this period.
HYPOTHETICAL EXAMPLE FOR COMPARISON PURPOSES
The second section of the table below provides information about hypothetical account values and hypothetical expenses based on the Fund's actual expense ratio and an assumed rate of return of 5% per year before expenses, which is not the Fund's actual return. Thus, you should not use the hypothetical account values and expenses to estimate the actual ending account balance or your expenses for the period. Rather, these figures are required to be provided to enable you to compare the ongoing costs of investing in the Fund with other funds. To do so, compare this 5% hypothetical example with the 5% hypothetical examples that appear in the shareholder reports of the other funds.
Annual Shareholder Report| Beginning Account Value 3/1/2010 | Ending Account Value 8/31/2010 | Expenses Paid During Period1 |
| Actual: |
| Class A Shares | $1,000 | $1,051.40 | $3.93 |
| Class B Shares | $1,000 | $1,047.40 | $7.84 |
| Hypothetical (assuming a 5% return before expenses): |
| Class A Shares | $1,000 | $1,021.37 | $3.87 |
| Class B Shares | $1,000 | $1,017.54 | $7.73 |
| 1 | Expenses are equal to the Fund's annualized net expense ratios, multiplied by the average account value over the period, multiplied by 184/365 (to reflect the one-half-year period). The annualized net expense ratios are as follows: |
| Class A Shares | 0.76% |
| Class B Shares | 1.52% |
Performance data quoted represents past performance which is no guarantee of future results. Investment return and principal value will fluctuate so that an investor's shares, when redeemed, may be worth more or less than their original cost. Mutual fund performance changes over time and current performance may be lower or higher than what is stated. For current to the most recent month-end performance and after-tax returns, visit FederatedInvestors.com or call 1-800-341-7400.
Management's Discussion of Fund
Performance (unaudited)
The Fund's total return, based on net asset value, for the 12-month reporting period ended August 31, 2010, was 10.41% for Class A Shares and 9.58% for Class B Shares. The total return of the S&P/Investortools Municipal Bond New York Index (“NY Index”),1 a broad-based securities market index, was 9.63% during the same period. The Fund's total return for the most recently completed fiscal year reflected actual cash flows, transaction costs and other expenses, which were not reflected in the total return of the NY Index.
| 1 | The Fund's investment adviser has elected to change the Fund's broad-based securities market index to the NY Index from the Barclay's Capital New York Municipal Bond Index (BCNYMB). The NY Index is more representative of the securities in which the Fund invests. The NY Index consists of bonds in the S&P/Investortools Municipal Bond Index (“Main Index”) that have been issued by the state of New York or local governments or state or local government entities within New York. The Main Index is a broad, comprehensive, market value-weighted index composed of approximately 55,000 bond issues that are exempt from U.S. federal income taxes or subject to the alternative minimum tax (AMT). Eligibility criteria for inclusion in the Main Index include, but are not limited to: the bond issuer must be a state (including the Commonwealth of Puerto Rico and U.S. territories) or a local government or a state or local government entity where interest on the bond is exempt from U.S. federal income taxes or subject to the AMT; the bond must be held by a mutual fund for which Standard & Poor's Securities Evaluations, Inc. provides prices; it must be denominated in U.S. dollars and have a minimum par amount of $2 million; and the bond must have a minimum term to maturity and/or call date greater than or equal to one calendar month. The Main Index is rebalanced monthly. The total return of the BCNYMB was 9.48% for the 12-month reporting period. The BCNYMB is an unmanaged market value-weighted index for the long-term, tax-exempt bond market comprising investment-grade, tax-exempt and fixed-rate bonds issued in the state of New York. To be included in the index, bonds must have a minimum credit rating of Baa, an outstanding par value of at least $7 million and be issued as part of a transaction of at least $75 million. The bonds must be fixed-rate, have an issue date after December 31, 1990, and must be at least one year from their maturity date, as well as have been issued in the particular state. The BCNYMB includes both zero coupon bonds and bonds subject to the alternative minimum tax. Neither the NY Index nor the BCNYMB are adjusted to reflect sales charges, expenses and other fees that the Securities and Exchange Commission (SEC) requires to be reflected in the Fund's performance. It is not possible to invest directly in an index. |
The following discussion will focus on the performance of the Fund's Class A Shares. The 10.41% total return of the Class A Shares consisted of 4.13% of tax-exempt dividends and 6.28% appreciation in the net asset value of the shares.4
During the 12-month reporting period ended August 31, 2010, the pace of recovery in output and employment slowed, with tight credit, modest income growth and lower housing wealth being major contributors to this economic environment. Yields on nominal Treasury coupon securities fell noticeably during the period, and Treasury auctions were generally well received. The pace of economic recovery was more modest than had been anticipated and inflation remained subdued. To help support economic recovery, the Federal Reserve Board (the “Fed”) kept constant its holdings of securities at the current levels by reinvesting principal payments from agency debt and mortgage-backed securities in longer term Treasury securities and rolling over its holdings of Treasury debt as it matured. The Fed maintained the target range for the federal funds rate between 0.00% and 0.25% during the entire period.
The state of New York continued to have a broad and wealthy economy that continued to attract a highly educated work force. The state of New York's pension system continued to be well funded, and it continued to have a wealthy tax base and a long history of raising revenue and adjusting spending to maintain fiscal solvency. However, the state continued to maintain an above average debt burden relative to other states due in part to significant additional issuance for capital spending needs. The state's economy has been highly cyclical which reflects its dependence on New York City and the financial services industry. The state fiscal situation has also been volatile due to its above average dependence on income taxes and the large recurring expenditure demands from very generous social service programs.
| 2 | Duration is a measure of a security's price sensitivity to changes in interest rates. Securities with longer durations are more sensitive to changes in interest rates than securities with shorter durations. |
| 3 | Bond prices are sensitive to changes in interest rates and a rise in interest rates can cause a decline in their prices. |
| 4 | Income may be subject to the federal alternative minimum tax for individuals and corporations. |
The credit fundamentals of the municipal bond market showed continued deterioration in such credit factors as pension funding requirements, real estate values and revenue growth.
As determined at the end of the 12-month reporting period, the Fund's dollar-weighted average duration was 5.99 years. Duration management continued to be a significant component of the Fund's investment strategy. The shorter a fund's duration relative to an index, the less its net asset value will react as interest rates change. The Fund adjusted duration relative to the NY Index several times during the reporting period. Tax-exempt municipal bond yields declined significantly during the period as the market stabilized and then recovered from a near crisis environment to one of improved liquidity, a near zero federal funds rate and increased investment activity. As a result, the Fund's duration overweight (110%) relative to the NY Index resulted in a positive contribution to the Fund's performance.
During the 12-month reporting period, relative to the NY Index, the Fund maintained a higher portfolio allocation to securities issued by public utilities and industrial development revenue bonds. These allocations helped the Fund's performance due to the narrowing of credit spreads within these sectors. The Fund had a higher allocation to pre-refunded bonds, higher education debt and healthcare than the NY Index. These sectors underperformed the NY Index during the period and detracted from performance. Overall the Fund experienced a negative excess return contribution from its sector allocations.
Annual Shareholder ReportRisk-aversion by investors subsided as the financial markets stabilized and a preference for yield resulted in the outperformance of bonds rated A and BBB (and unrated bonds of similar quality) relative to bonds rated in the higher rating categories (or unrated bonds of similar quality).5 With the decrease in credit spreads during the period and the narrowing of credit spreads to a greater extent for A and BBB-rated (or comparable quality) debt, the Fund's overweight, relative to the NY Index, in BBB-rated debt during the reporting period minimally helped the Fund's performance as the yield on BBB-rated debt decreased to a greater extent than for other investment-grade securities.6 Also, the Fund's weighting in BB-rated debt relative to NY Index's zero weighting in that rating category detracted from Fund performance despite the contraction of credit spreads during the period due to security selection.
| 5 | Credit ratings pertain only to the securities in the portfolio and do not protect Fund shares against market risk. |
| 6 | Investment-grade securities are securities that are rated at least “BBB” or unrated securities of a comparable quality. Noninvestment-grade securities are securities that are not rated at least “BBB” or unrated securities of a comparable quality. Credit ratings are an indication of the risk that a security will default. They do not protect a security from credit risk. Lower-rated bonds typically offer higher yields to help compensate investors for the increased risk associated with them. Among these risks are lower creditworthiness, greater price volatility, more risk to principal and income than with higher-rated securities and increased possibilities of default. |
GROWTH OF A $10,000 INVESTMENT - CLASS A SHARES
The graph below illustrates the hypothetical investment of $10,0001 in Federated New York Municipal Income Fund (Class A Shares) (the “Fund”) from August 31, 2000 to August 31, 2010, compared to the S&P/Investortools Municipal Bond New York Index (NY Index),2 the Barclays Capital New York Municipal Bond Index (BCNYMB),2 S&P/Investortools Municipal Bond NY, Investment Grade, 3-Year Plus Sub-Index (NYIG Index),2 and the Morningstar Municipal New York Long Funds Category Average (MSTARMNYL).2
| Average Annual Total Returns3 for the Period Ended 8/31/2010 | |
| 1 Year | 5.41% |
| 5 Years | 2.29% |
| 10 Years | 3.96% |
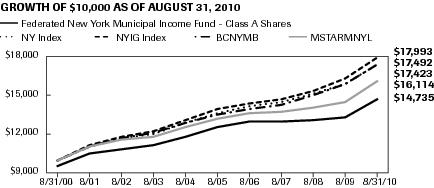
Performance data quoted represents past performance which is no guarantee of future results. Investment return and principal value will fluctuate so that an investor's shares, when redeemed, may be worth more or less than their original cost. Mutual fund performance changes over time and current performance may be lower or higher than what is stated. For current to the most recent month-end performance and after-tax returns, visit FederatedInvestors.com or call 1-800-341-7400. Returns shown do not reflect the deduction of taxes that a shareholder would pay on Fund distributions or the redemption of Fund shares. Mutual funds are not obligations of or guaranteed by any bank and are not federally insured. Total returns shown include the maximum sales charge of 4.50%.
Annual Shareholder Report| 1 | Represents a hypothetical investment of $10,000 in the Fund after deducting the maximum sales charge of 4.50% ($10,000 investment minus $450 sales charge = $9,550). The Fund's performance assumes the reinvestment of all dividends and distributions. The NY Index, NYIG Index, BCNYMB and MSTARMNYL have been adjusted to reflect reinvestment of dividends on securities in the index and the average. |
| 2 | The Fund's investment adviser has elected to change the Fund's broad-based securities market index to the NY Index from the BCNYMB. The NY Index is more representative of the securities in which the Fund invests. The NY Index consists of bonds in the S&P/Investortools Municipal Bond Index (Main Index) that have been issued by the state of New York or local governments or state or local government entities within New York. The Main Index is a broad, comprehensive, market value-weighted index comprised of approximately 55,000 bond issues that are exempt from U.S. federal income taxes or subject to the alternative minimum tax (AMT). Eligibility criteria for inclusion in the Main Index include, but are not limited to: the bond issuer must be a state (including the Commonwealth of Puerto Rico and U.S. territories) or a local government or a state or agency where interest on the bond is exempt from U.S. federal income taxes or subject to the AMT; the bond must be held by a mutual fund for which Standard & Poor's Securities Evaluations, Inc. provides prices; it must be denominated in U.S. dollars and have a minimum par amount of $2 million; and the bond must have a minimum term to maturity and/or call date greater than or equal to one calendar month. The Main Index is rebalanced monthly. The BCNYMB is an unmanaged market value-weighted index for the long-term, tax-exempt bond market comprising investment-grade, tax-exempt and fixed-rate bonds issued in the state of New York. To be included in the index, bonds must have a minimum credit rating of Baa, an outstanding par value of at least $7 million and be issued as part of a transaction of at least $75 million. The bonds must be fixed-rate, have an issue date after December 31, 1990, and must be at least one year from their maturity date, as well as have been issued in the particular state. The BCNYMB includes both zero coupon bonds and bonds subject to the AMT. The NYIG Index represents, the portion of the NY Index composed solely of bonds that are rated BBB-/Baa3 or higher with remaining maturities of more than 3 years that are not subject to AMT. Neither the NY Index, BCNYMB nor NYIG Index are adjusted to reflect sales charges, expenses and other fees that the Securities and Exchange Commission requires to be reflected in the Fund's performance. The NY Index, BCNYMB and NYIG Index are unmanaged and, unlike the Fund, are not affected by cash flows. It is not possible to invest directly in an index. Morningstar figures represent the average of the total returns reported by all the mutual funds designated by Morningstar as falling into the respective category indicated. Funds designated within the MSTARMNYL include those that invest at least 80% of assets in New York municipal debt and have durations of more than seven years (or, if duration is unavailable, average maturities of more than 12 years). They do not reflect sales charges. |
| 3 | Total returns quoted reflect all applicable sales charges. |
GROWTH OF A $10,000 INVESTMENT - CLASS B SHARES
The graph below illustrates the hypothetical investment of $10,0001 in Federated New York Municipal Income Fund (Class B Shares) (the “Fund”) from September 5, 2002 (start of performance) to August 31, 2010, compared to the S&P/Investortools Municipal Bond New York Index (NY Index),2 the Barclays Capital New York Municipal Bond Index (BCNYMB),2 S&P/Investortools Municipal Bond NY, 3-Year Plus Sub-Index (NYIG Index),2 and the Morningstar Municipal New York Long Funds Category Average (MSTARMNYL).2
| Average Annual Total Returns3 for the Period Ended 8/31/2010 | |
| 1 Year | 4.08% |
| 5 Years | 2.10% |
| Start of Performance (9/5/2002) | 3.07% |
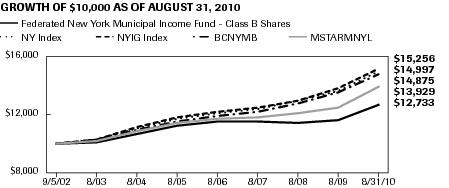
Performance data quoted represents past performance which is no guarantee of future results. Investment return and principal value will fluctuate so that an investor's shares, when redeemed, may be worth more or less than their original cost. Mutual fund performance changes over time and current performance may be lower or higher than what is stated. For current to the most recent month-end performance and after-tax returns, visit FederatedInvestors.com or call 1-800-341-7400. Returns shown do not reflect the deduction of taxes that a shareholder would pay on Fund distributions or the redemption of Fund shares. Mutual funds are not obligations of or guaranteed by any bank and are not federally insured. Total returns shown include the maximum contingent deferred sales charge of 5.50% as applicable.
Annual Shareholder Report| 1 | Represents a hypothetical investment of $10,000 in the Fund. The maximum contingent deferred sales charge is 5.50% on any redemption less than one year from the purchase date. The Fund's performance assumes the reinvestment of all dividends and distributions. The NY Index, BCNYMB and MSTARMNYL have been adjusted to reflect reinvestment of dividends on securities in the index and average. |
| 2 | The Fund's investment adviser has elected to change the Fund's broad-based securities market index to the NY Index from the BCNYMB. The NY Index is more representative of the securities in which the Fund invests. The NY Index consists of bonds in the S&P/Investortools Municipal Bond Index (Main Index) that have been issued by the state of New York or local governments or state or local government entities within New York. The Main Index is a broad, comprehensive, market value-weighted index comprised of approximately 55,000 bond issues that are exempt from U.S. federal income taxes or subject to the alternative minimum tax (AMT). Eligibility criteria for inclusion in the Main Index include, but are not limited to: the bond issuer must be a state (including the Commonwealth of Puerto Rico and U.S. territories) or a local government or a state or agency where interest on the bond is exempt from U.S. federal income taxes or subject to the AMT; the bond must be held by a mutual fund for which Standard & Poor's Securities Evaluations, Inc. provides prices; it must be denominated in U.S. dollars and have a minimum par amount of $2 million; and the bond must have a minimum term to maturity and/or call date greater than or equal to one calendar month. The Main Index is rebalanced monthly. The BCNYMB is an unmanaged market value-weighted index for the long-term, tax-exempt bond market comprising investment-grade, tax-exempt and fixed-rate bonds issued in the state of New York. To be included in the index, bonds must have a minimum credit rating of Baa, an outstanding par value of at least $7 million and be issued as part of a transaction of at least $75 million. The bonds must be fixed-rate, have an issue date after December 31, 1990, and must be at least one year from their maturity date, as well as have been issued in the particular state. The BCNYMB includes both zero coupon bonds and bonds subject to the alternative minimum tax. The NYIG Index represents, the portion of the NY Index composed solely of bonds that are rated BBB-/Baa3 or higher with remaining maturities of more than 3 years that are not subject to AMT. Neither the NY Index, BCNYMB nor NYIG Index are adjusted to reflect sales charges, expenses and other fees that the Securities and Exchange Commission requires to be reflected in the Fund's performance. The NY Index, BCNYMB and NYIG Index are unmanaged and, unlike the Fund, are not affected by cash flows. It is not possible to invest directly in an index. Morningstar figures represent the average of the total returns reported by all the mutual funds designated by Morningstar as falling into the respective category indicated. Funds designated within the MSTARMNYL include those that invest at least 80% of assets in New York municipal debt and have durations of more than seven years (or, if duration is unavailable, average maturities of more than 12 years). They do not reflect sales charges. |
| 3 | Total returns quoted reflect all applicable contingent deferred sales charges. |
Portfolio of Investments Summary Table (unaudited)
At August 31, 2010, the Fund's sector composition1 was as follows:
| Sector Composition | Percentage of Total Net Assets |
| Special Tax | 14.8% |
| Education | 12.7% |
| General Obligation — State | 10.4% |
| Transportation | 9.6% |
| General Obligation — Local | 9.1% |
| Pre-refunded | 7.2% |
| Hospital | 7.1% |
| Water & Sewer | 6.2% |
| Resource Recovery | 4.6% |
| Senior Care | 3.1% |
| Other2 | 13.7% |
| Other Assets and Liabilities — Net3 | 1.5% |
| TOTAL | 100.0% |
| 1 | Sector classifications, and the assignment of holdings to such sectors, are based upon the economic sector and/or revenue source of the underlying obligor, as determined by the Fund's Adviser. For securities that have been enhanced by a third-party, including bond insurers and banks, sector classifications are based upon the economic sector and/or revenue source of the underlying obligor, as determined by the Fund's Adviser. Pre-refunded securities are those whose debt service is paid from escrowed assets, usually U.S. government securities. |
| 2 | For purposes of this table, sector classifications constitute 84.8% of the Fund's total net assets. Remaining sectors have been aggregated under the designation “Other.” |
| 3 | Assets, other than investments in securities, less liabilities. See Statement of Assets and Liabilities. |
Portfolio of Investments
August 31, 2010
| Principal Amount | Value |
| MUNICIPAL BONDS – 95.0% |
| New York – 90.1% |
| $500,000 | Albany, NY IDA, IDRBs (Series 2004A), 5.375% (Albany College of Pharmacy), 12/1/2024 | 509,165 |
| 1,000,000 | Babylon, NY IDA, Resource Recovery Bonds (Series 2009A), 5.00% (Covanta Babylon, Inc.), 1/1/2019 | 1,140,130 |
| 785,000 | Dutchess County, NY IDA, Revenue Bonds, 5.00% (Marist College)/(Original Issue Yield: 5.15%), 7/1/2020 | 818,629 |
| 500,000 | East Rochester, NY Housing Authority, Revenue Bonds (Series 2002A), 5.375% (Rochester St. Mary's Residence Facility LLC)/(GNMA GTD), 12/20/2022 | 528,200 |
| 1,000,000 | Erie County, NY IDA, School Facility Revenue Bonds (Series 2009A), 5.25% (Buffalo, NY City School District), 5/1/2025 | 1,143,460 |
| 200,000 | Essex County, NY IDA, Environmental Improvement Revenue Bonds (Series 2006A), 4.60% (International Paper Co.), 12/1/2030 | 177,272 |
| 750,000 | Hempstead Town, NY IDA, Civic Facility Revenue Bonds, 5.00% (Adelphi University), 10/1/2035 | 768,210 |
| 500,000 | Hempstead Town, NY IDA, Civic Facility Revenue Bonds, 5.00% (Hofstra University)/(Original Issue Yield: 5.10%), 7/1/2033 | 507,680 |
| 560,000 | Hudson Yards Infrastructure Corp. NY, Senior Revenue Bonds (Fiscal 2007 Series A), 5.00%, 2/15/2047 | 560,566 |
| 220,000 | Islip, NY Resource Recovery Agency, Resource Recovery Revenue Bonds (Series 2001E), 5.75% (Assured Guaranty Municipal Corp. INS), 7/1/2023 | 234,907 |
| 500,000 | Livingston County, NY IDA, Civic Facility Revenue Bonds (Series 2005), 6.00% (Nicholas H. Noyes Memorial Hospital Civic Facility), 7/1/2030 | 475,505 |
| 1,000,000 | Long Island Power Authority, NY, Electric System Revenue Bonds (Series C), 5.25%, 9/1/2029 | 1,179,980 |
| 500,000 | Madison County, NY IDA, Civic Facility Revenue Bonds (Series 2003A), 5.00% (Colgate University), 7/1/2023 | 527,925 |
| 500,000 | Metropolitan Transportation Authority, NY, Dedicated Tax Fund Bonds (Series 2009B), 5.00% (MTA Dedicated Tax Fund)/(Original Issue Yield: 5.10%), 11/15/2034 | 538,560 |
| 250,000 | Metropolitan Transportation Authority, NY, Revenue Bonds (Series 1998A), 5.00% (MTA Dedicated Tax Fund)/(United States Treasury PRF 10/1/2015@100)/(Original Issue Yield: 5.22%), 4/1/2023 | 298,482 |
| 500,000 | Metropolitan Transportation Authority, NY, Revenue Bonds (Series 2006A), 5.00% (MTA Transportation Revenue), 11/15/2035 | 517,750 |
| 500,000 | Metropolitan Transportation Authority, NY, Transportation Revenue Bonds (Series 2007B), 5.00% (MTA Transportation Revenue), 11/15/2033 | 523,350 |
| Principal Amount | Value |
| $500,000 | Monroe County, NY IDA, Civic Center Revenue Bonds, 5.25% (St. John Fisher College)/(Radian Asset Assurance, Inc. INS)/(Original Issue Yield: 5.25%), 6/1/2026 | 501,350 |
| 500,000 | Nassau County, NY IDA, IDRBs (Series 2003A), 5.25% (KeySpan-Glenwood Energy Center LLC)/(KeySpan Corp. GTD), 6/1/2027 | 511,640 |
| 1,000,000 | Nassau County, NY, UT GO Bonds (Series 2009A), 5.00% (Assured Guaranty Corp. INS), 5/1/2021 | 1,182,570 |
| 500,000 | New York City Liberty Development Corp., Revenue Bonds (Series 2005), 5.25% (Goldman Sachs Group, Inc.), 10/1/2035 | 525,980 |
| 500,000 | New York City Trust For Cultural Resources, Refunding Revenue Bonds (Series 2008A), 5.00% (Museum of Modern Art), 4/1/2028 | 560,240 |
| 500,000 | New York City Trust For Cultural Resources, Refunding Revenue Bonds (Series 2008A), 5.00% (Museum of Modern Art), 4/1/2031 | 549,070 |
| 250,000 | New York City, NY IDA, Civic Facilities Revenue Bonds, 5.375% (New York University)/(AMBAC Assurance Corporation INS), 7/1/2017 | 259,402 |
| 380,000 | New York City, NY IDA, Civic Facility Revenue Bonds (Series 2001A), 6.375% (Staten Island University Hospital), 7/1/2031 | 383,842 |
| 175,000 | New York City, NY IDA, Civic Facility Revenue Bonds (Series 2002C), 6.45% (Staten Island University Hospital), 7/1/2032 | 178,418 |
| 500,000 | New York City, NY IDA, Special Airport Facility Revenue Bonds (Series 2001A), 5.50% (Airis JFK I LLC Project at JFK International)/(Original Issue Yield: 5.65%), 7/1/2028 | 449,950 |
| 500,000 | New York City, NY IDA, Special Facilities Revenue Bonds, 5.25% (British Airways), 12/1/2032 | 392,590 |
| 300,000 | New York City, NY IDA, Special Facilities Revenue Bonds, 5.50% (Terminal One Group Association), 1/1/2024 | 312,189 |
| 500,000 | New York City, NY Municipal Water Finance Authority, Revenue Bonds (Series 2002B), 5.00% (Original Issue Yield: 5.14%), 6/15/2026 | 514,185 |
| 65,000 | New York City, NY Municipal Water Finance Authority, Water & Sewer System Revenue Bonds (Series 2009A), 5.75% (Original Issue Yield: 5.90%), 6/15/2040 | 74,844 |
| 500,000 | New York City, NY Municipal Water Finance Authority, Water and Sewer System Revenue Bonds (Series 2009AA), 5.00%, 6/15/2022 | 583,370 |
| 500,000 | New York City, NY Transitional Finance Authority, Building Aid Revenue Bonds (Series 2009S-5), 5.25% (Original Issue Yield: 5.33%), 1/15/2039 | 544,815 |
| 500,000 | New York City, NY Transitional Finance Authority, Future Tax Secured Bonds (2003 Series C), 5.25% (United States Treasury PRF 8/1/2012@100), 8/1/2022 | 547,095 |
| 500,000 | New York City, NY, UT GO Bonds (Series 2009E-1), 6.25% (Original Issue Yield: 6.40%), 10/15/2028 | 609,095 |
| 500,000 | New York State Dormitory Authority, FHA-INS Mortgage Nursing Home Revenue Bonds (Series 2001), 6.10% (Norwegian Christian Home and Health Center)/(National Public Finance Guarantee Corporation INS), 8/1/2041 | 532,785 |
| Principal Amount | Value |
| $1,000,000 | New York State Dormitory Authority, Improvement Revenue Bonds (Series 2008D), 5.00% (Mental Health Services Facility)/(Assured Guaranty Municipal Corp. INS), 2/15/2018 | 1,172,420 |
| 500,000 | New York State Dormitory Authority, Lease Revenue Bonds (Series 2006A), 5.00% (State University of New York)/(National Public Finance Guarantee Corporation INS), 7/1/2031 | 525,225 |
| 500,000 | New York State Dormitory Authority, Revenue Bonds (Series 1998), 5.50% (Memorial Sloan-Kettering Cancer Center)/(National Public Finance Guarantee Corporation INS), 7/1/2023 | 600,130 |
| 300,000 | New York State Dormitory Authority, Revenue Bonds (Series 2002), 5.00% (Fordham University)/(United States Treasury PRF 7/1/2012@100), 7/1/2022 | 325,989 |
| 250,000 | New York State Dormitory Authority, Revenue Bonds (Series 2003), 5.375% (North Shore-Long Island Jewish Obligated Group)/(United States Treasury PRF 5/1/2013@100)/(Original Issue Yield: 5.48%), 5/1/2023 | 282,843 |
| 750,000 | New York State Dormitory Authority, Revenue Bonds (Series 2003A), 5.50% (Winthrop-University Hospital Association)/(Original Issue Yield: 5.70%), 7/1/2023 | 771,802 |
| 500,000 | New York State Dormitory Authority, Revenue Bonds (Series 2004), 5.25% (New York Methodist Hospital), 7/1/2024 | 513,570 |
| 250,000 | New York State Dormitory Authority, Revenue Bonds (Series 2004A), 5.25% (University of Rochester, NY), 7/1/2024 | 267,035 |
| 500,000 | New York State Dormitory Authority, Revenue Bonds (Series 2008A), 5.00% (School District Financing Program)/(Assured Guaranty Municipal Corp. INS), 10/1/2023 | 564,215 |
| 520,000 | New York State Dormitory Authority, Revenue Bonds (Series 2008C), 5.00% (New York State Personal Income Tax Revenue Bond Fund), 3/15/2026 | 584,475 |
| 500,000 | New York State Dormitory Authority, Revenue Bonds (Series 2009C), 5.00% (School District Financing Program)/(Assured Guaranty Corp. INS), 10/1/2023 | 571,715 |
| 250,000 | New York State Dormitory Authority, Revenue Bonds (Series A), 5.625% (City University of New York)/(Original Issue Yield: 5.95%), 7/1/2016 | 286,230 |
| 300,000 | New York State Environmental Facilities Corp., Clean Water & Drinking Water Revolving Funds Revenue Bonds (Series 2008A), 5.00%, 6/15/2029 | 334,326 |
| 500,000 | New York State Environmental Facilities Corp., Clean Water & Drinking Water Revolving Funds Revenue Bonds (Series 2009A), 5.00% (Original Issue Yield: 5.26%), 6/15/2034 | 544,450 |
| 500,000 | New York State Environmental Facilities Corp., Water Facilities Revenue Bonds (Series 2010A), 4.875% (United Waterworks Inc.), 9/1/2040 | 500,590 |
| Principal Amount | Value |
| $500,000 | New York State HFA, State Personal Income Tax Bonds (Series 2006A), 5.00% (New York State Personal Income Tax Revenue Bond Fund)/(Original Issue Yield: 5.099%), 3/15/2039 | 538,105 |
| 500,000 | New York State Local Government Assistance Corp., Senior Lien Revenue Refunding Bonds (Series 2008 A-5/6), 5.00%, 4/1/2020 | 598,360 |
| 500,000 | New York State Local Government Assistance Corp., Subordinate Lien Refunding Revenue Bonds (Series 2010A), 5.00%, 4/1/2023 | 592,115 |
| 500,000 | New York State Mortgage Agency, Homeowner Mortgage Revenue Bonds (Series 156), 5.35%, 10/1/2033 | 524,370 |
| 1,000,000 | New York State Thruway Authority, Revenue Bonds (Series 2006A), 5.00% (New York State Thruway Authority — Dedicated Highway & Bridge Trust Fund)/(AMBAC Assurance Corporation INS), 4/1/2026 | 1,084,950 |
| 250,000 | New York State Urban Development Corp., Revenue Refunding Bonds (Series 1995), 5.70% (New York State)/(Original Issue Yield: 5.94%), 4/1/2020 | 305,300 |
| 500,000 | New York State Urban Development Corp., Service Contract Revenue Refunding Bonds (Series 2008C), 5.00% (New York State), 1/1/2027 | 541,705 |
| 500,000 | New York State Urban Development Corp., Subordinated Lien Revenue Bonds (Series 2004A), 5.125% (New York State), 1/1/2022 | 542,715 |
| 500,000 | New York State, UT GO Bonds (Series 2009A), 5.00% (Original Issue Yield: 5.24%), 2/15/2039 | 535,560 |
| 300,000 | Newburgh, NY, 5.15% BANs, 8/30/2011 | 304,116 |
| 500,000 | Niagara County, NY IDA, Solid Waste Disposal Facility Revenue Refunding Bonds (Series 2001D), 5.55% TOBs (American Ref-Fuel Co. of Niagara, L.P. Facility) Mandatory Tender 11/15/2015 | 505,490 |
| 1,000,000 | Port Authority of New York and New Jersey, 5.00%, 12/1/2029 | 1,079,930 |
| 500,000 | Rensselaer County, NY IDA, Civic Facility Revenue Bonds (Series 2006), 5.00% (Rensselaer Polytechnic Institute), 3/1/2036 | 519,465 |
| 450,000 | Syracuse, NY IDA, School Facility Revenue Bonds (Series 2008A), 5.00% (Syracuse CSD, NY)/(Assured Guaranty Municipal Corp. INS), 5/1/2028 | 494,708 |
| 500,000 | Triborough Bridge & Tunnel Authority, NY, General Revenue Bonds (Series 2008A), 5.00% (Original Issue Yield: 5.10%), 11/15/2037 | 533,530 |
| 460,000 | Triborough Bridge & Tunnel Authority, NY, General Revenue Bonds (Series 2009A-2), 5.00%, 11/15/2023 | 533,457 |
| 175,000 | Westchester County, NY IDA, Continuing Care Retirement Mortgage Revenue Bonds (Series 2003A), 6.375% (Kendal on Hudson)/(Original Issue Yield: 6.55%), 1/1/2024 | 175,627 |
| TOTAL | 36,917,719 |
| Puerto Rico – 4.9% |
| 630,000 | Commonwealth of Puerto Rico, Public Improvement UT GO Bonds (Series 2004A), 5.00% (United States Treasury PRF 7/1/2014@100), 7/1/2034 | 733,843 |
| Principal Amount | Value |
| $370,000 | Commonwealth of Puerto Rico, Public Improvement UT GO Bonds (Series 2004A), 5.00%, 7/1/2034 | 372,927 |
| 325,000 | Puerto Rico Highway and Transportation Authority, Transportation Revenue Bonds (Series G), 5.00% (United States Treasury PRF 7/1/2013@100)/(Original Issue Yield: 5.10%), 7/1/2033 | 366,779 |
| 135,000 | Puerto Rico Public Building Authority, Revenue Bonds (Series 2002D), 5.25% (Commonwealth of Puerto Rico GTD)/(Original Issue Yield: 5.40%), 7/1/2027 | 136,517 |
| 365,000 | Puerto Rico Public Building Authority, Revenue Bonds (Series 2002D), 5.25% (United States Treasury PRF 7/1/2012@100)/(Original Issue Yield: 5.40%), 7/1/2027 | 396,667 |
| TOTAL | 2,006,733 |
| TOTAL MUNICIPAL BONDS (IDENTIFIED COST $36,920,246) | 38,924,452 |
| SHORT-TERM MUNICIPALS – 3.5%;1 |
| New York – 3.5% |
| 1,450,000 | New York City, NY Transitional Finance Authority, New York City Recovery Bonds (2003 Subseries 1-D) Daily VRDNs (Landesbank Hessen-Thuringen GTD LIQ), 0.240%, 9/1/2010 (AT AMORTIZED COST) | 1,450,000 |
| TOTAL INVESTMENTS — 98.5% (IDENTIFIED COST $38,370,246)2 | 40,374,452 |
| OTHER ASSETS AND LIABILITIES - NET — 1.5%3 | 631,925 |
| TOTAL NET ASSETS — 100% | $41,006,377 |
Securities that are subject to the federal alternative minimum tax (AMT) represent 5.1% of the Fund's portfolio as calculated based upon total market value (percentage is unaudited).
| 1 | Current rate and next reset date shown for Variable Rate Demand Notes. |
| 2 | The cost of investments for federal tax purposes amounts to $38,633,715. |
| 3 | Assets, other than investments in securities, less liabilities. See Statement of Assets and Liabilities. |
Note: The categories of investments are shown as a percentage of total net assets at August 31, 2010.
Various inputs are used in determining the value of the Fund's investments. These inputs are summarized in the three broad levels listed below:
Level 1 — quoted prices in active markets for identical securities
Level 2 — other significant observable inputs (including quoted prices for similar securities, interest rates, prepayment speeds, credit risk, etc.)
Level 3 — significant unobservable inputs (including the Fund's own assumptions in determining the fair value of investments)
The inputs or methodology used for valuing securities are not an indication of the risk associated with investing in those securities.
Annual Shareholder ReportThe following acronyms are used throughout this portfolio:
| AMBAC | — American Municipal Bond Assurance Corporation |
| BANs | — Bond Anticipation Notes |
| CSD | — Central School District |
| FHA | — Federal Housing Administration |
| GNMA | — Government National Mortgage Association |
| GO | — General Obligation |
| GTD | — Guaranteed |
| HFA | — Housing Finance Authority |
| IDA | — Industrial Development Authority |
| IDRBs | — Industrial Development Revenue Bonds |
| INS | — Insured |
| LIQ | — Liquidity Agreement |
| LLC | — Limited Liability Corporation |
| PRF | — Prerefunded |
| TOBs | — Tender Option Bonds |
| UT | — Unlimited Tax |
| VRDNs | — Variable Rate Demand Notes |
See Notes which are an integral part of the Financial Statements
Annual Shareholder ReportStatement of Assets and Liabilities
August 31, 2010
| Assets: |
| Total investments in securities, at value (identified cost $38,370,246) | $40,374,452 |
| Cash | 25,749 |
| Receivable for investments sold | 775,937 |
| Income receivable | 474,482 |
| Receivable for shares sold | 3,394 |
| TOTAL ASSETS | 41,654,014 |
| Liabilities: |
| Payable for investments purchased | $500,000 |
| Payable for shares redeemed | 62,341 |
| Income distribution payable | 35,412 |
| Payable for portfolio accounting fees | 25,000 |
| Payable for shareholder services fee (Note 5) | 7,702 |
| Payable for distribution services fee (Note 5) | 5,914 |
| Payable for advisory fee (Note 5) | 402 |
| Accrued expenses | 10,866 |
| TOTAL LIABILITIES | 647,637 |
| Net assets for 3,973,618 shares outstanding | $41,006,377 |
| Net Assets Consist of: |
| Paid-in capital | $42,718,697 |
| Net unrealized appreciation of investments | 2,004,206 |
| Accumulated net realized loss on investments | (3,716,526) |
| TOTAL NET ASSETS | $41,006,377 |
| Net Asset Value, Offering Price and Redemption Proceeds Per Share |
| Class A Shares: |
| Net asset value per share ($31,644,419 ÷ 3,066,417 shares outstanding), no par value, unlimited shares authorized | $10.32 |
| Offering price per share(100/95.50 of $10.32) | $10.81 |
| Redemption proceeds per share | $10.32 |
| Class B Shares: |
| Net asset value per share ($9,361,958 ÷ 907,201 shares outstanding), no par value, unlimited shares authorized | $10.32 |
| Offering price per share | $10.32 |
| Redemption proceeds per share (94.50/100 of $10.32) | $9.75 |
See Notes which are an integral part of the Financial Statements
Annual Shareholder ReportStatement of Operations
Year Ended August 31, 2010
| Investment Income: |
| Interest | $1,863,862 |
| Expenses: |
| Investment adviser fee (Note 5) | $162,418 |
| Administrative personnel and services fee (Note 5) | 190,000 |
| Custodian fees | 6,041 |
| Transfer and dividend disbursing agent fees and expenses | 48,871 |
| Directors'/Trustees' fees | 1,181 |
| Auditing fees | 20,500 |
| Legal fees | 2,826 |
| Portfolio accounting fees | 102,111 |
| Distribution services fee — Class A Shares (Note 5) | 15,297 |
| Distribution services fee — Class B Shares (Note 5) | 75,083 |
| Shareholder services fee — Class A Shares (Note 5) | 76,330 |
| Shareholder services fee — Class B Shares (Note 5) | 25,028 |
| Account administration fee — Class A Shares | 54 |
| Share registration costs | 29,059 |
| Printing and postage | 17,623 |
| Insurance premiums | 4,363 |
| Miscellaneous | 1,306 |
| TOTAL EXPENSES | 778,091 |
| Waivers and Reimbursements (Note 5): |
| Waiver of investment adviser fee | $(162,418) |
| Waiver of administrative personnel and services fee | (34,594) |
| Waiver of distribution services fee — Class A Shares | (15,297) |
| Reimbursement of shareholder services fee — Class A Shares | (2,960) |
| Reimbursement of other operating expenses | (176,175) |
| TOTAL WAIVERS AND REIMBURSEMENTS | (391,444) |
| Net expenses | 386,647 |
| Net investment income | 1,477,215 |
| Realized and Unrealized Gain (Loss) on Investments: |
| Net realized loss on investments | (557,296) |
| Net change in unrealized appreciation of investments | 2,996,508 |
| Net realized and unrealized gain on investments | 2,439,212 |
| Change in net assets resulting from operations | $3,916,427 |
See Notes which are an integral part of the Financial Statements
Annual Shareholder ReportStatement of Changes in Net Assets
| Year Ended August 31 | 2010 | 2009 |
| Increase (Decrease) in Net Assets |
| Operations: |
| Net investment income | $1,477,215 | $1,687,112 |
| Net realized loss on investments | (557,296) | (1,366,751) |
| Net change in unrealized appreciation/depreciation of investments | 2,996,508 | (68,417) |
| CHANGE IN NET ASSETS RESULTING FROM OPERATIONS | 3,916,427 | 251,944 |
| Distributions to Shareholders: |
| Distributions from net investment income |
| Class A Shares | (1,170,233) | (1,283,049) |
| Class B Shares | (307,511) | (402,839) |
| CHANGE IN NET ASSETS RESULTING FROM DISTRIBUTIONS TO SHAREHOLDERS | (1,477,744) | (1,685,888) |
| Share Transactions: |
| Proceeds from sale of shares | 5,761,305 | 4,351,851 |
| Net asset value of shares issued to shareholders in payment of distributions declared | 960,052 | 980,481 |
| Cost of shares redeemed | (7,998,281) | (9,277,846) |
| CHANGE IN NET ASSETS RESULTING FROM SHARE TRANSACTIONS | (1,276,924) | (3,945,514) |
| Change in net assets | 1,161,759 | (5,379,458) |
| Net Assets: |
| Beginning of period | 39,844,618 | 45,224,076 |
| End of period (including undistributed net investment income of $0 and $1,377, respectively) | $41,006,377 | $39,844,618 |
See Notes which are an integral part of the Financial Statements
Annual Shareholder ReportNotes to Financial Statements
August 31, 2010
Federated Municipal Securities Income Trust (the “Trust”) is registered under the Investment Company Act of 1940, as amended (the “Act”), as an open-end management investment company. The Trust consists of five portfolios. The financial statements included herein are only those of Federated New York Municipal Income Fund (the “Fund”), a non-diversified portfolio. The financial statements of the other portfolios are presented separately. The assets of each portfolio are segregated and a shareholder's interest is limited to the portfolio in which shares are held. Each portfolio pays its own expenses. The Fund offers two classes of shares: Class A Shares and Class B Shares. All shares of the Fund have equal rights with respect to voting, except on class-specific matters. The investment objective of the Fund is to provide current income exempt from federal regular income tax (federal regular income tax does not include the federal alternative minimum tax (AMT)) and the personal income taxes imposed by the state of New York and New York municipalities. Interest income from the Fund's investments may be subject to the federal AMT for individuals and corporations.
2. Significant Accounting Policies
The following is a summary of significant accounting policies consistently followed by the Fund in the preparation of its financial statements. These policies are in conformity with U.S. generally accepted accounting principles (GAAP).
Investment Valuation
In calculating its net asset value (NAV), the Fund generally values investments as follows:
- Fixed-income securities acquired with remaining maturities greater than 60 days are fair valued using price evaluations provided by a pricing service approved by the Board of Trustees (the “Trustees”).
- Fixed-income securities acquired with remaining maturities of 60 days or less are valued at their cost (adjusted for the accretion of any discount or amortization of any premium).
- Derivative contracts listed on exchanges are valued at their reported settlement or closing price.
- Over-the-counter (OTC) derivative contracts are fair valued using price evaluations provided by a pricing service approved by the Trustees.
- Shares of other mutual funds are valued based upon their reported NAVs.
If the Fund cannot obtain a price or price evaluation from a pricing service for an investment, the Fund may attempt to value the investment based upon the mean of bid and asked quotations or fair value the investment based on price evaluations, from one or more dealers. If any price, quotation, price evaluation or other pricing source is not readily available when the NAV is calculated, the Fund uses the fair value of the investment determined in accordance with the procedures described below. There can be no assurance that the Fund could purchase or sell an investment at the price used to calculate the Fund's NAV.
Fair Valuation and Significant Events Procedures
The Trustees have authorized the use of pricing services to provide evaluations of the current fair value of certain investments for purposes of calculating the NAV. Factors considered by pricing services in evaluating an investment include the yields or prices of investments of comparable quality, coupon, maturity, call rights and other potential prepayments, terms and type, reported transactions, indications as to values from dealers, and general market Annual Shareholder ReportThe Trustees also have adopted procedures requiring an investment to be priced at its fair value whenever the Adviser determines that a significant event affecting the value of the investment has occurred between the time as of which the price of the investment would otherwise be determined and the time as of which the NAV is computed. An event is considered significant if there is both an affirmative expectation that the investment's value will change in response to the event and a reasonable basis for quantifying the resulting change in value. Examples of significant events that may occur after the close of the principal market on which a security is traded, or after the time of a price evaluation provided by a pricing service or a dealer, include:
- With respect to price evaluations of fixed-income securities determined before the close of regular trading on the NYSE, actions by the Federal Reserve Open Market Committee and other significant trends in U.S. fixed-income markets;
- Political or other developments affecting the economy or markets in which an issuer conducts its operations or its securities are traded; and
- Announcements concerning matters such as acquisitions, recapitalizations, litigation developments, a natural disaster affecting the issuer's operations or regulatory changes or market developments affecting the issuer's industry.
The Fund may seek to obtain more current quotations or price evaluations from alternative pricing sources. If a reliable alternative pricing source is not available, the Fund will determine the fair value of the investment using another method approved by the Trustees.
Investment Income, Gains and Losses, Expenses and Distributions
Investment transactions are accounted for on a trade-date basis. Realized gains and losses from investment transactions are recorded on an identified-cost basis. Interest income and expenses are accrued daily. Distributions to shareholders are recorded on the ex-dividend date. Distributions of net investment income are declared daily and paid monthly. Non-cash dividends included in dividend income, if any, are recorded at fair value. Investment income, realized and unrealized gains and losses, and certain fund-level expenses are allocated to each class based on relative average daily net assets, except that each class may bear certain expenses unique to that class such as distribution services, shareholder services and account administration fees. Dividends are declared separately for each class. No class has preferential dividend rights; differences in per share dividend rates are generally due to differences in separate class expenses.
Premium and Discount Amortization
All premiums and discounts on fixed-income securities are amortized/accreted for financial statement purposes.
Annual Shareholder ReportIt is the Fund's policy to comply with the Subchapter M provision of the Internal Revenue Code and to distribute to shareholders each year substantially all of its income. Accordingly, no provision for federal income tax is necessary. As of and during the year ended August 31, 2010, the Fund did not have a liability for any uncertain tax positions. The Fund recognizes interest and penalties, if any, related to tax liabilities as income tax expense in the Statement of Operations. As of August 31, 2010, tax years 2007 through 2010 remain subject to examination by the Fund's major tax jurisdictions, which include the United States of America and the Commonwealth of Massachusetts.
When-Issued and Delayed Delivery Transactions
The Fund may engage in when-issued or delayed delivery transactions. The Fund records when-issued securities on the trade date and maintains security positions such that sufficient liquid assets will be available to make payment for the securities purchased. Securities purchased on a when-issued or delayed delivery basis are marked to market daily and begin earning interest on the settlement date. Losses may occur on these transactions due to changes in market conditions or the failure of counterparties to perform under the contract.
Other
The preparation of financial statements in conformity with GAAP requires management to make estimates and assumptions that affect the amounts of assets, liabilities, expenses and revenues reported in the financial statements. Actual results could differ from those estimated.
3. Shares of Beneficial Interest
The following tables summarize share activity:
| Year Ended August 31 | 2010 | 2009 | |
| Class A Shares: | Shares | Amount | Shares | Amount |
| Shares sold | 539,276 | $5,409,700 | 433,512 | $4,031,355 |
| Shares issued to shareholders in payment of distributions declared | 72,926 | 730,282 | 74,954 | 693,884 |
| Shares redeemed | (565,521) | (5,667,664) | (724,465) | (6,683,222) |
| NET CHANGE RESULTING FROM CLASS A SHARE TRANSACTIONS | 46,681 | $472,318 | (215,999) | $(1,957,983) |
| Year Ended August 31 | 2010 | 2009 | |
| Class B Shares: | Shares | Amount | Shares | Amount |
| Shares sold | 35,133 | $351,605 | 34,620 | $320,496 |
| Shares issued to shareholders in payment of distributions declared | 22,959 | 229,770 | 31,015 | 286,597 |
| Shares redeemed | (232,994) | (2,330,617) | (279,971) | (2,594,624) |
| NET CHANGE RESULTING FROM CLASS B SHARE TRANSACTIONS | (174,902) | $(1,749,242) | (214,336) | $(1,987,531) |
| NET CHANGE RESULTING FROM FUND SHARE TRANSACTIONS | (128,221) | $(1,276,924) | (430,335) | $(3,945,514) |
The timing and character of income and capital gain distributions are determined in accordance with income tax regulations, which may differ from GAAP. These differences are due to differing treatments for discount accretion/premium amortization on debt securities.
For the year ended August 31, 2010, permanent differences identified and reclassified among the components of net assets were as follows:
| Increase (Decrease) | |
| Undistributed Net Investment Income (Loss) | Accumulated Net Realized Gain (Loss) |
| $(848) | $848 |
Net investment income (loss), net realized gains (losses) and net assets were not affected by this reclassification.
The tax character of distributions as reported on the Statement of Changes in Net Assets for the year ended August 31, 2010 and 2009, was as follows:
| 2010 | 2009 |
| Tax-exempt income | $1,477,744 | $1,685,888 |
As of August 31, 2010, the components of distributable earnings on a tax basis were as follows:
| Net unrealized appreciation | $1,740,737 |
| Capital loss carryforwards and deferrals | $(3,453,057) |
The difference between book-basis and tax-basis net unrealized appreciation/depreciation is attributable to differing treatments for open defaulted securities and discount accretion/premium amortization on debt securities.
At August 31, 2010, the cost of investments for federal tax purposes was $38,633,715. The net unrealized appreciation of investments for federal tax purposes was $1,740,737. This consists of net unrealized appreciation from investments for those securities having an excess of value over cost of $1,938,261 and net unrealized depreciation from investments for those securities having an excess of cost over value of $197,524.
Annual Shareholder Report| Expiration Year | Expiration Amount |
| 2011 | $371,903 |
| 2012 | $4,752 |
| 2013 | $318,023 |
| 2016 | $249,898 |
| 2017 | $958,822 |
| 2018 | $1,218,820 |
Under current tax regulations, capital losses on securities transactions realized after
October 31 may be deferred and treated as occurring on the first day of the following fiscal year. As of August 31, 2010, for federal income tax purposes, post-October losses of $330,839 were deferred to September 1, 2010.
5. Investment Adviser Fee and Other Transactions with Affiliates
Investment Adviser Fee
Federated Investment Management Company is the Fund's investment adviser (the “Adviser”). The advisory agreement between the Fund and the Adviser provides for an annual fee equal to 0.40% of the Fund's average daily net assets. Subject to the terms described in the Expense Limitation note, the Adviser may voluntarily choose to waive any portion of its fee and/or reimburse certain operating expenses of the Fund. For the year ended August 31, 2010, the Adviser voluntarily waived its entire fee of $162,418 and voluntarily reimbursed $176,175 of other operating expenses.
Administrative Fee
Federated Administrative Services (FAS), under the Administrative Services Agreement, provides the Fund with administrative personnel and services. The fee paid to FAS is based on the average aggregate daily net assets of certain Federated funds as specified below:
| Administrative Fee | Average Aggregate Daily Net Assets of the Federated Funds |
| 0.150% | on the first $5 billion |
| 0.125% | on the next $5 billion |
| 0.100% | on the next $10 billion |
| 0.075% | on assets in excess of $20 billion |
The administrative fee received during any fiscal year shall be at least $150,000 per portfolio and $40,000 per each additional class of Shares. Subject to the terms described in the Expense Limitation note, FAS may voluntarily choose to waive any portion of its fee. For the year ended August 31, 2010, FAS waived $34,594 of its fee. The net fee paid to FAS was 0.383% of average daily net assets of the Fund. The Fund is currently being charged the minimum administrative fee; therefore the fee as a percentage of average aggregate daily net assets is greater than the amounts presented in the chart above.
Distribution Services Fee
The Fund has adopted a Distribution Plan (the “Plan”) pursuant to Rule 12b-1 under the Act. Under the terms of the Plan, the Fund will compensate Federated Securities Corp. (FSC), the principal distributor, from the daily net assets of the Fund's Class A Shares and Class B Shares to finance activities intended to result in the sale of these shares. The Plan provides that the Fund may incur distribution expenses at the following percentages of average daily net assets annually, to compensate FSC:
| Share Class Name | Percentage of Average Daily Net Assets of Class |
| Class A Shares | 0.05% |
| Class B Shares | 0.75% |
Subject to the terms described in the Expense Limitation note, FSC may voluntarily choose to waive any portion of its fee. For the year ended August 31, 2010, FSC voluntarily waived $15,297 of its fee. When FSC receives fees, it may pay some or all of them to financial intermediaries whose customers purchase shares. For the year ended August 31, 2010, FSC retained $668 of fees paid by the Fund.
Sales Charges
Front-end sales charges and contingent deferred sales charges (CDSC) do not represent expenses of the Fund. They are deducted from the proceeds of sales of Fund shares prior to investment or from redemption proceeds prior to remittance, as applicable. For the year ended August 31, 2010, FSC retained $22,689 in sales charges from the sale of Class A Shares.
Shareholder Services Fee
The Fund may pay fees (“Service Fees”) up to 0.25% of the average daily net assets of the Fund's Class A Shares and Class B Shares to financial intermediaries or to Federated Shareholder Services Company (FSSC) for providing services to shareholders and maintaining shareholder accounts. Subject to the terms described in the Expense Limitation note, FSSC may voluntarily reimburse the Fund for Service Fees. For the year ended August 31, 2010, FSSC voluntarily reimbursed $2,960 of Service Fees. For the year ended August 31, 2010, FSSC did not receive any fees paid by the Fund.
Interfund Transactions
During the year ended August 31, 2010, the Fund engaged in purchase and sale transactions with funds that have a common investment adviser (or affiliated investment advisers), common Directors/Trustees and/or common Officers. These purchase and sale transactions complied with Rule 17a-7 under the Act and amounted to $17,350,000 and $15,900,000, respectively.
Annual Shareholder ReportThe Adviser and its affiliates (which may include FSC, FAS and FSSC) have voluntarily agreed to waive their fees and/or reimburse expenses so that the total annual fund operating expenses (as shown in the financial highlights) paid by the Fund's Class A Shares and Class B Shares (after the voluntary waivers and/or reimbursements) will not exceed 0.76% and 1.52% (the “Fee Limit”), respectively, through the later of (the “Termination Date”): (a) October 31, 2011; or (b) the date of the Fund's next effective Prospectus. While the Adviser and its affiliates currently do not anticipate terminating or increasing these arrangements prior to the Termination Date, these arrangements may only be terminated or the Fee Limit increased prior to the Termination Date with the agreement of the Fund's Trustees.
General
Certain Officers and Trustees of the Fund are Officers and Directors or Trustees of the above companies.
Purchases and sales of investments, excluding long-term U.S. government securities and short-term obligations, for the year ended August 31, 2010, were as follows:
| Purchases | $9,961,076 |
| Sales | $12,538,146 |
Since the Fund invests a substantial portion of its assets in issuers located in one state, it will be more susceptible to factors adversely affecting issuers of that state than would be a comparable tax-exempt mutual fund that invests nationally. In order to reduce the credit risk associated with such factors, at August 31, 2010, 19.1% of the securities in the portfolio of investments is backed by letters of credit or bond insurance of various financial institutions and financial guaranty assurance agencies. The largest percentage of investments insured by or supported (“backed”) by a letter of credit from any one institution or agency was 6.1% of total investments.
The Fund participates in a $100,000,000 unsecured, uncommitted revolving line of credit (LOC) agreement with PNC Bank. The LOC was made available for extraordinary or emergency purposes, primarily for financing redemption payments. Borrowings are charged interest at a rate offered to the Fund by PNC Bank at the time of the borrowing. As of August 31, 2010, there were no outstanding loans. During the year ended August 31, 2010, the Fund did not utilize the LOC.
Pursuant to an Exemptive Order issued by the Securities and Exchange Commission, the Fund, along with other funds advised by subsidiaries of Federated Investors, Inc., may participate in an interfund lending program. This program provides an alternative credit facility allowing the funds to borrow from other participating affiliated funds. As of August 31, 2010, there were no outstanding loans. During the year ended August 31, 2010, the program was not utilized.
Annual Shareholder ReportSince October 2003, Federated Investors, Inc. and related entities (collectively, “Federated”), and various Federated sponsored mutual funds (“Federated Funds”) have been named as defendants in several class action lawsuits now pending in the United States District Court for the District of Maryland. The lawsuits were purportedly filed on behalf of people who purchased, owned and/or redeemed shares of certain Federated Funds during specified periods beginning November 1, 1998. The suits are generally similar in alleging that Federated engaged in illegal and improper trading practices including market timing and late trading in concert with certain institutional traders, which allegedly caused financial injury to the mutual fund shareholders. Federated without admitting the validity of any claim has reached a preliminary settlement with the Plaintiffs in these cases. Any settlement would have to be approved by the Court. Federated entities have also been named as defendants in several additional lawsuits that are now pending in the United States District Court for the Western District of Pennsylvania. These lawsuits have been consolidated into a single action alleging excessive advisory fees involving one of the Federated Funds. The Board of the Federated Funds retained the law firm of Dickstein Shapiro LLP to represent the Federated Funds in these lawsuits. Federated and the Federated Funds, and their respective counsel, have been defending this litigation, and none of the Federated Funds remains a defendant in any of the lawsuits. Additional lawsuits based upon similar allegations may be filed in the future. The potential impact of these lawsuits, all of which seek monetary damages, attorneys' fees and expenses, and future potential similar suits is uncertain. Although we do not believe that these lawsuits will have a material adverse effect on the Federated Funds, there can be no assurance that these suits, ongoing adverse publicity and/or other developments resulting from the allegations in these matters will not result in increased redemptions, or reduced sales, of shares of the Federated Funds or other adverse consequences for the Federated Funds.
Management has evaluated subsequent events through the date the financial statements were issued, and determined that no events have occurred that require additional disclosure.
12. Federal Tax Information (unaudited)
For the fiscal year ended August 31, 2010, 100.0% of distributions from net investment income is exempt from federal income tax, other than the federal AMT.
Annual Shareholder ReportReport of Independent Registered Public Accounting Firm
TO THE BOARD OF TRUSTEES OF federated municipal securities income trust AND SHAREHOLDERS OF federated New york Municipal income fund:
We have audited the accompanying statement of assets and liabilities, including the portfolio of investments, of Federated New York Municipal Income Fund (the “Fund”), a portfolio of Federated Municipal Securities Income Trust, as of August 31, 2010, and the related statement of operations for the year then ended, the statements of changes in net assets for each of the years in the two-year period then ended, and the financial highlights for each of the years in the five-year period then ended. These financial statements and financial highlights are the responsibility of the Fund's management. Our responsibility is to express an opinion on these financial statements and financial highlights based on our audits.
We conducted our audits in accordance with the standards of the Public Company Accounting Oversight Board (United States). Those standards require that we plan and perform the audit to obtain reasonable assurance about whether the financial statements and financial highlights are free of material misstatement. An audit includes examining, on a test basis, evidence supporting the amounts and disclosures in the financial statements. Our procedures included confirmation of securities owned as of August 31, 2010 by correspondence with the custodian and brokers or by other appropriate auditing procedures. An audit also includes assessing the accounting principles used and significant estimates made by management, as well as evaluating the overall financial statement presentation. We believe that our audits provide a reasonable basis for our opinion.
In our opinion, the financial statements and financial highlights referred to above present fairly, in all material respects, the financial position of Federated New York Municipal Income Fund as of August 31, 2010, and the results of its operations for the year then ended, the changes in its net assets for each of the years in the two-year period then ended, and the financial highlights for each of the years in the five-year period then ended, in conformity with U.S. generally accepted accounting principles.

Boston, Massachusetts
October 25, 2010
Board of Trustees and Trust Officers
The Board of Trustees is responsible for managing the Trust's business affairs and for exercising all the Trust's powers except those reserved for the shareholders. The following tables give information about each Trustee and the senior officers of the Fund. Where required, the tables separately list Trustees who are “interested persons” of the Fund (i.e., “Interested” Trustees) and those who are not (i.e., “Independent” Trustees). Unless otherwise noted, the address of each person listed is Federated Investors Tower, 1001 Liberty Avenue, Pittsburgh, PA 15222. The address of all Independent Trustees listed is 4000 Ericsson Drive, Warrendale, PA 15086-7561; Attention: Mutual Fund Board. As of December 31, 2009, the Trust comprised five portfolio(s), and the Federated Fund Family consisted of 43 investment companies (comprising 145 portfolios). Unless otherwise noted, each Officer is elected annually. Unless otherwise noted, each Trustee oversees all portfolios in the Federated Fund Family and serves for an indefinite term. The Fund's Statement of Additional Information includes additional information about Trust Trustees and is available, without charge and upon request, by calling 1-800-341-7400.
Interested TRUSTEES Background
| Name Birth Date Positions Held with Trust Date Service Began | Principal Occupation(s) for Past Five Years, Other Directorships Held and Previous Position(s) |
| John F. Donahue* Birth Date: July 28, 1924 Trustee Began serving: August 1990 | Principal Occupations: Director or Trustee of the Federated Fund Family; Chairman and Director, Federated Investors, Inc.; Chairman of the Federated Fund Family's Executive Committee. Previous Positions: Chairman of the Federated Fund Family; Trustee, Federated Investment Management Company; Chairman and Director, Federated Investment Counseling. |
| J. Christopher Donahue* Birth Date: April 11, 1949 PRESIDENT AND Trustee Began serving: August 1990 | Principal Occupations: Principal Executive Officer and President of the Federated Fund Family; Director or Trustee of some of the Funds in the Federated Fund Family; President, Chief Executive Officer and Director, Federated Investors, Inc.; Chairman and Trustee, Federated Investment Management Company; Trustee, Federated Investment Counseling; Chairman and Director, Federated Global Investment Management Corp.; Chairman, Federated Equity Management Company of Pennsylvania and Passport Research, Ltd. (investment advisory subsidiary of Federated); Trustee, Federated Shareholder Services Company; Director, Federated Services Company. Previous Positions: President, Federated Investment Counseling; President and Chief Executive Officer, Federated Investment Management Company, Federated Global Investment Management Corp. and Passport Research, Ltd. |
| * | Family relationships and reasons for “interested” status: John F. Donahue is the father of J. Christopher Donahue; both are “interested” due to their beneficial ownership of shares of Federated Investors, Inc. and the positions they hold with Federated and its subsidiaries. |
INDEPENDENT TRUSTEES Background
| Name Birth Date Positions Held with Trust Date Service Began | Principal Occupation(s) for Past Five Years, Other Directorships Held, Previous Position(s) and Qualifications |
| John T. Conroy, Jr., Ph.D. Birth Date: June 23, 1937 Trustee Began serving: August 1991 | Principal Occupations: Director or Trustee of the Federated Fund Family; Chairman of the Board, Investment Properties Corporation; Partner or Trustee in private real estate ventures in Southwest Florida; Assistant Professor in Theology, Blessed Edmund Rice School for Pastoral Ministry. Previous Positions: President, Investment Properties Corporation; Senior Vice President, John R. Wood and Associates, Inc., Realtors; President, Naples Property Management, Inc. and Northgate Village Development Corporation. Qualifications: Business management and director experience. |
| Nicholas P. Constantakis, CPA Birth Date: September 3, 1939 Trustee Began serving: February 1998 | Principal Occupation: Director or Trustee of the Federated Fund Family. Other Directorship Held: Director and Chairman of the Audit Committee, Michael Baker Corporation (architecture, engineering and construction services). Previous Position: Partner, Andersen Worldwide SC. Qualifications: Public accounting and director experience. |
| John F. Cunningham Birth Date: March 5, 1943 Trustee Began serving: July 1999 | Principal Occupation: Director or Trustee of the Federated Fund Family. Other Directorships Held: Chairman, President and Chief Executive Officer, Cunningham & Co., Inc. (strategic business consulting); Trustee Associate, Boston College. Previous Positions: Director, Redgate Communications and EMC Corporation (computer storage systems); Chairman of the Board and Chief Executive Officer, Computer Consoles, Inc.; President and Chief Operating Officer, Wang Laboratories; Director, First National Bank of Boston; Director, Apollo Computer, Inc. Qualifications: Business management and director experience. |
| Maureen Lally-Green Birth Date: July 5, 1949 Trustee Began serving: August 2009 | Principal Occupations: Director or Trustee of the Federated Fund Family; Director, Office of Church Relations, Diocese of Pittsburgh; Adjunct Professor of Law, Duquesne University School of Law. Other Directorships Held: Director, Auberle; Trustee, St. Francis University; Director, Ireland Institute of Pittsburgh; Director, UPMC Mercy Hospital; Regent, St. Vincent Seminary; Director, Epilepsy Foundation of Western and Central Pennsylvania; Director, Saint Thomas More Society, Allegheny County; Director, Carlow University. Previous Position: Pennsylvania Superior Court Judge. Qualifications: Legal and director experience. |
| Name Birth Date Positions Held with Trust Date Service Began | Principal Occupation(s) for Past Five Years, Other Directorships Held, Previous Position(s) and Qualifications |
| Peter E. Madden Birth Date: March 16, 1942 Trustee Began serving: August 1991 | Principal Occupation: Director or Trustee, and Chairman of the Board of Directors or Trustees, of the Federated Fund Family. Other Directorship Held: Board of Overseers, Babson College. Previous Positions: Representative, Commonwealth of Massachusetts General Court; President, Chief Operating Officer and Director, State Street Bank and Trust Company and State Street Corporation (retired); Director, VISA USA and VISA International; Chairman and Director, Massachusetts Bankers Association; Director, Depository Trust Corporation; Director, The Boston Stock Exchange. Qualifications: Business management, mutual fund services and director experience. |
| Charles F. Mansfield, Jr. Birth Date: April 10, 1945 Trustee Began serving: January 1999 | Principal Occupations: Director or Trustee and Chairman of the Audit Committee of the Federated Fund Family; Management Consultant. Previous Positions: Chief Executive Officer, PBTC International Bank; Partner, Arthur Young & Company (now Ernst & Young LLP); Chief Financial Officer of Retail Banking Sector, Chase Manhattan Bank; Senior Vice President, HSBC Bank USA (formerly, Marine Midland Bank); Vice President, Citibank; Assistant Professor of Banking and Finance, Frank G. Zarb School of Business, Hofstra University; Executive Vice President, DVC Group, Inc. (marketing, communications and technology). Qualifications: Banking, business management, public accounting and director experience. |
| R. James Nicholson Birth Date: February 4, 1938 Trustee Began serving: January 2008 | Principal Occupations: Director or Trustee of the Federated Fund Family; Senior Counsel, Brownstein Hyatt Farber Schrek, P.C.; Former Secretary of the U.S. Dept. of Veterans Affairs; Former U.S. Ambassador to the Holy See; Former Chairman of the Republican National Committee. Other Directorships Held: Director, Horatio Alger Association; Director, The Daniels Fund. Previous Positions: Colonel, U.S. Army Reserve; Partner, Calkins, Kramer, Grimshaw and Harring, P.C.; General Counsel, Colorado Association of Housing and Building; Chairman and CEO, Nicholson Enterprises, Inc. (real estate holding company); Chairman and CEO, Renaissance Homes of Colorado. Qualifications: Legal, government, business management and mutual fund director experience. |
| Name Birth Date Positions Held with Trust Date Service Began | Principal Occupation(s) for Past Five Years, Other Directorships Held, Previous Position(s) and Qualifications |
| Thomas M. O'Neill Birth Date: June 14, 1951 Trustee Began serving: October 2006 | Principal Occupations: Director or Trustee of the Federated Fund Family; Sole Proprietor, Navigator Management Company (investment and strategic consulting). Other Directorships Held: Board of Overseers, Children's Hospital of Boston; Visiting Committee on Athletics, Harvard College. Previous Positions: Chief Executive Officer and President, Managing Director and Chief Investment Officer, Fleet Investment Advisors; President and Chief Executive Officer, Aeltus Investment Management, Inc.; General Partner, Hellman, Jordan Management Co., Boston, MA; Chief Investment Officer, The Putnam Companies, Boston, MA; Credit Analyst and Lending Officer, Fleet Bank; Director and Consultant, EZE Castle Software (investment order management software); Director, Midway Pacific (lumber). Qualifications: Business management, mutual fund, director and investment experience. |
| John S. Walsh Birth Date: November 28, 1957 Trustee Began serving: July 1999 | Principal Occupations: Director or Trustee of the Federated Fund Family; President and Director, Heat Wagon, Inc. (manufacturer of construction temporary heaters); President and Director, Manufacturers Products, Inc. (distributor of portable construction heaters); President, Portable Heater Parts, a division of Manufacturers Products, Inc. Previous Position: Vice President, Walsh & Kelly, Inc. Qualifications: Business management and director experience. |
| James F. Will Birth Date: October 12, 1938 Trustee Began serving: April 2006 | Principal Occupations: Director or Trustee of the Federated Fund Family; formerly, Vice Chancellor and President, Saint Vincent College. Other Directorships Held: Trustee, Saint Vincent College; Alleghany Corporation. Previous Positions: Chairman, President and Chief Executive Officer, Armco, Inc.; President and Chief Executive Officer, Cyclops Industries; President and Chief Operating Officer, Kaiser Steel Corporation. Qualifications: Business management, education and director experience. |
| Name Birth Date Positions Held with Trust Date Service Began | Principal Occupation(s) for Past Five Years and Previous Position(s) |
| John W. McGonigle Birth Date: October 26, 1938 EXECUTIVE VICE PRESIDENT AND SECRETARY Began serving: August 1990 | Principal Occupations: Executive Vice President and Secretary of the Federated Fund Family; Vice Chairman, Executive Vice President, Secretary and Director, Federated Investors, Inc. Previous Positions: Trustee, Federated Investment Management Company and Federated Investment Counseling; Director, Federated Global Investment Management Corp., Federated Services Company and Federated Securities Corp. |
| Richard A. Novak Birth Date: December 25, 1963 TREASURER Began serving: January 2006 | Principal Occupations: Principal Financial Officer and Treasurer of the Federated Fund Family; Senior Vice President, Federated Administrative Services; Financial and Operations Principal for Federated Securities Corp., Edgewood Services, Inc. and Southpointe Distribution Services, Inc. Previous Positions: Controller of Federated Investors, Inc.; Vice President, Finance of Federated Services Company; held various financial management positions within The Mercy Hospital of Pittsburgh; Auditor, Arthur Andersen & Co. |
| Richard B. Fisher Birth Date: May 17, 1923 VICE CHAIRMAN Began serving: August 2002 | Principal Occupations: Vice Chairman or Vice President of some of the Funds in the Federated Fund Family; Vice Chairman, Federated Investors, Inc.; Chairman, Federated Securities Corp. Previous Positions: President and Director or Trustee of some of the Funds in the Federated Fund Family; Executive Vice President, Federated Investors, Inc.; Director and Chief Executive Officer, Federated Securities Corp. |
| Brian P. Bouda Birth Date: February 28, 1947 SENIOR VICE PRESIDENT AND CHIEF COMPLIANCE OFFICER Began serving: August 2004 | Principal Occupations: Senior Vice President and Chief Compliance Officer of the Federated Fund Family; Vice President and Chief Compliance Officer of Federated Investors, Inc. and Chief Compliance Officer of its subsidiaries. Mr. Bouda joined Federated in 1999 and is a member of the American Bar Association and the State Bar Association of Wisconsin. |
| Mary Jo Ochson Birth Date: September 12, 1953 CHIEF INVESTMENT OFFICER Began serving: May 2004 | Principal Occupations: Mary Jo Ochson was named Chief Investment Officer of tax-exempt, fixed-income products in 2004 and Chief Investment Officer of Tax-Free Money Markets in 2010 and is a Vice President of the Trust . She joined Federated in 1982 and has been a Senior Portfolio Manager and a Senior Vice President of the Fund's Adviser since 1996. Ms. Ochson has received the Chartered Financial Analyst designation and holds an M.B.A. in Finance from the University of Pittsburgh. |
| J. Scott Albrecht Birth Date: June 1, 1960 VICE PRESIDENT Began serving: November 1998 | Principal Occupations: J. Scott Albrecht has been the Fund's portfolio manager since March 1995. He is Vice President of the Trust. Mr. Albrecht joined Federated in 1989. He became a Senior Vice President of the Fund's Adviser in January 2005 and served as a Vice President of the Fund's Adviser from 1994 through 2004. He has been a Senior Portfolio Manager since 1997 and was a Portfolio Manager from 1994 to 1996. Mr. Albrecht has received the Chartered Financial Analyst designation and holds an M.S. in Public Management from Carnegie Mellon University. |
Evaluation and Approval of Advisory Contract - May 2010
Federated New York Municipal Income Fund (the “Fund”)
The Fund's Board reviewed the Fund's investment advisory contract at meetings held in May 2010. The Board's decision regarding the contract reflects the exercise of its business judgment on whether to continue the existing arrangements.
In this connection, the Federated funds' Board had previously appointed a Senior Officer, whose duties include specified responsibilities relating to the process by which advisory fees are to be charged to a Federated fund. The Senior Officer has the authority to retain consultants, experts, or staff as may be reasonably necessary to assist in the performance of his duties, reports directly to the Board, and may be terminated only with the approval of a majority of the independent members of the Board. The Senior Officer prepared and furnished to the Board an independent, written evaluation that covered topics discussed below. The Board considered that evaluation, along with other information, in deciding to approve the advisory contract.
During its review of the contract, the Board considered compensation and benefits received by the Adviser. This included the fees received for services provided to the Fund by other entities in the Federated organization and research services (if any) received by the Adviser from brokers that execute Federated fund trades, as well as advisory fees. The Board is also familiar with and considered judicial decisions concerning allegedly excessive investment advisory fees, which have indicated that the following factors may be relevant to an Adviser's fiduciary duty with respect to its receipt of compensation from a fund: the nature and quality of the services provided by the Adviser, including the performance of the fund; the Adviser's cost of providing the services; the extent to which the Adviser may realize “economies of scale” as a fund grows larger; any indirect benefits that may accrue to the Adviser and its affiliates as a result of the Adviser's relationship with a fund; performance and expenses of comparable funds; and the extent to which the independent Board members are fully informed about all facts the Board deems relevant bearing on the Adviser's services and fees. The Board further considered management fees (including any components thereof) charged to institutional and other clients of the Adviser for what might be viewed as like services, and the cost to the Adviser and its affiliates of supplying services pursuant to the management fee agreements, excluding any intra-corporate profit and profit margins of the Adviser and its affiliates for supplying such services. The Board was aware of these factors and was guided by them in its review of the Fund's advisory contract to the extent it considered them to be appropriate and relevant, as discussed further below.
Annual Shareholder ReportThe Senior Officer reviewed reports compiled by Federated, using data supplied by independent fund ranking organizations, regarding the performance of, and fees charged by, other mutual funds, noting his view that comparisons to fund peer groups are relevant in judging the reasonableness of proposed fees.
For the periods covered by the report, the Fund's performance for the one-year period was above the median of the relevant peer group, and the Fund's performance fell below the median of the relevant peer group for the three-year and five-year periods. The Board discussed the Fund's performance with the Adviser and recognized the efforts being undertaken by the Adviser. The Board will continue to monitor these efforts and the performance of the Fund.
The Board also received financial information about Federated, including reports on the compensation and benefits Federated derived from its relationships with the Federated funds. These reports covered not only the fees under the advisory contracts, but also fees received by Federated's subsidiaries for providing other services to the Federated funds under separate contracts (e.g., for serving as the Federated funds' administrator). The reports also discussed any indirect benefit Federated may derive from its receipt of research services from brokers who execute Federated fund trades. In addition, the Board considered the fact that, in order for a fund to be competitive in the marketplace, Federated and its affiliates frequently waived fees and/or Annual Shareholder ReportFederated furnished reports, requested by the Senior Officer, that reported revenues on a fund-by-fund basis and made estimates of the allocation of expenses on a fund-by-fund basis, using allocation methodologies specified by the Senior Officer. The Senior Officer noted that, although they may apply consistent allocation processes, the inherent difficulties in allocating costs (and the unavoidable arbitrary aspects of that exercise) and the lack of consensus on how to allocate those costs may render such allocation reports unreliable. The allocation reports were considered in the analysis by the Board but were determined to be of limited use.
The Board and the Senior Officer also reviewed a report compiled by Federated comparing profitability information for Federated to other publicly held fund management companies. In this regard, the Senior Officer noted the limited availability of such information, but nonetheless concluded that Federated's profit margins did not appear to be excessive and the Board agreed.
The Senior Officer's evaluation also discussed the notion of possible realization of “economies of scale” as a fund grows larger. The Board considered in this regard that the Adviser has made significant and long-term investments in areas that support all of the Federated funds, such as personnel and processes for the portfolio management, compliance, and risk management functions; and systems technology; and that the benefits of these efforts (as well as any economies, should they exist) were likely to be enjoyed by the fund complex as a whole. Finally, the Board also noted the absence of any applicable regulatory or industry guidelines on this subject, which (as discussed in the Senior Officer's evaluation) is compounded by the lack of any common industry practice or general pattern with respect to structuring fund advisory fees with “breakpoints” that serve to reduce the fee as the fund attains a certain size. The Senior Officer did not recommend institution of breakpoints in pricing Federated's fund advisory services at this time.
It was noted in the materials for the Board meeting that for the period covered by the report, the Fund's investment advisory fee was waived in its entirety. The Board reviewed the contractual fee rate and other expenses of the Fund with the Adviser and was satisfied that the overall expense structure of the Fund remained competitive.
The Senior Officer's evaluation noted his belief that the information and observations contained in his evaluation supported a finding that the proposed management fees are reasonable, and that Federated appeared to provide appropriate administrative services to the Fund for the fees paid. Under these Annual Shareholder ReportIn its decision to continue an existing investment advisory contract, the Board was mindful of the potential disruptions of the Fund's operations and various risks, uncertainties and other effects that could occur as a result of a decision to terminate or not renew an advisory contract. In particular, the Board recognized that many shareholders have invested in the Fund on the strength of the Adviser's industry standing and reputation and with the expectation that the Adviser will have a continuing role in providing advisory services to the Fund. Thus, the Board's approval of the advisory contract reflected the fact that it is the shareholders who have effectively selected the Adviser by virtue of having invested in the Fund.
The Board based its decision to approve the advisory contract on the totality of the circumstances and relevant factors and with a view to past and future long-term considerations. Not all of the factors and considerations identified above were necessarily relevant to the Fund, nor did the Board consider any one of them to be determinative. With respect to the factors that were relevant, the Board's decision to approve the contract reflects its determination that Federated's performance and actions provided a satisfactory basis to support the decision to continue the existing arrangements.
Annual Shareholder ReportVoting Proxies on Fund Portfolio Securities
A description of the policies and procedures that the Fund uses to determine how to vote proxies, if any, relating to securities held in the Fund's portfolio is available, without charge and upon request, by calling 1-800-341-7400. A report on “Form N-PX” of how the Fund voted any such proxies during the most recent 12-month period ended June 30 is available from Federated's website at FederatedInvestors.com. To access this information from the “Products” section of the website, click on the “Prospectuses and Regulatory Reports” link under “Related Information,” then select the appropriate link opposite the name of the Fund; or select the name of the Fund and from the Fund's page, click on the “Prospectuses and Regulatory Reports” link. Form N-PX filings are also available at the SEC's website at www.sec.gov.
Quarterly Portfolio Schedule
The Fund files with the SEC a complete schedule of its portfolio holdings, as of the close of the first and third quarters of its fiscal year, on “Form N-Q.” These filings are available on the SEC's website at www.sec.gov and may be reviewed and copied at the SEC's Public Reference Room in Washington, DC. (Call 1-800-SEC-0330 for information on the operation of the Public Reference Room.) You may also access this information from the “Products” section of Federated's website at FederatedInvestors.com by clicking on “Portfolio Holdings” under “Related Information,” then selecting the appropriate link opposite the name of the Fund; or select the name of the Fund and from the Fund's page, click on the “Portfolio Holdings” link.
Annual Shareholder ReportMutual funds are not bank deposits or obligations, are not guaranteed by any bank and are not insured or guaranteed by the U.S. government, the Federal Deposit Insurance Corporation, the Federal Reserve Board or any other government agency. Investment in mutual funds involves investment risk, including the possible loss of principal.
This Report is authorized for distribution to prospective investors only when preceded or accompanied by the Trust's Prospectus, which contains facts concerning its objective and policies, management fees, expenses and other information.

Federated New York Municipal Income Fund
Federated Investors Funds
4000 Ericsson Drive
Warrendale, PA 15086-7561
Contact us at FederatedInvestors.com
or call 1-800-341-7400.
Federated Securities Corp., Distributor
Cusip 313923401
Cusip 313923880
28992 (10/10)
Federated is a registered mark of Federated Investors, Inc.
2010 © Federated Investors, Inc.
Federated Ohio Municipal Income Fund
Established 1990
A Portfolio of Federated Municipal Securities Income Trust
ANNUAL SHAREHOLDER REPORT
August 31, 2010
Class A Shares
Class F Shares
FINANCIAL HIGHLIGHTS
SHAREHOLDER EXPENSE EXAMPLE
MANAGEMENT'S DISCUSSION OF FUND PERFORMANCE
PORTFOLIO OF INVESTMENTS SUMMARY TABLE
PORTFOLIO OF INVESTMENTS
STATEMENT OF ASSETS AND LIABILITIES
STATEMENT OF OPERATIONS
STATEMENT OF CHANGES IN NET ASSETS
NOTES TO FINANCIAL STATEMENTS
REPORT OF INDEPENDENT REGISTERED PUBLIC ACCOUNTING FIRM
BOARD OF TRUSTEES AND TRUST OFFICERS
EVALUATION AND APPROVAL OF ADVISORY CONTRACT
VOTING PROXIES ON FUND PORTFOLIO SECURITIES
QUARTERLY PORTFOLIO SCHEDULE
Financial Highlights - Class A Shares
(For a Share Outstanding Throughout Each Period)
| Year Ended 8/31/2010 | PeriodEnded 8/31/20091 |
| Net Asset Value, Beginning of Period | $10.68 | $10.22 |
| Income From Investment Operations: |
| Net investment income | 0.42 | 0.37 |
| Net realized and unrealized gain on investments | 0.45 | 0.44 |
| TOTAL FROM INVESTMENT OPERATIONS | 0.87 | 0.81 |
| Less Distributions: |
| Distributions from net investment income | (0.41) | (0.35) |
| Net Asset Value, End of Period | $11.14 | $10.68 |
| Total Return2 | 8.34% | 8.11% |
| Ratios to Average Net Assets: |
| Net expenses | 0.75% | 0.75%3,4 |
| Net investment income | 3.84% | 4.09%4 |
| Expense waiver/reimbursement5 | 0.16% | 0.17%4 |
| Supplemental Data: |
| Net assets, end of period (000 omitted) | $57,338 | $61,141 |
| Portfolio turnover | 20% | 13%6 |
| 1 | Reflects operations for the period from November 18, 2008 (date of initial investment) to August 31, 2009. |
| 2 | Based on net asset value, which does not reflect the sales charge, redemption fee or contingent deferred sales charge, if applicable. |
| 3 | The net expense ratio is calculated without reduction for expense offset arrangements. The net expense ratio for the year ended August 31, 2009, is 0.75% after taking into account this expense reduction. |
| 4 | Computed on an annualized basis. |
| 5 | This expense decrease is reflected in both the net expense and net investment income ratios shown above. |
| 6 | Portfolio turnover is calculated at the Fund level. Percentage indicated was calculated for the year ended August 31, 2009. |
See Notes which are an integral part of the Financial Statements
Annual Shareholder ReportFinancial Highlights - Class F Shares
(For a Share Outstanding Throughout Each Period)
| Year Ended August 31 | 2010 | 2009 | 2008 | 2007 | 2006 |
| Net Asset Value, Beginning of Period | $10.68 | $10.92 | $11.15 | $11.47 | $11.65 |
| Income From Investment Operations: |
| Net investment income | 0.40 | 0.43 | 0.46 | 0.46 | 0.48 |
| Net realized and unrealized gain (loss) on investments, futures contracts and swap contracts | 0.46 | (0.25) | (0.23) | (0.32) | (0.18) |
| TOTAL FROM INVESTMENT OPERATIONS | 0.86 | 0.18 | 0.23 | 0.14 | 0.30 |
| Less Distributions: |
| Distributions from net investment income | (0.40) | (0.42) | (0.46) | (0.46) | (0.48) |
| Net Asset Value, End of Period | $11.14 | $10.68 | $10.92 | $11.15 | $11.47 |
| Total Return1 | 8.18% | 1.81% | 2.06% | 1.22% | 2.63% |
| Ratios to Average Net Assets: |
| Net expenses | 0.90% | 0.90%2 | 0.90%2 | 0.92%3 | 0.90% |
| Net investment income | 3.70% | 4.06% | 4.15% | 4.02% | 4.11% |
| Expense waiver/reimbursement4 | 0.41% | 0.44% | 0.45% | 0.43% | 0.45% |
| Supplemental Data: |
| Net assets, end of period (000 omitted) | $135,096 | $124,090 | $117,080 | $120,409 | $118,063 |
| Portfolio turnover | 20% | 13% | 13% | 14% | 32% |
| 1 | Based on net asset value, which does not reflect the sales charge, redemption fee or contingent deferred sales charge, if applicable. |
| 2 | The net expense ratio is calculated without reduction for expense offset arrangements. The net expense ratios are 0.90% and 0.90% after taking into account these expense reductions for the years ended August 31, 2009 and 2008, respectively. |
| 3 | Includes 0.02% of interest and trust expenses related to the Fund's participation in certain inverse floater structures. |
| 4 | This expense decrease is reflected in both the net expense and net investment income ratios shown above. |
See Notes which are an integral part of the Financial Statements
Annual Shareholder ReportShareholder Expense Example (unaudited)
As a shareholder of the Fund, you incur two types of costs: (1) transaction costs, including sales charges (loads) on purchase or redemption payments; and (2) ongoing costs, including management fees and to the extent applicable, distribution (12b-1) fees and/or shareholder services fees and other Fund expenses. This Example is intended to help you to understand your ongoing costs (in dollars) of investing in the Fund and to compare these costs with the ongoing costs of investing in other mutual funds. It is based on an investment of $1,000 invested at the beginning of the period and held for the entire period from March 1, 2010 to August 31, 2010.
The first section of the table below provides information about actual account values and actual expenses. You may use the information in this section, together with the amount you invested, to estimate the expenses that you incurred over the period. Simply divide your account value by $1,000 (for example, an $8,600 account value divided by $1,000 = 8.6), then multiply the result by the number in the first section under the heading entitled “Expenses Paid During Period” to estimate the expenses attributable to your investment during this period.
HYPOTHETICAL EXAMPLE FOR COMPARISON PURPOSES
The second section of the table below provides information about hypothetical account values and hypothetical expenses based on the Fund's actual expense ratio and an assumed rate of return of 5% per year before expenses, which is not the Fund's actual return. Thus, you should not use the hypothetical account values and expenses to estimate the actual ending account balance or your expenses for the period. Rather, these figures are required to be provided to enable you to compare the ongoing costs of investing in the Fund with other funds. To do so, compare this 5% hypothetical example with the 5% hypothetical examples that appear in the shareholder reports of the other funds.
Annual Shareholder Report| Beginning Account Value 3/1/2010 | Ending Account Value 8/31/2010 | Expenses Paid During Period1 |
| Actual: |
| Class A Shares | $1,000 | $1,045.50 | $3.87 |
| Class F Shares | $1,000 | $1,044.70 | $4.64 |
| Hypothetical (assuming a 5% return before expenses): |
| Class A Shares | $1,000 | $1,021.42 | $3.82 |
| Class F Shares | $1,000 | $1,020.67 | $4.58 |
| 1 | Expenses are equal to the Fund's annualized net expense ratios, multiplied by the average account value over the period, multiplied by 184/365 (to reflect the one-half-year period). The annualized net expense ratios are as follows: |
| Class A Shares | 0.75% |
| Class F Shares | 0.90% |
Performance data quoted represents past performance which is no guarantee of future results. Investment return and principal value will fluctuate so that an investor's shares, when redeemed, may be worth more or less than their original cost. Mutual fund performance changes over time and current performance may be lower or higher than what is stated. For current to the most recent month-end performance and after-tax returns, visit FederatedInvestors.com or call 1-800-341-7400.
Management's Discussion of Fund
Performance (unaudited)
The Fund's total return, based on net asset value, for the 12-month reporting period ended August 31, 2010, was 8.34% for Class A Shares and 8.18% for Class F Shares. The total return of the S&P/Investortools Municipal Bond Ohio Index (OH Index),1 was 8.97%, during the same period. The Fund's total return for the most recently completed fiscal year end reflected actual cash flows, transaction costs and other expenses, which were not reflected in the total return of the OH Index.
During the reporting period, the most significant factors affecting the Fund's performance relative to the OH Index were: (a) the effective duration of its portfolio (which indicates the portfolio's sensitivity to changes in interest rates);2,3 (b) the allocation of the Fund's portfolio among securities of similar issuers (referred to as sectors); and (c) the credit ratings of portfolio securities (which indicates the risk that securities will default).
| 1 | The Fund's investment adviser has elected to change the Fund's broad-based securities market index to the OH Index from the Barclays Capital Ohio Municipal Bond Index (BCOHMB). The OH Index is more representative of the securities in which the Fund invests. The OH Index consists of bonds in the S&P/Investortools Municipal Bond Index (Main Index) that have been issued by the state of Ohio or local governments or state or local government entities within Ohio. The Main Index is a broad, comprehensive, market value-weighted index composed of approximately 55,000 bond issues that are exempt from U.S. federal income taxes or subject to the alternative minimum tax (AMT). Eligibility criteria for inclusion in the Main Index include, but are not limited to: the bond issuer must be a state (including the Commonwealth of Puerto Rico and U.S. territories) or a local government or agency where interest on the bond is exempt from U.S. federal income taxes or subject to the AMT; the bond must be held by a mutual fund for which Standard & Poor's Securities Evaluations, Inc. provides prices; it must be denominated in U.S. dollars and have a minimum par amount of $2 million; and the bond must have a minimum term to maturity and/or call date greater than or equal to one calendar month. The Main Index is rebalanced monthly. The total return of the BCOHMB during the 12-month reporting period was 8.89%. The BCOHMB is an unmanaged market value-weighted index for the long-term, tax-exempt bond market comprising investment-grade, tax-exempt and fixed-rate bonds issued in the state of Ohio. To be included in the index, bonds must have a minimum credit rating of Baa, an outstanding par value of at least $7 million and be issued as part of a transaction of at least $75 million. The bonds must be fixed-rate, have an issue date after December 31, 1990, and must be at least one year from their maturity date, as well as have been issued in the particular state. The BCOHMB includes both zero coupon bonds and bonds subject to the alternative minimum tax. Neither the OH Index nor the BCOHMB are not adjusted to reflect sales charges, expenses and other fees that the Securities and Exchange Commission (SEC) requires to be reflected in the Fund's performance. It is not possible to invest directly in an index. |
| 2 | Duration is a measure of a security's price sensitivity to changes in interest rates. Securities with longer durations are more sensitive to changes in interest rates than securities with shorter durations. For purposes of this Management's Discussion of Fund Performance, duration is determined using a third-party analytical system. |
| 3 | Bond prices are sensitive to changes in interest rates and a rise in interest rates can cause a decline in their prices. |
The following discussion focuses on the performance of the Fund's Class A Shares. The 8.34% total return of the Class A Shares for the reporting period consisted of 4.03% of tax-exempt dividends and reinvestments and 4.31% of price appreciation in the net asset value of the shares.4
During the 12-month reporting period, the pace of recovery in output and employment slowed with tight credit, modest income growth and lower housing wealth being major contributors to the economic environment. Yields on nominal Treasury coupon securities fell noticeably during the period, and Treasury auctions were generally well received. The pace of economic recovery was more modest in the near term than had been anticipated and inflation remained subdued. To help support economic recovery the Federal Reserve Board (the ”Fed”) kept constant its holdings of securities at the current levels by reinvesting principal payments from agency debt and mortgage-backed securities in longer-term Treasury securities, and rolling over its holdings of Treasury debt as it matured. The Fed maintained the target range for the federal funds rate between 0.00% and 0.025% during the entire period.
The state of Ohio has a history of strong financial management that, spanning several decades, has been tested by economic underperformance relative to the rest of the country. The state has addressed budget shortfalls promptly and has made an effort to build financial reserves. However, Ohio's economy remained weak due to its heavy reliance on the manufacturing industry and relied on federal stimulus funding and other non-recurring measures to balance its fiscal operations. The deterioration in manufacturing employment impacted the state's already weak demographics as unemployed workers migrated to other states. Ohio maintained a moderate debt burden relative to other states but had significant erosion in the funded portion of its public employee's pension liabilities.
The combined fiscal and monetary stimuli drove an impressive rebound in the valuation of risky assets. Tax-Exempt municipal credit spreads declined significantly as the spread between 20-year BBB-rated and AAA-rated tax-exempt municipal bonds declined by 57 basis points during the reporting period. This extensive normalization of the tax-exempt municipal market from the market disruptions in 2008, resulted from several positive technical factors. Significant federal financial support programs for state governments were put in place to stimulate local economies and boost confidence. The Build America Bonds program reduced the supply of tax-exempt municipal bonds issued, helping to create a shortage of tax-exempt bonds available in the market. Ongoing strong demand for yield from investors as money market rates remained very low, the expectations of higher marginal tax rates and strong mutual fund flows led to solid demand for tax-exempt debt. These factors helped to create the supply and demand imbalance that has enabled the tax-exempt municipal market to recover and provide positive returns during the period.
| 4 | Income may be subject to the alternative minimum tax for individuals and corporations (AMT). |
The credit fundamentals of the tax-exempt municipal bond market have shown continued deterioration in such credit factors as pension funding requirements, real estate values and revenue growth.
As determined at the end of the 12-month reporting period, the Fund's dollar-weighted average duration was 5.60 years. Duration management continued to be a significant component of the Fund's investment strategy. The shorter a fund's duration relative to an index, the less its net asset value will react as interest rates change. The Fund's duration was consistently shorter than the OH Index during the reporting period. Tax-exempt municipal bond yields declined significantly during the period as the market stabilized and then recovered from a near crisis environment to one of improved liquidity, a near zero federal funds target rate and increased investment activity. As a result, the Fund's duration underweight (85%) relative to the OH Index detracted from Fund performance.
During the 12-month reporting period, relative to the OH Index the Fund maintained a higher portfolio allocation to securities issued by single- and multi-family housing issuers, public power authorities and life care providers. These allocations helped the Fund's performance due to the narrowing of credit spreads within these sectors. The Fund also had a lesser allocation, compared to the OH Index, to tobacco-related debt which underperformed during the period and had a large positive contribution to performance. The Fund maintained an underweight in hospitals relative to the OH Index. This sector outperformed the OH Index during the period and detracted from performance. The Fund gained positive excess return from its sector selection during the period.
Risk-aversion by investors subsided as the financial markets stabilized and a preference for yield resulted in the outperformance of bonds rated A and BBB (and unrated bonds of similar quality)5 relative to bonds rated in the higher rating categories (or unrated bonds of similar quality). With the decrease in credit spreads during the period and the narrowing of credit spreads to a greater extent for A and BBB-rated (or comparable quality) debt, the Fund's overweight, relative to the OH Index, in A and BBB-rated debt during the reporting period helped the Fund's performance as the yield on A and BBB-rated debt decreased to a greater extent than for other investment-grade securities.
| 5 | Credit ratings pertain only to the securities in the portfolio and do not protect fund shares against market risk. Investment-grade securities are securities that are rated at least “BBB” or unrated securities of a comparable quality. Noninvestment-grade securities are securities that are not rated at least “BBB” or unrated securities of a comparable quality. Credit ratings are an indication of the risk that a security will default. They do not protect a security from credit risk. Lower-rated bonds typically offer higher yields to help compensate investors for the increased risk associated with them. Among these risks are lower credit worthiness, greater price volatility, more risk to principal and income than with higher-rated securities and increased possibilities of default. |
GROWTH OF A $10,000 INVESTMENT - CLASS A SHARES
The Fund's Class A Shares commenced operations on November 18, 2008. The Fund offers one other class of shares, Class F Shares. For the period prior to the commencement of operations of the Class A Shares, the performance information shown is for the Fund's Class F Shares adjusted to reflect the sales charges and expenses of the Class A Shares.
The graph below illustrates the hypothetical investment of $10,0001 in Federated Ohio Municipal Income Fund (Class A Shares) (the “Fund”) from August 31, 2000 to August 31, 2010, compared to the S&P/Investortools Municipal Bond Ohio Index (OH Index),2 the Barclays Capital Ohio Municipal Bond Index (BCOHMB),2 the S&P/Investortools Municipal Bond OH, Investment Grade, 3-year Plus with Tobacco 2% Constrained Sub-Index (OHIG Index)2 and the Morningstar Municipal Ohio Funds Category Average (MSTARMOH).2
| Average Annual Total Returns3 for the Period Ended 8/31/2010 |
| 1 Year | 3.49% |
| 5 Years | 2.07% |
| 10 Years | 3.72% |
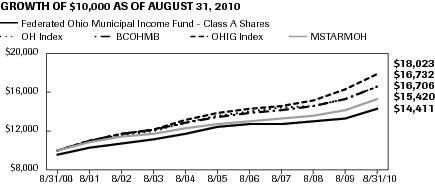
Performance data quoted represents past performance which is no guarantee of future results. Investment return and principal value will fluctuate so that an investor's shares, when redeemed, may be worth more or less than their original cost. Mutual fund performance changes over time and current performance may be lower or higher than what is stated. For current to the most recent month-end performance and after-tax returns, visit FederatedInvestors.com or call 1-800-341-7400. Returns shown do not reflect the deduction of taxes that a shareholder would pay on Fund distributions or the redemption of Fund shares. Mutual funds are not obligations of or guaranteed by any bank and are not federally insured. Total returns shown include the maximum sales charge of 4.50%.
Annual Shareholder Report| 1 | Represents a hypothetical investment of $10,000 in the Fund after deducting the maximum sales charge of 4.50% ($10,000 investment minus $450 sales charge = $9,550). The Fund's performance assumes the reinvestment of all dividends and distributions. The OH Index, BCOHMB, OHIG Index and MSTARMOH have been adjusted to reflect reinvestment of dividends on securities in the index and average. |
| 2 | The Fund's investment adviser has elected to change the Fund's broad-based securities market index to the OH Index from the Barclay's Capital Ohio Municipal Bond Index (BCOHMB). The OH Index is more representative of the securities in which the Fund invests. The OH Index consists of bonds in the S&P/Investortools Municipal Bond Index (Main Index) that have been issued by the state of Ohio or local governments or state or local government entities within Ohio. The Main Index is a broad, comprehensive, market value-weighted index composed of approximately 55,000 bond issues that are exempt from U.S. federal income taxes or subject to the alternative minimum tax (AMT). Eligibility criteria for inclusion in the Main Index include, but are not limited to: the bond issuer must be a state (including the Commonwealth of Puerto Rico and U.S. territories) or local government or a state or local government entity where interest on the bond is exempt from U.S. federal income taxes or subject to the AMT; the bond must be held by a mutual fund for which Standard & Poor's Securities Evaluations, Inc. provides prices; it must be denominated in U.S. dollars and have a minimum par amount of $2 million; and the bond must have a minimum term to maturity and/or call date greater than or equal to one calendar month. The Main Index is rebalanced monthly. The BCOHMB is an unmanaged market value-weighted index for the long-term, tax-exempt bond market comprising investment-grade, tax-exempt and fixed-rate bonds issued in the state of Ohio. To be included in the index, bonds must have a minimum credit rating of Baa, an outstanding par value of at least $7 million and be issued as part of a transaction of at least $75 million. The bonds must be fixed-rate, have an issue date after December 31, 1990, and must be at least one year from their maturity date, as well as have been issued in the particular state. The BCOHMB includes both zero coupon bonds and bonds subject to the alternative minimum tax. The OHIG Index represents the portion of the OH Index composed solely of bonds that are rated BBB-/Baa3 or higher with remaining maturities of more than three years while limiting tobacco bonds to 2%, by market weighting, of the sub-index. Neither the OH Index, BCOHMB nor the OHIG Index are adjusted to reflect sales charges, expenses and other fees that the Securities and Exchange Commission (SEC) requires to be reflected in the Fund's performance. The OH Index, BCOHMB and OHIG Index are unmanaged and, unlike the Fund, are not affected by cash flows. It is not possible to invest directly in an index. Morningstar figures represent the average of the total returns reported by all the mutual funds designated by Morningstar as falling into the respective category indicated. Funds designated within the MSTARMOH include those that invest at least 80% of assets in Ohio municipal debt and can include long-, intermediate- and short-duration portfolios. They do not reflect sales charges. |
| 3 | Total returns quoted reflect all applicable sales charges. |
GROWTH OF A $10,000 INVESTMENT - CLASS F SHARES
The graph below illustrates the hypothetical investment of $10,0001 in Federated Ohio Municipal Income Fund (Class F Shares) (the “Fund”) from August 31, 2000 to August 31, 2010, compared to S&P/Investortools Municipal Bond Ohio Index (OH Index),2 the Barclays Capital Ohio Municipal Bond Index (BCOHMB),2 the S&P/Investortools Municipal Bond OH, Investment Grade, 3-year Plus with Tobacco 2% Constrained Sub-Index (OHIG Index)2 and Morningstar Municipal Ohio Funds Category Average (MSTARMOH).2
| Average Annual Total Returns3 for the Period Ended 8/31/2010 |
| 1 Year | 6.08% |
| 5 Years | 2.94% |
| 10 Years | 4.34% |
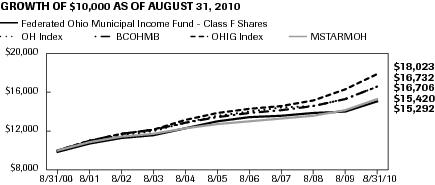
Performance data quoted represents past performance which is no guarantee of future results. Investment return and principal value will fluctuate so that an investor's shares, when redeemed, may be worth more or less than their original cost. Mutual fund performance changes over time and current performance may be lower or higher than what is stated. For current to the most recent month-end performance and after-tax returns, visit FederatedInvestors.com or call 1-800-341-7400. Returns shown do not reflect the deduction of taxes that a shareholder would pay on Fund distributions or the redemption of Fund shares. Mutual funds are not obligations of or guaranteed by any bank and are not federally insured. Total returns shown include the maximum sales charge of 1.00% and 1.00% contingent deferred sales charge, as applicable.
Annual Shareholder Report| 1 | Represents a hypothetical investment of $10,000 in the Fund after deducting the maximum sales charge of 1.00% ($10,000 investment minus $100 sales charge = $9,900). The maximum contingent deferred sales charge is 1.00% on any redemption less than four years from the purchase date. The Fund's performance assumes the reinvestment of all dividends and distributions. The OH Index, BCOHMB, OHIG Index and MSTARMOH have been adjusted to reflect reinvestment of dividends on securities in the index and average. |
| 2 | The Fund's investment adviser has elected to change the Fund's broad-based securities market index to the OH Index from the Barclay's Capital Ohio Municipal Bond Index (BCOHMB). The OH Index is more representative of the securities in which the Fund invests. The OH Index consists of bonds in the S&P/Investortools Municipal Bond Index (Main Index) that have been issued by the state of Ohio or local governments or state or local government entities within Ohio. The Main Index is a broad, comprehensive, market value-weighted index composed of approximately 55,000 bond issues that are exempt from U.S. federal income taxes or subject to the alternative minimum tax (AMT). Eligibility criteria for inclusion in the Main Index include, but are not limited to: the bond issuer must be a state (including the Commonwealth of Puerto Rico and U.S. territories) or local government or a state or local government entity where interest on the bond is exempt from U.S. federal income taxes or subject to the AMT; the bond must be held by a mutual fund for which Standard & Poor's Securities Evaluations, Inc. provides prices; it must be denominated in U.S. dollars and have a minimum par amount of $2 million; and the bond must have a minimum term to maturity and/or call date greater than or equal to one calendar month. The Main Index is rebalanced monthly. The BCOHMB is an unmanaged market value-weighted index for the long-term, tax-exempt bond market comprising investment-grade, tax-exempt and fixed-rate bonds issued in the state of Ohio. To be included in the index, bonds must have a minimum credit rating of Baa, an outstanding par value of at least $7 million and be issued as part of a transaction of at least $75 million. The bonds must be fixed-rate, have an issue date after December 31, 1990, and must be at least one year from their maturity date, as well as have been issued in the particular state. The BCOHMB includes both zero coupon bonds and bonds subject to the alternative minimum tax. The OHIG Index represents the portion of the OH Index composed solely of bonds that are rated BBB-/Baa3 or higher with remaining maturities of more than three years while limiting tobacco bonds to 2%, by market weighting, of the sub-index. Neither the OH Index, BCOHMB nor the OHIG Index are adjusted to reflect sales charges, expenses and other fees that the Securities and Exchange Commission (SEC) requires to be reflected in the Fund's performance. The OH Index, BCOHMB and OHIG Index are unmanaged and, unlike the Fund, are not affected by cash flows. It is not possible to invest directly in an index. Morningstar figures represent the average of the total returns reported by all the mutual funds designated by Morningstar as falling into the respective category indicated. Funds designated within the MSTARMOH include those that invest at least 80% of assets in Ohio municipal debt and can include long-, intermediate- and short-duration portfolios. They do not reflect sales charges. |
| 3 | Total returns quoted reflect all applicable sales charges and contingent deferred sales charges. |
Portfolio of Investments Summary Table (unaudited)
At August 31, 2010, the Fund's sector composition1 was as follows:
| Sector Composition | Percentage of Total Net Assets |
| General Obligation — Local | 19.6% |
| Education | 14.4% |
| Hospital | 13.2% |
| Water Sewer | 7.1% |
| General Obligation — State | 6.9% |
| Pre-refunded | 6.3% |
| Transportation | 5.6% |
| Senior Care | 5.4% |
| Public Power | 5.0% |
| Electric & Gas | 3.1% |
| Other2 | 13.3% |
| Other Assets and Liabilities — Net3 | 0.1% |
| TOTAL | 100.0% |
| 1 | Sector classifications, and the assignment of holdings to such sectors, are based upon the economic sector and/or revenue source of the underlying obligor, as determined by the Fund's Adviser. For securities that have been enhanced by a third-party, including bond insurers and banks, sector classifications are based upon the economic sector and/or revenue source of the underlying obligor, as determined by the Fund's Adviser. Pre-refunded securities are those whose debt service is paid from escrowed assets, usually U.S. government securities. |
| 2 | For purposes of this table, sector classifications constitute 86.6% of the Fund's total net assets. Remaining sectors have been aggregated under the designation “Other.” |
| 3 | Assets, other than investments in securities, less liabilities. See Statement of Assets and Liabilities. |
Portfolio of Investments
August 31, 2010
| Principal Amount | Value |
| MUNICIPAL BONDS – 98.1% |
| Ohio – 95.6% |
| $1,000,000 | Akron, Bath & Copley, OH Joint Township, Hospital District Revenue Bonds (Series 2004A), 5.125% (Summa Health System)/(Radian Asset Assurance, Inc. INS)/(Original Issue Yield: 5.38%), 11/15/2024 | 1,004,990 |
| 1,000,000 | Akron, Bath & Copley, OH Joint Township, Hospital District Revenue Bonds (Series A), 5.25% (Summa Health System)/(Radian Asset Assurance, Inc. INS), 11/15/2016 | 1,052,350 |
| 1,750,000 | Akron, Bath & Copley, OH Joint Township, Hospital Facilities Revenue Bonds (Series 2004A), 5.25% (Summa Health System)/(Radian Asset Assurance, Inc. INS)/(Original Issue Yield: 5.47%), 11/15/2031 | 1,719,113 |
| 2,000,000 | Allen County, OH, Hospital Facilities Revenue Bonds (Series 2010B), 5.25% (Catholic Healthcare Partners), 9/1/2027 | 2,187,140 |
| 500,000 | American Municipal Power-Ohio, Inc., Revenue Bonds (Series 2008A), 5.00% (American Municipal Power, Prairie State Energy Campus Project), 2/15/2016 | 569,915 |
| 2,000,000 | American Municipal Power-Ohio, Inc., Revenue Bonds (Series 2008A), 5.25% (American Municipal Power, Prairie State Energy Campus Project), 2/15/2028 | 2,145,100 |
| 1,825,000 | American Municipal Power-Ohio, Inc., Revenue Bonds, 5.25% (American Municipal Power, JV2)/(AMBAC Assurance Corporation INS), 1/1/2011 | 1,852,703 |
| 1,500,000 | Beavercreek, OH Local School District, UT GO Bonds, 6.60% (National Public Finance Guarantee Corporation INS), 12/1/2015 | 1,765,680 |
| 1,970,000 | Buckeye Tobacco Settlement Financing Authority, OH, Asset-Backed Bonds, 5.125% (Original Issue Yield: 5.44%), 6/1/2024 | 1,679,602 |
| 2,000,000 | Buckeye Tobacco Settlement Financing Authority, OH, Tobacco Settlement Asset-Backed Bonds (Series 2007A), 6.50%, 6/1/2047 | 1,595,280 |
| 2,710,000 | Butler County, OH, MFH Revenue Bonds (Series 2006), 5.10% (Trinity Manor Senior Housing)/(GNMA Collateralized Home Mortgage Program COL), 7/20/2036 | 2,763,414 |
| 1,000,000 | Centerville, OH, Health Care Fixed Rate Revenue Bonds (Series 2007A), 6.00% (Bethany Lutheran Village), 11/1/2038 | 900,130 |
| 1,000,000 | Cincinnati City School District, OH, COP, 5.00% (Assured Guaranty Municipal Corp. INS), 12/15/2024 | 1,108,420 |
| 1,000,000 | Cincinnati City School District, OH, UT GO Bonds, 5.00% (National Public Finance Guarantee Corporation INS), 12/1/2017 | 1,204,650 |
| 1,500,000 | Cincinnati City School District, OH, UT GO Bonds, 5.25% (United States Treasury PRF 12/1/2013@100), 12/1/2014 | 1,725,720 |
| 1,980,000 | Cleveland, OH Airport System, Revenue Bonds (Series 2006A), 5.25% (Assured Guaranty Corp. INS), 1/1/2018 | 2,286,722 |
| 2,200,000 | Cleveland, OH Airport System, Revenue Bonds, 5.00% (Assured Guaranty Municipal Corp. INS), 1/1/2022 | 2,370,346 |
| Principal Amount | Value |
| $2,685,000 | Cleveland, OH Public Power System, Revenue Refunding Bonds (Series 2010), 5.00%, 11/15/2017 | 3,114,627 |
| 2,350,000 | Cleveland, OH Waterworks, Revenue Bonds (Series 2007P), 5.00%, 1/1/2022 | 2,682,149 |
| 1,000,000 | Cleveland, OH Waterworks, Water Revenue Bonds (Series 2007O), 5.00% (National Public Finance Guarantee Corporation INS), 1/1/2032 | 1,059,420 |
| 1,125,000 | Cleveland, OH, LT GO Bonds, 5.25% (AMBAC Assurance Corporation INS), 12/1/2017 | 1,295,888 |
| 2,000,000 | Cleveland, OH, LT GO Bonds, 5.50% (Assured Guaranty Municipal Corp. INS), 10/1/2019 | 2,481,140 |
| 3,000,000 | Cleveland, OH, Various Purpose LT GO Bonds (Series 2009A), 5.00% (Assured Guaranty Corp. INS), 12/1/2026 | 3,290,970 |
| 865,000 | Cleveland-Cuyahoga County, OH Port Authority, Special Assessment Tax-Increment Revenue Bonds, 7.00% (University Heights, OH Public Parking Garage)/(Original Issue Yield: 7.20%), 12/1/2018 | 882,940 |
| 1,000,000 | Columbus, OH City School District, School Facilities Construction & Improvement UT GO Bonds (Series 2009), 5.00%, 12/1/2027 | 1,118,560 |
| 1,600,000 | Columbus, OH Sewer System, Revenue Bonds (Series 2008A), 5.00%, 6/1/2028 | 1,769,680 |
| 1,225,000 | Columbus, OH Sewer System, Revenue Bonds (Series 2008A), 5.00%, 6/1/2031 | 1,330,252 |
| 1,000,000 | Columbus, OH Sewer System, Revenue Bonds (Series A), 5.00%, 6/1/2023 | 1,141,430 |
| 2,000,000 | Cuyahoga County, OH, LT GO Bonds, 5.25%, 12/1/2018 | 2,319,000 |
| 2,465,000 | Cuyahoga County, OH, UT GO Jail Facilities Bonds, 5.25% (National Public Finance Guarantee Corporation INS)/(Original Issue Yield: 5.50%), 10/1/2013 | 2,582,630 |
| 2,000,000 | Cuyahoga County, OH, Various Purpose LT GO Bonds (Series 2009A), 5.00%, 12/1/2022 | 2,389,040 |
| 265,000 | Dayton-Montgomery County, OH Port Authority, Revenue Bonds (Series A), 4.75% (Dayton Regional Bond Fund), 11/15/2015 | 278,208 |
| 710,000 | Dayton-Montgomery County, OH Port Authority, Revenue Bonds (Series A), 5.00% (Dayton Regional Bond Fund), 11/15/2017 | 669,289 |
| 1,030,000 | Erie County, OH Hospital Facilities, Revenue Bonds (Series 2002A), 5.625% (Firelands Regional Medical Center)/(Original Issue Yield: 5.80%), 8/15/2032 | 1,033,440 |
| 250,000 | Erie County, OH Hospital Facilities, Revenue Bonds, 5.50% (Firelands Regional Medical Center), 8/15/2012 | 262,612 |
| 1,000,000 | Erie County, OH, Hospital Facilities Revenue Bonds (Series 2002A), 5.50% (Firelands Regional Medical Center)/(Original Issue Yield: 5.66%), 8/15/2022 | 1,018,440 |
| 1,000,000 | Erie County, OH, Revenue Bonds (Series 2006A), 5.00% (Firelands Regional Medical Center), 8/15/2036 | 919,660 |
| Principal Amount | Value |
| $3,000,000 | Franklin County, OH Convention Facilities Authority, Revenue Bonds, 5.00% (AMBAC Assurance Corporation INS), 12/1/2026 | 3,280,170 |
| 2,270,000 | Franklin County, OH Development Revenue, Revenue Bonds, 5.50% (American Chemical Society)/(Original Issue Yield: 5.75%), 10/1/2012 | 2,276,855 |
| 2,400,000 | Franklin County, OH Health Care Facilities, Improvement Revenue Bonds (Series 2010A), 5.625% (Ohio Presbyterian Retirement Services)/(Original Issue Yield: 5.75%), 7/1/2026 | 2,484,096 |
| 1,535,000 | Franklin County, OH Hospital Facility Authority, Hospital Improvement Revenue Bonds (Series 2009), 5.00% (Nationwide Children's Hospital)/(Original Issue Yield: 5.11%), 11/1/2034 | 1,596,722 |
| 475,000 | Franklin County, OH Mortgage Revenue, Revenue Bonds, 5.00% (Trinity Healthcare Credit Group), 6/1/2013 | 520,424 |
| 1,000,000 | Gallipolis, OH City School District, School Facilities Construction & Improvement UT GO Bonds, 5.00% (National Public Finance Guarantee Corporation INS), 12/1/2030 | 1,048,240 |
| 1,000,000 | Greene County, OH, University Housing Revenue Bonds (Series 2002A), 5.375% (Marauder Development LLC at Central State University)/(ACA Financial Guaranty Company INS)/(Original Issue Yield: 5.55%), 9/1/2022 | 779,760 |
| 1,000,000 | Greene County, OH, University Housing Revenue Bonds (Series 2002A), 5.50% (Marauder Development LLC at Central State University)/(ACA Financial Guaranty Company INS)/(Original Issue Yield: 5.65%), 9/1/2027 | 724,970 |
| 1,530,000 | Hamilton County, OH Hospital Facilities Authority, Revenue Bonds (Series 2004J), 5.25% (Cincinnati Children's Hospital Medical Center)/(FGIC and National Public Finance Guarantee Corporation INS), 5/15/2023 | 1,593,235 |
| 1,510,000 | Hamilton County, OH Hospital Facilities Authority, Revenue Bonds, 4.50% (Convalescent Hospital Children)/(FGIC and National Public Finance Guarantee Corporation INS), 5/15/2014 | 1,628,595 |
| 1,000,000 | Hamilton County, OH, EDRBs (Series 2006A), 5.00% (King Highland Community Urban Redevelopment Corp. — University of Cincinnati, Lessee)/(National Public Finance Guarantee Corporation INS), 6/1/2033 | 1,036,290 |
| 2,000,000 | Hamilton County, OH, Subordinated Sales Tax Refunding Revenue Bonds (Series 2006A), 5.00% (AMBAC Assurance Corporation INS), 12/1/2018 | 2,281,360 |
| 1,310,000 | Hamilton, OH City School District, School Facilities Construction & Improvement UT GO Bonds, 5.00% (Assured Guaranty Municipal Corp. INS), 12/1/2029 | 1,425,699 |
| 2,000,000 | Hilliard, OH School District, UT GO Bonds (Series 2006A), 5.00% (National Public Finance Guarantee Corporation INS), 12/1/2027 | 2,181,060 |
| 2,000,000 | Kent State University, OH, General Receipts Bonds (Series 2009B), 5.00% (Assured Guaranty Corp. INS), 5/1/2028 | 2,203,640 |
| 1,860,000 | Kettering, OH City School District, UT GO Bonds, 4.75% (Assured Guaranty Municipal Corp. INS), 12/1/2020 | 2,109,128 |
| Principal Amount | Value |
| $1,500,000 | Lorain County, OH, Health Care Facilities Revenue Refunding Bonds (Series 1998A), 5.25% (Kendal at Oberlin)/(Original Issue Yield: 5.53%), 2/1/2021 | 1,500,375 |
| 1,000,000 | Lorain County, OH, Hospital Revenue Bonds (Series 2006H), 5.00% (Catholic Healthcare Partners)/(Assured Guaranty Corp. INS), 2/1/2024 | 1,086,360 |
| 1,000,000 | Lorain County, OH, Hospital Revenue Refunding & Improvement Bonds, 5.25% (Catholic Healthcare Partners)/(Original Issue Yield: 5.52%), 10/1/2033 | 1,015,880 |
| 1,500,000 | Lucas County, OH, Health Care Facilities Refunding & Improvement Revenue Bonds (Series 2000A), 6.625% (Sunset Retirement Community, Inc.)/(Original Issue Yield: 6.75%), 8/15/2030 | 1,514,895 |
| 1,000,000 | Marysville, OH Wastewater Treatment System, Revenue Bonds (Series 2007), 4.75% (Syncora Guarantee, Inc. INS), 12/1/2047 | 1,000,290 |
| 1,090,000 | Marysville, OH Wastewater Treatment System, Revenue Bonds, 4.75% (Assured Guaranty Corp. INS)/(Original Issue Yield: 4.80%), 12/1/2046 | 1,104,214 |
| 1,000,000 | Miami County, OH, Hospital Facilities Revenue & Refunding Bonds (Series 2006), 5.25% (Upper Valley Medical Center, OH), 5/15/2021 | 1,057,910 |
| 1,600,000 | Miamisburg, OH City School District, School Facilities Construction & Improvement UT GO Bonds, 5.00%, 12/1/2024 | 1,852,784 |
| 1,000,000 | Montgomery County, OH, MFH Revenue Bonds (Series 2005), 4.95% (Chevy Chase Apartments)/(FHLMC GTD), 11/1/2035 | 1,032,340 |
| 1,000,000 | Montgomery County, OH, Revenue Bonds (Series 2008D), 6.125% (Catholic Health Initiatives)/(Original Issue Yield: 6.30%), 10/1/2028 | 1,144,010 |
| 1,555,000 | North Olmsted, OH, LT GO Bonds, 6.20% (AMBAC Assurance Corporation INS), 12/1/2011 | 1,602,785 |
| 1,415,000 | Oak Hills, OH Local School District, UT GO Bonds, 5.00% (Assured Guaranty Municipal Corp. INS), 12/1/2025 | 1,556,514 |
| 2,000,000 | Ohio Air Quality Development Authority, PCR Refunding Bonds (Series 2009-C), 5.625% (FirstEnergy Solutions Corp.), 6/1/2018 | 2,265,880 |
| 755,000 | Ohio HFA, Residential Mortgage Revenue Bonds (Series 2002 A-1), 5.30% (GNMA COL), 9/1/2022 | 777,265 |
| 835,000 | Ohio HFA, Residential Mortgage Revenue Bonds (Series 2008F), 5.25% (GNMA COL Home Mortgage Program GTD), 9/1/2028 | 887,597 |
| 105,000 | Ohio HFA, SFM Revenue Bonds (Series A3), 4.35% (GNMA COL), 9/1/2010 | 105,000 |
| 105,000 | Ohio HFA, SFM Revenue Bonds (Series A3), 4.55% (GNMA COL), 9/1/2011 | 107,412 |
| 145,000 | Ohio HFA, SFM Revenue Bonds, 3.30% (GNMA COL), 9/1/2030 | 145,513 |
| 420,000 | Ohio HFA, SFM Revenue Bonds, 3.65% (GNMA COL), 9/1/2011 | 426,103 |
| 880,000 | Ohio HFA, SFM Revenue Bonds, 3.90% (GNMA COL), 3/1/2013 | 903,646 |
| 1,885,000 | Ohio Municipal Electric Generation Agency, Revenue Bonds, 5.00% (American Municipal Power, JV5)/(AMBAC Assurance Corporation INS), 2/15/2014 | 2,081,587 |
| Principal Amount | Value |
| $1,000,000 | Ohio State Air Quality Development Authority, Air Quality Revenue Refunding Bonds (Series 2009B), 5.80% (Columbus Southern Power Company), 12/1/2038 | 1,072,670 |
| 1,455,000 | Ohio State Air Quality Development Authority, Revenue Bonds (Series 2009A), 5.70% (FirstEnergy Solutions Corp.), 8/1/2020 | 1,640,541 |
| 2,000,000 | Ohio State Higher Educational Facility Commission, Higher Education Facility Revenue Bonds (Series 2006), 5.00% (Kenyon College, OH), 7/1/2041 | 2,049,660 |
| 1,875,000 | Ohio State Higher Educational Facility Commission, Hospital Revenue Bonds (Series 2007A), 5.25% (University Hospitals Health System, Inc.), 1/15/2046 | 1,908,375 |
| 2,000,000 | Ohio State Higher Educational Facility Commission, Revenue Bonds (Series 2010), 5.00% (Xavier University)/(Original Issue Yield: 5.08%), 5/1/2040 | 2,082,340 |
| 300,000 | Ohio State Higher Educational Facility Commission, Revenue Bonds, 4.75% (Mount Union College), 10/1/2016 | 338,589 |
| 2,000,000 | Ohio State Higher Educational Facility Commission, Revenue Bonds, 5.00% (College of Wooster), 9/1/2020 | 2,177,940 |
| 750,000 | Ohio State Higher Educational Facility Commission, Revenue Bonds, 5.00% (Mount Union College), 10/1/2031 | 771,743 |
| 1,000,000 | Ohio State Higher Educational Facility Commission, Revenue Bonds, 5.00% (Otterbein College)/(CIFG Assurance NA INS), 12/1/2035 | 1,021,200 |
| 1,000,000 | Ohio State Higher Educational Facility Commission, Revenue Bonds, 5.00% (University of Dayton)/(AMBAC Assurance Corporation INS), 12/1/2027 | 1,037,480 |
| 2,010,000 | Ohio State Higher Educational Facility Commission, Revenue Bonds, 5.00% (Xavier University)/(CIFG Assurance NA INS)/(Escrowed In Treasuries COL), 5/1/2016 | 2,383,920 |
| 3,115,000 | Ohio State Higher Educational Facility Commission, Revenue Bonds, 5.00% (Xavier University)/(CIFG Assurance NA INS)/(United States Treasury PRF 5/1/2016@100), 5/1/2019 | 3,722,487 |
| 980,000 | Ohio State Higher Educational Facility Commission, Revenue Bonds, 5.25% (Mount Union College), 10/1/2021 | 1,073,208 |
| 1,000,000 | Ohio State Higher Educational Facility Commission, Revenue Bonds, 5.50% (Denison University), 11/1/2012 | 1,061,810 |
| 6,500,000 | Ohio State Higher Educational Facility Commission, Revenue Bonds, 6.25% (Case Western Reserve University, OH), 7/1/2014 | 7,193,875 |
| 1,000,000 | Ohio State Higher Educational Facility Commission, Revenue Refunding Bonds (Series 2008C), 5.00% (Case Western Reserve University, OH), 12/1/2029 | 1,076,680 |
| 1,765,000 | Ohio State Turnpike Commission, Refunding Revenue Bonds (Series 2009A), 5.00%, 2/15/2021 | 2,066,550 |
| 2,000,000 | Ohio State Turnpike Commission, Turnpike Revenue Refunding Bonds (Series 1998A), 5.50% (National Re Holdings Corp. INS), 2/15/2024 | 2,367,380 |
| Principal Amount | Value |
| $2,000,000 | Ohio State University, General Receipts Revenue Bonds (Series 2003B), 5.25%, 6/1/2023 | 2,205,780 |
| 2,000,000 | Ohio State Water Development Authority, PCRBs, 5.10% (United States Treasury PRF 6/1/2012@100), 12/1/2022 | 2,165,480 |
| 1,000,000 | Ohio State Water Development Authority, Revenue Refunding Bonds (Series 2008), 5.00%, 6/1/2028 | 1,117,540 |
| 1,200,000 | Ohio State, Hospital Revenue Refunding Bonds (Series 2008A), 5.25% (Cleveland Clinic)/(Original Issue Yield: 98.376%), 1/1/2033 | 1,271,760 |
| 2,585,000 | Ohio State, Infrastructure Improvement GO Bonds (Series 2008A), 5.375% (Original Issue Yield: 5.50%), 9/1/2028 | 2,953,569 |
| 3,000,000 | Ohio State, Infrastructure Improvement UT GO Bonds (Series 2007A), 4.75%, 9/1/2027 | 3,250,800 |
| 1,000,000 | Ohio State, Major New State Infrastructure Project Revenue Bonds (Series 2008-1), 5.75%, 6/15/2019 | 1,238,740 |
| 2,310,000 | Ohio State, UT GO Bonds, 4.25%, 5/1/2016 | 2,660,612 |
| 1,000,000 | Ohio State, UT GO Bonds, 5.00%, 6/15/2013 | 1,124,320 |
| 2,000,000 | Ohio Water Development Authority, Drinking Water Assistance Fund Refunding Revenue Bonds (Series 2008), 5.00% (Ohio State Water Development Authority), 12/1/2021 | 2,347,440 |
| 2,000,000 | Olentangy, OH Local School District, UT GO Bonds, 5.00% (Assured Guaranty Municipal Corp. INS), 12/1/2022 | 2,259,540 |
| 415,000 | Orrville, OH CSD, UT GO Bonds, 4.50% (AMBAC Assurance Corporation INS), 12/1/2018 | 476,590 |
| 350,000 | Orrville, OH CSD, UT GO Refunding Bonds, 5.00% (AMBAC Assurance Corporation INS), 12/1/2020 | 403,791 |
| 500,000 | Port Authority for Columbiana County, OH, Solid Waste Facility Revenue Bonds (Series 2004A), 7.25% (Apex Environmental LLC)/(Original Issue Yield: 7.30%), 8/1/2034 | 426,205 |
| 1,000,000 | Portage County, OH Board of County Hospital Trustees, Hospital Revenue Bonds (Series 1999), 5.75% (Robinson Memorial Hospital)/(AMBAC Assurance Corporation INS)/(Original Issue Yield: 5.90%), 11/15/2019 | 1,011,090 |
| 1,000,000 | Ravenna, OH City School District, UT GO Bonds (Series 2006), 5.00% (Assured Guaranty Municipal Corp. INS), 1/15/2031 | 1,059,880 |
| 770,000 | Richland County, OH Hospital Facilities, Revenue Bond, 5.00% (Medcentral Health System), 11/15/2015 | 841,656 |
| 1,500,000 | Rickenbacker, OH Port Authority, Capital Funding Revenue Bonds (Series 2002A), 5.375% (OASBO Expanded Asset Pooled Financing Program)/(Original Issue Yield: 5.60%), 1/1/2032 | 1,654,665 |
| 1,500,000 | Toledo-Lucas County, OH Port Authority, Revenue Bonds, 6.45% (CSX Corp.), 12/15/2021 | 1,794,840 |
| 1,375,000 | Toledo-Lucas County, OH Port Authority, Special Assessment Revenue Bonds, 5.25% (Crocker Park Public Improvement Project)/(Original Issue Yield: 5.37%), 12/1/2023 | 1,359,380 |
| Principal Amount | Value |
| $2,000,000 | Tuscarawas County, OH, Hospital Facilities Revenue Bonds, 5.75% (Union Hospital)/(Radian Asset Assurance, Inc. INS)/(United States Treasury PRF 10/1/2011@101), 10/1/2026 | 2,126,160 |
| 2,000,000 | University of Akron, OH, General Receipts Bonds (Series 2008B), 5.25% (Assured Guaranty Municipal Corp. INS), 1/1/2027 | 2,215,000 |
| 1,025,000 | University of Cincinnati, OH, General Receipts Revenue Bonds (Series 2004D), 5.00% (AMBAC Assurance Corporation INS), 6/1/2026 | 1,073,032 |
| 1,995,000 | Waynesville, OH Health Care Facilities, Revenue Bonds (Series 2001A), 5.70% (Quaker Heights Project)/(GNMA COL Home Mortgage Program GTD), 2/20/2043 | 2,071,708 |
| TOTAL | 184,065,280 |
| Guam – 0.3% |
| 560,000 | Guam Government Limited Obligation (Section 30), Bonds (Series 2009A), 5.625% (Original Issue Yield: 5.875%), 12/1/2029 | 594,138 |
| Puerto Rico – 2.2% |
| 2,000,000 | Commonwealth of Puerto Rico, UT GO Refunding Bonds (Series A), 5.00% TOBs, Mandatory Tender 7/1/2012 | 2,080,580 |
| 1,000,000 | Puerto Rico Government Development Bank (GDB), Senior Notes (Series 2006B), 5.00%, 12/1/2017 | 1,084,900 |
| 990,000 | Puerto Rico Industrial, Tourist, Educational, Medical & Environmental Control Facilities Financing Authority, Cogeneration Facility Revenue Bonds (Series 2000A), 6.625% (AES Puerto Rico Project)/(Original Issue Yield: 6.65%), 6/1/2026 | 998,583 |
| TOTAL | 4,164,063 |
| TOTAL MUNICIPAL BONDS (IDENTIFIED COST $179,134,459) | 188,823,481 |
| SHORT-TERM MUNICIPALS – 1.8%;1 |
| Ohio – 1.8% |
| 865,000 | Franklin County, OH Hospital Facility Authority, (Series 2008E) Weekly VRDNs (Nationwide Children's Hospital)/(JPMorgan Chase Bank, N.A. LIQ), 0.270%, 9/2/2010 | 865,000 |
| 2,040,000 | Geauga County, OH, Revenue Bonds (Series 2007A) Daily VRDNs (South Franklin Circle)/(Key Bank, N.A. LOC), 0.270%, 9/1/2010 | 2,040,000 |
| 600,000 | Montgomery County, OH, (Series 1998B) Daily VRDNs (Miami Valley Hospital)/(JPMorgan Chase Bank, N.A. LIQ), 0.320%, 9/1/2010 | 600,000 |
| TOTAL SHORT-TERM MUNICIPALS (AT AMORTIZED COST) | 3,505,000 |
| TOTAL INVESTMENTS — 99.9% (IDENTIFIED COST $182,639,459)2 | 192,328,481 |
| OTHER ASSETS AND LIABILITIES - NET — 0.1%3 | 105,800 |
| TOTAL NET ASSETS — 100% | $192,434,281 |
Securities that are subject to the federal alternative minimum tax (AMT) represent 4.1% of the Fund's portfolio as calculated based upon total market value (percentage is unaudited).
| 1 | Current rate and next reset date shown for Variable Rate Demand Notes. |
| 2 | The cost of investments for federal tax purposes amounts to $182,612,565. |
| 3 | Assets, other than investments in securities, less liabilities. See Statement of Assets and Liabilities. |
Note: The categories of investments are shown as a percentage of total net assets at August 31, 2010.
Various inputs are used in determining the value of the Fund's investments. These inputs are summarized in the three broad levels listed below:
Level 1 — quoted prices in active markets for identical securities
Level 2 — other significant observable inputs (including quoted prices for similar securities, interest rates, prepayment speeds, credit risk, etc.)
Level 3 — significant unobservable inputs (including the Fund's own assumptions in determining the fair value of investments)
The inputs or methodology used for valuing securities are not an indication of the risk associated with investing in those securities.
As of August 31, 2010, all investments of the Fund utilized Level 2 inputs, in valuing the Fund's assets carried at fair value.
The following acronyms are used throughout this portfolio:
| AMBAC | — American Municipal Bond Assurance Corporation |
| COL | — Collateralized |
| COP | — Certificate of Participation |
| CSD | — Central School District |
| EDRBs | — Economic Development Revenue Bonds |
| FGIC | — Financial Guaranty Insurance Company |
| FHLMC | — Federal Home Loan Mortgage Corporation |
| GNMA | — Government National Mortgage Association |
| GO | — General Obligation |
| GTD | — Guaranteed |
| HFA | — Housing Finance Authority |
| INS | — Insured |
| LIQ | — Liquidity Agreement |
| LOC | — Letter of Credit |
| LT | — Limited Tax |
| MFH | — Multi-Family Housing |
| PCR | — Pollution Control Revenue |
| PCRBs | — Pollution Control Revenue Bonds |
| PRF | — Prerefunded |
| SFM | — Single Family Mortgage |
| TOBs | — Tender Option Bonds |
| UT | — Unlimited Tax |
| VRDNs | — Variable Rate Demand Notes |
See Notes which are an integral part of the Financial Statements
Annual Shareholder ReportStatement of Assets and Liabilities
August 31, 2010
| Assets: |
| Total investments in securities, at value (identified cost $182,639,459) | $192,328,481 |
| Cash | 31,247 |
| Income receivable | 2,283,933 |
| Receivable for shares sold | 957,826 |
| Receivable for investments sold | 395,000 |
| TOTAL ASSETS | 195,996,487 |
| Liabilities: |
| Payable for investments purchased | $3,102,893 |
| Income distribution payable | 284,245 |
| Payable for shares redeemed | 81,143 |
| Payable for shareholder services fee (Note 5) | 36,844 |
| Payable for distribution services fee (Note 5) | 16,937 |
| Accrued expenses | 40,144 |
| TOTAL LIABILITIES | 3,562,206 |
| Net assets for 17,278,458 shares outstanding | $192,434,281 |
| Net Assets Consist of: |
| Paid-in capital | $185,483,206 |
| Net unrealized appreciation of investments | 9,689,022 |
| Accumulated net realized loss on investments, futures contracts and swap contracts | (2,866,264) |
| Undistributed net investment income | 128,317 |
| TOTAL NET ASSETS | $192,434,281 |
| Net Asset Value, Offering Price and Redemption Proceeds Per Share: |
| Class A Shares: |
| Net asset value per share ($57,337,945 ÷ 5,148,491 shares outstanding), no par value, unlimited shares authorized | $11.14 |
| Offering price per share (100/95.50 of $11.14) | $11.66 |
| Redemption proceeds per share | $11.14 |
| Class F Shares: |
| Net asset value per share ($135,096,336 ÷ 12,129,967 shares outstanding), no par value, unlimited shares authorized | $11.14 |
| Offering price per share (100/99.00 of $11.14) | $11.25 |
| Redemption proceeds per share (99.00/100 of $11.14) | $11.03 |
See Notes which are an integral part of the Financial Statements
Annual Shareholder ReportStatement of Operations
Year Ended August 31, 2010
| Investment Income: |
| Interest | $8,556,488 |
| Expenses: |
| Investment adviser fee (Note 5) | $744,275 |
| Administrative personnel and services fee (Note 5) | 190,000 |
| Custodian fees | 12,333 |
| Transfer and dividend disbursing agent fees and expenses | 90,653 |
| Directors'/Trustees' fees | 2,258 |
| Auditing fees | 20,500 |
| Legal fees | 3,170 |
| Portfolio accounting fees | 107,474 |
| Distribution services fee — Class F Shares (Note 5) | 514,231 |
| Shareholder services fee — Class A Shares (Note 5) | 143,777 |
| Shareholder services fee — Class F Shares (Note 5) | 319,634 |
| Account administration fee — Class F Shares | 207 |
| Share registration costs | 35,707 |
| Printing and postage | 30,715 |
| Insurance premiums | 4,643 |
| Miscellaneous | 2,371 |
| TOTAL EXPENSES | 2,221,948 |
| Waivers (Note 5): |
| Waiver of investment adviser fee | $(271,520) |
| Waiver of administrative personnel and services fee | (33,139) |
| Waiver of distribution services fee — Class F Shares | (321,394) |
| TOTAL WAIVERS | (626,053) |
| Net expenses | 1,595,895 |
| Net investment income | 6,960,593 |
| Realized and Unrealized Gain on Investments: |
| Net realized gain on investments | 987,390 |
| Net change in unrealized appreciation of investments | 6,688,717 |
| Net realized and unrealized gain on investments | 7,676,107 |
| Change in net assets resulting from operations | $14,636,700 |
See Notes which are an integral part of the Financial Statements
Annual Shareholder ReportStatement of Changes in Net Assets
| Year Ended August 31 | 2010 | 2009 |
| Increase (Decrease) in Net Assets |
| Operations: |
| Net investment income | $6,960,593 | $6,903,414 |
| Net realized gain (loss) on investments | 987,390 | (1,746,226) |
| Net change in unrealized appreciation/depreciation of investments | 6,688,717 | 2,876,514 |
| CHANGE IN NET ASSETS RESULTING FROM OPERATIONS | 14,636,700 | 8,033,702 |
| Distributions to Shareholders: |
| Distributions from net investment income |
| Class A Shares | (2,178,036) | (1,991,224) |
| Class F Shares | (4,687,502) | (4,728,273) |
| CHANGE IN NET ASSETS RESULTING FROM DISTRIBUTIONS TO SHAREHOLDERS | (6,865,538) | (6,719,497) |
| Share Transactions: |
| Proceeds from sale of shares | 25,803,266 | 20,522,273 |
| Proceeds from shares issued in connection with the tax-free transfer of assets from the Fifth Third Ohio Municipal Bond Fund | — | 86,350,459 |
| Net asset value of shares issued to shareholders in payment of distributions declared | 3,246,878 | 2,899,634 |
| Cost of shares redeemed | (29,617,349) | (42,936,723) |
| CHANGE IN NET ASSETS RESULTING FROM SHARE TRANSACTIONS | (567,205) | 66,835,643 |
| Change in net assets | 7,203,957 | 68,149,848 |
| Net Assets: |
| Beginning of period | 185,230,324 | 117,080,476 |
| End of period (including undistributed net investment income of $128,317 and $58,797, respectively) | $192,434,281 | $185,230,324 |
See Notes which are an integral part of the Financial Statements
Annual Shareholder ReportNotes to Financial Statements
August 31, 2010
Federated Municipal Securities Income Trust (the “Trust”) is registered under the Investment Company Act of 1940, as amended (the “Act”), as an open-end management investment company. The Trust consists of five portfolios. The financial statements included herein are only those of the Federated Ohio Municipal Income Fund (the “Fund”), a non-diversified portfolio. The financial statements of the other portfolios are presented separately. The assets of each portfolio are segregated and a shareholder's interest is limited to the portfolio in which shares are held. Each portfolio pays its own expenses. The Fund offers two classes of shares: Class A Shares and Class F Shares. All shares of the Fund have equal rights with respect to voting, except on class-specific matters. The investment objective of the Fund is to provide current income exempt from federal regular income tax (federal regular income tax does not include the federal AMT) and the personal income taxes imposed by the state of Ohio and Ohio municipalities. Interest income from the Fund's investments may be subject to the federal AMT for individuals and corporations.
Effective November 18, 2008, the Fund began offering Class A Shares.
On November 21, 2008, the Fund received assets from Fifth Third Ohio Municipal Bond Fund as the result of a tax-free reorganization, as follows:
| Shares of the Fund Issued | Fifth Third Ohio Municipal Bond Fund Net Assets Received | Unrealized Depreciation1 | Net Assets of the Fund Immediately Prior to Combination | Net Assets of the Fund Immediately After Combination |
| 8,507,423 | $86,350,459 | $132,804 | $106,903,124 | $193,253,583 |
| 1 | Unrealized depreciation is included in the Fifth Third Ohio Municipal Bond Fund Net Assets Received amount shown above. |
2. Significant Accounting Policies
The following is a summary of significant accounting policies consistently followed by the Fund in the preparation of its financial statements. These policies are in conformity with U.S. generally accepted accounting principles (GAAP).
Investment Valuation
In calculating its net asset value (NAV), the Fund generally values investments as follows:
- Fixed-income securities acquired with maturities greater than 60 days are fair valued using price evaluations provided by a pricing service approved by the Board of Trustees (the “Trustees”).
- Fixed-income securities acquired with remaining maturities of 60 days or less are valued at their cost (adjusted for the accretion of any discount or amortization of any premium).
- Derivative contracts listed on exchanges are valued at their reported settlement or closing price.
- Over-the-counter (OTC) derivative contracts are fair valued using price evaluations provided by a pricing service approved by the Trustees.
- Shares of other mutual funds are valued based upon their reported NAVs.
Fair Valuation and Significant Events Procedures
The Trustees have authorized the use of pricing services to provide evaluations of the current fair value of certain investments for purposes of calculating the NAV. Factors considered by pricing services in evaluating an investment include the yields or prices of investments of comparable quality, coupon, maturity, call rights and other potential prepayments, terms and type, reported transactions, indications as to values from dealers and general market conditions. Some pricing services provide a single price evaluation reflecting the bid-side of the market for an investment (a “bid” evaluation). Other pricing services offer both bid evaluations and price evaluations indicative of a price between the prices bid and asked for the investment (a “mid” evaluation). The Fund normally uses bid evaluations for U.S. Treasury and Agency securities, mortgage-backed securities and municipal securities. The Fund normally uses mid evaluations for other types of fixed-income securities and OTC derivative contracts. In the event that market quotations and price evaluations are not available for an investment, the fair value of the investment is determined in accordance with procedures adopted by the Trustees.
The Trustees also have adopted procedures requiring an investment to be priced at its fair value whenever the Adviser determines that a significant event affecting the value of the investment has occurred between the time as of which the price of the investment would otherwise be determined and the time as of which the NAV is computed. An event is considered significant if there is both an affirmative expectation that the investment's value will change in response to the event and a reasonable basis for quantifying the resulting change in value. Examples of significant events that may occur after the close of the principal market on which a security is traded, or after the time of a price evaluation provided by a pricing service or a dealer, include:
- With respect to price evaluations of fixed-income securities determined before the close of regular trading on the NYSE, actions by the Federal Reserve Open Market Committee and other significant trends in U.S. fixed-income markets;
- Political or other developments affecting the economy or markets in which an issuer conducts its operations or its securities are traded; and
- Announcements concerning matters such as acquisitions, recapitalizations, litigation developments, a natural disaster affecting the issuer's operations or regulatory changes or market developments affecting the issuer's industry.
The Fund may seek to obtain more current quotations or price evaluations from alternative pricing sources. If a reliable alternative pricing source is not available, the Fund will determine the fair value of the investment using another method approved by the Trustees.
Investment Income, Gains and Losses, Expenses and Distributions
Investment transactions are accounted for on a trade date basis. Realized gains and losses from investment transactions are recorded on an identified cost basis. Interest income and expenses are accrued daily. Distributions to shareholders are recorded on the ex-dividend date. Distributions of net investment income are declared and paid monthly. Non-cash Annual Shareholder ReportPremium and Discount Amortization
All premiums and discounts on fixed-income securities are amortized/accreted for financial statement purposes.
Federal Taxes
It is the Fund's policy to comply with the Subchapter M provision of the Internal Revenue Code and to distribute to shareholders each year substantially all of its income. Accordingly, no provision for federal income tax is necessary. As of and during the year ended August 31, 2010, the Fund did not have a liability for any uncertain tax positions. The Fund recognizes interest and penalties, if any, related to tax liabilities as income tax expense in the Statement of Operations. As of August 31, 2010, tax years 2007 through 2010 remain subject to examination by the Fund's major tax jurisdictions, which include the United States of America and the Commonwealth of Massachusetts.
When-Issued and Delayed Delivery Transactions
The Fund may engage in when-issued or delayed delivery transactions. The Fund records when-issued securities on the trade date and maintains security positions such that sufficient liquid assets will be available to make payment for the securities purchased. Securities purchased on a when-issued or delayed delivery basis are marked to market daily and begin earning interest on the settlement date. Losses may occur on these transactions due to changes in market conditions or the failure of counterparties to perform under the contract.
Restricted Securities
The Fund may purchase securities which are considered restricted. Restricted securities are securities that either: (a) cannot be offered for public sale without first being registered, or being able to take advantage of an exemption from registration, under the Securities Act of 1933; or (b) are subject to contractual restrictions on public sales. In some cases, when a security cannot be offered for public sale without first being registered, the issuer of the restricted security has agreed to register such securities for resale, at the issuer's expense, either upon demand by the Fund or in connection with another registered offering of the securities. Many such restricted securities may be resold in the secondary market in transactions exempt from registration. Restricted securities may be determined to be liquid under criteria established by the Trustees. The Fund will not incur any registration costs upon such resales. The Fund's restricted securities are valued at the price provided by dealers in the secondary market or, if no market prices are available, at the fair value as determined in accordance with procedures established by and under the general supervision of the Trustees.
Other
The preparation of financial statements in conformity with GAAP requires management to make estimates and assumptions that affect the amounts of assets, liabilities, expenses and revenues reported in the financial statements. Actual results could differ from those estimated.
Annual Shareholder ReportThe following tables summarize share activity:
| Year Ended 8/31/2010 | Period Ended 8/31/20091 | ||
| Class A Shares: | Shares | Amount | Shares | Amount |
| Shares sold | 534,701 | $5,817,233 | 382,635 | $7,287,254 |
| Shares issued in connection with the tax-free transfer of assets from the Fifth Third Ohio Municipal Bond Fund | — | — | 7,005,890 | 71,109,888 |
| Shares issued to shareholders in payment of distributions declared | 20,749 | 225,320 | 7,161 | 75,005 |
| Shares redeemed | (1,130,713) | (12,229,733) | (1,671,932) | (17,392,765) |
| NET CHANGE RESULTING FROM CLASS A SHARE TRANSACTIONS | (575,263) | $(6,187,180) | 5,723,754 | $61,079,382 |
| Year Ended August 31 | 2010 | 2009 | |
| Class F Shares: | Shares | Amount | Shares | Amount |
| Shares sold | 1,839,372 | $19,986,033 | 1,582,892 | $13,235,019 |
| Shares issued in connection with the tax-free transfer of assets from the Fifth Third Ohio Municipal Bond Fund | — | — | 1,501,533 | 15,240,571 |
| Shares issued to shareholders in payment of distributions declared | 278,262 | 3,021,558 | 271,604 | 2,824,629 |
| Shares redeemed | (1,603,699) | (17,387,616) | (2,462,680) | (25,543,958) |
| NET CHANGE RESULTING FROM CLASS F SHARE TRANSACTIONS | 513,935 | $5,619,975 | 893,349 | $5,756,261 |
| NET CHANGE RESULTING FROM FUND SHARE TRANSACTIONS | (61,328) | $(567,205) | 6,617,103 | $66,835,643 |
| 1 | Reflects operations for the period from November 18, 2008 (date of initial investment) to August 31, 2009. |
The timing and character of income and capital gain distributions are determined in accordance with income tax regulations, which may differ from GAAP. These differences are due in part to differing treatments for expiration of capital loss carryforwards and discount accretion/premium amortization on debt securities.
For the year ended August 31, 2010, permanent differences identified and reclassified among the components of net assets were as follows:
| Increase (Decrease) | ||
| Paid-In Capital | Undistributed Net Investment Income (Loss) | Accumulated Net Realized Gain (Loss) |
| $(69,375) | $(25,535) | $94,910 |
Net investment income (loss), net realized gains (losses) and net assets were not affected by this reclassification.
The tax character of distributions as reported on the Statement of Changes in Net Assets for the years ended August 31, 2010 and 2009, was as follows:
| 2010 | 2009 |
| Ordinary income | $36 | $ — |
| Tax-exempt income | $6,865,502 | $6,719,497 |
As of August 31, 2010, the components of distributable earnings on a tax basis were as follows:
| Undistributed tax-exempt income | $128,353 |
| Net unrealized appreciation | $9,715,916 |
| Capital loss carryforwards | $(2,893,194) |
At August 31, 2010, the cost of investments for federal tax purposes was $182,612,565. The net unrealized appreciation of investments for federal tax purposes was $9,715,916. This consists of net unrealized appreciation from investments for those securities having an excess of value over cost of $10,869,762, and net unrealized depreciation from investments for those securities having an excess of cost over value of $1,153,846.
At August 31, 2010, the Fund had a capital loss carryforward of $2,893,194 which will reduce the Fund's taxable income arising from future net realized gains on investments, if any, to the extent permitted by the Code and thus will reduce the amount of distributions to shareholders which would otherwise be necessary to relieve the Fund of any liability for federal income tax. Pursuant to the Code, such capital loss carryforward will expire as follows:
| Expiration Year | Expiration Amount |
| 2011 | $87,412 |
| 2012 | $176,880 |
| 2013 | $621,142 |
| 2015 | $180,029 |
| 2016 | $641,658 |
| 2017 | $626,069 |
| 2018 | $560,004 |
Capital loss carryforwards of $69,375 expired during the year ended August 31, 2010.
5. Investment Adviser Fee and Other Transactions with Affiliates
Investment Adviser Fee
Federated Investment Management Company is the Fund's investment adviser (the “Adviser”). The advisory agreement between the Fund and the Adviser provides for an annual fee equal to 0.40% of the Fund's average daily net assets. Subject to the terms described in the Expense Limitation note, the Adviser may voluntarily choose to waive any portion of its fee. For the year ended August 31, 2010, the Adviser voluntarily waived $271,520 of its fee.
Annual Shareholder ReportFederated Administrative Services (FAS), under the Administrative Services Agreement, provides the Fund with administrative personnel and services. The fee paid to FAS is based on the average aggregate daily net assets of certain Federated funds as specified below:
| Administrative Fee | Average Aggregate Daily Net Assets of the Federated Funds |
| 0.150% | on the first $5 billion |
| 0.125% | on the next $5 billion |
| 0.100% | on the next $10 billion |
| 0.075% | on assets in excess of $20 billion |
The administrative fee received during any fiscal year shall be at least $150,000 per portfolio and $40,000 per each additional class of Shares. Subject to the terms described in the Expense Limitation note, FAS may voluntarily choose to waive any portion of its fee. For the year ended August 31, 2010, the net fee paid to FAS was 0.084% of average daily net assets of the Fund. FAS waived $33,139 of its fee.
Distribution Services Fee
The Fund has adopted a Distribution Plan (the “Plan”) pursuant to Rule 12b-1 under the Act. Under the terms of the Plan, the Fund will compensate Federated Securities Corp. (FSC), the principal distributor, from the daily net assets of the Fund's Class A Shares and Class F Shares to finance activities intended to result in the sale of these shares. The Plan provides that the Fund may incur distribution expenses at the following percentage of average daily net assets, annually, to compensate FSC.
| Share Class Name | Percentage of Average Daily Net Assets of Class |
| Class A Shares | 0.05% |
| Class F Shares | 0.40% |
Subject to the terms described in the Expense Limitation note, FSC may voluntarily choose to waive any portion of its fee. For the year ended August 31, 2010, FSC voluntarily waived $321,394 of its fee. When FSC receives fees, it may pay some or all of them to financial intermediaries whose customers purchase shares. For the year ended August 31, 2010, FSC retained $192,837 of fees paid by the Fund. For the year ended August 31, 2010, the Fund's Class A Shares did not incur a distribution services fee; however it may begin to incur this fee upon approval of the Trustees.
Sales Charges
Front-end sales charges and contingent deferred sales charges (CDSC) do not represent expenses of the Fund. They are deducted from the proceeds of sales of Fund shares prior to investment or from redemptions proceeds prior to remittance, as applicable. For the year ended August 31, 2010, FSC retained $44,089 in sales charges from the sale of Class A Shares.
Annual Shareholder ReportThe Fund may pay fees (“Service Fees”) up to 0.25% of the average daily net assets of the Fund's Class A Shares and Class F Shares to financial intermediaries or to Federated Shareholder Services Company (FSSC) for providing services to shareholders and maintaining shareholder accounts. Subject to the terms described in the Expense Limitation note, FSSC may voluntarily reimburse the Fund for Service Fees. For the year ended August 31, 2010, FSSC received $1,478 of fees paid by the Fund.
Interfund Transactions
During the year ended August 31, 2010, the Fund engaged in purchase and sale transactions with funds that have a common investment adviser (or affiliated investment advisers), common Directors/Trustees, and/or common Officers. These purchase and sale transactions complied with Rule 17a-7 under the Act and amounted to $55,835,000 and $52,635,000, respectively.
Expense Limitation
The Adviser and its affiliates (which may include FSC, FAS and FSSC) have voluntarily agreed to waive their fees and/or reimburse expenses so that the total operating expenses (as shown in the financial highlights) paid by the Fund's Class A Shares and Class F Shares (after the voluntary waivers and reimbursements) will not exceed 0.75% and 0.90%, (the “Fee Limit”), respectively, through the later of (the “Termination Date”): (a) October 31, 2011; or (b) the date of the Fund's next effective Prospectus. While the Adviser and its affiliates currently do not anticipate terminating or increasing these arrangements prior to the Termination Date, these arrangements may only be terminated or the Fee Limit increased prior to the Termination Date with the agreement of the Trustees.
General
Certain Officers and Trustees of the Fund are Officers and Directors or Trustees of the above companies.
Purchases and sales of investments, excluding long-term U.S. government securities and short-term obligations, for the year ended August 31, 2010, were as follows:
| Purchases | $36,221,551 |
| Sales | $36,347,615 |
Since the Fund invests a substantial portion of its assets in issuers located in one state, it will be more susceptible to factors adversely affecting issuers of that state than would be a comparable tax-exempt mutual fund that invests nationally. In order to reduce the credit risk associated with such factors, at August 31, 2010, 35.0% of the securities in the portfolio of investments is backed by letters of credit or bond insurance of various financial institutions and financial guaranty assurance agencies. The largest percentage of investments insured by or supported (backed) by a letter of credit from any one institution or agency was 8.6% of total investments.
Annual Shareholder ReportThe Fund participates in a $100,000,000 unsecured, uncommitted revolving line of credit (LOC) agreement with PNC Bank. The LOC was made available for extraordinary or emergency purposes, primarily for financing redemption payments. Borrowings are charged interest at a rate offered to the Fund by PNC Bank at the time of the borrowing. As of August 31, 2010, there were no outstanding loans. During the year ended August 31, 2010, the Fund did not utilize the LOC.
Pursuant to an Exemptive Order issued by the Securities and Exchange Commission (SEC), the Fund, along with other funds advised by subsidiaries of Federated Investors, Inc., may participate in an interfund lending program. This program provides an alternative credit facility allowing the funds to borrow from other participating affiliated funds. As of August 31, 2010, there were no outstanding loans. During the year ended August 31, 2010, the program was not utilized.
Since October 2003, Federated Investors, Inc. and related entities (collectively, “Federated”), and various Federated sponsored mutual funds (“Federated Funds”) have been named as defendants in several class action lawsuits now pending in the United States District Court for the District of Maryland. The lawsuits were purportedly filed on behalf of people who purchased, owned and/or redeemed shares of certain Federated Funds during specified periods beginning November 1, 1998. The suits are generally similar in alleging that Federated engaged in illegal and improper trading practices including market timing and late trading in concert with certain institutional traders, which allegedly caused financial injury to the mutual fund shareholders. Federated without admitting the validity of any claim has reached a preliminary settlement with the Plaintiffs in these cases. Any settlement would have to be approved by the Court. Federated entities have also been named as defendants in several additional lawsuits that are now pending in the United States District Court for the Western District of Pennsylvania. These lawsuits have been consolidated into a single action alleging excessive advisory fees involving one of the Federated Funds. The Board of the Federated Funds retained the law firm of Dickstein Shapiro LLP to represent the Federated Funds in these lawsuits. Federated and the Federated Funds, and their respective counsel, have been defending this litigation, and none of the Federated Funds remains a defendant in any of the lawsuits. Additional lawsuits based upon similar allegations may be filed in the future. The potential impact of these lawsuits, all of which seek monetary damages, attorneys' fees and expenses, and future potential similar suits is uncertain. Although we do not believe that these lawsuits will have a material adverse effect on the Federated Funds, there can be no assurance that these suits, ongoing adverse publicity and/or other developments resulting from the allegations in these matters will not result in increased redemptions, or reduced sales, of shares of the Federated Funds or other adverse consequences for the Federated Funds.
Management has evaluated subsequent events through the date the financial statements were issued, and determined that no events have occurred that require additional disclosure.
12. Federal Tax Information (UNAUDITED)
For the fiscal year ended August 31, 2010, 100% of distributions from net investment income is exempt from federal income tax, other than the federal AMT.
Annual Shareholder ReportReport of Independent Registered Public Accounting Firm
TO THE BOARD OF TRUSTEES OF federated municipal securities income trust AND SHAREHOLDERS OF federated Ohio Municipal income fund:
We have audited the accompanying statement of assets and liabilities, including the portfolio of investments, of Federated Ohio Municipal Income Fund (the “Fund”), a portfolio of Federated Municipal Securities Income Trust, as of August 31, 2010, and the related statement of operations for the year then ended, the statements of changes in net assets for each of the years or periods in the two-year period then ended, and the financial highlights for each of the years in the five-year period then ended. These financial statements and financial highlights are the responsibility of the Fund's management. Our responsibility is to express an opinion on these financial statements and financial highlights based on our audits.
We conducted our audits in accordance with the standards of the Public Company Accounting Oversight Board (United States). Those standards require that we plan and perform the audit to obtain reasonable assurance about whether the financial statements and financial highlights are free of material misstatement. An audit includes examining, on a test basis, evidence supporting the amounts and disclosures in the financial statements. Our procedures included confirmation of securities owned as of August 31, 2010, by correspondence with the custodian and brokers or by other appropriate auditing procedures. An audit also includes assessing the accounting principles used and significant estimates made by management, as well as evaluating the overall financial statement presentation. We believe that our audits provide a reasonable basis for our opinion.
In our opinion, the financial statements and financial highlights referred to above present fairly, in all material respects, the financial position of Federated Ohio Municipal Income Fund as of August 31, 2010, and the results of its operations for the year then ended, the changes in its net assets for each of the years in the two-year period then ended, and the financial highlights for each of the years or periods in the five-year period then ended, in conformity with U.S. generally accepted accounting principles.

Boston, Massachusetts
October 25, 2010
Board of Trustees and Trust Officers
The Board of Trustees is responsible for managing the Trust's business affairs and for exercising all the Trust's powers except those reserved for the shareholders. The following tables give information about each Trustee and the senior officers of the Fund. Where required, the tables separately list Trustees who are “interested persons” of the Fund (i.e., “Interested” Trustees) and those who are not (i.e., “Independent” Trustees). Unless otherwise noted, the address of each person listed is Federated Investors Tower, 1001 Liberty Avenue, Pittsburgh, PA 15222. The address of all Independent Trustees listed is 4000 Ericsson Drive, Warrendale, PA 15086-7561; Attention: Mutual Fund Board. As of December 31, 2009, the Trust comprised five portfolio(s), and the Federated Fund Family consisted of 43 investment companies (comprising 145 portfolios). Unless otherwise noted, each Officer is elected annually. Unless otherwise noted, each Trustee oversees all portfolios in the Federated Fund Family and serves for an indefinite term. The Fund's Statement of Additional Information includes additional information about Trust Trustees and is available, without charge and upon request, by calling 1-800-341-7400.
Interested TRUSTEES Background
| Name Birth Date Positions Held with Trust Date Service Began | Principal Occupation(s) for Past Five Years, Other Directorships Held and Previous Position(s) |
| John F. Donahue* Birth Date: July 28, 1924 Trustee Began serving: August 1990 | Principal Occupations: Director or Trustee of the Federated Fund Family; Chairman and Director, Federated Investors, Inc.; Chairman of the Federated Fund Family's Executive Committee. Previous Positions: Chairman of the Federated Fund Family; Trustee, Federated Investment Management Company; Chairman and Director, Federated Investment Counseling. |
| J. Christopher Donahue* Birth Date: April 11, 1949 PRESIDENT AND Trustee Began serving: August 1990 | Principal Occupations: Principal Executive Officer and President of the Federated Fund Family; Director or Trustee of some of the Funds in the Federated Fund Family; President, Chief Executive Officer and Director, Federated Investors, Inc.; Chairman and Trustee, Federated Investment Management Company; Trustee, Federated Investment Counseling; Chairman and Director, Federated Global Investment Management Corp.; Chairman, Federated Equity Management Company of Pennsylvania and Passport Research, Ltd. (investment advisory subsidiary of Federated); Trustee, Federated Shareholder Services Company; Director, Federated Services Company. Previous Positions: President, Federated Investment Counseling; President and Chief Executive Officer, Federated Investment Management Company, Federated Global Investment Management Corp. and Passport Research, Ltd. |
| * | Family relationships and reasons for “interested” status: John F. Donahue is the father of J. Christopher Donahue; both are “interested” due to their beneficial ownership of shares of Federated Investors, Inc. and the positions they hold with Federated and its subsidiaries. |
INDEPENDENT TRUSTEES Background
| Name Birth Date Positions Held with Trust Date Service Began | Principal Occupation(s) for Past Five Years, Other Directorships Held, Previous Position(s) and Qualifications |
| John T. Conroy, Jr., Ph.D. Birth Date: June 23, 1937 Trustee Began serving: August 1991 | Principal Occupations: Director or Trustee of the Federated Fund Family; Chairman of the Board, Investment Properties Corporation; Partner or Trustee in private real estate ventures in Southwest Florida; Assistant Professor in Theology, Blessed Edmund Rice School for Pastoral Ministry. Previous Positions: President, Investment Properties Corporation; Senior Vice President, John R. Wood and Associates, Inc., Realtors; President, Naples Property Management, Inc. and Northgate Village Development Corporation. Qualifications: Business management and director experience. |
| Nicholas P. Constantakis, CPA Birth Date: September 3, 1939 Trustee Began serving: February 1998 | Principal Occupation: Director or Trustee of the Federated Fund Family. Other Directorship Held: Director and Chairman of the Audit Committee, Michael Baker Corporation (architecture, engineering and construction services). Previous Position: Partner, Andersen Worldwide SC. Qualifications: Public accounting and director experience. |
| John F. Cunningham Birth Date: March 5, 1943 Trustee Began serving: July 1999 | Principal Occupation: Director or Trustee of the Federated Fund Family. Other Directorships Held: Chairman, President and Chief Executive Officer, Cunningham & Co., Inc. (strategic business consulting); Trustee Associate, Boston College. Previous Positions: Director, Redgate Communications and EMC Corporation (computer storage systems); Chairman of the Board and Chief Executive Officer, Computer Consoles, Inc.; President and Chief Operating Officer, Wang Laboratories; Director, First National Bank of Boston; Director, Apollo Computer, Inc. Qualifications: Business management and director experience. |
| Maureen Lally-Green Birth Date: July 5, 1949 Trustee Began serving: August 2009 | Principal Occupations: Director or Trustee of the Federated Fund Family; Director, Office of Church Relations, Diocese of Pittsburgh; Adjunct Professor of Law, Duquesne University School of Law. Other Directorships Held: Director, Auberle; Trustee, St. Francis University; Director, Ireland Institute of Pittsburgh; Director, UPMC Mercy Hospital; Regent, St. Vincent Seminary; Director, Epilepsy Foundation of Western and Central Pennsylvania; Director, Saint Thomas More Society, Allegheny County; Director, Carlow University. Previous Position: Pennsylvania Superior Court Judge. Qualifications: Legal and director experience. |
| Name Birth Date Positions Held with Trust Date Service Began | Principal Occupation(s) for Past Five Years, Other Directorships Held, Previous Position(s) and Qualifications |
| Peter E. Madden Birth Date: March 16, 1942 Trustee Began serving: August 1991 | Principal Occupation: Director or Trustee, and Chairman of the Board of Directors or Trustees, of the Federated Fund Family. Other Directorship Held: Board of Overseers, Babson College. Previous Positions: Representative, Commonwealth of Massachusetts General Court; President, Chief Operating Officer and Director, State Street Bank and Trust Company and State Street Corporation (retired); Director, VISA USA and VISA International; Chairman and Director, Massachusetts Bankers Association; Director, Depository Trust Corporation; Director, The Boston Stock Exchange. Qualifications: Business management, mutual fund services and director experience. |
| Charles F. Mansfield, Jr. Birth Date: April 10, 1945 Trustee Began serving: January 1999 | Principal Occupations: Director or Trustee and Chairman of the Audit Committee of the Federated Fund Family; Management Consultant. Previous Positions: Chief Executive Officer, PBTC International Bank; Partner, Arthur Young & Company (now Ernst & Young LLP); Chief Financial Officer of Retail Banking Sector, Chase Manhattan Bank; Senior Vice President, HSBC Bank USA (formerly, Marine Midland Bank); Vice President, Citibank; Assistant Professor of Banking and Finance, Frank G. Zarb School of Business, Hofstra University; Executive Vice President, DVC Group, Inc. (marketing, communications and technology). Qualifications: Banking, business management, public accounting and director experience. |
| R. James Nicholson Birth Date: February 4, 1938 Trustee Began serving: January 2008 | Principal Occupations: Director or Trustee of the Federated Fund Family; Senior Counsel, Brownstein Hyatt Farber Schrek, P.C.; Former Secretary of the U.S. Dept. of Veterans Affairs; Former U.S. Ambassador to the Holy See; Former Chairman of the Republican National Committee. Other Directorships Held: Director, Horatio Alger Association; Director, The Daniels Fund. Previous Positions: Colonel, U.S. Army Reserve; Partner, Calkins, Kramer, Grimshaw and Harring, P.C.; General Counsel, Colorado Association of Housing and Building; Chairman and CEO, Nicholson Enterprises, Inc. (real estate holding company); Chairman and CEO, Renaissance Homes of Colorado. Qualifications: Legal, government, business management and mutual fund director experience. |
| Name Birth Date Positions Held with Trust Date Service Began | Principal Occupation(s) for Past Five Years, Other Directorships Held, Previous Position(s) and Qualifications |
| Thomas M. O'Neill Birth Date: June 14, 1951 Trustee Began serving: October 2006 | Principal Occupations: Director or Trustee of the Federated Fund Family; Sole Proprietor, Navigator Management Company (investment and strategic consulting). Other Directorships Held: Board of Overseers, Children's Hospital of Boston; Visiting Committee on Athletics, Harvard College. Previous Positions: Chief Executive Officer and President, Managing Director and Chief Investment Officer, Fleet Investment Advisors; President and Chief Executive Officer, Aeltus Investment Management, Inc.; General Partner, Hellman, Jordan Management Co., Boston, MA; Chief Investment Officer, The Putnam Companies, Boston, MA; Credit Analyst and Lending Officer, Fleet Bank; Director and Consultant, EZE Castle Software (investment order management software); Director, Midway Pacific (lumber). Qualifications: Business management, mutual fund, director and investment experience. |
| John S. Walsh Birth Date: November 28, 1957 Trustee Began serving: July 1999 | Principal Occupations: Director or Trustee of the Federated Fund Family; President and Director, Heat Wagon, Inc. (manufacturer of construction temporary heaters); President and Director, Manufacturers Products, Inc. (distributor of portable construction heaters); President, Portable Heater Parts, a division of Manufacturers Products, Inc. Previous Position: Vice President, Walsh & Kelly, Inc. Qualifications: Business management and director experience. |
| James F. Will Birth Date: October 12, 1938 Trustee Began serving: April 2006 | Principal Occupations: Director or Trustee of the Federated Fund Family; formerly, Vice Chancellor and President, Saint Vincent College. Other Directorships Held: Trustee, Saint Vincent College; Alleghany Corporation. Previous Positions: Chairman, President and Chief Executive Officer, Armco, Inc.; President and Chief Executive Officer, Cyclops Industries; President and Chief Operating Officer, Kaiser Steel Corporation. Qualifications: Business management, education and director experience. |
| Name Birth Date Positions Held with Trust Date Service Began | Principal Occupation(s) for Past Five Years and Previous Position(s) |
| John W. McGonigle Birth Date: October 26, 1938 EXECUTIVE VICE PRESIDENT AND SECRETARY Began serving: August 1990 | Principal Occupations: Executive Vice President and Secretary of the Federated Fund Family; Vice Chairman, Executive Vice President, Secretary and Director, Federated Investors, Inc. Previous Positions: Trustee, Federated Investment Management Company and Federated Investment Counseling; Director, Federated Global Investment Management Corp., Federated Services Company and Federated Securities Corp. |
| Richard A. Novak Birth Date: December 25, 1963 TREASURER Began serving: January 2006 | Principal Occupations: Principal Financial Officer and Treasurer of the Federated Fund Family; Senior Vice President, Federated Administrative Services; Financial and Operations Principal for Federated Securities Corp., Edgewood Services, Inc. and Southpointe Distribution Services, Inc. Previous Positions: Controller of Federated Investors, Inc.; Vice President, Finance of Federated Services Company; held various financial management positions within The Mercy Hospital of Pittsburgh; Auditor, Arthur Andersen & Co. |
| Richard B. Fisher Birth Date: May 17, 1923 VICE CHAIRMAN Began serving: August 2002 | Principal Occupations: Vice Chairman or Vice President of some of the Funds in the Federated Fund Family; Vice Chairman, Federated Investors, Inc.; Chairman, Federated Securities Corp. Previous Positions: President and Director or Trustee of some of the Funds in the Federated Fund Family; Executive Vice President, Federated Investors, Inc.; Director and Chief Executive Officer, Federated Securities Corp. |
| Brian P. Bouda Birth Date: February 28, 1947 SENIOR VICE PRESIDENT AND CHIEF COMPLIANCE OFFICER Began serving: August 2004 | Principal Occupations: Senior Vice President and Chief Compliance Officer of the Federated Fund Family; Vice President and Chief Compliance Officer of Federated Investors, Inc. and Chief Compliance Officer of its subsidiaries. Mr. Bouda joined Federated in 1999 and is a member of the American Bar Association and the State Bar Association of Wisconsin. |
| Mary Jo Ochson Birth Date: September 12, 1953 CHIEF INVESTMENT OFFICER Began serving: May 2004 | Principal Occupations: Mary Jo Ochson was named Chief Investment Officer of tax-exempt, fixed-income products in 2004 and Chief Investment Officer of Tax-Free Money Markets in 2010. She joined Federated in 1982 and has been a Senior Portfolio Manager and a Senior Vice President of the Fund's Adviser since 1996. Ms. Ochson has received the Chartered Financial Analyst designation and holds an M.B.A. in Finance from the University of Pittsburgh. |
| J. Scott Albrecht Birth Date: June 1, 1960 VICE PRESIDENT Began serving: November 1998 | Principal Occupations: J. Scott Albrecht has been the Fund's portfolio manager since March 1995. He is Vice President of the Trust. Mr. Albrecht joined Federated in 1989. He became a Senior Vice President of the Fund's Adviser in January 2005 and served as a Vice President of the Fund's Adviser from 1994 through 2004. He has been a Senior Portfolio Manager since 1997 and was a Portfolio Manager from 1994 to 1996. Mr. Albrecht has received the Chartered Financial Analyst designation and holds an M.S. in Public Management from Carnegie Mellon University. |
Evaluation and Approval of Advisory Contract - May 2010
Federated Ohio Municipal Income Fund (the “Fund”)
The Fund's Board reviewed the Fund's investment advisory contract at meetings held in May 2010. The Board's decision regarding the contract reflects the exercise of its business judgment on whether to continue the existing arrangements.
In this connection, the Federated funds' Board had previously appointed a Senior Officer, whose duties include specified responsibilities relating to the process by which advisory fees are to be charged to a Federated fund. The Senior Officer has the authority to retain consultants, experts, or staff as may be reasonably necessary to assist in the performance of his duties, reports directly to the Board, and may be terminated only with the approval of a majority of the independent members of the Board. The Senior Officer prepared and furnished to the Board an independent, written evaluation that covered topics discussed below. The Board considered that evaluation, along with other information, in deciding to approve the advisory contract.
During its review of the contract, the Board considered compensation and benefits received by the Adviser. This included the fees received for services provided to the Fund by other entities in the Federated organization and research services (if any) received by the Adviser from brokers that execute Federated fund trades, as well as advisory fees. The Board is also familiar with and considered judicial decisions concerning allegedly excessive investment advisory fees, which have indicated that the following factors may be relevant to an Adviser's fiduciary duty with respect to its receipt of compensation from a fund: the nature and quality of the services provided by the Adviser, including the performance of the fund; the Adviser's cost of providing the services; the extent to which the Adviser may realize “economies of scale” as a fund grows larger; any indirect benefits that may accrue to the Adviser and its affiliates as a result of the Adviser's relationship with a fund; performance and expenses of comparable funds; and the extent to which the independent Board members are fully informed about all facts the Board deems relevant bearing on the Adviser's services and fees. The Board further considered management fees (including any components thereof) charged to institutional and other clients of the Adviser for what might be viewed as like services, and the cost to the Adviser and its affiliates of supplying services pursuant to the management fee agreements, excluding any intra-corporate profit and profit margins of the Adviser and its affiliates for supplying such services. The Board was aware of these factors and was guided by them in its review of the Fund's advisory contract to the extent it considered them to be appropriate and relevant, as discussed further below.
Annual Shareholder ReportThe Senior Officer reviewed reports compiled by Federated, using data supplied by independent fund ranking organizations, regarding the performance of, and fees charged by, other mutual funds, noting his view that comparisons to fund peer groups are relevant in judging the reasonableness of proposed fees.
The Fund's performance fell below the median of the relevant peer group for the one-year, three-year and five-year periods covered by the report. The Board discussed the Fund's performance with the Adviser and recognized the efforts being undertaken by the Adviser. The Board will continue to monitor these efforts and the performance of the Fund.
The Board also received financial information about Federated, including reports on the compensation and benefits Federated derived from its relationships with the Federated funds. These reports covered not only the fees under the advisory contracts, but also fees received by Federated's subsidiaries for providing other services to the Federated funds under separate contracts (e.g., for serving as the Federated funds' administrator). The reports also discussed any indirect benefit Federated may derive from its receipt of research services from brokers who execute Federated fund trades. In addition, the Board considered the fact that, in order for a fund to be competitive in the marketplace, Federated and its affiliates frequently waived fees and/or Annual Shareholder ReportFederated furnished reports, requested by the Senior Officer, that reported revenues on a fund-by-fund basis and made estimates of the allocation of expenses on a fund-by-fund basis, using allocation methodologies specified by the Senior Officer. The Senior Officer noted that, although they may apply consistent allocation processes, the inherent difficulties in allocating costs (and the unavoidable arbitrary aspects of that exercise) and the lack of consensus on how to allocate those costs may render such allocation reports unreliable. The allocation reports were considered in the analysis by the Board but were determined to be of limited use.
The Board and the Senior Officer also reviewed a report compiled by Federated comparing profitability information for Federated to other publicly held fund management companies. In this regard, the Senior Officer noted the limited availability of such information, but nonetheless concluded that Federated's profit margins did not appear to be excessive and the Board agreed.
The Senior Officer's evaluation also discussed the notion of possible realization of “economies of scale” as a fund grows larger. The Board considered in this regard that the Adviser has made significant and long-term investments in areas that support all of the Federated funds, such as personnel and processes for the portfolio management, compliance, and risk management functions; and systems technology; and that the benefits of these efforts (as well as any economies, should they exist) were likely to be enjoyed by the fund complex as a whole. Finally, the Board also noted the absence of any applicable regulatory or industry guidelines on this subject, which (as discussed in the Senior Officer's evaluation) is compounded by the lack of any common industry practice or general pattern with respect to structuring fund advisory fees with “breakpoints” that serve to reduce the fee as the fund attains a certain size. The Senior Officer did not recommend institution of breakpoints in pricing Federated's fund advisory services at this time.
It was noted in the materials for the Board meeting that for the period covered by the report, the Fund's investment advisory fee, after waivers and expense reimbursements, if any, was below the median of the relevant peer group. The Board reviewed the fees and other expenses of the Fund with the Adviser and was satisfied that the overall expense structure of the Fund remained competitive.
The Senior Officer's evaluation noted his belief that the information and observations contained in his evaluation supported a finding that the proposed management fees are reasonable, and that Federated appeared to provide appropriate administrative services to the Fund for the fees paid. Under these Annual Shareholder ReportIn its decision to continue an existing investment advisory contract, the Board was mindful of the potential disruptions of the Fund's operations and various risks, uncertainties and other effects that could occur as a result of a decision to terminate or not renew an advisory contract. In particular, the Board recognized that many shareholders have invested in the Fund on the strength of the Adviser's industry standing and reputation and with the expectation that the Adviser will have a continuing role in providing advisory services to the Fund. Thus, the Board's approval of the advisory contract reflected the fact that it is the shareholders who have effectively selected the Adviser by virtue of having invested in the Fund.
The Board based its decision to approve the advisory contract on the totality of the circumstances and relevant factors and with a view to past and future long-term considerations. Not all of the factors and considerations identified above were necessarily relevant to the Fund, nor did the Board consider any one of them to be determinative. With respect to the factors that were relevant, the Board's decision to approve the contract reflects its determination that Federated's performance and actions provided a satisfactory basis to support the decision to continue the existing arrangements.
Annual Shareholder ReportVoting Proxies on Fund Portfolio Securities
A description of the policies and procedures that the Fund uses to determine how to vote proxies, if any, relating to securities held in the Fund's portfolio is available, without charge and upon request, by calling 1-800-341-7400. A report on “Form N-PX” of how the Fund voted any such proxies during the most recent 12-month period ended June 30 is available from Federated's website at FederatedInvestors.com. To access this information from the “Products” section of the website, click on the “Prospectuses and Regulatory Reports” link under “Related Information,” then select the appropriate link opposite the name of the Fund; or select the name of the Fund and from the Fund's page, click on the “Prospectuses and Regulatory Reports” link. Form N-PX filings are also available at the SEC's website at www.sec.gov.
Quarterly Portfolio Schedule
The Fund files with the SEC a complete schedule of its portfolio holdings, as of the close of the first and third quarters of its fiscal year, on “Form N-Q.” These filings are available on the SEC's website at www.sec.gov and may be reviewed and copied at the SEC's Public Reference Room in Washington, DC. (Call 1-800-SEC-0330 for information on the operation of the Public Reference Room.) You may also access this information from the “Products” section of Federated's website at FederatedInvestors.com by clicking on “Portfolio Holdings” under “Related Information,” then selecting the appropriate link opposite the name of the Fund; or select the name of the Fund and from the Fund's page, click on the “Portfolio Holdings” link.
Annual Shareholder ReportMutual funds are not bank deposits or obligations, are not guaranteed by any bank and are not insured or guaranteed by the U.S. government, the Federal Deposit Insurance Corporation, the Federal Reserve Board or any other government agency. Investment in mutual funds involves investment risk, including the possible loss of principal.
This Report is authorized for distribution to prospective investors only when preceded or accompanied by the Trust's Prospectus, which contains facts concerning its objective and policies, management fees, expenses and other information.

Federated Ohio Municipal Income Fund
Federated Investors Funds
4000 Ericsson Drive
Warrendale, PA 15086-7561
Contact us at FederatedInvestors.com
or call 1-800-341-7400.
Federated Securities Corp., Distributor
Cusip 313923823
Cusip 313923609
28994 (10/10)
Federated is a registered mark of Federated Investors, Inc.
2010 © Federated Investors, Inc.
Federated Pennsylvania Municipal Income Fund
Established 1990
A Portfolio of Federated Municipal Securities Income Trust
ANNUAL SHAREHOLDER REPORT
August 31, 2010
Class A Shares
Class B Shares
FINANCIAL HIGHLIGHTS
SHAREHOLDER EXPENSE EXAMPLE
MANAGEMENT'S DISCUSSION OF FUND PERFORMANCE
PORTFOLIO OF INVESTMENTS SUMMARY TABLE
PORTFOLIO OF INVESTMENTS
STATEMENT OF ASSETS AND LIABILITIES
STATEMENT OF OPERATIONS
STATEMENT OF CHANGES IN NET ASSETS
NOTES TO FINANCIAL STATEMENTS
REPORT OF INDEPENDENT REGISTERED PUBLIC ACCOUNTING FIRM
BOARD OF TRUSTEES AND TRUST OFFICERS
EVALUATION AND APPROVAL OF ADVISORY CONTRACT
VOTING PROXIES ON FUND PORTFOLIO SECURITIES
QUARTERLY PORTFOLIO SCHEDULE
Financial Highlights - Class A Shares
(For a Share Outstanding Throughout Each Period)
| Year Ended August 31 | 2010 | 2009 | 2008 | 2007 | 2006 |
| Net Asset Value, Beginning of Period | $10.37 | $10.70 | $11.22 | $11.63 | $11.81 |
| Income From Investment Operations: |
| Net investment income | 0.43 | 0.47 | 0.47 | 0.50 | 0.52 |
| Net realized and unrealized gain (loss) on investments, futures contracts and swap contracts | 0.55 | (0.34) | (0.52) | (0.41) | (0.17) |
| TOTAL FROM INVESTMENT OPERATIONS | 0.98 | 0.13 | (0.05) | 0.09 | 0.35 |
| Less Distributions: |
| Distributions from net investment income | (0.43) | (0.46) | (0.47) | (0.50) | (0.53) |
| Net Asset Value, End of Period | $10.92 | $10.37 | $10.70 | $11.22 | $11.63 |
| Total Return1 | 9.60% | 1.46% | (0.44)% | 0.70% | 3.03% |
| Ratios to Average Net Assets: |
| Net expenses | 0.75% | 0.75% | 0.75%2 | 0.82%3 | 0.86%3 |
| Net investment income | 4.04% | 4.65% | 4.30% | 4.34% | 4.49% |
| Expense waiver/reimbursement4 | 0.09% | 0.10% | 0.09% | 0.09% | 0.09% |
| Supplemental Data: |
| Net assets, end of period (000 omitted) | $270,219 | $276,442 | $281,863 | $282,386 | $263,534 |
| Portfolio turnover | 12% | 13% | 19% | 23% | 17% |
| 1 | Based on net asset value, which does not reflect the sales charge, redemption fee or contingent deferred sales charge, if applicable. |
| 2 | The net expense ratio is calculated without reduction for expense offset arrangements. The net expense ratio for the year ended August 31, 2008, is 0.75% after taking into account this expense reduction. |
| 3 | Includes interest and trust expenses related to the Fund's participation in certain inverse floater structures of 0.07% and 0.11% for the years ended August 31, 2007 and 2006, respectively. |
| 4 | This expense decrease is reflected in both the net expense and net investment income ratios shown above. |
See Notes which are an integral part of the Financial Statements
Annual Shareholder ReportFinancial Highlights - Class B Shares
(For a Share Outstanding Throughout Each Period)
| Year Ended August 31 | 2010 | 2009 | 2008 | 2007 | 2006 |
| Net Asset Value, Beginning of Period | $10.37 | $10.69 | $11.22 | $11.63 | $11.81 |
| Income From Investment Operations: |
| Net investment income | 0.35 | 0.39 | 0.39 | 0.41 | 0.43 |
| Net realized and unrealized gain (loss) on investments, futures contracts and swap contracts | 0.54 | (0.33) | (0.53) | (0.41) | (0.18) |
| TOTAL FROM INVESTMENT OPERATIONS | 0.89 | 0.06 | (0.14) | — | 0.25 |
| Less Distributions: |
| Distributions from net investment income | (0.34) | (0.38) | (0.39) | (0.41) | (0.43) |
| Net Asset Value, End of Period | $10.92 | $10.37 | $10.69 | $11.22 | $11.63 |
| Total Return1 | 8.76% | 0.77% | (1.30)% | (0.08)% | 2.23% |
| Ratios to Average Net Assets: |
| Net expenses | 1.52% | 1.52% | 1.52%2 | 1.59%3 | 1.63%3 |
| Net investment income | 3.27% | 3.90% | 3.53% | 3.56% | 3.73% |
| Expense waiver/reimbursement4 | 0.07% | 0.08% | 0.08% | 0.08% | 0.09% |
| Supplemental Data: |
| Net assets, end of period (000 omitted) | $16,071 | $20,671 | $27,298 | $34,860 | $47,213 |
| Portfolio turnover | 12% | 13% | 19% | 23% | 17% |
| 1 | Based on net asset value, which does not reflect the sales charge, redemption fee or contingent deferred sales charge, if applicable. |
| 2 | The net expense ratio is calculated without reduction for expense offset arrangements. The net expense ratio for the year ended August 31, 2008, is 1.52% after taking into account this expense reduction. |
| 3 | Includes interest and trust expenses related to the Fund's participation in certain inverse floater structures of 0.07% and 0.11% for the years ended August 31, 2007 and 2006, respectively. |
| 4 | This expense decrease is reflected in both the net expense and net investment income ratios shown above. |
See Notes which are an integral part of the Financial Statements
Annual Shareholder ReportShareholder Expense Example (unaudited)
As a shareholder of the Fund, you incur two types of costs: (1) transaction costs, including sales charges (loads) on purchase or redemption payments; and (2) ongoing costs, including management fees and to the extent applicable, distribution (12b-1) fees and/or shareholder services fees and other Fund expenses. This Example is intended to help you to understand your ongoing costs (in dollars) of investing in the Fund and to compare these costs with the ongoing costs of investing in other mutual funds. It is based on an investment of $1,000 invested at the beginning of the period and held for the entire period from March 1, 2010 to August 31, 2010.
The first section of the table below provides information about actual account values and actual expenses. You may use the information in this section, together with the amount you invested, to estimate the expenses that you incurred over the period. Simply divide your account value by $1,000 (for example, an $8,600 account value divided by $1,000 = 8.6), then multiply the result by the number in the first section under the heading entitled “Expenses Paid During Period” to estimate the expenses attributable to your investment during this period.
HYPOTHETICAL EXAMPLE FOR COMPARISON PURPOSES
The second section of the table below provides information about hypothetical account values and hypothetical expenses based on the Fund's actual expense ratio and an assumed rate of return of 5% per year before expenses, which is not the Fund's actual return. Thus, you should not use the hypothetical account values and expenses to estimate the actual ending account balance or your expenses for the period. Rather, these figures are required to be provided to enable you to compare the ongoing costs of investing in the Fund with other funds. To do so, compare this 5% hypothetical example with the 5% hypothetical examples that appear in the shareholder reports of the other funds.
Annual Shareholder Report| Beginning Account Value 3/1/2010 | Ending Account Value 8/31/2010 | Expenses Paid During Period1 |
| Actual: |
| Class A Shares | $1,000 | $1,049.90 | $3.88 |
| Class B Shares | $1,000 | $1,045.80 | $7.84 |
| Hypothetical (assuming a 5% return before expenses): |
| Class A Shares | $1,000 | $1,021.42 | $3.82 |
| Class B Shares | $1,000 | $1,017.54 | $7.73 |
| 1 | Expenses are equal to the Fund's annualized net expense ratios, multiplied by the average account value over the period, multiplied by 184/365 (to reflect the one-half-year period). The annualized net expense ratios are as follows: |
| Class A Shares | 0.75% |
| Class B Shares | 1.52% |
Performance data quoted represents past performance which is no guarantee of future results. Investment return and principal value will fluctuate so that an investor's shares, when redeemed, may be worth more or less than their original cost. Mutual fund performance changes over time and current performance may be lower or higher than what is stated. For current to the most recent month-end performance and after-tax returns, visit FederatedInvestors.com or call 1-800-341-7400.
Management's Discussion of Fund Performance
The Fund's total return, based on net asset value, for the 12-month reporting period ended August 31, 2010, was 9.60% for Class A Shares and 8.76% for Class B Shares. The total return of the S&P/Investortools Municipal Bond Pennsylvania Index (PA Index),1 a broad-based securities market index, was 9.85% during the same period. The Fund's total return for the most recently completed fiscal year reflected actual cash flows, transaction costs and other expenses, which were not reflected in the total return of the PA Index.
| 1 | The Fund's investment adviser has elected to change the Fund's broad-based securities market index to the PA Index from the Barclays Capital Pennsylvania Municipal Bond Index (BCPAMB). The PA Index is more representative of the securities in which the Fund invests. The PA Index consists of bonds in the S&P/Investortools Municipal Bond Index (Main Index) that have been issued by the Commonwealth of Pennsylvania or local governments or state or local government entities within Pennsylvania. The Main Index is a broad, comprehensive, market value-weighted index composed of approximately 55,000 bond issues that are exempt from U.S. federal income taxes or subject to the alternative minimum tax (AMT). Eligibility criteria for inclusion in the Main Index include, but are not limited to: the bond issuer must be a state (including the Commonwealth of Puerto Rico and U.S. territories) or a local government or agency where interest on the bond is exempt from U.S. federal income taxes or subject to the AMT; the bond must be held by a mutual fund for which Standard & Poor's Securities Evaluations, Inc. provides prices; it must be denominated in U.S. dollars and have a minimum par amount of $2 million; and the bond must have a minimum term to maturity and/or call date greater than or equal to one calendar month. The Main Index is rebalanced monthly. The total return of the BCPAMB during the 12-month reporting period was 9.10%. The BCPAMB is an unmanaged, market value-weighted index for the long-term, tax-exempt bond market comprising investment-grade, tax-exempt and fixed-rate bonds issued in the Commonwealth of Pennsylvania. To be included in the index, bonds must have a minimum credit rating of Baa, an outstanding par value of at least $7 million and be issued as part of a transaction of at least $75 million. The bonds must be fixed-rate, have an issue date after December 31, 1990, and must be at least one year from their maturity date, as well as have been issued in the particular state. The BCPAMB includes both zero coupon bonds and bonds subject to the AMT. Neither the PA Index nor the BCPAMB are adjusted to reflect sales charges, expenses and other fees that the Securities and Exchange Commission (SEC) requires to be reflected in the Fund's performance. It is not possible to invest directly in an index. |
The following discussion focuses on the performance of the Fund's Class A Shares. The 9.60% total return of the Class A Shares for the reporting period consisted of 4.30% of tax-exempt dividends and reinvestments and 5.30% of price appreciation in the net asset value of the shares.4
During the 12-month reporting period, the pace of recovery in output and employment slowed with tight credit, modest income growth and lower housing wealth being major contributors to the economic environment. Yields on nominal Treasury coupon securities fell noticeably during the period, and Treasury auctions were generally well received. The pace of economic recovery was more modest than had been anticipated and inflation remained subdued. To help support economic recovery, the Federal Reserve Board (the “Fed”) kept constant its holdings of securities at the current levels by reinvesting principal payments from agency debt and mortgage-backed securities in longer term Treasury securities and rolling over its holdings of Treasury debt as it matured. The Fed maintained the target range for the federal funds rate between 0.00% and 0.25% during the entire period.
The Commonwealth of Pennsylvania continued to have one of the oldest populations in the U.S. with a median age of 39.9 years, three years above the national median level. The Commonwealth continued to maintain a moderate debt burden and a diversifying economy but continued to have weak revenue growth. The Commonwealth continued to draw upon its sizable reserves amid measures to maintain budget balance. The Pennsylvania economy continued to diversify away from manufacturing; strong employment in education and health services continued to be a stabilizing factor. The pension system has historically been well funded.
| 2 | Duration is a measure of a security's price sensitivity to changes in interest rates. Securities with longer durations are more sensitive to changes in interest rates than securities with shorter durations. For purposes of this Management's Discussion of Fund Performance, duration is determined using a third-party analytical system. |
| 3 | Bond prices are sensitive to changes in interest rates and a rise in interest rates can cause a decline in their prices. |
| 4 | Income may be subject to the AMT for individuals and corporations. |
The credit fundamentals of the tax-exempt municipal bond market have shown continued deterioration in such credit factors as pension funding requirements, real estate values and revenue growth.
As determined at the end of the 12-month reporting period, the Fund's dollar-weighted average duration for the reporting period was 6.2 years. Duration management was a significant component of the Fund's investment strategy. The shorter a fund's duration relative to an index, the less its net asset value will react as interest rates change. The Fund adjusted duration relative to the PA Index several times during the reporting period. Tax-exempt municipal bond yields declined significantly during the period as the market stabilized and then recovered from a near crisis environment to one of improved liquidity, a near zero Federal funds rate and increased investment activity. As a result, the Fund's duration underweight (90%) relative to the PA Index detracted from Fund performance.
During the 12-month reporting period, the Fund maintained a higher portfolio allocation to securities issued by multi-family housing issuers, public power authorities and life care providers. These allocations helped the Fund's performance due to the narrowing of credit spreads within these sectors. The Fund also had less of an allocation to industrial development debt and hospitals than the PA Index. These sectors outperformed the PA Index during the period and detracted from performance.
Annual Shareholder ReportRisk-aversion by investors subsided as the financial markets stabilized and a preference for yield resulted in the outperformance of bonds rated A and BBB (and unrated bonds of similar quality)5 relative to bonds rated in the higher rating categories (or unrated bonds of similar quality). With the decrease in credit spreads during the period and the narrowing of credit spreads to a greater extent for A- and BBB-rated (or comparable quality) debt, the Fund's overweight, relative to the PA Index, in BBB-rated debt during the reporting period helped the Fund's performance as the yield on BBB-rated debt decreased to a greater extent than for other investment-grade securities.6 Also, the Fund's weighting in BB-rated debt relative to the PA Index's zero weighting in that rating category resulted in a positive contribution to Fund performance for the same reasons.
| 5 | Credit ratings pertain only to the securities in the portfolio and do not protect Fund shares against market risk. |
| 6 | Investment-grade securities are securities that are rated at least “BBB” or unrated securities of a comparable quality. Noninvestment-grade securities are securities that are not rated at least “BBB” or unrated securities of a comparable quality. Credit ratings are an indication of the risk that a security will default. They do not protect a security from credit risk. Lower-rated bonds typically offer higher yields to help compensate investors for the increased risk associated with them. Among these risks are lower credit worthiness, greater price volatility, more risk to principal and income than with higher-rated securities and increased possibilities of default. |
GROWTH OF A $10,000 INVESTMENT - CLASS A SHARES
The graph below illustrates the hypothetical investment of $10,0001 in Federated Pennsylvania Municipal Income Fund (Class A Shares) (the “Fund”) from August 31, 2000 to August 31, 2010, compared to the S&P/Investortools Municipal Bond Pennsylvania Index (PA Index),2 the Barclays Capital Pennsylvania Municipal Bond Index (BCPAMB),2 the S&P/Investortools Municipal Bond PA, Investment Grade, 3-Year Plus Sub-Index (PAIG Index),2and the Morningstar Municipal Pennsylvania Funds Category Average (MSTARMPA).2
| Average Annual Total Returns3 for the Period Ended 8/31/2010 |
| 1 Years | 4.66% |
| 5 Years | 1.86% |
| 10 Years | 4.00% |
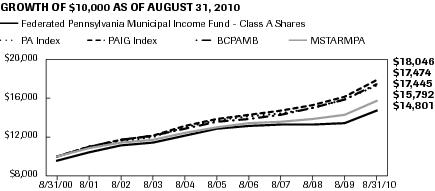
Performance data quoted represents past performance which is no guarantee of future results. Investment return and principal value will fluctuate so that an investor's shares, when redeemed, may be worth more or less than their original cost. Mutual fund performance changes over time and current performance may be lower or higher than what is stated. For current to the most recent month-end performance and after-tax returns, visit FederatedInvestors.com or call 1-800-341-7400. Returns shown do not reflect the deduction of taxes that a shareholder would pay on Fund distributions or the redemption of Fund shares. Mutual funds are not obligations of or guaranteed by any bank and are not federally insured. Total returns shown include the maximum sales charge of 4.50%.
Annual Shareholder Report| 1 | Represents a hypothetical investment of $10,000 in the Fund after deducting the maximum sales charge of 4.50% ($10,000 investment minus $450 sales charge = $9,550). The Fund's performance assumes the reinvestment of all dividends and distributions. The PA Index, BCPAMB, PAIG Index and MSTARMPA have each been adjusted to reflect reinvestment of dividends on securities in the index and average. |
| 2 | The Fund's investment adviser has elected to change the Fund's broad-based securities market index to the PA Index from the BCPAMB. The PA Index is more representative of the securities in which the fund invests. The PA Index consists of bonds in the S&P/Investortools Municipal Bond Index (Main Index) that have been issued by the Commonwealth of Pennsylvania or local governments or state or local government entities within Pennsylvania. The Main Index is a broad, comprehensive, market value-weighted index composed of approximately 55,000 bond issues that are exempt from U.S. federal income taxes or subject to the alternative minimum tax (AMT). Eligibility criteria for inclusion in the Main Index include, but are not limited to: the bond issuer must be a state (including the Commonwealth of Puerto Rico and U.S. territories) or local government or state or local government entity where interest on the bond is exempt from U.S. federal income taxes or subject to the AMT; the bond must be held by a mutual fund for which Standard & Poor's Securities Evaluations, Inc. provides prices; it must be denominated in U.S. dollars and have a minimum par amount of $2 million; and the bond must have a minimum term to maturity and/or call date greater than or equal to one calendar month. The Main Index is rebalanced monthly. The BCPAMB is an unmanaged, market value-weighted index for the long-term, tax-exempt bond market comprising investment-grade, tax-exempt and fixed-rate bonds issued in the Commonwealth of Pennsylvania. To be included in the index, bonds must have a minimum credit rating of Baa, an outstanding par value of at least $7 million and be issued as part of a transaction of at least $75 million. The bonds must be fixed-rate, have an issue date after December 31, 1990, and must be at least one year from their maturity date, as well as have been issued in Pennsylvania. The PAIG Index represents the return of the portion of the PA Index composed solely of bonds that are rated at least BBB with remaining maturities of more than three years that are not subject to AMT. Neither the PA Index, BCPAMB nor the PAIG Index are adjusted to reflect sales charges, expenses and other fees that the Securities and Exchange Commission (SEC) requires to be reflected in the Fund's performance. The PA Index, BCPAMB and PAIG Index are unmanaged, and, unlike the Fund, are not affected by cash flows. It is not possible to invest directly in an index. Morningstar figures represent the average of the total returns reported by all the mutual funds designated by Morningstar as falling into the respective category indicated. Funds designated within the MSTARMPA include those that invest at least 80% of assets in Pennsylvania municipal debt and can include long-, intermediate- and short-duration portfolios. They do not reflect sales charges. |
| 3 | Total returns quoted reflect all applicable sales charges. |
GROWTH OF A $10,000 INVESTMENT - CLASS B SHARES
The graph below illustrates the hypothetical investment of $10,0001 in Federated Pennsylvania Municipal Income Fund (Class B Shares) (the “Fund”) from August 31, 2000 to August 31, 2010, compared to the S&P/Investortools Municipal Bond Pennsylvania Index (PA Index),2 the Barclays Capital Pennsylvania Municipal Bond Index (BCPAMB),2 S&P/Investortools Municipal Bond PA, Investment Grade, 3-Year Plus Sub-Index (PAIG Index),2 and the Morningstar Municipal Pennsylvania Funds Category Average (MSTARMPA).2
| Average Annual Total Return3 for the Period Ended 8/31/2010 |
| 1 Year | 3.26% |
| 5 Years | 1.67% |
| 10 Years | 3.83% |
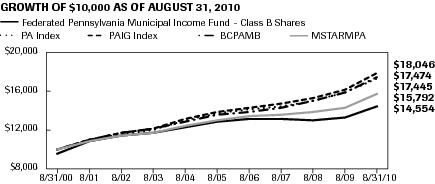
Performance data quoted represents past performance which is no guarantee of future results. Investment return and principal value will fluctuate so that an investor's shares, when redeemed, may be worth more or less than their original cost. Mutual fund performance changes over time and current performance may be lower or higher than what is stated. For current to the most recent month-end performance and after-tax returns, visit FederatedInvestors.com or call 1-800-341-7400. Returns shown do not reflect the deduction of taxes that a shareholder would pay on Fund distributions or the redemption of Fund shares. Mutual funds are not obligations of or guaranteed by any bank and are not federally insured. Total returns shown include the maximum contingent deferred sales charge of 5.50% as applicable.
Annual Shareholder Report| 1 | Represents a hypothetical investment of $10,000 in the Fund. The maximum contingent deferred sales charge is 5.50% of any redemption less than one year from the purchase date. The Fund's performance assumes the reinvestment of all dividends and distributions. The PA Index, BCPAMB, PAIG Index and MSTARMPA have been adjusted to reflect reinvestment of dividends on securities in the index and average. |
| 2 | The Fund's investment adviser has elected to change the Fund's broad-based securities market index to the PA Index from the BCPAMB. The PA Index is more representative of the securities in which the fund invests. The PA Index consists of bonds in the S&P/Investortools Municipal Bond Index (Main Index) that have been issued by the Commonwealth of Pennsylvania or local governments or state or local government entities within Pennsylvania. The Main Index is a broad, comprehensive, market value-weighted index composed of approximately 55,000 bond issues that are exempt from U.S. federal income taxes or subject to the alternative minimum tax (AMT). Eligibility criteria for inclusion in the Main Index include, but are not limited to: the bond issuer must be a state (including the Commonwealth of Puerto Rico and U.S. territories) or local government or state or local government entity where interest on the bond is exempt from U.S. federal income taxes or subject to the AMT; the bond must be held by a mutual fund for which Standard & Poor's Securities Evaluations, Inc. provides prices; it must be denominated in U.S. dollars and have a minimum par amount of $2 million; and the bond must have a minimum term to maturity and/or call date greater than or equal to one calendar month. The Main Index is rebalanced monthly. The BCPAMB is an unmanaged, market value-weighted index for the long-term, tax-exempt bond market comprising investment-grade, tax-exempt and fixed-rate bonds issued in the Commonwealth of Pennsylvania. To be included in the index, bonds must have a minimum credit rating of Baa, an outstanding par value of at least $7 million and be issued as part of a transaction of at least $75 million. The bonds must be fixed-rate, have an issue date after December 31, 1990, and must be at least one year from their maturity date, as well as have been issued in Pennsylvania. The PAIG Index represents the return of the portion of the PA Index composed solely of bonds that are rated at least BBB with remaining maturities of more than three years that are not subject to AMT. Neither the PA Index, BCPAMB nor the PAIG Index are adjusted to reflect sales charges, expenses and other fees that the SEC requires to be reflected in the Fund's performance. The PA Index, BCPAMB and PAIG Index are unmanaged, and, unlike the Fund, are not affected by cash flows. It is not possible to invest directly in an index. Morningstar figures represent the average of the total returns reported by all the mutual funds designated by Morningstar as falling into the respective category indicated. Funds designated within the MSTARMPA include those that invest at least 80% of assets in Pennsylvania municipal debt and can include long-, intermediate- and short-duration portfolios. They do not reflect sales charges. |
| 3 | Total returns quoted reflect all applicable contingent deferred sales charges. |
Portfolio of Investments Summary Table (unaudited)
At August 31, 2010 the Fund's sector composition1 was as follows:
| Sector Composition | Percentage of Total Net Assets |
| Government Obligation - Local | 18.7% |
| Education | 17.4% |
| Hospital | 13.8% |
| Pre-refunded | 10.8% |
| Water and Sewer | 9.7% |
| Government Obligation - State | 6.3% |
| Industrial Development Bond/Pollution Control Revenue | 3.8% |
| Multi-Family Housing | 3.6% |
| Single-Family Housing | 3.5% |
| Transportation | 2.4% |
| Other2 | 7.2% |
| Other Assets and Liabilities — Net3 | 2.8% |
| TOTAL | 100.0% |
| 1 | Sector classifications, and the assignment of holdings to such sectors, are based upon the economic sector and/or revenue source of the underlying obligor, as determined by the Fund's Adviser. For securities that have been enhanced by a third-party, including bond insurers and banks, sector classifications are based upon the economic sector and/or revenue source of the underlying obligor, as determined by the Fund's Adviser. Pre-refunded securities are those whose debt service is paid from escrowed assets, usually U.S. government securities. |
| 2 | For purposes of this table, sector classifications constitute 90.0% of the Fund's total net assets. Remaining sectors have been aggregated under the designation “Other.” |
| 3 | Assets, other than investments in securities, less liabilities. See Statement of Assets and Liabilities. |
Portfolio of Investments
August 31, 2010
| Principal Amount | Value |
| MUNICIPAL BONDS – 96.4% |
| Pennsylvania – 96.4% |
| $1,000,000 | Abington, PA School District, UT GO Bonds, 4.00% (FGIC and National Public Finance Guarantee Corporation INS), 10/1/2012 | 1,066,300 |
| 1,500,000 | Allegheny County Redevelopment Authority, Tax Increment Bonds (Series 2000A), 6.30% (Waterfront Project)/(United States Treasury PRF 12/15/2010@101), 12/15/2018 | 1,540,950 |
| 3,555,000 | Allegheny County, PA HDA, Hospital Revenue Bonds (Series 2008A), 5.00% (UPMC Health System), 6/15/2018 | 4,088,037 |
| 2,000,000 | Allegheny County, PA HDA, Refunding Revenue Bonds (Series 1998A), 5.125% (Jefferson Regional Medical Center, PA)/(Original Issue Yield: 5.34%), 5/1/2023 | 1,964,780 |
| 1,260,000 | Allegheny County, PA HDA, Revenue Bonds, 5.375% (Ohio Valley General Hospital, PA)/(Original Issue Yield: 5.50%), 1/1/2018 | 1,260,517 |
| 2,000,000 | Allegheny County, PA HDA, Revenue Bonds, 5.50% (Catholic Health East)/(Original Issue Yield: 5.60%), 11/15/2032 | 2,030,060 |
| 1,000,000 | Allegheny County, PA Higher Education Building Authority, Revenue Bonds (Series 2002A), 5.95% (Chatham College)/(Original Issue Yield: 5.97%), 3/1/2032 | 1,014,290 |
| 1,000,000 | Allegheny County, PA Higher Education Building Authority, Revenue Bonds (Series 2002B), 5.25% (Chatham College)/(Original Issue Yield: 5.35%), 11/15/2016 | 1,001,040 |
| 2,200,000 | Allegheny County, PA Higher Education Building Authority, University Revenue Bonds (Series 2006A), 4.75% (Robert Morris University), 2/15/2026 | 2,129,710 |
| 250,000 | Allegheny County, PA Higher Education Building Authority, University Revenue Bonds, 5.125% (Carnegie Mellon University)/(Original Issue Yield: 5.39%), 3/1/2032 | 261,330 |
| 1,000,000 | 1,2 | Allegheny County, PA IDA, Cargo Facilities Lease Revenue Bonds (Series 1999), 6.625% (AFCO Cargo PIT LLC Project)/(Original Issue Yield: 6.75%), 9/1/2024 | 897,440 |
| 1,385,000 | Allegheny County, PA IDA, Environmental Improvement Refunding Revenue Bonds (Series 2005), 5.50% (United States Steel Corp.), 11/1/2016 | 1,426,439 |
| 3,000,000 | Allegheny County, PA IDA, Environmental Improvement Revenue Refunding Bonds (Series 2009), 6.75% (United States Steel Corp.), 11/1/2024 | 3,316,920 |
| 900,000 | Allegheny County, PA IDA, Lease Revenue Bonds (Series 2001), 6.60% (Residential Resources, Inc. Project)/(United States Treasury PRF 9/1/2011@100)/(Original Issue Yield: 6.75%), 9/1/2031 | 953,730 |
| 885,000 | Allegheny County, PA IDA, Lease Revenue Bonds (Series 2006), 5.125% (Residential Resources, Inc. Project), 9/1/2031 | 808,996 |
| Principal Amount | Value |
| $1,500,000 | Allegheny County, PA IDA, Revenue Refunding Bonds, 4.05% (Duquesne Light Power Co.)/(AMBAC Assurance Corporation INS), 9/1/2011 | 1,532,655 |
| 1,435,000 | Allegheny County, PA, UT GO Bonds, 5.00% (Assured Guaranty Corp. INS), 12/1/2033 | 1,541,161 |
| 2,000,000 | Allentown, PA School District, UT GO Bonds (Series 2008A), 5.00%, 2/15/2023 | 2,220,960 |
| 3,000,000 | Bradford County, PA IDA, Solid Waste Disposal Refunding Revenue Bonds (Series 2005A), 4.70% (International Paper Co.), 3/1/2019 | 3,016,200 |
| 750,000 | Bucks County, PA IDA, Revenue Bonds (Series 2002A), 6.00% (Pennswood Village)/(United States Treasury PRF 10/1/2012@101)/(Original Issue Yield: 6.12%), 10/1/2027 | 840,795 |
| 500,000 | Bucks County, PA IDA, Revenue Bonds (Series 2002A), 6.00% (Pennswood Village)/(United States Treasury PRF 10/1/2012@101)/(Original Issue Yield: 6.16%), 10/1/2034 | 557,195 |
| 2,000,000 | Bucks County, PA IDA, Revenue Bonds (Series 2007A), 5.00% (School Lane Charter School), 3/15/2037 | 1,817,220 |
| 2,000,000 | Bucks County, PA Water & Sewer Authority, Revenue Bond, 4.20% (Assured Guaranty Municipal Corp. INS)/(Original Issue Yield: 4.21%), 6/1/2020 | 2,174,400 |
| 1,000,000 | Carlisle, PA Area School District, UT GO Bonds, 4.00% (FGIC and National Public Finance Guarantee Corporation INS), 3/1/2013 | 1,083,560 |
| 1,055,000 | Catasauqua, PA Area School District, UT GO Bonds, 5.00% (Assured Guaranty Municipal Corp. INS), 2/15/2031 | 1,110,989 |
| 1,500,000 | Centre County, PA Hospital Authority, Hospital Revenue Bonds, 6.25% (Mount Nittany Medical Center)/(Assured Guaranty Corp. INS)/(Original Issue Yield: 6.30%), 11/15/2044 | 1,585,320 |
| 2,000,000 | Chester County, PA HEFA, Revenue Bonds (Series 2006), 5.00% (Devereux Foundation), 11/1/2031 | 2,010,400 |
| 2,000,000 | Chester County, PA, UT GO Bonds, 5.00%, 7/15/2028 | 2,284,380 |
| 1,500,000 | Clarion County, PA IDA, Water Facility Revenue Refunding Bonds (Series 2009), 5.50% (Pennsylvania American Water Co.), 12/1/2039 | 1,585,605 |
| 5,075,000 | Commonwealth of Pennsylvania, UT GO Bonds (Second Series 2009), 5.00%, 4/15/2023 | 5,973,326 |
| 4,000,000 | Commonwealth of Pennsylvania, UT GO Bonds (Second Series 2010A), 5.00%, 5/1/2017 | 4,840,880 |
| 6,150,000 | Commonwealth of Pennsylvania, UT GO Bonds (Series 2007A), 5.00%, 8/1/2023 | 7,040,213 |
| 1,000,000 | Cumberland County, PA Municipal Authority, Retirement Community Revenue Bonds (Series 2002A), 7.125% (Wesley Affiliated Services, Inc. Obligated Group)/(United States Treasury PRF 1/1/2013@101)/(Original Issue Yield: 7.40%), 1/1/2025 | 1,154,580 |
| 5,000,000 | Delaware Valley, PA Regional Finance Authority, Local Government Revenue Bonds (Series 1997B), 5.60% (AMBAC Assurance Corporation INS), 7/1/2017 | 5,762,550 |
| Principal Amount | Value |
| $1,000,000 | Delaware Valley, PA Regional Finance Authority, Local Government Revenue Bonds (Series 1998A), 5.50% (AMBAC Assurance Corporation INS), 8/1/2028 | 1,115,500 |
| 2,000,000 | Delaware Valley, PA Regional Finance Authority, Revenue Bonds, 5.75%, 7/1/2017 | 2,278,460 |
| 1,500,000 | Ephrata, PA Area School District, UT GO Bonds, 4.25% (FGIC and National Public Finance Guarantee Corporation INS), 4/15/2017 | 1,652,820 |
| 1,500,000 | Erie County, PA Hospital Authority, Revenue Bonds (Series 2006), 5.00% (Hamot Health Foundation)/(CIFG Assurance NA INS), 11/1/2035 | 1,447,845 |
| 1,000,000 | Erie County, PA Hospital Authority, Revenue Bonds (Series 2007), 5.00% (Hamot Health Foundation)/(CIFG Assurance NA INS), 11/1/2037 | 956,990 |
| 1,000,000 | Erie, PA Higher Education Building Authority, Revenue Bonds (Series 2007 GG3), 5.00% (Gannon University)/(Radian Asset Assurance, Inc. INS), 5/1/2032 | 959,060 |
| 2,000,000 | Geisinger Authority, PA Health System, Health System Revenue Bonds (Series 2009A), 5.25% (Geisinger Health System), 6/1/2039 | 2,111,800 |
| 1,000,000 | Greater Johnstown, PA School District, LT GO Bonds, 3.00%, 2/1/2011 | 1,010,590 |
| 2,000,000 | Harrisburg, PA Authority, Water Revenue Refunding Bonds (Series 2008), 5.25% (Original Issue Yield: 5.35%), 7/15/2031 | 2,042,520 |
| 2,000,000 | Indiana County, PA IDA, Refunding Revenue Bonds, 5.00% (Indiana University of PA)/(AMBAC Assurance Corporation INS), 11/1/2029 | 1,809,740 |
| 1,615,000 | Johnstown, PA Redevelopment Authority, Revenue Bonds (Series A), 4.50% (Assured Guaranty Municipal Corp. INS), 8/15/2019 | 1,737,498 |
| 1,000,000 | Lancaster County, PA Hospital Authority, Health Center Revenue Bonds (Series 2001), 5.875% (Willow Valley Retirement Communities)/(Original Issue Yield: 5.95%), 6/1/2031 | 1,014,750 |
| 1,000,000 | Lancaster County, PA Hospital Authority, Revenue Bonds, 5.50% (Lancaster General Hospital)/(United States Treasury PRF 9/15/2013@100)/(Original Issue Yield: 5.63%), 3/15/2026 | 1,136,520 |
| 360,000 | Lancaster County, PA Solid Waste Management, Revenue Bonds (Series A), 5.25% (AMBAC Assurance Corporation INS), 12/15/2010 | 364,396 |
| 1,345,000 | Lancaster County, PA, UT GO Bonds, 5.00% (Assured Guaranty Municipal Corp. INS), 3/1/2027 | 1,487,355 |
| 1,000,000 | Lancaster, PA Higher Education Authority, College Revenue Bonds, 5.00% (Franklin & Marshall College), 4/15/2019 | 1,123,250 |
| 1,000,000 | Lawrence County, PA IDA, Senior Health and Housing Facilities Revenue Bonds, 7.50% (Shenango Presbyterian Senior Care Obligated Group)/(United States Treasury PRF 11/15/2011@102)/(Original Issue Yield: 7.75%), 11/15/2031 | 1,101,950 |
| 1,000,000 | Lebanon County, PA Health Facilities Authority, Hospital Revenue Bonds, 5.80% (Good Samaritan Hospital)/(Original Issue Yield: 5.92%), 11/15/2022 | 1,003,370 |
| Principal Amount | Value |
| $2,000,000 | Lehigh County, PA General Purpose Authority, Hospital Revenue Bonds, 5.25% (St. Lukes Hospital of Bethlehem)/(United States Treasury PRF 8/15/2013@100)/(Original Issue Yield: 5.42%), 8/15/2023 | 2,275,820 |
| 2,250,000 | Lehigh County, PA General Purpose Authority, Revenue Bonds (Series 2005B), 5.00% (Lehigh Valley Health Network)/(Assured Guaranty Municipal Corp. INS), 7/1/2035 | 2,331,113 |
| 550,000 | Luzerne County, PA IDA, Lease Revenue Bonds, 3.40% (Assured Guaranty Municipal Corp. INS)/(Original Issue Yield: 3.55%), 12/15/2013 | 590,838 |
| 500,000 | Luzerne County, PA IDA, Lease Revenue Bonds, 3.55% (Assured Guaranty Municipal Corp. INS)/(Original Issue Yield: 3.70%), 12/15/2014 | 545,790 |
| 2,000,000 | Luzerne County, PA, UT GO Bonds (Series 2008A), 5.00% (Assured Guaranty Municipal Corp. INS), 12/15/2027 | 2,147,820 |
| 2,250,000 | Lycoming County PA Authority, College Revenue Bonds (Series 2008), 5.50% (Pennsylvania College of Technology)/(Assured Guaranty Corp. INS), 10/1/2032 | 2,432,138 |
| 3,000,000 | Lycoming County PA Authority, Revenue Bonds (Series A), 5.75% (Susquehanna Health System)/(Original Issue Yield: 5.90%), 7/1/2039 | 3,098,280 |
| 1,000,000 | Monroe County, PA Hospital Authority, Hospital Revenue Bonds (Series 2002A), 5.50% (Pocono Medical Center)/(Radian Asset Assurance, Inc. INS)/(Original Issue Yield: 5.60%), 1/1/2022 | 1,017,530 |
| 1,000,000 | Monroe County, PA Hospital Authority, Revenue Bonds, 6.00% (Pocono Medical Center)/(United States Treasury PRF 1/1/2014@100)/(Original Issue Yield: 6.17%), 1/1/2043 | 1,173,950 |
| 2,000,000 | Montgomery County, PA Higher Education & Health Authority Hospital, Revenue Bonds (Series 2006FF1), 5.00% (Dickinson College)/(CIFG Assurance NA INS), 5/1/2031 | 2,083,920 |
| 1,000,000 | Mount Lebanon, PA Hospital Authority, Revenue Bonds (Series 2002A), 5.625% (St. Clair Memorial Hospital)/(Original Issue Yield: 5.75%), 7/1/2032 | 1,010,570 |
| 1,000,000 | New Wilmington, PA Municipal Authority, Revenue Bonds (Series 2007GG4), 5.125% (Westminster College)/(Radian Asset Assurance, Inc. INS), 5/1/2033 | 992,640 |
| 1,500,000 | Northampton County, PA General Purpose Authority, Hospital Revenue Bonds (Series 2008A), 5.50% (St. Lukes Hospital of Bethlehem)/(Original Issue Yield: 5.60%), 8/15/2035 | 1,538,790 |
| 1,000,000 | Northumberland County PA IDA, Facilities Revenue Bonds (Series 2002B), 5.50% (NHS Youth Service, Inc.)/(ACA Financial Guaranty Company INS)/(Original Issue Yield: 5.80%), 2/15/2033 | 778,060 |
| 805,000 | Pennsylvania Convention Center Authority, Revenue Bonds, 6.70% (Escrowed In Treasuries COL)/(Original Issue Yield: 6.843%), 9/1/2016 (FGIC INS) | 931,224 |
| 2,000,000 | Pennsylvania EDFA, Exempt Facilities Revenue Bonds (Series 2009), 7.00% (Allegheny Energy Supply Company LLC), 7/15/2039 | 2,286,740 |
| Principal Amount | Value |
| $2,000,000 | Pennsylvania EDFA, Revenue Bonds (Series 1998A), 5.25% (Northwestern Human Services, Inc.)/(Original Issue Yield: 5.668%), 6/1/2028 | 1,651,620 |
| 1,000,000 | Pennsylvania EDFA, Revenue Bonds (Series 2000), 5.90% (Dr. Gertrude A. Barber Center, Inc.)/(Radian Asset Assurance, Inc. INS), 12/1/2030 | 1,000,690 |
| 1,000,000 | Pennsylvania EDFA, Solid Waste Disposal Revenue Bonds (Series 2004A), 4.70% TOBs (Waste Management, Inc.), Mandatory Tender 11/1/2014 | 1,057,400 |
| 1,000,000 | Pennsylvania EDFA, Solid Waste Disposal Revenue Bonds, Project A, 5.10% (Waste Management, Inc.), 10/1/2027 | 1,009,120 |
| 4,000,000 | Pennsylvania EDFA, Water Facilities Revenue Bonds (Series 2009B), 5.00% (Aqua Pennsylvania, Inc.), 11/15/2040 | 4,216,960 |
| 2,000,000 | Pennsylvania EDFA, Water Facility Revenue Bonds (Series 2009), 6.20% (Pennsylvania American Water Co.), 4/1/2039 | 2,212,780 |
| 850,000 | Pennsylvania HFA, SFM Revenue Bonds (Series 2001-72A), 5.25%, 4/1/2021 | 850,459 |
| 1,985,000 | Pennsylvania HFA, SFM Revenue Bonds (Series 2006-92A), 4.75%, 4/1/2031 | 1,977,179 |
| 3,000,000 | Pennsylvania HFA, SFM Revenue Bonds (Series 2006-95A), 4.90%, 10/1/2037 | 3,018,660 |
| 2,000,000 | Pennsylvania HFA, SFM Revenue Bonds (Series 2009-105C), 4.875%, 10/1/2034 | 2,057,140 |
| 1,500,000 | Pennsylvania Intergovernmental Coop Authority, Special Tax Revenue Refunding Bonds (Series 2009), 5.00% (Philadelphia Funding Program), 6/15/2022 | 1,747,965 |
| 1,000,000 | Pennsylvania Intergovernmental Coop Authority, Special Tax Revenue Refunding Bonds (Series 2010), 5.00% (Philadelphia Funding Program), 6/15/2018 | 1,205,900 |
| 2,590,000 | Pennsylvania State Higher Education Assistance Agency, Capital Acquisition Revenue Bonds, 6.125% (United States Treasury PRF 12/15/2010@100), 12/15/2019 | 2,624,551 |
| 1,020,000 | Pennsylvania State Higher Education Facilities Authority, 5.125% (Gwynedd-Mercy College)/(Radian Asset Assurance, Inc. INS), 5/1/2032 | 952,272 |
| 1,000,000 | Pennsylvania State Higher Education Facilities Authority, College Revenue Bonds (Series 2007), 5.00% (Bryn Mawr College)/(AMBAC Assurance Corporation INS), 12/1/2037 | 1,044,140 |
| 1,330,000 | Pennsylvania State Higher Education Facilities Authority, Revenue Bonds (Series 2003A), 5.25% (Clarion University Foundation, Inc.)/(Syncora Guarantee, Inc. INS), 7/1/2018 | 1,364,354 |
| 1,490,000 | Pennsylvania State Higher Education Facilities Authority, Revenue Bonds (Series 2003AA1), 5.25% (Dickinson College)/(Radian Asset Assurance, Inc. INS), 11/1/2018 | 1,577,999 |
| Principal Amount | Value |
| $1,350,000 | Pennsylvania State Higher Education Facilities Authority, Revenue Bonds (Series 2004A), 5.25% (Philadelphia University)/(Original Issue Yield: 5.32%), 6/1/2032 | 1,351,255 |
| 1,000,000 | Pennsylvania State Higher Education Facilities Authority, Revenue Bonds (Series 2006-FF2), 5.00% (Elizabethtown College)/(Radian Asset Assurance, Inc. INS), 12/15/2027 | 1,017,010 |
| 2,000,000 | Pennsylvania State Higher Education Facilities Authority, Revenue Bonds (Series 2008), 5.00% (University of the Sciences in Philadelphia)/(Assured Guaranty Corp. INS), 11/1/2032 | 2,133,760 |
| 1,000,000 | Pennsylvania State Higher Education Facilities Authority, Revenue Bonds (Series 2008), 6.00% (Edinboro University Foundation), 7/1/2042 | 1,031,390 |
| 1,500,000 | Pennsylvania State Higher Education Facilities Authority, Revenue Bonds (Series 2009), 5.00% (Carnegie Mellon University), 8/1/2021 | 1,764,210 |
| 1,000,000 | Pennsylvania State Higher Education Facilities Authority, Revenue Bonds (Series 2009A), 5.25% (University of Pennsylvania Health System), 8/15/2022 | 1,129,670 |
| 2,000,000 | Pennsylvania State Higher Education Facilities Authority, Revenue Bonds (Series 200B), 5.50% (University of Pennsylvania Health System)/(Original Issue Yield: 5.65%), 8/15/2018 | 2,428,000 |
| 1,100,000 | Pennsylvania State Higher Education Facilities Authority, Revenue Bonds (Series 2010), 5.00% (Thomas Jefferson University), 3/1/2040 | 1,161,292 |
| 1,875,000 | Pennsylvania State Higher Education Facilities Authority, Revenue Bonds (Series 2010E), 5.00% (UPMC Health System)/(Original Issue Yield: 5.10%), 5/15/2031 | 1,937,513 |
| 1,160,000 | Pennsylvania State Higher Education Facilities Authority, Revenue Bonds (Series AA2), 5.25% (Lycoming College)/(Radian Asset Assurance, Inc. INS), 11/1/2024 | 1,192,573 |
| 1,000,000 | Pennsylvania State Higher Education Facilities Authority, Revenue Bonds (Series B), 4.00% (Thomas Jefferson University)/(AMBAC Assurance Corporation INS), 9/1/2011 | 1,033,540 |
| 1,200,000 | Pennsylvania State Higher Education Facilities Authority, Revenue Bonds (Series B), 4.00% (Thomas Jefferson University)/(AMBAC Assurance Corporation INS), 9/1/2013 | 1,302,420 |
| 1,250,000 | Pennsylvania State Higher Education Facilities Authority, Revenue Bonds (Series EE-1), 5.00% (York College of Pennsylvania)/(Syncora Guarantee, Inc. INS), 11/1/2033 | 1,273,262 |
| 3,150,000 | Pennsylvania State Higher Education Facilities Authority, Revenue Bonds, 4.65% (Philadelphia College of Osteopathic Medicine)/(Original Issue Yield: 4.77%), 12/1/2028 | 3,173,719 |
| 1,100,000 | Pennsylvania State Higher Education Facilities Authority, Revenue Bonds, 5.00% (Messiah College)/(AMBAC Assurance Corporation INS), 11/1/2012 | 1,150,138 |
| 1,000,000 | Pennsylvania State Higher Education Facilities Authority, Revenue Bonds, 5.00% (Philadelphia University)/(Original Issue Yield: 5.22%), 6/1/2035 | 990,110 |
| Principal Amount | Value |
| $750,000 | Pennsylvania State Higher Education Facilities Authority, Revenue Bonds, 5.00% (Widener University), 7/15/2039 | 737,572 |
| 1,000,000 | Pennsylvania State Higher Education Facilities Authority, Revenue Bonds, 5.25% (Widener University)/(Original Issue Yield: 5.42%), 7/15/2024 | 1,024,270 |
| 1,500,000 | Pennsylvania State Higher Education Facilities Authority, Student Housing Revenue Bonds (Series 2003A), 5.00% (California University of Pennsylvania)/(ACA Financial Guaranty Company INS)/(Original Issue Yield: 5.08%), 7/1/2023 | 1,316,745 |
| 2,000,000 | Pennsylvania State Higher Education Facilities Authority, Student Housing Revenue Bonds, 5.125% (Foundation for Indiana University of Pennsylvania)/(Syncora Guarantee, Inc. INS), 7/1/2039 | 1,961,460 |
| 1,500,000 | Pennsylvania State IDA, EDRBs (Series 2002), 5.50% (AMBAC Assurance Corporation INS), 7/1/2020 | 1,589,415 |
| 1,000,000 | Pennsylvania State Public School Building Authority, Revenue Bonds, 4.05% (Community College of Philadelphia)/(Original Issue Yield: 4.15%), 6/15/2012 | 1,040,020 |
| 5,740,000 | Pennsylvania State Turnpike Commission, Turnpike Revenue Bonds (Series 2006A), 5.00% (AMBAC Assurance Corporation INS), 12/1/2026 | 6,187,720 |
| 1,500,000 | Pennsylvania State University, Revenue Bonds, 5.00%, 9/1/2029 | 1,676,985 |
| 1,000,000 | Pennsylvania State University, Revenue Bonds, 5.00%, 9/1/2035 | 1,088,830 |
| 1,600,000 | Philadelphia Authority for Industrial Development, Senior Living Revenue Bonds (Series 2005A), 5.625% (PresbyHomes Germantown/Morrisville), 7/1/2035 | 1,412,368 |
| 5,000,000 | Philadelphia, PA Gas Works, Revenue Bonds (Seventh Series 1998 General Ordinance), 5.00% (AMBAC Assurance Corporation INS), 10/1/2037 | 4,977,750 |
| 1,250,000 | Philadelphia, PA Redevelopment Authority, Revenue Bonds (Series 2003A), 5.50% (Beech Student Housing Complex)/(ACA Financial Guaranty Company INS), 7/1/2019 | 1,200,075 |
| 1,000,000 | Philadelphia, PA Redevelopment Authority, Revenue Bonds (Series 2003A), 5.625% (Beech Student Housing Complex)/(ACA Financial Guaranty Company INS), 7/1/2023 | 924,520 |
| 1,000,000 | Philadelphia, PA School District, UT GO Bonds (Series 2002B), 5.625% (United States Treasury PRF 8/1/2012@100), 8/1/2022 | 1,100,590 |
| 3,000,000 | Philadelphia, PA School District, UT GO Bonds (Series 2008E), 6.00% (Original Issue Yield: 6.30%), 9/1/2038 | 3,308,010 |
| 2,610,000 | Philadelphia, PA Water & Wastewater System, Revenue Bonds (Series 2001A), 5.00% (United States Treasury PRF 11/1/2012@100)/(Original Issue Yield: 5.10%), 11/1/2031 | 2,865,937 |
| 500,000 | Philadelphia, PA Water & Wastewater System, Revenue Refunding Bonds, 6.25% (National Public Finance Guarantee Corporation INS), 8/1/2011 | 523,600 |
| Principal Amount | Value |
| $500,000 | Philadelphia, PA Water & Wastewater System, Revenue Refunding Bonds, 6.25% (National Public Finance Guarantee Corporation INS), 8/1/2012 | 548,245 |
| 750,000 | Philadelphia, PA Water & Wastewater System, Water and Wastewater Revenue Bonds (Series 2009A), 5.25% (Original Issue Yield: 5.33%), 1/1/2036 | 798,330 |
| 2,000,000 | Philadelphia, PA, Refunding UT GO Bonds (Series 2008A), 5.25% (Assured Guaranty Municipal Corp. INS), 12/15/2032 | 2,111,180 |
| 3,000,000 | Philadelphia, PA, UT GO Bonds (Series 2008B), 7.125% (Assured Guaranty Corp. INS)/(Original Issue Yield: 7.25%), 7/15/2038 | 3,447,240 |
| 3,000,000 | Philadelphia, PA, UT GO Refunding Bonds (Series 2009A), 5.125% (Assured Guaranty Corp. INS)/(Original Issue Yield: 5.20%), 8/1/2025 | 3,341,370 |
| 1,245,000 | Pittsburgh, PA Urban Redevelopment Authority, MFH Revenue Bonds (Series 2006), 4.90% (West Park Court)/(GNMA COL), 11/20/2047 | 1,245,498 |
| 1,075,000 | Pittsburgh, PA Urban Redevelopment Authority, Mortgage Revenue Bonds (Series 1997C), 5.90% (GNMA COL), 10/1/2022 | 1,076,355 |
| 1,000,000 | Pittsburgh, PA Urban Redevelopment Authority, Revenue Bonds (Series 2006C), 4.80% (GNMA COL), 4/1/2028 | 1,024,410 |
| 1,035,000 | Pittsburgh, PA Urban Redevelopment Authority, Tax Allocation, 4.50% (Center Triangle), 5/1/2019 | 1,104,790 |
| 1,885,000 | Pittsburgh, PA Water & Sewer Authority, Water & Sewer System Revenue Bonds, 5.00% (United States Treasury PRF 9/1/2015@100), 9/1/2024 | 2,235,233 |
| 3,000,000 | Pittsburgh, PA Water & Sewer Authority, Water and Sewer System Revenue Bonds (Series 2008 D-1), 5.00% (Assured Guaranty Municipal Corp. INS), 9/1/2025 | 3,296,250 |
| 3,000,000 | Pittsburgh, PA, UT GO Bonds (Series 2002A), 5.50% (AMBAC Assurance Corporation INS), 9/1/2015 | 3,128,610 |
| 2,165,000 | Radnor Township, PA, UT GO Bonds (Series 2004AA), 5.125%, 7/15/2027 | 2,327,916 |
| 1,500,000 | Reading, PA, UT GO Bonds (Series 2009), 5.00% (Assured Guaranty Municipal Corp. INS), 11/1/2029 | 1,564,905 |
| 1,000,000 | Saxonburg, PA Area Authority, Sewer & Water Revenue Bonds, 5.00% (Assured Guaranty Corp. INS), 3/1/2030 | 1,050,950 |
| 1,110,000 | Sayre, PA, Health Care Facilities Authority, Revenue Bonds (Series 2002A), 5.75% (Guthrie Healthcare System, PA)/(United States Treasury PRF 12/1/2011@101)/(Original Issue Yield: 5.90%), 12/1/2021 | 1,196,080 |
| 775,000 | Sayre, PA, Health Care Facilities Authority, Revenue Bonds (Series 2002A), 5.875% (Guthrie Healthcare System, PA)/(United States Treasury PRF 12/1/2011@101)/(Original Issue Yield: 6.00%), 12/1/2031 | 836,310 |
| 7,440,000 | Scranton, PA Sewer Authority, Sewer Revenue Bonds, 5.00% (Assured Guaranty Municipal Corp. INS), 12/1/2036 | 7,713,792 |
| Principal Amount | Value |
| $1,000,000 | Scranton, PA, UT GO Bonds (Series 2001C), 7.10% (United States Treasury PRF 9/1/2011@100)/(Original Issue Yield: 7.35%), 9/1/2031 | 1,066,620 |
| 3,000,000 | Scranton-Lackawanna, PA Health & Welfare Authority, Revenue Bonds, 5.00% (University of Scranton)/(Syncora Guarantee, Inc. INS), 11/1/2037 | 3,088,980 |
| 550,000 | Snyder County PA Higher Education Authority University Revenue, Revenue Bonds, 2.70% (Susquehanna University)/(Original Issue Yield: 2.72%), 1/1/2011 | 553,894 |
| 165,000 | Snyder County PA Higher Education Authority University Revenue, Revenue Bonds, 2.95% (Susquehanna University)/(Original Issue Yield: 2.98%), 1/1/2012 | 169,940 |
| 1,000,000 | South Fork Municipal Authority, PA, Hospital Revenue Bonds (Series 2010), 5.50% (Conemaugh Valley Memorial Hospital)/(Original Issue Yield: 5.72%), 7/1/2029 | 1,013,560 |
| 1,295,000 | Southcentral PA, General Authority, Hospital Revenue Bonds, 5.00% (Hanover Hospital, Inc.)/(Radian Asset Assurance, Inc. INS), 12/1/2029 | 1,170,123 |
| 540,000 | Southcentral PA, General Authority, Revenue Bonds, 5.625% (Wellspan Health Obligated Group)/(Escrowed In Treasuries COL), 5/15/2026 | 563,425 |
| 2,460,000 | Southcentral PA, General Authority, Revenue Bonds, 5.625% (Wellspan Health Obligated Group)/(United States Treasury PRF 5/15/2011@101), 5/15/2026 | 2,578,252 |
| 500,000 | St. Mary Hospital Authority, PA, Health System Revenue Bonds (Series 2004A), 5.00% (Catholic Health East)/(Original Issue Yield: 5.15%), 11/15/2021 | 519,345 |
| 1,000,000 | St. Mary Hospital Authority, PA, Health System Revenue Bonds (Series 2004B), 5.375% (Catholic Health East)/(United States Treasury PRF 11/15/2014@100)/(Original Issue Yield: 5.42%), 11/15/2034 | 1,173,540 |
| 1,000,000 | St. Mary Hospital Authority, PA, Health System Revenue Bonds (Series 2004B), 5.50% (Catholic Health East)/(United States Treasury PRF 11/15/2014@100), 11/15/2024 | 1,178,660 |
| 2,000,000 | State Public School Building Authority, PA, School Revenue Bonds, 5.00% (Haverford Twp, PA School District)/(Syncora Guarantee, Inc. INS), 3/15/2027 | 2,104,540 |
| 2,000,000 | State Public School Building Authority, PA, School Revenue Bonds, 5.00% (Haverford Twp, PA School District)/(Syncora Guarantee, Inc. INS), 3/15/2029 | 2,086,340 |
| 1,000,000 | 1,2 | Susquehanna, PA Area Regional Airport Authority, Airport Facilities Revenue Bonds (Series 1999), 5.50% (Aero Harrisburg)/(Original Issue Yield: 5.85%), 1/1/2024 | 787,280 |
| 1,245,000 | Union County, PA Higher Educational Facilities Financing Authority, Revenue Bonds (Series 2002A), 5.25% (Bucknell University), 4/1/2021 | 1,374,380 |
| 1,250,000 | Union County, PA Hospital Authority, Revenue Bonds, 5.25% (Evangelical Community Hospital)/(Radian Asset Assurance, Inc. INS), 8/1/2024 | 1,250,812 |
| Principal Amount | Value |
| $400,000 | Washington County, PA Authority, Lease Revenue Bonds, 7.875% (Escrowed In Treasuries COL), 12/15/2018 | 584,588 |
| 1,000,000 | West Chester, PA Area School District, UT GO Bonds (Series A), 4.00% (Assured Guaranty Municipal Corp. INS), 5/15/2011 | 1,026,240 |
| 1,000,000 | West Chester, PA Area School District, UT GO Bonds (Series A), 4.00% (Assured Guaranty Municipal Corp. INS), 5/15/2012 | 1,061,570 |
| 1,885,000 | West Shore, PA Area Hospital Authority, Revenue Bonds, 6.15% (Holy Spirit Hospital), 1/1/2020 | 1,921,739 |
| 1,000,000 | West Shore, PA Area Hospital Authority, Revenue Bonds, 6.25% (Holy Spirit Hospital)/(Original Issue Yield: 6.30%), 1/1/2032 | 1,008,660 |
| 610,000 | West View, PA Municipal Authority, Special Obligation Bonds, 9.50% (Escrowed In Treasuries COL), 11/15/2014 | 750,788 |
| 2,660,000 | Westmoreland County, PA Municipal Authority, Municipal Service Refunding Revenue Bonds (Series 2006A), 5.00% (Assured Guaranty Municipal Corp. INS), 8/15/2028 | 2,855,031 |
| TOTAL MUNICIPAL BONDS (IDENTIFIED COST $264,692,217) | 275,993,254 |
| SHORT-TERM MUNICIPALS – 0.8%;3 |
| Pennsylvania – 0.8% |
| 2,300,000 | Pennsylvania State Higher Education Facilities Authority, (Series 2007B) Weekly VRDNs (La Salle University)/(Citizens Bank of Pennsylvania LOC), 0.450%, 9/1/2010 (AT AMORTIZED COST) | 2,300,000 |
| TOTAL INVESTMENTS — 97.2% (IDENTIFIED COST $266,992,217)4 | 278,293,254 |
| OTHER ASSETS AND LIABILITIES - NET — 2.8%5 | 7,996,685 |
| TOTAL NET ASSETS — 100% | $286,289,939 |
Securities that are subject to the federal alternative minimum tax (AMT) represent 5.5% of the Fund's portfolio as calculated based upon total market value (percentage is unaudited).
| 1 | Denotes a restricted security that either: (a) cannot be offered for public sale without first being registered, or being able to take advantage of an exemption from registration, under the Securities Act of 1933; or (b) is subject to a contractual restriction on public sales. At August 31, 2010, these restricted securities amounted to $1,684,720, which represented 0.6% of total net assets. |
| 2 | Denotes a restricted security that may be resold without restriction to “qualified institutional buyers” as defined in Rule 144A under the Securities Act of 1933 and that the Fund has determined to be liquid under criteria established by the Fund's Board of Trustees. At August 31, 2010, these liquid restricted securities amounted to $1,684,720, which represented 0.6% of total net assets. |
| 3 | Current rate and next reset date shown on Variable Rate Demand Notes. |
| 4 | The cost of investments for federal tax purposes amounts to $266,987,568. |
| 5 | Assets, other than investments in securities, less liabilities. See Statement of Assets and Liabilities. |
Various inputs are used in determining the value of the Fund's investments. These inputs are summarized in the three broad levels listed below:
Level 1 — quoted prices in active markets for identical securities
Level 2 — other significant observable inputs (including quoted prices for similar securities, interest rates, prepayment speeds, credit risk, etc.)
Level 3 — significant unobservable inputs (including the Fund's own assumptions in determining the fair value of investments)
The inputs or methodology used for valuing securities are not an indication of the risk associated with investing in those securities.
As of August 31, 2010, all investments of the Fund utilized Level 2 inputs in valuing the Fund's assets carried at fair value.
The following acronyms are used throughout this portfolio:
| AMBAC | — American Municipal Bond Assurance Corporation |
| COL | — Collateralized |
| EDFA | — Economic Development Finance Authority |
| EDRBs | — Economic Development Revenue Bonds |
| FGIC | — Financial Guaranty Insurance Company |
| GNMA | — Government National Mortgage Association |
| GO | — General Obligation |
| HDA | — Hospital Development Authority |
| HEFA | — Health and Education Facilities Authority |
| HFA | — Housing Finance Authority |
| IDA | — Industrial Development Authority |
| INS | — Insured |
| LOC | — Letter of Credit |
| LT | — Limited Tax |
| MFH | — Multi-Family Housing |
| PRF | — Prerefunded |
| SFM | — Single Family Mortgage |
| TOBs | — Tender Option Bonds |
| UT | — Unlimited Tax |
| VRDNs | — Variable Rate Demand Notes |
See Notes which are an integral part of the Financial Statements
Annual Shareholder ReportStatement of Assets and Liabilities
August 31, 2010
| Assets: |
| Total investments in securities, at value (identified cost $266,992,217) | $278,293,254 |
| Cash | 36,371 |
| Receivable for investments sold | 4,482,455 |
| Income receivable | 3,752,442 |
| Receivable for shares sold | 561,258 |
| TOTAL ASSETS | 287,125,780 |
| Liabilities: |
| Payable for shares redeemed | $378,008 |
| Income distribution payable | 341,507 |
| Payable for shareholder services fee (Note 5) | 54,279 |
| Payable for portfolio accounting fees | 25,000 |
| Payable for distribution services fee (Note 5) | 10,194 |
| Accrued expenses | 26,853 |
| TOTAL LIABILITIES | 835,841 |
| Net assets for 26,205,446 shares outstanding | $286,289,939 |
| Net Assets Consist of: |
| Paid-in capital | $294,806,060 |
| Net unrealized appreciation of investments | 11,301,037 |
| Accumulated net realized loss on investments | (20,012,428) |
| Undistributed net investment income | 195,270 |
| TOTAL NET ASSETS | $286,289,939 |
| Net Asset Value, Offering Price and Redemption Proceeds Per Share |
| Class A Shares: |
| Net asset value per share ($270,219,257 ÷ 24,734,377 shares outstanding), no par value, unlimited shares authorized | $10.92 |
| Offering price per share (100/95.50 of $10.92) | $11.43 |
| Redemption proceeds per share | $10.92 |
| Class B Shares: |
| Net asset value per share ($16,070,682 ÷ 1,471,069 shares outstanding), no par value, unlimited shares authorized | $10.92 |
| Offering price per share | $10.92 |
| Redemption proceeds per share (94.50/100 of $10.92) | $10.32 |
See Notes which are an integral part of the Financial Statements
Annual Shareholder ReportStatement of Operations
Year Ended August 31, 2010
| Investment Income: |
| Interest | $14,171,462 |
| Expenses: |
| Investment adviser fee (Note 5) | $1,180,445 |
| Administrative personnel and services fee (Note 5) | 229,997 |
| Custodian fees | 17,871 |
| Transfer and dividend disbursing agent fees and expenses | 120,729 |
| Directors'/Trustees' fees | 2,418 |
| Auditing fees | 20,500 |
| Legal fees | 2,855 |
| Portfolio accounting fees | 107,473 |
| Distribution services fee — Class B Shares (Note 5) | 137,119 |
| Shareholder services fee — Class A Shares (Note 5) | 636,989 |
| Shareholder services fee — Class B Shares (Note 5) | 45,706 |
| Account administration fee — Class A Shares | 52,643 |
| Share registration costs | 31,785 |
| Printing and postage | 29,504 |
| Insurance premiums | 4,867 |
| Miscellaneous | 4,021 |
| TOTAL EXPENSES | 2,624,922 |
| Waivers and Reimbursement (Note 5): |
| Waiver of investment adviser fee | $(198,032) |
| Waiver of administrative personnel and services fee | (5,418) |
| Reimbursement of shareholder services fee — Class A Shares | (52,926) |
| TOTAL WAIVERS AND REIMBURSEMENT | (256,376) |
| Net expenses | 2,368,546 |
| Net investment income | 11,802,916 |
| Realized and Unrealized Gain (Loss) on Investments: |
| Net realized loss on investments | (1,239,493) |
| Net change in unrealized appreciation of investments | 16,408,420 |
| Net realized and unrealized gain on investments | 15,168,927 |
| Change in net assets resulting from operations | $26,971,843 |
See Notes which are an integral part of the Financial Statements
Annual Shareholder ReportStatement of Changes in Net Assets
| Year Ended August 31 | 2010 | 2009 |
| Increase (Decrease) in Net Assets |
| Operations: |
| Net investment income | $11,802,916 | $13,307,290 |
| Net realized loss on investments | (1,239,493) | (9,044,490) |
| Net change in unrealized appreciation/depreciation of investments | 16,408,420 | (817,272) |
| CHANGE IN NET ASSETS RESULTING FROM OPERATIONS | 26,971,843 | 3,445,528 |
| Distributions to Shareholders: |
| Distributions from net investment income |
| Class A Shares | (11,078,848) | (12,229,562) |
| Class B Shares | (588,118) | (840,687) |
| CHANGE IN NET ASSETS RESULTING FROM DISTRIBUTIONS TO SHAREHOLDERS | (11,666,966) | (13,070,249) |
| Share Transactions: |
| Proceeds from sale of shares | 50,491,968 | 73,980,454 |
| Proceeds from shares issued in connection with the tax-free transfer of assets from Fulton Tax Exempt Income Fund | — | 26,431,783 |
| Net asset value of shares issued to shareholders in payment of distributions declared | 6,756,227 | 6,938,598 |
| Cost of shares redeemed | (83,375,997) | (109,774,465) |
| CHANGE IN NET ASSETS RESULTING FROM SHARE TRANSACTIONS | (26,127,802) | (2,423,630) |
| Change in net assets | (10,822,925) | (12,048,351) |
| Net Assets: |
| Beginning of period | 297,112,864 | 309,161,215 |
| End of period (including undistributed net investment income of $195,270 and $65,290, respectively) | $286,289,939 | $297,112,864 |
See Notes which are an integral part of the Financial Statements
Annual Shareholder ReportNotes to Financial Statements
August 31, 2010
Federated Municipal Securities Income Trust (the “Trust”) is registered under the Investment Company Act of 1940, as amended (the “Act”), as an open-end management investment company. The Trust consists of five portfolios. The financial statements included herein are only those of Federated Pennsylvania Municipal Income Fund (the “Fund”), a non-diversified portfolio. The financial statements of the other portfolios are presented separately. The assets of each portfolio are segregated and a shareholder's interest is limited to the portfolio in which shares are held. Each portfolio pays its own expenses. The Fund offers two classes of shares: Class A Shares and Class B Shares. All shares of the Fund have equal rights with respect to voting, except on class-specific matters. The investment objective of the Fund is to provide current income exempt from federal regular income tax (federal regular income tax does not include the federal alternative minimum tax (AMT)) and the personal income taxes imposed by the state of Pennsylvania and Pennsylvania municipalities. Interest income from the Fund's investments may be subject to the federal AMT for individuals and corporations.
On January 16, 2009, the Fund received assets from Fulton Tax Exempt Income Fund as the result of a tax-free reorganization, as follows:
| Shares of the Fund Issued | Fulton Tax Exempt Income Fund Net Assets Received | Unrealized Appreciation1 | Net Assets of the Fund Immediately Prior to Combination | Net Assets of the Fund Immediately After Combination |
| 2,635,272 | $26,431,783 | $766,822 | $277,576,779 | $304,008,562 |
| 1 | Unrealized Appreciation is included in Fulton Tax Exempt Income Fund Net Assets Received amount shown above. |
2. Significant Accounting Policies
The following is a summary of significant accounting policies consistently followed by the Fund in the preparation of its financial statements. These policies are in conformity with U.S. generally accepted accounting principles (GAAP).
Investment Valuation
In calculating its net asset value (NAV), the Fund generally values investments as follows:
- Fixed-income securities acquired with remaining maturities greater than 60 days are fair valued using price evaluations provided by a pricing service approved by the Trustees.
- Fixed-income securities acquired with remaining maturities of 60 days or less are valued at their cost (adjusted for the accretion of any discount or amortization of any premium).
- Derivative contracts listed on exchanges are valued at their reported settlement or closing price.
- Over-the-counter (OTC) derivative contracts are fair valued using price evaluations provided by a pricing service approved by the Trustees.
- Shares of other mutual funds are valued based upon their reported NAVs.
Fair Valuation and Significant Events Procedures
The Trustees have authorized the use of pricing services to provide evaluations of the current fair value of certain investments for purposes of calculating the NAV. Factors considered by pricing services in evaluating an investment include the yields or prices of investments of comparable quality, coupon, maturity, call rights and other potential prepayments, terms and type, reported transactions, indications as to values from dealers and general market conditions. Some pricing services provide a single price evaluation reflecting the bid-side of the market for an investment (a “bid” evaluation). Other pricing services offer both bid evaluations and price evaluations indicative of a price between the prices bid and asked for the investment (a “mid” evaluation). The Fund normally uses bid evaluations for U.S. Treasury and Agency securities, mortgage-backed securities and municipal securities. The Fund normally uses mid evaluations for other types of fixed-income securities and OTC derivative contracts. In the event that market quotations and price evaluations are not available for an investment, the fair value of the investment is determined in accordance with procedures adopted by the Trustees.
The Trustees also have adopted procedures requiring an investment to be priced at its fair value whenever the Adviser determines that a significant event affecting the value of the investment has occurred between the time as of which the price of the investment would otherwise be determined and the time as of which the NAV is computed. An event is considered significant if there is both an affirmative expectation that the investment's value will change in response to the event and a reasonable basis for quantifying the resulting change in value. Examples of significant events that may occur after the close of the principal market on which a security is traded, or after the time of a price evaluation provided by a pricing service or a dealer, include:
- With respect to price evaluations of fixed-income securities determined before the close of regular trading on the NYSE, actions by the Federal Reserve Open Market Committee and other significant trends in U.S. fixed-income markets;
- Political or other developments affecting the economy or markets in which an issuer conducts its operations or its securities are traded; and
- Announcements concerning matters such as acquisitions, recapitalizations, litigation developments, a natural disaster affecting the issuer's operations or regulatory changes or market developments affecting the issuer's industry.
The Fund may seek to obtain more current quotations or price evaluations from alternative pricing sources. If a reliable alternative pricing source is not available, the Fund will determine the fair value of the investment using another method approved by the Trustees.
Investment Income, Gains and Losses, Expenses and Distributions
Investment transactions are accounted for on a trade date basis. Realized gains and losses from investment transactions are recorded on an identified cost basis. Interest income and expenses are accrued daily. Distributions to shareholders are recorded on the ex-dividend date. Distributions of net investment income are declared and paid monthly. Non-cash Annual Shareholder ReportPremium and Discount Amortization
All premiums and discounts on fixed-income securities are amortized/accreted for financial statement purposes.
Federal Taxes
It is the Fund's policy to comply with the Subchapter M provision of the Internal Revenue Code and to distribute to shareholders each year substantially all of its income. Accordingly, no provision for federal income tax is necessary. As of and during the year ended August 31, 2010, the Fund did not have a liability for any uncertain tax positions. The Fund recognizes interest and penalties, if any, related to tax liabilities as income tax expense in the Statement of Operations. As of August 31, 2010, tax years 2007 through 2010 remain subject to examination by the Fund's major tax jurisdictions, which include the United States of America and the Commonwealth of Massachusetts.
When-Issued and Delayed Delivery Transactions
The Fund may engage in when-issued or delayed delivery transactions. The Fund records when-issued securities on the trade date and maintains security positions such that sufficient liquid assets will be available to make payment for the securities purchased. Securities purchased on a when-issued or delayed delivery basis are marked to market daily and begin earning interest on the settlement date. Losses may occur on these transactions due to changes in market conditions or the failure of counterparties to perform under the contract.
Restricted Securities
The fund may purchase securities which are considered restricted. Restricted securities are securities that either: (a) cannot be offered for public sale without first being registered, or being able to take advantage of an exemption from registration, under the Securities Act of 1933; or (b) are subject to contractual restrictions on public sales. In some cases, when a security cannot be offered for public sale without first being registered, the issuer of the restricted security has agreed to register such securities for resale, at the issuer's expense, either upon demand by the Fund or in connection with another registered offering of the securities. Many such restricted securities may be resold in the secondary market in transactions exempt from registration. Restricted securities may be determined to be liquid under criteria established by the Trustees. The Fund will not incur any registration costs upon such resales. The Fund's restricted securities are valued at the price provided by dealers in the secondary market or, if no market prices are available, at the fair value as determined in accordance with procedures established by and under the general supervision of the Trustees.
Other
The preparation of financial statements in conformity with GAAP requires management to make estimates and assumptions that affect the amounts of assets, liabilities, expenses and revenues reported in the financial statements. Actual results could differ from those estimated.
Annual Shareholder ReportThe following tables summarize share activity:
| Year Ended August 31 | 2010 | 2009 | |
| Class A Shares: | Shares | Amount | Shares | Amount |
| Shares sold | 4,668,584 | $49,534,637 | 7,321,510 | $73,094,234 |
| Shares issued in connection with the tax-free transfer of assets from Fulton Tax Exempt Income Fund | — | — | 2,635,272 | 26,431,783 |
| Shares issued to shareholders in payment of distributions declared | 589,335 | 6,262,783 | 629,418 | 6,277,036 |
| Shares redeemed | (7,190,240) | (76,374,600) | (10,273,947) | (102,691,663) |
| NET CHANGE RESULTING FROM CLASS A SHARE TRANSACTIONS | (1,932,321) | $(20,577,180) | 312,253 | $3,111,390 |
| Year Ended August 31 | 2010 | 2009 | |
| Class B Shares: | Shares | Amount | Shares | Amount |
| Shares sold | 89,916 | $957,331 | 88,575 | $886,220 |
| Shares issued to shareholders in payment of distributions declared | 46,463 | 493,444 | 66,402 | 661,562 |
| Shares redeemed | (659,424) | (7,001,397) | (713,559) | (7,082,802) |
| NET CHANGE RESULTING FROM CLASS B SHARE TRANSACTIONS | (523,045) | $(5,550,622) | (558,582) | $(5,535,020) |
| NET CHANGE RESULTING FROM FUND SHARE TRANSACTIONS | (2,455,366) | $(26,127,802) | (246,329) | $(2,423,630) |
The timing and character of income and capital gain distributions are determined in accordance with income tax regulations, which may differ from GAAP. These differences are due to expiration of capital loss carryforwards and differing treatments for discount accretion/premium amortization on debt securities.
For the year ended August 31, 2010, permanent differences identified and reclassified among the components of net assets were as follows:
| Increase (Decrease) | ||
| Paid-In Capital | Undistributed Net Investment Income (Loss) | Accumulated Net Realized Gain (Loss) |
| $(2,171,230) | $(5,970) | $2,177,200 |
Net investment income (loss), net realized gains (losses) and net assets were not affected by this reclassification.
Annual Shareholder Report| 2010 | 2009 |
| Tax-exempt income | $11,666,966 | $13,070,249 |
As of August 31, 2010, the components of distributable earnings on a tax basis were as follows:
| Undistributed tax-exempt income | $195,270 |
| Net unrealized appreciation | $11,305,686 |
| Capital loss carry forwards | $(20,017,077) |
The difference between book-basis and tax-basis net unrealized appreciation/depreciation is attributable to differing treatments for discount accretion/premium amortization on debt securities.
At August 31, 2010, the cost of investments for federal tax purposes was $266,987,568. The net unrealized appreciation of investments for federal tax purposes was $11,305,686. This consists of net unrealized appreciation from investments for those securities having an excess of value over cost of $13,843,814 and net unrealized depreciation from investments for those securities having an excess of cost over value of $2,538,128.
At August 31, 2010, the Fund had a capital loss carry forward of $20,017,077 which will reduce the Fund's taxable income arising from future net realized gains on investments, if any, to the extent permitted by the Code and thus will reduce the amount of distributions to shareholders which would otherwise be necessary to relieve the Fund of any liability for federal income tax. Pursuant to the Code, such capital loss carry forward will expire as follows:
| Expiration Year | Expiration Amount |
| 2012 | $236,977 |
| 2013 | $1,984,510 |
| 2016 | $213,566 |
| 2017 | $7,730,607 |
| 2018 | $9,851,417 |
Capital loss carry forwards of $2,171,230 expired during the year ended August 31, 2010.
5. Investment Adviser Fee and Other Transactions with Affiliates
Investment Adviser Fee
Federated Investment Management Company is the Fund's investment adviser (the “Adviser”). The advisory agreement between the Fund and Adviser provides for an annual fee equal to 0.40% of the Fund's average daily net assets. Subject to the terms described in the Expense Limitation note, the Adviser may voluntarily choose to waive any portion of its fee. For the year ended August 31, 2010, the Adviser voluntarily waived $198,032 of its fee.
Annual Shareholder ReportFederated Administrative Services (FAS), under the Administrative Services Agreement, provides the Fund with administrative personnel and services. The fee paid to FAS is based on the average aggregate daily net assets of certain Federated funds as specified below:
| Administrative Fee | Average Aggregate Daily Net Assets of the Federated Funds |
| 0.150% | on the first $5 billion |
| 0.125% | on the next $5 billion |
| 0.100% | on the next $10 billion |
| 0.075% | on assets in excess of $20 billion |
The administrative fee received during any fiscal year shall be at least $150,000 per portfolio and $40,000 per each additional class of Shares. Subject to the terms described in the Expense Limitation note, FAS may voluntarily choose to waive any portion of its fee. For the year ended August 31, 2010, FAS waived $5,418 of its fee. The net fee paid to FAS was 0.076% of average daily net assets of the Fund.
Distribution Services Fee
The Fund has adopted a Distribution Plan (the “Plan”) pursuant to Rule 12b-1 under the Act. Under the terms of the Plan, the Fund will compensate Federated Securities Corp. (FSC), the principal distributor, from the daily net assets of the Fund's Class A Shares and Class B Shares to finance activities intended to result in the sale of these shares. The Plan provides that the Fund may incur distribution expenses at the following percentages of average daily net assets annually, to compensate FSC:
| Share Class Name | Percentage of Average Daily Net Assets of Class |
| Class A Shares | 0.05% |
| Class B Shares | 0.75% |
Subject to the terms described in the Expense Limitation note, FSC may voluntarily choose to waive any portion of its fee. When FSC receives fees, it may pay some or all of them to financial intermediaries whose customers purchase shares. For the year ended August 31, 2010, FSC retained $1,167 of fees paid by the Fund. For the year ended August 31, 2010, the Fund's Class A Shares did not incur a distribution services fee; however it may begin to incur the fee upon approval of the Trustees.
Sales Charges
Front-end sales charges and contingent deferred sales charges (CDSC) do not represent expenses of the Fund. They are deducted from the proceeds of sales of Fund shares prior to investment or from redemption proceeds prior to remittance, as applicable. For the year ended August 31, 2010, FSC retained $237,372 in sales charges from the sale of the Fund's
Class A Shares.
The Fund may pay fees (“Service Fees”) up to 0.25% of the average daily net assets of the Fund's Class A Shares and Class B Shares to financial intermediaries or to Federated Shareholder Services Company (FSSC) for providing services to shareholders and maintaining shareholder accounts. Subject to the terms described in the Expense Limitation note, FSSC may voluntarily reimburse the Fund for Service Fees. For the year ended August 31, 2010, FSSC reimbursed $52,926 of Service Fees. For the year ended August 31, 2010, FSSC did not receive any fees paid by the Fund.
Interfund Transactions
During the year ended August 31, 2010, the Fund engaged in purchase and sale transactions with funds that have a common investment adviser (or affiliated investment advisers), common Directors/Trustees and/or common Officers. These purchase and sale transactions complied with Rule 17a-7 under the Act and amounted to $73,595,000 and $73,795,000, respectively.
Expense Limitation
The Adviser and its affiliates (which may include FSC, FAS and FSSC) have voluntarily agreed to waive their fees and/or reimburse expenses so that the total annual fund operating expenses (as shown in the financial highlights) paid by the Fund's Class A Shares and Class B Shares (after the voluntary waivers and reimbursements) will not exceed 0.75% and 1.52%, respectively, (the “Fee Limit”) through the later of (the “Termination Date”): (a) October 31, 2011; or (b) the date of the Fund's next effective Prospectus. While the Adviser and its affiliates currently do not anticipate terminating or increasing these arrangements prior to the Termination Date, these arrangements may only be terminated or the Fee Limit increased prior to the Termination Date with the agreement of the Trustees.
General
Certain Officers and Trustees of the Fund are Officers and Directors or Trustees of the above companies.
Purchases and sales of investments, excluding long-term U.S. government securities and short-term obligations, for the year ended August 31, 2010, were as follows:
| Purchases | $33,572,245 |
| Sales | $63,189,254 |
Since the Fund invests a substantial portion of its assets in issuers located in one state, it will be more susceptible to factors adversely affecting issuers of that state than would be a comparable tax-exempt mutual fund that invests nationally. In order to reduce the credit risk associated with such factors, at August 31, 2010, 40.9% of the securities in the portfolio of investments is backed by letters of credit or bond insurance of various financial institutions and financial guaranty assurance agencies. The largest percentage of investments insured by or supported (backed) by a letter of credit from any one institution or agency was 11.4% of total investments.
Annual Shareholder ReportThe Fund participates in a $100,000,000 unsecured, uncommitted revolving line of credit (LOC) agreement with PNC Bank. The LOC was made available for extraordinary or emergency purposes, primarily for financing redemption payments. Borrowings are charged interest at a rate offered to the Fund by PNC Bank at the time of the borrowing. As of August 31, 2010, there were no outstanding loans. During the year ended August 31, 2010, the Fund did not utilize the LOC.
Pursuant to an Exemptive Order issued by the Securities and Exchange Commission, the Fund, along with other funds advised by subsidiaries of Federated Investors, Inc., may participate in an interfund lending program. This program provides an alternative credit facility allowing the funds to borrow from other participating affiliated funds. As of August 31, 2010, there were no outstanding loans. During the year ended August 31, 2010, the program was not utilized.
Since October 2003, Federated Investors, Inc. and related entities (collectively, “Federated”), and various Federated sponsored mutual funds (“Federated Funds”) have been named as defendants in several class action lawsuits now pending in the United States District Court for the District of Maryland. The lawsuits were purportedly filed on behalf of people who purchased, owned and/or redeemed shares of certain Federated Funds during specified periods beginning November 1, 1998. The suits are generally similar in alleging that Federated engaged in illegal and improper trading practices including market timing and late trading in concert with certain institutional traders, which allegedly caused financial injury to the mutual fund shareholders. Federated without admitting the validity of any claim has reached a preliminary settlement with the Plaintiffs in these cases. Any settlement would have to be approved by the Court. Federated entities have also been named as defendants in several additional lawsuits that are now pending in the United States District Court for the Western District of Pennsylvania. These lawsuits have been consolidated into a single action alleging excessive advisory fees involving one of the Federated Funds. The Board of the Federated Funds retained the law firm of Dickstein Shapiro LLP to represent the Federated Funds in these lawsuits. Federated and the Federated Funds, and their respective counsel, have been defending this litigation, and none of the Federated Funds remains a defendant in any of the lawsuits. Additional lawsuits based upon similar allegations may be filed in the future. The potential impact of these lawsuits, all of which seek monetary damages, attorneys' fees and expenses, and future potential similar suits is uncertain. Although we do not believe that these lawsuits will have a material adverse effect on the Federated Funds, there can be no assurance that these suits, ongoing adverse publicity and/or other developments resulting from the allegations in these matters will not result in increased redemptions, or reduced sales of shares of the Federated Funds, or other adverse consequences for the Federated Funds.
Management has evaluated subsequent events through the date the financial statements were issued, and determined that no events have occurred that require additional disclosure.
12. Federal Tax Information (unaudited)
For the fiscal year ended August 31, 2010, 100.0% of distributions from net investment income is exempt from federal income tax, other than the federal AMT.
Annual Shareholder ReportReport of Independent Registered Public Accounting Firm
TO THE BOARD OF TRUSTEES OF federated municipal securities income trust AND SHAREHOLDERS OF federated pennsylvania municipal income fund:
We have audited the accompanying statement of assets and liabilities, including the portfolio of investments, of Federated Pennsylvania Municipal Income Fund (the “Fund”), a portfolio of Federated Municipal Securities Income Trust, as of August 31, 2010, and the related statement of operations for the year then ended, the statements of changes in net assets for each of the years in the two-year period then ended, and the financial highlights for each of the years in the five-year period then ended. These financial statements and financial highlights are the responsibility of the Fund's management. Our responsibility is to express an opinion on these financial statements and financial highlights based on our audits.
We conducted our audits in accordance with the standards of the Public Company Accounting Oversight Board (United States). Those standards require that we plan and perform the audit to obtain reasonable assurance about whether the financial statements and financial highlights are free of material misstatement. An audit includes examining, on a test basis, evidence supporting the amounts and disclosures in the financial statements. Our procedures included confirmation of securities owned as of August 31, 2010 by correspondence with the custodian and brokers or by other appropriate auditing procedures. An audit also includes assessing the accounting principles used and significant estimates made by management, as well as evaluating the overall financial statement presentation. We believe that our audits provide a reasonable basis for our opinion.
In our opinion, the financial statements and financial highlights referred to above present fairly, in all material respects, the financial position of Federated Pennsylvania Municipal Income Fund as of August 31, 2010, and the results of its operations for the year then ended, the changes in its net assets for each of the years in the two-year period then ended, and the financial highlights for each of the years in the five-year period then ended, in conformity with U.S. generally accepted accounting principles.

Boston, Massachusetts
October 25, 2010
Board of Trustees and Trust Officers
The Board of Trustees is responsible for managing the Trust's business affairs and for exercising all the Trust's powers except those reserved for the shareholders. The following tables give information about each Trustee and the senior officers of the Fund. Where required, the tables separately list Trustees who are “interested persons” of the Fund (i.e., “Interested” Trustees) and those who are not (i.e., “Independent” Trustees). Unless otherwise noted, the address of each person listed is Federated Investors Tower, 1001 Liberty Avenue, Pittsburgh, PA 15222. The address of all Independent Trustees listed is 4000 Ericsson Drive, Warrendale, PA 15086-7561; Attention: Mutual Fund Board. As of December 31, 2009, the Trust comprised five portfolio(s), and the Federated Fund Family consisted of 43 investment companies (comprising 145 portfolios). Unless otherwise noted, each Officer is elected annually. Unless otherwise noted, each Trustee oversees all portfolios in the Federated Fund Family and serves for an indefinite term. The Fund's Statement of Additional Information includes additional information about Trust Trustees and is available, without charge and upon request, by calling 1-800-341-7400.
Interested TRUSTEES Background
| Name Birth Date Positions Held with Trust Date Service Began | Principal Occupation(s) for Past Five Years, Other Directorships Held and Previous Position(s) |
| John F. Donahue* Birth Date: July 28, 1924 Trustee Began serving: August 1990 | Principal Occupations: Director or Trustee of the Federated Fund Family; Chairman and Director, Federated Investors, Inc.; Chairman of the Federated Fund Family's Executive Committee. Previous Positions: Chairman of the Federated Fund Family; Trustee, Federated Investment Management Company; Chairman and Director, Federated Investment Counseling. |
| J. Christopher Donahue* Birth Date: April 11, 1949 PRESIDENT AND Trustee Began serving: August 1990 | Principal Occupations: Principal Executive Officer and President of the Federated Fund Family; Director or Trustee of some of the Funds in the Federated Fund Family; President, Chief Executive Officer and Director, Federated Investors, Inc.; Chairman and Trustee, Federated Investment Management Company; Trustee, Federated Investment Counseling; Chairman and Director, Federated Global Investment Management Corp.; Chairman, Federated Equity Management Company of Pennsylvania and Passport Research, Ltd. (investment advisory subsidiary of Federated); Trustee, Federated Shareholder Services Company; Director, Federated Services Company. Previous Positions: President, Federated Investment Counseling; President and Chief Executive Officer, Federated Investment Management Company, Federated Global Investment Management Corp. and Passport Research, Ltd. |
| * | Family relationships and reasons for “interested” status: John F. Donahue is the father of J. Christopher Donahue; both are “interested” due to their beneficial ownership of shares of Federated Investors, Inc. and the positions they hold with Federated and its subsidiaries. |
INDEPENDENT TRUSTEES Background
| Name Birth Date Positions Held with Trust Date Service Began | Principal Occupation(s) for Past Five Years, Other Directorships Held, Previous Position(s) and Qualifications |
| John T. Conroy, Jr., Ph.D. Birth Date: June 23, 1937 Trustee Began serving: August 1991 | Principal Occupations: Director or Trustee of the Federated Fund Family; Chairman of the Board, Investment Properties Corporation; Partner or Trustee in private real estate ventures in Southwest Florida; Assistant Professor in Theology, Blessed Edmund Rice School for Pastoral Ministry. Previous Positions: President, Investment Properties Corporation; Senior Vice President, John R. Wood and Associates, Inc., Realtors; President, Naples Property Management, Inc. and Northgate Village Development Corporation. Qualifications: Business management and director experience. |
| Nicholas P. Constantakis, CPA Birth Date: September 3, 1939 Trustee Began serving: February 1998 | Principal Occupation: Director or Trustee of the Federated Fund Family. Other Directorship Held: Director and Chairman of the Audit Committee, Michael Baker Corporation (architecture, engineering and construction services). Previous Position: Partner, Andersen Worldwide SC. Qualifications: Public accounting and director experience. |
| John F. Cunningham Birth Date: March 5, 1943 Trustee Began serving: July 1999 | Principal Occupation: Director or Trustee of the Federated Fund Family. Other Directorships Held: Chairman, President and Chief Executive Officer, Cunningham & Co., Inc. (strategic business consulting); Trustee Associate, Boston College. Previous Positions: Director, Redgate Communications and EMC Corporation (computer storage systems); Chairman of the Board and Chief Executive Officer, Computer Consoles, Inc.; President and Chief Operating Officer, Wang Laboratories; Director, First National Bank of Boston; Director, Apollo Computer, Inc. Qualifications: Business management and director experience. |
| Maureen Lally-Green Birth Date: July 5, 1949 Trustee Began serving: August 2009 | Principal Occupations: Director or Trustee of the Federated Fund Family; Director, Office of Church Relations, Diocese of Pittsburgh; Adjunct Professor of Law, Duquesne University School of Law. Other Directorships Held: Director, Auberle; Trustee, St. Francis University; Director, Ireland Institute of Pittsburgh; Director, UPMC Mercy Hospital; Regent, St. Vincent Seminary; Director, Epilepsy Foundation of Western and Central Pennsylvania; Director, Saint Thomas More Society, Allegheny County; Director, Carlow University. Previous Position: Pennsylvania Superior Court Judge. Qualifications: Legal and director experience. |
| Name Birth Date Positions Held with Trust Date Service Began | Principal Occupation(s) for Past Five Years, Other Directorships Held, Previous Position(s) and Qualifications |
| Peter E. Madden Birth Date: March 16, 1942 Trustee Began serving: August 1991 | Principal Occupation: Director or Trustee, and Chairman of the Board of Directors or Trustees, of the Federated Fund Family. Other Directorship Held: Board of Overseers, Babson College. Previous Positions: Representative, Commonwealth of Massachusetts General Court; President, Chief Operating Officer and Director, State Street Bank and Trust Company and State Street Corporation (retired); Director, VISA USA and VISA International; Chairman and Director, Massachusetts Bankers Association; Director, Depository Trust Corporation; Director, The Boston Stock Exchange. Qualifications: Business management, mutual fund services and director experience. |
| Charles F. Mansfield, Jr. Birth Date: April 10, 1945 Trustee Began serving: January 1999 | Principal Occupations: Director or Trustee and Chairman of the Audit Committee of the Federated Fund Family; Management Consultant. Previous Positions: Chief Executive Officer, PBTC International Bank; Partner, Arthur Young & Company (now Ernst & Young LLP); Chief Financial Officer of Retail Banking Sector, Chase Manhattan Bank; Senior Vice President, HSBC Bank USA (formerly, Marine Midland Bank); Vice President, Citibank; Assistant Professor of Banking and Finance, Frank G. Zarb School of Business, Hofstra University; Executive Vice President, DVC Group, Inc. (marketing, communications and technology). Qualifications: Banking, business management, public accounting and director experience. |
| R. James Nicholson Birth Date: February 4, 1938 Trustee Began serving: January 2008 | Principal Occupations: Director or Trustee of the Federated Fund Family; Senior Counsel, Brownstein Hyatt Farber Schrek, P.C.; Former Secretary of the U.S. Dept. of Veterans Affairs; Former U.S. Ambassador to the Holy See; Former Chairman of the Republican National Committee. Other Directorships Held: Director, Horatio Alger Association; Director, The Daniels Fund. Previous Positions: Colonel, U.S. Army Reserve; Partner, Calkins, Kramer, Grimshaw and Harring, P.C.; General Counsel, Colorado Association of Housing and Building; Chairman and CEO, Nicholson Enterprises, Inc. (real estate holding company); Chairman and CEO, Renaissance Homes of Colorado. Qualifications: Legal, government, business management and mutual fund director experience. |
| Name Birth Date Positions Held with Trust Date Service Began | Principal Occupation(s) for Past Five Years, Other Directorships Held, Previous Position(s) and Qualifications |
| Thomas M. O'Neill Birth Date: June 14, 1951 Trustee Began serving: October 2006 | Principal Occupations: Director or Trustee of the Federated Fund Family; Sole Proprietor, Navigator Management Company (investment and strategic consulting). Other Directorships Held: Board of Overseers, Children's Hospital of Boston; Visiting Committee on Athletics, Harvard College. Previous Positions: Chief Executive Officer and President, Managing Director and Chief Investment Officer, Fleet Investment Advisors; President and Chief Executive Officer, Aeltus Investment Management, Inc.; General Partner, Hellman, Jordan Management Co., Boston, MA; Chief Investment Officer, The Putnam Companies, Boston, MA; Credit Analyst and Lending Officer, Fleet Bank; Director and Consultant, EZE Castle Software (investment order management software); Director, Midway Pacific (lumber). Qualifications: Business management, mutual fund, director and investment experience. |
| John S. Walsh Birth Date: November 28, 1957 Trustee Began serving: July 1999 | Principal Occupations: Director or Trustee of the Federated Fund Family; President and Director, Heat Wagon, Inc. (manufacturer of construction temporary heaters); President and Director, Manufacturers Products, Inc. (distributor of portable construction heaters); President, Portable Heater Parts, a division of Manufacturers Products, Inc. Previous Position: Vice President, Walsh & Kelly, Inc. Qualifications: Business management and director experience. |
| James F. Will Birth Date: October 12, 1938 Trustee Began serving: April 2006 | Principal Occupations: Director or Trustee of the Federated Fund Family; formerly, Vice Chancellor and President, Saint Vincent College. Other Directorships Held: Trustee, Saint Vincent College; Alleghany Corporation. Previous Positions: Chairman, President and Chief Executive Officer, Armco, Inc.; President and Chief Executive Officer, Cyclops Industries; President and Chief Operating Officer, Kaiser Steel Corporation. Qualifications: Business management, education and director experience. |
| Name Birth Date Positions Held with Trust Date Service Began | Principal Occupation(s) for Past Five Years and Previous Position(s) |
| John W. McGonigle Birth Date: October 26, 1938 EXECUTIVE VICE PRESIDENT AND SECRETARY Began serving: August 1990 | Principal Occupations: Executive Vice President and Secretary of the Federated Fund Family; Vice Chairman, Executive Vice President, Secretary and Director, Federated Investors, Inc. Previous Positions: Trustee, Federated Investment Management Company and Federated Investment Counseling; Director, Federated Global Investment Management Corp., Federated Services Company and Federated Securities Corp. |
| Richard A. Novak Birth Date: December 25, 1963 TREASURER Began serving: January 2006 | Principal Occupations: Principal Financial Officer and Treasurer of the Federated Fund Family; Senior Vice President, Federated Administrative Services; Financial and Operations Principal for Federated Securities Corp., Edgewood Services, Inc. and Southpointe Distribution Services, Inc. Previous Positions: Controller of Federated Investors, Inc.; Vice President, Finance of Federated Services Company; held various financial management positions within The Mercy Hospital of Pittsburgh; Auditor, Arthur Andersen & Co. |
| Richard B. Fisher Birth Date: May 17, 1923 VICE CHAIRMAN Began serving: August 2002 | Principal Occupations: Vice Chairman or Vice President of some of the Funds in the Federated Fund Family; Vice Chairman, Federated Investors, Inc.; Chairman, Federated Securities Corp. Previous Positions: President and Director or Trustee of some of the Funds in the Federated Fund Family; Executive Vice President, Federated Investors, Inc.; Director and Chief Executive Officer, Federated Securities Corp. |
| Brian P. Bouda Birth Date: February 28, 1947 SENIOR VICE PRESIDENT AND CHIEF COMPLIANCE OFFICER Began serving: August 2004 | Principal Occupations: Senior Vice President and Chief Compliance Officer of the Federated Fund Family; Vice President and Chief Compliance Officer of Federated Investors, Inc. and Chief Compliance Officer of its subsidiaries. Mr. Bouda joined Federated in 1999 and is a member of the American Bar Association and the State Bar Association of Wisconsin. |
| Mary Jo Ochson Birth Date: September 12, 1953 CHIEF INVESTMENT OFFICER Began serving: May 2004 | Principal Occupations: Mary Jo Ochson was named Chief Investment Officer of tax-exempt, fixed-income products in 2004 and Chief Investment Officer of Tax-Free Money Markets in 2010. She joined Federated in 1982 and has been a Senior Portfolio Manager and a Senior Vice President of the Fund's Adviser since 1996. Ms. Ochson has received the Chartered Financial Analyst designation and holds an M.B.A. in Finance from the University of Pittsburgh. |
| J. Scott Albrecht Birth Date: June 1, 1960 VICE PRESIDENT Began serving: November 1998 | Principal Occupations: J. Scott Albrecht has been the Fund's portfolio manager since March 1995. He is Vice President of the Trust. Mr. Albrecht joined Federated in 1989. He became a Senior Vice President of the Fund's Adviser in January 2005 and served as a Vice President of the Fund's Adviser from 1994 through 2004. He has been a Senior Portfolio Manager since 1997 and was a Portfolio Manager from 1994 to 1996. Mr. Albrecht has received the Chartered Financial Analyst designation and holds an M.S. in Public Management from Carnegie Mellon University. |
Evaluation and Approval of Advisory Contract - May 2010
Federated Pennsylvania Municipal Income Fund (the “Fund”)
The Fund's Board reviewed the Fund's investment advisory contract at meetings held in May 2010. The Board's decision regarding the contract reflects the exercise of its business judgment on whether to continue the existing arrangements.
In this connection, the Federated funds' Board had previously appointed a Senior Officer, whose duties include specified responsibilities relating to the process by which advisory fees are to be charged to a Federated fund. The Senior Officer has the authority to retain consultants, experts, or staff as may be reasonably necessary to assist in the performance of his duties, reports directly to the Board, and may be terminated only with the approval of a majority of the independent members of the Board. The Senior Officer prepared and furnished to the Board an independent, written evaluation that covered topics discussed below. The Board considered that evaluation, along with other information, in deciding to approve the advisory contract.
During its review of the contract, the Board considered compensation and benefits received by the Adviser. This included the fees received for services provided to the Fund by other entities in the Federated organization and research services (if any) received by the Adviser from brokers that execute Federated fund trades, as well as advisory fees. The Board is also familiar with and considered judicial decisions concerning allegedly excessive investment advisory fees, which have indicated that the following factors may be relevant to an Adviser's fiduciary duty with respect to its receipt of compensation from a fund: the nature and quality of the services provided by the Adviser, including the performance of the fund; the Adviser's cost of providing the services; the extent to which the Adviser may realize “economies of scale” as a fund grows larger; any indirect benefits that may accrue to the Adviser and its affiliates as a result of the Adviser's relationship with a fund; performance and expenses of comparable funds; and the extent to which the independent Board members are fully informed about all facts the Board deems relevant bearing on the Adviser's services and fees. The Board further considered management fees (including any components thereof) charged to institutional and other clients of the Adviser for what might be viewed as like services, and the cost to the Adviser and its affiliates of supplying services pursuant to the management fee agreements, excluding any intra-corporate profit and profit margins of the Adviser and its affiliates for supplying such services. The Board was aware of these factors and was guided by them in its review of the Fund's advisory contract to the extent it considered them to be appropriate and relevant, as discussed further below.
Annual Shareholder ReportThe Senior Officer reviewed reports compiled by Federated, using data supplied by independent fund ranking organizations, regarding the performance of, and fees charged by, other mutual funds, noting his view that comparisons to fund peer groups are relevant in judging the reasonableness of proposed fees.
The Fund's performance fell below the median of the relevant peer group for the one-year, three-year and five-year periods covered by the report. The Board discussed the Fund's performance with the Adviser and recognized the efforts being undertaken by the Adviser. The Board will continue to monitor these efforts and the performance of the Fund.
The Board also received financial information about Federated, including reports on the compensation and benefits Federated derived from its relationships with the Federated funds. These reports covered not only the fees under the advisory contracts, but also fees received by Federated's subsidiaries for providing other services to the Federated funds under separate contracts (e.g., for serving as the Federated funds' administrator). The reports also discussed any indirect benefit Federated may derive from its receipt of research services from brokers who execute Federated fund trades. In addition, the Board considered the fact that, in order for a fund to be competitive in the marketplace, Federated and its affiliates frequently waived fees and/or Annual Shareholder ReportFederated furnished reports, requested by the Senior Officer, that reported revenues on a fund-by-fund basis and made estimates of the allocation of expenses on a fund-by-fund basis, using allocation methodologies specified by the Senior Officer. The Senior Officer noted that, although they may apply consistent allocation processes, the inherent difficulties in allocating costs (and the unavoidable arbitrary aspects of that exercise) and the lack of consensus on how to allocate those costs may render such allocation reports unreliable. The allocation reports were considered in the analysis by the Board but were determined to be of limited use.
The Board and the Senior Officer also reviewed a report compiled by Federated comparing profitability information for Federated to other publicly held fund management companies. In this regard, the Senior Officer noted the limited availability of such information, but nonetheless concluded that Federated's profit margins did not appear to be excessive and the Board agreed.
The Senior Officer's evaluation also discussed the notion of possible realization of “economies of scale” as a fund grows larger. The Board considered in this regard that the Adviser has made significant and long-term investments in areas that support all of the Federated funds, such as personnel and processes for the portfolio management, compliance, and risk management functions; and systems technology; and that the benefits of these efforts (as well as any economies, should they exist) were likely to be enjoyed by the fund complex as a whole. Finally, the Board also noted the absence of any applicable regulatory or industry guidelines on this subject, which (as discussed in the Senior Officer's evaluation) is compounded by the lack of any common industry practice or general pattern with respect to structuring fund advisory fees with “breakpoints” that serve to reduce the fee as the fund attains a certain size. The Senior Officer did not recommend institution of breakpoints in pricing Federated's fund advisory services at this time.
It was noted in the materials for the Board meeting that for the period covered by the report, the Fund's investment advisory fee, after waivers and expense reimbursements, if any, was below the median of the relevant peer group. The Board reviewed the fees and other expenses of the Fund with the Adviser and was satisfied that the overall expense structure of the Fund remained competitive.
The Senior Officer's evaluation noted his belief that the information and observations contained in his evaluation supported a finding that the proposed management fees are reasonable, and that Federated appeared to provide appropriate administrative services to the Fund for the fees paid. Under these Annual Shareholder ReportIn its decision to continue an existing investment advisory contract, the Board was mindful of the potential disruptions of the Fund's operations and various risks, uncertainties and other effects that could occur as a result of a decision to terminate or not renew an advisory contract. In particular, the Board recognized that many shareholders have invested in the Fund on the strength of the Adviser's industry standing and reputation and with the expectation that the Adviser will have a continuing role in providing advisory services to the Fund. Thus, the Board's approval of the advisory contract reflected the fact that it is the shareholders who have effectively selected the Adviser by virtue of having invested in the Fund.
The Board based its decision to approve the advisory contract on the totality of the circumstances and relevant factors and with a view to past and future long-term considerations. Not all of the factors and considerations identified above were necessarily relevant to the Fund, nor did the Board consider any one of them to be determinative. With respect to the factors that were relevant, the Board's decision to approve the contract reflects its determination that Federated's performance and actions provided a satisfactory basis to support the decision to continue the existing arrangements.
Annual Shareholder ReportVoting Proxies on Fund Portfolio Securities
A description of the policies and procedures that the Fund uses to determine how to vote proxies, if any, relating to securities held in the Fund's portfolio is available, without charge and upon request, by calling 1-800-341-7400. A report on “Form N-PX” of how the Fund voted any such proxies during the most recent 12-month period ended June 30 is available from Federated's website at FederatedInvestors.com. To access this information from the “Products” section of the website, click on the “Prospectuses and Regulatory Reports” link under “Related Information,” then select the appropriate link opposite the name of the Fund; or select the name of the Fund and from the Fund's page, click on the “Prospectuses and Regulatory Reports” link. Form N-PX filings are also available at the SEC's website at www.sec.gov.
Quarterly Portfolio Schedule
The Fund files with the SEC a complete schedule of its portfolio holdings, as of the close of the first and third quarters of its fiscal year, on “Form N-Q.” These filings are available on the SEC's website at www.sec.gov and may be reviewed and copied at the SEC's Public Reference Room in Washington, DC. (Call 1-800-SEC-0330 for information on the operation of the Public Reference Room.) You may also access this information from the “Products” section of Federated's website at FederatedInvestors.com by clicking on “Portfolio Holdings” under “Related Information,” then selecting the appropriate link opposite the name of the Fund; or select the name of the Fund and from the Fund's page, click on the “Portfolio Holdings” link.
Annual Shareholder ReportMutual funds are not bank deposits or obligations, are not guaranteed by any bank and are not insured or guaranteed by the U.S. government, the Federal Deposit Insurance Corporation, the Federal Reserve Board or any other government agency. Investment in mutual funds involves investment risk, including the possible loss of principal.
This Report is authorized for distribution to prospective investors only when preceded or accompanied by the Trust's Prospectus, which contains facts concerning its objective and policies, management fees, expenses and other information.

Federated Pennsylvania Municipal Income Fund
Federated Investors Funds
4000 Ericsson Drive
Warrendale, PA 15086-7561
Contact us at FederatedInvestors.com
or call 1-800-341-7400.
Federated Securities Corp., Distributor
Cusip 313923708
Cusip 313923807
28995 (10/10)
Federated is a registered mark of Federated Investors, Inc.
2010 © Federated Investors, Inc.
| (1) | The aggregate amount of all such services provided constitutes no more than five percent of the total amount of revenues paid by the registrant, the registrant’s adviser (not including any sub-adviser whose role is primarily portfolio management and is subcontracted with or overseen by another investment adviser), and any entity controlling, controlled by, or under common control with the investment adviser that provides ongoing services to the registrant to its accountant during the fiscal year in which the services are provided; |
| (2) | Such services were not recognized by the registrant, the registrant’s adviser (not including any sub-adviser whose role is primarily portfolio management and is subcontracted with or overseen by another investment adviser), and any entity controlling, controlled by, or under common control with the investment adviser that provides ongoing services to the registrant at the time of the engagement to be non-audit services; and |
| (3) | Such services are promptly brought to the attention of the Audit Committee of the issuer and approved prior to the completion of the audit by the Audit Committee or by one or more members of the Audit Committee who are members of the board of directors to whom authority to grant such approvals has been delegated by the Audit Committee. |
| (f) | NA |
| (g) | Non-Audit Fees billed to the registrant, the registrant’s investment adviser, and certain entities controlling, controlled by or under common control with the investment adviser: |
| Item 7. | Disclosure of Proxy Voting Policies and Procedures for Closed-End Management Investment Companies |
| Not Applicable |
| Item 8. | Portfolio Managers of Closed-End Management Investment Companies |
| Not Applicable |
| Item 9. | Purchases of Equity Securities by Closed-End Management Investment Company and Affiliated Purchasers |
| Not Applicable |
| Registrant | Federated Municipal Securities Income Trust |
| By | /S/ Richard A. Novak |
| Richard A. Novak, Principal Financial Officer | |
| Date | October 20, 2010 |
| Pursuant to the requirements of the Securities Exchange Act of 1934 and the Investment Company Act of 1940, this report has been signed below by the following persons on behalf of the registrant and in the capacities and on the dates indicated. | |
| By | /S/ J. Christopher Donahue |
| J. Christopher Donahue, Principal Executive Officer | |
| Date | October 20, 2010 |
| By | /S/ Richard A. Novak |
| Richard A. Novak, Principal Financial Officer | |
| Date | October 20, 2010 |