United States
Securities and Exchange Commission
Washington, D.C. 20549
Form N-CSR
Certified Shareholder Report of Registered Management Investment Companies
811-6165
(Investment Company Act File Number)
Federated Municipal Securities Income Trust
(Exact Name of Registrant as Specified in Charter)
Federated Investors Funds
4000 Ericsson Drive
Warrendale, Pennsylvania 15086-7561
(Address of Principal Executive Offices)
(412) 288-1900
(Registrant's Telephone Number)
John W. McGonigle, Esquire
Federated Investors Tower
1001 Liberty Avenue
Pittsburgh, Pennsylvania 15222-3779
(Name and Address of Agent for Service)
(Notices should be sent to the Agent for Service)
Date of Fiscal Year End: 08/31/2011
Date of Reporting Period: 08/31/2011
Item 1. Reports to Stockholders
 | | Annual Shareholder Report |
| | August 31, 2011 |
|
| Share Class | Ticker |
| A | FMOAX |
| B | FMOBX |
| C | FMNCX |
| F | FHTFX |
Federated Municipal High Yield Advantage Fund
Fund Established 1987
A Portfolio of Federated Municipal Securities Income Trust
Dear Valued Shareholder,
I am pleased to present the Annual Shareholder Report for your fund covering the period from September 1, 2010 through August 31, 2011. This report includes Management's Discussion of Fund Performance, a complete listing of your fund's holdings, performance information and financial statements along with other important fund information.
In addition, our website, FederatedInvestors.com, offers easy access to Federated resources that include timely fund updates, economic and market insights from our investment strategists, and financial planning tools. We invite you to register to take full advantage of its capabilities.
Thank you for investing with Federated. I hope you find this information useful and look forward to keeping you informed.
Sincerely,
J. Christopher Donahue, President
Not FDIC Insured  May Lose Value No Bank Guarantee
CONTENTS
Management's Discussion of Fund Performance (unaudited)
The Fund's total returns, based on net asset value, for the 12-month reporting period ended August 31, 2011, were 1.29% for Class A Shares and Class F Shares, 0.55% for Class B Shares and 0.54% for Class C Shares.1 The total return of the S&P Municipal Bond Index (Main Index),2 the Fund's broad-based securities market index, was 2.63% and the total return for the Morningstar High Yield Municipal Funds Category Average (MHYM),2 a peer group for the Fund, was 0.99% during the same period. At the end of the reporting period, the Fund's 12-month yield for Class A Shares was 5.74% versus 5.32% for the MHYM.
During the reporting period, the most significant factors affecting the Fund's performance relative to the Main Index were: (a) selection of lower-quality, investment-grade and noninvestment-grade securities; these securities typically have higher yields than high-quality, investment-grade securities available in the market;3 (b) security selection, particularly of inverse floaters; these securities typically have higher yields due to the leverage of the security; (c) selection of intermediate to long-term, tax-exempt municipal bonds that typically yield more than short-term, tax-exempt municipal bonds due to the upward sloping yield curve; (d) active adjustment of the Fund's duration (which indicates the portfolio sensitivity to changes in interest rates);4,5 and (e) allocation of the Fund's portfolio among securities of similar issuers (referred to as sectors).
The following discussion focuses on the performance of the Fund's Class A Shares. The 1.29% total return of the Class A Shares for the reporting period consisted of 5.71% of tax-exempt dividends and reinvestments and -4.42% of price depreciation in the net asset value of the shares.6
MARKET OVERVIEW
During the 12-month reporting period there was continued uncertainty regarding the economic outlook, regulatory policy and fiscal policy that continued to constrain hiring and capital investment. Economic growth was considerably slower than expected as reflected by deterioration in labor market conditions, slower household spending, a drop in consumer confidence and continued weakness in the housing market. The weakness in household and business spending was accompanied by fiscal consolidation at the state and local government level. The shedding of state and local government jobs contributed to the deterioration in overall labor market conditions. Higher energy and commodity prices and disruption from the Japanese earthquake were temporary factors that affected economic activity.
Throughout the period, concerns about the sovereign debt of certain European countries and the political controversy over the U.S. debt ceiling, its potential credit rating impact, and the downgrade of the long-term credit rating of the federal government of the United States had an effect on investor's Annual Shareholder Report
appetites for risk assets. As a result, the 10-year Treasury rallied from a high of 3.74% in February to a low of 2.06% in August 2011. Also, the tax-exempt municipal bond market experienced a widening in credit spreads during the period as the BBB-rated sector widened by over 20 basis points.Credit Quality7
According to Barclay's Capital the best performing bonds during the 12-month reporting period were in the A-rated category, followed by AAA- and AA-rated bonds. Lower-quality, tax-exempt municipal bonds saw spreads widen during the period, driving their prices down. This hurt the Fund's performance versus the Main Index because of the Fund's holdings in lower investment-grade, tax-exempt municipal bonds (bonds rated BBB or unrated bonds of comparable quality), and noninvestment-grade, tax-exempt municipal bonds, which averaged nearly 73% of the Fund's portfolio. During the course of the reporting period the Fund increased its allocation to noninvestment-grade and non-rated bonds in order to seek to take advantage of credit spreads which were wider than historic averages; this proved somewhat premature as spreads generally widened during the period.
Security Selection
On an historical basis, inverse floating rate securities typically have had higher yields due to the leverage of the security. These securities, however, usually were more sensitive to changes in interest rates and credit spreads. As a result, the Fund's allocation to inverse floating rate securities during the first half of the 12-month reporting period had a negative contribution to the Fund's performance relative to the Main Index. Individual securities saw both positive and negative price movement for idiosyncratic reasons, primarily changes in specific credit situations.
Maturity and Yield Curve
During the 12-month reporting period, the Fund primarily held securities on the longer end of the tax-exempt municipal bond yield curve (20-30 year maturity bonds), but also made selective purchases in the short and intermediate areas of the yield curve. The Fund's heavy position in bonds maturing in 15 years or more hurt the Fund's absolute returns as interest rates rose along the yield curve and longer bonds underperformed shorter bonds; this also hurt the Fund's performance relative to the Main Index. Throughout the latter half of the period the Fund emphasized higher coupons in purchases as a defensive mechanism against rising rates.
Duration
As determined at the end of the 12-month reporting period, the Fund's dollar-weighted average duration was 8.14 years. Duration management remained a significant component of the Fund's investment strategy. The shorter a fund's duration is, relative to an index, the less its net asset value will react as interest rates change. With rates rising across most of the yield curve, the Fund's longer duration relative to the Main Index hurt the Fund's performance.
Annual Shareholder Report
SectorDuring the 12-month reporting period, the Fund was overweight, as compared to the Main Index, in hospital and industrial development bonds, each of which outperformed and helped the Fund's performance. Similarly, the Fund's underweight allocation to pre-refunded bonds (bonds for which the principal and interest payments are secured or guaranteed by cash or U.S. Treasury securities held in an escrow account), which underperformed relative to the Main Index, was also beneficial to the Fund. On the other hand, the Fund's overweight allocations to lifecare and tobacco settlement bonds, which underperformed, hurt Fund performance. In general, the Fund's sector allocations contributed positively to its performance during the reporting period.
| 1 | Please see the footnotes to the line graphs under “Fund Performance and Growth of a $10,000 Investment” below for information regarding the affect of the reorganization of Federated Municipal High Yield Advantage Fund, Inc., a predecessor fund, into the Fund as of the close of business on November 10, 2006. |
| 2 | The Fund's total return for the most recently completed fiscal year reflected actual cash flows, transaction costs and other expenses, which were not reflected in the total return of the Main Index. S&P Indices changed the name of the Main Index from “S&P/Investortools Municipal Bond Index” to “S&P Municipal Bond Index.” Please see the footnotes to the line graphs under “Fund Performance and Growth of a $10,000 Investment” below for the definition of, and more information about, the Main Index and the MHYM. |
| 3 | Investment-grade securities and noninvestment-grade securities may either be: (a) rated by a nationally recognized statistical ratings organization or rating agency; or (b) unrated securities that the Fund's investment adviser (“Adviser”) believes are of comparable quality. The rating agencies that provided the ratings for rated securities include Standard and Poor's, Moody's Investor Services, Inc. and Fitch Rating Service. When ratings vary, the highest rating is used. Credit ratings of AA or better are considered to be high credit quality; credit ratings of A are considered high or medium/good quality; and credit ratings of BBB are considered to be medium/good credit quality, and the lowest category of investment-grade securities; credit ratings of BB and below are lower-rated, noninvestment-grade securities or junk bonds; and credit ratings of CCC or below are noninvestment-grade securities that have high default risk. Any credit quality breakdown does not give effect to the impact of any credit derivative investments made by the Fund. Credit ratings are an indication of the risk that a security will default. They do not protect a security from credit risk. Lower-rated bonds typically offer higher yields to help compensate investors for the increased risk associated with them. Among these risks are lower creditworthiness, greater price volatility, more risk to principal and income than with higher-rated securities and increased possibilities of default. |
| 4 | Bond prices are sensitive to changes in interest rates and a rise in interest rates can cause a decline in their prices. |
| 5 | Duration is a measure of a security's price sensitivity to changes in interest rates. Securities with longer durations are more sensitive to changes in interest rates than securities with shorter durations. |
| 6 | Income may be subject to state and local taxes, and the AMT. |
| 7 | Credit ratings pertain only to the securities in the portfolio and do not protect Fund shares against market risk. |
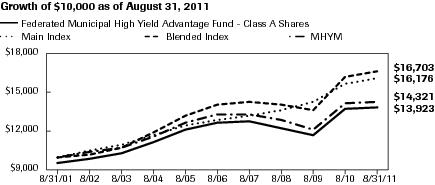
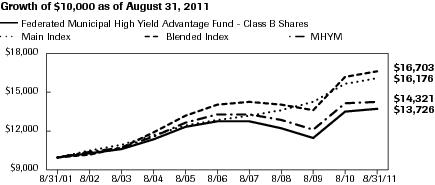
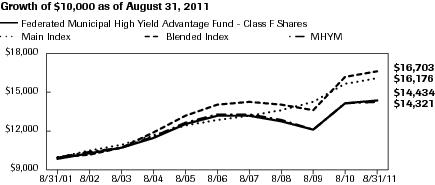
Annual Shareholder ReportFUND PERFORMANCE AND GROWTH OF A $10,000 INVESTMENT
The Average Annual Total Return table below shows returns for each class averaged over the stated periods. The graphs below illustrate the hypothetical investment of $10,0001 in Federated Municipal High Yield Advantage Fund2 (the “Fund”) from August 31, 2001 to August 31, 2011, compared to the S&P Municipal Bond Index (Main Index),3 S&P 25% A and Higher/25% BBB/50% High Yield, all 3-Year Plus Sub-Index, a custom blended index (Blended Index),4 and the Morningstar High Yield Municipal Funds Category Average (MHYM).5
Average Annual Total Returns for the Period Ended 8/31/2011
(returns reflect all applicable sales charges and contingent deferred sales charge as specified below in footnote #1)
| Share Class | 1 Year | 5 Years | 10 Years |
| Class A Shares | -3.21% | 0.86% | 3.36% |
| Class B Shares | -4.71% | 0.74% | 3.22% |
| Class C Shares | -0.41% | 1.06% | 3.08% |
| Class F Shares | -0.70% | 1.59% | 3.74% |
Performance data quoted represents past performance which is no guarantee of future results. Investment return and principal value will fluctuate so that an investor's shares, when redeemed, may be worth more or less than their original cost. Mutual fund performance changes over time and current performance may be lower or higher than what is stated. For current to the most recent month-end performance and after-tax returns, visit FederatedInvestors.com or call 1-800-341-7400. Returns shown do not reflect the deduction of taxes that a shareholder would pay on Fund distributions or the redemption of Fund shares. Mutual funds are not obligations of or guaranteed by any bank and are not federally insured.
Annual Shareholder Report
Growth of A $10,000 Investment – Class A Shares| Federated Municipal High Yield Advantage Fund - | Class A Shares | Main Index | Blended Index | MHYM |
| 8/31/2001 | 9,550 | 10,000 | 10,000 | 10,000 |
| 8/31/2002 | 9,912 | 10,571 | 10,244 | 10,356 |
| 8/31/2003 | 10,315 | 10,919 | 10,700 | 10,754 |
| 8/31/2004 | 11,116 | 11,758 | 11,880 | 11,635 |
| 8/31/2005 | 12,155 | 12,485 | 13,253 | 12,723 |
| 8/31/2006 | 12,738 | 12,920 | 14,062 | 13,380 |
| 8/31/2007 | 12,800 | 13,220 | 14,299 | 13,375 |
| 8/31/2008 | 12,306 | 13,665 | 14,080 | 12,920 |
| 8/31/2009 | 11,707 | 14,304 | 13,693 | 12,124 |
| 8/31/2010 | 13,746 | 15,762 | 16,268 | 14,180 |
| 8/31/2011 | 13,923 | 16,176 | 16,703 | 14,321 |
41 graphic description end -->
- Total returns shown include the maximum sales charge of 4.50% ($10,000 investment minus $450 sales charge = $9,550).
Growth of A $10,000 Investment – Class B Shares
| Federated Municipal High Yield Advantage Fund - | Class B Shares | Main Index | Blended Index | MHYM |
| 8/31/2001 | 10,000 | 10,000 | 10,000 | 10,000 |
| 8/31/2002 | 10,311 | 10,571 | 10,244 | 10,356 |
| 8/31/2003 | 10,639 | 10,919 | 10,700 | 10,754 |
| 8/31/2004 | 11,391 | 11,758 | 11,880 | 11,635 |
| 8/31/2005 | 12,363 | 12,485 | 13,253 | 12,723 |
| 8/31/2006 | 12,847 | 12,920 | 14,062 | 13,380 |
| 8/31/2007 | 12,812 | 13,220 | 14,299 | 13,375 |
| 8/31/2008 | 12,224 | 13,665 | 14,080 | 12,920 |
| 8/31/2009 | 11,541 | 14,304 | 13,693 | 12,124 |
| 8/31/2010 | 13,551 | 15,762 | 16,268 | 14,180 |
| 8/31/2011 | 13,726 | 16,176 | 16,703 | 14,321 |
41 graphic description end -->
- Total returns shown include the maximum contingent deferred sales charge of 5.50% as applicable.
Annual Shareholder ReportGrowth of A $10,000 Investment – Class C Shares
| Federated Municipal High Yield Advantage Fund - | Class C Shares | Main Index | Blended Index | MHYM |
| 8/31/2001 | 10,000 | 10,000 | 10,000 | 10,000 |
| 8/31/2002 | 10,313 | 10,571 | 10,244 | 10,356 |
| 8/31/2003 | 10,640 | 10,919 | 10,700 | 10,754 |
| 8/31/2004 | 11,392 | 11,758 | 11,880 | 11,635 |
| 8/31/2005 | 12,362 | 12,485 | 13,253 | 12,723 |
| 8/31/2006 | 12,845 | 12,920 | 14,062 | 13,380 |
| 8/31/2007 | 12,810 | 13,220 | 14,299 | 13,375 |
| 8/31/2008 | 12,236 | 13,665 | 14,080 | 12,920 |
| 8/31/2009 | 11,540 | 14,304 | 13,693 | 12,124 |
| 8/31/2010 | 13,466 | 15,762 | 16,268 | 14,180 |
| 8/31/2011 | 13,538 | 16,176 | 16,703 | 14,321 |
41 graphic description end -->
- Total returns shown include the maximum contingent deferred sales charge of 1.00% as applicable.
Growth of A $10,000 Investment – Class F Shares
| Federated Municipal High Yield Advantage Fund - | Class F Shares | Main Index | Blended Index | MHYM |
| 8/31/2001 | 9,900 | 10,000 | 10,000 | 10,000 |
| 8/31/2002 | 10,276 | 10,571 | 10,244 | 10,356 |
| 8/31/2003 | 10,693 | 10,919 | 10,700 | 10,754 |
| 8/31/2004 | 11,524 | 11,758 | 11,880 | 11,635 |
| 8/31/2005 | 12,601 | 12,485 | 13,253 | 12,723 |
| 8/31/2006 | 13,207 | 12,920 | 14,062 | 13,380 |
| 8/31/2007 | 13,269 | 13,220 | 14,299 | 13,375 |
| 8/31/2008 | 12,757 | 13,665 | 14,080 | 12,920 |
| 8/31/2009 | 12,136 | 14,304 | 13,693 | 12,124 |
| 8/31/2010 | 14,251 | 15,762 | 16,268 | 14,180 |
| 8/31/2011 | 14,434 | 16,176 | 16,703 | 14,321 |
41 graphic description end -->
- Total returns shown include the maximum sales charge of 1.00% ($10,000 investment minus $100 sales charge = $9,900), and maximum contingent deferred sales charge of 1.00% as applicable.
Annual Shareholder Report
| 1 | Represents a hypothetical investment of $10,000 in the Fund after deducting applicable sales charges: For Class A Shares, the maximum sales charge of 4.50% ($10,000 investment minus $450 sales charge = $9,550); For Class B Shares, the maximum contingent deferred sales charge is 5.50% on any redemption less than one year from the purchase date; For Class C Shares, the maximum contingent deferred sales charge is 1.00% on any redemption less than one year from the purchase date; For Class F Shares, the maximum sales charge of 1.00% ($10,000 investment minus $100 sales charge = $9,900), and the contingent deferred sales charge is 1.00% on any redemption less than four years from the purchase date. The Fund's performance assumes the reinvestment of all dividends and distributions. The Main Index, Blended Index and MHYM have been adjusted to reflect reinvestment of dividends on securities in the indexes and the average. |
| 2 | Federated Municipal High Yield Advantage Fund, Inc. (“Predecessor Fund”) was reorganized into Federated Municipal High Yield Advantage Fund (“Fund”), a series of Federated Municipal Securities Income Trust, as of the close of business on November 10, 2006. Prior to the reorganization, the Fund had no investment operations. The Fund is the successor to the Predecessor Fund. The information presented for periods prior to the close of business on November 10, 2006, refers to the performance of the Predecessor Fund, which after the reorganization is the Fund's performance as a result of the reorganization. |
| 3 | S&P Indices changed the name of the Main Index from the “S&P/Investortools Municipal Bond Index” to “S&P Municipal Bond Index.” The Main Index is a broad, comprehensive, market value-weighted index composed of approximately 55,000 bond issues that are exempt from U.S. federal income taxes or subject to AMT. Eligibility criteria for inclusion in the Main Index include, but are not limited to: the bond issuer must be a state (including the Commonwealth of Puerto Rico and U.S. territories) or a local government or a state or local government entity where interest on the bond is exempt from U.S. federal income taxes or subject to the AMT; the bond must be held by a mutual fund for which Standard & Poor's Securities Evaluations, Inc. provides prices; it must be denominated in U.S. dollars and have a minimum par amount of $2 million; and the bond must have a minimum term to maturity and/or call date greater than or equal to one calendar month. The Main Index is rebalanced monthly. The Main Index is not adjusted to reflect sales charges, expenses and other fees that the Securities and Exchange Commission (SEC) requires to be reflected in the Fund's performance. The Main Index is unmanaged, and, unlike the Fund, is not affected by cash flows. It is not possible to invest directly in an index. |
| 4 | S&P Indices changed the name of the Blended Index from “S&P/Investortools 25% A and Higher/25% BBB/50% High Yield, all 3-Year Plus Sub-Index” to “S&P 25% A and Higher/25% BBB/50% High Yield, all 3-Year Plus Sub-Index”. The Blended Index is a custom blended index that represents, by market weighting, 25% of the A-rated and higher component of the Main Index, 25% of the BBB-rated component of the Main Index and 50% of the below investment grade (bonds with ratings of less than BBB-/Baa3) component of the Main Index, all with remaining maturities of three years or more. The Blended Index is not adjusted to reflect sales charges, expenses and other fees that the SEC requires to be reflected in the Fund's performance. The Blended Index is unmanaged, and, unlike the Fund, is not affected by cash flows. It is not possible to invest directly in an index. |
| 5 | Morningstar figures represent the average of the total returns reported by all the mutual funds designated by Morningstar as falling into the respective category indicated. Funds designated within the MHYM include those that invest at least 50% of assets in high-income municipal securities that are not rated or that are rated by a major agency such as Standard & Poor's or Moody's Investor Service at a level of BBB (considered part of the high-yield universe within the municipal industry) and below. They do not reflect sales charges. |
Annual Shareholder Report Portfolio of Investments Summary Table (unaudited)
At August 31, 2011, the Fund's sector composition1 was as follows:
| Sector Composition | Percentage of
Total Net Assets |
| Hospital | 16.1% |
| Special Tax | 13.2% |
| Senior Care | 12.0% |
| Industrial Development Bond/Pollution Control Revenue Bond | 10.3% |
| Electric and Gas | 8.5% |
| Education | 6.6% |
| Tobacco | 5.0% |
| General Obligation — State | 4.7% |
| Transportation | 4.5% |
| General Obligation — Local | 4.0% |
| Other2 | 12.9% |
| Other Assets and Liabilities — Net3 | 2.2% |
| TOTAL | 100.0% |
| 1 | Sector classifications, and the assignment of holdings to such sectors, are based upon the economic sector and/or revenue source of the underlying obligor, as determined by the Fund's Adviser. For securities that have been enhanced by a third-party, including bond insurers and banks, sector classifications are based upon the economic sector and/or revenue source of the underlying obligor, as determined by the Fund's Adviser. |
| 2 | For purposes of this table, sector classifications constitute 84.9% of the Fund's total net assets. Remaining sectors have been aggregated under the designation “Other.” |
| 3 | Assets, other than investments in securities, less liabilities. See Statement of Assets and Liabilities. |
Annual Shareholder Report Portfolio of Investments
August 31, 2011
Principal
Amount | | | Value |
| | Municipal Bonds – 95.8% | |
| | Alabama – 1.8% | |
| $2,000,000 | | Alabama State Port Authority, Docks Facilities Revenue Bonds (Series 2010), 6.00% (Original Issue Yield: 6.25%), 10/1/2040 | 2,096,860 |
| 2,000,000 | | Courtland, AL IDB, Solid Waste Disposal Revenue Refunding Bonds (Series 2005B), 5.20% (International Paper Co.), 6/1/2025 | 1,936,840 |
| 2,000,000 | | Huntsville, AL Special Care Facilities Financing Authority, Retirement Facility Revenue Bonds (Series 2007), 5.50% (Redstone Village)/(Original Issue Yield: 5.60%), 1/1/2043 | 1,452,880 |
| 835,000 | | Selma, AL IDB, Gulf Opportunity Zone Bonds (Series 2010A), 5.80% (International Paper Co.), 5/1/2034 | 841,254 |
| 2,100,000 | | Sylacauga, AL Health Care Authority, Revenue Bonds (Series 2005A), 6.00% (Coosa Valley Medical Center)/(Original Issue Yield: 6.05%), 8/1/2035 | 1,778,616 |
| | TOTAL | 8,106,450 |
| | Alaska – 0.8% | |
| 1,000,000 | | Alaska Industrial Development and Export Authority, Community Provider Revenue Bonds (Series 2007C), 6.00% (Boys & Girls Home & Family Services, Inc.), 12/1/2036 | 648,850 |
| 1,195,000 | | Alaska Industrial Development and Export Authority, Power Revenue Bonds, 5.875% (Upper Lynn Canal Regional Power Supply System)/(Original Issue Yield: 6.00%), 1/1/2032 | 1,067,541 |
| 2,000,000 | 1,2 | Koyukuk, AK, Revenue Bonds (Series 2011), 7.75% (Tanana Chiefs Conference Health Care)/(Original Issue Yield: 8.125%), 10/1/2041 | 1,935,480 |
| | TOTAL | 3,651,871 |
| | Arizona – 2.1% | |
| 4,000,000 | | Maricopa County, AZ Pollution Control Corp., Refunding PCRBs (Series 2003A), 6.25% (Public Service Co., NM), 1/1/2038 | 3,981,680 |
| 1,500,000 | | Maricopa County, AZ Pollution Control Corp., Refunding PCRBs (Series 2009A), 7.25% (El Paso Electric Co.), 2/1/2040 | 1,690,095 |
| 1,385,000 | | Pima County, AZ IDA, PCRBs (Series 2009A), 4.95% (Tucson Electric Power Co.), 10/1/2020 | 1,373,851 |
| 2,000,000 | | Pima County, AZ IDA, Revenue Bonds (Series 2008B), 5.75% (Tucson Electric Power Co.), 9/1/2029 | 2,023,560 |
| | TOTAL | 9,069,186 |
| | California – 8.5% | |
| 2,500,000 | 1,2 | California PCFA, Solid Waste Disposal Revenue Bonds (Series 2002B), 5.00% (Waste Management, Inc.), 7/1/2027 | 2,462,225 |
| 1,000,000 | 1,2 | California PCFA, Solid Waste Disposal Revenue Bonds (Series 2005A-2), 5.40% (Waste Management, Inc.), 4/1/2025 | 1,016,570 |
| 2,000,000 | | California State Public Works Board, Lease Revenue Bonds (Series 2009I), 6.625%, 11/1/2034 | 2,212,020 |
Annual Shareholder ReportPrincipal
Amount | | | Value |
| $2,500,000 | | California State, Various Purpose UT GO Bonds, 5.25%, 10/1/2029 | 2,637,925 |
| 2,500,000 | | California State, Various Purpose UT GO Bonds, 6.00% (Original Issue Yield: 6.10%), 4/1/2038 | 2,725,175 |
| 1,190,000 | 1,2 | California Statewide CDA, MFH Revenue Bonds (Series 1999X), 6.65% (Magnolia City Lights Project), 7/1/2039 | 1,058,874 |
| 2,000,000 | | Chula Vista, CA, COP, 5.50% (Original Issue Yield: 5.88%), 3/1/2033 | 2,009,440 |
| 2,000,000 | | Golden State Tobacco Securitization Corp., CA, Enhanced Tobacco Settlement Asset-Backed Bonds (Series 2005A), 5.00% (California State), 6/1/2045 | 1,756,020 |
| 530,000 | | Golden State Tobacco Securitization Corp., CA, Tobacco Settlement Asset-Backed Bonds (Series 2007A-1), 5.75%, 6/1/2047 | 373,751 |
| 6,000,000 | | Golden State Tobacco Securitization Corp., CA, Tobacco Settlement Asset-Backed Revenue Bonds (Series 2007A-1), 5.125% (Original Issue Yield: 5.27%), 6/1/2047 | 3,852,780 |
| 750,000 | | Golden State Tobacco Securitization Corp., CA, Tobacco Settlement Revenue Bonds (Series 2003A-2), 7.90% (United States Treasury PRF 6/1/2023@100), 6/1/2042 | 846,248 |
| 1,000,000 | | Los Angeles, CA Regional Airport Improvement Corp., Facilities Sublease Refunding Revenue Bonds (Series 2002B), 7.50% (American Airlines, Inc.)/(Original Issue Yield: 7.929%), 12/1/2024 | 1,008,390 |
| 2,000,000 | | Los Angeles, CA Regional Airport Improvement Corp., Lease Revenue Bonds, Series C, 7.50% (American Airlines, Inc.)/(Original Issue
Yield: 7.929%), 12/1/2024 | 2,016,780 |
| 2,500,000 | | M-S-R Energy Authority, CA, Gas Revenue Bonds (Series 2009A), 7.00% (Citigroup, Inc. GTD), 11/1/2034 | 2,810,450 |
| 985,000 | | Oxnard, CA Community Facilities District No. 3, Special Tax Bonds (Series 2005), 5.00% (Seabridge at Mandalay Bay)/(Original Issue Yield: 5.22%), 9/1/2035 | 822,298 |
| 2,000,000 | | Riverside County, CA Redevelopment Agency, Tax Allocation Bonds (Series 2010D), 6.00% (Desert Communities Redevelopment Project Area)/(Original Issue Yield: 6.02%), 10/1/2037 | 2,002,640 |
| 1,500,000 | | Riverside County, CA Redevelopment Agency, Tax Allocation Bonds (Series 2010E), 6.50% (Interstate 215 Corridor Redevelopment Project Area)/(Original Issue Yield: 6.53%), 10/1/2040 | 1,546,545 |
| 349,000 | 3 | San Bernardino County, CA Housing Authority, Subordinated Revenue Bonds, 7.25% (Glen Aire Park & Pacific Palms), 4/15/2042 | 169,146 |
| 1,250,000 | | San Buenaventura, CA, Revenue Bonds (Series 2011), 8.00% (Community Memorial Health System), 12/1/2031 | 1,302,087 |
| 1,000,000 | | San Diego, CA Public Facilities Authority, Lease Revenue Refunding Bonds (Series 2010A), 5.25% (San Diego, CA)/(Original Issue
Yield: 5.37%), 3/1/2040 | 971,230 |
| 1,000,000 | | San Francisco, CA City & County Redevelopment Finance Agency, Tax Allocation Bonds (Series 2011C), 6.75% (Mission Bay North Redevelopment)/(Original Issue Yield: 6.86%), 8/1/2041 | 1,058,010 |
Annual Shareholder ReportPrincipal
Amount | | | Value |
| $2,000,000 | | San Jose, CA Airport, Airport Revenue Bonds (Series 2011A-1), 6.25%, 3/1/2034 | 2,135,780 |
| 1,000,000 | | Western Hills Water District, CA, Special Tax Revenue Bonds, 6.875% (Diablo Grande Community Facilities No. 1)/(Original Issue
Yield: 6.954%), 9/1/2031 | 627,230 |
| | TOTAL | 37,421,614 |
| | Colorado – 5.9% | |
| 2,000,000 | | Beacon Point, CO Metropolitan District, Revenue Bonds (Series 2005A), 6.25% (Original Issue Yield: 6.375%), 12/1/2035 | 1,821,520 |
| 536,000 | | Castle Oaks, CO Metropolitan District, LT GO Bonds (Series 2005), 6.125%, 12/1/2035 | 414,098 |
| 775,000 | | Colorado Educational & Cultural Facilities Authority, Charter School Revenue Bonds (Series 2007A), 5.70% (Windsor Charter Academy)/(Original Issue Yield: 5.70%), 5/1/2037 | 663,764 |
| 835,000 | | Colorado Educational & Cultural Facilities Authority, Charter School Revenue Bonds (Series 2007A), 5.75% (Northeast Academy Charter School), 5/15/2037 | 623,386 |
| 1,000,000 | | Colorado Educational & Cultural Facilities Authority, Charter School Revenue Bonds (Series 2007A), 6.00% (Monument Academy Charter School), 10/1/2037 | 891,720 |
| 1,610,000 | | Colorado Educational & Cultural Facilities Authority, Revenue Refunding Bonds (Series A), 7.125% (Denver Academy)/(Original Issue Yield: 7.375%), 11/1/2028 | 1,623,798 |
| 1,000,000 | | Colorado Health Facilities Authority, Health & Residential Care Facilities Revenue Bonds (Series 2007), 5.30% (Volunteers of America Care Facilities), 7/1/2037 | 777,490 |
| 1,100,000 | | Colorado Health Facilities Authority, Revenue Bonds (Series 2010A), 6.25% (Total Longterm Care National Obligated Group), 11/15/2040 | 1,112,144 |
| 2,000,000 | | Colorado Springs Urban Renewal Authority, Tax Increment Revenue Bonds (Series 2007), 7.00% (University Village Colorado), 12/1/2029 | 1,771,060 |
| 1,000,000 | | Conservatory Metropolitan District, CO, LT GO Bonds, 7.55% (United States Treasury PRF 12/1/2013@102), 12/1/2032 | 1,174,690 |
| 1,335,000 | | Conservatory Metropolitan District, CO, Refunding & Improvement LT GO Bonds, 5.125% (Radian Asset Assurance, Inc. INS), 12/1/2037 | 997,659 |
| 1,540,000 | | Denver, CO City & County Department of Aviation, Airport System Revenue Bonds (Series 2011A), 5.25% (Original Issue Yield: 5.35%), 11/15/2022 | 1,704,133 |
| 450,000 | | Eagle County, CO Air Terminal Corp., Airport Terminal Project Revenue Improvement Bonds (Series 2006B), 5.25%, 5/1/2020 | 429,458 |
| 750,000 | | Eagle County, CO Air Terminal Corp., Revenue Refunding Bonds (Series 2011A), 6.00%, 5/1/2027 | 761,573 |
| 1,000,000 | | Granby Ranch, CO Metropolitan District, LT GO Bonds (Series 2006), 6.75%, 12/1/2036 | 911,240 |
Annual Shareholder ReportPrincipal
Amount | | | Value |
| $500,000 | | Maher Ranch, CO Metropolitan District No. 4, LT GO Bonds (Series 2006), 7.00% (United States Treasury PRF 12/1/2013@102), 12/1/2036 | 578,765 |
| 1,000,000 | | Maher Ranch, CO Metropolitan District No. 4, LT GO Bonds, 7.875% (United States Treasury PRF 12/1/2013@102), 12/1/2033 | 1,176,380 |
| 2,235,000 | | Northwest, CO Metropolitan District No. 3, LT GO Bonds (Series 2005), 6.25%, 12/1/2035 | 1,885,446 |
| 2,000,000 | | Public Authority for Colorado Energy, Natural Gas Purchase Revenue Bonds (Series 2008), 6.25% (Merrill Lynch & Co., Inc. GTD)/(Original Issue Yield: 6.63%), 11/15/2028 | 2,063,840 |
| 1,500,000 | | Southlands, CO Metropolitan District No. 1, LT GO Bonds (Series 2004), 7.125% (United States Treasury PRF 12/1/2014@100)/(Original Issue Yield: 7.18%), 12/1/2034 | 1,812,360 |
| 2,000,000 | | Three Springs Metropolitan District No. 3, CO, Property Tax Supported Revenue Bonds (Series 2010), 7.75%, 12/1/2039 | 1,984,900 |
| | TOTAL | 25,179,424 |
| | Connecticut – 0.2% | |
| 1,000,000 | | Connecticut Development Authority, Airport Facility Revenue Bonds, 7.95% (Bombardier, Inc.), 4/1/2026 | 1,044,390 |
| | Delaware – 0.5% | |
| 1,905,000 | | Delaware EDA, Gas Facilities Refunding Bonds, 5.40% (Delmarva Power and Light Co.), 2/1/2031 | 1,982,838 |
| | Florida – 4.7% | |
| 3,000,000 | | Alachua County, FL, IDRB (Series 2007A), 5.875% (North Florida Retirement Village, Inc,), 11/15/2042 | 2,286,690 |
| 1,405,000 | | Arborwood, FL Community Development District, Capital Improvement Revenue Bonds (Series 2005A), 5.35%, 5/1/2036 | 971,543 |
| 109,219 | 3 | Capital Trust Agency, FL, Housing Revenue Notes, 5.95% (Atlantic Housing Foundation Properties), 1/15/2039 | 21,837 |
| 785,000 | | East Homestead, FL Community Development District, Special Assessment Revenue Bonds (Series 2005), 5.45%, 5/1/2036 | 664,793 |
| 60,000 | | Fishhawk Community Development District II, Special Assessment Revenue Bonds (Series 2004B), 7.04% (Original Issue Yield: 7.087%), 11/1/2014 | 58,610 |
| 1,000,000 | | Greater Orlando, FL Aviation Authority, Special Purpose Airport Facilities Revenue Bonds (Series 2005), 6.50% (Jet Blue Airways Corp.)/(Original Issue Yield: 6.811%), 11/15/2036 | 947,250 |
| 990,000 | | Lakes by the Bay South Community Development District, FL, Special Assessment Revenue Bonds (Series 2004A), 6.25% (Original Issue Yield: 6.277%), 5/1/2034 | 937,223 |
| 2,000,000 | | Lee County, FL IDA, Health Care Facilities Revenue Bond (Series A), 6.75% (Cypress Cove at Healthpark)/(Original Issue Yield: 6.98%), 10/1/2032 | 1,481,140 |
Annual Shareholder ReportPrincipal
Amount | | | Value |
| $1,000,000 | | Miami Beach, FL Health Facilities Authority, Hospital Revenue Bonds (Series 2001A), 6.70% (Mt. Sinai Medical Center, FL)/(Original Issue Yield: 6.80%), 11/15/2019 | 1,007,970 |
| 1,000,000 | | Miami-Dade County, FL Water & Sewer Authority, Water & Sewer System Revenue Bonds (Series 2010), 5.00% (Original Issue
Yield: 5.05%), 10/1/2034 | 1,033,890 |
| 1,000,000 | | Midtown Miami, FL Community Development District, Special Assessment Bonds (Series 2004A), 6.25% (Original Issue
Yield: 6.30%), 5/1/2037 | 967,660 |
| 600,000 | | Orlando, FL Urban Community Development District, Capital Improvement Revenue Bonds, 6.25%, 5/1/2034 | 518,766 |
| 2,000,000 | 1,2 | Palm Beach County, FL, Tax-Exempt Revenue Bonds (Series 2005A), 6.75% (G-Star School of the Arts for Motion Pictures and Broadcasting Charter School), 5/15/2035 | 1,723,620 |
| 1,000,000 | | Reunion East Community Development District, FL, Special Assessment Bonds (Series 2002A), 7.375%, 5/1/2033 | 691,790 |
| 1,000,000 | | South Lake County, FL Hospital District, Revenue Bonds (Series 2009A), 6.25% (South Lake Hospital, Inc.)/(Original Issue Yield: 6.30%), 4/1/2039 | 1,009,540 |
| 1,200,000 | | South Lake County, FL Hospital District, Revenue Bonds, 6.625% (South Lake Hospital, Inc.), 10/1/2023 | 1,236,264 |
| 1,640,000 | | Tolomato Community Development District, FL, Special Assessment Revenue Bonds (Series 2006), 5.40%, 5/1/2037 | 1,243,989 |
| 1,000,000 | | Tolomato Community Development District, FL, Special Assessment Revenue Bonds (Series 2007), 6.55% (Original Issue Yield: 6.60%), 5/1/2027 | 663,490 |
| 950,000 | | Verandah East, FL Community Development District, Capital Improvement Revenue Bonds (Series 2006A), 5.40%, 5/1/2037 | 531,705 |
| 775,000 | | Verandah West, FL Community Development District, Capital Improvement Revenue Bonds (Series 2003A), 6.625% (Original Issue Yield: 6.75%), 5/1/2033 | 741,900 |
| 1,630,000 | | Volusia County, FL Education Facility Authority, Educational Facilities Refunding Revenue Bonds (Series 2005), 5.00% (Embry-Riddle Aeronautical University, Inc.)/(Radian Asset Assurance, Inc. INS), 10/15/2025 | 1,599,177 |
| 470,000 | | Winter Garden Village at Fowler Groves Community Development District, FL, Special Assessment Bonds (Series 2006), 5.65%, 5/1/2037 | 427,456 |
| | TOTAL | 20,766,303 |
| | Georgia – 2.2% | |
| 4,000,000 | | Atlanta, GA Water & Wastewater, Revenue Bonds (Series 2009A), 6.25% (Original Issue Yield: 6.38%), 11/1/2039 | 4,390,560 |
| 770,000 | | Atlanta, GA, Tax Allocation Bonds (Series 2005B), 5.60% (Eastside Tax Allocation District)/(Original Issue Yield: 5.65%), 1/1/2030 | 761,245 |
| 1,045,000 | | Atlanta, GA, Tax Allocation Bonds (Series 2006), 5.50% (Princeton Lakes), 1/1/2031 | 963,156 |
Annual Shareholder ReportPrincipal
Amount | | | Value |
| $1,695,000 | | Augusta, GA HFA, MFH Refunding Revenue Bonds, 6.55% (Forest Brook Apartments), 12/1/2030 | 1,538,619 |
| 750,000 | | Fulton County, GA Residential Care Facilities, Revenue Bonds (Series 2004A), 6.00% (Canterbury Court), 2/15/2022 | 708,802 |
| 1,000,000 | | Medical Center Hospital Authority, GA, Revenue Refunding Bonds (Series 2007), 5.25% (Spring Harbor at Green Island), 7/1/2037 | 801,720 |
| | TOTAL | 9,164,102 |
| | Guam – 0.5% | |
| 500,000 | | Guam Government LO (Section 30), Bonds (Series 2009A), 5.75% (Original Issue Yield: 6.00%), 12/1/2034 | 503,210 |
| 1,000,000 | | Guam Government, GO Bonds (Series 2009A), 7.00% (Original Issue Yield: 7.18%), 11/15/2039 | 1,029,290 |
| 1,000,000 | | Guam Government, UT GO Bonds (Series 2007A), 5.25% (Original Issue Yield: 5.45%), 11/15/2037 | 850,210 |
| | TOTAL | 2,382,710 |
| | Hawaii – 1.2% | |
| 2,000,000 | | Hawaii State Department of Budget & Finance, Special Purpose Revenue Bonds (Series 2009), 6.50% (Hawaiian Electric Co., Inc.), 7/1/2039 | 2,121,800 |
| 700,000 | | Hawaii State Department of Budget & Finance, Special Purpose Revenue Bonds (Series A), 7.00% (Kahala Nui)/(Original Issue
Yield: 7.00%), 11/15/2012 | 714,714 |
| 1,000,000 | | Hawaii State Department of Budget & Finance, Special Purpose Revenue Bonds (Series A), 8.00% (Kahala Nui)/(Original Issue
Yield: 8.175%), 11/15/2033 | 1,042,130 |
| 1,000,000 | | Hawaii State Department of Budget & Finance, Special Purpose Senior Living Revenue Bonds (Series A), 9.00% (15 Craigside)/
(Original Issue Yield: 9.15%), 11/15/2044 | 1,111,850 |
| | TOTAL | 4,990,494 |
| | Illinois – 4.2% | |
| 1,750,000 | | Chicago, IL O'Hare International Airport, General Airport Third Lien Revenue Bonds (Series 2011A), 5.75% (Original Issue
Yield: 5.94%), 1/1/2039 | 1,868,335 |
| 2,500,000 | | Chicago, IL O'Hare International Airport, General Airport Third Lien Revenue Bonds (Series 2011C), 6.50%, 1/1/2041 | 2,814,500 |
| 415,000 | | DuPage County, IL, Special Tax Bonds (Series 2006), 5.625% (Naperville Campus LLC), 3/1/2036 | 324,119 |
| 1,000,000 | | Illinois Finance Authority, MFH Revenue Bonds (Series 2007), 6.10% (Dekalb Supportive Living Facility), 12/1/2041 | 778,030 |
| 1,000,000 | | Illinois Finance Authority, Revenue Bonds (Series 2005A), 5.625% (Friendship Village of Schaumburg)/(Original Issue Yield: 5.70%), 2/15/2037 | 794,950 |
| 1,250,000 | | Illinois Finance Authority, Revenue Bonds (Series 2005A), 6.00% (Landing at Plymouth Place)/(Original Issue Yield: 6.04%), 5/15/2037 | 1,036,275 |
Annual Shareholder ReportPrincipal
Amount | | | Value |
| $1,500,000 | | Illinois Finance Authority, Revenue Bonds (Series 2005A), 6.25% (Smith Village), 11/15/2035 | 1,263,405 |
| 1,000,000 | | Illinois Finance Authority, Revenue Bonds (Series 2010), 7.25% (Friendship Village of Schaumburg)/(Original Issue
Yield: 7.375%), 2/15/2045 | 980,250 |
| 600,000 | 4 | Illinois Finance Authority, Revenue Bonds (Series 2010B) (Clare at Water Tower)/(Original Issue Yield: 5.00%), 5/15/2050 | 1,974 |
| 1,400,000 | 4 | Illinois Finance Authority, Revenue Bonds {Series 2010A}, 6.125% (Clare at Water Tower), 5/15/2041 | 419,832 |
| 1,000,000 | | Illinois Finance Authority, Solid Waste Disposal Revenue Bonds, 5.05% (Waste Management, Inc.), 8/1/2029 | 977,370 |
| 1,200,000 | | Illinois Finance Authority, Water Facilities Revenue Bonds (Series 2009), 5.25% (American Water Capital Corp.), 10/1/2039 | 1,145,736 |
| 2,250,000 | | Illinois State, UT GO Bonds (Series 2006), 5.00%, 1/1/2027 | 2,275,155 |
| 1,000,000 | | Quad Cities, IL Regional EDA, MFH Revenue Bonds (Series 2006), 6.00% (Heritage Woods of Moline Supportive Living Facility), 12/1/2041 | 766,770 |
| 1,600,000 | | Railsplitter Tobacco Settlement Authority, IL, Tobacco Settlement Revenue Bonds (Series 2010), 6.00% (Original Issue
Yield: 6.10%), 6/1/2028 | 1,635,360 |
| 1,500,000 | | Will-Kankakee, IL Regional Development Authority, MFH Revenue Bonds (Series 2007), 7.00% (Senior Estates Supportive Living), 12/1/2042 | 1,305,525 |
| | TOTAL | 18,387,586 |
| | Indiana – 1.9% | |
| 1,000,000 | | Goshen, IN, Revenue Bonds (Series 1998), 5.75% (Greencroft Obligated Group)/(Original Issue Yield: 5.87%), 8/15/2028 | 853,180 |
| 2,000,000 | | Indiana Health Facility Financing Authority, Revenue Refunding Bonds (Series 1998), 5.625% (Greenwood Village South Project)/(Original Issue Yield: 5.802%), 5/15/2028 | 1,616,540 |
| 1,305,000 | | Indiana State Finance Authority (Environmental Improvement Bonds), Revenue Refunding Bonds (Series 2010), 6.00% (United States Steel Corp.), 12/1/2026 | 1,304,987 |
| 1,000,000 | | Jasper County, IN, PCR Refunding Bonds (Series 2003), 5.70% (Northern Indiana Public Service Company)/(AMBAC INS), 7/1/2017 | 1,140,870 |
| 1,000,000 | | South Bend, IN, EDRBs (Series 1999A), 6.25% (Southfield Village)/(Original Issue Yield: 6.375%), 11/15/2029 | 870,660 |
| 1,247,800 | 3,5 | St. Joseph County, IN Hospital Authority, Health Facilities Revenue Bonds (Series 2005), 5.375% (Madison Center Obligated Group), 2/15/2034 | 214,310 |
| 2,000,000 | | Vigo County, IN Hospital Authority, Hospital Revenue Bond (Series 2007), 5.80% (Union Hospital)/(Original Issue
Yield: 5.82%), 9/1/2047 | 1,759,320 |
| | TOTAL | 7,759,867 |
Annual Shareholder ReportPrincipal
Amount | | | Value |
| | Iowa – 0.7% | |
| $1,715,000 | | Iowa Finance Authority, Senior Living Facility Revenue Refunding Bonds (Series 2007A), 5.50% (Deerfield Retirement Community, Inc.), 11/15/2037 | 1,142,739 |
| 1,785,000 | | Wapello County, IA, Revenue Bonds, 6.25% (Ottumwa Regional Health Center)/(United States Treasury PRF 10/1/2012@100)/(Original Issue Yield: 6.40%), 10/1/2022 | 1,886,709 |
| | TOTAL | 3,029,448 |
| | Kansas – 1.9% | |
| 2,000,000 | | Kansas State Development Finance Authority, Revenue Bonds, 5.75% (Adventist Health System/ Sunbelt Obligated Group)/(Original Issue Yield: 5.95%), 11/15/2038 | 2,142,860 |
| 1,100,000 | | Labette County, KS, Hospital Refunding & Improvement Revenue Bonds (Series 2007A), 5.75% (Labette Health), 9/1/2037 | 1,023,110 |
| 790,000 | | Manhattan, KS IDRB, Industrial Revenue Bonds (Series 1999), 7.00% (Farrar Corp. Project), 8/1/2014 | 781,231 |
| 1,000,000 | | Manhattan, KS IDRB, Industrial Revenue Bonds (Series 2007), 5.50% (Farrar Corp. Project)/(Original Issue Yield: 5.55%), 8/1/2021 | 827,560 |
| 2,015,000 | | Norwich, KS, Industrial Revenue Bonds (Series 2006), 5.90% (Farrar Corp. Project), 8/1/2021 | 1,731,369 |
| 2,000,000 | | Olathe, KS, Senior Living Facility Revenue Bonds (Series 2006A), 6.00% (Catholic Care Campus, Inc.), 11/15/2038 | 1,764,580 |
| 125,000 | | Sedgwick & Shawnee Counties, KS, SFM Revenue Bonds (Series 1997A-1), 6.95% (GNMA Home Mortgage Program COL), 6/1/2029 | 129,069 |
| | TOTAL | 8,399,779 |
| | Kentucky – 0.8% | |
| 1,990,000 | | Kentucky EDFA, Hospital System Refunding Revenue Bonds, 5.875% (Appalachian Regional Health Center)/(Original Issue
Yield: 5.92%), 10/1/2022 | 1,807,378 |
| 435,000 | | Kentucky EDFA, Revenue Bonds (Series 2000A), 6.625% (Norton Healthcare, Inc.)/(Original Issue Yield: 6.97%), 10/1/2028 | 435,418 |
| 1,250,000 | | Kentucky EDFA, Revenue Bonds (Series 2011A), 7.375% (Miralea)/(Original Issue Yield: 7.40%), 5/15/2046 | 1,240,512 |
| | TOTAL | 3,483,308 |
| | Louisiana – 1.7% | |
| 1,000,000 | | DeSoto Parish, LA Environmental Improvement Authority, Revenue Bonds, Series A, 5.00% (International Paper Co.), 11/1/2018 | 996,600 |
| 981,000 | 3,5 | Lakeshore Villages Master Community Development District, LA, Special Assessment Bonds (Series 2007), 5.25% (Original Issue
Yield: 5.378%), 7/1/2017 | 490,892 |
| 1,000,000 | | Louisiana Public Facilities Authority, 6.50% (Ochsner Clinic Foundation)/(Original Issue Yield: 6.65%), 5/15/2037 | 1,057,370 |
| 3,000,000 | | Louisiana Public Facilities Authority, Revenue Bonds (Series 2010A), 5.00% (Entergy Gulf States Louisiana LLC), 9/1/2028 | 3,064,260 |
Annual Shareholder ReportPrincipal
Amount | | | Value |
| $2,000,000 | | Louisiana State Citizens Property Insurance Corp., Assessment Revenue Bonds (Series 2006C), 6.125% (Assured Guaranty Corp. INS)/(Original Issue Yield: 6.33%), 6/1/2025 | 2,221,360 |
| | TOTAL | 7,830,482 |
| | Maine – 0.3 | |
| 1,335,000 | | Maine Health & Higher Educational Facilities Authority, Revenue Bonds (Series 2011), 7.50% (MaineGeneral Medical Center), 7/1/2032 | 1,438,756 |
| | Maryland – 1.5% | |
| 1,555,000 | | Baltimore, MD, Special Obligation Revenue Bonds (Series 2008A), 7.00% (East Baltimore Research Park), 9/1/2038 | 1,576,412 |
| 1,060,000 | | Maryland State Economic Development Corp., Port Facilities Refunding Revenue Bonds (Series 2010), 5.75% (CONSOL Energy, Inc.), 9/1/2025 | 1,041,821 |
| 2,385,000 | | Maryland State Economic Development Corp., Revenue Bonds (Series B), 5.75% (Ports America Chesapeake, Inc.)/(Original Issue Yield: 5.875%), 6/1/2035 | 2,342,332 |
| 395,000 | | Maryland State Health & Higher Educational Facilities Authority, Revenue Bonds (Series 2007A), 5.25% (King Farm Presbyterian Retirement Community), 1/1/2027 | 324,145 |
| 1,100,000 | | Maryland State Health & Higher Educational Facilities Authority, Revenue Bonds (Series 2007A), 5.30% (King Farm Presbyterian Retirement Community)/(Original Issue Yield: 5.35%), 1/1/2037 | 798,809 |
| 500,000 | | Maryland State IDFA, EDRBs (Series 2005A), 6.00% (Our Lady of Good Counsel High School), 5/1/2035 | 500,600 |
| | TOTAL | 6,584,119 |
| | Massachusetts – 1.6% | |
| 1,500,000 | 6 | Massachusetts Development Finance Agency, Revenue Bonds (Series 2007A), 5.75% (Linden Ponds, Inc.), 11/15/2042 | 799,575 |
| 2,000,000 | | Massachusetts Development Finance Agency, Revenue Bonds (Series 2011I), 7.25% (Tufts Medical Center), 1/1/2032 | 2,205,020 |
| 500,000 | 1,2 | Massachusetts Development Finance Agency, Senior Living Facility Revenue Bonds (Series 2009A), 7.75% (The Groves in Lincoln)/(Original Issue Yield: 7.90%), 6/1/2039 | 503,515 |
| 1,000,000 | 1,2 | Massachusetts Development Finance Agency, Senior Living Facility Revenue Bonds (Series 2009A), 7.875% (The Groves in Lincoln)/(Original Issue Yield: 8.00%), 6/1/2044 | 1,011,510 |
| 2,000,000 | | Massachusetts HEFA, Revenue Bonds (Series 1998D), 5.25% (Jordan Hospital)/(Original Issue Yield: 5.53%), 10/1/2023 | 1,778,980 |
| 1,000,000 | | Massachusetts HEFA, Revenue Bonds (Series 2003E), 6.75% (Jordan Hospital)/(Original Issue Yield: 7.00%), 10/1/2033 | 975,860 |
| | TOTAL | 7,274,460 |
Annual Shareholder ReportPrincipal
Amount | | | Value |
| | Michigan – 4.2% | |
| $1,000,000 | | Dearborn, MI Economic Development Corp., Revenue Refunding Bonds, 7.125% (Henry Ford Village)/(Original Issue
Yield: 7.25%), 11/15/2043 | 923,950 |
| 4,000,000 | | Detroit, MI Water Supply System, Second Lien Refunding Revenue Bonds (Series 2006C), 5.00% (Assured Guaranty Municipal Corp. INS), 7/1/2033 | 3,926,760 |
| 1,000,000 | | Iron River, MI Hospital Finance Authority, Hospital Revenue & Refunding Bonds (Series 2008), 6.50% (Iron County Community Hospitals, Inc.)/(Original Issue Yield: 6.61%), 5/15/2033 | 905,350 |
| 2,500,000 | | Kent Hospital Finance Authority, MI, Revenue Bonds (Series 2005A), 6.25% (Metropolitan Hospital), 7/1/2040 | 2,328,400 |
| 2,665,000 | | Michigan Finance Authority, State Aid Revenue Notes (Series 2011A-2), 6.65% (Detroit, MI City School District), 3/20/2012 | 2,716,008 |
| 3,165,000 | | Michigan State HFA, Refunding Revenue Bonds, 5.75% (Henry Ford Health System, MI)/(Original Issue Yield: 6.00%), 11/15/2039 | 3,147,181 |
| 5,000,000 | | Michigan Tobacco Settlement Finance Authority, Tobacco Settlement Asset-Backed Bonds (Series 2007A), 6.00% (Original Issue
Yield: 6.25%), 6/1/2048 | 3,495,300 |
| 1,500,000 | | Plymouth, MI Educational Center Charter School, Public School Academy Revenue Refunding Bonds, Series 2005, 5.625%, 11/1/2035 | 1,183,935 |
| | TOTAL | 18,626,884 |
| | Minnesota – 3.6% | |
| 1,000,000 | | Baytown Township, MN, Lease Revenue Bonds (Series 2008A), 7.00% (St. Croix Preparatory Academy)/(Original Issue Yield: 7.05%), 8/1/2038 | 983,270 |
| 4,000,000 | | Becker, MN, PCRBs (Series 2000-A), 8.50% (Northern States Power Co., MN), 4/1/2030 | 4,207,280 |
| 1,300,000 | | Meeker County, MN, Gross Revenue Hospital Facilities Bonds (Series 2007), 5.75% (Meeker County Memorial Hospital), 11/1/2037 | 1,232,647 |
| 1,000,000 | | Pine City, MN Lease Revenue, Lease Revenue Bonds (Series 2006A), 6.25% (Lakes International Language Academy), 5/1/2035 | 897,870 |
| 500,000 | | Ramsey, MN, Lease Revenue Bonds (Series 2004A), 6.75% (Pact Charter School), 12/1/2033 | 480,230 |
| 800,000 | | St. Paul, MN Housing & Redevelopment Authority, Refunding Revenue Bonds (Series 2003A), 6.75% (Achieve Language Academy), 12/1/2022 | 797,400 |
| 1,000,000 | | St. Paul, MN Housing & Redevelopment Authority, Refunding Revenue Bonds (Series 2003A), 7.00% (Achieve Language Academy), 12/1/2032 | 992,210 |
| 1,800,000 | | St. Paul, MN Housing & Redevelopment Authority, Revenue Bonds (Series 2002B), 7.00% (Upper Landing Project)/(Original Issue
Yield: 7.05%), 3/1/2029 | 1,778,580 |
| 1,865,000 | | Winona, MN Port Authority, Lease Revenue Bonds (Series 2007A), 6.00% (Bluffview Montessori School Project), 11/1/2027 | 1,671,021 |
Annual Shareholder ReportPrincipal
Amount | | | Value |
| $2,920,000 | | Winona, MN Port Authority, Lease Revenue Bonds (Series 2007A), 6.15% (Bluffview Montessori School Project), 11/1/2037 | 2,527,085 |
| | TOTAL | 15,567,593 |
| | Missouri – 2.4% | |
| 2,445,000 | 1,2 | Kansas City, MO IDA, MFH Revenue Bonds, 6.90% (Woodbridge Apartments Project), 8/1/2030 | 2,233,043 |
| 1,000,000 | | Kirkwood, MO IDA, Retirement Community Revenue Bonds (Series 2010A), 8.25% (Aberdeen Heights Project)/(Original Issue Yield: 8.40%), 5/15/2039 | 1,034,240 |
| 3,000,000 | | Kirkwood, MO IDA, Retirement Community Revenue Bonds (Series 2010A), 8.25% (Aberdeen Heights Project)/(Original Issue Yield: 8.50%), 5/15/2045 | 3,096,960 |
| 3,000,000 | | Missouri Development Finance Board, Infrastructure Facilities Revenue Bonds (Series 2005A), 5.00% (Branson, MO), 6/1/2035 | 2,999,760 |
| 1,000,000 | | St. Joseph, MO IDA, Healthcare Revenue Bonds, 7.00% (Living Community St. Joseph Project), 8/15/2032 | 894,460 |
| 500,000 | | West Plains, MO IDA, Hospital Revenue Bonds, 6.75% (Ozarks Medical Center)/(Original Issue Yield: 6.78%), 11/15/2024 | 478,090 |
| | TOTAL | 10,736,553 |
| | Nevada – 2.0% | |
| 1,000,000 | | Clark County, NV Improvement District, Special Assessment Revenue Refunding Bonds (Series 2006B), 5.30% (Southern Highlands SID No.121-B)/(Original Issue Yield: 5.33%), 12/1/2029 | 793,980 |
| 4,000,000 | | Clark County, NV School District, LT GO Building Bonds (Series 2008A), 5.00%, 6/15/2025 | 4,182,280 |
| 920,000 | | Clark County, NV, LO Improvement Bonds (Series 2003), 6.375% (Mountains Edge SID No. 142)/(Original Issue Yield: 6.40%), 8/1/2023 | 936,394 |
| 840,000 | | Clark County, NV, Local Improvement Bonds (Series 2001), 6.875% (Summerlin-South SID No. 132)/(Original Issue Yield: 6.92%), 2/1/2021 | 842,386 |
| 480,000 | | Clark County, NV, Special Assessment Revenue Bonds (Series 2005), 5.00% (Summerlin-Mesa SID No. 151), 8/1/2025 | 337,930 |
| 475,000 | | Las Vegas, NV, Local Improvement Special Assessment Bonds (Series 2004), 6.00% (Providence SID No. 607), 6/1/2019 | 452,067 |
| 910,000 | | North Las Vegas, NV SID No. 60, Subordinate LT Obligation Refunding Bonds (Series 2006B), 5.10% (Aliante SID No. 60), 12/1/2022 | 817,007 |
| | TOTAL | 8,362,044 |
| | New Jersey – 2.7% | |
| 1,650,000 | | New Jersey EDA, Kapkowski Road Landfill Revenue Bonds, 6.50% (New Jersey Metromall Urban Renewal, Inc.)/(Original Issue
Yield: 6.55%), 4/1/2018 | 1,680,492 |
| 1,550,000 | | New Jersey EDA, Revenue Bonds (Series 1997A), 5.875% (Host Marriott Corp.), 12/1/2027 | 1,337,232 |
Annual Shareholder ReportPrincipal
Amount | | | Value |
| $2,000,000 | | New Jersey EDA, Revenue Bonds, 6.25% (Continental Airlines, Inc.), 9/15/2019 | 1,941,060 |
| 3,000,000 | | New Jersey EDA, Revenue Bonds, Series 2004, 5.50% (NJ Dedicated Cigarette Excise Tax), 6/15/2016 | 3,228,000 |
| 1,000,000 | | New Jersey EDA, Special Facilities Revenue Bonds (Series 2000), 7.20% (Continental Airlines, Inc.)/(Original Issue Yield: 7.25%), 11/15/2030 | 1,000,150 |
| 141,937 | 7 | New Jersey Health Care Facilities Financing Authority, Revenue Bonds, 6.50% (Pascack Valley Hospital Association)/(Original Issue Yield: 6.72%), 7/1/2023 | 1 |
| 2,000,000 | | New Jersey Health Care Facilities Financing Authority, Revenue Bonds, 6.625% (Palisades Medical Center)/(Original Issue
Yield: 6.67%), 7/1/2031 | 1,882,900 |
| 1,200,000 | | New Jersey State Transportation Trust Fund Authority, Transportation System Bonds (Series 2011A), 6.00% (New Jersey State), 6/15/2035 | 1,361,508 |
| | TOTAL | 12,431,343 |
| | New Mexico – 1.1% | |
| 850,000 | | Bernalillo County, NM MFH, Refunding Housing Revenue Bonds (Series 2001C), 7.50% (Valencia Retirement)/(SunAmerica, Inc. GTD), 12/1/2021 | 826,838 |
| 2,290,000 | | Dona Ana County, NM, MFH Revenue Bonds (Series 2001A), 7.00% (Montana Meadows Apartments), 12/1/2030 | 2,219,193 |
| 2,000,000 | | Farmington, NM, PCR Refunding Bonds (Series 2010E), 5.90% (Public Service Co., NM), 6/1/2040 | 1,913,540 |
| | TOTAL | 4,959,571 |
| | New York – 4.9% | |
| 1,495,000 | | Brooklyn Arena Local Development Corporation, NY, Pilot Revenue Bonds (Series 2009), 6.375% (Original Issue Yield: 6.476%), 7/15/2043 | 1,525,932 |
| 2,000,000 | | Nassau County, NY IDA, Continuing Care Retirement Community Fixed Rate Revenue Bonds (Series 2007A), 6.70% (Amsterdam at Harborside), 1/1/2043 | 1,869,420 |
| 2,000,000 | 1,2 | New York City, NY IDA, Liberty Revenue Bonds (Series A), 6.50%
(7 World Trade Center LLC), 3/1/2035 | 2,011,400 |
| 2,000,000 | 1,2 | New York City, NY IDA, Liberty Revenue Bonds (Series B), 6.75%
(7 World Trade Center LLC), 3/1/2015 | 2,008,800 |
| 1,000,000 | | New York City, NY IDA, Special Facilities Revenue Bonds (Series 2006), 5.125% (Jet Blue Airways Corp.)/(Original Issue
Yield: 5.35%), 5/15/2030 | 806,440 |
| 1,500,000 | | New York City, NY IDA, Special Facility Revenue Bonds (Series 2002), 7.625% (British Airways)/(Original Issue Yield: 7.976%), 12/1/2032 | 1,518,030 |
| 5,500,000 | | New York City, NY IDA, Special Facility Revenue Bonds
(Series 2005), 8.00% (American Airlines, Inc.)/(Original Issue
Yield: 8.095%), 8/1/2028 | 5,616,105 |
Annual Shareholder ReportPrincipal
Amount | | | Value |
| $1,820,000 | | New York City, NY TFA, Future Tax Secured Subordinate Bonds (Series 2011C), 5.50%, 11/1/2035 | 2,027,680 |
| 300,000 | | New York State Dormitory Authority, Revenue Bonds (Series 2005), 5.00% (Rochester General Hospital)/(Radian Asset Assurance, Inc. INS), 12/1/2035 | 265,383 |
| 2,500,000 | | Port Authority of New York and New Jersey, Special Project Bonds (Series 8), 6.00% (JFK International Air Terminal LLC)/(Original Issue Yield: 6.15%), 12/1/2042 | 2,533,000 |
| | TOTAL | 20,182,190 |
| | North Carolina – 1.2% | |
| 2,335,000 | | North Carolina Eastern Municipal Power Agency, Power System Revenue Bonds (Series 2009C), 5.00%, 1/1/2026 | 2,498,870 |
| 500,000 | | North Carolina Medical Care Commission, Health Care Facilities Revenue Bonds (Series 2005A), 5.65% (Pennybyrn at Maryfield)/(Original Issue Yield: 5.85%), 10/1/2025 | 407,985 |
| 1,200,000 | | North Carolina Medical Care Commission, Health Care Housing Revenue Bonds (Series 2004A), 5.80% (Arc of North Carolina Projects), 10/1/2034 | 1,199,928 |
| 1,000,000 | | North Carolina Medical Care Commission, Retirement Facilities First Mortgage Revenue Bonds (Series 2011A), 7.75% (Whitestone Project)/(Original Issue Yield: 8.00%), 3/1/2041 | 1,011,700 |
| | TOTAL | 5,118,483 |
| | Ohio – 3.5% | |
| 2,000,000 | | Buckeye Tobacco Settlement Financing Authority, OH, Tobacco Settlement Asset-Backed Bonds (Series 2007A-2), 5.875% (Original Issue Yield: 5.95%), 6/1/2030 | 1,504,160 |
| 3,655,000 | | Buckeye Tobacco Settlement Financing Authority, OH, Tobacco Settlement Asset-Backed Bonds (Series A-2), 6.50%, 6/1/2047 | 2,815,520 |
| 1,500,000 | | Cleveland-Cuyahoga County, OH Port Authority, Special Assessment Tax-Increment Revenue Bonds, 7.35% (University Heights, OH Public Parking Garage), 12/1/2031 | 1,501,260 |
| 1,500,000 | | Hamilton County, OH, Healthcare Revenue Bonds (Series 2011A), 6.625% (Life Enriching Communities)/(Original Issue Yield: 6.75%), 1/1/2046 | 1,511,745 |
| 2,000,000 | | Lucas County, OH, Revenue Bonds (Series 2011A), 6.00% (ProMedica Healthcare Obligated Group)/(Original Issue Yield: 6.22%), 11/15/2041 | 2,153,200 |
| 2,910,000 | | Ohio State Air Quality Development Authority, Revenue Bonds (Series 2009A), 5.70% (FirstEnergy Solutions Corp.), 8/1/2020 | 3,139,657 |
| 2,355,000 | | Ohio State Higher Educational Facility Commission, Hospital Facilities Revenue Bonds (Series 2010), 5.75% (Summa Health System)/(Original Issue Yield: 5.92%), 11/15/2040 | 2,293,063 |
Annual Shareholder ReportPrincipal
Amount | | | Value |
| $1,500,000 | | Port Authority for Columbiana County, OH, Solid Waste Facility Revenue Bonds (Series 2004A), 7.25% (Apex Environmental LLC)/(Original Issue Yield: 7.30%), 8/1/2034 | 1,218,270 |
| | TOTAL | 16,136,875 |
| | Oklahoma – 0.9% | |
| 1,000,000 | | Oklahoma County, OK Finance Authority, Retirement Facility Revenue Bonds (Series 2005), 6.00% (Concordia Life Care Community)/(Original Issue Yield: 6.15%), 11/15/2038 | 876,810 |
| 1,000,000 | | Oklahoma County, OK Finance Authority, Retirement Facility Revenue Bonds (Series 2005), 6.125% (Concordia Life Care Community), 11/15/2025 | 954,930 |
| 2,000,000 | | Tulsa, OK Industrial Authority, Senior Living Community Revenue Bonds (Series 2010A), 7.25% (Montereau, Inc.)/(Original Issue
Yield: 7.50%), 11/1/2045 | 2,043,520 |
| | TOTAL | 3,875,260 |
| | Oregon – 0.7% | |
| 1,000,000 | | Clackamas County, OR Hospital Facilities Authority, Refunding Gross Revenue Bonds (Series 2005), 5.125% (Willamette Falls Hospital), 4/1/2026 | 929,470 |
| 1,000,000 | 1,2 | Cow Creek Band of Umpqua Tribe of Indians, Tax-Exempt Tax Revenue Bonds (Series 2006C), 5.625%, 10/1/2026 | 791,540 |
| 1,000,000 | | Yamhill County, OR Hospital Authority, Revenue Bonds, 7.00% (Friendsview Retirement Community)/(United States Treasury PRF 12/1/2013@101)/(Original Issue Yield: 7.125%), 12/1/2034 | 1,149,420 |
| | TOTAL | 2,870,430 |
| | Pennsylvania – 5.6% | |
| 1,700,000 | 1,2 | Allegheny County, PA IDA, Cargo Facilities Lease Revenue Bonds (Series 1999), 6.625% (AFCO Cargo PIT LLC Project)/(Original Issue Yield: 6.75%), 9/1/2024 | 1,460,436 |
| 1,120,000 | | Allegheny County, PA IDA, Charter School Revenue Bonds (Series 2004A), 7.50% (Propel Schools)/(Original Issue
Yield: 7.75%), 12/15/2029 | 1,107,747 |
| 865,000 | | Allegheny County, PA IDA, Environmental Improvement Refunding Revenue Bonds (Series 2005), 5.50% (United States Steel Corp.), 11/1/2016 | 886,988 |
| 2,000,000 | | Allegheny County, PA IDA, Environmental Improvement Revenue Refunding Bonds (Series 2009), 6.875% (United States Steel Corp.), 5/1/2030 | 2,082,660 |
| 1,715,000 | | Allegheny County, PA Port Authority, Special Revenue Transportation Refunding Bonds (Series 2011), 5.75%, 3/1/2029 | 1,894,595 |
| 200,000 | | Carbon County, PA IDA, Refunding Revenue Bonds, 6.70% (Panther Creek Partners Project), 5/1/2012 | 199,848 |
| 1,500,000 | | Centre County, PA Hospital Authority, Hospital Revenue Bonds, 6.25% (Mount Nittany Medical Center)/(Assured Guaranty Corp. INS)/(Original Issue Yield: 6.30%), 11/15/2044 | 1,551,630 |
Annual Shareholder ReportPrincipal
Amount | | | Value |
| $1,500,000 | | Chartiers Valley, PA Industrial & Commercial Development Authority, First Mortgage Revenue Refunding Bonds (Series 1999), 6.375% (Asbury Health Center)/(Original Issue Yield: 6.52%), 12/1/2024 | 1,479,135 |
| 1,500,000 | | Chester County, PA IDA, Revenue Bonds (Series 2007A), 6.375% (Avon Grove Charter School)/(Original Issue Yield: 6.45%), 12/15/2037 | 1,308,030 |
| 3,000,000 | | Harrisburg, PA Authority, Water Revenue Refunding Bonds (Series 2008), 5.25% (Original Issue Yield: 5.35%), 7/15/2031 | 2,575,710 |
| 1,500,000 | | Monroe County, PA Hospital Authority, Hospital Revenue Bonds (Series 2007), 5.125% (Pocono Medical Center)/(Original Issue
Yield: 5.20%), 1/1/2037 | 1,402,125 |
| 4,000,000 | | Pennsylvania EDFA, Exempt Facilities Revenue Bonds (Series 2009), 7.00% (Allegheny Energy Supply Company LLC), 7/15/2039 | 4,278,440 |
| 900,000 | | Philadelphia Authority for Industrial Development, Senior Living Revenue Bonds (Series 2005A), 5.625% (PresbyHomes Germantown/Morrisville), 7/1/2035 | 781,686 |
| 1,000,000 | | Philadelphia, PA Authority for Industrial Development, Revenue Bonds (Series 2010), 6.375% (Global Leadership Academy Charter School), 11/15/2040 | 937,240 |
| 2,000,000 | | Philadelphia, PA, GO Bonds (Series 2011), 6.50%, 8/1/2041 | 2,234,960 |
| 660,000 | | Washington County, PA Redevelopment Authority, Redevelopment Bonds (Series 2006A), 5.45% (Victory Centre Project-Tanger Outlet Development), 7/1/2035 | 575,098 |
| | TOTAL | 24,756,328 |
| | Rhode Island – 1.0% | |
| 4,000,000 | | Rhode Island State Health and Educational Building Corp., Hospital Financing Revenue Bonds (Series 2009A), 7.00% (Lifespan Obligated Group)/(Assured Guaranty Corp. INS), 5/15/2039 | 4,545,960 |
| | South Carolina – 1.6% | |
| 787,813 | 8 | Connector 2000 Association, Inc., SC, Capital Appreciation Senior Revenue Bonds (Series 2011A (Original Issue Yield: 6.50%), 1/1/2032 | 367,420 |
| 32,544 | | Connector 2000 Association, Inc., SC, Capital Appreciation Senior Revenue Bonds (Series 2011A) (Original Issue Yield: 3.25%), 1/1/2012 | 31,741 |
| 55,838 | | Connector 2000 Association, Inc., SC, Capital Appreciation Senior Revenue Bonds (Series 2011A) (Original Issue Yield: 3.75%), 1/1/2013 | 50,239 |
| 58,405 | | Connector 2000 Association, Inc., SC, Capital Appreciation Senior Revenue Bonds (Series 2011A) (Original Issue Yield: 4.00%), 1/1/2014 | 47,969 |
| 63,152 | | Connector 2000 Association, Inc., SC, Capital Appreciation Senior Revenue Bonds (Series 2011A) (Original Issue Yield: 4.25%), 1/1/2015 | 46,525 |
| 70,394 | | Connector 2000 Association, Inc., SC, Capital Appreciation Senior Revenue Bonds (Series 2011A) (Original Issue Yield: 4.75%), 1/1/2016 | 27,148 |
| 95,235 | | Connector 2000 Association, Inc., SC, Capital Appreciation Senior Revenue Bonds (Series 2011A) (Original Issue Yield: 5.00%), 1/1/2017 | 34,338 |
| 105,248 | | Connector 2000 Association, Inc., SC, Capital Appreciation Senior Revenue Bonds (Series 2011A) (Original Issue Yield: 5.50%), 1/1/2018 | 34,853 |
Annual Shareholder ReportPrincipal
Amount | | | Value |
| $114,579 | | Connector 2000 Association, Inc., SC, Capital Appreciation Senior Revenue Bonds (Series 2011A) (Original Issue Yield: 5.75%), 1/1/2019 | 35,184 |
| 124,628 | | Connector 2000 Association, Inc., SC, Capital Appreciation Senior Revenue Bonds (Series 2011A) (Original Issue Yield: 5.75%), 1/1/2020 | 36,072 |
| 147,824 | | Connector 2000 Association, Inc., SC, Capital Appreciation Senior Revenue Bonds (Series 2011A) (Original Issue Yield: 6.00%), 1/1/2021 | 39,453 |
| 156,322 | | Connector 2000 Association, Inc., SC, Capital Appreciation Senior Revenue Bonds (Series 2011A) (Original Issue Yield: 6.00%), 1/1/2022 | 39,277 |
| 610,233 | 8 | Connector 2000 Association, Inc., SC, Capital Appreciation Senior Revenue Bonds (Series 2011A) (Original Issue Yield: 7.00%), 1/1/2042 | 281,494 |
| 352,808 | 8 | Connector 2000 Association, Inc., SC, Capital Appreciation Senior Revenue Bonds (Series 2011A) (Original Issue Yield: 7.50%), 7/22/2051 | 160,919 |
| 272,065 | 8 | Connector 2000 Association, Inc., SC, Capital Appreciation Senior Subordinate Bonds (Series 2011B) (Original Issue Yield: 8.50%), 1/1/2032 | 71,948 |
| 136,889 | 8 | Connector 2000 Association, Inc., SC, Capital Appreciation Senior Subordinate Bonds (Series 2011B) (Original Issue Yield: 9.00%), 7/22/2051 | 34,352 |
| 720,000 | | Lancaster County, SC, Assessment Revenue Bonds (Series 2006), 5.45% (Sun City Carolina Lakes Improvement District), 12/1/2037 | 587,419 |
| 900,000 | | Myrtle Beach, SC, Tax Increment Bonds (Series 2006A), 5.25% (Myrtle Beach Air Force Base Redevelopment Project Area)/(Original Issue Yield: 5.27%), 10/1/2026 | 713,358 |
| 750,000 | | Myrtle Beach, SC, Tax Increment Bonds (Series 2006A), 5.30% (Myrtle Beach Air Force Base Redevelopment Project Area)/(Original Issue Yield: 5.325%), 10/1/2035 | 549,555 |
| 2,000,000 | | South Carolina Jobs-EDA, Refunding & Improvement Revenue Bonds (Series 2009), 5.75% (Palmetto Health Alliance)/(Original Issue
Yield: 5.90%), 8/1/2039 | 1,972,540 |
| 2,000,000 | | South Carolina Jobs-EDA, Refunding Revenue Bonds (Series 2003A), 6.25% (Palmetto Health Alliance)/(Original Issue Yield: 6.47%), 8/1/2031 | 2,029,000 |
| | TOTAL | 7,190,804 |
| | South Dakota – 0.6% | |
| 2,605,000 | | Educational Enhancement Funding Corp., SD, Tobacco Revenue Bonds (Series 2002B), 6.50%, 6/1/2032 | 2,628,185 |
| | Tennessee – 1.1% | |
| 3,000,000 | | Elizabethton, TN Health & Educational Facilities Board, First Mortgage Hospital Revenue Refunding & Improvement Bonds (Series 2000B), 8.00% (Mountain States Health Alliance)/(United States Treasury PRF 7/1/2012@103), 7/1/2033 | 3,241,710 |
| 1,000,000 | | Johnson City, TN Health & Education Facilities Board, Hospital First Mortgage Revenue Bonds (Series 2006A), 5.50% (Mountain States Health Alliance), 7/1/2036 | 954,370 |
Annual Shareholder ReportPrincipal
Amount | | | Value |
| $1,000,000 | | Johnson City, TN Health & Education Facilities Board, Hospital Refunding Bonds (Series 2010A), 5.625% (Mountain States Health Alliance)/(Original Issue Yield: 5.90%), 7/1/2030 | 1,005,790 |
| | TOTAL | 5,201,870 |
| | Texas – 7.5% | |
| 1,000,000 | | Austin, TX Convention Center Enterprises, Inc., Convention Center Hotel Second Tier Revenue Refunding Bonds (Series 2006B), 5.75%, 1/1/2024 | 975,190 |
| 1,000,000 | | Austin, TX Convention Center Enterprises, Inc., Convention Center Hotel Second Tier Revenue Refunding Bonds (Series 2006B), 5.75%, 1/1/2034 | 888,530 |
| 755,000 | | Bexar County, HFDC., Revenue Bonds (Series 2010), 6.20% (Army Retirement Residence Foundation), 7/1/2045 | 763,101 |
| 2,380,000 | | Brazos River Authority, TX, Refunding PCRBs (Series 2001C), 5.75% TOBs (Texas Competitive Electric Holdings Co. LLC), Mandatory Tender 5/1/2036 | 2,308,600 |
| 2,000,000 | | Cass County, TX IDC, Environmental Improvement Revenue Bonds (Series 2009A), 9.50% (International Paper Co.), 3/1/2033 | 2,452,420 |
| 1,000,000 | | Central Texas Regional Mobility Authority, Senior Lien Revenue Bonds (Series 2011), 6.00% (Original Issue Yield: 6.13%), 1/1/2041 | 954,740 |
| 1,000,000 | | Central Texas Regional Mobility Authority, Senior Lien Revenue Bonds (Series 2011), 6.25% (Original Issue Yield: 6.30%), 1/1/2046 | 956,210 |
| 2,000,000 | | Decatur, TX Hospital Authority, Hospital Revenue Bonds (Series 2004A), 7.125% (Wise Regional Health System), 9/1/2034 | 1,961,920 |
| 2,000,000 | | Harris County, TX HFDC, Hospital Revenue Refunding Bonds (Series 2008B), 7.25% (Memorial Hermann Healthcare System)/(Original Issue Yield: 7.30%), 12/1/2035 | 2,230,740 |
| 765,000 | | HFDC of Central Texas, Inc., Retirement Facility Revenue Bonds (Series 2006A), 5.50% (Village at Gleannloch Farms, Inc.), 2/15/2027 | 605,046 |
| 1,265,000 | | HFDC of Central Texas, Inc., Retirement Facility Revenue Bonds (Series 2006A), 5.50% (Village at Gleannloch Farms, Inc.), 2/15/2037 | 904,336 |
| 1,000,000 | | HFDC of Central Texas, Inc., Retirement Facility Revenue Bonds (Series 2006A), 5.75% (Legacy at Willow Bend), 11/1/2036 | 812,720 |
| 1,000,000 | | Houston, TX Airport System, Special Facilities Revenue Bonds (Series 2001), 7.00% (Continental Airlines, Inc.), 7/1/2029 | 997,850 |
| 535,000 | | Houston, TX Higher Education Finance Corp., Education Revenue Bonds (Series 2011A), 6.875% (Cosmos Foundation, Inc.), 5/15/2041 | 556,502 |
| 2,000,000 | | Kerrville, TX HFDC, Hospital Revenue Bonds, 5.375% (Sid Peterson Memorial Hospital), 8/15/2035 | 1,837,400 |
| 4,000,000 | | Lufkin, TX HFDC, Revenue Refunding and Improvement Bonds (Series 2009), 6.25% (Memorial Health System of East Texas)/(Original Issue Yield: 6.50%), 2/15/2037 | 3,726,160 |
| 1,000,000 | | Matagorda County, TX Navigation District No. 1, PCRBs (Series 2001A), 6.30% (AEP Texas Central Co.), 11/1/2029 | 1,072,610 |
Annual Shareholder ReportPrincipal
Amount | | | Value |
| $1,500,000 | | North Texas Tollway Authority, Special Projects System Revenue Bonds (Series 2011), 6.00% (North Texas Toll Authority Special Projects System), 9/1/2041 | 1,686,015 |
| 210,000 | | Port of Corpus Christi, TX IDC, Revenue Refunding Bonds (Series C), 5.40% (Valero Energy Corp.), 4/1/2018 | 210,023 |
| 1,000,000 | | San Juan Higher Education Finance Authority, TX , Education Revenue Bonds (Series 2010A), 6.70% (Idea Public Schools), 8/15/2040 | 1,023,860 |
| 2,000,000 | 9 | Tarrant County, TX Cultural Education Facilities Finance Corp., Hospital Revenue Bonds (Series 2006), 6.375% (Doctors Hospital)/(Original Issue Yield: 6.60%), 11/1/2036 | 732,300 |
| 200,000 | | Tarrant County, TX Cultural Education Facilities Finance Corp., Revenue Bonds, Series 2006A, 6.00% (Northwest Senior Housing Corp. Edgemere Project), 11/15/2026 | 196,654 |
| 1,150,000 | | Tarrant County, TX Cultural Education Facilities Finance Corp., Revenue Bonds, Series 2006A, 6.00% (Northwest Senior Housing Corp. Edgemere Project), 11/15/2036 | 1,081,748 |
| 810,000 | | Tarrant County, TX HFDC, Revenue Bonds (Series 1998C), 5.75% (Bethesda Living Center)/(Original Issue Yield: 5.89%), 8/15/2018 | 750,125 |
| 1,000,000 | | Tarrant County, TX HFDC, Revenue Bonds (Series 1998C), 5.75% (Bethesda Living Center)/(Original Issue Yield: 5.97%), 8/15/2028 | 823,610 |
| 2,000,000 | 3,10 | Texas State Affordable Housing Corp., MFH Revenue Bonds (Junior Series 2002B), 8.00% (American Housing Foundation)/(Original Issue Yield: 8.365%), 3/1/2032 | 96,640 |
| 2,000,000 | | Texas State Public Finance Authority Charter School Finance Corporation, Education Revenue Bonds (Series 2010A), 6.20% (Cosmos Foundation, Inc.), 2/15/2040 | 1,965,820 |
| | TOTAL | 32,570,870 |
| | Utah – 0.8% | |
| 800,000 | | Spanish Fork City, UT, Charter School Revenue Bonds (Series 2006), 5.55% (American Leadership Academy), 11/15/2026 | 687,712 |
| 1,750,000 | | Spanish Fork City, UT, Charter School Revenue Bonds (Series 2006), 5.70% (American Leadership Academy), 11/15/2036 | 1,412,145 |
| 1,315,000 | 1,2 | Utah State Charter School Finance Authority, Charter School Revenue Bonds (Series 2007A), 6.00% (Channing Hall), 7/15/2037 | 1,102,733 |
| | TOTAL | 3,202,590 |
| | Virginia – 2.5% | |
| 555,000 | | Broad Street CDA, VA, Revenue Bonds, 7.10% (United States Treasury PRF 6/1/2013@102)/(Original Issue Yield: 7.15%), 6/1/2016 | 625,307 |
| 800,000 | | Broad Street CDA, VA, Revenue Bonds, 7.50% (United States Treasury PRF 6/1/2013@102)/(Original Issue Yield: 7.625%), 6/1/2033 | 906,800 |
| 1,500,000 | | Chesterfield County, VA EDA, Refunding PCRBs (Series 2009A), 5.00% (Virginia Electric & Power Co.), 5/1/2023 | 1,650,075 |
| 1,380,000 | | Mosaic District CDA, VA, Revenue Bonds (Series 2011A), 6.875% (Original Issue Yield: 6.93%), 3/1/2036 | 1,425,140 |
Annual Shareholder ReportPrincipal
Amount | | | Value |
| $1,500,000 | | Peninsula Port Authority, VA, Residential Care Facility Revenue Bonds (Series 2003A), 7.375% (Virginia Baptist Homes Obligated Group)/(United States Treasury PRF 12/1/2013@100)/(Original Issue Yield: 7.625%), 12/1/2032 | 1,709,295 |
| 1,500,000 | | Peninsula Town Center CDA, VA, Special Obligation Bonds (Series 2007), 6.35%, 9/1/2028 | 1,490,760 |
| 1,000,000 | | Peninsula Town Center CDA, VA, Special Obligation Bonds (Series 2007), 6.45%, 9/1/2037 | 985,140 |
| 4,250,000 | | Tobacco Settlement Financing Corp., VA, Tobacco Settlement Asset-Backed Bonds (Series 2007B-1), 5.00% (Original Issue
Yield: 5.12%), 6/1/2047 | 2,548,980 |
| | TOTAL | 11,341,497 |
| | Washington – 1.5% | |
| 3,000,000 | | Tobacco Settlement Authority, WA, Tobacco Settlement Asset Backed Revenue Bonds, 6.625% (Original Issue Yield: 6.875%), 6/1/2032 | 3,018,000 |
| 1,500,000 | 1,2 | Washington State Health Care Facilities Authority, Revenue Bonds (Series 2007A), 6.25% (Virginia Mason Medical Center)/(Original Issue Yield: 6.375%), 8/15/2042 | 1,497,900 |
| 2,000,000 | | Washington State Health Care Facilities Authority, Revenue Bonds (Series 2011A), 6.75% (Swedish Health Services), 11/15/2041 | 2,157,760 |
| | TOTAL | 6,673,660 |
| | West Virginia – 0.6% | |
| 640,000 | | Ohio County, WV County Commission, Special District Excise Tax Revenue Refunding & Improvement Bonds (Series 2006A), 5.625% (Fort Henry Economic Opportunity Development District), 3/1/2036 | 645,434 |
| 1,000,000 | | Ohio County, WV County Commission, Tax Increment Revenue Bonds (Series 2005A), 5.625% (Fort Henry Centre Tax Increment Financing District No. 1), 6/1/2034 | 983,280 |
| 1,000,000 | | Ohio County, WV County Commission, Tax Increment Revenue Bonds (Series 2007A), 5.85% (Fort Henry Centre Tax Increment Financing District No. 1), 6/1/2034 | 1,004,250 |
| | TOTAL | 2,632,964 |
| | Wisconsin – 2.8% | |
| 490,000 | | Badger, WI Tobacco Asset Securitization Corp., Asset-Backed Revenue Bonds, 6.125% (United States Treasury PRF)/(Original Issue Yield: 6.35%), 6/1/2027 | 507,841 |
| 750,000 | | Milwaukee, WI Redevelopment Authority, Redevelopment Education Revenue Bonds (Series 2005A), 5.75% (Milwaukee Science Education Consortium, Inc.)/(Original Issue Yield: 5.93%), 8/1/2035 | 619,365 |
| 5,335,000 | | Wisconsin State General Fund Appropriation, Revenue Bonds (Series 2009A), 5.75% (Wisconsin State)/(Original Issue
Yield: 5.950%), 5/1/2033 | 5,920,996 |
| 1,400,000 | | Wisconsin State HEFA, Revenue Bonds (Series 2004), 6.125% (Eastcastle Place, Inc.)/(Original Issue Yield: 6.25%), 12/1/2034 | 919,646 |
Annual Shareholder ReportPrincipal
Amount | | | Value |
| $1,000,000 | | Wisconsin State HEFA, Revenue Bonds (Series 2004A), 6.75% (Beaver Dam Community Hospitals, Inc.)/(Original Issue Yield: 6.95%), 8/15/2034 | 984,490 |
| 2,000,000 | | Wisconsin State HEFA, Revenue Bonds (Series 2006A), 5.25% (Wheaton Franciscan HealthCare), 8/15/2031 | 1,757,100 |
| 1,250,000 | | Wisconsin State HEFA, Revenue Bonds, 5.80% (Beaver Dam Community Hospitals, Inc.), 8/15/2028 | 1,131,100 |
| 500,000 | | Wisconsin State HEFA, Revenue Bonds, 6.625% (Tomah Memorial Hospital, Inc.)/(Original Issue Yield: 6.875%), 7/1/2028 | 495,440 |
| | TOTAL | 12,335,978 |
| | TOTAL MUNICIPAL BONDS
(IDENTIFIED COST $443,704,155) | 419,895,119 |
| | Corporate Bonds – 1.0% | |
| | Multi State – 1.0% | |
| 2,000,000 | 1 | Muni Mae TE Bond Subsidiary LLC, Pfd., 9.56%, 6/30/2050 | 1,680,040 |
| 4,000,000 | 1 | Non-Profit Preferred Funding Trust I, Partnership, 9/15/2037 | 2,529,840 |
| | TOTAL CORPORATE BONDS
(IDENTIFIED COST $5,989,955) | 4,209,880 |
| | Short-Term Municipals – 1.0%11 | |
| | New York – 0.8% | |
| 1,950,000 | | New York City, NY, (Fiscal 2006 Series H-1) Daily VRDNs (Dexia Credit Local LOC), 2.000%, 9/1/2011 | 1,950,000 |
| 1,650,000 | | New York City, NY, (Fiscal 2008 Subseries L-5) Daily VRDNs (Dexia Credit Local LIQ), 1.700%, 9/1/2011 | 1,650,000 |
| | TOTAL | 3,600,000 |
| | Virginia – 0.2% | |
| 800,000 | | Madison County, VA IDA, (Series 2007) Daily VRDNs (Woodberry Forest School)/(SunTrust Bank LOC), 0.290%, 9/1/2011 | 800,000 |
| | TOTAL SHORT-TERM MUNICIPALS
(AT AMORTIZED COST) | 4,400,000 |
| | TOTAL MUNICIPAL INVESTMENTS — 97.8%
(IDENTIFIED COST $454,094,110)12 | 428,504,999 |
| | OTHER ASSETS AND LIABILITIES - NET — 2.2%13 | 9,834,517 |
| | TOTAL NET ASSETS — 100% | $438,339,516 |
Securities that are subject to the federal alternative minimum tax (AMT) represent 12.0% of the Fund's portfolio as calculated based upon total market value (percentage is unaudited).
Annual Shareholder Report
| 1 | Denotes a restricted security that either: (a) cannot be offered for public sale without first being registered, or being able to take advantage of an exemption from registration, under the Securities Act of 1933; or (b) is subject to a contractual restriction on public sales. At August 31, 2011, these restricted securities amounted to $25,027,526, which represented 5.7% of total net assets. |
| 2 | Denotes a restricted security that may be resold without restriction to “qualified institutional buyers” as defined in Rule 144A under the Securities Act of 1933 and that the Fund has determined to be liquid under criteria established by the Fund's Board of Trustees (the “Trustees”). At August 31, 2011, these liquid restricted securities amounted to $20,817,646, which represented 4.7% of total net assets. |
| 3 | Non-income producing security. |
| 4 | Non-income producing security. Subsequent to August 31, 2011, issuer was declared to be in default. |
| 5 | Issuer in default. |
| 6 | Obligor had filed for bankruptcy protection. Subsequent to August 31, 2011, the bond was restructured and new securities were received by the Fund. |
| 7 | Obligor had filed for bankruptcy. On September 30, 2008, a Notice of Initial Distribution was received and a portion of the bond was redeemed at par. Subsequent distributions have occurred on various dates to redeem portions of the remaining bonds at discounts to par. The market value of the holding is adjusted to reflect the expected value of future distributions. |
| 8 | Market quotations and price evaluations are not available. Fair value determined in accordance with procedures established by and under the general supervision of the Trustees. |
| 9 | A partial payment was received on the scheduled semi-annual interest payment date of May 1, 2011. On November 1, 2010, the scheduled semi-annual interest payment was not received. |
| 10 | Subsequent to August 31, 2011, a notice of Final Distribution was received with proceeds from the sale insufficient to make any payment to subordinated bondholders. As a result, future principal and interest payments will not be fulfilled and the market value of the security was adjusted to zero on September 20, 2011. |
| 11 | Current rate and next reset date shown for Variable Rate Demand Notes. |
| 12 | The cost of investments for federal tax purposes amounts to $455,456,518. |
| 13 | Assets, other than investments in securities, less liabilities. See Statement of Assets and Liabilities. |
Note: The categories of investments are shown as a percentage of total net assets at August 31, 2011.
Various inputs are used in determining the value of the Fund's investments. These inputs are summarized in the three broad levels listed below:
Level 1 — quoted prices in active markets for identical securities, including investment companies with daily net asset values if applicable.
Level 2 — other significant observable inputs (including quoted prices for similar securities, interest rates, prepayment speeds, credit risk, etc.). Also includes securities valued at amortized cost.
Level 3 — significant unobservable inputs (including the Fund's own assumptions in determining the fair value of investments).
Annual Shareholder Report
The inputs or methodology used for valuing securities are not an indication of the risk associated with investing in those securities.The following is a summary of the inputs used, as of August 31, 2011, in valuing the Fund's assets carried at fair value:
| Valuation Inputs | | | | |
| Level 1 —
Quoted
Prices and
Investments in
Mutual Funds | Level 2 —
Other
Significant
Observable
Inputs | Level 3 —
Significant
Unobservable
Inputs | Total |
| Debt Securities: | | | | |
| Municipal Bonds | $ — | $418,978,986 | $916,133 | $419,895,119 |
| Corporate Bonds | — | 4,209,880 | — | 4,209,880 |
| Short-Term Municipals | — | 4,400,000 | — | 4,400,000 |
| TOTAL SECURITIES | $ — | $427,588,866 | $916,133 | $428,504,999 |
Following is a reconciliation of assets in which significant unobservable inputs (Level 3) were used In determining fair value:
| Investments in
Debt Securities |
| Balance as of September 1, 2010 | $ — |
| Realized gain (loss) | — |
| Change in unrealized appreciation/depreciation | 342,465 |
| Purchases | 573,668 |
| Sales | — |
| Transfers into Level 3 | — |
| (Transfers out of Level 3) | — |
| Balance as of August 31, 2011 | $916,133 |
| The total change in unrealized appreciation (depreciation) included in the Statement of Operations attributable to investments still held at August 31, 2011 | $342,465 |
Annual Shareholder Report
The following acronyms are used throughout this portfolio:| AMBAC | — American Municipal Bond Assurance Corporation |
| CDA | — Community Development Authority |
| COL | — Collateralized |
| COPs | — Certificates of Participation |
| EDA | — Economic Development Authority |
| EDFA | — Economic Development Finance Authority |
| EDRBs | — Economic Development Revenue Bonds |
| GNMA | — Government National Mortgage Association |
| GO | — General Obligation |
| GTD | — Guaranteed |
| HEFA | — Health and Education Facilities Authority |
| HFA | — Housing Finance Authority |
| HFDC | — Health Facility Development Corporation |
| IDA | — Industrial Development Authority |
| IDB | — Industrial Development Bond |
| IDC | — Industrial Development Corporation |
| IDFA | — Industrial Development Finance Authority |
| IDRB | — Industrial Development Revenue Bond |
| INS | — Insured |
| LIQ | — Liquidity Agreement |
| LO | — Limited Obligation |
| LOC | — Letter of Credit |
| LT | — Limited Tax |
| MFH | — Multi-Family Housing |
| PCFA | — Pollution Control Finance Authority |
| PCR | — Pollution Control Revenue |
| PCRBs | — Pollution Control Revenue Bonds |
| PRF | — Pre-refunded |
| SFM | — Single Family Mortgage |
| SID | — Special Improvement District |
| TFA | — Transitional Finance Authority |
| TOBs | — Tender Option Bonds |
| UT | — Unlimited Tax |
| VRDNs | — Variable Rate Demand Notes |
See Notes which are an integral part of the Financial Statements
Annual Shareholder Report Financial Highlights – Class A Shares1
(For a Share Outstanding Throughout Each Period)
| Year Ended August 31 | 2011 | 20102 | 2009 | 2008 | 2007 |
| Net Asset Value, Beginning of Period | $8.59 | $7.76 | $8.72 | $9.58 | $10.02 |
| Income From Investment Operations: | | | | | |
| Net investment income | 0.45 | 0.49 | 0.49 | 0.50 | 0.51 |
| Net realized and unrealized gain (loss) on investments, futures contracts and swap contracts | (0.36) | 0.83 | (0.96) | (0.86) | (0.45) |
| TOTAL FROM INVESTMENT OPERATIONS | 0.09 | 1.32 | (0.47) | (0.36) | 0.06 |
| Less Distributions: | | | | | |
| Distributions from net investment income | (0.47) | (0.49) | (0.49) | (0.50) | (0.50) |
| Net Asset Value, End of Period | $8.21 | $8.59 | $7.76 | $8.72 | $9.58 |
| Total Return3 | 1.29% | 17.42% | (4.87)% | (3.86)% | 0.48% |
| Ratios to Average Net Assets: | | | | | |
| Net expenses | 0.85% | 0.77% | 0.79%4 | 0.81%4,5 | 1.15%5 |
| Net investment income | 5.57% | 5.93% | 6.65% | 5.50% | 5.05% |
| Expense waiver/reimbursement6 | 0.22% | 0.28% | 0.29% | 0.28% | 0.29% |
| Supplemental Data: | | | | | |
| Net assets, end of period (000 omitted) | $190,003 | $229,217 | $180,422 | $208,302 | $231,817 |
| Portfolio turnover | 28% | 18% | 24% | 34% | 47% |
| 1 | The Fund is the successor to the Federated Municipal High Yield Advantage Fund, Inc. (“Predecessor Fund”). The Predecessor Fund was reorganized into the Fund, a series of Federated Municipal Securities Income Trust, as of the close of business on November 10, 2006. Please see the Fund's Prospectus and Statement of Additional Information for further information regarding the reorganization. |
| 2 | Beginning with the year ended August 31, 2010, the Fund was audited by KPMG LLP. The previous years were audited by another independent registered public accounting firm. |
| 3 | Based on net asset value, which does not reflect the sales charge, redemption fee or contingent deferred sales charge, if applicable. |
| 4 | The net expense ratio is calculated without reduction for expense offset arrangements. The net expense ratios are 0.79% and 0.81% for the years ended August 31, 2009 and 2008, respectively, after taking into account these expense reductions. |
| 5 | Includes interest and trust expenses related to the Fund's participation in certain inverse floater structures of 0.03% and 0.37% for the years ended August 31, 2008 and 2007, respectively. |
| 6 | This expense decrease is reflected in both the net expense and net investment income ratios shown above. |
See Notes which are an integral part of the Financial Statements
Annual Shareholder Report Financial Highlights – Class B Shares1
(For a Share Outstanding Throughout Each Period)
| Year Ended August 31 | 2011 | 20102 | 2009 | 2008 | 2007 |
| Net Asset Value, Beginning of Period | $8.59 | $7.75 | $8.71 | $9.57 | $10.01 |
| Income From Investment Operations: | | | | | |
| Net investment income | 0.41 | 0.44 | 0.45 | 0.44 | 0.43 |
| Net realized and unrealized gain (loss) on investments, futures contracts and swap contracts | (0.38) | 0.82 | (0.97) | (0.87) | (0.45) |
| TOTAL FROM INVESTMENT OPERATIONS | 0.03 | 1.26 | (0.52) | (0.43) | (0.02) |
| Less Distributions: | | | | | |
| Distributions from net investment income | (0.41) | (0.42) | (0.44) | (0.43) | (0.42) |
| Net Asset Value, End of Period | $8.21 | $8.59 | $7.75 | $8.71 | $9.57 |
| Total Return3 | 0.55% | 16.69% | (5.59)% | (4.59)% | (0.27)% |
| Ratios to Average Net Assets: | | | | | |
| Net expenses | 1.60% | 1.53% | 1.54%4 | 1.56%4,5 | 1.91%5 |
| Net investment income | 4.82% | 5.19% | 5.90% | 4.74% | 4.28% |
| Expense waiver/reimbursement6 | 0.22% | 0.28% | 0.29% | 0.28% | 0.29% |
| Supplemental Data: | | | | | |
| Net assets, end of period (000 omitted) | $24,122 | $36,952 | $41,094 | $58,798 | $80,957 |
| Portfolio turnover | 28% | 18% | 24% | 34% | 47% |
| 1 | The Fund is the successor to the Predecessor Fund. The Predecessor Fund was reorganized into the Fund, a series of Federated Municipal Securities Income Trust, as of the close of business on November 10, 2006. Please see the Fund's Prospectus and Statement of Additional Information for further information regarding the reorganization. |
| 2 | Beginning with the year ended August 31, 2010, the Fund was audited by KPMG LLP. The previous years were audited by another independent registered public accounting firm. |
| 3 | Based on net asset value, which does not reflect the sales charge, redemption fee or contingent deferred sales charge, if applicable. |
| 4 | The net expense ratio is calculated without reduction for expense offset arrangements. The net expense ratios are 1.54% and 1.56% for the years ended August 31, 2009 and 2008, respectively, after taking into account these expense reductions. |
| 5 | Includes interest and trust expenses related to the Fund's participation in certain inverse floater structures of 0.03% and 0.37% for the years ended August 31, 2008 and 2007, respectively. |
| 6 | This expense decrease is reflected in both the net expense and net investment income ratios shown above. |
See Notes which are an integral part of the Financial Statements
Annual Shareholder Report Financial Highlights – Class C Shares1
(For a Share Outstanding Throughout Each Period)
| Year Ended August 31 | 2011 | 20102 | 2009 | 2008 | 2007 |
| Net Asset Value, Beginning of Period | $8.59 | $7.75 | $8.72 | $9.57 | $10.01 |
| Income From Investment Operations: | | | | | |
| Net investment income | 0.39 | 0.43 | 0.44 | 0.43 | 0.43 |
| Net realized and unrealized gain (loss) on investments, futures contracts and swap contracts | (0.36) | 0.83 | (0.97) | (0.85) | (0.45) |
| TOTAL FROM INVESTMENT OPERATIONS | 0.03 | 1.26 | (0.53) | (0.42) | (0.02) |
| Less Distributions: | | | | | |
| Distributions from net investment income | (0.41) | (0.42) | (0.44) | (0.43) | (0.42) |
| Net Asset Value, End of Period | $8.21 | $8.59 | $7.75 | $8.72 | $9.57 |
| Total Return3 | 0.54% | 16.69% | (5.69)% | (4.48)% | (0.27)% |
| Ratios to Average Net Assets: | | | | | |
| Net expenses | 1.60% | 1.53% | 1.54%4 | 1.56%4,5 | 1.90%5 |
| Net investment income | 4.82% | 5.18% | 5.91% | 4.75% | 4.30% |
| Expense waiver/reimbursement6 | 0.22% | 0.28% | 0.29% | 0.28% | 0.29% |
| Supplemental Data: | | | | | |
| Net assets, end of period (000 omitted) | $46,925 | $52,785 | $40,630 | $48,495 | $56,448 |
| Portfolio turnover | 28% | 18% | 24% | 34% | 47% |
| 1 | The Fund is the successor to the Predecessor Fund. The Predecessor Fund was reorganized into the Fund, a series of Federated Municipal Securities Income Trust, as of the close of business on November 10, 2006. Please see the Fund's Prospectus and Statement of Additional Information for further information regarding the reorganization. |
| 2 | Beginning with the year ended August 31, 2010, the Fund was audited by KPMG LLP. The previous years were audited by another independent registered public accounting firm. |
| 3 | Based on net asset value, which does not reflect the sales charge, redemption fee or contingent deferred sales charge, if applicable. |
| 4 | The net expense ratio is calculated without reduction for expense offset arrangements. The net expense ratios are 1.54% and 1.56% for the years ended August 31, 2009 and 2008, respectively, after taking into account these expense reductions. |
| 5 | Includes interest and trust expenses related to the Fund's participation in certain inverse floater structures of 0.03% and 0.37% for the years ended August 31, 2008 and 2007, respectively. |
| 6 | This expense decrease is reflected in both the net expense and net investment income ratios shown above. |
See Notes which are an integral part of the Financial Statements
Annual Shareholder Report Financial Highlights – Class F Shares1
(For a Share Outstanding Throughout Each Period)
| Year Ended August 31 | 2011 | 20102 | 2009 | 2008 | 2007 |
| Net Asset Value, Beginning of Period | $8.59 | $7.76 | $8.72 | $9.58 | $10.02 |
| Income From Investment Operations: | | | | | |
| Net investment income | 0.45 | 0.49 | 0.49 | 0.50 | 0.51 |
| Net realized and unrealized gain (loss) on investments, futures contracts and swap contracts | (0.36) | 0.83 | (0.96) | (0.86) | (0.45) |
| TOTAL FROM INVESTMENT OPERATIONS | 0.09 | 1.32 | (0.47) | (0.36) | 0.06 |
| Less Distributions: | | | | | |
| Distributions from net investment income | (0.47) | (0.49) | (0.49) | (0.50) | (0.50) |
| Net Asset Value, End of Period | $8.21 | $8.59 | $7.76 | $8.72 | $9.58 |
| Total Return3 | 1.29% | 17.42% | (4.87)% | (3.86)% | 0.48% |
| Ratios to Average Net Assets: | | | | | |
| Net expenses | 0.85% | 0.77% | 0.79%4 | 0.81%4,5 | 1.15%5 |
| Net investment income | 5.57% | 5.93% | 6.66% | 5.50% | 5.05% |
| Expense waiver/reimbursement6 | 0.22% | 0.28% | 0.29% | 0.28% | 0.29% |
| Supplemental Data: | | | | | |
| Net assets, end of period (000 omitted) | $177,290 | $200,948 | $162,315 | $190,686 | $208,724 |
| Portfolio turnover | 28% | 18% | 24% | 34% | 47% |
| 1 | The Fund is the successor to the Predecessor Fund. The Predecessor Fund was reorganized into the Fund, a series of Federated Municipal Securities Income Trust, as of the close of business on November 10, 2006. Please see the Fund's Prospectus and Statement of Additional Information for further information regarding the reorganization. |
| 2 | Beginning with the year ended August 31, 2010, the Fund was audited by KPMG LLP. The previous years were audited by another independent registered public accounting firm. |
| 3 | Based on net asset value, which does not reflect the sales charge, redemption fee or contingent deferred sales charge, if applicable. |
| 4 | The net expense ratio is calculated without reduction for expense offset arrangements. The net expense ratios are 0.79% and 0.81% for the years ended August 31, 2009 and 2008, respectively, after taking into account these expense reductions. |
| 5 | Includes interest and trust expenses related to the Fund's participation in certain inverse floater structures of 0.03% and 0.37% for the years ended August 31, 2008 and 2007, respectively. |
| 6 | This expense decrease is reflected in both the net expense and net investment income ratios shown above. |
See Notes which are an integral part of the Financial Statements
Annual Shareholder Report Statement of Assets and Liabilities
August 31, 2011
| Assets: | | |
| Total investments in securities, at value (identified cost $454,094,110) | | $428,504,999 |
| Cash | | 91,235 |
| Income receivable | | 7,448,624 |
| Receivable for investments sold | | 3,745,421 |
| Receivable for shares sold | | 476,973 |
| TOTAL ASSETS | | 440,267,252 |
| Liabilities: | | |
| Payable for shares redeemed | $838,094 | |
| Payable for investments purchased | 808,250 | |
| Payable for shareholder services fee (Note 5) | 98,123 | |
| Payable for transfer and dividend disbursing agent fees and expenses | 53,194 | |
| Payable for distribution services fee (Note 5) | 45,609 | |
| Payable for portfolio accounting fees | 42,310 | |
| Payable for Directors'/Trustees' fees | 305 | |
| Accrued expenses | 41,851 | |
| TOTAL LIABILITIES | | 1,927,736 |
| Net assets for 53,375,046 shares outstanding | | $438,339,516 |
| Net Assets Consist of: | | |
| Paid-in capital | | $539,437,454 |
| Net unrealized depreciation of investments | | (25,589,111) |
| Accumulated net realized loss on investments | | (75,895,468) |
| Undistributed net investment income | | 386,641 |
| TOTAL NET ASSETS | | $438,339,516 |
Annual Shareholder ReportStatement of Assets and Liabilities — continued| Net Asset Value, Offering Price and Redemption Proceeds Per Share | | |
| Class A Shares: | | |
| Net asset value per share ($190,002,588 ÷ 23,132,710 shares outstanding), no par value, unlimited shares authorized | | $8.21 |
| Offering price per share (100/95.50 of $8.21) | | $8.60 |
| Redemption proceeds per share | | $8.21 |
| Class B Shares: | | |
| Net asset value per share ($24,121,660 ÷ 2,938,871 shares outstanding), no par value, unlimited shares authorized | | $8.21 |
| Offering price per share | | $8.21 |
| Redemption proceeds per share (94.50/100 of $8.21) | | $7.76 |
| Class C Shares: | | |
| Net asset value per share ($46,924,761 ÷ 5,716,710 shares outstanding), no par value, unlimited shares authorized | | $8.21 |
| Offering price per share | | $8.21 |
| Redemption proceeds per share (99.00/100 of $8.21) | | $8.13 |
| Class F Shares: | | |
| Net asset value per share ($177,290,507 ÷ 21,586,755 shares outstanding), no par value, unlimited shares authorized | | $8.21 |
| Offering price per share (100/99.00 of $8.21) | | $8.29 |
| Redemption proceeds per share (99.00/100 of $8.21) | | $8.13 |
See Notes which are an integral part of the Financial Statements
Annual Shareholder Report Statement of Operations
Year Ended August 31, 2011
| Investment Income: | | | |
| Interest | | | $29,628,073 |
| Expenses: | | | |
| Investment adviser fee (Note 5) | | $2,768,963 | |
| Administrative fee (Note 5) | | 360,596 | |
| Custodian fees | | 30,504 | |
| Transfer and dividend disbursing agent fees and expenses | | 315,826 | |
| Directors'/Trustees' fees | | 7,285 | |
| Auditing fees | | 25,500 | |
| Legal fees | | 9,277 | |
| Portfolio accounting fees | | 114,143 | |
| Distribution services fee (Note 5) | | 581,275 | |
| Shareholder services fee (Note 5) | | 1,148,183 | |
| Account administration fee (Note 2) | | 3,599 | |
| Share registration costs | | 72,031 | |
| Printing and postage | | 55,628 | |
| Insurance premiums | | 5,245 | |
| Taxes | | 3,227 | |
| Miscellaneous | | 5,624 | |
| TOTAL EXPENSES | | 5,506,906 | |
| Waivers and Reimbursement (Note 5): | | | |
| Waiver of investment adviser fee | $(986,039) | | |
| Waiver of administrative fee | (9,399) | | |
| Reimbursement of other operating expenses | (3,227) | | |
| TOTAL WAIVERS AND REIMBURSEMENT | | (998,665) | |
| Net expenses | | | 4,508,241 |
| Net investment income | | | 25,119,832 |
| Realized and Unrealized Loss on Investments: | | | |
| Net realized loss on investments | | | (21,677,564) |
| Net change in unrealized depreciation of investments | | | (2,061,000) |
| Net realized and unrealized loss on investments | | | (23,738,564) |
| Change in net assets resulting from operations | | | $1,381,268 |
See Notes which are an integral part of the Financial Statements
Annual Shareholder Report Statement of Changes in Net Assets
| Year Ended August 31 | 2011 | 2010 |
| Increase (Decrease) in Net Assets | | |
| Operations: | | |
| Net investment income | $25,119,832 | $27,256,213 |
| Net realized loss on investments | (21,677,564) | (4,647,021) |
| Net change in unrealized appreciation/depreciation of investments | (2,061,000) | 51,699,531 |
| CHANGE IN NET ASSETS RESULTING FROM OPERATIONS | 1,381,268 | 74,308,723 |
| Distributions to Shareholders: | | |
| Distributions from net investment income | | |
| Class A Shares | (11,698,595) | (11,920,940) |
| Class B Shares | (1,498,494) | (2,011,270) |
| Class C Shares | (2,449,536) | (2,393,810) |
| Class F Shares | (10,715,888) | (10,593,663) |
| CHANGE IN NET ASSETS RESULTING FROM DISTRIBUTIONS TO SHAREHOLDERS | (26,362,513) | (26,919,683) |
| Share Transactions: | | |
| Proceeds from sale of shares | 65,671,044 | 120,222,929 |
| Net asset value of shares issued to shareholders in payment of distributions declared | 20,780,268 | 20,737,218 |
| Cost of shares redeemed | (143,032,996) | (92,907,304) |
| CHANGE IN NET ASSETS RESULTING FROM SHARE TRANSACTIONS | (56,581,684) | 48,052,843 |
| Change in net assets | (81,562,929) | 95,441,883 |
| Net Assets: | | |
| Beginning of period | 519,902,445 | 424,460,562 |
| End of period (including undistributed net investment income of $386,641 and $1,269,386, respectively) | $438,339,516 | $519,902,445 |
See Notes which are an integral part of the Financial Statements
Annual Shareholder Report Notes to Financial Statements
August 31, 2011
1. Organization
Federated Municipal Securities Income Trust (the “Trust”) is registered under the Investment Company Act of 1940, as amended (the “Act”), as an open-end management investment company. The Trust consists of five portfolios. The financial statements included herein are only those of Federated Municipal High Yield Advantage Fund (the “Fund”), a non-diversified portfolio. The financial statements of the other portfolios are presented separately. The assets of each portfolio are segregated and a shareholder's interest is limited to the portfolio in which shares are held. Each portfolio pays its own expenses. The Fund offers four classes of shares: Class A Shares, Class B Shares, Class C Shares and Class F Shares. All shares of the Fund have equal rights with respect to voting, except on class-specific matters. The investment objective of the Fund is to provide a high level of current income which is generally exempt from federal regular income tax. Interest income from the Fund's investments may be subject to the federal AMT for individuals and corporations and state and local taxes.
2. Significant Accounting Policies
The following is a summary of significant accounting policies consistently followed by the Fund in the preparation of its financial statements. These policies are in conformity with U.S. generally accepted accounting principles (GAAP).
Investment Valuation
In calculating its net asset value (NAV), the Fund generally values investments as follows:
- Fixed-income securities acquired with remaining maturities greater than 60 days are fair valued using price evaluations provided by a pricing service approved by the Board of Trustees (the “Trustees”).
- Fixed-income securities acquired with remaining maturities of 60 days or less are valued at their cost (adjusted for the accretion of any discount or amortization of any premium), which approximates market value.
- Shares of other mutual funds are valued based upon their reported NAVs.
- Derivative contracts listed on exchanges are valued at their reported settlement or closing price.
- Over-the-counter (OTC) derivative contracts are fair valued using price evaluations provided by a pricing service approved by the Trustees.
- For securities that are fair valued in accordance with procedures established by and under the general supervision of the Trustees, certain factors may be considered such as: the purchase price of the security, information obtained by contacting the issuer, analysis of the issuer's financial statements or other available documents, fundamental analytical data, the nature and duration of restrictions on disposition, the movement of the market in which the security is normally traded and public trading in similar securities of the issuer or comparable issuers.
If the Fund cannot obtain a price or price evaluation from a pricing service for an investment, the Fund may attempt to value the investment based upon the mean of bid and asked quotations or fair value the investment based on price evaluations, from one or more dealers. If any price, quotation, price evaluation or other pricing source is not readily available when the NAV is calculated, the Fund uses the fair value of the investment determined in accordance with the procedures described below. There can be no assurance that the Fund could purchase or sell an investment at the price used to calculate the Fund's NAV.
Annual Shareholder Report
Fair Valuation and Significant Events ProceduresThe Trustees have authorized the use of pricing services to provide evaluations of the current fair value of certain investments for purposes of calculating the NAV. Factors considered by pricing services in evaluating an investment include the yields or prices of investments of comparable quality, coupon, maturity, call rights and other potential prepayments, terms and type, reported transactions, indications as to values from dealers and general market conditions. Some pricing services provide a single price evaluation reflecting the bid-side of the market for an investment (a “bid” evaluation). Other pricing services offer both bid evaluations and price evaluations indicative of a price between the prices bid and asked for the investment (a “mid” evaluation). The Fund normally uses bid evaluations for U.S. Treasury and Agency securities, mortgage-backed securities and municipal securities. The Fund normally uses mid evaluations for other types of fixed-income securities and OTC derivative contracts. In the event that market quotations and price evaluations are not available for an investment, the fair value of the investment is determined in accordance with procedures adopted by the Trustees.
The Trustees also have adopted procedures requiring an investment to be priced at its fair value whenever the Adviser determines that a significant event affecting the value of the investment has occurred between the time as of which the price of the investment would otherwise be determined and the time as of which the NAV is computed. An event is considered significant if there is both an affirmative expectation that the investment's value will change in response to the event and a reasonable basis for quantifying the resulting change in value. Examples of significant events that may occur after the close of the principal market on which a security is traded, or after the time of a price evaluation provided by a pricing service or a dealer, include:
- With respect to price evaluations of fixed-income securities determined before the close of regular trading on the NYSE, actions by the Federal Reserve Open Market Committee and other significant trends in U.S. fixed-income markets;
- Political or other developments affecting the economy or markets in which an issuer conducts its operations or its securities are traded; and
- Announcements concerning matters such as acquisitions, recapitalizations, litigation developments, a natural disaster affecting the issuer's operations or regulatory changes or market developments affecting the issuer's industry.
The Fund may seek to obtain more current quotations or price evaluations from alternative pricing sources. If a reliable alternative pricing source is not available, the Fund will determine the fair value of the investment using another method approved by the Trustees.
Annual Shareholder Report
Investment Income, Gains and Losses, Expenses and DistributionsInvestment transactions are accounted for on a trade date basis. Realized gains and losses from investment transactions are recorded on an identified cost basis. Interest income and expenses are accrued daily. Distributions to shareholders are recorded on the ex-dividend date. Distributions of net investment income are declared and paid monthly. Non-cash dividends included in dividend income, if any, are recorded at fair value. Investment income, realized and unrealized gains and losses and certain fund-level expenses are allocated to each class based on relative average daily net assets, except that Class A Shares, Class B Shares, Class C Shares and Class F Shares may bear account administration fees, distribution services fees and shareholder services fees unique to those classes. For the year ended August 31, 2011, account administration fees for the Fund were as follows:
| Account
Administration
Fees Incurred |
| Class A Shares | $2,385 |
| Class F Shares | 1,214 |
| TOTAL | $3,599 |
Dividends are declared separately for each class. No class has preferential dividend rights; differences in per share dividend rates are generally due to differences in separate class expenses.
Premium and Discount Amortization
All premiums and discounts on fixed-income securities are amortized/accreted using the effective interest rate method.
Federal Taxes
It is the Fund's policy to comply with the Subchapter M provision of the Internal Revenue Code and to distribute to shareholders each year substantially all of its income. Accordingly, no provision for federal income tax is necessary. As of and during the year ended August 31, 2011, the Fund did not have a liability for any uncertain tax positions. The Fund recognizes interest and penalties, if any, related to tax liabilities as income tax expense in the Statement of Operations. As of August 31, 2011, tax years 2008 through 2011 remain subject to examination by the Fund's major tax jurisdictions, which include the United States of America and the Commonwealth of Massachusetts.
When-Issued and Delayed Delivery Transactions
The Fund may engage in when-issued or delayed delivery transactions. The Fund records when-issued securities on the trade date and maintains security positions such that sufficient liquid assets will be available to make payment for the securities purchased. Securities purchased on a when-issued or delayed delivery basis are marked to market daily and begin earning interest on the settlement date. Losses may occur on these transactions due to changes in market conditions or the failure of counterparties to perform under the contract.
Restricted Securities
The Fund may purchase securities which are considered restricted. Restricted securities are securities that either: (a) cannot be offered for public sale without first being registered, or being able to take advantage of an exemption from registration, under the Securities Act of 1933; or (b) are subject to contractual restrictions on public sales. In some cases, when a Annual Shareholder Report
security cannot be offered for public sale without first being registered, the issuer of the restricted security has agreed to register such securities for resale, at the issuer's expense, either upon demand by the Fund or in connection with another registered offering of the securities. Many such restricted securities may be resold in the secondary market in transactions exempt from registration. Restricted securities may be determined to be liquid under criteria established by the Trustees. The Fund will not incur any registration costs upon such resales. The Fund's restricted securities are valued at the price provided by dealers in the secondary market or, if no market prices are available, at the fair value as determined in accordance with procedures established by and under the general supervision of the Trustees.Additional information on restricted securities, excluding securities purchased under Rule 144A, that have been deemed liquid by the Trustees, if applicable, held at August 31, 2011, is as follows:
| Security | Acquisition
Date |
Cost | Market
Value |
| Muni Mae TE Bond Subsidiary LLC, Pfd., 9.56%, 6/30/2050 | 5/31/2000 | $2,000,000 | $1,680,040 |
| Non-Profit Preferred Funding Trust I, Partnership, 9/15/2037 | 10/26/2006-2/16/2007 | $3,989,000 | $2,529,840 |
Other
The preparation of financial statements in conformity with GAAP requires management to make estimates and assumptions that affect the amounts of assets, liabilities, expenses and revenues reported in the financial statements. Actual results could differ from those estimated.
3. Shares of Beneficial Interest
The following tables summarize share activity:
| Year Ended August 31 | 2011 | 2010 |
| Class A Shares: | Shares | Amount | Shares | Amount |
| Shares sold | 4,820,706 | $39,181,804 | 8,282,792 | $68,683,951 |
| Shares issued to shareholders in payment of distributions declared | 1,136,642 | 9,221,844 | 1,142,618 | 9,403,962 |
| Shares redeemed | (9,496,538) | (76,613,825) | (6,011,277) | (49,676,591) |
| NET CHANGE RESULTING FROM CLASS A SHARE TRANSACTIONS | (3,539,190) | $(28,210,177) | 3,414,133 | $28,411,322 |
| Year Ended August 31 | 2011 | 2010 |
| Class B Shares: | Shares | Amount | Shares | Amount |
| Shares sold | 360,066 | $2,952,430 | 489,668 | $4,054,754 |
| Shares issued to shareholders in payment of distributions declared | 147,721 | 1,197,844 | 187,749 | 1,542,567 |
| Shares redeemed | (1,871,240) | (15,111,718) | (1,675,273) | (13,815,500) |
| NET CHANGE RESULTING FROM CLASS B SHARE TRANSACTIONS | (1,363,453) | $(10,961,444) | (997,856) | $(8,218,179) |
Annual Shareholder Report| Year Ended August 31 | 2011 | 2010 |
| Class C Shares: | Shares | Amount | Shares | Amount |
| Shares sold | 1,074,606 | $8,838,758 | 1,653,071 | $13,655,467 |
| Shares issued to shareholders in payment of distributions declared | 237,234 | 1,921,040 | 222,751 | 1,833,073 |
| Shares redeemed | (1,740,770) | (13,999,071) | (970,542) | (8,021,435) |
| NET CHANGE RESULTING FROM CLASS C SHARE TRANSACTIONS | (428,930) | $(3,239,273) | 905,280 | $7,467,105 |
| Year Ended August 31 | 2011 | 2010 |
| Class F Shares: | Shares | Amount | Shares | Amount |
| Shares sold | 1,791,610 | $14,698,052 | 4,084,624 | $33,828,757 |
| Shares issued to shareholders in payment of distributions declared | 1,041,903 | 8,439,540 | 966,773 | 7,957,616 |
| Shares redeemed | (4,630,615) | (37,308,382) | (2,590,504) | (21,393,778) |
| NET CHANGE RESULTING FROM CLASS F SHARE TRANSACTIONS | (1,797,102) | $(14,170,790) | 2,460,893 | $20,392,595 |
| NET CHANGE RESULTING FROM TOTAL FUND SHARE TRANSACTIONS | (7,128,675) | $(56,581,684) | 5,782,450 | $48,052,843 |
4. Federal Tax Information
The timing and character of income and capital gain distributions are determined in accordance with income tax regulations, which may differ from GAAP. These differences are due to the expiration of capital loss carryforwards, differing treatments for partnership income and gains, defaulted securities and discount accretion/premium amortization on debt securities.
For the year ended August 31, 2011, permanent differences identified and reclassified among the components of net assets were as follows:
| Increase (Decrease) |
| Paid-In Capital | Undistributed
Net Investment
Income (Loss) | Accumulated
Net Realized
Gain (Loss) |
| $(5,176,673) | $359,936 | $4,816,737 |
Net investment income (loss), net realized gains (losses) and net assets were not affected by this reclassification.
Annual Shareholder Report
The tax character of distributions as reported on the Statement of Changes in Net Assets for the years ended August 31, 2011 and 2010, was as follows: | 2011 | 2010 |
| Tax-exempt income | $26,362,513 | $26,837,001 |
| Ordinary income | $ — | $82,682 |
As of August 31, 2011, the components of distributable earnings on a tax basis were as follows:
| Undistributed tax-exempt income | $582,263 |
| Net unrealized depreciation | $(27,147,141) |
| Capital loss carryforwards and deferrals | $(74,533,060) |
The difference between book-basis and tax-basis net unrealized appreciation/depreciation is attributable to differing treatments for the deferral of losses on wash sales, discount accretion/premium amortization on debt securities, open defaulted securities and partnership adjustments.
At August 31, 2011, the cost of investments for federal tax purposes was $455,456,518. The net unrealized depreciation of investments for federal tax purposes was $26,951,519. This consists of net unrealized appreciation from investments for those securities having an excess of value over cost of $11,575,527 and net unrealized depreciation from investments for those securities having an excess of cost over value of $38,527,046.
At August 31, 2011, the Fund had a capital loss carryforward of $55,106,392 which will reduce the Fund's taxable income arising from future net realized gains on investments, if any, to the extent permitted by the Code and thus will reduce the amount of distributions to shareholders which would otherwise be necessary to relieve the Fund of any liability for federal income tax. Pursuant to the Code, such capital loss carryforward will expire as follows:
| Expiration Year | Expiration Amount |
| 2012 | $ 3,341,471 |
| 2013 | $ 7,976,021 |
| 2014 | $ 1,161,133 |
| 2017 | $20,198,309 |
| 2018 | $19,483,511 |
| 2019 | $2,945,947 |
Under the recently enacted Regulated Investment Company Modernization Act of 2010, the Fund will be permitted to carry forward capital losses incurred in taxable years beginning after December 22, 2010, for an unlimited period. However, any losses incurred during those future years will be required to be utilized prior to the losses incurred in pre-enactment tax years. As a result of this ordering rule, pre-enactment capital loss carryforwards may be more likely to expire unused. Additionally, post-enactment capital losses that are carried forward will retain their character as either short-term or long-term capital losses rather than being considered all short-term as under previous law.
Capital loss carryforwards of $5,101,855 expired during the year ended August 31, 2011.
Annual Shareholder Report
Under current tax regulations, capital losses on securities transactions realized after October 31 may be deferred and treated as occurring on the first day of the following fiscal year. As of August 31, 2011, for federal income tax purposes, post-October losses of $19,426,668 were deferred to September 1, 2011.5. Investment Adviser Fee and Other Transactions with Affiliates
Investment Adviser Fee
Federated Investment Management Company is the Fund's investment adviser (the “Adviser”). The advisory agreement between the Fund and the Adviser provides for an annual fee equal to 0.60% of the Fund's average daily net assets. Subject to the terms described in the Expense Limitation note, the Adviser may voluntarily choose to waive any portion of its fee. For the year ended August 31, 2011, the Adviser waived $986,039 of its fee. In addition, for the year ended August 31, 2011, the Adviser voluntarily reimbursed $3,227 of other operating expenses.
Pursuant to a settlement with the New York Attorney General, the Adviser has agreed to waive investment adviser fees in compliance with an Assurance of Discontinuance dated November 17, 2005. The net adviser fee was reduced to 0.3233% effective January 1, 2006 and could not be increased until after December 31, 2010, at which time the obligation expired. The Adviser fee waived as a result of this settlement is included in the $986,039 mentioned in the previous paragraph.
Administrative Fee
Federated Administrative Services (FAS), under the Administrative Services Agreement, provides the Fund with administrative personnel and services. The fee paid to FAS is based on the average aggregate daily net assets of certain Federated funds as specified below:
Administrative Fee | Average Aggregate Daily Net Assets
of the Federated Funds |
| 0.150% | on the first $5 billion |
| 0.125% | on the next $5 billion |
| 0.100% | on the next $10 billion |
| 0.075% | on assets in excess of $20 billion |
The administrative fee received during any fiscal year shall be at least $150,000 per portfolio and $40,000 per each additional class of Shares. Subject to the terms described in the Expense Limitation note, FAS may voluntarily choose to waive any portion of its fee. For the year ended August 31, 2011, the net fee paid to FAS was 0.076% of average daily net assets of the Fund. FAS waived $9,399 of its fee.
Annual Shareholder Report
Distribution Services FeeThe Fund has adopted a Distribution Plan (the “Plan”) pursuant to Rule 12b-1 under the Act. Under the terms of the Plan, the Fund will compensate Federated Securities Corp. (FSC), the principal distributor, from the daily net assets of the Fund's Class A Shares, Class B Shares, Class C Shares and Class F Shares to finance activities intended to result in the sale of these shares. The Plan provides that the Fund may incur distribution expenses at the following percentages of average daily net assets annually, to compensate FSC:
| Share Class Name | Percentage of Average Daily
Net Assets of Class |
| Class A Shares | 0.05% |
| Class B Shares | 0.75% |
| Class C Shares | 0.75% |
| Class F Shares | 0.05% |
Subject to the terms described in the Expense Limitation note, FSC may voluntarily choose to waive any portion of its fee. For the year ended August 31, 2011, distribution services fees for the Fund were as follows:
| Distribution
Services Fees
Incurred |
| Class B Shares | $219,683 |
| Class C Shares | 361,592 |
| TOTAL | $581,275 |
When FSC receives fees, it may pay some or all of them to financial intermediaries whose customers purchase shares. For the year ended August 31, 2011, FSC retained $91,483 of fees paid by the Fund. For the year ended August 31, 2011, the Fund's Class A Shares and Class F Shares did not incur a distribution services fee; however, they may begin to incur this fee upon approval of the Trustees.
Sales Charges
Front-end sales charges and contingent deferred sales charges (CDSC) do not represent expenses of the Fund. They are deducted from the proceeds of sales of Fund shares prior to investment or from redemption proceeds prior to remittance, as applicable. For the year ended August 31, 2011, FSC retained $47,041 in sales charges from the sale of Class A Shares. FSC also retained $10,353 of CDSC relating to redemptions of Class A Shares, $2,605 related to redemptions of Class B Shares, $2,182 related to redemptions of Class C Shares and $17,602 relating to redemptions of Class F Shares.
Annual Shareholder Report
Shareholder Services FeeThe Fund may pay fees (“Service Fees”) up to 0.25% of the average daily net assets of the Fund's Class A Shares, Class B Shares, Class C Shares and Class F Shares to financial intermediaries or to Federated Shareholder Services Company (FSSC) for providing services to shareholders and maintaining shareholder accounts. Subject to the terms described in the Expense Limitation note, FSSC may voluntarily reimburse the Fund for Service Fees. For the year ended August 31, 2011, Service Fees for the Fund were as follows:
| Service Fees
Incurred |
| Class A Shares | $496,090 |
| Class B Shares | 73,227 |
| Class C Shares | 120,531 |
| Class F Shares | 458,335 |
| TOTAL | $1,148,183 |
For the year ended August 31, 2011, FSSC received $15,580 of fees paid by the Fund.
Interfund Transactions
During the year ended August 31, 2011, the Fund engaged in purchase and sale transactions with funds that have a common investment adviser (or affiliated investment advisers), common Directors/Trustees and/or common Officers. These purchase and sale transactions complied with Rule 17a-7 under the Act and amounted to $156,420,000 and $171,592,375, respectively.
Expense Limitation
The Adviser and its affiliates (which may include FSC, FAS and FSSC) have voluntarily agreed to waive their fees and/or reimburse expenses so that the total annual fund operating expenses (as shown in the financial highlights) paid by the Fund's Class A Shares, Class B Shares, Class C Shares and Class F Shares (after the voluntary waivers and reimbursements) will not exceed 0.89%, 1.64%, 1.64% and 0.89% (the “Fee Limit”), respectively, up to but not including the later of (the “Termination Date”): (a) November 1, 2012; or (b) the date of the Fund's next effective Prospectus. While the Adviser and its affiliates currently do not anticipate terminating or increasing these arrangements prior to the Termination Date, these arrangements may only be terminated or the Fee Limit increased prior to the Termination Date with the agreement of the Fund's Trustees.
General
Certain Officers and Trustees of the Fund are Officers and Directors or Trustees of the above companies.
6. Investment Risk
Although the Fund has a diversified portfolio, the Fund has 43.5% of its portfolio invested in lower-rated and comparable quality unrated high-yield securities. Investments in higher yield securities may be subject to a greater degree of credit risk and the risk tends to be more sensitive to economic conditions than higher-rated securities. The risk of loss due to default by the issuer may be significantly greater for the holders of high-yielding securities because such securities are generally unsecured and often subordinated to other creditors of the issuer.
Annual Shareholder Report
7. Investment TransactionsPurchases and sales of investments, excluding long-term U.S. government securities and short-term obligations, for the year ended August 31, 2011, were as follows:
| Purchases | $126,850,348 |
| Sales | $122,900,348 |
8. Line of Credit
The Fund participates in a $100,000,000 unsecured, uncommitted revolving line of credit (LOC) agreement with PNC Bank. The LOC was made available for extraordinary or emergency purposes, primarily for financing redemption payments. Borrowings are charged interest at a rate offered to the Fund by PNC Bank at the time of the borrowing. As of August 31, 2011, there were no outstanding loans. During the year ended August 31, 2011, the Fund did not utilize the LOC.
9. Interfund Lending
Pursuant to an Exemptive Order issued by the Securities and Exchange Commission, the Fund, along with other funds advised by subsidiaries of Federated Investors, Inc., may participate in an interfund lending program. This program provides an alternative credit facility allowing the Fund to borrow from other participating affiliated funds. As of August 31, 2011, there were no outstanding loans. During the year ended August 31, 2011, the program was not utilized.
10. Recent Accounting Pronouncements
In April 2011, the Financial Accounting Standards Board (FASB) released Accounting Standards Update (ASU) No. 2011-03, “Reconsideration of Effective Control for Repurchase Agreements.” This ASU amends FASB Accounting Standards Codification (ASC) Topic 860, “Transfers and Servicing”; specifically the criteria required to determine whether a repurchase agreement and similar agreements should be accounted for as sales of financial assets or secured borrowings with commitments. This ASU is effective for fiscal years and interim periods beginning after December 15, 2011. At this time, management is evaluating the implications of adopting ASU No. 2011-03 and its impact on the Fund's financial statements and the accompanying notes, net assets and results of operations.
Annual Shareholder Report
In addition, in May 2011, FASB released ASU No. 2011-04, “Amendments to Achieve Common Fair Value Measurement and Disclosure Requirements in U.S. GAAP and IFRSs.” This ASU amends FASB ASC Topic 820, “Fair Value Measurement,” to establish common requirements for measuring fair value and for disclosing information about fair value measurements in accordance with GAAP. This ASU is effective for fiscal years and interim periods beginning after December 15, 2011. At this time, management is evaluating the implications of adopting ASU No. 2011-04 and its impact on the Fund's financial statements and the accompanying notes.11. Federal Tax Information (unaudited)
For the fiscal year ended August 31, 2011, 100.0% of the distributions from net investment income is exempt from federal income tax, other than the federal AMT.
Annual Shareholder Report Report of Independent Registered Public Accounting Firm
TO THE BOARD OF TRUSTEES OF federated municipal securities income trust and shareholders of federated municipal High yield advantage FUND:
We have audited the accompanying statement of assets and liabilities, including the portfolio of investments, of Federated Municipal High Yield Advantage Fund (the “Fund”), a portfolio of Federated Municipal Securities Income Trust, as of August 31, 2011, and the related statement of operations for the year then ended, and the statements of changes in net assets and the financial highlights for each of the years in the two-year period then ended. These financial statements and financial highlights are the responsibility of the Fund's management. Our responsibility is to express an opinion on these financial statements and financial highlights based on our audits. The financial highlights for the periods presented prior to September 1, 2009 were audited by other independent registered public accountants whose report thereon dated October 20, 2009, expressed an unqualified opinion on those statements.
We conducted our audits in accordance with the standards of the Public Company Accounting Oversight Board (United States). Those standards require that we plan and perform the audit to obtain reasonable assurance about whether the financial statements and financial highlights are free of material misstatement. An audit includes examining, on a test basis, evidence supporting the amounts and disclosures in the financial statements. Our procedures included confirmation of securities owned as of August 31, 2011 by correspondence with the custodian and brokers or by other appropriate auditing procedures. An audit also includes assessing the accounting principles used and significant estimates made by management, as well as evaluating the overall financial statement presentation. We believe that our audits provide a reasonable basis for our opinion.
In our opinion, the financial statements and financial highlights referred to above present fairly, in all material respects, the financial position of Federated Municipal High Yield Advantage Fund as of August 31, 2011, and the results of its operations for the year then ended, and the changes in its net assets and the financial highlights for each of the years in the two-year period then ended, in conformity with U.S. generally accepted accounting principles.
Boston, Massachusetts
October 24, 2011
Annual Shareholder Report Shareholder Expense Example (unaudited)
As a shareholder of the Fund, you incur two types of costs: (1) transaction costs, including sales charges (loads) on purchase or redemption payments; and (2) ongoing costs, including management fees and to the extent applicable, distribution (12b-1) fees and/or shareholder services fees and other Fund expenses. This Example is intended to help you to understand your ongoing costs (in dollars) of investing in the Fund and to compare these costs with the ongoing costs of investing in other mutual funds. It is based on an investment of $1,000 invested at the beginning of the period and held for the entire period from March 1, 2011 to August 31, 2011.
ACTUAL EXPENSES
The first section of the table below provides information about actual account values and actual expenses. You may use the information in this section, together with the amount you invested, to estimate the expenses that you incurred over the period. Simply divide your account value by $1,000 (for example, an $8,600 account value divided by $1,000 = 8.6), then multiply the result by the number in the first section under the heading entitled “Expenses Paid During Period” to estimate the expenses attributable to your investment during this period.
HYPOTHETICAL EXAMPLE FOR COMPARISON PURPOSES
The second section of the table below provides information about hypothetical account values and hypothetical expenses based on the Fund's actual expense ratio and an assumed rate of return of 5% per year before expenses, which is not the Fund's actual return. Thus, you should not use the hypothetical account values and expenses to estimate the actual ending account balance or your expenses for the period. Rather, these figures are required to be provided to enable you to compare the ongoing costs of investing in the Fund with other funds. To do so, compare this 5% hypothetical example with the 5% hypothetical examples that appear in the shareholder reports of the other funds.
Annual Shareholder Report
Please note that the expenses shown in the table are meant to highlight your ongoing costs only and do not reflect any transaction costs, such as sales charges (loads) on purchase or redemption payments. Therefore, the second section of the table is useful in comparing ongoing costs only, and will not help you determine the relative total costs of owning different funds. In addition, if these transaction costs were included, your costs would have been higher. | Beginning
Account Value
3/1/2011 | Ending
Account Value
8/31/2011 | Expenses Paid
During Period1 |
| Actual: | | | |
| Class A Shares | $1,000 | $1,074.60 | $4.65 |
| Class B Shares | $1,000 | $1,071.90 | $8.56 |
| Class C Shares | $1,000 | $1,071.90 | $8.56 |
| Class F Shares | $1,000 | $1,074.60 | $4.65 |
Hypothetical (assuming a 5% return
before expenses): | | | |
| Class A Shares | $1,000 | $1,020.72 | $4.53 |
| Class B Shares | $1,000 | $1,016.94 | $8.34 |
| Class C Shares | $1,000 | $1,016.94 | $8.34 |
| Class F Shares | $1,000 | $1,020.72 | $4.53 |
| 1 | Expenses are equal to the Fund's annualized net expense ratios, multiplied by the average account value over the period, multiplied by 184/365 (to reflect the one-half-year period). The annualized net expense ratios are as follows: |
| Class A Shares | 0.89% |
| Class B Shares | 1.64% |
| Class C Shares | 1.64% |
| Class F Shares | 0.89% |
Annual Shareholder Report Board of Trustees and Trust Officers
The Board of Trustees is responsible for managing the Trust's business affairs and for exercising all the Trust's powers except those reserved for the shareholders. The following tables give information about each Trustee and the senior officers of the Fund. Where required, the tables separately list Trustees who are “interested persons” of the Fund (i.e., “Interested” Trustees) and those who are not (i.e., “Independent” Trustees). Unless otherwise noted, the address of each person listed is Federated Investors Tower, 1001 Liberty Avenue, Pittsburgh, PA 15222. The address of all Independent Trustees listed is 4000 Ericsson Drive, Warrendale, PA 15086-7561; Attention: Mutual Fund Board. As of December 31, 2010, the Trust comprised 5 portfolio(s), and the Federated Fund Family consisted of 43 investment companies (comprising 136 portfolios). Unless otherwise noted, each Officer is elected annually. Unless otherwise noted, each Trustee oversees all portfolios in the Federated Fund Family and serves for an indefinite term. The Fund's Statement of Additional Information includes additional information about Trust Trustees and is available, without charge and upon request, by calling 1-800-341-7400.
Interested TRUSTEES Background
Name
Birth Date
Positions Held with Trust
Date Service Began | Principal Occupation(s) for Past Five Years,
Other Directorships Held and Previous Position(s) |
John F. Donahue*
Birth Date: July 28, 1924
Trustee
Began serving: August 1990 | Principal Occupations: Director or Trustee of the Federated Fund Family; Chairman and Director, Federated Investors, Inc.; Chairman of the Federated Fund Family's Executive Committee.
Previous Positions: Chairman of the Federated Fund Family; Trustee, Federated Investment Management Company; Chairman and Director, Federated Investment Counseling. |
J. Christopher Donahue*
Birth Date: April 11, 1949
President and Trustee
Began serving: August 1990 | Principal Occupations: Principal Executive Officer and President of the Federated Fund Family; Director or Trustee of some of the Funds in the Federated Fund Family; President, Chief Executive Officer and Director, Federated Investors, Inc.; Chairman and Trustee, Federated Investment Management Company; Trustee, Federated Investment Counseling; Chairman and Director, Federated Global Investment Management Corp.; Chairman, Federated Equity Management Company of Pennsylvania and Passport Research, Ltd. (investment advisory subsidiary of Federated); Trustee, Federated Shareholder Services Company; Director, Federated Services Company.
Previous Positions: President, Federated Investment Counseling; President and Chief Executive Officer, Federated Investment Management Company, Federated Global Investment Management Corp. and Passport Research, Ltd. |
| * | Family relationships and reasons for “interested” status: John F. Donahue is the father of J. Christopher Donahue; both are “interested” due to their beneficial ownership of shares of Federated Investors, Inc. and the positions they hold with Federated and its subsidiaries. |
Annual Shareholder Report INDEPENDENT TRUSTEES Background
Name
Birth Date
Positions Held with Trust
Date Service Began | Principal Occupation(s) for Past Five Years,
Other Directorships Held, Previous Position(s) and Qualifications |
Nicholas P. Constantakis, CPA
Birth Date: September 3, 1939
Trustee
Began serving: February 1998 | Principal Occupation: Director or Trustee of the Federated Fund Family.
Other Directorship Held: Director and Chairman of the Audit Committee, Michael Baker Corporation (architecture, engineering and construction services).
Previous Position: Partner, Andersen Worldwide SC.
Qualifications: Public accounting and director experience. |
John F. Cunningham
Birth Date: March 5, 1943
Trustee
Began serving: June 1999 | Principal Occupation: Director or Trustee of the Federated Fund Family.
Other Directorships Held: Chairman, President and Chief Executive Officer, Cunningham & Co., Inc. (strategic business consulting); Trustee Associate, Boston College.
Previous Positions: Director, Redgate Communications and EMC Corporation (computer storage systems); Chairman of the Board and Chief Executive Officer, Computer Consoles, Inc.; President and Chief Operating Officer, Wang Laboratories; Director, First National Bank of Boston; Director, Apollo Computer, Inc.
Qualifications: Business management and director experience. |
Maureen Lally-Green
Birth Date: July 5, 1949
Trustee
Began serving: August 2009 | Principal Occupations: Director or Trustee of the Federated Fund Family; Director, Office of Church Relations, Diocese of Pittsburgh; Adjunct Professor of Law, Duquesne University School of Law.
Other Directorships Held: Director, Auberle; Trustee, St. Francis University; Director, Ireland Institute of Pittsburgh; Director, UPMC Mercy Hospital; Regent, St. Vincent Seminary; Director, Epilepsy Foundation of Western and Central Pennsylvania; Director, Saint Thomas More Society, Allegheny County; Director, Carlow University.
Previous Position: Pennsylvania Superior Court Judge.
Qualifications: Legal and director experience. |
Peter E. Madden
Birth Date: March 16, 1942
Trustee
Began serving: August 1991 | Principal Occupation: Director or Trustee, and Chairman of the Board of Directors or Trustees, of the Federated Fund Family.
Previous Positions: Representative, Commonwealth of Massachusetts General Court; President, Chief Operating Officer and Director, State Street Bank and Trust Company and State Street Corporation (retired); Director, VISA USA and VISA International; Chairman and Director, Massachusetts Bankers Association; Director, Depository Trust Corporation; Director, The Boston Stock Exchange.
Qualifications: Business management, mutual fund services and director experience. |
Annual Shareholder ReportName
Birth Date
Positions Held with Trust
Date Service Began | Principal Occupation(s) for Past Five Years,
Other Directorships Held, Previous Position(s) and Qualifications |
Charles F. Mansfield, Jr.
Birth Date: April 10, 1945
Trustee
Began serving: January 1999 | Principal Occupations: Director or Trustee and Chairman of the Audit Committee of the Federated Fund Family; Management Consultant.
Previous Positions: Chief Executive Officer, PBTC International Bank; Partner, Arthur Young & Company (now Ernst & Young LLP); Chief Financial Officer of Retail Banking Sector, Chase Manhattan Bank; Senior Vice President, HSBC Bank USA (formerly, Marine Midland Bank); Vice President, Citibank; Assistant Professor of Banking and Finance, Frank G. Zarb School of Business, Hofstra University; Executive Vice President, DVC Group, Inc. (marketing, communications and technology).
Qualifications: Banking, business management, education and director experience. |
R. James Nicholson
Birth Date: February 4, 1938
Trustee
Began serving: January 2008 | Principal Occupations: Director or Trustee of the Federated Fund Family; Senior Counsel, Brownstein Hyatt Farber Schrek, P.C.; Former Secretary of the U.S. Dept. of Veterans Affairs; Former U.S. Ambassador to the Holy See; Former Chairman of the Republican National Committee.
Other Directorships Held: Director, Horatio Alger Association; Director, The Daniels Fund.
Previous Positions: Colonel, U.S. Army Reserve; Partner, Calkins, Kramer, Grimshaw and Harring, P.C.; General Counsel, Colorado Association of Housing and Building; Chairman and CEO, Nicholson Enterprises, Inc. (real estate holding company); Chairman and CEO, Renaissance Homes of Colorado.
Qualifications: Legal, government, business management and director experience. |
Thomas M. O'Neill
Birth Date: June 14, 1951
Trustee
Began serving: October 2006 | Principal Occupations: Director or Trustee of the Federated Fund Family; Sole Proprietor, Navigator Management Company (investment and strategic consulting).
Other Directorships Held: Board of Overseers, Children's Hospital of Boston; Visiting Committee on Athletics, Harvard College.
Previous Positions: Chief Executive Officer and President, Managing Director and Chief Investment Officer, Fleet Investment Advisors; President and Chief Executive Officer, Aeltus Investment Management, Inc.; General Partner, Hellman, Jordan Management Co., Boston, MA; Chief Investment Officer, The Putnam Companies, Boston, MA; Credit Analyst and Lending Officer, Fleet Bank; Director and Consultant, EZE Castle Software (investment order management software); Director, Midway Pacific (lumber).
Qualifications: Business management, mutual fund, director and investment experience. |
Annual Shareholder ReportName
Birth Date
Positions Held with Trust
Date Service Began | Principal Occupation(s) for Past Five Years,
Other Directorships Held, Previous Position(s) and Qualifications |
John S. Walsh
Birth Date: November 28, 1957
Trustee
Began serving: June 1999 | Principal Occupations: Director or Trustee of the Federated Fund Family; President and Director, Heat Wagon, Inc. (manufacturer of construction temporary heaters); President and Director, Manufacturers Products, Inc. (distributor of portable construction heaters); President, Portable Heater Parts, a division of Manufacturers Products, Inc.
Previous Position: Vice President, Walsh & Kelly, Inc.
Qualifications: Business management and director experience. |
James F. Will
Birth Date: October 12, 1938
Trustee
Began serving: April 2006 | Principal Occupations: Director or Trustee of the Federated Fund Family; formerly, Vice Chancellor and President, Saint Vincent College.
Other Directorships Held: Trustee, Saint Vincent College; Director, Alleghany Corporation; Trustee, Wheeling Jesuit University; Director, Liberty Tire Recycling.
Previous Positions: Chairman, President and Chief Executive Officer, Armco, Inc.; President and Chief Executive Officer, Cyclops Industries; President and Chief Operating Officer, Kaiser Steel Corporation.
Qualifications: Business management, education and director experience. |
OFFICERS
Name
Birth Date
Positions Held with Trust
Date Service Began | Principal Occupation(s) for Past Five Years
and Previous Position(s) |
John W. McGonigle
Birth Date: October 26, 1938
EXECUTIVE VICE PRESIDENT AND SECRETARY
Began serving: August 1990 | Principal Occupations: Executive Vice President and Secretary of the Federated Fund Family; Vice Chairman, Executive Vice President, Secretary and Director, Federated Investors, Inc.
Previous Positions: Trustee, Federated Investment Management Company and Federated Investment Counseling; Director, Federated Global Investment Management Corp., Federated Services Company and Federated Securities Corp. |
Richard A. Novak
Birth Date: December 25, 1963
Treasurer
Began serving: January 2006 | Principal Occupations: Principal Financial Officer and Treasurer of the Federated Fund Family; Senior Vice President, Federated Administrative Services; Financial and Operations Principal for Federated Securities Corp., Edgewood Services, Inc. and Southpointe Distribution Services, Inc.
Previous Positions: Controller of Federated Investors, Inc.; Vice President, Finance of Federated Services Company; held various financial management positions within The Mercy Hospital of Pittsburgh; Auditor, Arthur Andersen & Co. |
Annual Shareholder ReportName
Birth Date
Positions Held with Trust
Date Service Began | Principal Occupation(s) for Past Five Years
and Previous Position(s) |
Richard B. Fisher
Birth Date: May 17, 1923
Vice Chairman
Began serving: August 2002 | Principal Occupations: Vice Chairman or Vice President of some of the Funds in the Federated Fund Family; Vice Chairman, Federated Investors, Inc.; Chairman, Federated Securities Corp.
Previous Positions: President and Director or Trustee of some of the Funds in the Federated Fund Family; Executive Vice President, Federated Investors, Inc.; Director and Chief Executive Officer, Federated Securities Corp. |
Brian P. Bouda
Birth Date: February 28, 1947
CHIEF COMPLIANCE OFFICER AND SENIOR VICE PRESIDENT
Began serving: August 2004 | Principal Occupations: Senior Vice President and Chief Compliance Officer of the Federated Fund Family; Vice President and Chief Compliance Officer of Federated Investors, Inc. and Chief Compliance Officer of its subsidiaries. Mr. Bouda joined Federated in 1999 and is a member of the American Bar Association and the State Bar Association of Wisconsin. |
J. Scott Albrecht
Birth Date: June 1, 1960
VICE PRESIDENT
Began serving: November 1999 | Principal Occupations: J. Scott Albrecht is Vice President of the Fund. Mr. Albrecht joined Federated in 1989. He became a Senior Vice President of the Fund's Adviser in January 2005 and served as a Vice President of the Fund's Adviser from 1994 through 2004. He has been a Senior Portfolio Manager since 1997 and was a Portfolio Manager from 1994 to 1996. Mr. Albrecht has received the Chartered Financial Analyst designation and an M.S. in Public Management from Carnegie Mellon University. |
Annual Shareholder Report Evaluation and Approval of Advisory Contract – May 2011
Federated Municipal High Yield Advantage Fund (the “Fund”)
The Fund's Board reviewed the Fund's investment advisory contract at meetings held in May 2011. The Board's decision regarding the contract reflects the exercise of its business judgment on whether to continue the existing arrangements.
In this connection, the Federated Funds' Board had previously appointed a Senior Officer, whose duties include specified responsibilities relating to the process by which advisory fees are to be charged to a Federated fund. The Senior Officer has the authority to retain consultants, experts, or staff as may be reasonably necessary to assist in the performance of his duties, reports directly to the Board, and may be terminated only with the approval of a majority of the independent members of the Board. The Senior Officer prepared and furnished to the Board an independent, written evaluation that covered topics discussed below (the “Evaluation”). The Board considered that Evaluation, along with other information, in deciding to approve the advisory contract.
During its review of the contract, the Board considered compensation and benefits received by the Adviser. This included the fees received for services provided to the Fund by other entities in the Federated organization and research services (if any) received by the Adviser from brokers that execute Federated fund trades, as well as advisory fees. The Board is also familiar with and considered judicial decisions concerning allegedly excessive investment advisory fees, which have indicated that the following factors may be relevant to an Adviser's fiduciary duty with respect to its receipt of compensation from a fund: the nature and quality of the services provided by the Adviser, including the performance of the fund; the Adviser's cost of providing the services; the extent to which the Adviser may realize “economies of scale” as a fund grows larger; any indirect benefits that may accrue to the Adviser and its affiliates as a result of the Adviser's relationship with a fund; performance and expenses of comparable funds; and the extent to which the independent Board members are fully informed about all facts the Board deems relevant bearing on the Adviser's services and fees. The Board further considered management fees (including any components thereof) charged to institutional and other clients of the Adviser for what might be viewed as like services, and the cost to the Adviser and its affiliates of supplying services pursuant to the management fee agreements, excluding any intra-corporate profit and profit margins of the Adviser and its affiliates for supplying such services. The Board was aware of these factors and was guided by them in its review of the Fund's advisory contract to the extent it considered them to be appropriate and relevant, as discussed further below.
Annual Shareholder Report
The Board considered and weighed these circumstances in light of its substantial accumulated experience in governing the Fund and working with Federated on matters relating to the Federated funds, and was assisted in its deliberations by independent legal counsel. Throughout the year, the Board has requested and received substantial and detailed information about the Fund and the Federated organization that was in addition to the extensive materials that comprise and accompany the Senior Officer's Evaluation. Federated provided much of this information at each regular meeting of the Board, and furnished additional information in connection with the particular meeting at which the Board's formal review of the advisory contract occurred. Between regularly scheduled meetings, the Board also received information on particular matters as the need arose. Thus, the Board's consideration of the advisory contract included review of the Senior Officer's Evaluation, accompanying data and additional information covering such matters as: the Adviser's investment philosophy, revenue, profitability, personnel and processes; investment and operating strategies; the Fund's short- and long-term performance (in absolute terms, both on a gross basis and net of expenses, as well as in relationship to its particular investment program and certain competitor or “peer group” funds and/or other benchmarks, as appropriate), and comments on the reasons for performance; the Fund's investment objectives; the Fund's expenses (including the advisory fee itself and the overall expense structure of the Fund, both in absolute terms and relative to similar and/or competing funds, with due regard for contractual or voluntary expense limitations); the use and allocation of brokerage commissions derived from trading the Fund's portfolio securities (if any); and the nature, quality and extent of the advisory and other services provided to the Fund by the Adviser and its affiliates. The Board also considered the preferences and expectations of Fund shareholders and their relative sophistication; the continuing state of competition in the mutual fund industry and market practices; the range of comparable fees for similar funds in the mutual fund industry; the Fund's relationship to the Federated family of funds which include a comprehensive array of funds with different investment objectives, policies and strategies which are available for exchange without the incurrence of additional sales charges; compliance and audit reports concerning the Federated funds and the Federated companies that service them (including communications from regulatory agencies), as well as Federated's responses to any issues raised therein; and relevant developments in the mutual fund industry and how the Federated funds and/or Federated are responding to them. The Board's evaluation process is evolutionary. The criteria considered and the emphasis placed on relevant criteria change in recognition of changing circumstances in the mutual fund marketplace.With respect to the Fund's performance and expenses in particular, the Board has found the use of comparisons to other mutual funds with comparable investment programs to be relevant, given the high degree of competition in the mutual fund business. The Board focused on comparisons with other similar Annual Shareholder Report
mutual funds more heavily than non-mutual fund products or services because it is believed that they are more relevant. For example, other mutual funds are the products most like the Fund, they are readily available to Fund shareholders as alternative investment vehicles, and they are the type of investment vehicle in fact chosen and maintained by the Fund's investors. The range of their fees and expenses therefore appears to be a generally reliable indication of what consumers have found to be reasonable in the precise marketplace in which the Fund competes. The Fund's ability to deliver competitive performance when compared to its peer group was a useful indicator of how the Adviser is executing the Fund's investment program, which in turn assisted the Board in reaching a conclusion that the nature, extent, and quality of the Adviser's investment management services were such as to warrant continuation of the advisory contract. In this regard, the Senior Officer has reviewed Federated's fees for providing advisory services to products outside the Federated family of funds (e.g., institutional and separate accounts). He concluded that mutual funds and institutional accounts are inherently different products. Those differences include, but are not limited to, different types of targeted investors; being subject to different laws and regulations; different legal structures; different average account sizes; different associated costs; different portfolio management techniques made necessary by different cash flows; and portfolio manager time spent in review of securities pricing. The Senior Officer did not consider these fee schedules to be determinative in judging the appropriateness of mutual fund advisory contracts.The Senior Officer reviewed information compiled by Federated, using data supplied by independent fund ranking organizations, regarding the performance of, and fees charged by, other mutual funds, noting his view that comparisons to fund peer groups are relevant in judging the reasonableness of proposed fees.
The Fund's performance fell below the median of the relevant peer group for the one-year, three-year and five-year periods covered by the Evaluation. The Board discussed the Fund's performance with the Adviser and recognized the efforts being undertaken by the Adviser. The Board will continue to monitor these efforts and the performance of the Fund.
The Board also received financial information about Federated, including information regarding the compensation and benefits Federated derived from its relationships with the Federated funds. This information covered not only the fees under the advisory contracts, but also fees received by Federated's subsidiaries for providing other services to the Federated funds under separate contracts (e.g., for serving as the Federated funds' administrator). The information also detailed any indirect benefit Federated may derive from its receipt of research services from brokers who execute Federated fund trades. In addition, the Board considered the fact that, in order for a fund to be competitive in the marketplace, Federated and its affiliates frequently waived fees Annual Shareholder Report
and/or reimbursed expenses and have disclosed to fund investors and/or indicated to the Board their intention to do so in the future, where appropriate. Moreover, the Board receives regular reporting as to the institution or elimination of these voluntary waivers.Federated furnished information, requested by the Senior Officer, that reported revenues on a fund-by-fund basis and made estimates of the allocation of expenses on a fund-by-fund basis, using allocation methodologies specified by the Senior Officer. The Senior Officer noted that, although they may apply consistent allocation processes, the inherent difficulties in allocating costs (and the unavoidable arbitrary aspects of that exercise) and the lack of consensus on how to allocate those costs may render such allocation information unreliable. The allocation information was considered in the analysis by the Board but was determined to be of limited use.
The Board and the Senior Officer also reviewed information compiled by Federated comparing profitability information for Federated to other publicly held fund management companies. In this regard, the Senior Officer noted the limited availability of such information, but nonetheless concluded that Federated's profit margins did not appear to be excessive and the Board agreed.
The Senior Officer's Evaluation also discussed the notion of possible realization of “economies of scale” as a fund grows larger. The Board considered in this regard that the Adviser has made significant and long-term investments in areas that support all of the Federated funds, such as personnel and processes for the portfolio management, compliance, internal audit, and risk management functions; and systems technology; and that the benefits of these efforts (as well as any economies, should they exist) were likely to be enjoyed by the fund complex as a whole. Finally, the Board also noted the absence of any applicable regulatory or industry guidelines on this subject, which (as discussed in the Senior Officer's Evaluation) is compounded by the lack of any common industry practice or general pattern with respect to structuring fund advisory fees with “breakpoints” that serve to reduce the fee as the fund attains a certain size. The Senior Officer did not recommend institution of breakpoints in pricing Federated's fund advisory services at this time.
It was noted in the materials for the Board meeting that for the period covered by the Evaluation, the Fund's investment advisory fee, after waivers and expense reimbursements, if any, was below the median of the relevant peer group. The Board reviewed the fees and other expenses of the Fund with the Adviser and was satisfied that the overall expense structure of the Fund remained competitive.
The Senior Officer noted that, considering the totality of the circumstances, and all of the factors referenced within his Evaluation, he had concluded that, subject to comments and recommendations made within his Evaluation, his observations and the information accompanying the Evaluation supported a finding by the Board that the management fees for each of the funds are reasonable and that Federated appeared to provide appropriate administrative Annual Shareholder Report
services to the Fund for the fees paid. Under these circumstances, no changes were recommended to, and no objection was raised to, the continuation of the Fund's advisory contract. The Board concluded that the nature, quality and scope of services provided the Fund by the Adviser and its affiliates were satisfactory.In its decision to continue an existing investment advisory contract, the Board was mindful of the potential disruptions of the Fund's operations and various risks, uncertainties and other effects that could occur as a result of a decision to terminate or not renew an advisory contract. In particular, the Board recognized that many shareholders have invested in the Fund on the strength of the Adviser's industry standing and reputation and with the expectation that the Adviser will have a continuing role in providing advisory services to the Fund. Thus, the Board's approval of the advisory contract reflected the fact that it is the shareholders who have effectively selected the Adviser by virtue of having invested in the Fund.
The Board based its decision to approve the advisory contract on the totality of the circumstances and relevant factors and with a view to past and future long-term considerations. Not all of the factors and considerations identified above were necessarily relevant to the Fund, nor did the Board consider any one of them to be determinative. With respect to the factors that were relevant, the Board's decision to approve the contract reflects its determination that Federated's performance and actions provided a satisfactory basis to support the decision to continue the existing arrangements.
Annual Shareholder Report Voting Proxies on Fund Portfolio Securities
A description of the policies and procedures that the Fund uses to determine how to vote proxies, if any, relating to securities held in the Fund's portfolio is available, without charge and upon request, by calling 1-800-341-7400. A report on “Form N-PX” of how the Fund voted any such proxies during the most recent 12-month period ended June 30 is available from Federated's website at FederatedInvestors.com. To access this information from the home page, select “View All” next to “Find Products.” Select a fund name and share class, if applicable, to go to the Fund Overview page. On the Fund Overview page, select the “Documents” tab. At the bottom of that page, select “Proxy Voting Record Report (Form N-PX).” Form N-PX filings are also available at the SEC's website at www.sec.gov.
Quarterly Portfolio Schedule
The Fund files with the SEC a complete schedule of its portfolio holdings, as of the close of the first and third quarters of its fiscal year, on “Form N-Q.” These filings are available on the SEC's website at www.sec.gov and may be reviewed and copied at the SEC's Public Reference Room in Washington, DC. (Call 1-800-SEC-0330 for information on the operation of the Public Reference Room.) You may also access this information from the “Products” section of Federated's website at FederatedInvestors.com. From the home page, select “View All” next to “Find Products.” Select a fund name and share class, if applicable, to go to the Fund Overview page. On the Fund Overview page, select the “Documents” tab. At the bottom of that page, select “Form N-Q.”
Annual Shareholder ReportMutual funds are not bank deposits or obligations, are not guaranteed by any bank and are not insured or guaranteed by the U.S. government, the Federal Deposit Insurance Corporation, the Federal Reserve Board or any other government agency. Investment in mutual funds involves investment risk, including the possible loss of principal.
This Report is authorized for distribution to prospective investors only when preceded or accompanied by the Fund's Prospectus, which contains facts concerning its objective and policies, management fees, expenses and other information.
Federated Municipal High Yield Advantage Fund
Federated Investors Funds
4000 Ericsson Drive
Warrendale, PA 15086-7561
Contact us at FederatedInvestors.com
or call 1-800-341-7400.
Federated Securities Corp., Distributor
Cusip 313923864
Cusip 313923856
Cusip 313923849
Cusip 313923831
G01091-01 (10/11)
Federated is a registered trademark of Federated Investors, Inc.
2011 © Federated Investors, Inc.
| | Annual Shareholder Report |
| | August 31, 2011 |
|
Federated Michigan Intermediate Municipal Trust
Fund Established 1991
A Portfolio of Federated Municipal Securities Income Trust
Dear Valued Shareholder,
I am pleased to present the Annual Shareholder Report for your fund covering the period from September 1, 2010 through August 31, 2011. This report includes Management's Discussion of Fund Performance, a complete listing of your fund's holdings, performance information and financial statements along with other important fund information.
In addition, our website, FederatedInvestors.com, offers easy access to Federated resources that include timely fund updates, economic and market insights from our investment strategists, and financial planning tools. We invite you to register to take full advantage of its capabilities.
Thank you for investing with Federated. I hope you find this information useful and look forward to keeping you informed.
Sincerely,
J. Christopher Donahue, President
Not FDIC Insured May Lose Value No Bank Guarantee
CONTENTS
Management's Discussion of Fund
Performance (unaudited)
The Fund's total return, based on net asset value, for the 12-month reporting period ended August 31, 2011, was 2.74%. The total return of the S&P Municipal Bond Intermediate Index (“Intermediate Index” or “benchmark”),1 the Fund's broad-based securities market index, was 3.49% for the same period. The Fund's total return reflected actual cash flows, transaction costs and other expenses which were not reflected in the total return of the Intermediate Index.
During the reporting period, the most significant factors affecting the Fund's performance relative to the Intermediate Index were: (a) the effective duration of the portfolio (which indicates the portfolio's sensitivity to changes in interest rates);2,3 (b) the selection of securities with different maturities (expressed by a yield curve showing the relative yield of similar securities with different maturities); (c) the allocation of the fund's portfolio among securities of similar issuers (referred to as sectors); (d) the credit quality of portfolio securities (which indicates the risk that the securities may default); and (e) security selection.
The 2.74% total return for the reporting period consisted of 3.63% of tax-exempt dividends and -0.89% of price depreciation in the net asset value of the shares.4
MARKET OVERVIEW
During the 12-month reporting period, there was continued uncertainty regarding the economic outlook, regulatory policy and fiscal policy that continued to constrain hiring and capital investment. Economic growth was considerably slower than expected as reflected by deterioration in labor market conditions, slower household spending, a drop in consumer confidence and continued weakness in the housing market. The weakness in household and business spending was accompanied by fiscal consolidation at the state and local government level. The shedding of state and local government jobs contributed to the deterioration in overall labor market conditions. Higher energy and commodity prices and disruption from the Japanese earthquake were temporary factors that affected economic activity.
Throughout the period, concerns about the sovereign debt of certain European countries and the political controversy over the U.S. debt ceiling, its potential credit rating impact, and the downgrade of the long-term credit rating of the federal government of the United States had an effect on investor's appetites for risk assets. As a result, the ten-year Treasury rallied from a high of 3.74% in February to a low of 2.06% in August 2011. Also, the tax-exempt municipal bond market experienced a widening in credit spreads during the period as the BBB-rated sector widened by over 20 basis points.
Annual Shareholder Report
During the 12-month reporting period, the Michigan tax-exempt municipal market reflected the national market. According to Municipal Market Data, spreads on Michigan bonds tightened compared to the AAA benchmark. The Bond Buyer reported that issuance of Michigan municipal bonds for the first eight months of 2011 was 33% lower than during the same period in 2010.The economic and fiscal situations in Michigan, while still weak, continued to show signs of recovery from the recession and sharp contraction of the auto industry. The state's unemployment rate, on a seasonally adjusted basis, fell from 12.4% at the end of July 2010 to 10.9% in July 2011. The state approved its 2011-12 budget four months early. The budget was passed without tax increases, but included substantial cuts in aid to schools and local governments.
Actions by the ratings agencies have reflected an improving situation. In October 2010 Moody's Ratings Service changed the outlook on its Aa2 rating from negative to stable. In July 2010 Fitch Ratings Service had changed the outlook on its AA- rating from stable to positive. Standard & Poor's rating of AA- with a stable outlook remained unchanged during the reporting period.
DURATION
As determined at the end of the 12-month reporting period, the Fund's dollar-weighted average duration was 4.7 years. Duration management was a significant component of the Fund's investment strategy. The Fund's duration was maintained short of the duration of the Intermediate Index during the 12-month reporting period. The Fund's relatively short duration had a positive impact on the Fund's performance because rates rose through the intermediate part of the yield curve.
YIELD CURVE/MATURITY
Throughout the 12-month reporting period, bonds with maturities of less than seven years were the beneficiaries of falling interest rates. Bonds with maturities longer than seven years saw prices decline as interest rates rose, but the dividend income provided by the longer maturity bonds more than offset the price decline, so total return was still positive. The net effect was that bonds with maturities centered around seven years outperformed the rest of the yield curve. The Fund's concentration of bonds in the seven-year area and an overweight allocation to bonds less than three years, relative to the Intermediate Index, resulted in yield curve positioning providing net excess return to the Fund's performance relative to the Intermediate Index.
SECTOR
Sector selection provided a positive impact on the Fund's performance, relative to the Intermediate Index, during the 12-month reporting period. In particular, overweight positions relative to the benchmark in hospital and industrial development bonds, both outperforming sectors, provided excess return. Similarly, an underweight position in pre-refunded bonds (bonds for which the Annual Shareholder Report
principal and interest payments are secured or guaranteed by cash or U.S. Treasury securities held in an escrow account), which underperformed the Intermediate Index, was also beneficial to the Fund's performance.CREDIT QUALITY
The Fund maintained a high-quality portfolio, with over 90% of the portfolio rated in one of the three highest rating categories (AAA, AA and A) throughout the 12-month reporting period.5,6 According to Barclay's Capital, the best performing bonds during the period were in the A-rated category, followed by AAA and AA-rated bonds. Lower quality tax-exempt municipal bonds saw spreads widen during the period, driving their prices down.
The Fund had a slightly overweight position in BBB-rated bonds and a slightly underweight position in A-rated bonds relative to the Intermediate Index. As a result, credit quality hurt the Fund's performance versus the Intermediate Index.
SECURITY SELECTION
Security-specific factors, notably the credit rating downgrade of a number of insured bonds, had a negative impact on the Fund's performance versus the benchmark. Also, since the Intermediate Index is a national index and the Fund invests only in Michigan-exempt securities, idiosyncratic factors related to the state of Michigan caused variance in the Fund's performance by comparison.
| 1 | S&P Indices changed the name of the Intermediate Index from “S&P/Investortools Municipal Bond Intermediate Index” to “S&P Municipal Bond Intermediate Index.” Please see the footnotes to the line graph under “Fund Performance and Growth of a $10,000 Investment” below for the definition of, and more information about, the Intermediate Index. |
| 2 | Duration is a measure of a security's price sensitivity to changes in interest rates. Securities with longer durations are more sensitive to changes in interest rates than securities with shorter durations. |
| 3 | Bond prices are sensitive to changes in interest rates and a rise in interest rates can cause a decline in their prices. |
| 4 | Income may be subject to the federal alternative minimum tax for individuals or corporations. |
| 5 | Credit ratings pertain only to the securities in the portfolio and do not protect the Fund shares against market risk. |
| 6 | Investment-grade securities and noninvestment-grade securities may either be: (a) rated by a nationally recognized statistical ratings organization or rating agency; or (b) unrated securities that the Fund's investment adviser (“Adviser”) believes are of comparable quality. The rating agencies that provided the ratings for rated securities include Standard & Poor's, Moody's Investor Services, Inc. and Fitch Rating Service. When ratings vary, the highest rating is used. Credit ratings of AA or better are considered to be high credit quality; credit ratings of A are considered high or medium/good quality; and credit ratings of BBB are considered to be medium/good credit quality, and the lowest category of investment-grade securities; credit ratings of BB and below are lower-rated, noninvestment-grade securities or junk bonds; and credit ratings of CCC or below are noninvestment-grade securities that have high default risk. Any credit quality breakdown does not give effect to the impact of any credit derivative investments made by the Fund. Credit ratings are an indication of the risk that a security will default. They do not protect a security from credit risk. Lower rated bonds typically offer higher yields to help compensate investors for the increased risk associated with them. Among these risks are lower creditworthiness, greater price volatility, more risk to principal and income than with higher rated securities and increased possibilities of default. |
Annual Shareholder ReportFUND PERFORMANCE AND GROWTH OF A $10,000 INVESTMENT
The Average Annual Total Return table below shows returns for Class A Shares averaged over the stated periods. The graph below illustrates the hypothetical investment of $10,0001 in Federated Michigan Intermediate Municipal Trust (Class A Shares) (the “Fund”) from August 31, 2001 to August 31, 2011, compared to the S&P Municipal Bond Intermediate Index (Intermediate Index),2 and the S&P Municipal Bond MI, Investment Grade, 3-15 Years Sub-Index (Michigan (3-15) Index).3
Average Annual Total Returns for the Period Ended 8/31/2011
(returns reflect all applicable sales charges as specified below in footnote #1)
| Share Class | 1 Year | 5 Years | 10 Years |
| A | -0.36% | 3.62% | 3.85% |
Performance data quoted represents past performance which is no guarantee of future results. Investment return and principal value will fluctuate so that an investor's shares, when redeemed, may be worth more or less than their original cost. Mutual fund performance changes over time and current performance may be lower or higher than what is stated. For current to the most recent month-end performance and after-tax returns, visit FederatedInvestors.com or call 1-800-341-7400. Returns shown do not reflect the deduction of taxes that a shareholder would pay on Fund distributions or the redemption of Fund shares. Mutual funds are not obligations of or guaranteed by any bank and are not federally insured.
Annual Shareholder Report
Growth of a $10,000 Investment – CLASS A SHARES| Federated Michigan Intermediate Municipal Trust - | Class A Shares | Intermediate Index | Michigan (3-15) Index |
| 8/31/2001 | 9,700 | 10,000 | 10,000 |
| 8/31/2002 | 10,297 | 10,644 | 10,703 |
| 8/31/2003 | 10,665 | 11,015 | 11,124 |
| 8/31/2004 | 11,263 | 11,774 | 11,829 |
| 8/31/2005 | 11,577 | 12,233 | 12,216 |
| 8/31/2006 | 11,847 | 12,584 | 12,552 |
| 8/31/2007 | 12,138 | 12,976 | 12,936 |
| 8/31/2008 | 12,646 | 13,700 | 13,635 |
| 8/31/2009 | 13,113 | 14,597 | 14,380 |
| 8/31/2010 | 14,195 | 16,037 | 15,912 |
| 8/31/2011 | 14,584 | 16,597 | 16,510 |
41 graphic description end -->
- Total returns shown include the maximum sales charge of 3.00% ($10,000 investment minus $300 sales charge = $9,700).
| 1 | Represents a hypothetical investment of $10,000 in the Fund after deducting the maximum sales charge of 3.00% ($10,000 investment minus $300 sales charge = $9,700). The Fund's performance assumes the reinvestment of all dividends and distributions. The Intermediate Index and Michigan (3-15) Index have been adjusted to reflect reinvestment of dividends on securities in the indexes. |
| 2 | S&P Indices changed the name of the Intermediate Index from “S&P/Investortools Municipal Bond Intermediate Index” to “S&P Municipal Bond Intermediate Index.” The Intermediate Index consists of bonds in the S&P Municipal Bond Index (“Main Index”) with a minimum maturity of 3 years and a maximum maturity of up to, but not including, 15 years as measured from the Rebalancing Date of the Main Index. The Main Index is a broad, comprehensive, market value-weighted index composed of approximately 55,000 bond issues that are exempt from U.S. federal income taxes or subject to the alternative minimum tax (AMT). Eligibility criteria for inclusion in the Main Index include, but are not limited to: the bond issuer must be a state (including the Commonwealth of Puerto Rico and U.S. territories) or a local government or a state or local government entity where interest on the bond is exempt from U.S. federal income taxes or subject to the AMT; the bond must be held by a mutual fund for which Standard & Poor's Securities Evaluations, Inc. provides prices; it must be denominated in U.S. dollars and have a minimum par amount of $2 million; and the bond must have a minimum term to maturity and/or call date greater than or equal to one calendar month. The Main Index is rebalanced monthly. The Intermediate Index is not adjusted to reflect sales charges, expenses and other fees that the Securities and Exchange Commission (SEC) requires to be reflected in the Fund's performance. The Intermediate Index is unmanaged and, unlike the Fund, is not affected by cash flows. It is not possible to invest directly in an index. |
| 3 | S&P Indices changed the name of the Michigan (3-15) Index from “S&P/Investortools Municipal Bond MI, Investment Grade, 3-15 Years Sub-Index” to “S&P Municipal Bond MI, Investment Grade, 3-15 Years Sub-Index.” The Michigan (3-15) Index represents, by market weighting, the portion of the Intermediate Index composed solely of bonds issued by the state of Michigan or local governments or state or local government entities within Michigan that are rated BBB-/Baa3 or higher with remaining maturities of between 3 and 15 years. The Michigan (3-15) Index is not adjusted to reflect sales charges, expenses and other fees that the SEC requires to be reflected in the Fund's performance. The Michigan (3-15) Index is unmanaged and, unlike the Fund, is not affected by cash flows. It is not possible to invest directly in an index. |
Annual Shareholder Report Portfolio of Investments Summary Table (unaudited)
At August 31, 2011 the Fund's sector composition1 was as follows:
| Sector Composition | Percentage of
Total Net Assets |
| General Obligation — Local | 26.6% |
| Hospital | 18.4% |
| Education | 9.8% |
| Water Sewer | 8.6% |
| Transportation | 6.7% |
| General Obligation — State | 5.3% |
| Special Tax | 5.2% |
| Industrial Development Bond/Pollution Control Revenue | 4.9% |
| Public Power | 4.4% |
| Pre-refunded | 3.1% |
| Other2 | 5.7% |
| Other Assets and Liabilities — Net3 | 1.3% |
| TOTAL | 100.0% |
| 1 | Sector classifications, and the assignment of holdings to such sectors, are based upon the economic sector and/or revenue source of the underlying obligor, as determined by the Fund's Adviser. For securities that have been enhanced by a third-party, including bond insurers and banks, sector classifications are based upon the economic sector and/or revenue source of the underlying obligor, as determined by the Fund's Adviser. Pre-refunded securities are those whose debt service is paid from escrowed assets, usually U.S. government securities. |
| 2 | For purposes of this table, sector classifications constitute 93.0% of the Fund's total net assets. Remaining sectors have been aggregated under the designation “Other.” |
| 3 | Assets, other than investments in securities, less liabilities. See Statement of Assets and Liabilities. |
Annual Shareholder Report Portfolio of Investments
August 31, 2011
Principal
Amount | | | Value |
| | MUNICIPAL BONDS – 97.2% | |
| | Michigan – 97.2% | |
| $1,300,000 | | Ann Arbor, MI Public School District, School Building & Site UT GO Bonds, 5.00% (National Public Finance Guarantee Corporation INS), 5/1/2019 | 1,428,258 |
| 955,000 | | Ann Arbor, MI, Court and Police Facilities LT GO Capital Improvement Bonds, 4.75%, 5/1/2025 | 1,033,654 |
| 1,125,000 | | Armada, MI Area Schools, School Building & Site UT GO Bonds, 5.00% (National Public Finance Guarantee Corporation INS), 5/1/2021 | 1,226,655 |
| 1,000,000 | | Avondale, MI School District, Refunding UT GO Bonds (Series 2009), 4.50% (Q-SBLF GTD)/(Assured Guaranty Corp. INS), 5/1/2018 | 1,092,960 |
| 1,000,000 | | Battle Creek, MI School District, School Building & Site UT GO Bonds, 5.00% (Assured Guaranty Municipal Corp. INS), 5/1/2022 | 1,084,150 |
| 725,000 | | Berkley, MI School District, Refunding UT GO Bonds (Series 2009), 5.00% (Q-SBLF GTD)/(Assured Guaranty Corp. INS), 5/1/2019 | 827,885 |
| 1,690,000 | | Bishop, MI International Airport Authority, 4.50% (Assured Guaranty Municipal Corp. INS), 12/1/2023 | 1,772,303 |
| 1,000,000 | | Brandon School District, MI, UT GO School Building and Site Bonds, 5.00% (Assured Guaranty Municipal Corp. INS), 5/1/2019 | 1,098,660 |
| 1,215,000 | | Bridgeport Spaulding, MI Community School District, UT GO Bonds, 5.50% (United States Treasury PRF 5/1/2012@100), 5/1/2015 | 1,257,914 |
| 100,000 | | Canton Charter Township, MI, LT GO Bonds, 5.00% (Assured Guaranty Municipal Corp. INS), 4/1/2014 | 109,919 |
| 1,000,000 | | Central Michigan University Board of Trustees, General Revenue Refunding Bonds (Series 2009), 5.00%, 10/1/2023 | 1,098,140 |
| 500,000 | | Chippewa Valley, MI Schools, UT GO Refunding Bonds, 5.00% (Q-SBLF GTD)/(Assured Guaranty Municipal Corp. INS), 5/1/2014 | 552,730 |
| 570,000 | | Coldwater, MI Electric Utility, Revenue Refunding Bonds, 4.50% (Syncora Guarantee, Inc. INS), 8/1/2013 | 599,862 |
| 1,250,000 | | Coopersville, MI Public Schools, School Building & Site UT GO Bonds, 5.00% (Assured Guaranty Municipal Corp. INS), 5/1/2022 | 1,338,025 |
| 1,500,000 | | Detroit, MI Sewage Disposal System, Revenue Refunding Bonds, 5.50% (National Public Finance Guarantee Corporation INS), 7/1/2016 | 1,676,790 |
| 1,000,000 | | Detroit, MI Water Supply System, Revenue Bonds Series A, 5.00% (Assured Guaranty Municipal Corp. INS), 7/1/2015 | 1,110,150 |
| 1,000,000 | | Detroit, MI Water Supply System, Senior Lien Revenue Bonds (Series 2005-B), 5.50% (Berkshire Hathaway Assurance Corp. INS), 7/1/2020 | 1,121,210 |
| 2,000,000 | | Detroit, MI Water Supply System, Senior Lien Revenue Bonds (Series 2006A), 5.00% (Assured Guaranty Municipal Corp. INS), 7/1/2018 | 2,146,960 |
| 2,000,000 | | Dickinson County, MI Economic Development Corp., Refunding PCRBs (Series 2004A), 4.80% (International Paper Co.), 11/1/2018 | 2,063,020 |
Annual Shareholder ReportPrincipal
Amount | | | Value |
| $1,000,000 | | Eastern Michigan University Board of Regents, General Revenue Bonds (Series 2009C), 5.00% (Assured Guaranty Corp. INS)/(Q-SBLF GTD), 2/15/2023 | 1,094,920 |
| 250,000 | | Essexville-Hampton, MI Public Schools, UT GO Refunding Bonds, 4.00% (Assured Guaranty Municipal Corp. INS), 5/1/2014 | 263,518 |
| 1,000,000 | | Ferris State University, MI, General Revenue Bonds (Series 2009), 5.00% (Assured Guaranty Corp. INS), 10/1/2020 | 1,125,390 |
| 2,000,000 | | Jackson County, MI Hospital Finance Authority, Hospital Revenue Refunding Bonds (Series 2006C), 5.00% (Allegiance Health)/(Assured Guaranty Corp. INS), 6/1/2026 | 2,094,520 |
| 1,000,000 | | Jenison, MI Public Schools, School Building & Site Bonds (Series 2011B), 5.00%, 5/1/2021 | 1,134,720 |
| 2,130,000 | | Kalamazoo, MI Hospital Finance Authority, Hospital Revenue Bonds (Series 2006), 5.00% (Bronson Methodist Hospital)/(Assured Guaranty Municipal Corp. INS), 5/15/2019 | 2,411,032 |
| 1,000,000 | | Kalamazoo, MI Public Schools, Refunding Building & Site UT GO Bonds, 5.00% (Assured Guaranty Municipal Corp. INS), 5/1/2018 | 1,118,980 |
| 1,000,000 | | Kalamazoo, MI Regional Educational Services Agency, UT GO School Building and Site Bonds, 5.00%, 5/1/2019 | 1,137,270 |
| 450,000 | | Kalamazoo, MI Water Revenue, Revenue Refunding Bonds, 5.00% (AMBAC INS), 9/1/2014 | 502,502 |
| 510,000 | | Kalamazoo, MI Water Revenue, Revenue Refunding Bonds, 5.00% (AMBAC INS), 9/1/2015 | 584,394 |
| 1,785,000 | | Kent County, MI Airport Revenue, LT GO Airport Revenue Bonds (Series 2007), 5.00% (Gerald R. Ford International Airport), 1/1/2021 | 1,937,671 |
| 1,345,000 | | Kent County, MI, Capital Improvement LT GO Bonds (Series 2004A), 5.00%, 12/1/2020 | 1,486,978 |
| 1,750,000 | | Kent County, MI, LT GO Bonds (Series 2009), 5.00%, 1/1/2025 | 1,908,953 |
| 1,500,000 | | Kent Hospital Finance Authority, MI, Revenue Refunding Bonds (Series 2011A), 5.00% (Spectrum Health), 11/15/2022 | 1,645,425 |
| 1,000,000 | | Lake Superior State University, MI, General Revenue Bonds, 5.50% (AMBAC INS), 11/15/2021 | 1,003,620 |
| 1,900,000 | | Lansing, MI Board of Water & Light, Utility System Revenue Bonds (Series 2011A), 5.00%, 7/1/2024 | 2,111,888 |
| 1,000,000 | | Lansing, MI School District, Refunding School Building & Site UT GO Bonds, 5.00% (Q-SBLF GTD), 5/1/2020 | 1,079,400 |
| 1,200,000 | | Marysville, MI Public School District, School Building & Site UT GO Bonds (Series 2007), 5.00% (Assured Guaranty Municipal Corp. INS), 5/1/2022 | 1,300,980 |
| 1,000,000 | | Michigan Municipal Bond Authority, Revenue Bonds (Series 2005B), 5.00% (Detroit, MI City School District)/(Assured Guaranty Municipal Corp. INS), 6/1/2015 | 1,085,600 |
| 1,000,000 | | Michigan Municipal Bond Authority, Revenue Bonds (Series 2007B), 5.00% (AMBAC INS), 12/1/2013 | 1,033,230 |
Annual Shareholder ReportPrincipal
Amount | | | Value |
| $1,525,000 | | Michigan Municipal Bond Authority, Revenue Bonds, 5.00% (Clean Water Revolving Fund), 10/1/2017 | 1,843,572 |
| 1,000,000 | | Michigan Public Power Agency, Combustion Turbine No. 1 Project Refunding Revenue Bonds (Series 2011A), 5.00% (Assured Guaranty Municipal Corp. INS), 1/1/2022 | 1,113,450 |
| 945,000 | | Michigan State Building Authority, Facilities Program Refunding Revenue Bonds (Series 2001I) , 5.50% (United States Treasury PRF 10/15/2011@100), 10/15/2019 | 951,114 |
| 55,000 | | Michigan State Building Authority, Facilities Program Refunding Revenue Bonds (Series 2001I), 5.50% (United States Treasury PRF 10/15/2011@100), 10/15/2019 | 55,356 |
| 1,000,000 | | Michigan State Building Authority, Facilities Program Revenue Bonds (Series 2009II), 5.00% (Assured Guaranty Corp. INS), 10/15/2022 | 1,113,210 |
| 1,000,000 | | Michigan State Building Authority, Revenue Refunding Bonds (Series 2009I), 5.25% (Assured Guaranty Corp. INS), 10/15/2024 | 1,107,180 |
| 1,000,000 | | Michigan State Building Authority, Revenue Refunding Bonds (Series I), 5.00% TOBs (United States Treasury PRF), Mandatory Tender (AMBAC Assurance Corporation INS), 10/15/2011 | 1,005,860 |
| 2,000,000 | | Michigan State Comprehensive Transportation Fund, Refunding Bonds (Series 2009), 5.25%, 5/15/2019 | 2,349,540 |
| 1,000,000 | | Michigan State Department of Transportation, Grant Anticipation Bonds, 4.25% (Assured Guaranty Municipal Corp. INS), 9/15/2012 | 1,037,840 |
| 2,485,000 | | Michigan State Department of Transportation, Grant Anticipation Bonds, 5.25% (Assured Guaranty Municipal Corp. INS), 9/15/2021 | 2,787,623 |
| 1,970,000 | | Michigan State Financial Authority, Revenue Bonds (Series 2006A), 5.00% (Trinity Healthcare Credit Group), 12/1/2026 | 2,024,746 |
| 1,275,000 | | Michigan State Hospital Finance Authority, Hospital Revenue & Refunding Bonds (Series 2007A), 5.00% (Oakwood Obligated Group), 7/15/2018 | 1,367,208 |
| 1,000,000 | | Michigan State Hospital Finance Authority, Hospital Revenue and Refunding Bonds (Series 2006A), 5.00% (Henry Ford Health System, MI), 11/15/2021 | 1,046,280 |
| 1,000,000 | | Michigan State Hospital Finance Authority, Hospital Revenue Bonds (Series 2006A), 5.00% (MidMichigan Obligated Group), 4/15/2026 | 1,005,680 |
| 1,300,000 | | Michigan State Hospital Finance Authority, Refunding Revenue Bonds (Series 2002A), 5.50% (Crittenton Hospital Medical Center), 3/1/2016 | 1,328,093 |
| 1,000,000 | | Michigan State Hospital Finance Authority, Refunding Revenue Bonds (Series 2010 F-3), 2.625% TOBs (Ascension Health Credit Group), Mandatory Tender 6/30/2014 | 1,045,850 |
| 750,000 | | Michigan State Hospital Finance Authority, Refunding Revenue Bonds, 5.00% (Sparrow Obligated Group, MI), 11/15/2022 | 779,858 |
| 690,000 | | Michigan State Hospital Finance Authority, Revenue Bonds (Series 1993P), 5.375% (Sisters of Mercy Health System)/(United States Treasury COL)/(Original Issue Yield: 5.55%)/(National Public Finance Guarantee Corporation INS), 8/15/2014 | 741,929 |
Annual Shareholder ReportPrincipal
Amount | | | Value |
| $2,000,000 | | Michigan State Hospital Finance Authority, Revenue Bonds (Series 2005C), 5.00% (McLaren Health Care Corp.), 8/1/2020 | 2,104,000 |
| 2,000,000 | | Michigan State Hospital Finance Authority, Revenue Bonds (Series 2010B), 5.00% (Ascension Health Credit Group), 11/15/2024 | 2,150,200 |
| 250,000 | | Michigan State Hospital Finance Authority, Revenue Refunding Bonds (Series A), 5.00% (Henry Ford Health System, MI), 11/15/2014 | 271,405 |
| 500,000 | | Michigan State Hospital Finance Authority, Revenue Refunding Bonds (Series A), 5.00% (Henry Ford Health System, MI), 11/15/2025 | 502,145 |
| 1,000,000 | | Michigan State Hospital Finance Authority, Revenue Refunding Bonds (Series A), 5.00% (Oakwood Obligated Group), 7/15/2025 | 999,250 |
| 250,000 | | Michigan State Hospital Finance Authority, Revenue Refunding Bonds, 5.00% (Sparrow Obligated Group, MI), 11/15/2012 | 259,905 |
| 450,000 | | Michigan State Hospital Financial Authority, Revenue Bonds (Series A), 4.15% (Holland Community Hospital), 1/1/2012 | 454,167 |
| 2,000,000 | | Michigan State Housing Development Authority, MFH Revenue Bonds (Series 2010A), 4.375%, 10/1/2025 | 2,023,120 |
| 195,000 | | Michigan State Housing Development Authority, MFH Revenue Bonds (Series B), 4.00% (Assured Guaranty Municipal Corp. INS), 10/1/2012 | 198,438 |
| 145,000 | | Michigan State Housing Development Authority, MFH Revenue Bonds (Series B), 4.00% (Assured Guaranty Municipal Corp. INS)/(Go of Authority LOC), 4/1/2012 | 146,570 |
| 210,000 | | Michigan State Housing Development Authority, MFH Revenue Bonds (Series B), 4.05% (Assured Guaranty Municipal Corp. INS), 10/1/2013 | 215,250 |
| 100,000 | | Michigan State Housing Development Authority, MFH Revenue Bonds (Series B), 4.05% (Assured Guaranty Municipal Corp. INS), 4/1/2013 | 101,991 |
| 500,000 | | Michigan State South Central Power Agency, Power Supply Revenue Refunding Bonds, 4.50% (AMBAC INS), 11/1/2011 | 503,220 |
| 1,000,000 | | Michigan State Strategic Fund, Ltd Obligation Refunding Revenue Bonds, 7.00% (Detroit Edison Co.)/(AMBAC INS), 5/1/2021 | 1,263,650 |
| 820,000 | | Michigan State Strategic Fund, Revenue Bonds (Series 2004), 5.00% (NSF International), 8/1/2013 | 857,802 |
| 2,000,000 | | Michigan State Strategic Fund, Revenue Bonds, 4.25% TOBs (Republic Services, Inc.), Mandatory Tender 4/1/2014 | 2,032,980 |
| 130,000 | | Michigan State Strategic Fund, Revenue Bonds, 5.30% (Porter Hills Presbyterian Village, Inc.)/(Original Issue Yield: 5.422%), 7/1/2018 | 130,069 |
| 1,000,000 | | Michigan State Strategic Fund, Solid Disposal LT Obligation Refunding Revenue Bonds (Series 2002), 4.625% (Waste Management, Inc.), 12/1/2012 | 1,036,760 |
| 2,600,000 | | Michigan State Trunk Line, Refunding Revenue Bonds (Series 2009), 5.00%, 11/1/2020 | 3,018,600 |
| 1,000,000 | | Michigan State Trunk Line, Revenue Bonds, 5.00% (FGIC and National Public Finance Guarantee Corporation INS), 11/1/2014 | 1,122,960 |
| 1,000,000 | | Michigan State Trunk Line, Revenue Bonds, 5.00% (National Public Finance Guarantee Corporation INS), 9/1/2014 | 1,119,820 |
Annual Shareholder ReportPrincipal
Amount | | | Value |
| $2,000,000 | | Michigan State, Environmental Program & Refunding UT GO Bonds (Series 2008A), 5.00%, 5/1/2016 | 2,313,340 |
| 1,000,000 | | Michigan Strategic Fund, LT Obligation Refunding Revenue Bonds (Series 2008ET-2), 5.50% TOBs (Detroit Edison Co.), Mandatory Tender 8/1/2016 | 1,152,060 |
| 1,000,000 | | Michigan Strategic Fund, LT Obligation Revenue Bonds (Series 2011), 5.25% (Michigan State), 10/15/2022 | 1,114,540 |
| 2,000,000 | | Michigan Technological University Board of Control, General Revenue & Revenue Refunding Bonds (Series 2008), 5.25% (Assured Guaranty Corp. INS), 10/1/2018 | 2,334,480 |
| 75,000 | | Mount Clemens, MI Community School District, UT GO Bonds, 5.50% (United States Treasury PRF 11/1/2011@100), 5/1/2012 | 75,661 |
| 500,000 | | Northview Michigan Public School District, Refunding UT GO Bonds, 5.00% (Assured Guaranty Municipal Corp. INS), 5/1/2019 | 568,635 |
| 1,000,000 | | Oakland County, MI EDC, Revenue Refunding Bonds, 4.00% (Cranbrook Educational Community), 11/1/2021 | 1,045,380 |
| 525,000 | | Ovid Elsie, MI Area Schools, UT GO Refunding Bonds, 4.00% (Q-SBLF GTD)/(Assured Guaranty Municipal Corp. INS), 5/1/2015 | 570,355 |
| 1,000,000 | | Regents of University of Michigan, General Revenue Bonds (Series 2010C), 4.00%, 4/1/2022 | 1,093,370 |
| 550,000 | | Rochester Hills, MI, Refunding UT GO Bonds (Series 2010), 4.50%, 4/1/2021 | 615,340 |
| 1,130,000 | | Romulus, MI Tax Increment Finance Authority, Recreation Center LT GO Bonds, 5.00% (Assured Guaranty Municipal Corp. INS), 11/1/2022 | 1,208,490 |
| 1,100,000 | | Roseville, MI Community Schools, School Building & Site Refunding UT GO Bonds, 5.00% (Assured Guaranty Municipal Corp. INS), 5/1/2021 | 1,187,626 |
| 1,670,000 | | Saginaw County, MI Water Supply System, Revenue Bonds (Series 2011A), 4.75% (Assured Guaranty Municipal Corp. INS), 7/1/2025 | 1,753,500 |
| 1,500,000 | | Saginaw, MI Hospital Finance Authority, Hospital Revenue Refunding Bonds (Series 2010H), 5.00% (Covenant Medical Center, Inc.)/(Original Issue Yield: 5.07%), 7/1/2030 | 1,419,330 |
| 675,000 | | South Lyon, MI Community School District, UT GO Bonds (Series II), 5.25% (United States Treasury PRF 5/1/2014@100), 5/1/2018 | 761,359 |
| 1,130,000 | | Taylor, MI Building Authority, Refunding LT GO Bonds, 5.00% (National Public Finance Guarantee Corporation INS), 12/1/2015 | 1,190,760 |
| 1,350,000 | | Thornapple Kellogg, MI School District, School Building & Site Refunding UT GO Bonds, 5.00% (National Public Finance Guarantee Corporation INS), 5/1/2022 | 1,463,602 |
| 500,000 | | Utica, MI Community Schools, School Building and Site Refunding UT GO Bonds, 5.00% (National Public Finance Guarantee Corporation INS), 5/1/2017 | 578,720 |
| 750,000 | | Warren, MI Consolidated School District, UT GO Refunding Bonds, 5.00% (Assured Guaranty Municipal Corp. INS), 5/1/2016 | 867,615 |
Annual Shareholder ReportPrincipal
Amount | | | Value |
| $2,000,000 | | Wayne County, MI Airport Authority, Airport Revenue Refunding Bonds (Series 2010C), 5.00%, 12/1/2021 | 2,135,540 |
| 2,000,000 | | Wayne State University, MI, General Revenue Refunding Bonds (Series 2008), 5.00% (Assured Guaranty Municipal Corp. INS), 11/15/2019 | 2,276,280 |
| 1,000,000 | | Western Michigan University, General Revenue Refunding Bonds (Series 2009), 5.25% (Assured Guaranty Corp. INS), 11/15/2019 | 1,154,310 |
| 25,000 | | Whitehall, MI District Schools, UT GO Bonds, 5.50% (United States Treasury PRF 11/1/2011@100), 5/1/2016 | 25,223 |
| 600,000 | | Wyandotte, MI Electric Authority, Revenue Bonds (Series A), 4.50% (National Public Finance Guarantee Corporation INS), 10/1/2011 | 601,956 |
| 600,000 | | Wyandotte, MI Electric Authority, Revenue Bonds (Series A), 5.00% (National Public Finance Guarantee Corporation INS), 10/1/2012 | 627,924 |
| 1,000,000 | | Ypsilanti, MI School District, UT GO Bonds, 5.00% (National Public Finance Guarantee Corporation INS), 5/1/2023 | 1,056,120 |
| | TOTAL MUNICIPAL BONDS
(IDENTIFIED COST $115,713,885) | 121,108,443 |
| | SHORT-TERM MUNICIPALS – 1.5%1 | |
| | Michigan – 1.5% | |
| 1,800,000 | | Michigan State Hospital Finance Authority, (Series 1999 A) Weekly VRDNs (Covenant Retirement Communities, Inc.)/(Bank of America N.A. LOC), 0.190%, 9/1/2011 | 1,800,000 |
| 100,000 | | Michigan Strategic Fund, (Series 2010) Weekly VRDNs (CS Facilities LLC)/(Fifth Third Bank, Cincinnati LOC), 0.380%, 9/1/2011 | 100,000 |
| | TOTAL SHORT-TERM MUNICIPALS
(AT AMORTIZED COST) | 1,900,000 |
| | TOTAL MUNICIPAL INVESTMENTS — 98.7%
(IDENTIFIED COST $117,613,885)2 | 123,008,443 |
| | OTHER ASSETS AND LIABILITIES - NET — 1.3%3 | 1,618,016 |
| | TOTAL NET ASSETS — 100% | $124,626,459 |
Securities that are subject to the federal alternative minimum tax (AMT) represent 4.5% of the Fund's portfolio as calculated based upon total market value (percentage is unaudited).
| 1 | Current rate and next reset date shown for Variable Rate Demand Notes. |
| 2 | The cost of investments for federal tax purposes amounts to $117,611,005. |
| 3 | Assets, other than investments in securities, less liabilities. See Statement of Assets and Liabilities. |
Note: The categories of investments are shown as a percentage of total net assets at August 31, 2011.
Annual Shareholder Report
Various inputs are used in determining the value of the Fund's investments. These inputs are summarized in the three broad levels listed below:Level 1 — quoted prices in active markets for identical securities, including investment companies with daily net asset values, if applicable.
Level 2 — other significant observable inputs (including quoted prices for similar securities, interest rates, prepayment speeds, credit risk, etc.). Also includes securities valued at amortized cost.
Level 3 — significant unobservable inputs (including the Fund's own assumptions in determining the fair value of investments).
The inputs or methodology used for valuing securities are not an indication of the risk associated with investing in those securities.
As of August 31, 2011, all investments of the Fund utilized Level 2 inputs in valuing the Fund's assets carried at fair value.
The following acronyms are used throughout this portfolio:
| AMBAC | — American Municipal Bond Assurance Corporation |
| COL | — Collateralized |
| EDC | — Economic Development Commission |
| FGIC | — Financial Guaranty Insurance Company |
| GO | — General Obligation |
| GTD | — Guaranteed |
| INS | — Insured |
| LOC | — Letter of Credit |
| LT | — Limited Tax |
| MFH | — Multi-Family Housing |
| PCRBs | — Pollution Control Revenue Bonds |
| PRF | — Prerefunded |
| Q-SBLF | — Qualified School Bond Loan Fund |
| TOBs | — Tender Option Bonds |
| UT | — Unlimited Tax |
| VRDNs | — Variable Rate Demand Notes |
See Notes which are an integral part of the Financial Statements
Annual Shareholder Report Financial Highlights – Class A Shares
(For a Share Outstanding Throughout Each Period)
| Year Ended August 31 | 2011 | 2010 | 2009 | 2008 | 2007 |
| Net Asset Value, Beginning of Period | $11.27 | $10.80 | $10.84 | $10.84 | $11.03 |
| Income From Investment Operations: | | | | | |
| Net investment income | 0.39 | 0.40 | 0.42 | 0.45 | 0.46 |
| Net realized gain (loss) on investments and futures contracts | (0.10) | 0.47 | (0.04) | (0.00)1 | (0.19) |
| TOTAL FROM INVESTMENT OPERATIONS | 0.29 | 0.87 | 0.38 | 0.45 | 0.27 |
| Less Distributions: | | | | | |
| Distributions from net investment income | (0.39) | (0.40) | (0.42) | (0.45) | (0.46) |
| Net Asset Value, End of Period | $11.17 | $11.27 | $10.80 | $10.84 | $10.84 |
| Total Return2 | 2.74% | 8.25% | 3.69% | 4.19% | 2.49% |
| Ratios to Average Net Assets: | | | | | |
| Net expenses | 0.54% | 0.54% | 0.54% | 0.53% | 0.50% |
| Net investment income | 3.60% | 3.66% | 3.98% | 4.10% | 4.21% |
| Expense waiver3 | 0.38% | 0.35% | 0.31% | 0.32% | 0.34% |
| Supplemental Data: | | | | | |
| Net assets, end of period (000 omitted) | $124,626 | $160,614 | $164,536 | $155,117 | $151,877 |
| Portfolio turnover | 16% | 21% | 12% | 13% | 17% |
| 1 | Represents less than $0.01. |
| 2 | Based on net asset value, which does not reflect the sales charge, redemption fee or contingent deferred sales charge, if applicable. |
| 3 | This expense decrease is reflected in both the net expense and net investment income ratios shown above. |
See Notes which are an integral part of the Financial Statements
Annual Shareholder Report Statement of Assets and Liabilities
August 31, 2011
| Assets: | | |
| Total investments in securities, at value (identified cost $117,613,885) | | $123,008,443 |
| Cash | | 20,803 |
| Income receivable | | 1,642,887 |
| Receivable for investments sold | | 1,360,000 |
| Receivable for shares sold | | 114,707 |
| TOTAL ASSETS | | 126,146,840 |
| Liabilities: | | |
| Payable for investments purchased | $1,112,500 | |
| Income distribution payable | 188,807 | |
| Payable for shares redeemed | 144,116 | |
| Payable for shareholder services fee (Note 5) | 23,155 | |
| Payable for account administration fee | 1,837 | |
| Payable for Directors'/Trustees' fees | 323 | |
| Accrued expenses | 49,643 | |
| TOTAL LIABILITIES | | 1,520,381 |
| Net assets for 11,161,339 shares outstanding | | $124,626,459 |
| Net Assets Consist of: | | |
| Paid-in capital | | $119,368,027 |
| Net unrealized appreciation of investments | | 5,394,558 |
| Accumulated net realized loss on investments | | (136,918) |
| Undistributed net investment income | | 792 |
| TOTAL NET ASSETS | | $124,626,459 |
| Net Asset Value, Offering Price and Redemption Proceeds Per Share: | | |
| Net asset value per share ($124,626,459 ÷ 11,161,339 shares outstanding), no par value, unlimited shares authorized | | $11.17 |
| Offering price per share (100/97.00 of $11.17) | | $11.52 |
| Redemption proceeds per share | | $11.17 |
See Notes which are an integral part of the Financial Statements
Annual Shareholder Report Statement of Operations
Year Ended August 31, 2011
| Investment Income: | | | |
| Interest | | | $5,600,481 |
| Expenses: | | | |
| Investment adviser fee (Note 5) | | $540,970 | |
| Administrative fee (Note 5) | | 150,000 | |
| Custodian fees | | 12,875 | |
| Transfer and dividend disbursing agent fees and expenses | | 33,361 | |
| Directors'/Trustees' fees | | 4,065 | |
| Auditing fees | | 20,548 | |
| Legal fees | | 7,661 | |
| Portfolio accounting fees | | 96,696 | |
| Shareholder services fee (Note 5) | | 301,941 | |
| Account administration fee | | 25,415 | |
| Share registration costs | | 26,941 | |
| Printing and postage | | 20,709 | |
| Insurance premiums | | 4,464 | |
| Miscellaneous | | 2,415 | |
| TOTAL EXPENSES | | 1,248,061 | |
| Waivers (Note 5): | | | |
| Waiver of investment adviser fee | $(487,479) | | |
| Waiver of administrative fee | (23,646) | | |
| TOTAL WAIVERS | | (511,125) | |
| Net expenses | | | 736,936 |
| Net investment income | | | 4,863,545 |
| Realized and Unrealized Gain (Loss) on Investments: | | | |
| Net realized gain on investments | | | 955,944 |
| Net change in unrealized depreciation of investments | | | (3,291,917) |
| Net realized and unrealized loss on investments | | | (2,335,973) |
| Change in net assets resulting from operations | | | $2,527,572 |
See Notes which are an integral part of the Financial Statements
Annual Shareholder Report Statement of Changes in Net Assets
| Year Ended August 31 | 2011 | 2010 |
| Increase (Decrease) in Net Assets | | |
| Operations: | | |
| Net investment income | $4,863,545 | $5,962,690 |
| Net realized gain on investments | 955,944 | 975,763 |
| Net change in unrealized appreciation/depreciation of investments | (3,291,917) | 5,999,550 |
| CHANGE IN NET ASSETS RESULTING FROM OPERATIONS | 2,527,572 | 12,938,003 |
| Distributions to Shareholders: | | |
| Distributions from net investment income | (4,860,756) | (5,986,764) |
| Share Transactions: | | |
| Proceeds from sale of shares | 22,585,441 | 31,531,607 |
| Net asset value of shares issued to shareholders in payment of distributions declared | 2,195,813 | 2,616,977 |
| Cost of shares redeemed | (58,435,862) | (45,021,397) |
| CHANGE IN NET ASSETS RESULTING FROM SHARE TRANSACTIONS | (33,654,608) | (10,872,813) |
| Change in net assets | (35,987,792) | (3,921,574) |
| Net Assets: | | |
| Beginning of period | 160,614,251 | 164,535,825 |
| End of period (including undistributed net investment income of $792 and $62, respectively) | $124,626,459 | $160,614,251 |
See Notes which are an integral part of the Financial Statements
Annual Shareholder Report Notes to Financial Statements
August 31, 2011
1. Organization
Federated Municipal Securities Income Trust (the “Trust”) is registered under the Investment Company Act of 1940, as amended (the “Act”), as an open-end management investment company. The Trust consists of five portfolios. The financial statements included herein are only those of Federated Michigan Intermediate Municipal Trust (the “Fund”), a non-diversified portfolio. The financial statements of the other portfolios are presented separately. The assets of each portfolio are segregated and a shareholder's interest is limited to the portfolio in which shares are held. Each portfolio pays its own expenses. The Fund offers one class of shares: Class A Shares. The investment objective of the Fund is to provide current income exempt from federal regular income tax and the personal income taxes imposed by the state of Michigan and Michigan municipalities. Interest income from the Fund's investments may be subject to the federal alternative minimum tax (AMT) for individuals and corporations.
2. Significant Accounting Policies
The following is a summary of significant accounting policies consistently followed by the Fund in the preparation of its financial statements. These policies are in conformity with U.S. generally accepted accounting principles (GAAP).
Investment Valuation
In calculating its net asset value (NAV), the Fund generally values investments as follows:
- Fixed-income securities acquired with remaining maturities greater than 60 days are fair valued using price evaluations provided by a pricing service approved by the Fund's Board of Trustees (the “Trustees”).
- Fixed-income securities acquired with remaining maturities of 60 days or less are valued at their cost (adjusted for the accretion of any discount or amortization of any premium), which approximates market value.
- Derivative contracts listed on exchanges are valued at their reported settlement or closing price.
- Over-the-counter (OTC) derivative contracts are fair valued using price evaluations provided by a pricing service approved by the Trustees.
- Shares of other mutual funds are valued based upon their reported NAVs.
- For securities that are fair valued in accordance with procedures established by and under the general supervision of the Trustees, certain factors may be considered such as: the purchase price of the security, information obtained by contacting the issuer, analysis of the issuer's financial statements or other available documents, fundamental analytical data, the nature and duration of restrictions on disposition, the movement of the market in which the security is normally traded and public trading in similar securities of the issuer or comparable issuers.
If the Fund cannot obtain a price or price evaluation from a pricing service for an investment, the Fund may attempt to value the investment based upon the mean of bid and asked quotations or fair value the investment based on price evaluations, from one or more dealers. If any price, quotation, price evaluation or other pricing source is not readily available when the NAV is calculated, the Fund uses the fair value of the investment determined in accordance with the procedures described below. There can be no assurance that the Fund could purchase or sell an investment at the price used to calculate the Fund's NAV.
Annual Shareholder Report
Fair Valuation and Significant Events ProceduresThe Trustees have authorized the use of pricing services to provide evaluations of the current fair value of certain investments for purposes of calculating the NAV. Factors considered by pricing services in evaluating an investment include the yields or prices of investments of comparable quality, coupon, maturity, call rights and other potential prepayments, terms and type, reported transactions, indications as to values from dealers and general market conditions. Some pricing services provide a single price evaluation reflecting the bid-side of the market for an investment (a “bid” evaluation). Other pricing services offer both bid evaluations and price evaluations indicative of a price between the prices bid and asked for the investment (a “mid” evaluation). The Fund normally uses bid evaluations for U.S. Treasury and Agency securities, mortgage-backed securities and municipal securities. The Fund normally uses mid evaluations for other types of fixed-income securities and OTC derivative contracts. In the event that market quotations and price evaluations are not available for an investment, the fair value of the investment is determined in accordance with procedures adopted by the Trustees.
The Trustees also have adopted procedures requiring an investment to be priced at its fair value whenever the Adviser determines that a significant event affecting the value of the investment has occurred between the time as of which the price of the investment would otherwise be determined and the time as of which the NAV is computed. An event is considered significant if there is both an affirmative expectation that the investment's value will change in response to the event and a reasonable basis for quantifying the resulting change in value. Examples of significant events that may occur after the close of the principal market on which a security is traded, or after the time of a price evaluation provided by a pricing service or a dealer, include:
- With respect to price evaluations of fixed-income securities determined before the close of regular trading on the NYSE, actions by the Federal Reserve Open Market Committee and other significant trends in U.S. fixed-income markets;
- Political or other developments affecting the economy or markets in which an issuer conducts its operations or its securities are traded; and
- Announcements concerning matters such as acquisitions, recapitalizations, litigation developments, a natural disaster affecting the issuer's operations or regulatory changes or market developments affecting the issuer's industry.
The Fund may seek to obtain more current quotations or price evaluations from alternative pricing sources. If a reliable alternative pricing source is not available, the Fund will determine the fair value of the investment using another method approved by the Trustees.
Investment Income, Gains and Losses, Expenses and Distributions
Investment transactions are accounted for on a trade-date basis. Realized gains and losses from investment transactions are recorded on an identified-cost basis. Interest income and expenses are accrued daily. Distributions to shareholders are recorded on the ex-dividend date. Distributions of net investment income are declared daily and paid monthly. Non-cash dividends included in dividend income, if any, are recorded at fair value.
Premium and Discount Amortization
All premiums and discounts on fixed-income securities are amortized/accreted using the effective interest rate method.
Annual Shareholder Report
Federal TaxesIt is the Fund's policy to comply with the Subchapter M provision of the Internal Revenue Code and to distribute to shareholders each year substantially all of its income. Accordingly, no provision for federal income tax is necessary. As of and during the year ended August 31, 2011, the Fund did not have a liability for any uncertain tax positions. The Fund recognizes interest and penalties, if any, related to tax liabilities as income tax expense in the Statement of Operations. As of August 31, 2011, tax years 2008 through 2011 remain subject to examination by the Fund's major tax jurisdictions, which include the United States of America and the Commonwealth of Massachusetts.
When-Issued and Delayed Delivery Transactions
The Fund may engage in when-issued or delayed delivery transactions. The Fund records when-issued securities on the trade date and maintains security positions such that sufficient liquid assets will be available to make payment for the securities purchased. Securities purchased on a when-issued or delayed delivery basis are marked to market daily and begin earning interest on the settlement date. Losses may occur on these transactions due to changes in market conditions or the failure of counterparties to perform under the contract.
Other
The preparation of financial statements in conformity with GAAP requires management to make estimates and assumptions that affect the amounts of assets, liabilities, expenses and revenues reported in the financial statements. Actual results could differ from those estimated.
3. Shares of Beneficial Interest
The following table summarizes share activity:
| Year Ended August 31 | 2011 | 2010 |
| Shares sold | 2,063,500 | 2,883,620 |
| Shares issued to shareholders in payment of distributions declared | 201,206 | 238,946 |
| Shares redeemed | (5,349,893) | (4,113,505) |
| NET CHANGE RESULTING FROM FUND SHARE TRANSACTIONS | (3,085,187) | (990,939) |
4. Federal Tax Information
The timing and character of income and capital gain distributions are determined in accordance with income tax regulations, which may differ from GAAP. These differences are due to differing treatments for discount accretion/premium amortization on debt securities.
For the year ended August 31, 2011, permanent differences identified and reclassified among the components of net assets were as follows:
| Increase (Decrease) |
Undistributed
Net Investment
Income (Loss) | Accumulated
Net Realized
Gain (Loss) |
| $(2,059) | $2,059 |
Net investment income (loss), net realized gains (losses) and net assets were not affected by this reclassification.
Annual Shareholder Report
The tax character of distributions as reported on the Statement of Changes in Net Assets for the years ended August 31, 2011 and 2010, was as follows: | 2011 | 2010 |
| Tax-exempt income | $4,860,756 | $5,986,764 |
As of August 31, 2011, the components of distributable earnings on a tax basis were as follows:
| Undistributed tax-exempt income | $792 |
| Net unrealized appreciation | $5,397,438 |
| Capital loss carryforwards | $(139,798) |
The difference between book-basis and tax-basis net unrealized appreciation/depreciation is attributable to differing treatments for discount accretion/premium amortization on debt securities.
At August 31, 2011, the cost of investments for federal tax purposes was $117,611,005. The net unrealized appreciation of investments for federal tax purposes was $5,397,438. This consists of net unrealized appreciation from investments for those securities having an excess of value over cost of $5,543,818 and net unrealized depreciation from investments for those securities having an excess of cost over value of $146,380.
At August 31, 2011, the Fund had a capital loss carryforward of $139,798 which will reduce the Fund's taxable income arising from future net realized gains on investments, if any, to the extent permitted by the Code and thus will reduce the amount of distributions to shareholders which would otherwise be necessary to relieve the Fund of any liability for federal income tax. Pursuant to the Code, such capital loss carryforward will expire as follows:
| Expiration Year | Expiration Amount |
| 2014 | $60,257 |
| 2016 | $10,927 |
| 2017 | $68,614 |
Under the recently enacted Regulated Investment Company Modernization Act of 2010, the Fund will be permitted to carry forward capital losses incurred in taxable years beginning after December 22, 2010, for an unlimited period. However, any losses incurred during those future years will be required to be utilized prior to the losses incurred in pre-enactment tax years. As a result of this ordering rule, pre-enactment capital loss carryforwards may be more likely to expire unused. Additionally, post-enactment capital losses that are carried forward will retain their character as either short-term or long-term capital losses rather than being considered all short-term as under previous law.
The Fund used capital loss carryforwards of $962,348 to offset taxable gains realized during the year ended August 31, 2011.
Annual Shareholder Report
5. Investment Adviser Fee and Other Transactions with AffiliatesInvestment Adviser Fee
Federated Investment Management Company is the Fund's investment adviser (the “Adviser”). The advisory agreement between the Fund and the Adviser provides for an annual fee equal to 0.40% of the Fund's average daily net assets. Subject to the terms described in the Expense Limitation note, the Adviser may voluntarily choose to waive any portion of its fee. For the year ended August 31, 2011, the Adviser voluntarily waived $487,479 of its fee.
Administrative Fee
Federated Administrative Services (FAS), under the Administrative Services Agreement, provides the Fund with administrative personnel and services. The fee paid to FAS is based on the average aggregate daily net assets of certain Federated funds as specified below:
| Administrative Fee | Average Aggregate Daily Net Assets
of the Federated Funds |
| 0.150% | on the first $5 billion |
| 0.125% | on the next $5 billion |
| 0.100% | on the next $10 billion |
| 0.075% | on assets in excess of $20 billion |
The administrative fee received during any fiscal year shall be at least $150,000 per portfolio and $40,000 per each additional class of Shares. Subject to the terms described in the Expense Limitation note, FAS may voluntarily choose to waive any portion of its fee. For the year ended August 31, 2011, the net fee paid to FAS was 0.093% of average daily net assets of the Fund. For the year ended August 31, 2011, FAS waived $23,646 of its fee.
Shareholder Services Fee
The Fund may pay fees (Service Fees) up to 0.25% of the average daily net assets of the Fund's Class A Shares to financial intermediaries or to Federated Shareholder Services Company (FSSC) for providing services to shareholders and maintaining shareholder accounts. Subject to the terms described in the Expense Limitation note, FSSC may voluntarily reimburse the Fund for Services Fees. For the year ended August 31, 2011, FSSC received $2,069 of fees paid by the Fund.
Interfund Transactions
During the year ended August 31, 2011, the Fund engaged in purchase and sale transactions with funds that have a common investment adviser (or affiliated investment advisers), common Directors/Trustees and/or common Officers. These purchase and sale transactions complied with Rule 17a-7 under the Act and amounted to $44,420,000 and $43,120,000, respectively.
Expense Limitation
Effective November 1, 2011, the Adviser and its affiliates (which may include FAS and FSSC) have voluntarily agreed to waive their fees and/or reimburse expenses so that the total annual fund operating expenses (as shown in the financial highlights) paid by the Fund's Class A Shares (after the voluntary waivers and reimbursements) will not exceed 0.63% (the “Fee Limit”) up to but not including the later of (the “Termination Date”): (a) November 1, 2012; or Annual Shareholder Report
(b) the date of the Fund's next effective Prospectus. While the Adviser and its affiliates currently do not anticipate terminating or increasing these arrangements prior to the Termination Date, these arrangements may only be terminated or the Fee Limit increased prior to the Termination date with the agreement of the Trustees.General
Certain Officers and Trustees of the Fund are Officers and Directors or Trustees of the above companies.
6. Investment Transactions
Purchases and sales of investments, excluding long-term U.S. government securities and short-term obligations, for the year ended August 31, 2011, were as follows:
| Purchases | $20,871,829 |
| Sales | $54,838,645 |
7. Concentration of Risk
Since the Fund invests a substantial portion of its assets in issuers located in one state, it will be more susceptible to factors adversely affecting issuers of that state than would be a comparable tax-exempt mutual fund that invests nationally. In order to reduce the credit risk associated with such factors, at August 31, 2011, 48.8% of the securities in the Portfolio of Investments were backed by letters of credit or bond insurance of various financial institutions and financial guaranty assurance agencies. The largest percentage of investments insured by or supported (backed) by a letter of credit from any one institution or agency, Assured Guaranty Municipal Corp., was 23.9% of total investments.
8. Line of Credit
The Fund participates in a $100,000,000 unsecured, uncommitted revolving line of credit (LOC) agreement with PNC Bank. The LOC was made available for extraordinary or emergency purposes, primarily for financing redemption payments. Borrowings are charged interest at a rate offered to the Fund by PNC Bank at the time of the borrowing. As of August 31, 2011, there were no outstanding loans. During the year ended August 31, 2011, the Fund did not utilize the LOC.
9. Interfund Lending
Pursuant to an Exemptive Order issued by the Securities and Exchange Commission, the Fund, along with other funds advised by subsidiaries of Federated Investors, Inc., may participate in an interfund lending program. This program provides an alternative credit facility allowing the Fund to borrow from other participating affiliated funds. As of August 31, 2011, there were no outstanding loans. During the year ended August 31, 2011, the program was not utilized.
10. Recent Accounting Pronouncements
In April 2011, the Financial Accounting Standards Board (FASB) released Accounting Standards Update (ASU) No. 2011-03, “Reconsideration of Effective Control for Repurchase Agreements.” This ASU amends FASB Accounting Standards Codification (ASC) Topic 860, “Transfers and Servicing,” specifically the criteria required to determine whether a repurchase agreement and similar agreements should be accounted for as sales of financial assets or Annual Shareholder Report
secured borrowings with commitments. This ASU is effective for fiscal years and interim periods beginning after December 15, 2011. At this time, management is evaluating the implications of adopting ASU No. 2011-03 and its impact on the Fund's financial statements and the accompanying notes, net assets and results of operations.In addition, in May 2011, FASB released ASU No. 2011-04, “Amendments to Achieve Common Fair Value Measurement and Disclosure Requirements in U.S. GAAP and IFRSs.” This ASU amends FASB ASC Topic 820, “Fair Value Measurement,” to establish common requirements for measuring fair value and for disclosing information about fair value measurements in accordance with GAAP. This ASU is effective for fiscal years and interim periods beginning after December 15, 2011. At this time, management is evaluating the implications of adopting ASU No. 2011-04 and its impact on the Fund's financial statements and the accompanying notes.
11. Federal Tax Information (unaudited)
For the fiscal year ended August 31, 2011, 100% of the distributions from net investment income is exempt from federal income tax, other than the federal AMT.
Annual Shareholder Report Report of Independent Registered Public Accounting Firm
TO THE BOARD OF TRUSTEES OF federated municipal securities income trust and shareholders of federated Michigan intermediate municipal Trust:
We have audited the accompanying statement of assets and liabilities, including the portfolio of investments, of Federated Michigan Intermediate Municipal Trust (the “Fund”), a portfolio of Federated Municipal Securities Income Trust, as of August 31, 2011, and the related statement of operations for the year then ended, the statements of changes in net assets for each of the years in the two-year period then ended, and the financial highlights for each of the years in the five-year period then ended. These financial statements and financial highlights are the responsibility of the Fund's management. Our responsibility is to express an opinion on these financial statements and financial highlights based on our audit.
We conducted our audits in accordance with the standards of the Public Company Accounting Oversight Board (United States). Those standards require that we plan and perform the audit to obtain reasonable assurance about whether the financial statements and financial highlights are free of material misstatement. An audit includes examining, on a test basis, evidence supporting the amounts and disclosures in the financial statements. Our procedures included confirmation of securities owned as of August 31, 2011 by correspondence with the custodian, transfer agent and brokers or by other appropriate auditing procedures. An audit also includes assessing the accounting principles used and significant estimates made by management, as well as evaluating the overall financial statement presentation. We believe that our audits provide a reasonable basis for our opinion.
In our opinion, the financial statements and financial highlights referred to above present fairly, in all material respects, the financial position of Federated Michigan Intermediate Municipal Trust as of August 31, 2011, and the results of its operations for the year then ended, the changes in its net assets for each of the years in the two-year period then ended, and the financial highlights for each of the years in the five-year period then ended, in conformity with U.S. generally accepted accounting principles.
Boston, Massachusetts
October 24, 2011
Annual Shareholder Report Shareholder Expense Example (unaudited)
As a shareholder of the Fund, you incur two types of costs: (1) transaction costs, including sales charges (loads) on purchase or redemption payments; and (2) ongoing costs, including management fees and to the extent applicable, distribution (12b-1) fees and/or shareholder services fees and other Fund expenses. This Example is intended to help you to understand your ongoing costs (in dollars) of investing in the Fund and to compare these costs with the ongoing costs of investing in other mutual funds. It is based on an investment of $1,000 invested at the beginning of the period and held for the entire period from March 1, 2011 to August 31, 2011.
ACTUAL EXPENSES
The first section of the table below provides information about actual account values and actual expenses. You may use the information in this section, together with the amount you invested, to estimate the expenses that you incurred over the period. Simply divide your account value by $1,000 (for example, an $8,600 account value divided by $1,000 = 8.6), then multiply the result by the number in the first section under the heading entitled “Expenses Paid During Period” to estimate the expenses attributable to your investment during this period.
HYPOTHETICAL EXAMPLE FOR COMPARISON PURPOSES
The second section of the table below provides information about hypothetical account values and hypothetical expenses based on the Fund's actual expense ratio and an assumed rate of return of 5% per year before expenses, which is not the Fund's actual return. Thus, you should not use the hypothetical account values and expenses to estimate the actual ending account balance or your expenses for the period. Rather, these figures are required to be provided to enable you to compare the ongoing costs of investing in the Fund with other funds. To do so, compare this 5% hypothetical example with the 5% hypothetical examples that appear in the shareholder reports of the other funds.
Please note that the expenses shown in the table are meant to highlight your ongoing costs only and do not reflect any transaction costs, such as sales charges (loads) on purchase or redemption payments. Therefore, the second section of the table is useful in comparing ongoing costs only, and will not help you determine the relative total costs of owning different funds. In addition, if these transaction costs were included, your costs would have been higher.
| Beginning
Account Value
3/1/2011 | Ending
Account Value
8/31/2011 | Expenses Paid
During Period1 |
| Actual | $1,000 | $1057.80 | $2.80 |
Hypothetical (assuming a 5% return
before expenses) | $1,000 | $1,022.48 | $2.75 |
| 1 | Expenses are equal to the Fund's annualized net expense ratio of 0.54%, multiplied by the average account value over the period, multiplied by 184/365 (to reflect the one-half-year period). |
Annual Shareholder Report Board of Trustees and Trust Officers
The Board of Trustees is responsible for managing the Trust's business affairs and for exercising all the Trust's powers except those reserved for the shareholders. The following tables give information about each Trustee and the senior officers of the Fund. Where required, the tables separately list Trustees who are “interested persons” of the Fund (i.e., “Interested” Trustees) and those who are not (i.e., “Independent” Trustees). Unless otherwise noted, the address of each person listed is Federated Investors Tower, 1001 Liberty Avenue, Pittsburgh, PA 15222. The address of all Independent Trustees listed is 4000 Ericsson Drive, Warrendale, PA 15086-7561; Attention: Mutual Fund Board. As of December 31, 2010, the Trust comprised five portfolio(s), and the Federated Fund Family consisted of 43 investment companies (comprising 136 portfolios). Unless otherwise noted, each Officer is elected annually. Unless otherwise noted, each Trustee oversees all portfolios in the Federated Fund Family and serves for an indefinite term. The Fund's Statement of Additional Information includes additional information about Trust Trustees and is available, without charge and upon request, by calling 1-800-341-7400.
Interested TRUSTEES Background
Name
Birth Date
Positions Held with Trust
Date Service Began | Principal Occupation(s) for Past Five Years,
Other Directorships Held and Previous Position(s) |
John F. Donahue*
Birth Date: July 28, 1924
Trustee
Began serving: August 1990 | Principal Occupations: Director or Trustee of the Federated Fund Family; Chairman and Director, Federated Investors, Inc.; Chairman of the Federated Fund Family's Executive Committee.
Previous Positions: Chairman of the Federated Fund Family; Trustee, Federated Investment Management Company; Chairman and Director, Federated Investment Counseling. |
J. Christopher Donahue*
Birth Date: April 11, 1949
President and Trustee
Began serving: August 1990 | Principal Occupations: Principal Executive Officer and President of the Federated Fund Family; Director or Trustee of some of the Funds in the Federated Fund Family; President, Chief Executive Officer and Director, Federated Investors, Inc.; Chairman and Trustee, Federated Investment Management Company; Trustee, Federated Investment Counseling; Chairman and Director, Federated Global Investment Management Corp.; Chairman, Federated Equity Management Company of Pennsylvania and Passport Research, Ltd. (investment advisory subsidiary of Federated); Trustee, Federated Shareholder Services Company; Director, Federated Services Company.
Previous Positions: President, Federated Investment Counseling; President and Chief Executive Officer, Federated Investment Management Company, Federated Global Investment Management Corp. and Passport Research, Ltd. |
| * | Family relationships and reasons for “interested” status: John F. Donahue is the father of J. Christopher Donahue; both are “interested” due to their beneficial ownership of shares of Federated Investors, Inc. and the positions they hold with Federated and its subsidiaries. |
Annual Shareholder Report INDEPENDENT TRUSTEES Background
Name
Birth Date
Positions Held with Trust
Date Service Began | Principal Occupation(s) for Past Five Years,
Other Directorships Held, Previous Position(s) and Qualifications |
Nicholas P. Constantakis, CPA
Birth Date: September 3, 1939
Trustee
Began serving: February 1998 | Principal Occupation: Director or Trustee of the Federated Fund Family.
Other Directorship Held: Director and Chairman of the Audit Committee, Michael Baker Corporation (architecture, engineering and construction services).
Previous Position: Partner, Andersen Worldwide SC.
Qualifications: Public accounting and director experience. |
John F. Cunningham
Birth Date: March 5, 1943
Trustee
Began serving: July 1999 | Principal Occupation: Director or Trustee of the Federated Fund Family.
Other Directorships Held: Chairman, President and Chief Executive Officer, Cunningham & Co., Inc. (strategic business consulting); Trustee Associate, Boston College.
Previous Positions: Director, Redgate Communications and EMC Corporation (computer storage systems); Chairman of the Board and Chief Executive Officer, Computer Consoles, Inc.; President and Chief Operating Officer, Wang Laboratories; Director, First National Bank of Boston; Director, Apollo Computer, Inc.
Qualifications: Business management and director experience. |
Maureen Lally-Green
Birth Date: July 5, 1949
Trustee
Began serving: August 2009 | Principal Occupations: Director or Trustee of the Federated Fund Family; Director, Office of Church Relations, Diocese of Pittsburgh; Adjunct Professor of Law, Duquesne University School of Law.
Other Directorships Held: Director, Auberle; Trustee, St. Francis University; Director, Ireland Institute of Pittsburgh; Director, UPMC Mercy Hospital; Regent, St. Vincent Seminary; Director, Epilepsy Foundation of Western and Central Pennsylvania; Director, Saint Thomas More Society, Allegheny County; Director, Carlow University.
Previous Position: Pennsylvania Superior Court Judge.
Qualifications: Legal and director experience. |
Peter E. Madden
Birth Date: March 16, 1942
Trustee
Began serving: August 1991 | Principal Occupation: Director or Trustee, and Chairman of the Board of Directors or Trustees, of the Federated Fund Family.
Previous Positions: Representative, Commonwealth of Massachusetts General Court; President, Chief Operating Officer and Director, State Street Bank and Trust Company and State Street Corporation (retired); Director, VISA USA and VISA International; Chairman and Director, Massachusetts Bankers Association; Director, Depository Trust Corporation; Director, The Boston Stock Exchange.
Qualifications: Business management, mutual fund services and director experience. |
Annual Shareholder ReportName
Birth Date
Positions Held with Trust
Date Service Began | Principal Occupation(s) for Past Five Years,
Other Directorships Held, Previous Position(s) and Qualifications |
Charles F. Mansfield, Jr.
Birth Date: April 10, 1945
Trustee
Began serving: January 1999 | Principal Occupations: Director or Trustee and Chairman of the Audit Committee of the Federated Fund Family; Management Consultant.
Previous Positions: Chief Executive Officer, PBTC International Bank; Partner, Arthur Young & Company (now Ernst & Young LLP); Chief Financial Officer of Retail Banking Sector, Chase Manhattan Bank; Senior Vice President, HSBC Bank USA (formerly, Marine Midland Bank); Vice President, Citibank; Assistant Professor of Banking and Finance, Frank G. Zarb School of Business, Hofstra University; Executive Vice President, DVC Group, Inc. (marketing, communications and technology).
Qualifications: Banking, business management, education and director experience. |
R. James Nicholson
Birth Date: February 4, 1938
Trustee
Began serving: January 2008 | Principal Occupations: Director or Trustee of the Federated Fund Family; Senior Counsel, Brownstein Hyatt Farber Schrek, P.C.; Former Secretary of the U.S. Dept. of Veterans Affairs; Former U.S. Ambassador to the Holy See; Former Chairman of the Republican National Committee.
Other Directorships Held: Director, Horatio Alger Association; Director, The Daniels Fund.
Previous Positions: Colonel, U.S. Army Reserve; Partner, Calkins, Kramer, Grimshaw and Harring, P.C.; General Counsel, Colorado Association of Housing and Building; Chairman and CEO, Nicholson Enterprises, Inc. (real estate holding company); Chairman and CEO, Renaissance Homes of Colorado.
Qualifications: Legal, government, business management and director experience. |
Thomas M. O'Neill
Birth Date: June 14, 1951
Trustee
Began serving: October 2006 | Principal Occupations: Director or Trustee of the Federated Fund Family; Sole Proprietor, Navigator Management Company (investment and strategic consulting).
Other Directorships Held: Board of Overseers, Children's Hospital of Boston; Visiting Committee on Athletics, Harvard College.
Previous Positions: Chief Executive Officer and President, Managing Director and Chief Investment Officer, Fleet Investment Advisors; President and Chief Executive Officer, Aeltus Investment Management, Inc.; General Partner, Hellman, Jordan Management Co., Boston, MA; Chief Investment Officer, The Putnam Companies, Boston, MA; Credit Analyst and Lending Officer, Fleet Bank; Director and Consultant, EZE Castle Software (investment order management software); Director, Midway Pacific (lumber).
Qualifications: Business management, mutual fund, director and investment experience. |
Annual Shareholder ReportName
Birth Date
Positions Held with Trust
Date Service Began | Principal Occupation(s) for Past Five Years,
Other Directorships Held, Previous Position(s) and Qualifications |
John S. Walsh
Birth Date: November 28, 1957
Trustee
Began serving: July 1999 | Principal Occupations: Director or Trustee of the Federated Fund Family; President and Director, Heat Wagon, Inc. (manufacturer of construction temporary heaters); President and Director, Manufacturers Products, Inc. (distributor of portable construction heaters); President, Portable Heater Parts, a division of Manufacturers Products, Inc.
Previous Position: Vice President, Walsh & Kelly, Inc.
Qualifications: Business management and director experience. |
James F. Will
Birth Date: October 12, 1938
Trustee
Began serving: April 2006 | Principal Occupations: Director or Trustee of the Federated Fund Family; formerly, Vice Chancellor and President, Saint Vincent College.
Other Directorships Held: Trustee, Saint Vincent College; Director, Alleghany Corporation; Trustee, Wheeling Jesuit University; Director, Liberty Tire Recycling.
Previous Positions: Chairman, President and Chief Executive Officer, Armco, Inc.; President and Chief Executive Officer, Cyclops Industries; President and Chief Operating Officer, Kaiser Steel Corporation.
Qualifications: Business management, education and director experience. |
OFFICERS
Name
Birth Date
Positions Held with Trust
Date Service Began | Principal Occupation(s) for Past Five Years
and Previous Position(s) |
John W. McGonigle
Birth Date: October 26, 1938
EXECUTIVE VICE PRESIDENT AND SECRETARY
Began serving: August 1990 | Principal Occupations: Executive Vice President and Secretary of the Federated Fund Family; Vice Chairman, Executive Vice President, Secretary and Director, Federated Investors, Inc.
Previous Positions: Trustee, Federated Investment Management Company and Federated Investment Counseling; Director, Federated Global Investment Management Corp., Federated Services Company and Federated Securities Corp. |
Richard A. Novak
Birth Date: December 25, 1963
TREASURER
Began serving: January 2006 | Principal Occupations: Principal Financial Officer and Treasurer of the Federated Fund Family; Senior Vice President, Federated Administrative Services; Financial and Operations Principal for Federated Securities Corp., Edgewood Services, Inc. and Southpointe Distribution Services, Inc.
Previous Positions: Controller of Federated Investors, Inc.; Vice President, Finance of Federated Services Company; held various financial management positions within The Mercy Hospital of Pittsburgh; Auditor, Arthur Andersen & Co. |
Annual Shareholder ReportName
Birth Date
Positions Held with Trust
Date Service Began | Principal Occupation(s) for Past Five Years
and Previous Position(s) |
Richard B. Fisher
Birth Date: May 17, 1923
VICE CHAIRMAN
Began serving: August 2002 | Principal Occupations: Vice Chairman or Vice President of some of the Funds in the Federated Fund Family; Vice Chairman, Federated Investors, Inc.; Chairman, Federated Securities Corp.
Previous Positions: President and Director or Trustee of some of the Funds in the Federated Fund Family; Executive Vice President, Federated Investors, Inc.; Director and Chief Executive Officer, Federated Securities Corp. |
Brian P. Bouda
Birth Date: February 28, 1947
CHIEF COMPLIANCE OFFICER AND SENIOR VICE PRESIDENT
Began serving: August 2004 | Principal Occupations: Senior Vice President and Chief Compliance Officer of the Federated Fund Family; Vice President and Chief Compliance Officer of Federated Investors, Inc. and Chief Compliance Officer of its subsidiaries. Mr. Bouda joined Federated in 1999 and is a member of the American Bar Association and the State Bar Association of Wisconsin. |
Robert J. Ostrowski
Birth Date: April 26, 1963
CHIEF INVESTMENT OFFICER
Began serving: February 2010 | Principal Occupations: Robert J. Ostrowski joined Federated in 1987 as an Investment Analyst and became a Portfolio Manager in 1990. He was named Chief Investment Officer of taxable fixed-income products in 2004 and also serves as a Senior Portfolio Manager. Mr. Ostrowski became an Executive Vice President of the Fund's Adviser in 2009 and served as a Senior Vice President of the Fund's Adviser from 1997 to 2009. Mr. Ostrowski has received the Chartered Financial Analyst designation. He received his M.S. in Industrial Administration from Carnegie Mellon University. |
J. Scott Albrecht
Birth Date: June 1, 1960
VICE PRESIDENT
Began serving: November 1999 | Principal Occupations: J. Scott Albrecht is Vice President of the Trust. Mr. Albrecht joined Federated in 1989. He became a Senior Vice President of the Fund's Adviser in January 2005 and served as a Vice President of the Fund's Adviser from 1994 through 2004. He has been a Senior Portfolio Manager since 1997 and was a Portfolio Manager from 1994 to 1996. Mr. Albrecht has received the Chartered Financial Analyst designation and an M.S. in Public Management from Carnegie Mellon University. |
Annual Shareholder Report Evaluation and Approval of Advisory Contract – May 2011
federated MICHIGAN INTERMEDIATE MUNICIPAL TRUST (the “Fund”)
The Fund's Board reviewed the Fund's investment advisory contract at meetings held in May 2011. The Board's decision regarding the contract reflects the exercise of its business judgment on whether to continue the existing arrangements.
In this connection, the Federated Funds' Board had previously appointed a Senior Officer, whose duties include specified responsibilities relating to the process by which advisory fees are to be charged to a Federated fund. The Senior Officer has the authority to retain consultants, experts, or staff as may be reasonably necessary to assist in the performance of his duties, reports directly to the Board, and may be terminated only with the approval of a majority of the independent members of the Board. The Senior Officer prepared and furnished to the Board an independent, written evaluation that covered topics discussed below (the “Evaluation”). The Board considered that Evaluation, along with other information, in deciding to approve the advisory contract.
During its review of the contract, the Board considered compensation and benefits received by the Adviser. This included the fees received for services provided to the Fund by other entities in the Federated organization and research services (if any) received by the Adviser from brokers that execute Federated fund trades, as well as advisory fees. The Board is also familiar with and considered judicial decisions concerning allegedly excessive investment advisory fees, which have indicated that the following factors may be relevant to an Adviser's fiduciary duty with respect to its receipt of compensation from a fund: the nature and quality of the services provided by the Adviser, including the performance of the fund; the Adviser's cost of providing the services; the extent to which the Adviser may realize “economies of scale” as a fund grows larger; any indirect benefits that may accrue to the Adviser and its affiliates as a result of the Adviser's relationship with a fund; performance and expenses of comparable funds; and the extent to which the independent Board members are fully informed about all facts the Board deems relevant bearing on the Adviser's services and fees. The Board further considered management fees (including any components thereof) charged to institutional and other clients of the Adviser for what might be viewed as like services, and the cost to the Adviser and its affiliates of supplying services pursuant to the management fee agreements, excluding any intra-corporate profit and profit margins of the Adviser and its affiliates for supplying such services. The Board was aware of these factors and was guided by them in its review of the Fund's advisory contract to the extent it considered them to be appropriate and relevant, as discussed further below.
Annual Shareholder Report
The Board considered and weighed these circumstances in light of its substantial accumulated experience in governing the Fund and working with Federated on matters relating to the Federated funds, and was assisted in its deliberations by independent legal counsel. Throughout the year, the Board has requested and received substantial and detailed information about the Fund and the Federated organization that was in addition to the extensive materials that comprise and accompany the Senior Officer's Evaluation. Federated provided much of this information at each regular meeting of the Board, and furnished additional information in connection with the particular meeting at which the Board's formal review of the advisory contract occurred. Between regularly scheduled meetings, the Board also received information on particular matters as the need arose. Thus, the Board's consideration of the advisory contract included review of the Senior Officer's Evaluation, accompanying data and additional information covering such matters as: the Adviser's investment philosophy, revenue, profitability, personnel and processes; investment and operating strategies; the Fund's short- and long-term performance (in absolute terms, both on a gross basis and net of expenses, as well as in relationship to its particular investment program and certain competitor or “peer group” funds and/or other benchmarks, as appropriate), and comments on the reasons for performance; the Fund's investment objectives; the Fund's expenses (including the advisory fee itself and the overall expense structure of the Fund, both in absolute terms and relative to similar and/or competing funds, with due regard for contractual or voluntary expense limitations); the use and allocation of brokerage commissions derived from trading the Fund's portfolio securities (if any); and the nature, quality and extent of the advisory and other services provided to the Fund by the Adviser and its affiliates. The Board also considered the preferences and expectations of Fund shareholders and their relative sophistication; the continuing state of competition in the mutual fund industry and market practices; the range of comparable fees for similar funds in the mutual fund industry; the Fund's relationship to the Federated family of funds which include a comprehensive array of funds with different investment objectives, policies and strategies which are available for exchange without the incurrence of additional sales charges; compliance and audit reports concerning the Federated funds and the Federated companies that service them (including communications from regulatory agencies), as well as Federated's responses to any issues raised therein; and relevant developments in the mutual fund industry and how the Federated funds and/or Federated are responding to them. The Board's evaluation process is evolutionary. The criteria considered and the emphasis placed on relevant criteria change in recognition of changing circumstances in the mutual fund marketplace.With respect to the Fund's performance and expenses in particular, the Board has found the use of comparisons to other mutual funds with comparable investment programs to be relevant, given the high degree of competition in the mutual fund business. The Board focused on comparisons with other similar Annual Shareholder Report
mutual funds more heavily than non-mutual fund products or services because it is believed that they are more relevant. For example, other mutual funds are the products most like the Fund, they are readily available to Fund shareholders as alternative investment vehicles, and they are the type of investment vehicle in fact chosen and maintained by the Fund's investors. The range of their fees and expenses therefore appears to be a generally reliable indication of what consumers have found to be reasonable in the precise marketplace in which the Fund competes. The Fund's ability to deliver competitive performance when compared to its peer group was a useful indicator of how the Adviser is executing the Fund's investment program, which in turn assisted the Board in reaching a conclusion that the nature, extent, and quality of the Adviser's investment management services were such as to warrant continuation of the advisory contract. In this regard, the Senior Officer has reviewed Federated's fees for providing advisory services to products outside the Federated family of funds (e.g., institutional and separate accounts). He concluded that mutual funds and institutional accounts are inherently different products. Those differences include, but are not limited to, different types of targeted investors; being subject to different laws and regulations; different legal structures; different average account sizes; different associated costs; different portfolio management techniques made necessary by different cash flows; and portfolio manager time spent in review of securities pricing. The Senior Officer did not consider these fee schedules to be determinative in judging the appropriateness of mutual fund advisory contracts.The Senior Officer reviewed information compiled by Federated, using data supplied by independent fund ranking organizations, regarding the performance of, and fees charged by, other mutual funds, noting his view that comparisons to fund peer groups are relevant in judging the reasonableness of proposed fees.
For the periods covered by the Evaluation, the Fund's performance for the one and five -year period was above the median of the relevant peer group, and the Fund's performance fell below the median of the relevant peer group for the three-year period. The Board discussed the Fund's performance with the Adviser and recognized the efforts being undertaken by the Adviser. The Board will continue to monitor these efforts and the performance of the Fund.
The Board also received financial information about Federated, including information regarding the compensation and benefits Federated derived from its relationships with the Federated funds. This information covered not only the fees under the advisory contracts, but also fees received by Federated's subsidiaries for providing other services to the Federated funds under separate contracts (e.g., for serving as the Federated funds' administrator). The information also detailed any indirect benefit Federated may derive from its receipt of research services from brokers who execute Federated fund trades. In addition, the Board considered the fact that, in order for a fund to be competitive in the marketplace, Federated and its affiliates frequently waived fees Annual Shareholder Report
and/or reimbursed expenses and have disclosed to fund investors and/or indicated to the Board their intention to do so in the future, where appropriate. Moreover, the Board receives regular reporting as to the institution or elimination of these voluntary waivers.Federated furnished information, requested by the Senior Officer, that reported revenues on a fund-by-fund basis and made estimates of the allocation of expenses on a fund-by-fund basis, using allocation methodologies specified by the Senior Officer. The Senior Officer noted that, although they may apply consistent allocation processes, the inherent difficulties in allocating costs (and the unavoidable arbitrary aspects of that exercise) and the lack of consensus on how to allocate those costs may render such allocation information unreliable. The allocation information was considered in the analysis by the Board but was determined to be of limited use.
The Board and the Senior Officer also reviewed information compiled by Federated comparing profitability information for Federated to other publicly held fund management companies. In this regard, the Senior Officer noted the limited availability of such information, but nonetheless concluded that Federated's profit margins did not appear to be excessive and the Board agreed.
The Senior Officer's Evaluation also discussed the notion of possible realization of “economies of scale” as a fund grows larger. The Board considered in this regard that the Adviser has made significant and long-term investments in areas that support all of the Federated funds, such as personnel and processes for the portfolio management, compliance, internal audit, and risk management functions; and systems technology; and that the benefits of these efforts (as well as any economies, should they exist) were likely to be enjoyed by the fund complex as a whole. Finally, the Board also noted the absence of any applicable regulatory or industry guidelines on this subject, which (as discussed in the Senior Officer's Evaluation) is compounded by the lack of any common industry practice or general pattern with respect to structuring fund advisory fees with “breakpoints” that serve to reduce the fee as the fund attains a certain size. The Senior Officer did not recommend institution of breakpoints in pricing Federated's fund advisory services at this time.
It was noted in the materials for the Board meeting that for the period covered by the Evaluation, the Fund's investment advisory fee, after waivers and expense reimbursements, if any, was below the median of the relevant peer group. The Board reviewed the fees and other expenses of the Fund with the Adviser and was satisfied that the overall expense structure of the Fund remained competitive.
The Senior Officer noted that, considering the totality of the circumstances, and all of the factors referenced within his Evaluation, he had concluded that, subject to comments and recommendations made within his Evaluation, his observations and the information accompanying the Evaluation supported a finding by the Board that the management fees for each of the funds are reasonable and that Federated appeared to provide appropriate administrative Annual Shareholder Report
services to the Fund for the fees paid. Under these circumstances, no changes were recommended to, and no objection was raised to, the continuation of the Fund's advisory contract. The Board concluded that the nature, quality and scope of services provided the Fund by the Adviser and its affiliates were satisfactory.In its decision to continue an existing investment advisory contract, the Board was mindful of the potential disruptions of the Fund's operations and various risks, uncertainties and other effects that could occur as a result of a decision to terminate or not renew an advisory contract. In particular, the Board recognized that many shareholders have invested in the Fund on the strength of the Adviser's industry standing and reputation and with the expectation that the Adviser will have a continuing role in providing advisory services to the Fund. Thus, the Board's approval of the advisory contract reflected the fact that it is the shareholders who have effectively selected the Adviser by virtue of having invested in the Fund.
The Board based its decision to approve the advisory contract on the totality of the circumstances and relevant factors and with a view to past and future long-term considerations. Not all of the factors and considerations identified above were necessarily relevant to the Fund, nor did the Board consider any one of them to be determinative. With respect to the factors that were relevant, the Board's decision to approve the contract reflects its determination that Federated's performance and actions provided a satisfactory basis to support the decision to continue the existing arrangements.
Annual Shareholder Report Voting Proxies on Fund Portfolio Securities
A description of the policies and procedures that the Fund uses to determine how to vote proxies, if any, relating to securities held in the Fund's portfolio is available, without charge and upon request, by calling 1-800-341-7400. A report on “Form N-PX” of how the Fund voted any such proxies during the most recent 12-month period ended June 30 is available from Federated's website at FederatedInvestors.com. To access this information from the home page, select “View All” next to “Find Products.” Select a fund name and share class, if applicable, to go to the Fund Overview page. On the Fund Overview page, select the “Documents” tab. At the bottom of that page, select “Proxy Voting Record Report (Form N-PX).” Form N-PX filings are also available at the SEC's website at www.sec.gov.
Quarterly Portfolio Schedule
The Fund files with the SEC a complete schedule of its portfolio holdings, as of the close of the first and third quarters of its fiscal year, on “Form N-Q.” These filings are available on the SEC's website at www.sec.gov and may be reviewed and copied at the SEC's Public Reference Room in Washington, DC. (Call 1-800-SEC-0330 for information on the operation of the Public Reference Room.) You may also access this information from the “Products” section of Federated's website at FederatedInvestors.com. From the home page, select “View All” next to “Find Products.” Select a fund name and share class, if applicable, to go to the Fund Overview page. On the Fund Overview page, select the “Documents” tab. At the bottom of that page, select “Form N-Q.”
Annual Shareholder ReportMutual funds are not bank deposits or obligations, are not guaranteed by any bank and are not insured or guaranteed by the U.S. government, the Federal Deposit Insurance Corporation, the Federal Reserve Board or any other government agency. Investment in mutual funds involves investment risk, including the possible loss of principal.
This Report is authorized for distribution to prospective investors only when preceded or accompanied by the Trust's Prospectus, which contains facts concerning its objective and policies, management fees, expenses and other information.
Federated Michigan Intermediate Municipal Trust
Federated Investors Funds
4000 Ericsson Drive
Warrendale, PA 15086-7561
Contact us at FederatedInvestors.com
or call 1-800-341-7400.
Federated Securities Corp., Distributor
Cusip 313923302
G01106-03 (10/11)
Federated is a registered trademark of Federated Investors, Inc.
2011 © Federated Investors, Inc.
| | Annual Shareholder Report |
| | August 31, 2011 |
|
| Share Class | Ticker |
| A | NYIFX |
| B | NYIBX |
Federated New York Municipal Income Fund
Fund Established 1992
A Portfolio of Federated Municipal Securities Income Trust
Dear Valued Shareholder,
I am pleased to present the Annual Shareholder Report for your fund covering the period from September 1, 2010 through August 31, 2011. This report includes Management's Discussion of Fund Performance, a complete listing of your fund's holdings, performance information and financial statements along with other important fund information.
In addition, our website, FederatedInvestors.com, offers easy access to Federated resources that include timely fund updates, economic and market insights from our investment strategists, and financial planning tools. We invite you to register to take full advantage of its capabilities.
Thank you for investing with Federated. I hope you find this information useful and look forward to keeping you informed.
Sincerely,
J. Christopher Donahue, President
Not FDIC Insured May Lose Value No Bank Guarantee
CONTENTS
Management's Discussion of Fund
Performance (unaudited)
The Fund's total return, based on net asset value, for the 12-month reporting period ended August 31, 2011, was 2.00% for Class A Shares and 1.23% for Class B Shares. The total return of the S&P Municipal Bond New York Index (“NY Index” or “benchmark”),1 the Fund's broad-based securities market index, was 2.59% during the same period. The Fund's total return for the most recently completed fiscal year reflected actual cash flows, transaction costs and other expenses, which were not reflected in the total return of the NY Index.
During the reporting period, the most significant factors affecting the Fund's performance relative to the NY Index were: (a) the effective duration of its portfolio (which indicates the portfolio's sensitivity to changes in interest rates);2,3 (b) the allocation of the Fund's portfolio among securities of similar issuers (referred to as sectors); and (c) the credit ratings of portfolio securities.
The following discussion focuses on the performance of the Fund's Class A Shares. The 2.00% total return of the Class A Shares for the reporting period consisted of 3.84% of tax-exempt dividends and reinvestments and -1.84% of price depreciation in the net asset value of the shares.4
MARKET OVERVIEW
During the 12-month reporting period there was continued uncertainty regarding the economic outlook, regulatory policy and fiscal policy that continued to constrain hiring and capital investment. Economic growth was considerably slower than expected as reflected by deterioration in labor market conditions, slower household spending, a drop in consumer confidence and continued weakness in the housing market. The weakness in household and business spending was accompanied by fiscal consolidation at the state and local government level. The shedding of state and local government jobs contributed to the deterioration in overall labor market conditions. Higher energy and commodity prices and disruption from the Japanese earthquake were temporary factors that affected economic activity.
Throughout the period, concerns about the sovereign debt of certain European countries and the political controversy over the U.S. debt ceiling, its potential credit rating impact, and the downgrade of the long-term credit rating of the federal government of the United States had an effect on investor's appetites for risk assets. As a result, the 10-year Treasury rallied from a high of 3.74% in February to a low of 2.06% in August 2011. Also, the tax-exempt municipal bond market experienced a widening in credit spreads during the period as the BBB-rated sector widened by over 20 basis points.
Annual Shareholder Report
New York State had a broad and wealthy state economy although New York had a high reliance on taxes paid by those in the high paying financial services industry. Job losses were not as severe in New York as they were in the nation as a whole. The budget was enacted on time and was balanced and budget reserves have been accumulated to provide a cushion for future downturns. New York's pension system was well funded compared to other states.DURATION
As determined at the end of the 12-month reporting period, the Fund's dollar-weighted average duration for the reporting period was 5.15 years. Duration management was a significant component of the Fund's investment strategy. The shorter a fund's duration relative to an index, the less its net asset value will react as interest rates change. The Fund adjusted duration relative to the NY Index several times during the reporting period. The fund maintained an overweight position in the longer duration securities relative to the benchmark. As a result, the Fund's duration overweight position (105%) relative to the NY Index contributed positive excess return to Fund performance.
SECTOR
During the reporting period, the Fund maintained a higher portfolio allocation to higher education issuers and healthcare-related debt. These allocations helped the Fund's performance due to the outperformance of these sectors relative to the benchmark. The Fund also had less of an allocation to public power and state tax supported debt than the NY Index. These sectors outperformed the benchmark during the period and detracted from the Fund's performance. The fund's underweight position to tobacco-related financings also added to excess return as this sector underperformed over the period.
CREDIT QUALITY
The 12-month reporting period experienced a tug of war for investors between continued risk aversion as economic activity deteriorated and a desire to reach for yield into the lower quality sectors of the market because of the historically low level of interest rates. The Fund's overweight position, relative to the NY Index, in A-rated debt during the reporting period helped the Fund's performance as the rates on A-rated debt decreased to a greater extent than for other investment-grade securities.5,6 Also, the Fund's weighting in BB-rated debt relative to the zero weighting of the NY Index in that rating category resulted in a negative contribution to Fund performance as a result of the underperformance of high yield or noninvestment-grade municipal securities.
Annual Shareholder Report| 1 | S&P Indices changed the name of the NY Index from “S&P/Investortools Municipal Bond New York Index” to “S&P Municipal Bond New York Index.” Please see the footnotes to the line graphs under “Fund Performance and Growth of a $10,000 Investment” below for the definition of, and more information about, the NY Index. |
| 2 | Duration is a measure of a security's price sensitivity to changes in interest rates. Securities with longer durations are more sensitive to changes in interest rates than securities with shorter durations. |
| 3 | Bond prices are sensitive to changes in interest rates and a rise in interest rates can cause a decline in their prices. |
| 4 | Income may be subject to the federal alternative minimum tax for individuals and corporations. |
| 5 | Credit ratings pertain only to the securities in the portfolio and do not protect Fund shares against market risk. |
| 6 | Investment-grade securities and noninvestment-grade securities may either be: (a) rated by a nationally recognized statistical ratings organization or rating agency; or (b) unrated securities that the Fund's investment adviser (“Adviser”) believes are of comparable quality. The rating agencies that provided the ratings for rated securities include Standard and Poor's, Moody's Investor Services, Inc. and Fitch Rating Service. When ratings vary, the highest rating is used. Credit ratings of AA or better are considered to be high credit quality; credit ratings of A are considered high or medium/good quality; and credit ratings of BBB are considered to be medium/good credit quality, and the lowest category of investment-grade securities; credit ratings of BB and below are lower-rated, noninvestment-grade securities or junk bonds; and credit ratings of CCC or below are noninvestment-grade securities that have high default risk. Any credit quality breakdown does not give effect to the impact of any credit derivative investments made by the Fund. Credit ratings are an indication of the risk that a security will default. They do not protect a security from credit risk. Lower-rated bonds typically offer higher yields to help compensate investors for the increased risk associated with them. Among these risks are lower creditworthiness, greater price volatility, more risk to principal and income than with higher-rated securities and increased possibilities of default. |
Annual Shareholder ReportFUND PERFORMANCE AND GROWTH OF A $10,000 INVESTMENT
The Average Annual Total Return table below shows returns for each class averaged over the stated periods. The graphs below illustrate the hypothetical investment of $10,0001 in Federated New York Municipal Income Fund (the “Fund”) from August 31, 2001 (or start of performance) to August 31, 2011, compared to the S&P Municipal Bond New York Index (NY Index),2 S&P Municipal Bond NY, Investment Grade, 3-Year Plus Sub-Index (NYIG Index)3 and the Morningstar Municipal New York Long Funds Category Average (MSTARMNYL).4
Average Annual Total Returns for the Period Ended 8/31/2011
(returns reflect all applicable sales charges and contingent deferred sales charges as specified below in footnote #1)
| Share Class | 1 Year | 5 Years | 10 Years | Start of
Performance |
| A | -2.62% | 2.02% | 3.14% | N/A |
| B* | -4.16% | 1.85% | N/A | 2.94% |
| * | The Fund's B shares commenced operations on 9/5/2002. |
Performance data quoted represents past performance which is no guarantee of future results. Investment return and principal value will fluctuate so that an investor's shares, when redeemed, may be worth more or less than their original cost. Mutual fund performance changes over time and current performance may be lower or higher than what is stated. For current to the most recent month-end performance and after-tax returns, visit FederatedInvestors.com or call 1-800-341-7400. Returns shown do not reflect the deduction of taxes that a shareholder would pay on Fund distributions or the redemption of Fund shares. Mutual funds are not obligations of or guaranteed by any bank and are not federally insured.
Annual Shareholder Report
Growth of A $10,000 Investment – Class A Shares| Federated New York Municipal Income Fund - | Class A Shares | NY Index | NYIG Index | MSTARMNYL |
| 8/31/2001 | 9,550 | 10,000 | 10,000 | 10,000 |
| 8/31/2002 | 9,816 | 10,571 | 10,596 | 10,464 |
| 8/31/2003 | 10,091 | 10,919 | 10,979 | 10,702 |
| 8/31/2004 | 10,748 | 11,758 | 11,821 | 11,394 |
| 8/31/2005 | 11,396 | 12,485 | 12,531 | 11,988 |
| 8/31/2006 | 11,772 | 12,920 | 12,938 | 12,317 |
| 8/31/2007 | 11,840 | 13,220 | 13,232 | 12,454 |
| 8/31/2008 | 11,902 | 13,665 | 13,835 | 12,750 |
| 8/31/2009 | 12,102 | 14,304 | 14,685 | 13,153 |
| 8/31/2010 | 13,361 | 15,762 | 16,169 | 14,576 |
| 8/31/2011 | 13,627 | 16,176 | 16,608 | 14,732 |
41 graphic description end -->
- Total returns shown include the maximum sales charge of 4.50% ($10,000 investment minus $450 sales charge = $9,550)
Growth of A $10,000 Investment – Class B shares
| Federated New York Income Fund - | Class B Shares | NY Index | NYIG Index | MSTARMNYL |
| 9/5/2002 | 10,000 | 10,000 | 10,000 | 10,000 |
| 8/31/2003 | 10,142 | 10,329 | 10,361 | 10,227 |
| 8/31/2004 | 10,722 | 11,123 | 11,156 | 10,889 |
| 8/31/2005 | 11,281 | 11,810 | 11,825 | 11,456 |
| 8/31/2006 | 11,559 | 12,222 | 12,210 | 11,771 |
| 8/31/2007 | 11,537 | 12,506 | 12,488 | 11,902 |
| 8/31/2008 | 11,512 | 12,927 | 13,056 | 12,185 |
| 8/31/2009 | 11,618 | 13,531 | 13,858 | 12,570 |
| 8/31/2010 | 12,733 | 14,910 | 15,259 | 13,930 |
| 8/31/2011 | 12,989 | 15,302 | 15,674 | 14,079 |
41 graphic description end -->
- Total returns shown include the maximum contingent deferred sales charge of 5.50% as applicable.
| 1 | Represents a hypothetical investment of $10,000 in the Fund after deducting applicable sales charges: For Class A Shares, the maximum sales charge of 4.50% ($10,000 investment minus $450 sales charge = $9,550); For Class B Shares, the maximum contingent deferred sales charge is 5.50% on any redemption less than one year from the purchase date. The Fund's performance assumes the reinvestment of all dividends and distributions. The NY Index, NYIG Index and MSTARMNYL have been adjusted to reflect reinvestment of dividends on securities in the index and average. |
| 2 | S&P Indices changed the name of the NY Index from “S&P/Investortools Municipal Bond New York Index” to “S&P Municipal Bond New York Index.” The NY Index consists of bonds in the S&P Municipal Bond Index (Main Index) that have been issued by the state of New York or local governments or state or local government entities within New York. The Main Index is a broad, comprehensive, market value-weighted index comprised of approximately 55,000 bond issues that are exempt from U.S. federal income taxes or subject to the alternative minimum tax (AMT). Eligibility criteria for inclusion in the Main Index include, but are not limited to: the bond issuer must be a state (including the Commonwealth of Puerto Rico and U.S. territories) or a local government or a state or agency where interest on the bond is exempt from U.S. federal income taxes or subject to the AMT; the bond must be |
Annual Shareholder Report | held by a mutual fund for which Standard & Poor's Securities Evaluations, Inc. provides prices; it must be denominated in U.S. dollars and have a minimum par amount of $2 million; and the bond must have a minimum term to maturity and/or call date greater than or equal to one calendar month. The Main Index is rebalanced monthly. The NY Index is not adjusted to reflect sales charges, expenses and other fees that the Securities and Exchange Commission (SEC) requires to be reflected in the Fund's performance. The NY Index is unmanaged and, unlike the Fund, is not affected by cash flows. It is not possible to invest directly in an index. |
| 3 | S&P Indices changed the name of the NYIG Index from “S&P/Investortools Municipal Bond NY, Investment Grade, 3-Year Plus Sub-Index” to “S&P Municipal Bond NY, Investment Grade, 3-Year Plus Sub-Index.” The NYIG Index represents, the portion of the NY Index composed solely of bonds that are rated BBB-/Baa3 or higher with remaining maturities of more than 3 years that are not subject to AMT. The NYIG Index is not adjusted to reflect sales charges, expenses and other fees that the SEC requires to be reflected in the Fund's performance. The NYIG Index is unmanaged and, unlike the Fund, is not affected by cash flows. It is not possible to invest directly in an index. |
| 4 | Morningstar figures represent the average of the total returns reported by all the mutual funds designated by Morningstar as falling into the respective category indicated. Funds designated within the MSTARMNYL include those that invest at least 80% of assets in New York municipal debt and have durations of more than seven years (or, if duration is unavailable, average maturities of more than 12 years). They do not reflect sales charges. |
Annual Shareholder Report Portfolio of Investments Summary Table (unaudited)
At August 31, 2011, the Fund's sector composition1 was as follows:
| Sector Composition | Percentage of
Total Net Assets |
| General Obligation — Local | 16.3% |
| Special Tax | 15.9% |
| General Obligation — State | 13.1% |
| Transportation | 10.3% |
| Education | 9.5% |
| Water and Sewer | 7.7% |
| Resource Recovery | 5.7% |
| Pre-refunded | 5.5% |
| Hospital | 4.3% |
| Tobacco | 2.3% |
| Other2 | 8.1% |
| Other Assets and Liabilities — Net3 | 1.3% |
| TOTAL | 100.0% |
| 1 | Sector classifications, and the assignment of holdings to such sectors, are based upon the economic sector and/or revenue source of the underlying obligor, as determined by the Fund's Adviser. For securities that have been enhanced by a third-party, including bond insurers and banks, sector classifications are based upon the economic sector and/or revenue source of the underlying obligor, as determined by the Fund's Adviser. Pre-refunded securities are those whose debt service is paid from escrowed assets, usually U.S. government securities. |
| 2 | For purposes of this table, sector classifications constitute 90.6% of the Fund's total net assets. Remaining sectors have been aggregated under the designation “Other.” |
| 3 | Assets, other than investments in securities, less liabilities. See Statement of Assets and Liabilities. |
Annual Shareholder Report Portfolio of Investments
August 31, 2011
Principal
Amount | | | Value |
| | MUNICIPAL BONDS – 92.6% | |
| | New York – 88.9% | |
| $1,000,000 | | Babylon, NY IDA, Resource Recovery Bonds (Series 2009A), 5.00% (Covanta Babylon, Inc.), 1/1/2019 | 1,131,440 |
| 480,000 | | Brooklyn Arena Local Development Corporation, NY, Pilot Revenue Bonds (Series 2009), 6.375% (Original Issue Yield: 6.476%), 7/15/2043 | 489,931 |
| 785,000 | | Dutchess County, NY IDA, Revenue Bonds, 5.00% (Marist College)/(Original Issue Yield: 5.15%), 7/1/2020 | 805,779 |
| 1,000,000 | | Erie County, NY IDA, School Facility Revenue Bonds (Series 2009A), 5.25% (Buffalo, NY City School District), 5/1/2025 | 1,102,590 |
| 200,000 | | Essex County, NY IDA, Environmental Improvement Revenue Bonds (Series 2006A), 4.60% (International Paper Co.), 12/1/2030 | 171,540 |
| 500,000 | | Hempstead Town, NY IDA, Civic Facility Revenue Bonds, 5.00% (Hofstra University)/(Original Issue Yield: 5.10%), 7/1/2033 | 504,060 |
| 220,000 | | Islip, NY Resource Recovery Agency, Resource Recovery Revenue Bonds (Series 2001E), 5.75% (Assured Guaranty Municipal Corp. INS), 7/1/2023 | 231,504 |
| 500,000 | | Livingston County, NY IDA, Civic Facility Revenue Bonds (Series 2005), 6.00% (Nicholas H. Noyes Memorial Hospital Civic Facility), 7/1/2030 | 449,990 |
| 500,000 | | Madison County, NY IDA, Civic Facility Revenue Bonds (Series 2003A), 5.00% (Colgate University), 7/1/2023 | 516,510 |
| 500,000 | | Metropolitan Transportation Authority, NY, Dedicated Tax Fund Bonds (Series 2009B), 5.00% (MTA Dedicated Tax Fund)/(Original Issue Yield: 5.10%), 11/15/2034 | 522,195 |
| 250,000 | | Metropolitan Transportation Authority, NY, Revenue Bonds (Series 1998A), 5.00% (MTA Dedicated Tax Fund)/(United States Treasury PRF 10/1/2015@100)/(Original Issue Yield: 5.22%), 4/1/2023 | 294,915 |
| 500,000 | | Metropolitan Transportation Authority, NY, Revenue Bonds (Series 2006A), 5.00% (MTA Transportation Revenue), 11/15/2035 | 504,520 |
| 500,000 | | Nassau County, NY IDA, IDRBs (Series 2003A), 5.25% (KeySpan-Glenwood Energy Center LLC)/(KeySpan Corp. GTD), 6/1/2027 | 506,375 |
| 1,000,000 | | Nassau County, NY, UT GO Bonds (Series 2009A), 5.00% (Assured Guaranty Corp. INS), 5/1/2021 | 1,140,740 |
| 500,000 | | New York City Trust For Cultural Resources, Refunding Revenue Bonds (Series 2008A), 5.00% (Museum of Modern Art), 4/1/2028 | 541,135 |
| 500,000 | | New York City Trust For Cultural Resources, Refunding Revenue Bonds (Series 2008A), 5.00% (Museum of Modern Art), 4/1/2031 | 530,560 |
| 250,000 | | New York City, NY IDA, Civic Facilities Revenue Bonds, 5.375% (New York University)/(AMBAC INS), 7/1/2017 | 250,998 |
| 365,000 | | New York City, NY IDA, Civic Facility Revenue Bonds (Series 2001A), 6.375% (Staten Island University Hospital), 7/1/2031 | 366,321 |
Annual Shareholder ReportPrincipal
Amount | | | Value |
| $170,000 | | New York City, NY IDA, Civic Facility Revenue Bonds (Series 2002C), 6.45% (Staten Island University Hospital), 7/1/2032 | 172,337 |
| 500,000 | | New York City, NY IDA, Special Airport Facility Revenue Bonds (Series 2001A), 5.50% (Airis JFK I LLC Project at JFK International)/(Original Issue Yield: 5.65%), 7/1/2028 | 434,695 |
| 500,000 | | New York City, NY IDA, Special Facilities Revenue Bonds, 5.25% (British Airways), 12/1/2032 | 404,855 |
| 300,000 | | New York City, NY IDA, Special Facilities Revenue Bonds, 5.50% (Terminal One Group Association), 1/1/2024 | 309,882 |
| 500,000 | | New York City, NY Municipal Water Finance Authority, Water and Sewer System Revenue Bonds (Series 2009AA), 5.00%, 6/15/2022 | 566,800 |
| 500,000 | | New York City, NY Transitional Finance Authority, Building Aid Revenue Bonds (Series 2009S-5), 5.25% (Original Issue Yield: 5.33%), 1/15/2039 | 529,065 |
| 455,000 | | New York City, NY Transitional Finance Authority, Future Tax Secured Subordinate Bonds (Series 2011C), 5.50%, 11/1/2035 | 506,920 |
| 500,000 | | New York City, NY, UT GO Bonds (Series 2009E-1), 6.25% (Original Issue Yield: 6.40%), 10/15/2028 | 588,890 |
| 1,000,000 | | New York State Dormitory Authority, Improvement Revenue Bonds (Series 2008D), 5.00% (Mental Health Services Facility)/(Assured Guaranty Municipal Corp. INS), 2/15/2018 | 1,164,690 |
| 500,000 | | New York State Dormitory Authority, Lease Revenue Bonds (Series 2006A), 5.00% (State University of New York)/(National Public Finance Guarantee Corporation INS), 7/1/2031 | 517,085 |
| 500,000 | | New York State Dormitory Authority, Revenue Bonds (Series 1998), 5.50% (Memorial Sloan-Kettering Cancer Center)/(National Public Finance Guarantee Corporation INS), 7/1/2023 | 588,215 |
| 250,000 | | New York State Dormitory Authority, Revenue Bonds (Series 2003), 5.375% (North Shore-Long Island Jewish Obligated Group)/(United States Treasury PRF 5/1/2013@100)/(Original IssueYield: 5.48%), 5/1/2023 | 271,132 |
| 500,000 | | New York State Dormitory Authority, Revenue Bonds (Series 2008A), 5.00% (School District Financing Program)/(Assured Guaranty Municipal Corp. INS), 10/1/2023 | 553,950 |
| 520,000 | | New York State Dormitory Authority, Revenue Bonds (Series 2008C), 5.00% (New York State Personal Income Tax Revenue Bond Fund), 3/15/2026 | 570,320 |
| 500,000 | | New York State Dormitory Authority, Revenue Bonds (Series 2009C), 5.00% (School District Financing Program)/(Assured Guaranty Corp. INS), 10/1/2023 | 552,765 |
| 250,000 | | New York State Dormitory Authority, Revenue Bonds (Series A), 5.625% (City University of New York)/(Original Issue Yield: 5.95%), 7/1/2016 | 278,773 |
| 300,000 | | New York State Environmental Facilities Corp., Clean Water & Drinking Water Revolving Funds Revenue Bonds (Series 2008A), 5.00%, 6/15/2029 | 326,778 |
Annual Shareholder ReportPrincipal
Amount | | | Value |
| $500,000 | | New York State Environmental Facilities Corp., Clean Water & Drinking Water Revolving Funds Revenue Bonds (Series 2009A), 5.00% (Original Issue Yield: 5.26%), 6/15/2034 | 530,060 |
| 500,000 | | New York State Environmental Facilities Corp., Water Facilities Revenue Bonds (Series 2010A), 4.875% (United Waterworks Inc.), 9/1/2040 | 478,685 |
| 500,000 | | New York State Local Government Assistance Corp., Senior Lien Revenue Refunding Bonds (Series 2008 A-5/6), 5.00%, 4/1/2020 | 598,365 |
| 500,000 | | New York State Local Government Assistance Corp., Subordinate Lien Refunding Revenue Bonds (Series 2010A), 5.00%, 4/1/2023 | 583,815 |
| 490,000 | | New York State Mortgage Agency, Homeowner Mortgage Revenue Bonds (Series 156), 5.35%, 10/1/2033 | 508,086 |
| 1,000,000 | | New York State Thruway Authority, Revenue Bonds (Series 2006A), 5.00% (New York State Thruway Authority — Dedicated Highway & Bridge Trust Fund)/(AMBAC INS), 4/1/2026 | 1,077,030 |
| 250,000 | | New York State Urban Development Corp., Revenue Refunding Bonds (Series 1995), 5.70% (New York State)/(Original Issue Yield: 5.94%), 4/1/2020 | 297,850 |
| 500,000 | | New York State Urban Development Corp., Service Contract Revenue Refunding Bonds (Series 2008C), 5.00% (New York State), 1/1/2027 | 532,380 |
| 500,000 | | New York State Urban Development Corp., Subordinated Lien Revenue Bonds (Series 2004A), 5.125% (New York State), 1/1/2022 | 530,870 |
| 500,000 | | New York State, UT GO Bonds (Series 2009A), 5.00% (Original Issue Yield: 5.24%), 2/15/2039 | 529,305 |
| 500,000 | | New York State, UT GO Bonds (Series 2011A), 5.00%, 2/15/2020 | 602,725 |
| 500,000 | | Niagara County, NY IDA, Solid Waste Disposal Facility Revenue Refunding Bonds (Series 2001D), 5.55% TOBs (American Ref-Fuel Co. of Niagara, L.P. Facility) Mandatory Tender 11/15/2015 | 506,155 |
| 1,000,000 | | Port Authority of New York and New Jersey, 5.00%, 12/1/2029 | 1,052,710 |
| 500,000 | | Rensselaer County, NY IDA, Civic Facility Revenue Bonds (Series 2006), 5.00% (Rensselaer Polytechnic Institute), 3/1/2036 | 500,400 |
| 450,000 | | Syracuse, NY IDA, School Facility Revenue Bonds (Series 2008A), 5.00% (Syracuse CSD, NY)/(Assured Guaranty Municipal Corp. INS), 5/1/2028 | 478,516 |
| 500,000 | | Triborough Bridge & Tunnel Authority, NY, General Revenue Bonds (Series 2008A), 5.00% (Original Issue Yield: 5.10%), 11/15/2037 | 521,355 |
| 460,000 | | Triborough Bridge & Tunnel Authority, NY, General Revenue Bonds (Series 2009A-2), 5.00%, 11/15/2023 | 516,189 |
| 800,000 | | Westchester, NY Tobacco Asset Securitization Corp., Revenue Bonds, 5.00%, 6/1/2026 | 725,984 |
| | TOTAL | 28,968,735 |
Annual Shareholder ReportPrincipal
Amount | | | Value |
| | Puerto Rico – 3.7% | |
| $630,000 | | Commonwealth of Puerto Rico, Public Improvement UT GO Bonds (Series 2004A), 5.00% (United States Treasury PRF 7/1/2014@100), 7/1/2034 | 711,182 |
| 325,000 | | Puerto Rico Highway and Transportation Authority, Transportation Revenue Bonds (Series G), 5.00% (United States Treasury PRF 7/1/2013@100)/(Original Issue Yield: 5.10%), 7/1/2033 | 352,843 |
| 135,000 | | Puerto Rico Public Building Authority, Revenue Bonds (Series 2002D), 5.25% (Commonwealth of Puerto Rico GTD)/(Original Issue Yield: 5.40%), 7/1/2027 | 132,712 |
| | TOTAL | 1,196,737 |
| | TOTAL MUNICIPAL BONDS
(IDENTIFIED COST $28,976,720) | 30,165,472 |
| | SHORT-TERM MUNICIPALS – 6.1%1 | |
| | New York – 6.1% | |
| 600,000 | | New York City, NY Municipal Water Finance Authority, (Series 2001F-1) Daily VRDNs (Dexia Credit Local LIQ), 1.900%, 9/1/2011 | 600,000 |
| 800,000 | | New York City, NY Transitional Finance Authority, New York City Recovery Bonds (2003 Subseries 2-A) Daily VRDNs (Dexia Credit Local LIQ), 1.500%, 9/1/2011 | 800,000 |
| 600,000 | | New York City, NY, (Fiscal 2006 Series H-1) Daily VRDNs (Dexia Credit Local LOC), 2.000%, 9/1/2011 | 600,000 |
| | TOTAL SHORT-TERM MUNICIPALS
(AT AMORTIZED COST) | 2,000,000 |
| | TOTAL INVESTMENTS — 98.7%
(IDENTIFIED COST $30,976,720)2 | 32,165,472 |
| | OTHER ASSETS AND LIABILITIES - NET — 1.3%3 | 413,471 |
| | TOTAL NET ASSETS — 100% | $32,578,943 |
Securities that are subject to the federal alternative minimum tax (AMT) represent 6.4% of the Fund's portfolio as calculated based upon total market value (percentage is unaudited).
| 1 | Current rate and next reset date shown for Variable Rate Demand Notes. |
| 2 | The cost of investments for federal tax purposes amounts to $31,229,963. |
| 3 | Assets, other than investments in securities, less liabilities. See Statement of Assets and Liabilities. |
Note: The categories of investments are shown as a percentage of total net assets at August 31, 2011.
Annual Shareholder Report
Various inputs are used in determining the value of the Fund's investments. These inputs are summarized in the three broad levels listed below:Level 1 — quoted prices in active markets for identical securities, including investment companies with daily net asset values, if applicable.
Level 2 — other significant observable inputs (including quoted prices for similar securities, interest rates, prepayment speeds, credit risk, etc.). Also includes securities valued at amortized cost.
Level 3 — significant unobservable inputs (including the Fund's own assumptions in determining the fair value of investments).
The inputs or methodology used for valuing securities are not an indication of the risk associated with investing in those securities.
As of August 31, 2011, all investments of the Fund utilized level 2 inputs in valuing the Fund's assets carried at fair value.
The following acronyms are used throughout this portfolio:
| AMBAC | — American Municipal Bond Assurance Corporation |
| CSD | — Central School District |
| GO | — General Obligation |
| GTD | — Guaranteed |
| IDA | — Industrial Development Authority |
| IDRBs | — Industrial Development Revenue Bonds |
| INS | — Insured |
| LIQ | — Liquidity Agreement |
| LOC | — Letter of Credit |
| PRF | — Prerefunded |
| TOBs | — Tender Option Bonds |
| UT | — Unlimited Tax |
| VRDNs | — Variable Rate Demand Notes |
See Notes which are an integral part of the Financial Statements
Annual Shareholder Report Financial Highlights – Class A Shares
(For a Share Outstanding Throughout Each Period)
| Year Ended August 31 | 2011 | 2010 | 2009 | 2008 | 2007 |
| Net Asset Value, Beginning of Period | $10.32 | $9.71 | $9.98 | $10.36 | $10.73 |
| Income From Investment Operations: | | | | | |
| Net investment income | 0.38 | 0.38 | 0.41 | 0.43 | 0.44 |
| Net realized and unrealized gain (loss) on investments, futures contracts and swap contracts | (0.19) | 0.61 | (0.27) | (0.38) | (0.37) |
| TOTAL FROM INVESTMENT OPERATIONS | 0.19 | 0.99 | 0.14 | 0.05 | 0.07 |
| Less Distributions: | | | | | |
| Distributions from net investment income | (0.38) | (0.38) | (0.41) | (0.43) | (0.44) |
| Net Asset Value, End of Period | $10.13 | $10.32 | $9.71 | $9.98 | $10.36 |
| Total Return1 | 2.00% | 10.41% | 1.68% | 0.53% | 0.57% |
| Ratios to Average Net Assets: | | | | | |
| Net expenses | 0.76% | 0.76% | 0.76% | 0.76%2 | 0.80%3 |
| Net investment income | 3.88% | 3.82% | 4.40% | 4.25% | 4.09% |
| Expense waiver/reimbursement4 | 1.12% | 0.98% | 1.02% | 0.89% | 0.85% |
| Supplemental Data: | | | | | |
| Net assets, end of period (000 omitted) | $29,108 | $31,644 | $29,334 | $32,288 | $36,867 |
| Portfolio turnover | 11% | 26% | 12% | 20% | 21% |
| 1 | Based on net asset value, which does not reflect the sales charge, redemption fee or contingent deferred sales charge, if applicable. |
| 2 | The net expense ratio is calculated without reduction for expense offset arrangements. The net expense ratio is 0.76% for the year ended August 31, 2008, after taking into account this expense reduction. |
| 3 | Includes 0.04% of interest and trust expenses related to the Fund's participation in certain inverse floater structures. |
| 4 | This expense decrease is reflected in both the net expense and net investment income ratios shown above. |
See Notes which are an integral part of the Financial Statements
Annual Shareholder Report Financial Highlights – Class B Shares
(For a Share Outstanding Throughout Each Period)
| Year Ended August 31 | 2011 | 2010 | 2009 | 2008 | 2007 |
| Net Asset Value, Beginning of Period | $10.32 | $9.71 | $9.98 | $10.36 | $10.73 |
| Income From Investment Operations: | | | | | |
| Net investment income | 0.31 | 0.31 | 0.34 | 0.36 | 0.36 |
| Net realized and unrealized gain (loss) on investments, futures contracts and swap contracts | (0.19) | 0.61 | (0.27) | (0.38) | (0.37) |
| TOTAL FROM INVESTMENT OPERATIONS | 0.12 | 0.92 | 0.07 | (0.02) | (0.01) |
| Less Distributions: | | | | | |
| Distributions from net investment income | (0.31) | (0.31) | (0.34) | (0.36) | (0.36) |
| Net Asset Value, End of Period | $10.13 | $10.32 | $9.71 | $9.98 | $10.36 |
| Total Return1 | 1.23% | 9.58% | 0.91% | (0.23)% | (0.19)% |
| Ratios to Average Net Assets: | | | | | |
| Net expenses | 1.52% | 1.52% | 1.52% | 1.52%2 | 1.56%3 |
| Net investment income | 3.10% | 3.07% | 3.65% | 3.50% | 3.33% |
| Expense waiver/reimbursement4 | 1.10% | 0.92% | 0.96% | 0.70% | 0.60% |
| Supplemental Data: | | | | | |
| Net assets, end of period (000 omitted) | $3,471 | $9,362 | $10,511 | $12,936 | $15,951 |
| Portfolio turnover | 11% | 26% | 12% | 20% | 21% |
| 1 | Based on net asset value, which does not reflect the sales charge, redemption fee or contingent deferred sales charge, if applicable. |
| 2 | The net expense ratio is calculated without reduction for expense offset arrangements. The net expense ratio is 1.52% for the year ended August 31, 2008, after taking into account this expense reduction. |
| 3 | Includes 0.04% of interest and trust expenses related to the Fund's participation in certain inverse floater structures. |
| 4 | This expense decrease is reflected in both the net expense and net investment income ratios shown above. |
See Notes which are an integral part of the Financial Statements
Annual Shareholder Report Statement of Assets and Liabilities
August 31, 2011
| Assets: | | |
| Total investments in securities, at value (identified cost $30,976,720) | | $32,165,472 |
| Cash | | 112,872 |
| Income receivable | | 388,803 |
| Receivable for shares sold | | 109,109 |
| TOTAL ASSETS | | 32,776,256 |
| Liabilities: | | |
| Payable for shares redeemed | $102,819 | |
| Income distribution payable | 25,768 | |
| Payable for portfolio accounting fees | 35,417 | |
| Payable for transfer and dividend disbursing agent fees and expenses | 8,178 | |
| Payable for shareholder services fee (Note 5) | 6,166 | |
| Payable for share registration costs | 5,751 | |
| Payable for distribution services fee (Note 5) | 2,328 | |
| Payable for advisory fee (Note 5) | 994 | |
| Payable for Directors'/Trustees' fees | 184 | |
| Accrued expenses | 9,708 | |
| TOTAL LIABILITIES | | 197,313 |
| Net assets for 3,217,568 shares outstanding | | $32,578,943 |
| Net Assets Consist of: | | |
| Paid-in capital | | $34,925,070 |
| Net unrealized appreciation of investments | | 1,188,752 |
| Accumulated net realized loss on investments | | (3,535,137) |
| Undistributed net investment income | | 258 |
| TOTAL NET ASSETS | | $32,578,943 |
| Net Asset Value, Offering Price and Redemption Proceeds Per Share | | |
| Class A Shares | | |
| Net asset value per share ($29,108,136 ÷ 2,874,781 shares outstanding), no par value, unlimited shares authorized | | $10.13 |
| Offering price per share (100/95.50 of $10.13) | | $10.61 |
| Redemption proceeds per share | | $10.13 |
| Class B Shares | | |
| Net asset value per share ($3,470,807 ÷ 342,787 shares outstanding), no par value, unlimited shares authorized | | $10.13 |
| Offering price per share | | $10.13 |
| Redemption proceeds per share (94.50/100 of $10.13) | | $9.57 |
See Notes which are an integral part of the Financial Statements
Annual Shareholder Report Statement of Operations
Year Ended August 31, 2011
| Investment Income: | | | |
| Interest | | | $1,644,766 |
| Expenses: | | | |
| Investment adviser fee (Note 5) | | $141,867 | |
| Administrative fee (Note 5) | | 190,000 | |
| Custodian fees | | 7,801 | |
| Transfer and dividend disbursing agent fees and expenses | | 48,087 | |
| Directors'/Trustees' fees | | 2,948 | |
| Auditing fees | | 20,548 | |
| Legal fees | | 8,046 | |
| Portfolio accounting fees | | 97,499 | |
| Distribution services fee (Note 5) | | 46,642 | |
| Shareholder services fee (Note 5) | | 88,667 | |
| Share registration costs | | 33,583 | |
| Printing and postage | | 23,240 | |
| Insurance premiums | | 4,221 | |
| Miscellaneous | | 1,195 | |
| TOTAL EXPENSES | | 714,344 | |
| Waivers and Reimbursements (Note 5): | | | |
| Waiver of investment adviser fee | $(141,867) | | |
| Waiver of administrative fee | (34,645) | | |
| Reimbursement of shareholder services fee | (3,025) | | |
| Reimbursement of other operating expenses | (216,358) | | |
| TOTAL WAIVERS AND REIMBURSEMENTS | | (395,895) | |
| Net expenses | | | 318,449 |
| Net investment income | | | 1,326,317 |
| Realized and Unrealized Loss on Investments: | | | |
| Net realized loss on investments | | | (200,918) |
| Net change in unrealized appreciation of investments | | | (815,454) |
| Net realized and unrealized loss on investments | | | (1,016,372) |
| Change in net assets resulting from operations | | | $309,945 |
See Notes which are an integral part of the Financial Statements
Annual Shareholder Report Statement of Changes in Net Assets
| Year Ended August 31 | 2011 | 2010 |
| Increase (Decrease) in Net Assets | | |
| Operations: | | |
| Net investment income | $1,326,317 | $1,477,215 |
| Net realized loss on investments | (200,918) | (557,296) |
| Net change in unrealized appreciation/depreciation of investments | (815,454) | 2,996,508 |
| CHANGE IN NET ASSETS RESULTING FROM OPERATIONS | 309,945 | 3,916,427 |
| Distributions to Shareholders: | | |
| Distributions from net investment income | | |
| Class A Shares | (1,124,486) | (1,170,233) |
| Class B Shares | (191,169) | (307,511) |
| CHANGE IN NET ASSETS RESULTING FROM DISTRIBUTIONS TO SHAREHOLDERS | (1,315,655) | (1,477,744) |
| Share Transactions: | | |
| Proceeds from sale of shares | 8,877,609 | 5,761,305 |
| Net asset value of shares issued to shareholders in payment of distributions declared | 922,181 | 960,052 |
| Cost of shares redeemed | (17,221,514) | (7,998,281) |
| CHANGE IN NET ASSETS RESULTING FROM SHARE TRANSACTIONS | (7,421,724) | (1,276,924) |
| Change in net assets | (8,427,434) | 1,161,759 |
| Net Assets: | | |
| Beginning of period | 41,006,377 | 39,844,618 |
| End of period (including undistributed net investment income of $258 and $0, respectively) | $32,578,943 | $41,006,377 |
See Notes which are an integral part of the Financial Statements
Annual Shareholder Report Notes to Financial Statements
August 31, 2011
1. Organization
Federated Municipal Securities Income Trust (the “Trust”) is registered under the Investment Company Act of 1940, as amended (the “Act”), as an open-end management investment company. The Trust consists of five portfolios. The financial statements included herein are only those of Federated New York Municipal Income Fund (the “Fund”), a non-diversified portfolio. The financial statements of the other portfolios are presented separately. The assets of each portfolio are segregated and a shareholder's interest is limited to the portfolio in which shares are held. Each portfolio pays its own expenses. The Fund offers two classes of shares: Class A Shares and Class B Shares. All shares of the Fund have equal rights with respect to voting, except on class-specific matters. The investment objective of the Fund is to provide current income exempt from federal regular income tax (federal regular income tax does not include the AMT), and the personal income taxes imposed by the state of New York and New York municipalities. Interest income from the Fund's investments may be subject to the federal AMT for individuals and corporations.
2. Significant Accounting Policies
The following is a summary of significant accounting policies consistently followed by the Fund in the preparation of its financial statements. These policies are in conformity with U.S. generally accepted accounting principles (GAAP).
Investment Valuation
In calculating its net asset value (NAV), the Fund generally values investments as follows:
- Fixed-income securities acquired with remaining maturities greater than 60 days are fair valued using price evaluations provided by a pricing service approved by the Board of Trustees (the “Trustees”).
- Fixed-income securities acquired with remaining maturities of 60 days or less are valued at their cost (adjusted for the accretion of any discount or amortization of any premium), which approximates market value.
- Derivative contracts listed on exchanges are valued at their reported settlement or closing price.
- Over-the-counter (OTC) derivative contracts are fair valued using price evaluations provided by a pricing service approved by the Trustees.
- Shares of other mutual funds are valued based upon their reported NAVs.
- For securities that are fair valued in accordance with procedures established by and under the general supervision of the Trustees, certain factors may be considered such as: the purchase price of the security, information obtained by contacting the issuer, analysis of the issuer's financial statements or other available documents, fundamental analytical data, the nature and duration of restrictions on disposition, the movement of the market in which the security is normally traded and public trading in similar securities of the issuer or comparable issuers.
Annual Shareholder Report
If the Fund cannot obtain a price or price evaluation from a pricing service for an investment, the Fund may attempt to value the investment based upon the mean of bid and asked quotations or fair value the investment based on price evaluations, from one or more dealers. If any price, quotation, price evaluation or other pricing source is not readily available when the NAV is calculated, the Fund uses the fair value of the investment determined in accordance with the procedures described below. There can be no assurance that the Fund could purchase or sell an investment at the price used to calculate the Fund's NAV.Fair Valuation and Significant Events Procedures
The Trustees have authorized the use of pricing services to provide evaluations of the current fair value of certain investments for purposes of calculating the NAV. Factors considered by pricing services in evaluating an investment include the yields or prices of investments of comparable quality, coupon, maturity, call rights and other potential prepayments, terms and type, reported transactions, indications as to values from dealers and general market conditions. Some pricing services provide a single price evaluation reflecting the bid-side of the market for an investment (a “bid” evaluation). Other pricing services offer both bid evaluations and price evaluations indicative of a price between the prices bid and asked for the investment (a “mid” evaluation). The Fund normally uses bid evaluations for U.S. Treasury and Agency securities, mortgage-backed securities and municipal securities. The Fund normally uses mid evaluations for other types of fixed-income securities and OTC derivative contracts. In the event that market quotations and price evaluations are not available for an investment, the fair value of the investment is determined in accordance with procedures adopted by the Trustees.
The Trustees also have adopted procedures requiring an investment to be priced at its fair value whenever the Adviser determines that a significant event affecting the value of the investment has occurred between the time as of which the price of the investment would otherwise be determined and the time as of which the NAV is computed. An event is considered significant if there is both an affirmative expectation that the investment's value will change in response to the event and a reasonable basis for quantifying the resulting change in value. Examples of significant events that may occur after the close of the principal market on which a security is traded, or after the time of a price evaluation provided by a pricing service or a dealer, include:
- With respect to price evaluations of fixed-income securities determined before the close of regular trading on the NYSE, actions by the Federal Reserve Open Market Committee and other significant trends in U.S. fixed-income markets;
- Political or other developments affecting the economy or markets in which an issuer conducts its operations or its securities are traded; and
- Announcements concerning matters such as acquisitions, recapitalizations, litigation developments, a natural disaster affecting the issuer's operations or regulatory changes or market developments affecting the issuer's industry.
The Fund may seek to obtain more current quotations or price evaluations from alternative pricing sources. If a reliable alternative pricing source is not available, the Fund will determine the fair value of the investment using another method approved by the Trustees.
Annual Shareholder Report
Investment Income, Gains and Losses, Expenses and Distributions
Investment transactions are accounted for on a trade-date basis. Realized gains and losses from investment transactions are recorded on an identified-cost basis. Interest income and expenses are accrued daily. Distributions to shareholders are recorded on the ex-dividend date. Distributions of net investment income are declared daily and paid monthly. Non-cash dividends included in dividend income, if any, are recorded at fair value. Investment income, realized and unrealized gains and losses and certain fund-level expenses are allocated to each class based on relative average daily net assets, except that each class may bear certain expenses unique to that class such as distribution services and shareholder services fees. Dividends are declared separately for each class. No class has preferential dividend rights; differences in per share dividend rates are generally due to differences in separate class expenses.
Premium and Discount Amortization
All premiums and discounts on fixed-income securities are amortized/accreted using the effective interest rate method.
Federal Taxes
It is the Fund's policy to comply with the Subchapter M provision of the Internal Revenue Code and to distribute to shareholders each year substantially all of its income. Accordingly, no provision for federal income tax is necessary. As of and during the year ended August 31, 2011, the Fund did not have a liability for any uncertain tax positions. The Fund recognizes interest and penalties, if any, related to tax liabilities as income tax expense in the Statement of Operations. As of August 31, 2011, tax years 2008 through 2011 remain subject to examination by the Fund's major tax jurisdictions, which include the United States of America and the Commonwealth of Massachusetts.
When-Issued and Delayed Delivery Transactions
The Fund may engage in when-issued or delayed delivery transactions. The Fund records when-issued securities on the trade date and maintains security positions such that sufficient liquid assets will be available to make payment for the securities purchased. Securities purchased on a when-issued or delayed delivery basis are marked to market daily and begin earning interest on the settlement date. Losses may occur on these transactions due to changes in market conditions or the failure of counterparties to perform under the contract.
Other
The preparation of financial statements in conformity with GAAP requires management to make estimates and assumptions that affect the amounts of assets, liabilities, expenses and revenues reported in the financial statements. Actual results could differ from those estimated.
Annual Shareholder Report
3. Shares of Beneficial InterestThe following tables summarize share activity:
| Year Ended August 31 | 2011 | 2010 |
| Class A Shares: | Shares | Amount | Shares | Amount |
| Shares sold | 879,289 | $8,635,803 | 539,276 | $5,409,700 |
| Shares issued to shareholders in payment of distributions declared | 78,438 | 775,315 | 72,926 | 730,282 |
| Shares redeemed | (1,149,363) | (11,236,870) | (565,521) | (5,667,664) |
| NET CHANGE RESULTING FROM CLASS A SHARE TRANSACTIONS | (191,636) | $(1,825,752) | 46,681 | $472,318 |
| Year Ended August 31 | 2011 | 2010 |
| Class B Shares: | Shares | Amount | Shares | Amount |
| Shares sold | 24,596 | $241,806 | 35,133 | $351,605 |
| Shares issued to shareholders in payment of distributions declared | 14,855 | 146,866 | 22,959 | 229,770 |
| Shares redeemed | (603,865) | (5,984,644) | (232,994) | (2,330,617) |
| NET CHANGE RESULTING FROM CLASS B SHARE TRANSACTIONS | (564,414) | $(5,595,972) | (174,902) | $(1,749,242) |
| NET CHANGE RESULTING FROM TOTAL FUND SHARE TRANSACTIONS | (756,050) | $(7,421,724) | (128,221) | $(1,276,924) |
4. Federal Tax Information
The timing and character of income and capital gain distributions are determined in accordance with income tax regulations, which may differ from GAAP. These differences are due to differing treatments for discount accretion/premium amortization on debt securities and for expiration of capital loss carryforwards.
For the year ended August 31, 2011, permanent differences identified and reclassified among the components of net assets were as follows:
| Increase (Decrease) |
| Paid-In Capital | Undistributed
Net Investment
Income (Loss) | Accumulated
Net Realized
Gain (Loss) |
| $(371,903) | $(10,404) | $382,307 |
Net investment income (loss), net realized gains (losses) and net assets were not affected by this reclassification.
Annual Shareholder Report
The tax character of distributions as reported on the Statement of Changes in Net Assets for the year ended August 31, 2011 and 2010, was as follows: | 2011 | 2010 |
| Tax-exempt income | $1,315,655 | $1,477,744 |
As of August 31, 2011, the components of distributable earnings on a tax basis were as follows:
| Undistributed tax-exempt income | $258 |
| Net unrealized appreciation | $935,509 |
| Capital loss carryforwards and deferrals | $(3,281,894) |
The difference between book-basis and tax-basis net unrealized appreciation/depreciation is attributable to differing treatments for defaulted securities and discount accretion/premium amortization on debt securities.
At August 31, 2011, the cost of investments for federal tax purposes was $31,229,963. The net unrealized appreciation of investments for federal tax purposes was $935,509. This consists of net unrealized appreciation from investments for those securities having an excess of value over cost of $1,214,442 and net unrealized depreciation from investments for those securities having an excess of cost over value of $278,933.
At August 31, 2011, the Fund had a capital loss carryforward of $3,075,938 which will reduce the Fund's taxable income arising from future net realized gains on investments, if any, to the extent permitted by the Code and thus will reduce the amount of distributions to shareholders which would otherwise be necessary to relieve the Fund of any liability for federal income tax. Pursuant to the Code, such capital loss carryforward will expire as follows:
| Expiration Year | Expiration Amount |
| 2012 | $4,752 |
| 2013 | $318,023 |
| 2016 | $249,898 |
| 2017 | $958,822 |
| 2018 | $1,218,820 |
| 2019 | $325,623 |
Capital loss carryforwards of $371,903 expired during the year ended August 31, 2011.
Under current tax regulations, capital losses on securities transactions realized after October 31 may be deferred and treated as occurring on the first day of the following fiscal year. As of August 31, 2011, for federal income tax purposes, post-October losses of $205,956 were deferred to September 1, 2011.
Under the recently enacted Regulated Investment Company Modernization Act of 2010, the Fund will be permitted to carry forward capital losses incurred in taxable years beginning after December 22, 2010, for an unlimited period. However, any losses incurred during those future years will be required to be utilized prior to the losses incurred in pre-enactment tax years. As a result of this ordering rule, pre-enactment capital loss carryforwards may be more likely to expire unused. Additionally, post-enactment capital losses that are carried forward will retain their character as either short-term or long-term capital losses rather than being considered all short-term as under previous law.
Annual Shareholder Report
5. Investment Adviser Fee and Other Transactions with AffiliatesInvestment Adviser Fee
Federated Investment Management Company is the Fund's investment adviser (the “Adviser”). The advisory agreement between the Fund and the Adviser provides for an annual fee equal to 0.40% of the Fund's average daily net assets. Subject to the terms described in the Expense Limitation note, the Adviser may voluntarily choose to waive any portion of its fee and/or reimburse certain operating expenses of the Fund. For the year ended August 31, 2011, the Adviser voluntarily waived its entire fee of $141,867 and voluntarily reimbursed $216,358 of other operating expenses.
Administrative Fee
Federated Administrative Services (FAS), under the Administrative Services Agreement, provides the Fund with administrative personnel and services. The fee paid to FAS is based on the average aggregate daily net assets of certain Federated funds as specified below:
| Administrative Fee | Average Aggregate Daily Net Assets
of the Federated Funds |
| 0.150% | on the first $5 billion |
| 0.125% | on the next $5 billion |
| 0.100% | on the next $10 billion |
| 0.075% | on assets in excess of $20 billion |
The administrative fee received during any fiscal year shall be at least $150,000 per portfolio and $40,000 per each additional class of Shares. Subject to the terms described in the Expense Limitation note, FAS may voluntarily choose to waive any portion of its fee. For the year ended August 31, 2011, FAS waived $34,645 of its fee. The net fee paid to FAS was 0.438% of average daily net assets of the Fund. The Fund is currently being charged the minimum administrative fee; therefore the fee as a percentage of average aggregate daily net assets is greater than the amounts presented in the chart above.
Distribution Services Fee
The Fund has adopted a Distribution Plan (the “Plan”) pursuant to Rule 12b-1 under the Act. Under the terms of the Plan, the Fund will compensate Federated Securities Corp. (FSC), the principal distributor, from the daily net assets of the Fund's Class A Shares and Class B Shares to finance activities intended to result in the sale of these shares. The Plan provides that the Fund may incur distribution expenses at the following percentages of average daily net assets annually, to compensate FSC:
| Share Class Name | Percentage of Average Daily
Net Assets of Class |
| Class A Shares | 0.05% |
| Class B Shares | 0.75% |
Annual Shareholder Report
Subject to the terms described in the Expense Limitation note, FSC may voluntarily choose to waive any portion of its fee. For the year ended August 31, 2011, distribution services fees for the Fund were as follows: | Distribution
Services Fees
Incurred |
| Class B Shares | $46,642 |
When FSC receives fees, it may pay some or all of them to financial intermediaries whose customers purchase shares. For the year ended August 31, 2011, FSC retained $2,931 of fees paid by the fund. For the year ended August 31, 2011, the Fund's Class A Shares did not incur a distribution services fee; however it may begin to incur this fee upon approval of the Trustees.
Sales Charges
Front-end sales charges and contingent deferred sales charges (CDSC) do not represent expenses of the Fund. They are deducted from the proceeds of sales of Fund shares prior to investment or from redemption proceeds prior to remittance, as applicable. For the year ended August 31, 2011, FSC retained $4,554 in sales charges from the sale of Class A Shares.
Shareholder Services Fee
The Fund may pay fees (“Service Fees”) up to 0.25% of the average daily net assets of the Fund's Class A Shares and Class B Shares to financial intermediaries or to Federated Shareholder Services Company (FSSC) for providing services to shareholders and maintaining shareholder accounts. Subject to the terms described in the Expense Limitation note, FSSC may voluntarily reimburse the Fund for Service Fees. In addition, unaffiliated third-party financial intermediaries may waive Service Fees. This waiver can be modified or terminated at any time. For the year ended August 31, 2011, Service Fees for the Fund were as follows:
| Service Fees
Incurred | Service Fees
Reimbursed |
| Class A Shares | $73,120 | $(3,025) |
| Class B Shares | 15,547 | — |
| TOTAL | $88,667 | $(3,025) |
For the year ended August 31, 2011, FSSC did not receive any fees paid by the Fund.
Interfund Transactions
During the year ended August 31, 2011, the Fund engaged in purchase and sale transactions with funds that have a common investment adviser (or affiliated investment advisers), common Directors/Trustees and/or common Officers. These purchase and sale transactions complied with Rule 17a-7 under the Act and amounted to $13,900,000 and $12,750,000, respectively.
Annual Shareholder Report
Expense Limitation
The Adviser and its affiliates (which may include FSC, FAS and FSSC) have voluntarily agreed to waive their fees and/or reimburse expenses so that the total annual Fund operating expenses (as shown in the financial highlights) paid by the Fund's Class A Shares and Class B Shares (after the voluntary waivers and/or reimbursements) will not exceed 0.76% and 1.52% (the “Fee Limit”), respectively, up to but not including the later of (the “Termination Date”): (a) November 1, 2012; or (b) the date of the Fund's next effective Prospectus. While the Adviser and its affiliates currently do not anticipate terminating or increasing these arrangements prior to the Termination Date, these arrangements may only be terminated, or the Fee Limit increased, prior to the Termination Date with the agreement of the Fund's Trustees.
General
Certain Officers and Trustees of the Fund are Officers and Directors or Trustees of the above companies.
6. Investment Transactions
Purchases and sales of investments, excluding long-term U.S. government securities and short-term obligations, for the year ended August 31, 2011, were as follows:
| Purchases | $3,848,483 |
| Sales | $11,510,394 |
7. Concentration of Risk
Since the Fund invests a substantial portion of its assets in issuers located in one state, it will be more susceptible to factors adversely affecting issuers of that state than would be a comparable tax-exempt mutual fund that invests nationally. In order to reduce the credit risk associated with such factors, at August 31, 2011, 20.4% of the securities in the portfolio of investments is backed by letters of credit or bond insurance of various financial institutions and financial guaranty assurance agencies. The largest percentage of investments insured by or supported (backed) by a letter of credit from any one institution or agency was 6.8% of total investments.
8. Line of Credit
The Fund participates in a $100,000,000 unsecured, uncommitted revolving line of credit (LOC) agreement with PNC Bank. The LOC was made available for extraordinary or emergency purposes, primarily for financing redemption payments. Borrowings are charged interest at a rate offered to the Fund by PNC Bank at the time of the borrowing. As of August 31, 2011, there were no outstanding loans. During the year ended August 31, 2011, the Fund did not utilize the LOC.
9. Interfund Lending
Pursuant to an Exemptive Order issued by the Securities and Exchange Commission, the Fund, along with other funds advised by subsidiaries of Federated Investors, Inc., may participate in an interfund lending program. This program provides an alternative credit facility allowing the funds to borrow from other participating affiliated funds. As of August 31, 2011, there were no outstanding loans. During the year ended August 31, 2011, the program was not utilized.
Annual Shareholder Report
10. Recent Accounting PronouncementsIn April 2011, the Financial Accounting Standards Board (FASB) released Accounting Standards Update (ASU) No. 2011-03, “Reconsideration of Effective Control for Repurchase Agreements.” This ASU amends FASB Accounting Standards Codification (ASC) Topic 860, “Transfers and Servicing”; specifically the criteria required to determine whether a repurchase agreement and similar agreements should be accounted for as sales of financial assets or secured borrowings with commitments. This ASU is effective for fiscal years and interim periods beginning after December 15, 2011. At this time, management is evaluating the implications of adopting ASU No. 2011-03 and its impact on the Fund's financial statements and the accompanying notes, net assets and results of operations.
In addition, in May 2011, FASB released ASU No. 2011-04, “Amendments to Achieve Common Fair Value Measurement and Disclosure Requirements in U.S. GAAP and IFRSs.” This ASU amends FASB ASC Topic 820, “Fair Value Measurement,” to establish common requirements for measuring fair value and for disclosing information about fair value measurements in accordance with GAAP. This ASU is effective for fiscal years and interim periods beginning after December 15, 2011. At this time, management is evaluating the implications of adopting ASU No. 2011-04 and its impact on the Fund's financial statements and the accompanying notes.
11. Federal Tax Information (unaudited)
For the fiscal year ended August 31, 2011, 100% of distributions from net investment income is exempt from federal income tax, other than the federal AMT.
Annual Shareholder Report Report of Independent Registered Public Accounting Firm
TO THE BOARD OF TRUSTEES OF federated municipal securities income trust and shareholders of federated New york municipal income FUND:
We have audited the accompanying statement of assets and liabilities, including the portfolio of investments, of Federated New York Municipal Income Fund (the “Fund”), a portfolio of Federated Municipal Securities Income Trust, as of August 31, 2011, and the related statement of operations for the year then ended, the statements of changes in net assets for each of the years in the two-year period then ended, and the financial highlights for each of the years in the five-year period then ended. These financial statements and financial highlights are the responsibility of the Fund's management. Our responsibility is to express an opinion on these financial statements and financial highlights based on our audit.
We conducted our audits in accordance with the standards of the Public Company Accounting Oversight Board (United States). Those standards require that we plan and perform the audit to obtain reasonable assurance about whether the financial statements and financial highlights are free of material misstatement. An audit includes examining, on a test basis, evidence supporting the amounts and disclosures in the financial statements. Our procedures included confirmation of securities owned as of August 31, 2011, by correspondence with the custodian, transfer agent and brokers or by other appropriate auditing procedures. An audit also includes assessing the accounting principles used and significant estimates made by management, as well as evaluating the overall financial statement presentation. We believe that our audits provide a reasonable basis for our opinion.
In our opinion, the financial statements and financial highlights referred to above present fairly, in all material respects, the financial position of Federated New York Municipal Income Fund as of August 31, 2011, and the results of its operations for the year then ended, the changes in its net assets for each of the years in the two-year period then ended, and the financial highlights for each of the years in the five-year period then ended, in conformity with U.S. generally accepted accounting principles.
Boston, Massachusetts
October 24, 2011
Annual Shareholder Report Shareholder Expense Example (unaudited)
As a shareholder of the Fund, you incur two types of costs: (1) transaction costs, including sales charges (loads) on purchase or redemption payments; and (2) ongoing costs, including management fees and to the extent applicable, distribution (12b-1) fees and/or shareholder services fees and other Fund expenses. This Example is intended to help you to understand your ongoing costs (in dollars) of investing in the Fund and to compare these costs with the ongoing costs of investing in other mutual funds. It is based on an investment of $1,000 invested at the beginning of the period and held for the entire period from March 1, 2011 to August 31, 2011.
ACTUAL EXPENSES
The first section of the table below provides information about actual account values and actual expenses. You may use the information in this section, together with the amount you invested, to estimate the expenses that you incurred over the period. Simply divide your account value by $1,000 (for example, an $8,600 account value divided by $1,000 = 8.6), then multiply the result by the number in the first section under the heading entitled “Expenses Paid During Period” to estimate the expenses attributable to your investment during this period.
HYPOTHETICAL EXAMPLE FOR COMPARISON PURPOSES
The second section of the table below provides information about hypothetical account values and hypothetical expenses based on the Fund's actual expense ratio and an assumed rate of return of 5% per year before expenses, which is not the Fund's actual return. Thus, you should not use the hypothetical account values and expenses to estimate the actual ending account balance or your expenses for the period. Rather, these figures are required to be provided to enable you to compare the ongoing costs of investing in the Fund with other funds. To do so, compare this 5% hypothetical example with the 5% hypothetical examples that appear in the shareholder reports of the other funds.
Annual Shareholder Report
Please note that the expenses shown in the table are meant to highlight your ongoing costs only and do not reflect any transaction costs, such as sales charges (“loads”) on purchase or redemption payments. Therefore, the second section of the table is useful in comparing ongoing costs only, and will not help you determine the relative total costs of owning different funds. In addition, if these transaction costs were included, your costs would have been higher. | Beginning
Account Value
3/1/2011 | Ending
Account Value
8/31/2011 | Expenses Paid
During Period1 |
| Actual: | | | |
| Class A Shares | $1,000 | $1,066.80 | $3.96 |
| Class B Shares | $1,000 | $1,062.80 | $7.90 |
Hypothetical (assuming a 5% return
before expenses): | | | |
| Class A Shares | $1,000 | $1,021.37 | $3.87 |
| Class B Shares | $1,000 | $1,017.54 | $7.73 |
| 1 | Expenses are equal to the Fund's annualized net expense ratios, multiplied by the average account value over the period, multiplied by 184/365 (to reflect the one-half-year period). The annualized net expense ratios are as follows: |
| Class A Shares | 0.76% |
| Class B Shares | 1.52% |
Annual Shareholder Report Board of Trustees and Trust Officers
The Board of Trustees is responsible for managing the Trust's business affairs and for exercising all the Trust's powers except those reserved for the shareholders. The following tables give information about each Trustee and the senior officers of the Fund. Where required, the tables separately list Trustees who are “interested persons” of the Fund (i.e., “Interested” Trustees) and those who are not (i.e., “Independent” Trustees). Unless otherwise noted, the address of each person listed is Federated Investors Tower, 1001 Liberty Avenue, Pittsburgh, PA 15222. The address of all Independent Trustees listed is 4000 Ericsson Drive, Warrendale, PA 15086-7561; Attention: Mutual Fund Board. As of December 31, 2010, the Trust comprised five portfolio(s), and the Federated Fund Family consisted of 43 investment companies (comprising 136 portfolios). Unless otherwise noted, each Officer is elected annually. Unless otherwise noted, each Trustee oversees all portfolios in the Federated Fund Family and serves for an indefinite term. The Fund's Statement of Additional Information includes additional information about Trust Trustees and is available, without charge and upon request, by calling 1-800-341-7400.
Interested TRUSTEES Background
Name
Birth Date
Positions Held with Trust
Date Service Began | Principal Occupation(s) for Past Five Years,
Other Directorships Held and Previous Position(s) |
John F. Donahue*
Birth Date: July 28, 1924
Trustee
Began serving: August 1990 | Principal Occupations: Director or Trustee of the Federated Fund Family; Chairman and Director, Federated Investors, Inc.; Chairman of the Federated Fund Family's Executive Committee.
Previous Positions: Chairman of the Federated Fund Family; Trustee, Federated Investment Management Company; Chairman and Director, Federated Investment Counseling. |
J. Christopher Donahue*
Birth Date: April 11, 1949
President and Trustee
Began serving: August 1990 | Principal Occupations: Principal Executive Officer and President of the Federated Fund Family; Director or Trustee of some of the Funds in the Federated Fund Family; President, Chief Executive Officer and Director, Federated Investors, Inc.; Chairman and Trustee, Federated Investment Management Company; Trustee, Federated Investment Counseling; Chairman and Director, Federated Global Investment Management Corp.; Chairman, Federated Equity Management Company of Pennsylvania and Passport Research, Ltd. (investment advisory subsidiary of Federated); Trustee, Federated Shareholder Services Company; Director, Federated Services Company.
Previous Positions: President, Federated Investment Counseling; President and Chief Executive Officer, Federated Investment Management Company, Federated Global Investment Management Corp. and Passport Research, Ltd. |
| * | Family relationships and reasons for “interested” status: John F. Donahue is the father of J. Christopher Donahue; both are “interested” due to their beneficial ownership of shares of Federated Investors, Inc. and the positions they hold with Federated and its subsidiaries. |
Annual Shareholder Report INDEPENDENT TRUSTEES Background
Name
Birth Date
Positions Held with Trust
Date Service Began | Principal Occupation(s) for Past Five Years,
Other Directorships Held, Previous Position(s) and Qualifications |
Nicholas P. Constantakis, CPA
Birth Date: September 3, 1939
Trustee
Began serving: February 1998 | Principal Occupation: Director or Trustee of the Federated Fund Family.
Other Directorship Held: Director and Chairman of the Audit Committee, Michael Baker Corporation (architecture, engineering and construction services).
Previous Position: Partner, Andersen Worldwide SC.
Qualifications: Public accounting and director experience. |
John F. Cunningham
Birth Date: March 5, 1943
Trustee
Began serving: June 1999 | Principal Occupation: Director or Trustee of the Federated Fund Family.
Other Directorships Held: Chairman, President and Chief Executive Officer, Cunningham & Co., Inc. (strategic business consulting); Trustee Associate, Boston College.
Previous Positions: Director, Redgate Communications and EMC Corporation (computer storage systems); Chairman of the Board and Chief Executive Officer, Computer Consoles, Inc.; President and Chief Operating Officer, Wang Laboratories; Director, First National Bank of Boston; Director, Apollo Computer, Inc.
Qualifications: Business management and director experience. |
Maureen Lally-Green
Birth Date: July 5, 1949
Trustee
Began serving: August 2009 | Principal Occupations: Director or Trustee of the Federated Fund Family; Director, Office of Church Relations, Diocese of Pittsburgh; Adjunct Professor of Law, Duquesne University School of Law.
Other Directorships Held: Director, Auberle; Trustee, St. Francis University; Director, Ireland Institute of Pittsburgh; Director, UPMC Mercy Hospital; Regent, St. Vincent Seminary; Director, Epilepsy Foundation of Western and Central Pennsylvania; Director, Saint Thomas More Society, Allegheny County; Director, Carlow University.
Previous Position: Pennsylvania Superior Court Judge.
Qualifications: Legal and director experience. |
Peter E. Madden
Birth Date: March 16, 1942
Trustee
Began serving: August 1991 | Principal Occupation: Director or Trustee, and Chairman of the Board of Directors or Trustees, of the Federated Fund Family.
Previous Positions: Representative, Commonwealth of Massachusetts General Court; President, Chief Operating Officer and Director, State Street Bank and Trust Company and State Street Corporation (retired); Director, VISA USA and VISA International; Chairman and Director, Massachusetts Bankers Association; Director, Depository Trust Corporation; Director, The Boston Stock Exchange.
Qualifications: Business management, mutual fund services and director experience. |
Annual Shareholder ReportName
Birth Date
Positions Held with Trust
Date Service Began | Principal Occupation(s) for Past Five Years,
Other Directorships Held, Previous Position(s) and Qualifications |
Charles F. Mansfield, Jr.
Birth Date: April 10, 1945
Trustee
Began serving: January 1999 | Principal Occupations: Director or Trustee and Chairman of the Audit Committee of the Federated Fund Family; Management Consultant.
Previous Positions: Chief Executive Officer, PBTC International Bank; Partner, Arthur Young & Company (now Ernst & Young LLP); Chief Financial Officer of Retail Banking Sector, Chase Manhattan Bank; Senior Vice President, HSBC Bank USA (formerly, Marine Midland Bank); Vice President, Citibank; Assistant Professor of Banking and Finance, Frank G. Zarb School of Business, Hofstra University; Executive Vice President, DVC Group, Inc. (marketing, communications and technology).
Qualifications: Banking, business management, education and director experience. |
R. James Nicholson
Birth Date: February 4, 1938
Trustee
Began serving: January 2008 | Principal Occupations: Director or Trustee of the Federated Fund Family; Senior Counsel, Brownstein Hyatt Farber Schrek, P.C.; Former Secretary of the U.S. Dept. of Veterans Affairs; Former U.S. Ambassador to the Holy See; Former Chairman of the Republican National Committee.
Other Directorships Held: Director, Horatio Alger Association; Director, The Daniels Fund.
Previous Positions: Colonel, U.S. Army Reserve; Partner, Calkins, Kramer, Grimshaw and Harring, P.C.; General Counsel, Colorado Association of Housing and Building; Chairman and CEO, Nicholson Enterprises, Inc. (real estate holding company); Chairman and CEO, Renaissance Homes of Colorado.
Qualifications: Legal, government, business management and director experience. |
Thomas M. O'Neill
Birth Date: June 14, 1951
Trustee
Began serving: October 2006 | Principal Occupations: Director or Trustee of the Federated Fund Family; Sole Proprietor, Navigator Management Company (investment and strategic consulting).
Other Directorships Held: Board of Overseers, Children's Hospital of Boston; Visiting Committee on Athletics, Harvard College.
Previous Positions: Chief Executive Officer and President, Managing Director and Chief Investment Officer, Fleet Investment Advisors; President and Chief Executive Officer, Aeltus Investment Management, Inc.; General Partner, Hellman, Jordan Management Co., Boston, MA; Chief Investment Officer, The Putnam Companies, Boston, MA; Credit Analyst and Lending Officer, Fleet Bank; Director and Consultant, EZE Castle Software (investment order management software); Director, Midway Pacific (lumber).
Qualifications: Business management, mutual fund, director and investment experience. |
Annual Shareholder ReportName
Birth Date
Positions Held with Trust
Date Service Began | Principal Occupation(s) for Past Five Years,
Other Directorships Held, Previous Position(s) and Qualifications |
John S. Walsh
Birth Date: November 28, 1957
Trustee
Began serving: June 1999 | Principal Occupations: Director or Trustee of the Federated Fund Family; President and Director, Heat Wagon, Inc. (manufacturer of construction temporary heaters); President and Director, Manufacturers Products, Inc. (distributor of portable construction heaters); President, Portable Heater Parts, a division of Manufacturers Products, Inc.
Previous Position: Vice President, Walsh & Kelly, Inc.
Qualifications: Business management and director experience. |
James F. Will
Birth Date: October 12, 1938
Trustee
Began serving: April 2006 | Principal Occupations: Director or Trustee of the Federated Fund Family; formerly, Vice Chancellor and President, Saint Vincent College.
Other Directorships Held: Trustee, Saint Vincent College; Director, Alleghany Corporation; Trustee, Wheeling Jesuit University; Director, Liberty Tire Recycling.
Previous Positions: Chairman, President and Chief Executive Officer, Armco, Inc.; President and Chief Executive Officer, Cyclops Industries; President and Chief Operating Officer, Kaiser Steel Corporation.
Qualifications: Business management, education and director experience. |
OFFICERS
Name
Birth Date
Positions Held with Trust
Date Service Began | Principal Occupation(s) for Past Five Years
and Previous Position(s) |
John W. McGonigle
Birth Date: October 26, 1938
EXECUTIVE VICE PRESIDENT AND SECRETARY
Began serving: August 1990 | Principal Occupations: Executive Vice President and Secretary of the Federated Fund Family; Vice Chairman, Executive Vice President, Secretary and Director, Federated Investors, Inc.
Previous Positions: Trustee, Federated Investment Management Company and Federated Investment Counseling; Director, Federated Global Investment Management Corp., Federated Services Company and Federated Securities Corp. |
Richard A. Novak
Birth Date: December 25, 1963
TREASURER
Began serving: January 2006 | Principal Occupations: Principal Financial Officer and Treasurer of the Federated Fund Family; Senior Vice President, Federated Administrative Services; Financial and Operations Principal for Federated Securities Corp., Edgewood Services, Inc. and Southpointe Distribution Services, Inc.
Previous Positions: Controller of Federated Investors, Inc.; Vice President, Finance of Federated Services Company; held various financial management positions within The Mercy Hospital of Pittsburgh; Auditor, Arthur Andersen & Co. |
Annual Shareholder ReportName
Birth Date
Positions Held with Trust
Date Service Began | Principal Occupation(s) for Past Five Years
and Previous Position(s) |
Richard B. Fisher
Birth Date: May 17, 1923
VICE CHAIRMAN
Began serving: August 2002 | Principal Occupations: Vice Chairman or Vice President of some of the Funds in the Federated Fund Family; Vice Chairman, Federated Investors, Inc.; Chairman, Federated Securities Corp.
Previous Positions: President and Director or Trustee of some of the Funds in the Federated Fund Family; Executive Vice President, Federated Investors, Inc.; Director and Chief Executive Officer, Federated Securities Corp. |
Brian P. Bouda
Birth Date: February 28, 1947
CHIEF COMPLIANCE OFFICER AND SENIOR VICE PRESIDENT
Began serving: August 2004 | Principal Occupations: Senior Vice President and Chief Compliance Officer of the Federated Fund Family; Vice President and Chief Compliance Officer of Federated Investors, Inc. and Chief Compliance Officer of its subsidiaries. Mr. Bouda joined Federated in 1999 and is a member of the American Bar Association and the State Bar Association of Wisconsin. |
Robert J. Ostrowski
Birth Date: April 26, 1963
CHIEF INVESTMENT OFFICER
Began serving: May 2004 | Principal Occupations: Robert J. Ostrowski joined Federated in 1987 as an Investment Analyst and became a Portfolio Manager in 1990. He was named Chief Investment Officer of taxable fixed-income products in 2004 and also serves as a Senior Portfolio Manager. Mr. Ostrowski became an Executive Vice President of the Fund's Adviser in 2009 and served as a Senior Vice President of the Fund's Adviser from 1997 to 2009. Mr. Ostrowski has received the Chartered Financial Analyst designation. He received his M.S. in Industrial Administration from Carnegie Mellon University. |
J. Scott Albrecht
Birth Date: June 1, 1960
VICE PRESIDENT
Began serving: November 1999 | Principal Occupations: J. Scott Albrecht has been the Fund's portfolio manager since March 1995. He is Vice President of the Trust. Mr. Albrecht joined Federated in 1989. He became a Senior Vice President of the Fund's Adviser in January 2005 and served as a Vice President of the Fund's Adviser from 1994 through 2004. He has been a Senior Portfolio Manager since 1997 and was a Portfolio Manager from 1994 to 1996. Mr. Albrecht has received the Chartered Financial Analyst designation and holds an M.S. in Public Management from Carnegie Mellon University. |
Annual Shareholder Report Evaluation and Approval of Advisory Contract – May 2011
federated new york municipal income fund (the “Fund”)
The Fund's Board reviewed the Fund's investment advisory contract at meetings held in May 2011. The Board's decision regarding the contract reflects the exercise of its business judgment on whether to continue the existing arrangements.
In this connection, the Federated Funds' Board had previously appointed a Senior Officer, whose duties include specified responsibilities relating to the process by which advisory fees are to be charged to a Federated fund. The Senior Officer has the authority to retain consultants, experts, or staff as may be reasonably necessary to assist in the performance of his duties, reports directly to the Board, and may be terminated only with the approval of a majority of the independent members of the Board. The Senior Officer prepared and furnished to the Board an independent, written evaluation that covered topics discussed below (the “Evaluation”). The Board considered that Evaluation, along with other information, in deciding to approve the advisory contract.
During its review of the contract, the Board considered compensation and benefits received by the Adviser. This included the fees received for services provided to the Fund by other entities in the Federated organization and research services (if any) received by the Adviser from brokers that execute Federated fund trades, as well as advisory fees. The Board is also familiar with and considered judicial decisions concerning allegedly excessive investment advisory fees, which have indicated that the following factors may be relevant to an Adviser's fiduciary duty with respect to its receipt of compensation from a fund: the nature and quality of the services provided by the Adviser, including the performance of the fund; the Adviser's cost of providing the services; the extent to which the Adviser may realize “economies of scale” as a fund grows larger; any indirect benefits that may accrue to the Adviser and its affiliates as a result of the Adviser's relationship with a fund; performance and expenses of comparable funds; and the extent to which the independent Board members are fully informed about all facts the Board deems relevant bearing on the Adviser's services and fees. The Board further considered management fees (including any components thereof) charged to institutional and other clients of the Adviser for what might be viewed as like services, and the cost to the Adviser and its affiliates of supplying services pursuant to the management fee agreements, excluding any intra-corporate profit and profit margins of the Adviser and its affiliates for supplying such services. The Board was aware of these factors and was guided by them in its review of the Fund's advisory contract to the extent it considered them to be appropriate and relevant, as discussed further below.
Annual Shareholder Report
The Board considered and weighed these circumstances in light of its substantial accumulated experience in governing the Fund and working with Federated on matters relating to the Federated funds, and was assisted in its deliberations by independent legal counsel. Throughout the year, the Board has requested and received substantial and detailed information about the Fund and the Federated organization that was in addition to the extensive materials that comprise and accompany the Senior Officer's Evaluation. Federated provided much of this information at each regular meeting of the Board, and furnished additional information in connection with the particular meeting at which the Board's formal review of the advisory contract occurred. Between regularly scheduled meetings, the Board also received information on particular matters as the need arose. Thus, the Board's consideration of the advisory contract included review of the Senior Officer's Evaluation, accompanying data and additional information covering such matters as: the Adviser's investment philosophy, revenue, profitability, personnel and processes; investment and operating strategies; the Fund's short- and long-term performance (in absolute terms, both on a gross basis and net of expenses, as well as in relationship to its particular investment program and certain competitor or “peer group” funds and/or other benchmarks, as appropriate), and comments on the reasons for performance; the Fund's investment objectives; the Fund's expenses (including the advisory fee itself and the overall expense structure of the Fund, both in absolute terms and relative to similar and/or competing funds, with due regard for contractual or voluntary expense limitations); the use and allocation of brokerage commissions derived from trading the Fund's portfolio securities (if any); and the nature, quality and extent of the advisory and other services provided to the Fund by the Adviser and its affiliates. The Board also considered the preferences and expectations of Fund shareholders and their relative sophistication; the continuing state of competition in the mutual fund industry and market practices; the range of comparable fees for similar funds in the mutual fund industry; the Fund's relationship to the Federated family of funds which include a comprehensive array of funds with different investment objectives, policies and strategies which are available for exchange without the incurrence of additional sales charges; compliance and audit reports concerning the Federated funds and the Federated companies that service them (including communications from regulatory agencies), as well as Federated's responses to any issues raised therein; and relevant developments in the mutual fund industry and how the Federated funds and/or Federated are responding to them. The Board's evaluation process is evolutionary. The criteria considered and the emphasis placed on relevant criteria change in recognition of changing circumstances in the mutual fund marketplace.With respect to the Fund's performance and expenses in particular, the Board has found the use of comparisons to other mutual funds with comparable investment programs to be relevant, given the high degree of competition in the mutual fund business. The Board focused on comparisons with other similar Annual Shareholder Report
mutual funds more heavily than non-mutual fund products or services because it is believed that they are more relevant. For example, other mutual funds are the products most like the Fund, they are readily available to Fund shareholders as alternative investment vehicles, and they are the type of investment vehicle in fact chosen and maintained by the Fund's investors. The range of their fees and expenses therefore appears to be a generally reliable indication of what consumers have found to be reasonable in the precise marketplace in which the Fund competes. The Fund's ability to deliver competitive performance when compared to its peer group was a useful indicator of how the Adviser is executing the Fund's investment program, which in turn assisted the Board in reaching a conclusion that the nature, extent, and quality of the Adviser's investment management services were such as to warrant continuation of the advisory contract. In this regard, the Senior Officer has reviewed Federated's fees for providing advisory services to products outside the Federated family of funds (e.g., institutional and separate accounts). He concluded that mutual funds and institutional accounts are inherently different products. Those differences include, but are not limited to, different types of targeted investors; being subject to different laws and regulations; different legal structures; different average account sizes; different associated costs; different portfolio management techniques made necessary by different cash flows; and portfolio manager time spent in review of securities pricing. The Senior Officer did not consider these fee schedules to be determinative in judging the appropriateness of mutual fund advisory contracts.The Senior Officer reviewed information compiled by Federated, using data supplied by independent fund ranking organizations, regarding the performance of, and fees charged by, other mutual funds, noting his view that comparisons to fund peer groups are relevant in judging the reasonableness of proposed fees.
The Fund's performance fell below the median of the relevant peer group for the one-year, three-year and five-year periods covered by the Evaluation. The Board discussed the Fund's performance with the Adviser and recognized the efforts being undertaken by the Adviser. The Board will continue to monitor these efforts and the performance of the Fund.
The Board also received financial information about Federated, including information regarding the compensation and benefits Federated derived from its relationships with the Federated funds. This information covered not only the fees under the advisory contracts, but also fees received by Federated's subsidiaries for providing other services to the Federated funds under separate contracts (e.g., for serving as the Federated funds' administrator). The information also detailed any indirect benefit Federated may derive from its receipt of research services from brokers who execute Federated fund trades. In addition, the Board considered the fact that, in order for a fund to be competitive in the marketplace, Federated and its affiliates frequently waived fees Annual Shareholder Report
and/or reimbursed expenses and have disclosed to fund investors and/or indicated to the Board their intention to do so in the future, where appropriate. Moreover, the Board receives regular reporting as to the institution or elimination of these voluntary waivers.Federated furnished information, requested by the Senior Officer, that reported revenues on a fund-by-fund basis and made estimates of the allocation of expenses on a fund-by-fund basis, using allocation methodologies specified by the Senior Officer. The Senior Officer noted that, although they may apply consistent allocation processes, the inherent difficulties in allocating costs (and the unavoidable arbitrary aspects of that exercise) and the lack of consensus on how to allocate those costs may render such allocation information unreliable. The allocation information was considered in the analysis by the Board but was determined to be of limited use.
The Board and the Senior Officer also reviewed information compiled by Federated comparing profitability information for Federated to other publicly held fund management companies. In this regard, the Senior Officer noted the limited availability of such information, but nonetheless concluded that Federated's profit margins did not appear to be excessive and the Board agreed.
The Senior Officer's Evaluation also discussed the notion of possible realization of “economies of scale” as a fund grows larger. The Board considered in this regard that the Adviser has made significant and long-term investments in areas that support all of the Federated funds, such as personnel and processes for the portfolio management, compliance, internal audit, and risk management functions; and systems technology; and that the benefits of these efforts (as well as any economies, should they exist) were likely to be enjoyed by the fund complex as a whole. Finally, the Board also noted the absence of any applicable regulatory or industry guidelines on this subject, which (as discussed in the Senior Officer's Evaluation) is compounded by the lack of any common industry practice or general pattern with respect to structuring fund advisory fees with “breakpoints” that serve to reduce the fee as the fund attains a certain size. The Senior Officer did not recommend institution of breakpoints in pricing Federated's fund advisory services at this time.
It was noted in the materials for the Board meeting that for the period covered by the Evaluation, the Fund's investment advisory fee was waived in its entirety. The Board reviewed the contractual fee rate and other expenses of the Fund with the Adviser and was satisfied that the overall expense structure of the Fund remained competitive.
The Senior Officer noted that, considering the totality of the circumstances, and all of the factors referenced within his Evaluation, he had concluded that, subject to comments and recommendations made within his Evaluation, his observations and the information accompanying the Evaluation supported a finding by the Board that the management fees for each of the funds are reasonable and that Federated appeared to provide appropriate administrative services to the Fund for the fees paid. Under these circumstances, no changes Annual Shareholder Report
were recommended to, and no objection was raised to, the continuation of the Fund's advisory contract. The Board concluded that the nature, quality and scope of services provided the Fund by the Adviser and its affiliates were satisfactory.In its decision to continue an existing investment advisory contract, the Board was mindful of the potential disruptions of the Fund's operations and various risks, uncertainties and other effects that could occur as a result of a decision to terminate or not renew an advisory contract. In particular, the Board recognized that many shareholders have invested in the Fund on the strength of the Adviser's industry standing and reputation and with the expectation that the Adviser will have a continuing role in providing advisory services to the Fund. Thus, the Board's approval of the advisory contract reflected the fact that it is the shareholders who have effectively selected the Adviser by virtue of having invested in the Fund.
The Board based its decision to approve the advisory contract on the totality of the circumstances and relevant factors and with a view to past and future long-term considerations. Not all of the factors and considerations identified above were necessarily relevant to the Fund, nor did the Board consider any one of them to be determinative. With respect to the factors that were relevant, the Board's decision to approve the contract reflects its determination that Federated's performance and actions provided a satisfactory basis to support the decision to continue the existing arrangements.
Annual Shareholder Report Voting Proxies on Fund Portfolio Securities
A description of the policies and procedures that the Fund uses to determine how to vote proxies, if any, relating to securities held in the Fund's portfolio is available, without charge and upon request, by calling 1-800-341-7400. A report on “Form N-PX” of how the Fund voted any such proxies during the most recent 12-month period ended June 30 is available from Federated's website at FederatedInvestors.com. To access this information from the home page, select “View All” next to “Find Products.” Select a fund name and share class, if applicable, to go to the Fund Overview page. On the Fund Overview page, select the “Documents” tab. At the bottom of that page, select “Proxy Voting Record Report (Form N-PX).” Form N-PX filings are also available at the SEC's website at www.sec.gov.
Quarterly Portfolio Schedule
The Fund files with the SEC a complete schedule of its portfolio holdings, as of the close of the first and third quarters of its fiscal year, on “Form N-Q.” These filings are available on the SEC's website at www.sec.gov and may be reviewed and copied at the SEC's Public Reference Room in Washington, DC. (Call 1-800-SEC-0330 for information on the operation of the Public Reference Room.) You may also access this information from the “Products” section of Federated's website at FederatedInvestors.com. From the home page, select “View All” next to “Find Products.” Select a fund name and share class, if applicable, to go to the Fund Overview page. On the Fund Overview page, select the “Documents” tab. At the bottom of that page, select “Form N-Q.”
Annual Shareholder ReportMutual funds are not bank deposits or obligations, are not guaranteed by any bank and are not insured or guaranteed by the U.S. government, the Federal Deposit Insurance Corporation, the Federal Reserve Board or any other government agency. Investment in mutual funds involves investment risk, including the possible loss of principal.
This Report is authorized for distribution to prospective investors only when preceded or accompanied by the Trust's Prospectus, which contains facts concerning its objective and policies, management fees, expenses and other information.
Federated New York Municipal Income Fund
Federated Investors Funds
4000 Ericsson Drive
Warrendale, PA 15086-7561
Contact us at FederatedInvestors.com
or call 1-800-341-7400.
Federated Securities Corp., Distributor
Cusip 313923401
Cusip 313923880
28992 (10/11)
Federated is a registered trademark of Federated Investors, Inc.
2011 © Federated Investors, Inc.
| | Annual Shareholder Report |
| | August 31, 2011 |
|
| Share Class | Ticker |
| A | OMIAX |
| F | OMIFX |
Federated Ohio Municipal Income Fund
Fund Established 1990
A Portfolio of Federated Municipal Securities Income Trust
Dear Valued Shareholder,
I am pleased to present the Annual Shareholder Report for your fund covering the period from September 1, 2010 through August 31, 2011. This report includes Management's Discussion of Fund Performance, a complete listing of your fund's holdings, performance information and financial statements along with other important fund information.
In addition, our website, FederatedInvestors.com, offers easy access to Federated resources that include timely fund updates, economic and market insights from our investment strategists, and financial planning tools. We invite you to register to take full advantage of its capabilities.
Thank you for investing with Federated. I hope you find this information useful and look forward to keeping you informed.
Sincerely,
J. Christopher Donahue, President
Not FDIC Insured May Lose Value No Bank Guarantee
CONTENTS
Management's Discussion of Fund Performance (unaudited)
The Fund's total return, based on net asset value, for the 12-month reporting period ended August 31, 2011, was 2.04% for Class A Shares and 1.89% for Class F Shares. The total return of the S&P Municipal Bond Ohio Index (OH Index or benchmark),1 the Fund's broad-based securities market index, was 2.50%, during the same period. The Fund's total return for the most recently completed fiscal year reflected actual cash flows, transaction costs and other expenses, which were not reflected in the total return of the OH Index.
During the reporting period, the most significant factors affecting the Fund's performance relative to the OH Index were: (a) the effective duration of its portfolio (which indicates the portfolio's sensitivity to changes in interest rates);2,3 (b) the allocation of the Fund's portfolio among securities of similar issuers (referred to as sectors); and (c) the credit ratings of portfolio securities (which indicates the risk that securities will default).4
The following discussion focuses on the performance of the Fund's Class A Shares. The 2.04% total return of the Class A Shares for the reporting period consisted of 3.93% of tax-exempt dividends and reinvestments and -1.89% of price depreciation in the net asset value of the shares.5
MARKET OVERVIEW
During the 12-month reporting period, there was continued uncertainty regarding the economic outlook, regulatory policy and fiscal policy that continued to constrain hiring and capital investment. Economic growth was considerably slower than expected as reflected by deterioration in labor market conditions, slower household spending, a drop in consumer confidence and continued weakness in the housing market. The weakness in the household and business spending was accompanied by fiscal consolidation at the state and local government level. The shedding of state and local government jobs contributed to the deterioration in overall labor market conditions. Higher energy and commodity prices and disruption from the Japanese earthquake were temporary factors that affected economic activity.
Throughout the period, concerns about the sovereign debt of certain European countries and the political controversy over the U.S. debt ceiling, its potential credit rating impact, and the downgrade of the long-term credit rating of the federal government of the United States had an effect on investor's appetites for risk assets. As a result, the ten-year Treasury moved from a high of 3.74% in February to a low of 2.06% in August 2011. Also, the tax-exempt municipal bond market experienced a widening in credit spreads during the period as the BBB-rated sector widened by over 20 basis points.
Annual Shareholder Report
Ohio has a long track record of strong financial and budget management and has frequently implemented timely budget adjustments when needed. The state also had moderate debt levels and successfully broadened its economic base away from automobiles toward a more diverse service sector. Recently the budget was narrowly balanced using significant nonrecurring revenue sources. The state made steady progress in funding post-employment benefits, although pension liabilities increased and funded ratios declined.Duration
As determined at the end of the 12-month reporting period, the Fund's dollar-weighted average duration for the reporting period was 5.17 years. Duration management was a significant component of the Fund's investment strategy. The shorter a fund's duration relative to an index, the less its net asset value will react as interest rates change. The Fund adjusted duration relative to the OH Index several times during the reporting period. The Fund maintained an underweight position in the longer duration securities relative to the benchmark. As a result, the Fund's duration underweight position (90%) relative to the OH Index detracted from Fund performance.
SECTOR
During the 12-month reporting period, the Fund maintained a higher portfolio allocation to higher education issuers, transportation financings and water and sewer authorities. These allocations helped the Fund's performance due to the outperformance of these sectors relative to the OH Index. The Fund also had less of an allocation to healthcare-related debt and electric utilities than the benchmark. These sectors outperformed the OH Index during the period and detracted from performance.
Credit Quality
The reporting period experienced a tug of war for investors between continued risk aversion as economic activity deteriorated and a desire to reach for yield into the lower quality sectors of the market because of the historically low level of interest rates. The Fund's overweight position, relative to the OH Index, in A-rated debt during the reporting period helped the Fund's performance as the rates on A-rated debt decreased to a greater extent than for other investment-grade securities.5 Also, the Fund's weighting in BB-rated debt relative to the zero weighting of the OH Index in that rating category resulted in a negative contribution to Fund performance as a result of the underperformance of high-yield or noninvestment-grade municipal securities.
Annual Shareholder Report| 1 | S&P Indices changed the name of the OH Index from “S&P/Investortools Municipal Bond Ohio Index” to “S&P Municipal Bond Ohio Index.” Please see the footnotes to the line graphs under “Fund Performance and Growth of a $10,000 Investment” below for the definition of, and more information about, the OH Index. |
| 2 | Duration is a measure of a security's price sensitivity to changes in interest rates. Securities with longer durations are more sensitive to changes in interest rates than securities with shorter durations. For purposes of this Management's Discussion of Fund Performance, duration is determined using a third-party analytical system. |
| 3 | Bond prices are sensitive to changes in interest rates and a rise in interest rates can cause a decline in their prices. |
| 4 | Investment-grade securities and noninvestment-grade securities may either be: (a) rated by a nationally recognized statistical ratings organization or rating agency; or (b) unrated securities that the Fund's investment adviser (“Adviser”) believes are of comparable quality. The rating agencies that provided the ratings for rated securities include Standard and Poor's, Moody's Investor Services, Inc., and Fitch Rating Service. When ratings vary, the highest rating is used. Credit ratings of AA or better are considered to be high credit quality; credit ratings of A are considered high or medium/good quality; and credit ratings of BBB are considered to be medium/good credit quality, and the lowest category of investment-grade securities; credit ratings of BB and below are lower-rated, noninvestment-grade securities or junk bonds; and credit ratings of CCC or below are noninvestment-grade securities that have high default risk. Any credit quality breakdown does not give effect to the impact of any credit derivative investments made by the Fund. Credit ratings are an indication of the risk that a security will default. They do not protect a security from credit risk. Lower-rated bonds typically offer higher yields to help compensate investors for the increased risk associated with them. Among these risks are lower creditworthiness, greater price volatility, more risk to principal and income than with higher-rated securities and increased possibilities of default. |
| 5 | Income may be subject to the alternative minimum tax for individuals and corporations (AMT). |
Annual Shareholder ReportFUND PERFORMANCE AND GROWTH OF A $10,000 INVESTMENT
The Average Annual Total Return table below shows returns for each class averaged over the stated periods. The graphs below illustrate the hypothetical investment of $10,0001 in Federated Ohio Municipal Income Fund (the “Fund”) from August 31, 2001 to August 31, 2011, compared to S&P Municipal Bond Ohio Index (OH Index),2 the S&P Municipal Bond OH, Investment Grade, 3-year Plus with Tobacco 2% Constrained Sub-Index (OHIG Index)3 and Morningstar Municipal Ohio Funds Category Average (MSTARMOH).4
Average Annual Total Returns for the Period Ended 8/31/2011
(returns reflect all applicable sales charges and contingent deferred sales charges as specified below in footnote #1)
| Share Class | 1 Year | 5 Years | 10 Years |
| A | -2.51% | 2.01%* | 3.11%* |
| F | -0.08% | 2.78% | 3.66% |
| * | The Fund's Class A Shares commenced operations on November 18, 2008. For the period prior to the commencement of operations of the Class A Shares, the performance information shown is for the Fund's Class F Shares adjusted to reflect the sales charges and expenses of the Class A Shares. |
Performance data quoted represents past performance which is no guarantee of future results. Investment return and principal value will fluctuate so that an investor's shares, when redeemed, may be worth more or less than their original cost. Mutual fund performance changes over time and current performance may be lower or higher than what is stated. For current to the most recent month-end performance and after-tax returns, visit FederatedInvestors.com or call 1-800-341-7400. Returns shown do not reflect the deduction of taxes that a shareholder would pay on Fund distributions or the redemption of Fund shares. Mutual funds are not obligations of or guaranteed by any bank and are not federally insured.
Annual Shareholder Report
GROWTH OF A $10,000 INVESTMENT – CLASS A SHARES| Federated Ohio Municipal Income Fund - | Class A Shares | OH Index | OHIG Index | MSTARMOH |
| 8/31/2001 | 9,550 | 10,000 | 10,000 | 10,000 |
| 8/31/2002 | 9,990 | 10,620 | 10,653 | 10,502 |
| 8/31/2003 | 10,276 | 11,026 | 11,075 | 10,741 |
| 8/31/2004 | 10,894 | 11,797 | 11,905 | 11,343 |
| 8/31/2005 | 11,471 | 12,452 | 12,591 | 11,775 |
| 8/31/2006 | 11,737 | 12,862 | 13,002 | 12,021 |
| 8/31/2007 | 11,850 | 13,205 | 13,314 | 12,210 |
| 8/31/2008 | 12,058 | 13,409 | 13,837 | 12,557 |
| 8/31/2009 | 12,283 | 13,990 | 14,809 | 13,049 |
| 8/31/2010 | 13,307 | 15,245 | 16,323 | 14,156 |
| 8/31/2011 | 13,578 | 15,626 | 16,806 | 14,321 |
41 graphic description end -->
- Total returns shown include the maximum sales charge of 4.50% ($10,000 investment minus $450 sales charge = $9,550).
GROWTH OF A $10,000 INVESTMENT – CLASS F SHARES
| Federated Ohio Municipal Income Fund - | Class F Shares | OH Index | OHIG Index | MSTARMOH |
| 8/31/2001 | 9,900 | 10,000 | 10,000 | 10,000 |
| 8/31/2002 | 10,391 | 10,620 | 10,653 | 10,502 |
| 8/31/2003 | 10,721 | 11,026 | 11,075 | 10,741 |
| 8/31/2004 | 11,403 | 11,797 | 11,905 | 11,343 |
| 8/31/2005 | 12,049 | 12,452 | 12,591 | 11,775 |
| 8/31/2006 | 12,366 | 12,862 | 13,002 | 12,021 |
| 8/31/2007 | 12,516 | 13,205 | 13,314 | 12,210 |
| 8/31/2008 | 12,775 | 13,409 | 13,837 | 12,557 |
| 8/31/2009 | 13,006 | 13,990 | 14,809 | 13,049 |
| 8/31/2010 | 14,070 | 15,245 | 16,323 | 14,156 |
| 8/31/2011 | 14,335 | 15,626 | 16,806 | 14,321 |
41 graphic description end -->
- Total returns shown include the maximum sales charge of 1.00% ($10,000 investment minus $100 sales charge = $9,900), and maximum contingent deferred sales charge of 1.00% as applicable.
Annual Shareholder Report
| 1 | Represents a hypothetical investment of $10,000 in the Fund after deducting applicable sales charges: For Class A Shares, the maximum sales charge of 4.50% ($10,000 investment minus $450 sales charge = $9,550); For Class F Shares, the maximum sales charge of 1.00% ($10,000 investment minus $100 sales charge = $9,900); and the maximum contingent deferred sales charge is 1.00% on any redemption less than four years from the purchase date. The Fund's performance assumes the reinvestment of all dividends and distributions. The OH Index, OHIG Index and MSTARMOH have been adjusted to reflect reinvestment of dividends on securities in the index and average. |
| 2 | S&P Indices changed the name of the OH Index from “S&P/Investortools Municipal Bond Ohio Index” to “S&P Municipal Bond Ohio Index.” The OH Index consists of bonds in the S&P Municipal Bond Index (Main Index) that have been issued by the state of Ohio or local governments or state or local government entities within Ohio. The Main Index is a broad, comprehensive, market value-weighted index composed of approximately 55,000 bond issues that are exempt from U.S. federal income taxes or subject to the alternative minimum tax (AMT). Eligibility criteria for inclusion in the Main Index include, but are not limited to: the bond issuer must be a state (including the Commonwealth of Puerto Rico and U.S. territories) or local government or a state or local government entity where interest on the bond is exempt from U.S. federal income taxes or subject to the AMT; the bond must be held by a mutual fund for which Standard & Poor's Securities Evaluations, Inc. provides prices; it must be denominated in U.S. dollars and have a minimum par amount of $2 million; and the bond must have a minimum term to maturity and/or call date greater than or equal to one calendar month. The Main Index is rebalanced monthly. The Ohio Index is not adjusted to reflect sales charges, expenses, and other fees that the Securities and Exchange Commission (SEC) requires to be reflected in the Fund's performance. The OH Index is unmanaged and, unlike the Fund, is not affected by cashflows. It is not possible to invest directly in an index. |
| 3 | S&P Indices changed the name of the OHIG Index from “S&P/Investortools Municipal Bond OH, Investment Grade, 3-year Plus with Tobacco 2% Constrained Sub-Index” to “S&P Municipal Bond Ohio, Investment Grade, 3-year Plus with Tobacco 2% Constrained Sub-Index.” The OHIG Index represents the portion of the OH Index composed solely of bonds that are rated BBB-/Baa3 or higher with remaining maturities of more than three years while limiting tobacco bonds to 2%, by market weighting, of the sub-index. The OHIG Index is not adjusted to reflect sales charges, expenses and other fees that the SEC requires to be reflected in the Fund's performance. The OHIG Index is unmanaged and, unlike the Fund, is not affected by cash flows. It is not possible to invest directly in an index. |
| 4 | Morningstar figures represent the average of the total returns reported by all the mutual funds designated by Morningstar as falling into the respective category indicated. Funds designated within the MSTARMOH include those that invest at least 80% of assets in Ohio municipal debt and can include long-, intermediate- and short-duration portfolios. They do not reflect sales charges. |
Annual Shareholder Report Portfolio of Investments Summary Table (unaudited)
At August 31, 2011, the Fund's sector composition1 was as follows:
| Sector Composition | Percentage of
Total Net Assets |
| General Obligation — Local | 18.7% |
| Hospital | 13.9% |
| Education | 13.7% |
| General Obligation-State | 7.8% |
| Water And Sewer | 7.2% |
| Public Power | 6.3% |
| Transportation | 5.7% |
| Senior Care | 5.2% |
| Prerefunded | 4.3% |
| Electric and Gas | 4.1% |
| Other2 | 11.6% |
| Other Assets and Liabilities — Net3 | 1.5% |
| TOTAL | 100.0% |
| 1 | Sector classifications, and the assignment of holdings to such sectors, are based upon the economic sector and/or revenue source of the underlying obligor, as determined by the Fund's Adviser. For securities that have been enhanced by a third-party including bond insurers and banks, sector classifications are based upon the economic sector and/or revenue source of the underlying obligor, as determined by the Fund's Adviser. Pre-refunded securities are those whose debt service is paid from escrowed assets, usually U.S. government securities. |
| 2 | For purposes of this table, sector classifications constitute 86.9% of the Fund's total net assets. Remaining sectors have been aggregated under the designation “Other.” |
| 3 | Assets, other than investments in securities, less liabilities. See Statement of Assets and Liabilities. |
Annual Shareholder Report Portfolio of Investments
August 31, 2011
Principal
Amount | | | Value |
| | MUNICIPAL BONDS – 98.0% | |
| | Ohio – 95.3% | |
| $1,000,000 | | Akron, Bath & Copley, OH Joint Township, Hospital District Revenue Bonds (Series A), 5.25% (Summa Health System)/(Radian Asset Assurance, Inc. INS), 11/15/2016 | 1,054,910 |
| 2,250,000 | | Akron, Bath & Copley, OH Joint Township, Hospital Facilities Revenue Bonds (Series A), 5.25% (Summa Health System)/(Radian Asset Assurance, Inc. INS)/(Original Issue Yield: 5.47%), 11/15/2031 | 2,118,938 |
| 2,000,000 | | Allen County, OH, Hospital Facilities Revenue Bonds (Series 2010B), 5.25% (Catholic Healthcare Partners), 9/1/2027 | 2,060,720 |
| 500,000 | | American Municipal Power-Ohio, Inc., Revenue Bonds (Series 2008A), 5.00% (American Municipal Power, Prairie State Energy Campus Project), 2/15/2016 | 571,480 |
| 2,000,000 | | American Municipal Power-Ohio, Inc., Revenue Bonds (Series 2008A), 5.25% (American Municipal Power, Prairie State Energy Campus Project), 2/15/2028 | 2,130,420 |
| 1,500,000 | | Beavercreek, OH Local School District, UT GO Bonds, 6.60% (National Public Finance Guarantee Corporation INS), 12/1/2015 | 1,711,965 |
| 1,965,000 | | Buckeye Tobacco Settlement Financing Authority, OH, Asset-Backed Bonds, 5.125% (Original Issue Yield: 5.44%), 6/1/2024 | 1,531,541 |
| 1,000,000 | | Buckeye Tobacco Settlement Financing Authority, OH, Tobacco Settlement Asset-Backed Bonds (Series 2007A-1), 5.00%, 6/1/2015 | 1,063,450 |
| 1,000,000 | | Buckeye Tobacco Settlement Financing Authority, OH, Tobacco Settlement Asset-Backed Bonds (Series A-2), 6.50%, 6/1/2047 | 770,320 |
| 2,660,000 | | Butler County, OH, MFH Revenue Bonds (Series 2006), 5.10% (Trinity Manor Senior Housing)/(GNMA Collateralized Home Mortgage Program COL), 7/20/2036 | 2,667,900 |
| 1,000,000 | | Centerville, OH, Health Care Fixed Rate Revenue Bonds (Series 2007A), 6.00% (Bethany Lutheran Village), 11/1/2038 | 845,130 |
| 1,000,000 | | Cincinnati City School District, OH, COP, 5.00% (Assured Guaranty Municipal Corp. INS), 12/15/2024 | 1,077,910 |
| 1,000,000 | | Cincinnati City School District, OH, UT GO Bonds, 5.00% (National Public Finance Guarantee Corporation INS), 12/1/2017 | 1,195,060 |
| 1,980,000 | | Cleveland, OH Airport System, Revenue Bonds (Series 2006A), 5.25% (Assured Guaranty Corp. INS), 1/1/2018 | 2,196,572 |
| 2,200,000 | | Cleveland, OH Airport System, Revenue Bonds, 5.00% (Assured Guaranty Municipal Corp. INS), 1/1/2022 | 2,271,522 |
| 1,550,000 | | Cleveland, OH Public Power System, Revenue Bonds (Series 2008B-1), 5.00%, 11/15/2038 | 1,550,852 |
| 2,685,000 | | Cleveland, OH Public Power System, Revenue Refunding Bonds (Series 2010), 5.00%, 11/15/2017 | 3,089,173 |
| 2,350,000 | | Cleveland, OH Waterworks, Revenue Bonds (Series 2007P), 5.00%, 1/1/2022 | 2,640,789 |
Annual Shareholder ReportPrincipal
Amount | | | Value |
| $1,000,000 | | Cleveland, OH Waterworks, Water Revenue Bonds (Series 2007O), 5.00% (National Public Finance Guarantee Corporation INS), 1/1/2032 | 1,035,400 |
| 2,000,000 | | Cleveland, OH, LT GO Bonds, 5.50% (Assured Guaranty Municipal Corp. INS), 10/1/2019 | 2,451,900 |
| 795,000 | | Cleveland-Cuyahoga County, OH Port Authority, Special Assessment Tax-Increment Revenue Bonds, 7.00% (University Heights, OH Public Parking Garage)/(Original Issue Yield: 7.20%), 12/1/2018 | 811,401 |
| 1,000,000 | | Columbus, OH City School District, School Facilities Construction & Improvement UT GO Bonds (Series 2009), 5.00%, 12/1/2027 | 1,087,550 |
| 1,600,000 | | Columbus, OH Sewer System, Revenue Bonds (Series 2008A), 5.00%, 6/1/2028 | 1,725,216 |
| 1,225,000 | | Columbus, OH Sewer System, Revenue Bonds (Series 2008A), 5.00%, 6/1/2031 | 1,299,725 |
| 1,000,000 | | Columbus, OH Sewer System, Revenue Bonds (Series A), 5.00%, 6/1/2023 | 1,125,360 |
| 1,290,000 | | Cuyahoga County, OH, UT GO Jail Facilities Bonds, 5.25% (National Public Finance Guarantee Corporation INS)/(Original Issue
Yield: 5.50%), 10/1/2013 | 1,333,602 |
| 2,000,000 | | Cuyahoga County, OH, Various Purpose LT GO Bonds (Series 2009A), 5.00%, 12/1/2022 | 2,329,560 |
| 245,000 | | Dayton-Montgomery County, OH Port Authority, Revenue Bonds (Series A), 4.75% (Dayton Regional Bond Fund), 11/15/2015 | 247,962 |
| 630,000 | | Dayton-Montgomery County, OH Port Authority, Revenue Bonds (Series A), 5.00% (Dayton Regional Bond Fund), 11/15/2017 | 626,308 |
| 250,000 | | Erie County, OH Hospital Facilities, Revenue Bonds, 5.50% (Firelands Regional Medical Center), 8/15/2012 | 256,822 |
| 1,000,000 | | Erie County, OH, Hospital Facilities Revenue Bonds (Series 2002A), 5.50% (Firelands Regional Medical Center)/(Original Issue
Yield: 5.66%), 8/15/2022 | 1,012,390 |
| 3,000,000 | | Franklin County, OH Convention Facilities Authority, Revenue Bonds, 5.00% (AMBAC INS), 12/1/2026 | 3,161,580 |
| 2,400,000 | | Franklin County, OH Health Care Facilities, Improvement Revenue Bonds (Series 2010A), 5.625% (Ohio Presbyterian Retirement Services)/(Original Issue Yield: 5.75%), 7/1/2026 | 2,410,560 |
| 1,535,000 | | Franklin County, OH Hospital Facility Authority, Hospital Improvement Revenue Bonds (Series 2009), 5.00% (Nationwide Children's Hospital)/(Original Issue Yield: 5.11%), 11/1/2034 | 1,548,216 |
| 475,000 | | Franklin County, OH Mortgage Revenue, Revenue Bonds, 5.00% (Trinity Healthcare Credit Group), 6/1/2013 | 508,644 |
| 2,165,000 | | Franklin County, OH, Various Purpose LT GO Bonds, 5.00%, 12/1/2031 | 2,315,662 |
| 1,000,000 | | Gallipolis, OH City School District, School Facilities Construction & Improvement UT GO Bonds, 5.00% (National Public Finance Guarantee Corporation INS), 12/1/2030 | 1,033,190 |
Annual Shareholder ReportPrincipal
Amount | | | Value |
| $1,530,000 | | Hamilton County, OH Hospital Facilities Authority, Revenue Bonds (Series 2004J), 5.25% (Cincinnati Children's Hospital Medical Center)/(FGIC and National Public Finance Guarantee Corporation INS), 5/15/2023 | 1,535,539 |
| 1,510,000 | | Hamilton County, OH Hospital Facilities Authority, Revenue Bonds, 4.50% (Convalescent Hospital Children)/(FGIC and National Public Finance Guarantee Corporation INS), 5/15/2014 | 1,559,951 |
| 1,000,000 | | Hamilton County, OH, EDRBs (Series 2006A), 5.00% (King Highland Community Urban Redevelopment Corp.- University of Cincinnati, Lessee)/(National Public Finance Guarantee Corporation INS), 6/1/2033 | 1,001,180 |
| 2,000,000 | | Hamilton County, OH, Subordinated Sales Tax Refunding Revenue Bonds (Series 2006A), 5.00% (AMBAC INS), 12/1/2018 | 2,238,220 |
| 1,310,000 | | Hamilton, OH City School District, School Facilities Construction & Improvement UT GO Bonds, 5.00% (Assured Guaranty Municipal Corp. INS), 12/1/2029 | 1,373,011 |
| 2,000,000 | | Hilliard, OH School District, UT GO Bonds (Series 2006A), 5.00% (National Public Finance Guarantee Corporation INS), 12/1/2027 | 2,127,820 |
| 2,000,000 | | Kent State University, OH, General Receipts Bonds (Series 2009B), 5.00% (Assured Guaranty Corp. INS), 5/1/2028 | 2,124,040 |
| 1,860,000 | | Kettering, OH City School District, UT GO Bonds, 4.75% (Assured Guaranty Municipal Corp. INS), 12/1/2020 | 2,056,528 |
| 1,500,000 | | Lorain County, OH Port Authority, Recovery Zone Facility Revenue Bonds (Series 2010), 6.75% (United States Steel Corp.), 12/1/2040 | 1,524,210 |
| 1,500,000 | | Lorain County, OH, Health Care Facilities Revenue Refunding Bonds (Series 1998A), 5.25% (Kendal at Oberlin)/(Original Issue
Yield: 5.53%), 2/1/2021 | 1,500,585 |
| 1,000,000 | | Lorain County, OH, Hospital Revenue Bonds (Series 2006H), 5.00% (Catholic Healthcare Partners)/(Assured Guaranty Corp. INS), 2/1/2024 | 1,062,800 |
| 1,000,000 | | Lorain County, OH, Hospital Revenue Refunding & Improvement Bonds, 5.25% (Catholic Healthcare Partners)/(Original Issue
Yield: 5.52%), 10/1/2033 | 1,004,840 |
| 1,500,000 | | Lucas County, OH, Health Care Facilities Refunding & Improvement Revenue Bonds (Series 2000A), 6.625% (Sunset Retirement Community, Inc.)/(Original Issue Yield: 6.75%), 8/15/2030 | 1,500,810 |
| 2,000,000 | | Lucas County, OH, Hospital Revenue Bonds (Series 2011A), 6.50% (ProMedica Healthcare Obligated Group), 11/15/2037 | 2,240,740 |
| 1,000,000 | | Marysville, OH Wastewater Treatment System, Revenue Bonds (Series 2007), 4.75% (Syncora Guarantee, Inc. INS), 12/1/2047 | 967,210 |
| 1,090,000 | | Marysville, OH Wastewater Treatment System, Revenue Bonds, 4.75% (Assured Guaranty Corp. INS)/(Original Issue Yield: 4.80%), 12/1/2046 | 1,069,432 |
| 1,000,000 | | Miami County, OH, Hospital Facilities Revenue & Refunding Bonds (Series 2006), 5.25% (Upper Valley Medical Center, OH), 5/15/2021 | 1,051,100 |
Annual Shareholder ReportPrincipal
Amount | | | Value |
| $1,600,000 | | Miamisburg, OH City School District, School Facilities Construction & Improvement UT GO Bonds, 5.00%, 12/1/2024 | 1,765,792 |
| 1,000,000 | | Montgomery County, OH, MFH Revenue Bonds (Series 2005), 4.95% (Chevy Chase Apartments)/(FHLMC GTD), 11/1/2035 | 1,027,030 |
| 1,000,000 | | Montgomery County, OH, Revenue Bonds (Series 2008D), 6.125% (Catholic Health Initiatives)/(Original Issue Yield: 6.30%), 10/1/2028 | 1,106,520 |
| 795,000 | | North Olmsted, OH, LT GO Bonds, 6.20% (AMBAC INS), 12/1/2011 | 803,045 |
| 1,415,000 | | Oak Hills, OH Local School District, UT GO Bonds, 5.00% (Assured Guaranty Municipal Corp. INS), 12/1/2025 | 1,516,498 |
| 590,000 | | Ohio HFA, Residential Mortgage Revenue Bonds (Series 2002 A-1), 5.30% (GNMA COL), 9/1/2022 | 615,317 |
| 630,000 | | Ohio HFA, Residential Mortgage Revenue Bonds (Series 2008F), 5.25% (GNMA COL Home Mortgage Program GTD), 9/1/2028 | 661,330 |
| 95,000 | | Ohio HFA, SFM Revenue Bonds (Series A3), 4.55% (GNMA COL), 9/1/2011 | 95,000 |
| 395,000 | | Ohio HFA, SFM Revenue Bonds, 3.65% (GNMA COL), 9/1/2011 | 395,000 |
| 820,000 | | Ohio HFA, SFM Revenue Bonds, 3.90% (GNMA COL), 3/1/2013 | 837,696 |
| 1,885,000 | | Ohio Municipal Electric Generation Agency, Revenue Bonds, 5.00% (American Municipal Power, JV5)/(AMBAC INS), 2/15/2014 | 2,039,664 |
| 2,000,000 | | Ohio State Air Quality Development Authority, Air Quality Revenue Refunding Bonds (Series 2009B), 5.80% (Columbus Southern Power Company), 12/1/2038 | 2,106,080 |
| 1,150,000 | | Ohio State Air Quality Development Authority, Environmental Improvement Revenue Bonds (Series 2010), 5.00% (Buckeye Power, Inc.), 12/1/2021 | 1,233,421 |
| 2,000,000 | | Ohio State Air Quality Development Authority, PCR Refunding Bonds (Series 2009-C), 5.625% (FirstEnergy Solutions Corp.), 6/1/2018 | 2,246,020 |
| 1,455,000 | | Ohio State Air Quality Development Authority, Revenue Bonds (Series 2009A), 5.70% (FirstEnergy Solutions Corp.), 8/1/2020 | 1,569,829 |
| 2,000,000 | | Ohio State Higher Educational Facility Commission, Higher Education Facility Revenue Bonds (Series 2006), 5.00% (Kenyon College, OH), 7/1/2041 | 2,004,960 |
| 1,875,000 | | Ohio State Higher Educational Facility Commission, Hospital Revenue Bonds (Series 2007A), 5.25% (University Hospitals Health System, Inc.), 1/15/2046 | 1,761,675 |
| 1,000,000 | | Ohio State Higher Educational Facility Commission, Revenue Bonds (Series 2011A), 5.375% (University of Dayton)/(Original Issue
Yield: 5.48%), 12/1/2030 | 1,053,930 |
| 300,000 | | Ohio State Higher Educational Facility Commission, Revenue Bonds, 4.75% (Mount Union College), 10/1/2016 | 339,993 |
| 2,000,000 | | Ohio State Higher Educational Facility Commission, Revenue Bonds, 5.00% (College of Wooster), 9/1/2020 | 2,140,360 |
| 1,000,000 | | Ohio State Higher Educational Facility Commission, Revenue Bonds, 5.00% (University of Dayton)/(AMBAC INS), 12/1/2027 | 1,023,090 |
Annual Shareholder ReportPrincipal
Amount | | | Value |
| $2,010,000 | | Ohio State Higher Educational Facility Commission, Revenue Bonds, 5.00% (Xavier University)/(Escrowed In Treasuries COL), 5/1/2016 | 2,374,353 |
| 3,115,000 | | Ohio State Higher Educational Facility Commission, Revenue Bonds, 5.00% (Xavier University)/(United States Treasury PRF), 5/1/2019 | 3,703,143 |
| 1,000,000 | | Ohio State Higher Educational Facility Commission, Revenue Bonds, 5.50% (Denison University), 11/1/2012 | 1,017,780 |
| 5,085,000 | | Ohio State Higher Educational Facility Commission, Revenue Bonds, 6.25% (Case Western Reserve University, OH), 7/1/2014 | 5,518,293 |
| 1,000,000 | | Ohio State Higher Educational Facility Commission, Revenue Refunding Bonds (Series 2008C), 5.00% (Case Western Reserve University, OH), 12/1/2029 | 1,039,050 |
| 1,000,000 | | Ohio State Turnpike Commission, Revenue Refunding Bonds (Series 2010A), 5.00%, 2/15/2031 | 1,068,170 |
| 2,000,000 | | Ohio State Turnpike Commission, Turnpike Revenue Refunding Bonds (Series 1998A), 5.50% (National Re Holdings Corp. INS), 2/15/2024 | 2,321,280 |
| 2,000,000 | | Ohio State University, General Receipts Bonds (Series 2008A), 5.00%, 12/1/2027 | 2,161,260 |
| 320,000 | | Ohio State University, General Receipts Revenue Bonds (Series 2003B), 5.25%, 6/1/2023 | 340,758 |
| 1,000,000 | | Ohio State Water Development Authority, Revenue Refunding Bonds (Series 2008), 5.00% (United States Treasury PRF 6/1/2018@100), 6/1/2028 | 1,221,850 |
| 1,200,000 | | Ohio State, Hospital Revenue Refunding Bonds (Series 2008A), 5.25% (Cleveland Clinic)/(Original Issue Yield: 98.376%), 1/1/2033 | 1,237,704 |
| 2,585,000 | | Ohio State, Infrastructure Improvement GO Bonds (Series 2008A), 5.375% (Original Issue Yield: 5.50%), 9/1/2028 | 2,856,709 |
| 3,000,000 | | Ohio State, Infrastructure Improvement UT GO Bonds (Series 2007A), 4.75%, 9/1/2027 | 3,161,580 |
| 1,000,000 | | Ohio State, Major New State Infrastructure Project Revenue Bonds (Series 2008-1), 5.75%, 6/15/2019 | 1,215,730 |
| 2,310,000 | | Ohio State, UT GO Bonds, 4.25%, 5/1/2016 | 2,650,633 |
| 1,000,000 | | Ohio State, UT GO Bonds, 5.00%, 6/15/2013 | 1,082,900 |
| 2,000,000 | | Ohio Water Development Authority, Drinking Water Assistance Fund Refunding Revenue Bonds (Series 2008), 5.00% (Ohio State Water Development Authority), 12/1/2021 | 2,319,080 |
| 2,000,000 | | Olentangy, OH Local School District, UT GO Bonds, 5.00% (Assured Guaranty Municipal Corp. INS), 12/1/2022 | 2,207,180 |
| 415,000 | | Orrville, OH CSD, UT GO Bonds, 4.50% (AMBAC INS), 12/1/2018 | 473,092 |
| 350,000 | | Orrville, OH CSD, UT GO Refunding Bonds, 5.00% (AMBAC INS), 12/1/2020 | 395,567 |
| 500,000 | | Port Authority for Columbiana County, OH, Solid Waste Facility Revenue Bonds (Series 2004A), 7.25% (Apex Environmental LLC)/(Original Issue Yield: 7.30%), 8/1/2034 | 406,090 |
Annual Shareholder ReportPrincipal
Amount | | | Value |
| $1,000,000 | | Portage County, OH Board of County Hospital Trustees, Hospital Revenue Bonds (Series 1999), 5.75% (Robinson Memorial Hospital)/(AMBAC INS)/(Original Issue Yield: 5.90%), 11/15/2019 | 1,003,190 |
| 1,000,000 | | Ravenna, OH City School District, UT GO Bonds (Series 2006), 5.00% (Assured Guaranty Municipal Corp. INS), 1/15/2031 | 1,089,960 |
| 770,000 | | Richland County, OH Hospital Facilities, Revenue Bond, 5.00% (Medcentral Health System), 11/15/2015 | 853,121 |
| 1,500,000 | | Rickenbacker, OH Port Authority, Capital Funding Revenue Bonds (Series 2002A), 5.375% (OASBO Expanded Asset Pooled Financing Program)/(Original Issue Yield: 5.60%), 1/1/2032 | 1,581,030 |
| 1,500,000 | | Toledo-Lucas County, OH Port Authority, Revenue Bonds, 6.45%
(CSX Corp.), 12/15/2021 | 1,749,435 |
| 1,375,000 | | Toledo-Lucas County, OH Port Authority, Special Assessment Revenue Bonds, 5.25% (Crocker Park Public Improvement Project)/(Original Issue Yield: 5.37%), 12/1/2023 | 1,317,346 |
| 2,000,000 | | University of Akron, OH, General Receipts Bonds (Series 2008B), 5.25% (Assured Guaranty Municipal Corp. INS), 1/1/2027 | 2,154,780 |
| 1,025,000 | | University of Cincinnati, OH, General Receipts Revenue Bonds (Series 2004D), 5.00% (AMBAC INS), 6/1/2026 | 1,080,873 |
| 1,995,000 | | Waynesville, OH Health Care Facilities, Revenue Bonds (Series 2001A), 5.70% (Quaker Heights Project)/(GNMA COL Home Mortgage Program GTD), 2/20/2043 | 2,033,603 |
| | TOTAL | 160,785,506 |
| | Guam – 0.3% | |
| 560,000 | | Guam Government LO (Section 30), Bonds (Series 2009A), 5.625% (Original Issue Yield: 5.875%), 12/1/2029 | 568,249 |
| | Puerto Rico – 2.4% | |
| 2,000,000 | | Commonwealth of Puerto Rico, UT GO Refunding Bonds (Series A), 5.00% TOBs, Mandatory Tender 7/1/2012 | 2,047,280 |
| 1,000,000 | | Puerto Rico Government Development Bank (GDB), Senior Notes (Series 2006B), 5.00%, 12/1/2017 | 1,077,880 |
| 990,000 | | Puerto Rico Industrial, Tourist, Educational, Medical & Environmental Control Facilities Financing Authority, Cogeneration Facility Revenue Bonds (Series 2000A), 6.625% (AES Puerto Rico Project)/(Original Issue Yield: 6.65%), 6/1/2026 | 997,920 |
| | TOTAL | 4,123,080 |
| | TOTAL MUNICIPAL BONDS
(IDENTIFIED COST $158,952,917) | 165,476,835 |
| | SHORT-TERM MUNICIPALS – 0.5%1 | |
| | Ohio – 0.5% | |
| 300,000 | | Franklin County, OH Hospital Facility Authority, (Series 2008E) Weekly VRDNs (Nationwide Children's Hospital)/(JPMorgan Chase Bank, N.A. LIQ), 0.180%, 9/1/2011 | 300,000 |
Annual Shareholder ReportPrincipal
Amount | | | Value |
| $500,000 | | Geauga County, OH, Revenue Bonds (Series 2007A) Daily VRDNs (South Franklin Circle)/(Key Bank, N.A. LOC), 0.250%, 9/1/2011 | 500,000 |
| | TOTAL | 800,000 |
| | TOTAL SHORT-TERM MUNICIPALS
(AT AMORTIZED COST) | 800,000 |
| | TOTAL INVESTMENTS — 98.5%
(IDENTIFIED COST $159,752,917)2 | 166,276,835 |
| | OTHER ASSETS AND LIABILITIES - NET — 1.5%3 | 2,596,398 |
| | TOTAL NET ASSETS — 100% | $168,873,233 |
Securities that are subject to the federal alternative minimum tax (AMT) represent 4.4% of the Fund's portfolio as calculated based upon total market value (percentage is unaudited).
| 1 | Current rate and next reset date shown for Variable Rate Demand Notes. |
| 2 | The cost of investments for federal tax purposes amounts to $159,711,529. |
| 3 | Assets, other than investments in securities, less liabilities. See Statement of Assets and Liabilities. |
Note: The categories of investments are shown as a percentage of total net assets at August 31, 2011.
Various inputs are used in determining the value of the Fund's investments. These inputs are summarized in the three broad levels listed below:
Level 1 — quoted prices in active markets for identical securities, including investment companies with daily net asset values, if applicable.
Level 2 — other significant observable inputs (including quoted prices for similar securities, interest rates, prepayment speeds, credit risk, etc.). Also includes securities valued at amortized cost.
Level 3 — significant unobservable inputs (including the Fund's own assumptions in determining the fair value of investments).
The inputs or methodology used for valuing securities are not an indication of the risk associated with investing in those securities.
As of August 31, 2011, all investments of the Fund utilized Level 2 inputs in valuing the Fund's assets carried at fair value.
Annual Shareholder Report
The following acronyms are used throughout this portfolio:| AMBAC | — American Municipal Bond Assurance Corporation |
| COL | — Collateralized |
| COP | — Certificate of Participation |
| CSD | — Central School District |
| EDRBs | — Economic Development Revenue Bonds |
| FGIC | — Financial Guaranty Insurance Company |
| FHLMC | — Federal Home Loan Mortgage Corporation |
| GNMA | — Government National Mortgage Association |
| GO | — General Obligation |
| GTD | — Guaranteed |
| HFA | — Housing Finance Authority |
| INS | — Insured |
| LIQ | — Liquidity Agreement |
| LO | — Limited Obligation |
| LOC | — Letter of Credit |
| LT | — Limited Tax |
| MFH | — Multi-Family Housing |
| PCR | — Pollution Control Revenue |
| PRF | — Prerefunded |
| SFM | — Single Family Mortgage |
| TOBs | — Tender Option Bonds |
| UT | — Unlimited Tax |
| VRDNs | — Variable Rate Demand Notes |
See Notes which are an integral part of the Financial Statements
Annual Shareholder Report Financial Highlights – Class A Shares
| Year Ended August 31, | Period
Ended
8/31/20091 |
| 2011 | 2010 |
| Net Asset Value, Beginning of Period | $11.14 | $10.68 | $10.22 |
| Income From Investment Operations: | | | |
| Net investment income | 0.42 | 0.42 | 0.37 |
| Net realized and unrealized gain (loss) on investments | (0.21) | 0.45 | 0.44 |
| TOTAL FROM INVESTMENT OPERATIONS | 0.21 | 0.87 | 0.81 |
| Less Distributions: | | | |
| Distributions from net investment income | (0.42) | (0.41) | (0.35) |
| Net Asset Value, End of Period | $10.93 | $11.14 | $10.68 |
| Total Return2 | 2.04% | 8.34% | 8.11% |
| Ratios to Average Net Assets: | | | |
| Net expenses | 0.75% | 0.75% | 0.75%3,4 |
| Net investment income | 3.87% | 3.84% | 4.09%4 |
| Expense waiver/reimbursement5 | 0.18% | 0.16% | 0.17%4 |
| Supplemental Data: | | | |
| Net assets, end of period (000 omitted) | $50,990 | $57,338 | $61,141 |
| Portfolio turnover | 9% | 20% | 13%6 |
| 1 | Reflects operations for the period from November 18, 2008 (date of initial investment) to August 31, 2009. |
| 2 | Based on net asset value, which does not reflect the sales charge, redemption fee or contingent deferred sales charge, if applicable. |
| 3 | The net expense ratio is calculated without reduction for expense offset arrangements. The net expense ratio is 0.75% for the period ended August 31, 2009, after taking into account this expense reduction. |
| 4 | Computed on an annualized basis. |
| 5 | This expense decrease is reflected in both the net expense and net investment income ratios shown above. |
| 6 | Portfolio turnover is calculated at the Fund level. Percentage indicated was calculated for the year ended August 31, 2009. |
See Notes which are an integral part of the Financial Statements
Annual Shareholder Report Financial Highlights – Class F Shares
| Year Ended August 31 | 2011 | 2010 | 2009 | 2008 | 2007 |
| Net Asset Value, Beginning of Period | $11.14 | $10.68 | $10.92 | $11.15 | $11.47 |
| Income From Investment Operations: | | | | | |
| Net investment income | 0.40 | 0.40 | 0.43 | 0.46 | 0.46 |
| Net realized and unrealized gain (loss) on investments, futures contracts and swap contracts | (0.21) | 0.46 | (0.25) | (0.23) | (0.32) |
| TOTAL FROM INVESTMENT OPERATIONS | 0.19 | 0.86 | 0.18 | 0.23 | 0.14 |
| Less Distributions: | | | | | |
| Distributions from net investment income | (0.40) | (0.40) | (0.42) | (0.46) | (0.46) |
| Net Asset Value, End of Period | $10.93 | $11.14 | $10.68 | $10.92 | $11.15 |
| Total Return1 | 1.89% | 8.18% | 1.81% | 2.06% | 1.22% |
| Ratios to Average Net Assets: | | | | | |
| Net expenses | 0.90% | 0.90% | 0.90%2 | 0.90%2 | 0.92%3 |
| Net investment income | 3.72% | 3.70% | 4.06% | 4.15% | 4.02% |
| Expense waiver/reimbursement4 | 0.43% | 0.41% | 0.44% | 0.45% | 0.43% |
| Supplemental Data: | | | | | |
| Net assets, end of period (000 omitted) | $117,884 | $135,096 | $124,090 | $117,080 | $120,409 |
| Portfolio turnover | 9% | 20% | 13% | 13% | 14% |
| 1 | Based on net asset value, which does not reflect the sales charge, redemption fee or contingent deferred sales charge, if applicable. |
| 2 | The net expense ratio is calculated without reduction for expense offset arrangements. The net expense ratios are 0.90% and 0.90% for the years ended August 31, 2009 and 2008, respectively, after taking into account these expense reductions. |
| 3 | Includes interest and trust expenses related to the Fund's participation in certain inverse floater structures of 0.02% for the year ended August 31, 2007. |
| 4 | This expense decrease is reflected in both the net expense and net investment income ratios shown above. |
See Notes which are an integral part of the Financial Statements
Annual Shareholder Report Statement of Assets and Liabilities
August 31, 2011
| Assets: | | |
| Total investments in securities, at value (identified cost $159,752,917) | | $166,276,835 |
| Cash | | 50,369 |
| Income receivable | | 2,042,629 |
| Receivable for investments sold | | 750,000 |
| Receivable for shares sold | | 164,578 |
| TOTAL ASSETS | | 169,284,411 |
| Liabilities: | | |
| Income distribution payable | $227,454 | |
| Payable for shares redeemed | 68,858 | |
| Payable for portfolio accounting fees | 35,416 | |
| Payable for shareholder services fee (Note 5) | 34,275 | |
| Payable for distribution services fee (Note 5) | 15,046 | |
| Payable for transfer and dividend disbursing agent fees and expenses | 12,659 | |
| Payable for Directors'/Trustees' fees | 244 | |
| Accrued expenses | 17,226 | |
| TOTAL LIABILITIES | | 411,178 |
| Net assets for 15,456,694 shares outstanding | | $168,873,233 |
| Net Assets Consist of: | | |
| Paid-in capital | | $166,123,649 |
| Net unrealized appreciation of investments | | 6,523,918 |
| Accumulated net realized loss on investments, futures contracts and swap contracts | | (3,809,340) |
| Undistributed net investment income | | 35,006 |
| TOTAL NET ASSETS | | $168,873,233 |
| Net Asset Value, Offering Price and Redemption Proceeds Per Share | | |
| Class A Shares: | | |
| Net asset value per share ($50,989,513 ÷ 4,667,181 shares outstanding), no par value, unlimited shares authorized | | $10.93 |
| Offering price per share (100/95.50 of $10.93) | | $11.45 |
| Redemption proceeds per share | | $10.93 |
| Class F Shares: | | |
| Net asset value per share ($117,883,720 ÷ 10,789,513 shares outstanding), no par value, unlimited shares authorized | | $10.93 |
| Offering price per share (100/99.00 of $10.93) | | $11.04 |
| Redemption proceeds per share (99.00/100 of $10.93) | | $10.82 |
See Notes which are an integral part of the Financial Statements
Annual Shareholder Report Statement of Operations
Year Ended August 31, 2011
| Investment Income: | | | |
| Interest | | | $8,214,263 |
| Expenses: | | | |
| Investment adviser fee (Note 5) | | $710,867 | |
| Administrative fee (Note 5) | | 190,000 | |
| Custodian fees | | 13,671 | |
| Transfer and dividend disbursing agent fees and expenses | | 93,142 | |
| Directors'/Trustees' fees | | 4,275 | |
| Auditing fees | | 21,048 | |
| Legal fees | | 7,746 | |
| Portfolio accounting fees | | 97,499 | |
| Distribution services fee (Note 5) | | 498,975 | |
| Shareholder services fee (Note 5) | | 443,698 | |
| Account administration fee (Note 2) | | 594 | |
| Share registration costs | | 39,148 | |
| Printing and postage | | 28,616 | |
| Insurance premiums | | 4,535 | |
| Miscellaneous | | 2,369 | |
| TOTAL EXPENSES | | 2,156,183 | |
| Waivers (Note 5): | | | |
| Waiver of investment adviser fee | $(282,402) | | |
| Waiver of administrative fee | (33,223) | | |
| Waiver of distribution services fee | (311,859) | | |
| TOTAL WAIVERS | | (627,484) | |
| Net expenses | | | 1,528,699 |
| Net investment income | | | 6,685,564 |
| Realized and Unrealized Loss on Investments: | | | |
| Net realized loss on investments | | | (1,061,763) |
| Net change in unrealized appreciation of investments | | | (3,165,104) |
| Net realized and unrealized loss on investments | | | (4,226,867) |
| Change in net assets resulting from operations | | | $2,458,697 |
See Notes which are an integral part of the Financial Statements
Annual Shareholder Report Statement of Changes in Net Assets
| Year Ended August 31 | 2011 | 2010 |
| Increase (Decrease) in Net Assets | | |
| Operations: | | |
| Net investment income | $6,685,564 | $6,960,593 |
| Net realized gain (loss) on investments | (1,061,763) | 987,390 |
| Net change in unrealized appreciation/depreciation of investments | (3,165,104) | 6,688,717 |
| CHANGE IN NET ASSETS RESULTING FROM OPERATIONS | 2,458,697 | 14,636,700 |
| Distributions to Shareholders: | | |
| Distributions from net investment income | | |
| Class A Shares | (2,068,806) | (2,178,036) |
| Class F Shares | (4,678,794) | (4,687,502) |
| CHANGE IN NET ASSETS RESULTING FROM DISTRIBUTIONS TO SHAREHOLDERS | (6,747,600) | (6,865,538) |
| Share Transactions: | | |
| Proceeds from sale of shares | 15,589,268 | 25,803,266 |
| Net asset value of shares issued to shareholders in payment of distributions declared | 3,577,683 | 3,246,878 |
| Cost of shares redeemed | (38,439,096) | (29,617,349) |
| CHANGE IN NET ASSETS RESULTING FROM SHARE TRANSACTIONS | (19,272,145) | (567,205) |
| Change in net assets | (23,561,048) | 7,203,957 |
| Net Assets: | | |
| Beginning of period | 192,434,281 | 185,230,324 |
| End of period (including undistributed net investment income of $35,006 and $128,317, respectively) | $168,873,233 | $192,434,281 |
See Notes which are an integral part of the Financial Statements
Annual Shareholder Report Notes to Financial Statements
August 31, 2011
1. Organization
Federated Municipal Securities Income Trust (the “Trust”) is registered under the Investment Company Act of 1940, as amended (the “Act”), as an open-end management investment company. The Trust consists of five portfolios. The financial statements included herein are only those of the Federated Ohio Municipal Income Fund (the “Fund”), a non-diversified portfolio. The financial statements of the other portfolios are presented separately. The assets of each portfolio are segregated and a shareholder's interest is limited to the portfolio in which shares are held. Each portfolio pays its own expenses. The Fund offers two classes of shares: Class A Shares and Class F Shares. All shares of the Fund have equal rights with respect to voting, except on class-specific matters. The investment objective of the Fund is to provide current income exempt from federal regular income tax (federal regular income tax does not include the federal alternative minimum tax (AMT)) and the personal income taxes imposed by the state of Ohio and Ohio municipalities. Interest income from the Fund's investments may be subject to the federal AMT for individuals and corporations.
2. Significant Accounting Policies
The following is a summary of significant accounting policies consistently followed by the Fund in the preparation of its financial statements. These policies are in conformity with U.S. generally accepted accounting principles (GAAP).
Investment Valuation
In calculating its net asset value (NAV), the Fund generally values investments as follows:
- Fixed-income securities acquired with maturities greater than 60 days are fair valued using price evaluations provided by a pricing service approved by the Board of Trustees (the “Trustees”).
- Fixed-income securities acquired with remaining maturities of 60 days or less are valued at their cost (adjusted for the accretion of any discount or amortization of any premium), which approximates market value.
- Derivative contracts listed on exchanges are valued at their reported settlement or closing price.
- Over-the-counter (OTC) derivative contracts are fair valued using price evaluations provided by a pricing service approved by the Trustees.
- Shares of other mutual funds are valued based upon their reported NAVs.
- For securities that are fair valued in accordance with procedures established by and under the general supervision of the Trustees, certain factors may be considered such as: the purchase price of the security, information obtained by contacting the issuer, analysis of the issuer's financial statements or other available documents, fundamental analytical data, the nature and duration of restrictions on disposition, the movement of the market in which the security is normally traded and public trading in similar securities of the issuer or comparable issuers.
Annual Shareholder Report
If the Fund cannot obtain a price or price evaluation from a pricing service for an investment, the Fund may attempt to value the investment based upon the mean of bid and asked quotations or fair value the investment based on price evaluations, from one or more dealers. If any price, quotation, price evaluation or other pricing source is not readily available when the NAV is calculated, the Fund uses the fair value of the investment determined in accordance with the procedures described below. There can be no assurance that the Fund could purchase or sell an investment at the price used to calculate the Fund's NAV.Fair Valuation and Significant Events Procedures
The Trustees have authorized the use of pricing services to provide evaluations of the current fair value of certain investments for purposes of calculating the NAV. Factors considered by pricing services in evaluating an investment include the yields or prices of investments of comparable quality, coupon, maturity, call rights and other potential prepayments, terms and type, reported transactions, indications as to values from dealers and general market conditions. Some pricing services provide a single price evaluation reflecting the bid-side of the market for an investment (a “bid” evaluation). Other pricing services offer both bid evaluations and price evaluations indicative of a price between the prices bid and asked for the investment (a “mid” evaluation). The Fund normally uses bid evaluations for U.S. Treasury and Agency securities, mortgage-backed securities and municipal securities. The Fund normally uses mid evaluations for other types of fixed-income securities and OTC derivative contracts. In the event that market quotations and price evaluations are not available for an investment, the fair value of the investment is determined in accordance with procedures adopted by the Trustees.
The Trustees also have adopted procedures requiring an investment to be priced at its fair value whenever the Adviser determines that a significant event affecting the value of the investment has occurred between the time as of which the price of the investment would otherwise be determined and the time as of which the NAV is computed. An event is considered significant if there is both an affirmative expectation that the investment's value will change in response to the event and a reasonable basis for quantifying the resulting change in value. Examples of significant events that may occur after the close of the principal market on which a security is traded, or after the time of a price evaluation provided by a pricing service or a dealer, include:
- With respect to price evaluations of fixed-income securities determined before the close of regular trading on the NYSE, actions by the Federal Reserve Open Market Committee and other significant trends in U.S. fixed-income markets;
- Political or other developments affecting the economy or markets in which an issuer conducts its operations or its securities are traded; and
- Announcements concerning matters such as acquisitions, recapitalizations, litigation developments, a natural disaster affecting the issuer's operations or regulatory changes or market developments affecting the issuer's industry.
The Fund may seek to obtain more current quotations or price evaluations from alternative pricing sources. If a reliable alternative pricing source is not available, the Fund will determine the fair value of the investment using another method approved by the Trustees.
Investment Income, Gains and Losses, Expenses and Distributions
Investment transactions are accounted for on a trade date basis. Realized gains and losses from investment transactions are recorded on an identified cost basis. Interest income and expenses are accrued daily. Distributions to shareholders are recorded on the ex-dividend date. Distributions of net investment income are declared and paid monthly. Non-cash Annual Shareholder Report
dividends included in dividend income, if any, are recorded at fair value. Investment income, realized and unrealized gains and losses, and certain fund-level expenses are allocated to each class based on relative average daily net assets, except that each class may bear certain expenses unique to that class such as account administration, distribution services and shareholder services fees. For the year ended August 31, 2011, account administration fees for the Fund were as follows: | Account
Administration
Fees Incurred |
| Class F Shares | $594 |
Dividends are declared separately for each class. No class has preferential dividend rights; differences in per share dividend rates are generally due to differences in separate class expenses.
Premium and Discount Amortization
All premiums and discounts on fixed-income securities are amortized/accreted using the effective interest rate method.
Federal Taxes
It is the Fund's policy to comply with the Subchapter M provision of the Internal Revenue Code and to distribute to shareholders each year substantially all of its income. Accordingly, no provision for federal income tax is necessary. As of and during the year ended August 31, 2011, the Fund did not have a liability for any uncertain tax positions. The Fund recognizes interest and penalties, if any, related to tax liabilities as income tax expense in the Statement of Operations. As of August 31, 2011, tax years 2008 through 2011 remain subject to examination by the Fund's major tax jurisdictions, which include the United States of America and the Commonwealth of Massachusetts.
When-Issued and Delayed Delivery Transactions
The Fund may engage in when-issued or delayed delivery transactions. The Fund records when-issued securities on the trade date and maintains security positions such that sufficient liquid assets will be available to make payment for the securities purchased. Securities purchased on a when-issued or delayed delivery basis are marked to market daily and begin earning interest on the settlement date. Losses may occur on these transactions due to changes in market conditions or the failure of counterparties to perform under the contract.
Other
The preparation of financial statements in conformity with GAAP requires management to make estimates and assumptions that affect the amounts of assets, liabilities, expenses and revenues reported in the financial statements. Actual results could differ from those estimated.
Annual Shareholder Report
3. Shares of Beneficial InterestThe following table summarizes share activity:
| Year Ended August 31 | 2011 | 2010 |
| Class A Shares: | Shares | Amount | Shares | Amount |
| Shares sold | 487,067 | $5,235,408 | 534,701 | $5,817,233 |
| Shares issued to shareholders in payment of distributions declared | 30,581 | 327,696 | 20,749 | 225,320 |
| Shares redeemed | (998,958) | (10,649,720) | (1,130,713) | (12,229,733) |
| NET CHANGE RESULTING FROM CLASS A SHARE TRANSACTIONS | (481,310) | $(5,086,616) | (575,263) | $(6,187,180) |
| Year Ended August 31 | 2011 | 2010 |
| Class F Shares: | Shares | Amount | Shares | Amount |
| Shares sold | 956,698 | $10,353,860 | 1,839,372 | $19,986,033 |
| Shares issued to shareholders in payment of distributions declared | 303,161 | 3,249,987 | 278,262 | 3,021,558 |
| Shares redeemed | (2,600,313) | (27,789,376) | (1,603,699) | (17,387,616) |
| NET CHANGE RESULTING FROM CLASS F SHARE TRANSACTIONS | (1,340,454) | $(14,185,529) | 513,935 | $5,619,975 |
| NET CHANGE RESULTING FROM TOTAL FUND SHARE TRANSACTIONS | (1,821,764) | $(19,272,145) | (61,328) | $(567,205) |
4. Federal Tax Information
The timing and character of income and capital gain distributions are determined in accordance with income tax regulations, which may differ from GAAP. These differences are due in part to differing treatments for expiration of capital loss carryforwards and discount accretion/premium amortization on debt securities.
For the year ended August 31, 2011, permanent differences identified and reclassified among the components of net assets were as follows:
| Increase (Decrease) |
| Paid-In Capital | Undistributed
Net Investment
Income (Loss) | Accumulated
Net Realized
Gain (Loss) |
| $(87,412) | $(31,275) | $118,687 |
Net investment income (loss), net realized gains (losses) and net assets were not affected by this reclassification.
The tax character of distributions as reported on the Statement of Changes in Net Assets for the years ended August 31, 2011 and 2010, was as follows:
| 2011 | 2010 |
| Ordinary Income | $10 | $36 |
| Tax-exempt income | $6,747,590 | $6,865,502 |
Annual Shareholder Report
As of August 31, 2011, the components of distributable earnings on a tax basis were as follows:| Undistributed tax-exempt income | $35,006 |
| Net unrealized appreciation | $6,565,306 |
| Capital loss carryforwards and deferrals | $(3,850,728) |
At August 31, 2011, the cost of investments for federal tax purposes was $159,711,529. The net unrealized appreciation of investments for federal tax purposes was $6,565,306. This consists of net unrealized appreciation from investments for those securities having an excess of value over cost of $7,681,742, and net unrealized depreciation from investments for those securities having an excess of cost over value of $1,116,436.
At August 31, 2011, the Fund had a capital loss carryforward of $2,828,247 which will reduce the Fund's taxable income arising from future net realized gains on investments, if any, to the extent permitted by the Code and thus will reduce the amount of distributions to shareholders which would otherwise be necessary to relieve the Fund of any liability for federal income tax. Pursuant to the Code, such capital loss carryforward will expire as follows:
| Expiration Year | Expiration Amount |
| 2012 | $176,880 |
| 2013 | $621,142 |
| 2015 | $180,029 |
| 2016 | $641,658 |
| 2017 | $626,069 |
| 2018 | $560,004 |
| 2019 | $22,465 |
Capital loss carryforwards of $87,412 expired during the year ended August 31, 2011.
Under current tax regulations, capital losses on securities transactions realized after October 31, may be deferred and treated as occurring on the first day of the following fiscal year. As of August 31, 2011, for federal income tax purposes, post-October losses of $1,022,481 was deferred to September 1, 2011.
Under the recently enacted Regulated Investment Company Modernization Act of 2010, the Fund will be permitted to carry forward capital losses incurred in taxable years beginning after December 22, 2010, for an unlimited period. However, any losses incurred during those future years will be required to be utilized prior to the losses incurred in pre-enactment tax years. As a result of this ordering rule, pre-enactment capital loss carryforwards may be more likely to expire unused. Additionally, post-enactment capital losses that are carried forward will retain their character as either short-term or long-term capital losses rather than being considered all short-term as under previous law.
Annual Shareholder Report
5. Investment Adviser Fee and Other Transactions with AffiliatesInvestment Adviser Fee
Federated Investment Management Company is the Fund's investment adviser (the “Adviser”). The advisory agreement between the Fund and the Adviser provides for an annual fee equal to 0.40% of the Fund's average daily net assets. Subject to the terms described in the Expense Limitation note, the Adviser may voluntarily choose to waive any portion of its fee. For the year ended August 31, 2011, the Adviser voluntarily waived $282,402 of its fee.
Administrative Fee
Federated Administrative Services (FAS), under the Administrative Services Agreement, provides the Fund with administrative personnel and services. The fee paid to FAS is based on the average aggregate daily net assets of certain Federated funds as specified below:
| Administrative Fee | Average Aggregate Daily
Net Assets of the Federated Funds |
| 0.150% | on the first $5 billion |
| 0.125% | on the next $5 billion |
| 0.100% | on the next $10 billion |
| 0.075% | on assets in excess of $20 billion |
The administrative fee received during any fiscal year shall be at least $150,000 per portfolio and $40,000 per each additional class of Shares. Subject to the terms described in the Expense Limitation note, FAS may voluntarily choose to waive any portion of its fee. For the year ended August 31, 2011, the net fee paid to FAS was 0.088% of average daily net assets of the Fund. FAS waived $33,223 of its fee.
Distribution Services Fee
The Fund has adopted a Distribution Plan (the “Plan”) pursuant to Rule 12b-1 under the Act. Under the terms of the Plan, the Fund will compensate Federated Securities Corp. (FSC), the principal distributor, from the daily net assets of the Fund's Class A Shares and Class F Shares to finance activities intended to result in the sale of these shares. The Plan provides that the Fund may incur distribution expenses at the following percentage of average daily net assets, annually, to compensate FSC.
| Share Class Name | Percentage of Average Daily
Net Assets of Class |
| Class A Shares | 0.05% |
| Class F Shares | 0.40% |
Subject to the terms described in the Expense Limitation note, FSC may voluntarily choose to waive any portion of its fee. For the year ended August 31, 2011, distribution services fees for the Fund were as follows:
| Distribution
Services Fees
Incurred | Distribution
Services Fees
Waived |
| Class F Shares | $498,975 | $(311,859) |
Annual Shareholder ReportWhen FSC receives fees, it may pay some or all of them to financial intermediaries whose customers purchase shares. For the year ended August 31, 2011, FSC retained $187,116 of fees paid by the Fund. For the year ended August 31, 2011, the Fund's Class A Shares did not incur a distribution services fee; however it may begin to incur this fee upon approval of the Trustees.
Sales Charges
Front-end sales charges and contingent deferred sales charges (CDSC) do not represent expenses of the Fund. They are deducted from the proceeds of sales of Fund shares prior to investment or from redemptions proceeds prior to remittance, as applicable. For the year ended August 31, 2011, FSC did not receive any fees paid by the Fund.
Shareholder Services Fee
The Fund may pay fees (Service Fees) up to 0.25% of the average daily net assets of the Fund's Class A Shares and Class F Shares to financial intermediaries or to Federated Shareholder Services Company (FSSC) for providing services to shareholders and maintaining shareholder accounts. Subject to the terms described in the Expense Limitation note, FSSC may voluntarily reimburse the Fund for Service Fees. For the year ended August 31, 2011, Service Fees for the Fund were as follows:
| Service Fees
Incurred |
| Class A Shares | $132,432 |
| Class F Shares | 311,266 |
| TOTAL | $443,698 |
For the year ended August 31, 2011, FSSC received $1,476 of fees paid by the Fund.
Interfund Transactions
During the year ended August 31, 2011, the Fund engaged in purchase and sale transactions with funds that have a common investment adviser (or affiliated investment advisers), common Directors/Trustees and/or common Officers. These purchase and sale transactions complied with Rule 17a-7 under the Act and amounted to $33,395,000 and $35,550,000, respectively.
Expense Limitation
The Adviser and its affiliates (which may include FSC, FAS and FSSC) have voluntarily agreed to waive their fees and/or reimburse expenses so that the total annual fund operating expenses (as shown in the financial highlights) paid by the Fund's Class A Shares and Class F Shares (after the voluntary waivers and reimbursements) will not exceed 0.75% and 0.90%, (the “Fee Limit”), respectively, up to but not including the later of (the “Termination Date”): (a) November 1, 2012; or (b) the date of the Fund's next effective Prospectus. While the Adviser and its affiliates currently do not anticipate terminating or increasing these arrangements prior to the Termination Date, these arrangements may only be terminated or the Fee Limit increased prior to the Termination Date with the agreement of the Trustees.
Annual Shareholder Report
GeneralCertain Officers and Trustees of the Fund are Officers and Directors or Trustees of the above companies.
6. Investment Transactions
Purchases and sales of investments, excluding long-term U.S. government securities and short-term obligations, for the year ended August 31, 2011, were as follows:
| Purchases | $15,066,229 |
| Sales | $33,623,962 |
7. Concentration of Risk
Since the Fund invests a substantial portion of its assets in issuers located in one state, it will be more susceptible to factors adversely affecting issuers of that state than would be a comparable tax-exempt mutual fund that invests nationally. In order to reduce the credit risk associated with such factors, at August 31, 2011, 32.7% of the securities in the portfolio of investments is backed by letters of credit or bond insurance of various financial institutions and financial guaranty assurance agencies. The largest percentage of investments insured by or supported (backed) by a letter of credit from any one institution or agency was 8.3% of total investments.
8. Line of Credit
The Fund participates in a $100,000,000 unsecured, uncommitted revolving line of credit (LOC) agreement with PNC Bank. The LOC was made available for extraordinary or emergency purposes, primarily for financing redemption payments. Borrowings are charged interest at a rate offered to the Fund by PNC Bank at the time of the borrowing. As of August 31, 2011, there were no outstanding loans. During the year ended August 31, 2011, the Fund did not utilize the LOC.
9. Interfund LEnDing
Pursuant to an Exemptive Order issued by the Securities and Exchange Commission, the Fund, along with other funds advised by subsidiaries of Federated Investors, Inc., may participate in an interfund lending program. This program provides an alternative credit facility allowing the funds to borrow from other participating affiliated funds. As of August 31, 2011, there were no outstanding loans. During the year ended August 31, 2011, the program was not utilized.
Annual Shareholder Report
10. Recent Accounting PronouncementsIn April 2011, the Financial Accounting Standards Board (FASB) released Accounting Standards Update (ASU) No. 2011-03, “Reconsideration of Effective Control for Repurchase Agreements.” This ASU amends FASB Accounting Standards Codification (ASC) Topic 860, “Transfers and Servicing”; specifically the criteria required to determine whether a repurchase agreement and similar agreements should be accounted for as sales of financial assets or secured borrowings with commitments. This ASU is effective for fiscal years and interim periods beginning after December 15, 2011. At this time, management is evaluating the implications of adopting ASU No. 2011-03 and its impact on the Fund's financial statements and the accompanying notes, net assets and results of operations.
In addition, in May 2011, FASB released ASU No. 2011-04, “Amendments to Achieve Common Fair Value Measurement and Disclosure Requirements in U.S. GAAP and IFRSs.” This ASU amends FASB ASC Topic 820, “Fair Value Measurement,” to establish common requirements for measuring fair value and for disclosing information about fair value measurements in accordance with GAAP. This ASU is effective for fiscal years and interim periods beginning after December 15, 2011. At this time, management is evaluating the implications of adopting ASU No. 2011-04 and its impact on the Fund's financial statements and the accompanying notes.
11. Federal Tax Information (unaudited)
For the fiscal year ended August 31, 2011, 100% of distributions from net investment income is exempt from federal income tax, other than the federal AMT.
Annual Shareholder Report Report of Independent Registered Public Accounting Firm
TO THE BOARD OF TRUSTEES OF federated municipal securities income trust AND SHAREHOLDERS OF federated Ohio Municipal income fund:
We have audited the accompanying statement of assets and liabilities, including the portfolio of investments, of Federated Ohio Municipal Income Fund (the “Fund”), a portfolio of Federated Municipal Securities Income Trust, as of August 31, 2011, and the related statement of operations for the year then ended, the statements of changes in net assets for each of the years or periods in the two-year period then ended, and the financial highlights for each of the years in the five-year period then ended. These financial statements and financial highlights are the responsibility of the Fund's management. Our responsibility is to express an opinion on these financial statements and financial highlights based on our audits.
We conducted our audits in accordance with the standards of the Public Company Accounting Oversight Board (United States). Those standards require that we plan and perform the audit to obtain reasonable assurance about whether the financial statements and financial highlights are free of material misstatement. An audit includes examining, on a test basis, evidence supporting the amounts and disclosures in the financial statements. Our procedures included confirmation of securities owned as of August 31, 2011, by correspondence with the custodian and brokers or by other appropriate auditing procedures. An audit also includes assessing the accounting principles used and significant estimates made by management, as well as evaluating the overall financial statement presentation. We believe that our audits provide a reasonable basis for our opinion.
In our opinion, the financial statements and financial highlights referred to above present fairly, in all material respects, the financial position of Federated Ohio Municipal Income Fund as of August 31, 2011, and the results of its operations for the year then ended, the changes in its net assets for each of the years in the two-year period then ended, and the financial highlights for each of the years or periods in the five-year period then ended, in conformity with U.S. generally accepted accounting principles.
Boston, Massachusetts
October 25, 2011
Annual Shareholder Report Shareholder Expense Example (unaudited)
As a shareholder of the Fund, you incur two types of costs: (1) transaction costs, including sales charges (loads) on purchase or redemption payments; and (2) ongoing costs, including management fees and to the extent applicable, distribution (12b-1) fees and/or shareholder services fees and other Fund expenses. This Example is intended to help you to understand your ongoing costs (in dollars) of investing in the Fund and to compare these costs with the ongoing costs of investing in other mutual funds. It is based on an investment of $1,000 invested at the beginning of the period and held for the entire period from March 1, 2011 to August 31, 2011.
ACTUAL EXPENSES
The first section of the table below provides information about actual account values and actual expenses. You may use the information in this section, together with the amount you invested, to estimate the expenses that you incurred over the period. Simply divide your account value by $1,000 (for example, an $8,600 account value divided by $1,000 = 8.6), then multiply the result by the number in the first section under the heading entitled “Expenses Paid During Period” to estimate the expenses attributable to your investment during this period.
HYPOTHETICAL EXAMPLE FOR COMPARISON PURPOSES
The second section of the table below provides information about hypothetical account values and hypothetical expenses based on the Fund's actual expense ratio and an assumed rate of return of 5% per year before expenses, which is not the Fund's actual return. Thus, you should not use the hypothetical account values and expenses to estimate the actual ending account balance or your expenses for the period. Rather, these figures are required to be provided to enable you to compare the ongoing costs of investing in the Fund with other funds. To do so, compare this 5% hypothetical example with the 5% hypothetical examples that appear in the shareholder reports of the other funds.
Annual Shareholder Report
Please note that the expenses shown in the table are meant to highlight your ongoing costs only and do not reflect any transaction costs, such as sales charges (loads) on purchase or redemption payments. Therefore, the second section of the table is useful in comparing ongoing costs only, and will not help you determine the relative total costs of owning different funds. In addition, if these transaction costs were included, your costs would have been higher. | Beginning
Account Value
3/1/2011 | Ending
Account Value
8/31/2011 | Expenses Paid
During Period1 |
| Actual: | | | |
| Class A Shares | $1,000 | $1,055.50 | $3.89 |
| Class F Shares | $1,000 | $1,054.70 | $4.66 |
Hypothetical (assuming a 5% return
before expenses): | | | |
| Class A Shares | $1,000 | $1,021.42 | $3.82 |
| Class F Shares | $1,000 | $1,020.67 | $4.58 |
| 1 | Expenses are equal to the Fund's annualized net expense ratios, multiplied by the average account value over the period, multiplied by 184/365 (to reflect the one-half-year period). The annualized net expense ratios are as follows: |
| Class A Shares | 0.75% |
| Class F Shares | 0.90% |
Annual Shareholder Report Board of Trustees and Trust Officers
The Board of Trustees is responsible for managing the Trust's business affairs and for exercising all the Trust's powers except those reserved for the shareholders. The following tables give information about each Trustee and the senior officers of the Fund. Where required, the tables separately list Trustees who are “interested persons” of the Fund (i.e., “Interested” Trustees) and those who are not (i.e., “Independent” Trustees). Unless otherwise noted, the address of each person listed is Federated Investors Tower, 1001 Liberty Avenue, Pittsburgh, PA 15222. The address of all Independent Trustees listed is 4000 Ericsson Drive, Warrendale, PA 15086-7561; Attention: Mutual Fund Board. As of December 31, 2010, the Trust comprised five portfolio(s), and the Federated Fund Family consisted of 43 investment companies (comprising 136 portfolios). Unless otherwise noted, each Officer is elected annually. Unless otherwise noted, each Trustee oversees all portfolios in the Federated Fund Family and serves for an indefinite term. The Fund's Statement of Additional Information includes additional information about Trust Trustees and is available, without charge and upon request, by calling 1-800-341-7400.
Interested TRUSTEES Background
Name
Birth Date
Positions Held with Trust
Date Service Began | Principal Occupation(s) for Past Five Years,
Other Directorships Held and Previous Position(s) |
John F. Donahue*
Birth Date: July 28, 1924
Trustee
Began serving: August 1990 | Principal Occupations: Director or Trustee of the Federated Fund Family; Chairman and Director, Federated Investors, Inc.; Chairman of the Federated Fund Family's Executive Committee.
Previous Positions: Chairman of the Federated Fund Family; Trustee, Federated Investment Management Company; Chairman and Director, Federated Investment Counseling. |
J. Christopher Donahue*
Birth Date: April 11, 1949
President and Trustee
Began serving: August 1990 | Principal Occupations: Principal Executive Officer and President of the Federated Fund Family; Director or Trustee of some of the Funds in the Federated Fund Family; President, Chief Executive Officer and Director, Federated Investors, Inc.; Chairman and Trustee, Federated Investment Management Company; Trustee, Federated Investment Counseling; Chairman and Director, Federated Global Investment Management Corp.; Chairman, Federated Equity Management Company of Pennsylvania and Passport Research, Ltd. (investment advisory subsidiary of Federated); Trustee, Federated Shareholder Services Company; Director, Federated Services Company.
Previous Positions: President, Federated Investment Counseling; President and Chief Executive Officer, Federated Investment Management Company, Federated Global Investment Management Corp. and Passport Research, Ltd. |
| * | Family relationships and reasons for “interested” status: John F. Donahue is the father of J. Christopher Donahue; both are “interested” due to their beneficial ownership of shares of Federated Investors, Inc. and the positions they hold with Federated and its subsidiaries. |
Annual Shareholder Report INDEPENDENT TRUSTEES Background
Name
Birth Date
Positions Held with Trust
Date Service Began | Principal Occupation(s) for Past Five Years,
Other Directorships Held, Previous Position(s) and Qualifications |
Nicholas P. Constantakis, CPA
Birth Date: September 3, 1939
Trustee
Began serving: February 1998 | Principal Occupation: Director or Trustee of the Federated Fund Family.
Other Directorship Held: Director and Chairman of the Audit Committee, Michael Baker Corporation (architecture, engineering and construction services).
Previous Position: Partner, Andersen Worldwide SC.
Qualifications: Public accounting and director experience. |
John F. Cunningham
Birth Date: March 5, 1943
Trustee
Began serving: June 1999 | Principal Occupation: Director or Trustee of the Federated Fund Family.
Other Directorships Held: Chairman, President and Chief Executive Officer, Cunningham & Co., Inc. (strategic business consulting); Trustee Associate, Boston College.
Previous Positions: Director, Redgate Communications and EMC Corporation (computer storage systems); Chairman of the Board and Chief Executive Officer, Computer Consoles, Inc.; President and Chief Operating Officer, Wang Laboratories; Director, First National Bank of Boston; Director, Apollo Computer, Inc.
Qualifications: Business management and director experience. |
Maureen Lally-Green
Birth Date: July 5, 1949
Trustee
Began serving: August 2009 | Principal Occupations: Director or Trustee of the Federated Fund Family; Director, Office of Church Relations, Diocese of Pittsburgh; Adjunct Professor of Law, Duquesne University School of Law.
Other Directorships Held: Director, Auberle; Trustee, St. Francis University; Director, Ireland Institute of Pittsburgh; Director, UPMC Mercy Hospital; Regent, St. Vincent Seminary; Director, Epilepsy Foundation of Western and Central Pennsylvania; Director, Saint Thomas More Society, Allegheny County; Director, Carlow University.
Previous Position: Pennsylvania Superior Court Judge.
Qualifications: Legal and director experience. |
Peter E. Madden
Birth Date: March 16, 1942
Trustee
Began serving: August 1991 | Principal Occupation: Director or Trustee, and Chairman of the Board of Directors or Trustees, of the Federated Fund Family.
Previous Positions: Representative, Commonwealth of Massachusetts General Court; President, Chief Operating Officer and Director, State Street Bank and Trust Company and State Street Corporation (retired); Director, VISA USA and VISA International; Chairman and Director, Massachusetts Bankers Association; Director, Depository Trust Corporation; Director, The Boston Stock Exchange.
Qualifications: Business management, mutual fund services and director experience. |
Annual Shareholder ReportName
Birth Date
Positions Held with Trust
Date Service Began | Principal Occupation(s) for Past Five Years,
Other Directorships Held, Previous Position(s) and Qualifications |
Charles F. Mansfield, Jr.
Birth Date: April 10, 1945
Trustee
Began serving: January 1999 | Principal Occupations: Director or Trustee and Chairman of the Audit Committee of the Federated Fund Family; Management Consultant.
Previous Positions: Chief Executive Officer, PBTC International Bank; Partner, Arthur Young & Company (now Ernst & Young LLP); Chief Financial Officer of Retail Banking Sector, Chase Manhattan Bank; Senior Vice President, HSBC Bank USA (formerly, Marine Midland Bank); Vice President, Citibank; Assistant Professor of Banking and Finance, Frank G. Zarb School of Business, Hofstra University; Executive Vice President, DVC Group, Inc. (marketing, communications and technology).
Qualifications: Banking, business management, education and director experience. |
R. James Nicholson
Birth Date: February 4, 1938
Trustee
Began serving: January 2008 | Principal Occupations: Director or Trustee of the Federated Fund Family; Senior Counsel, Brownstein Hyatt Farber Schrek, P.C.; Former Secretary of the U.S. Dept. of Veterans Affairs; Former U.S. Ambassador to the Holy See; Former Chairman of the Republican National Committee.
Other Directorships Held: Director, Horatio Alger Association; Director, The Daniels Fund.
Previous Positions: Colonel, U.S. Army Reserve; Partner, Calkins, Kramer, Grimshaw and Harring, P.C.; General Counsel, Colorado Association of Housing and Building; Chairman and CEO, Nicholson Enterprises, Inc. (real estate holding company); Chairman and CEO, Renaissance Homes of Colorado.
Qualifications: Legal, government, business management and director experience. |
Thomas M. O'Neill
Birth Date: June 14, 1951
Trustee
Began serving: October 2006 | Principal Occupations: Director or Trustee of the Federated Fund Family; Sole Proprietor, Navigator Management Company (investment and strategic consulting).
Other Directorships Held: Board of Overseers, Children's Hospital of Boston; Visiting Committee on Athletics, Harvard College.
Previous Positions: Chief Executive Officer and President, Managing Director and Chief Investment Officer, Fleet Investment Advisors; President and Chief Executive Officer, Aeltus Investment Management, Inc.; General Partner, Hellman, Jordan Management Co., Boston, MA; Chief Investment Officer, The Putnam Companies, Boston, MA; Credit Analyst and Lending Officer, Fleet Bank; Director and Consultant, EZE Castle Software (investment order management software); Director, Midway Pacific (lumber).
Qualifications: Business management, mutual fund, director and investment experience. |
Annual Shareholder ReportName
Birth Date
Positions Held with Trust
Date Service Began | Principal Occupation(s) for Past Five Years,
Other Directorships Held, Previous Position(s) and Qualifications |
John S. Walsh
Birth Date: November 28, 1957
Trustee
Began serving: June 1999 | Principal Occupations: Director or Trustee of the Federated Fund Family; President and Director, Heat Wagon, Inc. (manufacturer of construction temporary heaters); President and Director, Manufacturers Products, Inc. (distributor of portable construction heaters); President, Portable Heater Parts, a division of Manufacturers Products, Inc.
Previous Position: Vice President, Walsh & Kelly, Inc.
Qualifications: Business management and director experience. |
James F. Will
Birth Date: October 12, 1938
Trustee
Began serving: April 2006 | Principal Occupations: Director or Trustee of the Federated Fund Family; formerly, Vice Chancellor and President, Saint Vincent College.
Other Directorships Held: Trustee, Saint Vincent College; Director, Alleghany Corporation; Trustee, Wheeling Jesuit University; Director, Liberty Tire Recycling.
Previous Positions: Chairman, President and Chief Executive Officer, Armco, Inc.; President and Chief Executive Officer, Cyclops Industries; President and Chief Operating Officer, Kaiser Steel Corporation.
Qualifications: Business management, education and director experience. |
OFFICERS
Name
Birth Date
Positions Held with Trust
Date Service Began | Principal Occupation(s) for Past Five Years
and Previous Position(s) |
John W. McGonigle
Birth Date: October 26, 1938
EXECUTIVE VICE PRESIDENT AND SECRETARY
Began serving: August 1990 | Principal Occupations: Executive Vice President and Secretary of the Federated Fund Family; Vice Chairman, Executive Vice President, Secretary and Director, Federated Investors, Inc.
Previous Positions: Trustee, Federated Investment Management Company and Federated Investment Counseling; Director, Federated Global Investment Management Corp., Federated Services Company and Federated Securities Corp. |
Richard A. Novak
Birth Date: December 25, 1963
TREASURER
Began serving: January 2006 | Principal Occupations: Principal Financial Officer and Treasurer of the Federated Fund Family; Senior Vice President, Federated Administrative Services; Financial and Operations Principal for Federated Securities Corp., Edgewood Services, Inc. and Southpointe Distribution Services, Inc.
Previous Positions: Controller of Federated Investors, Inc.; Vice President, Finance of Federated Services Company; held various financial management positions within The Mercy Hospital of Pittsburgh; Auditor, Arthur Andersen & Co. |
Annual Shareholder ReportName
Birth Date
Positions Held with Trust
Date Service Began | Principal Occupation(s) for Past Five Years
and Previous Position(s) |
Richard B. Fisher
Birth Date: May 17, 1923
VICE CHAIRMAN
Began serving: August 2002 | Principal Occupations: Vice Chairman or Vice President of some of the Funds in the Federated Fund Family; Vice Chairman, Federated Investors, Inc.; Chairman, Federated Securities Corp.
Previous Positions: President and Director or Trustee of some of the Funds in the Federated Fund Family; Executive Vice President, Federated Investors, Inc.; Director and Chief Executive Officer, Federated Securities Corp. |
Brian P. Bouda
Birth Date: February 28, 1947
CHIEF COMPLIANCE OFFICER AND SENIOR VICE PRESIDENT
Began serving: August 2004 | Principal Occupations: Senior Vice President and Chief Compliance Officer of the Federated Fund Family; Vice President and Chief Compliance Officer of Federated Investors, Inc. and Chief Compliance Officer of its subsidiaries. Mr. Bouda joined Federated in 1999 and is a member of the American Bar Association and the State Bar Association of Wisconsin. |
Robert J. Ostrowski
Birth Date: April 26, 1963
CHIEF INVESTMENT OFFICER
Began serving: February 2010 | Principal Occupations: Robert J. Ostrowski joined Federated in 1987 as an Investment Analyst and became a Portfolio Manager in 1990. He was named Chief Investment Officer of taxable fixed-income products in 2004 and also serves as a Senior Portfolio Manager. Mr. Ostrowski became an Executive Vice President of the Fund's Adviser in 2009 and served as a Senior Vice President of the Fund's Adviser from 1997 to 2009. Mr. Ostrowski has received the Chartered Financial Analyst designation. He received his M.S. in Industrial Administration from Carnegie Mellon University. |
J. Scott Albrecht
Birth Date: June 1, 1960
VICE PRESIDENT
Began serving: November 1999 | Principal Occupations: J. Scott Albrecht has been the Fund's portfolio manager since March 1995. He is Vice President of the Trust. Mr. Albrecht joined Federated in 1989. He became a Senior Vice President of the Fund's Adviser in January 2005 and served as a Vice President of the Fund's Adviser from 1994 through 2004. He has been a Senior Portfolio Manager since 1997 and was a Portfolio Manager from 1994 to 1996. Mr. Albrecht has received the Chartered Financial Analyst designation and holds an M.S. in Public Management from Carnegie Mellon University. |
Annual Shareholder Report Evaluation and Approval of Advisory Contract – May 2011
federated ohio municipal income fund (the “Fund”)
The Fund's Board reviewed the Fund's investment advisory contract at meetings held in May 2011. The Board's decision regarding the contract reflects the exercise of its business judgment on whether to continue the existing arrangements.
In this connection, the Federated Funds' Board had previously appointed a Senior Officer, whose duties include specified responsibilities relating to the process by which advisory fees are to be charged to a Federated fund. The Senior Officer has the authority to retain consultants, experts, or staff as may be reasonably necessary to assist in the performance of his duties, reports directly to the Board, and may be terminated only with the approval of a majority of the independent members of the Board. The Senior Officer prepared and furnished to the Board an independent, written evaluation that covered topics discussed below (the “Evaluation”). The Board considered that Evaluation, along with other information, in deciding to approve the advisory contract.
During its review of the contract, the Board considered compensation and benefits received by the Adviser. This included the fees received for services provided to the Fund by other entities in the Federated organization and research services (if any) received by the Adviser from brokers that execute Federated fund trades, as well as advisory fees. The Board is also familiar with and considered judicial decisions concerning allegedly excessive investment advisory fees, which have indicated that the following factors may be relevant to an Adviser's fiduciary duty with respect to its receipt of compensation from a fund: the nature and quality of the services provided by the Adviser, including the performance of the fund; the Adviser's cost of providing the services; the extent to which the Adviser may realize “economies of scale” as a fund grows larger; any indirect benefits that may accrue to the Adviser and its affiliates as a result of the Adviser's relationship with a fund; performance and expenses of comparable funds; and the extent to which the independent Board members are fully informed about all facts the Board deems relevant bearing on the Adviser's services and fees. The Board further considered management fees (including any components thereof) charged to institutional and other clients of the Adviser for what might be viewed as like services, and the cost to the Adviser and its affiliates of supplying services pursuant to the management fee agreements, excluding any intra-corporate profit and profit margins of the Adviser and its affiliates for supplying such services. The Board was aware of these factors and was guided by them in its review of the Fund's advisory contract to the extent it considered them to be appropriate and relevant, as discussed further below.
Annual Shareholder Report
The Board considered and weighed these circumstances in light of its substantial accumulated experience in governing the Fund and working with Federated on matters relating to the Federated funds, and was assisted in its deliberations by independent legal counsel. Throughout the year, the Board has requested and received substantial and detailed information about the Fund and the Federated organization that was in addition to the extensive materials that comprise and accompany the Senior Officer's Evaluation. Federated provided much of this information at each regular meeting of the Board, and furnished additional information in connection with the particular meeting at which the Board's formal review of the advisory contract occurred. Between regularly scheduled meetings, the Board also received information on particular matters as the need arose. Thus, the Board's consideration of the advisory contract included review of the Senior Officer's Evaluation, accompanying data and additional information covering such matters as: the Adviser's investment philosophy, revenue, profitability, personnel and processes; investment and operating strategies; the Fund's short- and long-term performance (in absolute terms, both on a gross basis and net of expenses, as well as in relationship to its particular investment program and certain competitor or “peer group” funds and/or other benchmarks, as appropriate), and comments on the reasons for performance; the Fund's investment objectives; the Fund's expenses (including the advisory fee itself and the overall expense structure of the Fund, both in absolute terms and relative to similar and/or competing funds, with due regard for contractual or voluntary expense limitations); the use and allocation of brokerage commissions derived from trading the Fund's portfolio securities (if any); and the nature, quality and extent of the advisory and other services provided to the Fund by the Adviser and its affiliates. The Board also considered the preferences and expectations of Fund shareholders and their relative sophistication; the continuing state of competition in the mutual fund industry and market practices; the range of comparable fees for similar funds in the mutual fund industry; the Fund's relationship to the Federated family of funds which include a comprehensive array of funds with different investment objectives, policies and strategies which are available for exchange without the incurrence of additional sales charges; compliance and audit reports concerning the Federated funds and the Federated companies that service them (including communications from regulatory agencies), as well as Federated's responses to any issues raised therein; and relevant developments in the mutual fund industry and how the Federated funds and/or Federated are responding to them. The Board's evaluation process is evolutionary. The criteria considered and the emphasis placed on relevant criteria change in recognition of changing circumstances in the mutual fund marketplace.With respect to the Fund's performance and expenses in particular, the Board has found the use of comparisons to other mutual funds with comparable investment programs to be relevant, given the high degree of competition in the mutual fund business. The Board focused on comparisons with other similar Annual Shareholder Report
mutual funds more heavily than non-mutual fund products or services because it is believed that they are more relevant. For example, other mutual funds are the products most like the Fund, they are readily available to Fund shareholders as alternative investment vehicles, and they are the type of investment vehicle in fact chosen and maintained by the Fund's investors. The range of their fees and expenses therefore appears to be a generally reliable indication of what consumers have found to be reasonable in the precise marketplace in which the Fund competes. The Fund's ability to deliver competitive performance when compared to its peer group was a useful indicator of how the Adviser is executing the Fund's investment program, which in turn assisted the Board in reaching a conclusion that the nature, extent, and quality of the Adviser's investment management services were such as to warrant continuation of the advisory contract. In this regard, the Senior Officer has reviewed Federated's fees for providing advisory services to products outside the Federated family of funds (e.g., institutional and separate accounts). He concluded that mutual funds and institutional accounts are inherently different products. Those differences include, but are not limited to, different types of targeted investors; being subject to different laws and regulations; different legal structures; different average account sizes; different associated costs; different portfolio management techniques made necessary by different cash flows; and portfolio manager time spent in review of securities pricing. The Senior Officer did not consider these fee schedules to be determinative in judging the appropriateness of mutual fund advisory contracts.The Senior Officer reviewed information compiled by Federated, using data supplied by independent fund ranking organizations, regarding the performance of, and fees charged by, other mutual funds, noting his view that comparisons to fund peer groups are relevant in judging the reasonableness of proposed fees.
For the periods covered by the Evaluation, the Fund's performance for the one-year period was above the median of the relevant peer group, and the Fund's performance fell below the median of the relevant peer group for the three and five-year periods. The Board discussed the Fund's performance with the Adviser and recognized the efforts being undertaken by the Adviser. The Board will continue to monitor these efforts and the performance of the Fund.
The Board also received financial information about Federated, including information regarding the compensation and benefits Federated derived from its relationships with the Federated funds. This information covered not only the fees under the advisory contracts, but also fees received by Federated's subsidiaries for providing other services to the Federated funds under separate contracts (e.g., for serving as the Federated funds' administrator). The information also detailed any indirect benefit Federated may derive from its receipt of research services from brokers who execute Federated fund trades. In addition, the Board considered the fact that, in order for a fund to be competitive in the marketplace, Federated and its affiliates frequently waived fees Annual Shareholder Report
and/or reimbursed expenses and have disclosed to fund investors and/or indicated to the Board their intention to do so in the future, where appropriate. Moreover, the Board receives regular reporting as to the institution or elimination of these voluntary waivers.Federated furnished information, requested by the Senior Officer, that reported revenues on a fund-by-fund basis and made estimates of the allocation of expenses on a fund-by-fund basis, using allocation methodologies specified by the Senior Officer. The Senior Officer noted that, although they may apply consistent allocation processes, the inherent difficulties in allocating costs (and the unavoidable arbitrary aspects of that exercise) and the lack of consensus on how to allocate those costs may render such allocation information unreliable. The allocation information was considered in the analysis by the Board but was determined to be of limited use.
The Board and the Senior Officer also reviewed information compiled by Federated comparing profitability information for Federated to other publicly held fund management companies. In this regard, the Senior Officer noted the limited availability of such information, but nonetheless concluded that Federated's profit margins did not appear to be excessive and the Board agreed.
The Senior Officer's Evaluation also discussed the notion of possible realization of “economies of scale” as a fund grows larger. The Board considered in this regard that the Adviser has made significant and long-term investments in areas that support all of the Federated funds, such as personnel and processes for the portfolio management, compliance, internal audit, and risk management functions; and systems technology; and that the benefits of these efforts (as well as any economies, should they exist) were likely to be enjoyed by the fund complex as a whole. Finally, the Board also noted the absence of any applicable regulatory or industry guidelines on this subject, which (as discussed in the Senior Officer's Evaluation) is compounded by the lack of any common industry practice or general pattern with respect to structuring fund advisory fees with “breakpoints” that serve to reduce the fee as the fund attains a certain size. The Senior Officer did not recommend institution of breakpoints in pricing Federated's fund advisory services at this time.
It was noted in the materials for the Board meeting that for the period covered by the Evaluation, the Fund's investment advisory fee, after waivers and expense reimbursements, if any, was below the median of the relevant peer group. The Board reviewed the fees and other expenses of the Fund with the Adviser and was satisfied that the overall expense structure of the Fund remained competitive.
The Senior Officer noted that, considering the totality of the circumstances, and all of the factors referenced within his Evaluation, he had concluded that, subject to comments and recommendations made within his Evaluation, his observations and the information accompanying the Evaluation supported a finding by the Board that the management fees for each of the funds are reasonable and that Federated appeared to provide appropriate administrative Annual Shareholder Report
services to the Fund for the fees paid. Under these circumstances, no changes were recommended to, and no objection was raised to, the continuation of the Fund's advisory contract. The Board concluded that the nature, quality and scope of services provided the Fund by the Adviser and its affiliates were satisfactory.In its decision to continue an existing investment advisory contract, the Board was mindful of the potential disruptions of the Fund's operations and various risks, uncertainties and other effects that could occur as a result of a decision to terminate or not renew an advisory contract. In particular, the Board recognized that many shareholders have invested in the Fund on the strength of the Adviser's industry standing and reputation and with the expectation that the Adviser will have a continuing role in providing advisory services to the Fund. Thus, the Board's approval of the advisory contract reflected the fact that it is the shareholders who have effectively selected the Adviser by virtue of having invested in the Fund.
The Board based its decision to approve the advisory contract on the totality of the circumstances and relevant factors and with a view to past and future long-term considerations. Not all of the factors and considerations identified above were necessarily relevant to the Fund, nor did the Board consider any one of them to be determinative. With respect to the factors that were relevant, the Board's decision to approve the contract reflects its determination that Federated's performance and actions provided a satisfactory basis to support the decision to continue the existing arrangements.
Annual Shareholder Report Voting Proxies on Fund Portfolio Securities
A description of the policies and procedures that the Fund uses to determine how to vote proxies, if any, relating to securities held in the Fund's portfolio is available, without charge and upon request, by calling 1-800-341-7400. A report on “Form N-PX” of how the Fund voted any such proxies during the most recent 12-month period ended June 30 is available from Federated's website at FederatedInvestors.com. To access this information from the home page, select “View All” next to “Find Products.” Select a fund name and share class, if applicable, to go to the Fund Overview page. On the Fund Overview page, select the “Documents” tab. At the bottom of that page, select “Proxy Voting Record Report (Form N-PX).” Form N-PX filings are also available at the SEC's website at www.sec.gov.
Quarterly Portfolio Schedule
The Fund files with the SEC a complete schedule of its portfolio holdings, as of the close of the first and third quarters of its fiscal year, on “Form N-Q.” These filings are available on the SEC's website at www.sec.gov and may be reviewed and copied at the SEC's Public Reference Room in Washington, DC. (Call 1-800-SEC-0330 for information on the operation of the Public Reference Room.) You may also access this information from the “Products” section of Federated's website at FederatedInvestors.com. From the home page, select “View All” next to “Find Products.” Select a fund name and share class, if applicable, to go to the Fund Overview page. On the Fund Overview page, select the “Documents” tab. At the bottom of that page, select “Form N-Q.”
Annual Shareholder ReportMutual funds are not bank deposits or obligations, are not guaranteed by any bank and are not insured or guaranteed by the U.S. government, the Federal Deposit Insurance Corporation, the Federal Reserve Board or any other government agency. Investment in mutual funds involves investment risk, including the possible loss of principal.
This Report is authorized for distribution to prospective investors only when preceded or accompanied by the Trust's Prospectus, which contains facts concerning its objective and policies, management fees, expenses and other information.
Federated Ohio Municipal Income Fund
Federated Investors Funds
4000 Ericsson Drive
Warrendale, PA 15086-7561
Contact us at FederatedInvestors.com
or call 1-800-341-7400.
Federated Securities Corp., Distributor
Cusip 313923823
Cusip 313923609
28994 (10/11)
Federated is a registered trademark of Federated Investors, Inc.
2011 © Federated Investors, Inc.
| | Annual Shareholder Report |
| | August 31, 2011 |
|
| Share Class | Ticker |
| A | PAMFX |
| B | FPABX |
Federated Pennsylvania Municipal Income Fund
Fund Established 1990
A Portfolio of Federated Municipal Securities Income Trust
Dear Valued Shareholder,
I am pleased to present the Annual Shareholder Report for your fund covering the period from September 1, 2010 through August 31, 2011. This report includes Management's Discussion of Fund Performance, a complete listing of your fund's holdings, performance information and financial statements along with other important fund information.
In addition, our website, FederatedInvestors.com, offers easy access to Federated resources that include timely fund updates, economic and market insights from our investment strategists, and financial planning tools. We invite you to register to take full advantage of its capabilities.
Thank you for investing with Federated. I hope you find this information useful and look forward to keeping you informed.
Sincerely,
J. Christopher Donahue, President
Not FDIC Insured May Lose Value No Bank Guarantee
CONTENTS
Management's Discussion of Fund Performance
The Fund's total return, based on net asset value, for the 12-month reporting period ended August 31, 2011, was 1.92% for Class A Shares and 1.13% for Class B Shares. The total return of the S&P Municipal Bond Pennsylvania Index (PA Index or benchmark),1 the Fund's broad-based securities market index, was 2.82% during the same period. The Fund's total return for the most recently completed fiscal year reflected actual cash flows, transaction costs and other expenses, which were not reflected in the total return of the PA Index.
During the reporting period, the most significant factors affecting the Fund's performance relative to the PA Index were: (a) the effective duration of its portfolio (which indicates the portfolio's sensitivity to changes in interest rates);2,3 (b) the allocation of the Fund's portfolio among securities of similar issuers (referred to as sectors); and (c) the credit ratings of portfolio securities.
The following discussion focuses on the performance of the Fund's Class A Shares. The 1.92% total return of the Class A Shares for the reporting period consisted of 4.12% of tax-exempt dividends and reinvestments and -2.20% of price depreciation in the net asset value of the shares.4
MARKET OVERVIEW
During the 12-month reporting period, there was continued uncertainty regarding the economic outlook, regulatory policy and fiscal policy that continued to constrain hiring and capital investment. Economic growth was considerably slower than expected as reflected by deterioration in labor market conditions, slower household spending, a drop in consumer confidence and continued weakness in the housing market. The weakness in the household and business spending was accompanied by fiscal consolidation at the state and local government level. The shedding of state and local government jobs contributed to the deterioration in overall labor market conditions. Higher energy and commodity prices and the disruption from the Japanese earthquake were temporary factors that affected economic activity.
Throughout the period, concerns about the sovereign debt of certain European countries and the political controversy over the U.S. debt ceiling, its potential credit rating impact and the downgrade of the long-term credit rating of the federal government of the United States had an effect on investors' appetites for risk assets. As a result, the 10-year Treasury rallied from a high of 3.74% in February to a low of 2.06% in August 2011. Also, the tax-exempt municipal bond market experienced a widening in credit spreads during the period as the BBB-rated sector widened by over 20 basis points.
Annual Shareholder Report
The Commonwealth of Pennsylvania maintained its AA-rating and had the benefit of a diverse economic base which experienced some weakness commensurate with the national recession. The state also had a favorable debt profile compared to other states and was able to maintain an adequate reserve position. A major concern was the growing state unfunded pension liability and increased funding costs which were likely to put stress on the budget.Duration
As determined at the end of the 12-month reporting period, the Fund's dollar-weighted average duration for the reporting period was 5.33 years. Duration management was a significant component of the Fund's investment strategy. The shorter a fund's duration relative to an index, the less its net asset value will react as interest rates change. The Fund adjusted duration relative to the PA Index several times during the reporting period. The fund maintained an underweight position in the longer duration securities relative to the benchmark. As a result, the Fund's duration underweight position (95%) relative to the PA Index detracted from Fund performance.
Sector
During the 12-month reporting period, the Fund maintained a higher portfolio allocation to higher education issuers and water and sewer authorities. These allocations helped the Fund's performance due to the outperformance of these sectors relative to the PA Index. The Fund also had less of an allocation to transportation and healthcare-related debt than the benchmark. These sectors outperformed the PA Index during the period and the Fund's lesser allocation detracted from Fund performance relative to the PA Index.
CREDIT QUALITY
The 12-month reporting period experienced a tug of war for investors between continued risk aversion as economic activity deteriorated and a desire to reach for yield into the lower quality sectors of the market because of the historically low level of interest rates. The Fund's overweight position, relative to the PA Index, in A-rated debt during the reporting period helped the Fund's performance as the rates on A-rated debt decreased to a greater extent than for other investment-grade securities.5,6 Also, the Fund's weighting in BB-rated debt relative to the zero weighting of the PA Index in that rating category resulted in a negative contribution to Fund performance as a result of the underperformance of high yield or noninvestment-grade municipal securities.
Annual Shareholder Report| 1 | S&P Indices changed the name of the PA Index from “S&P/Investortools Municipal Bond Pennsylvania Index” to “S&P Municipal Bond Pennsylvania Index.” Please see the footnotes to the line graphs under “Fund Performance and Growth of a $10,000 Investment” below for the definition of, and more information about, the PA Index. |
| 2 | Duration is a measure of a security's price sensitivity to changes in interest rates. Securities with longer durations are more sensitive to changes in interest rates than securities with shorter durations. For purposes of this Management's Discussion of Fund Performance, duration is determined using a third-party analytical system. |
| 3 | Bond prices are sensitive to changes in interest rates and a rise in interest rates can cause a decline in their prices. |
| 4 | Income may be subject to the AMT for individuals and corporations. |
| 5 | Credit ratings pertain only to the securities in the portfolio and do not protect Fund shares against market risk. |
| 6 | Investment-grade securities and noninvestment-grade securities may either: be (a) rated by a nationally recognized statistical ratings organization or rating agency; or (b) unrated securities that the Fund's investment adviser (“Adviser”) believes are of comparable quality. The rating agencies that provided the ratings for rated securities include Standard and Poor's, Moody's Investor Services, Inc. and Fitch Rating Service. When ratings vary, the highest rating is used. Credit ratings of AA or better are considered to be high credit quality; credit ratings of A are considered high or medium/good quality; and credit ratings of BBB are considered to be medium/good credit quality, and the lowest category of investment grade securities; credit ratings of BB and below are lower-rated, noninvestment-grade securities or junk bonds; and credit ratings of CCC or below are noninvestment- grade securities that have high default risk. Any credit quality breakdown does not give effect to the impact of any credit derivative investments made by the Fund. Credit ratings are an indication of the risk that a security will default. They do not protect a security from credit risk. Lower-rated bonds typically offer higher yields to help compensate investors for the increased risk associated with them. Among these risks are lower creditworthiness, greater price volatility, more risk to principal and income than with higher-rated securities and increased possibilities of default. |
Annual Shareholder ReportFUND PERFORMANCE AND GROWTH OF A $10,000 INVESTMENT
The Average Annual Total Return table below shows returns for each class averaged over the stated periods. The graphs below illustrate the hypothetical investment of $10,0001 in Federated Pennsylvania Municipal Income Fund (the “Fund”) from August 31, 2001 to August 31, 2011, compared to the S&P Municipal Bond Pennsylvania Index (PA Index),2 the S&P Municipal Bond PA, Investment Grade, 3-Year Plus Sub-Index (PAIG Index)3 and the Morningstar Municipal Pennsylvania Funds Category Average (MSTARMPA).4
Average Annual Total Returns for the Period Ended 8/31/2011
(returns reflect all applicable sales charges and contingent deferred sales charge as specified below in footnote #1)
| Share Class | 1 Year | 5 Years | 10 Years |
| A | -2.62% | 1.64% | 3.29% |
| B | -4.25% | 1.45% | 3.11% |
Performance data quoted represents past performance which is no guarantee of future results. Investment return and principal value will fluctuate so that an investor's shares, when redeemed, may be worth more or less than their original cost. Mutual fund performance changes over time and current performance may be lower or higher than what is stated. For current to the most recent month-end performance and after-tax returns, visit FederatedInvestors.com or call 1-800-341-7400. Returns shown do not reflect the deduction of taxes that a shareholder would pay on Fund distributions or the redemption of Fund shares. Mutual funds are not obligations of or guaranteed by any bank and are not federally insured.
Annual Shareholder Report
GROWTH OF A $10,000 INVESTMENT – CLASS A SHARES| Federated Pennsylvania Municipal Income Fund - | Class A Shares | PA Index | PAIG Index | MSTARMPA |
| 8/31/2001 | 9,550 | 10,000 | 10,000 | 10,000 |
| 8/31/2002 | 10,190 | 10,621 | 10,660 | 10,525 |
| 8/31/2003 | 10,499 | 11,007 | 11,075 | 10,791 |
| 8/31/2004 | 11,178 | 11,812 | 11,900 | 11,429 |
| 8/31/2005 | 11,802 | 12,503 | 12,580 | 11,957 |
| 8/31/2006 | 12,160 | 12,923 | 12,988 | 12,279 |
| 8/31/2007 | 12,244 | 13,254 | 13,311 | 12,446 |
| 8/31/2008 | 12,191 | 13,733 | 13,849 | 12,688 |
| 8/31/2009 | 12,369 | 14,443 | 14,729 | 13,148 |
| 8/31/2010 | 13,556 | 15,865 | 16,305 | 14,443 |
| 8/31/2011 | 13,816 | 16,312 | 16,793 | 14,674 |
41 graphic description end -->
- Total returns shown include the maximum sales charge of 4.50% ($10,000 investment minus $450 sales charge = $9,550).
GROWTH OF A $10,000 INVESTMENT – CLASS B SHARES
| Federated Pennsylvania Municipal Income Fund - | Class B Shares | PA Index | PAIG Index | MSTARMPA |
| 8/31/2001 | 10,000 | 10,000 | 10,000 | 10,000 |
| 8/31/2002 | 10,579 | 10,621 | 10,660 | 10,525 |
| 8/31/2003 | 10,818 | 11,007 | 11,075 | 10,791 |
| 8/31/2004 | 11,429 | 11,812 | 11,900 | 11,429 |
| 8/31/2005 | 11,974 | 12,503 | 12,580 | 11,957 |
| 8/31/2006 | 12,241 | 12,923 | 12,988 | 12,279 |
| 8/31/2007 | 12,231 | 13,254 | 13,311 | 12,446 |
| 8/31/2008 | 12,072 | 13,733 | 13,849 | 12,688 |
| 8/31/2009 | 12,165 | 14,443 | 14,729 | 13,148 |
| 8/31/2010 | 13,333 | 15,865 | 16,305 | 14,443 |
| 8/31/2011 | 13,589 | 16,312 | 16,793 | 14,674 |
41 graphic description end -->
- Total returns shown include the maximum contingent deferred sales charge of 5.50% as applicable.
Annual Shareholder Report
| 1 | Represents a hypothetical investment of $10,000 in the Fund after deducting applicable sales charges: For Class A Shares, the maximum sales charge of 4.50% ($10,000 investment minus $450 sales charge = $9,550); For Class B Shares, the maximum contingent deferred sales charge is 5.50% on any redemption less than one year from the purchase date. The Fund's performance assumes the reinvestment of all dividends and distributions. The PA Index, PAIG Index and MSTARMPA have been adjusted to reflect reinvestment of dividends on securities in the index and average. |
| 2 | S&P Indices changed the name of the PA Index from “S&P/Investortools Municipal Bond Pennsylvania Index” to “S&P Municipal Bond Pennsylvania Index.” The PA Index consists of bonds in the S&P Municipal Bond Index (“Main Index”) that have been issued by the Commonwealth of Pennsylvania or local governments or state or local government entities within Pennsylvania. The Main Index is a broad, comprehensive, market value-weighted index composed of approximately 55,000 bond issues that are exempt from U.S. federal income taxes or subject to the alternative minimum tax (AMT). Eligibility criteria for inclusion in the Main Index include, but are not limited to: the bond issuer must be a state (including the Commonwealth of Puerto Rico and U.S. territories) or local government or state or local government entity where interest on the bond is exempt from U.S. federal income taxes or subject to the AMT; the bond must be held by a mutual fund for which Standard & Poor's Securities Evaluations, Inc. provides prices; it must be denominated in U.S. dollars and have a minimum par amount of $2 million; and the bond must have a minimum term to maturity and/or call date greater than or equal to one calendar month. The Main Index is rebalanced monthly. The PA Index is not adjusted to reflect sales charges, expenses and other fees that the Securities and Exchange Commission (SEC) requires to be reflected in the Fund's performance. The PA Index is unmanaged, and unlike the Fund, is not affected by cash flows. It is not possible to invest directly in an index. |
| 3 | S&P Indices changed the name of the PAIG Index from “S&P/Investortools Municipal Bond PA, Investment Grade, 3-Year Plus Sub-Index” to “S&P Municipal Bond Pennsylvania, Investment Grade, 3-Year Plus Sub-Index.” The PAIG Index represents the return of the portion of the PA Index composed solely of bonds that are rated at least BBB with remaining maturities of more than three years that are not subject to AMT. The PAIG Index is not adjusted to reflect sales charges, expenses and other fees that the SEC requires to be reflected in the Fund's performance. The PAIG Index is unmanaged and, unlike the Fund, is not affected by cash flows. It is not possible to invest directly in an index. |
| 4 | Morningstar figures represent the average of the total returns reported by all the mutual funds designated by Morningstar as falling into the respective category indicated. Funds designated within the MSTARMPA include those that invest at least 80% of assets in Pennsylvania municipal debt and can include long-, intermediate- and short-duration portfolios. They do not reflect sales charges. |
Annual Shareholder Report Portfolio of Investments Summary Table (unaudited)
At August 31, 2011, the Fund's sector composition1 was as follows:
| Sector Composition | Percentage of
Total Net Assets |
| Education | 17.2% |
| Hospital | 16.5% |
| Government Obligation — Local | 15.9% |
| Water and Sewer | 10.9% |
| Pre-refunded | 9.1% |
| Government Obligation — State | 7.2% |
| Special Care | 5.8% |
| Industrial Development Bond/Pollution Control Revenue | 4.4% |
| Transportation | 4.0% |
| Multi-Family Housing | 3.2% |
| Other2 | 7.9% |
| Other Assets and Liabilities — Net3 | (2.1)% |
| TOTAL | 100.0% |
| 1 | Sector classifications, and the assignment of holdings to such sectors, are based upon the economic sector and/or revenue source of the underlying obligor, as determined by the Fund's Adviser. For securities that have been enhanced by a third-party, including bond insurers and banks, sector classifications are based upon the economic sector and/or revenue source of the underlying obligor, as determined by the Fund's Adviser. Pre-refunded securities are those whose debt service is paid from escrowed assets, usually U.S. government securities. |
| 2 | For purposes of this table, sector classifications constitute 94.2% of the Fund's total net assets. Remaining sectors have been aggregated under the designation “Other.” |
| 3 | Assets, other than investments in securities, less liabilities. See Statement of Assets and Liabilities. |
Annual Shareholder Report Portfolio of Investments
August 31, 2011
Principal
Amount | | | Value |
| | MUNICIPAL BONDS – 99.2% | |
| | Pennsylvania – 99.2% | |
| $1,000,000 | | Abington, PA School District, UT GO Bonds, 4.00% (FGIC and National Public Finance Guarantee Corporation INS), 10/1/2012 | 1,036,600 |
| 3,555,000 | | Allegheny County, PA HDA, Hospital Revenue Bonds (Series 2008A), 5.00% (UPMC Health System), 6/15/2018 | 4,104,496 |
| 2,000,000 | | Allegheny County, PA HDA, Refunding Revenue Bonds (Series 1998A), 5.125% (Jefferson Regional Medical Center, PA)/(Original Issue Yield: 5.34%), 5/1/2023 | 1,957,780 |
| 2,000,000 | | Allegheny County, PA HDA, Revenue Bonds, 5.50% (Catholic Health East)/(Original Issue Yield: 5.60%), 11/15/2032 | 2,012,100 |
| 1,000,000 | | Allegheny County, PA Higher Education Building Authority, Revenue Bonds (Series 2002A), 5.95% (Chatham College)/(Original Issue Yield: 5.97%), 3/1/2032 | 1,002,090 |
| 1,000,000 | | Allegheny County, PA Higher Education Building Authority, Revenue Bonds (Series 2002B), 5.25% (Chatham College)/(Original Issue Yield: 5.35%), 11/15/2016 | 1,001,540 |
| 2,200,000 | | Allegheny County, PA Higher Education Building Authority, University Revenue Bonds (Series 2006A), 4.75% (Robert Morris University), 2/15/2026 | 1,991,968 |
| 250,000 | | Allegheny County, PA Higher Education Building Authority, University Revenue Bonds, 5.125% (Carnegie Mellon University)/(Original Issue Yield: 5.39%), 3/1/2032 | 250,912 |
| 1,000,000 | 1,2 | Allegheny County, PA IDA, Cargo Facilities Lease Revenue Bonds (Series 1999), 6.625% (AFCO Cargo PIT LLC Project)/(Original Issue Yield: 6.75%), 9/1/2024 | 859,080 |
| 1,385,000 | | Allegheny County, PA IDA, Environmental Improvement Refunding Revenue Bonds (Series 2005), 5.50% (United States Steel Corp.), 11/1/2016 | 1,420,207 |
| 3,000,000 | | Allegheny County, PA IDA, Environmental Improvement Revenue Refunding Bonds (Series 2009), 6.75% (United States Steel Corp.), 11/1/2024 | 3,224,580 |
| 860,000 | | Allegheny County, PA IDA, Lease Revenue Bonds (Series 2006), 5.125% (Residential Resources, Inc. Project), 9/1/2031 | 757,548 |
| 1,500,000 | | Allegheny County, PA IDA, Revenue Refunding Bonds, 4.05% (Duquesne Light Power Co.)/(AMBAC INS), 9/1/2011 | 1,500,000 |
| 2,000,000 | | Allegheny County, PA Port Authority, Special Revenue Transportation Refunding Bonds (Series 2011), 5.00% (Original Issue Yield: 5.20%), 3/1/2026 | 2,143,720 |
| 1,715,000 | | Allegheny County, PA Port Authority, Special Revenue Transportation Refunding Bonds (Series 2011), 5.75%, 3/1/2029 | 1,894,595 |
| 3,000,000 | | Bradford County, PA IDA, Solid Waste Disposal Refunding Revenue Bonds (Series 2005A), 4.70% (International Paper Co.), 3/1/2019 | 3,001,050 |
Annual Shareholder ReportPrincipal
Amount | | | Value |
| $750,000 | | Bucks County, PA IDA, Revenue Bonds (Series 2002A), 6.00% (Pennswood Village)/(United States Treasury PRF 10/1/2012@101)/(Original Issue Yield: 6.12%), 10/1/2027 | 801,795 |
| 500,000 | | Bucks County, PA IDA, Revenue Bonds (Series 2002A), 6.00% (Pennswood Village)/(United States Treasury PRF 10/1/2012@101)/(Original Issue Yield: 6.16%), 10/1/2034 | 534,530 |
| 2,000,000 | | Bucks County, PA Water & Sewer Authority, Revenue Bond, 4.20% (Assured Guaranty Municipal Corp. INS)/(Original Issue Yield: 4.21%), 6/1/2020 | 2,151,960 |
| 1,000,000 | | Carlisle, PA Area School District, UT GO Bonds, 4.00% (FGIC and National Public Finance Guarantee Corporation INS), 3/1/2013 | 1,052,700 |
| 1,055,000 | | Catasauqua, PA Area School District, UT GO Bonds, 5.00% (Assured Guaranty Municipal Corp. INS), 2/15/2031 | 1,091,556 |
| 1,500,000 | | Centre County, PA Hospital Authority, Hospital Revenue Bonds, 6.25% (Mount Nittany Medical Center)/(Assured Guaranty Corp. INS)/(Original Issue Yield: 6.30%), 11/15/2044 | 1,551,630 |
| 2,000,000 | | Chester County, PA HEFA, Revenue Bonds (Series 2006), 5.00% (Devereux Foundation), 11/1/2031 | 1,977,320 |
| 2,000,000 | | Chester County, PA, UT GO Bonds, 5.00%, 7/15/2028 | 2,239,840 |
| 1,500,000 | | Clarion County, PA IDA, Water Facility Revenue Refunding Bonds (Series 2009), 5.50% (Pennsylvania American Water Co.), 12/1/2039 | 1,559,325 |
| 5,075,000 | | Commonwealth of Pennsylvania, UT GO Bonds (Second Series 2009), 5.00%, 4/15/2023 | 5,851,475 |
| 4,000,000 | | Commonwealth of Pennsylvania, UT GO Bonds (Second Series 2010A), 5.00%, 5/1/2017 | 4,809,320 |
| 6,150,000 | | Commonwealth of Pennsylvania, UT GO Bonds (Series 2007A), 5.00%, 8/1/2023 | 6,914,630 |
| 1,000,000 | | Cumberland County, PA Municipal Authority, Retirement Community Revenue Bonds (Series 2002A), 7.125% (Wesley Affiliated Services, Inc. Obligated Group)/(United States Treasury PRF 1/1/2013@101)/(Original Issue Yield: 7.40%), 1/1/2025 | 1,098,780 |
| 5,000,000 | | Delaware Valley, PA Regional Finance Authority, Local Government Revenue Bonds (Series 1997B), 5.60% (AMBAC INS), 7/1/2017 | 5,733,950 |
| 1,000,000 | | Delaware Valley, PA Regional Finance Authority, Revenue Bonds, 5.75%, 7/1/2017 | 1,137,800 |
| 1,500,000 | | Ephrata, PA Area School District, UT GO Bonds, 4.25% (FGIC and National Public Finance Guarantee Corporation INS), 4/15/2017 | 1,651,680 |
| 1,500,000 | | Erie County, PA Hospital Authority, Revenue Bonds (Series 2006), 5.00% (UPMC Health System)/(CIFG Assurance NA INS), 11/1/2035 | 1,495,725 |
| 1,000,000 | | Erie County, PA Hospital Authority, Revenue Bonds (Series 2007), 5.00% (UPMC Health System)/(CIFG Assurance NA INS), 11/1/2037 | 994,150 |
| 1,000,000 | | Erie, PA Higher Education Building Authority, Revenue Bonds (Series 2007 GG3), 5.00% (Gannon University)/(Radian Asset Assurance, Inc. INS), 5/1/2032 | 902,080 |
Annual Shareholder ReportPrincipal
Amount | | | Value |
| $2,000,000 | | Geisinger Authority, PA Health System, Health System Revenue Bonds (Series 2009A), 5.25% (Geisinger Health System), 6/1/2039 | 2,061,440 |
| 2,000,000 | | Harrisburg, PA Authority, Water Revenue Refunding Bonds (Series 2008), 5.25% (Original Issue Yield: 5.35%), 7/15/2031 | 1,717,140 |
| 2,000,000 | | Indiana County, PA IDA, Refunding Revenue Bonds, 5.00% (Indiana University of PA)/(AMBAC INS), 11/1/2029 | 1,746,320 |
| 1,615,000 | | Johnstown, PA Redevelopment Authority, Revenue Bonds (Series A), 4.50% (Assured Guaranty Municipal Corp. INS), 8/15/2019 | 1,711,141 |
| 1,000,000 | | Lancaster County, PA Hospital Authority, Health Center Revenue Bonds (Series 2001), 5.875% (Willow Valley Retirement Communities)/(Original Issue Yield: 5.95%), 6/1/2031 | 1,000,950 |
| 1,000,000 | | Lancaster County, PA Hospital Authority, Revenue Bonds, 5.50% (Lancaster General Hospital)/(United States Treasury PRF 9/15/2013@100)/(Original Issue Yield: 5.63%), 3/15/2026 | 1,096,940 |
| 1,000,000 | | Lancaster, PA Higher Education Authority, College Revenue Bonds, 5.00% (Franklin & Marshall College), 4/15/2019 | 1,109,800 |
| 1,000,000 | | Lawrence County, PA IDA, Senior Health and Housing Facilities Revenue Bonds, 7.50% (Shenango Presbyterian Senior Care Obligated Group)/(United States Treasury PRF 11/15/2011@102)/(Original Issue Yield: 7.75%), 11/15/2031 | 1,034,280 |
| 1,000,000 | | Lebanon County, PA Health Facilities Authority, Hospital Revenue Bonds, 5.80% (Good Samaritan Hospital)/(Original Issue Yield: 5.92%), 11/15/2022 | 925,290 |
| 2,000,000 | | Lehigh County, PA General Purpose Authority, Hospital Revenue Bonds, 5.25% (St. Lukes Hospital of Bethlehem)/(United States Treasury PRF 8/15/2013@100)/(Original Issue Yield: 5.42%), 8/15/2023 | 2,188,760 |
| 2,250,000 | | Lehigh County, PA General Purpose Authority, Revenue Bonds (Series 2005B), 5.00% (Lehigh Valley Health Network)/(Assured Guaranty Municipal Corp. INS), 7/1/2035 | 2,273,085 |
| 550,000 | | Luzerne County, PA IDA, Lease Revenue Bonds, 3.40% (Luzerne County, PA)/(Assured Guaranty Municipal Corp. INS)/(Original Issue Yield: 3.55%), 12/15/2013 | 579,216 |
| 500,000 | | Luzerne County, PA IDA, Lease Revenue Bonds, 3.55% (Luzerne County, PA)/(Assured Guaranty Municipal Corp. INS)/(Original Issue Yield: 3.70%), 12/15/2014 | 538,515 |
| 2,250,000 | | Lycoming County PA Authority, College Revenue Bonds (Series 2008), 5.50% (Pennsylvania College of Technology)/(Assured Guaranty Corp. INS), 10/1/2032 | 2,374,267 |
| 2,200,000 | | Lycoming County PA Authority, Revenue Bonds (Series A), 5.75% (Susquehanna Health System)/(Original Issue Yield: 5.90%), 7/1/2039 | 2,108,612 |
| 1,000,000 | | Monroe County, PA Hospital Authority, Hospital Revenue Bonds (Series 2002A), 5.50% (Pocono Medical Center)/(Radian Asset Assurance, Inc. INS)/(Original Issue Yield: 5.60%), 1/1/2022 | 1,004,680 |
Annual Shareholder ReportPrincipal
Amount | | | Value |
| $1,000,000 | | Monroe County, PA Hospital Authority, Revenue Bonds, 6.00% (Pocono Medical Center)/(United States Treasury PRF 1/1/2014@100)/(Original Issue Yield: 6.17%), 1/1/2043 | 1,128,670 |
| 2,000,000 | | Montgomery County, PA Higher Education & Health Authority Hospital, Revenue Bonds (Series 2006FF1), 5.00% (Dickinson College)/(CIFG Assurance NA INS), 5/1/2031 | 2,042,400 |
| 1,000,000 | | Mount Lebanon, PA Hospital Authority, Revenue Bonds (Series 2002A), 5.625% (St. Clair Memorial Hospital)/(Original Issue Yield: 5.75%), 7/1/2032 | 1,002,860 |
| 1,000,000 | | New Wilmington, PA Municipal Authority, Revenue Bonds (Series 2007GG4), 5.125% (Westminster College)/(Radian Asset Assurance, Inc. INS), 5/1/2033 | 908,100 |
| 1,500,000 | | Northampton County, PA General Purpose Authority, Hospital Revenue Bonds (Series 2008A), 5.50% (St. Lukes Hospital of Bethlehem)/(Original Issue Yield: 5.60%), 8/15/2035 | 1,429,050 |
| 1,000,000 | | Northumberland County PA IDA, Facilities Revenue Bonds (Series 2002B), 5.50% (NHS Youth Service, Inc.)/(ACA Financial Guaranty Company INS)/(Original Issue Yield: 5.80%), 2/15/2033 | 564,280 |
| 710,000 | | Pennsylvania Convention Center Authority, Revenue Bonds, 6.70% (Escrowed In Treasuries COL)/(Original Issue Yield: 6.843%), 9/1/2016 | 808,718 |
| 2,000,000 | | Pennsylvania EDFA, Exempt Facilities Revenue Bonds (Series 2009), 7.00% (Allegheny Energy Supply Company LLC), 7/15/2039 | 2,139,220 |
| 3,000,000 | | Pennsylvania EDFA, PCR Refunding Bonds (Series 2008), 4.00% (PPL Electric Utilities Corp.), 10/1/2023 | 2,953,290 |
| 2,000,000 | | Pennsylvania EDFA, Revenue Bonds (Series 1998A), 5.25% (Northwestern Human Services, Inc.)/(Original Issue Yield: 5.668%), 6/1/2028 | 1,559,420 |
| 1,000,000 | | Pennsylvania EDFA, Revenue Bonds (Series 2000), 5.90% (Dr. Gertrude A. Barber Center, Inc.)/(Radian Asset Assurance, Inc. INS), 12/1/2030 | 999,960 |
| 2,000,000 | | Pennsylvania EDFA, Revenue Bonds (Series 2010B), 5.00% (Aqua Pennsylvania, Inc. ), 12/1/2043 | 2,074,840 |
| 1,000,000 | | Pennsylvania EDFA, Solid Waste Disposal Revenue Bonds (Series 2004A), 4.70% TOBs (Waste Management, Inc.), Mandatory Tender 11/1/2014 | 1,086,920 |
| 1,000,000 | | Pennsylvania EDFA, Solid Waste Disposal Revenue Bonds, Project A, 5.10% (Waste Management, Inc.), 10/1/2027 | 995,610 |
| 2,000,000 | | Pennsylvania EDFA, Water Facilities Revenue Bonds (Series 2009B), 5.00% (Aqua Pennsylvania, Inc.), 11/15/2040 | 2,073,400 |
| 2,000,000 | | Pennsylvania EDFA, Water Facility Revenue Bonds (Series 2009), 6.20% (Pennsylvania American Water Co.), 4/1/2039 | 2,172,160 |
| 2,900,000 | | Pennsylvania HFA, SFM Revenue Bonds (Series 2006-95A), 4.90%, 10/1/2037 | 2,882,977 |
| 1,500,000 | | Pennsylvania Intergovernmental Coop Authority, Special Tax Revenue Refunding Bonds (Series 2009), 5.00%, 6/15/2022 | 1,716,345 |
Annual Shareholder ReportPrincipal
Amount | | | Value |
| $1,000,000 | | Pennsylvania Intergovernmental Coop Authority, Special Tax Revenue Refunding Bonds (Series 2010), 5.00%, 6/15/2018 | 1,197,740 |
| 1,020,000 | | Pennsylvania State Higher Education Facilities Authority, 5.125% (Gwynedd-Mercy College)/(Radian Asset Assurance, Inc. INS), 5/1/2032 | 977,894 |
| 1,000,000 | | Pennsylvania State Higher Education Facilities Authority, College Revenue Bonds (Series 2007), 5.00% (Bryn Mawr College)/(AMBAC INS), 12/1/2037 | 1,032,690 |
| 1,330,000 | | Pennsylvania State Higher Education Facilities Authority, Revenue Bonds (Series 2003A), 5.25% (Clarion University Foundation, Inc.)/(Syncora Guarantee, Inc. INS), 7/1/2018 | 1,339,137 |
| 1,490,000 | | Pennsylvania State Higher Education Facilities Authority, Revenue Bonds (Series 2003AA1), 5.25% (Dickinson College)/(Radian Asset Assurance, Inc. INS), 11/1/2018 | 1,557,616 |
| 1,000,000 | | Pennsylvania State Higher Education Facilities Authority, Revenue Bonds (Series 2006-FF2), 5.00% (Elizabethtown College)/(Radian Asset Assurance, Inc. INS), 12/15/2027 | 1,000,770 |
| 2,000,000 | | Pennsylvania State Higher Education Facilities Authority, Revenue Bonds (Series 2008), 5.00% (University of the Sciences in Philadelphia)/(Assured Guaranty Corp. INS), 11/1/2032 | 2,095,500 |
| 1,500,000 | | Pennsylvania State Higher Education Facilities Authority, Revenue Bonds (Series 2009), 5.00% (Carnegie Mellon University), 8/1/2021 | 1,728,915 |
| 1,000,000 | | Pennsylvania State Higher Education Facilities Authority, Revenue Bonds (Series 2009A), 5.25% (University of Pennsylvania Health System), 8/15/2022 | 1,128,290 |
| 2,000,000 | | Pennsylvania State Higher Education Facilities Authority, Revenue Bonds (Series 200B), 5.50% (University of Pennsylvania Health System)/(Original Issue Yield: 5.65%), 8/15/2018 | 2,377,760 |
| 1,100,000 | | Pennsylvania State Higher Education Facilities Authority, Revenue Bonds (Series 2010), 5.00% (Thomas Jefferson University), 3/1/2040 | 1,128,336 |
| 1,875,000 | | Pennsylvania State Higher Education Facilities Authority, Revenue Bonds (Series 2010E), 5.00% (UPMC Health System)/(Original Issue Yield: 5.10%), 5/15/2031 | 1,909,313 |
| 1,000,000 | | Pennsylvania State Higher Education Facilities Authority, Revenue Bonds (Series B), 4.00% (Thomas Jefferson University)/(AMBAC INS), 9/1/2011 | 1,000,000 |
| 1,200,000 | | Pennsylvania State Higher Education Facilities Authority, Revenue Bonds (Series B), 4.00% (Thomas Jefferson University)/(AMBAC INS), 9/1/2013 | 1,262,052 |
| 1,250,000 | | Pennsylvania State Higher Education Facilities Authority, Revenue Bonds (Series EE-1), 5.00% (York College of Pennsylvania)/(Syncora Guarantee, Inc. INS), 11/1/2033 | 1,263,487 |
| 3,150,000 | | Pennsylvania State Higher Education Facilities Authority, Revenue Bonds, 4.65% (Philadelphia College of Osteopathic Medicine)/(Original Issue Yield: 4.77%), 12/1/2028 | 3,156,867 |
Annual Shareholder ReportPrincipal
Amount | | | Value |
| $1,100,000 | | Pennsylvania State Higher Education Facilities Authority, Revenue Bonds, 5.00% (Messiah College)/(AMBAC INS), 11/1/2012 | 1,141,943 |
| 750,000 | | Pennsylvania State Higher Education Facilities Authority, Revenue Bonds, 5.00% (Widener University), 7/15/2039 | 735,578 |
| 1,000,000 | | Pennsylvania State Higher Education Facilities Authority, Revenue Bonds, 5.25% (Widener University)/(Original Issue Yield: 5.42%), 7/15/2024 | 1,018,850 |
| 1,500,000 | | Pennsylvania State Higher Education Facilities Authority, Student Housing Revenue Bonds (Series 2003A), 5.00% (California University of Pennsylvania)/(ACA Financial Guaranty Company INS)/(Original Issue Yield: 5.08%), 7/1/2023 | 1,282,770 |
| 2,000,000 | | Pennsylvania State Higher Education Facilities Authority, Student Housing Revenue Bonds, 5.125% (Foundation for Indiana University of Pennsylvania)/(Syncora Guarantee, Inc. INS), 7/1/2039 | 1,826,040 |
| 1,500,000 | | Pennsylvania State IDA, EDRBs (Series 2002), 5.50% (AMBAC INS), 7/1/2020 | 1,554,765 |
| 1,000,000 | | Pennsylvania State Public School Building Authority, Revenue Bonds, 4.05% (Community College of Philadelphia)/(Original Issue Yield: 4.15%), 6/15/2012 | 1,022,710 |
| 2,440,000 | | Pennsylvania State Turnpike Commission, Motor License Fund-Enhanced Turnpike Subordinate Special Revenue Bonds (Series 2011A), 5.50% (Original Issue Yield: 5.55%), 12/1/2041 | 2,634,273 |
| 2,000,000 | | Pennsylvania State Turnpike Commission, Motor License Fund-Enhanced Turnpike Subordinate Special Revenue Bonds (Series 2011A), 6.00%, 12/1/2036 | 2,280,020 |
| 5,740,000 | | Pennsylvania State Turnpike Commission, Turnpike Revenue Bonds (Series 2006A), 5.00% (AMBAC INS), 12/1/2026 | 6,059,431 |
| 1,500,000 | | Pennsylvania State University, Revenue Bonds, 5.00%, 9/1/2029 | 1,622,790 |
| 3,000,000 | | Pennsylvania State University, Revenue Bonds, 5.00%, 9/1/2035 | 3,102,360 |
| 1,600,000 | | Philadelphia Authority for Industrial Development, Senior Living Revenue Bonds (Series 2005A), 5.625% (PresbyHomes Germantown/Morrisville), 7/1/2035 | 1,389,664 |
| 2,000,000 | | Philadelphia, PA Airport System, Airport Revenue Refunding Bonds (Series 2010D), 5.25%, 6/15/2028 | 2,030,780 |
| 2,350,000 | | Philadelphia, PA Gas Works, Revenue Bonds (Seventh Series 1998 General Ordinance), 5.00% (AMBAC INS), 10/1/2037 | 2,306,243 |
| 1,250,000 | | Philadelphia, PA Redevelopment Authority, Revenue Bonds (Series 2003A), 5.50% (Beech Student Housing Complex)/(ACA Financial Guaranty Company INS), 7/1/2019 | 1,191,025 |
| 1,000,000 | | Philadelphia, PA Redevelopment Authority, Revenue Bonds (Series 2003A), 5.625% (Beech Student Housing Complex)/(ACA Financial Guaranty Company INS), 7/1/2023 | 906,180 |
| 1,000,000 | | Philadelphia, PA School District, UT GO Bonds (Series 2002B), 5.625% (United States Treasury PRF 8/1/2012@100), 8/1/2022 | 1,049,250 |
Annual Shareholder ReportPrincipal
Amount | | | Value |
| $3,000,000 | | Philadelphia, PA School District, UT GO Bonds (Series 2008E), 6.00% (Original Issue Yield: 6.30%), 9/1/2038 | 3,216,150 |
| 2,610,000 | | Philadelphia, PA Water & Wastewater System, Revenue Bonds (Series 2001A), 5.00% (United States Treasury PRF 11/1/2012@100)/(Original Issue Yield: 5.10%), 11/1/2031 | 2,754,229 |
| 500,000 | | Philadelphia, PA Water & Wastewater System, Revenue Refunding Bonds, 6.25% (National Public Finance Guarantee Corporation INS), 8/1/2012 | 526,480 |
| 750,000 | | Philadelphia, PA Water & Wastewater System, Water and Wastewater Revenue Bonds (Series 2009A), 5.25% (Original Issue Yield: 5.33%), 1/1/2036 | 773,880 |
| 3,000,000 | | Philadelphia, PA, UT GO Bonds (Series 2008B), 7.125% (Assured Guaranty Corp. INS)/(Original Issue Yield: 7.25%), 7/15/2038 | 3,361,080 |
| 3,000,000 | | Philadelphia, PA, UT GO Refunding Bonds (Series 2009A), 5.125% (Assured Guaranty Corp. INS)/(Original Issue Yield: 5.20%), 8/1/2025 | 3,160,350 |
| 1,075,000 | | Pittsburgh, PA Urban Redevelopment Authority, Mortgage Revenue Bonds (Series 1997C), 5.90% (GNMA COL), 10/1/2022 | 1,076,322 |
| 1,000,000 | | Pittsburgh, PA Urban Redevelopment Authority, Revenue Bonds (Series 2006C), 4.80% (GNMA COL), 4/1/2028 | 1,012,750 |
| 1,035,000 | | Pittsburgh, PA Urban Redevelopment Authority, Tax Allocation, 4.50% (Center Triangle), 5/1/2019 | 1,106,726 |
| 1,885,000 | | Pittsburgh, PA Water & Sewer Authority, Water & Sewer System Revenue Bonds, 5.00% (United States Treasury PRF 9/1/2015@100), 9/1/2024 | 2,199,776 |
| 3,000,000 | | Pittsburgh, PA Water & Sewer Authority, Water and Sewer System Revenue Bonds (Series 2008 D-1), 5.00% (Assured Guaranty Municipal Corp. INS), 9/1/2025 | 3,215,070 |
| 3,000,000 | | Pittsburgh, PA, UT GO Bonds (Series 2002A), 5.50% (AMBAC INS), 9/1/2015 | 3,052,470 |
| 2,165,000 | | Radnor Township, PA, UT GO Bonds (Series 2004AA), 5.125%, 7/15/2027 | 2,273,683 |
| 1,000,000 | | Saxonburg, PA Area Authority, Sewer & Water Revenue Bonds, 5.00% (Assured Guaranty Corp. INS), 3/1/2030 | 1,038,310 |
| 1,110,000 | | Sayre, PA, Health Care Facilities Authority, Revenue Bonds (Series 2002A), 5.75% (Guthrie Healthcare System, PA)/(United States Treasury PRF 12/1/2011@101)/(Original Issue Yield: 5.90%), 12/1/2021 | 1,136,340 |
| 775,000 | | Sayre, PA, Health Care Facilities Authority, Revenue Bonds (Series 2002A), 5.875% (Guthrie Healthcare System, PA)/(United States Treasury PRF 12/1/2011@101)/(Original Issue Yield: 6.00%), 12/1/2031 | 793,631 |
| 7,440,000 | | Scranton, PA Sewer Authority, Sewer Revenue Bonds, 5.00% (Assured Guaranty Municipal Corp. INS), 12/1/2036 | 7,496,023 |
Annual Shareholder ReportPrincipal
Amount | | | Value |
| $3,000,000 | | Scranton-Lackawanna, PA Health & Welfare Authority, Revenue Bonds, 5.00% (University of Scranton)/(Syncora Guarantee, Inc. INS), 11/1/2037 | 3,036,300 |
| 165,000 | | Snyder County PA Higher Education Authority University Revenue, Revenue Bonds, 2.95% (Susquehanna University)/(Original Issue Yield: 2.98%), 1/1/2012 | 166,422 |
| 1,000,000 | | South Fork Municipal Authority, PA, Hospital Revenue Bonds (Series 2010), 5.50% (Conemaugh Valley Memorial Hospital)/(Original Issue Yield: 5.72%), 7/1/2029 | 995,420 |
| 1,295,000 | | Southcentral PA, General Authority, Hospital Revenue Bonds, 5.00% (Hanover Hospital, Inc.)/(Radian Asset Assurance, Inc. INS), 12/1/2029 | 1,138,059 |
| 1,000,000 | | Southeastern, PA Transportation Authority, Capital Grant Receipts Bonds (Series 2011), 5.00%, 6/1/2028 | 1,056,840 |
| 1,000,000 | | Southeastern, PA Transportation Authority, Revenue Refunding Bonds (Series 2010), 5.00%, 3/1/2018 | 1,170,770 |
| 500,000 | | St. Mary Hospital Authority, PA, Health System Revenue Bonds (Series 2004A), 5.00% (Catholic Health East)/(Original Issue Yield: 5.15%), 11/15/2021 | 520,295 |
| 1,000,000 | | St. Mary Hospital Authority, PA, Health System Revenue Bonds (Series 2004B), 5.375% (Catholic Health East)/(United States Treasury PRF 11/15/2014@100)/(Original Issue Yield: 5.42%), 11/15/2034 | 1,142,610 |
| 1,000,000 | | St. Mary Hospital Authority, PA, Health System Revenue Bonds (Series 2004B), 5.50% (Catholic Health East)/(United States Treasury PRF 11/15/2014@100), 11/15/2024 | 1,146,550 |
| 2,000,000 | | State Public School Building Authority, PA, School Revenue Bonds, 5.00% (Haverford Twp, PA School District)/(Syncora Guarantee, Inc. INS), 3/15/2027 | 2,073,820 |
| 2,000,000 | | State Public School Building Authority, PA, School Revenue Bonds, 5.00% (Haverford Twp, PA School District)/(Syncora Guarantee, Inc. INS), 3/15/2029 | 2,057,140 |
| 900,000 | 1 | Susquehanna, PA Area Regional Airport Authority, Airport Facilities Revenue Bonds (Series 1999), 5.50% (Aero Harrisburg)/(Original Issue Yield: 5.85%), 1/1/2024 | 688,320 |
| 1,245,000 | | Union County, PA Higher Educational Facilities Financing Authority, Revenue Bonds (Series 2002A), 5.25% (Bucknell University), 4/1/2021 | 1,326,373 |
| 1,250,000 | | Union County, PA Hospital Authority, Revenue Bonds, 5.25% (Evangelical Community Hospital)/(Radian Asset Assurance, Inc. INS), 8/1/2024 | 1,225,500 |
| 400,000 | | Washington County, PA Authority, Lease Revenue Bonds, 7.875% (Escrowed In Treasuries COL), 12/15/2018 | 575,292 |
| 1,885,000 | | West Shore, PA Area Hospital Authority, Revenue Bonds , 6.15% (Holy Spirit Hospital)/(United States Treasury PRF 1/1/2012@100), 1/1/2020 | 1,921,965 |
| 1,000,000 | | West Shore, PA Area Hospital Authority, Revenue Bonds, 6.25% (Holy Spirit Hospital)/(Original Issue Yield: 6.30%), 1/1/2032 | 1,000,740 |
Annual Shareholder ReportPrincipal
Amount | | | Value |
| $520,000 | | West View, PA Municipal Authority, Special Obligation Bonds, 9.50% (Escrowed In Treasuries COL), 11/15/2014 | 616,871 |
| 2,660,000 | | Westmoreland County, PA Municipal Authority, Municipal Service Refunding Revenue Bonds (Series 2006A), 5.00% (Assured Guaranty Municipal Corp. INS), 8/15/2028 | 2,789,436 |
| | TOTAL MUNICIPAL BONDS
(IDENTIFIED COST $238,094,551) | 243,870,200 |
| | SHORT-TERM MUNICIPALS – 2.9%3 | |
| | Pennsylvania – 2.9% | |
| 1,650,000 | | Luzerne County, PA, (Series A of 2006) Weekly VRDNs (Assured Guaranty Municipal Corp. INS)/(JPMorgan Chase Bank, N.A. LIQ), 0.200%, 9/1/2011 | 1,650,000 |
| 2,500,000 | | Philadelphia, PA IDA, (Series 2007A) Daily VRDNs (Fox Chase Cancer Center)/(Citizens Bank of Pennsylvania LOC), 0.230%, 9/1/2011 | 2,500,000 |
| 3,000,000 | | Philadelphia, PA Hospitals & Higher Education Facilities Authority, (Series 2008A) Daily VRDNs (Children's Hospital of Philadelphia)/(Wells Fargo Bank, N.A. LIQ), 0.130%, 9/1/2011 | 3,000,000 |
| | TOTAL SHORT-TERM MUNICIPALS
(AT AMORTIZED COST) | 7,150,000 |
| | TOTAL MUNICIPAL INVESTMENTS — 102.1%
(IDENTIFIED COST $245,244,551)4 | 251,020,200 |
| | OTHER ASSETS AND LIABILITIES - NET — (2.1)%5 | (5,081,642) |
| | TOTAL NET ASSETS — 100% | $245,938,558 |
Securities that are subject to the federal alternative minimum tax (AMT) represent 5.0% of the Fund's portfolio as calculated based upon total market value (percentage is unaudited).
| 1 | Denotes a restricted security that either: (a) cannot be offered for public sale without first being registered, or being able to take advantage of an exemption from registration, under the Securities Act of 1933; or (b) is subject to a contractual restriction on public sales. At August 31, 2011, these restricted securities amounted to $1,547,400, which represented 0.6% of total net assets. |
| 2 | Denotes a restricted security that may be resold without restriction to “qualified institutional buyers” as defined in Rule 144A under the Securities Act of 1933 and that the Fund has determined to be liquid under criteria established by the Fund's Board of Trustees (the “Trustees”). At August 31, 2011, these liquid restricted securities amounted to $859,080, which represented 0.3% of total net assets. |
| 3 | Current rate and next reset date shown for Variable Rate Demand Notes. |
| 4 | The cost of investments for federal tax purposes amounts to $245,234,510. |
| 5 | Assets, other than investments in securities, less liabilities. See Statement of Assets and Liabilities. |
Note: The categories of investments are shown as a percentage of total net assets at August 31, 2011.
Various inputs are used in determining the value of the Fund's investments. These inputs are summarized in the three broad levels listed below:
Level 1 — quoted prices in active markets for identical securities, including investment companies with daily net asset values, if applicable.
Level 2 — other significant observable inputs (including quoted prices for similar securities, Annual Shareholder Report
interest rates, prepayment speeds, credit risk, etc.). Also includes securities valued at amortized cost.Level 3 — significant unobservable inputs (including the Fund's own assumptions in determining the fair value of investments).
The inputs or methodology used for valuing securities are not an indication of the risk associated with investing in those securities.
As of August 31, 2011, all investments of the Fund utilized Level 2 inputs in valuing the Fund's assets carried at fair value.
The following acronyms are used throughout this portfolio:
| AMBAC | — American Municipal Bond Assurance Corporation |
| COL | — Collateralized |
| EDFA | — Economic Development Finance Authority |
| EDRBs | — Economic Development Revenue Bonds |
| FGIC | — Financial Guaranty Insurance Company |
| GNMA | — Government National Mortgage Association |
| GO | — General Obligation |
| HDA | — Hospital Development Authority |
| HEFA | — Health and Education Facilities Authority |
| HFA | — Housing Finance Authority |
| IDA | — Industrial Development Authority |
| INS | — Insured |
| LIQ | — Liquidity Agreement |
| LOC | — Letter of Credit |
| PCR | — Pollution Control Revenue |
| PRF | — Prerefunded |
| SFM | — Single Family Mortgage |
| TOBs | — Tender Option Bonds |
| UT | — Unlimited Tax |
| VRDNs | — Variable Rate Demand Notes |
See Notes which are an integral part of the Financial Statements
Annual Shareholder Report Financial Highlights – Class A Shares
(For a Share Outstanding Throughout Each Period)
| Year Ended August 31 | 2011 | 2010 | 2009 | 2008 | 2007 |
| Net Asset Value, Beginning of Period | $10.92 | $10.37 | $10.70 | $11.22 | $11.63 |
| Income From Investment Operations: | | | | | |
| Net investment income | 0.44 | 0.43 | 0.47 | 0.47 | 0.50 |
| Net realized gain (loss) on investments, futures contracts and swap contracts | (0.25) | 0.55 | (0.34) | (0.52) | (0.41) |
| TOTAL FROM INVESTMENT OPERATIONS | 0.19 | 0.98 | 0.13 | (0.05) | 0.09 |
| Less Distributions: | | | | | |
| Distributions from net investment income | (0.43) | (0.43) | (0.46) | (0.47) | (0.50) |
| Net Asset Value, End of Period | $10.68 | $10.92 | $10.37 | $10.70 | $11.22 |
| Total Return1 | 1.92% | 9.60% | 1.46% | (0.44)% | 0.70% |
| Ratios to Average Net Assets: | | | | | |
| Net expenses | 0.75% | 0.75% | 0.75% | 0.75%2 | 0.82%3 |
| Net investment income | 4.04% | 4.04% | 4.65% | 4.30% | 4.34% |
| Expense waiver/reimbursement4 | 0.11% | 0.09% | 0.10% | 0.09% | 0.09% |
| Supplemental Data: | | | | | |
| Net assets, end of period (000 omitted) | $238,538 | $270,219 | $276,442 | $281,863 | $282,386 |
| Portfolio turnover | 8% | 12% | 13% | 19% | 23% |
| 1 | Based on net asset value, which does not reflect the sales charge, redemption fee or contingent deferred sales charge, if applicable. |
| 2 | The net expense ratio is calculated without reduction for expense offset arrangements. The net expense ratio is 0.75% for the year ended August 31, 2008, after taking into account this expense reduction. |
| 3 | Includes interest and trust expenses related to the Fund's participation in certain inverse floater structures of 0.07% for the year ended August 31, 2007. |
| 4 | This expense decrease is reflected in both the net expense and net investment income ratios shown above. |
See Notes which are an integral part of the Financial Statements
Annual Shareholder Report Financial Highlights – Class B Shares
(For a Share Outstanding Throughout Each Period)
| Year Ended August 31 | 2011 | 2010 | 2009 | 2008 | 2007 |
| Net Asset Value, Beginning of Period | $10.92 | $10.37 | $10.69 | $11.22 | $11.63 |
| Income From Investment Operations: | | | | | |
| Net investment income | 0.331 | 0.35 | 0.39 | 0.39 | 0.41 |
| Net realized gain (loss) on investments, futures contracts and swap contracts | (0.22) | 0.54 | (0.33) | (0.53) | (0.41) |
| TOTAL FROM INVESTMENT OPERATIONS | 0.11 | 0.89 | 0.06 | (0.14) | — |
| Less Distributions: | | | | | |
| Distributions from net investment income | (0.35) | (0.34) | (0.38) | (0.39) | (0.41) |
| Net Asset Value, End of Period | $10.68 | $10.92 | $10.37 | $10.69 | $11.22 |
| Total Return2 | 1.13% | 8.76% | 0.77% | (1.30)% | (0.08)% |
| Ratios to Average Net Assets: | | | | | |
| Net expenses | 1.52% | 1.52% | 1.52% | 1.52%3 | 1.59%4 |
| Net investment income | 3.26% | 3.27% | 3.90% | 3.53% | 3.56% |
| Expense waiver/reimbursement5 | 0.09% | 0.07% | 0.08% | 0.08% | 0.08% |
| Supplemental Data: | | | | | |
| Net assets, end of period (000 omitted) | $7,401 | $16,071 | $20,671 | $27,298 | $34,860 |
| Portfolio turnover | 8% | 12% | 13% | 19% | 23% |
| 1 | Per share number has been calculated using the average shares method. |
| 2 | Based on net asset value, which does not reflect the sales charge, redemption fee or contingent deferred sales charge, if applicable. |
| 3 | The net expense ratio is calculated without reduction for expense offset arrangements. The net expense ratio is 1.52% for the year ended August 31, 2008, after taking into account this expense reduction. |
| 4 | Includes interest and trust expenses related to the Fund's participation in certain inverse floater structures of 0.07% for the year ended August 31, 2007. |
| 5 | This expense decrease is reflected in both the net expense and net investment income ratios shown above. |
See Notes which are an integral part of the Financial Statements
Annual Shareholder Report Statement of Assets and Liabilities
August 31, 2011
| Assets: | | |
| Total investments in securities, at value (identified cost $245,244,551) | | $251,020,200 |
| Cash | | 38,095 |
| Income receivable | | 3,409,256 |
| Receivable for shares sold | | 129,222 |
| Receivable for investments sold | | 120,541 |
| TOTAL ASSETS | | 254,717,314 |
| Liabilities: | | |
| Payable for shares redeemed | $5,683,034 | |
| Payable for investments purchased | 2,632,345 | |
| Income distribution payable | 328,309 | |
| Payable for shareholder services fee (Note 5) | 52,994 | |
| Payable for distribution services fee (Note 5) | 4,793 | |
| Payable for Directors'/Trustees' fees | 401 | |
| Accrued expenses | 76,880 | |
| TOTAL LIABILITIES | | 8,778,756 |
| Net assets for 23,035,695 shares outstanding | | $245,938,558 |
| Net Assets Consist of: | | |
| Paid-in capital | | $261,726,803 |
| Net unrealized appreciation of investments | | 5,775,649 |
| Accumulated net realized loss on investments | | (21,588,195) |
| Undistributed net investment income | | 24,301 |
| TOTAL NET ASSETS | | $245,938,558 |
| Net Asset Value, Offering Price and Redemption Proceeds Per Share | | |
| Class A Shares: | | |
| Net asset value per share ($238,537,744 ÷ 22,342,687 shares outstanding), no par value, unlimited shares authorized | | $10.68 |
| Offering price per share (100/95.50 of $10.68) | | $11.18 |
| Redemption proceeds per share | | $10.68 |
| Class B Shares: | | |
| Net asset value per share ($7,400,814 ÷ 693,008 shares outstanding), no par value, unlimited shares authorized | | $10.68 |
| Offering price per share | | $10.68 |
| Redemption proceeds per share (94.50/100 of $10.68) | | $10.09 |
See Notes which are an integral part of the Financial Statements
Annual Shareholder Report Statement of Operations
Year Ended August 31, 2011
| Investment Income: | | | |
| Interest | | | $12,371,343 |
| Expenses: | | | |
| Investment adviser fee (Note 5) | | $1,031,782 | |
| Administrative fee (Note 5) | | 201,548 | |
| Custodian fees | | 15,357 | |
| Transfer and dividend disbursing agent fees and expenses | | 123,789 | |
| Directors'/Trustees' fees | | 5,238 | |
| Auditing fees | | 21,048 | |
| Legal fees | | 7,758 | |
| Portfolio accounting fees | | 100,000 | |
| Distribution services fee (Note 5) | | 84,565 | |
| Shareholder services fee (Note 5) | | 634,359 | |
| Account administration fee (Note 2) | | 10,505 | |
| Share registration costs | | 35,642 | |
| Printing and postage | | 34,175 | |
| Insurance premiums | | 4,726 | |
| Miscellaneous | | 3,957 | |
| TOTAL EXPENSES | | 2,314,449 | |
| Waivers and Reimbursement (Note 5): | | | |
| Waiver of investment adviser fee | $(225,814) | | |
| Waiver of administrative fee | (5,251) | | |
| Reimbursement of shareholder services fee | (49,334) | | |
| TOTAL WAIVERS AND REIMBURSEMENT | | (280,399) | |
| Net expenses | | | 2,034,050 |
| Net investment income | | | 10,337,293 |
| Realized and Unrealized Loss on Investments: | | | |
| Net realized loss on investments | | | (1,583,780) |
| Net change in unrealized appreciation of investments | | | (5,525,388) |
| Net realized and unrealized loss on investments | | | (7,109,168) |
| Change in net assets resulting from operations | | | $3,228,125 |
See Notes which are an integral part of the Financial Statements
Annual Shareholder Report Statement of Changes in Net Assets
| Year Ended August 31 | 2011 | 2010 |
| Increase (Decrease) in Net Assets | | |
| Operations: | | |
| Net investment income | $10,337,293 | $11,802,916 |
| Net realized loss on investments | (1,583,780) | (1,239,493) |
| Net change in unrealized appreciation/depreciation of investments | (5,525,388) | 16,408,420 |
| CHANGE IN NET ASSETS RESULTING FROM OPERATIONS | 3,228,125 | 26,971,843 |
| Distributions to Shareholders: | | |
| Distributions from net investment income | | |
| Class A Shares | (10,127,762) | (11,078,848) |
| Class B Shares | (372,487) | (588,118) |
| CHANGE IN NET ASSETS RESULTING FROM DISTRIBUTIONS TO SHAREHOLDERS | (10,500,249) | (11,666,966) |
| Share Transactions: | | |
| Proceeds from sale of shares | 34,671,658 | 50,491,968 |
| Net asset value of shares issued to shareholders in payment of distributions declared | 6,428,811 | 6,756,227 |
| Cost of shares redeemed | (74,179,726) | (83,375,997) |
| CHANGE IN NET ASSETS RESULTING FROM SHARE TRANSACTIONS | (33,079,257) | (26,127,802) |
| Change in net assets | (40,351,381) | (10,822,925) |
| Net Assets: | | |
| Beginning of period | 286,289,939 | 297,112,864 |
| End of period (including undistributed net investment income of $24,301 and $195,270, respectively) | $245,938,558 | $286,289,939 |
See Notes which are an integral part of the Financial Statements
Annual Shareholder Report Notes to Financial Statements
August 31, 2011
1. Organization
Federated Municipal Securities Income Trust (the “Trust”) is registered under the Investment Company Act of 1940, as amended (the “Act”), as an open-end management investment company. The Trust consists of five portfolios. The financial statements included herein are only those of Federated Pennsylvania Municipal Income Fund (the “Fund”), a non-diversified portfolio. The financial statements of the other portfolios are presented separately. The assets of each portfolio are segregated and a shareholder's interest is limited to the portfolio in which shares are held. Each portfolio pays its own expenses. The Fund offers two classes of shares: Class A Shares and Class B Shares. All shares of the Fund have equal rights with respect to voting, except on class-specific matters. The investment objective of the Fund is to provide current income exempt from federal regular income tax (federal regular income tax does not include the federal alternative minimum tax (AMT)) and the personal income taxes imposed by the Commonwealth of Pennsylvania and Pennsylvania municipalities. Interest income from the Fund's investments may be subject to the federal AMT for individuals and corporations.
2. Significant Accounting Policies
The following is a summary of significant accounting policies consistently followed by the Fund in the preparation of its financial statements. These policies are in conformity with U.S. generally accepted accounting principles (GAAP).
Investment Valuation
In calculating its net asset value (NAV), the Fund generally values investments as follows:
- Fixed-income securities acquired with remaining maturities greater than 60 days are fair valued using price evaluations provided by a pricing service approved by the Trustees.
- Fixed-income securities acquired with remaining maturities of 60 days or less are valued at their cost (adjusted for the accretion of any discount or amortization of any premium), which approximates market value.
- Derivative contracts listed on exchanges are valued at their reported settlement or closing price.
- Over-the-counter (OTC) derivative contracts are fair valued using price evaluations provided by a pricing service approved by the Trustees.
- Shares of other mutual funds are valued based upon their reported NAVs.
- For securities that are fair valued in accordance with procedures established by and under the general supervision of the Trustees, certain factors may be considered such as: the purchase price of the security, information obtained by contacting the issuer, analysis of the issuer's financial statements or other available documents, fundamental analytical data, the nature and duration of restrictions on disposition, the movement of the market in which the security is normally traded and public trading in similar securities of the issuer or comparable issuers.
If the Fund cannot obtain a price or price evaluation from a pricing service for an investment, the Fund may attempt to value the investment based upon the mean of bid and asked quotations or fair value the investment based on price evaluations, from one or more dealers. If any price, quotation, price evaluation or other pricing source is not readily available when the NAV is calculated, the Fund uses the fair value of the investment determined in accordance with the procedures described below. There can be no assurance that the Fund could purchase or sell an investment at the price used to calculate the Fund's NAV.
Annual Shareholder Report
Fair Valuation and Significant Events ProceduresThe Trustees have authorized the use of pricing services to provide evaluations of the current fair value of certain investments for purposes of calculating the NAV. Factors considered by pricing services in evaluating an investment include the yields or prices of investments of comparable quality, coupon, maturity, call rights and other potential prepayments, terms and type, reported transactions, indications as to values from dealers and general market conditions. Some pricing services provide a single price evaluation reflecting the bid-side of the market for an investment (a “bid” evaluation). Other pricing services offer both bid evaluations and price evaluations indicative of a price between the prices bid and asked for the investment (a “mid” evaluation). The Fund normally uses bid evaluations for U.S. Treasury and Agency securities, mortgage-backed securities and municipal securities. The Fund normally uses mid evaluations for other types of fixed-income securities and OTC derivative contracts. In the event that market quotations and price evaluations are not available for an investment, the fair value of the investment is determined in accordance with procedures adopted by the Trustees.
The Trustees also have adopted procedures requiring an investment to be priced at its fair value whenever the Adviser determines that a significant event affecting the value of the investment has occurred between the time as of which the price of the investment would otherwise be determined and the time as of which the NAV is computed. An event is considered significant if there is both an affirmative expectation that the investment's value will change in response to the event and a reasonable basis for quantifying the resulting change in value. Examples of significant events that may occur after the close of the principal market on which a security is traded, or after the time of a price evaluation provided by a pricing service or a dealer, include:
- With respect to price evaluations of fixed-income securities determined before the close of regular trading on the NYSE, actions by the Federal Reserve Open Market Committee and other significant trends in U.S. fixed-income markets;
- Political or other developments affecting the economy or markets in which an issuer conducts its operations or its securities are traded; and
- Announcements concerning matters such as acquisitions, recapitalizations, litigation developments, a natural disaster affecting the issuer's operations or regulatory changes or market developments affecting the issuer's industry.
The Fund may seek to obtain more current quotations or price evaluations from alternative pricing sources. If a reliable alternative pricing source is not available, the Fund will determine the fair value of the investment using another method approved by the Trustees.
Annual Shareholder Report
Investment Income, Gains and Losses, Expenses and DistributionsInvestment transactions are accounted for on a trade date basis. Realized gains and losses from investment transactions are recorded on an identified cost basis. Interest income and expenses are accrued daily. Distributions to shareholders are recorded on the ex-dividend date. Distributions of net investment income are declared and paid monthly. Non-cash dividends included in dividend income, if any, are recorded at fair value. Investment income, realized and unrealized gains and losses and certain fund-level expenses are allocated to each class based on relative average daily net assets, except that Class A Shares and Class B Shares may bear account administration fees, distribution services fees and shareholder services fees unique to those classes. For the year ended August 31, 2011, account administration fees for the Fund were as follows:
| Account
Administration
Fees Incurred |
| Class A Shares | $10,505 |
Dividends are declared separately for each class. No class has preferential dividend rights; differences in per share dividend rates are generally due to differences in separate class expenses.
Premium and Discount Amortization
All premiums and discounts on fixed-income securities are amortized/accreted using the effective interest rate method.
Federal Taxes
It is the Fund's policy to comply with the Subchapter M provision of the Internal Revenue Code and to distribute to shareholders each year substantially all of its income. Accordingly, no provision for federal income tax is necessary. As of and during the year ended August 31, 2011, the Fund did not have a liability for any uncertain tax positions. The Fund recognizes interest and penalties, if any, related to tax liabilities as income tax expense in the Statement of Operations. As of August 31, 2011, tax years 2008 through 2011 remain subject to examination by the Fund's major tax jurisdictions, which include the United States of America and the Commonwealth of Massachusetts.
When-Issued and Delayed Delivery Transactions
The Fund may engage in when-issued or delayed delivery transactions. The Fund records when-issued securities on the trade date and maintains security positions such that sufficient liquid assets will be available to make payment for the securities purchased. Securities purchased on a when-issued or delayed delivery basis are marked to market daily and begin earning interest on the settlement date. Losses may occur on these transactions due to changes in market conditions or the failure of counterparties to perform under the contract.
Restricted Securities
The fund may purchase securities which are considered restricted. Restricted securities are securities that either: (a) cannot be offered for public sale without first being registered, or being able to take advantage of an exemption from registration, under the Securities Act of 1933; or (b) are subject to contractual restrictions on public sales. In some cases, when a security cannot be offered for public sale without first being registered, the issuer of the restricted security has agreed to register such securities for resale, at the issuer's expense, Annual Shareholder Report
either upon demand by the Fund or in connection with another registered offering of the securities. Many such restricted securities may be resold in the secondary market in transactions exempt from registration. Restricted securities may be determined to be liquid under criteria established by the Trustees. The Fund will not incur any registration costs upon such resales. The Fund's restricted securities are valued at the price provided by dealers in the secondary market or, if no market prices are available, at the fair value as determined in accordance with procedures established by and under the general supervision of the Trustees.Additional information on restricted securities, excluding securities purchased under Rule 144A that have been deemed liquid by the Trustees, if applicable, held at August 31, 2011, is as follows:
| Security | Acquisition
Date | Cost | Market
Value |
| Susquehanna, PA Area Regional AirportAuthority, Airport Facilities Revenue Bonds (Series 1999), 5.50% (Aero Harrisburg)/(Original Issue Yield: 5.85%), 1/1/2024 | 3/30/2000 | $871,783 | $688,320 |
Other
The preparation of financial statements in conformity with GAAP requires management to make estimates and assumptions that affect the amounts of assets, liabilities, expenses and revenues reported in the financial statements. Actual results could differ from those estimated.
3. Shares of Beneficial Interest
The following tables summarize share activity:
| Year Ended August 31 | 2011 | 2010 |
| Class A Shares: | Shares | Amount | Shares | Amount |
| Shares sold | 3,256,199 | $34,223,213 | 4,668,584 | $49,534,637 |
| Shares issued to shareholders in payment of distributions declared | 584,362 | 6,113,898 | 589,335 | 6,262,783 |
| Shares redeemed | (6,232,251) | (65,280,679) | (7,190,240) | (76,374,600) |
NET CHANGE RESULTING FROM
CLASS A SHARE TRANSACTIONS | (2,391,690) | $(24,943,568) | (1,932,321) | $(20,577,180) |
| Year Ended August 31 | 2011 | 2010 |
| Class B Shares: | Shares | Amount | Shares | Amount |
| Shares sold | 42,567 | $448,445 | 89,916 | $957,331 |
| Shares issued to shareholders in payment of distributions declared | 30,078 | 314,913 | 46,463 | 493,444 |
| Shares redeemed | (850,706) | (8,899,047) | (659,424) | (7,001,397) |
NET CHANGE RESULTING FROM
CLASS B SHARE TRANSACTIONS | (778,061) | $(8,135,689) | (523,045) | $(5,550,622) |
NET CHANGE RESULTING
FROM TOTAL FUND
SHARE TRANSACTIONS | (3,169,751) | $(33,079,257) | (2,455,366) | $(26,127,802) |
Annual Shareholder Report4. Federal Tax Information
The timing and character of income and capital gain distributions are determined in accordance with income tax regulations, which may differ from GAAP. These differences are due to differing treatments for discount accretion/premium amortization on debt securities.
For the year ended August 31, 2011, permanent differences identified and reclassified among the components of net assets were as follows:
| Increase (Decrease) |
Undistributed
Net Investment
Income (Loss) | Accumulated
Net Realized
Gain (Loss) |
| $(8,013) | $8,013 |
Net investment income (loss), net realized gains (losses) and net assets were not affected by this reclassification.
The tax character of distributions as reported on the Statement of Changes in Net Assets for the years ended August 31, 2011 and 2010, was as follows:
| 2011 | 2010 |
| Tax-exempt income | $10,500,249 | $11,666,966 |
As of August 31, 2011, the components of distributable earnings on a tax basis were as follows:
| Undistributed tax-exempt income | $24,301 |
| Net unrealized appreciation | $5,785,690 |
| Capital loss carryforwards and deferrals | $(21,598,236) |
The difference between book-basis and tax-basis net unrealized appreciation/depreciation is attributable to differing treatments for discount accretion/premium amortization on debt securities.
At August 31, 2011, the cost of investments for federal tax purposes was $245,234,510. The net unrealized appreciation of investments for federal tax purposes was $5,785,690. This consists of net unrealized appreciation from investments for those securities having an excess of value over cost of $9,595,658 and net unrealized depreciation from investments for those securities having an excess of cost over value of $3,809,968.
Annual Shareholder Report
At August 31, 2011, the Fund had a capital loss carryforward of $20,020,638 which will reduce the Fund's taxable income arising from future net realized gains on investments, if any, to the extent permitted by the Code and thus will reduce the amount of distributions to shareholders which would otherwise be necessary to relieve the Fund of any liability for federal income tax. Pursuant to the Code, such capital loss carryforward will expire as follows:| Expiration Year | Expiration Amount |
| 2012 | $236,977 |
| 2013 | $1,984,510 |
| 2016 | $213,566 |
| 2017 | $7,730,607 |
| 2018 | $9,851,417 |
| 2019 | $3,561 |
Under the recently enacted Regulated Investment Company Modernization Act of 2010, the Fund will be permitted to carry forward capital losses incurred in taxable years beginning after December 22, 2010 for an unlimited period. However, any losses incurred during those future years will be required to be utilized prior to the losses incurred in pre-enactment tax years. As a result of this ordering rule, pre-enactment capital loss carryforwards may be more likely to expire unused. Additionally, post-enactment capital losses that are carried forward will retain their character as either short-term or long-term capital losses rather than being considered all short-term as under previous law.
Under current tax regulations, capital losses on securities transactions realized after October 31 may be deferred and treated as occurring on the first day of the following fiscal year. As of August 31, 2011, for federal income tax purposes, post-October losses of $1,577,598 were deferred to September 1, 2011.
5. Investment Adviser Fee and Other Transactions with Affiliates
Investment Adviser Fee
Federated Investment Management Company is the Fund's investment adviser (the “Adviser”). The advisory agreement between the Fund and the Adviser provides for an annual fee equal to 0.40% of the Fund's average daily net assets. Subject to the terms described in the Expense Limitation note, the Adviser may voluntarily choose to waive any portion of its fee. For the year ended August 31, 2011, the Adviser voluntarily waived $225,814 of its fee.
Administrative Fee
Federated Administrative Services (FAS), under the Administrative Services Agreement, provides the Fund with administrative personnel and services. The fee paid to FAS is based on the average aggregate daily net assets of certain Federated funds as specified below:
| Administrative Fee | Average Aggregate Daily Net Assets
of the Federated Funds |
| 0.150% | on the first $5 billion |
| 0.125% | on the next $5 billion |
| 0.100% | on the next $10 billion |
| 0.075% | on assets in excess of $20 billion |
Annual Shareholder ReportThe administrative fee received during any fiscal year shall be at least $150,000 per portfolio and $40,000 per each additional class of Shares. Subject to the terms described in the Expense Limitation note, FAS may voluntarily choose to waive any portion of its fee. For the year ended August 31, 2011, the net fee paid to FAS was 0.076% of average daily net assets of the Fund. FAS waived $5,251 of its fee.
Distribution Services Fee
The Fund has adopted a Distribution Plan (the “Plan”) pursuant to Rule 12b-1 under the Act. Under the terms of the Plan, the Fund will compensate Federated Securities Corp. (FSC), the principal distributor, from the daily net assets of the Fund's Class A Shares and Class B Shares to finance activities intended to result in the sale of these shares. The Plan provides that the Fund may incur distribution expenses at the following percentages of average daily net assets annually, to compensate FSC:
| Share Class Name | Percentage of Average Daily
Net Assets of Class |
| Class A Shares | 0.05% |
| Class B Shares | 0.75% |
Subject to the terms described in the Expense Limitation note, FSC may voluntarily choose to waive any portion of its fee. For the year ended August 31, 2011, distribution services fees for the Fund were as follows:
| Distribution
Services Fees
Incurred |
| Class B Shares | $84,565 |
When FSC receives fees, it may pay some or all of them to financial intermediaries whose customers purchase shares. For the year ended August 31, 2011, FSC retained $5,334 of fees paid by the Fund. For the year ended August 31, 2011, the Fund's Class A Shares did not incur a distribution services fee; however it may begin to incur the fee upon approval of the Trustees.
Sales Charges
Front-end sales charges and contingent deferred sales charges (CDSC) do not represent expenses of the Fund. They are deducted from the proceeds of sales of Fund shares prior to investment or from redemption proceeds prior to remittance, as applicable. For the year ended August 31, 2011, FSC retained $36,997 in sales charges from the sale of the Fund's Class A Shares. FSC also retained $95 of CDSC relating to redemptions of Class B shares.
Annual Shareholder Report
Shareholder Services FeeThe Fund may pay fees (“Service Fees”) up to 0.25% of the average daily net assets of the Fund's Class A Shares and Class B Shares to financial intermediaries or to Federated Shareholder Services Company (FSSC) for providing services to shareholders and maintaining shareholder accounts. Subject to the terms described in the Expense Limitation note, FSSC may voluntarily reimburse the Fund for Service Fees. For the year ended August 31, 2011, Service Fees for the Fund were as follows:
| Service Fees
Incurred | Service Fees
Reimbursed |
| Class A Shares | $606,171 | $(49,334) |
| Class B Shares | $28,188 | — |
| TOTAL | $634,359 | $(49,334) |
For the year ended August 31, 2011, FSSC did not receive any fees paid by the Fund.
Interfund Transactions
During the year ended August 31, 2011, the Fund engaged in purchase and sale transactions with funds that have a common investment adviser (or affiliated investment advisers), common Directors/Trustees and/or common Officers. These purchase and sale transactions complied with Rule 17a-7 under the Act and amounted to $50,600,000 and $49,250,000, respectively.
Expense Limitation
The Adviser and its affiliates (which may include FSC, FAS and FSSC) have voluntarily agreed to waive their fees and/or reimburse expenses so that the total annual fund operating expenses (as shown in the financial highlights) paid by the Fund's Class A Shares and Class B Shares (after the voluntary waivers and reimbursements) will not exceed 0.75% and 1.52% (the “Fee Limit”), respectively, up to but not including the later of (the “Termination Date”): (a) November 1, 2012; or (b) the date of the Fund's next effective Prospectus. While the Adviser and its affiliates currently do not anticipate terminating or increasing these arrangements prior to the Termination Date, these arrangements may only be terminated or the Fee Limit increased prior to the Termination Date with the agreement of the Trustees.
General
Certain Officers and Trustees of the Fund are Officers and Directors or Trustees of the above companies.
6. Investment Transactions
Purchases and sales of investments, excluding long-term U.S. government securities and short-term obligations, for the year ended August 31, 2011, were as follows:
| Purchases | $19,990,830 |
| Sales | $44,341,253 |
7. Concentration of Risk
Since the Fund invests a substantial portion of its assets in issuers located in one state, it will be more susceptible to factors adversely affecting issuers of that state than would be a comparable tax-exempt mutual fund that invests nationally. In order to reduce the credit risk associated with such factors, at August 31, 2011, 38.5% of the securities in the portfolio of Annual Shareholder Report
investments is backed by letters of credit or bond insurance of various financial institutions and financial guaranty assurance agencies. The largest percentage of investments insured by or supported (backed) by a letter of credit from any one institution or agency was 14.8% of total investments.8. Line of Credit
The Fund participates in a $100,000,000 unsecured, uncommitted revolving line of credit (LOC) agreement with PNC Bank. The LOC was made available for extraordinary or emergency purposes, primarily for financing redemption payments. Borrowings are charged interest at a rate offered to the Fund by PNC Bank at the time of the borrowing. As of August 31, 2011, there were no outstanding loans. During the year ended August 31, 2011, the Fund did not utilize the LOC.
9. Interfund Lending
Pursuant to an Exemptive Order issued by the Securities and Exchange Commission, the Fund, along with other funds advised by subsidiaries of Federated Investors, Inc., may participate in an interfund lending program. This program provides an alternative credit facility allowing the Fund to borrow from other participating affiliated funds. As of August 31, 2011, there were no outstanding loans. During the year ended August 31, 2011, the program was not utilized.
10. Recent Accounting Pronouncements
In April 2011, the Financial Accounting Standards Board (FASB) released Accounting Standards Update (ASU) No. 2011-03, “Reconsideration of Effective Control for Repurchase Agreements.” This ASU amends FASB Accounting Standards Codification (ASC) Topic 860, “Transfers and Servicing,” specifically the criteria required to determine whether a repurchase agreement and similar agreements should be accounted for as sales of financial assets or secured borrowings with commitments. This ASU is effective for fiscal years and interim periods beginning after December 15, 2011. At this time, management is evaluating the implications of adopting ASU No. 2011-03 and its impact on the Fund's financial statements and the accompanying notes, net assets and results of operations.
In addition, in May 2011, FASB released ASU No. 2011-04, “Amendments to Achieve Common Fair Value Measurement and Disclosure Requirements in U.S. GAAP and IFRSs.” This ASU amends FASB ASC Topic 820, “Fair Value Measurement,” to establish common requirements for measuring fair value and for disclosing information about fair value measurements in accordance with GAAP. This ASU is effective for fiscal years and interim periods beginning after December 15, 2011. At this time, management is evaluating the implications of adopting ASU No. 2011-04 and its impact on the Fund's financial statements and the accompanying notes.
11. Federal Tax Information (unaudited)
For the fiscal year ended August 31, 2011, 100.0% of the distributions from net investment income is exempt from federal income tax, other than the federal AMT.
Annual Shareholder Report Report of Independent Registered Public Accounting Firm
TO THE BOARD OF TRUSTEES OF federated municipal securities income trust AND SHAREHOLDERS OF federated pennsylvania municipal income fund:
We have audited the accompanying statement of assets and liabilities, including the portfolio of investments, of Federated Pennsylvania Municipal Income Fund (the “Fund”), a portfolio of Federated Municipal Securities Income Trust, as of August 31, 2011, and the related statement of operations for the year then ended, the statements of changes in net assets for each of the years in the two-year period then ended and the financial highlights for each of the years in the five-year period then ended. These financial statements and financial highlights are the responsibility of the Fund's management. Our responsibility is to express an opinion on these financial statements and financial highlights based on our audits.
We conducted our audits in accordance with the standards of the Public Company Accounting Oversight Board (United States). Those standards require that we plan and perform the audit to obtain reasonable assurance about whether the financial statements and financial highlights are free of material misstatement. An audit includes examining, on a test basis, evidence supporting the amounts and disclosures in the financial statements. Our procedures included confirmation of securities owned as of August 31, 2011, by correspondence with the custodian and brokers or by other appropriate auditing procedures. An audit also includes assessing the accounting principles used and significant estimates made by management, as well as evaluating the overall financial statement presentation. We believe that our audits provide a reasonable basis for our opinion.
In our opinion, the financial statements and financial highlights referred to above present fairly, in all material respects, the financial position of Federated Pennsylvania Municipal Income Fund as of August 31, 2011, and the results of its operations for the year then ended, the changes in its net assets for each of the years in the two-year period then ended and the financial highlights for each of the years in the five-year period then ended, in conformity with U.S. generally accepted accounting principles.
Boston, Massachusetts
October 24, 2011
Annual Shareholder Report Shareholder Expense Example (unaudited)
As a shareholder of the Fund, you incur two types of costs: (1) transaction costs, including sales charges (loads) on purchase or redemption payments; and (2) ongoing costs, including management fees and to the extent applicable, distribution (12b-1) fees and/or shareholder services fees and other Fund expenses. This Example is intended to help you to understand your ongoing costs (in dollars) of investing in the Fund and to compare these costs with the ongoing costs of investing in other mutual funds. It is based on an investment of $1,000 invested at the beginning of the period and held for the entire period from March 1, 2011 to August 31, 2011.
ACTUAL EXPENSES
The first section of the table below provides information about actual account values and actual expenses. You may use the information in this section, together with the amount you invested, to estimate the expenses that you incurred over the period. Simply divide your account value by $1,000 (for example, an $8,600 account value divided by $1,000 = 8.6), then multiply the result by the number in the first section under the heading entitled “Expenses Paid During Period” to estimate the expenses attributable to your investment during this period.
HYPOTHETICAL EXAMPLE FOR COMPARISON PURPOSES
The second section of the table below provides information about hypothetical account values and hypothetical expenses based on the Fund's actual expense ratio and an assumed rate of return of 5% per year before expenses, which is not the Fund's actual return. Thus, you should not use the hypothetical account values and expenses to estimate the actual ending account balance or your expenses for the period. Rather, these figures are required to be provided to enable you to compare the ongoing costs of investing in the Fund with other funds. To do so, compare this 5% hypothetical example with the 5% hypothetical examples that appear in the shareholder reports of the other funds.
Annual Shareholder Report
Please note that the expenses shown in the table are meant to highlight your ongoing costs only and do not reflect any transaction costs, such as sales charges (loads) on purchase or redemption payments. Therefore, the second section of the table is useful in comparing ongoing costs only, and will not help you determine the relative total costs of owning different funds. In addition, if these transaction costs were included, your costs would have been higher. | Beginning
Account Value
3/1/2011 | Ending
Account Value
8/31/2011 | Expenses Paid
During Period1 |
| Actual: | | | |
| Class A Shares | $1,000 | $1,060.30 | $3.89 |
| Class B Shares | $1,000 | $1,056.10 | $7.88 |
Hypothetical (assuming a 5% return
before expenses): | | | |
| Class A Shares | $1,000 | $1,021.42 | $3.82 |
| Class B Shares | $1,000 | $1,017.54 | $7.73 |
| 1 | Expenses are equal to the Fund's annualized net expense ratios, multiplied by the average account value over the period, multiplied by 184/365 (to reflect the one-half-year period). The annualized net expense ratios are as follows: |
| Class A Shares | 0.75% |
| Class B Shares | 1.52% |
Annual Shareholder Report Board of Trustees and Trust Officers
The Board of Trustees is responsible for managing the Trust's business affairs and for exercising all the Trust's powers except those reserved for the shareholders. The following tables give information about each Trustee and the senior officers of the Fund. Where required, the tables separately list Trustees who are “interested persons” of the Fund (i.e., “Interested” Trustees) and those who are not (i.e., “Independent” Trustees). Unless otherwise noted, the address of each person listed is Federated Investors Tower, 1001 Liberty Avenue, Pittsburgh, PA 15222. The address of all Independent Trustees listed is 4000 Ericsson Drive, Warrendale, PA 15086-7561; Attention: Mutual Fund Board. As of December 31, 2010, the Trust comprised five portfolio(s), and the Federated Fund Family consisted of 43 investment companies (comprising 136 portfolios). Unless otherwise noted, each Officer is elected annually. Unless otherwise noted, each Trustee oversees all portfolios in the Federated Fund Family and serves for an indefinite term. The Fund's Statement of Additional Information includes additional information about Trust Trustees and is available, without charge and upon request, by calling 1-800-341-7400.
Interested TRUSTEES Background
Name
Birth Date
Positions Held with Trust
Date Service Began | Principal Occupation(s) for Past Five Years,
Other Directorships Held and Previous Position(s) |
John F. Donahue*
Birth Date: July 28, 1924
Trustee
Began serving: August 1990 | Principal Occupations: Director or Trustee of the Federated Fund Family; Chairman and Director, Federated Investors, Inc.; Chairman of the Federated Fund Family's Executive Committee.
Previous Positions: Chairman of the Federated Fund Family; Trustee, Federated Investment Management Company; Chairman and Director, Federated Investment Counseling. |
J. Christopher Donahue*
Birth Date: April 11, 1949
President and Trustee
Began serving: August 1990 | Principal Occupations: Principal Executive Officer and President of the Federated Fund Family; Director or Trustee of some of the Funds in the Federated Fund Family; President, Chief Executive Officer and Director, Federated Investors, Inc.; Chairman and Trustee, Federated Investment Management Company; Trustee, Federated Investment Counseling; Chairman and Director, Federated Global Investment Management Corp.; Chairman, Federated Equity Management Company of Pennsylvania and Passport Research, Ltd. (investment advisory subsidiary of Federated); Trustee, Federated Shareholder Services Company; Director, Federated Services Company.
Previous Positions: President, Federated Investment Counseling; President and Chief Executive Officer, Federated Investment Management Company, Federated Global Investment Management Corp. and Passport Research, Ltd. |
| * | Family relationships and reasons for “interested” status: John F. Donahue is the father of J. Christopher Donahue; both are “interested” due to their beneficial ownership of shares of Federated Investors, Inc. and the positions they hold with Federated and its subsidiaries. |
Annual Shareholder Report INDEPENDENT TRUSTEES Background
Name
Birth Date
Positions Held with Trust
Date Service Began | Principal Occupation(s) for Past Five Years,
Other Directorships Held, Previous Position(s) and Qualifications |
Nicholas P. Constantakis, CPA
Birth Date: September 3, 1939
Trustee
Began serving: February 1998 | Principal Occupation: Director or Trustee of the Federated Fund Family.
Other Directorship Held: Director and Chairman of the Audit Committee, Michael Baker Corporation (architecture, engineering and construction services).
Previous Position: Partner, Andersen Worldwide SC.
Qualifications: Public accounting and director experience. |
John F. Cunningham
Birth Date: March 5, 1943
Trustee
Began serving: July 1999 | Principal Occupation: Director or Trustee of the Federated Fund Family.
Other Directorships Held: Chairman, President and Chief Executive Officer, Cunningham & Co., Inc. (strategic business consulting); Trustee Associate, Boston College.
Previous Positions: Director, Redgate Communications and EMC Corporation (computer storage systems); Chairman of the Board and Chief Executive Officer, Computer Consoles, Inc.; President and Chief Operating Officer, Wang Laboratories; Director, First National Bank of Boston; Director, Apollo Computer, Inc.
Qualifications: Business management and director experience. |
Maureen Lally-Green
Birth Date: July 5, 1949
Trustee
Began serving: August 2009 | Principal Occupations: Director or Trustee of the Federated Fund Family; Director, Office of Church Relations, Diocese of Pittsburgh; Adjunct Professor of Law, Duquesne University School of Law.
Other Directorships Held: Director, Auberle; Trustee, St. Francis University; Director, Ireland Institute of Pittsburgh; Director, UPMC Mercy Hospital; Regent, St. Vincent Seminary; Director, Epilepsy Foundation of Western and Central Pennsylvania; Director, Saint Thomas More Society, Allegheny County; Director, Carlow University.
Previous Position: Pennsylvania Superior Court Judge.
Qualifications: Legal and director experience. |
Peter E. Madden
Birth Date: March 16, 1942
Trustee
Began serving: August 1991 | Principal Occupation: Director or Trustee, and Chairman of the Board of Directors or Trustees, of the Federated Fund Family.
Previous Positions: Representative, Commonwealth of Massachusetts General Court; President, Chief Operating Officer and Director, State Street Bank and Trust Company and State Street Corporation (retired); Director, VISA USA and VISA International; Chairman and Director, Massachusetts Bankers Association; Director, Depository Trust Corporation; Director, The Boston Stock Exchange.
Qualifications: Business management, mutual fund services and director experience. |
Annual Shareholder ReportName
Birth Date
Positions Held with Trust
Date Service Began | Principal Occupation(s) for Past Five Years,
Other Directorships Held, Previous Position(s) and Qualifications |
Charles F. Mansfield, Jr.
Birth Date: April 10, 1945
Trustee
Began serving: January 1999 | Principal Occupations: Director or Trustee and Chairman of the Audit Committee of the Federated Fund Family; Management Consultant.
Previous Positions: Chief Executive Officer, PBTC International Bank; Partner, Arthur Young & Company (now Ernst & Young LLP); Chief Financial Officer of Retail Banking Sector, Chase Manhattan Bank; Senior Vice President, HSBC Bank USA (formerly, Marine Midland Bank); Vice President, Citibank; Assistant Professor of Banking and Finance, Frank G. Zarb School of Business, Hofstra University; Executive Vice President, DVC Group, Inc. (marketing, communications and technology).
Qualifications: Banking, business management, education and director experience. |
R. James Nicholson
Birth Date: February 4, 1938
Trustee
Began serving: January 2008 | Principal Occupations: Director or Trustee of the Federated Fund Family; Senior Counsel, Brownstein Hyatt Farber Schrek, P.C.; Former Secretary of the U.S. Dept. of Veterans Affairs; Former U.S. Ambassador to the Holy See; Former Chairman of the Republican National Committee.
Other Directorships Held: Director, Horatio Alger Association; Director, The Daniels Fund.
Previous Positions: Colonel, U.S. Army Reserve; Partner, Calkins, Kramer, Grimshaw and Harring, P.C.; General Counsel, Colorado Association of Housing and Building; Chairman and CEO, Nicholson Enterprises, Inc. (real estate holding company); Chairman and CEO, Renaissance Homes of Colorado.
Qualifications: Legal, government, business management and director experience. |
Thomas M. O'Neill
Birth Date: June 14, 1951
Trustee
Began serving: October 2006 | Principal Occupations: Director or Trustee of the Federated Fund Family; Sole Proprietor, Navigator Management Company (investment and strategic consulting).
Other Directorships Held: Board of Overseers, Children's Hospital of Boston; Visiting Committee on Athletics, Harvard College.
Previous Positions: Chief Executive Officer and President, Managing Director and Chief Investment Officer, Fleet Investment Advisors; President and Chief Executive Officer, Aeltus Investment Management, Inc.; General Partner, Hellman, Jordan Management Co., Boston, MA; Chief Investment Officer, The Putnam Companies, Boston, MA; Credit Analyst and Lending Officer, Fleet Bank; Director and Consultant, EZE Castle Software (investment order management software); Director, Midway Pacific (lumber).
Qualifications: Business management, mutual fund, director and investment experience. |
Annual Shareholder ReportName
Birth Date
Positions Held with Trust
Date Service Began | Principal Occupation(s) for Past Five Years,
Other Directorships Held, Previous Position(s) and Qualifications |
John S. Walsh
Birth Date: November 28, 1957
Trustee
Began serving: July 1999 | Principal Occupations: Director or Trustee of the Federated Fund Family; President and Director, Heat Wagon, Inc. (manufacturer of construction temporary heaters); President and Director, Manufacturers Products, Inc. (distributor of portable construction heaters); President, Portable Heater Parts, a division of Manufacturers Products, Inc.
Previous Position: Vice President, Walsh & Kelly, Inc.
Qualifications: Business management and director experience. |
James F. Will
Birth Date: October 12, 1938
Trustee
Began serving: April 2006 | Principal Occupations: Director or Trustee of the Federated Fund Family; formerly, Vice Chancellor and President, Saint Vincent College.
Other Directorships Held: Trustee, Saint Vincent College; Director, Alleghany Corporation; Trustee, Wheeling Jesuit University; Director, Liberty Tire Recycling.
Previous Positions: Chairman, President and Chief Executive Officer, Armco, Inc.; President and Chief Executive Officer, Cyclops Industries; President and Chief Operating Officer, Kaiser Steel Corporation.
Qualifications: Business management, education and director experience. |
OFFICERS
Name
Birth Date
Positions Held with Trust
Date Service Began | Principal Occupation(s) for Past Five Years
and Previous Position(s) |
John W. McGonigle
Birth Date: October 26, 1938
EXECUTIVE VICE PRESIDENT AND SECRETARY
Began serving: August 1990 | Principal Occupations: Executive Vice President and Secretary of the Federated Fund Family; Vice Chairman, Executive Vice President, Secretary and Director, Federated Investors, Inc.
Previous Positions: Trustee, Federated Investment Management Company and Federated Investment Counseling; Director, Federated Global Investment Management Corp., Federated Services Company and Federated Securities Corp. |
Richard A. Novak
Birth Date: December 25, 1963
TREASURER
Began serving: January 2006 | Principal Occupations: Principal Financial Officer and Treasurer of the Federated Fund Family; Senior Vice President, Federated Administrative Services; Financial and Operations Principal for Federated Securities Corp., Edgewood Services, Inc. and Southpointe Distribution Services, Inc.
Previous Positions: Controller of Federated Investors, Inc.; Vice President, Finance of Federated Services Company; held various financial management positions within The Mercy Hospital of Pittsburgh; Auditor, Arthur Andersen & Co. |
Annual Shareholder ReportName
Birth Date
Positions Held with Trust
Date Service Began | Principal Occupation(s) for Past Five Years
and Previous Position(s) |
Richard B. Fisher
Birth Date: May 17, 1923
VICE CHAIRMAN
Began serving: August 2002 | Principal Occupations: Vice Chairman or Vice President of some of the Funds in the Federated Fund Family; Vice Chairman, Federated Investors, Inc.; Chairman, Federated Securities Corp.
Previous Positions: President and Director or Trustee of some of the Funds in the Federated Fund Family; Executive Vice President, Federated Investors, Inc.; Director and Chief Executive Officer, Federated Securities Corp. |
Brian P. Bouda
Birth Date: February 28, 1947
CHIEF COMPLIANCE OFFICER AND SENIOR VICE PRESIDENT
Began serving: August 2004 | Principal Occupations: Senior Vice President and Chief Compliance Officer of the Federated Fund Family; Vice President and Chief Compliance Officer of Federated Investors, Inc. and Chief Compliance Officer of its subsidiaries. Mr. Bouda joined Federated in 1999 and is a member of the American Bar Association and the State Bar Association of Wisconsin. |
Mary Jo Ochson
Birth Date: September 12, 1953
CHIEF INVESTMENT OFFICER
Began serving: May 2004 | Principal Occupations: Mary Jo Ochson was named Chief Investment Officer of tax-exempt, fixed-income products in 2004 and Chief Investment Officer of Tax-Free Money Markets in 2010. She joined Federated in 1982 and has been a Senior Portfolio Manager and a Senior Vice President of the Fund's Adviser since 1996. Ms. Ochson has received the Chartered Financial Analyst designation and holds an M.B.A. in Finance from the University of Pittsburgh. |
J. Scott Albrecht
Birth Date: June 1, 1960
VICE PRESIDENT
Began serving: November 1998 | Principal Occupations: J. Scott Albrecht has been the Fund's portfolio manager since March 1995. He is Vice President of the Trust. Mr. Albrecht joined Federated in 1989. He became a Senior Vice President of the Fund's Adviser in January 2005 and served as a Vice President of the Fund's Adviser from 1994 through 2004. He has been a Senior Portfolio Manager since 1997 and was a Portfolio Manager from 1994 to 1996. Mr. Albrecht has received the Chartered Financial Analyst designation and holds an M.S. in Public Management from Carnegie Mellon University. |
Annual Shareholder Report Evaluation and Approval of Advisory Contract – May 2011
federated pennsylvania municipal income fund (the “Fund”)
The Fund's Board reviewed the Fund's investment advisory contract at meetings held in May 2011. The Board's decision regarding the contract reflects the exercise of its business judgment on whether to continue the existing arrangements.
In this connection, the Federated Funds' Board had previously appointed a Senior Officer, whose duties include specified responsibilities relating to the process by which advisory fees are to be charged to a Federated fund. The Senior Officer has the authority to retain consultants, experts, or staff as may be reasonably necessary to assist in the performance of his duties, reports directly to the Board, and may be terminated only with the approval of a majority of the independent members of the Board. The Senior Officer prepared and furnished to the Board an independent, written evaluation that covered topics discussed below (the “Evaluation”). The Board considered that Evaluation, along with other information, in deciding to approve the advisory contract.
During its review of the contract, the Board considered compensation and benefits received by the Adviser. This included the fees received for services provided to the Fund by other entities in the Federated organization and research services (if any) received by the Adviser from brokers that execute Federated fund trades, as well as advisory fees. The Board is also familiar with and considered judicial decisions concerning allegedly excessive investment advisory fees, which have indicated that the following factors may be relevant to an Adviser's fiduciary duty with respect to its receipt of compensation from a fund: the nature and quality of the services provided by the Adviser, including the performance of the fund; the Adviser's cost of providing the services; the extent to which the Adviser may realize “economies of scale” as a fund grows larger; any indirect benefits that may accrue to the Adviser and its affiliates as a result of the Adviser's relationship with a fund; performance and expenses of comparable funds; and the extent to which the independent Board members are fully informed about all facts the Board deems relevant bearing on the Adviser's services and fees. The Board further considered management fees (including any components thereof) charged to institutional and other clients of the Adviser for what might be viewed as like services, and the cost to the Adviser and its affiliates of supplying services pursuant to the management fee agreements, excluding any intra-corporate profit and profit margins of the Adviser and its affiliates for supplying such services. The Board was aware of these factors and was guided by them in its review of the Fund's advisory contract to the extent it considered them to be appropriate and relevant, as discussed further below.
Annual Shareholder Report
The Board considered and weighed these circumstances in light of its substantial accumulated experience in governing the Fund and working with Federated on matters relating to the Federated funds, and was assisted in its deliberations by independent legal counsel. Throughout the year, the Board has requested and received substantial and detailed information about the Fund and the Federated organization that was in addition to the extensive materials that comprise and accompany the Senior Officer's Evaluation. Federated provided much of this information at each regular meeting of the Board, and furnished additional information in connection with the particular meeting at which the Board's formal review of the advisory contract occurred. Between regularly scheduled meetings, the Board also received information on particular matters as the need arose. Thus, the Board's consideration of the advisory contract included review of the Senior Officer's Evaluation, accompanying data and additional information covering such matters as: the Adviser's investment philosophy, revenue, profitability, personnel and processes; investment and operating strategies; the Fund's short- and long-term performance (in absolute terms, both on a gross basis and net of expenses, as well as in relationship to its particular investment program and certain competitor or “peer group” funds and/or other benchmarks, as appropriate), and comments on the reasons for performance; the Fund's investment objectives; the Fund's expenses (including the advisory fee itself and the overall expense structure of the Fund, both in absolute terms and relative to similar and/or competing funds, with due regard for contractual or voluntary expense limitations); the use and allocation of brokerage commissions derived from trading the Fund's portfolio securities (if any); and the nature, quality and extent of the advisory and other services provided to the Fund by the Adviser and its affiliates. The Board also considered the preferences and expectations of Fund shareholders and their relative sophistication; the continuing state of competition in the mutual fund industry and market practices; the range of comparable fees for similar funds in the mutual fund industry; the Fund's relationship to the Federated family of funds which include a comprehensive array of funds with different investment objectives, policies and strategies which are available for exchange without the incurrence of additional sales charges; compliance and audit reports concerning the Federated funds and the Federated companies that service them (including communications from regulatory agencies), as well as Federated's responses to any issues raised therein; and relevant developments in the mutual fund industry and how the Federated funds and/or Federated are responding to them. The Board's evaluation process is evolutionary. The criteria considered and the emphasis placed on relevant criteria change in recognition of changing circumstances in the mutual fund marketplace.With respect to the Fund's performance and expenses in particular, the Board has found the use of comparisons to other mutual funds with comparable investment programs to be relevant, given the high degree of competition in the mutual fund business. The Board focused on comparisons with other similar Annual Shareholder Report
mutual funds more heavily than non-mutual fund products or services because it is believed that they are more relevant. For example, other mutual funds are the products most like the Fund, they are readily available to Fund shareholders as alternative investment vehicles, and they are the type of investment vehicle in fact chosen and maintained by the Fund's investors. The range of their fees and expenses therefore appears to be a generally reliable indication of what consumers have found to be reasonable in the precise marketplace in which the Fund competes. The Fund's ability to deliver competitive performance when compared to its peer group was a useful indicator of how the Adviser is executing the Fund's investment program, which in turn assisted the Board in reaching a conclusion that the nature, extent, and quality of the Adviser's investment management services were such as to warrant continuation of the advisory contract. In this regard, the Senior Officer has reviewed Federated's fees for providing advisory services to products outside the Federated family of funds (e.g., institutional and separate accounts). He concluded that mutual funds and institutional accounts are inherently different products. Those differences include, but are not limited to, different types of targeted investors; being subject to different laws and regulations; different legal structures; different average account sizes; different associated costs; different portfolio management techniques made necessary by different cash flows; and portfolio manager time spent in review of securities pricing. The Senior Officer did not consider these fee schedules to be determinative in judging the appropriateness of mutual fund advisory contracts.The Senior Officer reviewed information compiled by Federated, using data supplied by independent fund ranking organizations, regarding the performance of, and fees charged by, other mutual funds, noting his view that comparisons to fund peer groups are relevant in judging the reasonableness of proposed fees.
The Fund's performance fell below the median of the relevant peer group for the one-year, three-year and five-year periods covered by the Evaluation. The Board discussed the Fund's performance with the Adviser and recognized the efforts being undertaken by the Adviser. The Board will continue to monitor these efforts and the performance of the Fund.
The Board also received financial information about Federated, including information regarding the compensation and benefits Federated derived from its relationships with the Federated funds. This information covered not only the fees under the advisory contracts, but also fees received by Federated's subsidiaries for providing other services to the Federated funds under separate contracts (e.g., for serving as the Federated funds' administrator). The information also detailed any indirect benefit Federated may derive from its receipt of research services from brokers who execute Federated fund trades. In addition, the Board considered the fact that, in order for a fund to be competitive in the marketplace, Federated and its affiliates frequently waived fees Annual Shareholder Report
and/or reimbursed expenses and have disclosed to fund investors and/or indicated to the Board their intention to do so in the future, where appropriate. Moreover, the Board receives regular reporting as to the institution or elimination of these voluntary waivers.Federated furnished information, requested by the Senior Officer, that reported revenues on a fund-by-fund basis and made estimates of the allocation of expenses on a fund-by-fund basis, using allocation methodologies specified by the Senior Officer. The Senior Officer noted that, although they may apply consistent allocation processes, the inherent difficulties in allocating costs (and the unavoidable arbitrary aspects of that exercise) and the lack of consensus on how to allocate those costs may render such allocation information unreliable. The allocation information was considered in the analysis by the Board but was determined to be of limited use.
The Board and the Senior Officer also reviewed information compiled by Federated comparing profitability information for Federated to other publicly held fund management companies. In this regard, the Senior Officer noted the limited availability of such information, but nonetheless concluded that Federated's profit margins did not appear to be excessive and the Board agreed.
The Senior Officer's Evaluation also discussed the notion of possible realization of “economies of scale” as a fund grows larger. The Board considered in this regard that the Adviser has made significant and long-term investments in areas that support all of the Federated funds, such as personnel and processes for the portfolio management, compliance, internal audit, and risk management functions; and systems technology; and that the benefits of these efforts (as well as any economies, should they exist) were likely to be enjoyed by the fund complex as a whole. Finally, the Board also noted the absence of any applicable regulatory or industry guidelines on this subject, which (as discussed in the Senior Officer's Evaluation) is compounded by the lack of any common industry practice or general pattern with respect to structuring fund advisory fees with “breakpoints” that serve to reduce the fee as the fund attains a certain size. The Senior Officer did not recommend institution of breakpoints in pricing Federated's fund advisory services at this time.
It was noted in the materials for the Board meeting that for the period covered by the Evaluation, the Fund's investment advisory fee, after waivers and expense reimbursements, if any, was below the median of the relevant peer group. The Board reviewed the fees and other expenses of the Fund with the Adviser and was satisfied that the overall expense structure of the Fund remained competitive.
The Senior Officer noted that, considering the totality of the circumstances, and all of the factors referenced within his Evaluation, he had concluded that, subject to comments and recommendations made within his Evaluation, his observations and the information accompanying the Evaluation supported a finding by the Board that the management fees for each of the funds was reasonable and that Federated appeared to provide appropriate administrative Annual Shareholder Report
services to the Fund for the fees paid. Under these circumstances, no changes were recommended to, and no objection was raised to, the continuation of the Fund's advisory contract. The Board concluded that the nature, quality and scope of services provided the Fund by the Adviser and its affiliates were satisfactory.In its decision to continue an existing investment advisory contract, the Board was mindful of the potential disruptions of the Fund's operations and various risks, uncertainties and other effects that could occur as a result of a decision to terminate or not renew an advisory contract. In particular, the Board recognized that many shareholders have invested in the Fund on the strength of the Adviser's industry standing and reputation and with the expectation that the Adviser will have a continuing role in providing advisory services to the Fund. Thus, the Board's approval of the advisory contract reflected the fact that it is the shareholders who have effectively selected the Adviser by virtue of having invested in the Fund.
The Board based its decision to approve the advisory contract on the totality of the circumstances and relevant factors and with a view to past and future long-term considerations. Not all of the factors and considerations identified above were necessarily relevant to the Fund, nor did the Board consider any one of them to be determinative. With respect to the factors that were relevant, the Board's decision to approve the contract reflects its determination that Federated's performance and actions provided a satisfactory basis to support the decision to continue the existing arrangements.
Annual Shareholder Report Voting Proxies on Fund Portfolio Securities
A description of the policies and procedures that the Fund uses to determine how to vote proxies, if any, relating to securities held in the Fund's portfolio is available, without charge and upon request, by calling 1-800-341-7400. A report on “Form N-PX” of how the Fund voted any such proxies during the most recent 12-month period ended June 30 is available from Federated's website at FederatedInvestors.com. To access this information from the home page, select “View All” next to “Find Products.” Select a fund name and share class, if applicable, to go to the Fund Overview page. On the Fund Overview page, select the “Documents” tab. At the bottom of that page, select “Proxy Voting Record Report (Form N-PX).” Form N-PX filings are also available at the SEC's website at www.sec.gov.
Quarterly Portfolio Schedule
The Fund files with the SEC a complete schedule of its portfolio holdings, as of the close of the first and third quarters of its fiscal year, on “Form N-Q.” These filings are available on the SEC's website at www.sec.gov and may be reviewed and copied at the SEC's Public Reference Room in Washington, DC. (Call 1-800-SEC-0330 for information on the operation of the Public Reference Room.) You may also access this information from the “Products” section of Federated's website at FederatedInvestors.com. From the home page, select “View All” next to “Find Products.” Select a fund name and share class, if applicable, to go to the Fund Overview page. On the Fund Overview page, select the “Documents” tab. At the bottom of that page, select “Form N-Q.”
Annual Shareholder ReportMutual funds are not bank deposits or obligations, are not guaranteed by any bank and are not insured or guaranteed by the U.S. government, the Federal Deposit Insurance Corporation, the Federal Reserve Board or any other government agency. Investment in mutual funds involves investment risk, including the possible loss of principal.
This Report is authorized for distribution to prospective investors only when preceded or accompanied by the Trust's Prospectus, which contains facts concerning its objective and policies, management fees, expenses and other information.
Federated Pennsylvania Municipal Income Fund
Federated Investors Funds
4000 Ericsson Drive
Warrendale, PA 15086-7561
Contact us at FederatedInvestors.com
or call 1-800-341-7400.
Federated Securities Corp., Distributor
Cusip 313923708
Cusip 313923807
28995 (10/11)
Federated is a registered trademark of Federated Investors, Inc.
2011 © Federated Investors, Inc.
Item 2. Code of Ethics
(a) As of the end of the period covered by this report, the registrant has adopted a code of ethics (the "Section 406 Standards for Investment Companies - Ethical Standards for Principal Executive and Financial Officers") that applies to the registrant's Principal Executive Officer and Principal Financial Officer; the registrant's Principal Financial Officer also serves as the Principal Accounting Officer.
(c) Not Applicable
(d) Not Applicable
(e) Not Applicable
(f)(3) The registrant hereby undertakes to provide any person, without charge, upon request, a copy of the code of ethics. To request a copy of the code of ethics, contact the registrant at 1-800-341-7400, and ask for a copy of the Section 406 Standards for Investment Companies - Ethical Standards for Principal Executive and Financial Officers.
Item 3. Audit Committee Financial Expert
The registrant's Board has determined that each of the following members of the Board's Audit Committee is an “audit committee financial expert,” and is "independent," for purposes of this Item: Nicholas P. Constantakis, Charles F. Mansfield, Jr., Thomas M. O'Neill and John S. Walsh.
Item 4. Principal Accountant Fees and Services
(a) Audit Fees billed to the registrant for the two most recent fiscal years:
Fiscal year ended 2011 - $122,500
Fiscal year ended 2010 - $105,000
(b) Audit-Related Fees billed to the registrant for the two most recent fiscal years:
Fiscal year ended 2011 - $0
Fiscal year ended 2010 - $224
Travel to Audit Committee Meetings.
Amount requiring approval of the registrant’s audit committee pursuant to paragraph (c)(7)(ii) of Rule 2-01 of Regulation S-X, $0 and $10,691 respectively. Fiscal year ended 2010- Audit consent fees for N-14 merger documents.
(c) Tax Fees billed to the registrant for the two most recent fiscal years:
Fiscal year ended 2011 - $0
Fiscal year ended 2010 - $0
Amount requiring approval of the registrant’s audit committee pursuant to paragraph (c)(7)(ii) of Rule 2-01 of Regulation S-X, $0 and $0 respectively.
(d) All Other Fees billed to the registrant for the two most recent fiscal years:
Fiscal year ended 2011 - $0
Fiscal year ended 2010 - $0
Amount requiring approval of the registrant’s audit committee pursuant to paragraph (c)(7)(ii) of Rule 2-01 of Regulation S-X, $0 and $0 respectively.
(e)(1) Audit Committee Policies regarding Pre-approval of Services.
The Audit Committee is required to pre-approve audit and non-audit services performed by the independent auditor in order to assure that the provision of such services do not impair the auditor’s independence. Unless a type of service to be provided by the independent auditor has received general pre-approval, it will require specific pre-approval by the Audit Committee. Any proposed services exceeding pre-approved cost levels will require specific pre-approval by the Audit Committee.
Certain services have the general pre-approval of the Audit Committee. The term of the general pre-approval is 12 months from the date of pre-approval, unless the Audit Committee specifically provides for a different period. The Audit Committee will annually review the services that may be provided by the independent auditor without obtaining specific pre-approval from the Audit Committee and may grant general pre-approval for such services. The Audit Committee will revise the list of general pre-approved services from time to time, based on subsequent determinations. The Audit Committee will not delegate its responsibilities to pre-approve services performed by the independent auditor to management.
The Audit Committee has delegated pre-approval authority to its Chairman. The Chairman will report any pre-approval decisions to the Audit Committee at its next scheduled meeting. The Committee will designate another member with such pre-approval authority when the Chairman is unavailable.
AUDIT SERVICES
The annual Audit services engagement terms and fees will be subject to the specific pre-approval of the Audit Committee. The Audit Committee must approve any changes in terms, conditions and fees resulting from changes in audit scope, registered investment company (RIC) structure or other matters.
In addition to the annual Audit services engagement specifically approved by the Audit Committee, the Audit Committee may grant general pre-approval for other Audit Services, which are those services that only the independent auditor reasonably can provide. The Audit Committee has pre-approved certain Audit services, all other Audit services must be specifically pre-approved by the Audit Committee.
AUDIT-RELATED SERVICES
Audit-related services are assurance and related services that are reasonably related to the performance of the audit or review of the Company’s financial statements or that are traditionally performed by the independent auditor. The Audit Committee believes that the provision of Audit-related services does not impair the independence of the auditor, and has pre-approved certain Audit-related services, all other Audit-related services must be specifically pre-approved by the Audit Committee.
TAX SERVICES
The Audit Committee believes that the independent auditor can provide Tax services to the Company such as tax compliance, tax planning and tax advice without impairing the auditor’s independence. However, the Audit Committee will not permit the retention of the independent auditor in connection with a transaction initially recommended by the independent auditor, the purpose of which may be tax avoidance and the tax treatment of which may not be supported in the Internal Revenue Code and related regulations. The Audit Committee has pre-approved certain Tax services, all Tax services involving large and complex transactions must be specifically pre-approved by the Audit Committee.
ALL OTHER SERVICES
With respect to the provision of services other than audit, review or attest services the pre-approval requirement is waived if:
(1) The aggregate amount of all such services provided constitutes no more than five percent of the total amount of revenues paid by the registrant, the registrant’s adviser (not including any sub-adviser whose role is primarily portfolio management and is subcontracted with or overseen by another investment adviser), and any entity controlling, controlled by, or under common control with the investment adviser that provides ongoing services to the registrant to its accountant during the fiscal year in which the services are provided;
(2) Such services were not recognized by the registrant, the registrant’s adviser (not including any sub-adviser whose role is primarily portfolio management and is subcontracted with or overseen by another investment adviser), and any entity controlling, controlled by, or under common control with the investment adviser that provides ongoing services to the registrant at the time of the engagement to be non-audit services; and
(3) Such services are promptly brought to the attention of the Audit Committee of the issuer and approved prior to the completion of the audit by the Audit Committee or by one or more members of the Audit Committee who are members of the board of directors to whom authority to grant such approvals has been delegated by the Audit Committee.
The Audit Committee may grant general pre-approval to those permissible non-audit services classified as All Other services that it believes are routine and recurring services, and would not impair the independence of the auditor.
The SEC’s rules and relevant guidance should be consulted to determine the precise definitions of prohibited non-audit services and the applicability of exceptions to certain of the prohibitions.
PRE-APPROVAL FEE LEVELS
Pre-approval fee levels for all services to be provided by the independent auditor will be established annually by the Audit Committee. Any proposed services exceeding these levels will require specific pre-approval by the Audit Committee.
PROCEDURES
Requests or applications to provide services that require specific approval by the Audit Committee will be submitted to the Audit Committee by both the independent auditor and the Principal Accounting Officer and/or Internal Auditor, and must include a joint statement as to whether, in their view, the request or application is consistent with the SEC’s rules on auditor independence.
(e)(2) Percentage of services identified in items 4(b) through 4(d) that were approved by the registrants audit committee pursuant to paragraph (c)(7)(i)(C) of Rule 2-01 of Regulation S-X:
4(b)
Fiscal year ended 2011 – 0%
Fiscal year ended 2010 - 0%
Percentage of services provided to the registrants investment adviser and any entity controlling, controlled by, or under common control with the investment adviser that provides ongoing services to the registrant that were approved by the registrants audit committee pursuant to paragraph (c)(7)(i)(C) of Rule 2-01 of Regulation S-X, 0% and 0% respectively.
4(c)
Fiscal year ended 2011 – 0%
Fiscal year ended 2010 – 0%
Percentage of services provided to the registrants investment adviser and any entity controlling, controlled by, or under common control with the investment adviser that provides ongoing services to the registrant that were approved by the registrants audit committee pursuant to paragraph (c)(7)(i)(C) of Rule 2-01 of Regulation S-X, 0% and 0% respectively.
4(d)
Fiscal year ended 2011 – 0%
Fiscal year ended 2010 – 0%
Percentage of services provided to the registrants investment adviser and any entity controlling, controlled by, or under common control with the investment adviser that provides ongoing services to the registrant that were approved by the registrants audit committee pursuant to paragraph (c)(7)(i)(C) of Rule 2-01 of Regulation S-X, 0% and 0% respectively.
(f) NA
(g) Non-Audit Fees billed to the registrant, the registrant’s investment adviser, and certain entities controlling, controlled by or under common control with the investment adviser:
Fiscal year ended 2011 - $3,343
Fiscal year ended 2010 - $378,501
(h) The registrant’s Audit Committee has considered that the provision of non-audit services that were rendered to the registrant’s adviser (not including any sub-adviser whose role is primarily portfolio management and is subcontracted with or overseen by another investment adviser), and any entity controlling, controlled by, or under common control with the investment adviser that provides ongoing services to the registrant that were not pre-approved pursuant to paragraph (c)(7)(ii) of Rule 2-01 of Regulation S-X is compatible with maintaining the principal accountant’s independence.
Item 5. Audit Committee of Listed Registrants
Not Applicable
Item 6. Schedule of Investments
(a) The registrant’s Schedule of Investments is included as part of the Report to Stockholders filed under Item 1 of this form.
(b) Not Applicable; Fund had no divestments during the reporting period covered since the previous Form N-CSR filing.
Item 7. Disclosure of Proxy Voting Policies and Procedures for Closed-End Management Investment Companies
Not Applicable
Item 8. Portfolio Managers of Closed-End Management Investment Companies
Not Applicable
Item 9. Purchases of Equity Securities by Closed-End Management Investment Company and Affiliated Purchasers
Not Applicable
Item 10. Submission of Matters to a Vote of Security Holders
Not Applicable
Item 11. Controls and Procedures
(a) The registrant’s President and Treasurer have concluded that the
registrant’s disclosure controls and procedures (as defined in rule 30a-3(c) under the Act) are effective in design and operation and are sufficient to form the basis of the certifications required by Rule 30a-(2) under the Act, based on their evaluation of these disclosure controls and procedures within 90 days of the filing date of this report on Form N-CSR.
(b) There were no changes in the registrant’s internal control over financial reporting (as defined in rule 30a-3(d) under the Act) during the second fiscal quarter of the period covered by this report that have materially affected, or are reasonably likely to materially affect, the registrant’s internal control over financial reporting.
Item 12. Exhibits
SIGNATURES
Pursuant to the requirements of the Securities Exchange Act of 1934 and the Investment Company Act of 1940, the registrant has duly caused this report to be signed on its behalf by the undersigned, thereunto duly authorized.
Registrant Federated Municipal Securities Income Trust
By /S/ Richard A. Novak
Richard A. Novak, Principal Financial Officer
Date October 21, 2011
Pursuant to the requirements of the Securities Exchange Act of 1934 and the Investment Company Act of 1940, this report has been signed below by the following persons on behalf of the registrant and in the capacities and on the dates indicated.
By /S/ J. Christopher Donahue
J. Christopher Donahue, Principal Executive Officer
Date October 21, 2011
By /S/ Richard A. Novak
Richard A. Novak, Principal Financial Officer
Date October 21, 2011