United States
Securities and Exchange Commission
Washington, D.C. 20549
Form N-CSR
Certified Shareholder Report of Registered Management Investment Companies
811-6165
(Investment Company Act File Number)
Federated Municipal Securities Income Trust
_______________________________________________________________
(Exact Name of Registrant as Specified in Charter)
Federated Investors Funds
4000 Ericsson Drive
Warrendale, Pennsylvania 15086-7561
(Address of Principal Executive Offices)
(412) 288-1900
(Registrant's Telephone Number)
John W. McGonigle, Esquire
Federated Investors Tower
1001 Liberty Avenue
Pittsburgh, Pennsylvania 15222-3779
(Name and Address of Agent for Service)
(Notices should be sent to the Agent for Service)
Date of Fiscal Year End: 08/31/16
Date of Reporting Period: 08/31/16
Item 1. Reports to Stockholders

Annual Shareholder Report
August 31, 2016
| Share Class | Ticker |
| A | FMOAX |
| B | FMOBX |
| C | FMNCX |
| F | FHTFX |
| Institutional | FMYIX |
Federated Municipal High Yield Advantage Fund
Fund Established 1987
A Portfolio of Federated Municipal Securities Income Trust
Dear Valued Shareholder,
I am pleased to present the Annual Shareholder Report for your fund covering the period from September 1, 2015 through August 31, 2016. This report includes Management's Discussion of Fund Performance, a complete listing of your fund's holdings, performance information and financial statements along with other important fund information.
In addition, our website, FederatedInvestors.com, offers easy access to Federated resources that include timely fund updates, economic and market insights from our investment strategists, and financial planning tools. We invite you to register to take full advantage of its capabilities.
Thank you for investing with Federated. I hope you find this information useful and look forward to keeping you informed.
Sincerely,
J. Christopher Donahue, President
Not FDIC Insured • May Lose Value • No Bank Guarantee
CONTENTS
| 1 |
| 9 |
| 10 |
| 36 |
| 41 |
| 43 |
| 44 |
| 45 |
| 55 |
| 56 |
| 58 |
| 64 |
| 70 |
| 70 |
Management's Discussion of Fund Performance (unaudited)
The total return of Federated Municipal High Yield Advantage Fund (the “Fund”), based on net asset value for the 12-month reporting period ended August 31, 2016 (“reporting period”), was 9.17% for Class A Shares and Class F Shares, 8.35% for Class B Shares, 8.47% for Class C Shares and 9.45% for Institutional Shares.1 The 9.45% total return of the Institutional Shares consisted of 4.70% of tax-exempt dividends and reinvestments and price appreciation of 4.75% in the net asset value.2 The Fund's broad-based securities market index, the S&P Municipal Bond Index (the “Main Index”), had a total return of 7.03% during the reporting period. The total return of the 25% S&P A and Higher/25% BBB/50% High Yield, All 3-Year Plus Sub-Index (the “Blended Index”)3 was 10.60% during the reporting period. The total return of the Morningstar High Yield Muni Funds Average (MHYMFA),4 a peer group average for the Fund, was 9.77% during the reporting period. The Fund's and the MHYMFA's total returns for the most recently completed fiscal year reflected actual cash flows, transaction costs and other expenses, which were not reflected in the total return of any index.
During the reporting period, the Fund's investment strategy focused on: (a) selection of lower-quality, investment-grade and noninvestment-grade securities5 (these securities typically have higher yields than high-quality, investment-grade securities available in the market); (b) security selection; (c) selection of intermediate- to long-term, tax-exempt municipal bonds that typically yield more than short-term, tax-exempt municipal bonds due to the upward sloping yield curve; (d) active adjustment of the Fund's duration6 (which indicates the portfolio sensitivity to changes in interest rates);7 (e) allocation of the Fund's portfolio among securities of similar issuers (referred to as “sectors”); and (f) credit quality. These were the most significant factors affecting the Fund's performance relative to the Blended Index during the reporting period.
The following discussion will focus on the performance of the Fund's Institutional Shares.
Market OVERVIEW
During the reporting period, 10-year Treasury yields decreased from a high of 2.34% in November 2015 to a low of 1.36% in July 2016 and averaged 1.89%. Economic activity in the U.S. expanded at a moderate pace despite the global economic and financial setbacks in recent months. A range of recent economic indicators, including strong job gains, pointed to additional strengthening of the labor market. Inflation showed signs of picking up in recent months; however, it continued to run below the Federal Reserve System's (the “Fed”) two percent longer run objective. This partly reflected declines in energy prices and impacts of the U.S. dollar's strength on non-energy imports. Global economic
Annual Shareholder Report
developments continued to pose risks as turmoil in Chinese financial markets and lower oil prices contributed to concerns about the prospects for global economic growth and a pullback from risky assets. The Fed's decision to raise the federal funds target rate by 1/4 percent was widely anticipated by the markets. A downward revision in the expected path of the federal funds target rate was warranted by economic conditions and moved closer to the markets' expectations of the long-run plan.
The vote by the United Kingdom to leave the European Union (“Brexit”) resulted in immediate asset price volatility and some financial markets, particularly certain foreign exchange markets, experienced brief periods of strained liquidity. Safe haven asset prices appreciated substantially, but broad based market dislocations did not develop. Overall, the negative sentiment surrounding the Brexit outcome was subsequently alleviated by expectations of the central banks being more accommodative. Nevertheless, several long term global risks related to Brexit remained.
Downward pressure on domestic energy activity intensified over the reporting period as oil prices dropped further. The imbalance of crude oil relative to demand remained very high, and it was not expected to resolve quickly. The collapse in the price of oil supported the fixed-income markets by further reducing price pressures and generating concerns that the drop in oil prices might reflect declining demand in a weakening global economy. The support for household spending from lower energy prices was offset by the restraint implied by the appreciation of the U.S. dollar and the possibility of adverse effects from slower economic growth in China.
During the reporting period, developments in Europe continued to be a focus for investors which indirectly affected interest rate levels in the tax-exempt municipal bond market. With regard to Europe, there continued to be downside risks to growth emanating from the region, given its unresolved imbalances, weak economic growth and continued deflationary risks. The U.S. dollar strengthened against the currencies of most advanced economies amid concerns about growth in those countries as well as announcements by several central banks regarding monetary policy actions. Elements underpinning the strength of the U.S. dollar were the increasing prevalence of negative interest rates on sovereign debt in some key European economies and risks to the international economic outlook. The European Central Bank announced that it would expand its asset purchase program.Credit conditions in the municipal bond market continued to be generally solid. Credit quality continued to be overall very stable, and ratios of general obligation bonds to those of comparable Treasury securities rose, partly reflecting the declines in yields on Treasury securities. The default by Puerto Rico and the downgrade of Illinois general obligation bonds both had only a limited effect on the broader municipal market.The municipal bond markets' technical (supply and demand) position was mostly favorable over the reporting period. The issuance of municipal debt was lower than in previous periods as issuers were hesitant to add additional
Annual Shareholder Report
leverage and the economic benefits of refunding existing debt became less advantageous. Flows from investors into intermediate, long and high yield municipal bonds were positive and broad-based for a significant portion of the reporting period.
The intermittent flight to quality by investors as a result of the unstable global political and economic environment also favored municipal bonds as they were viewed as a safer alternative investment.
The risk of additional municipal issuers becoming distressed remained through the reporting period. Some state and local governments turned to the courts for assistance in lowering their onerous pension liabilities, but responses from the courts were generally not favorable. Any workouts of these concerns are likely to take many years, which will continue to constrain state and local government budgets and limit their capacity to deal with severe infrastructure needs. The ongoing pressures on public pension plans and their unfunded liabilities continued to receive significant scrutiny.
Some positive news about the fiscal position of the states became available during the reporting period and, in some cases, revenues rose sufficiently enough to enable increases in state government spending and employment. These positive events allowed the spread between “AAA”- and “BBB”-rated general obligation debt to narrow by 27 basis points for 30 year maturities during the reporting period. The municipal yield curve also flattened significantly as yields on shorter maturities increased while yields on longer maturities (5 years and longer) declined leading to better total return performance for longer dated municipal bonds.
SECURITY SELECTION
Individual security selection was the largest contributor to Fund performance compared to the Blended Index. Although a number of idiosyncratic factors played a role, the Fund benefited from an overall improvement in underlying credit, particularly the advance refunding of several positions. Throughout the reporting period, the Fund held an underweight position in Puerto Rico bonds as compared to the Blended Index; although Puerto Rico bonds saw a partial bounce back during the reporting period after several years of deterioration, the Fund's mix of Puerto Rico holdings partially mitigated the impact of the underweight position. Overall, individual security selection contributed positively to Fund performance during the reporting period.
YIELD CURVE AND MATURITY
During the reporting period, the Fund's distribution of maturities along the yield curve, relative to the Blended Index, contributed negatively to Fund performance. In particular, the Fund's relative underweight of long bonds trading at a discount–which better captured the benefit of falling rates–was the main factor behind this lag.
Annual Shareholder Report
SECTOR allocation
During the reporting period, the Fund was overweight, as compared to the Blended Index, in Senior Care and Airport bonds, which helped the Fund's relative performance. Overweight positions in Industrial Development and Pre-Refunded Bonds (bonds for which the principal and interest payments are secured or guaranteed by cash or U.S. Treasury securities held in an escrow account), which underperformed, caused a drag in relative performance. As a whole, the Fund's sector allocations contributed negatively to Fund performance relative to the Blended Index during the reporting period.
DURATION
As determined at the end of the reporting period, the Fund's dollar-weighted average duration was 5.2 years, 0.3 years shorter than 5.5 years at the beginning of the reporting period. Duration management remained a significant component of the Fund's investment strategy. During the reporting period, the Fund's duration was generally 90-100% of the Blended Index. Overall, the Fund's duration made a negative contribution to Fund performance relative to the Blended Index.
CREDIT QUALITY8
During the reporting period, the lowest-rated part of the Blended Index–bonds rated “B” or lower–saw the strongest returns. This portion of the Blended Index is dominated by Puerto Rico bonds and benefited from the partial resurgence in prices for these bonds. The Fund's underweight position in bonds with these ratings–particularly Puerto Rico bonds–led to credit quality contributing negatively to Fund performance versus the Blended Index.
| 1 | Please see the footnotes to the line graphs under “Fund Performance and Growth of a $10,000 Investment” below for information regarding the effect of the reorganization of Federated Municipal High Yield Advantage Fund, Inc., a predecessor fund, into the Fund as of the close of business on November 10, 2006. |
| 2 | Income may be subject to state taxes, local taxes and the federal alternative minimum tax for individuals or corporations. |
| 3 | The Blended Index is being used for comparison purposes because, although it is not the Fund's broad-based securities market index, the Fund's investment adviser (“Adviser”) believes it more closely reflects the market sectors in which the Fund invests. Please see the footnotes to the line graphs under “Fund Performance and Growth of a $10,000 Investment” below for the definition of, and more information about, the Main Index and the Blended Index. |
| 4 | Please see the footnotes to the line graphs under “Fund Performance and Growth of a $10,000 Investment” below for the definition of, and more information about, the MHYMFA. |
| 5 | Credit ratings pertain only to the securities in the portfolio and do not protect Fund shares against market risk. |
| 6 | Duration is a measure of a security's price sensitivity to changes in interest rates. Securities with longer durations are more sensitive to changes in interest rates than securities with shorter durations. For purposes of this Management Discussion of Fund Performance, duration is determined using a third-party analytical system. |
| 7 | Bond prices are sensitive to changes in interest rates, and a rise in interest rates can cause a decline in their prices. |
Annual Shareholder Report
| 8 | Investment-grade securities and noninvestment-grade securities may either be: (a) rated by a nationally recognized statistical ratings organization or rating agency; or (b) unrated securities that the Fund's Adviser believes are of comparable quality. The rating agencies that provided the ratings for rated securities include Standard and Poor's, Moody's Investor Services, Inc. and Fitch Rating Service. When ratings vary, the highest rating is used. Credit ratings of “AA” or better are considered to be high credit quality; credit ratings of “A” are considered high or medium/good quality; and credit ratings of “BBB” are considered to be medium/good credit quality, and the lowest category of investment-grade securities; credit ratings of “BB” and below are lower-rated, noninvestment-grade securities or junk bonds; and credit ratings of “CCC” or below are noninvestment-grade securities that have high default risk. Any credit quality breakdown does not give effect to the impact of any credit derivative investments made by the Fund. Credit ratings are an indication of the risk that a security will default. They do not protect a security from credit risk. Lower-rated bonds typically offer higher yields to help compensate investors for the increased risk associated with them. Among these risks are lower creditworthiness, greater price volatility, more risk to principal and income than with higher-rated securities and increased possibilities of default. |
Annual Shareholder Report
FUND PERFORMANCE AND GROWTH OF A $10,000 INVESTMENT
The graph below illustrates the hypothetical investment of $10,0001 in Federated Municipal High Yield Advantage Fund2 (the “Fund”) from August 31, 2006 to August 31, 2016, compared to the S&P Municipal Bond Index (Main Index),3 S&P 25% A and Higher/25% BBB/50% High Yield, All 3-Year Plus Sub-Index, a custom blended index (Blended Index),4 and the Morningstar High Yield Muni Funds Average (MHYMFA).5 The Average Annual Total Return table below shows returns for each class averaged over the stated periods.
Growth of A $10,000 Investment
Growth of $10,000 as of August 31, 2016
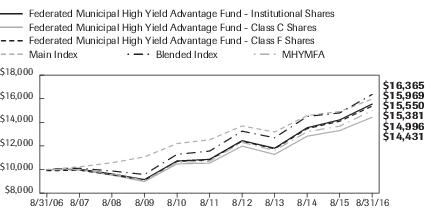
| Federated Municipal High Yield Advantage Fund - | Institutional Shares | Class C Shares | Class F Shares | Main Index | Blended Index | MHYMFA |
| F | F | F | I | I | I |
| 8/31/2006 | 10,000 | 10,000 | 9,900 | 10,000 | 10,000 | 10,000 |
| 8/31/2007 | 10,033 | 9,973 | 9,946 | 10,232 | 10,113 | 9,996 |
| 8/31/2008 | 9,632 | 9,526 | 9,563 | 10,577 | 9,877 | 9,656 |
| 8/31/2009 | 9,150 | 8,984 | 9,097 | 11,072 | 9,581 | 9,062 |
| 8/31/2010 | 10,728 | 10,484 | 10,682 | 12,200 | 11,287 | 10,599 |
| 8/31/2011 | 10,865 | 10,540 | 10,820 | 12,520 | 11,563 | 10,704 |
| 8/31/2012 | 12,449 | 11,986 | 12,397 | 13,693 | 13,251 | 12,300 |
| 8/31/2013 | 11,807 | 11,282 | 11,756 | 13,181 | 12,691 | 11,613 |
| 8/31/2014 | 13,543 | 12,826 | 13,466 | 14,572 | 14,498 | 13,207 |
| 8/31/2015 | 14,207 | 13,304 | 14,089 | 14,919 | 14,796 | 13,676 |
| 8/31/2016 | 15,550 | 14,431 | 15,381 | 15,969 | 16,365 | 14,996 |
41 graphic description end -->
| ■ | The returns shown for Class C Shares include the maximum contingent deferred sales charge of 1.00% as applicable. |
| ■ | Total returns shown for Class F Shares include the maximum sales charge of 1.00% ($10,000 investment minus $100 sales charge =$9,900) and the maximum contingent deferred sales charge of 1.00% as applicable. |
The Fund offers multiple share classes whose performance may be greater than or less than its other share class(es) due to differences in sales charges and expenses. See the Average Annual Total Return table below for the returns of additional classes not shown in the line graph above.
Annual Shareholder Report
Average Annual Total Returns for the Period Ended 8/31/2016
(returns reflect all applicable sales charges and contingent deferred sales charges as specified below in footnote #1)
| | 1 Year | 5 Years | 10 Years |
| Class A Shares | 4.23% | 6.30% | 4.03% |
| Class B Shares | 2.85% | 6.15% | 3.88% |
| Class C Shares | 7.47% | 6.49% | 3.74% |
| Class F Shares | 7.08% | 7.08% | 4.40% |
| Institutional Shares6 | 9.45% | 7.44% | 4.51% |
| Main Index | 7.03% | 4.99% | 4.79% |
| Blended Index | 10.60% | 7.19% | 5.05% |
| MHYMFA | 9.77% | 7.05% | 4.14% |
Performance data quoted represents past performance which is no guarantee of future results. Investment return and principal value will fluctuate so that an investor's shares, when redeemed, may be worth more or less than their original cost. Mutual fund performance changes over time and current performance may be lower or higher than what is stated. For current to the most recent month-end performance and after-tax returns, visit FederatedInvestors.com or call 1-800-341-7400. Returns shown do not reflect the deduction of taxes that a shareholder would pay on Fund distributions or the redemption of Fund shares. Mutual funds are not obligations of or guaranteed by any bank and are not federally insured.
Annual Shareholder Report
| 1 | Represents a hypothetical investment of $10,000 in the Fund after deducting applicable sales charges: For Class A Shares, the maximum sales charge of 4.50% ($10,000 investment minus $450 sales charge = $9,550); for Class B Shares, the maximum contingent deferred sales charge is 5.50% on any redemption less than one year from the purchase date; for Class C Shares, a 1.00% contingent deferred sales charge would be applied on any redemption less than one year from the purchase date; for Class F Shares, the maximum sales charge of 1.00% ($10,000 investment minus $100 sales charge = $9,900) and a contingent deferred sales charge of 1.00% would be applied on any redemption less than three years from the purchase date. The Fund's performance assumes the reinvestment of all dividends and distributions. The Main Index, Blended Index and MHYMFA have been adjusted to reflect reinvestment of dividends on securities in the indexes and the average. |
| 2 | Federated Municipal High Yield Advantage Fund, Inc. (“Predecessor Fund”) was reorganized into Federated Municipal High Yield Advantage Fund (“Fund”), a series of Federated Municipal Securities Income Trust, as of the close of business on November 10, 2006. Prior to the reorganization, the Fund had no investment operations. The Fund is the successor to the Predecessor Fund. The information presented for periods prior to the close of business on November 10, 2006, refers to the performance of the Predecessor Fund, which after the reorganization is the Fund's performance as a result of the reorganization. |
| 3 | The Main Index is a broad, comprehensive, market value-weighted index composed of approximately 55,000 bond issues that are exempt from U.S. federal income taxes or subject to AMT. Eligibility criteria for inclusion in the Main Index include, but are not limited to: the bond issuer must be a state (including the Commonwealth of Puerto Rico and U.S. territories) or a local government or a state or local government entity where interest on the bond is exempt from U.S. federal income taxes or subject to the AMT; the bond must be held by a mutual fund for which Standard & Poor's Securities Evaluations, Inc. provides prices; it must be denominated in U.S. dollars and have a minimum par amount of $2 million; and the bond must have a minimum term to maturity and/or call date greater than or equal to one calendar month. The Main Index is rebalanced monthly. The Main Index is not adjusted to reflect sales charges, expenses and other fees that the Securities and Exchange Commission (SEC) requires to be reflected in the Fund's performance. The Main Index is unmanaged, and, unlike the Fund, is not affected by cash flows. It is not possible to invest directly in an index. |
| 4 | The Blended Index is a custom blended index that represents, by market weighting, 25% of the A-rated and higher component of the Main Index, 25% of the BBB-rated component of the Main Index and 50% of the below investment grade (bonds with ratings of less than BBB-/Baa3) component of the Main Index, all with remaining maturities of three years or more. The Blended Index is not adjusted to reflect sales charges, expenses and other fees that the SEC requires to be reflected in the Fund's performance. The Blended Index is unmanaged, and, unlike the Fund, is not affected by cash flows. It is not possible to invest directly in an index. |
| 5 | Morningstar figures represent the average of the total returns reported by all the mutual funds designated by Morningstar as falling into the respective category indicated. They do not reflect sales charges. |
| 6 | The Fund's Institutional Shares commenced operations on June 11, 2013. For the period prior to the commencement of operations of Institutional Shares, the performance information shown is for the Fund's Class F Shares, adjusted to reflect the expenses of the Fund's Institutional Shares for each year for which the Fund's Institutional Shares expenses would have exceeded the actual expenses paid by the Fund's Class F Shares. |
Annual Shareholder Report
Portfolio of Investments Summary Table (unaudited)
At August 31, 2016, the Fund's sector composition1 was as follows:
| Sector Composition | Percentage of
Total Net Assets |
| Senior Care | 8.9% |
| Education | 8.6% |
| Industrial Development Bond/Pollution Control Revenue Bond | 8.6% |
| Hospital | 7.6% |
| Refunded | 7.1% |
| Water and Sewer | 6.9% |
| Dedicated Tax | 6.8% |
| Incremental Tax | 5.9% |
| Tobacco | 5.7% |
| General Obligation—State | 5.5% |
| Other2 | 27.5% |
| Other Assets and Liabilities—Net3 | 0.9% |
| TOTAL | 100.0% |
| 1 | Sector classifications, and the assignment of holdings to such sectors, are based upon the economic sector and/or revenue source of the underlying obligor, as determined by the Fund's Adviser. For securities that have been enhanced by a third-party guarantor, such as bond insurers and banks, sector classifications are based upon the economic sector and/or revenue source of the underlying obligor, as determined by the Fund's Adviser. |
| 2 | For purposes of this table, sector classifications constitute 71.6% of the Fund's total net assets. Remaining sectors have been aggregated under the designation “Other.” |
| 3 | Assets, other than investments in securities, less liabilities. See Statement of Assets and Liabilities. |
Annual Shareholder Report
Portfolio of Investments
August 31, 2016
Principal
Amount | | | Value |
| | | MUNICIPAL BONDS—98.1% | |
| | | Alabama—1.5% | |
| $2,000,000 | | Alabama State Port Authority, Docks Facilities Revenue Bonds (Series 2010), 6.00% (Original Issue Yield: 6.25%), 10/1/2040 | $2,375,020 |
| 1,500,000 | | Huntsville, AL Special Care Facilities Financing Authority, Retirement Facilities Revenue Bonds (Series 2007), 5.50% (Redstone Village)/(Original Issue Yield: 5.60%), 1/1/2043 | 1,504,725 |
| 500,000 | | Huntsville, AL Special Care Facilities Financing Authority, Retirement Facilities Revenue Bonds (Series 2011A), 7.50% (Redstone Village)/(Original Issue Yield: 7.625%), 1/1/2047 | 566,580 |
| 2,000,000 | | Jefferson County, AL Sewer System, Senior Lien Sewer Revenue Current Interest Warrants (Series 2013-A), 5.50% (AGM INS)/(Original Issue Yield: 5.65%), 10/1/2053 | 2,374,720 |
| 2,000,000 | | Jefferson County, AL Sewer System, Senior Lien Sewer Revenue Current Interest Warrants (Series 2013A), 5.25% (AGM INS), 10/1/2048 | 2,354,160 |
| 835,000 | | Selma, AL IDB, Gulf Opportunity Zone Bonds (Series 2010A), 5.80% (International Paper Co.), 5/1/2034 | 964,233 |
| | | TOTAL | 10,139,438 |
| | | Alaska—0.4% | |
| 1,000,000 | 1,2 | Alaska Industrial Development and Export Authority, Community Provider Revenue Bonds (Series 2007C), 6.00% (Boys & Girls Home & Family Services, Inc.), 12/1/2036 | 109,910 |
| 2,000,000 | 3,4 | Koyukuk, AK, Revenue Bonds (Series 2011), 7.75% (Tanana Chiefs Conference Health Care)/(United States Treasury PRF 10/1/2019@100)/(Original Issue Yield: 8.125%), 10/1/2041 | 2,411,240 |
| | | TOTAL | 2,521,150 |
| | | Arizona—3.2% | |
| 4,000,000 | | Maricopa County, AZ Pollution Control Corp., PCR Refunding Bonds (Series 2003A), 6.25% (Public Service Co., NM), 1/1/2038 | 4,563,880 |
| 1,500,000 | | Maricopa County, AZ Pollution Control Corp., PCR Refunding Bonds (Series 2009A), 7.25% (El Paso Electric Co.), 2/1/2040 | 1,713,660 |
| 1,500,000 | | Phoenix, AZ IDA, Education Facility Revenue Bonds (Series 2014A), 5.00% (Great Heart Academies), 7/1/2044 | 1,680,195 |
| 1,000,000 | | Phoenix, AZ IDA, Education Facility Revenue Bonds (Series 2016A), 5.00% (Great Heart Academies), 7/1/2046 | 1,131,750 |
| 1,385,000 | | Pima County, AZ IDA, PCRBs (Series 2009A), 4.95% (Tucson Electric Power Co.), 10/1/2020 | 1,564,745 |
| 3,570,000 | | Salt River Project, AZ Agricultural Improvement & Power District, Revenue Refunding Bonds (Series 2015A), 5.00%, 12/1/2041 | 4,374,285 |
| 4,955,000 | | Salt Verde Financial Corp., AZ, Senior Gas Revenue Bonds (Series 2007), 5.00% (Citigroup, Inc. GTD), 12/1/2037 | 6,366,977 |
Annual Shareholder Report
Principal
Amount | | | Value |
| | | MUNICIPAL BONDS—continued | |
| | | Arizona—continued | |
| $430,000 | 3,4 | Verrado Community Facilities District No. 1, AZ, District GO Refunding Bonds (Series 2013A), 6.00%, 7/15/2027 | $491,189 |
| | | TOTAL | 21,886,681 |
| | | California—8.5% | |
| 2,000,000 | | California PCFA, Solid Waste Disposal Revenue Refunding Bonds (Series 2015A-3), 4.30% (Waste Management, Inc.), 7/1/2040 | 2,166,440 |
| 750,000 | 3,4 | California School Finance Authority, School Facility Revenue Bonds (Series 2014A), 5.125% (KIPP LA), 7/1/2044 | 850,973 |
| 565,000 | 3,4 | California School Finance Authority, School Facility Revenue Bonds (Series 2015A), 5.00% (KIPP LA), 7/1/2045 | 643,625 |
| 2,750,000 | | California State, Various Purpose UT GO Bonds, 5.00%, 8/1/2035 | 3,398,835 |
| 2,500,000 | | California State, Various Purpose UT GO Bonds, 5.25%, 10/1/2029 | 2,838,150 |
| 2,500,000 | | California State, Various Purpose UT GO Bonds, 6.00% (Original Issue Yield: 6.10%), 4/1/2038 | 2,832,250 |
| 2,250,000 | 3,4 | California Statewide CDA , Revenue Bonds (Series 2016A), 5.25% (Loma Linda University Medical Center ), 12/1/2056 | 2,605,005 |
| 1,045,000 | 3,4 | California Statewide CDA MFH, Revenue Bonds (Series 1999X), 6.65% (Magnolia City Lights Project), 7/1/2029 | 1,046,568 |
| 2,000,000 | | Chula Vista, CA, COPs, 5.50% (United States Treasury PRF 3/1/2020@100)/(Original Issue Yield: 5.88%), 3/1/2033 | 2,329,580 |
| 500,000 | | Corona-Norco USD Community Facilities District No. 98-1, CA, 2013 Special Tax Refunding Bonds, 5.00%, 9/1/2032 | 591,080 |
| 3,000,000 | | Foothill/Eastern Transportation Corridor Agency, CA, Toll Road Revenue Refunding Bonds (Series 2013A), 6.00% (Original Issue Yield: 6.40%), 1/15/2053 | 3,626,460 |
| 500,000 | | Golden State Tobacco Securitization Corp., CA, Enhanced Tobacco Settlement Asset-Backed Bonds (Series 2013A), 5.00% (California State), 6/1/2029 | 606,540 |
| 2,000,000 | | Golden State Tobacco Securitization Corp., CA, Enhanced Tobacco Settlement Asset-Backed Bonds (Series 2015A), 5.00% (California State), 6/1/2045 | 2,423,940 |
| 6,530,000 | | Golden State Tobacco Securitization Corp., CA, Tobacco Settlement Asset-Backed Bonds (Series 2007A-1), 5.75%, 6/1/2047 | 6,673,791 |
| 1,000,000 | | Irvine, CA Community Facilities District No. 2013-3, Special Tax Bonds (Series 2014), 5.00% (Improvement Area No. 1 (Great Park), 9/1/2049 | 1,142,930 |
| 95,000 | | Irvine, CA Reassessment District No. 13-1, LO Improvement Bonds, 5.00%, 9/2/2028 | 112,988 |
| 365,000 | | Irvine, CA Reassessment District No. 13-1, LO Improvement Bonds, 5.00%, 9/2/2029 | 429,182 |
| 180,000 | | Irvine, CA Reassessment District No. 13-1, LO Improvement Bonds, 5.00%, 9/2/2030 | 211,136 |
| 1,000,000 | | Los Angeles, CA Department of Water & Power (Water Works/System), Water System Revenue Bonds (Series 2016A), 5.00%, 7/1/2046 | 1,236,010 |
Annual Shareholder Report
Principal
Amount | | | Value |
| | | MUNICIPAL BONDS—continued | |
| | | California—continued | |
| $1,000,000 | | Los Angeles, CA Harbor Department, Revenue Refunding Bonds (Series 2014A), 5.00%, 8/1/2044 | $1,181,680 |
| 2,500,000 | | M-S-R Energy Authority, CA, Gas Revenue Bonds (Series 2009A), 7.00% (Citigroup, Inc. GTD), 11/1/2034 | 3,823,575 |
| 495,000 | | Poway, CA USDT, Special Tax Bonds (Series 2012), 5.00% (Community Facilities District No. 6 (4S Ranch)), 9/1/2033 | 570,403 |
| 2,000,000 | | Riverside County, CA Redevelopment Agency, Tax Allocation Bonds (Series 2010D), 6.00% (Desert Communities Redevelopment Project Area)/(Original Issue Yield: 6.02%), 10/1/2037 | 2,368,880 |
| 1,500,000 | | Riverside County, CA Redevelopment Agency, Tax Allocation Bonds (Series 2010E), 6.50% (Interstate 215 Corridor Redevelopment Project Area)/(Original Issue Yield: 6.53%), 10/1/2040 | 1,801,065 |
| 349,000 | 1 | San Bernardino County, CA Housing Authority, Subordinated Revenue Bonds, 7.25% (Glen Aire Park & Pacific Palms), 4/15/2042 | 172,455 |
| 1,250,000 | | San Buenaventura, CA, Revenue Bonds (Series 2011), 8.00% (Community Memorial Health System), 12/1/2031 | 1,598,262 |
| 1,000,000 | | San Francisco, CA City & County Redevelopment Finance Agency, Tax Allocation Bonds (Series 2011C), 6.75% (Mission Bay North Redevelopment)/(United States Treasury PRF 2/1/2021@100)/(Original Issue Yield: 6.86%), 8/1/2041 | 1,255,780 |
| 1,280,000 | | San Francisco, CA City & County Redevelopment Financing Agency, Tax Allocation Refunding Bonds (Series 2016A), 5.00% (Mission Bay North Redevelopment )/(National Public Finance Guarantee Corporation INS), 8/1/2041 | 1,586,138 |
| 500,000 | | San Francisco, CA City & County Redevelopment Financing Agency, Tax Allocation Refunding Bonds (Series 2016C), 5.00% (Mission Bay South Redevelopment)/(National Public Finance Guarantee Corporation INS), 8/1/2041 | 620,090 |
| 2,000,000 | | San Jose, CA Airport, Airport Revenue Bonds (Series 2011A-1), 6.25%, 3/1/2034 | 2,407,400 |
| 1,250,000 | | Santa Margarita, CA Water District Community Facilities District No. 2013-1, Special Tax Bonds (Series 2013), 5.625% (Original Issue Yield: 5.70%), 9/1/2043 | 1,469,012 |
| 1,500,000 | | University of California (The Regents of), General Revenue Bonds (Series 2016 AR), 5.00%, 5/15/2046 | 1,866,690 |
| 1,000,000 | | Western Riverside Water & Wastewater Financing Authority, CA, Local Agency Revenue Refunding Bonds (Series 2016A), 5.00%, 9/1/2044 | 1,202,330 |
| | | TOTAL | 57,689,243 |
| | | Colorado—5.0% | |
| 2,000,000 | | Castle Oaks, CO Metropolitan District No. 3, LT GO Bonds (Series 2015), 6.25%, 12/1/2044 | 2,158,360 |
| 825,000 | | Castle Oaks, CO Metropolitan District No. 3, LT GO Completion Bonds (Series 2016), 5.50%, 12/1/2045 | 859,427 |
| 2,000,000 | | Central Platte Valley, CO Metropolitan District, GO Refunding Bonds (Series 2013A), 5.625% (Original Issue Yield: 5.79%), 12/1/2038 | 2,374,080 |
Annual Shareholder Report
Principal
Amount | | | Value |
| | | MUNICIPAL BONDS—continued | |
| | | Colorado—continued | |
| $1,250,000 | | Central Platte Valley, CO Metropolitan District, GO Refunding Bonds (Series 2013A), 6.00%, 12/1/2038 | $1,520,825 |
| 1,000,000 | | Central Platte Valley, CO Metropolitan District, GO Refunding Bonds (Series 2014), 5.00%, 12/1/2043 | 1,077,990 |
| 1,625,000 | | Colorado Educational & Cultural Facilities Authority, Charter School Refunding & Improvement Revenue Bonds (Series 2014), 5.50% (Skyview Academy), 7/1/2049 | 1,785,761 |
| 1,000,000 | 3,4 | Colorado Educational & Cultural Facilities Authority, Charter School Refunding & Improvement Revenue Bonds (Series 2015), 5.00% (University Lab School)/(Original Issue Yield: 5.02%), 12/15/2045 | 1,064,900 |
| 695,000 | | Colorado Educational & Cultural Facilities Authority, Charter School Revenue Bonds (Series 2007A), 5.70% (Windsor Charter Academy)/(Original Issue Yield: 5.70%), 5/1/2037 | 699,003 |
| 765,000 | | Colorado Educational & Cultural Facilities Authority, Charter School Revenue Bonds (Series 2007A), 5.75% (Northeast Academy Charter School)/(United States Treasury PRF 5/15/2017@100), 5/15/2037 | 792,800 |
| 1,000,000 | | Colorado Educational & Cultural Facilities Authority, Charter School Revenue Bonds (Series 2007A), 6.00% (Monument Academy Charter School)/(United States Treasury PRF 10/1/2017@100), 10/1/2037 | 1,058,160 |
| 1,000,000 | 3,4 | Colorado Educational & Cultural Facilities Authority, School Improvement Revenue Bonds (Series 2016), 5.00% (Loveland Classical School), 7/1/2046 | 1,038,710 |
| 800,000 | | Colorado Health Facilities Authority, Health & Residential Care Facilities Revenue Bonds (Series 2007), 5.30% (Volunteers of America Care Facilities), 7/1/2037 | 800,192 |
| 1,100,000 | | Colorado Health Facilities Authority, Revenue Bonds (Series 2010A), 6.25% (Total Long Term Care National Obligated Group)/(United States Treasury PRF 11/15/2020), 11/15/2040 | 1,335,972 |
| 2,000,000 | 2 | Colorado Springs Urban Renewal Authority, Tax Increment Revenue Bonds (Series 2007), 7.00% (University Village Colorado)/(United States Treasury PRF 12/1/2017@100), 12/1/2029 | 2,130,780 |
| 1,500,000 | | Copperleaf Metropolitan District No. 2, CO, LT GO Refunding Bonds (Series 2015), 5.75%, 12/1/2045 | 1,607,535 |
| 435,000 | | Eagle County, CO Air Terminal Corp., Airport Terminal Project Revenue Improvement Bonds (Series 2006B), 5.25%, 5/1/2020 | 436,053 |
| 750,000 | | Eagle County, CO Air Terminal Corp., Revenue Refunding Bonds (Series 2011A), 6.00%, 5/1/2027 | 835,133 |
| 1,250,000 | | Leyden Rock Metropolitan District No. 10, CO, LT GO Refunding & Improvement Bonds (Series 2016A), 5.00%, 12/1/2045 | 1,285,650 |
| 2,000,000 | | Public Authority for Colorado Energy, Natural Gas Purchase Revenue Bonds (Series 2008), 6.25% (Bank of America Corp. GTD)/(Original Issue Yield: 6.63%), 11/15/2028 | 2,677,380 |
| 1,500,000 | | Sierra Ridge Metropolitan District No. 2, LT GO Bonds (Series 2016A), 5.50%, 12/1/2046 | 1,587,480 |
Annual Shareholder Report
Principal
Amount | | | Value |
| | | MUNICIPAL BONDS—continued | |
| | | Colorado—continued | |
| $2,000,000 | | STC Metropolitan District No. 2, CO, LT GO Senior Bonds (Series 2015A), 6.00% (Original Issue Yield: 6.25%), 12/1/2038 | $2,069,180 |
| 1,500,000 | | Sterling Ranch Community Authority Board, CO, LT Supported Revenue Senior Bonds (Series 2015A), 5.75% (Sterling Ranch Metropolitan District No. 2, CO)/(Original Issue Yield: 5.83%), 12/1/2045 | 1,545,885 |
| 1,030,000 | | Tallyn's Reach Metropolitan District No. 3, CO, LT GO Refunding & Improvement Bonds (Series 2013), 5.125%, 11/1/2038 | 1,122,525 |
| 2,000,000 | | Three Springs Metropolitan District No. 3, CO, Property Tax Supported Revenue Bonds (Series 2010), 7.75%, 12/1/2039 | 2,165,880 |
| | | TOTAL | 34,029,661 |
| | | Connecticut—0.4% | |
| 1,000,000 | | Connecticut Development Authority, Airport Facility Revenue Bonds, 7.95% (Bombardier, Inc.), 4/1/2026 | 999,920 |
| 1,835,000 | 3,4 | Mohegan Tribe of Indians of Connecticut Gaming Authority, Priority Distribution Payment Refunding Bonds (Series 2015C), 6.25% (Original Issue Yield: 6.375%), 2/1/2030 | 1,926,328 |
| | | TOTAL | 2,926,248 |
| | | Delaware—0.5% | |
| 1,350,000 | 3,4 | Delaware EDA , Charter School Revenue Bonds (Series 2016A), 5.00% (ASPIRA of Delaware Charter Operations, Inc.), 6/1/2051 | 1,460,295 |
| 1,905,000 | | Delaware EDA, Gas Facilities Refunding Bonds, 5.40% (Delmarva Power and Light Co.), 2/1/2031 | 2,148,268 |
| | | TOTAL | 3,608,563 |
| | | District of Columbia—2.1% | |
| 1,000,000 | | District of Columbia Revenue, Revenue Bonds (Series 2016A), 5.00% (Friendship Public Charter School, Inc.), 6/1/2046 | 1,134,450 |
| 5,000,000 | | District of Columbia Water & Sewer Authority, Green Revenue Bonds (Series 2015A), 5.00%, 10/1/2045 | 6,082,550 |
| 3,000,000 | | District of Columbia Water & Sewer Authority, Public Utility Subordinate Lien Revenue Refunding Bonds (Series 2016A), 5.00%, 10/1/2039 | 3,693,030 |
| 2,000,000 | | District of Columbia, Revenue Bonds (Series 2012A), 5.00% (Friendship Public Charter School, Inc.), 6/1/2042 | 2,225,120 |
| 1,030,000 | | District of Columbia, Revenue Bonds (Series 2013A), 6.00% (KIPP DC), 7/1/2043 | 1,238,905 |
| | | TOTAL | 14,374,055 |
| | | Florida—5.8% | |
| 3,000,000 | | Alachua County, FL, IDRBs (Series 2007A), 5.875% (North Florida Retirement Village, Inc.), 11/15/2042 | 3,056,130 |
| 1,005,000 | | Arborwood, FL Community Development District, Capital Improvement Revenue Bonds (Series 2005A-2), 5.35%, 5/1/2036 | 1,005,653 |
Annual Shareholder Report
Principal
Amount | | | Value |
| | | MUNICIPAL BONDS—continued | |
| | | Florida—continued | |
| $165,000 | | Arborwood, FL Community Development District, Special Assessment Revenue Bonds (Series 2014A-1), 6.90% (Step Coupon 11/1/2016)/(Original Issue Yield: 6.90%), 5/1/2036 | $190,737 |
| 104,232 | 1 | Capital Trust Agency, FL, Housing Revenue Notes, 5.95% (Atlantic Housing Foundation Properties), 1/15/2039 | 2,596 |
| 3,000,000 | 3,4 | Collier County, FL IDA, Continuing Care Community Revenue Bonds (Series 2013A), 8.25% (Arlington of Naples)/(Original Issue Yield: 8.375%), 5/15/2049 | 3,635,010 |
| 1,000,000 | | Florida State Mid-Bay Authority, First Senior Lien Revenue Bonds (Series 2015A), 5.00%, 10/1/2040 | 1,174,470 |
| 1,000,000 | | Lakewood Ranch Stewardship District, FL, Special Assessment Revenue Bonds (Series 2015), 4.875% (Lakewood Centre North)/(Original Issue Yield: 4.96%), 5/1/2045 | 1,053,760 |
| 1,500,000 | | Lakewood Ranch Stewardship District, FL, Special Assessment Revenue Bonds (Series 2016), 5.125% (Villages of Lakewood Ranch South)/(Original Issue Yield: 5.16%), 5/1/2046 | 1,588,545 |
| 2,000,000 | | Lee County, FL IDA, Healthcare Facilities Revenue Refunding Bonds (Series 2012), 6.50% (Cypress Cove at Healthpark), 10/1/2047 | 2,273,900 |
| 2,000,000 | | Martin County, FL Health Facilities Authority, Hospital Revenue Bonds (Series 2012), 5.50% (Martin Memorial Medical Center)/(Original Issue Yield: 5.53%), 11/15/2042 | 2,281,640 |
| 2,000,000 | | Martin County, FL IDA, Industrial Development Revenue Refunding Bonds (Series 2013), 4.20% (Indiantown Cogeneration, L.P.), 12/15/2025 | 2,108,320 |
| 2,000,000 | 3,4 | Miami, FL, SO Non-Ad Valorem Revenue Refunding Bonds (Series 2012), 5.00%, 3/1/2030 | 2,321,680 |
| 1,000,000 | | Miami-Dade County, FL Aviation, Aviation Revenue Refunding Bonds (Series 2014A), 5.00%, 10/1/2036 | 1,165,210 |
| 4,000,000 | | Miami-Dade County, FL Transit System Sales Surtax Revenue Bonds (Series 2012), 5.00%, 7/1/2042 | 4,704,520 |
| 745,000 | | Midtown Miami, FL Community Development District, Special Assessment & Revenue Refunding Bonds (Series 2014A), 5.00% (Original Issue Yield: 5.25%), 5/1/2037 | 805,375 |
| 1,000,000 | | Palm Beach County, FL Health Facilities Authority, Revenue Bonds (Series 2014A), 7.50% (Sinai Residences of Boca Raton)/(Original Issue Yield: 7.625%), 6/1/2049 | 1,239,900 |
| 1,810,000 | 3,4 | Palm Beach County, FL, Tax-Exempt Revenue Bonds (Series 2005A), 6.75% (G-Star School of the Arts for Motion Pictures and Broadcasting Charter School), 5/15/2035 | 1,811,267 |
| 1,405,000 | | Pinellas County, FL Educational Facilities Authority, Revenue Bonds (Series 2011A), 7.125% (Pinellas Preparatory Academy), 9/15/2041 | 1,561,236 |
| 145,000 | 1,2 | Reunion East Community Development District, FL, Special Assessment Bonds (Series 2002A-1), 7.375%, 5/1/2033 | 1 |
| 160,000 | | Reunion East Community Development District, FL, Special Assessment Refunding Bonds (2015-1), 6.60%, 5/1/2033 | 167,718 |
Annual Shareholder Report
Principal
Amount | | | Value |
| | | MUNICIPAL BONDS—continued | |
| | | Florida—continued | |
| $1,000,000 | | South Lake County, FL Hospital District, Revenue Bonds (Series 2009A), 6.25% (South Lake Hospital, Inc.)/(Original Issue Yield: 6.30%), 4/1/2039 | $1,124,790 |
| 10,000 | 1,2 | Tolomato Community Development District, FL, Special Assessment Revenue Bonds (Series 1), 6.55%, 5/1/2027 | 10,204 |
| 1,295,000 | | Tolomato Community Development District, FL, Special Assessment Revenue Bonds (Series 2006), 5.40%, 5/1/2037 | 1,296,567 |
| 290,000 | | Tolomato Community Development District, FL, Special Assessment Revenue Bonds (Series 2015-1), 6.10% (Step Coupon 11/1/2021@6.61%)/(Original Issue Yield: 6.93%), 5/1/2040 | 181,314 |
| 175,000 | | Tolomato Community Development District, FL, Special Assessment Revenue Bonds (Series 2015-2), 6.10% (Step Coupon 11/1/2024@6.61%)/(Original Issue Yield: 6.752%), 5/1/2040 | 92,703 |
| 190,000 | 1,2 | Tolomato Community Development District, FL, Special Assessment Revenue Bonds (Series 2015-3), 6.61%, 5/1/2040 | 2 |
| 155,000 | 1,2 | Tolomato Community Development District, FL, Special Assessment Revenue Bonds (Series 3), 6.55%, 5/1/2027 | 2 |
| 55,000 | | Tolomato Community Development District, FL, Special Assessment Revenue Bonds (Series A-2), 0.00% (Step Coupon 5/1/2017@6.61%), 5/1/2039 | 44,453 |
| 135,000 | | Tolomato Community Development District, FL, Special Assessment Revenue Bonds (Series A-3), 0.00% (Step Coupon 5/1/2019@6.61%), 5/1/2040 | 81,621 |
| 70,000 | | Tolomato Community Development District, FL, Special Assessment Revenue Bonds (Series A-4), 0.00% (Step Coupon 5/1/2022@6.61%), 5/1/2040 | 31,391 |
| 200,000 | | Tolomato Community Development District, FL, Special Assessment Revenue Refunding Bonds (Series A-1), 6.55% (Original Issue Yield: 6.60%), 5/1/2027 | 201,060 |
| 840,000 | | Verandah East, FL Community Development District, Capital Improvement Revenue Bonds (Series 2006A), 5.40%, 5/1/2037 | 840,000 |
| 945,000 | | Verandah West, FL Community Development District, Capital Improvement Revenue Refunding Bonds (Series 2013), 5.00% (Original Issue Yield: 5.125%), 5/1/2033 | 999,545 |
| 2,000,000 | | Willow Walk, FL Community Development District, Special Assessment Bonds (Series 2015), 5.625%, 5/1/2045 | 2,096,920 |
| 420,000 | | Winter Garden Village at Fowler Groves Community Development District, FL, Special Assessment Bonds (Series 2006), 5.65%, 5/1/2037 | 420,655 |
| | | TOTAL | 39,568,895 |
| | | Georgia—1.5% | |
| 4,000,000 | | Atlanta, GA Water & Wastewater, Revenue Bonds (Series 2009A), 6.25% (United States Treasury PRF 11/1/2019@100)/(Original Issue Yield: 6.38%), 11/1/2039 | 4,692,160 |
| 4,000,000 | | Atlanta, GA Water & Wastewater, Revenue Refunding Bonds (Series 2015), 5.00%, 11/1/2040 | 4,861,640 |
Annual Shareholder Report
Principal
Amount | | | Value |
| | | MUNICIPAL BONDS—continued | |
| | | Georgia—continued | |
| $1,000,000 | | Medical Center Hospital Authority, GA, Revenue Refunding Bonds (Series 2007), 5.25% (Spring Harbor at Green Island), 7/1/2037 | $1,014,900 |
| | | TOTAL | 10,568,700 |
| | | Guam—0.8% | |
| 645,000 | | Guam Government Business Privilege Tax, Business Privilege Tax Bonds (Series 2012B), 5.00%, 1/1/2037 | 706,785 |
| 1,000,000 | | Guam Government LO (Section 30), Revenue Refunding Bonds (Series 2016A), 5.00%, 12/1/2046 | 1,188,920 |
| 500,000 | | Guam Government LO (Section 30), Bonds (Series 2009A), 5.75% (United States Treasury PRF 12/1/2019@100)/(Original Issue Yield: 6.00%), 12/1/2034 | 578,505 |
| 1,000,000 | | Guam Government, UT GO Bonds (Series 2007A), 5.25% (United States Treasury PRF 11/15/2017@100)/(Original Issue Yield: 5.45%), 11/15/2037 | 1,055,670 |
| 1,000,000 | | Guam International Airport Authority, General Revenue Bonds (Series 2013C), 6.125% (AGM INS)/(Original Issue Yield: 6.23%), 10/1/2043 | 1,212,980 |
| 500,000 | | Guam Power Authority, Revenue Bonds (Series 2012A), 5.00%, 10/1/2034 | 556,390 |
| | | TOTAL | 5,299,250 |
| | | Hawaii—0.8% | |
| 3,660,000 | | Hawaii State Department of Budget & Finance, Special Purpose Revenue Bonds (Series 2009), 6.50% (Hawaiian Electric Co., Inc.), 7/1/2039 | 4,141,034 |
| 1,000,000 | | Hawaii State Department of Budget & Finance, Special Purpose Senior Living Revenue Bonds (Series A), 9.00% (15 Craigside)/(Original Issue Yield: 9.15%), 11/15/2044 | 1,214,610 |
| | | TOTAL | 5,355,644 |
| | | Idaho—0.4% | |
| 2,500,000 | | Idaho Health Facilities Authority, Revenue Bonds (Series 2013A), 8.125% (Terraces of Boise)/(Original Issue Yield: 8.25%), 10/1/2049 | 2,830,175 |
| | | Illinois—6.6% | |
| 500,000 | | Chicago, IL Motor Fuel Tax, Motor Fuel Tax Revenue Refunding Bonds (Series 2013), 5.00% (AGM INS), 1/1/2033 | 565,020 |
| 1,750,000 | | Chicago, IL O'Hare International Airport, General Airport Third Lien Revenue Bonds (Series 2011A), 5.75% (Original Issue Yield: 5.94%), 1/1/2039 | 2,046,432 |
| 2,500,000 | | Chicago, IL O'Hare International Airport, General Airport Third Lien Revenue Bonds (Series 2011C), 6.50%, 1/1/2041 | 3,033,025 |
| 1,000,000 | | Chicago, IL Sales Tax, Revenue Refunding Bonds (Series 2002), 5.00%, 1/1/2032 | 1,109,850 |
| 1,250,000 | | Chicago, IL Water Revenue, Second Lien Water Revenue Bonds (Series 2014), 5.00%, 11/1/2044 | 1,433,738 |
Annual Shareholder Report
Principal
Amount | | | Value |
| | | MUNICIPAL BONDS—continued | |
| | | Illinois—continued | |
| $1,500,000 | | Chicago, IL, Project & Refunding UT GO Bonds (Series 2005D), 5.50% (Original Issue Yield: 5.81%), 1/1/2040 | $1,571,310 |
| 2,000,000 | | Chicago, IL, Refunding UT GO Bonds (Series 2016C), 5.00%, 1/1/2038 | 2,034,200 |
| 3,000,000 | | Chicago, IL, UT GO Bonds (Series 2009C), 5.00% (Original Issue Yield: 5.16%), 1/1/2034 | 3,038,670 |
| 415,000 | | DuPage County, IL, Special Tax Bonds (Series 2006), 5.625% (Naperville Campus LLC), 3/1/2036 | 417,797 |
| 1,500,000 | | Illinois Finance Authority, Charter School Refunding & Improvement Revenue Bonds (Series 2011A), 7.125% (Uno Charter School Network, Inc.), 10/1/2041 | 1,713,630 |
| 1,250,000 | | Illinois Finance Authority, Education Revenue Bonds (Series 2015), 5.00% (Noble Network of Charter Schools), 9/1/2032 | 1,391,838 |
| 1,100,000 | | Illinois Finance Authority, Educational Facility Revenue, Senior Revenue Bonds (Series 2014A), 6.125% (Rogers Park Montessori School Project), 2/1/2045 | 1,193,566 |
| 900,000 | | Illinois Finance Authority, MFH Revenue Bonds (Series 2007), 6.10% (Dekalb Supportive Living Facility), 12/1/2041 | 925,065 |
| 1,000,000 | | Illinois Finance Authority, Revenue Bonds (Series 2005A), 5.625% (Friendship Village of Schaumburg)/(Original Issue Yield: 5.70%), 2/15/2037 | 1,000,570 |
| 1,000,000 | | Illinois Finance Authority, Revenue Bonds (Series 2010), 7.25% (Friendship Village of Schaumburg)/(Original Issue Yield: 7.375%), 2/15/2045 | 1,080,100 |
| 1,000,000 | | Illinois Finance Authority, Revenue Bonds (Series 2015A), 5.00% (Rush University Medical Center Obligated Group), 11/15/2038 | 1,188,430 |
| 2,250,000 | | Illinois State, UT GO Bonds (Series 2006), 5.00%, 1/1/2027 | 2,259,742 |
| 2,000,000 | | Illinois State, UT GO Bonds (Series 2013A), 5.00%, 4/1/2035 | 2,163,980 |
| 1,000,000 | | Illinois State, UT GO Bonds (Series February 2014), 5.00% (Original Issue Yield: 5.04%), 2/1/2039 | 1,084,970 |
| 2,025,000 | | Illinois State, UT GO Bonds (Series June 2013), 5.50% (Original Issue Yield: 5.65%), 7/1/2038 | 2,282,256 |
| 2,000,000 | | Illinois State, UT GO Bonds (Series May 2014), 5.00%, 5/1/2039 | 2,174,860 |
| 1,410,000 | | Illinois State, UT GO Refunding Bonds (Series May 2012), 5.00%, 8/1/2025 | 1,570,162 |
| 2,000,000 | | Metropolitan Pier & Exposition Authority, IL, McCormick Place Expansion Project Bonds (Series 2015A), 5.50%, 6/15/2053 | 2,349,340 |
| 1,000,000 | | Quad Cities, IL Regional EDA, MFH Revenue Bonds (Series 2006), 6.00% (Heritage Woods of Moline SLF), 12/1/2041 | 1,022,270 |
| 1,600,000 | | Railsplitter Tobacco Settlement Authority, IL, Tobacco Settlement Revenue Bonds (Series 2010), 6.00% (Original Issue Yield: 6.10%), 6/1/2028 | 1,914,656 |
| 2,000,000 | | Southwestern, IL Development Authority, Health Facility Revenue Bonds (Series 2013), 7.625% (Memorial Group, Inc.)/(Original Issue Yield: 7.95%), 11/1/2048 | 2,789,380 |
Annual Shareholder Report
Principal
Amount | | | Value |
| | | MUNICIPAL BONDS—continued | |
| | | Illinois—continued | |
| $1,500,000 | | Will-Kankakee, IL Regional Development Authority, MFH Revenue Bonds (Series 2007), 7.00% (Senior Estates Supportive Living), 12/1/2042 | $1,567,695 |
| | | TOTAL | 44,922,552 |
| | | Indiana—2.3% | |
| 1,250,000 | | Carmel, IN, Revenue Bonds (Series 2012A), 7.125% (Barrington of Carmel)/(Original Issue Yield: 7.20%), 11/15/2042 | 1,428,012 |
| 1,000,000 | | Carmel, IN, Revenue Bonds (Series 2012A), 7.125% (Barrington of Carmel)/(Original Issue Yield: 7.30%), 11/15/2047 | 1,139,500 |
| 2,000,000 | | Indiana Municipal Power Agency, Power Supply System Refunding Revenue Bonds (Series 2016C), 5.00%, 1/1/2037 | 2,433,440 |
| 4,000,000 | | Indiana State Finance Authority, Tax-Exempt Private Activity Bonds (Series 2013), 5.25% (Ohio River Bridges East End Crossing), 1/1/2051 | 4,510,000 |
| 1,000,000 | | Jasper County, IN, PCR Refunding Bonds (Series 2003), 5.70% (Northern Indiana Public Service Company)/(AMBAC Financial Group, Inc. INS), 7/1/2017 | 1,039,060 |
| 2,000,000 | | Rockport, IN, Revenue Refunding Bonds (Series 2012-A), 7.00% (AK Steel Corp.), 6/1/2028 | 1,690,600 |
| 2,000,000 | | Vigo County, IN Hospital Authority, Hospital Revenue Bond (Series 2007), 5.80% (Union Hospital)/(Original Issue Yield: 5.82%), 9/1/2047 | 2,050,880 |
| 1,000,000 | | Whiting, IN Environmental Facilities, Revenue Bonds (Series 2016A), 5.00% TOBs (BP PLC), 3/1/2023 | 1,189,150 |
| | | TOTAL | 15,480,642 |
| | | Iowa—1.5% | |
| 3,000,000 | | Iowa Finance Authority, Midwestern Disaster Area Revenue Bonds (Series 2013), 5.25% (Iowa Fertilizer Co.)/(Original Issue Yield: 5.30%), 12/1/2025 | 3,231,240 |
| 1,000,000 | | Iowa Finance Authority, Midwestern Disaster Area Revenue Bonds (Series 2013), 5.50% (Iowa Fertilizer Co.), 12/1/2022 | 1,035,440 |
| 994,700 | | Iowa Finance Authority, Senior Living Facility Revenue Refunding Bonds (Series 2014A), 2.70% (Deerfield Retirement Community, Inc.), 11/15/2046 | 842,352 |
| 186,592 | 1,2 | Iowa Finance Authority, Senior Living Facility Revenue Refunding Bonds (Series 2014B), 2.00% (Deerfield Retirement Community, Inc.), 5/15/2056 | 149 |
| 3,750,000 | | Tobacco Settlement Authority, IA, Tobacco Settlement Asset-Backed Bonds (Series 2005C), 5.50% (Original Issue Yield: 5.78%), 6/1/2042 | 3,750,112 |
| 1,060,000 | | Xenia Rural Water District, Water Revenue Refunding Capital Loan Notes (Series 2016), 5.00%, 12/1/2041 | 1,240,518 |
| | | TOTAL | 10,099,811 |
Annual Shareholder Report
Principal
Amount | | | Value |
| | | MUNICIPAL BONDS—continued | |
| | | Kansas—1.1% | |
| $2,000,000 | | Kansas State Development Finance Authority, Revenue Bonds, 5.75% (Adventist Health System/Sunbelt Obligated Group)/(Original Issue Yield: 5.95%), 11/15/2038 | $2,297,560 |
| 1,000,000 | | Manhattan, KS IDRBs, Industrial Revenue Bonds (Series 2007), 5.50% (Farrar Corp. Project)/(Original Issue Yield: 5.55%), 8/1/2021 | 994,010 |
| 2,015,000 | | Norwich, KS, Industrial Revenue Bonds (Series 2006), 5.90% (Farrar Corp. Project), 8/1/2021 | 2,015,726 |
| 2,000,000 | | Olathe, KS, Senior Living Facility Revenue Bonds (Series 2006A), 6.00% (Catholic Care Campus, Inc.)/(United States Treasury PRF 11/15/2016@100), 11/15/2038 | 2,005,860 |
| 20,000 | | Sedgwick & Shawnee Counties, KS, SFM Revenue Bonds (Series 1997A-1), 6.95% (GNMA Home Mortgage Program COL), 6/1/2029 | 20,978 |
| | | TOTAL | 7,334,134 |
| | | Kentucky—0.2% | |
| 1,250,000 | | Kentucky EDFA, Revenue Bonds (Series 2011A), 7.375% (Miralea)/(Original Issue Yield: 7.40%), 5/15/2046 | 1,467,562 |
| | | Louisiana—2.2% | |
| 1,500,000 | | Jefferson Parish, LA Hospital Service District No. 1, Hospital Revenue Refunding Bonds (Series 2011A), 6.00% (West Jefferson Medical Center)/(United States Treasury PRF 1/1/2021@100)/(Original Issue Yield: 6.05%), 1/1/2039 | 1,819,395 |
| 1,000,000 | | Louisiana Public Facilities Authority, Refunding Revenue Bonds (Series 2016), 5.00% (Ochsner Clinic Foundation), 5/15/2047 | 1,189,080 |
| 2,000,000 | | Louisiana Public Facilities Authority, Refunding Revenue Bonds (Series 2016B), 3.50% (Entergy Louisiana LLC)/(Original Issue Yield: 3.60%), 6/1/2030 | 2,099,420 |
| 1,000,000 | | Louisiana Public Facilities Authority, Revenue Bonds (Series 2011), 6.50% (Ochsner Clinic Foundation)/(United States Treasury PRF 5/15/2021@100)/(Original Issue Yield: 6.65%), 5/15/2037 | 1,256,530 |
| 2,000,000 | | Louisiana State Citizens Property Insurance Corp., Assessment Revenue Bonds (Series 2006C), 6.125% (United States Treasury PRF 6/1/2018@100)/(Original Issue Yield: 6.33%), 6/1/2025 | 2,190,460 |
| 2,000,000 | | Louisiana State, UT GO Refunding Bonds (Series 2016-B), 5.00%, 8/1/2028 | 2,518,460 |
| 2,000,000 | | New Orleans, LA Aviation Board, General Airport Revenue Bonds (Series 2015B), 5.00%, 1/1/2045 | 2,316,880 |
| 1,500,000 | | Tobacco Settlement Financing Corp., LA, Tobacco Settlement Asset-Backed Refunding Bonds (Series 2013A), 5.25%, 5/15/2035 | 1,711,380 |
| | | TOTAL | 15,101,605 |
| | | Maine—0.4% | |
| 1,335,000 | | Maine Health & Higher Educational Facilities Authority, Revenue Bonds (Series 2011), 7.50% (Maine General Medical Center), 7/1/2032 | 1,600,024 |
Annual Shareholder Report
Principal
Amount | | | Value |
| | | MUNICIPAL BONDS—continued | |
| | | Maine—continued | |
| $1,000,000 | | Maine Health & Higher Educational Facilities Authority, Revenue Bonds (Series 2016A), 5.00% (Eastern Maine Healthcare Systems Obligated Group), 7/1/2046 | $1,163,630 |
| | | TOTAL | 2,763,654 |
| | | Maryland—1.4% | |
| 2,000,000 | | Frederick County, MD, Tax Increment & Special Tax B LO Bonds (Series 2013B), 7.125% (Jefferson Technology Park)/(Original Issue Yield: 7.30%), 7/1/2043 | 2,300,540 |
| 1,060,000 | | Maryland State EDC, Port Facilities Revenue Refunding Bonds (Series 2010), 5.75% (CONSOL Energy, Inc.), 9/1/2025 | 1,080,660 |
| 1,000,000 | | Maryland State EDC, Private Activity Revenue Bonds (Series 2016D Green Bonds), 5.00% (Purple Line Transit Partners LLC), 3/31/2051 | 1,189,160 |
| 2,385,000 | | Maryland State EDC, Revenue Bonds (Series B), 5.75% (Ports America Chesapeake, Inc.)/(Original Issue Yield: 5.875%), 6/1/2035 | 2,665,261 |
| 1,000,000 | | Prince Georges County, MD Revenue Authority, SO Bonds (Series 2016), 5.00% (Suitland-Naylor Road Project), 7/1/2046 | 1,051,720 |
| 1,000,000 | | Westminster, MD, Revenue Bonds (Series 2014A), 6.25% (Lutheran Village at Miller's Grant, Inc.)/(Original Issue Yield: 6.30%), 7/1/2044 | 1,144,180 |
| | | TOTAL | 9,431,521 |
| | | Massachusetts—0.8% | |
| 2,500,000 | | Commonwealth of Massachusetts, UT GO Bonds (Consolidated Loan of 2016 Series A), 5.00%, 3/1/2046 | 2,998,750 |
| 2,000,000 | | Massachusetts Development Finance Agency, Revenue Bonds (Series 2011I), 7.25% (Tufts Medical Center), 1/1/2032 | 2,443,940 |
| | | TOTAL | 5,442,690 |
| | | Michigan—4.2% | |
| 1,000,000 | | Dearborn, MI EDC, Revenue Refunding Bonds, 7.125% (Henry Ford Village)/(Original Issue Yield: 7.25%), 11/15/2043 | 1,024,550 |
| 1,000,000 | | Detroit, MI City School District, School Building & Site Improvement Refunding Bonds (Series 2012A), 5.00% (Q-SBLF GTD), 5/1/2028 | 1,149,150 |
| 1,000,000 | | Detroit, MI City School District, School Building & Site Improvement Refunding Bonds (Series 2012A), 5.00% (Q-SBLF GTD), 5/1/2031 | 1,140,370 |
| 1,500,000 | | Detroit, MI Sewage Disposal System, Revenue Refunding Senior Lien Bonds (Series 2012A), 5.25% (Original Issue Yield: 5.30%), 7/1/2039 | 1,718,175 |
| 4,000,000 | | Detroit, MI Water Supply System, Second Lien Revenue Refunding Bonds (Series 2006C), 5.00% (AGM INS), 7/1/2033 | 4,015,840 |
| 2,500,000 | | Kent Hospital Finance Authority, MI, Revenue Bonds (Series 2005A), 6.25% (Metropolitan Hospital), 7/1/2040 | 2,506,850 |
| 500,000 | | Michigan State Building Authority, Facilities Program Revenue Refunding Bonds (Series 2016I), 5.00%, 10/15/2051 | 602,695 |
Annual Shareholder Report
Principal
Amount | | | Value |
| | | MUNICIPAL BONDS—continued | |
| | | Michigan—continued | |
| $2,000,000 | | Michigan State Finance Authority Revenue, Local Government Loan Program Revenue Bonds (Series 2014B), 5.00% (Public Lighting Authority), 7/1/2044 | $2,278,820 |
| 1,900,000 | | Michigan State Finance Authority Revenue, Senior Lien Revenue Bonds (Series 2014 C-5), 5.00% (Detroit, MI Sewage Disposal System)/(National Public Finance Guarantee Corp. INS), 7/1/2020 | 2,165,848 |
| 1,000,000 | | Michigan State Finance Authority Revenue, Senior Lien Revenue Bonds (Series 2014 C-7), 5.00% (Detroit, MI Sewage Disposal System)/(National Public Finance Guarantee Corp. INS), 7/1/2032 | 1,178,380 |
| 1,000,000 | | Michigan State Finance Authority Revenue, Senior Lien Revenue Bonds (Series 2014 D-6), 5.00% (Detroit, MI Water Supply System)/(National Public Finance Guarantee Corp. INS), 7/1/2036 | 1,162,910 |
| 5,000,000 | | Michigan Tobacco Settlement Finance Authority, Tobacco Settlement Asset-Backed Bonds (Series 2007A), 6.00% (Original Issue Yield: 6.25%), 6/1/2048 | 5,030,500 |
| 1,500,000 | | Plymouth, MI Educational Center Charter School, Public School Academy Revenue Refunding Bonds, Series 2005, 5.625%, 11/1/2035 | 1,102,095 |
| 1,000,000 | | Romeo, MI Community School District, 2016 School Building & Site UT GO Bonds (Series 1), 5.00% (Q-SBLF GTD), 5/1/2041 | 1,197,330 |
| 1,000,000 | | University of Michigan (The Regents of), General Revenue Bonds (Series 2015), 5.00%, 4/1/2040 | 1,245,620 |
| 1,000,000 | | Warren, MI Consolidated School District, 2016 School Building & Site UT GO Bonds, 5.00% (Q-SBLF INS), 5/1/2036 | 1,203,940 |
| | | TOTAL | 28,723,073 |
| | | Minnesota—2.2% | |
| 750,000 | | Baytown Township, MN, Charter School Lease Revenue Refunding Bonds (Series 2016A), 4.00% (St. Croix Preparatory Academy), 8/1/2041 | 746,460 |
| 1,100,000 | | Baytown Township, MN, Charter School Lease Revenue Refunding Bonds (Series 2016A), 4.25% (St. Croix Preparatory Academy), 8/1/2046 | 1,114,201 |
| 2,000,000 | | Baytown Township, MN, Lease Revenue Bonds (Series 2008A), 7.00% (St. Croix Preparatory Academy)/(Original Issue Yield: 7.05%), 8/1/2038 | 2,045,040 |
| 2,000,000 | | Duluth, MN EDA, Health Care Facilities Revenue Bonds (Series 2012), 6.00% (St. Luke's Hospital of Duluth Obligated Group), 6/15/2039 | 2,290,260 |
| 1,700,000 | | Forest Lake, MN, Charter School Lease Revenue Bonds (Series 2014A), 5.75% (Lakes International Language Academy), 8/1/2044 | 1,884,773 |
| 2,000,000 | | St. Cloud, MN Charter School, Lease Revenue Bonds (Series 2016A), 5.00% (Stride Academy), 4/1/2046 | 2,044,440 |
| 2,000,000 | | St. Paul and Ramsey County, MN Housing and Redevelopment Authority, Charter School Lease Revenue Bonds (Series 2015A), 5.375% (Twin Cities Academy), 7/1/2050 | 2,108,380 |
Annual Shareholder Report
Principal
Amount | | | Value |
| | | MUNICIPAL BONDS—continued | |
| | | Minnesota—continued | |
| $500,000 | | St. Paul, MN Housing & Redevelopment Authority, Tax Increment Revenue Refunding Bonds (Series 2012), 5.00% (Upper Landing Project), 9/1/2026 | $535,590 |
| 930,000 | | St. Paul, MN Housing & Redevelopment Authority, Tax Increment Revenue Refunding Bonds (Series 2012), 5.00% (Upper Landing Project), 3/1/2029 | 991,417 |
| 325,000 | | Winona, MN Port Authority, Lease Revenue Bonds (Series 2016A), 4.50% (Bluffview Montessori School Project), 6/1/2036 | 327,945 |
| 750,000 | | Winona, MN Port Authority, Lease Revenue Bonds (Series 2016A), 4.75% (Bluffview Montessori School Project), 6/1/2046 | 756,727 |
| | | TOTAL | 14,845,233 |
| | | Mississippi—0.2% | |
| 945,000 | | Warren County, MS Gulf Opportunity Zone, Gulf Opportunity Zone Bonds (Series 2011A), 5.375% (International Paper Co.), 12/1/2035 | 1,059,071 |
| | | Missouri—0.8% | |
| 1,000,000 | | Kirkwood, MO IDA, Retirement Community Revenue Bonds (Series 2010A), 8.25% (Aberdeen Heights Project)/(Original Issue Yield: 8.40%), 5/15/2039 | 1,133,320 |
| 3,000,000 | | Kirkwood, MO IDA, Retirement Community Revenue Bonds (Series 2010A), 8.25% (Aberdeen Heights Project)/(Original Issue Yield: 8.50%), 5/15/2045 | 3,388,560 |
| 1,000,000 | | St. Joseph, MO IDA, Healthcare Revenue Bonds, 7.00% (Living Community St. Joseph Project), 8/15/2032 | 1,001,930 |
| | | TOTAL | 5,523,810 |
| | | Nebraska—0.4% | |
| 2,500,000 | | Central Plains Energy Project, NE, Gas Project Revenue Bonds (Project No. 3) (Series 2012), 5.25% (Goldman Sachs Group, Inc. GTD), 9/1/2037 | 2,864,350 |
| | | Nevada—1.0% | |
| 4,000,000 | | Clark County, NV School District, LT GO Building Bonds (Series 2008A), 5.00% (United States Treasury PRF 6/15/2018@100), 6/15/2025 | 4,311,440 |
| 1,500,000 | | Las Vegas, NV Redevelopment Agency, Tax Increment Revenue Refunding Bonds (Series 2016), 5.00%, 6/15/2045 | 1,766,715 |
| 1,000,000 | | Las Vegas, NV, Local Improvement Bonds (Series 2015), 5.00% (Summerlin Village 24 SID No. 812), 12/1/2035 | 1,063,100 |
| | | TOTAL | 7,141,255 |
| | | New Jersey—2.5% | |
| 1,000,000 | | Essex County, NJ Improvement Authority, Solid Waste Disposal Revenue Bonds (Series 2015), 5.25% (Covanta Energy Corp.), 7/1/2045 | 1,045,410 |
| 1,000,000 | | New Jersey EDA, Energy Facility Revenue Bonds (Series 2012A), 5.125% (UMM Energy Partners LLC)/(Original Issue Yield: 5.19%), 6/15/2043 | 1,073,050 |
Annual Shareholder Report
Principal
Amount | | | Value |
| | | MUNICIPAL BONDS—continued | |
| | | New Jersey—continued | |
| $650,000 | | New Jersey EDA, Kapkowski Road Landfill Revenue Bonds, 6.50% (New Jersey Metromall Urban Renewal, Inc.)/(Original Issue Yield: 6.55%), 4/1/2018 | $688,545 |
| 3,000,000 | | New Jersey EDA, School Facilites Construction Revenue Refunding Bonds (Series 2013NN), 5.00% (New Jersey State), 3/1/2030 | 3,340,710 |
| 3,255,000 | | New Jersey EDA, School Facilities Construction Bonds (Series 2015WW), 5.25% (New Jersey State), 6/15/2040 | 3,759,851 |
| 2,500,000 | | New Jersey EDA, Special Facility Revenue Bonds (Series 1999), 5.25% (United Airlines, Inc.), 9/15/2029 | 2,797,150 |
| 1,125,000 | | New Jersey EDA, Special Facility Revenue Bonds (Series 2000B), 5.625% (United Airlines, Inc.), 11/15/2030 | 1,307,441 |
| 1,500,000 | | New Jersey EDA, Special Facility Revenue Bonds (Series 2003), 5.50% (United Airlines, Inc.), 6/1/2033 | 1,709,565 |
| 1,200,000 | | New Jersey State Transportation Trust Fund Authority, Transportation System Bonds (Series 2011A), 6.00% (New Jersey State), 6/15/2035 | 1,391,340 |
| | | TOTAL | 17,113,062 |
| | | New Mexico—0.8% | |
| 1,995,000 | | Dona Ana County, NM, MFH Revenue Bonds (Series 2001A), 7.00% (Montana Meadows Apartments), 12/1/2030 | 1,998,112 |
| 1,000,000 | | New Mexico State Hospital Equipment Loan Council, Hospital Improvement and Revenue Refunding Bonds (Series 2012A), 5.50% (Gerald Champion Regional Medical Center)/(Original Issue Yield: 5.70%), 7/1/2042 | 1,124,290 |
| 2,000,000 | 3,4 | Winrock Town Center, NM Tax Increment Development District 1, Senior Lien Gross Receipts Tax Increment Bonds (Series 2015), 6.00% (Original Issue Yield: 6.12%), 5/1/2040 | 2,143,140 |
| | | TOTAL | 5,265,542 |
| | | New York—7.7% | |
| 1,495,000 | | Brooklyn Arena Local Development Corp., NY, PILOTs Revenue Bonds (Series 2009), 6.375% (United States Treasury PRF 7/15/2020@100)/(Original Issue Yield: 6.476%), 7/15/2043 | 1,773,175 |
| 1,000,000 | | Brooklyn Arena Local Development Corporation, NY, PILOTs Revenue Refunding Bonds (Series 2016A), 5.00%, 7/15/2042 | 1,212,180 |
| 1,000,000 | 3,4 | Build NYC Resource Corporation, Revenue Bonds (Series 2015), 5.50% (Albert Einstein School of Medicine, Inc.), 9/1/2045 | 1,199,400 |
| 1,285,000 | | Hudson Yards Infrastructure Corp. NY, Hudson Yards Senior Revenue Bonds (Series 2012A), 5.75%, 2/15/2047 | 1,514,963 |
| 2,000,000 | | Metropolitan Transportation Authority, NY, Revenue Bonds (Series 2014D-1), 5.00% (MTA Transportation Revenue), 11/15/2039 | 2,428,300 |
| 5,405,000 | | Metropolitan Transportation Authority, NY, Revenue Bonds (Series 2015A), 5.00% (MTA Transportation Revenue), 11/15/2045 | 6,502,918 |
| 1,500,000 | | Nassau County, NY IDA, Continuing Care Retirement Community Fixed Rate Revenue Bonds (Series 2014A), 6.70% (Amsterdam at Harborside), 1/1/2049 | 1,507,560 |
Annual Shareholder Report
Principal
Amount | | | Value |
| | | MUNICIPAL BONDS—continued | |
| | | New York—continued | |
| $559,206 | | Nassau County, NY IDA, Continuing Care Retirement Community Fixed Rate Revenue Bonds (Series 2014C), 2.00% (Amsterdam at Harborside), 1/1/2049 | $69,761 |
| 1,400,000 | | New York City, NY TFA , Future Tax Secured Subordinate Bonds (Fiscal 2017 Subseries A-1), 4.00%, 5/1/2042 | 1,574,188 |
| 2,500,000 | | New York City, NY TFA, Building Aid Revenue Bonds (Fiscal 2015 Series S-1), 5.00%, 7/15/2043 | 3,011,325 |
| 5,000,000 | | New York City, NY, LT GO Bonds (Series 2017 A-1), 4.00%, 8/1/2039 | 5,631,650 |
| 2,000,000 | 3,4 | New York Liberty Development Corp., Revenue Bonds (Series 2014 Class 1), 5.00% (3 World Trade Center), 11/15/2044 | 2,318,900 |
| 1,000,000 | 3,4 | New York Liberty Development Corp., Revenue Bonds (Series 2014 Class 2), 5.375% (3 World Trade Center), 11/15/2040 | 1,193,960 |
| 3,000,000 | | New York Transportation Development Corporation, Special Facilities Bonds (Series 2016A), 5.25% (Laguardia Airport Terminal B Redevelopment ), 1/1/2050 | 3,509,040 |
| 2,900,000 | | New York Transportation Development Corporation, Special Facility Revenue Refunding Bonds (Series 2016), 5.00% (American Airlines, Inc.), 8/1/2031 | 3,188,289 |
| 1,120,000 | | Newburgh, NY, UT GO Bonds (Series 2012A), 5.25% (Original Issue Yield: 5.40%), 6/15/2029 | 1,244,611 |
| 1,185,000 | | Newburgh, NY, UT GO Bonds (Series 2012A), 5.50%, 6/15/2030 | 1,318,656 |
| 1,000,000 | | Niagara Area Development Corp., NY, Solid Waste Disposal Facility Revenue Refunding Bonds (Series 2012A), 5.25% (Covanta Energy Corp.), 11/1/2042 | 1,021,400 |
| 1,000,000 | | Onondaga, NY Civic Development Corp., Tax Exempt Revenue Bonds (Series 2014A), 5.125% (St. Joseph's Hospital Health Center)/(Original Issue Yield: 5.375%)/(United States Treasury PRF 7/1/2019@100), 7/1/2031 | 1,124,820 |
| 2,500,000 | | Port Authority of New York and New Jersey, Special Project Bonds (Series 8), 6.00% (JFK International Air Terminal LLC)/(Original Issue Yield: 6.15%), 12/1/2042 | 2,933,275 |
| 3,000,000 | | Triborough Bridge & Tunnel Authority, NY, General Revenue Bonds (Series 2016A), 5.00%, 11/15/2046 | 3,703,830 |
| 4,700,000 | | TSASC, Inc. NY, Tobacco Settlement Asset-Backed Bonds (Series 2006-1), 5.125% (Original Issue Yield: 5.35%), 6/1/2042 | 4,659,110 |
| | | TOTAL | 52,641,311 |
| | | North Carolina—0.5% | |
| 2,250,000 | | North Carolina Department of Transportation, Tax-Exempt Private Activity Revenue Bonds (Series 2015), 5.00% (I-77 HOT Lanes), 6/30/2054 | 2,522,610 |
| 1,000,000 | | North Carolina Medical Care Commission, Retirement Facilities First Mortgage Revenue Bonds (Series 2011A), 7.75% (Whitestone Project)/(Original Issue Yield: 8.00%), 3/1/2041 | 1,155,040 |
| | | TOTAL | 3,677,650 |
Annual Shareholder Report
Principal
Amount | | | Value |
| | | MUNICIPAL BONDS—continued | |
| | | Ohio—4.0% | |
| $2,000,000 | | Akron, Bath & Copley, OH Joint Township Hospital District, Hospital Facilities Revenue Bonds (Series 2012), 5.00% (Akron General Health System)/(United States Treasury PRF 1/1/2022@100), 1/1/2031 | $2,385,760 |
| 1,000,000 | | American Municipal Power-Ohio, Inc., Revenue Refunding Bonds (Series 2015A), 5.00% (American Municipal Power, Prairie State Energy Campus Project), 2/15/2039 | 1,181,000 |
| 2,000,000 | | Buckeye Tobacco Settlement Financing Authority, OH, Tobacco Settlement Asset-Backed Bonds (Series 2007A-2), 5.875% (Original Issue Yield: 5.95%), 6/1/2030 | 1,987,680 |
| 3,655,000 | | Buckeye Tobacco Settlement Financing Authority, OH, Tobacco Settlement Asset-Backed Bonds (Series A-2), 6.50%, 6/1/2047 | 3,750,578 |
| 1,500,000 | | Hamilton County, OH, Healthcare Revenue Bonds (Series 2011A), 6.625% (Life Enriching Communities)/(Original Issue Yield: 6.75%), 1/1/2046 | 1,746,855 |
| 2,000,000 | | Muskingum County, OH, Hospital Facilities Revenue Bonds (Series 2013), 5.00% (Genesis Healthcare Corp.)/(Original Issue Yield: 5.08%), 2/15/2044 | 2,176,800 |
| 4,000,000 | | Northeast OH Regional Sewer District, Wastewater Improvement Revenue & Refunding Bonds (Series 2014), 5.00%, 11/15/2044 | 4,843,200 |
| 2,910,000 | | Ohio State Air Quality Development Authority, Revenue Bonds (Series 2009A), 5.70% (FirstEnergy Solutions Corp.), 8/1/2020 | 2,953,621 |
| 2,355,000 | | Ohio State Higher Educational Facility Commission, Hospital Facilities Revenue Bonds (Series 2010), 5.75% (Summa Health System)/(Original Issue Yield: 5.92%), 11/15/2040 | 2,651,754 |
| 1,125,000 | | Ohio State Hospital Revenue, Hospital Revenue Bonds (Series 2016A), 5.00% (University Hospitals Health System, Inc.), 1/15/2041 | 1,347,232 |
| 1,000,000 | | Ohio State Treasurer Private Activity, Revenue Bonds (Series 2015), 5.00% (Portsmouth Gateway Group LLC), 6/30/2053 | 1,130,890 |
| 802,477 | 1,3 | Port Authority for Columbiana County, OH, Solid Waste Facility Revenue Bonds (Series 2004A), 7.25% (Apex Environmental LLC)/(Original Issue Yield: 7.30%), 8/1/2034 | 8 |
| 110,159 | 1,3 | Port Authority for Columbiana County, OH, Solid Waste Facility Revenue Bonds (Series 2012D), 10.82% (Apex Environmental LLC), 8/1/2034 | 1 |
| 750,000 | | Southeastern Ohio Port Authority, OH, Hospital Facilities Revenue Refunding & Improvement Bonds (Series 2012), 6.00% (Memorial Health System, OH)/(Original Issue Yield: 6.02%), 12/1/2042 | 860,738 |
| | | TOTAL | 27,016,117 |
| | | Oklahoma—1.4% | |
| 1,000,000 | | Oklahoma County, OK Finance Authority, Retirement Facility Revenue Bonds (Series 2005), 6.00% (Concordia Life Care Community)/(Original Issue Yield: 6.15%), 11/15/2038 | 1,001,340 |
| 1,000,000 | | Oklahoma County, OK Finance Authority, Retirement Facility Revenue Bonds (Series 2005), 6.125% (Concordia Life Care Community), 11/15/2025 | 1,002,030 |
Annual Shareholder Report
Principal
Amount | | | Value |
| | | MUNICIPAL BONDS—continued | |
| | | Oklahoma—continued | |
| $2,000,000 | | Tulsa, OK Industrial Authority, Senior Living Community Revenue Bonds (Series 2010A), 7.25% (Montereau, Inc.)/(Original Issue Yield: 7.50%), 11/1/2045 | $2,208,000 |
| 3,000,000 | | Tulsa, OK Municipal Airport Trust, Revenue Refunding Bonds (Series 2000B), 5.50% (American Airlines, Inc.), 6/1/2035 | 3,417,690 |
| 1,500,000 | | Tulsa, OK Municipal Airport Trust, Revenue Refunding Bonds (Series 2015), 5.00% TOBs (American Airlines, Inc.), Mandatory Tender 6/1/2025 | 1,745,610 |
| | | TOTAL | 9,374,670 |
| | | Oregon—0.3% | |
| 1,000,000 | 3,4 | Cow Creek Band of Umpqua Tribe of Indians, Tax-Exempt Tax Revenue Bonds (Series 2006C), 5.625%, 10/1/2026 | 1,002,020 |
| 250,000 | | Yamhill County, OR Hospital Authority, (Friendsview Retirement Community), Revenue Refunding Bonds (Series 2016A), 5.00%, 11/15/2036 | 277,260 |
| 550,000 | | Yamhill County, OR Hospital Authority, Revenue Refunding Bonds (Series 2016A), 5.00% (Friendsview Retirement Community), 11/15/2051 | 605,841 |
| | | TOTAL | 1,885,121 |
| | | Pennsylvania—4.3% | |
| 865,000 | | Allegheny County, PA IDA, Environmental Improvement Revenue Refunding Bonds (Series 2005), 5.50% (United States Steel Corp.), 11/1/2016 | 868,555 |
| 1,715,000 | | Allegheny County, PA Port Authority, Special Revenue Transportation Refunding Bonds (Series 2011), 5.75%, 3/1/2029 | 2,043,440 |
| 3,715,000 | | Allentown, PA Neighborhood Improvement Zone Development Authority, Tax Revenue Bonds (Series 2012A), 5.00%, 5/1/2042 | 4,054,885 |
| 500,000 | | Butler County, PA Hospital Authority, Hospital Revenue Bonds (Series 2015A), 5.00% (Butler Health System), 7/1/2035 | 583,830 |
| 1,500,000 | | Chester County, PA IDA, Revenue Bonds (Series 2007A), 6.375% (Avon Grove Charter School)/(Original Issue Yield: 6.45%), 12/15/2037 | 1,567,170 |
| 2,000,000 | | Chester County, PA IDA, Revenue Bonds (Series 2012A), 5.375% (Collegium Charter School)/(Original Issue Yield: 5.50%), 10/15/2042 | 2,081,240 |
| 1,000,000 | | Clairton Municipal Authority, PA, Sewer Revenue Bonds (Series 2012B), 5.00% (Original Issue Yield: 5.05%), 12/1/2042 | 1,141,920 |
| 3,000,000 | | Harrisburg, PA Authority, Water Revenue Refunding Bonds (Series 2008), 5.25% (Original Issue Yield: 5.35%), 7/15/2031 | 3,123,000 |
| 2,000,000 | | Pennsylvania EDFA, Exempt Facilities Revenue Refunding Bonds (Series 2014), 5.50% (National Gypsum Co.), 11/1/2044 | 2,247,140 |
| 1,250,000 | | Pennsylvania EDFA, Tax-Exempt Private Activity Revenue Bonds (Series 2015), 5.00% (Pennsylvania Rapid Bridge Replacement), 12/31/2038 | 1,474,312 |
Annual Shareholder Report
Principal
Amount | | | Value |
| | | MUNICIPAL BONDS—continued | |
| | | Pennsylvania—continued | |
| $1,000,000 | | Philadelphia, PA Authority for Industrial Development, Revenue Bonds (Series 2010), 6.375% (Global Leadership Academy Charter School), 11/15/2040 | $1,103,850 |
| 1,205,000 | | Philadelphia, PA Authority for Industrial Development, Revenue Bonds (Series 2012), 6.625% (New Foundations Charter School), 12/15/2041 | 1,375,652 |
| 900,000 | | Philadelphia, PA Authority for Industrial Development, Senior Living Revenue Bonds (Series 2005A), 5.625% (PresbyHomes Germantown/Morrisville), 7/1/2035 | 910,395 |
| 1,665,000 | | Philadelphia, PA Hospitals & Higher Education Facilities Authority, Hospital Revenue Bonds (Series 2012A), 5.625% (Temple University Health System Obligated Group)/(Original Issue Yield: 5.875%), 7/1/2042 | 1,867,864 |
| 2,000,000 | | Philadelphia, PA, GO Bonds (Series 2011), 6.50%, 8/1/2041 | 2,392,960 |
| 1,500,000 | | Reading Area Water Authority, PA, Water Revenue Bonds (Series 2011), 5.25% (Original Issue Yield: 5.27%), 12/1/2036 | 1,776,540 |
| 555,000 | | Washington County, PA Redevelopment Authority, Redevelopment Bonds (Series 2006A), 5.45% (Victory Centre Project-Tanger Outlet Development), 7/1/2035 | 561,444 |
| | | TOTAL | 29,174,197 |
| | | Puerto Rico—0.8% | |
| 995,000 | | Puerto Rico Electric Power Authority, 5.05% (Original Issue Yield: 5.08%), 7/1/2042 | 645,576 |
| 195,000 | | Puerto Rico Electric Power Authority, 7.00% (Original Issue Yield: 7.07%), 7/1/2040 | 127,495 |
| 4,000,000 | | Puerto Rico Electric Power Authority, Power Revenue Bonds (Series 2010XX), 5.25% (Original Issue Yield: 5.40%), 7/1/2040 | 2,595,360 |
| 310,000 | | Puerto Rico Electric Power Authority, Power Revenue Bonds (Series 2013A), 7.00%, 7/1/2033 | 202,703 |
| 2,500,000 | | Puerto Rico Electric Power Authority, Power Revenue Bonds (Series 2013A), 7.00% (Original Issue Yield: 7.12%), 7/1/2043 | 1,634,450 |
| | | TOTAL | 5,205,584 |
| | | Rhode Island—1.2% | |
| 4,000,000 | | Rhode Island State Health and Educational Building Corp., Hospital Financing Revenue Bonds (Series 2009A), 7.00% (Lifespan Obligated Group)/(United States Treasury PRF 5/15/2019@100), 5/15/2039 | 4,670,360 |
| 500,000 | | Rhode Island State Health and Educational Building Corp., Hospital Financing Revenue Refunding Bonds (Series 2016), 5.00% (Lifespan Obligated Group), 5/15/2039 | 590,570 |
| 2,730,000 | | Tobacco Settlement Financing Corp., RI, Tobacco Settlement Asset-Backed Bonds (Series 2015B), 5.00%, 6/1/2050 | 2,927,625 |
| | | TOTAL | 8,188,555 |
| | | South Carolina—0.7% | |
| 1,145,000 | | Lancaster County, SC, Assessment Revenue Bonds (Series 2006), 5.45% (Sun City Carolina Lakes Improvement District), 12/1/2037 | 1,146,660 |
Annual Shareholder Report
Principal
Amount | | | Value |
| | | MUNICIPAL BONDS—continued | |
| | | South Carolina—continued | |
| $600,000 | | Myrtle Beach, SC, Tax Increment Bonds (Series 2006A), 5.25% (Myrtle Beach Air Force Base Redevelopment Project Area)/(Original Issue Yield: 5.27%), 10/1/2026 | $600,294 |
| 750,000 | | Myrtle Beach, SC, Tax Increment Bonds (Series 2006A), 5.30% (Myrtle Beach Air Force Base Redevelopment Project Area)/(Original Issue Yield: 5.325%), 10/1/2035 | 750,368 |
| 2,000,000 | | South Carolina Jobs-EDA, Refunding & Improvement Revenue Bonds (Series 2009), 5.75% (Palmetto Health Alliance)/(Original Issue Yield: 5.90%), 8/1/2039 | 2,184,060 |
| | | TOTAL | 4,681,382 |
| | | South Dakota—0.1% | |
| 800,000 | | Educational Enhancement Funding Corp., SD, Tobacco Settlement Revenue Bonds (Series 2013B), 5.00%, 6/1/2025 | 938,728 |
| | | Tennessee—0.9% | |
| 1,000,000 | | Johnson City, TN Health & Education Facilities Board, Hospital Refunding Bonds (Series 2010A), 5.625% (Mountain States Health Alliance)/(Original Issue Yield: 5.90%), 7/1/2030 | 1,137,060 |
| 1,500,000 | | Johnson City, TN Health & Education Facilities Board, Hospital Revenue Bonds (Series 2010), 6.50% (Mountain States Health Alliance), 7/1/2038 | 1,742,415 |
| 2,725,000 | | Tennessee Energy Acquisition Corp., Gas Revenue Bonds (Series 2006A), 5.25% (Goldman Sachs Group, Inc. GTD), 9/1/2023 | 3,306,760 |
| | | TOTAL | 6,186,235 |
| | | Texas—10.8% | |
| 1,100,000 | | Arlington, TX Higher Education Finance Corp., Revenue Bonds (Series 2016A), 5.00% (Uplift Education), 12/1/2046 | 1,272,854 |
| 500,000 | | Austin, TX Airport System, Airport System Revenue Bonds (Series 2014), 5.00%, 11/15/2044 | 581,715 |
| 1,000,000 | | Austin, TX Convention Center Enterprises, Inc., Convention Center Hotel Second Tier Revenue Refunding Bonds (Series 2006B), 5.75%, 1/1/2024 | 1,009,600 |
| 1,000,000 | | Austin, TX Convention Center Enterprises, Inc., Convention Center Hotel Second Tier Revenue Refunding Bonds (Series 2006B), 5.75%, 1/1/2034 | 1,010,020 |
| 755,000 | | Bexar County, HFDC, Revenue Bonds (Series 2010), 6.20% (Army Retirement Residence Foundation), 7/1/2045 | 861,825 |
| 1,000,000 | | Board of Managers, Joint Guadalupe County-City of Seguin, TX, Hospital Mortgage Revenue Refunding & Improvement Bonds (Series 2015), 5.00% (Original Issue Yield: 5.08%), 12/1/2045 | 1,075,020 |
| 2,000,000 | | Cass County, TX IDC, Environmental Improvement Revenue Bonds (Series 2009A), 9.50% (International Paper Co.), 3/1/2033 | 2,392,600 |
| 1,000,000 | | Central Texas Regional Mobility Authority, Senior Lien Revenue Bonds (Series 2011), 6.00% (United States Treasury PRF 1/1/2021@100)/(Original Issue Yield: 6.13%), 1/1/2041 | 1,215,780 |
Annual Shareholder Report
Principal
Amount | | | Value |
| | | MUNICIPAL BONDS—continued | |
| | | Texas—continued | |
| $1,000,000 | | Central Texas Regional Mobility Authority, Senior Lien Revenue Bonds (Series 2011), 6.25% (United States Treasury PRF 1/1/2021@100)/(Original Issue Yield: 6.30%), 1/1/2046 | $1,226,380 |
| 1,000,000 | | Central Texas Regional Mobility Authority, Senior Lien Revenue Refunding Bonds (Series 2016), 5.00%, 1/1/2046 | 1,185,880 |
| 2,000,000 | | Clifton Higher Education Finance Corp., TX, 6.00% (Idea Public Schools), 8/15/2043 | 2,438,640 |
| 750,000 | | Clifton Higher Education Finance Corp., TX, Education Revenue Bonds (Series 2011), 5.75% (Idea Public Schools)/(Original Issue Yield: 6.00%), 8/15/2041 | 847,995 |
| 500,000 | | Clifton Higher Education Finance Corp., TX, Education Revenue Bonds (Series 2012), 5.00% (Idea Public Schools), 8/15/2042 | 555,890 |
| 1,000,000 | | Clifton Higher Education Finance Corp., TX, Revenue Bonds (Series 2014), 5.00% (Idea Public Schools)/(PSFG GTD), 8/15/2039 | 1,205,750 |
| 2,000,000 | | Clifton Higher Education Finance Corp., TX, Revenue Bonds (Series 2015A), 5.00% (Uplift Education), 12/1/2050 | 2,269,500 |
| 4,000,000 | | Dallas-Fort Worth, TX International Airport, Joint Revenue Improvement Bonds (Series 2014B), 5.00%, 11/1/2034 | 4,644,560 |
| 1,500,000 | | Decatur, TX Hospital Authority, Hospital Revenue Bonds (Series 2014A), 5.25% (Wise Regional Health System)/(Original Issue Yield: 5.30%), 9/1/2044 | 1,630,500 |
| 515,000 | | Decatur, TX Hospital Authority, Revenue Bonds, 6.375% (Wise Regional Health System), 9/1/2042 | 610,115 |
| 2,775,000 | | Grand Parkway Transportation Corp., TX, Subordinate Tier Toll Revenue Bonds (Series 2013B TELA Supported), 5.25%, 10/1/2051 | 3,315,237 |
| 1,000,000 | | HFDC of Central Texas, Inc., Retirement Facility Revenue Bonds (Series 2006A), 5.75% (Legacy at Willow Bend), 11/1/2036 | 1,004,170 |
| 1,500,000 | | Houston, TX Airport System, Special Facilities Revenue & Refunding Bonds (Series 2011), 6.625% (United Airlines, Inc.)/(Original Issue Yield: 6.875%), 7/15/2038 | 1,746,915 |
| 2,000,000 | | Houston, TX Airport System, Special Facilities Revenue Bonds (Series 2015B-1), 5.00% (United Airlines, Inc.), 7/15/2035 | 2,243,240 |
| 500,000 | | Houston, TX Airport System, Special Facilities Revenue Refunding Bonds (Series 2014), 4.75% (United Airlines, Inc.)/(Original Issue Yield: 4.90%), 7/1/2024 | 572,865 |
| 1,000,000 | | Houston, TX Airport System, Special Facilities Revenue Refunding Bonds (Series 2014), 5.00% (United Airlines, Inc.)/(Original Issue Yield: 5.15%), 7/1/2029 | 1,134,180 |
| 1,000,000 | | Houston, TX Airport System, Subordinate Lien Revenue Refunding Bonds (Series 2012A), 5.00%, 7/1/2032 | 1,135,460 |
| 2,000,000 | | Houston, TX Combined Utility System, First Lien Revenue & Refunding Bonds (Series 2016B), 5.00%, 11/15/2036 | 2,488,640 |
| 535,000 | | Houston, TX Higher Education Finance Corp., Education Revenue Bonds (Series 2011A), 6.875% (Cosmos Foundation, Inc.)/(United States Treasury PRF 5/15/2021@100), 5/15/2041 | 682,312 |
Annual Shareholder Report
Principal
Amount | | | Value |
| | | MUNICIPAL BONDS—continued | |
| | | Texas—continued | |
| $2,000,000 | | Lavernia, TX Higher Education Finance Corp., Education Revenue Bonds (Series 2015A), 5.50% (Meridian World School), 8/15/2045 | $2,165,820 |
| 2,000,000 | | Lufkin, TX HFDC, Revenue Refunding and Improvement Bonds (Series 2009), 6.25% (Memorial Health System of East Texas)/(United States Treasury PRF 2/15/2019@100)/(Original Issue Yield: 6.50%), 2/15/2037 | 2,268,840 |
| 1,000,000 | | Matagorda County, TX Navigation District No. 1, PCR Refunding Bonds (Series 2001A), 6.30% (AEP Texas Central Co.), 11/1/2029 | 1,134,300 |
| 700,000 | | New Hope Cultural Education Facilities Finance Corporation, Retirement Facility Revenue Bonds (Series 2016), 5.00% (MRC Crestview), 11/15/2046 | 791,112 |
| 1,500,000 | | North Texas Tollway Authority, Special Projects System Revenue Bonds (Series 2011), 6.00% (North Texas Toll Authority Special Projects System), 9/1/2041 | 1,836,420 |
| 1,500,000 | | North Texas Tollway Authority, System First Tier Revenue Refunding Bonds (Series 2016A), 5.00%, 1/1/2026 | 1,845,705 |
| 600,000 | | North Texas Tollway Authority, System First Tier Revenue Refunding Bonds (Series 2016A), 5.00%, 1/1/2039 | 724,158 |
| 2,000,000 | | North Texas Tollway Authority, System Second Tier Revenue Refunding Bonds (Series 2014B), 5.00%, 1/1/2031 | 2,405,800 |
| 2,000,000 | | Red River, TX HFDC, Retirement Facility Revenue Bonds (Series 2014A), 8.00% (MRC The Crossings), 11/15/2049 | 2,425,860 |
| 1,000,000 | | San Juan Higher Education Finance Authority, TX, Education Revenue Bonds (Series 2010A), 6.70% (Idea Public Schools), 8/15/2040 | 1,217,700 |
| 1,000,000 | | Tarrant County, TX Cultural Education Facilities Finance Corp., Hospital Revenue Bonds (Series 2016A), 5.00% (Baylor Scott & White Health Care System), 11/15/2045 | 1,211,350 |
| 1,500,000 | | Tarrant County, TX Cultural Education Facilities Finance Corp., Retirement Facility Revenue Bonds (Series 2015A Fixed Rate Bonds), 5.50% (Buckingham Senior Living Community), 11/15/2045 | 1,682,805 |
| 2,000,000 | | Texas Private Activity Bonds Surface Transportation Corporation, Senior Lien Revenue Bonds (Series 2016), 5.00% (Blueridge Transportation Group, LLC SH 288 Toll Lanes), 12/31/2055 | 2,297,100 |
| 2,000,000 | | Texas State Public Finance Authority Charter School Finance Corp., Education Revenue Bonds (Series 2010A), 6.20% (Cosmos Foundation, Inc.)/(United States Treasury PRF 2/15/2020@100), 2/15/2040 | 2,364,920 |
| 2,000,000 | | Texas State Transportation Commission, Highway Improvement UT GO Bonds (Series 2016), 5.00% (Texas State), 4/1/2046 | 2,467,840 |
| 2,680,000 | | Texas State Transportation Commission, Second Tier Revenue Refunding Bonds (Series 2015-C), 5.00% (Central Texas Turnpike System), 8/15/2042 | 3,133,242 |
Annual Shareholder Report
Principal
Amount | | | Value |
| | | MUNICIPAL BONDS—continued | |
| | | Texas—continued | |
| $2,500,000 | | Travis County, TX HFDC, First Mortgage Revenue Refunding Bonds (Series 2012A), 7.125% (Longhorn Village)/(Original Issue Yield: 7.40%), 1/1/2046 | $2,848,875 |
| | | TOTAL | 73,179,490 |
| | | Utah—0.2% | |
| 1,315,000 | 3,4 | Utah State Charter School Finance Authority, Charter School Revenue Bonds (Series 2007A), 6.00% (Channing Hall), 7/15/2037 | 1,323,206 |
| | | Virginia—1.3% | |
| 1,500,000 | | Chesterfield County, VA EDA, PCR Refunding Bonds (Series 2009A), 5.00% (Virginia Electric & Power Co.), 5/1/2023 | 1,663,635 |
| 1,500,000 | 3,4 | Embrey Mill CDA , VA, Special Assessment Revenue Bonds (Series 2015), 5.60%, 3/1/2045 | 1,565,925 |
| 1,380,000 | | Mosaic District CDA, VA, Revenue Bonds (Series 2011A), 6.875% (Original Issue Yield: 6.93%), 3/1/2036 | 1,594,480 |
| 4,250,000 | | Tobacco Settlement Financing Corp., VA, Tobacco Settlement Asset-Backed Bonds (Series 2007B-1), 5.00% (Original Issue Yield: 5.12%), 6/1/2047 | 4,133,252 |
| | | TOTAL | 8,957,292 |
| | | Washington—2.6% | |
| 1,000,000 | | Port of Seattle, WA IDC, Special Facilities Revenue Refunding Bonds (Series 2012), 5.00% (Delta Air Lines, Inc.)/(Original Issue Yield: 5.31%), 4/1/2030 | 1,085,650 |
| 925,000 | | Tobacco Settlement Authority, WA, Tobacco Settlement Revenue Refunding Bonds (Series 2013), 5.25%, 6/1/2031 | 1,040,912 |
| 1,500,000 | 3,4 | Washington State Health Care Facilities Authority, Revenue Bonds (Series 2007A), 6.25% (Virginia Mason Medical Center)/(Original Issue Yield: 6.375%), 8/15/2042 | 1,572,930 |
| 2,500,000 | 3,4 | Washington State Housing Finance Commission, Nonprofit Housing Revenue & Revenue Refunding Bonds (Series 2014A), 7.50% (Rockwood Retirement Communities), 1/1/2049 | 2,971,275 |
| 1,000,000 | 3,4 | Washington State Housing Finance Commission, Nonprofit Housing Revenue Bonds (Series 2015A), 7.00% (Heron's Key Senior Living), 7/1/2045 | 1,087,330 |
| 1,000,000 | 3,4 | Washington State Housing Finance Commission, Nonprofit Housing Revenue Bonds (Series 2015A), 7.00% (Heron's Key Senior Living)/(Original Issue Yield: 7.05%), 7/1/2050 | 1,080,130 |
| 7,000,000 | | Washington State, UT GO Bonds (Series 2015A-1), 5.00%, 8/1/2038 | 8,553,580 |
| | | TOTAL | 17,391,807 |
| | | West Virginia—0.3% | |
| 985,000 | | Ohio County, WV County Commission, Tax Increment Revenue Bonds (Series 2005A), 5.625% (Fort Henry Centre Tax Increment Financing District No. 1), 6/1/2034 | 987,650 |
Annual Shareholder Report
Principal
Amount | | | Value |
| | | MUNICIPAL BONDS—continued | |
| | | West Virginia—continued | |
| $1,000,000 | | Ohio County, WV County Commission, Tax Increment Revenue Bonds (Series 2007A), 5.85% (Fort Henry Centre Tax Increment Financing District No. 1)/(United States Treasury PRF 6/1/2017@100), 6/1/2034 | $1,038,680 |
| | | TOTAL | 2,026,330 |
| | | Wisconsin—1.5% | |
| 1,000,000 | | Public Finance Authority, WI, Exempt Facilities Refunding Revenue Bonds (Series 2016), 4.00% (National Gypsum Co.), 8/1/2035 | 1,028,880 |
| 5,335,000 | | Wisconsin State General Fund Appropriation, Revenue Bonds (Series 2009A), 5.75% (Wisconsin State)/(Original Issue Yield: 5.95%), 5/1/2033 | 6,001,662 |
| 800,000 | | Wisconsin State HEFA, Revenue Refunding Bonds (Series 2015), 5.00% (ProHealth Care, Inc.), 8/15/2039 | 938,432 |
| 2,000,000 | 3,4 | Wisconsin State Public Finance Authority, Revenue Refunding Bonds (Series 2016C), 4.30% (Celanese US Holdings LLC), 11/1/2030 | 2,110,020 |
| | | TOTAL | 10,078,994 |
| | | TOTAL MUNICIPAL BONDS
(IDENTIFIED COST $610,941,716) | 667,303,939 |
| | | CORPORATE BONDS—0.1% | |
| | | Multi State—0.1% | |
| 4,000,000 | 1,3 | Non-Profit Preferred Funding Trust I, Partnership, 9/15/2037
(IDENTIFIED COST $3,989,000) | 309,600 |
| | | SHORT-TERM MUNICIPALS—0.9%5 | |
| | | Alabama—0.1% | |
| 500,000 | | Wilsonville, AL IDB, (Series D) (Gaston Plant) Daily VRDNs (Alabama Power Co.), 0.64%, 9/1/2016 | 500,000 |
| | | Georgia—0.2% | |
| 1,800,000 | | Burke County, GA Development Authority, (1st Series 2009) Daily VRDNs (Georgia Power Co.), 0.64%, 9/1/2016 | 1,800,000 |
| | | New York—0.4% | |
| 1,000,000 | | New York City, NY, (Fiscal 2006 Series H-2) Daily VRDNs, (JPMorgan Chase Bank, N.A. LIQ), 0.59%, 9/1/2016 | 1,000,000 |
| 100,000 | | New York City, NY, (Series 2013D-3) Daily VRDNs, (JPMorgan Chase Bank, N.A. LIQ), 0.59%, 9/1/2016 | 100,000 |
| 1,800,000 | | New York City, NY, 2015 Series F (Subseries F-5) Daily VRDNs (Barclays Bank PLC LIQ), 0.59%, 9/1/2016 | 1,800,000 |
| 100,000 | | New York State HFA, (Series 2009B: 505 West 37th Street Housing) Daily VRDNs (Midtown West B LLC)/(Landesbank Hessen-Thuringen LOC), 0.64%, 9/1/2016 | 100,000 |
| | | TOTAL | 3,000,000 |
Annual Shareholder Report
Principal
Amount | | | Value |
| | | SHORT-TERM MUNICIPALS—continued5 | |
| | | Ohio—0.1% | |
| $100,000 | | Allen County, OH, (Series 2010C) Daily VRDNs (Mercy Health)/(MUFG Union Bank, N.A. LOC), 0.67%, 9/1/2016 | $100,000 |
| 500,000 | | Ohio State Higher Educational Facility Commission, (Series 2008 B-4) Daily VRDNs (Cleveland Clinic), (Barclays Bank PLC LIQ), 0.59%, 9/1/2016 | 500,000 |
| | | TOTAL | 600,000 |
| | | Pennsylvania—0.1% | |
| 400,000 | | Philadelphia, PA Hospitals & Higher Education Facilities Authority, (Series 2002-A) Daily VRDNs (Children's Hospital of Philadelphia)/(Wells Fargo Bank, N.A. LIQ), 0.59%, 9/1/2016 | 400,000 |
| | | Tennessee—0.0% | |
| 100,000 | | Shelby County, TN Health Education & Housing Facilities Board, (Series 2008A) Daily VRDNs (Methodist Le Bonheur Healthcare), (AGM INS)/(U.S. Bank, N.A. LIQ), 0.59%, 9/1/2016 | 100,000 |
| | | TOTAL SHORT-TERM MUNICIPALS—0.9%
(AT AMORTIZED COST) | 6,400,000 |
| | | TOTAL INVESTMENTS—99.1%
(IDENTIFIED COST $621,330,716)6 | 674,013,539 |
| | | OTHER ASSETS AND LIABILITIES - NET—0.9%7 | 6,026,656 |
| | | TOTAL NET ASSETS—100% | $680,040,195 |
Securities that are subject to the federal alternative minimum tax (AMT) represent 11.5% of the Fund's portfolio as calculated based upon total market value (unaudited).
| 1 | Non-income-producing security. |
| 2 | Security in default. |
| 3 | Denotes a restricted security that either: (a) cannot be offered for public sale without first being registered, or being able to take advantage of an exemption from registration, under the Securities Act of 1933; or (b) is subject to a contractual restriction on public sales. At August 31, 2016, these restricted securities amounted to $41,184,635, which represented 6.1% of total net assets. |
| 4 | Denotes a restricted security that may be resold without restriction to “qualified institutional buyers” as defined in Rule 144A under the Securities Act of 1933 and that the Fund has determined to be liquid under criteria established by the Fund's Board of Trustees (the “Trustees”). At August 31, 2016, these liquid restricted securities amounted to $40,875,026, which represented 6.0% of total net assets. |
| 5 | Current rate and next reset date shown for Variable Rate Demand Notes. |
| 6 | The cost of investments for federal tax purposes amounts to $621,623,495. |
| 7 | Assets, other than investments in securities, less liabilities. See Statement of Assets and Liabilities. |
Note: The categories of investments are shown as a percentage of total net assets at August 31, 2016.
Various inputs are used in determining the value of the Fund's investments. These inputs are summarized in the three broad levels listed below:
Level 1—quoted prices in active markets for identical securities.
Annual Shareholder Report
Level 2—other significant observable inputs (including quoted prices for similar securities, interest rates, prepayment speeds, credit risk, etc.). Also includes securities valued at amortized cost.
Level 3—significant unobservable inputs (including the Fund's own assumptions in determining the fair value of investments).
The inputs or methodology used for valuing securities are not an indication of the risk associated with investing in those securities.
As of August 31, 2016, all investments of the Fund utilized Level 2 inputs in valuing the Fund's assets carried at fair value.
The following acronyms are used throughout this portfolio:
| AGM | —Assured Guaranty Municipal Corp. |
| AMBAC | —American Municipal Bond Assurance Corporation |
| CDA | —Community Development Authority |
| COL | —Collateralized |
| COPs | —Certificates of Participation |
| EDA | —Economic Development Authority |
| EDC | —Economic Development Corporation |
| EDFA | —Economic Development Finance Authority |
| GNMA | —Government National Mortgage Association |
| GO | —General Obligation |
| GTD | —Guaranteed |
| HEFA | —Health and Education Facilities Authority |
| HFA | —Housing Finance Authority |
| HFDC | —Health Facility Development Corporation |
| IDA | —Industrial Development Authority |
| IDB | —Industrial Development Bond |
| IDC | —Industrial Development Corporation |
| IDRBs | —Industrial Development Revenue Bonds |
| INS | —Insured |
| LIQ | —Liquidity Agreement |
| LO | —Limited Obligation |
| LOC | —Letter of Credit |
| LT | —Limited Tax |
| MFH | —Multi-Family Housing |
| PCFA | —Pollution Control Finance Authority |
| PCR | —Pollution Control Revenue |
| PCRBs | —Pollution Control Revenue Bonds |
| PILOTs | —Payment in Lieu of Taxes |
| PRF | —Pre-refunded |
| PSFG | —Public School Fund Guarantee |
| Q-SBLF | —Qualified School Bond Loan Fund |
| SFM | —Single Family Mortgage |
| SID | —Special Improvement District |
| SO | —Special Obligation |
| TELA | —Toll Equity Loan Agreement |
| TFA | —Transitional Finance Authority |
| TOBs | —Tender Option Bonds |
| USDT | —Unified School District |
| UT | —Unlimited Tax |
| VRDNs | —Variable Rate Demand Notes |
See Notes which are an integral part of the Financial Statements
Annual Shareholder Report
Financial Highlights–Class A Shares
(For a Share Outstanding Throughout Each Period)
| Year Ended August 31 | 2016 | 2015 | 2014 | 2013 | 2012 |
| Net Asset Value, Beginning of Period | $8.86 | $8.85 | $8.11 | $8.95 | $8.21 |
| Income From Investment Operations: | | | | | |
| Net investment income | 0.37 | 0.39 | 0.41 | 0.40 | 0.42 |
| Net realized and unrealized gain (loss) on investments and futures contracts | 0.42 | 0.01 | 0.74 | (0.84) | 0.74 |
| TOTAL FROM INVESTMENT OPERATIONS | 0.79 | 0.40 | 1.15 | (0.44) | 1.16 |
| Less Distributions: | | | | | |
| Distributions from net investment income | (0.37) | (0.39) | (0.41) | (0.40) | (0.42) |
| Net Asset Value, End of Period | $9.28 | $8.86 | $8.85 | $8.11 | $8.95 |
| Total Return1 | 9.17% | 4.63% | 14.54% | (5.17)% | 14.58% |
| Ratios to Average Net Assets: | | | | | |
| Net expenses | 0.89% | 0.89% | 0.89% | 0.89% | 0.89% |
| Net investment income | 4.12% | 4.42% | 4.84% | 4.53% | 4.88% |
| Expense waiver/reimbursement2 | 0.14% | 0.15% | 0.17% | 0.15% | 0.15% |
| Supplemental Data: | | | | | |
| Net assets, end of period (000 omitted) | $270,092 | $230,664 | $224,298 | $215,101 | $239,911 |
| Portfolio turnover | 10% | 12% | 19% | 17% | 14% |
| 1 | Based on net asset value, which does not reflect the sales charge, redemption fee or contingent deferred sales charge, if applicable. |
| 2 | This expense decrease is reflected in both the net expense and net investment income ratios shown above. |
See Notes which are an integral part of the Financial Statements
Annual Shareholder Report
Financial Highlights–Class B Shares
(For a Share Outstanding Throughout Each Period)
| Year Ended August 31 | 2016 | 2015 | 2014 | 2013 | 2012 | |
| Net Asset Value, Beginning of Period | $8.85 | $8.84 | $8.11 | $8.95 | $8.21 |
| Income From Investment Operations: | | | | | |
| Net investment income | 0.31 | 0.35 | 0.36 | 0.36 | 0.36 |
| Net realized and unrealized gain (loss) on investments and futures contracts | 0.42 | (0.01) | 0.71 | (0.86) | 0.74 |
| TOTAL FROM INVESTMENT OPERATIONS | 0.73 | 0.34 | 1.07 | (0.50) | 1.10 |
| Less Distributions: | | | | | |
| Distributions from net investment income | (0.31) | (0.33) | (0.34) | (0.34) | (0.36) |
| Net Asset Value, End of Period | $9.27 | $8.85 | $8.84 | $8.11 | $8.95 |
| Total Return1 | 8.35% | 3.85% | 13.56% | (5.88)% | 13.72% |
| Ratios to Average Net Assets: | | | | | |
| Net expenses | 1.64% | 1.64% | 1.64% | 1.64% | 1.64% |
| Net investment income | 3.38% | 3.66% | 4.09% | 3.76% | 4.15% |
| Expense waiver/reimbursement2 | 0.14% | 0.15% | 0.17% | 0.15% | 0.15% |
| Supplemental Data: | | | | | |
| Net assets, end of period (000 omitted) | $12,241 | $11,528 | $13,424 | $15,620 | $22,783 |
| Portfolio turnover | 10% | 12% | 19% | 17% | 14% |
| 1 | Based on net asset value, which does not reflect the sales charge, redemption fee or contingent deferred sales charge, if applicable. |
| 2 | This expense decrease is reflected in both the net expense and net investment income ratios shown above. |
See Notes which are an integral part of the Financial Statements
Annual Shareholder Report
Financial Highlights–Class C Shares
(For a Share Outstanding Throughout Each Period)
| Year Ended August 31 | 2016 | 2015 | 2014 | 2013 | 2012 | |
| Net Asset Value, Beginning of Period | $8.85 | $8.85 | $8.11 | $8.95 | $8.21 |
| Income From Investment Operations: | | | | | |
| Net investment income | 0.31 | 0.33 | 0.35 | 0.34 | 0.36 |
| Net realized and unrealized gain (loss) on investments and futures contracts | 0.43 | (0.00)1 | 0.74 | (0.84) | 0.74 |
| TOTAL FROM INVESTMENT OPERATIONS | 0.74 | 0.33 | 1.09 | (0.50) | 1.10 |
| Less Distributions: | | | | | |
| Distributions from net investment income | (0.31) | (0.33) | (0.35) | (0.34) | (0.36) |
| Net Asset Value, End of Period | $9.28 | $8.85 | $8.85 | $8.11 | $8.95 |
| Total Return2 | 8.47% | 3.73% | 13.69% | (5.88)% | 13.72% |
| Ratios to Average Net Assets: | | | | | |
| Net expenses | 1.64% | 1.64% | 1.64% | 1.64% | 1.64% |
| Net investment income | 3.37% | 3.67% | 4.09% | 3.78% | 4.13% |
| Expense waiver/reimbursement3 | 0.14% | 0.15% | 0.17% | 0.15% | 0.15% |
| Supplemental Data: | | | | | |
| Net assets, end of period (000 omitted) | $77,213 | $61,093 | $56,208 | $53,002 | $61,295 |
| Portfolio turnover | 10% | 12% | 19% | 17% | 14% |
| 1 | Represents less than $0.01. |
| 2 | Based on net asset value, which does not reflect the sales charge, redemption fee or contingent deferred sales charge, if applicable. |
| 3 | This expense decrease is reflected in both the net expense and net investment income ratios shown above. |
See Notes which are an integral part of the Financial Statements
Annual Shareholder Report
Financial Highlights–Class F Shares
(For a Share Outstanding Throughout Each Period)
| Year Ended August 31 | 2016 | 2015 | 2014 | 2013 | 2012 |
| Net Asset Value, Beginning of Period | $8.86 | $8.85 | $8.11 | $8.95 | $8.21 |
| Income From Investment Operations: | | | | | |
| Net investment income | 0.37 | 0.39 | 0.41 | 0.40 | 0.42 |
| Net realized and unrealized gain (loss) on investments and futures contracts | 0.42 | 0.01 | 0.74 | (0.84) | 0.74 |
| TOTAL FROM INVESTMENT OPERATIONS | 0.79 | 0.40 | 1.15 | (0.44) | 1.16 |
| Less Distributions: | | | | | |
| Distributions from net investment income | (0.37) | (0.39) | (0.41) | (0.40) | (0.42) |
| Net Asset Value, End of Period | $9.28 | $8.86 | $8.85 | $8.11 | $8.95 |
| Total Return1 | 9.17% | 4.63% | 14.54% | (5.17)% | 14.58% |
| Ratios to Average Net Assets: | | | | | |
| Net expenses | 0.89% | 0.89% | 0.89% | 0.89% | 0.89% |
| Net investment income | 4.12% | 4.41% | 4.84% | 4.53% | 4.89% |
| Expense waiver/reimbursement2 | 0.14% | 0.15% | 0.17% | 0.15% | 0.15% |
| Supplemental Data: | | | | | |
| Net assets, end of period (000 omitted) | $213,796 | $189,216 | $187,704 | $178,932 | $203,396 |
| Portfolio turnover | 10% | 12% | 19% | 17% | 14% |
| 1 | Based on net asset value, which does not reflect the sales charge, redemption fee or contingent deferred sales charge, if applicable. |
| 2 | This expense decrease is reflected in both the net expense and net investment income ratios shown above. |
See Notes which are an integral part of the Financial Statements
Annual Shareholder Report
Financial Highlights–Institutional Shares
(For a Share Outstanding Throughout Each Period)
| | Year Ended August 31, | Period
Ended
08/31/20131 |
| 2016 | 2015 | 2014 |
| Net Asset Value, Beginning of Period | $8.85 | $8.84 | $8.11 | $8.88 |
| Income From Investment Operations: | | | | |
| Net investment income | 0.40 | 0.42 | 0.42 | 0.09 |
| Net realized and unrealized gain (loss) on investments and futures contracts | 0.42 | 0.01 | 0.74 | (0.78) |
| TOTAL FROM INVESTMENT OPERATIONS | 0.82 | 0.43 | 1.16 | (0.69) |
| Less Distributions: | | | | |
| Distributions from net investment income | (0.40) | (0.42) | (0.43) | (0.08) |
| Net Asset Value, End of Period | $9.27 | $8.85 | $8.84 | $8.11 |
| Total Return2 | 9.45% | 4.90% | 14.71% | (7.83)% |
| Ratios to Average Net Assets: | | | | |
| Net expenses | 0.64% | 0.64% | 0.64% | 0.64%3 |
| Net investment income | 4.35% | 4.67% | 5.01% | 6.05%3 |
| Expense waiver/reimbursement4 | 0.14% | 0.15% | 0.16% | 0.21%3 |
| Supplemental Data: | | | | |
| Net assets, end of period (000 omitted) | $106,699 | $63,857 | $48,577 | $2,426 |
| Portfolio turnover | 10% | 12% | 19% | 17%5 |
| 1 | Reflects operations for the period from June 11, 2013 (date of initial investment) to August 31, 2013. |
| 2 | Based on net asset value. Total returns for periods of less than one year are not annualized. |
| 3 | Computed on an annualized basis. |
| 4 | This expense decrease is reflected in both the net expense and net investment income ratios shown above. |
| 5 | Portfolio turnover is calculated at the Fund level. Percentage indicated was calculated for the year ended August 31, 2013. |
See Notes which are an integral part of the Financial Statements
Annual Shareholder Report
Statement of Assets and Liabilities
August 31, 2016
| Assets: | | |
| Total investment in securities, at value (identified cost $621,330,716) | | $674,013,539 |
| Cash | | 6,210 |
| Income receivable | | 8,607,540 |
| Receivable for shares sold | | 1,448,553 |
| TOTAL ASSETS | | 684,075,842 |
| Liabilities: | | |
| Payable for investments purchased | $3,214,691 | |
| Payable for shares redeemed | 528,373 | |
| Payable for other service fees (Notes 2 and 5) | 117,153 | |
| Payable for distribution services fee (Note 5) | 56,604 | |
| Payable for investment adviser fee (Note 5) | 8,456 | |
| Payable for administrative fee (Note 5) | 1,452 | |
| Accrued expenses (Note 5) | 108,918 | |
| TOTAL LIABILITIES | | 4,035,647 |
| Net assets for 73,288,415 shares outstanding | | $680,040,195 |
| Net Assets Consists of: | | |
| Paid-in capital | | $707,490,111 |
| Net unrealized appreciation of investments | | 52,682,823 |
| Accumulated net realized loss on investments | | (80,656,661) |
| Undistributed net investment income | | 523,922 |
| TOTAL NET ASSETS | | $680,040,195 |
Annual Shareholder Report
Statement of Assets and Liabilities–continued
| Net Asset Value, Offering Price and Redemption Proceeds Per Share: | | |
| Class A Shares: | | |
| Net asset value per share ($270,092,191 ÷ 29,099,286 shares outstanding), no par value, unlimited shares authorized | | $9.28 |
| Offering price per share (100/95.50 of $9.28) | | $9.72 |
| Redemption proceeds per share | | $9.28 |
| Class B Shares: | | |
| Net asset value per share ($12,240,980 ÷ 1,319,893 shares outstanding), no par value, unlimited shares authorized | | $9.27 |
| Offering price per share | | $9.27 |
| Redemption proceeds per share (94.50/100 of $9.27) | | $8.76 |
| Class C Shares: | | |
| Net asset value per share ($77,212,526 ÷ 8,324,301 shares outstanding), no par value, unlimited shares authorized | | $9.28 |
| Offering price per share | | $9.28 |
| Redemption proceeds per share (99.00/100 of $9.28) | | $9.19 |
| Class F Shares: | | |
| Net asset value per share ($213,795,950 ÷ 23,036,204 shares outstanding), no par value, unlimited shares authorized | | $9.28 |
| Offering price per share (100/99.00 of $9.28) | | $9.37 |
| Redemption proceeds per share (99.00/100 of $9.28) | | $9.19 |
| Institutional Shares: | | |
| Net asset value per share ($106,698,548 ÷ 11,508,731 shares outstanding), no par value, unlimited shares authorized | | $9.27 |
| Offering price per share | | $9.27 |
| Redemption proceeds per share | | $9.27 |
See Notes which are an integral part of the Financial Statements
Annual Shareholder Report
Statement of Operations
Year Ended August 31, 2016
| Investment Income: | | | |
| Interest | | | $30,872,021 |
| Expenses: | | | |
| Investment adviser fee (Note 5) | | $3,695,342 | |
| Administrative fee (Note 5) | | 481,720 | |
| Custodian fees | | 25,465 | |
| Transfer agent fees | | 324,047 | |
| Directors'/Trustees' fees (Note 5) | | 6,585 | |
| Auditing fees | | 36,625 | |
| Legal fees | | 7,964 | |
| Distribution services fee (Note 5) | | 613,572 | |
| Other service fees (Notes 2 and 5) | | 1,329,641 | |
| Portfolio accounting fees | | 133,837 | |
| Share registration costs | | 74,488 | |
| Printing and postage | | 39,325 | |
| Miscellaneous (Note 5) | | 14,474 | |
| TOTAL EXPENSES | | 6,783,085 | |
| Waivers: | | | |
| Waiver of investment adviser fee (Note 5) | $(857,697) | | |
| Waiver of other operating expenses (Note 2) | (10,299) | | |
| TOTAL WAIVERS | | (867,996) | |
| Net expenses | | | 5,915,089 |
| Net investment income | | | 24,956,932 |
| Realized and Unrealized Gain (Loss) on Investments: | | | |
| Net realized loss on investments | | | (5,725,997) |
| Net change in unrealized appreciation of investments | | | 34,602,926 |
| Net realized and unrealized gain on investments | | | 28,876,929 |
| Change in net assets resulting from operations | | | $53,833,861 |
See Notes which are an integral part of the Financial Statements
Annual Shareholder Report
Statement of Changes in Net Assets
| Year Ended August 31 | 2016 | 2015 |
| Increase (Decrease) in Net Assets | | |
| Operations: | | |
| Net investment income | $24,956,932 | $23,909,503 |
| Net realized loss on investments | (5,725,997) | (2,029,677) |
| Net change in unrealized appreciation/depreciation of investments | 34,602,926 | 2,167,734 |
| CHANGE IN NET ASSETS RESULTING FROM OPERATIONS | 53,833,861 | 24,047,560 |
| Distributions to Shareholders: | | |
| Distributions from net investment income | | |
| Class A Shares | (10,375,106) | (10,129,493) |
| Class B Shares | (405,912) | (460,151) |
| Class C Shares | (2,334,994) | (2,164,489) |
| Class F Shares | (8,158,364) | (8,439,946) |
| Institutional Shares | (3,589,323) | (2,666,699) |
| CHANGE IN NET ASSETS RESULTING FROM DISTRIBUTIONS TO SHAREHOLDERS | (24,863,699) | (23,860,778) |
| Share Transactions: | | |
| Proceeds from sale of shares | 175,791,364 | 124,495,318 |
| Net asset value of shares issued to shareholders in payment of distributions declared | 22,222,500 | 21,099,459 |
| Cost of shares redeemed | (103,301,725) | (119,635,036) |
| CHANGE IN NET ASSETS RESULTING FROM SHARE TRANSACTIONS | 94,712,139 | 25,959,741 |
| Change in net assets | 123,682,301 | 26,146,523 |
| Net Assets: | | |
| Beginning of period | 556,357,894 | 530,211,371 |
| End of period (including undistributed net investment income of $523,922 and $464,950, respectively) | $680,040,195 | $556,357,894 |
See Notes which are an integral part of the Financial Statements
Annual Shareholder Report
Notes to Financial Statements
August 31, 2016
1. ORGANIZATION
Federated Municipal Securities Income Trust (the “Trust”) is registered under the Investment Company Act of 1940, as amended (the “Act”), as an open-end management investment company. The Trust consists of five portfolios. The financial statements included herein are only those of the Federated Municipal High Yield Advantage Fund (the “Fund”), a non-diversified portfolio. The financial statements of the other portfolios are presented separately. The assets of each portfolio are segregated and a shareholder's interest is limited to the portfolio in which shares are held. Each portfolio pays its own expenses. The Fund offers five classes of shares: Class A Shares, Class B Shares, Class C Shares, Class F Shares and Institutional Shares. All shares of the Fund have equal rights with respect to voting, except on class-specific matters. The investment objective of the Fund is to provide a high level of current income which is generally exempt from federal regular income tax. Interest income from the Fund's investments may be subject to the federal AMT for individuals and corporations and state and local taxes.
2. SIGNIFICANT ACCOUNTING POLICIES
The following is a summary of significant accounting policies consistently followed by the Fund in the preparation of its financial statements. These policies are in conformity with U.S. generally accepted accounting principles (GAAP).
Investment Valuation
In calculating its net asset value (NAV), the Fund generally values investments as follows:
| ■ | Fixed-income securities acquired with remaining maturities greater than 60 days are fair valued using price evaluations provided by a pricing service approved by the Trustees. |
| ■ | Fixed-income securities acquired with remaining maturities of 60 days or less are valued at their cost (adjusted for the accretion of any discount or amortization of any premium) unless the issuer's creditworthiness is impaired or other factors indicate that amortized cost is not an accurate estimate of the investment's fair value, in which case it would be valued in the same manner as a longer-term security. |
| ■ | Shares of other mutual funds or non-exchange-traded investment companies are valued based upon their reported NAVs. |
| ■ | Derivative contracts listed on exchanges are valued at their reported settlement or closing price, except that options are valued at the mean of closing bid and asked quotations. |
| ■ | Over-the-counter (OTC) derivative contracts are fair valued using price evaluations provided by a pricing service approved by the Trustees. |
| ■ | For securities that are fair valued in accordance with procedures established by and under the general supervision of the Trustees, certain factors may be considered such as: the last traded or purchase price of the security, information obtained by contacting the issuer or dealers, analysis of the issuer's financial statements or other available documents, fundamental analytical data, the nature and duration of restrictions on disposition, the movement of the market in which the security is normally traded, public trading in similar securities or derivative contracts of the issuer or comparable issuers, movement of a relevant index, or other factors including but not limited to industry changes and relevant government actions. |
Annual Shareholder Report
If any price, quotation, price evaluation or other pricing source is not readily available when the NAV is calculated, or if the Fund cannot obtain price evaluations from a pricing service or from more than one dealer for an investment within a reasonable period of time as set forth in the Fund's valuation policies and procedures, the Fund uses the fair value of the investment determined in accordance with the procedures described below. There can be no assurance that the Fund could obtain the fair value assigned to an investment if it sold the investment at approximately the time at which the Fund determines its NAV per share.
Fair Valuation Procedures
The Trustees have ultimate responsibility for determining the fair value of investments for which market quotations are not readily available. The Trustees have appointed a valuation committee (“Valuation Committee”) comprised of officers of the Fund, Federated Investment Management Company (“Adviser”) and certain of the Adviser's affiliated companies to assist in determining fair value and in overseeing the calculation of the NAV. The Trustees have also authorized the use of pricing services recommended by the Valuation Committee to provide fair value evaluations of the current value of certain investments for purposes of calculating the NAV. The Valuation Committee employs various methods for reviewing third-party pricing-service evaluations including periodic reviews of third-party pricing services' policies, procedures and valuation methods (including key inputs, methods, models and assumptions), transactional back-testing, comparisons of evaluations of different pricing services and review of price challenges by the Adviser based on recent market activity. In the event that market quotations and price evaluations are not available for an investment, the Valuation Committee determines the fair value of the investment in accordance with procedures adopted by the Trustees. The Trustees periodically review and approve the fair valuations made by the Valuation Committee and any changes made to the procedures.
Factors considered by pricing services in evaluating an investment include the yields or prices of investments of comparable quality, coupon, maturity, call rights and other potential prepayments, terms and type, reported transactions, indications as to values from dealers and general market conditions. Some pricing services provide a single price evaluation reflecting the bid-side of the market for an investment (a “bid” evaluation). Other pricing services offer both bid evaluations and price evaluations indicative of a price between the prices bid and asked for the investment (a “mid” evaluation). The Fund normally uses bid evaluations for any U.S. Treasury and Agency securities, mortgage-backed securities and municipal securities. The Fund normally uses mid evaluations for any other types of fixed-income securities and any OTC derivative contracts. In the event that market quotations and price evaluations are not available for an investment, the fair value of the investment is determined in accordance with procedures adopted by the Trustees.
Investment Income, Gains and Losses, Expenses and Distributions
Investment transactions are accounted for on a trade-date basis. Realized gains and losses from investment transactions are recorded on an identified-cost basis. Interest income and expenses are accrued daily. Dividend income and distributions to shareholders are recorded on the ex-dividend date. Distributions of net investment income are declared and paid monthly. Non-cash dividends included in dividend income, if any, are recorded at fair value. Investment income, realized and unrealized gains and losses and certain fund-level expenses are allocated to each class based on relative average daily net assets, except that Class A Shares, Class B Shares, Class C Shares and Class F Shares may bear distribution services fees and other service fees unique to those classes. The detail of the total fund expense waivers of $867,996 is disclosed in various locations in this Note 2 and Note 5.
Annual Shareholder Report
For the year ended August 31, 2016, an unaffiliated third-party waived $10,299 of portfolio accounting fees.
Dividends are declared separately for each class. No class has preferential dividend rights; differences in per share dividend rates are generally due to differences in separate class expenses.
Other Service Fees
The Fund may pay other service fees up to 0.25% of the average daily net assets of the Fund's Class A Shares, Class B Shares, Class C Shares and Class F Shares to unaffiliated financial intermediaries or to Federated Shareholder Services Company (FSSC) for providing services to shareholders and maintaining shareholder accounts. Subject to the terms described in the Expense Limitation note, FSSC may voluntarily reimburse the Fund for other service fees. For the year ended August 31, 2016, other service fees for the Fund were as follows:
| | Other
Service Fees
Incurred |
| Class A Shares | $629,349 |
| Class B Shares | 30,108 |
| Class C Shares | 174,416 |
| Class F Shares | 495,768 |
| TOTAL | $1,329,641 |
Premium and Discount Amortization
All premiums and discounts on fixed-income securities are amortized/accreted using the effective-interest-rate method.
Federal Taxes
It is the Fund's policy to comply with the Subchapter M provision of the Internal Revenue Code (the “Code”) and to distribute to shareholders each year substantially all of its income. Accordingly, no provision for federal income tax is necessary. As of and during the year ended August 31, 2016, the Fund did not have a liability for any uncertain tax positions. The Fund recognizes interest and penalties, if any, related to tax liabilities as income tax expense in the Statement of Operations. As of August 31, 2016, tax years 2013 through 2016 remain subject to examination by the Fund's major tax jurisdictions, which include the United States of America and the Commonwealth of Massachusetts.
When-Issued and Delayed-Delivery Transactions
The Fund may engage in when-issued or delayed-delivery transactions. The Fund records when-issued securities on the trade date and maintains security positions such that sufficient liquid assets will be available to make payment for the securities purchased. Securities purchased on a when-issued or delayed-delivery basis are marked to market daily and begin earning interest on the settlement date. Losses may occur on these transactions due to changes in market conditions or the failure of counterparties to perform under the contract.
Annual Shareholder Report
Restricted Securities
The Fund may purchase securities which are considered restricted. Restricted securities are securities that either: (a) cannot be offered for public sale without first being registered, or being able to take advantage of an exemption from registration, under the Securities Act of 1933; or (b) are subject to contractual restrictions on public sales. In some cases, when a security cannot be offered for public sale without first being registered, the issuer of the restricted security has agreed to register such securities for resale, at the issuer's expense, either upon demand by the Fund or in connection with another registered offering of the securities. Many such restricted securities may be resold in the secondary market in transactions exempt from registration. Restricted securities may be determined to be liquid under criteria established by the Trustees. The Fund will not incur any registration costs upon such resales. The Fund's restricted securities, like other securities, are priced in accordance with procedures established by and under the general supervision of the Trustees.
Additional information on restricted securities held at August 31, 2016, excluding securities purchased under Rule 144A that have been deemed liquid by the Trustees if applicable, is as follows:
| Security | Acquisition Date | Cost | Market Value |
| Non-Profit Preferred Funding Trust I, Partnership, 9/15/2037 | 10/26/2006 - 2/16/2007 | $3,989,000 | $309,600 |
Port Authority for Columbiana County, OH,
Solid Waste Facility Revenue Bonds
(Series 2004A), 8/1/2034 | 12/23/2004 | $797,831 | $8 |
Port Authority for Columbiana County, OH,
Solid Waste Facility Revenue Bonds
(Series 2012D), 8/1/2034 | 8/1/2014 - 8/1/2015 | $110,159 | $1 |
Other
The preparation of financial statements in conformity with GAAP requires management to make estimates and assumptions that affect the amounts of assets, liabilities, expenses and revenues reported in the financial statements. Actual results could differ from those estimated. The Fund applies Investment Company accounting and reporting guidance.
3. SHARES OF BENEFICIAL INTEREST
The following tables summarize share activity:
| Year Ended August 31 | 2016 | 2015 |
| Class A Shares: | Shares | Amount | Shares | Amount |
| Shares sold | 7,488,898 | $67,738,359 | 5,465,390 | $48,881,128 |
| Shares issued to shareholders in payment of distributions declared | 1,046,627 | 9,444,663 | 1,025,803 | 9,126,405 |
| Shares redeemed | (5,472,829) | (49,637,970) | (5,793,518) | (51,607,563) |
| NET CHANGE RESULTING FROM CLASS A SHARE TRANSACTIONS | 3,062,696 | $27,545,052 | 697,675 | $6,399,970 |
Annual Shareholder Report
| Year Ended August 31 | 2016 | 2015 |
| Class B Shares: | Shares | Amount | Shares | Amount |
| Shares sold | 268,233 | $2,426,365 | 98,407 | $878,652 |
| Shares issued to shareholders in payment of distributions declared | 41,981 | 378,522 | 46,495 | 413,612 |
| Shares redeemed | (292,574) | (2,653,276) | (360,317) | (3,215,403) |
| NET CHANGE RESULTING FROM CLASS B SHARE TRANSACTIONS | 17,640 | $151,611 | (215,415) | $(1,923,139) |
| Year Ended August 31 | 2016 | 2015 |
| Class C Shares: | Shares | Amount | Shares | Amount |
| Shares sold | 2,416,214 | $21,820,337 | 1,367,829 | $12,189,881 |
| Shares issued to shareholders in payment of distributions declared | 219,208 | 1,977,956 | 211,990 | 1,886,115 |
| Shares redeemed | (1,211,625) | (10,971,588) | (1,033,549) | (9,202,470) |
| NET CHANGE RESULTING FROM CLASS C SHARE TRANSACTIONS | 1,423,797 | $12,826,705 | 546,270 | $4,873,526 |
| Year Ended August 31 | 2016 | 2015 |
| Class F Shares: | Shares | Amount | Shares | Amount |
| Shares sold | 2,967,384 | $26,974,645 | 1,719,200 | $15,343,244 |
| Shares issued to shareholders in payment of distributions declared | 809,181 | 7,299,565 | 830,650 | 7,390,024 |
| Shares redeemed | (2,099,780) | (18,963,305) | (2,397,300) | (21,337,996) |
| NET CHANGE RESULTING FROM CLASS F SHARE TRANSACTIONS | 1,676,785 | $15,310,905 | 152,550 | $1,395,272 |
| Year Ended August 31 | 2016 | 2015 |
| Institutional Shares: | Shares | Amount | Shares | Amount |
| Shares sold | 6,274,225 | $56,831,658 | 5,302,659 | $47,202,413 |
| Shares issued to shareholders in payment of distributions declared | 345,789 | 3,121,794 | 256,933 | 2,283,303 |
| Shares redeemed | (2,326,858) | (21,075,586) | (3,836,276) | (34,271,604) |
| NET CHANGE RESULTING FROM INSTITUTIONAL SHARE TRANSACTIONS | 4,293,156 | $38,877,866 | 1,723,316 | $15,214,112 |
| NET CHANGE RESULTING FROM TOTAL FUND SHARE TRANSACTIONS | 10,474,074 | $94,712,139 | 2,904,396 | $25,959,741 |
4. FEDERAL TAX INFORMATION
The timing and character of income and capital gain distributions are determined in accordance with income tax regulations, which may differ from GAAP. These differences are due to differing treatments for discount accretion/premium amortization on debt securities, open defaulted bonds and partnership adjustments.
Annual Shareholder Report
For the year ended August 31, 2016, permanent differences identified and reclassified among the components of net assets were as follows:
| Increase (Decrease) |
Undistributed
Net Investment
Income (Loss) | Accumulated
Net Realized
Gain (Loss) |
| $(34,261) | $34,261 |
Net investment income (loss), net realized gains (losses) and net assets were not affected by the reclassification.
The tax character of distributions as reported on the Statement of Changes in Net Assets for the years ended August 31, 2016 and 2015, was as follows:
| | 2016 | 2015 |
| Tax-exempt income | $24,859,794 | $23,815,805 |
| Ordinary income | $3,905 | $44,973 |
As of August 31, 2016, the components of distributable earnings on a tax basis were as follows:
| Undistributed tax-exempt income | $650,945 |
| Net unrealized appreciation | $52,263,021 |
| Capital loss carryforwards | $(80,363,882) |
The difference between book-basis and tax-basis net unrealized appreciation/depreciation is attributable to differing treatments for discount accretion/premium amortization on debt securities, open defaulted bonds and partnership adjustments.
At August 31, 2016, the cost of investments for federal tax purposes was $621,623,495. The net unrealized appreciation of investments for federal tax purposes was $52,390,044. This consists of net unrealized appreciation from investments for those securities having an excess of value over cost of $59,771,177 and net unrealized depreciation from investments for those securities having an excess of cost over value of $7,381,133.
At August 31, 2016, the Fund had a capital loss carryforward of $80,363,882 which will reduce the Fund's taxable income arising from future net realized gains on investments, if any, to the extent permitted by the Code, thereby reducing the amount of distributions to shareholders which would otherwise be necessary to relieve the Fund of any liability for federal income tax. Pursuant to the Code, a net capital loss incurred in taxable years beginning on or before December 22, 2010, is characterized as short-term and may be carried forward for a maximum of eight tax years (“Carryforward Limit”), whereas a net capital loss incurred in taxable years beginning after December 22, 2010, retains its character as either short-term or long-term, does not expire and is required to be utilized prior to the losses which have a Carryforward Limit.
Annual Shareholder Report
The following schedule summarizes the Fund's capital loss carryforwards and expiration years:
| Expiration Year | Short-Term | Long-Term | Total |
| No expiration | $5,446,629 | $32,289,486 | $37,736,115 |
| 2017 | $20,198,309 | NA | $20,198,309 |
| 2018 | $19,483,511 | NA | $19,483,511 |
| 2019 | $2,945,947 | NA | $2,945,947 |
5. INVESTMENT ADVISER FEE AND OTHER TRANSACTIONS WITH AFFILIATES
Investment Adviser Fee
The advisory agreement between the Fund and the Adviser provides for an annual fee equal to 0.60% of the Fund's average daily net assets. Subject to the terms described in the Expense Limitation note, the Adviser may voluntarily choose to waive any portion of its fee. For the year ended August 31, 2016, the Adviser voluntarily waived $857,697 of its fee.
Administrative Fee
Federated Administrative Services (FAS), under the Administrative Services Agreement, provides the Fund with administrative personnel and services. For purposes of determining the appropriate rate breakpoint, “Investment Complex” is defined as all of the Federated Funds subject to a fee under the Administrative Services Agreement. The fee paid to FAS is based on the average daily net assets of the Investment Complex as specified below, plus certain out-of-pocket expenses:
| Administrative Fee | Average Daily Net Assets
of the Investment Complex |
| 0.150% | on the first $5 billion |
| 0.125% | on the next $5 billion |
| 0.100% | on the next $10 billion |
| 0.075% | on assets in excess of $20 billion |
Subject to the terms described in the Expense Limitation note, FAS may voluntarily choose to waive any portion of its fee. For the year ended August 31, 2016, the annualized fee paid to FAS was 0.078% of average daily net assets of the Fund.
Annual Shareholder Report
Distribution Services Fee
The Fund has adopted a Distribution Plan (the “Plan”) pursuant to Rule 12b-1 under the Act. Under the terms of the Plan, the Fund will compensate Federated Securities Corp. (FSC), the principal distributor, from the daily net assets of the Fund's Class A Shares, Class B Shares, Class C Shares and Class F Shares to finance activities intended to result in the sale of these shares. The Plan provides that the Fund may incur distribution expenses at the following percentages of average daily net assets annually, to compensate FSC:
| Share Class Name | Percentage of Average Daily
Net Assets of Class |
| Class A Shares | 0.05% |
| Class B Shares | 0.75% |
| Class C Shares | 0.75% |
| Class F Shares | 0.05% |
Subject to the terms described in the Expense Limitation note, FSC may voluntarily choose to waive any portion of its fee. For the year ended August 31, 2016, distribution services fees for the Fund were as follows:
| | Distribution
Services Fee
Incurred |
| Class B Shares | $90,325 |
| Class C Shares | 523,247 |
| TOTAL | $613,572 |
For the year ended August 31, 2016, FSC retained $147,487 of fees paid by the Fund. When FSC receives fees, it may pay some or all of them to financial intermediaries whose customers purchase shares. For the year ended August 31, 2016, the Fund's Class A Shares and Class F Shares did not incur a distribution services fee; however, each may begin to incur this fee upon approval by the Trustees.
Sales Charges
Front-end sales charges and contingent deferred sales charges (CDSC) do not represent expenses of the Fund. They are deducted from the proceeds of sales of Fund shares prior to investment or from redemption proceeds prior to remittance, as applicable. For the year ended August 31, 2016, FSC retained $53,457 in sales charges from the sale of Class A Shares. FSC also retained $22,042, $19,048, $7,307 and $19,265 of CDSC relating to redemptions of Class A Shares, Class B Shares, Class C Shares and Class F Shares, respectively.
Other Service Fees
For the year ended August 31, 2016, FSSC received $36,819 of the other service fees disclosed in Note 2.
Annual Shareholder Report
Interfund Transactions
During the year ended August 31, 2016, the Fund engaged in purchase and sale transactions with funds that have a common investment adviser (or affiliated investment advisers), common Directors/Trustees and/or common Officers. These purchase and sale transactions complied with Rule 17a-7 under the Act and amounted to $110,300,000 and $117,650,000, respectively.
Expense Limitation
The Adviser and certain of its affiliates (which may include FSC, FAS and FSSC) on their own initiative have agreed to waive certain amounts of their respective fees and/or reimburse expenses. Total annual fund operating expenses (as shown in the financial highlights, excluding interest expense, extraordinary expenses, line of credit expenses and proxy-related expenses paid by the Fund, if any) paid by the Fund's Class A Shares, Class B Shares, Class C Shares, Class F Shares and Institutional Shares (after the voluntary waivers and reimbursements) will not exceed 0.89%, 1.64%, 1.64%, 0.89% and 0.64% (the “Fee Limit”), respectively, up to but not including the later of (the “Termination Date”): (a) November 1, 2017; or (b) the date of the Fund's next effective Prospectus. While the Adviser and its applicable affiliates currently do not anticipate terminating or increasing these arrangements prior to the Termination Date, these arrangements may only be terminated or the Fee Limit increased prior to the Termination Date with the agreement of the Trustees.
General
Certain Officers and Trustees of the Fund are Officers and Directors or Trustees of certain of the above companies. To efficiently facilitate payment, Directors'/Trustees' fees and certain expenses related to conducting meetings of the Directors/Trustees and other miscellaneous expenses are paid by an affiliate of the Adviser which in due course are reimbursed by the Fund. Such expenses may be included in Accrued and Miscellaneous Expenses on the Statement of Assets and Liabilities and Statement of Operations, respectively.
6. Investment TRANSACTIONS
Purchases and sales of investments, excluding long-term U.S. government securities and short-term obligations, for the year ended August 31, 2016, were as follows:
| Purchases | $152,497,782 |
| Sales | $58,371,247 |
7. CONCENTRATION OF RISK
The Fund has 39.4% of its portfolio invested in lower rated and comparable quality unrated high-yield securities. Investments in higher yield securities may be subject to a greater degree of credit risk and the risk tends to be more sensitive to economic conditions than higher rated securities. The risk of loss due to default by the issuer may be significantly higher for the holders of high yielding securities because such securities are generally unsecured and often subordinated to other creditors of the issuer.
Annual Shareholder Report
8. LINE OF CREDIT
The Fund participates with certain other Federated Funds, on a several basis, in an up to $500,000,000 unsecured, 364-day, committed, revolving line of credit (LOC) agreement. The LOC was made available to finance temporarily the repurchase or redemption of shares of the Fund, failed trades, payment of dividends, settlement of trades and for other short-term, temporary or emergency general business purposes. The Fund cannot borrow under the LOC if an inter-fund loan is outstanding. The Fund's ability to borrow under the LOC also is subject to the limitations of the Act and various conditions precedent that must be satisfied before the Fund can borrow. Loans under the LOC are charged interest at a fluctuating rate per annum equal to the highest, on any day, of (a) (i) the federal funds effective rate, (ii) the one month London Interbank Offer Rate (LIBOR), and (iii) 0.0%, plus (b) a margin. The LOC also requires the Fund to pay, quarterly in arrears and at maturity, its pro rata share of a commitment fee based on the amount of the lenders' commitment that has not been utilized. As of August 31, 2016, the Fund had no outstanding loans. During the year ended August 31, 2016, the Fund did not utilize the LOC.
9. INTERFUND LENDING
Pursuant to an Exemptive Order issued by the Securities and Exchange Commission, the Fund, along with other funds advised by subsidiaries of Federated Investors, Inc., may participate in an interfund lending program. This program provides an alternative credit facility allowing the Fund to borrow from other participating affiliated funds. As of August 31, 2016, there were no outstanding loans. During the year ended August 31, 2016, the program was not utilized.
10. FEDERAL TAX INFORMATION (UNAUDITED)
For the fiscal year ended August 31, 2016, 99.98% of distributions from net investment income is exempt from federal income tax, other than the federal AMT.
Annual Shareholder Report
Report of Independent Registered Public Accounting Firm
TO THE BOARD OF TRUSTEES OF federated municipal securities income trust and shareholders of federated municipal High yield advantage FUND:
We have audited the accompanying statement of assets and liabilities, including the portfolio of investments, of Federated Municipal High Yield Advantage Fund (the “Fund”), a portfolio of Federated Municipal Securities Income Trust, as of August 31, 2016, and the related statement of operations for the year then ended, the statements of changes in net assets for each of the years in the two-year period then ended and the financial highlights for each of the years or periods in the five-year period then ended. These financial statements and financial highlights are the responsibility of the Fund's management. Our responsibility is to express an opinion on these financial statements and financial highlights based on our audits.
We conducted our audits in accordance with the standards of the Public Company Accounting Oversight Board (United States). Those standards require that we plan and perform the audit to obtain reasonable assurance about whether the financial statements and financial highlights are free of material misstatement. An audit includes examining, on a test basis, evidence supporting the amounts and disclosures in the financial statements. Our procedures included confirmation of securities owned as of August 31, 2016, by correspondence with the custodian and brokers or by other appropriate auditing procedures. An audit also includes assessing the accounting principles used and significant estimates made by management, as well as evaluating the overall financial statement presentation. We believe that our audits provide a reasonable basis for our opinion.
In our opinion, the financial statements and financial highlights referred to above present fairly, in all material respects, the financial position of Federated Municipal High Yield Advantage Fund as of August 31, 2016, and the results of its operations for the year then ended, the changes in its net assets for each of the years in the two-year period then ended and the financial highlights for each of the years or periods in the five-year period then ended, in conformity with U.S. generally accepted accounting principles.
Boston, Massachusetts
October 24, 2016
Annual Shareholder Report
Shareholder Expense Example (unaudited)
As a shareholder of the Fund, you incur two types of costs: (1) transaction costs, including sales charges (loads) on purchase or redemption payments; and (2) ongoing costs, including management fees and to the extent applicable, distribution (12b-1) fees and/or other service fees and other Fund expenses. This Example is intended to help you to understand your ongoing costs (in dollars) of investing in the Fund and to compare these costs with the ongoing costs of investing in other mutual funds. It is based on an investment of $1,000 invested at the beginning of the period and held for the entire period from March 1, 2016 to August 31, 2016.
ACTUAL EXPENSES
The first section of the table below provides information about actual account values and actual expenses. You may use the information in this section, together with the amount you invested, to estimate the expenses that you incurred over the period. Simply divide your account value by $1,000 (for example, an $8,600 account value divided by $1,000 = 8.6), then multiply the result by the number in the first section under the heading entitled “Expenses Paid During Period” to estimate the expenses attributable to your investment during this period.
HYPOTHETICAL EXAMPLE FOR COMPARISON PURPOSES
The second section of the table below provides information about hypothetical account values and hypothetical expenses based on the Fund's actual expense ratio and an assumed rate of return of 5% per year before expenses, which is not the Fund's actual return. Thus, you should not use the hypothetical account values and expenses to estimate the actual ending account balance or your expenses for the period. Rather, these figures are required to be provided to enable you to compare the ongoing costs of investing in the Fund with other funds. To do so, compare this 5% hypothetical example with the 5% hypothetical examples that appear in the shareholder reports of the other funds.
Annual Shareholder Report
Please note that the expenses shown in the table are meant to highlight your ongoing costs only and do not reflect any transaction costs, such as sales charges (loads) on purchase or redemption payments. Therefore, the second section of the table is useful in comparing ongoing costs only, and will not help you determine the relative total costs of owning different funds. In addition, if these transaction costs were included, your costs would have been higher.
| | Beginning
Account Value
3/1/2016 | Ending
Account Value
8/31/2016 | Expenses Paid
During Period1 |
| Actual: | | | |
| Class A Shares | $1,000 | $1,050.50 | $4.59 |
| Class B Shares | $1,000 | $1,046.60 | $8.44 |
| Class C Shares | $1,000 | $1,047.70 | $8.44 |
| Class F Shares | $1,000 | $1,051.70 | $4.59 |
| Institutional Shares | $1,000 | $1,051.90 | $3.30 |
Hypothetical (assuming a 5% return
before expenses): | | | |
| Class A Shares | $1,000 | $1,020.66 | $4.52 |
| Class B Shares | $1,000 | $1,016.89 | $8.31 |
| Class C Shares | $1,000 | $1,016.89 | $8.31 |
| Class F Shares | $1,000 | $1,020.66 | $4.52 |
| Institutional Shares | $1,000 | $1,021.92 | $3.25 |
| 1 | Expenses are equal to the Fund's annualized net expense ratios, multiplied by the average account value over the period, multiplied by 184/366 (to reflect the one-half-year period). The annualized net expense ratios are as follows: |
| | |
| Class A Shares | 0.89% |
| Class B Shares | 1.64% |
| Class C Shares | 1.64% |
| Class F Shares | 0.89% |
| Institutional Shares | 0.64% |
Annual Shareholder Report
Board of Trustees and Trust Officers
The Board of Trustees is responsible for managing the Trust's business affairs and for exercising all the Trust's powers except those reserved for the shareholders. The following tables give information about each Trustee and the senior officers of the Fund. Where required, the tables separately list Trustees who are “interested persons” of the Fund (i.e., “Interested” Trustees) and those who are not (i.e., “Independent” Trustees). Unless otherwise noted, the address of each person listed is Federated Investors Tower, 1001 Liberty Avenue, Pittsburgh, PA 15222. The address of all Independent Trustees listed is 4000 Ericsson Drive, Warrendale, PA 15086-7561; Attention: Mutual Fund Board. As of December 31, 2015, the Trust comprised 5 portfolio(s), and the Federated Fund Family consisted of 38 investment companies (comprising 122 portfolios). Unless otherwise noted, each Officer is elected annually. Unless otherwise noted, each Trustee oversees all portfolios in the Federated Fund Family and serves for an indefinite term. The Fund's Statement of Additional Information includes additional information about Trust Trustees and is available, without charge and upon request, by calling 1-800-341-7400.
Interested TRUSTEES Background
Name
Birth Date
Positions Held with Trust
Date Service Began | Principal Occupation(s) for Past Five Years,
Other Directorships Held and Previous Position(s) |
J. Christopher Donahue*
Birth Date: April 11, 1949
President and Trustee
Indefinite Term
Began serving: August 1990 | Principal Occupations: Principal Executive Officer and President of certain of the Funds in the Federated Fund Family; Director or Trustee of the Funds in the Federated Fund Family; President, Chief Executive Officer and Director, Federated Investors, Inc.; Chairman and Trustee, Federated Investment Management Company; Trustee, Federated Investment Counseling; Chairman and Director, Federated Global Investment Management Corp.; Chairman, Federated Equity Management Company of Pennsylvania and Passport Research, Ltd. (investment advisory subsidiary of Federated); Trustee, Federated Shareholder Services Company; Director, Federated Services Company.
Previous Positions: President, Federated Investment Counseling; President and Chief Executive Officer, Federated Investment Management Company, Federated Global Investment Management Corp. and Passport Research, Ltd. |
Annual Shareholder Report
Name
Birth Date
Positions Held with Trust
Date Service Began | Principal Occupation(s) for Past Five Years,
Other Directorships Held and Previous Position(s) |
John B. Fisher*
Birth Date: May 16, 1956
Trustee
Indefinite Term
Began serving: May 2016 | Principal Occupations: Principal Executive Officer and President of certain of the Funds in the Federated Fund Family; Director or Trustee of certain of the Funds in the Federated Fund Family; Vice President, Federated Investors, Inc.; President, Director/Trustee and CEO, Federated Advisory Services Company, Federated Equity Management Company of Pennsylvania, Federated Global Investment Management Corp., Federated Investment Counseling, Federated Investment Management Company; President and CEO of Passport Research, Ltd.; President of some of the Funds in the Federated Fund Complex and Director, Federated Investors Trust Company.
Previous Positions: President and Director of the Institutional Sales Division of Federated Securities Corp.; President and Director of Federated Investment Counseling; Director, Edgewood Securities Corp.; Director, Federated Services Company; Director, Federated Investors, Inc.; Chairman and Director, Southpointe Distribution Services, Inc. and President, Technology, Federated Services Company. |
| * | Reasons for “interested” status: J. Christopher Donahue and John B. Fisher are interested due to their beneficial ownership of shares of Federated Investors, Inc. and due to positions they hold with Federated and its subsidiaries. J. Christopher Donahue is the son of John F. Donahue, Chairman Emeritus of the Federated Funds. |
INDEPENDENT TRUSTEES Background
Name
Birth Date
Positions Held with Trust
Date Service Began | Principal Occupation(s) for Past Five Years,
Other Directorships Held, Previous Position(s) and Qualifications |
John T. Collins
Birth Date: January 24, 1947
Trustee
Indefinite Term
Began serving: October 2013 | Principal Occupations: Director or Trustee of the Federated Fund Family; Retired.
Other Directorships Held: Director, Chair of the Compensation Committee, Audit Committee member, KLX Corp.
Qualifications: Mr. Collins has served in several business and financial management roles and directorship positions throughout his career. Mr. Collins previously served as Chairman and CEO, The Collins Group, Inc. (a private equity firm). Mr. Collins serves as Chairman Emeriti, Bentley University. Mr. Collins previously served as Director, FleetBoston Financial Corp.; Director and Audit Committee Member, Bank of America Corp. and Director, Beth Israel Deaconess Medical Center (Harvard University Affiliate Hospital). |
Annual Shareholder Report
Name
Birth Date
Positions Held with Trust
Date Service Began | Principal Occupation(s) for Past Five Years,
Other Directorships Held, Previous Position(s) and Qualifications |
G. Thomas Hough
Birth Date: February 28, 1955
Trustee
Indefinite Term
Began serving: August 2015 | Principal Occupations: Director or Trustee of the Federated Fund Family; Retired.
Other Directorships Held: Director, Chair of the Audit Committee, Governance Committee, Publix Super Markets, Inc.; Director, Equifax, Inc.
Qualifications: Mr. Hough has served in accounting, business management and directorship positions throughout his career. Mr. Hough most recently held the position of Americas Vice Chair of Assurance with Ernst & Young LLP. Mr. Hough is an Executive Committee member of the United States Golf Association, he serves on the President's Cabinet and Business School Board of Visitors for the University of Alabama and is on the Business School Board of Visitors for Wake Forest University. |
Maureen Lally-Green
Birth Date: July 5, 1949
Trustee
Indefinite Term
Began serving: August 2009 | Principal Occupations: Director or Trustee of the Federated Fund Family; Interim Dean of the Duquesne University School of Law; Adjunct Professor of Law, Duquesne University School of Law.
Other Directorships Held: Director, CONSOL Energy Inc.
Qualifications: Judge Lally-Green has served in various legal and business roles and directorship positions throughout her career. Judge Lally-Green previously served as: Associate General Secretary, Diocese of Pittsburgh; a member of the Superior Court of Pennsylvania; and as a Professor of Law, Duquesne University School of Law. Judge Lally-Green also holds the positions on either a public or not for profit Board of Directors as follows: Member, Pennsylvania State Board of Education (public); Director and Chair, UPMC Mercy Hospital; Regent, St. Vincent Seminary; Director and Vice Chair, Our Campaign for the Church Alive!, Inc.; Director, Saint Vincent College; and Director and Chair, Cardinal Wuerl North Catholic High School, Inc. Judge Lally-Green has held the positions of: Director, Auberle; Director, Ireland Institute of Pittsburgh; Director, Saint Thomas More Society; and Director, Catholic High Schools of the Diocese of Pittsburgh, Inc. |
Peter E. Madden
Birth Date: March 16, 1942
Trustee
Indefinite Term
Began serving: August 1991 | Principal Occupation: Director or Trustee, and Chair of the Board of Directors or Trustees, of the Federated Fund Family; Retired.
Other Directorships Held: None.
Qualifications: Mr. Madden has served in several business management, mutual fund services and directorship positions throughout his career. Mr. Madden previously served as President, Chief Operating Officer and Director, State Street Bank and Trust Company (custodian bank) and State Street Corporation (financial services). He was Director, VISA USA and VISA International and Chairman and Director, Massachusetts Bankers Association. Mr. Madden served as Director, Depository Trust Corporation and Director, The Boston Stock Exchange. Mr. Madden also served as a Representative to the Commonwealth of Massachusetts General Court. |
Annual Shareholder Report
Name
Birth Date
Positions Held with Trust
Date Service Began | Principal Occupation(s) for Past Five Years,
Other Directorships Held, Previous Position(s) and Qualifications |
Charles F. Mansfield, Jr.
Birth Date: April 10, 1945
Trustee
Indefinite Term
Began serving: January 1999 | Principal Occupations: Director or Trustee of the Federated Fund Family; Management Consultant.
Other Directorships Held: None.
Qualifications: Mr. Mansfield has served in several banking, business management and educational roles and directorship positions throughout his career. Mr. Mansfield previously served as Chief Executive Officer, PBTC International Bank; Partner, Arthur Young & Company (now Ernst & Young LLP); Chief Financial Officer of Retail Banking Sector, Chase Manhattan Bank; Senior Vice President, HSBC Bank USA (formerly, Marine Midland Bank); Vice President, Citibank; Assistant Professor of Banking and Finance, Frank G. Zarb School of Business, Hofstra University; Executive Vice President DVC Group, Inc. (marketing, communications and technology). |
Thomas M. O'Neill
Birth Date: June 14, 1951
Trustee
Indefinite Term
Began serving: August 2006 | Principal Occupations: Director or Trustee, Chair of the Audit Committee of the Federated Fund Family; Sole Proprietor, Navigator Management Company (investment and strategic consulting).
Other Directorships Held: None.
Qualifications: Mr. O'Neill has served in several business, mutual fund and financial management roles and directorship positions throughout his career. Mr. O'Neill serves as Director, Medicines for Humanity and Director, The Golisano Children's Museum of Naples, Florida. Mr. O'Neill previously served as Chief Executive Officer and President, Managing Director and Chief Investment Officer, Fleet Investment Advisors; President and Chief Executive Officer, Aeltus Investment Management, Inc.; General Partner, Hellman, Jordan Management Co., Boston, MA; Chief Investment Officer, The Putnam Companies, Boston, MA; Credit Analyst and Lending Officer, Fleet Bank; Director and Consultant, EZE Castle Software (investment order management software); and Director, Midway Pacific (lumber). |
P. Jerome Richey
Birth Date: February 23, 1949
Trustee
Indefinite Term
Began serving: October 2013 | Principal Occupations: Director or Trustee of the Federated Fund Family; Management Consultant.
Other Directorships Held: None.
Qualifications: Mr. Richey has served in several business and legal management roles and directorship positions throughout his career. Mr. Richey most recently held the positions of Senior Vice Chancellor and Chief Legal Officer, University of Pittsburgh. Mr. Richey serves as Board Member, Epilepsy Foundation of Western Pennsylvania and Board member, World Affairs Council of Pittsburgh. Mr. Richey previously served as Chief Legal Officer and Executive Vice President, CONSOL Energy Inc. and Shareholder, Buchanan Ingersoll & Rooney PC (a law firm). |
Annual Shareholder Report
Name
Birth Date
Positions Held with Trust
Date Service Began | Principal Occupation(s) for Past Five Years,
Other Directorships Held, Previous Position(s) and Qualifications |
John S. Walsh
Birth Date: November 28, 1957
Trustee
Indefinite Term
Began serving: June 1999 | Principal Occupations: Director or Trustee of the Federated Fund Family; President and Director, Heat Wagon, Inc. (manufacturer of construction temporary heaters); President and Director, Manufacturers Products, Inc. (distributor of portable construction heaters); President, Portable Heater Parts, a division of Manufacturers Products, Inc.
Other Directorships Held: None.
Qualifications: Mr. Walsh has served in several business management roles and directorship positions throughout his career. Mr. Walsh previously served as Vice President, Walsh & Kelly, Inc. (paving contractors). |
OFFICERS
Name
Birth Date
Positions Held with Trust
Date Service Began | Principal Occupation(s) for Past Five Years
and Previous Position(s) |
John W. McGonigle
Birth Date: October 26, 1938
EXECUTIVE VICE PRESIDENT AND SECRETARY
Officer since: August 1990 | Principal Occupations: Executive Vice President and Secretary of the Federated Fund Family; Vice Chairman, Executive Vice President, Secretary and Director, Federated Investors, Inc.
Previous Positions: Trustee, Federated Investment Management Company and Federated Investment Counseling; Director, Federated Global Investment Management Corp., Federated Services Company and Federated Securities Corp. |
Lori A. Hensler
Birth Date: January 6, 1967
TREASURER
Officer since: April 2013 | Principal Occupations: Principal Financial Officer and Treasurer of the Federated Fund Family; Senior Vice President, Federated Administrative Services; Financial and Operations Principal for Federated Securities Corp. and Edgewood Services, Inc.; and Assistant Treasurer, Federated Investors Trust Company. Ms. Hensler has received the Certified Public Accountant designation.
Previous Positions: Controller of Federated Investors, Inc.; Senior Vice President and Assistant Treasurer, Federated Investors Management Company; Treasurer, Federated Investors Trust Company; Assistant Treasurer, Federated Administrative Services, Federated Administrative Services, Inc., Federated Securities Corp., Edgewood Services, Inc., Federated Advisory Services Company, Federated Equity Management Company of Pennsylvania, Federated Global Investment Management Corp., Federated Investment Counseling, Federated Investment Management Company, Passport Research, Ltd., and Federated MDTA, LLC; Financial and Operations Principal for Federated Securities Corp., Edgewood Services, Inc. and Southpointe Distribution Services, Inc. |
Annual Shareholder Report
Name
Birth Date
Positions Held with Trust
Date Service Began | Principal Occupation(s) for Past Five Years
and Previous Position(s) |
Richard B. Fisher
Birth Date: May 17, 1923
Vice Chairman
Officer since: August 2002 | Principal Occupations: Vice Chairman or Vice President of some of the Funds in the Federated Fund Family; Vice Chairman, Federated Investors, Inc.; Chairman, Federated Securities Corp.
Previous Positions: President and Director or Trustee of some of the Funds in the Federated Fund Family; Executive Vice President, Federated Investors, Inc.; Director and Chief Executive Officer, Federated Securities Corp. |
Peter J. Germain
Birth Date: September 3, 1959
CHIEF LEGAL OFFICER
Officer since: January 2005 | Principal Occupations: Mr. Germain is Chief Legal Officer of the Federated Fund Family. He is General Counsel and Vice President, Federated Investors, Inc.; President, Federated Administrative Services and Federated Administrative Services, Inc.; Vice President, Federated Securities Corp.; Secretary, Federated Private Asset Management, Inc.; and Secretary, Retirement Plan Service Company of America. Mr. Germain joined Federated in 1984 and is a member of the Pennsylvania Bar Association.
Previous Positions: Deputy General Counsel, Special Counsel, Managing Director of Mutual Fund Services, Federated Investors, Inc.; Senior Vice President, Federated Services Company; and Senior Corporate Counsel, Federated Investors, Inc. |
Stephen Van Meter
Birth Date: June 5, 1975
CHIEF COMPLIANCE OFFICER AND SENIOR VICE PRESIDENT
Officer since: July 2015 | Principal Occupations: Senior Vice President and Chief Compliance Officer of the Federated Fund Family; Vice President and Chief Compliance Officer of Federated Investors, Inc. and Chief Compliance Officer of certain of its subsidiaries. Mr. Van Meter joined Federated in October 2011. He holds FINRA licenses under Series 3, 7, 24 and 66.
Previous Positions: Mr. Van Meter previously held the position of Compliance Operating Officer, Federated Investors, Inc. Prior to joining Federated, Mr. Van Meter served at the United States Securities and Exchange Commission in the positions of Senior Counsel, Office of Chief Counsel, Division of Investment Management and Senior Counsel, Division of Enforcement. |
Robert J. Ostrowski
Birth Date: April 26, 1963
Chief Investment Officer
Officer since: February 2010 | Principal Occupations: Robert J. Ostrowski joined Federated in 1987 as an Investment Analyst and became a Portfolio Manager in 1990. He was named Chief Investment Officer of Federated's taxable fixed-income products in 2004 and also serves as a Senior Portfolio Manager. Mr. Ostrowski became an Executive Vice President of the Fund's Adviser in 2009 and served as a Senior Vice President of the Fund's Adviser from 1997 to 2009. Mr. Ostrowski has received the Chartered Financial Analyst designation. He received his M.S. in Industrial Administration from Carnegie Mellon University. |
Annual Shareholder Report
Evaluation and Approval of Advisory Contract–May 2016
Federated Municipal High Yield Advantage Fund (the “Fund”)
Following a review and recommendation of approval by the Fund's independent trustees, the Fund's Board of Trustees (the “Board”) reviewed and unanimously approved at its May 2016 meetings the continuation of the Fund's investment advisory contract for an additional one-year term. The Board's decision regarding the contract reflects the exercise of its business judgment after consideration of all of the information received on whether to continue the existing arrangements.
The Board had previously appointed a Senior Officer, whose duties include specified responsibilities relating to the process by which advisory fees are to be charged to a Federated fund. The Senior Officer has the authority to retain consultants, experts, or staff as may be reasonably necessary to assist in the performance of his duties, reports directly to the Board, and may be terminated only with the approval of a majority of the independent members of the Board. The Senior Officer prepared and furnished to the Board an independent, written evaluation that covered topics discussed below (the “Senior Officer's Evaluation”). The Board considered the Senior Officer's Evaluation, along with other information, in deciding to approve the investment advisory contract.
The Board is also familiar with and considered judicial decisions concerning allegedly excessive investment advisory fees, which have indicated that the following factors may be relevant to an adviser's fiduciary duty with respect to its receipt of compensation from a fund: the nature and quality of the services provided by an adviser to a fund and its shareholders, including the performance and fees and expenses of the fund and of comparable funds; an adviser's cost of providing the services, including the profitability to an adviser of providing advisory services to a fund; the extent to which an adviser may realize “economies of scale” as a fund grows larger and, if such economies of scale exist, whether they have been shared with a fund and its shareholders or the family of funds; any “fall-out financial benefits” that accrue to an adviser because of its relationship with a fund (including research services received from brokers that execute fund trades and any fees paid to affiliates of an adviser for services rendered to a fund); comparative fee and expense structures, including a comparison of fees paid to an adviser with those paid by similar funds; and the extent of care, conscientiousness and independence with which board members perform their duties and their expertise, including whether they are fully informed about all facts the board deems relevant to its consideration of an adviser's services and fees. The Board noted that the Securities and Exchange Commission (“SEC”) disclosure requirements regarding the basis for the Board's approval of the Fund's investment advisory contract generally track the factors listed above. Consistent with these judicial decisions and SEC disclosure requirements, the Board also considered management fees charged to
Annual Shareholder Report
institutional and other clients of Federated Investment Management Company (the “Adviser”) for what might be viewed as like services. The Board was aware of these factors and was guided by them in its review of the Fund's investment advisory contract to the extent it considered them to be appropriate and relevant, as discussed further below.
The Board considered and weighed these circumstances in light of its substantial accumulated experience in governing the Fund and working with Federated Investors, Inc. and its affiliates (“Federated”) on matters relating to the Federated funds, and was assisted in its deliberations by independent legal counsel. Throughout the year, and in connection with its May meetings, the Board requested and received substantial and detailed information about the Fund and the Federated organization that was in addition to the extensive materials that comprise and accompany the Senior Officer's Evaluation. Federated provided much of this information at each regular meeting of the Board, and furnished additional substantial information in connection with the May meetings at which the Board's formal review of the investment advisory contract occurred. At the May meetings in addition to meeting in separate sessions of the independent trustees without management present, senior management of the Adviser also met with the independent trustees and their counsel to discuss the materials presented and any other matters thought relevant by the Adviser or the trustees. Between regularly scheduled meetings, the Board also received information on particular matters as the need arose. Thus, the Board's consideration of the investment advisory contract included review of the Senior Officer's Evaluation, accompanying data and additional information covering such matters as: the Adviser's investment philosophy, revenue, profitability, personnel and processes; investment and operating strategies; the Fund's short- and long-term performance (in absolute terms, both on a gross basis and net of expenses, as well as in relationship to its particular investment program and certain competitor or “peer group” funds and/or other benchmarks, as appropriate), and comments on the reasons for performance; the Fund's investment objectives; the Fund's expenses (including the advisory fee itself and the overall expense structure of the Fund, both in absolute terms and relative to similar and/or competing funds, with due regard for contractual or voluntary expense limitations); the use and allocation of brokerage commissions derived from trading the Fund's portfolio securities (if any); and the nature, quality and extent of the advisory and other services provided to the Fund by the Adviser and its affiliates. The Board also considered the preferences and expectations of Fund shareholders; the entrepreneurial risk assumed by the Adviser in sponsoring the Fund; the continuing state of competition in the mutual fund industry and market practices; the range of comparable fees for similar funds in the mutual fund industry; the Fund's relationship to the Federated funds which include a comprehensive array of funds with different investment objectives, policies and strategies which are generally available for exchange without the incurrence of additional sales charges; compliance and
Annual Shareholder Report
audit reports concerning the Federated funds and the Federated companies that service them (including communications from regulatory agencies), as well as Federated's responses to any issues raised therein; and relevant developments in the mutual fund industry and how the Federated funds and/or Federated are responding to them. The Board's evaluation process is evolutionary. The criteria considered and the emphasis placed on relevant criteria change in recognition of changing circumstances in the mutual fund marketplace.
While mindful that courts have cautioned against giving such comparisons too much weight, the Board has found the use of comparisons of the Fund's fees and expenses to other mutual funds with comparable investment programs to be relevant to its deliberations. In this regard, the Board was presented with, and considered, information regarding the contractual advisory fee rates, net advisory fee rates, total expense ratios and each element of the Fund's total expense ratio (i.e., gross and net advisory fees, custody fees, portfolio accounting fees and transfer agency fees) relative to the Fund's peers. The Board focused on comparisons with other similar mutual funds more heavily than non-mutual fund products or services because it is believed that they are more relevant. For example, other mutual funds are the products most like the Fund, they are readily available to Fund shareholders as alternative investment vehicles, and they are the type of investment vehicle in fact chosen and maintained by the Fund's investors. The range of their fees and expenses therefore appears to be a relevant indicator of what consumers have found to be reasonable in the precise marketplace in which the Fund competes.
The Board reviewed the contractual advisory fee rate, net advisory fee rate where partially waived and other expenses of the Fund and noted the position of the Fund's fee rates relative to its peers. In this regard, the Board noted that the contractual advisory fee rate was above the median of the relevant peer group, but the Board noted the applicable waivers and reimbursements, and that the overall expense structure of the Fund remained competitive in the context of other factors considered by the Board.
By contrast, the Senior Officer has reviewed Federated's fees for providing advisory services to products outside the Federated funds (e.g., institutional and separate accounts and sub-adviser services). He concluded that mutual funds and institutional accounts are inherently different products. Those differences include, but are not limited to, different types of targeted investors; being subject to different laws and regulations; different legal structures; different average account sizes and portfolio management techniques made necessary by different cash flows and different associated costs; and the time spent by portfolio managers and their teams, funds financial services, legal, compliance and risk management in reviewing securities pricing, addressing different administrative responsibilities, addressing different degrees of risk associated with management and a variety of different costs. The Senior Officer did not consider the fees for providing advisory services to these outside products to be determinative in judging the appropriateness of mutual fund advisory fees.
Annual Shareholder Report
Following such evaluation, the Board concluded, within the context of its full deliberations, that the expenses of the Fund are reasonable and supported renewal of the investment advisory contract with respect to the Fund.
The Board considered the nature, extent and quality of the services provided to the Fund by the Adviser and the resources of the Adviser and its affiliates dedicated to the Fund. In this regard, the Board evaluated, among other things, the Adviser's personnel, experience, track record, overall reputation and willingness to invest in personnel and infrastructure that benefit the Fund. In addition, the Board reviewed the qualifications, backgrounds and responsibilities of the portfolio management team primarily responsible for the day-to-day management of the Fund. The Board noted the compliance programs of and the compliance-related resources provided to the Fund by the Adviser. The Fund's ability to deliver competitive performance when compared to its peer group was also deemed to be relevant by the Board as a useful indicator of how the Adviser is executing the Fund's investment program, which in turn was one of the Board's considerations in reaching a conclusion that the nature, extent, and quality of the Adviser's investment management services were such as to warrant continuation of the investment advisory contract.
In evaluating the Fund's investment performance, the Board considered performance results in light of the Fund's investment objective, strategies and risks, as disclosed in the Fund's prospectus. The Board particularly considered detailed investment reports on the Fund's performance provided to the Board throughout the year and in connection with the May meetings. The Senior Officer also reviewed information compiled by Federated, using data supplied by independent fund ranking organizations, regarding the performance of, and fees charged by, other mutual funds, noting his view that comparisons to fund peer groups may be helpful, though not conclusive, in judging the reasonableness of the proposed fees. The Board considered, in evaluating such comparisons, that in some cases individual funds may exhibit significant and unique differences in their objectives and management techniques when compared to other funds within an industry peer group.
For the periods covered by the Senior Officer's Evaluation, the Fund's performance for the three-year and five-year periods was above the median of the relevant peer group, and the Fund's performance was at the median of the relevant peer group for the one-year period. The Board discussed the Fund's performance with the Adviser and recognized the efforts being taken by the Adviser in the context of the other factors considered relevant by the Board.
Following such evaluation, the Board concluded, within the context of its full deliberations, that the performance of the Fund supported renewal of the investment advisory contract with respect to the Fund.
The Board also received financial information about Federated, including information regarding the compensation and ancillary (or “fall-out”) benefits Federated derived from its relationships with the Federated funds. This information covered not only the fees under the investment advisory contracts,
Annual Shareholder Report
but also fees received by Federated's subsidiaries for providing other services to the Federated funds under separate contracts (e.g., for serving as the Federated funds' administrator). The information also detailed any indirect benefit Federated may derive from its receipt of research services from brokers who execute Federated fund trades. In addition, the Board considered the fact that, in order for a fund to be competitive in the marketplace, Federated and its affiliates frequently waived fees and/or reimbursed expenses and have disclosed to fund investors and/or indicated to the Board their intention to do so in the future, where appropriate. Moreover, the Board receives regular reporting as to the institution, adjustment or elimination of these voluntary waivers. The Board considered Federated's previous reductions in contractual management fees to certain funds in response to the Senior Officer's recommendations.
Federated furnished information, requested by the Senior Officer, that reported revenues on a fund-by-fund basis and made estimates of the allocation of expenses on a fund-by-fund basis, using allocation methodologies specified by the Senior Officer. The Senior Officer noted that, while these cost allocation reports apply consistent allocation processes, the inherent difficulties in allocating costs continues to cause the Senior Officer to question the precision of the process and to conclude that such reports may be unreliable, since a single change in an allocation estimate may dramatically alter the resulting estimate of cost and/or profitability of a fund and may produce unintended consequences. The allocation information, including the Senior Officer's view that fund-by-fund estimations may be unreliable, was considered in the analysis by the Board.
The Board and the Senior Officer also reviewed information compiled by Federated comparing profitability information for Federated to other publicly held fund management companies. In this regard, the Senior Officer concluded that Federated's profit margins did not appear to be excessive. The Senior Officer also noted that Federated appeared financially sound, with the resources to fulfill its obligations under its contracts with the Fund.
The Senior Officer's Evaluation also discussed the notion of possible realization of “economies of scale” as a fund grows larger. The Board considered in this regard that the Adviser has made significant and long-term investments in areas that support all of the Federated funds, such as personnel and processes for the portfolio management, shareholder services, compliance, internal audit, and risk management functions, as well as systems technology (including technology relating to cybersecurity), and that the benefits of these efforts (as well as any economies of scale, should they exist) were likely to be enjoyed by the fund family as a whole. The Board noted that the Adviser's investments in these areas are extensive. In addition, the Board considered that Federated and its affiliates have frequently waived fees and/or reimbursed expenses and that this has allowed fund shareholders to share potential economies of scale from a fund's inception. Federated, as it does throughout the year, and again in connection with the Board's review, furnished information relative to revenue sharing or adviser paid fees. Federated and the Senior Officer noted that this information
Annual Shareholder Report
should be viewed to determine if there was an incentive to either not apply breakpoints or to apply breakpoints at higher levels and should not be viewed to determine the appropriateness of advisory fees, because it would represent marketing and distribution expenses. Finally, the Board also noted the absence of any applicable regulatory or industry guidelines on this subject, which (as discussed in the Senior Officer's Evaluation) is compounded by the lack of any common industry practice or general pattern with respect to structuring fund advisory fees with “breakpoints” that serve to reduce the fee as a fund attains a certain size.
The Senior Officer noted that, subject to the comments and recommendations made within the Senior Officer's Evaluation, his observations and the information accompanying the Senior Officer's Evaluation supported a finding by the Board that the management fee for the fund was reasonable. Under these circumstances, no changes were recommended to, and no objection was raised to, the continuation of the Fund's investment advisory contract.
In its decision to continue an existing investment advisory contract, the Board was mindful of the potential disruptions of the Fund's operations and various risks, uncertainties and other effects that could occur as a result of a decision to terminate or not renew an investment advisory contract. In particular, the Board recognized that many shareholders have invested in the Fund on the strength of the Adviser's industry standing and reputation and with the expectation that the Adviser will have a continuing role in providing advisory services to the Fund. Thus, the Board's approval of the investment advisory contract reflected the fact that it is the shareholders who have effectively selected the Adviser by virtue of having invested in the Fund. The Board concluded that, in light of the factors discussed above, including the nature, quality and scope of the services provided to the Fund by the Adviser and its affiliates, continuation of the investment advisory contract was appropriate.
The Board based its decision to approve the investment advisory contract on the totality of the circumstances and relevant factors and with a view to past and future long-term considerations. Not all of the factors and considerations identified above were necessarily relevant to the Fund, nor did the Board consider any one of them to be determinative. With respect to the factors that were relevant, the Board's decision to approve the continuation of the contract reflects its determination that Federated's performance and actions provided a satisfactory basis to support the decision to continue the existing arrangement.
Annual Shareholder Report
Voting Proxies on Fund Portfolio Securities
A description of the policies and procedures that the Fund uses to determine how to vote proxies, if any, relating to securities held in the Fund's portfolio is available, without charge and upon request, by calling 1-800-341-7400. A report on “Form N-PX” of how the Fund voted any such proxies during the most recent 12-month period ended June 30 is available via the Proxy Voting Record (Form N-PX) link associated with the Fund and share class name at www.FederatedInvestors.com/FundInformation. Form N-PX filings are also available at the SEC's website at www.sec.gov.
Quarterly Portfolio Schedule
The Fund files with the SEC a complete schedule of its portfolio holdings, as of the close of the first and third quarters of its fiscal year, on “Form N-Q.” These filings are available on the SEC's website at www.sec.gov and may be reviewed and copied at the SEC's Public Reference Room in Washington, DC. (Call 1-800-SEC-0330 for information on the operation of the Public Reference Room.) You may also access this information via the link to the Fund and share class name at www.FederatedInvestors.com/FundInformation.
Annual Shareholder Report
Mutual funds are not bank deposits or obligations, are not guaranteed by any bank and are not insured or guaranteed by the U.S. government, the Federal Deposit Insurance Corporation, the Federal Reserve Board or any other government agency. Investment in mutual funds involves investment risk, including the possible loss of principal.
This Report is authorized for distribution to prospective investors only when preceded or accompanied by the Fund's Prospectus, which contains facts concerning its objective and policies, management fees, expenses and other information.
Federated Municipal High Yield Advantage Fund
Federated Investors Funds
4000 Ericsson Drive
Warrendale, PA 15086-7561
Contact us at FederatedInvestors.com
or call 1-800-341-7400.
Federated Securities Corp., Distributor
CUSIP 313923864
CUSIP 313923856
CUSIP 313923849
CUSIP 313923831
CUSIP 313923815
G01091-01 (10/16)
Federated is a registered trademark of Federated Investors, Inc.
2016 ©Federated Investors, Inc.
Annual Shareholder Report
August 31, 2016
Federated Michigan Intermediate Municipal Trust
Fund Established 1991
A Portfolio of Federated Municipal Securities Income Trust
Dear Valued Shareholder,
I am pleased to present the Annual Shareholder Report for your fund covering the period from September 1, 2015 through August 31, 2016. This report includes Management's Discussion of Fund Performance, a complete listing of your fund's holdings, performance information and financial statements along with other important fund information.
In addition, our website, FederatedInvestors.com, offers easy access to Federated resources that include timely fund updates, economic and market insights from our investment strategists, and financial planning tools. We invite you to register to take full advantage of its capabilities.
Thank you for investing with Federated. I hope you find this information useful and look forward to keeping you informed.
Sincerely,
J. Christopher Donahue, President
Not FDIC Insured • May Lose Value • No Bank Guarantee
CONTENTS
| 1 |
| 8 |
| 9 |
| 16 |
| 17 |
| 18 |
| 19 |
| 20 |
| 27 |
| 28 |
| 30 |
| 36 |
| 42 |
| 42 |
Management's Discussion of Fund Performance (unaudited)
The total return of Federated Michigan Intermediate Municipal Trust (the “Fund”), based on net asset value for the 12-month reporting period ended August 31, 2016 (“reporting period”), was 4.82% for its Class A Shares. The 4.82% total return for the reporting period consisted of 2.52% of tax-exempt dividends and price appreciation of 2.30% in the net asset value of the shares.1 The total return of the S&P Municipal Bond Intermediate Index (the “Intermediate Index”),2 the Fund's broad based securities market index, was 6.44% during the same period. The total return of the Morningstar Muni Single State Intermediate Funds Average (MMSSIFA),3 a peer group average for the Fund, was 5.17% during the same reporting period. The Fund's and the MMSSIFA's total returns for the most recently completed fiscal year reflected actual cash flows, transaction costs and other expenses, which were not reflected in the total return of the Intermediate Index.
During the reporting period, the Fund's investment strategy focused on: (a) the effective duration of the portfolio (which indicates the portfolio's sensitivity to changes in interest rates);4,5 (b) the selection of securities with different maturities (expressed by a yield curve showing the relative yield of similar securities with different maturities); (c) the allocation of the Fund's portfolio among securities of similar issuers (referred to as “sectors”); (d) the credit quality of portfolio securities (which is shown through credit ratings which indicate the risk that securities may default);6 and (e) security selection. These were the most significant factors affecting the Fund's performance relative to the Intermediate Index during the reporting period.
Market OVERVIEW
During the reporting period, 10-year Treasury yields decreased from a high of 2.34% in November 2015 to a low of 1.36% in July 2016 and averaged 1.89%. Economic activity in the U.S. expanded at a moderate pace despite the global economic and financial setbacks in recent months. A range of recent economic indicators, including strong job gains, pointed to additional strengthening of the labor market. Inflation showed signs of picking up in recent months; however, it continued to run below the Federal Reserve System's (the “Fed”) two percent longer run objective. This partly reflected declines in energy prices and impacts of the U.S. dollar's strength on non-energy imports. Global economic developments continued to pose risks as turmoil in Chinese financial markets and lower oil prices contributed to concerns about the prospects for global economic growth and a pullback from risky assets. The Fed's decision to raise the federal funds target rate by ¼ percent was widely anticipated by the markets. A downward revision in the expected path of the federal funds target rate was warranted by economic conditions and moved closer to the markets' expectations of the long-run plan.
Annual Shareholder Report
The vote by the United Kingdom to leave the European Union (“Brexit”) resulted in immediate asset price volatility and some financial markets, particularly certain foreign exchange markets, experienced brief periods of strained liquidity. Safe haven asset prices appreciated substantially, but broad based market dislocations did not develop. Overall, the negative sentiment surrounding the Brexit outcome was subsequently alleviated by expectations of the central banks being more accommodative. Nevertheless, several long term global risks related to Brexit remained.
Downward pressure on domestic energy activity intensified over the reporting period as oil prices dropped further. The imbalance of crude oil relative to demand remained very high, and it was not expected to resolve quickly. The collapse in the price of oil supported the fixed-income markets by further reducing price pressures and generating concerns that the drop in oil prices might reflect declining demand in a weakening global economy. The support for household spending from lower energy prices was offset by the restraint implied by the appreciation of the U.S. dollar and the possibility of adverse effects from slower economic growth in China.
During the reporting period, developments in Europe continued to be a focus for investors which indirectly affected interest rate levels in the tax-exempt municipal bond market. With regard to Europe, there continued to be downside risks to growth emanating from the region, given its unresolved imbalances, weak economic growth and continued deflationary risks. The U.S. dollar strengthened against the currencies of most advanced economies amid concerns about growth in those countries as well as announcements by several central banks regarding monetary policy actions. Elements underpinning the strength of the U.S. dollar were the increasing prevalence of negative interest rates on sovereign debt in some key European economies and risks to the international economic outlook. The European Central Bank announced that it would expand its asset purchase program.Credit conditions in the municipal bond market continued to be generally solid. Credit quality continued to be overall very stable, and ratios of general obligation bonds to those of comparable Treasury securities rose, partly reflecting the declines in yields on Treasury securities. The default by Puerto Rico and the downgrade of Illinois general obligation bonds both had only a limited effect on the broader municipal market.The municipal bond markets' technical (supply and demand) position was mostly favorable over the reporting period. The issuance of municipal debt was lower than in previous periods as issuers were hesitant to add additional leverage and the economic benefits of refunding existing debt became less advantageous. Flows from investors into intermediate, long and high-yield municipal bonds were positive and broad-based for a significant portion of the reporting period.
The intermittent flight to quality by investors as a result of the unstable global political and economic environment also favored municipal bonds as they were viewed as a safer alternative investment.
Annual Shareholder Report
The risk of additional municipal issuers becoming distressed remained through the reporting period. Some state and local governments turned to the courts for assistance in lowering their onerous pension liabilities, but responses from the courts were generally not favorable. Any workouts of these concerns are likely to take many years, which will continue to constrain state and local government budgets and limit their capacity to deal with severe infrastructure needs. The ongoing pressures on public pension plans and their unfunded liabilities continued to receive significant scrutiny.
Some positive news about the fiscal position of the states became available during the reporting period and, in some cases, revenues rose sufficiently enough to enable increases in state government spending and employment. These positive events allowed the spread between “AAA”- and “BBB”-rated general obligation debt to narrow by 27 basis points for 30 year maturities during the reporting period. The municipal yield curve also flattened significantly as yields on shorter maturities increased while yields on longer maturities (5 years and longer) declined leading to better total return performance for longer dated municipal bonds.
We found that Michigan's financial condition remained on solid ground in several respects. As it has the last several years, the state approved a balanced budget early for 2016-17. In March S&P revised its outlook on the state's general obligation bonds from positive to stable, while maintaining its rating of “AA”. Moody's “Aa1” (stable outlook) and Fitch's “AA” (stable outlook) ratings were unchanged.
Local credit quality remained mixed during the reporting period. Although generally improving across the state, several negative situations continue to capture headlines. During the reporting period, Detroit moved forward after emerging from bankruptcy in 2014, while Detroit Public Schools was split into two separate entities in an effort to resolve its financial and operational distress. Flint captured headlines as it encountered severe problems with its water system on top of its already deep financial difficulties. Meanwhile, Wayne County saw some stabilization in its financial situation.
Spreads on Michigan State general obligation bonds tightened by 2 to 5 basis points compared to the Thomson Municipal Market Data “AAA” Curve benchmark. Michigan general obligations of 8-years maturity or more saw the most tightening.
The Bond Buyer reported that issuance of Michigan municipal bonds for the reporting period was 4.8% lower than during the prior reporting period. This was in line with national trends.
DURATION
As determined at the end of the reporting period, the Fund's dollar-weighted average duration was 4.5 years. Duration management continued to be a significant component of the Fund's investment strategy. Throughout the reporting period the Fund's duration was generally short compared to the
Annual Shareholder Report
duration of the Intermediate Index—on average, its duration was 92% of the Intermediate Index. Given that interest declined over the course of the period, the Fund's duration detracted from the Fund's performance relative to the Intermediate Index.
YIELD CURVE and MATURITY
During the reporting period, the yield curve flattened as rates on short bonds rose and rates on longer bonds fell. The Fund's relative underweight position in bonds with more than ten years to maturity (which outperformed due to the flattening) resulted in yield curve positioning that detracted from the Fund's performance relative to the Intermediate Index.
CREDIT QUALITY7
During the reporting period, the Fund, according to its strategy, maintained a high-quality portfolio, with over 95% of the portfolio rated in one of the three highest rating categories (“AAA,” “AA” and “A”). The Fund's consequent underweight allocation to “BBB”-rated bonds (which outperformed the Intermediate Index) detracted from the Fund's overall performance versus the Index.
SECTOR Allocation
During the reporting period, sector selection provided a neutral contribution to total return relative to the Intermediate Index. The Fund was aided by overweight positions in a number of outperforming sectors, notably Higher Education, Hospital, Airport, and Water & Sewer Bonds, as well as an underweight allocation to State General Obligations, which underperformed. However, the Fund was hurt by overweights in underperforming sectors, including Pre-Refunded Bonds (bonds for which the principal and interest payments are secured or guaranteed by cash or U.S. Treasury securities held in an escrow account), and Local General Obligations; as well as an underweight allocation to Multi-Family Housing and Other Utilities, each of which outperformed.
Annual Shareholder Report
SECURITY SELECTION
During the reporting period, security-specific factors included credit rating changes, calls and other idiosyncratic occurrences for individual bonds. These individual items had a negative effect on the Fund's performance versus the Intermediate Index. Additionally, since the Intermediate Index consists of national bonds while the Fund only included securities issued in Michigan, the Fund's return was influenced by conditions which were specific to the state.
| 1 | Income may be subject to the federal alternative minimum tax for individuals or corporations (AMT). |
| 2 | Please see the footnotes to the line graph under “Fund Performance and Growth of a $10,000 Investment” below for the definition of, and more information about, the Intermediate Index. |
| 3 | Please see the footnotes to the line graphs under “Fund Performance and Growth of a $10,000 Investment” for the definition of, and more information about, the MMSSIFA. |
| 4 | Duration is a measure of a security's price sensitivity to changes in interest rates. Securities with longer durations are more sensitive to changes in interest rates than securities with shorter durations. For purposes of this Management Discussion of Fund Performance, duration is determined using a third-party analytical system. |
| 5 | Bond prices are sensitive to changes in interest rates, and a rise in interest rates can cause a decline in their prices. |
| 6 | Credit ratings pertain only to the securities in the portfolio and do not protect the Fund shares against market risk. |
| 7 | Investment-grade securities and noninvestment-grade securities may either be: (a) rated by a nationally recognized statistical ratings organization or rating agency; or (b) unrated securities that the Fund's investment adviser (“Adviser”) believes are of comparable quality. The rating agencies that provided the ratings for rated securities include Standard & Poor's, Moody's Investor Services, Inc. and Fitch Rating Service. When ratings vary, the highest rating is used. Credit ratings of “AA” or better are considered to be high credit quality; credit ratings of “A” are considered high or medium/good quality; and credit ratings of “BBB” are considered to be medium/good credit quality, and the lowest category of investment-grade securities; credit ratings of “BB” and below are lower-rated, noninvestment-grade securities or junk bonds; and credit ratings of “CCC” or below are noninvestment-grade securities that have high default risk. Any credit quality breakdown does not give effect to the impact of any credit derivative investments made by the Fund. Credit ratings are an indication of the risk that a security will default. They do not protect a security from credit risk. Lower rated bonds typically offer higher yields to help compensate investors for the increased risk associated with them. Among these risks are lower creditworthiness, greater price volatility, more risk to principal and income than with higher rated securities and increased possibilities of default. |
Annual Shareholder Report
FUND PERFORMANCE AND GROWTH OF A $10,000 INVESTMENT
The graph below illustrates the hypothetical investment of $10,0001 in Federated Michigan Intermediate Municipal Trust (Class A Shares) (the “Fund”) from August 31, 2006 to August 31, 2016, compared to the S&P Municipal Bond Intermediate Index (Intermediate Index)2 and the Morningstar Muni Single State Intermediate Funds Average (MMSSIFA).3 The Average Annual Total Return table below shows returns for Class A Shares averaged over the stated periods.
Growth of a $10,000 Investment–CLASS A SHARES
Growth of $10,000 as of August 31, 2016
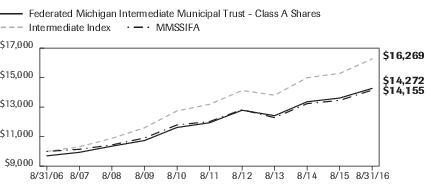
| Federated Michigan Intermediate Municipal Trust - | Class A Shares | NA | Intermediate Index | MMSSIFA |
| F | NA | I | I |
| 8/31/2006 | 9,700 | | 10,000 | 10,000 |
| 8/31/2007 | 9,938 | | 10,311 | 10,143 |
| 8/31/2008 | 10,354 | | 10,887 | 10,440 |
| 8/31/2009 | 10,737 | | 11,600 | 10,910 |
| 8/31/2010 | 11,622 | | 12,745 | 11,796 |
| 8/31/2011 | 11,941 | | 13,190 | 12,021 |
| 8/31/2012 | 12,790 | | 14,128 | 12,828 |
| 8/31/2013 | 12,420 | | 13,808 | 12,288 |
| 8/31/2014 | 13,364 | | 14,994 | 13,238 |
| 8/31/2015 | 13,615 | | 15,285 | 13,459 |
| 8/31/2016 | 14,272 | | 16,269 | 14,155 |
41 graphic description end -->
| ■ | Total returns shown include the maximum sales charge of 3.00% ($10,000 investment minus $300 sales charge = $9,700). |
Average Annual Total Returns for the Period Ended 8/31/2016
(returns reflect all applicable sales charges as specified below in footnote #1)
| | 1 Year | 5 Years | 10 Years |
| Class A Shares | 1.67% | 2.99% | 3.62% |
| Intermediate Index | 6.44% | 4.29% | 4.99% |
| MMSSIFA | 5.17% | 3.45% | 3.54% |
Annual Shareholder Report
Performance data quoted represents past performance which is no guarantee of future results. Investment return and principal value will fluctuate so that an investor's shares, when redeemed, may be worth more or less than their original cost. Mutual fund performance changes over time and current performance may be lower or higher than what is stated. For current to the most recent month-end performance and after-tax returns, visit FederatedInvestors.com or call 1-800-341-7400. Returns shown do not reflect the deduction of taxes that a shareholder would pay on Fund distributions or the redemption of Fund shares. Mutual funds are not obligations of or guaranteed by any bank and are not federally insured.
| 1 | Represents a hypothetical investment of $10,000 in the Fund after deducting the maximum sales charge of 3.00% ($10,000 investment minus $300 sales charge = $9,700). The Fund's performance assumes the reinvestment of all dividends and distributions. The Intermediate Index and the MMSSIFA have been adjusted to reflect reinvestment of dividends on securities in the index and average. |
| 2 | The Intermediate Index consists of bonds in the S&P Municipal Bond Index with a minimum maturity of 3 years and a maximum maturity of 15 years. It is a subindex of the S&P Municipal Bond Index which tracks fixed-rate tax-free bonds and bonds subject to the alternative minimum tax (AMT). The index includes bonds of all quality—from “AAA” to non-rated, including defaulted bonds—from all sectors of the municipal bond market. The Intermediate Index is not adjusted to reflect sales charges, expenses and other fees that the Securities and Exchange Commission (SEC) requires to be reflected in the Fund's performance. The Intermediate Index is unmanaged and, unlike the Fund, is not affected by cash flows. It is not possible to invest directly in an index. |
| 3 | Morningstar figures represent the average of the total returns reported by all the mutual funds designated by Morningstar as falling into the respective category indicated. They do not reflect sales charges. |
Annual Shareholder Report
Portfolio of Investments Summary Table (unaudited)
At August 31, 2016, the Fund's sector composition1 was as follows:
| Sector Composition | Percentage of
Total Net Assets |
| General Obligation—Local | 30.9% |
| Hospital | 13.0% |
| Water & Sewer | 11.0% |
| Education | 10.1% |
| Dedicated Tax | 7.5% |
| Public Power | 5.4% |
| General Obligation—State Appropriation | 5.1% |
| Refunded | 4.9% |
| Airport | 4.7% |
| General Obligation—State | 2.8% |
| Other2 | 5.1% |
| Other Assets and Liabilities—Net3 | (0.5)% |
| TOTAL | 100.0% |
| 1 | Sector classifications, and the assignment of holdings to such sectors, are based upon the economic sector and/or revenue source of the underlying obligor, as determined by the Fund's Adviser. For securities that have been enhanced by a third-party guarantor, such as bond insurers and banks, sector classifications are based upon the economic sector and/or revenue source of the underlying obligor, as determined by the Fund's Adviser. |
| 2 | For purposes of this table, sector classifications constitute 95.4% of the Fund's total net assets. Remaining sectors have been aggregated under the designation “Other.” |
| 3 | Assets, other than investments in securities, less liabilities. See Statement of Assets and Liabilities. |
Annual Shareholder Report
Portfolio of Investments
August 31, 2016
Principal
Amount | | | Value |
| | | MUNICIPAL BONDS—99.6% | |
| | | Michigan—99.6% | |
| $850,000 | | Ann Arbor, MI Public School District, School Building & Site UT GO Bonds (Series 2015), 5.00%, 5/1/2025 | $1,079,075 |
| 955,000 | | Ann Arbor, MI, Court and Police Facilities LT GO Capital Improvement Bonds, 4.75%, 5/1/2025 | 1,014,859 |
| 1,000,000 | | Avondale, MI School District, Refunding UT GO Bonds (Series 2009), 4.50% (Q-SBLF GTD)/(Assured Guaranty Corp. INS), 5/1/2018 | 1,061,360 |
| 500,000 | | Bay City, MI School District, Refunding UT GO Bonds (Series 2014), 5.00% (Q-SBLF GTD), 11/1/2023 | 613,075 |
| 1,000,000 | | Berkley, MI School District, School Building & Site UT GO Bonds (Series 2015), 5.00% (Q-SBLF GTD), 5/1/2030 | 1,214,240 |
| 410,000 | | Birmingham, MI Public Schools, School Building & Site UT GO Bonds (Series 2015), 5.00%, 5/1/2027 | 520,491 |
| 1,690,000 | | Bishop, MI International Airport Authority, Refunding LT GO (Series 2010A), 4.50% (AGM INS), 12/1/2023 | 1,904,529 |
| 710,000 | | Caledonia, MI Community Schools, School Building & Site UT GO Bonds (Series 2014), 5.00% (Q-SBLF GTD), 5/1/2023 | 862,742 |
| 750,000 | | Canton Charter Township, MI, 2016 LT GO Capital Improvement & Refunding Bonds, 5.00%, 4/1/2026 | 942,420 |
| 1,000,000 | | Central Michigan University Board of Trustees, General Revenue Refunding Bonds (Series 2009), 5.00%, 10/1/2023 | 1,108,660 |
| 1,000,000 | | Chippewa Valley, MI Schools, Refunding UT GO Bonds (Series 2013), 5.00% (Q-SBLF GTD), 5/1/2024 | 1,207,380 |
| 2,000,000 | | Dearborn, MI School District, UT GO School Building & Site Bonds (Series 2014A), 5.00% (Q-SBLF GTD), 5/1/2025 | 2,441,000 |
| 1,000,000 | | Detroit/Wayne County, MI Stadium Authority, Building Authority Stadium LT GO Refunding Bonds (Series 2012), 5.00% (Wayne County, MI)/(AGM INS), 10/1/2021 | 1,141,180 |
| 1,000,000 | | Eastern Michigan University Board of Regents, General Revenue Bonds (Series 2009C), 5.00% (Assured Guaranty Corp. INS), 2/15/2023 | 1,088,310 |
| 1,000,000 | | Ferris State University, MI, General Revenue Bonds (Series 2009), 5.00% (Assured Guaranty Corp. INS), 10/1/2020 | 1,083,070 |
| 1,000,000 | | Genesee, MI Water Supply System, Revenue Refunding Bonds (Series 2014), 5.00% (Build America Mutual Assurance INS), 11/1/2025 | 1,223,490 |
| 620,000 | | Grand Rapids, MI Public Schools, School Building & Site & Refunding UT GO Bonds (Series 2016), 5.00% (AGM INS), 5/1/2027 | 787,115 |
| 500,000 | | Grand Rapids, MI Sanitary Sewer System Revenue Improvement and Refunding Bonds (Series 2014), 5.00%, 1/1/2022 | 600,155 |
| 1,000,000 | | Grand Rapids, MI Sanitary Sewer System, Revenue Refunding Bonds (Series 2013), 5.00%, 1/1/2024 | 1,225,590 |
Annual Shareholder Report
Principal
Amount | | | Value |
| | | MUNICIPAL BONDS—continued | |
| | | Michigan—continued | |
| $300,000 | | Grand Rapids, MI, LT GO Refunding Bonds (Series 2016), 5.00%, 10/1/2025 | $384,522 |
| 705,000 | | Grand Valley State University Board of Trustees, MI, General Revenue Bonds (Series 2015A), 5.00%, 12/1/2026 | 878,247 |
| 1,500,000 | | Holland, MI Electric Utility System, Revenue Bonds (Series 2014A), 4.00%, 7/1/2022 | 1,699,680 |
| 2,000,000 | | Holland, MI School District, UT GO Bonds, 5.00% (AGM INS), 5/1/2025 | 2,464,460 |
| 1,030,000 | | Holly Area School District, MI, UT GO Refunding Bonds (Series 2014), 5.00% (Q-SBLF GTD), 5/1/2024 | 1,273,626 |
| 2,000,000 | | Jackson County, MI Hospital Finance Authority, Hospital Revenue Refunding Bonds (Series 2006C), 5.00% (Allegiance Health)/(Assured Guaranty Corp. INS), 6/1/2026 | 2,249,360 |
| 2,130,000 | | Kalamazoo, MI Hospital Finance Authority, Hospital Revenue Bonds (Series 2006), 5.00% (Bronson Methodist Hospital)/(AGM INS), 5/15/2019 | 2,354,438 |
| 1,000,000 | | Kalamazoo, MI Regional Educational Services Agency, UT GO School Building and Site Bonds, 5.00%, 5/1/2019 | 1,066,800 |
| 1,750,000 | | Kent County, MI, LT GO Bonds (Series 2009), 5.00%, 1/1/2025 | 1,908,900 |
| 335,000 | | Kent County, MI, LT GO Capital Improvement Bonds (Series 2016), 5.00%, 6/1/2027 | 432,371 |
| 1,500,000 | | Kent Hospital Finance Authority, MI, Revenue Refunding Bonds (Series 2011A), 5.00% (Spectrum Health), 11/15/2022 | 1,780,545 |
| 1,010,000 | | Lake Superior State University, MI, General Revenue Refunding Bonds (Series 2012), 4.00% (AGM INS), 11/15/2020 | 1,110,030 |
| 1,000,000 | | Lakeview, MI Public School District, UT GO Bonds (Series 2016), 5.00% (Q-SBLF GTD), 5/1/2026 | 1,272,910 |
| 1,900,000 | | Lansing, MI Board of Water & Light, Utility System Revenue Bonds (Series 2011A), 5.00%, 7/1/2024 | 2,241,981 |
| 1,550,000 | | Marquette, MI Board of Light and Power, Electric Utility System Revenue & Refunding Bonds (Series 2016A), 5.00%, 7/1/2027 | 1,955,325 |
| 1,200,000 | | Marysville, MI Public School District, School Building & Site UT GO Bonds (Series 2007), 5.00% (United States Treasury PRF 5/1/2017@100)/(Q-SBLF GTD)/(AGM INS), 5/1/2022 | 1,235,748 |
| 1,525,000 | | Michigan Municipal Bond Authority, Revenue Bonds, 5.00% (Clean Water Revolving Fund), 10/1/2017 | 1,598,017 |
| 1,000,000 | | Michigan Public Power Agency, Combustion Turbine No. 1 Project Revenue Refunding Bonds (Series 2011A), 5.00% (AGM INS), 1/1/2022 | 1,142,220 |
| 500,000 | | Michigan State Building Authority, Facilities Program Revenue & Refunding Bonds (Series 2013I-A), 5.00%, 10/15/2022 | 607,130 |
| 1,000,000 | | Michigan State Building Authority, Facilities Program Revenue Bonds (Series 2009II), 5.00% (Assured Guaranty Corp. INS), 10/15/2022 | 1,121,020 |
Annual Shareholder Report
Principal
Amount | | | Value |
| | | MUNICIPAL BONDS—continued | |
| | | Michigan—continued | |
| $1,000,000 | | Michigan State Building Authority, Facilities Program Revenue Refunding Bonds (Series 2016I), 5.00%, 4/15/2026 | $1,280,230 |
| 1,000,000 | | Michigan State Building Authority, Revenue Refunding Bonds (Series 2009I), 5.25% (Assured Guaranty Corp. INS), 10/15/2024 | 1,126,050 |
| 1,000,000 | | Michigan State Building Authority, Revenue Refunding Bonds (Series 2015I), 5.00%, 4/15/2027 | 1,262,590 |
| 2,000,000 | | Michigan State Comprehensive Transportation Fund, Refunding Bonds (Series 2009), 5.25%, 5/15/2019 | 2,222,340 |
| 1,000,000 | | Michigan State Comprehensive Transportation Fund, Revenue Refunding Bonds (Series 2015), 5.00%, 11/15/2026 | 1,260,460 |
| 1,485,000 | | Michigan State Department of Transportation, Grant Anticipation Bonds, 5.25% (United States Treasury PRF 9/15/2017@100)/(AGM INS), 9/15/2021 | 1,557,290 |
| 1,500,000 | | Michigan State Department of Transportation, Grant Anticipation Refunding Bonds (Series 2016), 5.00%, 3/15/2026 | 1,912,035 |
| 1,200,000 | | Michigan State Finance Authority Revenue, Hospital Revenue & Refunding Bonds (Series 2015), 5.00% (Sparrow Obligated Group, MI), 11/15/2022 | 1,461,072 |
| 1,000,000 | | Michigan State Finance Authority Revenue, Hospital Revenue & Refunding Bonds (Series 2015MI), 5.50% (Trinity Healthcare Credit Group), 12/1/2026 | 1,296,080 |
| 250,000 | | Michigan State Finance Authority Revenue, Hospital Revenue Refunding Bonds (Series 2014), 5.00% (MidMichigan Obligated Group), 6/1/2026 | 305,853 |
| 1,500,000 | | Michigan State Finance Authority Revenue, Local Government Loan Program Revenue Bonds (Series 2014B), 5.00% (Public Lighting Authority), 7/1/2022 | 1,758,765 |
| 1,000,000 | | Michigan State Finance Authority Revenue, Local Government Loan Program Revenue Bonds (Series 2014H-1), 5.00% (Detroit, MI Regional Convention Facility Authority), 10/1/2020 | 1,114,350 |
| 1,000,000 | | Michigan State Finance Authority Revenue, Senior Lien Revenue Bonds (Series 2014 C-5), 5.00% (Detroit, MI Sewage Disposal System)/(National Public Finance Guarantee Corp. INS), 7/1/2019 | 1,107,600 |
| 2,500,000 | | Michigan State Finance Authority Revenue, Senior Lien Revenue Bonds (Series 2014 D-2), 5.00% (Detroit, MI Water Supply System)/(AGM INS), 7/1/2024 | 3,090,250 |
| 2,000,000 | | Michigan State Finance Authority Revenue, Senior Lien Revenue Bonds (Series 2014 D-2), 5.00% (Detroit, MI Water Supply System)/(AGM INS), 7/1/2025 | 2,454,160 |
| 1,500,000 | | Michigan State Finance Authority, Revenue Bonds (Series 2012B), 5.00% (Michigan Finance Authority Unemployment Obligation Assessment), 1/1/2021 | 1,676,580 |
| 1,000,000 | | Michigan State Finance Authority, State Revolving Fund Revenue Bonds (Series 2012), 5.00% (Clean Water Revolving Fund), 10/1/2025 | 1,219,650 |
Annual Shareholder Report
Principal
Amount | | | Value |
| | | MUNICIPAL BONDS—continued | |
| | | Michigan—continued | |
| $1,000,000 | | Michigan State Hospital Finance Authority, Hospital Revenue & Refunding Bonds (Series 2006A), 5.00% (Henry Ford Health System, MI), 11/15/2021 | $1,008,830 |
| 1,275,000 | | Michigan State Hospital Finance Authority, Hospital Revenue & Refunding Bonds (Series 2007A), 5.00% (Beaumont Health Credit Group)/(United States Treasury PRF 7/15/2017@100), 7/15/2018 | 1,324,623 |
| 1,000,000 | | Michigan State Hospital Finance Authority, Hospital Revenue Refunding Bonds, 5.00% (McLaren Health Care Corp.), 5/15/2023 | 1,214,860 |
| 2,000,000 | | Michigan State Hospital Finance Authority, Revenue Bonds (Series 2010B), 5.00% (Ascension Health Alliance Senior Credit Group), 11/15/2024 | 2,247,000 |
| 500,000 | | Michigan State Hospital Finance Authority, Revenue Refunding Bonds (Series A), 5.00% (Henry Ford Health System, MI), 11/15/2025 | 504,115 |
| 500,000 | | Michigan State Trunk Line, Fund Bonds (Series 2011), 5.00%, 11/15/2022 | 595,805 |
| 500,000 | | Michigan State Trunk Line, Fund Bonds (Series 2011), 5.00%, 11/15/2023 | 591,300 |
| 1,000,000 | | Michigan State Trunk Line, Refunding Bonds (Series 2014), 5.00%, 11/15/2018 | 1,094,230 |
| 2,600,000 | | Michigan State Trunk Line, Revenue Refunding Bonds (Series 2009), 5.00%, 11/1/2020 | 2,936,674 |
| 1,000,000 | | Michigan State University Board of Trustees, General Revenue Bonds (Series 2015A), 5.00% (Michigan State University), 8/15/2028 | 1,259,570 |
| 1,000,000 | | Michigan State, UT GO Environmental Program Bonds (Series 2016A), 5.00%, 12/1/2023 | 1,255,110 |
| 1,000,000 | | Michigan State, UT GO Environmental Program Refunding Bonds (Series 2016B), 5.00%, 11/1/2024 | 1,276,710 |
| 1,000,000 | | Michigan Strategic Fund, LO Revenue Refunding Bonds, 7.00% (Detroit Edison Co.)/(AMBAC Financial Group, Inc. INS), 5/1/2021 | 1,252,970 |
| 1,000,000 | | Michigan Strategic Fund, LT Obligation Revenue Bonds (Series 2011), 5.25% (Michigan State), 10/15/2022 | 1,201,310 |
| 1,000,000 | | Michigan Strategic Fund, LT Obligation Revenue Bonds (Series 2015), 5.00% (Michigan State), 3/1/2023 | 1,201,730 |
| 1,000,000 | | Michigan Technological University Board of Control, General Revenue & Revenue Refunding Bonds (Series 2008), 5.25% (United States Treasury COL)/(Assured Guaranty Corp. INS), 10/1/2018 | 1,095,790 |
| 500,000 | | Northview, MI Public School District, Refunding UT GO Bonds, 5.00% (Q-SBLF GTD)/(AGM INS), 5/1/2019 | 533,690 |
| 1,000,000 | | Oakland County, MI EDC, Revenue Refunding Bonds, 4.00% (Cranbrook Educational Community), 11/1/2021 | 1,026,360 |
| 1,855,000 | | Orchard View, MI Schools, UT GO Bonds, 4.00% (Q-SBLF GTD)/(AGM INS), 5/1/2022 | 2,062,983 |
| 1,000,000 | | Portage, MI Public Schools, UT GO School Building & Site & Refunding Bonds (Series 2016), 5.00%, 11/1/2027 | 1,259,950 |
Annual Shareholder Report
Principal
Amount | | | Value |
| | | MUNICIPAL BONDS—continued | |
| | | Michigan—continued | |
| $1,425,000 | | Rockford, MI Public Schools, School Building & Site UT GO Bonds (Series 2014), 5.00% (Q-SBLF GTD), 5/1/2025 | $1,742,960 |
| 1,130,000 | | Romulus, MI Tax Increment Finance Authority, Recreation Center LT GO Bonds, 5.00% (United States Treasury PRF 11/1/2016@100)/(AGM INS), 11/1/2022 | 1,138,611 |
| 1,000,000 | | Roseville, MI Community Schools, UT GO Refunding Bonds (Series 2014), 5.00% (Q-SBLF GTD), 5/1/2024 | 1,236,530 |
| 2,000,000 | | Royal Oak, MI Hospital Finance Authority, Hospital Revenue Refunding Bonds (Series 2014D), 5.00% (Beaumont Health Credit Group), 9/1/2023 | 2,455,040 |
| 1,670,000 | | Saginaw County, MI Water Supply System, Revenue Bonds (Series 2011A), 4.75% (AGM INS), 7/1/2025 | 1,886,115 |
| 500,000 | | South Redford, MI School District, UT GO Refunding Bonds, 5.00% (Q-SBLF GTD), 5/1/2020 | 569,820 |
| 1,085,000 | | Southfield, MI Library Building Authority, Refunding LT GO Bonds, 5.00%, 5/1/2026 | 1,341,841 |
| 1,000,000 | | Thornapple Kellogg, MI School District, Refunding UT GO Bonds (Series 2014), 5.00% (Q-SBLF GTD), 5/1/2025 | 1,237,330 |
| 1,000,000 | | University of Michigan (The Regents of), General Revenue Bonds (Series 2010C), 4.00%, 4/1/2022 | 1,104,600 |
| 2,000,000 | 1 | University of Michigan (The Regents of), General Revenue Bonds (Series 2012E), 0.99%, 4/2/2018 | 1,989,840 |
| 250,000 | | University of Michigan (The Regents of), General Revenue Bonds (Series 2014A), 5.00%, 4/1/2024 | 317,677 |
| 500,000 | | Utica, MI Community Schools, School Building and Site Refunding UT GO Bonds, 5.00% (Q-SBLF GTD)/(National Public Finance Guarantee Corp. INS), 5/1/2017 | 514,555 |
| 500,000 | | Utica, MI Community Schools, School Building and Site Refunding UT GO Bonds (Series 2015), 5.00% (Q-SBLF GTD), 5/1/2029 | 610,060 |
| 1,000,000 | | Wayland, MI University School District, UT GO Refunding Bonds (Series 2016A), 5.00% (Q-SBLF GTD), 5/1/2028 | 1,251,510 |
| 2,000,000 | | Wayne County, MI Airport Authority, Airport Revenue Refunding Bonds (Series 2010C), 5.00%, 12/1/2021 | 2,289,040 |
| 2,000,000 | | Wayne County, MI Airport Authority, Airport Revenue Refunding Bonds (Series 2011A-B), 5.00%, 12/1/2021 | 2,322,680 |
| 1,400,000 | | Wayne County, MI Airport Authority, Junior Lien Revenue Bonds, 5.00% (National Re Holdings Corp. INS), 12/1/2023 | 1,468,180 |
| 1,000,000 | | Wayne State University, MI, General Revenue Refunding Bonds (Series 2008), 5.00% (AGM INS), 11/15/2019 | 1,092,230 |
| 1,355,000 | | West Bloomfield, MI School District, Refunding UT GO Bonds (Series 2015), 5.00%, 5/1/2020 | 1,542,640 |
| 500,000 | | Western Townships MI, Utilities Authority, Sewage Disposal System Refunding LT GO Bonds (Series 2012), 5.00%, 1/1/2023 | 604,000 |
Annual Shareholder Report
Principal
Amount | | | Value |
| | | MUNICIPAL BONDS—continued | |
| | | Michigan—continued | |
| $1,000,000 | | Ypsilanti, MI School District, UT GO Bonds, 5.00% (Q-SBLF GTD)/(National Public Finance Guarantee Corp. INS), 5/1/2023 | $1,029,590 |
| 1,000,000 | | Ypsilanti, MI School District, UT GO Bonds (Series 2016A), 5.00% (Q-SBLF GTD), 5/1/2026 | 1,234,500 |
| | | TOTAL | 129,924,385 |
| | | TOTAL MUNICIPAL BONDS
(IDENTIFIED COST $121,565,140) | 129,924,385 |
| | | SHORT-TERM MUNICIPALS—0.9%2 | |
| | | Michigan—0.9% | |
| 1,200,000 | | Michigan Higher Education Facilities Authority, (Series 2006) Weekly VRDNs (Albion College)/(JPMorgan Chase Bank, N.A. LOC), 0.59%, 9/1/2016
(AT AMORTIZED COST) | 1,200,000 |
| | | TOTAL MUNICIPAL INVESTMENTS—100.5%
(IDENTIFIED COST $122,765,140)3 | 131,124,385 |
| | | OTHER ASSETS AND LIABILITIES - NET—(0.5)%4 | (608,109) |
| | | TOTAL NET ASSETS—100% | $130,516,276 |
Securities that are subject to the federal alternative minimum tax (AMT) represent 2.9% of the Fund's portfolio as calculated based upon total market value (unaudited).
| 1 | Floating rate note with current rate and current maturity or next reset date shown. |
| 2 | Current rate and next reset date shown for Variable Rate Demand Notes. |
| 3 | The cost of investments for federal tax purposes amounts to $122,760,926. |
| 4 | Assets, other than investments in securities, less liabilities. See Statement of Assets and Liabilities. |
Note: The categories of investments are shown as a percentage of total net assets at August 31, 2016.
Various inputs are used in determining the value of the Fund's investments. These inputs are summarized in the three broad levels listed below:
Level 1—quoted prices in active markets for identical securities.
Level 2—other significant observable inputs (including quoted prices for similar securities, interest rates, prepayment speeds, credit risk, etc.). Also includes securities valued at amortized cost.
Level 3—significant unobservable inputs (including the Fund's own assumptions in determining the fair value of investments).
The inputs or methodology used for valuing securities are not an indication of the risk associated with investing in those securities.
As of August 31, 2016, all investments of the Fund utilized Level 2 inputs in valuing the Fund's assets carried at fair value.
Annual Shareholder Report
The following acronyms are used throughout this portfolio:
| AGM | —Assured Guaranty Municipal Corp. |
| AMBAC | —American Municipal Bond Assurance Corporation |
| COL | —Collateralized |
| EDC | —Economic Development Corporation |
| GO | —General Obligation |
| GTD | —Guaranteed |
| INS | —Insured |
| LO | —Limited Obligation |
| LOC | —Letter of Credit |
| LT | —Limited Tax |
| PRF | —Pre-refunded |
| Q-SBLF | —Qualified School Bond Loan Fund |
| UT | —Unlimited Tax |
| VRDNs | —Variable Rate Demand Notes |
See Notes which are an integral part of the Financial Statements
Annual Shareholder Report
Financial Highlights–Class A Shares
(For a Share Outstanding Throughout Each Period)
| Year Ended August 31 | 2016 | 2015 | 2014 | 2013 | 2012 |
| Net Asset Value, Beginning of Period | $11.31 | $11.39 | $10.90 | $11.59 | $11.17 |
| Income From Investment Operations: | | | | | |
| Net investment income | 0.28 | 0.29 | 0.33 | 0.34 | 0.36 |
Net realized and unrealized gain (loss)
on investments | 0.26 | (0.08) | 0.49 | (0.67) | 0.42 |
| TOTAL FROM INVESTMENT OPERATIONS | 0.54 | 0.21 | 0.82 | (0.33) | 0.78 |
| Less Distributions: | | | | | |
| Distributions from net investment income | (0.28) | (0.29) | (0.33) | (0.33) | (0.36) |
| Distributions from net realized gain on investments | (0.03) | — | — | (0.03) | — |
| TOTAL DISTRIBUTIONS | (0.31) | (0.29) | (0.33) | (0.36) | (0.36) |
| Net Asset Value, End of Period | $11.54 | $11.31 | $11.39 | $10.90 | $11.59 |
| Total Return1 | 4.82% | 1.88% | 7.60% | (2.89)% | 7.11% |
| Ratios to Average Net Assets: | | | | | |
| Net expenses | 0.75% | 0.75% | 0.73% | 0.63% | 0.62% |
| Net investment income | 2.40% | 2.57% | 2.94% | 2.95% | 3.16% |
| Expense waiver/reimbursement2 | 0.16% | 0.16% | 0.20% | 0.26% | 0.35% |
| Supplemental Data: | | | | | |
| Net assets, end of period (000 omitted) | $130,516 | $129,662 | $123,083 | $121,759 | $131,357 |
| Portfolio turnover | 12% | 25% | 19% | 8% | 13% |
| 1 | Based on net asset value, which does not reflect the sales charge, redemption fee or contingent deferred sales charge, if applicable. |
| 2 | This expense decrease is reflected in both the net expense and net investment income ratios shown above. |
See Notes which are an integral part of the Financial Statements
Annual Shareholder Report
Statement of Assets and Liabilities
August 31, 2016
| Assets: | | |
| Total investment in securities, at value (identified cost $122,765,140) | | $131,124,385 |
| Cash | | 83,254 |
| Income receivable | | 1,573,780 |
| Receivable for shares sold | | 131,452 |
| TOTAL ASSETS | | 132,912,871 |
| Liabilities: | | |
| Payable for investments purchased | $1,225,450 | |
| Payable for shares redeemed | 1,003,796 | |
| Income distribution payable | 86,619 | |
| Payable for other service fees (Notes 2 and 5) | 27,597 | |
| Payable for investment adviser fee (Note 5) | 880 | |
| Payable for administrative fee (Note 5) | 280 | |
| Accrued expenses (Note 5) | 51,973 | |
| TOTAL LIABILITIES | | 2,396,595 |
| Net assets for 11,305,478 shares outstanding | | $130,516,276 |
| Net Assets Consists of: | | |
| Paid-in capital | | $121,852,064 |
| Net unrealized appreciation of investments | | 8,359,245 |
| Accumulated net realized gain on investments | | 302,544 |
| Undistributed net investment income | | 2,423 |
| TOTAL NET ASSETS | | $130,516,276 |
| Net Asset Value, Offering Price and Redemption Proceeds Per Share: | | |
| Net asset value per share ($130,516,276 ÷ 11,305,478 shares outstanding), no par value, unlimited shares authorized | | $11.54 |
| Offering price per share (100/97.00 of $11.54) | | $11.90 |
| Redemption proceeds per share | | $11.54 |
See Notes which are an integral part of the Financial Statements
Annual Shareholder Report
Year Ended August 31, 2016
| Investment Income: | | | |
| Interest | | | $4,011,647 |
| Expenses: | | | |
| Investment adviser fee (Note 5) | | $508,656 | |
| Administrative fee (Note 5) | | 99,464 | |
| Custodian fees | | 9,980 | |
| Transfer agent fees | | 52,218 | |
| Directors'/Trustees' fees (Note 5) | | 2,668 | |
| Auditing fees | | 28,105 | |
| Legal fees | | 7,980 | |
| Other service fees (Notes 2 and 5) | | 314,731 | |
| Portfolio accounting fees | | 90,239 | |
| Share registration costs | | 26,908 | |
| Printing and postage | | 18,562 | |
| Miscellaneous (Note 5) | | 6,251 | |
| TOTAL EXPENSES | | 1,165,762 | |
| Waivers: | | | |
| Waiver of investment adviser fee (Note 5) | $(198,717) | | |
| Waiver of other operating expenses (Note 2) | (7,083) | | |
| TOTAL WAIVERS | | (205,800) | |
| Net expenses | | | 959,962 |
| Net investment income | | | 3,051,685 |
| Realized and Unrealized Gain on Investments: | | | |
| Net realized gain on investments | | | 304,521 |
| Net change in unrealized appreciation of investments | | | 2,601,270 |
| Net realized and unrealized gain on investments | | | 2,905,791 |
| Change in net assets resulting from operations | | | $5,957,476 |
See Notes which are an integral part of the Financial Statements
Annual Shareholder Report
Statement of Changes in Net Assets
| Year Ended August 31 | 2016 | 2015 |
| Increase (Decrease) in Net Assets | | |
| Operations: | | |
| Net investment income | $3,051,685 | $3,257,557 |
| Net realized gain on investments | 304,521 | 612,993 |
| Net change in unrealized appreciation/depreciation of investments | 2,601,270 | (1,444,031) |
| CHANGE IN NET ASSETS RESULTING FROM OPERATIONS | 5,957,476 | 2,426,519 |
| Distributions to Shareholders: | | |
| Distributions from net investment income | (3,050,783) | (3,257,233) |
| Distributions from net realized gain on investments | (367,767) | — |
| CHANGE IN NET ASSETS RESULTING FROM DISTRIBUTIONS TO SHAREHOLDERS | (3,418,550) | (3,257,233) |
| Share Transactions: | | |
| Proceeds from sale of shares | 24,995,513 | 23,713,292 |
| Net asset value of shares issued to shareholders in payment of distributions declared | 2,204,299 | 2,109,467 |
| Cost of shares redeemed | (28,884,490) | (18,413,406) |
| CHANGE IN NET ASSETS RESULTING FROM SHARE TRANSACTIONS | (1,684,678) | 7,409,353 |
| Change in net assets | 854,248 | 6,578,639 |
| Net Assets: | | |
| Beginning of period | 129,662,028 | 123,083,389 |
| End of period (including undistributed net investment income of $2,423 and $2,287, respectively) | $130,516,276 | $129,662,028 |
See Notes which are an integral part of the Financial Statements
Annual Shareholder Report
Notes to Financial Statements
August 31, 2016
1. ORGANIZATION
Federated Municipal Securities Income Trust (the “Trust”) is registered under the Investment Company Act of 1940, as amended (the “Act”), as an open-end management investment company. The Trust consists of five portfolios. The financial statements included herein are only those of Federated Michigan Intermediate Municipal Trust (the “Fund”), a non-diversified portfolio. The financial statements of the other portfolios are presented separately. The assets of each portfolio are segregated and a shareholder's interest is limited to the portfolio in which shares are held. Each portfolio pays its own expenses. The Fund offers one class of shares: Class A Shares. The investment objective of the Fund is to provide current income exempt from federal regular income tax and the personal income taxes imposed by the state of Michigan and Michigan municipalities. Interest income from the Fund's investments may be subject to the federal alternative minimum tax (AMT) for individuals and corporations.
2. SIGNIFICANT ACCOUNTING POLICIES
The following is a summary of significant accounting policies consistently followed by the Fund in the preparation of its financial statements. These policies are in conformity with U.S. generally accepted accounting principles (GAAP).
Investment Valuation
In calculating its net asset value (NAV), the Fund generally values investments as follows:
| ■ | Fixed-income securities acquired with remaining maturities greater than 60 days are fair valued using price evaluations provided by a pricing service approved by the Fund's Board of Trustees (the “Trustees”). |
| ■ | Fixed-income securities acquired with remaining maturities of 60 days or less are valued at their cost (adjusted for the accretion of any discount or amortization of any premium), unless the issuer's creditworthiness is impaired or other factors indicate that amortized cost is not an accurate estimate of the investment's fair value, in which case it would be valued in the same manner as a longer-term security. |
| ■ | Shares of other mutual funds or non-exchange-traded investment companies are valued based upon their reported NAVs. |
| ■ | Derivative contracts listed on exchanges are valued at their reported settlement or closing price, except that options are valued at the mean of closing bid and asked quotations. |
| ■ | Over-the-counter (OTC) derivative contracts are fair valued using price evaluations provided by a pricing service approved by the Trustees. |
| ■ | For securities that are fair valued in accordance with procedures established by and under the general supervision of the Trustees, certain factors may be considered such as: the last traded or purchase price of the security, information obtained by contacting the issuer or dealers, analysis of the issuer's financial statements or other available documents, fundamental analytical data, the nature and duration of restrictions on disposition, the movement of the market in which the security is normally traded, public trading in similar securities or derivative contracts of the issuer or comparable issuers, movement of a relevant index, or other factors including but not limited to industry changes and relevant government actions. |
Annual Shareholder Report
If any price, quotation, price evaluation or other pricing source is not readily available when the NAV is calculated, or if the Fund cannot obtain price evaluations from a pricing service or from more than one dealer for an investment within a reasonable period of time as set forth in the Fund's valuation policies and procedures, the Fund uses the fair value of the investment determined in accordance with the procedures described below. There can be no assurance that the Fund could obtain the fair value assigned to an investment if it sold the investment at approximately the time at which the Fund determines its NAV per share.
Fair Valuation Procedures
The Trustees have ultimate responsibility for determining the fair value of investments for which market quotations are not readily available. The Trustees have appointed a valuation committee (“Valuation Committee”) comprised of officers of the Fund, Federated Investment Management Company (“Adviser”) and certain of the Adviser's affiliated companies to assist in determining fair value and in overseeing the calculation of the NAV. The Trustees have also authorized the use of pricing services recommended by the Valuation Committee to provide fair value evaluations of the current value of certain investments for purposes of calculating the NAV. The Valuation Committee employs various methods for reviewing third-party pricing-service evaluations including periodic reviews of third-party pricing services' policies, procedures and valuation methods (including key inputs, methods, models and assumptions), transactional back-testing, comparisons of evaluations of different pricing services, and review of price challenges by the Adviser based on recent market activity. In the event that market quotations and price evaluations are not available for an investment, the Valuation Committee determines the fair value of the investment in accordance with procedures adopted by the Trustees. The Trustees periodically review and approve the fair valuations made by the Valuation Committee and any changes made to the procedures.
Factors considered by pricing services in evaluating an investment include the yields or prices of investments of comparable quality, coupon, maturity, call rights and other potential prepayments, terms and type, reported transactions, indications as to values from dealers and general market conditions. Some pricing services provide a single price evaluation reflecting the bid-side of the market for an investment (a “bid” evaluation). Other pricing services offer both bid evaluations and price evaluations indicative of a price between the prices bid and asked for the investment (a “mid” evaluation). The Fund normally uses bid evaluations for any U.S. Treasury and Agency securities, mortgage-backed securities and municipal securities. The Fund normally uses mid evaluations for any other types of fixed-income securities and any OTC derivative contracts. In the event that market quotations and price evaluations are not available for an investment, the fair value of the investment is determined in accordance with procedures adopted by the Trustees.
Investment Income, Gains and Losses, Expenses and Distributions
Investment transactions are accounted for on a trade-date basis. Realized gains and losses from investment transactions are recorded on an identified cost basis. Interest income and expenses are accrued daily. Distributions to shareholders are recorded on the ex-dividend date. Distributions of net investment income are declared daily and paid monthly. Non-cash dividends included in dividend income, if any, are recorded at fair value. The detail of the total fund expense waivers of $205,800 is disclosed in various locations in this Note 2 and Note 5.
For the year ended August 31, 2016, an unaffiliated third-party waived $7,083 of portfolio accounting fees.
Annual Shareholder Report
Other Service Fees
The Fund may pay other service fees up to 0.25% of the average daily net assets of the Fund's Class A Shares to unaffiliated financial intermediaries or to Federated Shareholder Services Company (FSSC) for providing services to shareholders and maintaining shareholder accounts. Subject to the terms described in the Expense Limitation note, FSSC may voluntarily reimburse the Fund for other service fees. For the year ended August 31, 2016, the Fund incurred $314,731 of other service fees.
Premium and Discount Amortization
All premiums and discounts on fixed-income securities are amortized/accreted using the effective-interest-rate method.
Federal Taxes
It is the Fund's policy to comply with the Subchapter M provision of the Internal Revenue Code (the “Code”) and to distribute to shareholders each year substantially all of its income. Accordingly, no provision for federal income tax is necessary. As of during the year ended August 31, 2016, the Fund did not have a liability for any uncertain tax positions. The Fund recognizes interest and penalties, if any, related to tax liabilities as income tax expense in the Statement of Operations. As of August 31, 2016, tax years 2013 through 2016 remain subject to examination by the Fund's major tax jurisdictions, which include the United States of America and the Commonwealth of Massachusetts.
When-Issued and Delayed-Delivery Transactions
The Fund may engage in when-issued or delayed-delivery transactions. The Fund records when-issued securities on the trade date and maintains security positions such that sufficient liquid assets will be available to make payment for the securities purchased. Securities purchased on a when-issued or delayed-delivery basis are marked to market daily and begin earning interest on the settlement date. Losses may occur on these transactions due to changes in market conditions or the failure of counterparties to perform under the contract.
Other
The preparation of financial statements in conformity with GAAP requires management to make estimates and assumptions that affect the amounts of assets, liabilities, expenses and revenues reported in the financial statements. Actual results could differ from those estimated. The Fund applies Investment Company accounting and reporting guidance.
3. SHARES OF BENEFICIAL INTEREST
The following table summarizes share activity:
| Year Ended August 31 | 2016 | 2015 |
| Shares sold | 2,180,293 | 2,085,445 |
| Shares issued to shareholders in payment of distributions declared | 192,469 | 185,412 |
| Shares redeemed | (2,526,727) | (1,621,047) |
| NET CHANGE RESULTING FROM CLASS A SHARE TRANSACTIONS | (153,965) | 649,810 |
4. FEDERAL TAX INFORMATION
The timing and character of income and capital gain distributions are determined in accordance with income tax regulations, which may differ from GAAP. These differences are due to differing treatments for discount accretion/premium amortization on debt securities.
Annual Shareholder Report
For the year ended August 31, 2016, permanent differences identified and reclassified among the components of net assets were as follows:
| Increase (Decrease) |
Undistributed
Net Investment
Income (Loss) | Accumulated
Net Realized
Gain (Loss) |
| $(766) | $766 |
Net investment income (loss), net realized gains (losses) and net assets were not affected by the reclassification.
The tax character of distributions as reported on the Statement of Changes in Net Assets for the years ended August 31, 2016 and 2015, was as follows:
| | 2016 | 2015 |
| Tax-exempt income | $3,050,783 | $3,257,233 |
| Long-term capital gains | $367,767 | $— |
As of August 31, 2016, the components of distributable earnings on a tax basis were as follows:
| Undistributed tax-exempt income | $2,423 |
| Undistributed long-term capital gains | $298,330 |
| Net unrealized appreciation | $8,363,459 |
The difference between book-basis and tax-basis net unrealized appreciation/depreciation is attributable to differing treatments for discount accretion/premium amortization on debt securities.
At August 31, 2016, the cost of investments for federal tax purposes was $122,760,926. The net unrealized appreciation of investments for federal tax purposes was $8,363,459. This consists of net unrealized appreciation from investments for those securities having an excess of value over cost of $8,373,618 and net unrealized depreciation from investments for those securities having an excess of cost over value of $10,159.
5. INVESTMENT ADVISER FEE AND OTHER TRANSACTIONS WITH AFFILIATES
Investment Adviser Fee
The advisory agreement between the Fund and the Adviser provides for an annual fee equal to 0.40% of the Fund's average daily net assets. Subject to the terms described in the Expense Limitation note, the Adviser may voluntarily choose to waive any portion of its fee. For the year ended August 31, 2016, the Adviser waived $198,717 of its fee.
Annual Shareholder Report
Administrative Fee
Federated Administrative Services (FAS), under the Administrative Services Agreement, provides the Fund with administrative personnel and services. For purposes of determining the appropriate rate breakpoint, “Investment Complex” is defined as all of the Federated Funds subject to a fee under the Administrative Services Agreement. The fee paid to FAS is based on the average daily net assets of the Investment Complex as specified below, plus certain out-of-pocket expenses:
| Administrative Fee | Average Daily Net Assets
of the Investment Complex |
| 0.150% | on the first $5 billion |
| 0.125% | on the next $5 billion |
| 0.100% | on the next $10 billion |
| 0.075% | on assets in excess of $20 billion |
Subject to the terms described in the Expense Limitation note, FAS may voluntarily choose to waive any portion of its fee. For the year ended August 31, 2016, the annualized fee paid to FAS was 0.078% of average daily net assets of the Fund.
Other Service Fees
For the year ended August 31, 2016, FSSC received $2,033 of the other service fees disclosed in Note 2.
Sales Charges
Front-end sales charges and contingent deferred sales charges (CDSC) do not represent expenses of the Fund. They are deducted from the proceeds of sales of Fund shares prior to investment or from redemption proceeds prior to remittance, as applicable. For the year ended August 31, 2016, FSC retained $634 of CDSC relating to redemptions of Class A Shares.
Interfund Transactions
During the year ended August 31, 2016, the Fund engaged in purchase and sale transactions with funds that have a common investment adviser (or affiliated investment advisers), common Directors/Trustees and/or common Officers. These purchase and sale transactions complied with Rule 17a-7 under the Act and amounted to $24,050,000 and $22,250,000, respectively.
Expense Limitation
The Adviser and certain of its affiliates (which may include FAS and FSSC) on their own initiative have agreed to waive certain amounts of their respective fees and/or reimburse expenses. Total annual fund operating expenses (as shown in the financial highlights, excluding interest expense, extraordinary expenses, line of credit expenses and proxy-related expenses paid by the Fund, if any) paid by the Fund's Class A Shares (after the voluntary waivers and reimbursements) will not exceed 0.75% (the “Fee Limit”) up to but not including the later of (the “Termination Date”): (a) November 1, 2017; or (b) the date of the Fund's next effective Prospectus. While the Adviser and its applicable affiliates currently do not anticipate terminating or increasing these arrangements prior to the Termination Date, these arrangements may only be terminated or the Fee Limit increased prior to the Termination Date with the agreement of the Trustees.
Annual Shareholder Report
General
Certain Officers and Trustees of the Fund are Officers and Directors or Trustees of certain of the above companies. To efficiently facilitate payment, Directors'/Trustees' fees and certain expenses related to conducting meetings of the Directors/Trustees and other miscellaneous expenses are paid by an affiliate of the Adviser which in due course are reimbursed by the Fund. Such expenses may be included in Accrued and Miscellaneous Expenses on the Statement of Assets and Liabilities and Statement of Operations, respectively.
6. Investment TRANSACTIONS
Purchases and sales of investments, excluding long-term U.S. government securities and short-term obligations, for the year ended August 31, 2016, were as follows:
| Purchases | $15,029,151 |
| Sales | $14,395,677 |
7. CONCENTRATION OF RISK
Since the Fund invests a substantial portion of its assets in issuers located in one state, it will be more susceptible to factors adversely affecting issuers of that state than would be a comparable tax-exempt mutual fund that invests nationally. In order to reduce the credit risk associated with such factors, at August 31, 2016, 45.3% of the securities in the Portfolio of Investments were backed by letters of credit or bond insurance of various financial institutions and financial guaranty assurance agencies. The largest percentage of investments insured by or supported by (backed) a letter of credit from any one institution or agency, was 19.8% of total investments.
8. LINE OF CREDIT
The Fund participates with certain other Federated Funds, on a several basis, in an up to $500,000,000 unsecured, 364-day, committed, revolving line of credit (LOC) agreement. The LOC was made available to finance temporarily the repurchase or redemption of shares of the Fund, failed trades, payment of dividends, settlement of trades and for other short-term, temporary or emergency general business purposes. The Fund cannot borrow under the LOC if an inter-fund loan is outstanding. The Fund's ability to borrow under the LOC also is subject to the limitations of the Act and various conditions precedent that must be satisfied before the Fund can borrow. Loans under the LOC are charged interest at a fluctuating rate per annum equal to the highest, on any day, of (a) (i) the federal funds effective rate, (ii) the one month London Interbank Offer Rate (LIBOR), and (iii) 0.0%, plus (b) a margin. The LOC also requires the Fund to pay, quarterly in arrears and at maturity, its pro rata share of a commitment fee based on the amount of the lenders' commitment that has not been utilized. As of August 31, 2016, the Fund had no outstanding loans. During the year ended August 31, 2016, the Fund did not utilize the LOC.
9. INTERFUND LENDING
Pursuant to an Exemptive Order issued by the Securities and Exchange Commission, the Fund, along with other funds advised by subsidiaries of Federated Investors, Inc., may participate in an interfund lending program. This program provides an alternative credit facility allowing the Fund to borrow from other participating affiliated funds. As August 31, 2016, there were no outstanding loans. During the year ended August 31, 2016, the program was not utilized.
Annual Shareholder Report
10. FEDERAL TAX INFORMATION (UNAUDITED)
For the year-ended August 31, 2016, the amount of long-term capital gains designated by the Fund was $367,767.
For the fiscal year ended August 31, 2016, 100% of distributions from net investment income is exempt from federal income tax, other than the federal AMT.
Annual Shareholder Report
Report of Independent Registered Public Accounting Firm
TO THE BOARD OF TRUSTEES OF federated municipal securities income trust and shareholders of federated Michigan intermediate municipal Trust:
We have audited the accompanying statement of assets and liabilities, including the portfolio of investments, of Federated Michigan Intermediate Municipal Trust (the “Fund”), a portfolio of Federated Municipal Securities Income Trust, as of August 31, 2016, and the related statement of operations for the year then ended, and the statements of changes in net assets for each of the years in the two-year period then ended and the financial highlights for each of the years in the five-year period then ended. These financial statements and financial highlights are the responsibility of the Fund's management. Our responsibility is to express an opinion on these financial statements and financial highlights based on our audits.
We conducted our audits in accordance with the standards of the Public Company Accounting Oversight Board (United States). Those standards require that we plan and perform the audit to obtain reasonable assurance about whether the financial statements and financial highlights are free of material misstatement. An audit includes examining, on a test basis, evidence supporting the amounts and disclosures in the financial statements. Our procedures included confirmation of securities owned as of August 31, 2016, by correspondence with the custodian and brokers or by other appropriate auditing procedures. An audit also includes assessing the accounting principles used and significant estimates made by management, as well as evaluating the overall financial statement presentation. We believe that our audits provide a reasonable basis for our opinion.
In our opinion, the financial statements and financial highlights referred to above present fairly, in all material respects, the financial position of Federated Michigan Intermediate Municipal Trust as of August 31, 2016, and the results of its operations for the year then ended, and the changes in its net assets for each of the years in the two-year period then ended and the financial highlights for each of the years in the five-year period then ended, in conformity with U.S. generally accepted accounting principles.
Boston, Massachusetts
October 24, 2016
Annual Shareholder Report
Shareholder Expense Example
As a shareholder of the Fund, you incur two types of costs: (1) transaction costs, including sales charges (loads) on purchase or redemption payments; and (2) ongoing costs, including management fees and to the extent applicable, distribution (12b-1) fees and/or other service fees and other Fund expenses. This Example is intended to help you to understand your ongoing costs (in dollars) of investing in the Fund and to compare these costs with the ongoing costs of investing in other mutual funds. It is based on an investment of $1,000 invested at the beginning of the period and held for the entire period from March 1, 2016 to August 31, 2016.
ACTUAL EXPENSES
The first section of the table below provides information about actual account values and actual expenses. You may use the information in this section, together with the amount you invested, to estimate the expenses that you incurred over the period. Simply divide your account value by $1,000 (for example, an $8,600 account value divided by $1,000 = 8.6), then multiply the result by the number in the first section under the heading entitled “Expenses Paid During Period” to estimate the expenses attributable to your investment during this period.
HYPOTHETICAL EXAMPLE FOR COMPARISON PURPOSES
The second section of the table below provides information about hypothetical account values and hypothetical expenses based on the Fund's actual expense ratio and an assumed rate of return of 5% per year before expenses, which is not the Fund's actual return. Thus, you should not use the hypothetical account values and expenses to estimate the actual ending account balance or your expenses for the period. Rather, these figures are required to be provided to enable you to compare the ongoing costs of investing in the Fund with other funds. To do so, compare this 5% hypothetical example with the 5% hypothetical examples that appear in the shareholder reports of the other funds.
Annual Shareholder Report
Please note that the expenses shown in the table are meant to highlight your ongoing costs only and do not reflect any transaction costs, such as sales charges (loads) on purchase or redemption payments. Therefore, the second section of the table is useful in comparing ongoing costs only, and will not help you determine the relative total costs of owning different funds. In addition, if these transaction costs were included, your costs would have been higher.
| | Beginning
Account Value
3/1/2016 | Ending
Account Value
8/31/2016 | Expenses Paid
During Period1 |
| Actual | $1,000 | $1,017.00 | $3.80 |
Hypothetical (assuming a 5% return
before expenses) | $1,000 | $1,021.37 | $3.81 |
| 1 | Expenses are equal to the Fund's annualized net expense ratio of 0.75%, multiplied by the average account value over the period, multiplied by 184/366 (to reflect the one-half-year period). |
Annual Shareholder Report
Board of Trustees and Trust Officers
The Board of Trustees is responsible for managing the Trust's business affairs and for exercising all the Trust's powers except those reserved for the shareholders. The following tables give information about each Trustee and the senior officers of the Fund. Where required, the tables separately list Trustees who are “interested persons” of the Fund (i.e., “Interested” Trustees) and those who are not (i.e., “Independent” Trustees). Unless otherwise noted, the address of each person listed is Federated Investors Tower, 1001 Liberty Avenue, Pittsburgh, PA 15222. The address of all Independent Trustees listed is 4000 Ericsson Drive, Warrendale, PA 15086-7561; Attention: Mutual Fund Board. As of December 31, 2015, the Trust comprised five portfolio(s), and the Federated Fund Family consisted of 38 investment companies (comprising 122 portfolios). Unless otherwise noted, each Officer is elected annually. Unless otherwise noted, each Trustee oversees all portfolios in the Federated Fund Family and serves for an indefinite term. The Fund's Statement of Additional Information includes additional information about Trust Trustees and is available, without charge and upon request, by calling 1-800-341-7400.
Interested TRUSTEES Background
Name
Birth Date
Positions Held with Trust
Date Service Began | Principal Occupation(s) for Past Five Years,
Other Directorships Held and Previous Position(s) |
J. Christopher Donahue*
Birth Date: April 11, 1949
President and Trustee
Indefinite Term
Began serving: August 1990 | Principal Occupations: Principal Executive Officer and President of certain of the Funds in the Federated Fund Family; Director or Trustee of the Funds in the Federated Fund Family; President, Chief Executive Officer and Director, Federated Investors, Inc.; Chairman and Trustee, Federated Investment Management Company; Trustee, Federated Investment Counseling; Chairman and Director, Federated Global Investment Management Corp.; Chairman, Federated Equity Management Company of Pennsylvania and Passport Research, Ltd. (investment advisory subsidiary of Federated); Trustee, Federated Shareholder Services Company; Director, Federated Services Company.
Previous Positions: President, Federated Investment Counseling; President and Chief Executive Officer, Federated Investment Management Company, Federated Global Investment Management Corp. and Passport Research, Ltd. |
Annual Shareholder Report
Name
Birth Date
Positions Held with Trust
Date Service Began | Principal Occupation(s) for Past Five Years,
Other Directorships Held and Previous Position(s) |
John B. Fisher*
Birth Date: May 16, 1956
Trustee
Indefinite Term
Began serving: May 2016 | Principal Occupations: Principal Executive Officer and President of certain of the Funds in the Federated Fund Family; Director or Trustee of certain of the Funds in the Federated Fund Family; Vice President, Federated Investors, Inc.; President, Director/Trustee and CEO, Federated Advisory Services Company, Federated Equity Management Company of Pennsylvania, Federated Global Investment Management Corp., Federated Investment Counseling, Federated Investment Management Company; President and CEO of Passport Research, Ltd.; President of some of the Funds in the Federated Fund Complex and Director, Federated Investors Trust Company.
Previous Positions: President and Director of the Institutional Sales Division of Federated Securities Corp.; President and Director of Federated Investment Counseling; Director, Edgewood Securities Corp.; Director, Federated Services Company; Director, Federated Investors, Inc.; Chairman and Director, Southpointe Distribution Services, Inc. and President, Technology, Federated Services Company. |
| * | Reasons for “interested” status: J. Christopher Donahue and John B. Fisher are interested due to their beneficial ownership of shares of Federated Investors, Inc. and due to positions they hold with Federated and its subsidiaries. J. Christopher Donahue is the son of John F. Donahue, Chairman Emeritus of the Federated Funds. |
INDEPENDENT TRUSTEES Background
Name
Birth Date
Positions Held with Trust
Date Service Began | Principal Occupation(s) for Past Five Years,
Other Directorships Held, Previous Position(s) and Qualifications |
John T. Collins
Birth Date: January 24, 1947
Trustee
Indefinite Term
Began serving: October 2013 | Principal Occupations: Director or Trustee of the Federated Fund Family; Retired.
Other Directorships Held: Director, Chair of the Compensation Committee, Audit Committee member, KLX Corp.
Qualifications: Mr. Collins has served in several business and financial management roles and directorship positions throughout his career. Mr. Collins previously served as Chairman and CEO, The Collins Group, Inc. (a private equity firm). Mr. Collins serves as Chairman Emeriti, Bentley University. Mr. Collins previously served as Director, FleetBoston Financial Corp.; Director and Audit Committee Member, Bank of America Corp. and Director, Beth Israel Deaconess Medical Center (Harvard University Affiliate Hospital). |
Annual Shareholder Report
Name
Birth Date
Positions Held with Trust
Date Service Began | Principal Occupation(s) for Past Five Years,
Other Directorships Held, Previous Position(s) and Qualifications |
G. Thomas Hough
Birth Date: February 28, 1955
Trustee
Indefinite Term
Began serving: August 2015 | Principal Occupations: Director or Trustee of the Federated Fund Family; Retired.
Other Directorships Held: Director, Chair of the Audit Committee, Governance Committee, Publix Super Markets, Inc.; Director, Equifax, Inc.
Qualifications: Mr. Hough has served in accounting, business management and directorship positions throughout his career. Mr. Hough most recently held the position of Americas Vice Chair of Assurance with Ernst & Young LLP. Mr. Hough is an Executive Committee member of the United States Golf Association, he serves on the President's Cabinet and Business School Board of Visitors for the University of Alabama and is on the Business School Board of Visitors for Wake Forest University. |
Maureen Lally-Green
Birth Date: July 5, 1949
Trustee
Indefinite Term
Began serving: August 2009 | Principal Occupations: Director or Trustee of the Federated Fund Family; Interim Dean of the Duquesne University School of Law; Adjunct Professor of Law, Duquesne University School of Law.
Other Directorships Held: Director, CONSOL Energy Inc.
Qualifications: Judge Lally-Green has served in various legal and business roles and directorship positions throughout her career. Judge Lally-Green previously served as: Associate General Secretary, Diocese of Pittsburgh; a member of the Superior Court of Pennsylvania; and as a Professor of Law, Duquesne University School of Law. Judge Lally-Green also holds the positions on either a public or not for profit Board of Directors as follows: Member, Pennsylvania State Board of Education (public); Director and Chair, UPMC Mercy Hospital; Regent, St. Vincent Seminary; Director and Vice Chair, Our Campaign for the Church Alive!, Inc.; Director, Saint Vincent College; and Director and Chair, Cardinal Wuerl North Catholic High School, Inc. Judge Lally-Green has held the positions of: Director, Auberle; Director, Ireland Institute of Pittsburgh; Director, Saint Thomas More Society; and Director, Catholic High Schools of the Diocese of Pittsburgh, Inc. |
Peter E. Madden
Birth Date: March 16, 1942
Trustee
Indefinite Term
Began serving: August 1991 | Principal Occupation: Director or Trustee, and Chair of the Board of Directors or Trustees, of the Federated Fund Family; Retired.
Other Directorships Held: None.
Qualifications: Mr. Madden has served in several business management, mutual fund services and directorship positions throughout his career. Mr. Madden previously served as President, Chief Operating Officer and Director, State Street Bank and Trust Company (custodian bank) and State Street Corporation (financial services). He was Director, VISA USA and VISA International and Chairman and Director, Massachusetts Bankers Association. Mr. Madden served as Director, Depository Trust Corporation and Director, The Boston Stock Exchange. Mr. Madden also served as a Representative to the Commonwealth of Massachusetts General Court. |
Annual Shareholder Report
Name
Birth Date
Positions Held with Trust
Date Service Began | Principal Occupation(s) for Past Five Years,
Other Directorships Held, Previous Position(s) and Qualifications |
Charles F. Mansfield, Jr.
Birth Date: April 10, 1945
Trustee
Indefinite Term
Began serving: January 1999 | Principal Occupations: Director or Trustee of the Federated Fund Family; Management Consultant.
Other Directorships Held: None.
Qualifications: Mr. Mansfield has served in several banking, business management and educational roles and directorship positions throughout his career. Mr. Mansfield previously served as Chief Executive Officer, PBTC International Bank; Partner, Arthur Young & Company (now Ernst & Young LLP); Chief Financial Officer of Retail Banking Sector, Chase Manhattan Bank; Senior Vice President, HSBC Bank USA (formerly, Marine Midland Bank); Vice President, Citibank; Assistant Professor of Banking and Finance, Frank G. Zarb School of Business, Hofstra University; Executive Vice President DVC Group, Inc. (marketing, communications and technology). |
Thomas M. O'Neill
Birth Date: June 14, 1951
Trustee
Indefinite Term
Began serving: August 2006 | Principal Occupations: Director or Trustee, Chair of the Audit Committee of the Federated Fund Family; Sole Proprietor, Navigator Management Company (investment and strategic consulting).
Other Directorships Held: None.
Qualifications: Mr. O'Neill has served in several business, mutual fund and financial management roles and directorship positions throughout his career. Mr. O'Neill serves as Director, Medicines for Humanity and Director, The Golisano Children's Museum of Naples, Florida. Mr. O'Neill previously served as Chief Executive Officer and President, Managing Director and Chief Investment Officer, Fleet Investment Advisors; President and Chief Executive Officer, Aeltus Investment Management, Inc.; General Partner, Hellman, Jordan Management Co., Boston, MA; Chief Investment Officer, The Putnam Companies, Boston, MA; Credit Analyst and Lending Officer, Fleet Bank; Director and Consultant, EZE Castle Software (investment order management software); and Director, Midway Pacific (lumber). |
P. Jerome Richey
Birth Date: February 23, 1949
Trustee
Indefinite Term
Began serving: October 2013 | Principal Occupations: Director or Trustee of the Federated Fund Family; Management Consultant.
Other Directorships Held: None.
Qualifications: Mr. Richey has served in several business and legal management roles and directorship positions throughout his career. Mr. Richey most recently held the positions of Senior Vice Chancellor and Chief Legal Officer, University of Pittsburgh. Mr. Richey serves as Board Member, Epilepsy Foundation of Western Pennsylvania and Board member, World Affairs Council of Pittsburgh. Mr. Richey previously served as Chief Legal Officer and Executive Vice President, CONSOL Energy Inc. and Shareholder, Buchanan Ingersoll & Rooney PC (a law firm). |
Annual Shareholder Report
Name
Birth Date
Positions Held with Trust
Date Service Began | Principal Occupation(s) for Past Five Years,
Other Directorships Held, Previous Position(s) and Qualifications |
John S. Walsh
Birth Date: November 28, 1957
Trustee
Indefinite Term
Began serving: June 1999 | Principal Occupations: Director or Trustee of the Federated Fund Family; President and Director, Heat Wagon, Inc. (manufacturer of construction temporary heaters); President and Director, Manufacturers Products, Inc. (distributor of portable construction heaters); President, Portable Heater Parts, a division of Manufacturers Products, Inc.
Other Directorships Held: None.
Qualifications: Mr. Walsh has served in several business management roles and directorship positions throughout his career. Mr. Walsh previously served as Vice President, Walsh & Kelly, Inc. (paving contractors). |
OFFICERS
Name
Birth Date
Positions Held with Trust
Date Service Began | Principal Occupation(s) for Past Five Years
and Previous Position(s) |
John W. McGonigle
Birth Date: October 26, 1938
EXECUTIVE VICE PRESIDENT AND SECRETARY
Officer since: August 1990 | Principal Occupations: Executive Vice President and Secretary of the Federated Fund Family; Vice Chairman, Executive Vice President, Secretary and Director, Federated Investors, Inc.
Previous Positions: Trustee, Federated Investment Management Company and Federated Investment Counseling; Director, Federated Global Investment Management Corp., Federated Services Company and Federated Securities Corp. |
Lori A. Hensler
Birth Date: January 6, 1967
TREASURER
Officer since: April 2013 | Principal Occupations: Principal Financial Officer and Treasurer of the Federated Fund Family; Senior Vice President, Federated Administrative Services; Financial and Operations Principal for Federated Securities Corp. and Edgewood Services, Inc.; and Assistant Treasurer, Federated Investors Trust Company. Ms. Hensler has received the Certified Public Accountant designation.
Previous Positions: Controller of Federated Investors, Inc.; Senior Vice President and Assistant Treasurer, Federated Investors Management Company; Treasurer, Federated Investors Trust Company; Assistant Treasurer, Federated Administrative Services, Federated Administrative Services, Inc., Federated Securities Corp., Edgewood Services, Inc., Federated Advisory Services Company, Federated Equity Management Company of Pennsylvania, Federated Global Investment Management Corp., Federated Investment Counseling, Federated Investment Management Company, Passport Research, Ltd., and Federated MDTA, LLC; Financial and Operations Principal for Federated Securities Corp., Edgewood Services, Inc. and Southpointe Distribution Services, Inc. |
Annual Shareholder Report
Name
Birth Date
Positions Held with Trust
Date Service Began | Principal Occupation(s) for Past Five Years
and Previous Position(s) |
Richard B. Fisher
Birth Date: May 17, 1923
VICE CHAIRMAN
Officer since: August 2002 | Principal Occupations: Vice Chairman or Vice President of some of the Funds in the Federated Fund Family; Vice Chairman, Federated Investors, Inc.; Chairman, Federated Securities Corp.
Previous Positions: President and Director or Trustee of some of the Funds in the Federated Fund Family; Executive Vice President, Federated Investors, Inc.; Director and Chief Executive Officer, Federated Securities Corp. |
Peter J. Germain
Birth Date: September 3, 1959
CHIEF LEGAL OFFICER
Officer since: January 2005 | Principal Occupations: Mr. Germain is Chief Legal Officer of the Federated Fund Family. He is General Counsel and Vice President, Federated Investors, Inc.; President, Federated Administrative Services and Federated Administrative Services, Inc.; Vice President, Federated Securities Corp.; Secretary, Federated Private Asset Management, Inc.; and Secretary, Retirement Plan Service Company of America. Mr. Germain joined Federated in 1984 and is a member of the Pennsylvania Bar Association.
Previous Positions: Deputy General Counsel, Special Counsel, Managing Director of Mutual Fund Services, Federated Investors, Inc.; Senior Vice President, Federated Services Company; and Senior Corporate Counsel, Federated Investors, Inc. |
Stephen Van Meter
Birth Date: June 5, 1975
CHIEF COMPLIANCE OFFICER AND SENIOR VICE PRESIDENT
Officer since: July 2015 | Principal Occupations: Senior Vice President and Chief Compliance Officer of the Federated Fund Family; Vice President and Chief Compliance Officer of Federated Investors, Inc. and Chief Compliance Officer of certain of its subsidiaries. Mr. Van Meter joined Federated in October 2011. He holds FINRA licenses under Series 3, 7, 24 and 66.
Previous Positions: Mr. Van Meter previously held the position of Compliance Operating Officer, Federated Investors, Inc. Prior to joining Federated, Mr. Van Meter served at the United States Securities and Exchange Commission in the positions of Senior Counsel, Office of Chief Counsel, Division of Investment Management and Senior Counsel, Division of Enforcement. |
Robert J. Ostrowski
Birth Date: April 26, 1963
CHIEF INVESTMENT OFFICER
Officer since: February 2010 | Principal Occupations: Robert J. Ostrowski joined Federated in 1987 as an Investment Analyst and became a Portfolio Manager in 1990. He was named Chief Investment Officer of Federated's taxable fixed-income products in 2004 and also serves as a Senior Portfolio Manager. Mr. Ostrowski became an Executive Vice President of the Fund's Adviser in 2009 and served as a Senior Vice President of the Fund's Adviser from 1997 to 2009. Mr. Ostrowski has received the Chartered Financial Analyst designation. He received his M.S. in Industrial Administration from Carnegie Mellon University. |
Annual Shareholder Report
Evaluation and Approval of Advisory Contract–May 2016
Federated Michigan Intermediate Municipal Trust (the “Fund”)
Following a review and recommendation of approval by the Fund's independent trustees, the Fund's Board of Trustees (the “Board”) reviewed and unanimously approved at its May 2016 meetings the continuation of the Fund's investment advisory contract for an additional one-year term. The Board's decision regarding the contract reflects the exercise of its business judgment after consideration of all of the information received on whether to continue the existing arrangements.
The Board had previously appointed a Senior Officer, whose duties include specified responsibilities relating to the process by which advisory fees are to be charged to a Federated fund. The Senior Officer has the authority to retain consultants, experts, or staff as may be reasonably necessary to assist in the performance of his duties, reports directly to the Board, and may be terminated only with the approval of a majority of the independent members of the Board. The Senior Officer prepared and furnished to the Board an independent, written evaluation that covered topics discussed below (the “Senior Officer's Evaluation”). The Board considered the Senior Officer's Evaluation, along with other information, in deciding to approve the investment advisory contract.
The Board is also familiar with and considered judicial decisions concerning allegedly excessive investment advisory fees, which have indicated that the following factors may be relevant to an adviser's fiduciary duty with respect to its receipt of compensation from a fund: the nature and quality of the services provided by an adviser to a fund and its shareholders, including the performance and fees and expenses of the fund and of comparable funds; an adviser's cost of providing the services, including the profitability to an adviser of providing advisory services to a fund; the extent to which an adviser may realize “economies of scale” as a fund grows larger and, if such economies of scale exist, whether they have been shared with a fund and its shareholders or the family of funds; any “fall-out financial benefits” that accrue to an adviser because of its relationship with a fund (including research services received from brokers that execute fund trades and any fees paid to affiliates of an adviser for services rendered to a fund); comparative fee and expense structures, including a comparison of fees paid to an adviser with those paid by similar funds; and the extent of care, conscientiousness and independence with which board members perform their duties and their expertise, including whether they are fully informed about all facts the board deems relevant to its consideration of an adviser's services and fees. The Board noted that the Securities and Exchange Commission (“SEC”) disclosure requirements regarding the basis for the Board's approval of the Fund's investment advisory contract generally track the factors listed above. Consistent with these judicial decisions and SEC disclosure requirements, the Board also considered management fees charged to
Annual Shareholder Report
institutional and other clients of Federated Investment Management Company (the “Adviser”) for what might be viewed as like services. The Board was aware of these factors and was guided by them in its review of the Fund's investment advisory contract to the extent it considered them to be appropriate and relevant, as discussed further below.
The Board considered and weighed these circumstances in light of its substantial accumulated experience in governing the Fund and working with Federated Investors, Inc. and its affiliates (“Federated”) on matters relating to the Federated funds, and was assisted in its deliberations by independent legal counsel. Throughout the year, and in connection with its May meetings, the Board requested and received substantial and detailed information about the Fund and the Federated organization that was in addition to the extensive materials that comprise and accompany the Senior Officer's Evaluation. Federated provided much of this information at each regular meeting of the Board, and furnished additional substantial information in connection with the May meetings at which the Board's formal review of the investment advisory contract occurred. At the May meetings in addition to meeting in separate sessions of the independent trustees without management present, senior management of the Adviser also met with the independent trustees and their counsel to discuss the materials presented and any other matters thought relevant by the Adviser or the trustees. Between regularly scheduled meetings, the Board also received information on particular matters as the need arose. Thus, the Board's consideration of the investment advisory contract included review of the Senior Officer's Evaluation, accompanying data and additional information covering such matters as: the Adviser's investment philosophy, revenue, profitability, personnel and processes; investment and operating strategies; the Fund's short- and long-term performance (in absolute terms, both on a gross basis and net of expenses, as well as in relationship to its particular investment program and certain competitor or “peer group” funds and/or other benchmarks, as appropriate), and comments on the reasons for performance; the Fund's investment objectives; the Fund's expenses (including the advisory fee itself and the overall expense structure of the Fund, both in absolute terms and relative to similar and/or competing funds, with due regard for contractual or voluntary expense limitations); the use and allocation of brokerage commissions derived from trading the Fund's portfolio securities (if any); and the nature, quality and extent of the advisory and other services provided to the Fund by the Adviser and its affiliates. The Board also considered the preferences and expectations of Fund shareholders; the entrepreneurial risk assumed by the Adviser in sponsoring the Fund; the continuing state of competition in the mutual fund industry and market practices; the range of comparable fees for similar funds in the mutual fund industry; the Fund's relationship to the Federated funds which include a comprehensive array of funds with different investment objectives, policies and strategies which are generally available for exchange without the incurrence of additional sales charges; compliance and
Annual Shareholder Report
audit reports concerning the Federated funds and the Federated companies that service them (including communications from regulatory agencies), as well as Federated's responses to any issues raised therein; and relevant developments in the mutual fund industry and how the Federated funds and/or Federated are responding to them. The Board's evaluation process is evolutionary. The criteria considered and the emphasis placed on relevant criteria change in recognition of changing circumstances in the mutual fund marketplace.
While mindful that courts have cautioned against giving such comparisons too much weight, the Board has found the use of comparisons of the Fund's fees and expenses to other mutual funds with comparable investment programs to be relevant to its deliberations. In this regard, the Board was presented with, and considered, information regarding the contractual advisory fee rates, net advisory fee rates, total expense ratios and each element of the Fund's total expense ratio (i.e., gross and net advisory fees, custody fees, portfolio accounting fees and transfer agency fees) relative to the Fund's peers. The Board focused on comparisons with other similar mutual funds more heavily than non-mutual fund products or services because it is believed that they are more relevant. For example, other mutual funds are the products most like the Fund, they are readily available to Fund shareholders as alternative investment vehicles, and they are the type of investment vehicle in fact chosen and maintained by the Fund's investors. The range of their fees and expenses therefore appears to be a relevant indicator of what consumers have found to be reasonable in the precise marketplace in which the Fund competes.
The Board reviewed the contractual advisory fee rate, net advisory fee rate where partially waived and other expenses of the Fund and noted the position of the Fund's fee rates relative to its peers. In this regard, the Board noted that the contractual advisory fee rate was below the median of the relevant peer group and the Board was satisfied that the overall expense structure of the Fund remained competitive.
By contrast, the Senior Officer has reviewed Federated's fees for providing advisory services to products outside the Federated funds (e.g., institutional and separate accounts and sub-adviser services). He concluded that mutual funds and institutional accounts are inherently different products. Those differences include, but are not limited to, different types of targeted investors; being subject to different laws and regulations; different legal structures; different average account sizes and portfolio management techniques made necessary by different cash flows and different associated costs; and the time spent by portfolio managers and their teams, funds financial services, legal, compliance and risk management in reviewing securities pricing, addressing different administrative responsibilities, addressing different degrees of risk associated with management and a variety of different costs. The Senior Officer did not consider the fees for providing advisory services to these outside products to be determinative in judging the appropriateness of mutual fund advisory fees.
Annual Shareholder Report
Following such evaluation, the Board concluded, within the context of its full deliberations, that the expenses of the Fund are reasonable and supported renewal of the investment advisory contract with respect to the Fund.
The Board considered the nature, extent and quality of the services provided to the Fund by the Adviser and the resources of the Adviser and its affiliates dedicated to the Fund. In this regard, the Board evaluated, among other things, the Adviser's personnel, experience, track record, overall reputation and willingness to invest in personnel and infrastructure that benefit the Fund. In addition, the Board reviewed the qualifications, backgrounds and responsibilities of the portfolio management team primarily responsible for the day-to-day management of the Fund. The Board noted the compliance programs of and the compliance-related resources provided to the Fund by the Adviser. The Fund's ability to deliver competitive performance when compared to its peer group was also deemed to be relevant by the Board as a useful indicator of how the Adviser is executing the Fund's investment program, which in turn was one of the Board's considerations in reaching a conclusion that the nature, extent, and quality of the Adviser's investment management services were such as to warrant continuation of the investment advisory contract.
In evaluating the Fund's investment performance, the Board considered performance results in light of the Fund's investment objective, strategies and risks, as disclosed in the Fund's prospectus. The Board particularly considered detailed investment reports on the Fund's performance provided to the Board throughout the year and in connection with the May meetings. The Senior Officer also reviewed information compiled by Federated, using data supplied by independent fund ranking organizations, regarding the performance of, and fees charged by, other mutual funds, noting his view that comparisons to fund peer groups may be helpful, though not conclusive, in judging the reasonableness of the proposed fees. The Board considered, in evaluating such comparisons, that in some cases individual funds may exhibit significant and unique differences in their objectives and management techniques when compared to other funds within an industry peer group.
The Fund's performance fell below the median of the relevant peer group for the one-year, three-year and five-year periods covered by the Senior Officer's Evaluation. The Board discussed the Fund's performance with the Adviser and recognized the efforts being taken by the Adviser in the context of the other factors considered relevant by the Board.
Following such evaluation, the Board concluded, within the context of its full deliberations, that the performance of the Fund supported renewal of the investment advisory contract with respect to the Fund.
The Board also received financial information about Federated, including information regarding the compensation and ancillary (or “fall-out”) benefits Federated derived from its relationships with the Federated funds. This information covered not only the fees under the investment advisory contracts, but also fees received by Federated's subsidiaries for providing other services to
Annual Shareholder Report
the Federated funds under separate contracts (e.g., for serving as the Federated funds' administrator). The information also detailed any indirect benefit Federated may derive from its receipt of research services from brokers who execute Federated fund trades. In addition, the Board considered the fact that, in order for a fund to be competitive in the marketplace, Federated and its affiliates frequently waived fees and/or reimbursed expenses and have disclosed to fund investors and/or indicated to the Board their intention to do so in the future, where appropriate. Moreover, the Board receives regular reporting as to the institution, adjustment or elimination of these voluntary waivers. The Board considered Federated's previous reductions in contractual management fees to certain funds in response to the Senior Officer's recommendations.
Federated furnished information, requested by the Senior Officer, that reported revenues on a fund-by-fund basis and made estimates of the allocation of expenses on a fund-by-fund basis, using allocation methodologies specified by the Senior Officer. The Senior Officer noted that, while these cost allocation reports apply consistent allocation processes, the inherent difficulties in allocating costs continues to cause the Senior Officer to question the precision of the process and to conclude that such reports may be unreliable, since a single change in an allocation estimate may dramatically alter the resulting estimate of cost and/or profitability of a fund and may produce unintended consequences. The allocation information, including the Senior Officer's view that fund-by-fund estimations may be unreliable, was considered in the analysis by the Board.
The Board and the Senior Officer also reviewed information compiled by Federated comparing profitability information for Federated to other publicly held fund management companies. In this regard, the Senior Officer concluded that Federated's profit margins did not appear to be excessive. The Senior Officer also noted that Federated appeared financially sound, with the resources to fulfill its obligations under its contracts with the Fund.
The Senior Officer's Evaluation also discussed the notion of possible realization of “economies of scale” as a fund grows larger. The Board considered in this regard that the Adviser has made significant and long-term investments in areas that support all of the Federated funds, such as personnel and processes for the portfolio management, shareholder services, compliance, internal audit, and risk management functions, as well as systems technology (including technology relating to cybersecurity), and that the benefits of these efforts (as well as any economies of scale, should they exist) were likely to be enjoyed by the fund family as a whole. The Board noted that the Adviser's investments in these areas are extensive. In addition, the Board considered that Federated and its affiliates have frequently waived fees and/or reimbursed expenses and that this has allowed fund shareholders to share potential economies of scale from a fund's inception. Federated, as it does throughout the year, and again in connection with the Board's review, furnished information relative to revenue sharing or adviser paid fees. Federated and the Senior Officer noted that this information should be viewed to determine if there was an incentive to either not apply
Annual Shareholder Report
breakpoints or to apply breakpoints at higher levels and should not be viewed to determine the appropriateness of advisory fees, because it would represent marketing and distribution expenses. Finally, the Board also noted the absence of any applicable regulatory or industry guidelines on this subject, which (as discussed in the Senior Officer's Evaluation) is compounded by the lack of any common industry practice or general pattern with respect to structuring fund advisory fees with “breakpoints” that serve to reduce the fee as a fund attains a certain size.
The Senior Officer noted that, subject to the comments and recommendations made within the Senior Officer's Evaluation, his observations and the information accompanying the Senior Officer's Evaluation supported a finding by the Board that the management fee for the fund was reasonable. Under these circumstances, no changes were recommended to, and no objection was raised to, the continuation of the Fund's investment advisory contract.
In its decision to continue an existing investment advisory contract, the Board was mindful of the potential disruptions of the Fund's operations and various risks, uncertainties and other effects that could occur as a result of a decision to terminate or not renew an investment advisory contract. In particular, the Board recognized that many shareholders have invested in the Fund on the strength of the Adviser's industry standing and reputation and with the expectation that the Adviser will have a continuing role in providing advisory services to the Fund. Thus, the Board's approval of the investment advisory contract reflected the fact that it is the shareholders who have effectively selected the Adviser by virtue of having invested in the Fund. The Board concluded that, in light of the factors discussed above, including the nature, quality and scope of the services provided to the Fund by the Adviser and its affiliates, continuation of the investment advisory contract was appropriate.
The Board based its decision to approve the investment advisory contract on the totality of the circumstances and relevant factors and with a view to past and future long-term considerations. Not all of the factors and considerations identified above were necessarily relevant to the Fund, nor did the Board consider any one of them to be determinative. With respect to the factors that were relevant, the Board's decision to approve the continuation of the contract reflects its determination that Federated's performance and actions provided a satisfactory basis to support the decision to continue the existing arrangement.
Annual Shareholder Report
Voting Proxies on Fund Portfolio Securities
A description of the policies and procedures that the Fund uses to determine how to vote proxies, if any, relating to securities held in the Fund's portfolio is available, without charge and upon request, by calling 1-800-341-7400. A report on “Form N-PX” of how the Fund voted any such proxies during the most recent 12-month period ended June 30 is available via the Proxy Voting Record (Form N-PX) link associated with the Fund and share class name at www.FederatedInvestors.com/FundInformation. Form N-PX filings are also available at the SEC's website at www.sec.gov.
Quarterly Portfolio Schedule
The Fund files with the SEC a complete schedule of its portfolio holdings, as of the close of the first and third quarters of its fiscal year, on “Form N-Q.” These filings are available on the SEC's website at www.sec.gov and may be reviewed and copied at the SEC's Public Reference Room in Washington, DC. (Call 1-800-SEC-0330 for information on the operation of the Public Reference Room.) You may also access this information via the link to the Fund and share class name at www.FederatedInvestors.com/FundInformation.
Annual Shareholder Report
Mutual funds are not bank deposits or obligations, are not guaranteed by any bank and are not insured or guaranteed by the U.S. government, the Federal Deposit Insurance Corporation, the Federal Reserve Board or any other government agency. Investment in mutual funds involves investment risk, including the possible loss of principal.
This Report is authorized for distribution to prospective investors only when preceded or accompanied by the Trust's Prospectus, which contains facts concerning its objective and policies, management fees, expenses and other information.
Federated Michigan Intermediate Municipal Trust
Federated Investors Funds
4000 Ericsson Drive
Warrendale, PA 15086-7561
Contact us at FederatedInvestors.com
or call 1-800-341-7400.
Federated Securities Corp., Distributor
CUSIP 313923302
G01106-03 (10/16)
Federated is a registered trademark of Federated Investors, Inc.
2016 ©Federated Investors, Inc.
Annual Shareholder Report
August 31, 2016
| Share Class | Ticker |
| A | NYIFX |
| B | NYIBX |
Federated New York Municipal Income Fund
Fund Established 1992
A Portfolio of Federated Municipal Securities Income Trust
Dear Valued Shareholder,
I am pleased to present the Annual Shareholder Report for your fund covering the period from September 1, 2015 through August 31, 2016. This report includes Management's Discussion of Fund Performance, a complete listing of your fund's holdings, performance information and financial statements along with other important fund information.
In addition, our website, FederatedInvestors.com, offers easy access to Federated resources that include timely fund updates, economic and market insights from our investment strategists, and financial planning tools. We invite you to register to take full advantage of its capabilities.
Thank you for investing with Federated. I hope you find this information useful and look forward to keeping you informed.
Sincerely,
J. Christopher Donahue, President
Not FDIC Insured • May Lose Value • No Bank Guarantee
CONTENTS
| 1 |
| 8 |
| 9 |
| 15 |
| 17 |
| 18 |
| 19 |
| 20 |
| 29 |
| 30 |
| 32 |
| 38 |
| 44 |
| 44 |
Management's Discussion of Fund Performance (unaudited)
The total return of Federated New York Municipal Income Fund (the “Fund”), based on net asset value for the 12-month reporting period ended August 31, 2016 (“reporting period”), was 6.72% for the Fund's A Shares and 5.92% for the Fund's B Shares. The 6.72% total return of the A Shares for the reporting period consisted of 3.04% of tax-exempt dividends and reinvestments and price appreciation of 3.68% in the net asset value of the shares.1 The total return for the S&P Municipal Bond New York Index (the “NY Index”),2 the Fund's broad-based securities market index, was 6.69%, during the same period. The total return for the S&P Municipal Bond NY, Investment Grade, 3-Year Plus Sub-Index (NYIG3 Index),3 a secondary benchmark for the Fund, was 7.44%, and the total return of the Morningstar Muni New York Long Funds Average (MMNYLFA),4 a peer group for the Fund, was 7.32% during the same period. The Fund's and MMNYLFA's total returns for the most recently completed fiscal year reflected actual cash flows, transaction costs and other expenses, which were not reflected in the total return of the NY Index or NYIG3 Index.
During the reporting period, the Fund's investment strategy focused on: (a) the effective duration of its portfolio (which indicates the portfolio's sensitivity to changes in interest rates);5,6 (b) the allocation of the portfolio among securities of similar issuers (referred to as “sectors”); and (c) the credit quality of portfolio securities (which is shown through credit ratings which indicate the risk that securities may default).7 These were the most significant factors affecting the Fund's performance relative to the NYIG3 Index during the reporting period.
The following discussion focuses on the performance of the Fund's Class A Shares.
MARKET OVERVIEW
During the reporting period, 10-year Treasury yields decreased from a high of 2.34% in November of 2015 to a low of 1.36% in July of 2016 and averaged 1.89%. Economic activity in the U.S. expanded at a moderate pace despite the global economic and financial setbacks in recent months. A range of recent economic indicators, including strong job gains, pointed to additional strengthening of the labor market. Inflation showed signs of picking up in recent months; however, it continued to run below the Federal Reserve System's (the “Fed”) two percent longer run objective. This partly reflected declines in energy prices and impacts of the U.S. dollar's strength on non-energy imports. Global economic developments continued to pose risks as turmoil in Chinese financial markets and lower oil prices contributed to concerns about the prospects for global economic growth and a pullback from risky assets. The Fed's decision to raise the federal funds target rate by 1/4 percent was widely anticipated by the
Annual Shareholder Report
markets. A downward revision in the expected path of the federal funds target rate was warranted by economic conditions and moved closer to the markets' expectations of the long-run plan.
The vote by the United Kingdom to leave the European Union (“Brexit”) resulted in immediate asset price volatility and some financial markets, particularly certain foreign exchange markets, experienced brief periods of strained liquidity. Safe haven asset prices appreciated substantially, but broad based market dislocations did not develop. Overall, the negative sentiment surrounding the Brexit outcome was subsequently alleviated by expectations of the central banks being more accommodative. Nevertheless, several long-term global risks related to Brexit remained.
Downward pressure on domestic energy activity intensified over the reporting period as oil prices dropped further. The imbalance of crude oil relative to demand remained very high, and it was not expected to resolve quickly. The collapse in the price of oil supported the fixed-income markets by further reducing price pressures and generating concerns that the drop in oil prices might reflect declining demand in a weakening global economy. The support for household spending from lower energy prices was offset by the restraint implied by the appreciation of the U.S. dollar and the possibility of adverse effects from slower economic growth in China.
During the reporting period, developments in Europe continued to be a focus for investors which indirectly affected interest rate levels in the tax-exempt municipal bond market. With regard to Europe, there continued to be downside risks to growth emanating from the region, given its unresolved imbalances, weak economic growth and continued deflationary risks. The U.S. dollar strengthened against the currencies of most advanced economies amid concerns about growth in those countries as well as announcements by several central banks regarding monetary policy actions. Elements underpinning the strength of the U.S. dollar were the increasing prevalence of negative interest rates on sovereign debt in some key European economies and risks to the international economic outlook. The European Central Bank announced that it would expand its asset purchase program.
Credit conditions in the municipal bond market continued to be generally solid. Credit quality continued to be overall very stable, and ratios of general obligation bonds to those of comparable Treasury securities rose, partly reflecting the declines in yields on Treasury securities. The default by Puerto Rico and the downgrade of Illinois general obligation bonds both had only a limited effect on the broader municipal market.The municipal bond markets' technical (supply and demand) position was mostly favorable over the reporting period. The issuance of municipal debt was lower than in previous periods as issuers were hesitant to add additional leverage and the economic benefits of refunding existing debt became less advantageous. Flows from investors into intermediate, long and high yield municipal bonds were positive and broad-based for a significant portion of the reporting period.
Annual Shareholder Report
The intermittent flight to quality by investors as a result of the unstable global political and economic environment also favored municipal bonds as they were viewed as a safer alternative investment.
The risk of additional municipal issuers becoming distressed remained through the reporting period. Some state and local governments turned to the courts for assistance in lowering their onerous pension liabilities, but responses from the courts were generally not favorable. Any workouts of these concerns are likely to take many years, which will continue to constrain state and local government budgets and limit their capacity to deal with severe infrastructure needs. The ongoing pressures on public pension plans and their unfunded liabilities continued to receive significant scrutiny.
Some positive news about the fiscal position of the states became available during the reporting period and, in some cases, revenues rose sufficiently to enable increases in state government spending and employment. These positive events allowed the spread between “AAA”- and “BBB”-rated general obligation debt to narrow by 27 basis points for 30 year maturities during the reporting period. The municipal yield curve also flattened significantly as yields on shorter maturities increased while yields on longer maturities (5 years and longer) declined leading to better total return performance for longer dated municipal bonds.
New York is the third largest U.S. state by population and has a large and diverse economy with high per capita income and a gross state product of over $1.2 trillion dollars. The state has a well below average leverage position with respect to its pension liabilities. The state implemented pension reforms in 2012 for all new employees that raised the retirement age, increased employee contributions and increased the number of years included in the calculation for final average salary on which pension benefits are based. New York followed a number of strong management practices, including multi-year financial planning and consensus revenue forecasting. The state had a long record of late budget adoption but passed its budget on time for almost every year of the last decade. The performance of the financial services industry is very important to New York's credit profile. The state's finances are highly sensitive to income tax payments from the wealthy and to employment in the high paid securities industry which are centered in New York City.
DURATION
As determined at the end of the reporting period, the Fund's dollar-weighted average duration for the reporting period was 4.8 years. Duration management continued to be a significant component of the Fund's investment strategy. The Fund's average duration was shorter than the average duration of the NYIG3 Index during the reporting period. Tax-exempt municipal bond yields decreased during most of the reporting period and decreased more for bonds with longer maturities as the yield curve significantly flattened during the reporting period. Bonds with a longer duration outperformed bonds with a shorter duration due
Annual Shareholder Report
to their differences in interest rate volatility. As a result of the Fund's underweight to bonds with longer durations relative to those included in the NYIG3 Index, duration had a negative impact on Fund performance over the reporting period. The Fund had a larger allocation to Pre-Refunded bonds than the NYIG3 Index. This sector underperformed the NYIG3 Index during the reporting period and provided negative excess return relative to the NYIG3 Index. Pre-Refunded bonds are escrowed in Treasury securities until their most recent call date and have less sensitivity to changes in interest rates as a result. As interest rates declined over the reporting period, Pre-Refunded bonds underperformed relative to the benchmark.
SeCTOR ALLOCATION
During the reporting period, sector allocation negatively contributed to the excess return of the Fund. The Fund maintained a lower portfolio allocation to Water and Sewer and Public Power revenue bonds than the benchmark. These lesser allocations hurt the Fund's performance due to the outperformance of these sectors relative to the NYIG3 Index. The Fund had larger allocations to Senior Care and Industrial Development revenue bonds than the NYIG3 Index. These sectors outperformed the NYIG3 Index during the reporting period and provided positive excess return relative to the NYIG3 Index.
credit QUALITY8
During the reporting period, the Fund received a significant positive contribution to excess return from credit selection as investor appetite for yield in the low interest rate environment increased municipal bond fund inflows and resulted in outperformance of bonds rated “A” and “BBB” (or unrated bonds of comparable quality) relative to bonds rated in the higher rating categories (or unrated bonds of comparable quality). Bonds in the noninvestment-grade category, below “BBB,” also outperformed the higher rating categories. With the decrease in credit spreads during the reporting period, and to a lesser extent for “AAA” and “AA” rated (or unrated comparable quality) debt, the Fund's overweight position, relative to the NYIG3 Index, in “A” and “BBB” (or unrated comparable quality) debt during the reporting period had a positive impact on the Fund's performance, as the yield on “A” and “BBB” (or unrated comparable quality) debt decreased to a greater extent than for other investment-grade securities. The Fund's exposure to noninvestment-grade debt added positive excess return as these securities also experienced spread tightening versus higher quality debt over the reporting period. Non-investment grade sectors that performed particularly well over the reporting period included Healthcare and Tobacco Settlement Debt.
Annual Shareholder Report
| 1 | Income may be subject to the federal alternative minimum tax for individuals and corporations (AMT). |
| 2 | Please see the footnotes to the line graphs under “Fund Performance and Growth of a $10,000 Investment” below for the definition of, and more information about, the NY Index. |
| 3 | Please see the footnotes to the line graphs under “Fund Performance and Growth of a $10,000 Investment” below for the definition of, and more information about, the NYIG3 Index. The Fund's secondary index is being used for comparison purposes because, while it is not the Fund's broad-based securities market index, the Fund's Adviser believes it more closely reflects the securities in which the Fund invests. |
| 4 | Please see the footnotes to the line graphs under “Fund Performance and Growth of a $10,000 Investment” below for the definition of, and more information about, the MMNYLFA. |
| 5 | Duration is a measure of a security's price sensitivity to changes in interest rates. Securities with longer durations are more sensitive to changes in interest rates than securities with shorter durations. For purposes of this Management's Discussion of Fund Performance, duration is determined using a third-party analytical system. |
| 6 | Bond prices are sensitive to changes in interest rates, and a rise in interest rates can cause a decline in their prices. |
| 7 | Credit ratings pertain only to the securities in the portfolio and do not protect Fund shares against market risk. |
| 8 | Investment-grade securities and noninvestment-grade securities may either be: (a) rated by a nationally recognized statistical ratings organization or rating agency; or (b) unrated securities that the Fund's investment adviser (“Adviser”) believes are of comparable quality. The rating agencies that provided the ratings for rated securities include Standard and Poor's, Moody's Investor Services, Inc. and Fitch Rating Service. When ratings vary, the highest rating is used. Credit ratings of “AA” or better are considered to be high credit quality; credit ratings of “A” are considered high or medium/good quality; and credit ratings of “BBB” are considered to be medium/good credit quality, and the lowest category of investment-grade securities; credit ratings of “BB” and below are lower-rated, noninvestment-grade securities or junk bonds; and credit ratings of “CCC” or below are noninvestment-grade securities that have high default risk. Any credit quality breakdown does not give effect to the impact of any credit derivative investments made by the Fund. Credit ratings are an indication of the risk that a security will default. They do not protect a security from credit risk. Lower-rated bonds typically offer higher yields to help compensate investors for the increased risk associated with them. Among these risks are lower creditworthiness, greater price volatility, more risk to principal and income than with higher-rated securities and increased possibilities of default. |
Annual Shareholder Report
FUND PERFORMANCE AND GROWTH OF A $10,000 INVESTMENT
The graph below illustrates the hypothetical investment of $10,0001 in Federated New York Municipal Income Fund (the “Fund”) from August 31, 2006 to August 31, 2016, compared to the S&P Municipal Bond New York Index (NY Index),2 S&P Municipal Bond NY, Investment Grade, 3-Year Plus Sub-Index (NYIG3 Index)3 and the Morningstar Muni New York Long Funds Average (MMNYLFA).4 The Average Annual Total Return table below shows returns for each class averaged over the stated periods.
Growth of A $10,000 Investment
Growth of $10,000 as of August 31, 2016
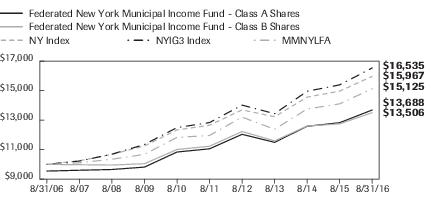
| Federated New York Municipal Income Fund - | Class A Shares | Class B Shares | NY Index | NYIG3 Index | MMNYLFA |
| F | F | I | I | I |
| 8/31/2006 | 9,550 | 10,000 | 10,000 | 10,000 | 10,000 |
| 8/31/2007 | 9,604 | 9,981 | 10,249 | 10,227 | 10,111 |
| 8/31/2008 | 9,655 | 9,958 | 10,683 | 10,692 | 10,352 |
| 8/31/2009 | 9,818 | 10,049 | 11,251 | 11,349 | 10,678 |
| 8/31/2010 | 10,840 | 11,011 | 12,335 | 12,495 | 11,833 |
| 8/31/2011 | 11,056 | 11,232 | 12,654 | 12,835 | 11,960 |
| 8/31/2012 | 12,038 | 12,230 | 13,693 | 14,018 | 13,203 |
| 8/31/2013 | 11,496 | 11,594 | 13,229 | 13,437 | 12,383 |
| 8/31/2014 | 12,584 | 12,599 | 14,562 | 14,958 | 13,757 |
| 8/31/2015 | 12,827 | 12,749 | 14,967 | 15,390 | 14,105 |
| 8/31/2016 | 13,688 | 13,506 | 15,967 | 16,535 | 15,125 |
41 graphic description end -->
| ■ | Total returns shown for the A Shares include the maximum sales charge of 4.50% ($10,000 investment minus $450 sales charge = $9,550) |
| ■ | Total returns shown for the B Shares include the maximum contingent deferred sales charge of 5.50% as applicable. |
Average Annual Total Returns for the Period Ended 8/31/2016
(returns reflect all applicable sales charges and contingent deferred sales charges as specified below in footnote #1)
| | 1 Year | 5 Years | 10 Years |
| Class A Shares | 1.88% | 3.40% | 3.19% |
| Class B Shares | 0.42% | 3.24% | 3.04% |
| NY Index | 6.69% | 4.76% | 4.79% |
| NYIG3 Index | 7.44% | 5.20% | 5.16% |
| MMNYLFA | 7.32% | 4.88% | 4.16% |
Annual Shareholder Report
Performance data quoted represents past performance which is no guarantee of future results. Investment return and principal value will fluctuate so that an investor's shares, when redeemed, may be worth more or less than their original cost. Mutual fund performance changes over time and current performance may be lower or higher than what is stated. For current to the most recent month-end performance and after-tax returns, visit FederatedInvestors.com or call 1-800-341-7400. Returns shown do not reflect the deduction of taxes that a shareholder would pay on Fund distributions or the redemption of Fund shares. Mutual funds are not obligations of or guaranteed by any bank and are not federally insured.
| 1 | Represents a hypothetical investment of $10,000 in the Fund after deducting applicable sales charges: For Class A Shares, the maximum sales charge of 4.50% ($10,000 investment minus $450 sales charge = $9,550); For Class B Shares, the maximum contingent deferred sales charge is 5.50% on any redemption of shares held up to one year from the purchase date. The Fund's performance assumes the reinvestment of all dividends and distributions. The NY Index, NYIG3 Index and MMNYLFA have been adjusted to reflect reinvestment of dividends on securities in the indexes and average. |
| 2 | The NY Index consists of bonds in the S&P Municipal Bond New York Index (“Main Index”) that have been issued by the state of New York or local governments or state or local government entities within New York. The Main Index is a broad, comprehensive, market value-weighted index comprised of approximately 55,000 bond issues that are exempt from U.S. federal income taxes or subject to the alternative minimum tax (AMT). Eligibility criteria for inclusion in the Main Index include, but are not limited to: the bond issuer must be a state (including the Commonwealth of Puerto Rico and U.S. territories) or a local government or a state or agency where interest on the bond is exempt from U.S. federal income taxes or subject to the AMT; the bond must be held by a mutual fund for which Standard & Poor's Securities Evaluations, Inc. provides prices; it must be denominated in U.S. dollars and have a minimum par amount of $2 million; and the bond must have a minimum term to maturity and/or call date greater than or equal to one calendar month. The Main Index is rebalanced monthly. The NY Index is not adjusted to reflect sales charges, expenses and other fees that the Securities and Exchange Commission (SEC) requires to be reflected in the Fund's performance. The NY Index is unmanaged and, unlike the Fund, is not affected by cash flows. It is not possible to invest directly in an index. |
| 3 | The NYIG3 Index represents the portion of the NY Index composed solely of bonds that are rated BBB-/Baa3 or higher with remaining maturities of more than three years that are not subject to AMT. The NYIG3 Index is not adjusted to reflect sales charges, expenses and other fees that the SEC requires to be reflected in the Fund's performance. The NYIG3 Index is unmanaged and, unlike the Fund, is not affected by cash flows. It is not possible to invest directly in an index. |
| 4 | Morningstar figures represent the average of the total returns reported by all the mutual funds designated by Morningstar as falling into the respective category indicated. They do not reflect sales charges. |
Annual Shareholder Report
Portfolio of Investments Summary Table (unaudited)
At August 31, 2016, the Fund's sector composition1 was as follows:
| Sector Composition | Percentage of
Total Net Assets |
| Education | 21.1% |
| Dedicated Tax | 13.0% |
| Pre-Refunded | 11.2% |
| Hospital | 8.3% |
| Toll Road | 5.9% |
| General Obligation—Local | 5.8% |
| Other Transportation | 5.2% |
| Industrial Development Bond/Pollution Control | 4.8% |
| General Obligation—State | 3.4% |
| Water & Sewer | 3.3% |
| Other2 | 17.0% |
| Other Assets and Liabilities—Net3 | 1.0% |
| TOTAL | 100.0% |
| 1 | Sector classifications, and the assignment of holdings to such sectors, are based upon the economic sector and/or revenue source of the underlying obligor, as determined by the Fund's Adviser. For securities that have been enhanced by a third-party guarantor, such as bond insurers and banks, sector classifications are based upon the economic sector and/or revenue source of the underlying obligor, as determined by the Fund's Adviser. Pre-refunded securities are those whose debt service is paid from escrowed assets, usually U.S. government securities. |
| 2 | For purposes of this table, sector classifications constitute 82.0% of the Fund's total net assets. Remaining sectors have been aggregated under the designation “Other.” |
| 3 | Assets, other than investments in securities, less liabilities. See Statement of Assets and Liabilities. |
Annual Shareholder Report
Portfolio of Investments
August 31, 2016
Principal
Amount | | | Value |
| | | MUNICIPAL BONDS—98.1% | |
| | | Guam—1.1% | |
| $300,000 | | Guam Power Authority, Revenue Bonds (Series 2014A), 5.00%, 10/1/2031 | $346,503 |
| | | New York—97.0% | |
| 1,000,000 | | Babylon, NY IDA, Resource Recovery Bonds (Series 2009A), 5.00% (Covanta Babylon, Inc.), 1/1/2019 | 1,092,010 |
| 250,000 | | Battery Park, NY City Authority, Senior Revenue Bonds (Series 2013A), 5.00%, 11/1/2025 | 317,270 |
| 480,000 | | Brooklyn Arena Local Development Corp., NY, PILOT Revenue Bonds (Series 2009), 6.375% (United States Treasury PRF 1/15/2020@100)/(Original Issue Yield: 6.476%), 7/15/2043 | 569,314 |
| 200,000 | | Build NYC Resource Corp., Revenue Refunding Bonds (Series 2014), 5.00% (New York Methodist Hospital), 7/1/2028 | 239,770 |
| 250,000 | | Cattaraugus County, NY Capital Resource Corp., Revenue Bonds, 5.00% (St. Bonaventure University), 5/1/2044 | 275,013 |
| 200,000 | | Chautauqua, NY Tobacco Asset Securitization Corp., Tobacco Settlement Asset-Backed Bonds (Series 2014), 5.00%, 6/1/2034 | 216,808 |
| 300,000 | | Dutchess County, NY Local Development Corp., Revenue Bonds (Series 2014A), 5.00% (Health Quest Systems, Inc. Obligated Group), 7/1/2034 | 355,860 |
| 300,000 | | Dutchess County, NY Local Development Corp., Revenue Bonds (Series 2015A), 5.00% (Marist College), 7/1/2040 | 360,687 |
| 200,000 | | Hempstead, NY Local Development Corp., Revenue Refunding Bonds (Series 2014), 5.00% (Adelphi University), 10/1/2034 | 239,458 |
| 215,000 | | Hudson Yards Infrastructure Corp. NY, Hudson Yards Senior Revenue Bonds (Series 2012A), 5.75%, 2/15/2047 | 253,476 |
| 500,000 | | Livingston County, NY IDA, Civic Facility Revenue Bonds (Series 2005), 6.00% (Nicholas H. Noyes Memorial Hospital Civic Facility), 7/1/2030 | 502,330 |
| 500,000 | | Long Island Power Authority, NY, Electric System General Revenue Bonds (Series 2014A), 5.00%, 9/1/2044 | 594,915 |
| 300,000 | | Madison County, NY Capital Resource Corp., Tax-Exempt Revenue Bonds (Series 2015B), 5.00% (Colgate University), 7/1/2040 | 369,258 |
| 300,000 | 1 | Metropolitan Transportation Authority, NY, (MTA Dedicated Tax Fund), Dedicated Tax Fund Refunding Bonds (Series 2008B-3a) (Floating Rate Tender Notes), 0.93%, 11/1/2018 | 299,055 |
| 500,000 | | Metropolitan Transportation Authority, NY, Dedicated Tax Fund Bonds (Series 2009B), 5.00% (MTA Dedicated Tax Fund)/(Original Issue Yield: 5.10%), 11/15/2034 | 565,665 |
| 500,000 | | Metropolitan Transportation Authority, NY, Revenue Bonds (Series 2006A), 5.00% (MTA Transportation Revenue), 11/15/2035 | 504,525 |
Annual Shareholder Report
Principal
Amount | | | Value |
| | | MUNICIPAL BONDS—continued | |
| | | New York—continued | |
| $500,000 | | Metropolitan Transportation Authority, NY, Revenue Bonds (Series 2012E), 5.00% (MTA Transportation Revenue), 11/15/2025 | $610,655 |
| 475,000 | | Monroe County, NY IDC, Revenue Bonds (Series 2011A), 5.00% (University of Rochester, NY), 7/1/2041 | 548,625 |
| 200,000 | | Monroe County, NY IDC, Tax-Exempt Revenue Bonds (Series 2015), 5.00% (Highland Hospital of Rochester), 7/1/2033 | 239,054 |
| 100,000 | | Nassau County, NY Local Economic Assistance Corp., Revenue Bonds (Series 2014), 5.00% (Catholic Health Services of Long Island Obligated Group), 7/1/2034 | 116,752 |
| 200,000 | | Nassau County, NY Tobacco Settlement Corp., Tobacco Settlement Asset-Backed Bonds (Series 2006A-3), 5.125% (Original
Issue Yield: 5.31%), 6/1/2046 | 196,566 |
| 300,000 | | New Rochelle, NY Corp. for Local Development, Revenue Bonds (Series 2015), 5.00% (Iona College), 7/1/2040 | 352,092 |
| 500,000 | | New York City Liberty Development Corp., Revenue Bonds (Series 2005), 5.25% (Goldman Sachs Group, Inc.), 10/1/2035 | 686,430 |
| 500,000 | | New York City Trust For Cultural Resources, Revenue Refunding Bonds (Series 2008A), 5.00% (Museum of Modern Art)/(United States Treasury PRF 10/1/2018@100), 4/1/2028 | 545,205 |
| 500,000 | | New York City Trust For Cultural Resources, Revenue Refunding Bonds (Series 2008A), 5.00% (Museum of Modern Art)/(United States Treasury PRF 10/1/2018@100), 4/1/2031 | 545,205 |
| 300,000 | | New York City, NY Municipal Water Finance Authority, Water & Sewer System Second General Resolution Revenue Bonds (Fiscal 2016 Subseries CC-1), 4.00%, 6/15/2038 | 343,818 |
| 500,000 | | New York City, NY Municipal Water Finance Authority, Water and Sewer System Revenue Bonds (Series 2008AA), 5.00%
(United States Treasury PRF 6/15/2018@100), 6/15/2022 | 539,115 |
| 100,000 | | New York City, NY TFA , Future Tax Secured Subordinate Bonds (Fiscal 2017 Subseries A-1), 4.00%, 5/1/2042 | 112,442 |
| 455,000 | | New York City, NY TFA, Future Tax Secured Subordinate Bonds (Series 2011C), 5.50%, 11/1/2035 | 539,948 |
| 200,000 | 1 | New York City, NY, UT GO Bonds (Fiscal 1995 Series F Subseries F-4), 1.26%, 2/15/2020 | 199,738 |
| 300,000 | | New York City, NY, UT GO Bonds (Fiscal 2016 Series E), 5.00%, 8/1/2032 | 377,208 |
| 55,000 | | New York City, NY, UT GO Bonds (Series 2008 E-1), 6.25%
(Original Issue Yield: 6.40%), 10/15/2028 | 61,352 |
| 445,000 | | New York City, NY, UT GO Bonds (Series 2008E-1), 6.25%
(United States Treasury PRF 10/15/2018@100)/(Original Issue
Yield: 6.40%), 10/15/2028 | 497,274 |
| 400,000 | | New York City, NY, UT GO Bonds (Series 2012B), 5.00%, 8/1/2027 | 482,120 |
| 180,000 | | New York Convention Center Development Corp., Revenue Refunding Bonds (Hotel Unit Fee Secured) (Series 2015), 5.00%, 11/15/2040 | 218,608 |
Annual Shareholder Report
Principal
Amount | | | Value |
| | | MUNICIPAL BONDS—continued | |
| | | New York—continued | |
| $500,000 | | New York Liberty Development Corp., Liberty Revenue Bonds (Series 2011), 5.75% (4 World Trade Center), 11/15/2051 | $600,460 |
| 400,000 | | New York Liberty Development Corp., Revenue Refunding Bonds (Series 2012 Class 3), 5.00% (7 World Trade Center LLC), 3/15/2044 | 454,968 |
| 500,000 | | New York State Dormitory Authority, General Purpose Revenue Bonds (Series 2011C), 5.00% (New York State Personal Income Tax Revenue Bond Fund), 3/15/2026 | 587,945 |
| 500,000 | | New York State Dormitory Authority, Revenue Bonds (Series 1998), 5.50% (Memorial Sloan-Kettering Cancer Center)/(National Public Finance Guarantee Corp. INS), 7/1/2023 | 625,560 |
| 520,000 | | New York State Dormitory Authority, Revenue Bonds
(Series 2008C), 5.00% (New York State Personal Income
Tax Revenue Bond Fund), 3/15/2026 | 553,202 |
| 10,000 | | New York State Dormitory Authority, Revenue Bonds
(Series 2009C), 5.00% (School District Financing Program)/(Assured Guaranty Corp. INS), 10/1/2023 | 11,138 |
| 490,000 | | New York State Dormitory Authority, Revenue Bonds (Series 2009C), 5.00% (School District Financing Program)/(United States Treasury PRF 10/1/2019@100), 10/1/2023 | 554,636 |
| 500,000 | | New York State Dormitory Authority, Revenue Bonds (Series 2010A), 5.00% (Cornell University), 7/1/2035 | 572,690 |
| 350,000 | | New York State Dormitory Authority, Revenue Bonds (Series 2012), 5.00% (Miriam Osborn Memorial Home Association), 7/1/2042 | 373,580 |
| 400,000 | | New York State Dormitory Authority, Revenue Bonds (Series 2012), 5.00% (Rochester, NY Institute of Technology), 7/1/2038 | 470,084 |
| 100,000 | | New York State Dormitory Authority, Revenue Bonds (Series 2012A), 5.00% (Catholic Health System Obligated Group), 7/1/2032 | 113,896 |
| 500,000 | | New York State Dormitory Authority, Revenue Bonds (Series 2012A), 5.00% (St. John's University), 7/1/2026 | 596,005 |
| 250,000 | | New York State Dormitory Authority, Revenue Bonds (Series 2012B), 5.00% (St. John's University), 7/1/2030 | 294,258 |
| 200,000 | | New York State Dormitory Authority, Revenue Bonds (Series 2013A), 5.00% (New York University), 7/1/2037 | 239,692 |
| 400,000 | | New York State Dormitory Authority, Revenue Bonds (Series 2014), 5.00% (Fordham University), 7/1/2030 | 485,304 |
| 200,000 | 2,3 | New York State Dormitory Authority, Revenue Bonds (Series 2015), 5.00% (Orange Regional Medical Center), 12/1/2040 | 225,972 |
| 300,000 | | New York State Dormitory Authority, Revenue Bonds (Series 2015A), 5.00% (Barnard College), 7/1/2035 | 363,339 |
| 300,000 | | New York State Dormitory Authority, Revenue Bonds (Series 2015A), 5.00% (North Shore-Long Island Jewish Obligated Group), 5/1/2036 | 359,139 |
| 300,000 | | New York State Dormitory Authority, Revenue Bonds (Series 2015A), 5.00% (The New School), 7/1/2040 | 358,056 |
| 300,000 | | New York State Dormitory Authority, Revenue Bonds (Series 2015B), 5.00% (State University of New York Educational Facilities), 7/1/2040 | 365,478 |
Annual Shareholder Report
Principal
Amount | | | Value |
| | | MUNICIPAL BONDS—continued | |
| | | New York—continued | |
| $300,000 | | New York State Environmental Facilities Corp., Clean Water & Drinking Water Revolving Funds Revenue Bonds (Series 2008A), 5.00%, 6/15/2029 | $322,368 |
| 500,000 | | New York State Local Government Assistance Corp., Senior Lien Revenue Refunding Bonds (Series 2008 A-5/6), 5.00%, 4/1/2020 | 556,720 |
| 500,000 | | New York State Local Government Assistance Corp., Subordinate Lien Revenue Refunding Bonds (Series 2010A), 5.00%, 4/1/2023 | 572,125 |
| 220,000 | | New York State Thruway Authority, General Revenue Bonds (Series 2012I), 5.00% (New York State Thruway Authority - General Revenue), 1/1/2028 | 261,558 |
| 500,000 | | New York State Thruway Authority, General Revenue Bonds (Series 2014J), 5.00% (New York State Thruway Authority - General Revenue), 1/1/2027 | 618,350 |
| 200,000 | | New York State Thruway Authority, General Revenue Junior Indebtedness Obligations (Series 2016A), 5.25% (New York State Thruway Authority - General Revenue ), 1/1/2056 | 247,380 |
| 210,000 | | New York State Urban Development Corp., Revenue Refunding Bonds (Series 1995), 5.70% (New York State)/(Original Issue
Yield: 5.94%), 4/1/2020 | 230,135 |
| 500,000 | | New York State, UT GO Bonds (Series 2009A), 5.00% (Original Issue Yield: 5.24%), 2/15/2039 | 551,335 |
| 500,000 | | New York State, UT GO Bonds (Series 2011A), 5.00%, 2/15/2020 | 574,200 |
| 100,000 | | New York Transportation Development Corporation, Special Facility Revenue Refunding Bonds (Series 2016), 5.00% (American
Airlines, Inc.), 8/1/2031 | 109,941 |
| 300,000 | | New York Transportation Development Corporation, Special Facilities Bonds (Series 2016A), 4.00% (Laguardia Airport Terminal B Redevelopment), 7/1/2046 | 316,503 |
| 335,000 | | Niagara Area Development Corp., NY, Solid Waste Disposal Facility Revenue Refunding Bonds (Series 2012B), 4.00% (Covanta Energy Corp.), 11/1/2024 | 339,918 |
| 500,000 | | Niagara Area Development Corp., NY, Tax Exempt Revenue Bonds (Series 2012A), 5.00% (Niagara University), 5/1/2030 | 578,520 |
| 200,000 | | Niagara Tobacco Asset Securitization Corp., Tobacco Settlement Asset-Backed Bonds (Series 2014), 5.25%, 5/15/2040 | 233,742 |
| 250,000 | | Onondaga, NY Civic Development Corp., Tax Exempt Revenue
Bonds (Series 2014A), 5.125% (St. Joseph's Hospital Health Center)/(United States Treasury PRF 7/1/2019@100)/(Original Issue Yield: 5.375%), 7/1/2031 | 281,205 |
| 200,000 | | Oyster Bay, NY, Public Improvement Refunding Bonds (Series 2014A), 5.00%, 1/15/2019 | 217,214 |
| 500,000 | | Port Authority of New York and New Jersey, Revenue Bonds
(194th Series), 5.00%, 10/15/2041 | 614,200 |
| 350,000 | | Suffolk County, NY Water Authority, Revenue Bonds (Series 2015A), 5.00%, 6/1/2037 | 431,364 |
Annual Shareholder Report
Principal
Amount | | | Value |
| | | MUNICIPAL BONDS—continued | |
| | | New York—continued | |
| $450,000 | | Syracuse, NY IDA, School Facility Revenue Bonds (Series 2008A), 5.00% (Syracuse CSD, NY)/(AGM INS), 5/1/2028 | $480,136 |
| 300,000 | | Tompkins County, NY Development Corp., Continuing Care Retirement Community Revenue Bonds (Series 2014A), 5.00% (Kendal at
Ithaca, Inc.), 7/1/2044 | 341,598 |
| 200,000 | | Tompkins County, NY Development Corp., Tax-Exempt Revenue Refunding Bonds (Series 2015), 5.00% (Ithaca College), 7/1/2038 | 237,832 |
| 500,000 | | Triborough Bridge & Tunnel Authority, NY, General Revenue Bonds (Series 2008A), 5.00% (Original Issue Yield: 5.10%), 11/15/2037 | 535,560 |
| 290,000 | | Triborough Bridge & Tunnel Authority, NY, General Revenue Bonds (Series 2009A-2), 5.00%, 11/15/2023 | 316,932 |
| 170,000 | | Triborough Bridge & Tunnel Authority, NY, General Revenue Bonds (Series 2009A-2), 5.00% (United States Treasury PRF 11/15/2018@100), 11/15/2023 | 186,363 |
| 300,000 | | Troy, NY Capital Resource Corporation, Revenue Bonds (Series 2015), 5.00% (Rensselaer Polytechnic Institute), 8/1/2032 | 365,670 |
| 400,000 | | TSASC, Inc. NY, Tobacco Settlement Asset-Backed Bonds (Series 2006-1), 5.125% (Original Issue Yield: 5.35%), 6/1/2042 | 396,520 |
| 200,000 | | Utility Debt Securitization Authority, NY, Restructuring Bonds (Series 2016A), 5.00% (Long Island Power Authority, NY), 12/15/2034 | 254,114 |
| | | TOTAL | 32,344,526 |
| | | TOTAL MUNICIPAL BONDS
(IDENTIFIED COST $29,940,676) | 32,691,029 |
| | | SHORT-TERM MUNICIPALS—0.9%4 | |
| | | New York—0.9% | |
| 100,000 | | New York City, NY, (Fiscal 2008 Subseries L-3) Daily VRDNs
(Bank of America N.A. LIQ), 0.58%, 9/1/2016 | 100,000 |
| 200,000 | | New York State HFA, (Series 2009B: 505 West 37th Street Housing) Daily VRDNs (Midtown West B LLC)/(Landesbank Hessen-Thuringen LOC), 0.64%, 9/1/2016 | 200,000 |
| | | TOTAL SHORT-TERM MUNICIPALS
(AT AMORTIZED COST) | 300,000 |
| | | TOTAL MUNICIPAL INVESTMENTS—99.0%
(IDENTIFIED COST $30,240,676)5 | 32,991,029 |
| | | OTHER ASSETS AND LIABILITIES - NET—1.0%6 | 349,401 |
| | | TOTAL NET ASSETS—100% | $33,340,430 |
Securities that are subject to the federal alternative minimum tax (AMT) represent 1.3% of the Fund's portfolio as calculated based upon total market value (unaudited).
| 1 | Floating rate note with current rate and current maturity or next reset date shown. |
| 2 | Denotes a restricted security that either: (a) cannot be offered for public sale without first being registered, or being able to take advantage of an exemption from registration, under the Securities Act of 1933; or (b) is subject to a contractual restriction on public sales. At August 31, 2016, these restricted securities amounted to $225,972, which represented 0.7% of total net assets. |
Annual Shareholder Report
| 3 | Denotes a restricted security that may be resold without restriction to “qualified institutional buyers” as defined in Rule 144A under the Securities Act of 1933 and that the Fund has determined to be liquid under criteria established by the Fund's Board of Trustees (the “Trustees”). At August 31, 2016, these liquid restricted securities amounted to $225,972, which represented 0.7% of total net assets. |
| 4 | Current rate and next reset date shown for Variable Rate Demand Notes. |
| 5 | The cost of investments for federal tax purposes amounts to $30,485,621. |
| 6 | Assets, other than investments in securities, less liabilities. See Statement of Assets and Liabilities. |
Note: The categories of investments are shown as a percentage of total net assets at August 31, 2016.
Various inputs are used in determining the value of the Fund's investments. These inputs are summarized in the three broad levels listed below:
Level 1—quoted prices in active markets for identical securities.
Level 2—other significant observable inputs (including quoted prices for similar securities, interest rates, prepayment speeds, credit risk, etc.). Also includes securities valued at amortized cost.
Level 3—significant unobservable inputs (including the Fund's own assumptions in determining the fair value of investments).
The inputs or methodology used for valuing securities are not an indication of the risk associated with investing in those securities.
As of August 31, 2016, all investments of the Fund utilized Level 2 inputs in valuing the Fund's assets carried at fair value.
The following acronyms are used throughout this portfolio:
| AGM | —Assured Guaranty Municipal Corp. |
| CSD | —Central School District |
| GO | —General Obligation |
| HFA | —Housing Finance Authority |
| IDA | —Industrial Development Authority |
| IDC | —Industrial Development Corporation |
| INS | —Insured |
| LIQ | —Liquidity Agreement |
| LOC | —Letter of Credit |
| PILOT | —Payment in Lieu of Taxes |
| PRF | —Pre-refunded |
| TFA | —Transitional Finance Authority |
| UT | —Unlimited Tax |
| VRDNs | —Variable Rate Demand Notes |
See Notes which are an integral part of the Financial Statements
Annual Shareholder Report
Financial Highlights–Class A Shares
(For a Share Outstanding Throughout Each Period)
| Year Ended August 31 | 2016 | 2015 | 2014 | 2013 | 2012 |
| Net Asset Value, Beginning of Period | $10.33 | $10.45 | $9.86 | $10.65 | $10.13 |
| Income From Investment Operations: | | | | | |
| Net investment income | 0.30 | 0.32 | 0.33 | 0.34 | 0.36 |
| Net realized and unrealized gain (loss) on investments and futures contracts | 0.38 | (0.12) | 0.59 | (0.80) | 0.52 |
| TOTAL FROM INVESTMENT OPERATIONS | 0.68 | 0.20 | 0.92 | (0.46) | 0.88 |
| Less Distributions: | | | | | |
| Distributions from net investment income | (0.30) | (0.32) | (0.33) | (0.33) | (0.36) |
| Net Asset Value, End of Period | $10.71 | $10.33 | $10.45 | $9.86 | $10.65 |
| Total Return1 | 6.72% | 1.94% | 9.46% | (4.50)% | 8.88% |
| Ratios to Average Net Assets: | | | | | |
| Net expenses | 0.76% | 0.76% | 0.76% | 0.76% | 0.62% |
| Net investment income | 2.89% | 3.10% | 3.26% | 3.15% | 3.49% |
| Expense waiver/reimbursement2 | 0.59% | 0.65% | 0.70% | 0.53% | 1.18% |
| Supplemental Data: | | | | | |
| Net assets, end of period (000 omitted) | $31,472 | $28,576 | $28,022 | $27,534 | $33,073 |
| Portfolio turnover | 10% | 17% | 27% | 7% | 19% |
| 1 | Based on net asset value, which does not reflect the sales charge, redemption fee or contingent deferred sales charge, if applicable. |
| 2 | This expense decrease is reflected in both the net expense and net investment income ratios shown above. |
See Notes which are an integral part of the Financial Statements
Annual Shareholder Report
Financial Highlights–Class B Shares
(For a Share Outstanding Throughout Each Period)
| Year Ended August 31 | 2016 | 2015 | 2014 | 2013 | 2012 |
| Net Asset Value, Beginning of Period | $10.33 | $10.45 | $9.86 | $10.65 | $10.13 |
| Income From Investment Operations: | | | | | |
| Net Investment Income | 0.23 | 0.25 | 0.25 | 0.25 | 0.28 |
| Net realized and unrealized gain (loss) on investments and futures contracts | 0.38 | (0.13) | 0.59 | (0.79) | 0.53 |
| TOTAL FROM INVESTMENT OPERATIONS | 0.61 | 0.12 | 0.84 | (0.54) | 0.81 |
| Less Distributions: | | | | | |
| Distributions from net investment income | (0.23) | (0.24) | (0.25) | (0.25) | (0.29) |
| Net Asset Value, End of Period | $10.71 | $10.33 | $10.45 | $9.86 | $10.65 |
| Total Return1 | 5.92% | 1.18% | 8.65% | (5.21)% | 8.07% |
| Ratios to Average Net Assets: | | | | | |
| Net expenses | 1.52% | 1.52% | 1.52% | 1.52% | 1.38% |
| Net investment income | 2.14% | 2.34% | 2.50% | 2.37% | 2.72% |
| Expense waiver/reimbursement2 | 0.58% | 0.65% | 0.69% | 0.52% | 1.17% |
| Supplemental Data: | | | | | |
| Net assets, end of period (000 omitted) | $1,869 | $2,130 | $2,562 | $2,661 | $3,022 |
| Portfolio turnover | 10% | 17% | 27% | 7% | 19% |
| 1 | Based on net asset value, which does not reflect the sales charge, redemption fee or contingent deferred sales charge, if applicable. |
| 2 | This expense decrease is reflected in both the net expense and net investment income ratios shown above. |
See Notes which are an integral part of the Financial Statements
Annual Shareholder Report
Statement of Assets and Liabilities
August 31, 2016
| Assets: | | |
| Total investment in securities, at value (identified cost $30,240,676) | | $32,991,029 |
| Cash | | 4,582 |
| Income receivable | | 369,180 |
| Receivable for shares sold | | 70,894 |
| TOTAL ASSETS | | 33,435,685 |
| Liabilities: | | |
| Payable for shares redeemed | $27,684 | |
| Income distribution payable | 11,877 | |
| Payable for portfolio accounting fees | 30,860 | |
| Payable for share registration costs | 8,659 | |
| Payable for other service fees (Notes 2 and 5) | 7,104 | |
| Payable for transfer agent fee | 2,658 | |
| Payable to adviser (Note 5) | 1,762 | |
| Payable for distribution services fee (Note 5) | 1,212 | |
| Accrued expenses (Note 5) | 3,439 | |
| TOTAL LIABILITIES | | 95,255 |
| Net assets for 3,113,120 shares outstanding | | $33,340,430 |
| Net Assets Consists of: | | |
| Paid-in capital | | $33,444,250 |
| Net unrealized appreciation of investments | | 2,750,353 |
| Accumulated net realized loss on investments | | (2,854,247) |
| Undistributed net investment income | | 74 |
| TOTAL NET ASSETS | | $33,340,430 |
| Net Asset Value, Offering Price and Redemption Proceeds Per Share: | | |
| Class A Shares: | | |
| Net asset value per share ($31,471,633 ÷ 2,938,630 shares outstanding), no par value, unlimited shares authorized | | $10.71 |
| Offering price per share (100/95.50 of $10.71) | | $11.21 |
| Redemption proceeds per share | | $10.71 |
| Class B Shares: | | |
| Net asset value per share ($1,868,797 ÷ 174,490 shares outstanding), no par value, unlimited shares authorized | | $10.71 |
| Offering price per share | | $10.71 |
| Redemption proceeds per share (94.50/100 of $10.71) | | $10.12 |
See Notes which are an integral part of the Financial Statements
Annual Shareholder Report
Statement of Operations
Year Ended August 31, 2016
| Investment Income: | | | |
| Interest | | | $1,171,849 |
| Expenses: | | | |
| Investment adviser fee (Note 5) | | $128,202 | |
| Administrative fee (Note 5) | | 25,069 | |
| Custodian fees | | 5,342 | |
| Transfer agent fees | | 19,829 | |
| Directors'/Trustees' fees (Note 5) | | 1,855 | |
| Auditing fees | | 23,905 | |
| Legal fees | | 7,980 | |
| Distribution services fee (Note 5) | | 14,911 | |
| Other service fees (Notes 2 and 5) | | 80,105 | |
| Portfolio accounting fees | | 90,239 | |
| Share registration costs | | 29,636 | |
| Printing and postage | | 17,144 | |
| Miscellaneous (Note 5) | | 5,549 | |
| TOTAL EXPENSES | | 449,766 | |
| Waivers and Reimbursements: | | | |
| Waiver of investment adviser fee (Note 5) | $(128,202) | | |
| Waiver/reimbursements of other operating expenses (Notes 2 and 5) | (61,317) | | |
| TOTAL WAIVERS AND REIMBURSEMENTS | | (189,519) | |
| Net expenses | | | 260,247 |
| Net investment income | | | 911,602 |
| Realized and Unrealized Gain (Loss) on Investments: | | | |
| Net realized loss on investments | | | (48,294) |
| Net change in unrealized appreciation of investments | | | 1,194,503 |
| Net realized and unrealized gain on investments | | | 1,146,209 |
| Change in net assets resulting from operations | | | $2,057,811 |
See Notes which are an integral part of the Financial Statements
Annual Shareholder Report
Statement of Changes in Net Assets
| Year Ended August 31 | 2016 | 2015 |
| Increase (Decrease) in Net Assets | | |
| Operations: | | |
| Net investment income | $911,602 | $938,087 |
| Net realized gain (loss) on investments and futures contracts | (48,294) | 97,656 |
| Net change in unrealized appreciation/depreciation of investments | 1,194,503 | (442,033) |
| CHANGE IN NET ASSETS RESULTING FROM OPERATIONS | 2,057,811 | 593,710 |
| Distributions to Shareholders: | | |
| Distributions from net investment income | | |
| Class A Shares | (869,539) | (878,026) |
| Class B Shares | (42,732) | (54,862) |
| CHANGE IN NET ASSETS RESULTING FROM DISTRIBUTIONS TO SHAREHOLDERS | (912,271) | (932,888) |
| Share Transactions: | | |
| Proceeds from sale of shares | 3,794,181 | 3,327,988 |
| Net asset value of shares issued to shareholders in payment of distributions declared | 761,780 | 754,171 |
| Cost of shares redeemed | (3,067,309) | (3,620,437) |
| CHANGE IN NET ASSETS RESULTING FROM SHARE TRANSACTIONS | 1,488,652 | 461,722 |
| Change in net assets | 2,634,192 | 122,544 |
| Net Assets: | | |
| Beginning of period | 30,706,238 | 30,583,694 |
| End of period (including undistributed net investment income of $74 and $4,580, respectively) | $33,340,430 | $30,706,238 |
See Notes which are an integral part of the Financial Statements
Annual Shareholder Report
Notes to Financial Statements
August 31, 2016
1. ORGANIZATION
Federated Municipal Securities Income Trust (the “Trust”) is registered under the Investment Company Act of 1940, as amended (the “Act”), as an open-end management investment company. The Trust consists of five portfolios. The financial statements included herein are only those of Federated New York Municipal Income Fund (the “Fund”), a non-diversified portfolio. The financial statements of the other portfolios are presented separately. The assets of each portfolio are segregated and a shareholder's interest is limited to the portfolio in which shares are held. Each portfolio pays its own expenses. The Fund offers two classes of shares: Class A Shares and Class B Shares. All shares of the Fund have equal rights with respect to voting, except on class-specific matters. Class B shares were closed to new accounts/investors on June 1, 2015, and to new purchases/exchanges by existing shareholders on August 1, 2015. The investment objective of the Fund is to provide current income exempt from federal regular income tax (federal regular income tax does not include the federal alternative minimum tax (AMT)), and the personal income taxes imposed by the state of New York and New York municipalities. Interest income from the Fund's investments may be subject to the federal AMT for individuals and corporations.
2. SIGNIFICANT ACCOUNTING POLICIES
The following is a summary of significant accounting policies consistently followed by the Fund in the preparation of its financial statements. These policies are in conformity with U.S. generally accepted accounting principles (GAAP).
Investment Valuation
In calculating its net asset value (NAV), the Fund generally values investments as follows:
| ■ | Fixed-income securities acquired with remaining maturities greater than 60 days are fair valued using price evaluations provided by a pricing service approved by the Trustees. |
| ■ | Fixed-income securities acquired with remaining maturities of 60 days or less are valued at their cost (adjusted for the accretion of any discount or amortization of any premium), unless the issuer's creditworthiness is impaired or other factors indicate that amortized cost is not an accurate estimate of the investment's fair value, in which case it would be valued in the same manner as a longer-term security. |
| ■ | Derivative contracts listed on exchanges are valued at their reported settlement or closing price, except that options are valued at the mean of closing bid and asked quotations. |
| ■ | Over-the-counter (OTC) derivative contracts are fair valued using price evaluations provided by a pricing service approved by the Trustees. |
| ■ | Shares of other mutual funds or non-exchange-traded investment companies are valued based upon their reported NAVs. |
| ■ | For securities that are fair valued in accordance with procedures established by and under the general supervision of the Trustees, certain factors may be considered such as: the last traded or purchase price of the security, information obtained by contacting the issuer or dealers, analysis of the issuer's financial statements or other available documents, fundamental analytical data, the nature and duration of restrictions on disposition, the movement of the market in which the security is normally traded, public trading in similar securities or derivative contracts of the issuer or comparable issuers, movement of a relevant index, or other factors including but not limited to industry changes and relevant government actions. |
Annual Shareholder Report
If any price, quotation, price evaluation or other pricing source is not readily available when the NAV is calculated, or if the Fund cannot obtain price evaluations from a pricing service or from more than one dealer for an investment within a reasonable period of time as set forth in the Fund's valuation policies and procedures, the Fund uses the fair value of the investment determined in accordance with the procedures described below. There can be no assurance that the Fund could obtain the fair value assigned to an investment if it sold the investment at approximately the time at which the Fund determines its NAV per share.
Fair Valuation Procedures
The Trustees have ultimate responsibility for determining the fair value of investments for which market quotations are not readily available. The Trustees have appointed a valuation committee (“Valuation Committee”) comprised of officers of the Fund, Federated Investment Management Company (“Adviser”) and certain of the Adviser's affiliated companies to assist in determining fair value and in overseeing the calculation of the NAV. The Trustees have also authorized the use of pricing services recommended by the Valuation Committee to provide fair value evaluations of the current value of certain investments for purposes of calculating the NAV. The Valuation Committee employs various methods for reviewing third-party pricing-service evaluations including periodic reviews of third-party pricing services' policies, procedures and valuation methods (including key inputs, methods, models and assumptions), transactional back-testing, comparisons of evaluations of different pricing services and review of price challenges by the Adviser based on recent market activity. In the event that market quotations and price evaluations are not available for an investment, the Valuation Committee determines the fair value of the investment in accordance with procedures adopted by the Trustees. The Trustees periodically review and approve the fair valuations made by the Valuation Committee and any changes made to the procedures.
Factors considered by pricing services in evaluating an investment include the yields or prices of investments of comparable quality, coupon, maturity, call rights and other potential prepayments, terms and type, reported transactions, indications as to values from dealers and general market conditions. Some pricing services provide a single price evaluation reflecting the bid-side of the market for an investment (a “bid” evaluation). Other pricing services offer both bid evaluations and price evaluations indicative of a price between the prices bid and asked for the investment (a “mid” evaluation). The Fund normally uses bid evaluations for any U.S. Treasury and Agency securities, mortgage-backed securities and municipal securities. The Fund normally uses mid evaluations for any other types of fixed-income securities and any OTC derivative contracts. In the event that market quotations and price evaluations are not available for an investment, the fair value of the investment is determined in accordance with procedures adopted by the Trustees.
Investment Income, Gains and Losses, Expenses and Distributions
Investment transactions are accounted for on a trade-date basis. Realized gains and losses from investment transactions are recorded on an identified cost basis. Interest income and expenses are accrued daily. Distributions to shareholders are recorded on the ex-dividend date. Distributions of net investment income, if any, are declared daily and paid monthly. Non-cash dividends included in dividend income, if any, are recorded at fair value. Investment income, realized and unrealized gains and losses and certain fund-level expenses are allocated to each class based on relative average daily net assets, except that Class A Shares and Class B Shares may bear distribution services fees and other service fees unique to those classes. The detail of the total fund expense waivers and reimbursements of $189,519 is disclosed in various locations in this Note 2 and Note 5.
Annual Shareholder Report
For the year ended August 31, 2016, an unaffiliated third-party waived $7,083 of portfolio accounting fees.
Dividends are declared separately for each class. No class has preferential dividend rights; differences in per share dividend rates are generally due to differences in separate class expenses.
Other Service Fees
The Fund may pay other service fees up to 0.25% of the average daily net assets of the Fund's Class A Shares and Class B Shares to unaffiliated financial intermediaries or to Federated Shareholder Services Company (FSSC) for providing services to shareholders and maintaining shareholder accounts. Subject to the terms described in the Expense Limitation note, FSSC may voluntarily reimburse the Fund for other service fees. In addition, unaffiliated third-party financial intermediaries may waive other service fees. This waiver can be modified or terminated at any time. For the year ended August 31, 2016, other service fees for the Fund were as follows:
| | Other
Service Fees
Incurred | Other
Service Fees
Reimbursed |
| Class A Shares | $75,134 | $(2,985) |
| Class B Shares | 4,971 | — |
| TOTAL | $80,105 | $(2,985) |
Premium and Discount Amortization
All premiums and discounts on fixed-income securities are amortized/accreted using the effective-interest-rate method.
Federal Taxes
It is the Fund's policy to comply with the Subchapter M provision of the Internal Revenue Code (the “Code”) and to distribute to shareholders each year substantially all of its income. Accordingly, no provision for federal income tax is necessary. As of and during the year ended August 31, 2016, the Fund did not have a liability for any uncertain tax positions. The Fund recognizes interest and penalties, if any, related to tax liabilities as income tax expense in the Statement of Operations. As of August 31, 2016, tax years 2013 through 2016 remain subject to examination by the Fund's major tax jurisdictions, which include the United States of America and the Commonwealth of Massachusetts.
When-Issued and Delayed-Delivery Transactions
The Fund may engage in when-issued or delayed-delivery transactions. The Fund records when-issued securities on the trade date and maintains security positions such that sufficient liquid assets will be available to make payment for the securities purchased. Securities purchased on a when-issued or delayed-delivery basis are marked to market daily and begin earning interest on the settlement date. Losses may occur on these transactions due to changes in market conditions or the failure of counterparties to perform under the contract.
Annual Shareholder Report
Restricted Securities
The Fund may purchase securities which are considered restricted. Restricted securities are securities that either: (a) cannot be offered for public sale without first being registered, or being able to take advantage of an exemption from registration, under the Securities Act of 1933; or (b) are subject to contractual restrictions on public sales. In some cases, when a security cannot be offered for public sale without first being registered, the issuer of the restricted security has agreed to register such securities for resale, at the issuer's expense, either upon demand by the Fund or in connection with another registered offering of the securities. Many such restricted securities may be resold in the secondary market in transactions exempt from registration. Restricted securities may be determined to be liquid under criteria established by the Trustees. The Fund will not incur any registration costs upon such resales. Restricted securities are valued at amortized cost in accordance with Rule 2a-7 under the Act.
Futures Contracts
The Fund purchases and sells financial futures contracts to increase return and to manage duration risk and yield curve risk. Upon entering into a financial futures contract with a broker, the Fund is required to deposit in a segregated account a specified amount of cash or U.S. government securities. Futures contracts are valued daily and unrealized gains or losses are recorded in a “variation margin” account. Daily, the Fund receives from or pays to the broker a specified amount of cash based upon changes in the variation margin account. When a contract is closed, the Fund recognizes a realized gain or loss. Futures contracts have market risks, including the risk that the change in the value of the contract may not correlate with the changes in the value of the underlying securities. There is minimal counterparty risk to the Fund since futures contracts are exchange traded and the exchange's clearing house, as counterparty to all exchange traded futures contracts, guarantees the futures contracts against default.
At August 31, 2016, the Fund had no outstanding futures contracts.
Other
The preparation of financial statements in conformity with GAAP requires management to make estimates and assumptions that affect the amounts of assets, liabilities, expenses and revenues reported in the financial statements. Actual results could differ from those estimated. The Fund applies Investment Company accounting and reporting guidance.
3. SHARES OF BENEFICIAL INTEREST
The following tables summarize share activity:
| Year Ended August 31 | 2016 | 2015 |
| Class A Shares: | Shares | Amount | Shares | Amount |
| Shares sold | 360,075 | $3,794,181 | 283,489 | $2,957,954 |
| Shares issued to shareholders in payment of distributions declared | 68,309 | 719,931 | 68,408 | 712,851 |
| Shares redeemed | (254,957) | (2,693,360) | (269,148) | (2,803,515) |
NET CHANGE RESULTING FROM
CLASS A SHARE TRANSACTIONS | 173,427 | $1,820,752 | 82,749 | $867,290 |
Annual Shareholder Report
| Year Ended August 31 | 2016 | 2015 |
| Class B Shares: | Shares | Amount | Shares | Amount |
| Shares sold | — | $— | 35,306 | $370,034 |
| Shares issued to shareholders in payment of distributions declared | 3,973 | 41,849 | 3,964 | 41,320 |
| Shares redeemed | (35,640) | (373,949) | (78,342) | (816,922) |
NET CHANGE RESULTING FROM
CLASS B SHARE TRANSACTIONS | (31,667) | $(332,100) | (39,072) | $(405,568) |
NET CHANGE RESULTING FROM
TOTAL FUND SHARE TRANSACTIONS | 141,760 | $1,488,652 | 43,677 | $461,722 |
4. FEDERAL TAX INFORMATION
The timing and character of income and capital gain distributions are determined in accordance with income tax regulations, which may differ from GAAP. These differences are due to differing treatments for discount accretion/premium amortization on debt securities and expiration of capital loss carryforward.
For the year ended August 31, 2016, permanent differences identified and reclassified among the components of net assets were as follows:
| Increase (Decrease) |
| Paid-In Capital | Undistributed
Net Investment
Income (Loss) | Accumulated
Net Realized
Gain (Loss) |
| $(239,378) | $(3,837) | $243,215 |
Net investment income (loss), net realized gains (losses) and net assets were not affected by the reclassification.
The tax character of distributions as reported on the Statement of Changes in Net Assets for the years ended August 31, 2016 and 2015, was as follows:
| | 2016 | 2015 |
| Tax-exempt income | $912,271 | $920,173 |
| Ordinary income | $— | $12,715 |
As of August 31, 2016, the components of distributable earnings on a tax-basis were as follows:
| Undistributed tax-exempt income | $74 |
| Net unrealized appreciation | $2,505,408 |
| Capital loss carryforwards | $(2,609,302) |
The difference between book-basis and tax-basis net unrealized appreciation/depreciation is attributable to differing treatments for defaulted securities and discount accretion/premium amortization on debt securities.
Annual Shareholder Report
At August 31, 2016, the cost of investments for federal tax purposes was $30,485,621. The net unrealized appreciation of investments for federal tax purposes was $2,505,408. This consists of net unrealized appreciation from investments for those securities having an excess of value over cost of $2,506,881 and net unrealized depreciation from investments for those securities having an excess of cost over value of $1,473.
At August 31, 2016, the Fund had a capital loss carryforward of $2,609,302 which will reduce the Fund's taxable income arising from future net realized gains on investments, if any, to the extent permitted by the Code, thereby reducing the amount of distributions to shareholders which would otherwise be necessary to relieve the Fund of any liability for federal income tax. Pursuant to the Code, a net capital loss incurred in taxable years beginning on or before December 22, 2010, is characterized as short-term and may be carried forward for a maximum of eight tax years (“Carryforward Limit”), whereas a net capital loss incurred in taxable years beginning after December 22, 2010, retains its character as either short-term or long-term, does not expire and is required to be utilized prior to the losses which have a Carryforward Limit.
The following schedule summarizes the Fund's capital loss carryforwards and expiration years:
| Expiration Year | Short-Term | Long-Term | Total |
| No Expiration | $64,175 | 41,862 | $106,037 |
| 2017 | $958,822 | NA | $958,822 |
| 2018 | $1,218,820 | NA | $1,218,820 |
| 2019 | $325,623 | NA | $325,623 |
Capital loss carryforwards of $239,378 expired during the year ended August 31, 2016.
5. INVESTMENT ADVISER FEE AND OTHER TRANSACTIONS WITH AFFILIATES
Investment Adviser Fee
The advisory agreement between the Fund and the Adviser provides for an annual fee equal to 0.40% of the Fund's average daily net assets. Subject to the terms described in the Expense Limitation note, the Adviser may voluntarily choose to waive any portion of its fee and/or reimburse other operating expenses. For the year ended August 31, 2016, the Adviser, voluntarily waived its entire fee of $128,202 and voluntarily reimbursed $51,249 of other operating expenses.
Annual Shareholder Report
Administrative Fee
Federated Administrative Services (FAS), under the Administrative Services Agreement, provides the Fund with administrative personnel and services. For purposes of determining the appropriate rate breakpoint, “Investment Complex” is defined as all of the Federated Funds subject to a fee under the Administrative Services Agreement. The fee paid to FAS is based on the average daily net assets of the Investment Complex as specified below, plus certain out-of-pocket expenses:
| Administrative Fee | Average Daily Net Assets
of the Investment Complex |
| 0.150% | on the first $5 billion |
| 0.125% | on the next $5 billion |
| 0.100% | on the next $10 billion |
| 0.075% | on assets in excess of $20 billion |
Subject to the terms described in the Expense Limitation note, FAS may voluntarily choose to waive any portion of its fee. For the year ended August 31, 2016, the annualized fee paid to FAS was 0.078% of average daily net assets of the Fund.
Distribution Services Fee
The Fund has adopted a Distribution Plan (the “Plan”) pursuant to Rule 12b-1 under the Act. Under the terms of the Plan, the Fund will compensate Federated Securities Corp. (FSC), the principal distributor, from the daily net assets of the Fund's Class A Shares and Class B Shares to finance activities intended to result in the sale of these shares. The Plan provides that the Fund may incur distribution expenses at the following percentages of average daily net assets annually, to compensate FSC:
| Share Class Name | Percentage of Average Daily
Net Assets of Class |
| Class A Shares | 0.05% |
| Class B Shares | 0.75% |
Subject to the terms described in the Expense Limitation note, FSC may voluntarily choose to waive any portion of its fee. For the year ended August 31, 2016, distribution services fees for the Fund were as follows:
| | Distribution
Services Fee
Incurred |
| Class B Shares | $14,911 |
When FSC receives fees, it may pay some or all of them to financial intermediaries whose customers purchase shares. For the year ended August 31, 2016, FSC retained $11,010 of fees paid by the Fund. For the year ended August 31, 2016, the Fund's Class A Shares did not incur a distribution services fee; however it may begin to incur this fee upon approval of the Trustees.
Other Service Fees
For the year ended August 31, 2016, FSSC received $4,955 and reimbursed $2,985 of the other service fees disclosed in Note 2.
Annual Shareholder Report
Sales Charges
Front-end sales charges and contingent deferred sales charges (CDSC) do not represent expenses of the Fund. They are deducted from the proceeds of sales of Fund shares prior to investment or from redemption proceeds prior to remittance, as applicable. For the year ended August 31, 2016, FSC retained $4,527 in sales charges from the sale of Class A Shares. FSC also retained $1,469 of CDSC relating to redemptions of Class B Shares.
Interfund Transactions
During the year ended August 31, 2016, the Fund engaged in purchase and sale transactions with funds that have a common investment adviser (or affiliated investment advisers), common Directors/Trustees, and/or common Officers. These purchase and sale transactions complied with Rule 17a-7 under the Act and amounted to $7,650,000 and $7,700,000, respectively.
Expense Limitation
The Adviser and certain of its affiliates (which may include FSC, FAS and FSSC) on their own initiative have agreed to waive certain amounts of their respective fees and/or reimburse expenses. Total annual fund operating expenses (as shown in the financial highlights, excluding interest expense, extraordinary expenses, line of credit expenses and proxy-related expenses paid by the Fund, if any) paid by the Fund's Class A Shares and Class B Shares (after the voluntary waivers and reimbursements) will not exceed 0.76% and 1.52% (the “Fee Limit”), respectively, up to but not including the later of (the “Termination Date”): (a) November 1, 2017; or (b) the date of the Fund's next effective Prospectus. While the Adviser and its applicable affiliates currently do not anticipate terminating or increasing these arrangements prior to the Termination Date, these arrangements may only be terminated or the Fee Limit increased prior to the Termination Date with the agreement of the Trustees.
General
Certain Officers and Trustees of the Fund are Officers and Directors or Trustees of certain of the above companies. To efficiently facilitate payment, Directors'/Trustees' fees and certain expenses related to conducting meetings of the Directors/Trustees and other miscellaneous expenses are paid by an affiliate of the Adviser which in due course are reimbursed by the Fund. Such expenses may be included in Accrued and Miscellaneous Expenses on the Statement of Assets and Liabilities and Statement of Operations, respectively.
6. Investment TRANSACTIONS
Purchases and sales of investments, excluding long-term U.S. government securities and short-term obligations, for the year ended August 31, 2016, were as follows:
| Purchases | $4,622,797 |
| Sales | $2,900,366 |
7. CONCENTRATION OF RISK
Since the Fund invests a substantial portion of its assets in issuers located in one state, it will be more susceptible to factors adversely affecting issuers of that state than would be a comparable tax-exempt mutual fund that invests nationally. In order to reduce the credit risk associated with such factors, at August 31, 2016, 4.0% of the securities in the Portfolio of Investments were backed by letters of credit or bond insurance of various financial institutions and financial guaranty assurance agencies.
Annual Shareholder Report
8. LINE OF CREDIT
The Fund participates with certain other Federated Funds, on a several basis, in an up to $500,000,000 unsecured, 364-day, committed, revolving line of credit (LOC) agreement. The LOC was made available to finance temporarily the repurchase or redemption of shares of the Fund, failed trades, payment of dividends, settlement of trades and for other short-term, temporary or emergency general business purposes. The Fund cannot borrow under the LOC if an inter-fund loan is outstanding. The Fund's ability to borrow under the LOC also is subject to the limitations of the Act and various conditions precedent that must be satisfied before the Fund can borrow. Loans under the LOC are charged interest at a fluctuating rate per annum equal to the highest, on any day, of (a) (i) the federal funds effective rate, (ii) the one month London Interbank Offer Rate (LIBOR), and (iii) 0.0%, plus (b) a margin. The LOC also requires the Fund to pay, quarterly in arrears and at maturity, its pro rata share of a commitment fee based on the amount of the lenders' commitment that has not been utilized. As of August 31, 2016, the Fund had no outstanding loans. During the year ended August 31, 2016, the Fund did not utilize the LOC.
9. INTERFUND LENDING
Pursuant to an Exemptive Order issued by the Securities and Exchange Commission, the Fund, along with other funds advised by subsidiaries of Federated Investors, Inc., may participate in an interfund lending program. This program provides an alternative credit facility allowing the Fund to borrow from other participating affiliated funds. As of August 31, 2016, there were no outstanding loans. During the year ended August 31, 2016, the program was not utilized.
10. FEDERAL TAX INFORMATION (UNAUDITED)
For the fiscal year ended August 31, 2016, 100% of distributions from net investment income is exempt from federal income tax, other than the federal AMT.
Annual Shareholder Report
Report of Independent Registered Public Accounting Firm
TO THE BOARD OF TRUSTEES OF federated municipal securities income trust and shareholders of federated New york municipal income FUND:
We have audited the accompanying statement of assets and liabilities, including the portfolio of investments, of Federated New York Municipal Income Fund (the “Fund”), a portfolio of Federated Municipal Securities Income Trust, as of August 31, 2016, and the related statement of operations for the year then ended, the statements of changes in net assets for each of the years in the two-year period then ended and the financial highlights for each of the years in the five-year period then ended. These financial statements and financial highlights are the responsibility of the Fund's management. Our responsibility is to express an opinion on these financial statements and financial highlights based on our audits.
We conducted our audits in accordance with the standards of the Public Company Accounting Oversight Board (United States). Those standards require that we plan and perform the audit to obtain reasonable assurance about whether the financial statements and financial highlights are free of material misstatement. An audit includes examining, on a test basis, evidence supporting the amounts and disclosures in the financial statements. Our procedures included confirmation of securities owned as of August 31, 2016, by correspondence with the custodian. An audit also includes assessing the accounting principles used and significant estimates made by management, as well as evaluating the overall financial statement presentation. We believe that our audits provide a reasonable basis for our opinion.
In our opinion, the financial statements and financial highlights referred to above present fairly, in all material respects, the financial position of Federated New York Municipal Income Fund as of August 31, 2016, and the results of its operations for the year then ended, the changes in its net assets for each of the years in the two-year period then ended and the financial highlights for each of the years in the five-year period then ended, in conformity with U.S. generally accepted accounting principles.
Boston, Massachusetts
October 24, 2016
Annual Shareholder Report
Shareholder Expense Example (unaudited)
As a shareholder of the Fund, you incur two types of costs: (1) transaction costs, including sales charges (loads) on purchase or redemption payments; and (2) ongoing costs, including management fees and to the extent applicable, distribution (12b-1) fees and/or other service fees and other Fund expenses. This Example is intended to help you to understand your ongoing costs (in dollars) of investing in the Fund and to compare these costs with the ongoing costs of investing in other mutual funds. It is based on an investment of $1,000 invested at the beginning of the period and held for the entire period from March 1, 2016 to August 31, 2016.
ACTUAL EXPENSES
The first section of the table below provides information about actual account values and actual expenses. You may use the information in this section, together with the amount you invested, to estimate the expenses that you incurred over the period. Simply divide your account value by $1,000 (for example, an $8,600 account value divided by $1,000 = 8.6), then multiply the result by the number in the first section under the heading entitled “Expenses Paid During Period” to estimate the expenses attributable to your investment during this period.
HYPOTHETICAL EXAMPLE FOR COMPARISON PURPOSES
The second section of the table below provides information about hypothetical account values and hypothetical expenses based on the Fund's actual expense ratio and an assumed rate of return of 5% per year before expenses, which is not the Fund's actual return. Thus, you should not use the hypothetical account values and expenses to estimate the actual ending account balance or your expenses for the period. Rather, these figures are required to be provided to enable you to compare the ongoing costs of investing in the Fund with other funds. To do so, compare this 5% hypothetical example with the 5% hypothetical examples that appear in the shareholder reports of the other funds.
Annual Shareholder Report
Please note that the expenses shown in the table are meant to highlight your ongoing costs only and do not reflect any transaction costs, such as sales charges (“loads”) on purchase or redemption payments. Therefore, the second section of the table is useful in comparing ongoing costs only, and will not help you determine the relative total costs of owning different funds. In addition, if these transaction costs were included, your costs would have been higher.
| | Beginning
Account Value
3/1/2016 | Ending
Account Value
8/31/2016 | Expenses Paid
During Period1 |
| Actual: | | | |
| Class A Shares | $1,000 | $1,034.50 | $3.89 |
| Class B Shares | $1,000 | $1,030.60 | $7.76 |
Hypothetical (assuming a 5% return
before expenses): | | | |
| Class A Shares | $1,000 | $1,021.32 | $3.86 |
| Class B Shares | $1,000 | $1,017.50 | $7.71 |
| 1 | Expenses are equal to the Fund's annualized net expense ratios, multiplied by the average account value over the period, multiplied by 184/366 (to reflect the one-half-year period). The annualized net expense ratios are as follows: |
| | |
| Class A Shares | 0.76% |
| Class B Shares | 1.52% |
Annual Shareholder Report
Board of Trustees and Trust Officers
The Board of Trustees is responsible for managing the Trust's business affairs and for exercising all the Trust's powers except those reserved for the shareholders. The following tables give information about each Trustee and the senior officers of the Fund. Where required, the tables separately list Trustees who are “interested persons” of the Fund (i.e., “Interested” Trustees) and those who are not (i.e., “Independent” Trustees). Unless otherwise noted, the address of each person listed is Federated Investors Tower, 1001 Liberty Avenue, Pittsburgh, PA 15222. The address of all Independent Trustees listed is 4000 Ericsson Drive, Warrendale, PA 15086-7561; Attention: Mutual Fund Board. As of December 31, 2015, the Trust comprised five portfolio(s), and the Federated Fund Family consisted of 38 investment companies (comprising 122 portfolios). Unless otherwise noted, each Officer is elected annually. Unless otherwise noted, each Trustee oversees all portfolios in the Federated Fund Family and serves for an indefinite term. The Fund's Statement of Additional Information includes additional information about Trust Trustees and is available, without charge and upon request, by calling 1-800-341-7400.
Interested TRUSTEES Background
Name
Birth Date
Positions Held with Trust
Date Service Began | Principal Occupation(s) for Past Five Years,
Other Directorships Held and Previous Position(s) |
J. Christopher Donahue*
Birth Date: April 11, 1949
President and Trustee
Indefinite Term
Began serving: August 1990 | Principal Occupations: Principal Executive Officer and President of certain of the Funds in the Federated Fund Family; Director or Trustee of the Funds in the Federated Fund Family; President, Chief Executive Officer and Director, Federated Investors, Inc.; Chairman and Trustee, Federated Investment Management Company; Trustee, Federated Investment Counseling; Chairman and Director, Federated Global Investment Management Corp.; Chairman, Federated Equity Management Company of Pennsylvania and Passport Research, Ltd. (investment advisory subsidiary of Federated); Trustee, Federated Shareholder Services Company; Director, Federated Services Company.
Previous Positions: President, Federated Investment Counseling; President and Chief Executive Officer, Federated Investment Management Company, Federated Global Investment Management Corp. and Passport Research, Ltd. |
Annual Shareholder Report
Name
Birth Date
Positions Held with Trust
Date Service Began | Principal Occupation(s) for Past Five Years,
Other Directorships Held and Previous Position(s) |
John B. Fisher*
Birth Date: May 16, 1956
Trustee
Indefinite Term
Began serving: May 2016 | Principal Occupations: Principal Executive Officer and President of certain of the Funds in the Federated Fund Family; Director or Trustee of certain of the Funds in the Federated Fund Family; Vice President, Federated Investors, Inc.; President, Director/Trustee and CEO, Federated Advisory Services Company, Federated Equity Management Company of Pennsylvania, Federated Global Investment Management Corp., Federated Investment Counseling, Federated Investment Management Company; President and CEO of Passport Research, Ltd.; President of some of the Funds in the Federated Fund Complex and Director, Federated Investors Trust Company.
Previous Positions: President and Director of the Institutional Sales Division of Federated Securities Corp.; President and Director of Federated Investment Counseling; Director, Edgewood Securities Corp.; Director, Federated Services Company; Director, Federated Investors, Inc.; Chairman and Director, Southpointe Distribution Services, Inc. and President, Technology, Federated Services Company. |
| * | Reasons for “interested” status: J. Christopher Donahue and John B. Fisher are interested due to their beneficial ownership of shares of Federated Investors, Inc. and due to positions they hold with Federated and its subsidiaries. J. Christopher Donahue is the son of John F. Donahue, Chairman Emeritus of the Federated Funds. |
INDEPENDENT TRUSTEES Background
Name
Birth Date
Positions Held with Trust
Date Service Began | Principal Occupation(s) for Past Five Years,
Other Directorships Held, Previous Position(s) and Qualifications |
John T. Collins
Birth Date: January 24, 1947
Trustee
Indefinite Term
Began serving: October 2013 | Principal Occupations: Director or Trustee of the Federated Fund Family; Retired.
Other Directorships Held: Director, Chair of the Compensation Committee, Audit Committee member, KLX Corp.
Qualifications: Mr. Collins has served in several business and financial management roles and directorship positions throughout his career. Mr. Collins previously served as Chairman and CEO, The Collins Group, Inc. (a private equity firm). Mr. Collins serves as Chairman Emeriti, Bentley University. Mr. Collins previously served as Director, FleetBoston Financial Corp.; Director and Audit Committee Member, Bank of America Corp. and Director, Beth Israel Deaconess Medical Center (Harvard University Affiliate Hospital). |
Annual Shareholder Report
Name
Birth Date
Positions Held with Trust
Date Service Began | Principal Occupation(s) for Past Five Years,
Other Directorships Held, Previous Position(s) and Qualifications |
G. Thomas Hough
Birth Date: February 28, 1955
Trustee
Indefinite Term
Began serving: August 2015 | Principal Occupations: Director or Trustee of the Federated Fund Family; Retired.
Other Directorships Held: Director, Chair of the Audit Committee, Governance Committee, Publix Super Markets, Inc.; Director, Equifax, Inc.
Qualifications: Mr. Hough has served in accounting, business management and directorship positions throughout his career. Mr. Hough most recently held the position of Americas Vice Chair of Assurance with Ernst & Young LLP. Mr. Hough is an Executive Committee member of the United States Golf Association, he serves on the President's Cabinet and Business School Board of Visitors for the University of Alabama and is on the Business School Board of Visitors for Wake Forest University. |
Maureen Lally-Green
Birth Date: July 5, 1949
Trustee
Indefinite Term
Began serving: August 2009 | Principal Occupations: Director or Trustee of the Federated Fund Family; Interim Dean of the Duquesne University School of Law; Adjunct Professor of Law, Duquesne University School of Law.
Other Directorships Held: Director, CONSOL Energy Inc.
Qualifications: Judge Lally-Green has served in various legal and business roles and directorship positions throughout her career. Judge Lally-Green previously served as: Associate General Secretary, Diocese of Pittsburgh; a member of the Superior Court of Pennsylvania; and as a Professor of Law, Duquesne University School of Law. Judge Lally-Green also holds the positions on either a public or not for profit Board of Directors as follows: Member, Pennsylvania State Board of Education (public); Director and Chair, UPMC Mercy Hospital; Regent, St. Vincent Seminary; Director and Vice Chair, Our Campaign for the Church Alive!, Inc.; Director, Saint Vincent College; and Director and Chair, Cardinal Wuerl North Catholic High School, Inc. Judge Lally-Green has held the positions of: Director, Auberle; Director, Ireland Institute of Pittsburgh; Director, Saint Thomas More Society; and Director, Catholic High Schools of the Diocese of Pittsburgh, Inc. |
Peter E. Madden
Birth Date: March 16, 1942
Trustee
Indefinite Term
Began serving: August 1991 | Principal Occupation: Director or Trustee, and Chair of the Board of Directors or Trustees, of the Federated Fund Family; Retired.
Other Directorships Held: None.
Qualifications: Mr. Madden has served in several business management, mutual fund services and directorship positions throughout his career. Mr. Madden previously served as President, Chief Operating Officer and Director, State Street Bank and Trust Company (custodian bank) and State Street Corporation (financial services). He was Director, VISA USA and VISA International and Chairman and Director, Massachusetts Bankers Association. Mr. Madden served as Director, Depository Trust Corporation and Director, The Boston Stock Exchange. Mr. Madden also served as a Representative to the Commonwealth of Massachusetts General Court. |
Annual Shareholder Report
Name
Birth Date
Positions Held with Trust
Date Service Began | Principal Occupation(s) for Past Five Years,
Other Directorships Held, Previous Position(s) and Qualifications |
Charles F. Mansfield, Jr.
Birth Date: April 10, 1945
Trustee
Indefinite Term
Began serving: January 1999 | Principal Occupations: Director or Trustee of the Federated Fund Family; Management Consultant.
Other Directorships Held: None.
Qualifications: Mr. Mansfield has served in several banking, business management and educational roles and directorship positions throughout his career. Mr. Mansfield previously served as Chief Executive Officer, PBTC International Bank; Partner, Arthur Young & Company (now Ernst & Young LLP); Chief Financial Officer of Retail Banking Sector, Chase Manhattan Bank; Senior Vice President, HSBC Bank USA (formerly, Marine Midland Bank); Vice President, Citibank; Assistant Professor of Banking and Finance, Frank G. Zarb School of Business, Hofstra University; Executive Vice President DVC Group, Inc. (marketing, communications and technology). |
Thomas M. O'Neill
Birth Date: June 14, 1951
Trustee
Indefinite Term
Began serving: October 2006 | Principal Occupations: Director or Trustee, Chair of the Audit Committee of the Federated Fund Family; Sole Proprietor, Navigator Management Company (investment and strategic consulting).
Other Directorships Held: None.
Qualifications: Mr. O'Neill has served in several business, mutual fund and financial management roles and directorship positions throughout his career. Mr. O'Neill serves as Director, Medicines for Humanity and Director, The Golisano Children's Museum of Naples, Florida. Mr. O'Neill previously served as Chief Executive Officer and President, Managing Director and Chief Investment Officer, Fleet Investment Advisors; President and Chief Executive Officer, Aeltus Investment Management, Inc.; General Partner, Hellman, Jordan Management Co., Boston, MA; Chief Investment Officer, The Putnam Companies, Boston, MA; Credit Analyst and Lending Officer, Fleet Bank; Director and Consultant, EZE Castle Software (investment order management software); and Director, Midway Pacific (lumber). |
P. Jerome Richey
Birth Date: February 23, 1949
Trustee
Indefinite Term
Began serving: October 2013 | Principal Occupations: Director or Trustee of the Federated Fund Family; Management Consultant.
Other Directorships Held: None.
Qualifications: Mr. Richey has served in several business and legal management roles and directorship positions throughout his career. Mr. Richey most recently held the positions of Senior Vice Chancellor and Chief Legal Officer, University of Pittsburgh. Mr. Richey serves as Board Member, Epilepsy Foundation of Western Pennsylvania and Board member, World Affairs Council of Pittsburgh. Mr. Richey previously served as Chief Legal Officer and Executive Vice President, CONSOL Energy Inc. and Shareholder, Buchanan Ingersoll & Rooney PC (a law firm). |
Annual Shareholder Report
Name
Birth Date
Positions Held with Trust
Date Service Began | Principal Occupation(s) for Past Five Years,
Other Directorships Held, Previous Position(s) and Qualifications |
John S. Walsh
Birth Date: November 28, 1957
Trustee
Indefinite Term
Began serving: June 1999 | Principal Occupations: Director or Trustee of the Federated Fund Family; President and Director, Heat Wagon, Inc. (manufacturer of construction temporary heaters); President and Director, Manufacturers Products, Inc. (distributor of portable construction heaters); President, Portable Heater Parts, a division of Manufacturers Products, Inc.
Other Directorships Held: None.
Qualifications: Mr. Walsh has served in several business management roles and directorship positions throughout his career. Mr. Walsh previously served as Vice President, Walsh & Kelly, Inc. (paving contractors). |
OFFICERS
Name
Birth Date
Positions Held with Trust
Date Service Began | Principal Occupation(s) for Past Five Years
and Previous Position(s) |
John W. McGonigle
Birth Date: October 26, 1938
EXECUTIVE VICE PRESIDENT AND SECRETARY
Officer since: August 1990 | Principal Occupations: Executive Vice President and Secretary of the Federated Fund Family; Vice Chairman, Executive Vice President, Secretary and Director, Federated Investors, Inc.
Previous Positions: Trustee, Federated Investment Management Company and Federated Investment Counseling; Director, Federated Global Investment Management Corp., Federated Services Company and Federated Securities Corp. |
Lori A. Hensler
Birth Date: January 6, 1967
TREASURER
Officer since: April 2013 | Principal Occupations: Principal Financial Officer and Treasurer of the Federated Fund Family; Senior Vice President, Federated Administrative Services; Financial and Operations Principal for Federated Securities Corp. and Edgewood Services, Inc.; and Assistant Treasurer, Federated Investors Trust Company. Ms. Hensler has received the Certified Public Accountant designation.
Previous Positions: Controller of Federated Investors, Inc.; Senior Vice President and Assistant Treasurer, Federated Investors Management Company; Treasurer, Federated Investors Trust Company; Assistant Treasurer, Federated Administrative Services, Federated Administrative Services, Inc., Federated Securities Corp., Edgewood Services, Inc., Federated Advisory Services Company, Federated Equity Management Company of Pennsylvania, Federated Global Investment Management Corp., Federated Investment Counseling, Federated Investment Management Company, Passport Research, Ltd., and Federated MDTA, LLC; Financial and Operations Principal for Federated Securities Corp., Edgewood Services, Inc. and Southpointe Distribution Services, Inc. |
Annual Shareholder Report
Name
Birth Date
Positions Held with Trust
Date Service Began | Principal Occupation(s) for Past Five Years
and Previous Position(s) |
Richard B. Fisher
Birth Date: May 17, 1923
VICE CHAIRMAN
Officer since: August 2002 | Principal Occupations: Vice Chairman or Vice President of some of the Funds in the Federated Fund Family; Vice Chairman, Federated Investors, Inc.; Chairman, Federated Securities Corp.
Previous Positions: President and Director or Trustee of some of the Funds in the Federated Fund Family; Executive Vice President, Federated Investors, Inc.; Director and Chief Executive Officer, Federated Securities Corp. |
Peter J. Germain
Birth Date: September 3, 1959
CHIEF LEGAL OFFICER
Officer since: January 2005 | Principal Occupations: Mr. Germain is Chief Legal Officer of the Federated Fund Family. He is General Counsel and Vice President, Federated Investors, Inc.; President, Federated Administrative Services and Federated Administrative Services, Inc.; Vice President, Federated Securities Corp.; Secretary, Federated Private Asset Management, Inc.; and Secretary, Retirement Plan Service Company of America. Mr. Germain joined Federated in 1984 and is a member of the Pennsylvania Bar Association.
Previous Positions: Deputy General Counsel, Special Counsel, Managing Director of Mutual Fund Services, Federated Investors, Inc.; Senior Vice President, Federated Services Company; and Senior Corporate Counsel, Federated Investors, Inc. |
Stephen Van Meter
Birth Date: June 5, 1975
CHIEF COMPLIANCE OFFICER AND SENIOR VICE PRESIDENT
Officer since: July 2015 | Principal Occupations: Senior Vice President and Chief Compliance Officer of the Federated Fund Family; Vice President and Chief Compliance Officer of Federated Investors, Inc. and Chief Compliance Officer of certain of its subsidiaries. Mr. Van Meter joined Federated in October 2011. He holds FINRA licenses under Series 3, 7, 24 and 66.
Previous Positions: Mr. Van Meter previously held the position of Compliance Operating Officer, Federated Investors, Inc. Prior to joining Federated, Mr. Van Meter served at the United States Securities and Exchange Commission in the positions of Senior Counsel, Office of Chief Counsel, Division of Investment Management and Senior Counsel, Division of Enforcement. |
Robert J. Ostrowski
Birth Date: April 26, 1963
CHIEF INVESTMENT OFFICER
Officer since: February 2010 | Principal Occupations: Robert J. Ostrowski joined Federated in 1987 as an Investment Analyst and became a Portfolio Manager in 1990. He was named Chief Investment Officer of Federated's taxable fixed-income products in 2004 and also serves as a Senior Portfolio Manager. Mr. Ostrowski became an Executive Vice President of the Fund's Adviser in 2009 and served as a Senior Vice President of the Fund's Adviser from 1997 to 2009. Mr. Ostrowski has received the Chartered Financial Analyst designation. He received his M.S. in Industrial Administration from Carnegie Mellon University. |
Annual Shareholder Report
Evaluation and Approval of Advisory Contract–May 2016
Federated New York Municipal Income Fund (the “Fund”)
Following a review and recommendation of approval by the Fund's independent trustees, the Fund's Board of Trustees (the “Board”) reviewed and unanimously approved at its May 2016 meetings the continuation of the Fund's investment advisory contract for an additional one-year term. The Board's decision regarding the contract reflects the exercise of its business judgment after consideration of all of the information received on whether to continue the existing arrangements.
The Board had previously appointed a Senior Officer, whose duties include specified responsibilities relating to the process by which advisory fees are to be charged to a Federated fund. The Senior Officer has the authority to retain consultants, experts, or staff as may be reasonably necessary to assist in the performance of his duties, reports directly to the Board, and may be terminated only with the approval of a majority of the independent members of the Board. The Senior Officer prepared and furnished to the Board an independent, written evaluation that covered topics discussed below (the “Senior Officer's Evaluation”). The Board considered the Senior Officer's Evaluation, along with other information, in deciding to approve the investment advisory contract.
The Board is also familiar with and considered judicial decisions concerning allegedly excessive investment advisory fees, which have indicated that the following factors may be relevant to an adviser's fiduciary duty with respect to its receipt of compensation from a fund: the nature and quality of the services provided by an adviser to a fund and its shareholders, including the performance and fees and expenses of the fund and of comparable funds; an adviser's cost of providing the services, including the profitability to an adviser of providing advisory services to a fund; the extent to which an adviser may realize “economies of scale” as a fund grows larger and, if such economies of scale exist, whether they have been shared with a fund and its shareholders or the family of funds; any “fall-out financial benefits” that accrue to an adviser because of its relationship with a fund (including research services received from brokers that execute fund trades and any fees paid to affiliates of an adviser for services rendered to a fund); comparative fee and expense structures, including a comparison of fees paid to an adviser with those paid by similar funds; and the extent of care, conscientiousness and independence with which board members perform their duties and their expertise, including whether they are fully informed about all facts the board deems relevant to its consideration of an adviser's services and fees. The Board noted that the Securities and Exchange Commission (“SEC”) disclosure requirements regarding the basis for the Board's approval of the Fund's investment advisory contract generally track the factors listed above. Consistent with these judicial decisions and SEC disclosure requirements, the Board also considered management fees charged to
Annual Shareholder Report
institutional and other clients of Federated Investment Management Company (the “Adviser”) for what might be viewed as like services. The Board was aware of these factors and was guided by them in its review of the Fund's investment advisory contract to the extent it considered them to be appropriate and relevant, as discussed further below.
The Board considered and weighed these circumstances in light of its substantial accumulated experience in governing the Fund and working with Federated Investors, Inc. and its affiliates (“Federated”) on matters relating to the Federated funds, and was assisted in its deliberations by independent legal counsel. Throughout the year, and in connection with its May meetings, the Board requested and received substantial and detailed information about the Fund and the Federated organization that was in addition to the extensive materials that comprise and accompany the Senior Officer's Evaluation. Federated provided much of this information at each regular meeting of the Board, and furnished additional substantial information in connection with the May meetings at which the Board's formal review of the investment advisory contract occurred. At the May meetings in addition to meeting in separate sessions of the independent trustees without management present, senior management of the Adviser also met with the independent trustees and their counsel to discuss the materials presented and any other matters thought relevant by the Adviser or the trustees. Between regularly scheduled meetings, the Board also received information on particular matters as the need arose. Thus, the Board's consideration of the investment advisory contract included review of the Senior Officer's Evaluation, accompanying data and additional information covering such matters as: the Adviser's investment philosophy, revenue, profitability, personnel and processes; investment and operating strategies; the Fund's short- and long-term performance (in absolute terms, both on a gross basis and net of expenses, as well as in relationship to its particular investment program and certain competitor or “peer group” funds and/or other benchmarks, as appropriate), and comments on the reasons for performance; the Fund's investment objectives; the Fund's expenses (including the advisory fee itself and the overall expense structure of the Fund, both in absolute terms and relative to similar and/or competing funds, with due regard for contractual or voluntary expense limitations); the use and allocation of brokerage commissions derived from trading the Fund's portfolio securities (if any); and the nature, quality and extent of the advisory and other services provided to the Fund by the Adviser and its affiliates. The Board also considered the preferences and expectations of Fund shareholders; the entrepreneurial risk assumed by the Adviser in sponsoring the Fund; the continuing state of competition in the mutual fund industry and market practices; the range of comparable fees for similar funds in the mutual fund industry; the Fund's relationship to the Federated funds which include a comprehensive array of funds with different investment objectives, policies and strategies which are generally available for exchange without the incurrence of additional sales charges; compliance and
Annual Shareholder Report
audit reports concerning the Federated funds and the Federated companies that service them (including communications from regulatory agencies), as well as Federated's responses to any issues raised therein; and relevant developments in the mutual fund industry and how the Federated funds and/or Federated are responding to them. The Board's evaluation process is evolutionary. The criteria considered and the emphasis placed on relevant criteria change in recognition of changing circumstances in the mutual fund marketplace.
While mindful that courts have cautioned against giving such comparisons too much weight, the Board has found the use of comparisons of the Fund's fees and expenses to other mutual funds with comparable investment programs to be relevant to its deliberations. In this regard, the Board was presented with, and considered, information regarding the contractual advisory fee rates, net advisory fee rates, total expense ratios and each element of the Fund's total expense ratio (i.e., gross and net advisory fees, custody fees, portfolio accounting fees and transfer agency fees) relative to the Fund's peers. The Board focused on comparisons with other similar mutual funds more heavily than non-mutual fund products or services because it is believed that they are more relevant. For example, other mutual funds are the products most like the Fund, they are readily available to Fund shareholders as alternative investment vehicles, and they are the type of investment vehicle in fact chosen and maintained by the Fund's investors. The range of their fees and expenses therefore appears to be a relevant indicator of what consumers have found to be reasonable in the precise marketplace in which the Fund competes.
It was noted in the materials for the Board meeting that for the period covered by the Senior Officer's Evaluation, the Fund's investment advisory fee was waived in its entirety. The Board reviewed the contractual advisory fee rate, net advisory fee rate and other expenses of the Fund with the Adviser and noted the position of the Fund's fee rates relative to its peers. In this regard, the Board noted that the contractual advisory fee rate was below the median of the relevant peer group and the Board was satisfied that the overall expense structure of the Fund remained competitive.
By contrast, the Senior Officer has reviewed Federated's fees for providing advisory services to products outside the Federated funds (e.g., institutional and separate accounts and sub-adviser services). He concluded that mutual funds and institutional accounts are inherently different products. Those differences include, but are not limited to, different types of targeted investors; being subject to different laws and regulations; different legal structures; different average account sizes and portfolio management techniques made necessary by different cash flows and different associated costs; and the time spent by portfolio managers and their teams, funds financial services, legal, compliance and risk management in reviewing securities pricing, addressing different administrative
Annual Shareholder Report
responsibilities, addressing different degrees of risk associated with management and a variety of different costs. The Senior Officer did not consider the fees for providing advisory services to these outside products to be determinative in judging the appropriateness of mutual fund advisory fees.
Following such evaluation, the Board concluded, within the context of its full deliberations, that the expenses of the Fund are reasonable and supported renewal of the investment advisory contract with respect to the Fund.
The Board considered the nature, extent and quality of the services provided to the Fund by the Adviser and the resources of the Adviser and its affiliates dedicated to the Fund. In this regard, the Board evaluated, among other things, the Adviser's personnel, experience, track record, overall reputation and willingness to invest in personnel and infrastructure that benefit the Fund. In addition, the Board reviewed the qualifications, backgrounds and responsibilities of the portfolio management team primarily responsible for the day-to-day management of the Fund. The Board noted the compliance programs of and the compliance-related resources provided to the Fund by the Adviser. The Fund's ability to deliver competitive performance when compared to its peer group was also deemed to be relevant by the Board as a useful indicator of how the Adviser is executing the Fund's investment program, which in turn was one of the Board's considerations in reaching a conclusion that the nature, extent, and quality of the Adviser's investment management services were such as to warrant continuation of the investment advisory contract.
In evaluating the Fund's investment performance, the Board considered performance results in light of the Fund's investment objective, strategies and risks, as disclosed in the Fund's prospectus. The Board particularly considered detailed investment reports on the Fund's performance provided to the Board throughout the year and in connection with the May meetings. The Senior Officer also reviewed information compiled by Federated, using data supplied by independent fund ranking organizations, regarding the performance of, and fees charged by, other mutual funds, noting his view that comparisons to fund peer groups may be helpful, though not conclusive, in judging the reasonableness of the proposed fees. The Board considered, in evaluating such comparisons, that in some cases individual funds may exhibit significant and unique differences in their objectives and management techniques when compared to other funds within an industry peer group.
The Fund's performance fell below the median of the relevant peer group for the one-year, three-year and five-year periods covered by the Senior Officer's Evaluation. The Board discussed the Fund's performance with the Adviser and recognized the efforts being taken by the Adviser in the context of the other factors considered relevant by the Board.
Following such evaluation, the Board concluded, within the context of its full deliberations, that the performance of the Fund supported renewal of the investment advisory contract with respect to the Fund.
Annual Shareholder Report
The Board also received financial information about Federated, including information regarding the compensation and ancillary (or “fall-out”) benefits Federated derived from its relationships with the Federated funds. This information covered not only the fees under the investment advisory contracts, but also fees received by Federated's subsidiaries for providing other services to the Federated funds under separate contracts (e.g., for serving as the Federated funds' administrator). The information also detailed any indirect benefit Federated may derive from its receipt of research services from brokers who execute Federated fund trades. In addition, the Board considered the fact that, in order for a fund to be competitive in the marketplace, Federated and its affiliates frequently waived fees and/or reimbursed expenses and have disclosed to fund investors and/or indicated to the Board their intention to do so in the future, where appropriate. Moreover, the Board receives regular reporting as to the institution, adjustment or elimination of these voluntary waivers. The Board considered Federated's previous reductions in contractual management fees to certain funds in response to the Senior Officer's recommendations.
Federated furnished information, requested by the Senior Officer, that reported revenues on a fund-by-fund basis and made estimates of the allocation of expenses on a fund-by-fund basis, using allocation methodologies specified by the Senior Officer. The Senior Officer noted that, while these cost allocation reports apply consistent allocation processes, the inherent difficulties in allocating costs continues to cause the Senior Officer to question the precision of the process and to conclude that such reports may be unreliable, since a single change in an allocation estimate may dramatically alter the resulting estimate of cost and/or profitability of a fund and may produce unintended consequences. The allocation information, including the Senior Officer's view that fund-by-fund estimations may be unreliable, was considered in the analysis by the Board.
The Board and the Senior Officer also reviewed information compiled by Federated comparing profitability information for Federated to other publicly held fund management companies. In this regard, the Senior Officer concluded that Federated's profit margins did not appear to be excessive. The Senior Officer also noted that Federated appeared financially sound, with the resources to fulfill its obligations under its contracts with the Fund.
The Senior Officer's Evaluation also discussed the notion of possible realization of “economies of scale” as a fund grows larger. The Board considered in this regard that the Adviser has made significant and long-term investments in areas that support all of the Federated funds, such as personnel and processes for the portfolio management, shareholder services, compliance, internal audit, and risk management functions, as well as systems technology (including technology relating to cybersecurity), and that the benefits of these efforts (as well as any economies of scale, should they exist) were likely to be enjoyed by the fund family as a whole. The Board noted that the Adviser's investments in these areas are extensive. In addition, the Board considered that Federated and its affiliates have frequently waived fees and/or reimbursed expenses and that this has
Annual Shareholder Report
allowed fund shareholders to share potential economies of scale from a fund's inception. Federated, as it does throughout the year, and again in connection with the Board's review, furnished information relative to revenue sharing or adviser paid fees. Federated and the Senior Officer noted that this information should be viewed to determine if there was an incentive to either not apply breakpoints or to apply breakpoints at higher levels and should not be viewed to determine the appropriateness of advisory fees, because it would represent marketing and distribution expenses. Finally, the Board also noted the absence of any applicable regulatory or industry guidelines on this subject, which (as discussed in the Senior Officer's Evaluation) is compounded by the lack of any common industry practice or general pattern with respect to structuring fund advisory fees with “breakpoints” that serve to reduce the fee as a fund attains a certain size.
The Senior Officer noted that, subject to the comments and recommendations made within the Senior Officer's Evaluation, his observations and the information accompanying the Senior Officer's Evaluation supported a finding by the Board that the management fee for the fund was reasonable. Under these circumstances, no changes were recommended to, and no objection was raised to, the continuation of the Fund's investment advisory contract.
In its decision to continue an existing investment advisory contract, the Board was mindful of the potential disruptions of the Fund's operations and various risks, uncertainties and other effects that could occur as a result of a decision to terminate or not renew an investment advisory contract. In particular, the Board recognized that many shareholders have invested in the Fund on the strength of the Adviser's industry standing and reputation and with the expectation that the Adviser will have a continuing role in providing advisory services to the Fund. Thus, the Board's approval of the investment advisory contract reflected the fact that it is the shareholders who have effectively selected the Adviser by virtue of having invested in the Fund. The Board concluded that, in light of the factors discussed above, including the nature, quality and scope of the services provided to the Fund by the Adviser and its affiliates, continuation of the investment advisory contract was appropriate.
The Board based its decision to approve the investment advisory contract on the totality of the circumstances and relevant factors and with a view to past and future long-term considerations. Not all of the factors and considerations identified above were necessarily relevant to the Fund, nor did the Board consider any one of them to be determinative. With respect to the factors that were relevant, the Board's decision to approve the continuation of the contract reflects its determination that Federated's performance and actions provided a satisfactory basis to support the decision to continue the existing arrangement.
Annual Shareholder Report
Voting Proxies on Fund Portfolio Securities
A description of the policies and procedures that the Fund uses to determine how to vote proxies, if any, relating to securities held in the Fund's portfolio is available, without charge and upon request, by calling 1-800-341-7400. A report on “Form N-PX” of how the Fund voted any such proxies during the most recent 12-month period ended June 30 is available via the Proxy Voting Record (Form N-PX) link associated with the Fund and share class name at www.FederatedInvestors.com/FundInformation. Form N-PX filings are also available at the SEC's website at www.sec.gov.
Quarterly Portfolio Schedule
The Fund files with the SEC a complete schedule of its portfolio holdings, as of the close of the first and third quarters of its fiscal year, on “Form N-Q.” These filings are available on the SEC's website at www.sec.gov and may be reviewed and copied at the SEC's Public Reference Room in Washington, DC. (Call 1-800-SEC-0330 for information on the operation of the Public Reference Room.) You may also access this information via the link to the Fund and share class name at www.FederatedInvestors.com/FundInformation.
Annual Shareholder Report
Mutual funds are not bank deposits or obligations, are not guaranteed by any bank and are not insured or guaranteed by the U.S. government, the Federal Deposit Insurance Corporation, the Federal Reserve Board or any other government agency. Investment in mutual funds involves investment risk, including the possible loss of principal.
This Report is authorized for distribution to prospective investors only when preceded or accompanied by the Fund's Prospectus, which contains facts concerning its objective and policies, management fees, expenses and other information.
Federated New York Municipal Income Fund
Federated Investors Funds
4000 Ericsson Drive
Warrendale, PA 15086-7561
Contact us at FederatedInvestors.com
or call 1-800-341-7400.
Federated Securities Corp., Distributor
CUSIP 313923401
CUSIP 313923880
28992 (10/16)
Federated is a registered trademark of Federated Investors, Inc.
2016 ©Federated Investors, Inc.
Annual Shareholder Report
August 31, 2016
| Share Class | Ticker |
| A | OMIAX |
| F | OMIFX |
Federated Ohio Municipal Income Fund
Fund Established 1990
A Portfolio of Federated Municipal Securities Income Trust
Dear Valued Shareholder,
I am pleased to present the Annual Shareholder Report for your fund covering the period from September 1, 2015, through August 31, 2016. This report includes Management's Discussion of Fund Performance, a complete listing of your fund's holdings, performance information and financial statements along with other important fund information.
In addition, our website, FederatedInvestors.com, offers easy access to Federated resources that include timely fund updates, economic and market insights from our investment strategists, and financial planning tools. We invite you to register to take full advantage of its capabilities.
Thank you for investing with Federated. I hope you find this information useful and look forward to keeping you informed.
Sincerely,
J. Christopher Donahue, President
Not FDIC Insured • May Lose Value • No Bank Guarantee
CONTENTS
| 1 |
| 9 |
| 10 |
| 18 |
| 20 |
| 21 |
| 22 |
| 23 |
| 33 |
| 34 |
| 36 |
| 42 |
| 48 |
| 48 |
Management's Discussion of Fund Performance (unaudited)
The total return of Federated Ohio Municipal Income Fund (the “Fund”), based on net asset value for the 12-month reporting period ended August 31, 2016,(“reporting period”) was 6.65% for A Shares and 6.58% for F Shares. The 6.65% total return of the A Shares for the reporting period consisted of 3.07% of tax-exempt dividends and reinvestments and price appreciation of 3.58% in the net asset value of the shares.1 The total return of the S&P Municipal Bond Ohio Index (the “OH Index”),2 the Fund's broad-based securities market index, was 8.78% during the same period. The total return for S&P Municipal Bond OH, Investment Grade, 3-Year Plus Index (OHIG3 Index),3 a secondary index for the Fund, was 7.88%, and the total return of the Morningstar Muni Ohio Funds Average (MMOFA),4 a peer group average for the Fund, was 6.25% during the same period. The Fund's and the MMOFA's total return for the most recently completed fiscal year reflected actual cash flows, transaction costs and other expenses, which were not reflected in the total return of the OH Index and OHIG3 Index.
During the reporting period, the Fund's investment strategy focused on: (a) the effective duration of its portfolio (which indicates the portfolio's sensitivity to changes in interest rates);5,6 (b) the allocation of the Fund's portfolio among securities of similar issuers (referred to as “sectors”); and (c) the credit quality of portfolio securities (which is shown through credit ratings which indicate the risk that securities may default).7 These were the most significant factors affecting the Fund's performance relative to the OHIG3 Index during the reporting period.
The following discussion focuses on the performance of the Fund's Class A Shares.
MARKET OVERVIEW
During the reporting period, 10-year Treasury yields decreased from a high of 2.34% in November of 2015 to a low of 1.36% in July of 2016 and averaged 1.89%. Economic activity in the U.S. expanded at a moderate pace despite the global economic and financial setbacks in recent months. A range of recent economic indicators, including strong job gains, pointed to additional strengthening of the labor market. Inflation showed signs of picking up in recent months; however, it continued to run below the Federal Reserve System's (the “Fed”) two percent longer run objective. This partly reflected declines in energy prices and impacts of the U.S. dollar's strength on non-energy imports. Global economic developments continued to pose risks as turmoil in Chinese financial markets and lower oil prices contributed to concerns about the prospects for global economic growth and a pullback from risky assets. The Fed's decision to raise the federal funds target rate by 1/4 percent was widely anticipated by the
Annual Shareholder Report
markets. A downward revision in the expected path of the federal funds target rate was warranted by economic conditions and moved closer to the markets' expectations of the long-run plan.
The vote by the United Kingdom to leave the European Union (“Brexit”) resulted in immediate asset price volatility and some financial markets, particularly certain foreign exchange markets, experienced brief periods of strained liquidity. Safe haven asset prices appreciated substantially, but broad based market dislocations did not develop. Overall, the negative sentiment surrounding the Brexit outcome was subsequently alleviated by expectations of the central banks being more accommodative. Nevertheless, several long-term global risks related to Brexit remained.
Downward pressure on domestic energy activity intensified over the reporting period as oil prices dropped further. The imbalance of crude oil relative to demand remained very high, and it was not expected to resolve quickly. The collapse in the price of oil supported the fixed-income markets by further reducing price pressures and generating concerns that the drop in oil prices might reflect declining demand in a weakening global economy. The support for household spending from lower energy prices was offset by the restraint implied by the appreciation of the U.S. dollar and the possibility of adverse effects from slower economic growth in China.
During the reporting period, developments in Europe continued to be a focus for investors which indirectly affected interest rate levels in the tax-exempt municipal bond market. With regard to Europe, there continued to be downside risks to growth emanating from the region, given its unresolved imbalances, weak economic growth and continued deflationary risks. The U.S. dollar strengthened against the currencies of most advanced economies amid concerns about growth in those countries as well as announcements by several central banks regarding monetary policy actions. Elements underpinning the strength of the U.S. dollar were the increasing prevalence of negative interest rates on sovereign debt in some key European economies and risks to the international economic outlook. The European Central Bank announced that it would expand its asset purchase program.
Credit conditions in the municipal bond market continued to be generally solid. Credit quality continued to be overall very stable, and ratios of general obligation bonds to those of comparable Treasury securities rose, partly reflecting the declines in yields on Treasury securities. The default by Puerto Rico and the downgrade of Illinois general obligation bonds both had only a limited effect on the broader municipal market.
The municipal bond markets' technical (supply and demand) position was mostly favorable over the reporting period. The issuance of municipal debt was lower than in previous periods as issuers were hesitant to add additional leverage and the economic benefits of refunding existing debt became less advantageous. Flows from investors into intermediate, long and high yield municipal bonds were positive and broad-based for a significant portion of the reporting period.
Annual Shareholder Report
The intermittent flight to quality by investors as a result of the unstable global political and economic environment also favored municipal bonds as they were viewed as a safer alternative investment.
The risk of additional municipal issuers becoming distressed remained through the reporting period. Some state and local governments turned to the courts for assistance in lowering their onerous pension liabilities, but responses from the courts were generally not favorable. Any workouts of these concerns are likely to take many years, which will continue to constrain state and local government budgets and limit their capacity to deal with severe infrastructure needs. The ongoing pressures on public pension plans and their unfunded liabilities continued to receive significant scrutiny.
Some positive news about the fiscal position of the states became available during the reporting period and, in some cases, revenues rose sufficiently enough to enable increases in state government spending and employment. These positive events allowed the spread between “AAA”- and “BBB”-rated general obligation debt to narrow by 27 basis points for 30 year maturities during the reporting period. The municipal yield curve also flattened significantly as yields on shorter maturities increased while yields on longer maturities (5 years and longer) declined leading to better total return performance for longer dated municipal bonds.
Ohio is the 7th largest state by population in the United States and its gross domestic product per capita also ranks 7th among the states. The state's economy remained stable and regained many of the jobs lost from the recession. Ohio's job growth was below the national average after an initially strong post-recession recovery. The manufacturing and energy sector showed some signs of softening with better growth in the financial services and health care sectors during the reporting period. The state's conservative budget management and continued growth have maintained solid financial performance and allowed for the absorption of several tax reforms that date back to fiscal 2012. The state maintained high levels of internal liquidity, moderate and affordable long term liabilities during the reporting period and a statutory requirement to deposit year end surplus revenues into a budget stabilization fund.
DURATION
As determined at the end of the reporting period, the Fund's dollar-weighted average duration for the reporting period was 4.4 years. Duration management continued to be a significant component of the Fund's investment strategy. The Fund's average duration was longer than the average duration of the OHIG3 Index during the reporting period. Tax-exempt municipal bond yields decreased during most of the reporting period and decreased more for bonds with longer maturities as the yield curve significantly flattened during the reporting period. Bonds with a longer duration outperformed bonds with a shorter duration due to their differences in interest rate volatility. As a result of the Fund's
Annual Shareholder Report
underweight to bonds with longer durations relative to those included in the OHIG3 Index, duration had a significant negative impact on Fund performance over the reporting period.
SECTOR allocation
During the reporting period, sector allocation negatively contributed to the excess return of the Fund. The Fund had larger allocation to Pre-Refunded bonds than the OHIG3 Index. This sector underperformed the OHIG3 Index during the reporting period and provided negative excess return relative to the OHIG3 Index. Pre-Refunded bonds are escrowed in Treasury securities until their most recent call date and have less sensitivity to changes in interest rates as a result. As interest rates declined over the reporting period, Pre-Refunded bonds underperformed relative to the benchmark. The Fund maintained a higher portfolio allocation to Dedicated Tax and Senior Care revenue bonds. These allocations helped the Fund's performance due to the outperformance of these sectors relative to the OHIG3 Index.
credit QUALITY8
During the reporting period, investor appetite for yield in the low interest rate environment increased municipal bond fund inflows and resulted in outperformance of bonds rated “A” and “BBB” (or unrated bonds of comparable quality) relative to bonds rated in the higher rating categories (or unrated bonds of comparable quality). Bonds in the noninvestment-grade category, below “BBB,” also outperformed the higher rating categories.7 With the decrease in credit spreads during the reporting period, and to a lesser extent for “AAA” and “AA” rated (or unrated comparable quality) debt, the Fund's overweight position, relative to the SPMBII, in “A” and “BBB” (or unrated comparable quality) debt during the reporting period had a positive impact on the Fund's performance, as the yield on “A” and “BBB” (or unrated comparable quality) debt decreased to a greater extent than for other investment-grade securities. The Fund's noninvestment-grade holdings of U.S. Steel Corporation and the Puerto Rico Government Development Bank contributed negative excess returns over the reporting period.
| 1 | Income may be subject to the alternative minimum tax for individuals and corporations (AMT). |
| 2 | Please see the footnotes to the line graphs under “Fund Performance and Growth of a $10,000 Investment” below for the definition of, and more information about, the OH Index. |
| 3 | Please see the footnotes to the line graphs under “Fund Performance and Growth of a $10,000 Investment” below for the definition of, and more information about, the OHIG3 Index. The Fund's secondary index is being used for comparison purposes because, while it is not the Fund's broad-based securities market index, the Fund's Adviser believes it more closely reflects the securities in which the Fund invests. |
| 4 | Please see the footnotes to the line graphs under “Fund Performance and Growth of a $10,000 Investment” below for the definition of, and more information about, the MMOFA. |
Annual Shareholder Report
| 5 | Duration is a measure of a security's price sensitivity to changes in interest rates. Securities with longer durations are more sensitive to changes in interest rates than securities with shorter durations. For purposes of this Management's Discussion of Fund Performance, duration is determined using a third-party analytical system. |
| 6 | Bond prices are sensitive to changes in interest rates, and a rise in interest rates can cause a decline in their prices. |
| 7 | Credit ratings pertain only to the securities in the portfolio and do not protect Fund shares against market risk. |
| 8 | Investment-grade securities and noninvestment-grade securities may either be: (a) rated by a nationally recognized statistical ratings organization or rating agency; or (b) unrated securities that the Fund's investment adviser (“Adviser”) believes are of comparable quality. The rating agencies that provided the ratings for rated securities include Standard and Poor's, Moody's Investor Services, Inc. and Fitch Rating Service. When ratings vary, the highest rating is used. Credit ratings of “AA” or better are considered to be high credit quality; credit ratings of “A” are considered high or medium/good quality; and credit ratings of “BBB” are considered to be medium/good credit quality, and the lowest category of investment-grade securities; credit ratings of “BB” and below are lower-rated, noninvestment-grade securities or junk bonds; and credit ratings of “CCC” or below are noninvestment-grade securities that have high default risk. Any credit quality breakdown does not give effect to the impact of any credit derivative investments made by the Fund. Credit ratings are an indication of the risk that a security will default. They do not protect a security from credit risk. Lower-rated bonds typically offer higher yields to help compensate investors for the increased risk associated with them. Among these risks are lower creditworthiness, greater price volatility, more risk to principal and income than with higher-rated securities and increased possibilities of default. |
Annual Shareholder Report
FUND PERFORMANCE AND GROWTH OF A $10,000 INVESTMENT
The graph below illustrates the hypothetical investment of $10,0001 in Federated Ohio Municipal Income Fund (the “Fund”) from August 31, 2006 to August 31, 2016, compared to the S&P Municipal Bond Ohio Index (OH Index),2 the S&P Municipal Bond OH, Investment Grade, 3-Year Plus Index (OHIG3 Index)3 and Morningstar Muni Ohio Funds Average (MMOFA).4 The Average Annual Total Return table below shows returns for each class averaged over the stated periods.
GROWTH OF A $10,000 INVESTMENT
Growth of $10,000 as of August 31, 2016
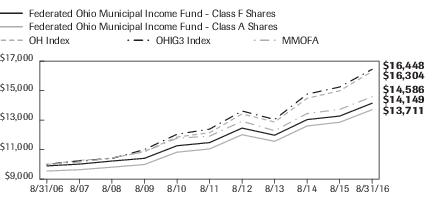
| Federated Ohio Municipal Income Fund - | Class F Shares | Class A Shares | OH Index | OHIG3 Index | MMOFA |
| F | F | I | I | I |
| 8/31/2006 | 9,900 | 9,550 | 10,000 | 10,000 | 10,000 |
| 8/31/2007 | 10,021 | 9,642 | 10,267 | 10,240 | 10,157 |
| 8/31/2008 | 10,228 | 9,811 | 10,425 | 10,406 | 10,445 |
| 8/31/2009 | 10,413 | 9,994 | 10,877 | 11,004 | 10,855 |
| 8/31/2010 | 11,264 | 10,827 | 11,852 | 12,043 | 11,776 |
| 8/31/2011 | 11,477 | 11,048 | 12,148 | 12,389 | 11,914 |
| 8/31/2012 | 12,460 | 12,012 | 13,419 | 13,619 | 12,925 |
| 8/31/2013 | 11,978 | 11,564 | 12,874 | 13,043 | 12,283 |
| 8/31/2014 | 13,036 | 12,604 | 14,479 | 14,761 | 13,447 |
| 8/31/2015 | 13,276 | 12,856 | 14,988 | 15,246 | 13,729 |
| 8/31/2016 | 14,149 | 13,711 | 16,304 | 16,448 | 14,586 |
41 graphic description end -->
| ■ | Total returns shown for Class A Shares include the maximum sales charge of 4.50% ($10,000 investment minus $450 sales charge = $9,550). |
| ■ | Total returns shown for Class F Shares include the maximum sales charge of 1.00% ($10,000 investment minus $100 sales charge = $9,900), and maximum contingent deferred sales charge of 1.00% as applicable. |
Annual Shareholder Report
Average Annual Total Returns for the Period Ended 8/31/2016
(returns reflect all applicable sales charges and contingent deferred sales charges as specified below in footnote #1)
| | 1 Year | 5 Years | 10 Years |
| Class A Shares | 1.81% | 3.45% | 3.21%* |
| Class F Shares | 4.55% | 4.07% | 3.53% |
| OH Index | 8.78% | 6.06% | 5.01% |
| OHIG3 Index | 7.88% | 5.83% | 5.10% |
| MMOFA | 6.25% | 4.18% | 3.84% |
| * | The Fund's Class A Shares commenced operations on November 18, 2008. For the period prior to the commencement of operations of the Class A Shares, the performance information shown is for the Fund's Class F Shares adjusted to reflect the sales charges and expenses of the Class A Shares. |
| | |
Performance data quoted represents past performance which is no guarantee of future results. Investment return and principal value will fluctuate so that an investor's shares, when redeemed, may be worth more or less than their original cost. Mutual fund performance changes over time and current performance may be lower or higher than what is stated. For current to the most recent month-end performance and after-tax returns, visit FederatedInvestors.com or call 1-800-341-7400. Returns shown do not reflect the deduction of taxes that a shareholder would pay on Fund distributions or the redemption of Fund shares. Mutual funds are not obligations of or guaranteed by any bank and are not federally insured.
| 1 | Represents a hypothetical investment of $10,000 in the Fund after deducting applicable sales charges: for Class A Shares, the maximum sales charge of 4.50% ($10,000 investment minus $450 sales charge = $9,550); for Class F Shares, the maximum sales charge of 1.00% ($10,000 investment minus $100 sales charge = $9,900); and the maximum contingent deferred sales charge is 1.00% on any redemption less than four years from the purchase date. The Fund's performance assumes the reinvestment of all dividends and distributions. The OH Index, OHIG3 Index and MMOFA have been adjusted to reflect reinvestment of dividends on securities in the index and average. |
| 2 | The OH Index consists of bonds in the S&P Municipal Bond Index (Main Index) that have been issued by the state of Ohio or local governments or state or local government entities within Ohio. The Main Index is a broad, comprehensive, market value-weighted index composed of approximately 55,000 bond issues that are exempt from U.S. federal income taxes or subject to the alternative minimum tax (AMT). Eligibility criteria for inclusion in the Main Index include, but are not limited to: the bond issuer must be a state (including the Commonwealth of Puerto Rico and U.S. territories) or local government or a state or local government entity where interest on the bond is exempt from U.S. federal income taxes or subject to the AMT; the bond must be held by a mutual fund for which Standard & Poor's Securities Evaluations, Inc. provides prices; it must be denominated in U.S. dollars and have a minimum par amount of $2 million; and the bond must have a minimum term to maturity and/or call date greater than or equal to one calendar month. The Main Index is rebalanced monthly. The Ohio Index is not adjusted to reflect sales charges, expenses and other fees that the Securities and Exchange Commission (SEC) requires to be reflected in the Fund's performance. The OH Index is unmanaged and, unlike the Fund, is not affected by cashflows. It is not possible to invest directly in an index. |
Annual Shareholder Report
| 3 | The OHIG3 Index represents the portion of the OH Index composed solely of bonds that are rated BBB-/Baa3 or higher with remaining maturities of more than three years. The OHIG3 Index is not adjusted to reflect sales charges, expenses and other fees that the SEC requires to be reflected in the Fund's performance. The OHIG3 Index is unmanaged and, unlike the Fund, is not affected by cash flows. It is not possible to invest directly in an index. |
| 4 | Morningstar figures represent the average of the total returns reported by all the mutual funds designated by Morningstar as falling into the respective category indicated. They do not reflect sales charges. |
Annual Shareholder Report
Portfolio of Investments Summary Table (unaudited)
At August 31, 2016, the Fund's sector composition1 was as follows:
| Sector Composition | Percentage of
Total Net Assets |
| Hospital | 16.0% |
| Education | 15.9% |
| Pre-refunded | 14.9% |
| General Obligation—Local | 9.5% |
| Dedicated Tax | 9.5% |
| Water & Sewer | 7.6% |
| Public Power | 5.5% |
| Toll Road | 4.1% |
| General Obligation—State | 3.8% |
| Senior Care | 2.7% |
| Other2 | 9.5% |
| Other Assets and Liabilities—Net3 | 1.0% |
| TOTAL | 100.0% |
| 1 | Sector classifications, and the assignment of holdings to such sectors, are based upon the economic sector and/or revenue source of the underlying obligor, as determined by the Fund's Adviser. For securities that have been enhanced by a third-party guarantor, such as bond insurers and banks, sector classifications are based upon the economic sector and/or revenue source of the underlying obligor, as determined by the Fund's Adviser. Pre-refunded securities are those whose debt service is paid from escrowed assets, usually U.S. government securities. |
| 2 | For purposes of this table, sector classifications constitute 89.5% of the Fund's total net assets. Remaining sectors have been aggregated under the designation “Other.” |
| 3 | Assets, other than investments in securities, less liabilities. See Statement of Assets and Liabilities. |
Annual Shareholder Report
Portfolio of Investments
August 31, 2016
Principal
Amount | | | Value |
| | | MUNICIPAL BONDS—94.9% | |
| | | Guam—1.0% | |
| $1,000,000 | | Guam Government Business Privilege Tax, Business Privilege Tax Bonds (Series 2012B), 5.00%, 1/1/2037 | $1,095,790 |
| 560,000 | | Guam Government LO (Section 30), Bonds (Series 2009A), 5.625% (United States Treasury PRF 12/1/2019@100)/(Original Issue Yield: 5.875%), 12/1/2019 | 645,685 |
| | | TOTAL | 1,741,475 |
| | | Ohio—93.8% | |
| 2,000,000 | | Akron, Bath & Copley, OH Joint Township Hospital District, Hospital Facilities Revenue Bonds (Series 2012), 5.00% (Akron General Health System)/(United States Treasury PRF 1/1/2022@100), 1/1/2031 | 2,385,760 |
| 2,000,000 | | Akron, Bath & Copley, OH Joint Township Hospital District, Hospital Improvement & Refunding Revenue Bonds (Series 2012), 5.00% (Children's Hospital Medical Center, Akron), 11/15/2032 | 2,298,660 |
| 1,000,000 | | Akron, OH, Income Tax Revenue Refunding Bonds (Series 2012A), 5.00% (Akron, OH Community Learning Centers), 12/1/2031 | 1,198,200 |
| 2,000,000 | | Akron, OH, Income Tax Revenue Refunding Bonds (Series 2012A), 5.00% (Akron, OH Community Learning Centers), 12/1/2033 | 2,391,520 |
| 500,000 | | Akron, OH, Revenue Refunding Bonds (Series A), 5.00% (Akron, OH Community Learning Centers), 12/1/2023 | 602,755 |
| 2,000,000 | | Allen County, OH, Hospital Facilities Revenue Bonds (Series 2010B), 5.25% (Mercy Health), 9/1/2027 | 2,306,380 |
| 1,000,000 | | Allen County, OH, Hospital Facilities Revenue Refunding Bonds, 5.00% (Mercy Health), 11/1/2043 | 1,170,720 |
| 115,000 | | American Municipal Power-Ohio, Inc., Revenue Bonds (Series 2008A), 5.25% (American Municipal Power, Prairie State Energy Campus Project), 2/15/2028 | 121,745 |
| 1,885,000 | | American Municipal Power-Ohio, Inc., Revenue Bonds (Series 2008A), 5.25% (American Municipal Power, Prairie State Energy Campus Project)/(United States Treasury PRF 2/15/2018@100), 2/15/2028 | 2,010,692 |
| 2,250,000 | | American Municipal Power-Ohio, Inc., Revenue Bonds (Series 2015A), 5.00% (American Municipal Power, Prairie State Energy Campus Project), 2/15/2029 | 2,719,485 |
| 1,000,000 | | American Municipal Power-Ohio, Inc., Revenue Refunding Bonds (Series 2015A), 5.00% (American Municipal Power, Prairie State Energy Campus Project), 2/15/2042 | 1,178,760 |
| 2,000,000 | | Bowling Green State University, OH, General Receipts Bonds (Series 2016A), 5.00%, 6/1/2044 | 2,405,080 |
| 2,000,000 | | Buckeye Tobacco Settlement Financing Authority, OH, Tobacco Settlement Asset-Backed Bonds (Series A-2), 6.50%, 6/1/2047 | 2,052,300 |
| 1,000,000 | | Centerville, OH, Health Care Fixed Rate Revenue Bonds (Series 2007A), 6.00% (Bethany Lutheran Village), 11/1/2038 | 1,029,150 |
Annual Shareholder Report
Principal
Amount | | | Value |
| | | MUNICIPAL BONDS—continued | |
| | | Ohio—continued | |
| $1,000,000 | | Cincinnati City School District, OH, UT GO Bonds, 5.00% (National Public Finance Guarantee Corp. INS), 12/1/2017 | $1,054,510 |
| 3,000,000 | | Cincinnati, OH Water System, Revenue Bonds (Series 2015A), 5.00%, 12/1/2040 | 3,682,560 |
| 2,000,000 | | Cincinnati, OH, UT Various Purpose GO Improvement & Refunding Bonds (Series 2014A), 5.00%, 12/1/2032 | 2,380,560 |
| 2,105,000 | | Cleveland Heights & University Heights, OH City School District, School Improvement UT GO Bonds (Series 2014), 5.00%, 12/1/2051 | 2,478,111 |
| 1,500,000 | | Cleveland State University, OH, General Receipts Bonds (Series 2012), 5.00%, 6/1/2037 | 1,741,290 |
| 2,200,000 | | Cleveland, OH Airport System, Revenue Bonds, 5.00% (United States Treasury PRF 1/1/2017@100), 1/1/2022 | 2,233,000 |
| 1,980,000 | | Cleveland, OH Airport System, Revenue Bonds (Series 2006A), 5.25% (Assured Guaranty Corp. INS), 1/1/2018 | 2,091,157 |
| 365,000 | | Cleveland, OH Airport System, Revenue Bonds (Series 2009C), 5.00% (Assured Guaranty Corp. INS), 1/1/2023 | 395,846 |
| 1,000,000 | | Cleveland, OH Municipal School District, School Improvement UT GO Bonds (Series 2015A), 5.00% (Ohio School District Credit Enhancement GTD), 12/1/2033 | 1,187,130 |
| 1,550,000 | | Cleveland, OH Public Power System, Revenue Bonds (Series 2008B-1), 5.00%, 11/15/2038 | 1,652,300 |
| 2,685,000 | | Cleveland, OH Public Power System, Revenue Refunding Bonds (Series 2010), 5.00%, 11/15/2017 | 2,817,746 |
| 1,000,000 | | Cleveland, OH Water, Senior Lien Revenue Bonds (Series 2012X), 5.00%, 1/1/2042 | 1,176,490 |
| 245,000 | | Cleveland, OH Water, Water Revenue Bonds (Series 2007P), 5.00%, 1/1/2026 | 258,686 |
| 2,000,000 | | Cleveland, OH, LT GO Bonds, 5.50% (AGM INS), 10/1/2019 | 2,281,100 |
| 3,000,000 | | Cleveland-Cuyahoga County, OH Port Authority, Revenue Bonds (Series 2014), 5.00% (Euclid Avenue Development Corp.), 8/1/2039 | 3,507,420 |
| 1,000,000 | | Columbus, OH City School District, School Facilities Construction & Improvement UT GO Bonds (Series 2009), 5.00% (United States Treasury PRF 6/1/2019@100), 12/1/2027 | 1,115,890 |
| 1,000,000 | | Columbus, OH Sewer System, Revenue Refunding Bonds (Series 2014), 5.00%, 6/1/2031 | 1,253,870 |
| 500,000 | | Columbus, OH, UT GO Refunding Bonds (Series 1), 5.00%, 7/1/2028 | 621,695 |
| 1,500,000 | | Columbus, OH, Various Purpose LT GO Bonds (Series 2013B), 5.00%, 8/15/2028 | 1,870,500 |
| 1,340,000 | | Cuyahoga County, OH Sales Tax, Various Purpose Sales Tax Revenue Bonds (Series 2014), 5.00%, 12/1/2034 | 1,651,175 |
| 1,000,000 | | Cuyahoga County, OH, LT GO Convention Hotel Project, 5.00%, 12/1/2036 | 1,192,190 |
| 220,000 | | Cuyahoga, OH CCD, General Receipts Revenue Bonds (Series 2012D), 5.00%, 8/1/2026 | 263,644 |
Annual Shareholder Report
Principal
Amount | | | Value |
| | | MUNICIPAL BONDS—continued | |
| | | Ohio—continued | |
| $1,335,000 | | Dayton, OH Airport, Airport Revenue Refunding Bonds (Series 2014A), 5.00% (James M. Cox Dayton International Airport)/(AGM INS), 12/1/2026 | $1,541,792 |
| 2,000,000 | | Fairfield County, OH, LT GO Bonds (Series 2015), 4.00%, 12/1/2040 | 2,178,720 |
| 2,000,000 | | Franklin County, OH Convention Facilities Authority, Tax & Lease Revenue Anticipation & Refunding Bonds (Series 2014), 5.00%, 12/1/2035 | 2,445,660 |
| 2,400,000 | | Franklin County, OH Health Care Facilities, Improvement Revenue Bonds (Series 2010A), 5.625% (Ohio Presbyterian Retirement Services)/(Original Issue Yield: 5.75%), 7/1/2026 | 2,657,640 |
| 1,000,000 | | Franklin County, OH Health Care Facilities, Refunding & Improvement Bonds (Series 2014), 5.00% (Friendship Village of Dublin, OH, Inc.), 11/15/2044 | 1,155,490 |
| 1,000,000 | | Franklin County, OH Hospital Facility Authority, Hospital Facilities Revenue Bonds (Series 2015), 5.00% (OhioHealth Corp.), 5/15/2040 | 1,197,050 |
| 1,535,000 | | Franklin County, OH Hospital Facility Authority, Hospital Improvement Revenue Bonds (Series 2009), 5.00% (Nationwide Children's Hospital)/(Original Issue Yield: 5.11%), 11/1/2034 | 1,704,541 |
| 2,165,000 | | Franklin County, OH, Various Purpose LT GO Bonds, 5.00% (United States Treasury PRF 12/1/2017@100), 12/1/2031 | 2,285,439 |
| 2,000,000 | | Hamilton County, OH Convention Facilities Authority, Convention Facilities Authority Revenue & Refunding Bonds (Series 2014), 5.00%, 12/1/2032 | 2,358,640 |
| 2,850,000 | | Hamilton County, OH Sales Tax, Revenue Refunding Bonds (Series 2011A), 5.00%, 12/1/2032 | 3,290,924 |
| 280,000 | | Hamilton, OH, LT GO Various Purpose Bonds, 5.00% (Assured Guaranty Corp. INS), 11/1/2021 | 314,899 |
| 1,555,000 | | JobsOhio Beverage System, OH, Statewide Senior Lien Liquor Profits Tax-Exempt Revenue Bonds (Series 2013A), 5.00%, 1/1/2038 | 1,822,087 |
| 165,000 | | Kent State University, OH, General Receipts Bonds (Series 2009B), 5.00% (Assured Guaranty Corp. INS), 5/1/2028 | 181,465 |
| 545,000 | | Kent State University, OH, General Receipts Bonds (Series 2009B), 5.00% (Assured Guaranty Corp. INS)/(United States Treasury PRF 5/1/2019@100), 5/1/2023 | 606,956 |
| 70,000 | | Kent State University, OH, General Receipts Bonds (Series 2009B), 5.00% (Assured Guaranty Corp. LOC), 5/1/2023 | 77,375 |
| 1,835,000 | | Kent State University, OH, General Receipts Revenue Bonds (Series 2009B), 5.00% (Assured Guaranty Corp. INS)/(United States Treasury PRF 5/1/2019@100), 5/1/2028 | 2,043,603 |
| 1,860,000 | | Kettering, OH City School District, UT GO Bonds, 4.75% (United States Treasury PRF 6/1/2017@100), 12/1/2020 | 1,917,102 |
| 400,000 | | Kettering, OH City School District, UT GO School Improvement Refunding Bonds, 4.75% (United States Treasury PRF 6/1/2017@100), 12/1/2022 | 412,076 |
Annual Shareholder Report
Principal
Amount | | | Value |
| | | MUNICIPAL BONDS—continued | |
| | | Ohio—continued | |
| $1,000,000 | | Lorain County, OH, Hospital Revenue Bonds (Series 2006H), 5.00% (Mercy Health)/(Assured Guaranty Corp. INS), 2/1/2024 | $1,062,150 |
| 2,000,000 | | Lucas County, OH, Hospital Revenue Bonds (Series 2011A), 6.50% (ProMedica Healthcare Obligated Group), 11/15/2037 | 2,501,180 |
| 1,090,000 | | Marysville, OH Wastewater Treatment System, Revenue Bonds, 4.75% (United States Treasury PRF 12/1/2016@100)/(Original Issue Yield: 4.80%), 12/1/2046 | 1,101,674 |
| 1,000,000 | | Marysville, OH Wastewater Treatment System, Revenue Refunding Bonds (Series 2016), 4.00% (Build America Mutual Assurance INS), 12/1/2046 | 1,104,890 |
| 2,000,000 | | Miami University, OH, General Receipts Revenue & Refunding Bonds (Series 2011), 5.00%, 9/1/2031 | 2,341,600 |
| 500,000 | | Miami University, OH, General Receipts Revenue & Refunding Bonds (Series 2011), 5.00%, 9/1/2036 | 583,560 |
| 1,600,000 | | Miamisburg, OH City School District, School Facilities Construction & Improvement UT GO Bonds, 5.00% (United States Treasury PRF 12/1/2018@100), 12/1/2024 | 1,756,384 |
| 500,000 | | Middletown, OH, LT GO Refunding and Improvement Bonds, 5.00% (AGM INS), 12/1/2021 | 536,300 |
| 1,000,000 | | Montgomery County, OH, Revenue Bonds (Series 2008D), 6.125% (Catholic Health Initiatives)/(Original Issue Yield: 6.30%), 10/1/2028 | 1,098,790 |
| 1,000,000 | | Muskingum County, OH, Hospital Facilities Revenue Bonds (Series 2013), 5.00% (Genesis Healthcare Corp.)/(Original Issue Yield: 5.08%), 2/15/2044 | 1,088,400 |
| 1,000,000 | | Northeast OH Regional Sewer District, Wastewater Improvement Revenue & Refunding Bonds (Series 2014), 5.00%, 11/15/2049 | 1,204,450 |
| 2,000,000 | | Northeast OH Regional Sewer District, Wastewater Improvement Revenue Bonds (Series 2013), 5.00%, 11/15/2038 | 2,413,740 |
| 160,000 | | Ohio HFA SFM, Revenue Bond (Series 1), 3.25%, 5/1/2020 | 160,326 |
| 2,000,000 | | Ohio State Air Quality Development Authority, Air Quality Revenue Refunding Bonds (Series 2009B), 5.80% (Columbus Southern Power Company), 12/1/2038 | 2,247,700 |
| 1,150,000 | | Ohio State Air Quality Development Authority, Environmental Improvement Revenue Bonds (Series 2010), 5.00% (Buckeye Power, Inc.), 12/1/2021 | 1,319,188 |
| 400,000 | | Ohio State Building Authority, Administration Building Fund Revenue Bonds (Series 2009A), 5.00% (United States Treasury PRF 4/1/2019@100), 10/1/2023 | 443,900 |
| 2,000,000 | | Ohio State Higher Educational Facility Commission, Higher Educational Facility Revenue Bonds (Series 2015), 5.00% (Kenyon College, OH), 7/1/2041 | 2,380,060 |
| 1,875,000 | | Ohio State Higher Educational Facility Commission, Hospital Revenue Bonds (Series 2007A), 5.25% (University Hospitals Health System, Inc.)/(United States Treasury PRF 1/15/2017@100), 1/15/2046 | 1,908,112 |
Annual Shareholder Report
Principal
Amount | | | Value |
| | | MUNICIPAL BONDS—continued | |
| | | Ohio—continued | |
| $300,000 | | Ohio State Higher Educational Facility Commission, Revenue Bonds, 4.75% (Mount Union College), 10/1/2016 | $300,999 |
| 1,000,000 | | Ohio State Higher Educational Facility Commission, Revenue Bonds (Series 2011A), 5.375% (University of Dayton)/(Original Issue Yield: 5.48%), 12/1/2030 | 1,154,810 |
| 1,830,000 | | Ohio State Higher Educational Facility Commission, Revenue Bonds (Series 2013), 5.00% (University of Dayton), 12/1/2031 | 2,169,886 |
| 1,000,000 | | Ohio State Higher Educational Facility Commission, Revenue Refunding Bonds (Series 2008C), 5.00% (Case Western Reserve University, OH), 12/1/2029 | 1,046,660 |
| 2,000,000 | | Ohio State Hospital Revenue, Hospital Revenue Bonds (Series 2016A), 5.00% (University Hospitals Health System, Inc.), 1/15/2046 | 2,380,420 |
| 3,325,000 | | Ohio State Treasurer Private Activity, Revenue Bonds (Series 2015), 5.00% (Portsmouth Gateway Group LLC), 12/31/2039 | 3,820,857 |
| 1,000,000 | | Ohio State Turnpike & Infrastructure Commission, Revenue Refunding Bonds (Series 2010A), 5.00%, 2/15/2031 | 1,127,480 |
| 1,000,000 | | Ohio State Turnpike & Infrastructure Commission, Turnpike Junior Lien Revenue Bonds (Series 2013A-1), 5.00% (Original Issue Yield: 5.05%), 2/15/2048 | 1,158,670 |
| 1,000,000 | | Ohio State Turnpike & Infrastructure Commission, Turnpike Revenue Refunding Bonds (Series 1998A), 5.50% (National Re Holdings Corp. INS), 2/15/2024 | 1,255,980 |
| 1,810,000 | | Ohio State University, General Receipts Bonds (Series 2008A), 5.00%, 12/1/2027 | 1,981,823 |
| 190,000 | | Ohio State University, General Receipts Bonds (Series 2008A), 5.00% (United States Treasury PRF 12/1/2018@100), 12/1/2027 | 208,571 |
| 1,000,000 | | Ohio State University, Special Purpose General Receipts Bonds (Series 2013A), 5.00%, 6/1/2038 | 1,203,210 |
| 1,000,000 | | Ohio State Water Development Authority, Drinking Water Assistance Fund Revenue Refunding Bonds (Series 2008), 5.00% (United States Treasury PRF 6/1/2018@100), 12/1/2021 | 1,076,410 |
| 1,000,000 | | Ohio State Water Development Authority, Revenue Refunding Bonds (Series 2008), 5.00% (United States Treasury PRF 6/1/2018@100), 6/1/2028 | 1,076,410 |
| 1,000,000 | | Ohio State Water Development Authority, Water Development Revenue Bonds (Fresh Water Series 2016B), 5.00%, 6/1/2037 | 1,261,940 |
| 3,000,000 | | Ohio State, Capital Facilities Lease-Appropriation Bonds (Series 2016A), 5.00%, 2/1/2030 | 3,748,500 |
| 1,500,000 | | Ohio State, Common Schools UT GO Bonds (Series 2011B), 5.00%, 9/15/2024 | 1,764,570 |
| 4,000,000 | | Ohio State, Higher Education UT GO Bonds (Series 2015C), 5.00%, 11/1/2033 | 4,936,080 |
| 1,500,000 | | Ohio State, Hospital Revenue Bonds, 5.00% (Cleveland Clinic), 1/1/2031 | 1,765,575 |
Annual Shareholder Report
Principal
Amount | | | Value |
| | | MUNICIPAL BONDS—continued | |
| | | Ohio—continued | |
| $1,200,000 | | Ohio State, Hospital Revenue Refunding Bonds (Series 2008A), 5.25% (Cleveland Clinic)/(Original Issue Yield: 5.37%), 1/1/2033 | $1,273,152 |
| 1,000,000 | | Ohio State, Major New State Infrastructure Project Revenue Bonds (Series 2008-1), 5.75% (United States Treasury PRF 6/15/2018@100), 6/15/2019 | 1,091,370 |
| 2,000,000 | | Ohio University, General Receipts Bonds (Series 2013), 5.00%, 12/1/2043 | 2,344,380 |
| 267,492 | 1,2 | Port Authority for Columbiana County, OH, Solid Waste Facility Revenue Bonds (Series 2004A), 7.25% (Apex Environmental LLC)/(Original Issue Yield: 7.30%), 8/1/2034 | 3 |
| 36,720 | 1,2 | Port Authority for Columbiana County, OH, Solid Waste Facility Revenue Bonds (Series 2012D), 10.82% (Apex Environmental LLC), 8/1/2034 | 0 |
| 1,115,000 | | Rickenbacker, OH Port Authority, Capital Funding Revenue Bonds (Series 2002A), 5.375% (OASBO Expanded Asset Pooled Financing Program)/(Original Issue Yield: 5.60%), 1/1/2032 | 1,299,878 |
| 470,000 | | River Valley, OH Local School District, UT GO School Facilities Bonds, 5.25% (School District Credit Program GTD), 11/1/2023 | 588,896 |
| 700,000 | | South Euclid, OH, LT GO Real Estate Acquisition and Urban Development Bonds, 5.00%, 6/1/2032 | 837,459 |
| 1,250,000 | | Southeastern Ohio Port Authority, OH, Hospital Facilities Revenue Refunding & Improvement Bonds (Series 2012), 6.00% (Memorial Health System, OH)/(Original Issue Yield: 6.02%), 12/1/2042 | 1,434,563 |
| 500,000 | | Switzerland, OH Local School District, UT GO School Improvement Refunding Bonds, 5.00% (School District Credit Program GTD), 12/1/2027 | 598,970 |
| 1,000,000 | | Toledo, OH Water System, Revenue Improvement and Refunding Bonds (Series 2013), 5.00%, 11/15/2032 | 1,204,600 |
| 1,500,000 | | Toledo-Lucas County, OH Port Authority, Revenue Bonds, 6.45% (CSX Corp.), 12/15/2021 | 1,874,055 |
| 2,000,000 | | University of Akron, OH, General Receipts Bonds (Series 2008B), 5.25% (United States Treasury PRF 1/1/2018@100), 1/1/2027 | 2,124,140 |
| 1,020,000 | | University of Akron, OH, General Receipts Bonds (Series 2015A), 5.00%, 1/1/2030 | 1,238,943 |
| 1,000,000 | | University of Akron, OH, General Receipts Bonds (Series 2016A), 5.00%, 1/1/2036 | 1,210,900 |
| 1,000,000 | | University of Cincinnati, OH, General Receipts Bonds (Series 2014C), 5.00%, 6/1/2041 | 1,211,000 |
| 1,000,000 | 3 | University of Cincinnati, OH, General Receipts Floating Rate Notes (Series 2015A), 0.801%, 6/1/2018 | 996,380 |
| | | TOTAL | 166,989,480 |
Annual Shareholder Report
Principal
Amount | | | Value |
| | | MUNICIPAL BONDS—continued | |
| | | Puerto Rico—0.1% | |
| $1,000,000 | | Puerto Rico Government Development Bank (GDB), Senior Notes (Series 2006B), 5.00%, 12/1/2017 | $231,249 |
| | | TOTAL MUNICIPAL BONDS
(IDENTIFIED COST $157,168,527) | 168,962,204 |
| | | SHORT-TERM MUNICIPALS—4.1%4 | |
| | | Ohio—4.1% | |
| 1,950,000 | | Allen County, OH, (Series 2010C) Daily VRDNs (Mercy Health)/(MUFG Union Bank, N.A. LOC), 0.67%, 9/1/2016 | 1,950,000 |
| 5,300,000 | | Ohio State Higher Educational Facility Commission, (Series 2008 B-4) Daily VRDNs (Cleveland Clinic)/(Barclays Bank PLC LIQ), 0.59%, 9/1/2016 | 5,300,000 |
| | | TOTAL | 7,250,000 |
| | | TOTAL SHORT-TERM MUNICIPALS
(AT AMORTIZED COST) | 7,250,000 |
| | | TOTAL INVESTMENTS—99.0%
(IDENTIFIED COST $164,418,527)5 | 176,212,204 |
| | | OTHER ASSETS AND LIABILITIES - NET—1.0%6 | 1,828,163 |
| | | TOTAL NET ASSETS—100% | $178,040,367 |
Securities that are subject to the federal alternative minimum tax (AMT) represent 3.0% of the Fund's portfolio as calculated based upon total market value (unaudited).
| 1 | Denotes a restricted security that either: (a) cannot be offered for public sale without first being registered, or being able to take advantage of an exemption from registration, under the Securities Act of 1933; or (b) is subject to a contractual restriction on public sales. At August 31, 2016, these restricted securities amounted to $3, which represented 0.0% of total net assets. |
| 2 | Non-income-producing security. |
| 3 | Floating rate note with current rate and current maturity or next reset date shown. |
| 4 | Current rate and next reset date shown for Variable Rate Demand Notes. |
| 5 | The cost of investments for federal tax purposes amounts to $164,242,816. |
| 6 | Assets, other than investments in securities, less liabilities. See Statement of Assets and Liabilities. |
Note: The categories of investments are shown as a percentage of total net assets at August 31, 2016.
Various inputs are used in determining the value of the Fund's investments. These inputs are summarized in the three broad levels listed below:
Level 1—quoted prices in active markets for identical securities.
Level 2—other significant observable inputs (including quoted prices for similar securities, interest rates, prepayment speeds, credit risk, etc.). Also includes securities valued at amortized cost.
Level 3—significant unobservable inputs (including the Fund's own assumptions in determining the fair value of investments).
The inputs or methodology used for valuing securities are not an indication of the risk associated with investing in those securities.
Annual Shareholder Report
As of August 31, 2016, all investments of the Fund utilized Level 2 inputs in valuing the Fund's assets carried at fair value.
The following acronyms are used throughout this portfolio:
| AGM | —Assured Guaranty Municipal Corp. |
| CCD | —Community College District |
| GO | —General Obligation |
| GTD | —Guaranteed |
| HFA | —Housing Finance Authority |
| INS | —Insured |
| LIQ | —Liquidity Agreement |
| LO | —Limited Obligation |
| LOC | —Letter of Credit |
| LT | —Limited Tax |
| PRF | —Pre-refunded |
| SFM | —Single Family Mortgage |
| UT | —Unlimited Tax |
| VRDNs | —Variable Rate Demand Notes |
See Notes which are an integral part of the Financial Statements
Annual Shareholder Report
Financial Highlights–Class A Shares
(For a Share Outstanding Throughout Each Period)
| Year Ended August 31 | 2016 | 2015 | 2014 | 2013 | 2012 |
| Net Asset Value, Beginning of Period | $11.16 | $11.28 | $10.70 | $11.47 | $10.93 |
| Income From Investment Operations: | | | | | |
| Net investment income | 0.34 | 0.36 | 0.36 | 0.38 | 0.38 |
Net realized and unrealized gain (loss) on
investments and futures contracts | 0.39 | (0.14) | 0.59 | (0.79) | 0.56 |
| TOTAL FROM INVESTMENT OPERATIONS | 0.73 | (0.22) | 0.95 | (0.41) | 0.94 |
| Less Distributions: | | | | | |
| Distributions from net investment income | (0.33) | (0.34) | (0.37) | (0.36) | (0.40) |
| Net Asset Value, End of Period | $11.56 | $11.16 | $11.28 | $10.70 | $11.47 |
| Total Return1 | 6.65% | 2.00% | 9.00% | (3.73)% | 8.72% |
| Ratios to Average Net Assets: | | | | | |
| Net expenses | 0.75% | 0.75% | 0.75% | 0.75% | 0.75% |
| Net investment income | 2.96% | 3.16% | 3.32% | 3.28% | 3.40% |
| Expense waiver/reimbursement2 | 0.15% | 0.14% | 0.16% | 0.14% | 0.18% |
| Supplemental Data: | | | | | |
| Net assets, end of period (000 omitted) | $66,884 | $67,469 | $69,461 | $45,131 | $53,165 |
| Portfolio turnover | 13% | 25% | 8% | 15% | 17% |
| 1 | Based on net asset value, which does not reflect the sales charge, redemption fee or contingent deferred sales charge, if applicable. |
| 2 | This expense decrease is reflected in both the net expense and net investment income ratios shown above. |
See Notes which are an integral part of the Financial Statements
Annual Shareholder Report
Financial Highlights–Class F Shares
(For a Share Outstanding Throughout Each Period)
| Year Ended August 31 | 2016 | 2015 | 2014 | 2013 | 2012 |
| Net Asset Value, Beginning of Period | $11.16 | $11.28 | $10.70 | $11.47 | $10.93 |
| Income from Investment Operations: | | | | | |
| Net investment income | 0.32 | 0.34 | 0.35 | 0.36 | 0.36 |
| Net realized and unrealized gain (loss) on investments and futures contracts | 0.40 | (0.13) | 0.58 | (0.79) | 0.56 |
| TOTAL FROM INVESTMENT OPERATIONS | 0.72 | 0.21 | 0.93 | (0.43) | 0.92 |
| Less Distributions: | | | | | |
| Distributions from net investment income | (0.31) | (0.33) | (0.35) | (0.34) | (0.38) |
| Net Asset Value, End of Period | $11.57 | $11.16 | $11.28 | $10.70 | $11.47 |
| Total Return1 | 6.58% | 1.84% | 8.84% | (3.87)% | 8.56% |
| Ratios to Average Net Assets: | | | | | |
| Net expenses | 0.90% | 0.90% | 0.90% | 0.90% | 0.90% |
| Net investment income | 2.81% | 3.01% | 3.19% | 3.13% | 3.25% |
| Expense waiver/reimbursement2 | 0.40% | 0.39% | 0.41% | 0.39% | 0.43% |
| Supplemental Data: | | | | | |
| Net assets, end of period (000 omitted) | $111,156 | $107,450 | $109,583 | $118,639 | $128,005 |
| Portfolio turnover | 13% | 25% | 8% | 15% | 17% |
| 1 | Based on net asset value, which does not reflect the sales charge, redemption fee or contingent deferred sales charge, if applicable. |
| 2 | This expense decrease is reflected in both the net expense and net investment income ratios shown above. |
See Notes which are an integral part of the Financial Statements
Annual Shareholder Report
Statement of Assets and Liabilities
August 31, 2016
| Assets: | | |
| Total investment in securities, at value (identified cost $164,418,527) | | $176,212,204 |
| Cash | | 36,022 |
| Income receivable | | 1,776,489 |
| Receivable for shares sold | | 157,681 |
| TOTAL ASSETS | | 178,182,396 |
| Liabilities: | | |
| Payable for shares redeemed | $30,003 | |
| Payable for other service fees (Notes 2 and 5) | 36,800 | |
| Payable for portfolio accounting fees | 30,860 | |
| Payable for distribution services fee (Note 5) | 14,190 | |
| Payable for share registration costs | 12,457 | |
| Payable for transfer agent fee | 9,990 | |
| Payable for investment adviser fee (Note 5) | 1,249 | |
| Payable for administrative fee (Note 5) | 380 | |
| Accrued expenses (Note 5) | 6,100 | |
| TOTAL LIABILITIES | | 142,029 |
| Net assets for 15,393,586 shares outstanding | | $178,040,367 |
| Net Assets Consists of: | | |
| Paid-in capital | | $166,011,523 |
| Net unrealized appreciation of investments | | 11,793,677 |
| Accumulated net realized gain on investments and futures contracts | | 84,657 |
| Undistributed net investment income | | 150,510 |
| TOTAL NET ASSETS | | $178,040,367 |
| Net Asset Value, Offering Price and Redemption Proceeds Per Share: | | |
| Class A Shares: | | |
| Net asset value per share ($66,884,259 ÷ 5,783,648 shares outstanding), no par value, unlimited shares authorized | | $11.56 |
| Offering price per share (100/95.50 of $11.56) | | $12.10 |
| Redemption proceeds per share | | $11.56 |
| Class F Shares: | | |
| Net asset value per share ($111,156,108 ÷ 9,609,938 shares outstanding), no par value, unlimited shares authorized | | $11.57 |
| Offering price per share (100/99.00 of $11.57) | | $11.69 |
| Redemption proceeds per share (99.00/100 of $11.57) | | $11.45 |
See Notes which are an integral part of the Financial Statements
Annual Shareholder Report
Statement of Operations
Year Ended August 31, 2016
| Investment Income: | | | |
| Interest | | | $6,468,347 |
| Expenses: | | | |
| Investment adviser fee (Note 5) | | $696,988 | |
| Administrative fee (Note 5) | | 136,289 | |
| Custodian fees | | 12,054 | |
| Transfer agent fees | | 93,396 | |
| Directors'/Trustees' fees (Note 5) | | 3,135 | |
| Auditing fees | | 28,105 | |
| Legal fees | | 7,979 | |
| Distribution services fee (Note 5) | | 431,779 | |
| Other service fees (Notes 2 and 5) | | 434,360 | |
| Portfolio accounting fees | | 90,239 | |
| Share registration costs | | 32,529 | |
| Printing and postage | | 25,921 | |
| Miscellaneous (Note 5) | | 7,249 | |
| TOTAL EXPENSES | | 2,000,024 | |
| Waivers: | | | |
| Waiver of investment adviser fee (Note 5) | $(247,026) | | |
| Waivers of other operating expenses (Notes 2 and 5) | (275,687) | | |
| TOTAL WAIVERS | | (522,713) | |
| Net expenses | | | 1,477,310 |
| Net investment income | | | 4,991,037 |
Realized and Unrealized Gain on Investments
and Futures Contracts: | | | |
| Net realized gain on investments | | | 617,882 |
| Net realized gain on futures contracts | | | 181,181 |
| Net change in unrealized appreciation of investments | | | 5,321,112 |
| Net change in unrealized depreciation of futures contracts | | | 13,594 |
| Net realized and unrealized gain on investments and futures contracts | | | 6,133,769 |
| Change in net assets resulting from operations | | | $11,124,806 |
See Notes which are an integral part of the Financial Statements
Annual Shareholder Report
Statement of Changes in Net Assets
| Year Ended August 31 | 2016 | 2015 |
| Increase (Decrease) in Net Assets | | |
| Operations: | | |
| Net investment income | $4,991,037 | $5,522,299 |
| Net realized gain on investments and futures contracts | 799,063 | 1,580,982 |
| Net change in unrealized appreciation/depreciation of investments and futures contracts | 5,334,706 | (3,714,956) |
| CHANGE IN NET ASSETS RESULTING FROM OPERATIONS | 11,124,806 | 3,388,325 |
| Distributions to Shareholders: | | |
| Distributions from net investment income | | |
| Class A Shares | (1,929,974) | (2,131,834) |
| Class F Shares | (2,979,646) | (3,173,611) |
| CHANGE IN NET ASSETS RESULTING FROM DISTRIBUTIONS TO SHAREHOLDERS | (4,909,620) | (5,305,445) |
| Share Transactions: | | |
| Proceeds from sale of shares | 13,106,588 | 17,320,037 |
| Net asset value of shares issued to shareholders in payment of distributions declared | 3,876,913 | 4,134,460 |
| Cost of shares redeemed | (20,076,614) | (23,663,206) |
| CHANGE IN NET ASSETS RESULTING FROM SHARE TRANSACTIONS | (3,093,113) | (2,208,709) |
| Change in net assets | 3,122,073 | (4,125,829) |
| Net Assets: | | |
| Beginning of period | 174,918,294 | 179,044,123 |
| End of period (including undistributed net investment income of $150,510 and $156,185, respectively) | $178,040,367 | $174,918,294 |
See Notes which are an integral part of the Financial Statements
Annual Shareholder Report
Notes to Financial Statements
August 31, 2016
1. ORGANIZATION
Federated Municipal Securities Income Trust (the “Trust”) is registered under the Investment Company Act of 1940, as amended (the “Act”), as an open-end management investment company. The Trust consists of five portfolios. The financial statements included herein are only those of the Federated Ohio Municipal Income Fund (the “Fund”), a non-diversified portfolio. The financial statements of the other portfolios are presented separately. The assets of each portfolio are segregated and a shareholder's interest is limited to the portfolio in which shares are held. Each portfolio pays its own expenses. The Fund offers two classes of shares: Class A Shares and Class F Shares. All shares of the Fund have equal rights with respect to voting, except on class-specific matters. The investment objective of the Fund is to provide current income exempt from federal regular income tax (federal regular income tax does not include the federal alternative minimum tax (AMT)) and the personal income taxes imposed by the state of Ohio and Ohio municipalities. Interest income from the Fund's investments may be subject to the federal AMT for individuals and corporations.
2. SIGNIFICANT ACCOUNTING POLICIES
The following is a summary of significant accounting policies consistently followed by the Fund in the preparation of its financial statements. These policies are in conformity with U.S. generally accepted accounting principles (GAAP).
Investment Valuation
In calculating its net asset value (NAV), the Fund generally values investments as follows:
| ■ | Fixed-income securities acquired with remaining maturities greater than 60 days are fair valued using price evaluations provided by a pricing service approved by the Fund's Board of Trustees (the “Trustees”). |
| ■ | Fixed-income securities acquired with remaining maturities of 60 days or less are valued at their cost (adjusted for the accretion of any discount or amortization of any premium), unless the issuer's creditworthiness is impaired or other factors indicate that amortized cost is not an accurate estimate of the investment's fair value, in which case it would be valued in the same manner as a longer-term security. |
| ■ | Derivative contracts listed on exchanges are valued at their reported settlement or closing price, except that options are valued at the mean of closing bid and asked quotations. |
| ■ | Over-the-counter (OTC) derivative contracts are fair valued using price evaluations provided by a pricing service approved by the Trustees. |
| ■ | Shares of other mutual funds or non-exchange-traded investment companies are valued based upon their reported NAVs. |
| ■ | For securities that are fair valued in accordance with procedures established by and under the general supervision of the Trustees, certain factors may be considered such as: the last traded or purchase price of the security, information obtained by contacting the issuer or dealers, analysis of the issuer's financial statements or other available documents, fundamental analytical data, the nature and duration of restrictions on disposition, the movement of the market in which the security is normally traded, public trading in similar securities or derivative contracts of the issuer or comparable issuers, movement of a relevant index, or other factors including but not limited to industry changes and relevant government actions. |
Annual Shareholder Report
If any price, quotation, price evaluation or other pricing source is not readily available when the NAV is calculated, or if the Fund cannot obtain price evaluations from a pricing service or from more than one dealer for an investment within a reasonable period of time as set forth in the Fund's valuation policies and procedures, the Fund uses the fair value of the investment determined in accordance with the procedures described below. There can be no assurance that the Fund could obtain the fair value assigned to an investment if it sold the investment at approximately the time at which the Fund determines its NAV per share.
Fair Valuation Procedures
The Trustees have ultimate responsibility for determining the fair value of investments for which market quotations are not readily available. The Trustees have appointed a valuation committee (“Valuation Committee”) comprised of officers of the Fund, Federated Investment Management Company (“Adviser”) and certain of the Adviser's affiliated companies to assist in determining fair value and in overseeing the calculation of the NAV. The Trustees have also authorized the use of pricing services recommended by the Valuation Committee to provide fair value evaluations of the current value of certain investments for purposes of calculating the NAV. The Valuation Committee employs various methods for reviewing third-party pricing-service evaluations including periodic reviews of third-party pricing services' policies, procedures and valuation methods (including key inputs, methods, models and assumptions), transactional back-testing, comparisons of evaluations of different pricing services and review of price challenges by the Adviser based on recent market activity. In the event that market quotations and price evaluations are not available for an investment, the Valuation Committee determines the fair value of the investment in accordance with procedures adopted by the Trustees. The Trustees periodically review and approve the fair valuations made by the Valuation Committee and any changes made to the procedures.
Factors considered by pricing services in evaluating an investment include the yields or prices of investments of comparable quality, coupon, maturity, call rights and other potential prepayments, terms and type, reported transactions, indications as to values from dealers and general market conditions. Some pricing services provide a single price evaluation reflecting the bid-side of the market for an investment (a “bid” evaluation). Other pricing services offer both bid evaluations and price evaluations indicative of a price between the prices bid and asked for the investment (a “mid” evaluation). The Fund normally uses bid evaluations for any U.S. Treasury and Agency securities, mortgage-backed securities and municipal securities. The Fund normally uses mid evaluations for any other types of fixed-income securities and any OTC derivative contracts. In the event that market quotations and price evaluations are not available for an investment, the fair value of the investment is determined in accordance with procedures adopted by the Trustees.
Investment Income, Gains and Losses, Expenses and Distributions
Investment transactions are accounted for on a trade-date basis. Realized gains and losses from investment transactions are recorded on an identified-cost basis. Interest income and expenses are accrued daily. Distributions to shareholders are recorded on the ex-dividend date. Distributions of net investment income are declared and paid monthly. Non-cash dividends included in dividend income, if any, are recorded at fair value. Investment income, realized and unrealized gains and losses and certain fund-level expenses are allocated to each class based on relative average daily net assets, except that Class A Shares and Class F Shares may bear distribution services fees and other service fees unique to those classes. The detail of the total fund expense waivers of $522,713 is disclosed in various locations in this Note 2 and Note 5.
Annual Shareholder Report
For the year ended August 31, 2016, an unaffiliated third-party waived $7,083 of portfolio accounting fees.
Dividends are declared separately for each class. No class has preferential dividend rights; differences in per share dividend rates are generally due to differences in separate class expenses.
Other Service Fees
The Fund may pay other service fees up to 0.25% of the average daily net assets of the Fund's Class A Shares and Class F Shares to unaffiliated financial intermediaries or to Federated Shareholder Services Company (FSSC) for providing services to shareholders and maintaining shareholder accounts. Subject to the terms described in the Expense Limitation note, FSSC may voluntarily reimburse the Fund for other service fees. In addition, unaffiliated third-party financial intermediaries may waive other service fees. This waiver can be modified or terminated at any time. For the year ended August 31, 2016, other service fees for the Fund were as follows:
| | Other
Service Fees
Incurred |
| Class A Shares | $165,756 |
| Class F Shares | 268,604 |
| TOTAL | $434,360 |
Premium and Discount Amortization
All premiums and discounts on fixed-income securities are amortized/accreted using the effective-interest-rate method.
Federal Taxes
It is the Fund's policy to comply with the Subchapter M provision of the Internal Revenue Code (the “Code”) and to distribute to shareholders each year substantially all of its income. Accordingly, no provision for federal income tax is necessary. As of and during the year ended August 31, 2016, the Fund did not have a liability for any uncertain tax positions. The Fund recognizes interest and penalties, if any, related to tax liabilities as income tax expense in the Statement of Operations. As of August 31, 2016, tax years 2013 through 2016 remain subject to examination by the Fund's major tax jurisdictions, which include the United States of America and the Commonwealth of Massachusetts.
When-Issued and Delayed-Delivery Transactions
The Fund may engage in when-issued or delayed-delivery transactions. The Fund records when-issued securities on the trade date and maintains security positions such that sufficient liquid assets will be available to make payment for the securities purchased. Securities purchased on a when-issued or delayed-delivery basis are marked to market daily and begin earning interest on the settlement date. Losses may occur on these transactions due to changes in market conditions or the failure of counterparties to perform under the contract.
Annual Shareholder Report
Restricted Securities
The Fund may purchase securities which are considered restricted. Restricted securities are securities that either: (a) cannot be offered for public sale without first being registered, or being able to take advantage of an exemption from registration, under the Securities Act of 1933; or (b) are subject to contractual restrictions on public sales. In some cases, when a security cannot be offered for public sale without first being registered, the issuer of the restricted security has agreed to register such securities for resale, at the issuer's expense, either upon demand by the Fund or in connection with another registered offering of the securities. Many such restricted securities may be resold in the secondary market in transactions exempt from registration. Restricted securities may be determined to be liquid under criteria established by the Trustees. The Fund will not incur any registration costs upon such resales. The Fund's restricted securities, like other securities, are priced in accordance with procedures established by and under the general supervision of the Trustees.
Additional information on restricted securities, excluding securities purchased under Rule 144A that have been deemed liquid by the Trustees, if applicable, held at August 31, 2016, is as follows:
| | Acquisition Date | Cost | Market Value |
| Port Authority for Columbiana County, OH, Solid Waste Facility Revenue Bonds (Series 2004A), 7.25% (Apex Environmental LLC)/(Original Issue Yield: 7.30%), 8/1/2034 | 12/23/2004 | $266,671 | $3 |
| Port Authority for Columbiana County, OH, Solid Waste Facility Revenue Bonds (Series 2012D), 10.82% (Apex Environmental LLC), 8/1/2034 | 8/1/2014 - 8/1/2015 | $36,720 | $0 |
Futures Contracts
The Fund purchases and sells financial futures contracts to manage duration risk. Upon entering into a financial futures contract with a broker, the Fund is required to deposit in a segregated account a specified amount of cash or U.S. government securities, which is shown as restricted cash in the Statement of Assets and Liabilities. Futures contracts are valued daily and unrealized gains or losses are recorded in a “variation margin” account. Daily, the Fund receives from or pays to the broker a specified amount of cash based upon changes in the variation margin account. When a contract is closed, the Fund recognizes a realized gain or loss. Futures contracts have market risks, including the risk that the change in the value of the contract may not correlate with the changes in the value of the underlying securities. There is minimal counterparty risk to the Fund since futures contracts are exchange traded and the exchange's clearing house, as counterparty to all exchange traded futures, guarantees the futures contracts against default.
As of August 31, 2016, the Fund had no outstanding futures contracts.
The average notional value of long futures contracts held by the Fund throughout the period was $5,165,406. This is based on amounts held as of each month-end throughout the fiscal period.
Annual Shareholder Report
The Effect of Derivative Instruments on the Statement of Operations for the Year ended August 31, 2016
| Amount of Realized Gain or (Loss) on Derivatives Recognized in Income |
| | Futures
Contracts |
| Interest rate contracts | $181,181 |
| Change in Unrealized Appreciation or (Depreciation) on Derivatives Recognized in Income |
| | Futures
Contracts |
| Interest rate contracts | $13,594 |
Other
The preparation of financial statements in conformity with GAAP requires management to make estimates and assumptions that affect the amounts of assets, liabilities, expenses and revenues reported in the financial statements. Actual results could differ from those estimated. The Fund applies Investment Company accounting and reporting guidance.
3. SHARES OF BENEFICIAL INTEREST
The following tables summarize share activity:
| Year Ended August 31 | 2016 | 2015 |
| Class A Shares: | Shares | Amount | Shares | Amount |
| Shares sold | 527,990 | $6,010,776 | 832,221 | $9,397,573 |
| Shares issued to shareholders in payment of distributions declared | 96,664 | 1,098,082 | 105,761 | 1,190,751 |
| Shares redeemed | (888,108) | (10,062,080) | (1,050,346) | (11,838,094) |
| NET CHANGE RESULTING FROM CLASS A SHARE TRANSACTIONS | (263,454) | $(2,953,222) | (112,364) | $(1,249,770) |
| Year Ended August 31 | 2016 | 2015 |
| Class F Shares: | Shares | Amount | Shares | Amount |
| Shares sold | 619,691 | $7,095,812 | 702,591 | $7,922,464 |
| Shares issued to shareholders in payment of distributions declared | 244,601 | 2,778,831 | 261,465 | 2,943,709 |
| Shares redeemed | (882,975) | (10,014,534) | (1,050,737) | (11,825,112) |
| NET CHANGE RESULTING FROM CLASS F SHARE TRANSACTIONS | (18,683) | $(139,891) | (86,681) | $(958,939) |
| NET CHANGE RESULTING FROM TOTAL FUND SHARE TRANSACTIONS | (282,137) | $(3,093,113) | (199,045) | $(2,208,709) |
4. FEDERAL TAX INFORMATION
The timing and character of income and capital gain distributions are determined in accordance with income tax regulations, which may differ from GAAP. These differences are due to differing treatments for discount accretion/premium amortization on debt securities.
Annual Shareholder Report
For the year ended August 31, 2016, permanent differences identified and reclassified among the components of net assets were as follows:
| Increase (Decrease) |
Undistributed
Net Investment
Income (Loss) | Accumulated
Net Realized
Gain (Loss) |
| $(87,092) | $87,092 |
Net investment income (loss), net realized gains (losses) and net assets were not affected by the reclassification.
The tax character of distributions as reported on the Statement of Changes in Net Assets for the years ended August 31, 2016 and 2015, was as follows:
| | 2016 | 2015 |
| Ordinary income | $3,946 | $1,761 |
| Tax-exempt income | $4,905,674 | $5,303,684 |
As of August 31, 2016, the components of distributable earnings on a tax basis were as follows:
| Undistributed tax-exempt income | $150,510 |
| Net unrealized appreciation | $11,969,388 |
| Capital loss carryforwards | $(91,054) |
The difference between book-basis and tax-basis net unrealized appreciation/depreciation is attributable to differing treatments for discount accretion/premium amortization on debt securities.
At August 31, 2016, the cost of investments for federal tax purposes was $164,242,816. The net unrealized appreciation of investments for federal tax purposes was $11,969,388. This consists of net unrealized appreciation from investments for those securities having an excess of value over cost of $13,045,299 and net unrealized depreciation from investments for those securities having an excess of cost over value of $1,075,911.
At August 31, 2016, the Fund had a capital loss carryforward of $91,054 which will reduce the Fund's taxable income arising from future net realized gains on investments, if any, to the extent permitted by the Code, thereby reducing the amount of distributions to shareholders which would otherwise be necessary to relieve the Fund of any liability for federal income tax. Pursuant to the Code, a net capital loss incurred in taxable years beginning on or before December 22, 2010, is characterized as short-term and may be carried forward for a maximum of eight tax years (“Carryforward Limit”), whereas a net capital loss incurred in taxable years beginning after December 22, 2010, retains its character as either short-term or long-term, does not expire and is required to be utilized prior to the losses which have a Carryforward Limit.
Annual Shareholder Report
The following schedule summarizes the Fund's capital loss carryforwards and expiration years:
| Expiration Year | Short-Term | Long-Term | Total |
| 2018 | $68,589 | NA | $68,589 |
| 2019 | $22,465 | NA | $22,465 |
The Fund used capital loss carryforwards of $733,909 to offset capital gains realized during the year ended August 31, 2016.
5. INVESTMENT ADVISER FEE AND OTHER TRANSACTIONS WITH AFFILIATES
Investment Adviser Fee
The advisory agreement between the Fund and the Adviser provides for an annual fee equal to 0.40% of the Fund's average daily net assets. Subject to the terms described in the Expense Limitation note, the Adviser may voluntarily choose to waive any portion of its fee. For the year ended August 31, 2016, the Adviser voluntarily waived $247,026 of its fee.
Administrative Fee
Federated Administrative Services (FAS), under the Administrative Services Agreement, provides the Fund with administrative personnel and services. For purposes of determining the appropriate rate breakpoint, “Investment Complex” is defined as all of the Federated Funds subject to a fee under the Administrative Services Agreement. The fee paid to FAS is based on the average daily net assets of the Investment Complex as specified below, plus certain out-of-pocket expenses:
| Administrative Fee | Average Daily Net Assets
of the Investment Complex |
| 0.150% | on the first $5 billion |
| 0.125% | on the next $5 billion |
| 0.100% | on the next $10 billion |
| 0.075% | on assets in excess of $20 billion |
Subject to the terms described in the Expense Limitation note, FAS may voluntarily choose to waive any portion of its fee. For the year ended August 31, 2016, the annualized fee paid to FAS was 0.078% of average daily net assets of the Fund.
Annual Shareholder Report
Distribution Services Fee
The Fund has adopted a Distribution Plan (the “Plan”) pursuant to Rule 12b-1 under the Act. Under the terms of the Plan, the Fund will compensate Federated Securities Corp. (FSC), the principal distributor, from the daily net assets of the Fund's Class A Shares and Class F Shares to finance activities intended to result in the sale of these shares. The Plan provides that the Fund may incur distribution expenses at the following percentages of average daily net assets annually, to compensate FSC:
| Share Class Name | Percentage of Average Daily
Net Assets of Class |
| Class A Shares | 0.05% |
| Class F Shares | 0.40% |
Subject to the terms described in the Expense Limitation note, FSC may voluntarily choose to waive any portion of its fee. For the year ended August 31, 2016, distribution services fees for the Fund were as follows:
| | Distribution
Services Fees
Incurred | Distribution
Services Fees
Waived |
| Class F Shares | $431,779 | $(268,604) |
When FSC receives fees, it may pay some or all of them to financial intermediaries whose customers purchase shares. For the year ended August 31, 2016, FSC retained $163,176 of fees paid by the Fund. For the year ended August 31, 2016, the Fund's Class A shares did not incur a distribution services fee; however it may begin to incur this fee upon approval of the Trustees.
Sales Charges
Front-end sales charges and contingent deferred sales charges (CDSC) do not represent expenses of the Fund. They are deducted from the proceeds of sales of Fund shares prior to investment or from redemption proceeds prior to remittance, as applicable. For the year ended August 31, 2016, FSC retained $9,043 and $393 in sales charges from the sale of Class A Shares and Class F Shares, respectively. FSC retained $15,441 in CDSC relating to redemptions of Class F Shares.
Other Service Fees
For the year ended August 31, 2016, FSSC received $2,018 of the other service fees disclosed in Note 2.
Interfund Transactions
During the year ended August 31, 2016, the Fund engaged in purchase and sale transactions with funds that have a common investment adviser (or affiliated investment advisers), common Directors/Trustees and/or common Officers. These purchase and sale transactions complied with Rule 17a-7 under the Act and amounted to $36,600,000 and $34,350,000, respectively.
Expense Limitation
The Adviser and certain of its affiliates (which may include FSC, FAS and FSSC) on their own initiative have agreed to waive their respective fees and/or reimburse expenses. Total annual fund operating expenses (as shown in the financial highlights, excluding interest expense, extraordinary expenses, line of credit expense and proxy-related expenses paid by the Fund, if
Annual Shareholder Report
any) paid by the Fund's Class A Shares and Class F Shares (after the voluntary waivers and reimbursements) will not exceed 0.75% and 0.90% (the “Fee Limit”), respectively, up to but not including the later of (the “Termination Date”): (a) November 1, 2017; or (b) the date of the Fund's next effective Prospectus. While the Adviser and its applicable affiliates currently do not anticipate terminating or increasing these arrangements prior to the Termination Date, these arrangements may only be terminated or the Fee Limit increased prior to the Termination Date with the agreement of the Trustees.
General
Certain Officers and Trustees of the Fund are Officers and Directors or Trustees of certain of the above companies. To efficiently facilitate payment, Directors'/Trustees' fees and certain expenses related to conducting meetings of the Directors/Trustees and other miscellaneous expenses are paid by an affiliate of the Adviser which in due course are reimbursed by the Fund. Such expenses may be included in Accrued and Miscellaneous Expenses on the Statement of Assets and Liabilities and Statement of Operations, respectively.
6. Investment TRANSACTIONS
Purchases and sales of investments, excluding long-term U.S. government securities and short-term obligations, for the year ended August 31, 2016, were as follows:
| Purchases | $21,649,517 |
| Sales | $29,365,758 |
7. CONCENTRATION OF RISK
Since the Fund invests a substantial portion of its assets in issuers located in one state, it will be more susceptible to factors adversely affecting issuers of that state than would be a comparable tax-exempt mutual fund that invests nationally. In order to reduce the credit risk associated with such factors, at August 31, 2016, 10.6% of the securities in the Portfolio of Investments is backed by letters of credit or bond insurance of various financial institutions and financial guaranty assurance agencies.
8. LINE OF CREDIT
The Fund participates with certain other Federated Funds, on a several basis, in an up to $500,000,000 unsecured, 364-day, committed, revolving line of credit (LOC) agreement. The LOC was made available to finance temporarily the repurchase or redemption of shares of the Fund, failed trades, payment of dividends, settlement of trades and for other short-term, temporary or emergency general business purposes. The Fund cannot borrow under the LOC if an inter-fund loan is outstanding. The Fund's ability to borrow under the LOC also is subject to the limitations of the Act and various conditions precedent that must be satisfied before the Fund can borrow. Loans under the LOC are charged interest at a fluctuating rate per annum equal to the highest, on any day, of (a) (i) the federal funds effective rate, (ii) the one month London Interbank Offer Rate (LIBOR), and (iii) 0.0%, plus (b) a margin. The LOC also requires the Fund to pay, quarterly in arrears and at maturity, its pro rata share of a commitment fee based on the amount of the lenders' commitment that has not been utilized. As of August 31, 2016, the Fund had no outstanding loans. During the year ended August 31, 2016, the Fund did not utilize the LOC.
Annual Shareholder Report
9. INTERFUND LENDING
Pursuant to an Exemptive Order issued by the Securities and Exchange Commission, the Fund, along with other funds advised by subsidiaries of Federated Investors, Inc., may participate in an interfund lending program. This program provides an alternative credit facility allowing the Fund to borrow from other participating affiliated funds. As of August 31, 2016, there were no outstanding loans. During the year ended August 31, 2016, the program was not utilized.
10. FEDERAL TAX INFORMATION (UNAUDITED)
For the fiscal year ended August 31, 2016, 99.92% of distributions from net investment income is exempt from federal income tax, other than the federal AMT.
Annual Shareholder Report
Report of Independent Registered Public Accounting Firm
TO THE BOARD OF TRUSTEES OF federated municipal securities income trust and shareholders of federated ohio municipal income FUND:
We have audited the accompanying statement of assets and liabilities, including the portfolio of investments, of Federated Ohio Municipal Income Fund (the “Fund”), a portfolio of Federated Municipal Securities Income Trust, as of August 31, 2016, and the related statement of operations for the year then ended, and the statements of changes in net assets for each of the years in the two-year period then ended and the financial highlights for each of the years in the five-year period then ended. These financial statements and financial highlights are the responsibility of the Fund's management. Our responsibility is to express an opinion on these financial statements and financial highlights based on our audits.
We conducted our audits in accordance with the standards of the Public Company Accounting Oversight Board (United States). Those standards require that we plan and perform the audit to obtain reasonable assurance about whether the financial statements and financial highlights are free of material misstatement. An audit includes examining, on a test basis, evidence supporting the amounts and disclosures in the financial statements. Our procedures included confirmation of securities owned as of August 31, 2016, by correspondence with the custodian. An audit also includes assessing the accounting principles used and significant estimates made by management, as well as evaluating the overall financial statement presentation. We believe that our audits provide a reasonable basis for our opinion.
In our opinion, the financial statements and financial highlights referred to above present fairly, in all material respects, the financial position of Federated Ohio Municipal Income Fund as of August 31, 2016, and the results of its operations for the year then ended, and the changes in its net assets for each of the years in the two-year period then ended and the financial highlights for each of the years in the five-year period then ended, in conformity with U.S. generally accepted accounting principles.
Boston, Massachusetts
October 24, 2016
Annual Shareholder Report
Shareholder Expense Example (unaudited)
As a shareholder of the Fund, you incur two types of costs: (1) transaction costs, including sales charges (loads) on purchase or redemption payments; and (2) ongoing costs, including management fees and to the extent applicable, distribution (12b-1) fees and/or other service fees and other Fund expenses. This Example is intended to help you to understand your ongoing costs (in dollars) of investing in the Fund and to compare these costs with the ongoing costs of investing in other mutual funds. It is based on an investment of $1,000 invested at the beginning of the period and held for the entire period from March 1, 2016 to August 31, 2016.
ACTUAL EXPENSES
The first section of the table below provides information about actual account values and actual expenses. You may use the information in this section, together with the amount you invested, to estimate the expenses that you incurred over the period. Simply divide your account value by $1,000 (for example, an $8,600 account value divided by $1,000 = 8.6), then multiply the result by the number in the first section under the heading entitled “Expenses Paid During Period” to estimate the expenses attributable to your investment during this period.
HYPOTHETICAL EXAMPLE FOR COMPARISON PURPOSES
The second section of the table below provides information about hypothetical account values and hypothetical expenses based on the Fund's actual expense ratio and an assumed rate of return of 5% per year before expenses, which is not the Fund's actual return. Thus, you should not use the hypothetical account values and expenses to estimate the actual ending account balance or your expenses for the period. Rather, these figures are required to be provided to enable you to compare the ongoing costs of investing in the Fund with other funds. To do so, compare this 5% hypothetical example with the 5% hypothetical examples that appear in the shareholder reports of the other funds.
Annual Shareholder Report
Please note that the expenses shown in the table are meant to highlight your ongoing costs only and do not reflect any transaction costs, such as sales charges (loads) on purchase or redemption payments. Therefore, the second section of the table is useful in comparing ongoing costs only, and will not help you determine the relative total costs of owning different funds. In addition, if these transaction costs were included, your costs would have been higher.
| | Beginning
Account Value
3/1/2016 | Ending
Account Value
8/31/2016 | Expenses Paid
During Period1 |
| Actual: | | | |
| Class A Shares | $1,000 | $1,034.90 | $3.84 |
| Class F Shares | $1,000 | $1,034.10 | $4.60 |
Hypothetical (assuming a 5% return
before expenses): | | | |
| Class A Shares | $1,000 | $1,021.37 | $3.81 |
| Class F Shares | $1,000 | $1,020.61 | $4.57 |
| 1 | Expenses are equal to the Fund's annualized net expense ratios, multiplied by the average account value over the period, multiplied by 184/366 (to reflect the one-half-year period). The annualized net expense ratios are as follows: |
| | |
| Class A Shares | 0.75% |
| Class F Shares | 0.90% |
Annual Shareholder Report
Board of Trustees and Trust Officers
The Board of Trustees is responsible for managing the Trust's business affairs and for exercising all the Trust's powers except those reserved for the shareholders. The following tables give information about each Trustee and the senior officers of the Fund. Where required, the tables separately list Trustees who are “interested persons” of the Fund (i.e., “Interested” Trustees) and those who are not (i.e., “Independent” Trustees). Unless otherwise noted, the address of each person listed is Federated Investors Tower, 1001 Liberty Avenue, Pittsburgh, PA 15222. The address of all Independent Trustees listed is 4000 Ericsson Drive, Warrendale, PA 15086-7561; Attention: Mutual Fund Board. As of December 31, 2015, the Trust comprised five portfolio(s), and the Federated Fund Family consisted of 38 investment companies (comprising 122 portfolios). Unless otherwise noted, each Officer is elected annually. Unless otherwise noted, each Trustee oversees all portfolios in the Federated Fund Family and serves for an indefinite term. The Fund's Statement of Additional Information includes additional information about Trust Trustees and is available, without charge and upon request, by calling 1-800-341-7400.
Interested TRUSTEES Background
Name
Birth Date
Positions Held with Trust
Date Service Began | Principal Occupation(s) for Past Five Years,
Other Directorships Held and Previous Position(s) |
J. Christopher Donahue*
Birth Date: April 11, 1949
President and Trustee
Indefinite Term
Began serving: August 1990 | Principal Occupations: Principal Executive Officer and President of certain of the Funds in the Federated Fund Family; Director or Trustee of the Funds in the Federated Fund Family; President, Chief Executive Officer and Director, Federated Investors, Inc.; Chairman and Trustee, Federated Investment Management Company; Trustee, Federated Investment Counseling; Chairman and Director, Federated Global Investment Management Corp.; Chairman, Federated Equity Management Company of Pennsylvania and Passport Research, Ltd. (investment advisory subsidiary of Federated); Trustee, Federated Shareholder Services Company; Director, Federated Services Company.
Previous Positions: President, Federated Investment Counseling; President and Chief Executive Officer, Federated Investment Management Company, Federated Global Investment Management Corp. and Passport Research, Ltd. |
Annual Shareholder Report
Name
Birth Date
Positions Held with Trust
Date Service Began | Principal Occupation(s) for Past Five Years,
Other Directorships Held and Previous Position(s) |
John B. Fisher*
Birth Date: May 16, 1956
Trustee
Indefinite Term
Began serving: May 2016 | Principal Occupations: Principal Executive Officer and President of certain of the Funds in the Federated Fund Family; Director or Trustee of certain of the Funds in the Federated Fund Family; Vice President, Federated Investors, Inc.; President, Director/Trustee and CEO, Federated Advisory Services Company, Federated Equity Management Company of Pennsylvania, Federated Global Investment Management Corp., Federated Investment Counseling, Federated Investment Management Company; President and CEO of Passport Research, Ltd.; President of some of the Funds in the Federated Fund Complex and Director, Federated Investors Trust Company.
Previous Positions: President and Director of the Institutional Sales Division of Federated Securities Corp.; President and Director of Federated Investment Counseling; Director, Edgewood Securities Corp.; Director, Federated Services Company; Director, Federated Investors, Inc.; Chairman and Director, Southpointe Distribution Services, Inc. and President, Technology, Federated Services Company. |
| * | Reasons for “interested” status: J. Christopher Donahue and John B. Fisher are interested due to their beneficial ownership of shares of Federated Investors, Inc. and due to positions they hold with Federated and its subsidiaries. J. Christopher Donahue is the son of John F. Donahue, Chairman Emeritus of the Federated Funds. |
INDEPENDENT TRUSTEES Background
Name
Birth Date
Positions Held with Trust
Date Service Began | Principal Occupation(s) for Past Five Years,
Other Directorships Held, Previous Position(s) and Qualifications |
John T. Collins
Birth Date: January 24, 1947
Trustee
Indefinite Term
Began serving: October 2013 | Principal Occupations: Director or Trustee of the Federated Fund Family; Retired.
Other Directorships Held: Director, Chair of the Compensation Committee, Audit Committee member, KLX Corp.
Qualifications: Mr. Collins has served in several business and financial management roles and directorship positions throughout his career. Mr. Collins previously served as Chairman and CEO, The Collins Group, Inc. (a private equity firm). Mr. Collins serves as Chairman Emeriti, Bentley University. Mr. Collins previously served as Director, FleetBoston Financial Corp.; Director and Audit Committee Member, Bank of America Corp. and Director, Beth Israel Deaconess Medical Center (Harvard University Affiliate Hospital). |
Annual Shareholder Report
Name
Birth Date
Positions Held with Trust
Date Service Began | Principal Occupation(s) for Past Five Years,
Other Directorships Held, Previous Position(s) and Qualifications |
G. Thomas Hough
Birth Date: February 28, 1955
Trustee
Indefinite Term
Began serving: August 2015 | Principal Occupations: Director or Trustee of the Federated Fund Family; Retired.
Other Directorships Held: Director, Chair of the Audit Committee, Governance Committee, Publix Super Markets, Inc.; Director, Equifax, Inc.
Qualifications: Mr. Hough has served in accounting, business management and directorship positions throughout his career. Mr. Hough most recently held the position of Americas Vice Chair of Assurance with Ernst & Young LLP. Mr. Hough is an Executive Committee member of the United States Golf Association, he serves on the President's Cabinet and Business School Board of Visitors for the University of Alabama and is on the Business School Board of Visitors for Wake Forest University. |
Maureen Lally-Green
Birth Date: July 5, 1949
Trustee
Indefinite Term
Began serving: August 2009 | Principal Occupations: Director or Trustee of the Federated Fund Family; Interim Dean of the Duquesne University School of Law; Adjunct Professor of Law, Duquesne University School of Law.
Other Directorships Held: Director, CONSOL Energy Inc.
Qualifications: Judge Lally-Green has served in various legal and business roles and directorship positions throughout her career. Judge Lally-Green previously served as: Associate General Secretary, Diocese of Pittsburgh; a member of the Superior Court of Pennsylvania; and as a Professor of Law, Duquesne University School of Law. Judge Lally-Green also holds the positions on either a public or not for profit Board of Directors as follows: Member, Pennsylvania State Board of Education (public); Director and Chair, UPMC Mercy Hospital; Regent, St. Vincent Seminary; Director and Vice Chair, Our Campaign for the Church Alive!, Inc.; Director, Saint Vincent College; and Director and Chair, Cardinal Wuerl North Catholic High School, Inc. Judge Lally-Green has held the positions of: Director, Auberle; Director, Ireland Institute of Pittsburgh; Director, Saint Thomas More Society; and Director, Catholic High Schools of the Diocese of Pittsburgh, Inc. |
Peter E. Madden
Birth Date: March 16, 1942
Trustee
Indefinite Term
Began serving: August 1991 | Principal Occupation: Director or Trustee, and Chair of the Board of Directors or Trustees, of the Federated Fund Family; Retired.
Other Directorships Held: None.
Qualifications: Mr. Madden has served in several business management, mutual fund services and directorship positions throughout his career. Mr. Madden previously served as President, Chief Operating Officer and Director, State Street Bank and Trust Company (custodian bank) and State Street Corporation (financial services). He was Director, VISA USA and VISA International and Chairman and Director, Massachusetts Bankers Association. Mr. Madden served as Director, Depository Trust Corporation and Director, The Boston Stock Exchange. Mr. Madden also served as a Representative to the Commonwealth of Massachusetts General Court. |
Annual Shareholder Report
Name
Birth Date
Positions Held with Trust
Date Service Began | Principal Occupation(s) for Past Five Years,
Other Directorships Held, Previous Position(s) and Qualifications |
Charles F. Mansfield, Jr.
Birth Date: April 10, 1945
Trustee
Indefinite Term
Began serving: January 1999 | Principal Occupations: Director or Trustee of the Federated Fund Family; Management Consultant.
Other Directorships Held: None.
Qualifications: Mr. Mansfield has served in several banking, business management and educational roles and directorship positions throughout his career. Mr. Mansfield previously served as Chief Executive Officer, PBTC International Bank; Partner, Arthur Young & Company (now Ernst & Young LLP); Chief Financial Officer of Retail Banking Sector, Chase Manhattan Bank; Senior Vice President, HSBC Bank USA (formerly, Marine Midland Bank); Vice President, Citibank; Assistant Professor of Banking and Finance, Frank G. Zarb School of Business, Hofstra University; Executive Vice President DVC Group, Inc. (marketing, communications and technology). |
Thomas M. O'Neill
Birth Date: June 14, 1951
Trustee
Indefinite Term
Began serving: August 2006 | Principal Occupations: Director or Trustee, Chair of the Audit Committee of the Federated Fund Family; Sole Proprietor, Navigator Management Company (investment and strategic consulting).
Other Directorships Held: None.
Qualifications: Mr. O'Neill has served in several business, mutual fund and financial management roles and directorship positions throughout his career. Mr. O'Neill serves as Director, Medicines for Humanity and Director, The Golisano Children's Museum of Naples, Florida. Mr. O'Neill previously served as Chief Executive Officer and President, Managing Director and Chief Investment Officer, Fleet Investment Advisors; President and Chief Executive Officer, Aeltus Investment Management, Inc.; General Partner, Hellman, Jordan Management Co., Boston, MA; Chief Investment Officer, The Putnam Companies, Boston, MA; Credit Analyst and Lending Officer, Fleet Bank; Director and Consultant, EZE Castle Software (investment order management software); and Director, Midway Pacific (lumber). |
P. Jerome Richey
Birth Date: February 23, 1949
Trustee
Indefinite Term
Began serving: October 2013 | Principal Occupations: Director or Trustee of the Federated Fund Family; Management Consultant.
Other Directorships Held: None.
Qualifications: Mr. Richey has served in several business and legal management roles and directorship positions throughout his career. Mr. Richey most recently held the positions of Senior Vice Chancellor and Chief Legal Officer, University of Pittsburgh. Mr. Richey serves as Board Member, Epilepsy Foundation of Western Pennsylvania and Board member, World Affairs Council of Pittsburgh. Mr. Richey previously served as Chief Legal Officer and Executive Vice President, CONSOL Energy Inc. and Shareholder, Buchanan Ingersoll & Rooney PC (a law firm). |
Annual Shareholder Report
Name
Birth Date
Positions Held with Trust
Date Service Began | Principal Occupation(s) for Past Five Years,
Other Directorships Held, Previous Position(s) and Qualifications |
John S. Walsh
Birth Date: November 28, 1957
Trustee
Indefinite Term
Began serving: June 1999 | Principal Occupations: Director or Trustee of the Federated Fund Family; President and Director, Heat Wagon, Inc. (manufacturer of construction temporary heaters); President and Director, Manufacturers Products, Inc. (distributor of portable construction heaters); President, Portable Heater Parts, a division of Manufacturers Products, Inc.
Other Directorships Held: None.
Qualifications: Mr. Walsh has served in several business management roles and directorship positions throughout his career. Mr. Walsh previously served as Vice President, Walsh & Kelly, Inc. (paving contractors). |
OFFICERS
Name
Birth Date
Positions Held with Trust
Date Service Began | Principal Occupation(s) for Past Five Years
and Previous Position(s) |
John W. McGonigle
Birth Date: October 26, 1938
EXECUTIVE VICE PRESIDENT AND SECRETARY
Officer since: August 1990 | Principal Occupations: Executive Vice President and Secretary of the Federated Fund Family; Vice Chairman, Executive Vice President, Secretary and Director, Federated Investors, Inc.
Previous Positions: Trustee, Federated Investment Management Company and Federated Investment Counseling; Director, Federated Global Investment Management Corp., Federated Services Company and Federated Securities Corp. |
Lori A. Hensler
Birth Date: January 6, 1967
TREASURER
Officer since: April 2013 | Principal Occupations: Principal Financial Officer and Treasurer of the Federated Fund Family; Senior Vice President, Federated Administrative Services; Financial and Operations Principal for Federated Securities Corp. and Edgewood Services, Inc.; and Assistant Treasurer, Federated Investors Trust Company. Ms. Hensler has received the Certified Public Accountant designation.
Previous Positions: Controller of Federated Investors, Inc.; Senior Vice President and Assistant Treasurer, Federated Investors Management Company; Treasurer, Federated Investors Trust Company; Assistant Treasurer, Federated Administrative Services, Federated Administrative Services, Inc., Federated Securities Corp., Edgewood Services, Inc., Federated Advisory Services Company, Federated Equity Management Company of Pennsylvania, Federated Global Investment Management Corp., Federated Investment Counseling, Federated Investment Management Company, Passport Research, Ltd., and Federated MDTA, LLC; Financial and Operations Principal for Federated Securities Corp., Edgewood Services, Inc. and Southpointe Distribution Services, Inc. |
Annual Shareholder Report
Name
Birth Date
Positions Held with Trust
Date Service Began | Principal Occupation(s) for Past Five Years
and Previous Position(s) |
Richard B. Fisher
Birth Date: May 17, 1923
VICE CHAIRMAN
Officer since: August 2002 | Principal Occupations: Vice Chairman or Vice President of some of the Funds in the Federated Fund Family; Vice Chairman, Federated Investors, Inc.; Chairman, Federated Securities Corp.
Previous Positions: President and Director or Trustee of some of the Funds in the Federated Fund Family; Executive Vice President, Federated Investors, Inc.; Director and Chief Executive Officer, Federated Securities Corp. |
Peter J. Germain
Birth Date: September 3, 1959
CHIEF LEGAL OFFICER
Officer since: January 2005 | Principal Occupations: Mr. Germain is Chief Legal Officer of the Federated Fund Family. He is General Counsel and Vice President, Federated Investors, Inc.; President, Federated Administrative Services and Federated Administrative Services, Inc.; Vice President, Federated Securities Corp.; Secretary, Federated Private Asset Management, Inc.; and Secretary, Retirement Plan Service Company of America. Mr. Germain joined Federated in 1984 and is a member of the Pennsylvania Bar Association.
Previous Positions: Deputy General Counsel, Special Counsel, Managing Director of Mutual Fund Services, Federated Investors, Inc.; Senior Vice President, Federated Services Company; and Senior Corporate Counsel, Federated Investors, Inc. |
Stephen Van Meter
Birth Date: June 5, 1975
CHIEF COMPLIANCE OFFICER AND SENIOR VICE PRESIDENT
Officer since: July 2015 | Principal Occupations: Senior Vice President and Chief Compliance Officer of the Federated Fund Family; Vice President and Chief Compliance Officer of Federated Investors, Inc. and Chief Compliance Officer of certain of its subsidiaries. Mr. Van Meter joined Federated in October 2011. He holds FINRA licenses under Series 3, 7, 24 and 66.
Previous Positions: Mr. Van Meter previously held the position of Compliance Operating Officer, Federated Investors, Inc. Prior to joining Federated, Mr. Van Meter served at the United States Securities and Exchange Commission in the positions of Senior Counsel, Office of Chief Counsel, Division of Investment Management and Senior Counsel, Division of Enforcement. |
Robert J. Ostrowski
Birth Date: April 26, 1963
CHIEF INVESTMENT OFFICER
Officer since: February 2010 | Principal Occupations: Robert J. Ostrowski joined Federated in 1987 as an Investment Analyst and became a Portfolio Manager in 1990. He was named Chief Investment Officer of Federated's taxable fixed-income products in 2004 and also serves as a Senior Portfolio Manager. Mr. Ostrowski became an Executive Vice President of the Fund's Adviser in 2009 and served as a Senior Vice President of the Fund's Adviser from 1997 to 2009. Mr. Ostrowski has received the Chartered Financial Analyst designation. He received his M.S. in Industrial Administration from Carnegie Mellon University. |
Annual Shareholder Report
Evaluation and Approval of Advisory Contract–May 2016
Federated Ohio Municipal Income Fund (the “Fund”)
Following a review and recommendation of approval by the Fund's independent trustees, the Fund's Board of Trustees (the “Board”) reviewed and unanimously approved at its May 2016 meetings the continuation of the Fund's investment advisory contract for an additional one-year term. The Board's decision regarding the contract reflects the exercise of its business judgment after consideration of all of the information received on whether to continue the existing arrangements.
The Board had previously appointed a Senior Officer, whose duties include specified responsibilities relating to the process by which advisory fees are to be charged to a Federated fund. The Senior Officer has the authority to retain consultants, experts, or staff as may be reasonably necessary to assist in the performance of his duties, reports directly to the Board, and may be terminated only with the approval of a majority of the independent members of the Board. The Senior Officer prepared and furnished to the Board an independent, written evaluation that covered topics discussed below (the “Senior Officer's Evaluation”). The Board considered the Senior Officer's Evaluation, along with other information, in deciding to approve the investment advisory contract.
The Board is also familiar with and considered judicial decisions concerning allegedly excessive investment advisory fees, which have indicated that the following factors may be relevant to an adviser's fiduciary duty with respect to its receipt of compensation from a fund: the nature and quality of the services provided by an adviser to a fund and its shareholders, including the performance and fees and expenses of the fund and of comparable funds; an adviser's cost of providing the services, including the profitability to an adviser of providing advisory services to a fund; the extent to which an adviser may realize “economies of scale” as a fund grows larger and, if such economies of scale exist, whether they have been shared with a fund and its shareholders or the family of funds; any “fall-out financial benefits” that accrue to an adviser because of its relationship with a fund (including research services received from brokers that execute fund trades and any fees paid to affiliates of an adviser for services rendered to a fund); comparative fee and expense structures, including a comparison of fees paid to an adviser with those paid by similar funds; and the extent of care, conscientiousness and independence with which board members perform their duties and their expertise, including whether they are fully informed about all facts the board deems relevant to its consideration of an adviser's services and fees. The Board noted that the Securities and Exchange Commission (“SEC”) disclosure requirements regarding the basis for the Board's approval of the Fund's investment advisory contract generally track the factors listed above. Consistent with these judicial decisions and SEC disclosure requirements, the Board also considered management fees charged to
Annual Shareholder Report
institutional and other clients of Federated Investment Management Company (the “Adviser”) for what might be viewed as like services. The Board was aware of these factors and was guided by them in its review of the Fund's investment advisory contract to the extent it considered them to be appropriate and relevant, as discussed further below.
The Board considered and weighed these circumstances in light of its substantial accumulated experience in governing the Fund and working with Federated Investors, Inc. and its affiliates (“Federated”) on matters relating to the Federated funds, and was assisted in its deliberations by independent legal counsel. Throughout the year, and in connection with its May meetings, the Board requested and received substantial and detailed information about the Fund and the Federated organization that was in addition to the extensive materials that comprise and accompany the Senior Officer's Evaluation. Federated provided much of this information at each regular meeting of the Board, and furnished additional substantial information in connection with the May meetings at which the Board's formal review of the investment advisory contract occurred. At the May meetings in addition to meeting in separate sessions of the independent trustees without management present, senior management of the Adviser also met with the independent trustees and their counsel to discuss the materials presented and any other matters thought relevant by the Adviser or the trustees. Between regularly scheduled meetings, the Board also received information on particular matters as the need arose. Thus, the Board's consideration of the investment advisory contract included review of the Senior Officer's Evaluation, accompanying data and additional information covering such matters as: the Adviser's investment philosophy, revenue, profitability, personnel and processes; investment and operating strategies; the Fund's short- and long-term performance (in absolute terms, both on a gross basis and net of expenses, as well as in relationship to its particular investment program and certain competitor or “peer group” funds and/or other benchmarks, as appropriate), and comments on the reasons for performance; the Fund's investment objectives; the Fund's expenses (including the advisory fee itself and the overall expense structure of the Fund, both in absolute terms and relative to similar and/or competing funds, with due regard for contractual or voluntary expense limitations); the use and allocation of brokerage commissions derived from trading the Fund's portfolio securities (if any); and the nature, quality and extent of the advisory and other services provided to the Fund by the Adviser and its affiliates. The Board also considered the preferences and expectations of Fund shareholders; the entrepreneurial risk assumed by the Adviser in sponsoring the Fund; the continuing state of competition in the mutual fund industry and market practices; the range of comparable fees for similar funds in the mutual fund industry; the Fund's relationship to the Federated funds which include a comprehensive array of funds with different investment objectives, policies and strategies which are generally available for exchange without the incurrence of additional sales charges; compliance and
Annual Shareholder Report
audit reports concerning the Federated funds and the Federated companies that service them (including communications from regulatory agencies), as well as Federated's responses to any issues raised therein; and relevant developments in the mutual fund industry and how the Federated funds and/or Federated are responding to them. The Board's evaluation process is evolutionary. The criteria considered and the emphasis placed on relevant criteria change in recognition of changing circumstances in the mutual fund marketplace.
While mindful that courts have cautioned against giving such comparisons too much weight, the Board has found the use of comparisons of the Fund's fees and expenses to other mutual funds with comparable investment programs to be relevant to its deliberations. In this regard, the Board was presented with, and considered, information regarding the contractual advisory fee rates, net advisory fee rates, total expense ratios and each element of the Fund's total expense ratio (i.e., gross and net advisory fees, custody fees, portfolio accounting fees and transfer agency fees) relative to the Fund's peers. The Board focused on comparisons with other similar mutual funds more heavily than non-mutual fund products or services because it is believed that they are more relevant. For example, other mutual funds are the products most like the Fund, they are readily available to Fund shareholders as alternative investment vehicles, and they are the type of investment vehicle in fact chosen and maintained by the Fund's investors. The range of their fees and expenses therefore appears to be a relevant indicator of what consumers have found to be reasonable in the precise marketplace in which the Fund competes.
The Board reviewed the contractual advisory fee rate, net advisory fee rate where partially waived and other expenses of the Fund and noted the position of the Fund's fee rates relative to its peers. In this regard, the Board noted that the contractual advisory fee rate was below the median of the relevant peer group and the Board was satisfied that the overall expense structure of the Fund remained competitive.
By contrast, the Senior Officer has reviewed Federated's fees for providing advisory services to products outside the Federated funds (e.g., institutional and separate accounts and sub-adviser services). He concluded that mutual funds and institutional accounts are inherently different products. Those differences include, but are not limited to, different types of targeted investors; being subject to different laws and regulations; different legal structures; different average account sizes and portfolio management techniques made necessary by different cash flows and different associated costs; and the time spent by portfolio managers and their teams, funds financial services, legal, compliance and risk management in reviewing securities pricing, addressing different administrative responsibilities, addressing different degrees of risk associated with management and a variety of different costs. The Senior Officer did not consider the fees for providing advisory services to these outside products to be determinative in judging the appropriateness of mutual fund advisory fees.
Annual Shareholder Report
Following such evaluation, the Board concluded, within the context of its full deliberations, that the expenses of the Fund are reasonable and supported renewal of the investment advisory contract with respect to the Fund.
The Board considered the nature, extent and quality of the services provided to the Fund by the Adviser and the resources of the Adviser and its affiliates dedicated to the Fund. In this regard, the Board evaluated, among other things, the Adviser's personnel, experience, track record, overall reputation and willingness to invest in personnel and infrastructure that benefit the Fund. In addition, the Board reviewed the qualifications, backgrounds and responsibilities of the portfolio management team primarily responsible for the day-to-day management of the Fund. The Board noted the compliance programs of and the compliance-related resources provided to the Fund by the Adviser. The Fund's ability to deliver competitive performance when compared to its peer group was also deemed to be relevant by the Board as a useful indicator of how the Adviser is executing the Fund's investment program, which in turn was one of the Board's considerations in reaching a conclusion that the nature, extent, and quality of the Adviser's investment management services were such as to warrant continuation of the investment advisory contract.
In evaluating the Fund's investment performance, the Board considered performance results in light of the Fund's investment objective, strategies and risks, as disclosed in the Fund's prospectus. The Board particularly considered detailed investment reports on the Fund's performance provided to the Board throughout the year and in connection with the May meetings. The Senior Officer also reviewed information compiled by Federated, using data supplied by independent fund ranking organizations, regarding the performance of, and fees charged by, other mutual funds, noting his view that comparisons to fund peer groups may be helpful, though not conclusive, in judging the reasonableness of the proposed fees. The Board considered, in evaluating such comparisons, that in some cases individual funds may exhibit significant and unique differences in their objectives and management techniques when compared to other funds within an industry peer group.
For the periods covered by the Senior Officer's Evaluation, the Fund's performance for the three-year and five-year periods was at the median of the relevant peer group, and the Fund's performance fell below the median of the relevant peer group for the one-year period. The Board discussed the Fund's performance with the Adviser and recognized the efforts being taken by the Adviser in the context of the other factors considered relevant by the Board.
Following such evaluation, the Board concluded, within the context of its full deliberations, that the performance of the Fund supported renewal of the investment advisory contract with respect to the Fund.
The Board also received financial information about Federated, including information regarding the compensation and ancillary (or “fall-out”) benefits Federated derived from its relationships with the Federated funds. This information covered not only the fees under the investment advisory contracts,
Annual Shareholder Report
but also fees received by Federated's subsidiaries for providing other services to the Federated funds under separate contracts (e.g., for serving as the Federated funds' administrator). The information also detailed any indirect benefit Federated may derive from its receipt of research services from brokers who execute Federated fund trades. In addition, the Board considered the fact that, in order for a fund to be competitive in the marketplace, Federated and its affiliates frequently waived fees and/or reimbursed expenses and have disclosed to fund investors and/or indicated to the Board their intention to do so in the future, where appropriate. Moreover, the Board receives regular reporting as to the institution, adjustment or elimination of these voluntary waivers. The Board considered Federated's previous reductions in contractual management fees to certain funds in response to the Senior Officer's recommendations.
Federated furnished information, requested by the Senior Officer, that reported revenues on a fund-by-fund basis and made estimates of the allocation of expenses on a fund-by-fund basis, using allocation methodologies specified by the Senior Officer. The Senior Officer noted that, while these cost allocation reports apply consistent allocation processes, the inherent difficulties in allocating costs continues to cause the Senior Officer to question the precision of the process and to conclude that such reports may be unreliable, since a single change in an allocation estimate may dramatically alter the resulting estimate of cost and/or profitability of a fund and may produce unintended consequences. The allocation information, including the Senior Officer's view that fund-by-fund estimations may be unreliable, was considered in the analysis by the Board.
The Board and the Senior Officer also reviewed information compiled by Federated comparing profitability information for Federated to other publicly held fund management companies. In this regard, the Senior Officer concluded that Federated's profit margins did not appear to be excessive. The Senior Officer also noted that Federated appeared financially sound, with the resources to fulfill its obligations under its contracts with the Fund.
The Senior Officer's Evaluation also discussed the notion of possible realization of “economies of scale” as a fund grows larger. The Board considered in this regard that the Adviser has made significant and long-term investments in areas that support all of the Federated funds, such as personnel and processes for the portfolio management, shareholder services, compliance, internal audit, and risk management functions, as well as systems technology (including technology relating to cybersecurity), and that the benefits of these efforts (as well as any economies of scale, should they exist) were likely to be enjoyed by the fund family as a whole. The Board noted that the Adviser's investments in these areas are extensive. In addition, the Board considered that Federated and its affiliates have frequently waived fees and/or reimbursed expenses and that this has allowed fund shareholders to share potential economies of scale from a fund's inception. Federated, as it does throughout the year, and again in connection with the Board's review, furnished information relative to revenue sharing or adviser paid fees. Federated and the Senior Officer noted that this information
Annual Shareholder Report
should be viewed to determine if there was an incentive to either not apply breakpoints or to apply breakpoints at higher levels and should not be viewed to determine the appropriateness of advisory fees, because it would represent marketing and distribution expenses. Finally, the Board also noted the absence of any applicable regulatory or industry guidelines on this subject, which (as discussed in the Senior Officer's Evaluation) is compounded by the lack of any common industry practice or general pattern with respect to structuring fund advisory fees with “breakpoints” that serve to reduce the fee as a fund attains a certain size.
The Senior Officer noted that, subject to the comments and recommendations made within the Senior Officer's Evaluation, his observations and the information accompanying the Senior Officer's Evaluation supported a finding by the Board that the management fee for the fund was reasonable. Under these circumstances, no changes were recommended to, and no objection was raised to, the continuation of the Fund's investment advisory contract.
In its decision to continue an existing investment advisory contract, the Board was mindful of the potential disruptions of the Fund's operations and various risks, uncertainties and other effects that could occur as a result of a decision to terminate or not renew an investment advisory contract. In particular, the Board recognized that many shareholders have invested in the Fund on the strength of the Adviser's industry standing and reputation and with the expectation that the Adviser will have a continuing role in providing advisory services to the Fund. Thus, the Board's approval of the investment advisory contract reflected the fact that it is the shareholders who have effectively selected the Adviser by virtue of having invested in the Fund. The Board concluded that, in light of the factors discussed above, including the nature, quality and scope of the services provided to the Fund by the Adviser and its affiliates, continuation of the investment advisory contract was appropriate.
The Board based its decision to approve the investment advisory contract on the totality of the circumstances and relevant factors and with a view to past and future long-term considerations. Not all of the factors and considerations identified above were necessarily relevant to the Fund, nor did the Board consider any one of them to be determinative. With respect to the factors that were relevant, the Board's decision to approve the continuation of the contract reflects its determination that Federated's performance and actions provided a satisfactory basis to support the decision to continue the existing arrangement.
Annual Shareholder Report
Voting Proxies on Fund Portfolio Securities
A description of the policies and procedures that the Fund uses to determine how to vote proxies, if any, relating to securities held in the Fund's portfolio is available, without charge and upon request, by calling 1-800-341-7400. A report on “Form N-PX” of how the Fund voted any such proxies during the most recent 12-month period ended June 30 is available via the Proxy Voting Record (Form N-PX) link associated with the Fund and share class name at www.FederatedInvestors.com/FundInformation. Form N-PX filings are also available at the SEC's website at www.sec.gov.
Quarterly Portfolio Schedule
The Fund files with the SEC a complete schedule of its portfolio holdings, as of the close of the first and third quarters of its fiscal year, on “Form N-Q.” These filings are available on the SEC's website at www.sec.gov and may be reviewed and copied at the SEC's Public Reference Room in Washington, DC. (Call 1-800-SEC-0330 for information on the operation of the Public Reference Room.) You may also access this information via the link to the Fund and share class name at www.FederatedInvestors.com/FundInformation.
Annual Shareholder Report
Mutual funds are not bank deposits or obligations, are not guaranteed by any bank and are not insured or guaranteed by the U.S. government, the Federal Deposit Insurance Corporation, the Federal Reserve Board or any other government agency. Investment in mutual funds involves investment risk, including the possible loss of principal.
This Report is authorized for distribution to prospective investors only when preceded or accompanied by the Trust's Prospectus, which contains facts concerning its objective and policies, management fees, expenses and other information.
Federated Ohio Municipal Income Fund
Federated Investors Funds
4000 Ericsson Drive
Warrendale, PA 15086-7561
Contact us at FederatedInvestors.com
or call 1-800-341-7400.
Federated Securities Corp., Distributor
CUSIP 313923823
CUSIP 313923609
28994 (10/16)
Federated is a registered trademark of Federated Investors, Inc.
2016 ©Federated Investors, Inc.
Annual Shareholder Report
August 31, 2016
| Share Class | Ticker |
| A | PAMFX |
| B | FPABX |
Federated Pennsylvania Municipal Income Fund
Fund Established 1990
A Portfolio of Federated Municipal Securities Income Trust
Dear Valued Shareholder,
I am pleased to present the Annual Shareholder Report for your fund covering the period from September 1, 2015 through August 31, 2016. This report includes Management's Discussion of Fund Performance, a complete listing of your fund's holdings, performance information and financial statements along with other important fund information.
In addition, our website, FederatedInvestors.com, offers easy access to Federated resources that include timely fund updates, economic and market insights from our investment strategists, and financial planning tools. We invite you to register to take full advantage of its capabilities.
Thank you for investing with Federated. I hope you find this information useful and look forward to keeping you informed.
Sincerely,
J. Christopher Donahue, President
Not FDIC Insured • May Lose Value • No Bank Guarantee
CONTENTS
| 1 |
| 8 |
| 9 |
| 17 |
| 19 |
| 20 |
| 21 |
| 22 |
| 32 |
| 33 |
| 35 |
| 41 |
| 47 |
| 47 |
Management's Discussion of Fund Performance (unaudited)
The total return of Federated Pennsylvania Municipal Income Fund (the “Fund”), based on net asset value for the 12-month reporting period ended August 31, 2016, (the “reporting period”) was 6.85% for A Shares and 5.93% for B Shares. The 6.85% total return of the A Shares for the reporting period consisted of 3.17% of tax-exempt dividends and reinvestments and price appreciation of 3.68% in the net asset value of the shares.1 The total return of the S&P Municipal Bond Pennsylvania Index (“PA Index”),2 the Fund's broad-based securities market index, was 6.64% during the same period. The total return of the S&P Municipal Bond PA, Investment Grade, 3-Year Plus Sub-Index (PAIG3 Index),3 a secondary index for the Fund, was 7.75%, and the total return of the Morningstar Muni Pennsylvania Funds Average (MMPFA),4 a peer group average for the Fund, was 6.39% during the same reporting period. The Fund's and the MMPFA's total returns for the most recently completed fiscal year reflected actual cash flows, transaction costs and other expenses, which were not reflected in the total return of the PA Index or PAIG3 Index.
During the reporting period, the Fund's investment strategy focused on: (a) the effective duration of its portfolio (which indicates the portfolio's sensitivity to changes in interest rates),5,6 (b) the allocation of the Fund's portfolio among securities of similar issuers (referred to as ���sectors”); and (c) the credit quality of portfolio securities (which is shown through credit ratings which indicate the risk that securities may default).7 These were the most significant factors affecting the Fund's performance relative to the PAIG3 Index during the reporting period.
The following discussion focuses on the performance of the Fund's Class A Shares.
Market OVERVIEW
During the reporting period, 10-year Treasury yields decreased from a high of 2.34% in November of 2015 to a low of 1.36% in July of 2016 and averaged 1.89%. Economic activity in the U.S. expanded at a moderate pace despite the global economic and financial setbacks in recent months. A range of recent economic indicators, including strong job gains, pointed to additional strengthening of the labor market. Inflation showed signs of picking up in recent months; however, it continued to run below the Federal Reserve System's (the “Fed”) two percent longer run objective. This partly reflected declines in energy prices and impacts of the U.S. dollar's strength on non-energy imports. Global economic developments continued to pose risks as turmoil in Chinese financial markets and lower oil prices contributed to concerns about the prospects for global economic growth and a pullback from risky assets. The Fed's decision to raise the federal funds target rate by 1/4 percent was widely anticipated by the
Annual Shareholder Report
markets. A downward revision in the expected path of the federal funds target rate was warranted by economic conditions and moved closer to the markets' expectations of the long-run plan.
The vote by the United Kingdom to leave the European Union (“Brexit”) resulted in immediate asset price volatility and some financial markets, particularly certain foreign exchange markets, experienced brief periods of strained liquidity. Safe haven asset prices appreciated substantially, but broad based market dislocations did not develop. Overall, the negative sentiment surrounding the Brexit outcome was subsequently alleviated by expectations of the central banks being more accommodative. Nevertheless, several long-term global risks related to Brexit remained.
Downward pressure on domestic energy activity intensified over the reporting period as oil prices dropped further. The imbalance of crude oil relative to demand remained very high, and it was not expected to resolve quickly. The collapse in the price of oil supported the fixed-income markets by further reducing price pressures and generating concerns that the drop in oil prices might reflect declining demand in a weakening global economy. The support for household spending from lower energy prices was offset by the restraint implied by the appreciation of the U.S. dollar and the possibility of adverse effects from slower economic growth in China.
During the reporting period, developments in Europe continued to be a focus for investors which indirectly affected interest rate levels in the tax-exempt municipal bond market. With regard to Europe, there continued to be downside risks to growth emanating from the region, given its unresolved imbalances, weak economic growth and continued deflationary risks. The U.S. dollar strengthened against the currencies of most advanced economies amid concerns about growth in those countries as well as announcements by several central banks regarding monetary policy actions. Elements underpinning the strength of the U.S. dollar were the increasing prevalence of negative interest rates on sovereign debt in some key European economies and risks to the international economic outlook. The European Central Bank announced that it would expand its asset purchase program.Credit conditions in the municipal bond market continued to be generally solid. Credit quality continued to be overall very stable, and ratios of general obligation bonds to those of comparable Treasury securities rose, partly reflecting the declines in yields on Treasury securities. The default by Puerto Rico and the downgrade of Illinois general obligation bonds both had only a limited effect on the broader municipal market.The municipal bond markets' technical (supply and demand) position was mostly favorable over the reporting period. The issuance of municipal debt was lower than in previous periods as issuers were hesitant to add additional leverage and the economic benefits of refunding existing debt became less advantageous. Flows from investors into intermediate, long and high-yield municipal bonds were positive and broad-based for a significant portion of the reporting period.
Annual Shareholder Report
The intermittent flight to quality by investors as a result of the unstable global political and economic environment also favored municipal bonds as they were viewed as a safer alternative investment.
The risk of additional municipal issuers becoming distressed remained through the reporting period. Some state and local governments turned to the courts for assistance in lowering their onerous pension liabilities, but responses from the courts were generally not favorable. Any workouts of these concerns are likely to take many years, which will continue to constrain state and local government budgets and limit their capacity to deal with severe infrastructure needs. The ongoing pressures on public pension plans and their unfunded liabilities continued to receive significant scrutiny.
Some positive news about the fiscal position of the states became available during the reporting period and, in some cases, revenues rose sufficiently enough to enable increases in state government spending and employment. These positive events allowed the spread between “AAA”- and “BBB”-rated general obligation debt to narrow by 27 basis points for 30 year maturities during the reporting period. The municipal yield curve also flattened significantly as yields on shorter maturities increased while yields on longer maturities (five years and longer) declined, leading to better total return performance for longer dated municipal bonds.
During the reporting period, Pennsylvania was the sixth largest state by both population and gross state product. Following decades of a declining manufacturing base, the economic growth engine has become its rejuvenated urban areas. The education and medical sectors have been driving the employment base in these areas. Pennsylvania maintained credit strengths that include a stable and less volatile economy than the overall U.S. economy, above average income levels and a pension reform plan which should lead to full funding of the Commonwealth's pension obligations. The Commonwealth successfully implemented revenue increases and expenditure cuts that intended to close the large structural budget gap. The contentious political environment did lead to a lengthy stalemate and delayed passage of their 2016 budget. Pension reform passed in 2010 put the pension plans on a path to be fully funded within 30 years subject to contribution collars limiting increases in annual contributions although pension will continue to be a key credit issue going forward.
Annual Shareholder Report
DURATION
As determined at the end of the reporting period, the Fund's dollar-weighted average duration for the reporting period was 4.6 years. Duration management continued to be a significant component of the Fund's investment strategy. The Fund's average duration was shorter than the average duration of the PAIG3 Index during the reporting period. Tax-exempt municipal bond yields decreased during most of the reporting period and decreased more for bonds with longer maturities as the yield curve significantly flattened during the reporting period. Bonds with a longer duration outperformed bonds with a shorter duration due to their differences in interest rate volatility. As a result of the Fund's underweight to bonds with longer durations relative to those included in the PAIG3 Index, duration had a significant negative impact on Fund performance over the reporting period.
Sector allocation
During the reporting period, sector allocation contributed positively to excess return. The Fund maintained a higher portfolio allocation to Industrial Development, Hospital and Senior Care, and Water and Sewer revenue bonds. These allocations helped the Fund's performance due to the outperformance of these sectors relative to the PAIG3 Index. The Fund had larger allocation to Pre-Refunded bonds than the PAIG3 Index. This sector underperformed the PAIG3 Index during the reporting period and provided negative excess return relative to the PAIG3 Index. Pre-Refunded bonds are escrowed in Treasury securities until their most recent call date and have less sensitivity to changes in interest rates as a result. As interest rates declines over the reporting period, Pre-Refunded bonds underperformed relative to the PAIG3 Index.
credit QUALITY8
During the reporting period, investor appetite for yield in the low interest rate environment increased municipal bond fund inflows and resulted in outperformance of bonds rated “A” and “BBB” (or unrated bonds of comparable quality) relative to bonds rated in the higher rating categories (or unrated bonds of comparable quality). Bonds in the noninvestment-grade7 category, below “BBB,” also outperformed the higher rating categories. With the decrease in credit spreads during the reporting period, and to a lesser extent for “AAA” and “AA” rated (or unrated comparable quality) debt, the Fund's overweight position, relative to the PAIG3 Index, in “A” and “BBB” (or unrated comparable quality) debt during the reporting period had a positive impact on the Fund's performance, as the yield on “A” and “BBB” (or unrated comparable quality) debt decreased to a greater extent than for other investment-grade securities. The Fund's noninvestment-grade holding of U.S. Steel Corporation contributed negative excess return as declining steel prices and the dumping of steel by foreign producers resulted in the bond's underperformance over the reporting period.
Annual Shareholder Report
| 1 | Income may be subject to the alternative minimum tax for individuals and corporations (AMT). |
| 2 | Please see the footnotes to the line graphs under “Fund Performance and Growth of a $10,000 Investment” below for the definition of, and more information about, the PA Index. |
| 3 | Please see the footnotes to the line graphs under “Fund Performance and Growth of a $10,000 Investment” below for the definition of, and more information about, the PAIG3 Index. The Fund's secondary index is being used for comparison purposes because, while it is not the Fund's broad-based securities market index, the Fund's Adviser believes it more closely reflects the securities in which the Fund invests. |
| 4 | Please see the footnotes to the line graphs under “Fund Performance and Growth of a $10,000 Investment” below for the definition of, and more information about, the MMPFA. |
| 5 | Duration is a measure of a security's price sensitivity to changes in interest rates. Securities with longer durations are more sensitive to changes in interest rates than securities with shorter durations. For purposes of this Management's Discussion of Fund Performance, duration is determined using a third-party analytical system. |
| 6 | Bond prices are sensitive to changes in interest rates, and a rise in interest rates can cause a decline in their prices. |
| 7 | Credit ratings pertain only to the securities in the portfolio and do not protect Fund shares against market risk. |
| 8 | Investment-grade securities and noninvestment-grade securities may either: be (a) rated by a nationally recognized statistical ratings organization or rating agency; or (b) unrated securities that the Fund's investment adviser (“Adviser”) believes are of comparable quality. The rating agencies that provided the ratings for rated securities include Standard and Poor's, Moody's Investor Services, Inc. and Fitch Rating Service. When ratings vary, the highest rating is used. Credit ratings of “AA” or better are considered to be high credit quality; credit ratings of “A” are considered high or medium/good quality; and credit ratings of “BBB” are considered to be medium/good credit quality, and the lowest category of investment-grade securities; credit ratings of “BB” and below are lower-rated, noninvestment-grade securities or junk bonds; and credit ratings of “CCC” or below are noninvestment-grade securities that have high default risk. Any credit quality breakdown does not give effect to the impact of any credit derivative investments made by the Fund. Credit ratings are an indication of the risk that a security will default. They do not protect a security from credit risk. Lower-rated bonds typically offer higher yields to help compensate investors for the increased risk associated with them. Among these risks are lower creditworthiness, greater price volatility, more risk to principal and income than with higher-rated securities and increased possibilities of default. |
Annual Shareholder Report
FUND PERFORMANCE AND GROWTH OF A $10,000 INVESTMENT
The graphs below illustrate the hypothetical investment of $10,0001 in Federated Pennsylvania Municipal Income Fund (the “Fund”) from August 31, 2006 to August 31, 2016, compared to the S&P Municipal Bond Pennsylvania Index (PA Index),2 the S&P Municipal Bond PA, Investment Grade, 3-Year Plus Sub-Index (PAIG3 Index)3 and the Morningstar Muni Pennsylvania Funds Average (MMPFA).4 The Average Annual Total Return table below shows returns for each class averaged over the stated periods.
GROWTH OF A $10,000 INVESTMENT
Growth of $10,000 as of August 31, 2016
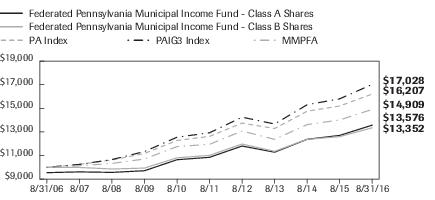
| Federated Pennsylvania Municipal Income Fund - | Class A Shares | Class B Shares | PA Index | PAIG3 Index | MMPFA |
| F | F | I | I | I |
| 8/31/2006 | 9,550 | 10,000 | 10,000 | 10,000 | 10,000 |
| 8/31/2007 | 9,616 | 9,992 | 10,257 | 10,249 | 10,136 |
| 8/31/2008 | 9,574 | 9,862 | 10,627 | 10,663 | 10,334 |
| 8/31/2009 | 9,714 | 9,938 | 11,176 | 11,340 | 10,708 |
| 8/31/2010 | 10,647 | 10,809 | 12,277 | 12,554 | 11,762 |
| 8/31/2011 | 10,851 | 11,016 | 12,623 | 12,929 | 11,950 |
| 8/31/2012 | 11,806 | 11,976 | 13,749 | 14,250 | 13,080 |
| 8/31/2013 | 11,285 | 11,359 | 13,288 | 13,673 | 12,373 |
| 8/31/2014 | 12,378 | 12,373 | 14,755 | 15,304 | 13,622 |
| 8/31/2015 | 12,706 | 12,605 | 15,198 | 15,803 | 14,016 |
| 8/31/2016 | 13,576 | 13,352 | 16,207 | 17,028 | 14,909 |
41 graphic description end -->
| ■ | Total returns shown for class A Shares include the maximum sales charge of 4.50% ($10,000 investment minus $450 sales charge = $9,550). |
| ■ | Total returns shown for the B Shares include the maximum contingent deferred sales charge of 5.50% as applicable. |
Average Annual Total Returns for the Period Ended 8/31/2016
(returns reflect all applicable sales charges and contingent deferred sales charges as specified below in footnote #1)
| | 1 Year | 5 Years | 10 Years |
| Class A Shares | 2.07% | 3.63% | 3.10% |
| Class B Shares | 0.43% | 3.43% | 2.95% |
| PA Index | 6.64% | 5.13% | 4.95% |
| PAIG3 Index | 7.75% | 5.66% | 5.47% |
| MMPFA | 6.39% | 4.69% | 4.05% |
Annual Shareholder Report
Performance data quoted represents past performance which is no guarantee of future results. Investment return and principal value will fluctuate so that an investor's shares, when redeemed, may be worth more or less than their original cost. Mutual fund performance changes over time and current performance may be lower or higher than what is stated. For current to the most recent month-end performance and after-tax returns, visit FederatedInvestors.com or call 1-800-341-7400. Returns shown do not reflect the deduction of taxes that a shareholder would pay on Fund distributions or the redemption of Fund shares. Mutual funds are not obligations of or guaranteed by any bank and are not federally insured.
| 1 | Represents a hypothetical investment of $10,000 in the Fund after deducting applicable sales charges: For Class A Shares, the maximum sales charge of 4.50% ($10,000 investment minus $450 sales charge = $9,550); For Class B Shares, the maximum contingent deferred sales charge is 5.50% on any redemption of shares held up to one year from the purchase date. The Fund's performance assumes the reinvestment of all dividends and distributions. The PA Index, PAIG3 Index and MMPFA have been adjusted to reflect reinvestment of dividends on securities in the index and average. |
| 2 | The PA Index consists of bonds in the S&P Municipal Bond Index (“Main Index”) that have been issued by the Commonwealth of Pennsylvania or local governments or state or local government entities within Pennsylvania. The Main Index is a broad, comprehensive, market value-weighted index composed of approximately 55,000 bond issues that are exempt from U.S. federal income taxes or subject to the alternative minimum tax (AMT). Eligibility criteria for inclusion in the Main Index include, but are not limited to: the bond issuer must be a state (including the Commonwealth of Puerto Rico and U.S. territories) or local government or state or local government entity where interest on the bond is exempt from U.S. federal income taxes or subject to the AMT; the bond must be held by a mutual fund for which Standard & Poor's Securities Evaluations, Inc. provides prices; it must be denominated in U.S. dollars and have a minimum par amount of $2 million; and the bond must have a minimum term to maturity and/or call date greater than or equal to one calendar month. The Main Index is rebalanced monthly. The PA Index is not adjusted to reflect sales charges, expenses and other fees that the Securities and Exchange Commission (SEC) requires to be reflected in the Fund's performance. The PA Index is unmanaged, and unlike the Fund, is not affected by cash flows. It is not possible to invest directly in an index. |
| 3 | The PAIG3 Index represents the portion of the PA Index composed solely of bonds that are rated at least BBB with remaining maturities of more than three years that are not subject to AMT. The PAIG3 Index is not adjusted to reflect sales charges, expenses and other fees that the SEC requires to be reflected in the Fund's performance. The PAIG3 Index is unmanaged and, unlike the Fund, is not affected by cash flows. It is not possible to invest directly in an index. |
| 4 | Morningstar figures represent the average of the total returns reported by all the mutual funds designated by Morningstar as falling into the respective category indicated. They do not reflect sales charges. |
Annual Shareholder Report
Portfolio of Investments Summary Table (unaudited)
At August 31, 2016, the Fund's sector composition1 was as follows:
| Sector Composition | Percentage of
Total Net Assets |
| Hospital | 18.3% |
| Water & Sewer | 13.7% |
| Education | 12.9% |
| Toll Road | 10.2% |
| General Obligation—Local | 9.9% |
| Dedicated Tax | 6.7% |
| Pre-Refunded | 6.4% |
| Industrial Development/Pollution Control | 4.1% |
| Senior Care | 4.1% |
| Airport | 2.8% |
| Other2 | 9.6% |
| Other Assets and Liabilities—Net3 | 1.3% |
| TOTAL | 100.0% |
| 1 | Sector classifications, and the assignment of holdings to such sectors, are based upon the economic sector and/or revenue source of the underlying obligor, as determined by the Fund's Adviser. For securities that have been enhanced by a third-party guarantor, such as bond insurers and banks, sector classifications are based upon the economic sector and/or revenue source of the underlying obligor, as determined by the Fund's Adviser. Pre-refunded securities are those whose debt service is paid from escrowed assets, usually U.S. government securities. |
| 2 | For purposes of this table, sector classifications constitute 89.1% of the Fund's total net assets. Remaining sectors have been aggregated under the designation “Other.” |
| 3 | Assets, other than investments in securities, less liabilities. See Statement of Assets and Liabilities. |
Annual Shareholder Report
Portfolio of Investments
August 31, 2016
Principal
Amount | | | Value |
| | | MUNICIPAL BONDS—96.6% | |
| | | Pennsylvania—96.6% | |
| $1,000,000 | | Allegheny County Sanitation Authority, Sewer Revenue Bonds (Series 2015), 5.00%, 12/1/2040 | $1,197,060 |
| 2,000,000 | | Allegheny County Sanitation Authority, Sewer Revenue Bonds (Series 2015), 5.00%, 12/1/2045 | 2,381,440 |
| 1,450,000 | | Allegheny County, PA Airport Authority, Airport Revenue Bonds (Series 2012A-1), 5.00% (Pittsburgh International Airport), 1/1/2023 | 1,677,722 |
| 1,550,000 | | Allegheny County, PA Airport Authority, Airport Revenue Bonds (Series 2012A-1), 5.00% (Pittsburgh International Airport), 1/1/2024 | 1,782,391 |
| 3,555,000 | | Allegheny County, PA HDA, Hospital Revenue Bonds (Series 2008A), 5.00% (UPMC Health System), 6/15/2018 | 3,824,505 |
| 370,000 | | Allegheny County, PA IDA, Lease Revenue Bonds (Series 2006), 5.125% (Residential Resources Inc. Project), 9/1/2031 | 370,426 |
| 2,000,000 | | Allegheny County, PA Port Authority, Special Revenue Transportation Refunding Bonds (Series 2011), 5.00% (Original Issue Yield: 5.20%), 3/1/2026 | 2,317,740 |
| 1,715,000 | | Allegheny County, PA Port Authority, Special Revenue Transportation Refunding Bonds (Series 2011), 5.75%, 3/1/2029 | 2,043,440 |
| 2,000,000 | | Allegheny County, PA, UT GO Refunding Bonds (Series C-76), 5.00%, 11/1/2041 | 2,442,340 |
| 2,250,000 | | Allentown, PA Neighborhood Improvement Zone Development Authority, Tax Revenue Bonds (Series 2012A), 5.00%, 5/1/2035 | 2,470,500 |
| 3,000,000 | | Berks County, PA Municipal Authority, Revenue Bonds (Series 2012A), 5.00% (Reading Hospital & Medical Center), 11/1/2044 | 3,375,300 |
| 2,000,000 | | Bethlehem, PA Authority, GTD Water Revenue Bonds (Series 2014), 5.00% (Bethlehem, PA)/(Build America Mutual Assurance INS), 11/15/2030 | 2,375,420 |
| 1,360,000 | | Bethlehem, PA Authority, GTD Water Revenue Bonds (Series 2014), 5.00% (Bethlehem, PA)/(Build America Mutual Assurance INS), 11/15/2031 | 1,610,906 |
| 1,000,000 | | Canonsburg-Houston Joint Authority, PA, Sewer Revenue Bonds (Series 2015A), 5.00%, 12/1/2040 | 1,190,720 |
| 2,000,000 | | Central Dauphin, PA School District, LT GO Bonds (Series 2016), 4.00% (State Aid Withholding GTD), 2/1/2029 | 2,303,420 |
| 500,000 | | Centre County, PA Hospital Authority, Hospital Revenue Bonds (Series 2016A), 5.00% (Mount Nittany Medical Center), 11/15/2046 | 594,955 |
| 1,000,000 | | Chartiers Valley, PA School District, UT GO Bonds (Series 2015B), 5.00% (State Aid Withholding GTD), 10/15/2040 | 1,199,670 |
| 2,530,000 | | Cheltenham Twp, PA School District, LT GO Bonds (Series 2014), 5.00% (State Aid Withholding GTD), 2/15/2040 | 2,929,386 |
| 2,000,000 | | Chester County, PA HEFA, Revenue Bonds (Series 2006), 5.00% (Devereux Foundation), 11/1/2031 | 2,009,320 |
Annual Shareholder Report
Principal
Amount | | | Value |
| | | MUNICIPAL BONDS—continued | |
| | | Pennsylvania—continued | |
| $1,900,000 | | Chester, PA Water Authority, Water Revenue Bonds (Series 2014), 5.00%, 12/1/2039 | $2,304,092 |
| 2,000,000 | | Clairton Municipal Authority, PA, Sewer Revenue Bonds (Series 2012B), 5.00%, 12/1/2037 | 2,286,320 |
| 1,500,000 | | Clarion County, PA IDA, Water Facility Revenue Refunding Bonds (Series 2009), 5.50% (Pennsylvania American Water Co.), 12/1/2039 | 1,663,845 |
| 2,000,000 | | Commonwealth Financing Authority of PA, Revenue Bonds (Series 2013B), 5.00% (Commonwealth of Pennsylvania), 6/1/2036 | 2,304,340 |
| 2,000,000 | | Commonwealth of Pennsylvania, UT GO Bonds (First Series 2011), 5.00%, 11/15/2030 | 2,339,940 |
| 2,000,000 | | Cumberland County, PA Municipal Authority, Revenue Bonds (Series 2007A), 5.00% (Diakon Lutheran Social Ministries)/(United States Treasury PRF 1/1/2017@100), 1/1/2036 | 2,028,280 |
| 905,000 | | Cumberland County, PA Municipal Authority, Revenue Bonds (Series 2015), 5.00% (Diakon Lutheran Social Ministries), 1/1/2038 | 1,058,633 |
| 1,000,000 | | Cumberland County, PA Municipal Authority, Revenue Bonds (Series 2016), 5.00% (Dickinson College), 5/1/2030 | 1,245,550 |
| 1,000,000 | | Cumberland County, PA Municipal Authority, Revenue Refunding Bonds (Series 2012), 5.25% (Asbury Pennsylvania Obligated Group), 1/1/2041 | 1,071,350 |
| 2,500,000 | | Dauphin County, PA General Authority, Health System Revenue Bonds (Series 2012A), 5.00% (Pinnacle Health System), 6/1/2042 | 2,857,175 |
| 1,000,000 | | Delaware County, PA Authority, Revenue Bonds (Series 2015), 5.00% (Villanova University), 8/1/2045 | 1,205,790 |
| 1,000,000 | | Delaware County, PA IDA, Solid Waste Disposal Revenue Bonds (Series 2015), 5.00% (Covanta Energy Corp.), 7/1/2043 | 1,036,600 |
| 1,250,000 | | Delaware County, PA Regional Water Quality Control Authority, Sewer Revenue Bonds (Series 2015), 5.00%, 5/1/2040 | 1,498,575 |
| 2,350,000 | | Delaware River Port Authority, Revenue Bonds (Series 2010D), 5.00%, 1/1/2028 | 2,637,616 |
| 750,000 | | East Hempfield Township, PA IDA, Revenue & Revenue Refunding Bonds (Series 2016), 5.00% (Willow Valley Retirement Communities), 12/1/2029 | 905,625 |
| 250,000 | | East Hempfield Township, PA IDA, Revenue & Revenue Refunding Bonds (Series 2016), 5.00% (Willow Valley Retirement Communities), 12/1/2039 | 294,093 |
| 1,000,000 | | Erie, PA Higher Education Building Authority, Revenue Bonds (Series 2007 GG3), 5.00% (Gannon University)/(Assured Guaranty Corp. INS), 5/1/2032 | 1,015,320 |
| 1,105,000 | | Erie, PA Water Authority, Revenue Refunding Bonds (Series 2014), 5.00% (AGM INS), 12/1/2034 | 1,335,381 |
| 1,000,000 | | Erie, PA Water Authority, Water Revenue Bonds (Series 2016), 5.00%, 12/1/2043 | 1,212,690 |
| 1,000,000 | | Fulton County, PA IDA, Hospital Revenue Bonds (Series 2016), 5.00% (Fulton County Medical Center), 7/1/2040 | 1,081,430 |
Annual Shareholder Report
Principal
Amount | | | Value |
| | | MUNICIPAL BONDS—continued | |
| | | Pennsylvania—continued | |
| $2,250,000 | | Geisinger Authority, PA Health System, Health System Revenue Bonds (Series 2009A), 5.25% (Geisinger Health System), 6/1/2039 | $2,478,982 |
| 2,260,000 | | Geisinger Authority, PA Health System, Revenue Bonds (Series 2014A), 5.00% (Geisinger Health System), 6/1/2041 | 2,654,008 |
| 2,000,000 | | Harrisburg, PA Authority, Water Revenue Refunding Bonds (Series 2008), 5.25% (Original Issue Yield: 5.35%), 7/15/2031 | 2,082,000 |
| 785,000 | | Lancaster County, PA Hospital Authority, Health Center Revenue Bonds (Series 2015), 5.00% (Masonic Villages), 11/1/2035 | 932,329 |
| 1,000,000 | | Lancaster County, PA Hospital Authority, Health Center Revenue Refunding Bonds (Series 2015A), 5.00% (Landis Homes Retirement Community)/(Original Issue Yield: 5.03%), 7/1/2045 | 1,143,300 |
| 1,215,000 | | Lancaster County, PA Hospital Authority, Health System Revenue Bonds (Series 2012B), 5.00% (Lancaster General Hospital)/(United States Treasury PRF 1/1/2022@100), 7/1/2042 | 1,466,784 |
| 1,000,000 | | Lancaster County, PA Solid Waste Management Authority, GTD Authority Bonds (Series 2013B), 5.00% (Dauphin County, PA GTD), 12/15/2033 | 1,192,780 |
| 2,250,000 | | Lycoming County PA Authority, College Revenue Bonds (Series 2008), 5.50% (Pennsylvania College of Technology)/(United States Treasury PRF 4/1/2018@100), 10/1/2032 | 2,422,350 |
| 2,200,000 | | Lycoming County PA Authority, Revenue Bonds (Series A), 5.75% (Susquehanna Health System)/(Original Issue Yield: 5.90%), 7/1/2039 | 2,487,870 |
| 1,100,000 | | Montgomery County, PA IDA, Retirement Communities Revenue Refunding Bonds (Series 2012), 5.00% (ACTS Retirement Life Communities, Inc.), 11/15/2028 | 1,264,109 |
| 400,000 | | Montgomery County, PA IDA, Retirement Communities Revenue Refunding Bonds (Series 2012), 5.00% (ACTS Retirement Life Communities, Inc.), 11/15/2029 | 458,032 |
| 1,000,000 | | Montgomery County, PA IDA, Revenue Bonds (Series 2016), 5.00% (Foulkeways at Gwynedd), 12/1/2046 | 1,164,260 |
| 1,000,000 | | New Wilmington, PA Municipal Authority, Revenue Bonds (Series 2007GG4), 5.125% (Westminster College)/(Assured Guaranty Corp. INS), 5/1/2033 | 1,022,090 |
| 1,000,000 | | Pennsylvania EDFA, Exempt Facilities Revenue Bonds (Series 2012A), 5.00% (Amtrak), 11/1/2041 | 1,116,570 |
| 1,000,000 | | Pennsylvania EDFA, Exempt Facilities Revenue Refunding Bonds (Series 2014), 5.50% (National Gypsum Co.), 11/1/2044 | 1,123,570 |
| 2,000,000 | | Pennsylvania EDFA, Junior GTD Parking Revenue Bonds (Series 2013B-1), 6.00% (Dauphin County, PA GTD), 7/1/2053 | 2,518,040 |
| 700,000 | | Pennsylvania EDFA, Revenue Bonds (Series 1998A), 5.25% (Northwestern Human Services, Inc.)/(Original Issue Yield: 5.668%), 6/1/2028 | 700,868 |
| 1,500,000 | | Pennsylvania EDFA, Revenue Bonds (Series 2014A), 5.00% (UPMC Health System), 2/1/2045 | 1,757,220 |
Annual Shareholder Report
Principal
Amount | | | Value |
| | | MUNICIPAL BONDS—continued | |
| | | Pennsylvania—continued | |
| $1,000,000 | | Pennsylvania EDFA, Tax-Exempt Private Activity Revenue Bonds (Series 2015), 5.00% (Pennsylvania Rapid Bridge Replacement), 12/31/2038 | $1,179,450 |
| 2,000,000 | | Pennsylvania EDFA, Tax-Exempt Private Activity Revenue Bonds (Series 2015), 5.00% (Pennsylvania Rapid Bridge Replacement), 6/30/2042 | 2,351,400 |
| 2,000,000 | | Pennsylvania EDFA, Water Facilities Revenue Bonds (Series 2009), 6.20% (Pennsylvania American Water Co.), 4/1/2039 | 2,250,200 |
| 2,000,000 | | Pennsylvania EDFA, Water Facilities Revenue Bonds (Series 2009B), 5.00% (Aqua Pennsylvania, Inc.), 11/15/2040 | 2,227,640 |
| 1,500,000 | | Pennsylvania Intergovernmental Cooperation Authority, Special Tax Revenue Refunding Bonds (Series 2009), 5.00%, 6/15/2022 | 1,660,530 |
| 1,000,000 | | Pennsylvania Intergovernmental Cooperation Authority, Special Tax Revenue Refunding Bonds (Series 2010), 5.00%, 6/15/2018 | 1,076,350 |
| 1,020,000 | | Pennsylvania State Higher Education Facilities Authority, 5.125% (Gwynedd-Mercy College)/(Assured Guaranty Corp. INS), 5/1/2032 | 1,046,051 |
| 1,000,000 | | Pennsylvania State Higher Education Facilities Authority, College Revenue Bonds (Series 2007), 5.00% (Bryn Mawr College)/(AMBAC Financial Group, Inc. INS), 12/1/2037 | 1,030,840 |
| 1,000,000 | | Pennsylvania State Higher Education Facilities Authority, Fixed Rate Revenue Bonds (Series 2015A), 5.25% (Thomas Jefferson University), 9/1/2050 | 1,196,720 |
| 2,000,000 | | Pennsylvania State Higher Education Facilities Authority, Revenue Bonds (First Series of 2012), 5.00% (Temple University), 4/1/2035 | 2,329,240 |
| 1,500,000 | | Pennsylvania State Higher Education Facilities Authority, Revenue Bonds (Series 2009), 5.00% (Carnegie Mellon University), 8/1/2021 | 1,649,940 |
| 1,000,000 | | Pennsylvania State Higher Education Facilities Authority, Revenue Bonds (Series 2009A), 5.25% (University of Pennsylvania Health System)/(United States Treasury PRF 8/15/2019@100), 8/15/2022 | 1,131,220 |
| 2,000,000 | | Pennsylvania State Higher Education Facilities Authority, Revenue Bonds (Series 200B), 5.50% (University of Pennsylvania Health System)/(United States Treasury COL)/(Original Issue Yield: 5.65%), 8/15/2018 | 2,184,580 |
| 1,100,000 | | Pennsylvania State Higher Education Facilities Authority, Revenue Bonds (Series 2010), 5.00% (Thomas Jefferson University), 3/1/2040 | 1,217,051 |
| 1,500,000 | | Pennsylvania State Higher Education Facilities Authority, Revenue Bonds (Series 2012A), 5.00% (University of Pennsylvania Health System), 8/15/2042 | 1,717,005 |
| 1,630,000 | | Pennsylvania State Higher Education Facilities Authority, Revenue Bonds (Series 2015), 5.00% (University of the Sciences in Philadelphia), 11/1/2036 | 1,926,774 |
| 1,000,000 | | Pennsylvania State Higher Education Facilities Authority, Revenue Refunding Bonds (Series 2015A), 5.00% (University of Pennsylvania), 10/1/2036 | 1,236,800 |
Annual Shareholder Report
Principal
Amount | | | Value |
| | | MUNICIPAL BONDS—continued | |
| | | Pennsylvania—continued | |
| $2,000,000 | | Pennsylvania State Higher Education Facilities Authority, Student Housing Revenue Bonds, 5.125% (Foundation for Indiana University of Pennsylvania)/(Syncora Guarantee, Inc. INS), 7/1/2039 | $2,003,420 |
| 1,000,000 | | Pennsylvania State Turnpike Commission, Turnpike Revenue Bonds (Series 2011E), 5.00%, 12/1/2030 | 1,166,320 |
| 2,000,000 | | Pennsylvania State Turnpike Commission, Turnpike Subordinate Revenue Bonds (Series 2009B), 5.125% (Original Issue Yield: 5.30%), 12/1/2040 | 2,218,600 |
| 1,000,000 | | Pennsylvania State Turnpike Commission, Turnpike Subordinate Revenue Bonds (Sub-Series B-1 of 2015), 5.00%, 12/1/2045 | 1,166,620 |
| 5,500,000 | | Pennsylvania State Turnpike Commission, Turnpike Subordinate Revenue Refunding Bonds (Second Series of 2016), 5.00%, 6/1/2039 | 6,495,060 |
| 2,000,000 | 1 | Pennsylvania State Turnpike Commission, Variable Rate Subordinate Lien Revenue Bonds (SIFMA Index Bonds) (Series 2015A-2), 1.36%, 12/1/2018 | 1,999,940 |
| 1,430,000 | 1 | Pennsylvania State Turnpike Commission, Variable Rate Turnpike Revenue Bonds (Series 2013B), 1.83%, 12/1/2020 | 1,445,058 |
| 2,440,000 | | Pennsylvania State Turnpike Commission-Motor License Fund Enhanced, Motor License Fund-Enhanced Turnpike Subordinate Special Revenue Bonds (Series 2011A), 5.50% (Original Issue Yield: 5.55%), 12/1/2041 | 2,806,537 |
| 2,000,000 | | Pennsylvania State Turnpike Commission-Motor License Fund Enhanced, Motor License Fund-Enhanced Turnpike Subordinate Special Revenue Bonds (Series 2011A), 6.00%, 12/1/2036 | 2,359,120 |
| 750,000 | | Pennsylvania State University, Revenue Bonds (Series A of 2016), 5.00%, 9/1/2041 | 927,713 |
| 2,000,000 | | Philadelphia, PA Airport System, Airport Revenue Refunding Bonds (Series 2010D), 5.25%, 6/15/2028 | 2,231,180 |
| 1,210,000 | | Philadelphia, PA Authority for Industrial Development, Revenue Bonds (Series 2012), 6.625% (New Foundations Charter School), 12/15/2041 | 1,381,360 |
| 1,600,000 | | Philadelphia, PA Authority for Industrial Development, Senior Living Revenue Bonds (Series 2005A), 5.625% (PresbyHomes Germantown/Morrisville), 7/1/2035 | 1,618,480 |
| 2,350,000 | | Philadelphia, PA Gas Works, Revenue Bonds (Seventh Series 1998 General Ordinance), 5.00% (United States Treasury PRF 10/1/2017@100), 10/1/2037 | 2,462,400 |
| 2,000,000 | | Philadelphia, PA Hospitals & Higher Education Facilities Authority, Hospital Revenue Bonds (Series 2011D), 5.00% (Children's Hospital of Philadelphia), 7/1/2028 | 2,330,240 |
| 1,670,000 | | Philadelphia, PA Hospitals & Higher Education Facilities Authority, Hospital Revenue Bonds (Series 2012A), 5.625% (Temple University Health System Obligated Group)/(Original Issue Yield: 5.875%), 7/1/2042 Philadelphia, PA Hospitals & Higher Education Facilities Authority, | 1,873,473 |
Annual Shareholder Report
Principal
Amount | | | Value |
| | | MUNICIPAL BONDS—continued | |
| | | Pennsylvania—continued | |
| $1,040,000 | | Philadelphia, PA Hospitals & Higher Education Facilities Authority, Hospital Revenue Bonds (Series 2014A), 5.00% (Children's Hospital of Philadelphia), 7/1/2042 | $1,251,775 |
| 5,000 | | Philadelphia, PA School District, LT GO Bonds (Series 2008E), 6.00% (United States Treasury PRF 9/1/2018@100), 9/1/2038 | 5,530 |
| 5,000 | | Philadelphia, PA School District, LT GO Bonds (Series 2008E), 6.00% (United States Treasury PRF 9/1/2018@100)/(Original Issue Yield: 6.30%), 9/1/2038 | 5,530 |
| 40,000 | | Philadelphia, PA School District, LT GO Bonds (Series 2008E), 6.00% (United States Treasury PRF 9/1/2018@100)/(Original Issue Yield: 6.30%), 9/1/2038 | 44,242 |
| 2,000,000 | | Philadelphia, PA Water & Wastewater System, Revenue Refunding Bonds (Series 2012), 5.00%, 11/1/2028 | 2,400,340 |
| 750,000 | | Philadelphia, PA Water & Wastewater System, Water and Wastewater Revenue Bonds (Series 2009A), 5.25% (Original Issue Yield: 5.33%), 1/1/2036 | 817,493 |
| 1,000,000 | | Pittsburgh, PA Public Parking Authority, Parking System Revenue Refunding Bonds (Series 2015A), 5.00%, 12/1/2025 | 1,232,980 |
| 1,035,000 | | Pittsburgh, PA Urban Redevelopment Authority, Tax Allocation, 4.50% (Center Triangle), 5/1/2019 | 1,078,253 |
| 2,000,000 | | Pittsburgh, PA Water & Sewer Authority, Water and Sewer System Revenue Bonds (Series 2008 D-1), 5.00% (AGM INS), 9/1/2025 | 2,158,020 |
| 3,000,000 | | Pittsburgh, PA, UT GO Bonds (Series 2012B), 5.00%, 9/1/2026 | 3,585,750 |
| 1,075,000 | | Reading Area Water Authority, PA, Water Revenue Bonds (Series 2011), 5.00% (Original Issue Yield: 5.08%), 12/1/2031 | 1,257,331 |
| 1,500,000 | | Reading Area Water Authority, PA, Water Revenue Bonds (Series 2011), 5.25% (Original Issue Yield: 5.27%), 12/1/2036 | 1,776,540 |
| 1,000,000 | | South Fork Municipal Authority, PA, Hospital Revenue Bonds (Series 2010), 5.50% (Conemaugh Valley Memorial Hospital)/(United States Treasury PRF 7/1/2020@100)/(Original Issue Yield: 5.72%), 7/1/2029 | 1,174,170 |
| 1,140,000 | | Southcentral PA, General Authority, Revenue Bonds (Series 2014A), 5.00% (Wellspan Health Obligated Group), 6/1/2026 | 1,394,152 |
| 1,000,000 | | Southeastern, PA Transportation Authority, Capital Grant Receipts Bonds (Series 2011), 5.00%, 6/1/2028 | 1,157,390 |
| 1,000,000 | | Southeastern, PA Transportation Authority, Revenue Refunding Bonds (Series 2010), 5.00%, 3/1/2018 | 1,063,070 |
| 2,000,000 | | St. Mary Hospital Authority, PA, Health System Revenue Bonds (Series 2012A), 5.00% (Trinity Healthcare Credit Group), 11/15/2026 | 2,271,500 |
| 1,000,000 | | Union County, PA Higher Educational Facilities Financing Authority, University Revenue Bonds (Series 2012A), 5.00% (Bucknell University), 4/1/2042 | 1,192,250 |
| 1,000,000 | | Union County, PA Higher Educational Facilities Financing Authority, University Revenue Bonds (Series 2015B), 5.00% (Bucknell University), 4/1/2032 | 1,240,860 |
Annual Shareholder Report
Principal
Amount | | | Value |
| | | MUNICIPAL BONDS—continued | |
| | | Pennsylvania—continued | |
| $3,000,000 | | West View, PA Municipal Authority Water Revenue, Revenue Bonds (Series 2014), 5.00%, 11/15/2039 | $3,634,920 |
| 1,685,000 | | Wilkes-Barre, PA Finance Authority, Revenue Bonds (Series 2015A), 5.00% (University of Scranton), 11/1/2033 | 2,012,884 |
| 825,000 | | Wilkes-Barre, PA Finance Authority, Revenue Bonds (Series 2015A), 5.00% (University of Scranton), 11/1/2034 | 983,318 |
| 2,895,000 | | York County, PA, UT GO Bonds (Series 2013), 5.00%, 6/1/2037 | 3,501,734 |
| | | TOTAL | 194,601,812 |
| | | TOTAL MUNICIPAL BONDS
(IDENTIFIED COST $180,680,686) | 194,601,812 |
| | | SHORT-TERM MUNICIPAL—2.1%2 | |
| | | Pennsylvania—2.1% | |
| 4,200,000 | | Philadelphia, PA Hospitals & Higher Education Facilities Authority, (Series 2002-A) Daily VRDNs (Children's Hospital of Philadelphia)/(Wells Fargo Bank, N.A. LIQ), 0.59%, 9/1/2016
(AT NET ASSET VALUE 0) | 4,200,000 |
| | | TOTAL MUNICIPAL INVESTMENTS—98.7%
(IDENTIFIED COST $184,893,526)3 | 198,801,812 |
| | | OTHER ASSETS AND LIABILITIES - NET—1.3%4 | 2,556,851 |
| | | TOTAL NET ASSETS—100% | $201,358,663 |
Securities that are subject to the federal alternative minimum tax (AMT) represent 5.8% of the Fund's portfolio as calculated based upon total market value (unaudited).
| 1 | Floating rate note with current rate and current maturity or next reset date shown. |
| 2 | Current rate and next reset date shown for Variable Rate Demand Notes. |
| 3 | The cost of investments for federal tax purposes amounts to $184,880,688. |
| 4 | Assets, other than investments in securities, less liabilities. See Statement of Assets and Liabilities. |
Note: The categories of investments are shown as a percentage of total net assets at August 31, 2016.
Various inputs are used in determining the value of the Fund's investments. These inputs are summarized in the three broad levels listed below:
Level 1—quoted prices in active markets for identical securities.
Level 2—other significant observable inputs (including quoted prices for similar securities, interest rates, prepayment speeds, credit risk, etc.). Also includes securities valued at amortized cost.
Level 3—significant unobservable inputs (including the Fund's own assumptions in determining the fair value of investments).
The inputs or methodology used for valuing securities are not an indication of the risk associated with investing in those securities.
As of August 31, 2016, all investments of the Fund utilized Level 2 inputs in valuing the Fund's assets carried at fair value.
Annual Shareholder Report
The following acronyms are used throughout this portfolio:
| AGM | —Assured Guaranty Municipal Corp. |
| AMBAC | —American Municipal Bond Assurance Corporation |
| COL | —Collateralized |
| EDFA | —Economic Development Finance Authority |
| GO | —General Obligation |
| GTD | —Guaranteed |
| HDA | —Hospital Development Authority |
| HEFA | —Health and Education Facilities Authority |
| IDA | —Industrial Development Authority |
| INS | —Insured |
| LIQ | —Liquidity Agreement |
| LT | —Limited Tax |
| PRF | —Pre-refunded |
| SIFMA | —Securities Industry and Financial Markets Association |
| UT | —Unlimited Tax |
| VRDNs | —Variable Rate Demand Notes |
See Notes which are an integral part of the Financial Statements
Annual Shareholder Report
Financial Highlights–Class A Shares
(For a Share Outstanding Throughout Each Period)
| Year Ended August 31 | 2016 | 2015 | 2014 | 2013 | 2012 |
| Net Asset Value, Beginning of Period | $10.88 | $10.94 | $10.34 | $11.20 | $10.68 |
| Income From Investment Operations: | | | | | |
| Net investment income | 0.33 | 0.36 | 0.38 | 0.39 | 0.40 |
| Net realized and unrealized gain (loss) on investments, futures contracts and swap contracts | 0.40 | (0.07) | 0.61 | (0.87) | 0.52 |
| TOTAL FROM INVESTMENT OPERATIONS | 0.73 | 0.29 | 0.99 | (0.48) | 0.92 |
| Less Distributions: | | | | | |
| Distributions from net investment income | (0.33) | (0.35) | (0.39) | (0.38) | (0.40) |
| Net Asset Value, End of Period | $11.28 | $10.88 | $10.94 | $10.34 | $11.20 |
| Total Return1 | 6.85% | 2.65% | 9.68% | (4.41)% | 8.80% |
| Ratios to Average Net Assets: | | | | | |
| Net expenses | 0.75%2 | 0.75% | 0.75% | 0.75% | 0.75% |
| Net investment income | 3.01% | 3.25% | 3.60% | 3.50% | 3.63% |
| Expense waiver/reimbursement3 | 0.13% | 0.12% | 0.13% | 0.10% | 0.10% |
| Supplemental Data: | | | | | |
| Net assets, end of period (000 omitted) | $199,403 | $202,057 | $219,307 | $231,890 | $275,974 |
| Portfolio turnover | 14% | 29% | 5% | 7% | 15% |
| 1 | Based on net asset value, which does not reflect the sales charge, redemption fee or contingent deferred sales charge, if applicable. |
| 2 | The Net expense ratio is calculated without reduction for expense offset arrangements. The net expense ratio is 0.75% for the year ended August 31, 2016, after taking into account this expense reduction. |
| 3 | This expense decrease is reflected in both the net expense and net investment income ratios shown above. |
See Notes which are an integral part of the Financial Statements
Annual Shareholder Report
Financial Highlights–Class B Shares
(For a Share Outstanding Throughout Each Period)
| Year Ended August 31 | 2016 | 2015 | 2014 | 2013 | 2012 |
| Net Asset Value, Beginning of Period | $10.89 | $10.95 | $10.34 | $11.20 | $10.68 |
| Income From Investment Operations: | | | | | |
| Net investment income | 0.30 | 0.29 | 0.30 | 0.31 | 0.32 |
| Net realized and unrealized gain (loss) on investments, futures contracts and swap contracts | 0.34 | (0.09) | 0.61 | (0.87) | 0.52 |
| TOTAL FROM INVESTMENT OPERATIONS | 0.64 | 0.20 | 0.91 | (0.56) | 0.84 |
| Less Distributions: | | | | | |
| Distributions from net investment income | (0.25) | (0.26) | (0.30) | (0.30) | (0.32) |
| Net Asset Value, End of Period | $11.28 | $10.89 | $10.95 | $10.34 | $11.20 |
| Total Return1 | 5.93% | 1.87% | 8.93% | (5.15)% | 7.96% |
| Ratios to Average Net Assets: | | | | | |
| Net expenses | 1.52%2 | 1.52% | 1.52% | 1.52% | 1.52% |
| Net investment income | 2.25% | 2.48% | 2.84% | 2.73% | 2.87% |
| Expense waiver/reimbursement3 | 0.11% | 0.10% | 0.11% | 0.08% | 0.08% |
| Supplemental Data: | | | | | |
| Net assets, end of period (000 omitted) | $1,955 | $2,429 | $2,815 | $3,824 | $5,137 |
| Portfolio turnover | 14% | 29% | 5% | 7% | 15% |
| 1 | Based on net asset value, which does not reflect the sales charge, redemption fee or contingent deferred sales charge, if applicable. |
| 2 | The Net expense ratio is calculated without reduction for expense offset arrangements. The net expense ratio is 1.52% for the year ended August 31, 2016, after taking into account this expense reduction. |
| 3 | This expense decrease is reflected in both the net expense and net investment income ratios shown above. |
See Notes which are an integral part of the Financial Statements
Annual Shareholder Report
Statement of Assets and Liabilities
August 31, 2016
| Assets: | | |
| Total investment in securities, at value (identified cost $184,893,526) | | $198,801,812 |
| Cash | | 73,610 |
| Income receivable | | 2,246,681 |
| Receivable for investments sold | | 210,000 |
| Receivable for shares sold | | 142,096 |
| TOTAL ASSETS | | 201,474,199 |
| Liabilities: | | |
| Payable for shares redeemed | $4,316 | |
| Payable for other service fees (Notes 2 and 5) | 44,158 | |
| Payable for portfolio accounting fees | 30,860 | |
| Payable for share registration costs | 14,940 | |
| Payable for transfer agent fee | 12,849 | |
| Payable for investment adviser fee (Note 5) | 1,635 | |
| Payable for distribution services fee (Note 5) | 1,243 | |
| Payable for administrative fee (Note 5) | 430 | |
| Accrued expenses (Note 5) | 5,105 | |
| TOTAL LIABILITIES | | 115,536 |
| Net assets for 17,855,586 shares outstanding | | $201,358,663 |
| Net Assets Consists of: | | |
| Paid-in capital | | $204,375,212 |
| Net unrealized appreciation of investments | | 13,908,286 |
| Accumulated net realized loss on investments and futures contracts | | (17,100,885) |
| Undistributed net investment income | | 176,050 |
| TOTAL NET ASSETS | | $201,358,663 |
| Net Asset Value, Offering Price and Redemption Proceeds Per Share: | | |
| Class A Shares: | | |
| Net asset value per share ($199,403,480 ÷ 17,682,316 shares outstanding), no par value, unlimited shares authorized | | $11.28 |
| Offering price per share (100/95.50 of $11.28) | | $11.81 |
| Redemption proceeds per share | | $11.28 |
| Class B Shares: | | |
| Net asset value per share ($1,955,183 ÷ 173,270 shares outstanding), no par value, unlimited shares authorized | | $11.28 |
| Offering price per share | | $11.28 |
| Redemption proceeds per share (94.50/100 of $11.28) | | $10.66 |
See Notes which are an integral part of the Financial Statements
Annual Shareholder Report
Statement of Operations
Year Ended August 31, 2016
| Investment Income: | | | |
| Interest | | | $7,515,192 |
| Expenses: | | | |
| Investment adviser fee (Note 5) | | $798,428 | |
| Administrative fee (Note 5) | | 156,125 | |
| Custodian fees | | 11,388 | |
| Transfer agent fees | | 98,014 | |
| Directors'/Trustees' fees (Note 5) | | 3,171 | |
| Auditing fees | | 28,105 | |
| Legal fees | | 7,980 | |
| Distribution services fee (Note 5) | | 16,194 | |
| Other service fees (Notes 2 and 5) | | 498,520 | |
| Portfolio accounting fees | | 90,238 | |
| Share registration costs | | 31,080 | |
| Printing and postage | | 25,546 | |
| Miscellaneous (Note 5) | | 7,531 | |
| TOTAL EXPENSES | | 1,772,320 | |
| Waivers, Reimbursement and Reduction: | | | |
| Waiver of investment adviser fee (Note 5) | $(202,783) | | |
| Waiver/reimbursement of other operating expenses (Notes 2 and 5) | (46,075) | | |
| Reduction of custodian fees (Note 6) | (155) | | |
| TOTAL WAIVERS, REIMBURSEMENT AND REDUCTION | | (249,013) | |
| Net expenses | | | 1,523,307 |
| Net investment income | | | 5,991,885 |
| Realized and Unrealized Gain on Investments and Futures Contracts: | | | |
| Net realized gain on investments | | | 134,153 |
| Net realized gain on futures contracts | | | 111,887 |
| Net change in unrealized appreciation of investments | | | 6,854,287 |
| Net change in unrealized depreciation of futures contracts | | | 21,751 |
| Net realized and unrealized gain on investments and futures contracts | | | 7,122,078 |
| Change in net assets resulting from operations | | | $13,113,963 |
See Notes which are an integral part of the Financial Statements
Annual Shareholder Report
Statement of Changes in Net Assets
| Year Ended August 31 | 2016 | 2015 |
| Increase (Decrease) in Net Assets | | |
| Operations: | | |
| Net investment income | $5,991,885 | $6,963,922 |
| Net realized gain on investments and futures contracts | 246,040 | 3,175,116 |
| Net change in unrealized appreciation/depreciation of investments and futures contracts | 6,876,038 | (4,552,902) |
| CHANGE IN NET ASSETS RESULTING FROM OPERATIONS | 13,113,963 | 5,586,136 |
| Distributions to Shareholders: | | |
| Distributions from net investment income | | |
| Class A Shares | (5,952,216) | (6,719,516) |
| Class B Shares | (48,177) | (63,054) |
| CHANGE IN NET ASSETS RESULTING FROM DISTRIBUTIONS TO SHAREHOLDERS | (6,000,393) | (6,782,570) |
| Share Transactions: | | |
| Proceeds from sale of shares | 14,059,901 | 13,477,630 |
| Net asset value of shares issued to shareholders in payment of distributions declared | 4,353,972 | 4,791,702 |
| Cost of shares redeemed | (28,654,766) | (34,708,941) |
| CHANGE IN NET ASSETS RESULTING FROM SHARE TRANSACTIONS | (10,240,893) | (16,439,609) |
| Change in net assets | (3,127,323) | (17,636,043) |
| Net Assets: | | |
| Beginning of period | 204,485,986 | 222,122,029 |
| End of period (including undistributed net investment income of $176,050 and $187,722, respectively) | $201,358,663 | $204,485,986 |
See Notes which are an integral part of the Financial Statements
Annual Shareholder Report
Notes to Financial Statements
August 31, 2016
1. ORGANIZATION
Federated Municipal Securities Income Trust (the “Trust”) is registered under the Investment Company Act of 1940, as amended (the “Act”), as an open-end management investment company. The Trust consists of five portfolios. The financial statements included herein are only those of Federated Pennsylvania Municipal Income Fund (the “Fund”), a non-diversified portfolio. The financial statements of the other portfolios are presented separately. The assets of each portfolio are segregated and a shareholder's interest is limited to the portfolio in which shares are held. Each portfolio pays its own expenses. The Fund offers two classes of shares: Class A Shares and Class B Shares. All shares of the Fund have equal rights with respect to voting, except on class-specific matters. Class B shares were closed to new accounts/investors on June 1, 2015 and to new purchases/exchanges by existing shareholders on August 1, 2015. The investment objective of the Fund is to provide current income exempt from federal regular income tax (federal regular income tax does not include the federal alternative minimum tax (AMT)) and the personal income taxes imposed by the state of Pennsylvania and Pennsylvania municipalities. Interest income from the Fund's investments may be subject to the federal AMT for individuals and corporations.
2. SIGNIFICANT ACCOUNTING POLICIES
The following is a summary of significant accounting policies consistently followed by the Fund in the preparation of its financial statements. These policies are in conformity with U.S. generally accepted accounting principles (GAAP).
Investment Valuation
In calculating its net asset value (NAV), the Fund generally values investments as follows:
| ■ | Fixed-income securities acquired with remaining maturities greater than 60 days are fair valued using price evaluations provided by a pricing service approved by the Fund's Board of Trustees (the “Trustees”). |
| ■ | Fixed-income securities acquired with remaining maturities of 60 days or less are valued at their cost (adjusted for the accretion of any discount or amortization of any premium) unless the issuer's creditworthiness is impaired or other factors indicate that amortized cost is not an accurate estimate of the investment's fair value, in which case it would be valued in the same manner as a longer-term security. |
| ■ | Derivative contracts listed on exchanges are valued at their reported settlement or closing price, except that options are valued at the mean of closing bid and asked quotations. |
| ■ | Over-the-counter (OTC) derivative contracts are fair valued using price evaluations provided by a pricing service approved by the Trustees. |
| ■ | Shares of other mutual funds or non-exchange-traded investment companies are valued based upon their reported NAVs. |
Annual Shareholder Report
| ■ | For securities that are fair valued in accordance with procedures established by and under the general supervision of the Trustees, certain factors may be considered such as: the last traded or purchase price of the security, information obtained by contacting the issuer or dealers, analysis of the issuer's financial statements or other available documents, fundamental analytical data, the nature and duration of restrictions on disposition, the movement of the market in which the security is normally traded, public trading in similar securities or derivative contracts of the issuer or comparable issuers, movement of a relevant index, or other factors including but not limited to industry changes and relevant government actions. |
If any price, quotation, price evaluation or other pricing source is not readily available when the NAV is calculated, or if the Fund cannot obtain price evaluations from a pricing service or from more than one dealer for an investment within a reasonable period of time as set forth in the Fund's valuation policies and procedures, the Fund uses the fair value of the investment determined in accordance with the procedures described below. There can be no assurance that the Fund could obtain the fair value assigned to an investment if it sold the investment at approximately the time at which the Fund determines its NAV per share.
Fair Valuation Procedures
The Trustees have ultimate responsibility for determining the fair value of investments for which market quotations are not readily available. The Trustees have appointed a valuation committee (“Valuation Committee”) comprised of officers of the Fund, Federated Investment Management Company (“Adviser”) and certain of the Adviser's affiliated companies to assist in determining fair value and in overseeing the calculation of the NAV. The Trustees have also authorized the use of pricing services recommended by the Valuation Committee to provide fair value evaluations of the current value of certain investments for purposes of calculating the NAV. The Valuation Committee employs various methods for reviewing third-party pricing-service evaluations including periodic reviews of third-party pricing services' policies, procedures and valuation methods (including key inputs, methods, models and assumptions), transactional back-testing, comparisons of evaluations of different pricing services and review of price challenges by the Adviser based on recent market activity. In the event that market quotations and price evaluations are not available for an investment, the Valuation Committee determines the fair value of the investment in accordance with procedures adopted by the Trustees. The Trustees periodically review and approve the fair valuations made by the Valuation Committee and any changes made to the procedures.
Factors considered by pricing services in evaluating an investment include the yields or prices of investments of comparable quality, coupon, maturity, call rights and other potential prepayments, terms and type, reported transactions, indications as to values from dealers and general market conditions. Some pricing services provide a single price evaluation reflecting the bid-side of the market for an investment (a “bid” evaluation). Other pricing services offer both bid evaluations and price evaluations indicative of a price between the prices bid and asked for the investment (a “mid” evaluation). The Fund normally uses bid evaluations for any U.S. Treasury and Agency securities, mortgage-backed securities and municipal securities. The Fund normally uses mid evaluations for any other types of fixed-income securities and any OTC derivative contracts. In the event that market quotations and price evaluations are not available for an investment, the fair value of the investment is determined in accordance with procedures adopted by the Trustees.
Annual Shareholder Report
Investment Income, Gains and Losses, Expenses and Distributions
Investment transactions are accounted for on a trade-date basis. Realized gains and losses from investment transactions are recorded on an identified-cost basis. Interest income and expenses are accrued daily. Distributions to shareholders are recorded on the ex-dividend date. Distributions of net investment income are declared and paid monthly. Non-cash dividends included in dividend income, if any, are recorded at fair value. Investment income, realized and unrealized gains and losses, and certain fund-level expenses are allocated to each class based on relative average daily net assets, except that Class A Shares and Class B Shares may bear distribution services fees and other services fees unique to those classes. The detail of the total fund expense waivers, reimbursement and reduction of $249,013 is disclosed in various locations in this Note 2, Note 5 and Note 6.
For the year ended August 31, 2016 an unaffiliated third-party waived $7,084 of portfolio accounting fees.
Dividends are declared separately for each class. No class has preferential dividend rights; differences in per share dividend rates are generally due to differences in separate class expenses.
Other Service Fees
The Fund may pay other service fees up to 0.25% of the average daily net assets of the Fund's Class A Shares and Class B Shares to unaffiliated financial intermediaries or to Federated Shareholder Services Company (FSSC) for providing services to shareholders and maintaining shareholder accounts. Subject to the terms described in the Expense Limitation note, FSSC may voluntarily reimburse the Fund for other service fees. For the year ended August 31, 2016, other service fees for the Fund were as follows:
| | Other
Service Fees
Incurred | Other
Service Fees
Reimbursed |
| Class A Shares | $493,122 | $(38,991) |
| Class B Shares | 5,398 | — |
| TOTAL | $498,520 | $(38,991) |
Premium and Discount Amortization
All premiums and discounts on fixed-income securities are amortized/accreted using the effective-interest-rate method.
Federal Taxes
It is the Fund's policy to comply with the Subchapter M provision of the Internal Revenue Code (the “Code”) and to distribute to shareholders each year substantially all of its income. Accordingly, no provision for federal income tax is necessary. As of and during the year ended August 31, 2016, the Fund did not have a liability for any uncertain tax positions. The Fund recognizes interest and penalties, if any, related to tax liabilities as income tax expense in the Statement of Operations. As of August 31, 2016, tax years 2013 through 2016 remain subject to examination by the Fund's major tax jurisdictions, which include the United States of America and the Commonwealth of Massachusetts.
Annual Shareholder Report
When-Issued and Delayed-Delivery Transactions
The Fund may engage in when-issued or delayed-delivery transactions. The Fund records when-issued securities on the trade date and maintains security positions such that sufficient liquid assets will be available to make payment for the securities purchased. Securities purchased on a when-issued or delayed-delivery basis are marked to market daily and begin earning interest on the settlement date. Losses may occur on these transactions due to changes in market conditions or the failure of counterparties to perform under the contract.
Restricted Securities
The Fund may purchase securities which are considered restricted. Restricted securities are securities that either: (a) cannot be offered for public sale without first being registered, or being able to take advantage of an exemption from registration, under the Securities Act of 1933; or (b) are subject to contractual restrictions on public sales. In some cases, when a security cannot be offered for public sale without first being registered, the issuer of the restricted security has agreed to register such securities for resale, at the issuer's expense, either upon demand by the Fund or in connection with another registered offering of the securities. Many such restricted securities may be resold in the secondary market in transactions exempt from registration. Restricted securities may be determined to be liquid under criteria established by the Trustees. The Fund will not incur any registration costs upon such resales. The Fund's restricted securities, like other securities, are priced in accordance with procedures established by and under the general supervision of the Trustees.
Futures Contracts
The Fund purchases and sells financial futures contracts to increase return and to manage duration and yield curve risks. Upon entering into a financial futures contract with a broker, the Fund is required to deposit in a segregated account a specified amount of cash or U.S. government securities which is shown as Restricted Cash in the Statement of Assets and Liabilities. Futures contracts are valued daily and unrealized gains or losses are recorded in a “variation margin” account. Daily, the Fund receives from or pays to the broker a specified amount of cash based upon changes in the variation margin account. When a contract is closed, the Fund recognizes a realized gain or loss. Futures contracts have market risks, including the risk that the change in the value of the contract may not correlate with the changes in the value of the underlying securities. There is minimal counterparty risk to the Fund since futures are exchange traded and the exchange's clearing house, as counterparty to all exchange traded futures, guarantees the futures against default.
At August 31, 2016, the Fund had no outstanding futures contracts.
The average notional value of long futures contracts held by the Fund throughout the period was $8,440,649. This is based on amounts held as of each month-end throughout the fiscal period.
Annual Shareholder Report
The Effect of Derivative Instruments on the Statement of Operations for the Year Ended August 31, 2016
| Amount of Realized Gain or (Loss) on Derivatives Recognized in Income |
| | Futures
Contracts |
| Interest rate contracts | $111,887 |
| Change in Unrealized Appreciation/(Depreciation) on Derivatives Recognized in Income |
| | Futures
Contracts |
| Interest rate contracts | $21,751 |
Other
The preparation of financial statements in conformity with GAAP requires management to make estimates and assumptions that affect the amounts of assets, liabilities, expenses and revenues reported in the financial statements. Actual results could differ from those estimated. The Fund applies Investment Company accounting and reporting guidance.
3. SHARES OF BENEFICIAL INTEREST
The following tables summarize share activity:
| Year Ended August 31 | 2016 | 2015 |
| Class A Shares: | Shares | Amount | Shares | Amount |
| Shares sold | 1,263,328 | $14,059,901 | 1,212,836 | $13,309,209 |
| Shares issued to shareholders in payment of distributions declared | 389,372 | 4,306,360 | 431,501 | 4,730,100 |
| Shares redeemed | (2,539,546) | (28,057,547) | (3,113,219) | (34,105,831) |
| NET CHANGE RESULTING FROM CLASS A SHARE TRANSACTIONS | (886,846) | $(9,691,286) | (1,468,882) | $(16,066,522) |
| Year Ended August 31 | 2016 | 2015 |
| Class B Shares: | Shares | Amount | Shares | Amount |
| Shares sold | — | $— | 15,332 | $168,420 |
| Shares issued to shareholders in payment of distributions declared | 4,307 | 47,612 | 5,616 | 61,603 |
| Shares redeemed | (54,112) | (597,219) | (54,985) | (603,110) |
| NET CHANGE RESULTING FROM CLASS B SHARE TRANSACTIONS | (49,805) | $(549,607) | (34,037) | $(373,087) |
| NET CHANGE RESULTING FROM TOTAL FUND SHARE TRANSACTIONS | (936,651) | $(10,240,893) | (1,502,919) | $(16,439,609) |
4. FEDERAL TAX INFORMATION
The timing and character of income and capital gain distributions are determined in accordance with income tax regulations, which may differ from GAAP. These differences are due to differing treatments for discount accretion/premium amortization on debt securities.
Annual Shareholder Report
For the year ended August 31, 2016, permanent differences identified and reclassified among the components of net assets were as follows:
| Increase (Decrease) |
Undistributed
Net Investment
Income (Loss) | Accumulated
Net Realized
Gain (Loss) |
| $(3,164) | $3,164 |
Net investment income (loss), net realized gains (losses) and net assets were not affected by the reclassification.
The tax character of distributions as reported on the Statement of Changes in Net Assets for the years ended August 31, 2016 and 2015, was as follows:
| | 2016 | 2015 |
| Tax-exempt income | $6,000,393 | $6,782,570 |
As of August 31, 2016, the components of distributable earnings on a tax basis were as follows:
| Undistributed tax-exempt income | $176,050 |
| Net unrealized appreciation | $13,921,124 |
| Capital loss carryforwards | $(17,113,723) |
The difference between book-basis and tax-basis net unrealized appreciation/depreciation is attributable to differing treatments for discount accretion/premium amortization on debt securities.
At August 31, 2016, the cost of investments for federal tax purposes was $184,880,688. The net unrealized appreciation of investments for federal tax purposes excluding any unrealized depreciation was $13,921,124. This consists of net unrealized appreciation from investments for those securities having an excess of value over cost of $13,921,186 and net unrealized depreciation from investments for those securities having an excess of cost over value of $62.
At August 31, 2016, the Fund had a capital loss carryforward of $17,113,723 which will reduce the Fund's taxable income arising from future net realized gains on investments, if any, to the extent permitted by the Code, thereby reducing the amount of distributions to shareholders which would otherwise be necessary to relieve the Fund of any liability for federal income tax. Pursuant to the Code, a net capital loss incurred in taxable years beginning on or before December 22, 2010, is characterized as short-term and may be carried forward for a maximum of eight tax years (“Carryforward Limit”), whereas a net capital loss incurred in taxable years beginning after December 22, 2010, retains its character as either short-term or long-term, does not expire and is required to be utilized prior to the losses which have a Carryforward Limit.
Annual Shareholder Report
The following schedule summarizes the Fund's capital loss carryforwards and expiration years:
| Expiration Year | Short-Term | Long-Term | Total |
| 2017 | $7,258,745 | NA | $7,258,745 |
| 2018 | $9,851,417 | NA | $9,851,417 |
| 2019 | $3,561 | NA | $3,561 |
The Fund used capital loss carryforwards of $267,792 to offset taxable gains realized during the year ended August 31, 2016.
5. INVESTMENT ADVISER FEE AND OTHER TRANSACTIONS WITH AFFILIATES
Investment Adviser Fee
The advisory agreement between the Fund and the Adviser provides for an annual fee equal to 0.40% of the Fund's average daily net assets. Subject to the terms described in the Expense Limitation note, the Adviser may voluntarily choose to waive any portion of its fee. For the year ended August 31, 2016 the Adviser voluntarily waived $202,783 of its fee.
Administrative Fee
Federated Administrative Services (FAS), under the Administrative Services Agreement, provides the Fund with administrative personnel and services. For purposes of determining the appropriate rate breakpoint, “Investment Complex” is defined as all of the Federated Funds subject to a fee under the Administrative Services Agreement. The fee paid to FAS is based on the average daily net assets of the Investment Complex as specified below, plus certain out-of-pocket expenses:
| Administrative Fee | Average Daily Net Assets
of the Investment Complex |
| 0.150% | on the first $5 billion |
| 0.125% | on the next $5 billion |
| 0.100% | on the next $10 billion |
| 0.075% | on assets in excess of $20 billion |
Subject to the terms described in the Expense Limitation note, FAS may voluntarily choose to waive any portion of its fee. For the year ended August 31, 2016, the annualized fee paid to FAS was 0.078% of average daily net assets of the Fund.
Annual Shareholder Report
Distribution Services Fee
The Fund has adopted a Distribution Plan (the “Plan”) pursuant to Rule 12b-1 under the Act. Under the terms of the Plan, the Fund will compensate Federated Securities Corp. (FSC), the principal distributor, from the daily net assets of the Fund's Class A Shares and Class B Shares to finance activities intended to result in the sale of these shares. The Plan provides that the Fund may incur distribution expenses at the following percentages of average daily net assets annually, to compensate FSC:
| Share Class Name | Percentage of Average Daily
Net Assets of Class |
| Class A Shares | 0.05% |
| Class B Shares | 0.75% |
Subject to the terms described in the Expense Limitation note, FSC may voluntarily choose to waive any portion of its fee. For the year ended August 31, 2016, distribution services fees for the Fund were as follows:
| | Distribution
Services Fee
Incurred |
| Class B Shares | $16,194 |
When FSC receives fees, it may pay some or all of them to financial intermediaries whose customers purchase shares. For the year ended August 31, 2016, FSC retained $11,949 of fees paid by the Fund. For the year ended August 31, 2016, the Fund's Class A Shares did not incur a distribution services fee; however it may begin to incur the fee upon approval of the Trustees.
Other Service Fees
For the year ended August 31, 2016, FSSC received $36,230 and reimbursed $38,991 of other service fees disclosed in Note 2.
Sales Charges
Front-end sales charges and contingent deferred sales charges (CDSC) do not represent expenses of the Fund. They are deducted from the proceeds of sales of Fund shares prior to investment or from redemption proceeds prior to remittance, as applicable. For the year ended August 31, 2016, FSC retained $18,755 in sales charges from the sale of Class A Shares. FSC also retained $7,500 and $437 of CDSC relating to redemptions of Class A Shares and Class B Shares, respectively.
Interfund Transactions
During the year ended August 31, 2016, the Fund engaged in purchase and sale transactions with funds that have a common investment adviser (or affiliated investment advisers), common Directors/Trustees, and/or common Officers. These purchase and sale transactions complied with Rule 17a-7 under the Act and amounted to $42,200,000 and $33,100,000, respectively.
Annual Shareholder Report
Expense Limitation
The Adviser and certain of its affiliates (which may include FSC, FAS and FSSC) on their own initiative have agreed to waive certain amounts of their respective fees and/or reimburse expenses. Total annual fund operating expenses (as shown in the financial highlights, excluding interest expense, extraordinary expenses, line of credit expenses and proxy-related expenses paid by the Fund, if any) paid by the Fund's Class A Shares and Class B Shares (after the voluntary waivers and reimbursements) will not exceed 0.75% and 1.52% (the “Fee Limit”), respectively, up to but not including the later of (the “Termination Date”): (a) November 1, 2017; or (b) the date of the Fund's next effective Prospectus. While the Adviser and its applicable affiliates currently do not anticipate terminating or increasing these arrangements prior to the Termination Date, these arrangements may only be terminated or the Fee Limit increased prior to the Termination Date with the agreement of the Trustees.
General
Certain Officers and Trustees of the Fund are Officers and Directors or Trustees of certain of the above companies. To efficiently facilitate payment, Directors/Trustees' fees and certain expenses related to conducting meetings of the Directors/Trustees and other miscellaneous expenses are paid by an affiliate of the Adviser which in due course are reimbursed by the Fund. Such expenses may be included in Accrued and Miscellaneous Expenses on the Statement of Assets and Liabilities and Statement of Operations, respectively.
6. EXPENSE REDUCTION
Through arrangements with the Fund's custodian, net credits realized as a result of uninvested cash balances were used to reduce custody expenses. For the year ended August 31, 2016, the Fund's expenses were reduced by $155 under these arrangements.
7. Investment TRANSACTIONS
Purchases and sales of investments, excluding long-term U.S. government securities and short-term obligations, for the year ended August 31, 2016 were as follows:
| Purchases | $26,978,833 |
| Sales | $36,712,348 |
8. CONCENTRATION OF RISK
Since the Fund invests a substantial portion of its assets in issuers located in one state, it will be more susceptible to factors adversely affecting issuers of that state than would be a comparable tax-exempt mutual fund that invests nationally. In order to reduce the credit risk associated with such factors, at August 31, 2016, 11.8% of the securities in the Portfolio of Investments are backed by letters of credit or bond insurance of various financial institutions and financial guaranty assurance agencies.
Annual Shareholder Report
9. LINE OF CREDIT
The Fund participates with certain other Federated Funds, on a several basis, in an up to $500,000,000 unsecured, 364-day, committed, revolving line of credit (LOC) agreement. The LOC was made available to finance temporarily the repurchase or redemption of shares of the Fund, failed trades, payment of dividends, settlement of trades and for other short-term, temporary or emergency general business purposes. The Fund cannot borrow under the LOC if an inter-fund loan is outstanding. The Fund's ability to borrow under the LOC also is subject to the limitations of the Act and various conditions precedent that must be satisfied before the Fund can borrow. Loans under the LOC are charged interest at a fluctuating rate per annum equal to the highest, on any day, of (a) (i) the federal funds effective rate, (ii) the one month London Interbank Offer Rate (LIBOR), and (iii) 0.0%, plus (b) a margin. The LOC also requires the Fund to pay, quarterly in arrears and at maturity, its pro rata share of a commitment fee based on the amount of the lenders' commitment that has not been utilized. As of August 31, 2016, the Fund had no outstanding loans. During the year ended August 31, 2016, the Fund did not utilize the LOC.
10. INTERFUND LENDING
Pursuant to an Exemptive Order issued by the Securities and Exchange Commission, the Fund, along with other funds advised by subsidiaries of Federated Investors, Inc., may participate in an interfund lending program. This program provides an alternative credit facility allowing the Fund to borrow from other participating affiliated funds. As of August 31, 2016, there were no outstanding loans. During the year ended August 31, 2016, the program was not utilized.
11. FEDERAL TAX INFORMATION (UNAUDITED)
For the fiscal year ended August 31, 2016, 100.00% of distributions from net investment income is exempt from federal income tax, other than the federal AMT.
Annual Shareholder Report
Report of Independent Registered Public Accounting Firm
TO THE BOARD OF TRUSTEES OF federated municipal securities income trust and shareholders of federated Pennsylvania municipal income FUND:
We have audited the accompanying statement of assets and liabilities, including the portfolio of investments, of Federated Pennsylvania Municipal Income Fund (the “Fund”), a portfolio of Federated Municipal Securities Income Trust, as of August 31, 2016, and the related statement of operations for the year then ended, the statements of changes in net assets for each of the years in the two-year period then ended and the financial highlights for each of the years in the five-year period then ended. These financial statements and financial highlights are the responsibility of the Fund's management. Our responsibility is to express an opinion on these financial statements and financial highlights based on our audits.
We conducted our audits in accordance with the standards of the Public Company Accounting Oversight Board (United States). Those standards require that we plan and perform the audit to obtain reasonable assurance about whether the financial statements and financial highlights are free of material misstatement. An audit includes examining, on a test basis, evidence supporting the amounts and disclosures in the financial statements. Our procedures included confirmation of securities owned as of August 31, 2016, by correspondence with the custodian and brokers or by other appropriate auditing procedures. An audit also includes assessing the accounting principles used and significant estimates made by management, as well as evaluating the overall financial statement presentation. We believe that our audits provide a reasonable basis for our opinion.
In our opinion, the financial statements and financial highlights referred to above present fairly, in all material respects, the financial position of Federated Pennsylvania Municipal Income Fund as of August 31, 2016, and the results of its operations for the year then ended, the changes in its net assets for each of the years in the two-year period then ended and the financial highlights for each of the years in the five-year period then ended, in conformity with U.S. generally accepted accounting principles.
Boston, Massachusetts
October 24, 2016
Annual Shareholder Report
Shareholder Expense Example (unaudited)
As a shareholder of the Fund, you incur two types of costs: (1) transaction costs, including sales charges (loads) on purchase or redemption payments; and (2) ongoing costs, including management fees and to the extent applicable, distribution (12b-1) fees and/or other service fees and other Fund expenses. This Example is intended to help you to understand your ongoing costs (in dollars) of investing in the Fund and to compare these costs with the ongoing costs of investing in other mutual funds. It is based on an investment of $1,000 invested at the beginning of the period and held for the entire period from March 1, 2016 to August 31, 2016.
ACTUAL EXPENSES
The first section of the table below provides information about actual account values and actual expenses. You may use the information in this section, together with the amount you invested, to estimate the expenses that you incurred over the period. Simply divide your account value by $1,000 (for example, an $8,600 account value divided by $1,000 = 8.6), then multiply the result by the number in the first section under the heading entitled “Expenses Paid During Period” to estimate the expenses attributable to your investment during this period.
HYPOTHETICAL EXAMPLE FOR COMPARISON PURPOSES
The second section of the table below provides information about hypothetical account values and hypothetical expenses based on the Fund's actual expense ratio and an assumed rate of return of 5% per year before expenses, which is not the Fund's actual return. Thus, you should not use the hypothetical account values and expenses to estimate the actual ending account balance or your expenses for the period. Rather, these figures are required to be provided to enable you to compare the ongoing costs of investing in the Fund with other funds. To do so, compare this 5% hypothetical example with the 5% hypothetical examples that appear in the shareholder reports of the other funds.
Annual Shareholder Report
Please note that the expenses shown in the table are meant to highlight your ongoing costs only and do not reflect any transaction costs, such as sales charges (loads) on purchase or redemption payments. Therefore, the second section of the table is useful in comparing ongoing costs only, and will not help you determine the relative total costs of owning different funds. In addition, if these transaction costs were included, your costs would have been higher.
| | Beginning
Account Value
3/1/2016 | Ending
Account Value
8/31/2016 | Expenses Paid
During Period1 |
| Actual: | | | |
| Class A Shares | $1,000 | $1,039.80 | $3.85 |
| Class B Shares | $1,000 | $1,034.80 | $7.77 |
Hypothetical (assuming a 5% return
before expenses): | | | |
| Class A Shares | $1,000 | $1,021.37 | $3.81 |
| Class B Shares | $1,000 | $1,017.50 | $7.71 |
| 1 | Expenses are equal to the Fund's annualized net expense ratios, multiplied by the average account value over the period, multiplied by 184/366 (to reflect the one-half-year period). The annualized net expense ratios are as follows: |
| | |
| Class A Shares | 0.75% |
| Class B Shares | 1.52% |
Annual Shareholder Report
Board of Trustees and Trust Officers
The Board of Trustees is responsible for managing the Trust's business affairs and for exercising all the Trust's powers except those reserved for the shareholders. The following tables give information about each Trustee and the senior officers of the Fund. Where required, the tables separately list Trustees who are “interested persons” of the Fund (i.e., “Interested” Trustees) and those who are not (i.e., “Independent” Trustees). Unless otherwise noted, the address of each person listed is Federated Investors Tower, 1001 Liberty Avenue, Pittsburgh, PA 15222. The address of all Independent Trustees listed is 4000 Ericsson Drive, Warrendale, PA 15086-7561; Attention: Mutual Fund Board. As of December 31, 2015, the Trust comprised five portfolio(s), and the Federated Fund Family consisted of 38 investment companies (comprising 122 portfolios). Unless otherwise noted, each Officer is elected annually. Unless otherwise noted, each Trustee oversees all portfolios in the Federated Fund Family and serves for an indefinite term. The Fund's Statement of Additional Information includes additional information about Trust Trustees and is available, without charge and upon request, by calling 1-800-341-7400.
Interested TRUSTEES Background
Name
Birth Date
Positions Held with Trust
Date Service Began | Principal Occupation(s) for Past Five Years,
Other Directorships Held and Previous Position(s) |
J. Christopher Donahue*
Birth Date: April 11, 1949
President and Trustee
Indefinite Term
Began serving: August 1990 | Principal Occupations: Principal Executive Officer and President of certain of the Funds in the Federated Fund Family; Director or Trustee of the Funds in the Federated Fund Family; President, Chief Executive Officer and Director, Federated Investors, Inc.; Chairman and Trustee, Federated Investment Management Company; Trustee, Federated Investment Counseling; Chairman and Director, Federated Global Investment Management Corp.; Chairman, Federated Equity Management Company of Pennsylvania and Passport Research, Ltd. (investment advisory subsidiary of Federated); Trustee, Federated Shareholder Services Company; Director, Federated Services Company.
Previous Positions: President, Federated Investment Counseling; President and Chief Executive Officer, Federated Investment Management Company, Federated Global Investment Management Corp. and Passport Research, Ltd. |
Annual Shareholder Report
Name
Birth Date
Positions Held with Trust
Date Service Began | Principal Occupation(s) for Past Five Years,
Other Directorships Held and Previous Position(s) |
John B. Fisher*
Birth Date: May 16, 1956
Trustee Trustee
Indefinite Term
Began serving: May 2016 | Principal Occupations: Principal Executive Officer and President of certain of the Funds in the Federated Fund Family; Director or Trustee of certain of the Funds in the Federated Fund Family; Vice President, Federated Investors, Inc.; President, Director/Trustee and CEO, Federated Advisory Services Company, Federated Equity Management Company of Pennsylvania, Federated Global Investment Management Corp., Federated Investment Counseling, Federated Investment Management Company; President and CEO of Passport Research, Ltd.; President of some of the Funds in the Federated Fund Complex and Director, Federated Investors Trust Company.
Previous Positions: President and Director of the Institutional Sales Division of Federated Securities Corp.; President and Director of Federated Investment Counseling; Director, Edgewood Securities Corp.; Director, Federated Services Company; Director, Federated Investors, Inc.; Chairman and Director, Southpointe Distribution Services, Inc. and President, Technology, Federated Services Company. |
| * | Reasons for “interested” status: J. Christopher Donahue and John B. Fisher are interested due to their beneficial ownership of shares of Federated Investors, Inc. and due to positions they hold with Federated and its subsidiaries. J. Christopher Donahue is the son of John F. Donahue, Chairman Emeritus of the Federated Funds. |
INDEPENDENT TRUSTEES Background
Name
Birth Date
Positions Held with Trust
Date Service Began | Principal Occupation(s) for Past Five Years,
Other Directorships Held, Previous Position(s) and Qualifications |
John T. Collins
Birth Date: January 24, 1947
Trustee
Indefinite Term
Began serving: October 2013 | Principal Occupations: Director or Trustee of the Federated Fund Family; Retired.
Other Directorships Held: Director, Chair of the Compensation Committee, Audit Committee member, KLX Corp.
Qualifications: Mr. Collins has served in several business and financial management roles and directorship positions throughout his career. Mr. Collins previously served as Chairman and CEO, The Collins Group, Inc. (a private equity firm). Mr. Collins serves as Chairman Emeriti, Bentley University. Mr. Collins previously served as Director, FleetBoston Financial Corp.; Director and Audit Committee Member, Bank of America Corp. and Director, Beth Israel Deaconess Medical Center (Harvard University Affiliate Hospital). |
Annual Shareholder Report
Name
Birth Date
Positions Held with Trust
Date Service Began | Principal Occupation(s) for Past Five Years,
Other Directorships Held, Previous Position(s) and Qualifications |
G. Thomas Hough
Birth Date: February 28, 1955
Trustee
Indefinite Term
Began serving: August 2015 | Principal Occupations: Director or Trustee of the Federated Fund Family; Retired.
Other Directorships Held: Director, Chair of the Audit Committee, Governance Committee, Publix Super Markets, Inc.; Director, Equifax, Inc.
Qualifications: Mr. Hough has served in accounting, business management and directorship positions throughout his career. Mr. Hough most recently held the position of Americas Vice Chair of Assurance with Ernst & Young LLP. Mr. Hough is an Executive Committee member of the United States Golf Association, he serves on the President's Cabinet and Business School Board of Visitors for the University of Alabama and is on the Business School Board of Visitors for Wake Forest University. |
Maureen Lally-Green
Birth Date: July 5, 1949
Trustee
Indefinite Term
Began serving: August 2009 | Principal Occupations: Director or Trustee of the Federated Fund Family; Interim Dean of the Duquesne University School of Law; Adjunct Professor of Law, Duquesne University School of Law.
Other Directorships Held: Director, CONSOL Energy Inc.
Qualifications: Judge Lally-Green has served in various legal and business roles and directorship positions throughout her career. Judge Lally-Green previously served as: Associate General Secretary, Diocese of Pittsburgh; a member of the Superior Court of Pennsylvania; and as a Professor of Law, Duquesne University School of Law. Judge Lally-Green also holds the positions on either a public or not for profit Board of Directors as follows: Member, Pennsylvania State Board of Education (public); Director and Chair, UPMC Mercy Hospital; Regent, St. Vincent Seminary; Director and Vice Chair, Our Campaign for the Church Alive!, Inc.; Director, Saint Vincent College; and Director and Chair, Cardinal Wuerl North Catholic High School, Inc. Judge Lally-Green has held the positions of: Director, Auberle; Director, Ireland Institute of Pittsburgh; Director, Saint Thomas More Society; and Director, Catholic High Schools of the Diocese of Pittsburgh, Inc. |
Peter E. Madden
Birth Date: March 16, 1942
Trustee
Indefinite Term
Began serving: August 1991 | Principal Occupation: Director or Trustee, and Chair of the Board of Directors or Trustees, of the Federated Fund Family; Retired.
Other Directorships Held: None.
Qualifications: Mr. Madden has served in several business management, mutual fund services and directorship positions throughout his career. Mr. Madden previously served as President, Chief Operating Officer and Director, State Street Bank and Trust Company (custodian bank) and State Street Corporation (financial services). He was Director, VISA USA and VISA International and Chairman and Director, Massachusetts Bankers Association. Mr. Madden served as Director, Depository Trust Corporation and Director, The Boston Stock Exchange. Mr. Madden also served as a Representative to the Commonwealth of Massachusetts General Court. |
Annual Shareholder Report
Name
Birth Date
Positions Held with Trust
Date Service Began | Principal Occupation(s) for Past Five Years,
Other Directorships Held, Previous Position(s) and Qualifications |
Charles F. Mansfield, Jr.
Birth Date: April 10, 1945
Trustee
Indefinite Term
Began serving: January 1999 | Principal Occupations: Director or Trustee of the Federated Fund Family; Management Consultant.
Other Directorships Held: None.
Qualifications: Mr. Mansfield has served in several banking, business management and educational roles and directorship positions throughout his career. Mr. Mansfield previously served as Chief Executive Officer, PBTC International Bank; Partner, Arthur Young & Company (now Ernst & Young LLP); Chief Financial Officer of Retail Banking Sector, Chase Manhattan Bank; Senior Vice President, HSBC Bank USA (formerly, Marine Midland Bank); Vice President, Citibank; Assistant Professor of Banking and Finance, Frank G. Zarb School of Business, Hofstra University; Executive Vice President DVC Group, Inc. (marketing, communications and technology). |
Thomas M. O'Neill
Birth Date: June 14, 1951
Trustee
Indefinite Term
Began serving: August 2006 | Principal Occupations: Director or Trustee, Chair of the Audit Committee of the Federated Fund Family; Sole Proprietor, Navigator Management Company (investment and strategic consulting).
Other Directorships Held: None.
Qualifications: Mr. O'Neill has served in several business, mutual fund and financial management roles and directorship positions throughout his career. Mr. O'Neill serves as Director, Medicines for Humanity and Director, The Golisano Children's Museum of Naples, Florida. Mr. O'Neill previously served as Chief Executive Officer and President, Managing Director and Chief Investment Officer, Fleet Investment Advisors; President and Chief Executive Officer, Aeltus Investment Management, Inc.; General Partner, Hellman, Jordan Management Co., Boston, MA; Chief Investment Officer, The Putnam Companies, Boston, MA; Credit Analyst and Lending Officer, Fleet Bank; Director and Consultant, EZE Castle Software (investment order management software); and Director, Midway Pacific (lumber). |
P. Jerome Richey
Birth Date: February 23, 1949
Trustee
Indefinite Term
Began serving: October 2013 | Principal Occupations: Director or Trustee of the Federated Fund Family; Management Consultant.
Other Directorships Held: None.
Qualifications: Mr. Richey has served in several business and legal management roles and directorship positions throughout his career. Mr. Richey most recently held the positions of Senior Vice Chancellor and Chief Legal Officer, University of Pittsburgh. Mr. Richey serves as Board Member, Epilepsy Foundation of Western Pennsylvania and Board member, World Affairs Council of Pittsburgh. Mr. Richey previously served as Chief Legal Officer and Executive Vice President, CONSOL Energy Inc. and Shareholder, Buchanan Ingersoll & Rooney PC (a law firm). |
Annual Shareholder Report
Name
Birth Date
Positions Held with Trust
Date Service Began | Principal Occupation(s) for Past Five Years,
Other Directorships Held, Previous Position(s) and Qualifications |
John S. Walsh
Birth Date: November 28, 1957
Trustee
Indefinite Term
Began serving: June 1999 | Principal Occupations: Director or Trustee of the Federated Fund Family; President and Director, Heat Wagon, Inc. (manufacturer of construction temporary heaters); President and Director, Manufacturers Products, Inc. (distributor of portable construction heaters); President, Portable Heater Parts, a division of Manufacturers Products, Inc.
Other Directorships Held: None.
Qualifications: Mr. Walsh has served in several business management roles and directorship positions throughout his career. Mr. Walsh previously served as Vice President, Walsh & Kelly, Inc. (paving contractors). |
OFFICERS
Name
Birth Date
Positions Held with Trust
Date Service Began | Principal Occupation(s) for Past Five Years
and Previous Position(s) |
John W. McGonigle
Birth Date: October 26, 1938
EXECUTIVE VICE PRESIDENT AND SECRETARY
Officer since: August 1990 | Principal Occupations: Executive Vice President and Secretary of the Federated Fund Family; Vice Chairman, Executive Vice President, Secretary and Director, Federated Investors, Inc.
Previous Positions: Trustee, Federated Investment Management Company and Federated Investment Counseling; Director, Federated Global Investment Management Corp., Federated Services Company and Federated Securities Corp. |
Lori A. Hensler
Birth Date: January 6, 1967
TREASURER
Officer since: April 2013 | Principal Occupations: Principal Financial Officer and Treasurer of the Federated Fund Family; Senior Vice President, Federated Administrative Services; Financial and Operations Principal for Federated Securities Corp. and Edgewood Services, Inc.; and Assistant Treasurer, Federated Investors Trust Company. Ms. Hensler has received the Certified Public Accountant designation.
Previous Positions: Controller of Federated Investors, Inc.; Senior Vice President and Assistant Treasurer, Federated Investors Management Company; Treasurer, Federated Investors Trust Company; Assistant Treasurer, Federated Administrative Services, Federated Administrative Services, Inc., Federated Securities Corp., Edgewood Services, Inc., Federated Advisory Services Company, Federated Equity Management Company of Pennsylvania, Federated Global Investment Management Corp., Federated Investment Counseling, Federated Investment Management Company, Passport Research, Ltd., and Federated MDTA, LLC; Financial and Operations Principal for Federated Securities Corp., Edgewood Services, Inc. and Southpointe Distribution Services, Inc. |
Annual Shareholder Report
Name
Birth Date
Positions Held with Trust
Date Service Began | Principal Occupation(s) for Past Five Years
and Previous Position(s) |
Richard B. Fisher
Birth Date: May 17, 1923
VICE CHAIRMAN
Officer since: August 2002 | Principal Occupations: Vice Chairman or Vice President of some of the Funds in the Federated Fund Family; Vice Chairman, Federated Investors, Inc.; Chairman, Federated Securities Corp.
Previous Positions: President and Director or Trustee of some of the Funds in the Federated Fund Family; Executive Vice President, Federated Investors, Inc.; Director and Chief Executive Officer, Federated Securities Corp. |
Peter J. Germain
Birth Date: September 3, 1959
CHIEF LEGAL OFFICER
Officer since: January 2005 | Principal Occupations: Mr. Germain is Chief Legal Officer of the Federated Fund Family. He is General Counsel and Vice President, Federated Investors, Inc.; President, Federated Administrative Services and Federated Administrative Services, Inc.; Vice President, Federated Securities Corp.; Secretary, Federated Private Asset Management, Inc.; and Secretary, Retirement Plan Service Company of America. Mr. Germain joined Federated in 1984 and is a member of the Pennsylvania Bar Association.
Previous Positions: Deputy General Counsel, Special Counsel, Managing Director of Mutual Fund Services, Federated Investors, Inc.; Senior Vice President, Federated Services Company; and Senior Corporate Counsel, Federated Investors, Inc. |
Stephen Van Meter
Birth Date: June 5, 1975
CHIEF COMPLIANCE OFFICER AND SENIOR VICE PRESIDENT
Officer since: July 2015 | Principal Occupations: Senior Vice President and Chief Compliance Officer of the Federated Fund Family; Vice President and Chief Compliance Officer of Federated Investors, Inc. and Chief Compliance Officer of certain of its subsidiaries. Mr. Van Meter joined Federated in October 2011. He holds FINRA licenses under Series 3, 7, 24 and 66.
Previous Positions: Mr. Van Meter previously held the position of Compliance Operating Officer, Federated Investors, Inc. Prior to joining Federated, Mr. Van Meter served at the United States Securities and Exchange Commission in the positions of Senior Counsel, Office of Chief Counsel, Division of Investment Management and Senior Counsel, Division of Enforcement. |
Robert J. Ostrowski
Birth Date: April 26, 1963
Chief Investment Officer
Officer since: February 2010 | Principal Occupations: Robert J. Ostrowski joined Federated in 1987 as an Investment Analyst and became a Portfolio Manager in 1990. He was named Chief Investment Officer of Federated's taxable fixed-income products in 2004 and also serves as a Senior Portfolio Manager. Mr. Ostrowski became an Executive Vice President of the Fund's Adviser in 2009 and served as a Senior Vice President of the Fund's Adviser from 1997 to 2009. Mr. Ostrowski has received the Chartered Financial Analyst designation. He received his M.S. in Industrial Administration from Carnegie Mellon University. |
Annual Shareholder Report
Evaluation and Approval of Advisory Contract–May 2016
Federated Pennsylvania Municipal Income Fund (the “Fund”)
Following a review and recommendation of approval by the Fund's independent trustees, the Fund's Board of Trustees (the “Board”) reviewed and unanimously approved at its May 2016 meetings the continuation of the Fund's investment advisory contract for an additional one-year term. The Board's decision regarding the contract reflects the exercise of its business judgment after consideration of all of the information received on whether to continue the existing arrangements.
The Board had previously appointed a Senior Officer, whose duties include specified responsibilities relating to the process by which advisory fees are to be charged to a Federated fund. The Senior Officer has the authority to retain consultants, experts, or staff as may be reasonably necessary to assist in the performance of his duties, reports directly to the Board, and may be terminated only with the approval of a majority of the independent members of the Board. The Senior Officer prepared and furnished to the Board an independent, written evaluation that covered topics discussed below (the “Senior Officer's Evaluation”). The Board considered the Senior Officer's Evaluation, along with other information, in deciding to approve the investment advisory contract.
The Board is also familiar with and considered judicial decisions concerning allegedly excessive investment advisory fees, which have indicated that the following factors may be relevant to an adviser's fiduciary duty with respect to its receipt of compensation from a fund: the nature and quality of the services provided by an adviser to a fund and its shareholders, including the performance and fees and expenses of the fund and of comparable funds; an adviser's cost of providing the services, including the profitability to an adviser of providing advisory services to a fund; the extent to which an adviser may realize “economies of scale” as a fund grows larger and, if such economies of scale exist, whether they have been shared with a fund and its shareholders or the family of funds; any “fall-out financial benefits” that accrue to an adviser because of its relationship with a fund (including research services received from brokers that execute fund trades and any fees paid to affiliates of an adviser for services rendered to a fund); comparative fee and expense structures, including a comparison of fees paid to an adviser with those paid by similar funds; and the extent of care, conscientiousness and independence with which board members perform their duties and their expertise, including whether they are fully informed about all facts the board deems relevant to its consideration of an adviser's services and fees. The Board noted that the Securities and Exchange Commission (“SEC”) disclosure requirements regarding the basis for the Board's approval of the Fund's investment advisory contract generally track the factors listed above. Consistent with these judicial decisions and SEC disclosure requirements, the Board also considered management fees charged to
Annual Shareholder Report
institutional and other clients of Federated Investment Management Company (the “Adviser”) for what might be viewed as like services. The Board was aware of these factors and was guided by them in its review of the Fund's investment advisory contract to the extent it considered them to be appropriate and relevant, as discussed further below.
The Board considered and weighed these circumstances in light of its substantial accumulated experience in governing the Fund and working with Federated Investors, Inc. and its affiliates (“Federated”) on matters relating to the Federated funds, and was assisted in its deliberations by independent legal counsel. Throughout the year, and in connection with its May meetings, the Board requested and received substantial and detailed information about the Fund and the Federated organization that was in addition to the extensive materials that comprise and accompany the Senior Officer's Evaluation. Federated provided much of this information at each regular meeting of the Board, and furnished additional substantial information in connection with the May meetings at which the Board's formal review of the investment advisory contract occurred. At the May meetings in addition to meeting in separate sessions of the independent trustees without management present, senior management of the Adviser also met with the independent trustees and their counsel to discuss the materials presented and any other matters thought relevant by the Adviser or the trustees. Between regularly scheduled meetings, the Board also received information on particular matters as the need arose. Thus, the Board's consideration of the investment advisory contract included review of the Senior Officer's Evaluation, accompanying data and additional information covering such matters as: the Adviser's investment philosophy, revenue, profitability, personnel and processes; investment and operating strategies; the Fund's short- and long-term performance (in absolute terms, both on a gross basis and net of expenses, as well as in relationship to its particular investment program and certain competitor or “peer group” funds and/or other benchmarks, as appropriate), and comments on the reasons for performance; the Fund's investment objectives; the Fund's expenses (including the advisory fee itself and the overall expense structure of the Fund, both in absolute terms and relative to similar and/or competing funds, with due regard for contractual or voluntary expense limitations); the use and allocation of brokerage commissions derived from trading the Fund's portfolio securities (if any); and the nature, quality and extent of the advisory and other services provided to the Fund by the Adviser and its affiliates. The Board also considered the preferences and expectations of Fund shareholders; the entrepreneurial risk assumed by the Adviser in sponsoring the Fund; the continuing state of competition in the mutual fund industry and market practices; the range of comparable fees for similar funds in the mutual fund industry; the Fund's relationship to the Federated funds which include a comprehensive array of funds with different investment objectives, policies and strategies which are generally available for exchange without the incurrence of additional sales charges; compliance and
Annual Shareholder Report
audit reports concerning the Federated funds and the Federated companies that service them (including communications from regulatory agencies), as well as Federated's responses to any issues raised therein; and relevant developments in the mutual fund industry and how the Federated funds and/or Federated are responding to them. The Board's evaluation process is evolutionary. The criteria considered and the emphasis placed on relevant criteria change in recognition of changing circumstances in the mutual fund marketplace.
While mindful that courts have cautioned against giving such comparisons too much weight, the Board has found the use of comparisons of the Fund's fees and expenses to other mutual funds with comparable investment programs to be relevant to its deliberations. In this regard, the Board was presented with, and considered, information regarding the contractual advisory fee rates, net advisory fee rates, total expense ratios and each element of the Fund's total expense ratio (i.e., gross and net advisory fees, custody fees, portfolio accounting fees and transfer agency fees) relative to the Fund's peers. The Board focused on comparisons with other similar mutual funds more heavily than non-mutual fund products or services because it is believed that they are more relevant. For example, other mutual funds are the products most like the Fund, they are readily available to Fund shareholders as alternative investment vehicles, and they are the type of investment vehicle in fact chosen and maintained by the Fund's investors. The range of their fees and expenses therefore appears to be a relevant indicator of what consumers have found to be reasonable in the precise marketplace in which the Fund competes.
The Board reviewed the contractual advisory fee rate, net advisory fee rate where partially waived and other expenses of the Fund and noted the position of the Fund's fee rates relative to its peers. In this regard, the Board noted that the contractual advisory fee rate was below the median of the relevant peer group and the Board was satisfied that the overall expense structure of the Fund remained competitive.
By contrast, the Senior Officer has reviewed Federated's fees for providing advisory services to products outside the Federated funds (e.g., institutional and separate accounts and sub-adviser services). He concluded that mutual funds and institutional accounts are inherently different products. Those differences include, but are not limited to, different types of targeted investors; being subject to different laws and regulations; different legal structures; different average account sizes and portfolio management techniques made necessary by different cash flows and different associated costs; and the time spent by portfolio managers and their teams, funds financial services, legal, compliance and risk management in reviewing securities pricing, addressing different administrative responsibilities, addressing different degrees of risk associated with management and a variety of different costs. The Senior Officer did not consider the fees for providing advisory services to these outside products to be determinative in judging the appropriateness of mutual fund advisory fees.
Annual Shareholder Report
Following such evaluation, the Board concluded, within the context of its full deliberations, that the expenses of the Fund are reasonable and supported renewal of the investment advisory contract with respect to the Fund.
The Board considered the nature, extent and quality of the services provided to the Fund by the Adviser and the resources of the Adviser and its affiliates dedicated to the Fund. In this regard, the Board evaluated, among other things, the Adviser's personnel, experience, track record, overall reputation and willingness to invest in personnel and infrastructure that benefit the Fund. In addition, the Board reviewed the qualifications, backgrounds and responsibilities of the portfolio management team primarily responsible for the day-to-day management of the Fund. The Board noted the compliance programs of and the compliance-related resources provided to the Fund by the Adviser. The Fund's ability to deliver competitive performance when compared to its peer group was also deemed to be relevant by the Board as a useful indicator of how the Adviser is executing the Fund's investment program, which in turn was one of the Board's considerations in reaching a conclusion that the nature, extent, and quality of the Adviser's investment management services were such as to warrant continuation of the investment advisory contract.
In evaluating the Fund's investment performance, the Board considered performance results in light of the Fund's investment objective, strategies and risks, as disclosed in the Fund's prospectus. The Board particularly considered detailed investment reports on the Fund's performance provided to the Board throughout the year and in connection with the May meetings. The Senior Officer also reviewed information compiled by Federated, using data supplied by independent fund ranking organizations, regarding the performance of, and fees charged by, other mutual funds, noting his view that comparisons to fund peer groups may be helpful, though not conclusive, in judging the reasonableness of the proposed fees. The Board considered, in evaluating such comparisons, that in some cases individual funds may exhibit significant and unique differences in their objectives and management techniques when compared to other funds within an industry peer group.
The Fund's performance fell below the median of the relevant peer group for the one-year, three-year and five-year periods covered by the Senior Officer's Evaluation. The Board discussed the Fund's performance with the Adviser and recognized the efforts being taken by the Adviser in the context of the other factors considered relevant by the Board.
Following such evaluation, the Board concluded, within the context of its full deliberations, that the performance of the Fund supported renewal of the investment advisory contract with respect to the Fund.
The Board also received financial information about Federated, including information regarding the compensation and ancillary (or “fall-out”) benefits Federated derived from its relationships with the Federated funds. This information covered not only the fees under the investment advisory contracts, but also fees received by Federated's subsidiaries for providing other services to
Annual Shareholder Report
the Federated funds under separate contracts (e.g., for serving as the Federated funds' administrator). The information also detailed any indirect benefit Federated may derive from its receipt of research services from brokers who execute Federated fund trades. In addition, the Board considered the fact that, in order for a fund to be competitive in the marketplace, Federated and its affiliates frequently waived fees and/or reimbursed expenses and have disclosed to fund investors and/or indicated to the Board their intention to do so in the future, where appropriate. Moreover, the Board receives regular reporting as to the institution, adjustment or elimination of these voluntary waivers. The Board considered Federated's previous reductions in contractual management fees to certain funds in response to the Senior Officer's recommendations.
Federated furnished information, requested by the Senior Officer, that reported revenues on a fund-by-fund basis and made estimates of the allocation of expenses on a fund-by-fund basis, using allocation methodologies specified by the Senior Officer. The Senior Officer noted that, while these cost allocation reports apply consistent allocation processes, the inherent difficulties in allocating costs continues to cause the Senior Officer to question the precision of the process and to conclude that such reports may be unreliable, since a single change in an allocation estimate may dramatically alter the resulting estimate of cost and/or profitability of a fund and may produce unintended consequences. The allocation information, including the Senior Officer's view that fund-by-fund estimations may be unreliable, was considered in the analysis by the Board.
The Board and the Senior Officer also reviewed information compiled by Federated comparing profitability information for Federated to other publicly held fund management companies. In this regard, the Senior Officer concluded that Federated's profit margins did not appear to be excessive. The Senior Officer also noted that Federated appeared financially sound, with the resources to fulfill its obligations under its contracts with the Fund.
The Senior Officer's Evaluation also discussed the notion of possible realization of “economies of scale” as a fund grows larger. The Board considered in this regard that the Adviser has made significant and long-term investments in areas that support all of the Federated funds, such as personnel and processes for the portfolio management, shareholder services, compliance, internal audit, and risk management functions, as well as systems technology (including technology relating to cybersecurity), and that the benefits of these efforts (as well as any economies of scale, should they exist) were likely to be enjoyed by the fund family as a whole. The Board noted that the Adviser's investments in these areas are extensive. In addition, the Board considered that Federated and its affiliates have frequently waived fees and/or reimbursed expenses and that this has allowed fund shareholders to share potential economies of scale from a fund's inception. Federated, as it does throughout the year, and again in connection with the Board's review, furnished information relative to revenue sharing or adviser paid fees. Federated and the Senior Officer noted that this information should be viewed to determine if there was an incentive to either not apply
Annual Shareholder Report
breakpoints or to apply breakpoints at higher levels and should not be viewed to determine the appropriateness of advisory fees, because it would represent marketing and distribution expenses. Finally, the Board also noted the absence of any applicable regulatory or industry guidelines on this subject, which (as discussed in the Senior Officer's Evaluation) is compounded by the lack of any common industry practice or general pattern with respect to structuring fund advisory fees with “breakpoints” that serve to reduce the fee as a fund attains a certain size.
The Senior Officer noted that, subject to the comments and recommendations made within the Senior Officer's Evaluation, his observations and the information accompanying the Senior Officer's Evaluation supported a finding by the Board that the management fee for the fund was reasonable. Under these circumstances, no changes were recommended to, and no objection was raised to, the continuation of the Fund's investment advisory contract.
In its decision to continue an existing investment advisory contract, the Board was mindful of the potential disruptions of the Fund's operations and various risks, uncertainties and other effects that could occur as a result of a decision to terminate or not renew an investment advisory contract. In particular, the Board recognized that many shareholders have invested in the Fund on the strength of the Adviser's industry standing and reputation and with the expectation that the Adviser will have a continuing role in providing advisory services to the Fund. Thus, the Board's approval of the investment advisory contract reflected the fact that it is the shareholders who have effectively selected the Adviser by virtue of having invested in the Fund. The Board concluded that, in light of the factors discussed above, including the nature, quality and scope of the services provided to the Fund by the Adviser and its affiliates, continuation of the investment advisory contract was appropriate.
The Board based its decision to approve the investment advisory contract on the totality of the circumstances and relevant factors and with a view to past and future long-term considerations. Not all of the factors and considerations identified above were necessarily relevant to the Fund, nor did the Board consider any one of them to be determinative. With respect to the factors that were relevant, the Board's decision to approve the continuation of the contract reflects its determination that Federated's performance and actions provided a satisfactory basis to support the decision to continue the existing arrangement.
Annual Shareholder Report
Voting Proxies on Fund Portfolio Securities
A description of the policies and procedures that the Fund uses to determine how to vote proxies, if any, relating to securities held in the Fund's portfolio is available, without charge and upon request, by calling 1-800-341-7400. A report on “Form N-PX” of how the Fund voted any such proxies during the most recent 12-month period ended June 30 is available via the Proxy Voting Record (Form N-PX) link associated with the Fund and share class name at www.FederatedInvestors.com/FundInformation. Form N-PX filings are also available at the SEC's website at www.sec.gov.
Quarterly Portfolio Schedule
The Fund files with the SEC a complete schedule of its portfolio holdings, as of the close of the first and third quarters of its fiscal year, on “Form N-Q.” These filings are available on the SEC's website at www.sec.gov and may be reviewed and copied at the SEC's Public Reference Room in Washington, DC. (Call 1-800-SEC-0330 for information on the operation of the Public Reference Room.) You may also access this information via the link to the Fund and share class name at www.FederatedInvestors.com/FundInformation.
Annual Shareholder Report
Mutual funds are not bank deposits or obligations, are not guaranteed by any bank and are not insured or guaranteed by the U.S. government, the Federal Deposit Insurance Corporation, the Federal Reserve Board or any other government agency. Investment in mutual funds involves investment risk, including the possible loss of principal.
This Report is authorized for distribution to prospective investors only when preceded or accompanied by the Trust's Prospectus, which contains facts concerning its objective and policies, management fees, expenses and other information.
Federated Pennsylvania Municipal Income Fund
Federated Investors Funds
4000 Ericsson Drive
Warrendale, PA 15086-7561
Contact us at FederatedInvestors.com
or call 1-800-341-7400.
Federated Securities Corp., Distributor
CUSIP 313923708
CUSIP 313923807
28995 (10/16)
Federated is a registered trademark of Federated Investors, Inc.
2016 ©Federated Investors, Inc.
Item 2. Code of Ethics
(a) As of the end of the period covered by this report, the registrant has adopted a code of ethics (the "Section 406 Standards for Investment Companies - Ethical Standards for Principal Executive and Financial Officers") that applies to the registrant's Principal Executive Officer and Principal Financial Officer; the registrant's Principal Financial Officer also serves as the Principal Accounting Officer.
(c) There was no amendment to the registrant’s code of ethics described in Item 2(a) above during the period covered by the report.
(d) There was no waiver granted, either actual or implicit, from a provision to the registrant’s code of ethics described in Item 2(a) above during the period covered by the report.
(e) Not Applicable
(f)(3) The registrant hereby undertakes to provide any person, without charge, upon request, a copy of the code of ethics. To request a copy of the code of ethics, contact the registrant at 1-800-341-7400, and ask for a copy of the Section 406 Standards for Investment Companies - Ethical Standards for Principal Executive and Financial Officers.
Item 3. Audit Committee Financial Expert
The registrant's Board has determined that each of the following members of the Board's Audit Committee is an “audit committee financial expert,” and is "independent," for purposes of this Item: John T. Collins, G. Thomas Hough and Thomas M. O'Neill.
Item 4. Principal Accountant Fees and Services
(a) Audit Fees billed to the registrant for the two most recent fiscal years:
Fiscal year ended 2016 - $149,795
Fiscal year ended 2015 - $141,420
(b) Audit-Related Fees billed to the registrant for the two most recent fiscal years:
Fiscal year ended 2016 - $0
Fiscal year ended 2015 - $0
Amount requiring approval of the registrant’s audit committee pursuant to paragraph (c)(7)(ii) of Rule 2-01 of Regulation S-X, $0 and $0 respectively.
(c) Tax Fees billed to the registrant for the two most recent fiscal years:
Fiscal year ended 2016 - $0
Fiscal year ended 2015 - $0
Amount requiring approval of the registrant’s audit committee pursuant to paragraph (c)(7)(ii) of Rule 2-01 of Regulation S-X, $0 and $0 respectively.
(d) All Other Fees billed to the registrant for the two most recent fiscal years:
Fiscal year ended 2016 - $0
Fiscal year ended 2015 - $0
Amount requiring approval of the registrant’s audit committee pursuant to paragraph (c)(7)(ii) of Rule 2-01 of Regulation S-X, $0 and $0 respectively.
(e)(1) Audit Committee Policies regarding Pre-approval of Services.
The Audit Committee is required to pre-approve audit and non-audit services performed by the independent auditor in order to assure that the provision of such services do not impair the auditor’s independence. Unless a type of service to be provided by the independent auditor has received general pre-approval, it will require specific pre-approval by the Audit Committee. Any proposed services exceeding pre-approved cost levels will require specific pre-approval by the Audit Committee.
Certain services have the general pre-approval of the Audit Committee. The term of the general pre-approval is 12 months from the date of pre-approval, unless the Audit Committee specifically provides for a different period. The Audit Committee will annually review the services that may be provided by the independent auditor without obtaining specific pre-approval from the Audit Committee and may grant general pre-approval for such services. The Audit Committee will revise the list of general pre-approved services from time to time, based on subsequent determinations. The Audit Committee will not delegate its responsibilities to pre-approve services performed by the independent auditor to management.
The Audit Committee has delegated pre-approval authority to its Chairman. The Chairman will report any pre-approval decisions to the Audit Committee at its next scheduled meeting. The Committee will designate another member with such pre-approval authority when the Chairman is unavailable.
AUDIT SERVICES
The annual Audit services engagement terms and fees will be subject to the specific pre-approval of the Audit Committee. The Audit Committee must approve any changes in terms, conditions and fees resulting from changes in audit scope, registered investment company (RIC) structure or other matters.
In addition to the annual Audit services engagement specifically approved by the Audit Committee, the Audit Committee may grant general pre-approval for other Audit Services, which are those services that only the independent auditor reasonably can provide. The Audit Committee has pre-approved certain Audit services, all other Audit services must be specifically pre-approved by the Audit Committee.
AUDIT-RELATED SERVICES
Audit-related services are assurance and related services that are reasonably related to the performance of the audit or review of the Company’s financial statements or that are traditionally performed by the independent auditor. The Audit Committee believes that the provision of Audit-related services does not impair the independence of the auditor, and has pre-approved certain Audit-related services, all other Audit-related services must be specifically pre-approved by the Audit Committee.
TAX SERVICES
The Audit Committee believes that the independent auditor can provide Tax services to the Company such as tax compliance, tax planning and tax advice without impairing the auditor’s independence. However, the Audit Committee will not permit the retention of the independent auditor in connection with a transaction initially recommended by the independent auditor, the purpose of which may be tax avoidance and the tax treatment of which may not be supported in the Internal Revenue Code and related regulations. The Audit Committee has pre-approved certain Tax services, all Tax services involving large and complex transactions must be specifically pre-approved by the Audit Committee.
ALL OTHER SERVICES
With respect to the provision of services other than audit, review or attest services the pre-approval requirement is waived if:
| (1) | The aggregate amount of all such services provided constitutes no more than five percent of the total amount of revenues paid by the registrant, the registrant’s adviser (not including any sub-adviser whose role is primarily portfolio management and is subcontracted with or overseen by another investment adviser), and any entity controlling, controlled by, or under common control with the investment adviser that provides ongoing services to the registrant to its accountant during the fiscal year in which the services are provided; |
| (2) | Such services were not recognized by the registrant, the registrant’s adviser (not including any sub-adviser whose role is primarily portfolio management and is subcontracted with or overseen by another investment adviser), and any entity controlling, controlled by, or under common control with the investment adviser that provides ongoing services to the registrant at the time of the engagement to be non-audit services; and |
| (3) | Such services are promptly brought to the attention of the Audit Committee of the issuer and approved prior to the completion of the audit by the Audit Committee or by one or more members of the Audit Committee who are members of the board of directors to whom authority to grant such approvals has been delegated by the Audit Committee. |
The Audit Committee may grant general pre-approval to those permissible non-audit services classified as All Other services that it believes are routine and recurring services, and would not impair the independence of the auditor.
The SEC’s rules and relevant guidance should be consulted to determine the precise definitions of prohibited non-audit services and the applicability of exceptions to certain of the prohibitions.
PRE-APPROVAL FEE LEVELS
Pre-approval fee levels for all services to be provided by the independent auditor will be established annually by the Audit Committee. Any proposed services exceeding these levels will require specific pre-approval by the Audit Committee.
PROCEDURES
Requests or applications to provide services that require specific approval by the Audit Committee will be submitted to the Audit Committee by both the independent auditor and the Principal Accounting Officer and/or Internal Auditor, and must include a joint statement as to whether, in their view, the request or application is consistent with the SEC’s rules on auditor independence.
(e)(2) Percentage of services identified in items 4(b) through 4(d) that were approved by the registrants audit committee pursuant to paragraph (c)(7)(i)(C) of Rule 2-01 of Regulation S-X:
4(b)
Fiscal year ended 2016 – 0%
Fiscal year ended 2015 - 0%
Percentage of services provided to the registrants investment adviser and any entity controlling, controlled by, or under common control with the investment adviser that provides ongoing services to the registrant that were approved by the registrants audit committee pursuant to paragraph (c)(7)(i)(C) of Rule 2-01 of Regulation S-X, 0% and 0% respectively.
4(c)
Fiscal year ended 2016 – 0%
Fiscal year ended 2015 – 0%
Percentage of services provided to the registrants investment adviser and any entity controlling, controlled by, or under common control with the investment adviser that provides ongoing services to the registrant that were approved by the registrants audit committee pursuant to paragraph (c)(7)(i)(C) of Rule 2-01 of Regulation S-X, 0% and 0% respectively.
4(d)
Fiscal year ended 2016 – 0%
Fiscal year ended 2015 – 0%
Percentage of services provided to the registrants investment adviser and any entity controlling, controlled by, or under common control with the investment adviser that provides ongoing services to the registrant that were approved by the registrants audit committee pursuant to paragraph (c)(7)(i)(C) of Rule 2-01 of Regulation S-X, 0% and 0% respectively.
| (g) | Non-Audit Fees billed to the registrant, the registrant’s investment adviser, and certain entities controlling, controlled by or under common control with the investment adviser: |
Fiscal year ended 2016 - $0
Fiscal year ended 2015 - $0
| (h) | The registrant’s Audit Committee has considered that the provision of non-audit services that were rendered to the registrant’s adviser (not including any sub-adviser whose role is primarily portfolio management and is subcontracted with or overseen by another investment adviser), and any entity controlling, controlled by, or under common control with the investment adviser that provides ongoing services to the registrant that were not pre-approved pursuant to paragraph (c)(7)(ii) of Rule 2-01 of Regulation S-X is compatible with maintaining the principal accountant’s independence. |
In its required communications to the Audit Committee of the registrant’s Board, KPMG LLP (“KPMG”), the registrant’s independent public accountant, informed the Audit Committee that KPMG and/or covered person professionals within KPMG maintain lending relationships with certain owners of greater than 10% of the shares of the registrant and/or certain investment companies within the “investment company complex” as defined under Rule 2-01(f)(14) of Regulation S-X, which are affiliates of the registrant. KPMG has advised the Audit Committee that these lending relationships implicate Rule 2-01(c)(1)(ii)(A) of Regulation S-X (referred to as the “Loan Rule”). The Loan Rule prohibits an independent public accountant, or covered person professionals at such firm, from having a financial relationship (such as a loan) with a lender that is a record or beneficial owner of more than 10% of an audit client’s equity securities. For purposes of the Loan Rule, audit clients include the registrant, as well as all registered investment companies audited by KPMG (collectively, the “KPMG Funds”).
KPMG informed the Audit Committee that KPMG believes that these lending relationships described above do not and will not impair KPMG’s ability to exercise objective and impartial judgment in connection with financial statement audits of the registrant and a reasonable investor with knowledge of all relevant facts and circumstances would conclude that KPMG has been and is capable of objective and impartial judgment on all issues encompassed within KPMG’s audits.
On June 20, 2016, the Division of Investment Management of the Securities and Exchange Commission (“SEC”) issued a no-action letter to another mutual fund complex (see Fidelity Management & Research Company et al., No-Action Letter) related to similar Loan Rule matters as those described above. In that letter, the SEC Staff confirmed that it would not recommend enforcement action against an investment company that relied on the audit services performed by an independent public accountant where the Loan Rule was implicated in certain specified circumstances. In that letter, the SEC staff indicated that it would not recommend enforcement action against the investment company complex if the Loan Rule is implicated provided that: (1) the auditor has complied with PCAOB Rule 3526(b)(1) and 3526(b)(2); (2) the Loan Rule is implicated because of lending relationships; and (3) notwithstanding such lending relationships that implicate the Loan Rule, the auditor has concluded that it is objective and impartial with respect to the issues encompassed within its engagement as auditor of the funds. The circumstances described in the no-action letter are substantially similar to the circumstances that implicated the Loan Rule with respect to KPMG and the registrant. The relief provided in the SEC no-action letter is effective for 18 months from its June 20, 2016 issuance date.
If it were to be determined that the relief available under the no-action letter was improperly relied upon, or that the independence requirements under the federal securities laws were not otherwise complied with regarding the registrant, for certain periods, any of the registrant’s filings with the SEC which contain financial statements of the registrant for such periods may not comply with applicable federal securities laws, the registrant’s ability to offer shares under its current registration statement may be impacted, and certain financial reporting and/or other covenants with, and representations and warranties to, the registrant’s lender under its committed line of credit may be impacted. Such events could have a material adverse effect on the registrant and the KPMG Funds.
Item 5. Audit Committee of Listed Registrants
Not Applicable
Item 6. Schedule of Investments
(a) The registrant’s Schedule of Investments is included as part of the Report to Stockholders filed under Item 1 of this form.
(b) Not Applicable; Fund had no divestments during the reporting period covered since the previous Form N-CSR filing.
Item 7. Disclosure of Proxy Voting Policies and Procedures for Closed-End Management Investment Companies
Not Applicable
Item 8. Portfolio Managers of Closed-End Management Investment Companies
Not Applicable
Item 9. Purchases of Equity Securities by Closed-End Management Investment Company and Affiliated Purchasers
Not Applicable
Item 10. Submission of Matters to a Vote of Security Holders
No Changes to Report
Item 11. Controls and Procedures
(a) The registrant’s President and Treasurer have concluded that the
registrant’s disclosure controls and procedures (as defined in rule 30a-3(c) under the Act) are effective in design and operation and are sufficient to form the basis of the certifications required by Rule 30a-(2) under the Act, based on their evaluation of these disclosure controls and procedures within 90 days of the filing date of this report on Form N-CSR.
(b) There were no changes in the registrant’s internal control over financial reporting (as defined in rule 30a-3(d) under the Act) during the second fiscal quarter of the period covered by this report that have materially affected, or are reasonably likely to materially affect, the registrant’s internal control over financial reporting.
Item 12. Exhibits
(a)(1) Code of Ethics- Not Applicable to this Report.
(a)(2) Certifications of Principal Executive Officer and Principal Financial Officer.
(a)(3) Not Applicable.
(b) Certifications pursuant to 18 U.S.C. Section 1350.
SIGNATURES
Pursuant to the requirements of the Securities Exchange Act of 1934 and the Investment Company Act of 1940, the registrant has duly caused this report to be signed on its behalf by the undersigned, thereunto duly authorized.
Registrant Federated Municipal Securities Income Trust
By /S/ Lori A. Hensler
Lori A. Hensler, Principal Financial Officer
Date October 24, 2016
Pursuant to the requirements of the Securities Exchange Act of 1934 and the Investment Company Act of 1940, this report has been signed below by the following persons on behalf of the registrant and in the capacities and on the dates indicated.
By /S/ J. Christopher Donahue
J. Christopher Donahue, Principal Executive Officer
Date October 24, 2016
By /S/ Lori A. Hensler
Lori A. Hensler, Principal Financial Officer
Date October 24, 2016