| UNITED STATES SECURITIES AND EXCHANGE COMMISSION Washington, D.C. 20549 |
FORM N-CSR
| CERTIFIED SHAREHOLDER REPORT OF REGISTERED MANAGEMENT INVESTMENT COMPANIES |
Investment Company Act file number: (811- 05989 )
Exact name of registrant as specified in charter: Putnam Utilities Growth and Income Fund
Address of principal executive offices: One Post Office Square, Boston, Massachusetts 02109
| Name and address of agent for service: | Beth S. Mazor, Vice President | |
| One Post Office Square | ||
| Boston, Massachusetts 02109 | ||
| Copy to: | John W. Gerstmayr, Esq. | |
| Ropes & Gray LLP | ||
| One International Place | ||
| Boston, Massachusetts 02110 | ||
| Registrant’s telephone number, including area code: | (617) 292-1000 | |
Date of fiscal year end: October 31, 2006
Date of reporting period: November 1, 2005— April 30, 2006
Item 1. Report to Stockholders:
The following is a copy of the report transmitted to stockholders pursuant to Rule 30e-1 under the Investment Company Act of 1940:
What makes Putnam different?

In 1830, Massachusetts Supreme Judicial Court Justice Samuel Putnam established The Prudent Man Rule, a legal foundation for responsible money management.
THE PRUDENT MAN RULE
All that can be required of a trustee to invest is that he shall conduct himself faithfully and exercise a sound discretion. He is to observe how men of prudence, discretion, and intelligence manage their own affairs, not in regard to speculation, but in regard to the permanent disposition of their funds, considering the probable income, as well as the probable safety of the capital to be invested.

A time-honored tradition in money management
Since 1937, our values have been rooted in a profound sense of responsibility for the money entrusted to us.
A prudent approach to investing
We use a research-driven team approach to seek consistent, dependable, superior investment results over time, although there is no guarantee a fund will meet its objectives.
Funds for every investment goal
We offer a broad range of mutual funds and other financial products so investors and their financial representatives can build diversified portfolios.
A commitment to doing what’s right for investors
We have below-average expenses and stringent investor protections, and provide a wealth of information about the Putnam funds.
Industry-leading service
We help investors, along with their financial representatives, make informed investment decisions with confidence.
| Putnam Utilities | |
| Growth and | |
| Income Fund | |
| 4 | 30 | 06 | |
| Semiannual Report | |
| Message from the Trustees | 2 |
| About the fund | 4 |
| Report from the fund managers | 7 |
| Performance | 13 |
| Expenses | 16 |
| Portfolio turnover | 18 |
| Risk | 19 |
| Your fund’s management | 20 |
| Terms and definitions | 23 |
| Trustee approval of management contract | 25 |
| Other information for shareholders | 30 |
| Financial statements | 31 |
| Brokerage commissions | 54 |
Cover photograph: © Marco Cristofori
Message from the Trustees
Dear Fellow Shareholder
In recent months, we have witnessed the continuing vibrancy of the current economic expansion, now in its fifth year. U.S. businesses have seized opportunities available both at home and abroad to generate some of the most impressive profit margins in history, by some measures. During your fund’s reporting period, common stocks have traded at higher levels to reflect improving corporate profits. However, the gains have not come without concerns in some quarters of the market about the risks facing the economy. These risks include high energy prices, inflation, and a potential pullback in consumer spending, as well as the potential adverse effects of the Federal Reserve’s (the Fed’s) series of interest-rate increases. Concerns about inflation, in particular, have been reflected in falling bond prices and rising bond yields, and worries about consumer spending have clouded the outlook for stocks.
You can be assured that the investment professionals managing your fund are closely monitoring the factors that are influencing the performance of the securities in which your fund invests. Moreover, Putnam Investments’ management team, under the leadership of Chief Executive Officer Ed Haldeman, continues to focus on investment performance and remains committed to putting the interests of shareholders first.
2
In the following pages, members of your fund’s management teams discuss the fund’s performance and strategies for the period ended April 30, 2006, and provide their outlook for the months ahead. As always, we thank you for your support of the Putnam funds.
Putnam Utilities Growth and Income Fund:
a diversified approach to utilities investing
Many stock funds offer the potential for growth but produce little or no income for investors. Putnam Utilities Growth and Income Fund sets itself apart by pursuing both current income and capital growth through investment in securities from the utilities sector.
Public utilities, which provide services such as electricity and gas, have a history of consistent dividend payouts to investors. As a result, these securities have long been valued as an alternative to bonds — especially during periods of low interest rates, when investors look outside the bond market for income. In recent years, the income-producing power of utilities holdings has grown even stronger, largely because of legislation in 2003 that reduced the federal tax on dividends from an individual’s ordinary income tax rate to a flat rate of 15%. Since that time, many investors have been able to keep more of their dividend income.
Another influence on the performance and attractiveness of utilities securities is the price of natural gas. Gas prices affect not only the natural gas industry, but any industry that uses gas in its production or delivery process. For example, gas is widely used to produce electricity; therefore, as gas prices rise and fall, the cost of electricity tends to follow suit. Since the demand for electricity is usually stable even as prices fluctuate, an industry-wide increase in prices can lead to higher profits for companies with more efficient production.
To make the most of opportunities in the utilities sector, the management team of Putnam Utilities Growth and Income Fund keeps the portfolio broadly diversified within the sector. The fund may invest in bonds as well as stocks, in both domestic and foreign markets, across several industries with varying degrees of regulation, and in companies of different sizes. An essential component of the fund’s strategy, particularly during periods of uncertainty, is to maintain a solid foundation of securities in stable-demand industries such
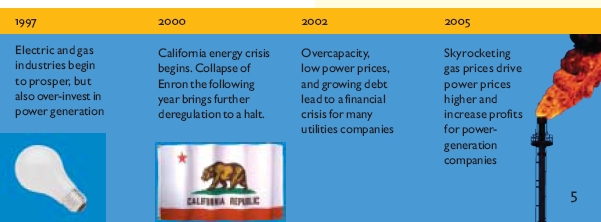
Key developments affecting electric and gas utilities
since the inception of the fund.
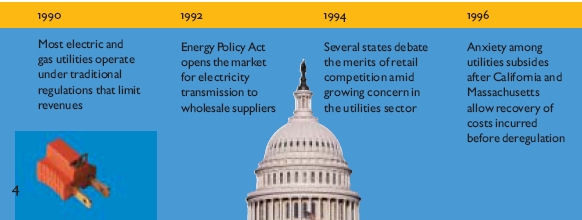
as electric power, telecommunications, and natural gas. Guided by this broad-based approach, the fund’s management team is committed to finding rewarding opportunities for income and growth by anticipating, and responding to, developments that affect the utilities sector.
International investing involves certain risks, such as currency fluctuations, economic instability, and political developments. The fund may invest a portion of its assets in small and/or midsize companies. Such investments increase the risk of greater price fluctuations. The fund concentrates its investments by sector and involves more risk than a fund that invests more broadly. Mutual funds that invest in bonds are subject to certain risks, including interest-rate risk, credit risk, and inflation risk. As interest rates rise, the prices of bonds fall. Long-term bonds are more exposed to interest-rate risk than short-term bonds. Unlike bonds, bond funds have ongoing fees and expenses. Diversification does not assure a profit or protect against loss. It is possible to lose money in a diversified portfolio.
Major industries in the utilities sector
Electric utilities Companies that generate, transmit, or distribute electricity.
Natural gas utilities Companies that transmit, store, or distribute natural gas.
Regional Bells Companies that provide access to voice communications networks within a specific geographic region.
Telecommunications Companies that provide voice, data, and video communications products and services.
Telephone Companies that provide fixed-line and wireless telephone communications services.
Water utilities Companies that provide services related to water or wastewater.
Putnam Utilities Growth and Income Fund seeks capital growth and current income by investing in stocks and bonds of utilities such as natural gas, electric, and communications services companies. It may be suitable for investors who want a long-term investment that can offer both income and growth potential.
Highlights
* For the six months ended April 30, 2006, Putnam Utilities Growth and Income Fund’s class A shares returned 3.28% without sales charges.
* The fund’s benchmark, the S&P Utilities Index, returned 1.32% ..
* The average return for the fund’s Lipper category, Utility Funds, was 6.27% .
* The fund’s quarterly dividend was adjusted from $0.0640 to $0.0540 in March 2006. See page 11 for more details.
* Additional fund performance, comparative performance, and Lipper data can be found in the performance section beginning on page 13.
Performance
Total return for class A shares for periods ended 4/30/06
Since the fund’s inception (11/19/90), average annual return is 8.28% at NAV and 7.91% at POP.
| Average annual return | Cumulative return | |||
| NAV | POP | NAV | POP | |
| 10 years | 6.75% | 6.18% | 92.22% | 82.13% |
| 5 years | 0.73 | –0.34 | 3.71 | –1.71 |
| 3 years | 18.08 | 15.98 | 64.63 | 55.99 |
| 1 year | 10.47 | 4.71 | 10.47 | 4.71 |
| 6 months | — | — | 3.28 | –2.16 |
Data is historical. Past performance does not guarantee future results. More recent returns may be less or more than those shown. Investment return and principal value will fluctuate, and you may have a gain or a loss when you sell your shares. Performance assumes reinvestment of distributions and does not account for taxes. Returns at NAV do not reflect a sales charge of 5.25% . For the most recent month-end performance, visit www.putnam.com. A short-term trading fee of up to 2% may apply.
6
Report from the fund managers
The period in review
Your fund delivered positive absolute performance for the first half of its 2006 fiscal year, outperforming its benchmark, the S&P Utilities Index, based on results at net asset value (NAV, or without sales charges). While the benchmark includes only stocks of power and gas companies based in the United States, your fund has a broader scope: it invests internationally in both stocks and bonds; telecommunications securities; and power and gas stocks. Due to our heavier weighting in European telecom stocks, which was established in anticipation of increasing merger and acquisitions (M&A) activity in Europe, the fund lagged the average for its Lipper category. However, during this period, U.S. telecom stocks benefited from M&A activity to a greater extent than their European counterparts. Since many of the fund’s peers had more exposure to U.S. telecoms, our relative underweighting detracted from results. Currency fluctuations had a modestly positive effect on performance for the period.
Market overview
The broad market indexes in the United States generally rallied throughout the period, a trend that has been sustained for longer periods in Europe and Japan. Over the last six months, however, the power, gas, and telecom sectors have moved erratically, trending only slightly upward, though telecom did strengthen through the first calendar quarter of 2006. We believe that the drivers of these sectors’ performance will be M&A activity — which is likely to be a positive because of the perception that it will lead to reduced competitive pressures — and interest rates, which most observers see as a headwind for all stocks, but especially damaging to utility stocks. In addition, energy prices (especially gas prices) can be expected to have a major impact on the utilities industry because electricity prices generally incorporate gas prices, which determine electricity’s marginal cost of production in most areas.
Higher interest rates and lower natural gas prices have hurt electric and
7
gas stocks over the past seven months; but we believe that gas prices, at least, will increase. This, combined with the evolving deregulation of the industry, should create a more favorable environment for utilities. It is important to note that while new deregulation initiatives have ceased since the California energy crisis and the collapse of Enron, plans enacted into law in the 1990s are just now reaching full implementation. Indeed, as the brief rally in telecom stocks drew to a close in March, stocks of power and gas utilities, which were also being buoyed by M&A rumors, began to trend higher. Basic business conditions in the telecom sector have not improved as much as we had expected, and we currently consider power and gas utilities stocks more attractive.
Strategy overview
The fund’s objective is to select among the securities of companies that sell basic, stable-demand services such as electricity, gas, water, and telecommunications. These securities normally provide somewhat more stability and yield, and only slightly less return, than securities from the broader markets. When we believe market conditions warrant it, we may seek to enhance this stability and yield with fixed-income investments.
Our stock selection process incorporates both quantitative and qualitative analysis, with the former being more
| Market sector performance | |
| These indexes provide an overview of performance in different market sectors for the | |
| six months ended 4/30/06. | |
| Equities | |
| S&P Utilities Index (utilities stocks) | 1.32% |
| S&P 500 Index (broad stock market) | 9.64% |
| Russell 1000 Growth Index (large-company growth stocks) | 7.06% |
| Russell 1000 Value Index (large-company value stocks) | 12.87% |
| Bonds | |
| Lehman Aggregate Bond Index (broad bond market) | 0.56% |
| JP Morgan Global High Yield Index (global high-yield corporate bonds) | 5.20% |
| Lehman Intermediate Treasury Bond Index (intermediate-maturity U.S. Treasury bonds) | 0.64% |
8
important in screening which securities we will consider and the latter being more important in our final buy or sell decisions. The most important measure of a security is our determination of its intrinsic value, based on our estimate of the earnings and cash flow we believe it can generate. Our understanding of past and future developments, risks, and uncertainties specific to the utilities industries is also a key consideration and one where our views frequently differ from the conventional wisdom in the investment community.
During the period, we increased the fund’s allocation to electric and gas utilities while reducing its telecom exposure, and increased the overall equity allocation while reducing fixed-income holdings. We also added to the fund’s international exposure, focusing almost exclusively on the developed economies of Europe and the Pacific. These shifts reflected our belief that utilities stocks had been hurt by gas prices and interest rates, and that more attractive values had become available in the United States and abroad. Consequently, we adjusted the portfolio allocations to take greater advantage of these opportunities.
Your fund’s holdings
The telecommunications sector performed well for most of the semian-nual period. Digi.com of Malaysia, a digital provider, was the portfolio’s strongest performer in this sector. Due to the decreasing cost of handsets and the
Comparison of top industry weightings
This chart shows how the fund’s top weightings have changed over the last six months. Weightings are shown as a percentage of net assets. Holdings will vary over time.
9
growing popularity of mobile telephony, demand for Digi.com’s services increased dramatically and its stock price increased by more than 60%. Koninklijke KPN of the Netherlands, which is benefiting from the same trends, is one of our largest holdings in the telecom sector, where we consider positive earnings momentum and upward estimate revisions to be the keys to stock price performance. Another key contributor from this sector is American Tower, a communications infrastructure company with a great deal of leverage on its assets; as volume grows and assets become more fully utilized, we believe its profit margins will expand. It, too, benefited from positive earnings momentum and upward estimate revisions.
However, another telecom holding, Vodafone Group, was the biggest detractor from performance. The company’s restructuring is proceeding more slowly than we had predicted, and its business performance has been uneven. In the last month of the period, the stock price began to improve, and we are maintaining the position. The fund’s results were also dampened by underweight positions in Bellsouth, AT&T, and Verizon Communications, which performed well in reaction to restructuring activity and improving investor perceptions.
Among power and gas utilities stocks, PG&E was the top positive contributor. As gas prices fell and some stocks tied to the power and gas markets
Top holdings
This table shows the fund's top holdings, and the percentage of the fund's net assets that each comprised, as of 4/30/06. The fund's holdings will change over time.
| Holding (percent of fund's net assets) | Industry |
| Exelon Corp. (6.4%) | Electric utilities |
| Dominion Resources, Inc. (4.8%) | Electric utilities |
| Entergy Corp. (4.3%) | Electric utilities |
| PG&E Corp. (4.2%) | Electric utilities |
| FPL Group, Inc. (3.2%) | Electric utilities |
| Vodafone Group PLC (United Kingdom) (3.0%) | Telecommunications |
| TXU Corp. (3.0%) | Electric utilities |
| FirstEnergy Corp. (2.9%) | Electric utilities |
| Edison International (2.8%) | Electric utilities |
| Sempra Energy (2.7%) | Natural gas utilities |
10
underperformed, attention shifted to the more regulated utilities. In this area, PG&E is a standout because of its growth opportunities, its good relationship with its regulators, and the continuing supervision of the bankruptcy judge who is keenly interested in its continuing financial recovery. Alliant Energy, a smaller power company operating primarily in Iowa and Wisconsin, benefited from some of these same trends, particularly growth opportunities and supportive regulation. Also, it is in the process of selling most of its unregulated and international businesses, a move that has enhanced its investment appeal. MDU Resources, on the other hand, has successfully managed its unregulated businesses, particularly its oil and gas exploration and production operations, and outperformed expectations. Another strong performer, AES, benefited when management delivered on its promise to improve financial reporting and controls. Other key contributors include Exelon, one of the largest electric utilities in the United States, and Sierra Pacific Resources, which continues to recover from the Western power crisis.
Among detractors from performance, Edison International, which has produced outstanding results in recent years, suffered from a decline in gas and power prices. Dominion Resources, which is an oil and gas producer as well as a utility, also underperformed in the weak gas price environment. FPL Group has underperformed, largely due to its ongoing attempt to acquire Constellation Energy Group, a long-term strategy that has not been well received by investors with a short-term focus.
Please note that the holdings discussed in this report may not have been held by the fund for the entire period. Portfolio composition is subject to review in accordance with the fund’s investment strategy and may vary in the future.
Of special interest
Reflecting a change in calculation methodology, the fund’s quarterly per-share dividend for class A shares was adjusted from $0.0640 to $0.0540 in March 2006. Similar adjustments were made for other share classes.
11
The outlook for your fund
The following commentary reflects anticipated developments that could affect your fund over the next six months, as well as your management team’s plans for responding to them.
Although the first half of fiscal 2006 has not been particularly rewarding, we believe the environment for utilities stocks, particularly power and gas stocks, is likely to become more favorable in the second half of the year. Both gas prices and interest rates have held these stocks back in recent months. In our opinion, gas prices may have been held down by seasonal factors, and we believe they could spike upwards in the event of a hot summer or another heavy hurricane season. Furthermore, while we believe that interest rates could head higher, we consider that excessive pessimism on this subject has, to some extent, taken its toll on stock prices and that a more hospitable environment could prevail in the latter half of the year. We began increasing the fund’s weightings in power and gas stocks in March to position the fund to take advantage of these changes, should they occur. Whatever the market environment, however, we will continue our efforts to produce steady, dependable returns through a broadly diversified portfolio of domestic and international stocks from throughout the utilities industries.
The views expressed in this report are exclusively those of Putnam Management. They are not meant as investment advice.
International investing involves certain risks, such as currency fluctuations, economic instability, and political developments. The fund may invest a portion of its assets in small and/or midsize companies. Such investments increase the risk of fluctuations in the value of your investment. The fund concentrates its investments in a limited number of sectors and involves more risk than a fund that invests more broadly. Mutual funds that invest in bonds are subject to certain risks, including interest-rate risk, credit risk, and inflation risk. As interest rates rise, the prices of bonds fall. Long-term bonds are more exposed to interest-rate risk than short-term bonds. Unlike bonds, bond funds have ongoing fees and expenses.
12
Your fund’s performance
This section shows your fund’s performance for periods ended April 30, 2006, the end of the first half of its current fiscal year. In accordance with regulatory requirements for mutual funds, we also include performance for the most recent calendar quarter-end. Performance should always be considered in light of a fund’s investment strategy. Data represents past performance. Past performance does not guarantee future results. More recent returns may be less or more than those shown. Investment return and principal value will fluctuate, and you may have a gain or a loss when you sell your shares. For the most recent month-end performance, please visit www.putnam.com or call Putnam at 1-800-225-1581. Class Y shares are generally only available to corporate and institutional clients. See the Terms and Definitions section in this report for definitions of the share classes offered by your fund.
| Fund performance | ||||||||||
| Total return for periods ended 4/30/06 | ||||||||||
| Class A | Class B | Class C | Class M | Class R | Class Y | |||||
| (inception dates) | (11/19/90) | (4/27/92) | (7/26/99) | (3/1/95) | (12/1/03) | (10/4/05) | ||||
| NAV | POP | NAV | CDSC | NAV | CDSC | NAV | POP | NAV | NAV | |
| Annual average | ||||||||||
| (life of fund) | 8.28% | 7.91% | 7.48% | 7.48% | 7.47% | 7.47% | 7.75% | 7.52% | 8.01% | 8.29% |
| 10 years | 92.22 | 82.13 | 78.35 | 78.35 | 78.21 | 78.21 | 83.07 | 77.11 | 87.43 | 92.44 |
| Annual average | 6.75 | 6.18 | 5.96 | 5.96 | 5.95 | 5.95 | 6.23 | 5.88 | 6.48 | 6.77 |
| 5 years | 3.71 | –1.71 | –0.06 | –1.91 | –0.09 | –0.09 | 1.17 | –2.14 | 2.40 | 3.83 |
| Annual average | 0.73 | –0.34 | –0.01 | –0.38 | –0.02 | –0.02 | 0.23 | –0.43 | 0.48 | 0.75 |
| 3 years | 64.63 | 55.99 | 61.19 | 58.19 | 61.08 | 61.08 | 62.37 | 57.13 | 63.41 | 64.82 |
| Annual average | 18.08 | 15.98 | 17.25 | 16.52 | 17.22 | 17.22 | 17.54 | 16.26 | 17.79 | 18.12 |
| 1 year | 10.47 | 4.71 | 9.67 | 4.67 | 9.60 | 8.60 | 9.82 | 6.23 | 10.13 | 10.60 |
| 6 months | 3.28 | –2.16 | 2.89 | –2.11 | 2.82 | 1.82 | 3.01 | –0.35 | 3.08 | 3.40 |
Performance assumes reinvestment of distributions and does not account for taxes. Returns at public offering price (POP) for class A and M shares reflect a sales charge of 5.25% and 3.25%, respectively. Class B share returns reflect the applicable contingent deferred sales charge (CDSC), which is 5% in the first year, declining to 1% in the sixth year, and is eliminated thereafter. Class C shares reflect a 1% CDSC the first year that is eliminated thereafter. Class R and Y shares have no initial sales charge or CDSC. Performance for class B, C, M, R, and Y shares before their inception is derived from the historical performance of class A shares, adjusted for the applicable sales charge (or CDSC) and, except for class Y shares, the higher operating expenses for such shares.
A 2% short-term trading fee may be applied to shares exchanged or sold within 5 days of purchase.
13
| Comparative index returns | ||
| For periods ended 4/30/06 | ||
| S&P Utilities | Lipper Utility Funds | |
| Index | category average* | |
| Annual average | ||
| (life of fund) | 8.31% | 10.07% |
| 10 years | 101.57 | 147.56 |
| Annual average | 7.26 | 9.31 |
| 5 years | –8.84 | 10.59 |
| Annual average | –1.83 | 1.81 |
| 3 years | 74.92 | 76.98 |
| Annual average | 20.49 | 20.81 |
| 1 year | 7.92 | 15.44 |
| 6 months | 1.32 | 6.27 |
| Index and Lipper results should be compared to fund performance at net asset value. | |
| * | Over the 6-month and 1-, 3-, 5-, and 10-year periods ended 4/30/06, there were 107, 104, 82, 71, and 41 funds, respectively, in this Lipper category. |
Fund price and distribution information
For the six-month period ended 4/30/06
| Distributions* | Class A | Class B | Class C | Class M | Class R | Class Y | ||
| Number | 2 | 2 | 2 | 2 | 2 | 2 | ||
| Income | $0.118 | $0.075 | $0.077 | $0.089 | $0.106 | $0.131 | ||
| Capital gains | — | — | — | — | — | — | ||
| Total | $0.118 | $0.075 | $0.077 | $0.089 | $0.106 | $0.131 | ||
| Share value: | NAV | POP | NAV | NAV | NAV | POP | NAV | NAV |
| 10/31/05 | $10.97 | $11.58 | $10.91 | $10.91 | $10.95 | $11.32 | $10.96 | $10.97 |
| 4/30/06 | 11.21 | 11.83 | 11.15 | 11.14 | 11.19 | 11.57 | 11.19 | 11.21 |
| Current yield | ||||||||
| (end of period) | ||||||||
| Current | ||||||||
| dividend rate1 | 1.93% | 1.83% | 1.15% | 1.15% | 1.43% | 1.38% | 1.72% | 2.18% |
| Current 30-day | ||||||||
| SEC yield2 | 1.85 | 1.76 | 1.12 | 1.12 | 1.36 | 1.32 | 1.61 | 2.10 |
* Dividend sources are estimated and may vary based on final tax calculations after the fund’s fiscal year-end.
| 1 | Most recent distribution, excluding capital gains, annualized and divided by NAV or POP at end of period. |
| 2 | Based only on investment income, calculated using SEC guidelines. |
14
| Fund performance for most recent calendar quarter | ||||||||||
| Total return for periods ended 3/31/06 | ||||||||||
| Class A | Class B | Class C | Class M | Class R | Class Y | |||||
| (inception dates) | (11/19/90) | (4/27/92) | (7/26/99) | (3/1/95) | (12/1/03) | (10/4/05) | ||||
| NAV | POP | NAV | CDSC | NAV | CDSC | NAV | POP | NAV | NAV | |
| Annual average | ||||||||||
| (life of fund) | 8.15% | 7.77% | 7.35% | 7.35% | 7.34% | 7.34% | 7.62% | 7.39% | 7.88% | 8.16% |
| 10 years | 87.76 | 77.89 | 74.19 | 74.19 | 74.20 | 74.20 | 78.98 | 73.14 | 83.23 | 87.98 |
| Annual average | 6.50 | 5.93 | 5.71 | 5.71 | 5.71 | 5.71 | 5.99 | 5.64 | 6.24 | 6.52 |
| 5 years | 6.63 | 1.03 | 2.70 | 0.80 | 2.76 | 2.76 | 4.04 | 0.63 | 5.35 | 6.76 |
| Annual average | 1.29 | 0.21 | 0.53 | 0.16 | 0.55 | 0.55 | 0.80 | 0.13 | 1.05 | 1.32 |
| 3 years | 71.70 | 62.77 | 68.07 | 65.07 | 67.94 | 67.94 | 69.27 | 63.68 | 70.56 | 71.90 |
| Annual average | 19.74 | 17.63 | 18.89 | 18.18 | 18.86 | 18.86 | 19.18 | 17.85 | 19.48 | 19.79 |
| 1 year | 8.97 | 3.23 | 8.17 | 3.17 | 8.10 | 7.10 | 8.43 | 4.94 | 8.74 | 9.10 |
| 6 months | –4.03 | –9.08 | –4.33 | –9.08 | –4.40 | –5.35 | –4.28 | –7.42 | –4.13 | –3.92 |
15
Your fund’s expenses
As a mutual fund investor, you pay ongoing expenses, such as management fees, distribution fees (12b-1 fees), and other expenses. In the most recent six-month period, your fund limited these expenses; had it not done so, expenses would have been higher. Using the information below, you can estimate how these expenses affect your investment and compare them with the expenses of other funds. You may also pay one-time transaction expenses, including sales charges (loads) and redemption fees, which are not shown in this section and would have resulted in higher total expenses. For more information, see your fund’s prospectus or talk to your financial advisor.
Review your fund’s expenses
The table below shows the expenses you would have paid on a $1,000 investment in Putnam Utilities Growth and Income Fund from November 1, 2005, to April 30, 2006. It also shows how much a $1,000 investment would be worth at the close of the period, assuming actual returns and expenses.
| Class A | Class B | Class C | Class M | Class R | Class Y | |
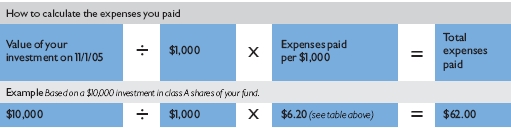
| Expenses paid per $1,000* | $ 6.20 | $ 9.96 | $ 9.96 | $ 8.71 | $ 7.45 | $ 4.94 |
| Ending value (after expenses) | $1,032.80 | $1,028.90 | $1,028.20 | $1,030.10 | $1,030.80 | $1,034.00 |
* Expenses for each share class are calculated using the fund’s annualized expense ratio for each class, which represents the ongoing expenses as a percentage of net assets for the six months ended 4/30/06. The expense ratio may differ for each share class (see the table at the bottom of the next page). Expenses are calculated by multiplying the expense ratio by the average account value for the period; then multiplying the result by the number of days in the period; and then dividing that result by the number of days in the year. Does not reflect the effect of a non-recurring reimbursement by Putnam. If this amount had been reflected in the table above, expenses for each share class would have been lower.
Estimate the expenses you paid
To estimate the ongoing expenses you paid for the six months ended April 30, 2006, use the calculation method below. To find the value of your investment on November 1, 2005, go to www.putnam.com and log on to your account. Click on the “Transaction History” tab in your Daily Statement and enter 11/01/2005 in both the “from” and “to” fields. Alternatively, call Putnam at 1-800-225-1581.
16
Compare expenses using the SEC’s method
The Securities and Exchange Commission (SEC) has established guidelines to help investors assess fund expenses. Per these guidelines, the table below shows your fund’s expenses based on a $1,000 investment, assuming a hypothetical 5% annualized return. You can use this information to compare the ongoing expenses (but not transaction expenses or total costs) of investing in the fund with those of other funds. All mutual fund shareholder reports will provide this information to help you make this comparison. Please note that you cannot use this information to estimate your actual ending account balance and expenses paid during the period.
| Class A | Class B | Class C | Class M | Class R | Class Y | |
| Expenses paid per $1,000* | $ 6.16 | $ 9.89 | $ 9.89 | $ 8.65 | $ 7.40 | $ 4.91 |
| Ending value (after expenses) | $1,018.70 | $1,014.98 | $1,014.98 | $1,016.22 | $1,017.46 | $1,019.93 |
* Expenses for each share class are calculated using the fund’s annualized expense ratio for each class, which represents the ongoing expenses as a percentage of net assets for the six months ended 4/30/06. The expense ratio may differ for each share class (see the table at the bottom of this page). Expenses are calculated by multiplying the expense ratio by the average account value for the period; then multiplying the result by the number of days in the period; and then dividing that result by the number of days in the year. Does not reflect the effect of a non-recurring reimbursement by Putnam. If this amount had been reflected in the table above, expenses for each share class would have been lower.
Compare expenses using industry averages
You can also compare your fund’s expenses with the average of its peer group, as defined by Lipper, an independent fund-rating agency that ranks funds relative to others that Lipper considers to have similar investment styles or objectives. The expense ratio for each share class shown below indicates how much of your fund’s net assets have been used to pay ongoing expenses during the period.
| Class A | Class B | Class C | Class M | Class R | Class Y | |
| Your fund's annualized | ||||||
| expense ratio* | 1.23% | 1.98% | 1.98% | 1.73% | 1.48% | 0.98% |
| Average annualized expense | ||||||
| ratio for Lipper peer group† | 1.25% | 2.00% | 2.00% | 1.75% | 1.50% | 1.00% |
* Does not reflect the effect of a non-recurring reimbursement by Putnam. If this amount had been reflected in the table above, the expense ratio for each share class would have been lower.
† Simple average of the expenses of all front-end load funds in the fund’s Lipper peer group, calculated in accordance with Lipper’s standard method for comparing fund expenses (excluding 12b-1 fees and without giving effect to any expense offset and brokerage service arrangements that may reduce fund expenses). This average reflects each fund’s expenses for its most recent fiscal year available to Lipper as of 3/31/06. To facilitate comparison, Putnam has adjusted this average to reflect the 12b-1 fees carried by each class of shares other than class Y shares, which do not incur 12b-1 fees. The peer group may include funds that are significantly smaller or larger than the fund, which may limit the comparability of the fund’s expenses to the simple average, which typically is higher than the asset-weighted average.
17
Your fund’s
portfolio turnover
Putnam funds are actively managed by teams of experts who buy and sell securities based on intensive analysis of companies, industries, economies, and markets. Portfolio turnover is a measure of how often a fund’s managers buy and sell securities for your fund. A portfolio turnover of 100%, for example, means that the managers sold and replaced securities valued at 100% of a fund’s assets within a one-year period. Funds with high turnover may be more likely to generate capital gains and dividends that must be distributed to shareholders as taxable income. High turnover may also cause a fund to pay more brokerage commissions and other transaction costs, which may detract from performance.
Funds that invest in bonds or other fixed-income instruments may have higher turnover than funds that invest only in stocks. Short-term bond funds tend to have higher turnover than longer-term bond funds, because shorter-term bonds will mature or be sold more frequently than longer-term bonds. You can use the table below to compare your fund’s turnover with the average turnover for funds in its Lipper category.
| Turnover comparisons | |||||
| Percentage of holdings that change every year | |||||
| 2005 | 2004 | 2003 | 2002 | 2001 | |
| Putnam Utilities Growth | |||||
| and Income Fund | 39% | 30% | 40% | 45% | 92% |
| Lipper Utility Funds | |||||
| category average | 122% | 203% | 231% | 224% | 229% |
Turnover data for the fund is calculated based on the fund’s fiscal-year period, which ends on October 31. Turnover data for the fund’s Lipper category is calculated based on the average of the turnover of each fund in the category for its fiscal year ended during the indicated year. Fiscal years vary across funds in the Lipper category, which may limit the comparability of the fund’s portfolio turnover rate to the Lipper average. Comparative data for 2005 is based on information available as of 12/31/05.
18
Your fund’s risk
This risk comparison is designed to help you understand how your fund compares with other funds. The comparison utilizes a risk measure developed by Morningstar, an independent fund-rating agency. This risk measure is referred to as the fund’s Overall Morningstar Risk.
Your fund’s Overall Morningstar® Risk
Your fund’s Overall Morningstar Risk is shown alongside that of the average fund in its broad asset class, as determined by Morningstar. The risk bar broadens the comparison by translating the fund’s Overall Morningstar Risk into a percentile, which is based on the fund’s ranking among all funds rated by Morningstar as of March 31, 2006. A higher Overall Morningstar Risk generally indicates that a fund’s monthly returns have varied more widely.
Morningstar determines a fund’s Overall Morningstar Risk by assessing variations in the fund’s monthly returns — with an emphasis on downside variations — over 3-, 5-, and 10-year periods, if available. Those measures are weighted and averaged to produce the fund’s Overall Morningstar Risk. The information shown is provided for the fund’s class A shares only; information for other classes may vary. Overall Morningstar Risk is based on historical data and does not indicate future results. Morningstar does not purport to measure the risk associated with a current investment in a fund, either on an absolute basis or on a relative basis. Low Overall Morningstar Risk does not mean that you cannot lose money on an investment in a fund. Copyright 2006 Morningstar, Inc. All Rights Reserved. The information contained herein (1) is proprietary to Morningstar and/or its content providers; (2) may not be copied or distributed; and (3) is not warranted to be accurate, complete, or timely. Neither Morningstar nor its content providers are responsible for any damages or losses arising from any use of this information.
19
Your fund’s management
Your fund is managed by the members of the Putnam Global Equity Research and Core Fixed-Income teams. Michael Yogg is the Portfolio Leader and Kevin Murphy is the Portfolio Member of the fund. The Portfolio Leader and Portfolio Member coordinate the teams’ management of the fund.
For a complete listing of the members of the Putnam Global Equity Research and Core Fixed-Income teams, including those who are not Portfolio Leaders or Portfolio Members of your fund, visit Putnam’s Individual Investor Web site at www.putnam.com.
Fund ownership by the Portfolio Leader and Portfolio Member
The table below shows how much the fund’s current Portfolio Leader and Portfolio Member have invested in the fund (in dollar ranges). Information shown is as of April 30, 2006, and April 30, 2005.
| $1 – | $10,001 – | $50,001 – | $100,001 – | $500,001 – | $1,000,001 | |||
| Year | $0 | $10,000 | $50,000 | $100,000 | $500,000 | $1,000,000 | and over | |
| Michael Yogg | 2006 | * | ||||||
| Portfolio Leader | 2005 | * | ||||||
| Kevin Murphy | 2006 | * | ||||||
| Portfolio Member | 2005 | * | ||||||
20
Fund manager compensation
The total 2005 fund manager compensation that is attributable to your fund is approximately $680,000. This amount includes a portion of 2005 compensation paid by Putnam Management to the fund managers listed in this section for their portfolio management responsibilities, calculated based on the fund assets they manage taken as a percentage of the total assets they manage. The compensation amount also includes a portion of the 2005 compensation paid to the Chief Investment Officers of the teams and the Group Chief Investment Officers of the fund’s broader investment categories for their oversight responsibilities, calculated based on the fund assets they oversee taken as a percentage of the total assets they oversee. This amount does not include compensation of other personnel involved in research, trading, administration, systems, compliance, or fund operations; nor does it include non-compensation costs. These percentages are determined as of the fund’s fiscal period-end. For personnel who joined Putnam Management during or after 2005, the calculation reflects annualized 2005 compensation or an estimate of 2006 compensation, as applicable.
Other Putnam funds managed by the Portfolio Leader and Portfolio Member
Kevin Murphy is also a Portfolio Member of Putnam Income Fund.
Michael Yogg and Kevin Murphy may also manage other accounts and variable trust funds advised by Putnam Management or an affiliate.
Changes in your fund’s Portfolio Leader and Portfolio Members
During the year ended April 30, 2006, Portfolio Members Srikantaiah Muralidhar and Hendrik Van Brevoort left your fund’s management team. After the close of the period, Portfolio Member Masroor Siddiqui also left your fund’s management team.
21
Fund ownership by Putnam’s Executive Board
The table below shows how much the members of Putnam’s Executive Board have invested in the fund (in dollar ranges). Information shown is as of April 30, 2006, and April 30, 2005.
| $1 – | $10,001 – | $50,001– | $100,001 | ||||
| Year | $0 | $10,000 | $50,000 | $100,000 | and over | ||
| Philippe Bibi | 2006 | * | |||||
| Chief Technology Officer | 2005 | * | |||||
| Joshua Brooks | 2006 | * | |||||
| Deputy Head of Investments | 2005 | * | |||||
| William Connolly | 2006 | * | |||||
| Head of Retail Management | N/A | ||||||
| Kevin Cronin | 2006 | * | |||||
| Head of Investments | 2005 | * | |||||
| Charles Haldeman, Jr. | 2006 | * | |||||
| President and CEO | 2005 | * | |||||
| Amrit Kanwal | 2006 | * | |||||
| Chief Financial Officer | 2005 | * | |||||
| Steven Krichmar | 2006 | * | |||||
| Chief of Operations | 2005 | * | |||||
| Francis McNamara, III | 2006 | * | |||||
| General Counsel | 2005 | * | |||||
| Richard Robie, III | 2006 | * | |||||
| Chief Administrative Officer | 2005 | * | |||||
| Edward Shadek | 2006 | * | |||||
| Deputy Head of Investments | 2005 | * | |||||
| Sandra Whiston | 2006 | * | |||||
| Head of Institutional Management | N/A | ||||||
N/A indicates the individual was not a member of Putnam’s Executive Board as of 4/30/05.
22
Terms and definitions
Important terms
Total return shows how the value of the fund’s shares changed over time, assuming you held the shares through the entire period and reinvested all distributions in the fund.
Net asset value (NAV) is the price, or value, of one share of a mutual fund, without a sales charge. NAVs fluctuate with market conditions. NAV is calculated by dividing the net assets of each class of shares by the number of outstanding shares in the class.
Public offering price (POP) is the price of a mutual fund share plus the maximum sales charge levied at the time of purchase. POP performance figures shown here assume the 5.25% maximum sales charge for class A shares and 3.25% for class M shares.
Contingent deferred sales charge (CDSC) is a charge applied at the time of the redemption of class B or C shares and assumes redemption at the end of the period. Your fund’s class B CDSC declines from a 5% maximum during the first year to 1% during the sixth year. After the sixth year, the CDSC no longer applies. The CDSC for class C shares is 1% for one year after purchase.
Share classes
Class A shares are generally subject to an initial sales charge and no sales charge on redemption (except on certain redemptions of shares bought without an initial sales charge).
Class B shares may be subject to a sales charge upon redemption.
Class C shares are not subject to an initial sales charge and are subject to a contingent deferred sales charge only if the shares are redeemed during the first year.
Class M shares have a lower initial sales charge and a higher 12b-1 fee than class A shares and no sales charge on redemption (except on certain redemptions of shares bought without an initial sales charge).
Class R shares are not subject to an initial sales charge or CDSC and are available only to certain defined contribution plans.
Class Y shares are not subject to an initial sales charge or CDSC, and carry no 12b-1 fee. They are only available to eligible purchasers, including eligible defined contribution plans or corporate IRAs.
23
Comparative indexes
JP Morgan Global High Yield Index is an unmanaged index of global high-yield fixed-income securities.
Lehman Aggregate Bond Index is an unmanaged index of U.S. investment-grade fixed-income securities.
Lehman Intermediate Treasury Bond Index is an unmanaged index of U.S. Treasury securities with maturities between 1 and 10 years.
Russell 1000 Growth Index is an unmanaged index of those companies in the large-cap Russell 1000 Index chosen for their growth orientation.
Russell 1000 Value Index is an unmanaged index of those companies in the large-cap Russell 1000 Index chosen for their value orientation.
S&P 500 Index is an unmanaged index of common stock performance.
S&P Utilities Index is an unmanaged index of common stock issued by utility companies.
Indexes assume reinvestment of all distributions and do not account for fees. Securities and performance of a fund and an index will differ. You cannot invest directly in an index.
Lipper is a third-party industry-ranking entity that ranks mutual funds. Its rankings do not reflect sales charges. Lipper rankings are based on total return at net asset value relative to other funds that have similar current investment styles or objectives as determined by Lipper. Lipper may change a fund’s category assignment at its discretion. Lipper category averages reflect performance trends for funds within a category.
24
Trustee approval of
management contract
General conclusions
The Board of Trustees of the Putnam funds oversees the management of each fund and, as required by law, determines annually whether to approve the continuance of your fund’s management contract with Putnam Management and its sub-management contract with Putnam Management’s affiliate, Putnam Investments Limited (“PIL”). In this regard, the Board of Trustees, with the assistance of its Contract Committee consisting solely of Trustees who are not “interested persons” (as such term is defined in the Investment Company Act of 1940, as amended) of the Putnam funds (the “Independent Trustees”), requests and evaluates all information it deems reasonably necessary under the circumstances. Over the course of several months beginning in March and ending in June 2005, the Contract Committee met five times to consider the information provided by Putnam Management and other information developed with the assistance of the Board’s independent counsel and independent staff. The Contract Committee reviewed and discussed key aspects of this information with all of the Independent Trustees. Upon completion of this review, the Contract Committee recommended and the Independent Trustees approved the continuance of your fund’s management contract and sub-management contract, effective July 1, 2005. Because PIL is an affiliate of Putnam Management and Putnam Management remains fully responsible for all services provided by PIL, the Trustees have not evaluated PIL as a separate entity and all subsequent references to Putnam Management below should be deemed to include reference to PIL as necessary or appropriate in the context.
This approval was based on the following conclusions:
* That the fee schedule currently in effect for your fund represents reasonable compensation in light of the nature and quality of the services being provided to the fund, the fees paid by competitive funds and the costs incurred by Putnam Management in providing such services, and
* That such fee schedule represents an appropriate sharing between fund shareholders and Putnam Management of such economies of scale as may exist in the management of the fund at current asset levels.
These conclusions were based on a comprehensive consideration of all information provided to the Trustees and were not the result of any single factor. Some of the factors that figured particularly in the Trustees’ deliberations and how the Trustees considered these factors are described below, although individual Trustees may have evaluated the information presented differently, giving different weights to various factors. It is also important to recognize that the fee arrangements for your fund and the other Putnam funds are the result of many years of review and discussion between the Independent Trustees and Putnam Management, that certain aspects of such arrangements may receive greater scrutiny in some years than others, and that the Trustees’ conclusions may be based, in part, on their consideration of these same arrangements in prior years.
25
Model fee schedules and categories; total expenses
The Trustees’ review of the management fees and total expenses of the Putnam funds focused on three major themes:
* Consistency. The Trustees, working in cooperation with Putnam Management, have developed and implemented a series of model fee schedules for the Putnam funds designed to ensure that each fund’s management fee is consistent with the fees for similar funds in the Putnam family of funds and compares favorably with fees paid by competitive funds sponsored by other investment advisors. Under this approach, each Putnam fund is assigned to one of several fee categories based on a combination of factors, including competitive fees and perceived difficulty of management, and a common fee schedule is implemented for all funds in a given fee category. The Trustees reviewed the model fee schedule then in effect for your fund, including fee levels and breakpoints, and the assignment of the fund to a particular fee category under this structure. (“Breakpoints” refer to reductions in fee rates that apply to additional assets once specified asset levels are reached.) The Trustees concluded that no changes should be made in the fund’s current fee schedule at this time.
* Competitiveness. The Trustees also reviewed comparative fee and expense information for competitive funds, which indicated that, in a custom peer group of competitive funds selected by Lipper Inc., your fund ranked in the 69th percentile in management fees and in the 31st percentile in total expenses (less any applicable 12b-1 fees) as of December 31, 2004 (the first percentile being the least expensive funds and the 100th percentile being the most expensive funds). (Because the fund’s custom peer group is smaller than the fund’s broad Lipper Inc. peer group, this expense comparison may differ from the Lipper peer expense information found elsewhere in this report.) The Trustees noted that expense ratios for a number of Putnam funds, which show the percentage of fund assets used to pay for management and administrative services, distribution (12b-1) fees and other expenses, had been increasing recently as a result of declining net assets and the natural operation of fee breakpoints. They noted that such expense ratio increases were currently being controlled by expense limitations implemented in January 2004 and which Putnam Management, in consultation with the Contract Committee, has committed to maintain at least through 2006. The Trustees expressed their intention to monitor this information closely to ensure that fees and expenses of the Putnam funds continue to meet evolving competitive standards.
* Economies of scale. The Trustees concluded that the fee schedule currently in effect for your fund represents an appropriate sharing of economies of scale at current asset levels. Your fund currently has the benefit of breakpoints in its management fee that provide shareholders with significant economies of scale, which means that the effective management fee rate of a fund (as a percentage of fund assets) declines as a fund grows in size and crosses specified asset thresholds. The Trustees examined the existing breakpoint structure of the Putnam funds’
26
management fees in light of competitive industry practices. The Trustees considered various possible modifications to the Putnam funds’ current breakpoint structure, but ultimately concluded that the current breakpoint structure continues to serve the interests of fund shareholders. Accordingly, the Trustees continue to believe that the fee schedules currently in effect for the funds represent an appropriate sharing of economies of scale at current asset levels. The Trustees noted that significant redemptions in many Putnam funds, together with significant changes in the cost structure of Putnam Management, have altered the economics of Putnam Management’s business in significant ways. In view of these changes, the Trustees intend to consider whether a greater sharing of the economies of scale by fund shareholders would be appropriate if and when aggregate assets in the Putnam funds begin to experience meaningful growth.
In connection with their review of the management fees and total expenses of the Putnam funds, the Trustees also reviewed the costs of the services to be provided and profits to be realized by Putnam Management and its affiliates from the relationship with the funds. This information included trends in revenues, expenses and profitability of Putnam Management and its affiliates relating to the investment management and distribution services provided to the funds. In this regard, the Trustees also reviewed an analysis of Putnam Management’s revenues, expenses and profitability with respect to the funds’ management contracts, allocated on a fund-by-fund basis.
Investment performance
The quality of the investment process provided by Putnam Management represented a major factor in the Trustees’ evaluation of the quality of services provided by Putnam Management under your fund’s management contract. The Trustees were assisted in their review of the funds’ investment process and performance by the work of the Investment Oversight Committees of the Trustees, which meet on a regular monthly basis with the funds’ portfolio teams throughout the year. The Trustees concluded that Putnam Management generally provides a high-quality investment process — as measured by the experience and skills of the individuals assigned to the management of fund portfolios, the resources made available to such personnel, and in general the ability of Putnam Management to attract and retain high-quality personnel — but also recognize that this does not guarantee favorable investment results for every fund in every time period. The Trustees considered the investment performance of each fund over multiple time periods and considered information comparing the fund’s performance with various benchmarks and with the performance of competitive funds. The Trustees noted the satisfactory investment performance of many Putnam funds. They also noted the disappointing investment performance of certain funds in recent years and continued to discuss with senior management of Putnam Management the factors contributing to such underperformance and actions being taken to improve performance. The Trustees recognized that, in recent years, Putnam Management has
27
made significant changes in its investment personnel and processes and in the fund product line to address areas of underperformance. The Trustees indicated their intention to continue to monitor performance trends to assess the effectiveness of these changes and to evaluate whether additional remedial changes are warranted.
In the case of your fund, the Trustees considered that your fund’s class A share cumulative total return performance at net asset value was in the following percentiles of its Lipper Inc. peer group (Lipper Utility Funds) for the one-, three- and five-year periods ended December 31, 2004 (the first percentile being the best-performing funds and the 100th percentile being the worst-performing funds):
| One-year period | Three-year period | Five-year period |
| 67th | 55th | 41st |
| (Because of the passage of time, these performance results may differ from the performance results for more recent periods shown elsewhere in this report. Over the one-, three-, and five-year periods ended December 31, 2004, there were 86, 74, and 63 funds, respectively, in your fund’s Lipper peer group.* Past performance is no guarantee of future performance.) | |
| As a general matter, the Trustees believe that cooperative efforts between the Trustees and Putnam Management represent the most effective way to address investment performance problems. The Trustees believe that investors in the Putnam funds have, in effect, placed their trust in the Putnam organization, under the oversight of the funds’ Trustees, to make appropriate decisions regarding the management of the funds. Based on the responsiveness of Putnam Management in the recent past to Trustee concerns about investment performance, the Trustees believe that it is preferable to seek change within Putnam Management to address performance shortcomings. In the Trustees’ view, the alternative of terminating a management contract and engaging a new investment advisor for an underperforming fund would entail significant disruptions and would not provide any greater assurance of improved investment performance. | |
| Brokerage and soft-dollar allocations; other benefits | |
| The Trustees considered various potential benefits that Putnam Management may receive in connection with the services it provides under the management contract with your fund. These include principally benefits related to brokerage and soft-dollar allocations, whereby a portion of the commissions paid by a fund for brokerage is earmarked to pay for research services that may be utilized by a fund’s investment advisor, subject to the obligation to seek best execution. The Trustees believe that soft-dollar credits and other potential benefits associated with the | |
| * | The percentile rankings for your fund’s class A share annualized total return performance in the Lipper Utility Funds category for the one-, five-, and ten-year periods ended March 31, 2006, were 86%, 75%, and 89%, respectively. Over the one-, five-, and ten-year periods ended March 31, 2006, the fund ranked 86th out of 100, 53rd out of 70, and 37th out of 41 funds, respectively. Note that this more recent information was not available when the Trustees approved the continuance of your fund’s management contract. |
28
allocation of fund brokerage, which pertains mainly to funds investing in equity securities, represent assets of the funds that should be used for the benefit of fund shareholders. This area has been marked by significant change in recent years. In July 2003, acting upon the Contract Committee’s recommendation, the Trustees directed that allocations of brokerage to reward firms that sell fund shares be discontinued no later than December 31, 2003. In addition, commencing in 2004, the allocation of brokerage commissions by Putnam Management to acquire research services from third-party service providers has been significantly reduced, and continues at a modest level only to acquire research that is customarily not available for cash. The Trustees will continue to monitor the allocation of the funds’ brokerage to ensure that the principle of “best price and execution” remains paramount in the portfolio trading process.
The Trustees’ annual review of your fund’s management contract also included the review of its distributor’s contract and distribution plan with Putnam Retail Management Limited Partnership and the custodian agreement and investor servicing agreement with Putnam Fiduciary Trust Company, all of which provide benefits to affiliates of Putnam Management.
Comparison of retail and institutional fee schedules
The information examined by the Trustees as part of their annual contract review has included for many years information regarding fees charged by Putnam Management and its affiliates to institutional clients such as defined benefit pension plans, college endowments, etc. This information included comparison of such fees with fees charged to the funds, as well as a detailed assessment of the differences in the services provided to these two types of clients. The Trustees observed, in this regard, that the differences in fee rates between institutional clients and the mutual funds are by no means uniform when examined by individual asset sectors, suggesting that differences in the pricing of investment management services to these types of clients reflect to a substantial degree historical competitive forces operating in separate market places. The Trustees considered the fact that fee rates across all asset sectors are higher on average for mutual funds than for institutional clients, as well as the differences between the services that Putnam Management provides to the Putnam funds and those that it provides to institutional clients of the firm, but have not relied on such comparisons to any significant extent in concluding that the management fees paid by your fund are reasonable.
29
Other information
for shareholders
Important notice regarding delivery of shareholder documents
In accordance with SEC regulations, Putnam sends a single copy of annual and semiannual shareholder reports, prospectuses, and proxy statements to Putnam shareholders who share the same address, unless a shareholder requests otherwise. If you prefer to receive your own copy of these documents, please call Putnam at 1-800-225-1581, and Putnam will begin sending individual copies within 30 days.
Proxy voting
Putnam is committed to managing our mutual funds in the best interests of our shareholders. The Putnam funds’ proxy voting guidelines and procedures, as well as information regarding how your fund voted proxies relating to portfolio securities during the 12-month period ended June 30, 2005, are available on the Putnam Individual Investor Web site, www.putnam.com/individual, and on the SEC’s Web site, www.sec.gov. If you have questions about finding forms on the SEC’s Web site, you may call the SEC at 1-800-SEC-0330. You may also obtain the Putnam funds’ proxy voting guidelines and procedures at no charge by calling Putnam’s Shareholder Services at 1-800-225-1581.
Fund portfolio holdings
The fund will file a complete schedule of its portfolio holdings with the SEC for the first and third quarters of each fiscal year on Form N-Q. Shareholders may obtain the fund’s Forms N-Q on the SEC’s Web site at www.sec.gov. In addition, the fund’s Forms N-Q may be reviewed and copied at the SEC’s Public Reference Room in Washington, D.C. You may call the SEC at 1-800-SEC-0330 for information about the SEC’s Web site or the operation of the Public Reference Room.
30
Financial statements
A guide to financial statements
These sections of the report, as well as the accompanying Notes, constitute the fund’s financial statements.
The fund’s portfolio lists all the fund’s investments and their values as of the last day of the reporting period. Holdings are organized by asset type and industry sector, country, or state to show areas of concentration and diversification.
Statement of assets and liabilities shows how the fund’s net assets and share price are determined. All investment and noninvestment assets are added together. Any unpaid expenses and other liabilities are subtracted from this total. The result is divided by the number of shares to determine the net asset value per share, which is calculated separately for each class of shares. (For funds with preferred shares, the amount subtracted from total assets includes the liquidation preference of preferred shares.)
Statement of operations shows the fund’s net investment gain or loss. This is done by first adding up all the fund’s earnings — from dividends and interest income — and subtracting its operating expenses to determine net investment income (or loss). Then, any net gain or loss the fund realized on the sales of its holdings — as well as any unrealized gains or losses over the period — is added to or subtracted from the net investment result to determine the fund’s net gain or loss for the fiscal period.
Statement of changes in net assets shows how the fund’s net assets were affected by the fund’s net investment gain or loss, by distributions to shareholders, and by changes in the number of the fund’s shares. It lists distributions and their sources (net investment income or realized capital gains) over the current reporting period and the most recent fiscal year-end. The distributions listed here may not match the sources listed in the Statement of operations because the distributions are determined on a tax basis and may be paid in a different period from the one in which they were earned. Dividend sources are estimated at the time of declaration. Actual results may vary. Any non-taxable return of capital cannot be determined until final tax calculations are completed after the end of the fund’s fiscal year.
Financial highlights provide an overview of the fund’s investment results, per-share distributions, expense ratios, net investment income ratios, and portfolio turnover in one summary table, reflecting the five most recent reporting periods. In a semiannual report, the highlight table also includes the current reporting period.
31
| The fund’s portfolio 4/30/06 (Unaudited) | |||
| COMMON STOCKS (95.4%)* | |||
| Shares | Value | ||
| Cable Television (0.1%) | |||
| Comcast Corp. Class A (Special) † | 25,800 | $ | 795,414 |
| Construction (0.3%) | |||
| Infrasourse Services, Inc. † | 74,840 | 1,413,728 | |
| Electric Utilities (60.0%) | |||
| Alliant Energy Corp. | 215,968 | 6,902,337 | |
| Chubu Electric Power, Inc. (Japan) | 127,400 | 3,336,188 | |
| CLP Holdings, Ltd. (Hong Kong) | 384,500 | 2,241,520 | |
| Consolidated Edison, Inc. (S) | 44,285 | 1,909,569 | |
| Constellation Energy Group, Inc. | 201,795 | 11,082,581 | |
| Dominion Resources, Inc. | 336,151 | 25,167,625 | |
| DPL, Inc. (S) | 276,451 | 7,511,174 | |
| Duke Energy Corp. (S) | 65,555 | 1,908,962 | |
| Edison International | 368,596 | 14,894,964 | |
| El Paso Electric Co. † | 98,856 | 1,952,406 | |
| Electric Power Development Co. (Japan) | 39,800 | 1,530,233 | |
| Enel SpA (Italy) | 954,538 | 8,235,348 | |
| Energy East Corp. (S) | 173,632 | 4,194,949 | |
| Entergy Corp. | 321,881 | 22,512,357 | |
| Exelon Corp. (S) | 620,852 | 33,526,004 | |
| FirstEnergy Corp. | 305,854 | 15,509,856 | |
| FPL Group, Inc. | 423,796 | 16,782,322 | |
| Great Plains Energy, Inc. | 97,210 | 2,746,183 | |
| Hera SpA (Italy) | 2,204,647 | 7,108,487 | |
| Hong Kong Electric Holdings, Ltd. (Hong Kong) | 149,500 | 736,567 | |
| Iberdrola SA (Spain) | 403,634 | 13,126,295 | |
| Kansai Electric Power, Inc. (Japan) | 157,200 | 3,669,101 | |
| Kyushu Electric Power Co., Inc. (Japan) | 49,000 | 1,141,531 | |
| Northeast Utilities | 236,063 | 4,756,669 | |
| NSTAR | 107,469 | 2,971,518 | |
| Oesterreichische Elektrizitaetswirtschafts AG | |||
| (Verbund) Class A (Austria) | 13,986 | 6,636,766 | |
| PG&E Corp. (S) | 558,815 | 22,263,190 | |
| PPL Corp. | 194,843 | 5,658,241 | |
| Progress Energy, Inc. (S) | 62,871 | 2,690,879 | |
| Public Service Enterprise Group, Inc. | 137,420 | 8,616,234 | |
| Scottish and Southern Energy PLC (United Kingdom) | 316,366 | 6,468,340 | |
| Sierra Pacific Resources † | 467,725 | 6,604,277 | |
| Southern Co. (The) | 184,902 | 5,959,391 | |
| Terna SPA (Italy) | 1,071,215 | 2,937,873 | |
| Tohoku Electric Power Co., Inc. (Japan) | 90,300 | 2,075,998 | |
| Tokyo Electric Power Co. (Japan) | 204,100 | 5,228,521 | |
| TXU Corp. | 315,302 | 15,648,438 | |
| Wisconsin Energy Corp. | 266,388 | 10,402,451 | |
| 316,645,345 | |||
32
| COMMON STOCKS (95.4%)* continued | |||
| Shares | Value | ||
| Investment Banking/Brokerage (0.1%) | |||
| Spark Infrastructure Group (Australia) | 625,545 | $ | 521,923 |
| Natural Gas Utilities (8.8%) | |||
| Australian Gas Light Co., Ltd. (Australia) | 29,756 | 437,857 | |
| Enbridge, Inc. (Canada) | 54,396 | 1,622,633 | |
| Equitable Resources, Inc. | 188,239 | 6,684,367 | |
| Gas Natural SDG SA (Spain) | 156,969 | 4,780,445 | |
| Hong Kong and China Gas Co., Ltd. (Hong Kong) | 591,000 | 1,410,156 | |
| Kinder Morgan, Inc. (S) | 37,326 | 3,285,435 | |
| MDU Resources Group, Inc. | 189,850 | 6,976,988 | |
| Osaka Gas Co., Ltd. (Japan) | 304,000 | 1,134,209 | |
| Sempra Energy | 306,546 | 14,107,247 | |
| Tokyo Gas Co., Ltd. (Japan) | 514,000 | 2,480,417 | |
| Williams Cos., Inc. (The) | 163,307 | 3,581,323 | |
| 46,501,077 | |||
| Oil & Gas (0.9%) | |||
| Questar Corp. | 56,433 | 4,517,462 | |
| Power Producers (2.2%) | |||
| AES Corp. (The) † | 644,969 | 10,945,124 | |
| Cheung Kong Infrastructure Holdings, Ltd. (Hong Kong) | 175,000 | 571,040 | |
| 11,516,164 | |||
| Publishing (0.1%) | |||
| Yellow Pages (Singapore), Ltd. (Singapore) | 528,000 | 530,905 | |
| Regional Bells (2.7%) | |||
| AT&T, Inc. # | 204,618 | 5,363,038 | |
| BellSouth Corp. | 87,556 | 2,957,642 | |
| Verizon Communications, Inc. | 179,824 | 5,939,587 | |
| 14,260,267 | |||
| Shipping (1.8%) | |||
| Autopistas Concesionaria Espanola SA (Spain) | 365,026 | 9,617,975 | |
| Telecommunications (13.2%) | |||
| ALLTEL Corp. | 10,867 | 699,509 | |
| American Tower Corp. Class A † | 81,107 | 2,768,993 | |
| CenturyTel, Inc. | 35,547 | 1,340,122 | |
| Digi.com Berhad (Malaysia) † | 727,900 | 2,249,581 | |
| Fastweb (Italy) † | 44,854 | 2,254,660 | |
| France Telecom SA (France) | 161,916 | 3,774,804 | |
| Hellenic Telecommunication Organization (OTE) | |||
| SA (Greece) † | 230,132 | 5,141,961 | |
| Hutchinson Telecommunications International, Ltd. | |||
| (Hong Kong) † | 531,800 | 936,243 | |
| Koninklijke (Royal) KPN NV (Netherlands) | 451,628 | 5,295,765 | |
| Mobistar SA (Belgium) | 33,702 | 2,701,794 | |
33
| COMMON STOCKS (95.4%)* continued | ||||
| Shares | Value | |||
| Telecommunications continued | ||||
| Nextel Partners, Inc. Class A † | 15,500 | $ | 439,270 | |
| Nippon Telegraph & Telephone (NTT) Corp. (Japan) | 289 | 1,290,857 | ||
| NTT DoCoMo, Inc. (Japan) | 1,228 | 1,828,341 | ||
| Orascom Telecom Holding SAE GDR (Egypt) | 3,857 | 207,121 | ||
| PanAmSat Holding Corp. | 67,018 | 1,665,397 | ||
| Singapore Telecommunications, Ltd. (Singapore) | 689,000 | 1,193,866 | ||
| Sprint Nextel Corp. | 368,240 | 9,132,352 | ||
| StarHub, Ltd. (Singapore) | 1,491,000 | 2,112,085 | ||
| Telecom Corp. of New Zealand, Ltd. (New Zealand) | 444,162 | 1,617,633 | ||
| Telenor ASA (Norway) | 311,208 | 3,603,344 | ||
| Telus Corp. (Canada) | 87,851 | 3,622,883 | ||
| Vodafone Group PLC (United Kingdom) | 6,822,244 | 16,056,376 | ||
| 69,932,957 | ||||
| Telephone (0.2%) | ||||
| Belgacom SA (Belgium) | 26,145 | 854,195 | ||
| Transportation Services (0.9%) | ||||
| Deutsche Post AG (Germany) | 182,019 | 4,846,407 | ||
| Water Utilities (4.1%) | ||||
| Aqua America, Inc. | 95,555 | 2,283,765 | ||
| Pennon Group PLC (United Kingdom) | 261,002 | 6,327,763 | ||
| Southwest Water Co. | 23,648 | 361,105 | ||
| Veolia Environnement (France) | 210,924 | 12,581,600 | ||
| 21,554,233 | ||||
| Total common stocks (cost $415,578,252) | $ | 503,508,052 | ||
| CORPORATE BONDS AND NOTES (0.7%)* | ||||
| Principal amount | Value | |||
| Ameritech Capital Funding company guaranty 6 1/4s, 2009 | $ | 605,000 | $ | 615,588 |
| Indianapolis Power & Light 144A 1st mtge. 6.3s, 2013 | 155,000 | 156,234 | ||
| Ipalco Enterprises, Inc. sec. notes 8 3/8s, 2008 | 35,000 | 36,400 | ||
| Kansas Gas & Electric bonds 5.647s, 2021 | 400,000 | 376,172 | ||
| Monongahela Power Co. 1st mtge. 5s, 2006 | 195,000 | 194,487 | ||
| Motiva Enterprises, LLC 144A sr. notes 5.2s, 2012 | 55,000 | 53,426 | ||
| Nevada Power Co. 2nd mtge. 9s, 2013 | 47,000 | 51,619 | ||
| Nevada Power Co. general ref. mtge. Ser. L, 5 7/8s, 2015 | 325,000 | 313,107 | ||
| PacifiCorp Sinking Fund 1st mtge. 5.45s, 2013 | 70,000 | 68,876 | ||
| Power Receivable Finance, LLC 144A sr. notes 6.29s, 2012 | 162,384 | 162,800 | ||
| Public Service Co. of Colorado sr. notes Ser. A, 6 7/8s, 2009 | 248,000 | 257,273 | ||
| Public Service Electric & Gas Co. sec. notes 5s, 2014 | 610,000 | 577,093 | ||
| TransAlta Corp. notes 6 3/4s, 2012 (Canada) | 815,000 | 841,530 | ||
| Verizon New Jersey, Inc. debs. 8s, 2022 | 55,000 | 58,793 | ||
| Total corporate bonds and notes (cost $3,920,868) | $ | 3,763,398 | ||
34
| SHORT-TERM INVESTMENTS (10.9%)* | |||
| Principal amount/shares | Value | ||
| Short-term investments held as collateral for loaned | |||
| securities with yields ranging from 4.70% to 5.01% | |||
| and due dates ranging from May 1, 2006 to June 2, 2006 (d) | $ 38,164,223 | $ | 38,119,372 |
| Putnam Prime Money Market Fund (e) | 19,194,723 | 19,194,723 | |
| Total short-term investments (cost $57,314,095) | $ | 57,314,095 | |
| TOTAL INVESTMENTS | |||
| Total investments (cost $476,813,215) | $ | 564,585,545 | |
* Percentages indicated are based on net assets of $527,574,271.
† Non-income-producing security.
(S) Securities on loan, in part or in entirety, at April 30, 2006.
# A portion of this security was pledged and segregated with the custodian to cover margin requirements for futures contracts at April 30, 2006.
(d) See Note 1 to the financial statements.
(e) See Note 5 to the financial statements regarding investments in Putnam Prime Money Market Fund.
At April 30, 2006, liquid assets totaling $680,528 have been designated as collateral for open forward contracts and swap contracts.
144A after the name of an issuer represents securities exempt from registration under Rule 144A of the Securities Act of 1933. These securities may be resold in transactions exempt from registration, normally to qualified institutional buyers.
GDR after the name of a foreign holding stands for Global Depository Receipts, representing ownership of foreign securities on deposit with a custodian bank.
DIVERSIFICATION BY COUNTRY
Distribution of investments by country of issue at April 30, 2006 (as a percentage of Portfolio Value):
| Austria | 1.3% |
| Belgium | 0.7 |
| Canada | 1.2 |
| France | 3.1 |
| Germany | 0.9 |
| Greece | 1.0 |
| Hong Kong | 1.1 |
| Italy | 3.9 |
| Japan | 4.5 |
| Netherlands | 1.0 |
| Norway | 0.7 |
| Singapore | 0.7 |
| Spain | 5.2 |
| United Kingdom | 5.5 |
| United States | 68.3 |
| Other | 0.9 |
| Total | 100.0% |
35
FORWARD CURRENCY CONTRACTS TO BUY at 4/30/06 (aggregate face value $12,882,426) (Unaudited)
| Unrealized | ||||||
| Aggregate | Delivery | appreciation/ | ||||
| Value | face value | date | (depreciation) | |||
| Australian Dollar | $ | 803,795 | $ | 774,374 | 7/19/06 | $ 29,421 |
| British Pound | 7,313,533 | 7,050,454 | 6/21/06 | 263,079 | ||
| Hong Kong Dollar | 1,148,781 | 1,149,234 | 5/17/06 | (453) | ||
| Japanese Yen | 1,957,814 | 1,927,858 | 5/17/06 | 29,956 | ||
| Swedish Krona | 1,586,377 | 1,494,908 | 6/21/06 | 91,469 | ||
| Swiss Franc | 504,266 | 485,598 | 6/21/06 | 18,668 | ||
| Total | $432,140 | |||||
FORWARD CURRENCY CONTRACTS TO SELL at 4/30/06 (aggregate face value $17,170,392) (Unaudited)
| Unrealized | |||||
| Aggregate | Delivery | appreciation/ | |||
| Value | face value | date | (depreciation) | ||
| Canadian Dollar | $ 33,187 | $ 32,396 | 7/19/06 | $ (791) | |
| Danish Krone | 745 | 712 | 6/21/06 | (33) | |
| Euro | 8,872,341 | 8,573,830 | 6/21/06 | (298,511) | |
| Hong Kong Dollar | 1,846,283 | 1,848,561 | 5/17/06 | 2,278 | |
| New Zealand Dollar | 871,433 | 834,362 | 7/19/06 | (37,071) | |
| Norwegian Krone | 2,996,621 | 2,796,588 | 6/21/06 | (200,033) | |
| Singapore Dollar | 2,846,203 | 2,770,103 | 5/17/06 | (76,100) | |
| Swedish Krona | 333,605 | 313,840 | 6/21/06 | (19,765) | |
| Total | $(630,026) | ||||
| FUTURES CONTRACTS OUTSTANDING at 4/30/06 (Unaudited) | |||||
| Unrealized | |||||
| Number of | Expiration | appreciation/ | |||
| contracts | Value | date | (depreciation) | ||
| Euro 90 day (Long) | 119 | $28,191,100 | Sep-06 | $(43,811) | |
| Euro 90 day (Short) | 114 | 27,015,150 | Mar-07 | 93,144 | |
| U.S. Treasury Bond 20 yr (Short) | 18 | 1,923,188 | Jun-06 | (1,159) | |
| U.S. Treasury Note 2 yr (Short) | 151 | 30,763,891 | Jun-06 | 39,443 | |
| U.S. Treasury Note 5 yr (Long) | 175 | 18,227,344 | Jun-06 | (84,224) | |
| U.S. Treasury Note 10 yr (Long) | 52 | 5,490,063 | Jun-06 | (34,503) | |
| Total | $(31,110) | ||||
| CREDIT DEFAULT CONTRACTS OUTSTANDING at 4/30/06 (Unaudited) | |||||
| Upfront | Fixed payments | ||||
| Swap counterparty / | premium | Notional | Termination | received (paid) by | Unrealized |
| Referenced Debt* | received (paid)** | amount | date | fund per annum | depreciation |
| Deutsche Bank AG | |||||
| France Telecomm, 7.25%, | |||||
| 1/28/13 | — | $680,000 | 9/20/10 | 41 bp | $(1,360) |
| * | Payments related to the reference debt are made upon a credit default event. |
| ** | Upfront premium is based on the difference between the original spread on issue and the market spread on day of execution. |
| The accompanying notes are an integral part of these financial statements. | |
36
| Statement of assets and liabilities 4/30/06 (Unaudited) | |
| ASSETS | |
| Investment in securities, at value, including $37,113,268 of securities on loan (Note 1): | |
| Unaffiliated issuers (identified cost $457,618,492) | $545,390,822 |
| Affiliated issuers (identified cost $19,194,723) (Note 5) | 19,194,723 |
| Foreign currency (cost $131) (Note 1) | 129 |
| Dividends, interest and other receivables | 1,060,706 |
| Receivable for shares of the fund sold | 133,239 |
| Receivable for securities sold | 5,658,281 |
| Receivable for variation margin (Note 1) | 11,863 |
| Receivable for open forward currency contracts (Note 1) | 434,871 |
| Receivable for closed forward currency contracts (Note 1) | 27,951 |
| Total assets | 571,912,585 |
| LIABILITIES | |
| Payable for securities purchased | 3,095,605 |
| Payable for shares of the fund repurchased | 987,008 |
| Payable for compensation of Manager (Notes 2 and 5) | 904,641 |
| Payable for investor servicing and custodian fees (Note 2) | 109,921 |
| Payable for Trustee compensation and expenses (Note 2) | 146,486 |
| Payable for administrative services (Note 2) | 3,200 |
| Payable for distribution fees (Note 2) | 152,618 |
| Payable for open forward currency contracts (Note 1) | 632,757 |
| Payable for closed forward currency contracts (Note 1) | 78,441 |
| Unrealized depreciation on swap contracts (Note 1) | 1,360 |
| Collateral on securities loaned, at value (Note 1) | 38,119,372 |
| Other accrued expenses | 106,905 |
| Total liabilities | 44,338,314 |
| Net assets | $527,574,271 |
| REPRESENTED BY | |
| Paid-in capital (Unlimited shares authorized) (Notes 1 and 4) | $534,348,039 |
| Distributions in excess of net investment income (Note 1) | (285,644) |
| Accumulated net realized loss on investments | |
| and foreign currency transactions (Note 1) | (94,040,689) |
| Net unrealized appreciation of investments | |
| and assets and liabilities in foreign currencies | 87,552,565 |
| Total — Representing net assets applicable to capital shares outstanding | $527,574,271 |
| (Continued on next page) | |
37
| Statement of assets and liabilities (Continued) | |
| COMPUTATION OF NET ASSET VALUE AND OFFERING PRICE | |
| Net asset value and redemption price per class A share | |
| ($451,106,807 divided by 40,247,125 shares) | $11.21 |
| Offering price per class A share | |
| (100/94.75 of $11.21)* | $11.83 |
| Net asset value and offering price per class B share | |
| ($65,842,600 divided by 5,907,180 shares)** | $11.15 |
| Net asset value and offering price per class C share | |
| ($4,243,529 divided by 380,935 shares)** | $11.14 |
| Net asset value and redemption price per class M share | |
| ($3,182,815 divided by 284,404 shares) | $11.19 |
| Offering price per class M share | |
| (100/96.75 of $11.19)* | $11.57 |
| Net asset value, offering price and redemption price per class R share | |
| ($218,610 divided by 19,534 shares) | $11.19 |
| Net asset value, offering price and redemption price per class Y share | |
| ($2,979,910 divided by 265,812 shares) | $11.21 |
| * | On single retail sales of less than $50,000. On sales of $50,000 or more and on group sales, the offering price is reduced. |
| ** | Redemption price per share is equal to net asset value less any applicable contingent deferred sales charge. |
The accompanying notes are an integral part of these financial statements.
38
| Statement of operations Six months ended 4/30/06 (Unaudited) | |
| INVESTMENT INCOME | |
| Dividends (net of foreign tax of $130,896) | $ 6,966,697 |
| Interest (including interest income of $373,383 | |
| from investments in affiliated issuers) (Note 5) | 1,132,138 |
| Securities lending | 30,924 |
| Total investment income | 8,129,759 |
| EXPENSES | |
| Compensation of Manager (Note 2) | 1,877,559 |
| Investor servicing fees (Note 2) | 502,644 |
| Custodian fees (Note 2) | 165,737 |
| Trustee compensation and expenses (Note 2) | 19,100 |
| Administrative services (Note 2) | 14,996 |
| Distribution fees — Class A (Note 2) | 571,510 |
| Distribution fees — Class B (Note 2) | 371,252 |
| Distribution fees — Class C (Note 2) | 22,236 |
| Distribution fees — Class M (Note 2) | 13,096 |
| Distribution fees — Class R (Note 2) | 624 |
| Other | 92,819 |
| Non-recurring costs (Notes 2 and 6) | 3,837 |
| Costs assumed by Manager (Notes 2 and 6) | (3,837) |
| Fees waived and reimbursed by Manager or affiliate (Notes 5 and 6) | (66,221) |
| Total expenses | 3,585,352 |
| Expense reduction (Note 2) | (73,976) |
| Net expenses | 3,511,376 |
| Net investment income | 4,618,383 |
| Net realized gain on investments (Notes 1 and 3) | 30,090,120 |
| Net realized gain on swap contracts (Note 1) | 1,401 |
| Net realized loss on futures contracts (Note 1) | (620,797) |
| Net realized gain on foreign currency transactions (Note 1) | 233,625 |
| Net unrealized depreciation of assets and liabilities | |
| in foreign currencies during the period | (396,810) |
| Net unrealized depreciation of investments, futures contracts | |
| and swap contracts during the period | (16,850,115) |
| Net gain on investments | 12,457,424 |
| Net increase in net assets resulting from operations | $ 17,075,807 |
| The accompanying notes are an integral part of these financial statements. | |
39
| Statement of changes in net assets | ||
| INCREASE (DECREASE) IN NET ASSETS | ||
| Six months ended | Year ended | |
| 4/30/06* | 10/31/05 | |
| Operations: | ||
| Net investment income | $ 4,618,383 | $ 11,320,952 |
| Net realized gain on investments | ||
| and foreign currency transactions | 29,704,349 | 63,124,234 |
| Net unrealized appreciation (depreciation) of investments | ||
| and assets and liabilities in foreign currencies | (17,246,925) | 11,960,893 |
| Net increase in net assets resulting from operations | 17,075,807 | 86,406,079 |
| Distributions to shareholders: (Note 1) | ||
| From net investment income | ||
| Class A | (4,893,780) | (9,262,544) |
| Class B | (516,564) | (1,061,588) |
| Class C | (31,674) | (52,149) |
| Class M | (28,447) | (60,094) |
| Class R | (2,566) | (3,077) |
| Class Y | (37,641) | — |
| Redemption fees (Note 1) | — | 2,264 |
| Decrease from capital share transactions (Note 4) | (51,392,471) | (52,819,205) |
| Total increase (decrease) in net assets | (39,827,336) | 23,149,686 |
| NET ASSETS | ||
| Beginning of period | 567,401,607 | 544,251,921 |
| End of period (including distributions in excess | ||
| of net investment income of $285,644 | ||
| and undistributed net investment income | ||
| of $606,645, respectively) | $527,574,271 | $567,401,607 |
| * Unaudited | ||
The accompanying notes are an integral part of these financial statements.
40
This page left blank intentionally.
41
| Financial highlights | (For a common share outstanding throughout the period) | ||||||||||||||
| INVESTMENT OPERATIONS: | LESS DISTRIBUTIONS: | RATIOS AND SUPPLEMENTAL DATA: | |||||||||||||
| Net | Total | Ratio of net | |||||||||||||
| Net asset | realized and | Total | From | From | From | Net asset | return | Net | Ratio of | investment | |||||
| value, | Net | unrealized | from | net | net realized | return | value, | at net | assets, | expenses to | income (loss) | Portfolio | |||
| beginning | investment | gain (loss) on | investment | investment | gain on | of | Total | Redemption | end | asset | end of period | average net | to average | turnover | |
| Period ended | of period | income (loss)(a) | investments | operations | income | investments | capital | distributions | fees | of period | value (%)(b) | (in thousands) | assets (%)(c) | net assets (%) | (%) |
| CLASS A | |||||||||||||||
| April 30, 2006** | $10.97 | .10(d,g) | .26 | .36 | (.12) | — | — | (.12) | — | $11.21 | 3.28* | $451,107 | .60*(d,g) | .90*(d,g) | 30.13* |
| October 31, 2005 | 9.58 | .22(d,f ) | 1.38 | 1.60 | (.21) | — | — | (.21) | —(e) | 10.97 | 16.76(f ) | 473,589 | 1.22(d) | 2.11(d,f ) | 38.79 |
| October 31, 2004 | 8.06 | .18(d) | 1.51 | 1.69 | (.17) | — | — | (.17) | — | 9.58 | 21.18 | 444,698 | 1.28(d) | 2.11(d) | 29.95 |
| October 31, 2003 | 6.71 | .19 | 1.34 | 1.53 | (.17) | — | (.01) | (.18) | — | 8.06 | 23.17 | 478,304 | 1.23 | 2.65 | 40.12 |
| October 31, 2002 | 9.56 | .23 | (2.84) | (2.61) | (.22) | — | (.02) | (.24) | — | 6.71 | (27.73) | 469,497 | 1.12 | 2.68 | 44.93 |
| October 31, 2001 | 13.86 | .25 | (2.73) | (2.48) | (.25) | (1.53) | (.04) | (1.82) | — | 9.56 | (20.40) | 846,231 | 1.05 | 2.14 | 91.91 |
| CLASS B | |||||||||||||||
| April 30, 2006** | $10.91 | .06(d,g) | .26 | .32 | (.08) | — | — | (.08) | — | $11.15 | 2.89* | $65,843 | .97*(d,g) | .53*(d,g) | 30.13* |
| October 31, 2005 | 9.53 | .14(d,f ) | 1.37 | 1.51 | (.13) | — | — | (.13) | —(e) | 10.91 | 15.86(f ) | 81,553 | 1.97(d) | 1.37(d,f ) | 38.79 |
| October 31, 2004 | 8.02 | .12(d) | 1.49 | 1.61 | (.10) | — | — | (.10) | — | 9.53 | 20.21 | 92,191 | 2.03(d) | 1.37(d) | 29.95 |
| October 31, 2003 | 6.67 | .14 | 1.34 | 1.48 | (.12) | — | (.01) | (.13) | — | 8.02 | 22.40 | 111,163 | 1.98 | 1.89 | 40.12 |
| October 31, 2002 | 9.51 | .16 | (2.82) | (2.66) | (.16) | — | (.02) | (.18) | — | 6.67 | (28.35) | 107,158 | 1.87 | 1.92 | 44.93 |
| October 31, 2001 | 13.78 | .16 | (2.70) | (2.54) | (.17) | (1.53) | (.03) | (1.73) | — | 9.51 | (20.93) | 213,564 | 1.80 | 1.39 | 91.91 |
| CLASS C | |||||||||||||||
| April 30, 2006** | $10.91 | .06(d,g) | .25 | .31 | (.08) | — | — | (.08) | — | $11.14 | 2.82* | $4,244 | .97*(d,g) | .52*(d,g) | 30.13* |
| October 31, 2005 | 9.53 | .14(d,f ) | 1.37 | 1.51 | (.13) | — | — | (.13) | —(e) | 10.91 | 15.91(f ) | 4,333 | 1.97(d) | 1.37(d,f ) | 38.79 |
| October 31, 2004 | 8.02 | .12(d) | 1.50 | 1.62 | (.11) | — | — | (.11) | — | 9.53 | 20.27 | 3,655 | 2.03(d) | 1.36(d) | 29.95 |
| October 31, 2003 | 6.67 | .14 | 1.34 | 1.48 | (.12) | — | (.01) | (.13) | — | 8.02 | 22.45 | 3,699 | 1.98 | 1.87 | 40.12 |
| October 31, 2002 | 9.51 | .16 | (2.82) | (2.66) | (.16) | — | (.02) | (.18) | — | 6.67 | (28.37) | 3,332 | 1.87 | 1.93 | 44.93 |
| October 31, 2001 | 13.79 | .16 | (2.70) | (2.54) | (.18) | (1.53) | (.03) | (1.74) | — | 9.51 | (20.93) | 6,028 | 1.80 | 1.38 | 91.91 |
| CLASS M | |||||||||||||||
| April 30, 2006** | $10.95 | .07(d,g) | .26 | .33 | (.09) | — | — | (.09) | — | $11.19 | 3.01* | $3,183 | .85*(d,g) | .66*(d,g) | 30.13* |
| October 31, 2005 | 9.57 | .17(d,f ) | 1.37 | 1.54 | (.16) | — | — | (.16) | —(e) | 10.95 | 16.11(f ) | 3,925 | 1.72(d) | 1.62(d,f ) | 38.79 |
| October 31, 2004 | 8.05 | .14(d) | 1.51 | 1.65 | (.13) | — | — | (.13) | — | 9.57 | 20.58 | 3,613 | 1.78(d) | 1.61(d) | 29.95 |
| October 31, 2003 | 6.70 | .16 | 1.34 | 1.50 | (.14) | — | (.01) | (.15) | — | 8.05 | 22.61 | 4,307 | 1.73 | 2.16 | 40.12 |
| October 31, 2002 | 9.55 | .18 | (2.83) | (2.65) | (.18) | — | (.02) | (.20) | — | 6.70 | (28.16) | 4,358 | 1.62 | 2.17 | 44.93 |
| October 31, 2001 | 13.83 | .19 | (2.71) | (2.52) | (.20) | (1.53) | (.03) | (1.76) | — | 9.55 | (20.72) | 8,692 | 1.55 | 1.64 | 91.91 |
| CLASS R | |||||||||||||||
| April 30, 2006** | $10.96 | .09(d,g) | .25 | .34 | (.11) | — | — | (.11) | — | $11.19 | 3.08* | $219 | .72*(d,g) | .77*(d,g) | 30.13* |
| October 31, 2005 | 9.57 | .20(d,f ) | 1.38 | 1.58 | (.19) | — | — | (.19) | —(e) | 10.96 | 16.53(f ) | 221 | 1.47(d) | 1.84(d,f ) | 38.79 |
| October 31, 2004† | 8.20 | .15(d) | 1.38 | 1.53 | (.16) | — | — | (.16) | — | 9.57 | 18.86* | 95 | 1.41*(d) | 1.71*(d) | 29.95 |
| CLASS Y | |||||||||||||||
| April 30, 2006** | $10.97 | .12(d,g) | .25 | .37 | (.13) | — | — | (.13) | — | $11.21 | 3.40* | $2,980 | .48*(d,g) | 1.05*(d,g) | 30.13* |
| October 31, 2005†† | 11.59 | .10(d) | (.72) | (.62) | — | — | — | — | —(e) | 10.97 | (5.35)* | 3,781 | .07*(d) | .07*(d) | 38.79 |
| See notes to financial highlights at the end of this section. | |||||||||||||||
The accompanying notes are an integral part of these financial statements.
42 43
Financial highlights (Continued)
* Not annualized.
** Unaudited.
† For the period December 1, 2003 (commencement of operations) to October 31, 2004.
†† For the period October 4, 2005 (commencement of operations) to October 31, 2005.
(a) Per share net investment income (loss) has been determined on the basis of the weighted average number of shares outstanding during the period.
(b) Total return assumes dividend reinvestment and does not reflect the effect of sales charges.
(c) Includes amounts paid through expense offset and brokerage service arrangements (Note 2).
(d) Reflects waivers of certain fund expenses in connection with investments in Putnam Prime Market Fund during the period. As a result of such waivers, the expenses of each class, as a percentage of its net assets, reflect a reduction of the following amounts (Note 5):
| 4/30/06 | 10/31/05 | 10/31/04 | |
| Class A | <0.01% | <0.01% | <0.01% |
| Class B | <0.01 | <0.01 | <0.01 |
| Class C | <0.01 | <0.01 | <0.01 |
| Class M | <0.01 | <0.01 | <0.01 |
| Class R | <0.01 | <0.01 | <0.01 |
| Class Y | <0.01 | <0.01 | — |
(e) Amount represents less than $0.01 per share.
(f) Reflects a non-recurring accrual related to Putnam Management’s settlement with the SEC regarding brokerage allocation practices, which amounted to the following amounts (Note 6):
| Percentage of | ||
| Per share | net assets | |
| Class A | $0.01 | 0.06% |
| Class B | 0.01 | 0.06 |
| Class C | 0.01 | 0.06 |
| Class M | 0.01 | 0.06 |
| Class R | 0.01 | 0.06 |
(g) Reflects a non-recurring accrual related to a reimbursement to the fund from Putnam Investments relating to the calculation of certain amounts paid by the fund to Putnam in previous years for transfer agent services, which amounted to less than $0.01 per share and 0.01% of average net assets for the period ended April 30, 2006 (Note 6).
The accompanying notes are an integral part of these financial statements.
44
Notes to financial statements 4/30/06 (Unaudited)
Note 1: Significant accounting policies
Putnam Utilities Growth and Income Fund (the “fund”), a Massachusetts business trust, is registered under the Investment Company Act of 1940, as amended, as a diversified, open-end management investment company. The fund seeks capital growth and current income primarily through investments in equity and debt securities issued by public utility companies. The fund concentrates its investments in one sector which involves more risk than a fund that invests more broadly.
The fund offers class A, class B, class C, class M, class R and class Y shares. Class A and class M shares are sold with a maximum front-end sales charge of 5.25% and 3.25%, respectively, and generally do not pay a contingent deferred sales charge. Class B shares, which convert to class A shares after approximately eight years, do not pay a front-end sales charge and are subject to a contingent deferred sales charge, if those shares are redeemed within six years of purchase. Class C shares have a one-year 1.00% contingent deferred sales charge and do not convert to class A shares. Class R shares, which are offered to qualified employee-benefit plans are sold without a front-end sales charge or a contingent deferred sales charge. The expenses for class A, class B, class C, class M and class R shares may differ based on the distribution fee of each class, which is identified in Note 2. Class Y shares, which are sold at net asset value, are generally subject to the same expenses as class A, class B, class C, class M and class R shares, but do not bear a distribution fee. Class Y shares are sold to certain eligible purchasers including certain defined contribution plans (including corporate IRAs), bank trust departments and trust companies.
A 2.00% redemption fee may apply to any shares that are redeemed (either by selling or exchanging into another fund) within 5 days of purchase. The redemption fee is accounted for as an addition to paid-in-capital.
Investment income, realized and unrealized gains and losses and expenses of the fund are borne pro-rata based on the relative net assets of each class to the total net assets of the fund, except that each class bears expenses unique to that class (including the distribution fees applicable to such classes). Each class votes as a class only with respect to its own distribution plan or other matters on which a class vote is required by law or determined by the Trustees. Shares of each class would receive their pro-rata share of the net assets of the fund, if the fund were liquidated. In addition, the Trustees declare separate dividends on each class of shares.
In the normal course of business, the fund enters into contracts that may include agreements to indemnify another party under given circumstances. The fund’s maximum exposure under these arrangements is unknown as this would involve future claims that may be, but have not yet been, made against the fund. However, the fund expects the risk of material loss to be remote.
The following is a summary of significant accounting policies consistently followed by the fund in the preparation of its financial statements. The prepara tion of financial statements is in conformity with accounting principles generally accepted in the United States of America and requires management to make estimates and assumptions that affect the reported amounts of assets and liabilities in the financial statements and the reported amounts of increases and decreases in net assets from operations during the reporting period. Actual results could differ from those estimates.
A) Security valuation Investments for which market quotations are readily available are valued at the last reported sales price on their principal exchange, or official closing price for certain markets. If no sales are reported — as in the case of some securities traded over-the-counter — a security is valued at its last reported bid price. Market quotations are not considered to be readily available for certain debt obligations; such investments are valued on the basis of valuations furnished by an independent pricing service approved by the Trustees or dealers selected by Putnam Investment Management, LLC (“Putnam
45
Management”), the fund’s manager, an indirect wholly-owned subsidiary of Putnam, LLC. Such services or dealers determine valuations for normal institutional-size trading units of such securities using methods based on market transactions for comparable securities and various relationships, generally recognized by institutional traders, between securities. Many securities markets and exchanges outside the U.S. close prior to the close of the New York Stock Exchange and therefore the closing prices for securities in such markets or on such exchanges may not fully reflect events that occur after such close but before the close of the New York Stock Exchange. Accordingly, on certain days, the fund will fair value foreign equity securities taking into account multiple factors, including movements in the U.S. securities markets. The number of days on which fair value prices will be used will depend on market activity and it is possible that fair value prices will be used by the fund to a significant extent. Securities quoted in foreign currencies, if any, are translated into U.S. dollars at the current exchange rate. Other investments, including certain restricted securities, are valued at fair value following procedures approved by the Trustees. Such valuations and procedures are reviewed periodically by the Trustees.
B) Joint trading account Pursuant to an exemptive order from the Securities and Exchange Commission, the fund may transfer uninvested cash balances, including cash collateral received under security lending arrangements, into a joint trading account along with the cash of other registered investment companies and certain other accounts managed by Putnam Management. These balances may be invested in issues of high-grade, short-term investments having maturities of up to 397 days for collateral received under security lending arrangements and up to 90 days for other cash investments.
C) Repurchase agreements The fund, or any joint trading account, through its custodian, receives delivery of the underlying securities, the market value of which at the time of purchase is required to be in an amount at least equal to the resale price, including accrued interest. Collateral for certain tri-party repurchase agreements is held at the counterparty’s custodian in a segregated account for the benefit of the fund and the coun-terparty. Putnam Management is responsible for determining that the value of these underlying securities is at all times at least equal to the resale price, including accrued interest.
D) Security transactions and related investment income Security transactions are recorded on the trade date (the date the order to buy or sell is executed). Gains or losses on securities sold are determined on the identified cost basis.
Interest income is recorded on the accrual basis. Dividend income, net of applicable withholding taxes, is recognized on the ex-dividend date except that certain dividends from foreign securities, if any, are recognized as soon as the fund is informed of the ex-dividend date. Non-cash dividends, if any, are recorded at the fair market value of the securities received.
All premiums/discounts are amortized/accreted on a yield-to-maturity basis.
E) Foreign currency translation The accounting records of the fund are maintained in U.S. dollars. The market value of foreign securities, currency holdings, and other assets and liabilities are recorded in the books and records of the fund after translation to U.S. dollars based on the exchange rates on that day. The cost of each security is determined using historical exchange rates. Income and withholding taxes are translated at prevailing exchange rates when earned or incurred. The fund does not isolate that portion of realized or unrealized gains or losses resulting from changes in the foreign exchange rate on investments from fluctuations arising from changes in the market prices of the securities. Such gains and losses are included with the net realized and unrealized gain or loss on investments. Net realized gains and losses on foreign currency transactions represent net realized exchange gains or losses on closed forward
46
currency contracts, disposition of foreign currencies, currency gains and losses realized between the trade and settlement dates on securities transactions and the difference between the amount of investment income and foreign withholding taxes recorded on the fund’s books and the U.S. dollar equivalent amounts actually received or paid. Net unrealized appreciation and depreciation of assets and liabilities in foreign currencies arise from changes in the value of open forward currency contracts and assets and liabilities other than investments at the period end, resulting from changes in the exchange rate. Investments in foreign securities involve certain risks, including those related to economic instability, unfavorable political developments, and currency fluctuations, not present with domestic investments.
F) Forward currency contracts The fund may buy and sell forward currency contracts, which are agreements between two parties to buy and sell currencies at a set price on a future date. These contracts are used to protect against a decline in value relative to the U.S. dollar of the currencies in which its portfolio securities are denominated or quoted (or an increase in the value of a currency in which securities a fund intends to buy are denominated, when a fund holds cash reserves and short-term investments), or for other investment purposes. The U.S. dollar value of forward currency contracts is determined using current forward currency exchange rates supplied by a quotation service. The market value of the contract will fluctuate with changes in currency exchange rates. The contract is marked-to-market daily and the change in market value is recorded as an unrealized gain or loss. When the contract is closed, the fund records a realized gain or loss equal to the difference between the value of the contract at the time it was opened and the value at the time it was closed. The fund could be exposed to risk if the value of the currency changes unfavorably, if the counterparties to the contracts are unable to meet the terms of their contracts or if the fund is unable to enter into a closing position. Risks may exceed amounts recognized on the statement of assets and liabilities. Forward currency contracts outstanding at period end, if any, are listed after the fund’s portfolio.
G) Futures and options contracts The fund may use futures and options contracts to hedge against changes in the values of securities the fund owns or expects to purchase, or for other investment purposes. The fund may also write options on swaps or securities it owns or in which it may invest to increase its current returns.
The potential risk to the fund is that the change in value of futures and options contracts may not correspond to the change in value of the hedged instruments. In addition, losses may arise from changes in the value of the underlying instruments, if there is an illiquid secondary market for the contracts, or if the counterparty to the contract is unable to perform. Risks may exceed amounts recognized on the statement of assets and liabilities. When the contract is closed, the fund records a realized gain or loss equal to the difference between the value of the contract at the time it was opened and the value at the time it was closed. Realized gains and losses on purchased options are included in realized gains and losses on investment securities. If a written call option is exercised, the premium originally received is recorded as an addition to sales proceeds. If a written put option is exercised, the premium originally received is recorded as a reduction to the cost of investments.
Futures contracts are valued at the quoted daily settlement prices established by the exchange on which they trade. The fund and the broker agree to exchange an amount of cash equal to the daily fluctuation in the value of the futures contract. Such receipts or payments are known as “variation margin.” Exchange traded options are valued at the last sale price or, if no sales are reported, the last bid price for purchased options and the last ask price for written options. Options traded over-the-counter are valued using prices supplied by dealers. Futures and written option contracts
47
outstanding at period end, if any, are listed after the fund’s portfolio.
H) Credit default contracts The fund may enter into credit default contracts where one party, the protection buyer, makes an upfront or periodic payment to a counter party, the protection seller, in exchange for the right to receive a contingent payment. The maximum amount of the payment may equal the notional amount, at par, of the underlying index or security as a result of a related credit event. An upfront payment received by the fund, as the protection seller, is recorded as a liability on the fund’s books. An upfront payment made by the fund, as the protection buyer, is recorded as an asset on the fund’s books. Periodic payments received or paid by the fund are recorded as realized gains or losses. The credit default contracts are marked-to-market daily based upon quotations from an independent pricing service or market makers and the change, if any, is recorded as unrealized gain or loss. Payments received or made as a result of a credit event or termination of the contract are recognized, net of a proportional amount of the upfront payment, as realized gains or losses. In addition to bearing the risk that the credit event will occur, the fund could be exposed to market risk due to unfavorable changes in interest rates or in the price of the underlying security or index, the possibility that the fund may be unable to close out its position at the same time or at the same price as if it had purchased comparable publicly traded securities or that the counterparty may default on its obligation to perform. Risks of loss may exceed amounts recognized on the statement of assets and liabilities. Credit default contracts outstanding at period end, if any, are listed after the fund’s portfolio.
I) Security lending The fund may lend securities, through its agents, to qualified borrowers in order to earn additional income. The loans are collateralized by cash and/or securities in an amount at least equal to the market value of the securities loaned. The market value of securities loaned isdetermined daily and any additional required collateral is allocated to the fund on the next business day. The risk of borrower default will be borne by the fund’s agents; the fund will bear the risk of loss with respect to the investment of the cash collateral. Income from securities lending is included in investment income on the statement of operations. At April 30, 2006, the value of securities loaned amounted to $37,113,268. The fund received cash collateral of $38,119,372, which is pooled with collateral of other Putnam funds into 31 issues of high-grade, short-term investments.
J) Federal taxes It is the policy of the fund to distribute all of its taxable income within the prescribed time and otherwise comply with the provisions of the Internal Revenue Code of 1986 (the “Code”) applicable to regulated investment companies. It is also the intention of the fund to distribute an amount sufficient to avoid imposition of any excise tax under Section 4982 of the Code, as amended. Therefore, no provision has been made for federal taxes on income, capital gains or unrealized appreciation on securities held nor for excise tax on income and capital gains.
At October 31, 2005, the fund had a capital loss carryover of $123,076,557 available to the extent allowed by the Code to offset future net capital gain, if any. The amount of the carryover and the expiration dates are:
| Loss Carryover | Expiration |
| $71,434,725 | October 31, 2010 |
| 51,641,832 | October 31, 2011 |
The aggregate identified cost on a tax basis is $477,942,617, resulting in gross unrealized appreciation and depreciation of $98,134,126 and $11,491,198, respectively, or net unrealized appreciation of $86,642,928.
K) Distributions to shareholders Distributions to shareholders from net investment income are recorded by the fund on the ex-dividend date. Distributions from capital gains, if any, are
48
recorded on the ex-dividend date and paid at least annually. The amount and character of income and gains to be distributed are determined in accordance with income tax regulations, which may differ from generally accepted accounting principles. Dividend sources are estimated at the time of declaration. Actual results may vary. Any non-taxable return of capital cannot be determined until final tax calculations are completed after the end of the fund’s fiscal year. Reclassifications are made to the fund’s capital accounts to reflect income and gains available for distribution (or available capital loss carryovers) under income tax regulations.
Note 2: Management fee, administrative services and other transactions
Putnam Management is paid for management and investment advisory services quarterly based on the average net assets of the fund. Such fee is based on the following annual rates: 0.70% of the first $500 million of average net assets, 0.60% of the next $500 million, 0.55% of the next $500 million, 0.50% of the next $5 billion, 0.475% of the next $5 billion, 0.455% of the next $5 billion, 0.44% of the next $5 billion and 0.43% thereafter.
Putnam Management has agreed to waive fees and reimburse expenses of the fund through October 31, 2006, to the extent necessary to ensure that the fund’s expenses do not exceed the simple average of the expenses of all front-end load funds viewed by Lipper Inc. as having the same investment classification or objective as the fund. The expense reimbursement is based on a comparison of the fund’s expenses with the average annualized operating expenses of the funds in its Lipper peer group for each calendar quarter during the fund’s last fiscal year, excluding 12b-1 fees and without giving effect to any expense offset and brokerage service arrangements that may reduce fund expenses. For the period ended April 30, 2006, Putnam Management did not waive any of its management fee from the fund. For the period ended April 30, 2006, Putnam Management has assumed $3,837 of legal, shareholder servicing and communication, audit and Trustee fees incurred by the fund in connection with certain legal and regulatory matters (including those described in Note 6).
Putnam Investments Limited (“PIL”), an affiliate of Putnam Management, is authorized by the Trustees to manage a separate portion of the assets of the fund as determined by Putnam Management from time to time. Putnam Management pays a quarterly sub-management fee to PIL for its services at an annual rate of 0.35% of the average net assets of the portion of the fund managed by PIL.
The fund reimburses Putnam Management an allocated amount for the compensation and related expenses of certain officers of the fund and their staff who provide administrative services to the fund. The aggregate amount of all such reimbursements is determined annually by the Trustees.
Custodial functions for the fund’s assets are provided by Putnam Fiduciary Trust Company (“PFTC”), a subsidiary of Putnam, LLC. PFTC receives fees for custody services based on the fund’s asset level, the number of its security holdings and transaction volumes. Putnam Investor Services, a division of PFTC, provides investor servicing agent functions to the fund. Putnam Investor Services receives fees for investor servicing based on the number of shareholder accounts in the fund and the level of defined contribution plan assets in the fund. During the period ended April 30, 2006, the fund incurred $668,381 for these services.
The fund has entered into an arrangement with PFTC whereby credits realized as a result of uninvested cash balances are used to reduce a portion of the fund’s expenses. The fund also reduced expenses through brokerage service arrangements. For the six months ended April 30, 2006, the fund’s expenses were reduced by $73,976 under these arrangements.
49
Each independent Trustee of the fund receives an annual Trustee fee, of which $344, as a quarterly retainer, has been allocated to the fund, and an additional fee for each Trustees meeting attended. Trustees receive additional fees for attendance at certain committee meetings, industry seminars and for certain compliance-related matters. Trustees also are reimbursed for expenses they incur relating to their services as Trustees. George Putnam, III, who is not an independent Trustee, also receives the foregoing fees for his services as Trustee.
The fund has adopted a Trustee Fee Deferral Plan (the “Deferral Plan”) which allows the Trustees to defer the receipt of all or a portion of Trustees fees payable on or after July 1, 1995. The deferred fees remain invested in certain Putnam funds until distribution in accordance with the Deferral Plan.
The fund has adopted an unfunded noncontributory defined benefit pension plan (the “Pension Plan”) covering all Trustees of the fund who have served as a Trustee for at least five years and were first elected prior to 2004. Benefits under the Pension Plan are equal to 50% of the Trustee’s average annual attendance and retainer fees for the three years ended December 31, 2005. Pension expense for the fund is included in Trustee compensation and expenses in the statement of operations. Accrued pension liability is included in Payable for Trustee compensation and expenses in the statement of assets and liabilities. The Trustees have terminated the Pension Plan with respect to any Trustee first elected after 2003.
The fund has adopted distribution plans (the “Plans”) with respect to its class A, class B, class C, class M and class R shares pursuant to Rule 12b-1 under the Investment Company Act of 1940. The purpose of the Plans is to compensate Putnam Retail Management, a wholly-owned subsidiary of Putnam, LLC and Putnam Retail Management GP, Inc., for services provided and expenses incurred in distributing shares of the fund. The Plans provide for payments by the fund to Putnam Retail Management at an annual rate of up to 0.35%, 1.00%, 1.00%, 1.00% and 1.00% of the average net assets attributable to class A, class B, class C, class M and class R shares, respectively. The Trustees have approved payment by the fund at an annual rate of 0.25%, 1.00%, 1.00%, 0.75% and 0.50% of the average net assets attributable to class A, class B, class C, class M and class R shares, respectively.
For the six months ended April 30, 2006, Putnam Retail Management, acting as underwriter, received net commissions of $12,953 and $62 from the sale of class A and class M shares, respectively, and received $31,396 and $148 in contingent deferred sales charges from redemptions of class B and class C shares, respectively. A deferred sales charge of up to 1.00% and 0.65% is assessed on certain redemptions of class A and class M shares, respectively. For the six months ended April 30, 2006, Putnam Retail Management, acting as underwriter, received no monies on class A and class M redemptions.
Note 3: Purchases and sales of securities
During the six months ended April 30, 2006, cost of purchases and proceeds from sales of investment securities other than short-term investments aggregated $157,842,114 and $209,584,842, respectively. There were no purchases or sales of U.S. government securities.
Note 4: Capital shares
At April 30, 2006, there was an unlimited number of shares of beneficial interest authorized. Transactions in capital shares were as follows:
50
| CLASS A | Shares | Amount | CLASS C | Shares | Amount | |
| Six months ended 4/30/06: | Six months ended 4/30/06: | |||||
| Shares sold | 2,019,259 | $ 22,388,489 | Shares sold | 53,181 | $ | 581,333 |
| Shares issued | Shares issued | |||||
| in connection | in connection | |||||
| with reinvestment | with reinvestment | |||||
| of distributions | 393,463 | 4,369,304 | of distributions | 2,467 | 27,238 | |
| 2,412,722 | 26,757,793 | 55,648 | 608,571 | |||
| Shares | Shares | |||||
| repurchased | (5,330,140) | (58,957,744) | repurchased | (72,035) | (793,840) | |
| Net decrease | (2,917,418) | $ (32,199,951) | Net decrease | (16,387) | $ | (185,269) |
| Year ended 10/31/05: | Year ended 10/31/05: | |||||
| Shares sold | 5,819,679 | $ 61,682,140 | Shares sold | 146,197 | $ 1,525,744 | |
| Shares issued | Shares issued | |||||
| in connection | in connection | |||||
| with reinvestment | with reinvestment | |||||
| of distributions | 774,668 | 8,256,454 | of distributions | 4,151 | 44,087 | |
| 6,594,347 | 69,938,594 | 150,348 | 1,569,831 | |||
| Shares | Shares | |||||
| repurchased | (9,839,774) | (103,842,574) | repurchased | (136,593) | (1,423,310) | |
| Net decrease | (3,245,427) | $ (33,903,980) | Net increase | 13,755 | $ | 146,521 |
| CLASS B | Shares | Amount | CLASS M | Shares | Amount | |
| Six months ended 4/30/06: | Six months ended 4/30/06: | |||||
| Shares sold | 250,171 | $ 2,748,954 | Shares sold | 12,026 | $ | 132,432 |
| Shares issued | Shares issued | |||||
| in connection | in connection | |||||
| with reinvestment | with reinvestment | |||||
| of distributions | 41,552 | 459,131 | of distributions | 2,254 | 25,009 | |
| 291,723 | 3,208,085 | 14,280 | 157,441 | |||
| Shares | Shares | |||||
| repurchased | (1,859,870) | (20,526,380) | repurchased | (88,179) | (973,958) | |
| Net decrease | (1,568,147) | $ (17,318,295) | Net decrease | (73,899) | $ | (816,517) |
| Year ended 10/31/05: | Year ended 10/31/05: | |||||
| Shares sold | 1,176,529 | $ 12,342,455 | Shares sold | 125,254 | $ 1,309,200 | |
| Shares issued | Shares issued | |||||
| in connection | in connection | |||||
| with reinvestment | with reinvestment | |||||
| of distributions | 88,507 | 937,636 | of distributions | 5,159 | 54,998 | |
| 1,265,036 | 13,280,091 | 130,413 | 1,364,198 | |||
| Shares | Shares | |||||
| repurchased | (3,465,887) | (36,174,712) | repurchased | (149,734) | (1,586,972) | |
| Net decrease | (2,200,851) | $ (22,894,621) | Net decrease | (19,321) | $ | (222,774) |
51
| CLASS R | Shares | Amount |
| Six months ended 4/30/06: | ||
| Shares sold | 9,986 | $ 110,186 |
| Shares issued | ||
| in connection | ||
| with reinvestment | ||
| of distributions | 231 | 2,566 |
| 10,217 | 112,752 | |
| Shares | ||
| repurchased | (10,863) | (118,998) |
| Net decrease | (646) | $ (6,246) |
| Year ended 10/31/05: | ||
| Shares sold | 23,188 | $ 243,156 |
| Shares issued | ||
| in connection | ||
| with reinvestment | ||
| of distributions | 287 | 3,077 |
| 23,475 | 246,233 | |
| Shares | ||
| repurchased | (13,171) | (138,818) |
| Net increase | 10,304 | $ 107,415 |
| CLASS Y | Shares | Amount |
| Six months ended 4/30/06: | ||
| Shares sold | 32,855 | $ 362,646 |
| Shares issued | ||
| in connection | ||
| with reinvestment | ||
| of distributions | 3,365 | 37,375 |
| 36,220 | 400,021 | |
| Shares | ||
| repurchased | (114,930) | (1,266,214) |
| Net decrease | (78,710) | $ (866,193) |
| For the period 10/4/05 (commencement of operations) | ||
| to 10/31/05: | ||
| Shares sold | 351,944 | $ 4,030,766 |
| Shares issued | ||
| in connection | ||
| with reinvestment | ||
| of distributions | — | — |
| 351,944 | 4,030,766 | |
| Shares | ||
| repurchased | (7,422) | (82,532) |
| Net increase | 344,522 | $ 3,948,234 |
Note 5: Investment in Putnam Prime Money Market Fund
Pursuant to an exemptive order from the Securities and Exchange Commission, the fund invests in Putnam Prime Money Market Fund, an open-end management investment company managed by Putnam Management. Management fees paid by the fund are reduced by an amount equal to the management and administrative services fees paid by Putnam Prime Money Market Fund with respect to assets invested by the fund in Putnam Prime Money Market Fund. For the period ended April 30, 2006, management fees paid were reduced by $10,669 relating to the fund’s investment in Putnam Prime Money Market Fund. Income distributions earned by the fund are recorded as income in the statement of operations and totaled $373,383 for the period ended April 30, 2006. During the period ended April 30, 2006, cost of purchases and cost of sales of investments in Putnam Prime Money Market Fund aggregated $139,079,608 and $137,246,778, respectively.
Note 6: Regulatory matters and litigation
Putnam Management has entered into agreements with the Securities and Exchange Commission and the Massachusetts Securities Division settling charges connected with excessive short-term trading by Putnam employees and, in the case of the charges brought by the Massachusetts Securities Division, by participants in some Putnam-administered 401(k) plans. Pursuant to these settlement agreements, Putnam Management will pay a total of $193.5 million in penalties and restitution, with $153.5 million being paid to certain open-end funds and their shareholders. The amount will be allocated to shareholders and funds pursuant to a plan developed by an independent consultant, and will be paid following approval of the plan by the SEC and the Massachusetts Securities Division.
The Securities and Exchange Commission’s and Massachusetts Securities Division’s allegations and related matters also serve as the general basis for numerous lawsuits, including purported class
52
action lawsuits filed against Putnam Management and certain related parties, including certain Putnam funds. Putnam Management will bear any costs incurred by Putnam funds in connection with these lawsuits. Putnam Management believes that the likelihood that the pending private lawsuits and purported class action lawsuits will have a material adverse financial impact on the fund is remote, and the pending actions are not likely to materially affect its ability to provide investment management services to its clients, including the Putnam funds.
Pursuant to a settlement with the Securities and Exchange Commission relating to Putnam Management’s brokerage allocation practices, on October 13, 2005 the fund received $311,551 in proceeds paid by Putnam Management. The fund had accrued a receivable for this amount in the prior fiscal year.
In March 2006, the fund received $55,552 from Putnam to address issues relating to the calculation of certain amounts paid by the Putnam mutual funds to Putnam for transfer agent services. This amount is included in Fees waived and reimbursed by Manager or affiliate on the Statement of operations. Review of this matter is ongoing and the amount received by the fund may be adjusted in the future. Such adjustment is not expected to be material.
Putnam Management and Putnam Retail Management are named as defendants in a civil suit in which the plaintiffs allege that the management and distribution fees paid by certain Putnam funds were excessive and seek recovery under the Investment Company Act of 1940. Putnam Management and Putnam Retail Management have contested the plaintiffs’ claims and the matter is currently pending in the U.S. District Court for the District of Massachusetts. Based on currently available information, Putnam Management believes that this action is without merit and that it is unlikely to have a material effect on Putnam Management’s and Putnam Retail Management’s ability to provide services to their clients, including the fund.
53
Brokerage commissions
(Unaudited)
Brokerage commissions are paid to firms that execute trades on behalf of your fund. When choosing these firms, Putnam is required by law to seek the best execution of the trades, taking all relevant factors into consideration, including expected quality of execution and commission rate. Listed below are the largest relationships based upon brokerage commissions for your fund and the other funds in Putnam’s Research group for the year ended April 30, 2006. The other Putnam mutual funds in this group are Putnam Global Natural Resources Fund, Putnam Health Sciences Trust, Putnam VT Health Sciences Fund, Putnam VT Research Fund, and Putnam VT Utilities Growth and Income Fund.
The top five firms that received brokerage commissions for trades executed for the Research group are (in descending order) Goldman Sachs, Merrill Lynch, UBS Warburg, Citigroup Global Markets, and Credit Suisse First Boston. Commissions paid to these firms together represented approximately 45% of the total brokerage commissions paid for the year ended April 30, 2006.
Commissions paid to the next 10 firms together represented approximately 37% of the total brokerage commissions paid during the period. These firms are (in alphabetical order) Bank of America, Bear Stearns & Company, Deutsche Bank Securities, JP Morgan Clearing, Lehman Brothers, Morgan Stanley Dean Witter, RBC Capital Markets, SG Cowen, Thomas Weisel Partners, and Wachovia Securities.
Commission amounts do not include “mark-ups” paid on bond or derivative trades made directly with a dealer. Additional information about brokerage commissions is available on the Securities and Exchange Commission (SEC) Web site at www.sec.gov. Putnam funds disclose commissions by firm to the SEC in semiannual filings on Form N-SAR.
54
Putnam puts your interests first
In January 2004, Putnam began introducing a number of voluntary initiatives designed to reduce fund expenses, provide investors with more useful information, and help safeguard the interests of all Putnam investors. Visit www.putnam.com for details.
Cost-cutting initiatives
Reduced sales charges The maximum sales charge for class A shares has been reduced to 5.25% for equity funds (formerly 5.75%) and 3.75% for most income funds (formerly 4.50%) . The maximum sales charge for class M shares has been reduced to 3.25% for equity funds (formerly 3.50%) .*
Lower class B purchase limit To help ensure that investors are in the most cost-effective share class, the maximum amount that can be invested in class B shares has been reduced to $100,000. (Larger trades or accumulated amounts will be refused.)
Ongoing expenses will be limited Through calendar 2006, total ongoing expenses, including management fees for all funds, will be maintained at or below the average of each fund’s industry peers in its Lipper load-fund universe. For more information, please see the Statement of Additional information.
Improved disclosure
Putnam fund prospectuses and shareholder reports have been revised to disclose additional information that will help shareholders compare funds and weigh their costs and risks along with their potential benefits. Shareholders will find easy-to-understand information about fund expense ratios, portfolio manager compensation, risk comparisons, turnover comparisons, brokerage commissions, and employee and trustee ownership of Putnam funds. Disclosure of breakpoint discounts has also been enhanced to alert investors to potential cost savings.
Protecting investors’ interests
Short-term trading fee introduced To discourage short-term trading, which can interfere with a fund’s long-term strategy, a 2% short-term trading fee may be imposed on any Putnam fund shares (other than money market funds) redeemed or exchanged within five calendar days of purchase.
* The maximum sales charge for class A shares of Putnam Limited Duration Government Income Fund (formerly Putnam Intermediate U.S. Government Income Fund) and Putnam Floating Rate Income Fund remains 3.25% .
55
Fund information
Founded over 65 years ago, Putnam Investments was built around the concept that a balance between risk and reward is the hallmark of a well-rounded financial program. We manage over 100 mutual funds in growth, value, blend, fixed income, and international.
| Investment Manager | Robert E. Patterson | James P. Pappas |
| Putnam Investment | George Putnam, III | Vice President |
| Management, LLC | W. Thomas Stephens | |
| One Post Office Square | Richard B. Worley | Richard S. Robie, III |
| Boston, MA 02109 | Vice President | |
| Officers | Francis J. McNamara, III | |
| Investment Sub-Manager | George Putnam, III | Vice President and |
| Putnam Investments Limited | President | Chief Legal Officer |
| 57-59 St. James Street | ||
| London, England SW1A 1LD | Charles E. Porter | Charles A. Ruys de Perez |
| Executive Vice President, | Vice President and | |
| Marketing Services | Associate Treasurer and | Chief Compliance Officer |
| Putnam Retail Management | Principal Executive Officer | |
| One Post Office Square | ||
| Boston, MA 02109 | Jonathan S. Horwitz | Mark C. Trenchard |
| Senior Vice President | Vice President and | |
| and Treasurer | BSA Compliance Officer | |
| Custodian | ||
| Putnam Fiduciary | ||
| Trust Company | Steven D. Krichmar | Judith Cohen |
| Vice President and | Vice President, Clerk and | |
| Principal Financial Officer | Assistant Treasurer | |
| Legal Counsel | ||
| Ropes & Gray LLP | Wanda M. McManus | |
| Michael T. Healy | Vice President, Senior Associate | |
| Trustees | Assistant Treasurer and | Treasurer and Assistant Clerk |
| John A. Hill, Chairman | Principal Accounting Officer | |
| Jameson Adkins Baxter, | ||
| Vice Chairman | Daniel T. Gallagher | Nancy T. Florek |
| Charles B. Curtis | Senior Vice President, | Vice President, Assistant Clerk, |
| Myra R. Drucker | Staff Counsel and | Assistant Treasurer |
| Charles E. Haldeman, Jr. | Compliance Liaison | and Proxy Manager |
| Paul L. Joskow | ||
| Elizabeth T. Kennan | ||
| John H. Mullin, III | ||
| Beth S. Mazor | ||
| Vice President | ||
This report is for the information of shareholders of Putnam Utilities Growth and Income Fund. It may also be used as sales literature when preceded or accompanied by the current prospectus, the most recent copy of Putnam’s Quarterly Performance Summary, and Putnam’s Quarterly Ranking Summary. For more recent performance, please visit www.putnam.com. Investors should carefully consider the investment objective, risks, charges, and expenses of a fund, which are described in its prospectus. For this and other information or to request a prospectus, call 1-800-225-1581 toll free. Please read the prospectus carefully before investing. The fund’s Statement of Additional Information contains additional information about the fund’s Trustees and is available without charge upon request by calling 1-800-225-1581.
56

Item 2. Code of Ethics:
Not applicable
Item 3. Audit Committee Financial Expert:
Not applicable
Item 4. Principal Accountant Fees and Services:
Not applicable
Item 5. Audit Committee of Listed Registrants
Not applicable
Item 6. Schedule of Investments:
The registrant’s schedule of investments in unaffiliated issuers is included in the report to shareholders in Item 1 above.
| Item 7. Disclosure of Proxy Voting Policies and Procedures For Closed-End Management Investment Companies: |
Not applicable
Item 8. Portfolio Managers of Closed-End Investment Companies
Not Applicable
| Item 9. Purchases of Equity Securities by Closed-End Management Investment Companies and Affiliated Purchasers: |
Not applicable
Item 10. Submission of Matters to a Vote of Security Holders:
Not applicable
Item 11. Controls and Procedures:
(a) The registrant's principal executive officer and principal financial officer have concluded, based on their evaluation of the effectiveness of the design and operation of the registrant's disclosure controls and procedures as of a date within 90 days of the filing date of this report, that the design and operation of such procedures are generally effective to provide reasonable assurance that information required to be disclosed by the registrant in this report is recorded, processed, summarized and reported within the time periods specified in the Commission's rules and forms.
(b) Changes in internal control over financial reporting: Not applicable
Item 12. Exhibits:
(a)(1) Not applicable
(a)(2) Separate certifications for the principal executive officer and principal financial officer of the registrant as required by Rule 30a-2(a) under the Investment Company Act of 1940, as amended, are filed herewith.
(b) The certifications required by Rule 30a-2(b) under the Investment Company Act of 1940, as amended, are filed herewith.
SIGNATURES
Pursuant to the requirements of the Securities Exchange Act of 1934 and the Investment Company Act of 1940, the registrant has duly caused this report to be signed on its behalf by the undersigned, thereunto duly authorized.
Putnam Utilities Growth and Income Fund
By (Signature and Title):
| /s/Michael T. Healy Michael T. Healy Principal Accounting Officer |
Date: June 28, 2006
Pursuant to the requirements of the Securities Exchange Act of 1934 and the Investment Company Act of 1940, this report has been signed below by the following persons on behalf of the registrant and in the capacities and on the dates indicated.
By (Signature and Title):
| /s/Charles E. Porter Charles E. Porter Principal Executive Officer |
Date: June 28, 2006
By (Signature and Title):
| /s/Steven D. Krichmar Steven D. Krichmar Principal Financial Officer |
Date: June 28, 2006