UNITED STATES
SECURITIES AND EXCHANGE COMMISSION
Washington, D.C. 20549
FORM N-CSR
CERTIFIED SHAREHOLDER REPORT OF REGISTERED
MANAGEMENT INVESTMENT COMPANIES
Investment Company Act file number: (811- 05989)
Exact name of registrant as specified in charter: Putnam Utilities Growth and Income Fund
Address of principal executive offices: One Post Office Square, Boston, Massachusetts 02109
| Name and address of agent for service: | Beth S. Mazor, Vice President |
| One Post Office Square | |
| Boston, Massachusetts 02109 | |
| Copy to: | John W. Gerstmayr, Esq. |
| Ropes & Gray LLP | |
| One International Place | |
| Boston, Massachusetts 02110 | |
Registrant’s telephone number, including area code: (617) 292-1000
Date of fiscal year end: October 31, 2007
Date of reporting period: November 1, 2006— October 31, 2007
Item 1. Report to Stockholders:
The following is a copy of the report transmitted to stockholders pursuant to Rule 30e-1 under the Investment Company Act of 1940:
What makes
Putnam different?
A time-honored tradition in money management
Since 1937, our values have been rooted in a profound sense of responsibility for the money entrusted to us.
A prudent approach to investing
We use a research-driven team approach to seek consistent, dependable, superior investment results over time, although there is no guarantee a fund will meet its objectives.
Funds for every investment goal
We offer a broad range of mutual funds and other financial products so investors and their financial representatives can build diversified portfolios.
A commitment to doing what’s right for investors
With a focus on investment performance, below-average expenses, and in-depth information about our funds, we put the interests of investors first and seek to set the standard for integrity and service.
Industry-leading service
We help investors, along with their financial representatives, make informed investment decisions with confidence.

In 1830, Massachusetts Supreme Judicial Court Justice Samuel Putnam established The Prudent Man Rule, a legal foundation for responsible money management.
THE PRUDENT MAN RULE
All that can be required of a trustee to invest is that he shall conduct himself faithfully and exercise a sound discretion. He is to observe how men of prudence, discretion, and intelligence manage their own affairs, not in regard to speculation, but in regard to the permanent disposition of their funds, considering the probable income, as well as the probable safety of the capital to be invested.

Putnam Utilities
Growth and
Income Fund
10| 31| 07
Annual Report
| Message from the Trustees | 1 |
| About the fund | 2 |
| Performance and portfolio snapshots | 4 |
| Report from the fund managers | 5 |
| Performance in depth | 10 |
| Expenses | 13 |
| Portfolio turnover | 15 |
| Risk | 15 |
| Your fund’s management | 16 |
| Terms and definitions | 17 |
| Trustee approval of management contract | 18 |
| Other information for shareholders | 22 |
| Financial statements | 23 |
| Federal tax information | 38 |
| Brokerage commissions | 38 |
| Shareholder meeting results | 39 |
| About the Trustees | 40 |
| Officers | 44 |
Cover photograph: © Marco Cristofori
Message from the Trustees
Dear Fellow Shareholder:
In November, Putnam Investments celebrated its 70th anniversary. From modest beginnings in Boston, Massachusetts, Putnam has grown into a global asset manager that serves millions of investors worldwide. Coincident with this anniversary, we are pleased to announce that Great-West Lifeco Inc. recently completed its purchase of Putnam Investments from Marsh & McLennan Companies, Inc. Great-West Lifeco is a financial services holding company with operations in Canada, the United States, and Europe, and is a member of the Power Financial Corporation group of companies. With this change, Putnam becomes part of a successful organization with a long-standing commitment to high-quality investment management and financial services. The change in ownership is not expected to affect the Putnam funds, the way Putnam manages money, or the funds’ management teams.
We would also like to take this opportunity to announce that Putnam President and Chief Executive Officer Ed Haldeman, one of your fund’s Trustees since 2004, was named President of the Funds, assuming this role from George Putnam, III. This change, together with the completion of the transaction with Great-West Lifeco, has enabled George Putnam to become an independent Trustee of the funds. Both George and Ed will continue serving on the Board of Trustees in our collective role of overseeing the Putnam funds on your behalf.
Lastly, we are pleased to announce that a new independent Trustee, Robert J. Darretta, has joined your fund’s Board of Trustees. Mr. Darretta brings extensive leadership experience in corporate finance and accounting. He is a former Vice Chairman of the Board of Directors of Johnson & Johnson, one of the leading U.S. health-care and consumer products companies, where he also served as Chief Financial Officer, Executive Vice President, and Treasurer.
Although the mutual fund industry has undergone many changes since George Putnam introduced his innovative balanced fund in 1937, Putnam’s guiding principles have not. As we celebrate Putnam’s 70-year milestone, we look forward to Putnam continuing its long tradition of prudent money management and to the new chapter opened by its recent change in ownership. As always, we thank you for your support of the Putnam funds.

Putnam Utilities Growth and Income Fund:
a diversified approach to utilities investing
Many stock funds offer the potential for growth but produce little or no income for investors. Putnam Utilities Growth and Income Fund sets itself apart by pursuing both capital growth and current income through investment in securities from the utilities sector.
Public utilities, which provide services such as electricity and gas, have a history of consistent dividend payouts to investors. As a result, these securities have long been valued as an alternative to bonds — especially during periods of low interest rates, when investors look outside the bond market for income. In recent years, the income-producing power of utilities holdings has grown even stronger, largely because of legislation in 2003 that reduced the federal tax on dividends. Since that time, many investors have been able to keep more of their dividend income, though there is no assurance that this tax reduction will continue indefinitely.
Another influence on the performance and attractiveness of utilities securities is the price of natural gas. Gas prices affect not only the natural gas industry, but any industry that uses gas in its production or delivery process. For example, gas is widely used to produce electricity; therefore, as gas prices rise and fall, the cost of electricity tends to follow suit. Since the demand for electricity is usually stable even as prices fluctuate, an industry-wide increase in prices can lead to higher profits for companies that use less costly fuels.
To make the most of opportunities in the utilities sector, the management team of Putnam Utilities Growth and Income Fund seeks to keep its portfolio broadly diversified within the sector. The fund may invest in bonds as well as stocks, in both domestic and foreign markets, across several industries with varying degrees of regulation, and in companies of different sizes. An essential component of the fund’s strategy, particularly during periods of uncertainty, is to maintain a solid foundation of securities in stable-demand industries such as electric power, telecommunications, and natural gas. Guided by this broad-based approach, the fund’s management team is committed to finding rewarding opportunities for income and growth by anticipating, and responding to, developments that affect the utilities sector.
International investing involves certain risks, such as currency fluctuations, economic instability, and political developments. The fund may invest a portion of its assets in small and/or midsize companies. Such investments increase the risk of greater price fluctuations.
The fund invests in fewer issuers or concentrates its investments by region or sector, and involves more risk than a fund that invests more broadly. The use of derivatives involves special risks and may result in losses. Mutual funds that invest in bonds are subject to certain risks including interest-rate risk, credit risk, and inflation risk. As interest rates rise, the prices of bonds fall. Long-term bonds are more exposed to interest-rate risk than short-term bonds. Unlike bonds, bond funds have ongoing fees and expenses.
Major industries in
the utilities sector
Electric utilities Companies that generate, transmit, or distribute electricity.
Natural gas utilities Companies that transmit, store, or distribute natural gas.
Regional Bells Companies that provide access to voice communications networks within a specific geographic region.
Telecommunications Companies that provide voice, data, and video communications products and services.
Telephone Companies that provide fixed-line and wireless telephone communications services.
Water utilities Companies that provide services related to water or wastewater.
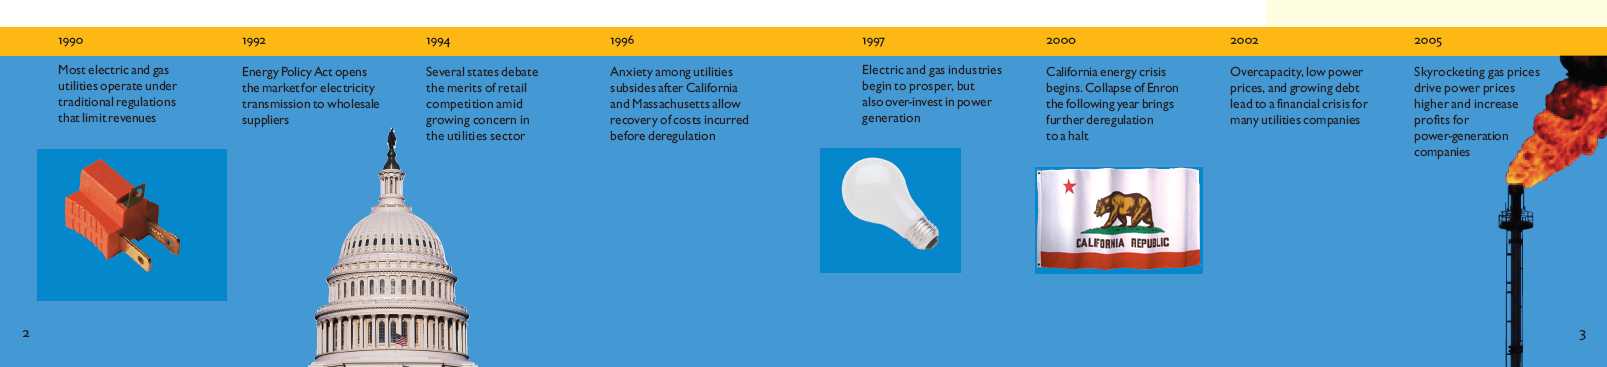
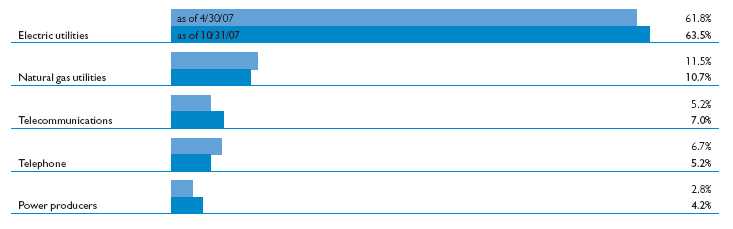
Key developments affecting electric and gas utilities
since the inception of the fund.
Performance and portfolio snapshots
Putnam Utilities Growth
and Income Fund
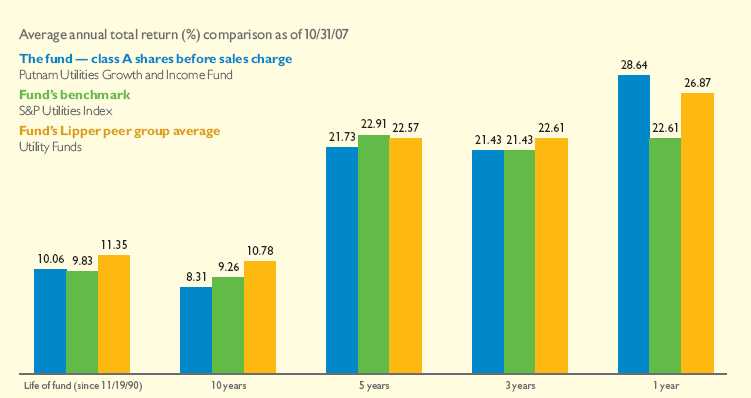
Current performance may be lower or higher than the quoted past performance, which cannot guarantee future results. Share price, principal value, and return will fluctuate, and you may have a gain or a loss when you sell your shares. Performance of class A shares assumes reinvestment of distributions and does not account for taxes. Fund returns in the bar chart do not reflect a sales charge. See pages 10–12 for additional performance information. For a portion of the periods, this fund may have limited expenses, without which returns would have been lower. A 1% short-term trading fee may apply. To obtain the most recent month-end performance, visit www.putnam.com.
“Performance relative to the benchmark was
strong due to good stock selection and the
fund’s ability to invest in utilities from around
the world and in telecommunications.”
Michael Yogg, Portfolio Leader, Putnam Utilities Growth and Income Fund
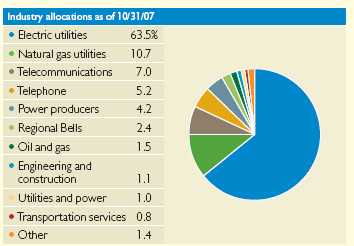
Allocations are represented as a percentage of net assets and may not equal 100%. Holdings and allocations may vary over time.
4
Report from the fund managers
The year in review

We are pleased to report that your fund outperformed its benchmark, the S&P Utilities Index, and the average for its Lipper category, based on results before sales charges. Performance relative to the benchmark was strong due in part to the fund’s ability to invest in utilities from around the world and in telecommunications, but also due to good stock selection. The benchmark consists only of electric and gas utilities based in the United States. The performance advantage relative to the Lipper peer group was the result of stock selection. Since all currencies in which the fund invests were either up versus the dollar or about unchanged, exposure to currencies other than the U.S. dollar had a positive impact on performance.
Market overview
The broad market indexes in the United States rallied over most of the fund’s 2007 fiscal year, and electric and gas utilities were among the market leaders. European markets, including utilities, were also strong. But while most Asia-Pacific markets advanced as well, the large, developed-market utilities, particularly in Japan, where the fund has the bulk of its Asian investments, were up only slightly. Telecommunications stocks generally kept pace with those of electric and gas utilities.
Utilities have been strong performers over the past five years. While the reasons for this have varied over time, there is one recurring theme: Investment in utility infrastructure, particularly in the United States, has lagged for decades, and this must be reversed. Shortages in generation capacity and weaknesses in the aging transmission and distribution grid have become particularly evident over the past three years.
Although every country and every U.S. state has a different regulatory system, and many have moved toward deregulation, all jurisdictions must promote investment in our utility infrastructure, either through the power market or through an adequate regulated return on investment.
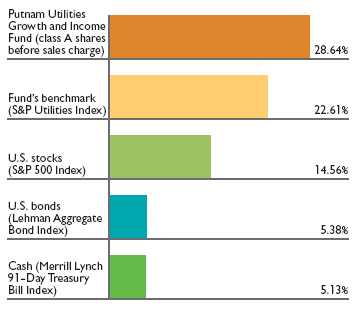
Market sector and fund performance
This comparison shows your fund’s performance in the context of different market sectors for the 12 months ended 10/31/07. See the previous page and pages 10–12 for additional fund performance information. Index descriptions can be found on page 17.
5
Power prices have risen in recent years, and while regulated returns have been flat on average, they have risen for transmission investment, where the need for new funds is most acute.
In 2007, a new chapter in this story emerged — the heightened concern over global warming and the question of how to limit emissions of carbon dioxide. If a generator emitting carbon by burning a fossil fuel must either pay a tax or purchase an allowance, generation costs will rise. It will likely be able to recover at least some of these costs in the market. Meanwhile, carbon-free nuclear-, hydro-, and wind-powered generators will likely benefit from the higher prices without incurring the higher costs, and their margins should expand.
We do not know the future shape of global warming legislation in the United States, though Europe is well along this path and several states are moving forward. However, the picture that is emerging for the next several years points toward conditions that may lead to above-average profitability and high levels of profitable investment. These include strains on generation, transmission, and distribution resources and tightness in power markets. The main risk to this scenario is political. If ratepayers — who are also voters — pay much higher electric rates, and utilities’ profit margins swell, there could be some type of regulatory backlash.
Strategy overview
Your fund’s portfolio is focused on the securities of companies that sell basic, stable-demand services such as electricity, gas, water, and telecommunications. These securities are generally considered to provide greater-than-average stability and yields when compared with the broader stock market. Our stock selection process incorporates both quantitative and fundamental analysis but relies more on the latter to make final decisions to buy and sell. For us, the most important measure of a security is our determination of the issuing company’s intrinsic value, which is based on our estimate of the earnings and cash flow it will generate. Our understanding of past and future developments and uncertainties specific to the utilities industries also helps guide our investment process.
Earlier this year, in January, we concluded that stocks of European utilities, which had had a strong run in calendar 2006 due partly to merger and acquisition speculation, were expensive relative to other sectors, and we reduced our allocation there. We were wrong in thinking this, as these stocks continued to do well after we reduced our allocation, though the reason for the strong performance
Comparison of top industry weightings
This chart shows how the fund’s top weightings have changed
over the past six months. Weightings are shown as a percentage
of net assets. Holdings will vary over time.
6
in 2007 was strong European electric power prices. We shifted the money to the portfolio’s fixed-income sleeve, which did not do nearly as well. Fortunately, the opportunity we lost through the shift from one sector to another was more than made up for by security selection, which added value within each sector. In April and May we gradually eliminated the fixed-income allocation, at least temporarily, and shifted the assets to stocks of North American utilities, which represented a significant portion of the fund’s portfolio at the close of the fiscal year. While both European and North American utilities have strong prospects, we have more confidence in the United States at this time.
Your fund’s holdings
Several stocks contributing strongly to performance will likely benefit from global warming concerns and plans designed to reduce carbon emissions. These include stocks of Exelon and Entergy, the largest nuclear generators in the United States, and the stock of Electricité de France, the largest such generator in the world. All three will profit if generators that rely on fossil fuels are restricted or financially penalized, and this is already being reflected in their stock prices. In France, the below-market fixed rate for power prices will delay the impact, but progressive liberalization, in accordance with European Union policies, will take hold eventually. Another stock that contributed positively was First Solar, which designs and manufactures solar modules that generate electricity. Similarly, Comverge, which owns software, hardware, and services businesses that allow utilities to better manage their electric load — by remotely shutting down large air conditioning installations when required, for example — added to results. Furthermore, an EDF spinoff, EDF Energies Nouvelles, a French wind generation company, contributed positively to returns. Among these stocks, First Solar was sold before the end of the fiscal year as a result of our ongoing monitoring of its valuation.
Our positions in The Williams Companies, Equitable Resources, and Energen benefited from the well-positioned gas businesses of these companies, which produced strong volumes and sold into generally healthy markets. Gas Natural, which is based in Spain, is essentially a gas distributor, and it enjoyed a strong market as well. We sold the stock of Gas Natural by the end of the fiscal year, taking profits on the position. ITC Holdings, a U.S.-based electricity transmission company, is earning high returns due to the willingness of regulators to award high returns on transmission investment, for which there is currently a tremendous need; it, too, contributed positively to returns. NRG Energy and
Top holdings
This table shows the fund’s top holdings, and the percentage of the fund’s net assets that each represented, as of 10/31/07. The fund’s holdings will change over time.
| Holding | Percent of fund’s net assets | Industry |
| Exelon Corp. | 8.0% | Electric utilities |
| Entergy Corp. | 4.8% | Electric utilities |
| AT&T, Inc. | 4.0% | Telephone |
| FPL Group, Inc. | 3.9% | Electric utilities |
| PG&E Corp. | 3.7% | Electric utilities |
| Public Service Enterprise Group, Inc. | 3.6% | Electric utilities |
| FirstEnergy Corp. | 3.5% | Electric utilities |
| Dominion Resources, Inc. | 3.5% | Electric utilities |
| Edison International | 3.2% | Electric utilities |
| Constellation Energy Group, Inc. | 2.7% | Electric utilities |
7
Edison International, which own well-positioned merchant generation businesses, boosted performance.
In the telecom sector, DiGi.com Berhad, a Malaysian wireless provider, has enjoyed continually rising earnings estimates as it has signed up more prepaid customers than analysts had anticipated. Telefonica (Spain) has benefited from faster than anticipated growth, especially among its Latin American subsidiaries. Verizon has had better-than-anticipated results in its Wireless and Enterprise segments. In Asia, Macquarie Airports, an investor in infrastructure, has been revalued upward as airport asset sales at record multiples have demonstrated the value of its portfolio.
With the fund up over 28% for its most recent fiscal year, few stocks actually declined during that time; but we view those with less-than-average returns as detractors from performance. Since merchant generators and carbon emission holdings did so well, regulated utilities were underperformers, on average, even though they were decent investments in absolute terms. In the United States, two that hurt performance were Spectra Energy on the gas side and Wisconsin Energy, primarily an electric utility. Others that had positive total returns but pulled down average returns were DPL Inc., CMS Energy, and Sierra Pacific Resources. We continue to hold these investments and believe that they will do well over the longer term. Also, while we currently favor the merchant generators, we want to maintain a balanced portfolio with some representation from the more regulated names.
The Asia-Pacific sleeve as a whole pulled down performance, in part due to an earthquake at the Tokyo Electric (TEPCO) nuclear facility, which shook the entire industry. We did not own TEPCO at the time of the quake, but other companies that buy power from the company had to find other, more expensive, sources. Gas utilities, particularly Tokyo Gas, were hurt by the higher commodity prices, which are eventually passed on to final consumers, but with a substantial lag. Another factor hurting the Asian stocks was management’s general reluctance to grow the dividend aggressively, even when the cash position and balance sheet strength would permit it.
Please note that the holdings discussed in this report may not have been held by the fund for the entire period. Portfolio composition is subject to review in accordance with the fund’s investment strategy and may vary in the future.
8
The outlook for your fund
The following commentary reflects anticipated developments that could affect your fund over the next six months, as well as your management team’s plans for responding to them.
As we noted earlier in this report, your fund and the utilities sector have done well over the past year, and indeed over the past five years, and we believe there are reasons to remain optimistic for the future. There is a need for new utility infrastructure; the supply demand situation will increasingly favor the generators; and factors such as carbon emissions legislation and inflation in construction costs favor incumbent generators and utilities generally. But while the future remains bright, there remain potential problems and uncertainties, and after the run in these stocks, there is a chance for a correction. While we envision carbon legislation favoring at least some generators, we do not now know for certain what the legislation will look like. While we believe power market conditions will favor generators, we do not know what political push back may be in store from consumers, politicians, and regulators. Finally, while merchant generation stocks have outperformed regulated utilities over the past several years, several factors — including a much slower economy for example — could cause a shift in the market environment. Consequently, highly regulated utilities — an area where we are currently underweight relative to the benchmark — could become the leading utility sector.
The views expressed in this report are exclusively those of Putnam Management. They are not meant as investment advice. The fund invests some or all of its assets in small and/or midsize companies. Such investments increase the risk of fluctuations in the value of your investment. The fund invests in fewer issuers or concentrates its investments by region or sector, and involves more risk than a fund that invests more broadly. The use of derivatives involves special risks and may result in losses. This fund may have a significant portion of its holdings in bonds. Mutual funds that invest in bonds are subject to certain risks, including interest-rate risk, credit risk, and inflation risk. As interest rates rise, the prices of bonds fall. Long-term bonds are more exposed to interest-rate risk than short-term bonds. Unlike bonds, bond funds have ongoing fees and expenses.
9
Your fund’s performance
This section shows your fund’s performance for periods ended October 31, 2007, the end of its most recent fiscal year. In accordance with regulatory requirements for mutual funds, we also include performance as of the most recent calendar quarter-end and expense information taken from the fund’s current prospectus. Performance should always be considered in light of a fund’s investment strategy. Data represents past performance. Past performance does not guarantee future results. More recent returns may be less or more than those shown. Investment return and principal value will fluctuate, and you may have a gain or a loss when you sell your shares. For the most recent month-end performance, please visit www.putnam.com or call Putnam at 1-800-225-1581. Class Y shares are generally only available to corporate and institutional clients and clients in other approved programs. See the Terms and Definitions section in th is report for definitions of the share classes offered by your fund.
Fund performance Total return for periods ended 10/31/07
| Class A | Class B | Class C | Class M | Class R | Class Y | |||||
| (inception dates) | (11/19/90) | (4/27/92) | (7/26/99) | (3/1/95) | (12/1/03) | (10/4/05) | ||||
| NAV | POP | NAV | CDSC | NAV | CDSC | NAV | POP | NAV | NAV | |
| Annual average | ||||||||||
| (life of fund) | 10.06% | 9.71% | 9.24% | 9.24% | 9.24% | 9.24% | 9.52% | 9.31% | 9.79% | 10.10% |
| 10 years | 122.18 | 110.55 | 106.25 | 106.25 | 106.15 | 106.15 | 111.50 | 104.60 | 116.78 | 123.40 |
| Annual average | 8.31 | 7.73 | 7.51 | 7.51 | 7.50 | 7.50 | 7.78 | 7.42 | 8.04 | 8.37 |
| 5 years | 167.25 | 153.28 | 157.56 | 155.56 | 157.82 | 157.82 | 160.78 | 152.13 | 164.01 | 168.72 |
| Annual average | 21.73 | 20.43 | 20.83 | 20.64 | 20.85 | 20.85 | 21.13 | 20.32 | 21.43 | 21.86 |
| 3 years | 79.06 | 69.68 | 75.05 | 72.05 | 75.07 | 75.07 | 76.39 | 70.68 | 77.80 | 80.04 |
| Annual average | 21.43 | 19.27 | 20.52 | 19.83 | 20.52 | 20.52 | 20.83 | 19.51 | 21.15 | 21.65 |
| 1 year | 28.64 | 21.89 | 27.71 | 22.71 | 27.74 | 26.74 | 28.05 | 23.88 | 28.35 | 29.03 |
Current performance may be lower or higher than the quoted past performance, which cannot guarantee future results. After sales charge returns (public offering price, or POP) for class A and M shares reflect a maximum 5.25% and 3.25% load, respectively. Class B share returns reflect the applicable contingent deferred sales charge (CDSC), which is 5% in the first year, declining to 1% in the sixth year, and is eliminated thereafter. Class C shares reflect a 1% CDSC for the first year and is eliminated thereafter. Class R and Y shares have no initial sales charge or CDSC. Performance for class B, C, M, R, and Y shares before their inception is derived from the historical performance of class A shares, adjusted for the applicable sales charge (or CDSC) and, except for class Y shares, the higher operating expenses for such shares.
For a portion of the periods, this fund may have limited expenses, without which returns would have been lower.
A 1% short-term trading fee may be applied to shares exchanged or sold within 7 days of purchase.
Change in the value of a $10,000 investment ($9,475 after sales charge)
Cumulative total return from 10/31/97 to 10/31/07
![]()
Past performance does not indicate future results. At the end of the same time period, a $10,000 investment in the fund’s class B and class C shares would have been valued at $20,625 and $20,615, respectively, and no contingent deferred sales charges would apply. A $10,000 investment in the fund’s class M shares ($9,675 after sales charge) would have been valued at $20,460 at public offering price. A $10,000 investment in the fund’s class R and class Y shares would have been valued at $21,678 and $22,340, respectively.
10
Comparative index returns For periods ended 10/31/07
| Lipper Utility Funds | ||
| S&P Utilities Index | category average* | |
| Annual average | ||
| (life of fund) | 9.83% | 11.35% |
| 10 years | 142.52 | 181.86 |
| Annual average | 9.26 | 10.78 |
| 5 years | 180.55 | 179.01 |
| Annual average | 22.91 | 22.57 |
| 3 years | 79.04 | 84.91 |
| Annual average | 21.43 | 22.61 |
| 1 year | 22.61 | 26.87 |
Index and Lipper results should be compared to fund performance at net asset value.
* Over the 1-year, 3-year, 5-year, 10-year, and life-of-fund periods ended 10/31/07, there were 100, 80, 65, 44, and 9 funds, respectively, in this Lipper category.
Fund price and distribution information For the 12-month period ended 10/31/07
| Distributions | Class A | Class B | Class C | Class M | Class R | Class Y | ||
| Number | 4 | 4 | 4 | 4 | 4 | 4 | ||
| Income | $0.196 | $0.083 | $0.092 | $0.124 | $0.168 | $0.232 | ||
| Capital gains | — | — | — | — | — | — | ||
| Total | $0.196 | $0.083 | $0.092 | $0.124 | $0.168 | $0.232 | ||
| Share value: | NAV | POP | NAV | NAV | NAV | POP | NAV | NAV |
| 10/31/06 | $12.82 | $13.53 | $12.75 | $12.74 | $12.80 | $13.23 | $12.80 | $12.82 |
| 10/31/07 | 16.27 | 17.17 | 16.19 | 16.17 | 16.25 | 16.80 | 16.24 | 16.28 |
| Current yield (end of period) | ||||||||
| Current dividend rate1 | 1.28% | 1.21% | 0.57% | 0.62% | 0.81% | 0.79% | 1.13% | 1.50% |
| Current 30-day SEC yield2 | N/A | 1.36 | 0.72 | 0.72 | N/A | 0.93 | 1.20 | 1.67 |
1 Most recent distribution, excluding capital gains, annualized and divided by NAV or POP at end of period.
2 Based only on investment income and calculated using the maximum offering price for each share class, in accordance with SEC guidelines.
Fund performance as of most recent calendar quarter Total return for periods ended 9/30/07
| Class A | Class B | Class C | Class M | Class R | Class Y | |||||
| (inception dates) | (11/19/90) | (4/27/92) | (7/26/99) | (3/1/95) | (12/1/03) | (10/4/05) | ||||
| NAV | POP | NAV | CDSC | NAV | CDSC | NAV | POP | NAV | NAV | |
| Annual average | ||||||||||
| (life of fund) | 9.68% | 9.33% | 8.86% | 8.86% | 8.86% | 8.86% | 9.14% | 8.93% | 9.41% | 9.71% |
| 10 years | 107.84 | 96.96 | 92.68 | 92.68 | 92.74 | 92.74 | 97.67 | 91.24 | 102.76 | 108.85 |
| Annual average | 7.59 | 7.01 | 6.78 | 6.78 | 6.78 | 6.78 | 7.05 | 6.70 | 7.32 | 7.64 |
| 5 years | 159.28 | 145.61 | 150.01 | 148.01 | 149.85 | 149.85 | 153.00 | 144.66 | 156.08 | 160.54 |
| Annual average | 20.99 | 19.69 | 20.11 | 19.92 | 20.10 | 20.10 | 20.40 | 19.59 | 20.69 | 21.11 |
| 3 years | 74.24 | 65.09 | 70.24 | 67.24 | 70.24 | 70.24 | 71.44 | 65.86 | 72.80 | 75.08 |
| Annual average | 20.33 | 18.19 | 19.40 | 18.70 | 19.40 | 19.40 | 19.68 | 18.37 | 20.00 | 20.53 |
| 1 year | 26.76 | 20.15 | 25.72 | 20.72 | 25.74 | 24.74 | 26.08 | 21.96 | 26.38 | 27.08 |
11
Fund’s annual operating expenses For the fiscal year ended 10/31/06
| Class A | Class B | Class C | Class M | Class R | Class Y | |
| Net expenses* | 1.23% | 1.98% | 1.98% | 1.73% | 1.48% | 0.98% |
| Total annual fund operating expenses | 1.24 | 1.99 | 1.99 | 1.74 | 1.49 | 0.99 |
* Reflects Putnam Management’s decision to contractually limit expenses through 10/31/08.
Expense information in this table is taken from the most recent prospectus, is subject to change, and may differ from that shown in the next section and in the financial highlights of this report. Expenses are shown as a percentage of average net assets.
12
Your fund’s expenses
As a mutual fund investor, you pay ongoing expenses, such as management fees, distribution fees (12b-1 fees), and other expenses. In the most recent six-month period, your fund limited these expenses; had it not done so, expenses would have been higher. Using the information below, you can estimate how these expenses affect your investment and compare them with the expenses of other funds. You may also pay one-time transaction expenses, including sales charges (loads) and redemption fees, which are not shown in this section and would have resulted in higher total expenses. For more information, see your fund’s prospectus or talk to your financial representative.
Review your fund’s expenses
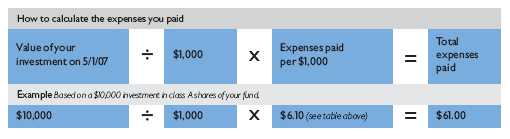
The table below shows the expenses you would have paid on a $1,000 investment in Putnam Utilities Growth and Income Fund from May 1, 2007, to October 31, 2007. It also shows how much a $1,000 investment would be worth at the close of the period, assuming actual returns and expenses.
| Class A | Class B | Class C | Class M | Class R | Class Y | |
| Expenses paid per $1,000* | $ 6.10 | $ 10.02 | $ 10.02 | $ 8.71 | $ 7.41 | $ 4.78 |
| Ending value (after expenses) | $1,084.70 | $1,080.80 | $1,080.60 | $1,082.10 | $1,083.90 | $1,086.00 |
* Expenses for each share class are calculated using the fund’s annualized expense ratio for each class, which represents the ongoing expenses as a percentage of average net assets for the six months ended 10/31/07. The expense ratio may differ for each share class (see the last table in this section). Expenses are calculated by multiplying the expense ratio by the average account value for the period; then multiplying the result by the number of days in the period; and then dividing that result by the number of days in the year.
Estimate the expenses you paid
To estimate the ongoing expenses you paid for the six months ended October 31, 2007, use the calculation method below. To find the value of your investment on May 1, 2007, call Putnam at 1-800-225-1581.
Compare expenses using the SEC’s method
The Securities and Exchange Commission (SEC) has established guidelines to help investors assess fund expenses. Per these guidelines, the table below shows your fund’s expenses based on a $1,000 investment, assuming a hypothetical 5% annualized return. You can use this information to compare the ongoing expenses (but not transaction expenses or total costs) of investing in the fund with those of other funds. All mutual fund shareholder reports will provide this information to help you make this comparison. Please note that you cannot use this information to estimate your actual ending account balance and expenses paid during the period.
| Class A | Class B | Class C | Class M | Class R | Class Y | |
| Expenses paid per $1,000* | $ 5.90 | $ 9.70 | $ 9.70 | $ 8.44 | $ 7.17 | $ 4.63 |
| Ending value (after expenses) | $1,019.36 | $1,015.58 | $1,015.58 | $1,016.84 | $1,018.10 | $1,020.62 |
* Expenses for each share class are calculated using the fund’s annualized expense ratio for each class, which represents the ongoing expenses as a percentage of average net assets for the six months ended 10/31/07. The expense ratio may differ for each share class (see the last table in this section). Expenses are calculated by multiplying the expense ratio by the average account value for the period; then multiplying the result by the number of days in the period; and then dividing that result by the number of days in the year.
13
Compare expenses using industry averages
You can also compare your fund’s expenses with the average of its peer group, as defined by Lipper, an independent fund-rating agency that ranks funds relative to others that Lipper considers to have similar investment styles or objectives. The expense ratio for each share class shown below indicates how much of your fund’s average net assets have been used to pay ongoing expenses during the period.
| Class A | Class B | Class C | Class M | Class R | Class Y | |
| Your fund’s annualized expense ratio* | 1.16% | 1.91% | 1.91% | 1.66% | 1.41% | 0.91% |
| Average annualized expense ratio for Lipper peer group† | 1.23% | 1.98% | 1.98% | 1.73% | 1.48% | 0.98% |
* For the fund’s most recent fiscal half year; may differ from expense ratios based on one-year data in the financial highlights.
† Putnam is committed to keeping fund expenses below the Lipper peer group average expense ratio and will limit fund expenses if they exceed the Lipper average. The Lipper average is a simple average of front-end load funds in the peer group that excludes 12b-1 fees as well as any expense offset and brokerage service arrangements that may reduce fund expenses. To facilitate the comparison in this presentation, Putnam has adjusted the Lipper average to reflect the 12b-1 fees carried by each class of shares other than class Y shares, which do not incur 12b-1 fees. Investors should note that the other funds in the peer group may be significantly smaller or larger than the fund, and that an asset-weighted average would likely be lower than the simple average. Also, the fund and Lipper report expense data at different times and for different periods. The fund’s expense ratio shown here is annualized data for the most recent six-month period, while the quarte rly updated Lipper average is based on the most recent fiscal year-end data available for the peer group funds as of 9/30/07.
14
Your fund’s portfolio turnover
and Morningstar® Risk
Putnam funds are actively managed by teams of experts who buy and sell securities based on intensive analysis of companies, industries, economies, and markets. Portfolio turnover is a measure of how often a fund’s managers buy and sell securities for your fund. A portfolio turnover of 100%, for example, means that the managers sold and replaced securities valued at 100% of a fund’s average portfolio value within a given period. Funds with high turnover may be more likely to generate capital gains that must be distributed to shareholders as taxable income. High turnover may also cause a fund to pay more brokerage commissions and other transaction costs, which may detract from performance.
Funds that invest in bonds or other fixed-income instruments may have higher turnover than funds that invest only in stocks. Short-term bond funds tend to have higher turnover than longer-term bond funds, because shorter-term bonds will mature or be sold more frequently than longer-term bonds. You can use the table below to compare your fund’s turnover with the average turnover for funds in its Lipper category.
Turnover comparisons
Percentage of holdings that change every year
| 2007 | 2006 | 2005 | 2004 | 2003 | |
| Putnam Utilities Growth and Income Fund | 42% | 65% | 39% | 30% | 40% |
| Lipper Utility Funds category average | 84% | 104% | 122% | 203% | 231% |
Turnover data for the fund is calculated based on the fund’s fiscal-year period, which ends on October 31. Turnover data for the fund’s Lipper category is calculated based on the average of the turnover of each fund in the category for its fiscal year ended during the indicated year. Fiscal years vary across funds in the Lipper category, which may limit the comparability of the fund’s portfolio turnover rate to the Lipper average. Comparative data for 2007 is based on information available as of 10/31/07.
Your fund’s Morningstar® Risk
This risk comparison is designed to help you understand how your fund compares with other funds. The comparison utilizes a risk measure developed by Morningstar, an independent fund-rating agency. This risk measure is referred to as the fund’s Morningstar Risk.
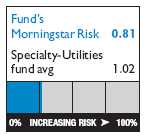
Your fund’s Morningstar Risk is shown alongside that of the average fund in its Morningstar category. The risk bar broadens the comparison by translating the fund’s Morningstar Risk into a percentile, which is based on the fund’s ranking among all funds rated by Morningstar as of September 30, 2007. A higher Morningstar Risk generally indicates that a fund’s monthly returns have varied more widely.
Morningstar determines a fund’s Morningstar Risk by assessing variations in the fund’s monthly returns — with an emphasis on —measures are weighted and averaged to produce the fund’s Morningstar Risk. The information shown is provided for the fund’s class A shares only; information for other classes may vary. Morningstar Risk is based on historical data and does not indicate future results. Morningstar does not purport to measure the risk associated with a current investment in a fund, either on an absolute basis or on a relative basis. Low Morningstar Risk does not mean that you cannot lose money on an investment in a fund. Copyright 2007 Morningstar, Inc. All Rights Reserved. The information contained herein (1) is proprietary to Morningstar and/or its content providers; (2) may not be copied or distributed; and (3) is not warranted to be accurate, complete, or timely. Neither Morningstar nor its content providers are responsible for any damages or losses arising from any use of this information.
15
Your fund’s management
Your fund is managed by the members of the Putnam Global Equity Research and Core Fixed-Income teams. Michael Yogg is the Portfolio Leader. Matthew Doody, Vivek Gandhi, Craig Goryl, and Kevin Murphy are the Portfolio Members of the fund. The Portfolio Leader and Portfolio Members coordinate the teams’ management of the fund.
For a complete listing of the members of the Putnam Global Equity Research and Core Fixed-Income teams, including those who are not Portfolio Leaders or Portfolio Members of your fund, visit Putnam’s Individual Investor Web site at www.putnam.com.
Investment team fund ownership
The table below shows how much the fund’s current Portfolio Leader and Portfolio Member have invested in the fund and in all Putnam mutual funds (in dollar ranges). Information shown is as of October 31, 2007, and October 31, 2006.
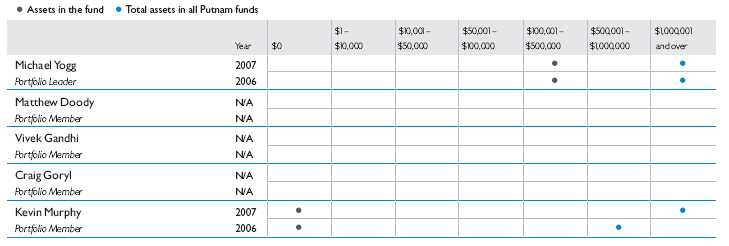
N/A indicates the individual became a Portfolio Leader or Portfolio Member after the reporting date.
Trustee and Putnam employee fund ownership
As of October 31, 2007, all of the Trustees of the Putnam funds owned fund shares. The table below shows the approximate value of investments in the fund and all Putnam funds as of that date by the Trustees and Putnam employees. These amounts include investments by the Trustees’ and employees’ immediate family members and investments through retirement and deferred compensation plans.
| Total assets in | ||
| Assets in the fund | all Putnam funds | |
| Trustees | $ 165,000 | $ 92,000,000 |
| Putnam employees | $2,461,000 | $777,000,000 |
Other Putnam funds managed by the Portfolio Leader and Portfolio Members
Kevin Murphy is also a Portfolio Member of Putnam Diversified Income Trust, Putnam Income Fund, Putnam Master Intermediate Income Trust, and Putnam Premier Income Trust.
Michael Yogg, Matthew Doody, Vivek Gandhi, Craig Goryl, and Kevin Murphy may also manage other accounts and variable trust funds advised by Putnam Management or an affiliate.
Changes in your fund’s Portfolio Leader and Portfolio Members
Your fund’s Portfolio Leader did not change during the year ended October 31, 2007. Shortly after the close of the period, Portfolio Member Stephen Burgess left your fund’s management team, and Portfolio Members Matthew Doody, Vivek Gandhi, and Craig Goryl joined your fund’s management team.
16
Terms and definitions
Important terms
Total return shows how the value of the fund’s shares changed over time, assuming you held the shares through the entire period and reinvested all distributions in the fund.
Net asset value (NAV) is the price, or value, of one share of a mutual fund, without a sales charge. NAVs fluctuate with market conditions. NAV is calculated by dividing the net assets of each class of shares by the number of outstanding shares in the class.
Public offering price (POP) is the price of a mutual fund share plus the maximum sales charge levied at the time of purchase. POP performance figures shown here assume the 5.25% maximum sales charge for class A shares and 3.25% for class M shares.
Contingent deferred sales charge (CDSC) is generally a charge applied at the time of the redemption of class B or C shares and assumes redemption at the end of the period. Your fund’s class B CDSC declines from a 5% maximum during the first year to 1% during the sixth year. After the sixth year, the CDSC no longer applies. The CDSC for class C shares is 1% for one year after purchase.
Current yield is the annual rate of return earned from dividends or interest of an investment. Current yield is expressed as a percentage of the price of a security, fund share, or principal investment.
Share classes
Class A shares are generally subject to an initial sales charge and no CDSC (except on certain redemptions of shares bought without an initial sales charge).
Class B shares are not subject to an initial sales charge. They may be subject to a CDSC.
Class C shares are not subject to an initial sales charge and are subject to a CDSC only if the shares are redeemed during the first year.
Class M shares have a lower initial sales charge and a higher 12b-1 fee than class A shares and no CDSC (except on certain redemptions of shares bought without an initial sales charge).
Class R shares are not subject to an initial sales charge or CDSC and are available only to certain defined contribution plans.
Class Y shares are not subject to an initial sales charge or CDSC, and carry no 12b-1 fee. They are generally only available to corporate and institutional clients and clients in other approved programs.
Comparative indexes
Lehman Aggregate Bond Index is an unmanaged index of U.S. investment-grade fixed-income securities.
Merrill Lynch 91-Day Treasury Bill Index is an unmanaged index that seeks to measure the performance of U.S. Treasury bills available in the marketplace.
S&P 500 Index is an unmanaged index of common stock performance.
S&P Utilities Index is an unmanaged index of common stocks issued by utility companies.
Indexes assume reinvestment of all distributions and do not account for fees. Securities and performance of a fund and an index will differ. You cannot invest directly in an index.
Lipper is a third-party industry-ranking entity that ranks mutual funds. Its rankings do not reflect sales charges. Lipper rankings are based on total return at net asset value relative to other funds that have similar current investment styles or objectives as determined by Lipper. Lipper may change a fund’s category assignment at its discretion. Lipper category averages reflect performance trends for funds within a category.
17
Trustee approval
of management contract
General conclusions
The Board of Trustees of the Putnam funds oversees the management of each fund and, as required by law, determines annually whether to approve the continuance of your fund’s management contract with Putnam Investment Management (“Putnam Management”) and the sub-management contract between Putnam Management’s affiliate, Putnam Investments Limited (“PIL”), and Putnam Management. In this regard, the Board of Trustees, with the assistance of its Contract Committee consisting solely of Trustees who are not “interested persons” (as such term is defined in the Investment Company Act of 1940, as amended) of the Putnam funds (the “Independent Trustees”), requests and evaluates all information it deems reasonably necessary under the circumstances. Over the course of several months ending in June 2007, the Contract Committee met several times to consider the information provided by Putnam Management and other information develo ped with the assistance of the Board’s independent counsel and independent staff. The Contract Committee reviewed and discussed key aspects of this information with all of the Independent Trustees. The Contract Committee recommended, and the Independent Trustees approved, the continuance of your fund’s management contract and sub-management contract, effective July 1, 2007. (Because PIL is an affiliate of Putnam Management and Putnam Management remains fully responsible for all services provided by PIL, the Trustees have not evaluated PIL as a separate entity, and all subsequent references to Putnam Management below should be deemed to include reference to PIL as necessary or appropriate in the context.)
In addition, in anticipation of the sale of Putnam Investments to Great-West Lifeco, at a series of meetings ending in March 2007, the Trustees reviewed and approved new management and distribution arrangements to take effect upon the change of control. Shareholders of all funds approved the management contracts in May 2007, and the change of control transaction was completed on August 3, 2007. Upon the change of control, the management contracts that were approved by the Trustees in June 2007 automatically terminated and were replaced by new contracts that had been approved by shareholders. In connection with their review for the June 2007 continuance of the Putnam funds’ management contracts, the Trustees did not identify any facts or circumstances that would alter the substance of the conclusions and recommendations they made in their review of the contracts to take effect upon the change of control.
The Independent Trustees’ approval was based on the following conclusions:
• That the fee schedule in effect for your fund represented reasonable compensation in light of the nature and quality of the services being provided to the fund, the fees paid by competitive funds and the costs incurred by Putnam Management in providing such services, and
• That this fee schedule represented an appropriate sharing between fund shareholders and Putnam Management of such economies of scale as may exist in the management of the fund at current asset levels.
These conclusions were based on a comprehensive consideration of all information provided to the Trustees and were not the result of any single factor. Some of the factors that figured particularly in the Trustees’ deliberations and how the Trustees considered these factors are described below, although individual Trustees may have evaluated the information presented differently, giving different weights to various factors. It is also important to recognize that the fee arrangements for your fund and the other Putnam funds are the result of many years of review and discussion between the Independent Trustees and Putnam Management, that certain aspects of such arrangements may receive greater scrutiny in some years than others, and that the Trustees’ conclusions may be based, in part, on their consideration of these same arrangements in prior years.
Management fee schedules and categories; total expenses
The Trustees reviewed the management fee schedules in effect for all Putnam funds, including fee levels and breakpoints, and the assignment of funds to particular fee categories. In reviewing fees and expenses, the Trustees generally focused their attention on material changes in circumstances — for example, changes in a fund’s size or investment style, changes in Putnam Management’s operating costs or responsibilities, or changes in competitive practices in the mutual fund industry — that suggest that consideration of fee changes might be warranted. The Trustees concluded that the circumstances did not warrant changes to the management fee structure of your fund, which had been carefully developed over the years, re-examined on many occasions and adjusted where appropriate. The Trustees focused on two areas of particular interest, as discussed further below:
18
• Competitiveness. The Trustees reviewed comparative fee and expense information for competitive funds, which indicated that, in a custom peer group of competitive funds selected by Lipper Inc., your fund ranked in the 67th percentile in management fees and in the 40th percentile in total expenses (less any applicable 12b-1 fees) as of December 31, 2006 (the first percentile being the least expensive funds and the 100th percentile being the most expensive funds). (Because the fund’s custom peer group is smaller than the fund’s broad Lipper Inc. peer group, this expense information may differ from the Lipper peer expense information found elsewhere in this report.) The Trustees noted that expense ratios for a number of Putnam funds, which show the percentage of fund assets used to pay for management and administrative services, distribution (12b-1) fees and other expenses, had been increasing recently as a result of declining net assets and the natural operation of fee breakpoints.
The Trustees noted that the expense ratio increases described above were currently being controlled by expense limitations implemented in January 2004 and which Putnam Management had committed to maintain at least through 2007. In anticipation of the change of control of Putnam Investments, the Trustees requested, and received a commitment from Putnam Management and Great-West Lifeco, to extend this program through at least June 30, 2009. These expense limitations give effect to a commitment by Putnam Management that the expense ratio of each open-end fund would be no higher than the average expense ratio of the competitive funds included in the fund’s relevant Lipper universe (exclusive of any applicable 12b-1 charges in each case). The Trustees observed that this commitment to limit fund expenses has served shareholders well since its inception.
In order to ensure that the expenses of the Putnam funds continue to meet evolving competitive standards, the Trustees requested, and Putnam Management agreed, to extend for the twelve months beginning July 1, 2007, an additional expense limitation for certain funds at an amount equal to the average expense ratio (exclusive of 12b-1 charges) of a custom peer group of competitive funds selected by Lipper to correspond to the size of the fund. This additional expense limitation will be applied to those open-end funds that had above-average expense ratios (exclusive of 12b-1 charges) based on the custom peer group data for the period ended December 31, 2006. This additional expense limitation will not be applied to your fund because it had a below-average expense ratio relative to its custom peer group.
• Economies of scale. Your fund currently has the benefit of breakpoints in its management fee that provide shareholders with significant economies of scale, which means that the effective management fee rate of a fund (as a percentage of fund assets) declines as a fund grows in size and crosses specified asset thresholds. Conversely, as a fund shrinks in size — as has been the case for many Putnam funds in recent years — these breakpoints result in increasing fee levels. In recent years, the Trustees have examined the operation of the existing breakpoint structure during periods of both growth and decline in asset levels. The Trustees concluded that the fee schedules in effect for the funds represented an appropriate sharing of economies of scale at current asset levels. In reaching this conclusion, the Trustees considered the Contract Committee’s stated intent to continue t o work with Putnam Management to plan for an eventual resumption in the growth of assets, and to consider the potential economies that might be produced under various growth assumptions.
In connection with their review of the management fees and total expenses of the Putnam funds, the Trustees also reviewed the costs of the services to be provided and profits to be realized by Putnam Management and its affiliates from the relationship with the funds. This information included trends in revenues, expenses and profitability of Putnam Management and its affiliates relating to the investment management and distribution services provided to the funds. In this regard, the Trustees also reviewed an analysis of Putnam Management’s revenues, expenses and profitability with respect to the funds’ management contracts, allocated on a fund-by-fund basis.
Investment performance
The quality of the investment process provided by Putnam Management represented a major factor in the Trustees’ evaluation of the quality of services provided by Putnam Management under your fund’s management contract. The Trustees were assisted in their review of the Putnam funds’ investment process and performance by the work of the Investment Process Committee of the Trustees and the Investment Oversight Committees of the Trustees, which had met on a regular monthly basis with the funds’ portfolio teams throughout the year. The Trustees concluded that Putnam Management generally provides a high-quality investment process — as measured by the experience and skills of the individuals assigned to the management of fund portfolios, the resources made available to such personnel, and in general the ability of Putnam Management to attract and
19
retain high-quality personnel — but also recognized that this does not guarantee favorable investment results for every fund in every time period. The Trustees considered the investment performance of each fund over multiple time periods and considered information comparing each fund’s performance with various benchmarks and with the performance of competitive funds.
The Trustees noted the satisfactory investment performance of many Putnam funds. They also noted the disappointing investment performance of certain funds in recent years and discussed with senior management of Putnam Management the factors contributing to such underperformance and actions being taken to improve performance. The Trustees recognized that, in recent years, Putnam Management has made significant changes in its investment personnel and processes and in the fund product line to address areas of underperformance. In particular, they noted the important contributions of Putnam Management’s leadership in attracting, retaining and supporting high-quality investment professionals and in systematically implementing an investment process that seeks to merge the best features of fundamental and quantitative analysis. The Trustees indicated their intention to continue to monitor performance trends to assess the effectiveness of these changes and to evaluate whether additional changes to address areas of underperformance are warranted.
In the case of your fund, the Trustees considered that your fund’s class A share cumulative total return performance at net asset value was in the following percentiles of its Lipper Inc. peer group (Lipper Utility Funds) for the one-, three- and five-year periods ended March 31, 2007 (the first percentile being the best-performing funds and the 100th percentile being the worst-performing funds):
| One-year period | Three-year period | Five-year period |
| 15th | 73rd | 69th |
(Because of the passage of time, these performance results may differ from the performance results for more recent periods shown elsewhere in this report. Over the one-, three- and five-year periods ended March 31, 2007, there were 98, 76, and 68 funds, respectively, in your fund’s Lipper peer group.* Past performance is no guarantee of future returns.)
As a general matter, the Trustees concluded that cooperative efforts between the Trustees and Putnam Management represent the most effective way to address investment performance problems. The Trustees noted that investors in the Putnam funds have, in effect, placed their trust in the Putnam organization, under the oversight of the funds’ Trustees, to make appropriate decisions regarding the management of the funds. Based on the responsiveness of Putnam Management in the recent past to Trustee concerns about investment performance, the Trustees concluded that it is preferable to seek change within Putnam Management to address performance shortcomings. In the Trustees’ view, the alternative of terminating a management contract and engaging a new investment adviser for an underperforming fund would entail significant disruptions and would not provide any greater assurance of improved investment performance.
Brokerage and soft-dollar allocations; other benefits
The Trustees considered various potential benefits that Putnam Management may receive in connection with the services it provides under the management contract with your fund. These include benefits related to brokerage and soft-dollar allocations, whereby a portion of the commissions paid by a fund for brokerage may be used to acquire research services that may be useful to Putnam Management in managing the assets of the fund and of other clients. The Trustees indicated their continued intent to monitor the potential benefits associated with the allocation of fund brokerage to ensure that the principle of seeking “best price and execution” remains paramount in the portfolio trading process.
The Trustees’ annual review of your fund’s management contract also included the review of its distributor’s contract and distribution plan with Putnam Retail Management Limited Partnership and the custodian agreement and investor servicing agreement with Putnam Fiduciary Trust Company (“PFTC”), each of which provides benefits to affiliates of Putnam Management. In the case of the custodian agreement, the Trustees considered that, effective January 1, 2007, the Putnam funds had engaged State Street Bank and Trust Company as custodian and began to transition the responsibility for providing custody services away from PFTC.
* The percentile rankings for your fund’s class A share annualized total return performance in the Lipper Utility Funds category for the one-, five- and ten-year periods ended September 30, 2007 were 42%, 57%, and 92%, respectively. Over the one-, five- and ten-year periods ended September 30, 2007, the fund ranked 42nd out of 101, 39th out of 68, and 44th out of 47 funds, respectively. Note that this more recent information was not available when the Trustees approved the continuance of your fund’s management contract.
20
Comparison of retail and institutional fee schedules
The information examined by the Trustees as part of their annual contract review has included for many years information regarding fees charged by Putnam Management and its affiliates to institutional clients such as defined benefit pension plans, college endowments, etc. This information included comparison of such fees with fees charged to the funds, as well as a detailed assessment of the differences in the services provided to these two types of clients. The Trustees observed, in this regard, that the differences in fee rates between institutional clients and the funds are by no means uniform when examined by individual asset sectors, suggesting that differences in the pricing of investment management services to these types of clients reflect to a substantial degree historical competitive forces operating in separate market places. The Trustees considered the fact that fee rates across all asset sectors are higher on average for funds than for institutional clients, as well as the differences between the services that Putnam Management provides to the Putnam funds and those that it provides to institutional clients of the firm, but did not rely on such comparisons to any significant extent in concluding that the management fees paid by your fund are reasonable.
21
Other information for shareholders
Putnam’s policy on confidentiality
In order to conduct business with our shareholders, we must obtain certain personal information such as account holders’ addresses, telephone numbers, Social Security numbers, and the names of their financial representatives. We use this information to assign an account number and to help us maintain accurate records of transactions and account balances. It is our policy to protect the confidentiality of your information, whether or not you currently own shares of our funds, and, in particular, not to sell information about you or your accounts to outside marketing firms. We have safeguards in place designed to prevent unauthorized access to our computer systems and procedures to protect personal information from unauthorized use. Under certain circumstances, we share this information with outside vendors who provide services to us, such as mailing and proxy solicitation. In those cases, the service providers enter into confi dentiality agreements with us, and we provide only the information necessary to process transactions and perform other services related to your account. We may also share this information with our Putnam affiliates to service your account or provide you with information about other Putnam products or services. It is also our policy to share account information with your financial representative, if you’ve listed one on your Putnam account. If you would like clarification about our confidentiality policies or have any questions or concerns, please don’t hesitate to contact us at 1-800-225-1581, Monday through Friday, 8:30 a.m. to 7:00 p.m., or Saturdays from 9:00 a.m. to 5:00 p.m. Eastern Time.
Proxy voting
Putnam is committed to managing our mutual funds in the best interests of our shareholders. The Putnam funds’ proxy voting guidelines and procedures, as well as information regarding how your fund voted proxies relating to portfolio securities during the 12-month period ended June 30, 2007, are available on the Putnam Individual Investor Web site, www.putnam.com/individual, and on the SEC’s Web site, www.sec.gov. If you have questions about finding forms on the SEC’s Web site, you may call the SEC at 1-800-SEC-0330. You may also obtain the Putnam funds’ proxy voting guidelines and procedures at no charge by calling Putnam’s Shareholder Services at 1-800-225-1581.
Fund portfolio holdings
The fund will file a complete schedule of its portfolio holdings with the SEC for the first and third quarters of each fiscal year on Form N-Q. Shareholders may obtain the fund’s Forms N-Q on the SEC’s Web site at www.sec.gov. In addition, the fund’s Forms N-Q may be reviewed and copied at the SEC’s Public Reference Room in Washington, D.C. You may call the SEC at 1-800-SEC-0330 for information about the SEC’s Web site or the operation of the Public Reference Room.
22
Financial statements
These sections of the report, as well as the accompanying Notes, preceded by the Report of Independent Registered Public Accounting Firm, constitute the fund’s financial statements.
The fund’s portfolio lists all the fund’s investments and their values as of the last day of the reporting period. Holdings are organized by asset type and industry sector, country, or state to show areas of concentration and diversification.
Statement of assets and liabilities shows how the fund’s net assets and share price are determined. All investment and non-investment assets are added together. Any unpaid expenses and other liabilities are subtracted from this total. The result is divided by the number of shares to determine the net asset value per share, which is calculated separately for each class of shares. (For funds with preferred shares, the amount subtracted from total assets includes the liquidation preference of preferred shares.)
Statement of operations shows the fund’s net investment gain or loss. This is done by first adding up all the fund’s earnings — from dividends and interest income — and subtracting its operating expenses to determine net investment income (or loss). Then, any net gain or loss the fund realized on the sales of its holdings — as well as any unrealized gains or losses over the period — is added to or subtracted from the net investment result to determine the fund’s net gain or loss for the fiscal year.
Statement of changes in net assets shows how the fund’s net assets were affected by the fund’s net investment gain or loss, by distributions to shareholders, and by changes in the number of the fund’s shares. It lists distributions and their sources (net investment income or realized capital gains) over the current reporting period and the most recent fiscal year-end. The distributions listed here may not match the sources listed in the Statement of operations because the distributions are determined on a tax basis and may be paid in a different period from the one in which they were earned.
Financial highlights provide an overview of the fund’s investment results, per-share distributions, expense ratios, net investment income ratios, and portfolio turnover in one summary table, reflecting the five most recent reporting periods. In a semiannual report, the highlight table also includes the current reporting period.
23
Report of Independent Registered Public Accounting Firm
To the Trustees and Shareholders of
Putnam Utilities Growth and Income Fund:
In our opinion, the accompanying statement of assets and liabilities, including the fund’s portfolio, and the related statements of operations and of changes in net assets and the financial highlights present fairly, in all material respects, the financial position of Putnam Utilities Growth and Income Fund (the “fund”) at October 31, 2007 and the results of its operations, the changes in its net assets and the financial highlights for each of the periods indicated, in conformity with accounting principles generally accepted in the United States of America. These financial statements and financial highlights (hereafter referred to as “financial statements”) are the responsibility of the fund’s management. Our responsibility is to express an opinion on these financial statements based on our audits. We conducted our audits of these financial statements in accordance with the standards of the Public Company Accounting Oversight Board (United States). Those standards require that we plan and perform the audit to obtain reasonable assurance about whether the financial statements are free of material misstatement. An audit includes examining, on a test basis, evidence supporting the amounts and disclosures in the financial statements, assessing the accounting principles used and significant estimates made by management, and evaluating the overall financial statement presentation. We believe that our audits, which included confirmation of investments owned at October 31, 2007 by correspondence with the custodian, and brokers provide a reasonable basis for our opinion.
PricewaterhouseCoopers LLP
Boston, Massachusetts
December 11, 2007
24
The fund’s portfolio 10/31/07
| COMMON STOCKS (98.9%)* | |||
| Shares | Value | ||
| Commercial and Consumer Services (0.4%) | |||
| Macquarie Infrastructure Group | |||
| (Australia) | 772,947 | $ | 2,299,065 |
| Electric Utilities (63.5%) | |||
| Alliant Energy Corp. | 148,334 | 5,933,360 | |
| American Electric Power Co., Inc. | 101,500 | 4,893,315 | |
| Chubu Electric Power, Inc. (Japan) | 119,200 | 3,054,521 | |
| CMS Energy Corp. (S) | 459,790 | 7,802,636 | |
| Consolidated Edison, Inc. (S) | 100,500 | 4,732,545 | |
| Constellation Energy Group, Inc. | 192,495 | 18,229,277 | |
| Dominion Resources, Inc. | 250,575 | 22,960,187 | |
| DPL, Inc. | 237,151 | 6,886,865 | |
| DTE Energy Co. (S) | 168,100 | 8,337,760 | |
| Duke Energy Corp. | 781,501 | 14,981,374 | |
| E.On AG (Germany) | 29,991 | 5,870,320 | |
| Edison International | 366,345 | 21,302,962 | |
| Electricite de France (France) | 61,466 | 7,401,282 | |
| Enel SpA (Italy) | 824,402 | 9,886,874 | |
| Entergy Corp. | 267,407 | 32,054,077 | |
| Exelon Corp. (S) | 641,952 | 53,140,787 | |
| FirstEnergy Corp. | 336,256 | 23,437,043 | |
| FPL Group, Inc. | 376,996 | 25,794,066 | |
| Iberdrola SA (Spain) | 488,644 | 7,882,194 | |
| ITC Holdings Corp. (S) | 107,300 | 6,141,852 | |
| Kansai Electric Power, Inc. (Japan) | 22,900 | 515,746 | |
| Kyushu Electric Power Co., Inc. (Japan) | 46,800 | 1,140,280 | |
| Northeast Utilities | 220,263 | 6,790,708 | |
| PG&E Corp. | 499,456 | 24,438,382 | |
| Progress Energy, Inc. | 128,631 | 6,174,288 | |
| Public Service Enterprise Group, Inc. | 250,420 | 23,940,152 | |
| RWE AG (Germany) | 58,134 | 7,959,895 | |
| SCANA Corp. | 99,700 | 4,046,823 | |
| Sierra Pacific Resources | 462,525 | 7,802,797 | |
| Southern Co. (The) (S) | 321,021 | 11,768,630 | |
| Spectra Energy Corp. | 347,100 | 9,017,658 | |
| Suez SA (France) | 152,726 | 9,976,747 | |
| Tohoku Electric Power Co., Inc. (Japan) | 64,100 | 1,353,320 | |
| TransAlta Corp. (Canada) | 36,208 | 1,301,757 | |
| Wisconsin Energy Corp. | 307,878 | 14,741,199 | |
| 421,691,679 | |||
| Energy (Other) (0.8%) | |||
| Comverge, Inc. † (S) | 65,900 | 2,319,680 | |
| Covanta Holding Corp. † | 98,146 | 2,660,738 | |
| 4,980,418 | |||
| Engineering & Construction (1.1%) | |||
| Bouygues SA (France) | 78,667 | 7,591,710 | |
| Natural Gas Utilities (10.7%) | |||
| Centrica PLC (United Kingdom) | 694,998 | 5,349,088 | |
| Energen Corp. | 75,800 | 4,851,200 | |
| Equitable Resources, Inc. | 254,703 | 14,344,873 | |
| MDU Resources Group, Inc. (S) | 185,357 | 5,219,653 | |
| Osaka Gas Co., Ltd. (Japan) | 1,172,000 | 4,558,927 | |
| Sempra Energy | 271,073 | 16,673,700 | |
| Toho Gas Co., Ltd. (Japan) | 521,000 | 2,694,488 | |
| COMMON STOCKS (98.9%)* continued | |||
| Shares | Value | ||
| Natural Gas Utilities continued | |||
| Tokyo Gas Co., Ltd. (Japan) | 1,096,000 | $ | 4,901,760 |
| Williams Cos., Inc. (The) (S) | 330,592 | 12,063,302 | |
| 70,656,991 | |||
| Oil & Gas (1.5%) | |||
| Questar Corp. | 176,628 | 10,081,926 | |
| Power Producers (4.2%) | |||
| AES Corp. (The) † | 681,348 | 14,587,661 | |
| Dynegy, Inc. Class A † (S) | 330,296 | 3,042,026 | |
| NRG Energy, Inc. † (S) | 121,300 | 5,538,558 | |
| Ormat Technologies, Inc. (S) | 88,100 | 4,751,233 | |
| 27,919,478 | |||
| Publishing (0.3%) | |||
| Idearc, Inc. | 75,228 | 2,029,651 | |
| Regional Bells (2.4%) | |||
| Verizon Communications, Inc. | 348,960 | 16,076,587 | |
| Telecommunications (7.0%) | |||
| CenturyTel, Inc. | 53,199 | 2,343,416 | |
| Cosmote Mobile Communications SA | |||
| (Greece) | 69,020 | 2,390,085 | |
| Digi.com Berhad (Malaysia) | 692,400 | 5,239,851 | |
| Koninklijke (Royal) KPN NV (Netherlands) | 307,503 | 5,819,927 | |
| StarHub, Ltd. (Singapore) | 1,284,650 | 2,777,990 | |
| Swisscom AG (Switzerland) | 4,281 | 1,589,198 | |
| Telefonica SA (Spain) | 513,520 | 17,021,031 | |
| Telenor ASA (Norway) † | 231,808 | 5,474,311 | |
| Telus Corp. (Canada) | 68,759 | 3,998,157 | |
| 46,653,966 | |||
| Telephone (5.2%) | |||
| AT&T, Inc. | 631,094 | 26,373,418 | |
| Hellenic Telecommunication Organization | |||
| (OTE) SA (Greece) | 73,622 | 2,700,614 | |
| Telekom Austria AG (Austria) | 184,065 | 5,297,644 | |
| 34,371,676 | |||
| Transportation Services (0.8%) | |||
| Macquarie Airports (Australia) | 572,962 | 2,357,975 | |
| TNT NV (Netherlands) | 66,864 | 2,751,983 | |
| 5,109,958 | |||
| Utilities & Power (1.0%) | |||
| Babcock & Brown Wind Partners | |||
| (Australia) | 1,127,926 | 1,948,732 | |
| EDF Energies Nouvelles SA (France) | 38,367 | 3,087,028 | |
| Tenaga Nasional Berhad (Malaysia) | 618,500 | 1,743,151 | |
| 6,778,911 | |||
| Total common stocks (cost $430,760,900) | $ | 656,242,016 | |
25
| SHORT-TERM INVESTMENTS (8.8%)* | ||||
| Principal amount/shares | Value | |||
| Short-term investments held | ||||
| as collateral for loaned securities | ||||
| with yields ranging from 4.50% | ||||
| to 5.69% and due dates ranging | ||||
| from November 1, 2007 to | ||||
| November 28, 2007 (d) | $ | 49,751,609 | $ | 49,670,970 |
| Putnam Prime Money Market Fund (e) | 8,502,082 | 8,502,082 | ||
| Total short-term investments (cost $58,173,052) | $ | 58,173,052 | ||
| TOTAL INVESTMENTS | ||||
| Total investments (cost $488,933,952) | $ | 714,415,068 | ||
* Percentages indicated are based on net assets of $663,743,747.
† Non-income-producing security.
(d) See Note 1 to the financial statements.
(e) See Note 5 to the financial statements regarding investments in Putnam Prime Money Market Fund.
(S) Securities on loan, in part or in entirety, at October 31, 2007.
DIVERSIFICATION BY COUNTRY
Distribution of investments by country of issue at October 31, 2007 (as a percentage of Portfolio Value):
| Australia | 1.0% | |
| Austria | 0.8 | |
| Canada | 0.8 | |
| France | 4.2 | |
| Germany | 2.1 | |
| Greece | 0.8 | |
| Italy | 1.5 | |
| Japan | 2.7 | |
| Malaysia | 1.1 | |
| Netherlands | 1.3 | |
| Norway | 0.8 | |
| Spain | 3.7 | |
| United Kingdom | 0.8 | |
| United States | 77.7 | |
| Other | 0.7 | |
| Total | 100.0% |
The accompanying notes are an integral part of these financial statements.
26
Statement of assets and liabilities 10/31/07
| ASSETS | |
| Investment in securities, at value, including $48,128,972 of securities on loan (Note 1): | |
| Unaffiliated issuers (identified cost $480,431,870) | $705,912,986 |
| Affiliated issuers (identified cost $8,502,082) (Note 5) | 8,502,082 |
| Cash | 43,595 |
| Dividends, interest and other receivables | 840,932 |
| Receivable for shares of the fund sold | 417,923 |
| Foreign tax reclaim | 82,606 |
| Total assets | 715,800,124 |
| LIABILITIES | |
| Payable to custodian (Note 2) | 3,389 |
| Payable for shares of the fund repurchased | 696,654 |
| Payable for compensation of Manager (Notes 2 and 5) | 1,061,152 |
| Payable for investor servicing (Note 2) | 174,509 |
| Payable for custodian fees (Note 2) | 12,101 |
| Payable for Trustee compensation and expenses (Note 2) | 186,998 |
| Payable for administrative services (Note 2) | 1,496 |
| Payable for distribution fees (Note 2) | 171,935 |
| Collateral on securities loaned, at value (Note 1) | 49,670,970 |
| Other accrued expenses | 77,173 |
| Total liabilities | 52,056,377 |
| Net assets | $663,743,747 |
| REPRESENTED BY | |
| Paid-in capital (Unlimited shares authorized) (Notes 1 and 4) | $446,686,803 |
| Undistributed net investment income (Note 1) | 1,375,830 |
| Accumulated net realized loss on investments and foreign currency transactions (Note 1) | (9,805,629) |
| Net unrealized appreciation of investments and assets and liabilities in foreign currencies | 225,486,743 |
| Total — Representing net assets applicable to capital shares outstanding | $663,743,747 |
| COMPUTATION OF NET ASSET VALUE AND OFFERING PRICE | |
| Net asset value and redemption price per class A share ($595,785,974 divided by 36,608,407 shares) | $16.27 |
| Offering price per class A share (100/94.75 of $16.27)* | $17.17 |
| Net asset value and offering price per class B share ($51,537,459 divided by 3,183,134 shares)** | $16.19 |
| Net asset value and offering price per class C share ($6,247,047 divided by 386,334 shares)** | $16.17 |
| Net asset value and redemption price per class M share ($3,945,571 divided by 242,806 shares) | $16.25 |
| Offering price per class M share (100/96.75 of $16.25)* | $16.80 |
| Net asset value, offering price and redemption price per class R share ($701,736 divided by 43,211 shares) | $16.24 |
| Net asset value, offering price and redemption price per class Y share ($5,525,960 divided by 339,456 shares) | $16.28 |
* On single retail sales of less than $50,000. On sales of $50,000 or more the offering price is reduced.
** Redemption price per share is equal to net asset value less any applicable contingent deferred sales charge.
The accompanying notes are an integral part of these financial statements.
27
Statement of operations Year ended 10/31/07
| INVESTMENT INCOME | |
| Dividends (net of foreign tax of $388,156) | $ 16,071,245 |
| Interest (including interest income of $527,490 from investments in affiliated issuers) (Note 5) | 788,951 |
| Securities lending | 105,066 |
| Total investment income | 16,965,262 |
| EXPENSES | |
| Compensation of Manager (Note 2) | 4,314,773 |
| Investor servicing fees (Note 2) | 1,138,829 |
| Custodian fees (Note 2) | 153,314 |
| Trustee compensation and expenses (Note 2) | 50,938 |
| Administrative services (Note 2) | 24,838 |
| Distribution fees — Class A (Note 2) | 1,413,416 |
| Distribution fees — Class B (Note 2) | 561,535 |
| Distribution fees — Class C (Note 2) | 53,207 |
| Distribution fees — Class M (Note 2) | 27,400 |
| Distribution fees — Class R (Note 2) | 2,233 |
| Other | 232,153 |
| Non-recurring costs (Notes 2 and 6) | 381 |
| Costs assumed by Manager (Notes 2 and 6) | (381) |
| Fees waived and reimbursed by Manager (Note 5) | (8,524) |
| Total expenses | 7,964,112 |
| Expense reduction (Note 2) | (173,448) |
| Net expenses | 7,790,664 |
| Net investment income | 9,174,598 |
| Net realized gain on investments (Notes 1 and 3) | 63,182,761 |
| Net realized loss on futures contracts (Note 1) | (24,844) |
| Net realized loss on swap contracts (Note 1) | (43,696) |
| Net realized loss on foreign currency transactions (Note 1) | (17,205) |
| Net unrealized appreciation of assets and liabilities in foreign currencies during the year | 1,006 |
| Net unrealized appreciation of investments during the year | 85,589,955 |
| Net gain on investments | 148,687,977 |
| Net increase in net assets resulting from operations | $157,862,575 |
The accompanying notes are an integral part of these financial statements.
28
Statement of changes in net assets
| INCREASE IN NET ASSETS | ||
| Year ended | Year ended | |
| 10/31/07 | 10/31/06 | |
| Operations: | ||
| Net investment income | $ 9,174,598 | $ 9,752,683 |
| Net realized gain on investments and foreign currency transactions | 63,097,016 | 50,957,064 |
| Net unrealized appreciation of investments and assets and liabilities in foreign currencies | 85,590,961 | 35,096,292 |
| Net increase in net assets resulting from operations | 157,862,575 | 95,806,039 |
| Distributions to shareholders (Note 1): | ||
| From ordinary income | ||
| Net investment income | ||
| Class A | (7,567,576) | (9,199,541) |
| Class B | (325,961) | (856,194) |
| Class C | (33,792) | (54,361) |
| Class M | (31,274) | (49,695) |
| Class R | (5,314) | (4,627) |
| Class Y | (74,156) | (70,276) |
| Redemption fees (Note 1) | 5,875 | 927 |
| Decrease from capital share transactions (Note 4) | (80,008,219) | (59,052,290) |
| Total increase in net assets | 69,822,158 | 26,519,982 |
| NET ASSETS | ||
| Beginning of year | 593,921,589 | 567,401,607 |
| End of year (including undistributed net investment income of $1,375,830 and $262,242, respectively) | $663,743,747 | $593,921,589 |
The accompanying notes are an integral part of these financial statements.
29
Financial highlights (For a common share outstanding throughout the period)
| INVESTMENT OPERATIONS: | LESS DISTRIBUTIONS: | RATIOS AND SUPPLEMENTAL DATA: | ||||||||||||
| Net | Total | Ratio of net | ||||||||||||
| Net asset | realized and | Total | From | From | Net asset | return | Net | Ratio of | investment | |||||
| value, | Net | unrealized | from | net | return | value, | at net | assets, | expenses to | income (loss) | Portfolio | |||
| beginning | investment | gain (loss) on | investment | investment | of | Total | Redemption | end | asset | end of period | average net | to average | turnover | |
| Period ended | of period | income (loss)(a) | investments | operations | income | capital | distributions | fees | of period | value (%)(b) | (in thousands) | assets (%)(c) | net assets (%) | (%) |
| CLASS A | ||||||||||||||
| October 31, 2007 | $12.82 | .22(d) | 3.43 | 3.65 | (.20) | — | (.20) | —(e) | $16.27 | 28.64 | $595,786 | 1.18(d) | 1.51(d) | 41.51 |
| October 31, 2006 | 10.97 | .22(d,g) | 1.86 | 2.08 | (.23) | — | (.23) | —(e) | 12.82 | 19.22 | 519,557 | 1.22(d,g) | 1.88(d,g) | 64.90 |
| October 31, 2005 | 9.58 | .22(d,f) | 1.38 | 1.60 | (.21) | — | (.21) | —(e) | 10.97 | 16.76(f) | 473,589 | 1.22(d) | 2.11(d,f) | 38.79 |
| October 31, 2004 | 8.06 | .18(d) | 1.51 | 1.69 | (.17) | — | (.17) | — | 9.58 | 21.18 | 444,698 | 1.28(d) | 2.11(d) | 29.95 |
| October 31, 2003 | 6.71 | .19 | 1.34 | 1.53 | (.17) | (.01) | (.18) | — | 8.06 | 23.17 | 478,304 | 1.23 | 2.65 | 40.12 |
| CLASS B | ||||||||||||||
| October 31, 2007 | $12.75 | .11(d) | 3.41 | 3.52 | (.08) | — | (.08) | —(e) | $16.19 | 27.71 | $51,537 | 1.93(d) | .79(d) | 41.51 |
| October 31, 2006 | 10.91 | .13(d,g) | 1.85 | 1.98 | (.14) | — | (.14) | —(e) | 12.75 | 18.31 | 62,195 | 1.97(d,g) | 1.18(d,g) | 64.90 |
| October 31, 2005 | 9.53 | .14(d,f) | 1.37 | 1.51 | (.13) | — | (.13) | —(e) | 10.91 | 15.86(f) | 81,553 | 1.97(d) | 1.37(d,f) | 38.79 |
| October 31, 2004 | 8.02 | .12(d) | 1.49 | 1.61 | (.10) | — | (.10) | — | 9.53 | 20.21 | 92,191 | 2.03(d) | 1.37(d) | 29.95 |
| October 31, 2003 | 6.67 | .14 | 1.34 | 1.48 | (.12) | (.01) | (.13) | — | 8.02 | 22.40 | 111,163 | 1.98 | 1.89 | 40.12 |
| CLASS C | ||||||||||||||
| October 31, 2007 | $12.74 | .11(d) | 3.41 | 3.52 | (.09) | — | (.09) | —(e) | $16.17 | 27.74 | $6,247 | 1.93(d) | .74(d) | 41.51 |
| October 31, 2006 | 10.91 | .13(d,g) | 1.84 | 1.97 | (.14) | — | (.14) | —(e) | 12.74 | 18.24 | 4,699 | 1.97(d,g) | 1.15(d,g) | 64.90 |
| October 31, 2005 | 9.53 | .14(d,f) | 1.37 | 1.51 | (.13) | — | (.13) | —(e) | 10.91 | 15.91(f) | 4,333 | 1.97(d) | 1.37(d,f) | 38.79 |
| October 31, 2004 | 8.02 | .12(d) | 1.50 | 1.62 | (.11) | — | (.11) | — | 9.53 | 20.27 | 3,655 | 2.03(d) | 1.36(d) | 29.95 |
| October 31, 2003 | 6.67 | .14 | 1.34 | 1.48 | (.12) | (.01) | (.13) | — | 8.02 | 22.45 | 3,699 | 1.98 | 1.87 | 40.12 |
| CLASS M | ||||||||||||||
| October 31, 2007 | $12.80 | .15(d) | 3.42 | 3.57 | (.12) | — | (.12) | —(e) | $16.25 | 28.05 | $3,946 | 1.68(d) | 1.01(d) | 41.51 |
| October 31, 2006 | 10.95 | .16(d,g) | 1.86 | 2.02 | (.17) | — | (.17) | —(e) | 12.80 | 18.64 | 3,438 | 1.72(d,g) | 1.42(d,g) | 64.90 |
| October 31, 2005 | 9.57 | .17(d,f) | 1.37 | 1.54 | (.16) | — | (.16) | —(e) | 10.95 | 16.11(f) | 3,925 | 1.72(d) | 1.62(d,f) | 38.79 |
| October 31, 2004 | 8.05 | .14(d) | 1.51 | 1.65 | (.13) | — | (.13) | — | 9.57 | 20.58 | 3,613 | 1.78(d) | 1.61(d) | 29.95 |
| October 31, 2003 | 6.70 | .16 | 1.34 | 1.50 | (.14) | (.01) | (.15) | — | 8.05 | 22.61 | 4,307 | 1.73 | 2.16 | 40.12 |
| CLASS R | ||||||||||||||
| October 31, 2007 | $12.80 | .17(d) | 3.44 | 3.61 | (.17) | — | (.17) | —(e) | $16.24 | 28.35 | $702 | 1.43(d) | 1.16(d) | 41.51 |
| October 31, 2006 | 10.96 | .18(d,g) | 1.86 | 2.04 | (.20) | — | (.20) | —(e) | 12.80 | 18.88 | 309 | 1.47(d,g) | 1.59(d,g) | 64.90 |
| October 31, 2005 | 9.57 | .20(d,f) | 1.38 | 1.58 | (.19) | — | (.19) | —(e) | 10.96 | 16.53(f) | 221 | 1.47(d) | 1.84(d,f) | 38.79 |
| October 31, 2004† | 8.20 | .15(d) | 1.38 | 1.53 | (.16) | — | (.16) | — | 9.57 | 18.86* | 95 | 1.41*(d) | 1.71*(d) | 29.95 |
| CLASS Y | ||||||||||||||
| October 31, 2007 | $12.82 | .25(d) | 3.44 | 3.69 | (.23) | — | (.23) | —(e) | $16.28 | 29.03 | $5,526 | .93(d) | 1.75(d) | 41.51 |
| October 31, 2006 | 10.97 | .24(d,g) | 1.86 | 2.10 | (.25) | — | (.25) | —(e) | 12.82 | 19.51 | 3,723 | .97(d,g) | 2.14(d,g) | 64.90 |
| October 31, 2005†† | 11.59 | .10(d) | (.72) | (.62) | — | — | — | —(e) | 10.97 | (5.35)* | 3,781 | .07*(d) | .07*(d) | 38.79 |
See notes to financial highlights at the end of this section.
The accompanying notes are an integral part of these financial statements.
| 30 | 31 |
Financial highlights (Continued)
* Not annualized.
† For the period December 1, 2003 (commencement of operations) to October 31, 2004.
†† For the period October 4, 2005 (commencement of operations) to October 31, 2005.
(a) Per share net investment income (loss) has been determined on the basis of the weighted average number of shares outstanding during the period.
(b) Total return assumes dividend reinvestment and does not reflect the effect of sales charges.
(c) Includes amounts paid through expense offset and brokerage service arrangements (Note 2).
(d) Reflects an involuntary contractual expense limitation and/or waivers of certain fund expenses in connection with investments in Putnam Prime Money Market Fund in effect during the period. As a result of such limitation and/or waivers, the expenses of each class reflect a reduction of the following amounts (Notes 2 and 5):
| Percentage | |
| of average | |
| net assets | |
| October 31, 2007 | <0.01% |
| October 31, 2006 | 0.01 |
| October 31, 2005 | <0.01 |
| October 31, 2004 | <0.01 |
(e) Amount represents less than $0.01 per share.
(f) Reflects a non-recurring accrual related to Putnam Management’s settlement with the SEC regarding brokerage allocation practices, which amounted to the following amounts:
| Percentage | ||
| of average | ||
| Per share | net assets | |
| Class A | $0.01 | 0.06% |
| Class B | 0.01 | 0.06 |
| Class C | 0.01 | 0.06 |
| Class M | 0.01 | 0.06 |
| Class R | 0.01 | 0.06 |
(g) Reflects a non-recurring reimbursement from Putnam Investments relating to the calculation of certain amounts paid by the fund to Putnam in previous years for transfer agent services, which amounted to less than $0.01 per share and 0.01% of average net assets for the period ended October 31, 2006.
The accompanying notes are an integral part of these financial statements.
32
Notes to financial statements 10/31/o7
Note 1: Significant accounting policies
Putnam Utilities Growth and Income Fund (the “fund”), a Massachusetts business trust, is registered under the Investment Company Act of 1940, as amended, as a diversified, open-end management investment company. The fund seeks capital growth and current income primarily through investments in equity and debt securities issued by public utility companies. The fund concentrates its investments in a limited number of sectors and involves more risk than a fund that invests more broadly.
The fund offers class A, class B, class C, class M, class R and class Y shares. Class A and class M shares are sold with a maximum front-end sales charge of 5.25% and 3.25%, respectively, and generally do not pay a contingent deferred sales charge. Effective January 2, 2008, the class A and class M maximum front-end sales charge will change to 5.75% and 3.50%, respectively. Class B shares, which convert to class A shares after approximately eight years, do not pay a front-end sales charge and are subject to a contingent deferred sales charge, if those shares are redeemed within six years of purchase. Class C shares have a one-year 1.00% contingent deferred sales charge and do not convert to class A shares. Class R shares, which are offered to qualified employee-benefit plans, are sold without a front-end sales charge or a contingent deferred sales charge. The expenses for class A, class B, class C, class M and class R shares may differ based on the distribution fee of each class, which is identified in Note 2. Class Y shares, which are sold at net asset value, are generally subject to the same expenses as class A, class B, class C, class M and class R shares, but do not bear a distribution fee. Class Y shares are generally only available to corporate and institutional clients and clients in other approved programs.
A 1.00% redemption fee may apply on any shares that are redeemed (either by selling or exchanging into another fund) within 7 days of purchase. The redemption fee is accounted for as an addition to paid-in-capital.
Investment income, realized and unrealized gains and losses and expenses of the fund are borne pro-rata based on the relative net assets of each class to the total net assets of the fund, except that each class bears expenses unique to that class (including the distribution fees applicable to such classes). Each class votes as a class only with respect to its own distribution plan or other matters on which a class vote is required by law or determined by the Trustees. If the fund were liquidated, shares of each class would receive their pro-rata share of the net assets of the fund. In addition, the Trustees declare separate dividends on each class of shares.
In the normal course of business, the fund enters into contracts that may include agreements to indemnify another party under given circumstances. The fund’s maximum exposure under these arrangements is unknown as this would involve future claims that may be, but have not yet been, made against the fund. However, the fund expects the risk of material loss to be remote.
The following is a summary of significant accounting policies consistently followed by the fund in the preparation of its financial statements. The preparation of financial statements is in conformity with accounting principles generally accepted in the United States of America and requires management to make estimates and assumptions that affect the reported amounts of assets and liabilities in the financial statements and the reported amounts of increases and decreases in net assets from operations during the reporting period. Actual results could differ from those estimates.
A) Security valuation Investments for which market quotations are readily available are valued at the last reported sales price on their principal exchange, or official closing price for certain markets. If no sales are reported — as in the case of some securities traded over-the-counter — a security is valued at its last reported bid price. Market quotations are not considered to be readily available for certain debt obligations; such investments are valued on the basis of valuations furnished by an independent pricing service approved by the Trustees or dealers selected by Putnam Investment Management, LLC (“Putnam Management”), the fund’s manager, a wholly-owned subsidiary of Putnam, LLC. Such services or dealers determine valuations for normal institutional-size trading units of such securities using methods based on market transactions for comparable securities and various relationships, genera lly recognized by institutional traders, between securities. Many securities markets and exchanges outside the U.S. close prior to the close of the New York Stock Exchange and therefore the closing prices for securities in such markets or on such exchanges may not fully reflect events that occur after such close but before the close of the New York Stock Exchange. Accordingly, on certain days, the fund will fair value foreign equity securities taking into account multiple factors, including movements in the U.S. securities markets. The number of days on which fair value prices will be used will depend on market activity and it is possible that fair value prices will be used by the fund to a significant extent. At October 31, 2007, fair value pricing was used for certain foreign securities in the portfolio. Securities quoted in foreign currencies, if any, are translated into U.S. dollars at the current exchange rate. Certain investments, including certain restricted securities and derivatives, are also valued at fair value following procedures approved by the Trustees. Such valuations and procedures are reviewed periodically by the Trustees. The fair value of securities is generally determined as the amount that the fund could reasonably expect to realize from an orderly disposition of such securities over a reasonable period of time. By its nature, a fair value price is a good faith estimate of the value of a security at a given point in time and does not reflect an actual market price, which may be different by a material amount.
B) Joint trading account Pursuant to an exemptive order from the Securities and Exchange Commission (the “SEC”), the fund may transfer uninvested cash balances, including cash collateral received under security lending arrangements, into a joint trading account along with the cash of other registered investment companies and certain other accounts managed by Putnam Management. These balances may be invested in issues of high-grade, short-term investments having maturities of up to 397 days for collateral received under security lending arrangements and up to 90 days for other cash investments.
C) Repurchase agreements The fund, or any joint trading account, through its custodian, receives delivery of the underlying securities, the market value of which at the time of purchase is required to be in an amount at least equal to the resale price, including accrued interest. Collateral for certain tri-party repurchase agreements is held at the counterparty’s custodian in a segregated account for the benefit of the fund and the counterparty. Putnam Management is responsible for determining that the value of these underlying securities is at all times at least equal to the resale price, including accrued interest.
33
D) Security transactions and related investment income Security transactions are recorded on the trade date (the date the order to buy or sell is executed). Gains or losses on securities sold are determined on the identified cost basis.
Interest income is recorded on the accrual basis. Dividend income, net of applicable withholding taxes, is recognized on the ex-dividend date except that certain dividends from foreign securities, if any, are recognized as soon as the fund is informed of the ex-dividend date. Non-cash dividends, if any, are recorded at the fair market value of the securities received. Dividends representing a return of capital or capital gains, if any, are reflected as a reduction of cost and/or as a realized gain.
E) Foreign currency translation The accounting records of the fund are maintained in U.S. dollars. The market value of foreign securities, currency holdings, and other assets and liabilities is recorded in the books and records of the fund after translation to U.S. dollars based on the exchange rates on that day. The cost of each security is determined using historical exchange rates. Income and withholding taxes are translated at prevailing exchange rates when earned or incurred. The fund does not isolate that portion of realized or unrealized gains or losses resulting from changes in the foreign exchange rate on investments from fluctuations arising from changes in the market prices of the securities. Such gains and losses are included with the net realized and unrealized gain or loss on investments. Net realized gains and losses on foreign currency transactions represent net realized exchange gains or losses on closed fo rward currency contracts, disposition of foreign currencies, currency gains and losses realized between the trade and settlement dates on securities transactions and the difference between the amount of investment income and foreign withholding taxes recorded on the fund’s books and the U.S. dollar equivalent amounts actually received or paid. Net unrealized appreciation and depreciation of assets and liabilities in foreign currencies arise from changes in the value of open forward currency contracts and assets and liabilities other than investments at the period end, resulting from changes in the exchange rate. Investments in foreign securities involve certain risks, including those related to economic instability, unfavorable political developments, and currency fluctuations, not present with domestic investments.
F) Futures and options contracts The fund may use futures and options contracts to hedge against changes in the values of securities the fund owns or expects to purchase, or for other investment purposes. The fund may also write options on swaps or securities it owns or in which it may invest to increase its current returns.
The potential risk to the fund is that the change in value of futures and options contracts may not correspond to the change in value of the hedged instruments. In addition, losses may arise from changes in the value of the underlying instruments, if there is an illiquid secondary market for the contracts, or if the counterparty to the contract is unable to perform. Risks may exceed amounts recognized on the Statement of assets and liabilities. When the contract is closed, the fund records a realized gain or loss equal to the difference between the value of the contract at the time it was opened and the value at the time it was closed. Realized gains and losses on purchased options are included in realized gains and losses on investment securities. If a written call option is exercised, the premium originally received is recorded as an addition to sales proceeds. If a written put option is exercised, the premium originally received is recorded as a reduction to the cost of investments.
Futures contracts are valued at the quoted daily settlement prices established by the exchange on which they trade. The fund and the broker agree to exchange an amount of cash equal to the daily fluctuation in the value of the futures contract. Such receipts or payments are known as “variation margin.” Exchange traded options are valued at the last sale price or, if no sales are reported, the last bid price for purchased options and the last ask price for written options. Options traded over-the-counter are valued using prices supplied by dealers. Futures and written option contracts outstanding at period end, if any, are listed after the fund’s portfolio.
G) Interest rate swap contracts The fund may enter into interest rate swap contracts, which are arrangements between two parties to exchange cash flows based on a notional principal amount, to manage the fund’s exposure to interest rates. Interest rate swap contracts are marked-to-market daily based upon quotations from an independent pricing service or market makers and the change, if any, is recorded as unrealized gain or loss. Payments received or made are recorded as realized gains or losses. Certain interest rate swap contracts may include extended effective dates. Income related to these swap contracts is accrued based on the terms of the contract. The fund could be exposed to credit or market risk due to unfavorable changes in the fluctuation of interest rates or if the counterparty defaults on its obligation to perform. Risk of loss may exceed amounts recognized on the Statement of assets and liabilities. Inter est rate swap contracts outstanding at period end, if any, are listed after the fund’s portfolio.
H) Securities lending The fund may lend securities, through its agents, to qualified borrowers in order to earn additional income. The loans are collateralized by cash and/or securities in an amount at least equal to the market value of the securities loaned. The market value of securities loaned is determined daily and any additional required collateral is allocated to the fund on the next business day. The risk of borrower default will be borne by the fund’s agents; the fund will bear the risk of loss with respect to the investment of the cash collateral. Income from securities lending is included in investment income on the Statement of operations. At October 31, 2007, the value of securities loaned amounted to $48,128,972. The fund received cash collateral of $49,670,970, which is pooled with collateral of other Putnam funds into 54 issues of short-term investments.
I) Federal taxes It is the policy of the fund to distribute all of its taxable income within the prescribed time and otherwise comply with the provisions of the Internal Revenue Code of 1986, as amended, (the “Code”) applicable to regulated investment companies. It is also the intention of the fund to distribute an amount sufficient to avoid imposition of any excise tax under Section 4982 of the Code, as amended. Therefore, no provision has been made for federal taxes on income, capital gains or unrealized appreciation on securities held nor for excise tax on income and capital gains.
At October 31, 2007, the fund had a capital loss carryover of $9,371,773 available to the extent allowed by the Code to offset future net capital gain, if any. This capital loss carryover will expire on October 31, 2011.
J) Distributions to shareholders Distributions to shareholders from net investment income are recorded by the fund on the ex-dividend date. Distributions from capital gains, if any, are recorded on the ex-dividend date and paid at least annually. The amount and character of income and gains to be distributed are determined in accordance with income tax
34
regulations, which may differ from generally accepted accounting principles. These differences include temporary and/or permanent differences of losses on wash sale transactions. Reclassifications are made to the fund’s capital accounts to reflect income and gains available for distribution (or available capital loss carryovers) under income tax regulations. For the year ended October 31, 2007, the fund reclassified $22,937 to decrease undistributed net investment income, with a decrease to accumulated net realized loss of $22,937.
The tax basis components of distributable earnings and the federal tax cost as of October 31, 2007 were as follows:
| Unrealized appreciation | $228,720,152 |
| Unrealized depreciation | (3,672,892) |
| ————————————— | |
| Net unrealized appreciation | 225,047,260 |
| Undistributed ordinary income | 1,375,830 |
| Capital loss carryforward | (9,371,773) |
| Cost for federal income tax purposes | $489,367,808 |
Note 2: Management fee, administrative services and other transactions
Putnam Management is paid for management and investment advisory services quarterly based on the average net assets of the fund. Such fee is based on the following annual rates: 0.70% of the first $500 million of average net assets, 0.60% of the next $500 million, 0.55% of the next $500 million, 0.50% of the next $5 billion, 0.475% of the next $5 billion, 0.455% of the next $5 billion, 0.44% of the next $5 billion and 0.43% thereafter.
Putnam Management has agreed to waive fees and reimburse expenses of the fund through June 30, 2009, to the extent necessary to ensure that the fund’s expenses do not exceed the simple average of the expenses of all front-end load funds viewed by Lipper, Inc. as having the same investment classification or objective as the fund. The expense reimbursement is based on a comparison of the fund’s expenses with the average annualized operating expenses of the funds in its Lipper peer group for each calendar quarter during the fund’s last fiscal year, excluding 12b-1 fees and without giving effect to any expense offset and brokerage service arrangements that may reduce fund expenses. For the year ended October 31, 2007, Putnam Management did not waive any of its management fee from the fund.
Effective August 3, 2007, Marsh & McLennan Companies, Inc. sold its ownership interest in Putnam Management, its parent companies and affiliates to a wholly-owned subsidiary of Great-West Lifeco, Inc. The fund’s shareholders have approved a new management contract for the fund that became effective upon the sale.
Putnam Investments Limited (“PIL”), an affiliate of Putnam Management, is authorized by the Trustees to manage a separate portion of the assets of the fund as determined by Putnam Management from time to time. Putnam Management pays a quarterly sub-management fee to PIL for its services at an annual rate of 0.35% of the average net assets of the portion of the fund managed by PIL. A new sub-management contract between Putnam Management and PIL was approved effective upon the change of control of Putnam Management described in the previous paragraph.
For the year ended October 31, 2007, Putnam Management has assumed $381 of legal, shareholder servicing and communication, audit and Trustee fees incurred by the fund in connection with certain legal and regulatory matters (including those described in Note 6).
The fund reimburses Putnam Management an allocated amount for the compensation and related expenses of certain officers of the fund and their staff who provide administrative services to the fund. The aggregate amount of all such reimbursements is determined annually by the Trustees.
Custodial services for the fund’s assets were provided by Putnam Fiduciary Trust Company (“PFTC”), an affiliate of Putnam Management, and by State Street Bank and Trust Company (“State Street”). Custody fees are based on the fund’s asset level, the number of its security holdings, transaction volumes and with respect to PFTC, certain fees related to the transition of assets to State Street. Putnam Investor Services, a division of PFTC, provided investor servicing agent functions to the fund. Putnam Investor Services received fees for investor servicing, subject to certain limitations, based on the number of shareholder accounts in the fund and the level of defined contribution plan assets in the fund. During the year ended October 31, 2007, the fund incurred $1,275,355 for custody and investor servicing agent functions provided by PFTC.
Under the custodian contract between the fund and State Street, the custodian bank has a lien on the securities of the fund to the extent permitted by the fund’s investment restrictions to cover any advances made by the custodian bank for the settlement of securities purchased by the fund. At October 31, 2007, the payable to the custodian bank represents the amount due for cash advanced for the settlement of securities purchased.
The fund has entered into arrangements with PFTC and State Street whereby PFTC’s and State Street’s fees are reduced by credits allowed on cash balances. The fund also reduced expenses through brokerage service arrangements. For the year ended October 31, 2007, the fund’s expenses were reduced by $173,448 under these arrangements.
Each independent Trustee of the fund receives an annual Trustee fee, of which $378, as a quarterly retainer, has been allocated to the fund, and an additional fee for each Trustees meeting attended. Trustees receive additional fees for attendance at certain committee meetings and industry seminars and for certain compliance-related matters. Trustees also are reimbursed for expenses they incur relating to their services as Trustees.
The fund has adopted a Trustee Fee Deferral Plan (the “Deferral Plan”) which allows the Trustees to defer the receipt of all or a portion of Trustees fees payable on or after July 1, 1995. The deferred fees remain invested in certain Putnam funds until distribution in accordance with the Deferral Plan.
The fund has adopted an unfunded noncontributory defined benefit pension plan (the “Pension Plan”) covering all Trustees of the fund who have served as a Trustee for at least five years and were first elected prior to 2004. Benefits under the Pension Plan are equal to 50% of the Trustee’s average annual attendance and retainer fees for the three years ended December 31, 2005. The retirement benefit is payable during a Trustee’s lifetime, beginning the year following retirement, for the number of years of service through December 31, 2006. Pension expense for the fund is included in Trustee compensation and expenses in the Statement of operations. Accrued pension liability is included in Payable for Trustee compensation and expenses in the Statement of assets and liabilities. The Trustees have terminated the Pension Plan with respect to any Trustee first elected after 2003.
The fund has adopted distribution plans (the “Plans”) with respect to its class A, class B, class C, class M and class R shares pursuant to Rule 12b-1 under the Investment Company Act of 1940. The purpose of the Plans is
35
to compensate Putnam Retail Management, a wholly-owned subsidiary of Putnam, LLC and Putnam Retail Management GP, Inc., for services provided and expenses incurred in distributing shares of the fund. The Plans provide for payments by the fund to Putnam Retail Management at an annual rate of up to 0.35%, 1.00%, 1.00%, 1.00% and 1.00% of the average net assets attributable to class A, class B, class C, class M and class R shares, respectively. The Trustees have approved payment by the fund at an annual rate of 0.25%, 1.00%, 1.00%, 0.75% and 0.50% of the average net assets attributable to class A, class B, class C, class M and class R shares, respectively.
For the year ended October 31, 2007, Putnam Retail Management, acting as underwriter, received net commissions of $30,725 and $273 from the sale of class A and class M shares, respectively, and received $34,600 and $111 in contingent deferred sales charges from redemptions of class B and class C shares, respectively. A deferred sales charge of up to 1.00% and 0.65% is assessed on certain redemptions of class A and class M shares, respectively. For the year ended October 31, 2007, Putnam Retail Management, acting as underwriter, received $399 and no monies on class A and class M redemptions, respectively.
Note 3: Purchases and sales of securities
During the year ended October 31, 2007, cost of purchases and proceeds from sales of investment securities other than short-term investments aggregated $259,054,920 and $334,935,669, respectively. There were no purchases or sales of U.S. government securities.
Note 4: Capital shares
At October 31, 2007, there was an unlimited number of shares of beneficial interest authorized. Transactions in capital shares were as follows:
| CLASS A | Shares | Amount | |
| Year ended 10/31/07: | |||
| Shares sold | 5,982,143 | $ | 86,767,209 |
| Shares issued in connection with | |||
| reinvestment of distributions | 468,792 | 6,786,835 | |
| 6,450,935 | 93,554,044 | ||
| Shares repurchased | (10,377,765) | (150,341,671) | |
| Net decrease | (3,926,830) | $ | (56,787,627) |
| Year ended 10/31/06: | |||
| Shares sold | 6,435,004 | $ | 75,096,029 |
| Shares issued in connection with | |||
| reinvestment of distributions | 728,340 | 8,218,506 | |
| 7,163,344 | 83,314,535 | ||
| Shares repurchased | (9,792,650) | (111,340,044) | |
| Net decrease | (2,629,306) | $ | (28,025,509) |
| CLASS B | Shares | Amount | |
| Year ended 10/31/07: | |||
| Shares sold | 615,862 | $ | 8,869,457 |
| Shares issued in connection with | |||
| reinvestment of distributions | 20,027 | 286,760 | |
| 635,889 | 9,156,217 | ||
| Shares repurchased | (2,331,713) | (33,319,587) | |
| Net decrease | (1,695,824) | $ | (24,163,370) |
| Year ended 10/31/06: | |||
| Shares sold | 688,306 | $ | 7,928,100 |
| Shares issued in connection with | |||
| reinvestment of distributions | 56,110 | 619,276 | |
| 744,416 | 8,547,376 | ||
| Shares repurchased | (3,340,785) | (37,760,234) | |
| Net decrease | (2,596,369) | $ | (29,212,858) |
| CLASS C | Shares | Amount | |
| Year ended 10/31/07: | |||
| Shares sold | 125,984 | $ | 1,837,921 |
| Shares issued in connection with | |||
| reinvestment of distributions | 1,995 | 28,709 | |
| 127,979 | 1,866,630 | ||
| Shares | |||
| repurchased | (110,496) | (1,575,421) | |
| Net increase | 17,483 | $ | 291,209 |
| Year ended 10/31/06: | |||
| Shares sold | 112,369 | $ | 1,291,132 |
| Shares issued in connection with | |||
| reinvestment of distributions | 4,180 | 46,806 | |
| 116,549 | 1,337,938 | ||
| Shares | |||
| repurchased | (145,020) | (1,640,170) | |
| Net decrease | (28,471) | $ | (302,232) |
| CLASS M | Shares | Amount | |
| Year ended 10/31/07: | |||
| Shares sold | 36,167 | $ | 533,387 |
| Shares issued in connection with | |||
| reinvestment of distributions | 2,000 | 28,885 | |
| 38,167 | 562,272 | ||
| Shares repurchased | (63,992) | (919,175) | |
| Net decrease | (25,825) | $ | (356,903) |
| Year ended 10/31/06: | |||
| Shares sold | 33,093 | $ | 382,717 |
| Shares issued in connection with | |||
| reinvestment of distributions | 3,963 | 44,613 | |
| 37,056 | 427,330 | ||
| Shares repurchased | (126,728) | (1,423,730) | |
| Net decrease | (89,672) | $ | (996,400) |
36
| CLASS R | Shares | Amount | |
| Year ended 10/31/07: | |||
| Shares sold | 26,667 | $ | 386,848 |
| Shares issued in connection with | |||
| reinvestment of distributions | 364 | 5,314 | |
| 27,031 | 392,162 | ||
| Shares repurchased | (7,933) | (108,592) | |
| Net increase | 19,098 | $ | 283,570 |
| Year ended 10/31/06: | |||
| Shares sold | 14,725 | $ | 166,050 |
| Shares issued in connection with | |||
| reinvestment of distributions | 410 | 4,627 | |
| 15,135 | 170,677 | ||
| Shares repurchased | (11,202) | (123,074) | |
| Net increase | 3,933 | $ | 47,603 |
| CLASS Y | Shares | Amount | |
| Year ended 10/31/07: | |||
| Shares sold | 163,689 | $ | 2,388,069 |
| Shares issued in connection with | |||
| reinvestment of distributions | 5,055 | 73,469 | |
| 168,744 | 2,461,538 | ||
| Shares repurchased | (119,723) | (1,736,636) | |
| Net increase | 49,021 | $ | 724,902 |
| Year ended 10/31/06: | |||
| Shares sold | 83,552 | $ | 970,628 |
| Shares issued in connection with | |||
| reinvestment of distributions | 6,181 | 69,762 | |
| 89,733 | 1,040,390 | ||
| Shares repurchased | (143,820) | (1,603,284) | |
| Net decrease | (54,087) | $ | (562,894) |
Note 5: Investment in Putnam Prime Money Market Fund
The fund invests in Putnam Prime Money Market Fund, an open-end management investment company managed by Putnam Management. Investments in Putnam Prime Money Market Fund are valued at its closing net asset value each business day. Management fees paid by the fund are reduced by an amount equal to the management fees paid by Putnam Prime Money Market Fund with respect to assets invested by the fund in Putnam Prime Money Market Fund. For the year ended October 31, 2007, management fees paid were reduced by $8,524 relating to the fund’s investment in Putnam Prime Money Market Fund. Income distributions earned by the fund are recorded as income in the Statement of operations and totaled $527,490 for the year ended October 31, 2007. During the year ended October 31, 2007, cost of purchases and proceeds of sales of investments in Putnam Prime Money Market Fund aggregated $304,069,878 and $301,920,732, respectively.
Note 6: Regulatory matters and litigation
In late 2003 and 2004, Putnam Management settled charges brought by the SEC and the Massachusetts Securities Division in connection with excessive short-term trading in Putnam funds. Payments from Putnam Management will be distributed to certain open-end Putnam funds and their shareholders. These allegations and related matters have served as the general basis for certain lawsuits, including purported class action lawsuits against Putnam Management and, in a limited number of cases, some Putnam funds. Putnam Management believes that these lawsuits will have no material adverse effect on the funds or on Putnam Management’s ability to provide investment management services. In addition, Putnam Management has agreed to bear any costs incurred by the Putnam funds as a result of these matters.
Putnam Management and Putnam Retail Management are named as defendants in a civil suit in which the plaintiffs allege that the management and distribution fees paid by certain Putnam funds were excessive and seek recovery under the Investment Company Act of 1940. Putnam Management and Putnam Retail Management have contested the plaintiffs’ claims and the matter is currently pending in the U.S. District Court for the District of Massachusetts. Based on currently available information, Putnam Management believes that this action is without merit and that it is unlikely to have a material effect on Putnam Management’s and Putnam Retail Management’s ability to provide services to their clients, including the fund.
Note 7: New accounting pronouncements
In June 2006, the Financial Accounting Standards Board (“FASB”) issued Interpretation No. 48, Accounting for Uncertainty in Income Taxes (the “Interpretation”). The Interpretation prescribes a minimum threshold for financial statement recognition of the benefit of a tax position taken or expected to be taken by a filer in the filer’s tax return. The Interpretation is not expected to have a material effect on the fund’s financial statements. However, the conclusions regarding the Interpretation may be subject to review and adjustment at a later date based on factors including, but not limited to, further implementation guidance expected from the FASB, and on-going analysis of tax laws, regulations and interpretations thereof.
In September 2006, the FASB issued Statement of Financial Accounting Standards No. 157, Fair Value Measurements (the “Standard”). The Standard defines fair value, sets out a framework for measuring fair value and requires additional disclosures about fair value measurements. The Standard applies to fair value measurements already required or permitted by existing standards. The Standard is effective for financial statements issued for fiscal years beginning after November 15, 2007 and interim periods within those fiscal years. Putnam Management is currently evaluating what impact the adoption of the Standard will have on the fund’s financial statements.
37
Federal tax information and brokerage
commissions (unaudited)
Federal tax information
The fund designated 100.00% of ordinary income distributions as qualifying for the dividends received deduction for corporations.
For its tax year ended October 31, 2007, the fund hereby designates 100.00%, or the maximum amount allowable, of its taxable ordinary income distributions as qualified dividends taxed at the individual net capital gain rates.
The Form 1099 you receive in January 2008 will show the tax status of all distributions paid to your account in calendar 2007.
Brokerage commissions
Brokerage commissions are paid to firms that execute trades on behalf of your fund. When choosing these firms, Putnam is required by law to seek the best execution of the trades, taking all relevant factors into consideration, including expected quality of execution and commission rate. Listed below are the largest relationships based upon brokerage commissions for your fund and the other funds in Putnam’s Research group for the year ended October 31, 2007. The other Putnam mutual funds in this group are Putnam Global Natural Resources Fund, Putnam Health Sciences Trust, Putnam Research Fund, Putnam VT Health Sciences Fund, Putnam VT Research Fund, and Putnam VT Utilities Growth and Income Fund.
The top five firms that received brokerage commissions for trades executed for the Research group are (in descending order) UBS Warburg, Merrill Lynch Credit Suisse First Boston, Goldman Sachs, and Citigroup Global Markets. Commissions paid to these firms together represented approximately 50% of the total brokerage commissions paid for the year ended October 31, 2007.
Commissions paid to the next 10 firms together represented approximately 33% of the total brokerage commissions paid during the period. These firms are (in alphabetical order) Bear Stearns & Company, Deutsche Bank Securities, JPMorgan Clearing, Lehman Brothers, Morgan Stanley Dean Witter, Raymond James, RBC Capital Markets, SG Cowen Securities, Thomas Weisel Partners, and Wachovia Securities.
Commission amounts do not include “mark-ups” paid on bond or derivative trades made directly with a dealer. Additional information about brokerage commissions is available on the Securities and Exchange Commission (SEC) Web site at www.sec.gov. Putnam funds disclose commissions by firm to the SEC in semiannual filings on Form N-SAR.
Shareholder meeting
results (unaudited)
May 15, 2007 meeting
A proposal to approve a new management contract between the fund and Putnam Investment Management, LLC was approved as follows:
| Votes for | Votes against | Abstentions |
| 25,306,267 | 1,154,647 | 1,374,745 |
All tabulations are rounded to the nearest whole number.
39
About the Trustees
| Jameson A. Baxter | (Born 1943), Trustee since 1994, |
| Vice Chairman since 2005 |
Ms. Baxter is the President of Baxter Associates, Inc., a private investment firm.
Ms. Baxter serves as a Director of ASHTA Chemicals, Inc., Ryerson, Inc. (a metals service corporation), the Mutual Fund Directors Forum, and Advocate Health Care. She is Chairman Emeritus of the Board of Trustees, Mount Holyoke College, having served as Chairman for five years. Until 2007, she was a Director of Banta Corporation (a printing and supply chain management company). Until 2004, she was a Director of BoardSource (formerly the National Center for Nonprofit Boards), and until 2002, she was a Director of Intermatic Corporation (a manufacturer of energy control products).
Ms. Baxter has held various positions in investment banking and corporate finance, including Vice President and Principal of the Regency Group, and Vice President of and Consultant to First Boston Corporation. She is a graduate of Mount Holyoke College.
Charles B. Curtis (Born 1940), Trustee since 2001
Mr. Curtis is President and Chief Operating Officer of the Nuclear Threat Initiative (a private foundation dealing with national security issues) and serves as Senior Advisor to the United Nations Foundation.
Mr. Curtis is a member of the Council on Foreign Relations and serves as a Director of Edison International and Southern California Edison. Until 2006, Mr. Curtis served as a member of the Trustee Advisory Council of the Applied Physics Laboratory, Johns Hopkins University. Until 2003, Mr. Curtis was a member of the Electric Power Research Institute Advisory Council and the University of Chicago Board of Governors for Argonne National Laboratory. Prior to 2002, Mr. Curtis was a Member of the Board of Directors of the Gas Technology Institute and the Board of Directors of the Environment and Natural Resources Program Steering Committee, John F. Kennedy School of Government, Harvard University. Until 2001, Mr. Curtis was a member of the Department of Defense Policy Board and Director of EG&G Technical Services, Inc. (a fossil energy research and development support company).
From August 1997 to December 1999, Mr. Curtis was a Partner at Hogan & Hartson L.L.P., a Washington, D.C. law firm. Prior to May 1997, Mr. Curtis was Deputy Secretary of Energy and Under Secretary of the U.S. Department of Energy. He served as Chairman of the Federal Energy Regulatory Commission from 1977 to 1981 and has held positions on the staff of the U.S. House of Representatives, the U.S. Treasury Department, and the SEC.
Robert J. Darretta (Born 1946), Trustee since 2007
Mr. Darretta serves as Director of UnitedHealth Group, a diversified health-care conglomerate.
Until April 2007, Mr. Darretta was Vice Chairman of the Board of Directors of Johnson & Johnson, a diversified health-care conglomerate. Prior to 2007, Mr. Darretta held several accounting and finance positions with Johnson & Johnson, including Chief Financial Officer, Executive Vice President, and Treasurer.
Mr. Darretta received a B.S. in Economics from Villanova University.
Myra R. Drucker (Born 1948), Trustee since 2004
Ms. Drucker is Chair of the Board of Trustees of Commonfund (a not-for-profit firm specializing in asset management for educational endowments and foundations), Vice Chair of the Board of Trustees of Sarah Lawrence College, and a member of the Investment Committee of the Kresge Foundation (a charitable trust). She is also a director of New York Stock Exchange LLC, a wholly-owned subsidiary of the publicly-traded NYSE Group, Inc., a director of Interactive Data Corporation (a provider of financial market data, analytics, and related services to financial institutions and individual investors), and an advisor to RCM Capital Management (an investment management firm).
Ms. Drucker is an ex-officio member of the New York Stock Exchange (NYSE) Pension Managers Advisory Committee, having served as Chair for seven years.
Until August 31, 2004, Ms. Drucker was Managing Director and a member of the Board of Directors of General Motors Asset Management and Chief Investment Officer of General Motors Trust Bank. Ms. Drucker also served as a member of the NYSE Corporate Accountability and Listing Standards Committee and the NYSE/NASD IPO Advisory Committee.
Prior to joining General Motors Asset Management in 2001, Ms. Drucker held various executive positions in the investment management industry. Ms. Drucker served as Chief Investment Officer of Xerox Corporation (a technology and service company in the document industry), where she was responsible for the investment of the company’s pension assets. Ms. Drucker was also Staff Vice President and Director of Trust Investments for International Paper (a paper products, paper distribution, packaging and forest products company) and previously served as Manager of Trust Investments for Xerox Corporation. Ms. Drucker received a B.A. degree in Literature and Psychology from Sarah Lawrence College and pursued graduate studies in economics, statistics and portfolio theory at Temple University.
40
| John A. Hill | (Born 1942), Trustee since 1985 |
| and Chairman since 2000 |
Mr. Hill is Vice Chairman of First Reserve Corporation, a private equity buyout firm that specializes in energy investments in the diversified worldwide energy industry.
Mr. Hill is a Director of Devon Energy Corporation and various private companies controlled by First Reserve Corporation, as well as Chairman of TH Lee, Putnam Investment Trust (a closed-end investment company advised by an affiliate of Putnam Management). He is also a Trustee of Sarah Lawrence College. Until 2005, he was a Director of Continuum Health Partners of New York.
Prior to acquiring First Reserve Corporation in 1983, Mr. Hill held executive positions in investment banking and investment management with several firms and with the federal government, including Deputy Associate Director of the Office of Management and Budget and Deputy Director of the Federal Energy Administration. He is active in various business associations, including the Economic Club of New York, and lectures on energy issues in the United States and Europe. Mr. Hill holds a B.A. degree in Economics from Southern Methodist University and pursued graduate studies there as a Woodrow Wilson Fellow.
Paul L. Joskow (Born 1947), Trustee since 1997
Dr. Joskow is the Elizabeth and James Killian Professor of Economics and Management, and Director of the Center for Energy and Environmental Policy Research at the Massachusetts Institute of Technology.
Dr. Joskow serves as a Director of TransCanada Corporation (an energy company focused on natural gas transmission and power services) and Exelon Corporation (an energy company focused on power services), and as a Member of the Board of Overseers of the Boston Symphony Orchestra. Prior to August 2007, he served as a Director of National Grid (a UK-based holding company with interests in electric and gas transmission and distribution and telecommunications infrastructure). Prior to July 2006, he served as President of the Yale University Council and continues to serve as a Member of the Council. Prior to February 2005, he served on the board of the Whitehead Institute for Biomedical Research (a non-profit research institution). Prior to February 2002, he was a Director of State Farm Indemnity Company (an automobile insurance company), and prior to March 2000, he was a Director of New England Electric System (a public utility holding company).
Dr. Joskow has published six books and numerous articles on topics in industrial organization, government regulation of industry, and competition policy. He is active in industry restructuring, environmental, energy, competition and privatization policies —serving as an advisor to governments and corporations worldwide. Dr. Joskow holds a Ph.D. and M. Phil from Yale University and a B.A. from Cornell University.
Elizabeth T. Kennan (Born 1938), Trustee since 1992
Dr. Kennan is a Partner of Cambus-Kenneth Farm (thoroughbred horse and cattle breeding). She is President Emeritus of Mount Holyoke College.
Dr. Kennan served as Chairman and is now Lead Director of Northeast Utilities. She is a Trustee of the National Trust for Historic Preservation, of Centre College and of Midway College in Midway, Kentucky. Until 2006, she was a member of The Trustees of Reservations. Prior to 2001, Dr. Kennan served on the oversight committee of the Folger Shakespeare Library. Prior to June 2005, she was a Director of Talbots, Inc., and she has served as Director on a number of other boards, including Bell Atlantic, Chastain Real Estate, Shawmut Bank, Berkshire Life Insurance, and Kentucky Home Life Insurance. Dr. Kennan has also served as President of Five Colleges Incorporated and as a Trustee of Notre Dame University, and is active in various educational and civic associations.
As a member of the faculty of Catholic University for twelve years, until 1978, Dr. Kennan directed the post-doctoral program in Patristic and Medieval Studies, taught history and published numerous articles. Dr. Kennan holds a Ph.D. from the University of Washington in Seattle, an M.S. from St. Hilda’s College at Oxford University and an A.B. from Mount Holyoke College. She holds several honorary doctorates.
Kenneth R. Leibler (Born 1949), Trustee since 2006
Mr. Leibler is a founding partner and former Chairman of the Boston Options Exchange, an electronic marketplace for the trading of listed derivative securities.
Mr. Leibler currently serves as a Trustee of Beth Israel Deaconess Hospital in Boston. He is also lead director of Ruder Finn Group, a global communications and advertising firm, and a director of Northeast Utilities, which operates New England’s largest energy delivery system. Prior to December 2006, he served as a director of the Optimum Funds group. Prior to October 2006, he served as a director of ISO New England, the organization responsible for the operation of the electric generation system in the New England states. Prior to 2000, Mr. Leibler was a director of the Investment Company Institute in Washington, D.C.
41
Prior to January 2005, Mr. Leibler served as Chairman and Chief Executive Officer of the Boston Stock Exchange. Prior to January 2000, he served as President and Chief Executive Officer of Liberty Financial Companies, a publicly traded diversified asset management organization. Prior to June 1990, he served as President and Chief Operating Officer of the American Stock Exchange (AMEX), and at the time was the youngest person in AMEX history to hold the title of President. Prior to serving as AMEX President, he held the position of Chief Financial Officer and headed its management and marketing operations. Mr. Leibler graduated magna cum laude with a degree in economics from Syracuse University, where he was elected Phi Beta Kappa.
Robert E. Patterson (Born 1945), Trustee since 1984
Mr. Patterson is Senior Partner of Cabot Properties, L.P. and Chairman of Cabot Properties, Inc. (a private equity firm investing in commercial real estate).
Mr. Patterson serves as Chairman Emeritus and Trustee of the Joslin Diabetes Center. Prior to June 2003, he was a Trustee of Sea Education Association. Prior to December 2001, he was President and Trustee of Cabot Industrial Trust (a publicly traded real estate investment trust). Prior to February 1998, he was Executive Vice President and Director of Acquisitions of Cabot Partners Limited Partnership (a registered investment adviser involved in institutional real estate investments). Prior to 1990, he served as Executive Vice President of Cabot, Cabot & Forbes Realty Advisors, Inc. (the predecessor company of Cabot Partners).
Mr. Patterson practiced law and held various positions in state government and was the founding Executive Director of the Massachusetts Industrial Finance Agency. Mr. Patterson is a graduate of Harvard College and Harvard Law School.
George Putnam, III (Born 1951), Trustee since 1984
Mr. Putnam is Chairman of New Generation Research, Inc. (a publisher of financial advisory and other research services), and President of New Generation Advisers, Inc. (a registered investment advisor to private funds). Mr. Putnam founded the New Generation companies in 1986.
Mr. Putnam is a Director of The Boston Family Office, LLC (a registered investment adviser). He is a Trustee of St. Mark’s School. Until 2006, he was a Trustee of Shore Country Day School, and until 2002 was a Trustee of the Sea Education Association.
Mr. Putnam previously worked as an attorney with the law firm of Dechert LLP (formerly known as Dechert Price & Rhoads) in Philadelphia. He is a graduate of Harvard College, Harvard Business School and Harvard Law School.
W. Thomas Stephens (Born 1942), Trustee since 1997
Mr. Stephens is Chairman and Chief Executive Officer of Boise Cascade, L.L.C. (a paper, forest products and timberland assets company).
Mr. Stephens is a Director of TransCanadaPipelines, Ltd. (an energy infrastructure company). Until 2004, Mr. Stephens was a Director of Xcel Energy Incorporated (a public utility company), Qwest Communications, and Norske Canada, Inc. (a paper manufacturer). Until 2003, Mr. Stephens was a Director of Mail-Well, Inc. (a diversified printing company). He served as Chairman of Mail-Well until 2001 and as CEO of MacMillan-Bloedel, Ltd. (a forest products company) until 1999.
Prior to 1996, Mr. Stephens was Chairman and Chief Executive Officer of Johns Manville Corporation. He holds B.S. and M.S. degrees from the University of Arkansas.
Richard B. Worley (Born 1945), Trustee since 2004
Mr. Worley is Managing Partner of Permit Capital LLC, an investment management firm.
Mr. Worley serves as a Trustee of the University of Pennsylvania Medical Center, The Robert Wood Johnson Foundation (a philanthropic organization devoted to health care issues), and the National Constitution Center. He is also a Director of The Colonial Williamsburg Foundation (a historical preservation organization) and the Philadelphia Orchestra Association. Mr. Worley also serves on the investment committees of Mount Holyoke College and World Wildlife Fund (a wildlife conservation organization).
Prior to joining Permit Capital LLC in 2002, Mr. Worley served as Chief Strategic Officer of Morgan Stanley Investment Management. He previously served as President, Chief Executive Officer and Chief Investment Officer of Morgan Stanley Dean Witter Investment Management and as a Managing Director of Morgan Stanley, a financial services firm. Mr. Worley also was the Chairman of Miller Anderson & Sherrerd, an investment management firm.
Mr. Worley holds a B.S. degree from the University of Tennessee and pursued graduate studies in economics at the University of Texas.
42
| Charles E. Haldeman, Jr.* | (Born 1948), Trustee since 2004 |
| and President of the Funds since 2007 |
Mr. Haldeman is President and Chief Executive Officer of Putnam, LLC (“Putnam Investments”) and President of the Putnam Funds. He is a member of Putnam Investments’ Executive Board of Directors and Advisory Council. Prior to November 2003, Mr. Haldeman served as Co-Head of Putnam Investments’ Investment Division.
Prior to joining Putnam Investments in 2002, Mr. Haldeman held executive positions in the investment management industry. He previously served as Chief Executive Officer of Delaware Investments and President and Chief Operating Officer of United Asset Management. Mr. Haldeman was also a partner and director of Cooke & Bieler, Inc. (an investment management firm).
Mr. Haldeman currently serves on the Board of Governors of the Investment Company Institute and as Chair of the Board of Trustees of Dartmouth College. He also serves on the Partners HealthCare Investment Committee, the Tuck School of Business and Dartmouth College Board of Overseers, and the Harvard Business School Board of Dean’s Advisors. He is a graduate of Dartmouth College, Harvard Law School and Harvard Business School. Mr. Haldeman is also a Chartered Financial Analyst (CFA) charterholder.
The address of each Trustee is One Post Office Square, Boston, MA 02109.
As of October 31, 2007, there were 103 Putnam funds. All Trustees serve as Trustees of all Putnam funds.
Each Trustee serves for an indefinite term, until his or her resignation, retirement at age 72, death, or removal.
* Trustee who is an “interested person” (as defined in the Investment Company Act of 1940) of the fund, Putnam Management, and/or Putnam Retail Management. Mr. Haldeman is the President of your fund and each of the other Putnam funds, and is President and Chief Executive Officer of Putnam Investments.
43
Officers
In addition to Charles E. Haldeman, Jr., the other officers of the fund are shown below:
| Charles E. Porter (Born 1938) | Richard S. Robie, III (Born 1960) |
| Executive Vice President, Principal Executive Officer, Associate | Vice President |
| Treasurer, and Compliance Liaison | Since 2004 |
| Since 1989 | |
| Senior Managing Director, Putnam Investments, Putnam Management | |
| Jonathan S. Horwitz (Born 1955) | and Putnam Retail Management. Prior to 2003, Senior Vice President, |
| Senior Vice President and Treasurer | United Asset Management Corporation |
| Since 2004 | |
| Francis J. McNamara, III (Born 1955) | |
| Prior to 2004, Managing Director, | Vice President and Chief Legal Officer |
| Putnam Investments | Since 2004 |
| Steven D. Krichmar (Born 1958) | Senior Managing Director, Putnam Investments, Putnam Management |
| Vice President and Principal Financial Officer | and Putnam Retail Management. Prior to 2004, General Counsel, |
| Since 2002 | State Street Research & Management Company |
| Senior Managing Director, Putnam Investments | Robert R. Leveille (Born 1969) |
| Vice President and Chief Compliance Officer | |
| Janet C. Smith (Born 1965) | Since 2007 |
| Vice President, Principal Accounting Officer and Assistant Treasurer | |
| Since 2007 | Managing Director, Putnam Investments, Putnam Management, |
| and Putnam Retail Management. Prior to 2004, member of Bell | |
| Managing Director, Putnam Investments and Putnam Management | Boyd & Lloyd LLC. Prior to 2003, Vice President and Senior Counsel, |
| Liberty Funds Group LLC | |
| Susan G. Malloy (Born 1957) | |
| Vice President and Assistant Treasurer | Mark C. Trenchard (Born 1962) |
| Since 2007 | Vice President and BSA Compliance Officer |
| Since 2002 | |
| Managing Director, Putnam Investments | |
| Managing Director, Putnam Investments | |
| Beth S. Mazor (Born 1958) | |
| Vice President | Judith Cohen (Born 1945) |
| Since 2002 | Vice President, Clerk and Assistant Treasurer |
| Since 1993 | |
| Managing Director, Putnam Investments | |
| Wanda M. McManus (Born 1947) | |
| James P. Pappas (Born 1953) | Vice President, Senior Associate Treasurer and Assistant Clerk |
| Vice President | Since 2005 |
| Since 2004 | |
| Nancy E. Florek (Born 1957) | |
| Managing Director, Putnam Investments and Putnam Management. | Vice President, Assistant Clerk, Assistant Treasurer |
| During 2002, Chief Operating Officer, Atalanta/Sosnoff | and Proxy Manager |
| Management Corporation | Since 2005 |
The address of each Officer is One Post Office Square, Boston, MA 02109.
44
Fund information
Founded 70 years ago, Putnam Investments was built around the concept that a balance between risk and reward is the hallmark of a well-rounded financial program. We manage over 100 mutual funds in growth, value, blend, fixed income, and international.
| Investment Manager | Officers | Mark C. Trenchard |
| Putnam Investment | Charles E. Haldeman, Jr. | Vice President and BSA Compliance Officer |
| Management, LLC | President | |
| One Post Office Square | Judith Cohen | |
| Boston, MA 02109 | Charles E. Porter | Vice President, Clerk and Assistant Treasurer |
| Executive Vice President, Principal | ||
| Marketing Services | Executive Officer, Associate Treasurer | Wanda M. McManus |
| Putnam Retail Management | and Compliance Liaison | Vice President, Senior Associate Treasurer |
| One Post Office Square | and Assistant Clerk | |
| Boston, MA 02109 | Jonathan S. Horwitz | |
| Senior Vice President and Treasurer | Nancy E. Florek | |
| Custodian | Vice President, Assistant Clerk, Assistant | |
| State Street Bank and Trust Company | Steven D. Krichmar | Treasurer and Proxy Manager |
| Vice President and Principal Financial Officer | ||
| Legal Counsel | ||
| Ropes & Gray LLP | Janet C. Smith | |
| Vice President, Principal Accounting Officer | ||
| Independent Registered Public | and Assistant Treasurer | |
| Accounting Firm | ||
| PricewaterhouseCoopers LLP | Susan G. Malloy | |
| Vice President and Assistant Treasurer | ||
| Trustees | ||
| John A. Hill, Chairman | Beth S. Mazor | |
| Jameson Adkins Baxter, Vice Chairman | Vice President | |
| Charles B. Curtis | ||
| Robert J. Darretta | James P. Pappas | |
| Myra R. Drucker | Vice President | |
| Charles E. Haldeman, Jr. | ||
| Paul L. Joskow | Richard S. Robie, III | |
| Elizabeth T. Kennan | Vice President | |
| Kenneth R. Leibler | ||
| Robert E. Patterson | Francis J. McNamara, III | |
| George Putnam, III | Vice President and Chief Legal Officer | |
| W. Thomas Stephens | ||
| Richard B. Worley | Robert R. Leveille | |
| Vice President and Chief Compliance Officer |
This report is for the information of shareholders of Putnam Utilities Growth and Income Fund. It may also be used as sales literature when preceded or accompanied by the current prospectus, the most recent copy of Putnam’s Quarterly Performance Summary, and Putnam’s Quarterly Ranking Summary. For more recent performance, please visit www.putnam.com. Investors should carefully consider the investment objective, risks, charges, and expenses of a fund, which are described in its prospectus. For this and other information or to request a prospectus, call 1-800-225-1581 toll free. Please read the prospectus carefully before investing. The fund’s Statement of Additional Information contains additional information about the fund’s Trustees and is available without charge upon request by calling 1-800-225-1581.

Item 2. Code of Ethics:
(a) The fund’s principal executive, financial and accounting officers are employees of Putnam Investment Management, LLC, the Fund's investment manager. As such they are subject to a comprehensive Code of Ethics adopted and administered by Putnam Investments which is designed to protect the interests of the firm and its clients. The Fund has adopted a Code of Ethics which incorporates the Code of Ethics of Putnam Investments with respect to all of its officers and Trustees who are employees of Putnam Investment Management, LLC. For this reason, the Fund has not adopted a separate code of ethics governing its principal executive, financial and accounting officers.
(c) In August 2007, the Code of Ethics of Putnam Investment Management, LLC was amended to reflect the change in ownership of Putnam Investments Trust, the parent company of Putnam Investment Management, LLC, from Marsh & McLennan Companies, Inc. (“MMC”) to Great-West Lifeco Inc., a subsidiary of Power Financial Corporation. In addition to administrative and non-substantive changes, the Code of Ethics was amended to remove a prohibition, which applied to members of Putnam Investments’ Executive Board and senior members of the staff of the Chief Financial Officer of Putnam Investments, on transactions in MMC securities during the period between the end of a calendar quarter and the public announcement of MMC’s earnings for that quarter.
Item 3. Audit Committee Financial Expert:
The Funds' Audit and Compliance Committee is comprised solely of Trustees who are "independent" (as such term has been defined by the Securities and Exchange Commission ("SEC") in regulations implementing Section 407 of the Sarbanes-Oxley Act (the "Regulations")). The Trustees believe that each of the members of the Audit and Compliance Committee also possess a combination of knowledge and experience with respect to financial accounting matters, as well as other attributes, that qualify them for service on the Committee. In addition, the Trustees have determined that each of Mr. Patterson, Mr. Stephens, Mr. Leibler, Mr. Hill and Mr. Darretta meets the financial literacy requirements of the New York Stock Exchange's rules and qualifies as an "audit committee financial expert" (as such term has been defined by the Regulations) based on their review of his pertinent experience and education. Certain other Trustees, although not on the Audit and Compliance Committee, would also qualify as "audit committee financial experts." The SEC has stated that the designation or identification of a person as an audit committee financial expert pursuant to this Item 3 of Form N-CSR does not impose on such person any duties, obligations or liability that are greater than the duties, obligations and liability imposed on such person as a member of the Audit and Compliance Committee and the Board of Trustees in the absence of such designation or identification.
Item 4. Principal Accountant Fees and Services:
The following table presents fees billed in each of the last two fiscal years for services rendered to the fund by the fund’s independent auditor:
| Fiscal | Audit- | |||
| year | Audit | Related | Tax | All Other |
| ended | Fees | Fees | Fees | Fees |
| October 31, 2007 | $72,341 | $64 | $11,470 | $218* |
| October 31, 2006 | $64,628* | $139 | $12,765 | $ 469* |
* Includes fees of $159 and $834 ($472 in Audit Fees and $362 in All Other Fees) billed by the fund’s independent auditor to the fund for procedures necessitated by regulatory and litigation matters for the fiscal years ended October 31, 2007 and October 31, 2006, respectively. These
fees were reimbursed to the fund by Putnam Investment Management, LLC (“Putnam Management”).
For the fiscal years ended October 31, 2007and October 31, 2006, the fund’s independent auditor billed aggregate non-audit fees in the amounts of $116,959 and $237,086 respectively, to the fund, Putnam Management and any entity controlling, controlled by or under common control with Putnam Management that provides ongoing services to the fund.
Audit Fees represent fees billed for the fund’s last two fiscal years.
Audit-Related Fees represent fees billed in the fund’s last two fiscal years for services traditionally performed by the fund’s auditor, including accounting consultation for proposed transactions or concerning financial accounting and reporting standards and other audit or attest services not required by statute or regulation.
Tax Fees represent fees billed in the fund’s last two fiscal years for tax compliance, tax planning and tax advice services. Tax planning and tax advice services include assistance with tax audits, employee benefit plans and requests for rulings or technical advice from taxing authorities.
All Other Fees represent fees billed for services relating to an analysis of recordkeeping fees and to the valuation of derivative securities.
Pre-Approval Policies of the Audit and Compliance Committee. The Audit and Compliance Committee of the Putnam funds has determined that, as a matter of policy, all work performed for the funds by the funds’ independent auditors will be pre-approved by the Committee itself and thus will generally not be subject to pre-approval procedures.
The Audit and Compliance Committee also has adopted a policy to pre-approve the engagement by Putnam Management and certain of its affiliates of the funds’ independent auditors, even in circumstances where pre-approval is not required by applicable law. Any such requests by Putnam Management or certain of its affiliates are typically submitted in writing to the Committee and explain, among other things, the nature of the proposed engagement, the estimated fees, and why this work should be performed by that particular audit firm as opposed to another one. In reviewing such requests, the Committee considers, among other things, whether the provision of such services by the audit firm are compatible with the independence of the audit firm.
The following table presents fees billed by the fund’s independent auditor for services required to be approved pursuant to paragraph (c)(7)(ii) of Rule 2-01 of Regulation S-X.
| Fiscal | Audit- | All | Total | |
| year | Related | Tax | Other | Non-Audit |
| ended | Fees | Fees | Fees | Fees |
| October 31, | ||||
| 2007 | $ - | $ 28,129 | $ - | $ - |
| October 31, | ||||
| 2006 | $ - | $ 95,192 | $ - | $ - |
Item 5. Audit Committee of Listed Registrants
Not applicable
Item 6. Schedule of Investments:
The registrant’s schedule of investments in unaffiliated issuers is included in the report to shareholders in Item 1 above.
Item 7. Disclosure of Proxy Voting Policies and Procedures For Closed-End Management Investment Companies:
Not applicable
Item 8. Portfolio Managers of Closed-End Investment Companies
Not Applicable
Item 9. Purchases of Equity Securities by Closed-End Management Investment Companies and Affiliated Purchasers:
Not applicable
Item 10. Submission of Matters to a Vote of Security Holders:
Not applicable
Item 11. Controls and Procedures:
(a) The registrant's principal executive officer and principal financial officer have concluded, based on their evaluation of the effectiveness of the design and operation of the registrant's disclosure controls and procedures as of a date within 90 days of the filing date of this report, that the design and operation of such procedures are generally effective to provide reasonable assurance that information required to be disclosed by the registrant in this report is recorded, processed, summarized and reported within the time periods specified in the Commission's rules and forms.
(b) Changes in internal control over financial reporting: During the period, Putnam Fiduciary Trust Company, the fund's transfer agent, began utilizing shareholder systems and systems support provided by DST Systems, Inc. and certain of its affiliates.
Item 12. Exhibits:
(a)(1) The Code of Ethics of The Putnam Funds, which incorporates the Code of Ethics of Putnam Investments, is filed herewith.
(a)(2) Separate certifications for the principal executive officer and principal financial officer of the registrant as required by Rule 30a-2(a) under the Investment Company Act of 1940, as amended, are filed herewith.
(b) The certifications required by Rule 30a-2(b) under the Investment Company Act of 1940, as amended, are filed herewith.
SIGNATURES
Pursuant to the requirements of the Securities Exchange Act of 1934 and the Investment Company Act of 1940, the registrant has duly caused this report to be signed on its behalf by the undersigned, thereunto duly authorized.
Putnam Utilities Growth and Income Fund
By (Signature and Title):
/s/Janet C. Smith
Janet C. Smith
Principal Accounting Officer
Date: December 28, 2007
Pursuant to the requirements of the Securities Exchange Act of 1934 and the Investment Company Act of 1940, this report has been signed below by the following persons on behalf of the registrant and in the capacities and on the dates indicated.
By (Signature and Title):
/s/Charles E. Porter
Charles E. Porter
Principal Executive Officer
Date: December 28, 2007
By (Signature and Title):
/s/Steven D. Krichmar
Steven D. Krichmar
Principal Financial Officer
Date: December 28, 2007