| UNITED STATES | |||
| SECURITIES AND EXCHANGE COMMISSION | |||
| Washington, D.C. 20549 | |||
| FORM N-CSR | |||
| CERTIFIED SHAREHOLDER REPORT OF REGISTERED | |||
| MANAGEMENT INVESTMENT COMPANIES | |||
| Investment Company Act file number: (811-05989) | |||
| Exact name of registrant as specified in charter: | Putnam Global Utilities Fund | ||
| Address of principal executive offices: One Post Office Square, Boston, Massachusetts 02109 | |||
| Name and address of agent for service: | Beth S. Mazor, Vice President | ||
| One Post Office Square | |||
| Boston, Massachusetts 02109 | |||
| Copy to: | John W. Gerstmayr, Esq. | ||
| Ropes & Gray LLP | |||
| One International Place | |||
| Boston, Massachusetts 02110 | |||
| Registrant’s telephone number, including area code: | (617) 292-1000 | ||
| Date of fiscal year end: August 31, 2009 | |||
| Date of reporting period: November 1, 2008 — August 31, 2009 | |||
Item 1. Report to Stockholders:
The following is a copy of the report transmitted to stockholders pursuant to Rule 30e-1 under the Investment Company Act of 1940:

A BALANCED APPROACH
Since 1937, when George Putnam created a diverse mix of stocks and bonds in a single, professionally managed portfolio, Putnam has championed the balanced approach.
A WORLD OF INVESTING
Today, we offer investors a world of equity, fixed-income, multi-asset, and absolute-return portfolios to suit a range of financial goals.
A COMMITMENT TO EXCELLENCE
Our portfolio managers seek superior results over time, backed by original, fundamental research on a global scale. We believe in the value of experienced financial advice, in providing exemplary service, and in putting clients first in all we do.

Putnam
Global Utilities
Fund
Annual report
8 | 31 | 09
| Message from the Trustees | 1 |
| About the fund | 2 |
| Performance and portfolio snapshots | 4 |
| Interview with your fund’s Portfolio Manager | 5 |
| Your fund’s performance | 9 |
| Your fund’s expenses | 10 |
| Terms and definitions | 12 |
| Trustee approval of management contract | 13 |
| Other information for shareholders | 20 |
| Financial statements | 22 |
| Federal tax information | 35 |
| About the Trustees | 36 |
| Officers | 40 |
Message from the Trustees
Dear Fellow Shareholder:
Securities markets in the United States and around the world have exhibited historic resiliency in recent months. Stock market indexes and some types of bonds have risen sharply from the lows hit earlier this year. These returns — among the most dramatic rebounds in a generation — have naturally drawn investors back into the markets and away from safe-haven U.S. Treasuries.
We welcome these bullish trends and the potential for investors to recoup losses from 2008’s dramatic downturn. However, we note that the economic recovery is a work in progress. The markets could very well pause in the coming months before returning to full health.
We are pleased to report that many Putnam mutual funds have delivered improved results over the past year, reflecting the substantial efforts of an investment team infused with new talent and a singular focus. Leading that team is industry veteran Walter C. Donovan, who joined Putnam in April of this year and oversees an investment organization strengthened by the arrival of several senior portfolio managers, seasoned research analysts, and traders.
Beyond our primary goal of seeking superior investment results for you, Putnam and the Board of Trustees continue to seek other ways to promote the interests of shareholders in the Putnam funds. This fall, you will be asked to vote on several such measures, including one proposal that could lower the management fees you pay (see page 20 for details). By now, you should have received a proxy mailing from Putnam. Be sure to act promptly by voting online, by phone, or by returning your signed proxy card.
In another development, after several years of steady leadership, Charles E. “Ed” Haldeman, Jr. has stepped down as President of the Putnam Funds and as a member of the Board of Trustees of the Funds. Effective July 2009, Robert L. Reynolds, President and Chief Executive Officer of Putnam Investments and a Trustee of the Putnam Funds, replaced Mr. Haldeman as President of the Putnam Funds.
We would like to take this opportunity to welcome new shareholders to the fund and to thank all our investors for your continued confidence in Putnam.

About the fund
A diversified approach to utilities investing
Many stock funds offer the potential for growth but produce little or no income for investors. Putnam Global Utilities Fund pursues both capital growth and current income through investments in the utilities sector. The fund targets industries that can profit from the global demand for utilities. It can invest in bonds as well as stocks, in both domestic and international markets, and across several industries with varying degrees of regulation.
At the start of 2009, the fund’s name was changed from Putnam Utilities Growth and Income Fund to Putnam Global Utilities Fund, and it is now one of nine Global Sector Funds that invest in markets around the world. Prior to the change, the fund had significant exposure to telecommunications companies. Now the fund focuses entirely on utilities and their related industries.
Although the fund’s portfolio can include businesses of all sizes and at different stages of growth, established corporations are the norm in the utilities sector. Utilities have a history of consistent dividend payouts to investors. Their securities are valued as an alternative to bonds, especially during periods of low interest rates, when investors look outside the bond market for income.
The fund’s strategy, particularly during periods of uncertainty, is to maintain a solid foundation of securities in stable-demand industries, such as electric power and natural gas. Guided by this approach, the fund’s manager is committed to finding rewarding opportunities for income and growth by anticipating developments that affect the utilities sector worldwide. The manager conducts intensive research with support from analysts on Putnam’s Global Equity Research team.
Consider these risks before investing: International investing involves certain risks, such as currency fluctuations, economic instability, and political developments. Additional risks may be associated with emerging-market securities, including illiquidity and volatility. The fund may invest a portion of its assets in small and/or midsize companies. Such investments increase the risk of greater price fluctuations. The fund invests in fewer issuers or concentrates its investments by region or sector, and involves more risk than a fund that invests more broadly.
Putnam Global Sector Funds
In recent decades, innovation, evolution, and business growth have propelled stocks in different industries to market-leading performance. Companies based outside the United States have played an increasingly important role in satisfying global demand and driving worldwide economic growth. Putnam Global Sector Funds help investors gain exposure to these dynamic companies by targeting industries on a global basis.
These actively managed funds reflect the best of Putnam’s global research capabilities, with holdings selected by analysts who have hands-on experience in the sectors they cover. Investing with flexibility and precision, the funds’ portfolio managers combine fundamental research with a proprietary stock-ranking process. They work with teams of analysts to determine where each sector is headed and to pinpoint opportunities. This suite of nine funds is backed by Putnam’s nearly 30 years of sector investing experience.
Global Consumer Fund
Retail, hotels, restaurants, media, food and beverages
Global Energy Fund
Oil and gas, energy equipment and services
Global Financials Fund
Commercial banks, insurance, diversified financial services, mortgage finance
Global Health Care Fund
Pharmaceuticals, biotechnology, health-care services
Global Industrials Fund
Airlines, railroads, trucking, aerospace and defense, construction, commercial services
Global Natural Resources Fund
Metals, chemicals, oil and gas, forest products
Global Technology Fund
Software, computers, Internet services
Global Telecommunications Fund
Diversified and wireless telecommunications services
Global Utilities Fund
Electric and gas utilities, telephone companies, water utilities
Developments and events that have affected the utilities sector
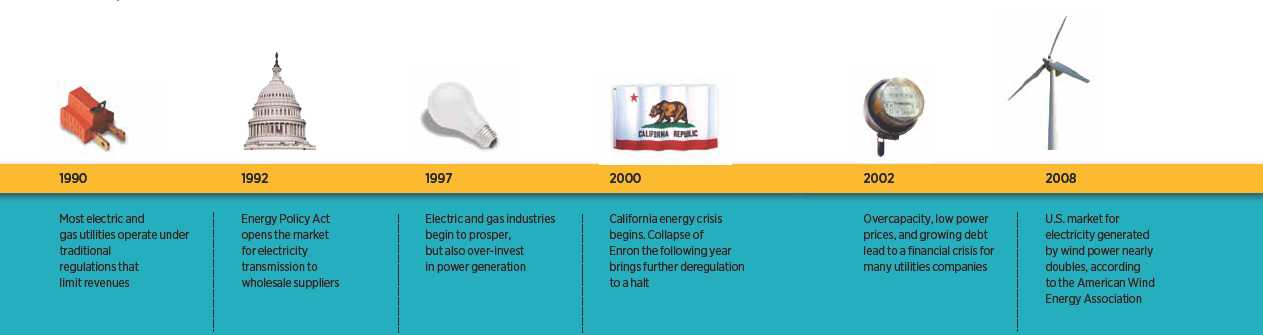
| 2 | 3 |
Performance and portfolio snapshots
Average annual total return (%) comparison as of 8/31/09
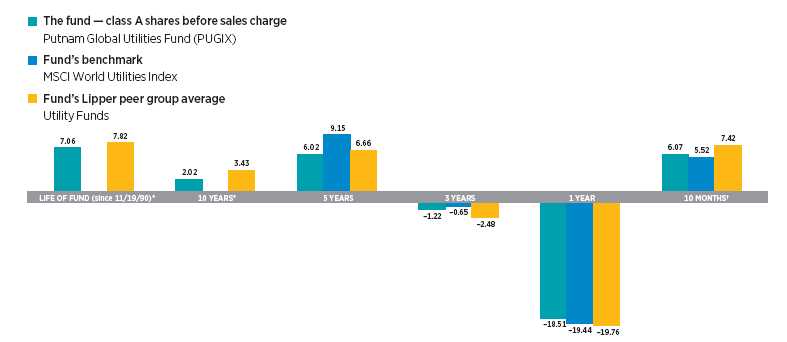
Current performance may be lower or higher than the quoted past performance, which cannot guarantee future results. Share price, principal value, and return will fluctuate, and you may have a gain or a loss when you sell your shares. Performance of class A shares assumes reinvestment of distributions and does not account for taxes. Fund returns in the bar chart do not reflect a sales charge of 5.75%; had they, returns would have been lower. See pages 5 and 9–10 for additional performance information. For a portion of the periods, this fund may have limited expenses, without which returns would have been lower. Due to market volatility, current performance may be higher or lower than performance shown. A 1% short-term trading fee may apply. To obtain the most recent month-end performance, visit putnam.com.
Putnam Management has recently undertaken a review of the fund’s benchmark. The MSCI World Utilities Index replaces the S&P Utilities Index as the primary benchmark for this fund because, in Putnam Management’s opinion, the securities tracked by this index more accurately reflect the types of securities generally held by the fund.
* The fund’s benchmark, the MSCI World Utilities Index, was introduced on 1/1/01, which post-dates the inception date of the fund’s class A shares.
† Returns for the ten-month period are not annualized, but cumulative.
"I do expect the Obama administration to
eventually tackle the issue of carbon emissions."
Michael Yogg, Portfolio Manager, Putnam Global Utilities Fund
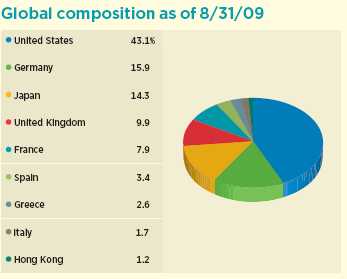
Country allocations are shown as a percentage of the fund’s portfolio value. Data excludes exposure to some countries achieved through various derivative instruments. Weightings will vary over time.
4
Interview with your
fund’s Portfolio Manager
Michael Yogg
To align Putnam Global Utilities Fund with the other Putnam global sector funds, the fund’s fiscal year now ends on August 31 instead of October 31. With that in mind, let’s talk about performance through August 31, 2009.
The fund experienced a loss of 18.51%, which was disappointing, since we devote great effort to pursuing the fund’s objectives of both capital growth and current income. The fund performed slightly better than its benchmark, the MSCI World Utilities Index, which declined 19.44% and its Lipper peers, which declined an average of 19.76%.
How would you characterize the environment for global utilities during the period?
It was unprecedented and unpredictable. During the global economic meltdown last fall and the evaporation of available credit in the wake of the Lehman Brothers collapse, utilities held up fairly well compared to the overall market. Because they typically pay out a dividend and deliver consistent business performance, utilities stocks have a reputation for safety and stability even during challenging markets.
This outperformance of utilities held up in most countries through mid-February; then the sector, in the United States, got some bad news: Great Plains Energy and Ameren, both Midwest electric utilities, announced they were slashing their dividends. The fund did not hold Ameren during the period, but continues to hold Great Plains Energy. These dividend reductions had the immediate effect of damaging the halo of safety and security that surrounds utilities stocks. Investors lost confidence in the entire U.S. utility group, because the dividend cuts raised the specter that other utility companies might follow suit. In February and early March, U.S. utilities stocks actually fell further than the S&P 500 Index. Performance began to improve after the market hit a low for the period on March 9, 2009, but since that time, as stocks o verall have had strong returns, utility stocks have underperformed.
How did you position the fund?
Because of weak power and natural gas prices, we are stepping back a bit from stocks that are heavily exposed to these markets. The fund still favors certain power generators, either because we believe their nuclear units give them a long-term competitive advantage, or because of valuation, or for both of these reasons. For the most part, however, in this uncertain environment, we are overweight those companies that can
Broad market index and fund performance
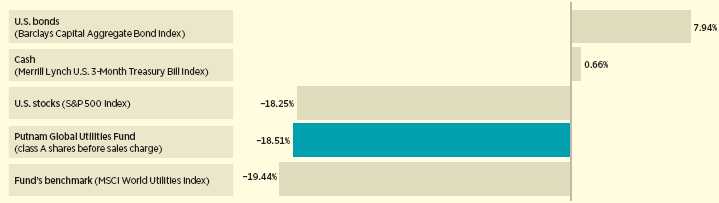
This comparison shows your fund’s performance in the context of broad market indexes for the 12 months ended 8/31/09. See the previous page and pages 9–10 for additional fund performance information. Index descriptions can be found on page 12.
5
earn a regulated return on equity investment, and therefore should be relatively insulated from the economy or power market conditions. They too can suffer sales and earnings shortfalls over the short term, but the regulatory process should serve as a backstop to their financial performance. From a geographic standpoint, our positioning is close to the benchmark, with a slight overweight given to U.S. companies, but this is a result of our research on individual companies, not part of a top-down strategic bet.
IN THE NEWS
The recession is likely over, according to Federal Reserve Chairman Ben Bernanke. In a September speech marking the one-year anniversary of the Lehman Brothers collapse, Bernanke cited growth in the manufacturing sector, stabilizing home prices, and improving retail sales data as signs that the U.S. economy had entered a recovery. The Fed chief cautioned, however, that the rebound is likely to be gradual and that new job creation may not improve as quickly as many hope. In fact, the Bureau of Labor Statistics reported the national unemployment rate reached a 26-year high of 9.7% in August, as more than 7.4 million jobs have been lost since the recession began in late 2007. Despite the economy’s uncertain footing, U.S. consumer spending and confidence both inched higher in recent reports — an encouraging sign from a sector that accounts for 70% of gross domestic product (GDP).
How did overseas utilities stocks, such as those in Europe and Asia, perform?
European utilities were also hit hard by the global financial crisis, mainly due to a number of large capital projects that were midway when the crisis hit — that is, too far along to be reined in. With rising capital costs and falling oil, gas, and power prices, companies’ balance sheets and cash flows suddenly appeared vulnerable, and stock prices tumbled. These stock prices began to recover in March when commodities prices bottomed and financial conditions eased. In Europe, operating and stock price performance is positively correlated to oil and gas prices. Asian utilities held up relatively well during the first months of the crisis but have lagged more recently, as investors have focused on more cyclical sectors, particularly in Japan.
What holdings had an impact on the fund’s performance?
The AES Corporation, a global company that both generates and distributes power, was a top contributor for the period. The company’s shares depreciated significantly when the entire market went down in early 2009. AES has a huge presence in emerging-market countries, and several subsidiaries in the emerging markets were struggling under a lot of debt.
Top 10 holdings
| HOLDING (percentage of fund’s net assets) | COUNTRY | INDUSTRY |
| E.ON AG (10.5%) | Germany | Electric utilities |
| Gaz de France SA (5.7%) | France | Natural gas utilities |
| RWE AG (5.3%) | Germany | Electric utilities |
| Tokyo Electric Power Co. (5.0%) | Japan | Electric utilities |
| Centrica PLC (4.9%) | United Kingdom | Natural gas utilities |
| PG&E Corp. (4.6%) | United States | Electric utilities |
| Tokyo Gas Co., Ltd. (4.2%) | Japan | Natural gas utilities |
| Exelon Corp. (3.9%) | United States | Electric utilities |
| Iberdrola SA (3.4%) | Spain | Electric utilities |
| Entergy Corp. (3.3%) | United States | Electric utilities |
This table shows the fund’s top 10 holdings and the percentage of the fund’s net assets that each represented as of 8/31/09. Short-term holdings are excluded. Holdings will vary over time.
6
We felt that AES stock was trading at far below its true value, and the fund added shares near the bottom of the company’s stock price.
Two utilities, CMS Energy, an electric and natural gas utility that serves customers in Michigan, and NV Energy, which provides electricity to customers throughout Nevada, helped performance. During the past several years, both of these utilities had been severely hurt by unfavorable regulatory climates that worked against the interests of shareholders. The regulatory environment grew so difficult for NV Energy that it was near bankruptcy in 2003. As portfolio manager, I was able to detect early in the period an improving regulatory climate, and the fund made money in both stocks as a result.
Another contributor, Public Power Corporation, which the fund was overweight, is the major public electric utility in Greece. Public Power was hurt in 2008 by higher purchased power and oil costs. When the prices of purchased power and oil were high, the company had to buy power from other electricity producers, then had to sell it. Because the regulated price was fixed too low, as purchased power and oil prices soared, the company’s profit margins were squeezed. Now that the prices of purchased power and oil are down substantially relative to 2008’s high, Public Power’s profits have improved, and the stock has appreciated.
Top detractors included the fund’s greater-than-benchmark holdings in Exelon Corporation and FirstEnergy Corporation. These power-generation companies had been hurt by low power prices. Exelon, the nation’s largest electric and gas utility, provides electric power in metropolitan Chicago and Philadelphia. FirstEnergy is an electricity utility with customers in Ohio, Pennsylvania, and New Jersey. Another detractor, Williams, an out-of-benchmark holding that gathers, processes, and transports natural gas via pipelines in the United States, was hurt by weak natural gas prices. The fund no longer owns Williams shares.
EDF shares underperformed as the company struggled under a challenging regulatory environment. The utility wants higher rates to maintain its financial integrity, while politicians want to keep rates low for the voters, and the stock suffered as a result.
What’s your outlook for the utilities market?
I am cautiously optimistic. However, there is a possibility that the Bush administration’s tax cut on dividends will expire in 2010, as scheduled in the law’s “sunset” provisions. If this occurs, taxes could increase, making dividend-paying utility stocks less attractive.
For now, the issue of reducing carbon emissions has been placed on the back burner, with the economic stimulus and now the health-care debate occupying much of Washington’s attention so far in 2009. However, I do expect the Obama administration to eventually tackle the issue of carbon emissions. This is why I favor nuclear and other clean-energy technologies in the portfolio. In addition, I still believe that the valuation of utilities stocks as a group has been held back unduly by concerns over further dividend rate cuts. I believe
Comparison of top industry weightings
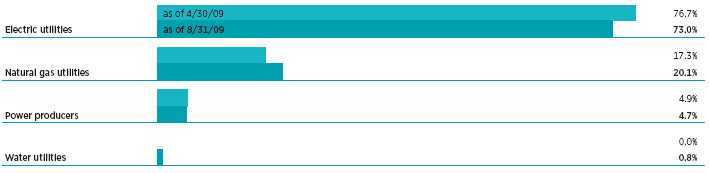
This chart shows how the fund’s top weightings have changed over the past four months. The fund changed its fiscal year-end from October 31 to August 31. Weightings are shown as a percentage of net assets. Holdings will vary over time.
7
that investors should not be overly concerned about further cuts. The utilities sector, in my opinion, is undervalued at this time and its fundamentals are sound.
Thank you, Michael, for your time and insights today.
The views expressed in this report are exclusively those of Putnam Management. They are not meant as investment advice.
Please note that the holdings discussed in this report may not have been held by the fund for the entire period. Portfolio composition is subject to review in accordance with the fund’s investment strategy and may vary in the future. Current and future portfolio holdings are subject to risk.

Portfolio Manager Michael Yogg is an Analyst and Sector Team Leader of Utilities at Putnam. He has a Ph.D. and an M.A. from Harvard University, and a B.A. from Yale University. A CFA charterholder, he joined Putnam in 1997 and has been in the investment industry since 1978.
8
Your fund’s performance
This section shows your fund’s performance, price, and distribution information for the fiscal period ended August 31, 2009. In accordance with regulatory requirements for mutual funds, we also include performance as of the most recent calendar quarter-end and expense information taken from the fund’s current prospectus. Performance should always be considered in light of a fund’s investment strategy. Data represents past performance. Past performance does not guarantee future results. More recent returns may be less or more than those shown. Investment return and principal value will fluctuate, and you may have a gain or a loss when you sell your shares. Performance information does not reflect any deduction for taxes a shareholder may owe on fund distributions or on the redemption of fund shares. For the most recent month-end performance, please visit the Individual Investors section at putnam.com or call Putnam at 1-800-225-1581. Class Y shares are generally only available to corporate and institutional clients and clients in other approved programs. See the Terms and Definitions section in this report for definitions of the share classes offered by your fund.
Fund performance Total return for periods ended 8/31/09
| Class A | Class B | Class C | Class M | Class R | Class Y | |||||
| (inception dates) | (11/19/90) | (4/27/92) | (7/26/99) | (3/1/95) | (12/1/03) | (10/4/05) | ||||
| NAV | POP | NAV | CDSC | NAV | CDSC | NAV | POP | NAV | NAV | |
| Annual average (life of fund) | 7.06% | 6.73% | 6.26% | 6.26% | 6.26% | 6.26% | 6.54% | 6.33% | 6.80% | 7.12% |
| 10 years | 22.16 | 15.15 | 13.31 | 13.31 | 13.28 | 13.28 | 16.16 | 12.09 | 19.16 | 23.32 |
| Annual average | 2.02 | 1.42 | 1.26 | 1.26 | 1.25 | 1.25 | 1.51 | 1.15 | 1.77 | 2.12 |
| 5 years | 33.92 | 26.19 | 29.03 | 27.03 | 28.87 | 28.87 | 30.65 | 26.08 | 32.24 | 35.19 |
| Annual average | 6.02 | 4.76 | 5.23 | 4.90 | 5.20 | 5.20 | 5.49 | 4.74 | 5.75 | 6.22 |
| 3 years | –3.62 | –9.13 | –5.79 | –8.51 | –5.80 | –5.80 | –5.09 | –8.40 | –4.32 | –2.96 |
| Annual average | –1.22 | –3.14 | –1.97 | –2.92 | –1.97 | –1.97 | –1.73 | –2.88 | –1.46 | –1.00 |
| 1 year | –18.51 | –23.18 | –19.08 | –23.03 | –19.15 | –19.94 | –18.90 | –21.76 | –18.68 | –18.30 |
| 10 months* | 6.07 | –0.02 | 5.44 | 0.44 | 5.39 | 4.39 | 5.66 | 1.94 | 5.89 | 6.27 |
Current performance may be lower or higher than the quoted past performance, which cannot guarantee future results. After-sales-charge returns (public offering price, or POP) for class A and M shares reflect a maximum 5.75% and 3.50% load, respectively. Class B share returns reflect the applicable contingent deferred sales charge (CDSC), which is 5% in the first year, declining to 1% in the sixth year, and is eliminated thereafter. Class C shares reflect a 1% CDSC for the first year that is eliminated thereafter. Class R and Y shares have no initial sales charge or CDSC. Performance for class B, C, M, R, and Y shares before their inception is derived from the historical performance of class A shares, adjusted for the applicable sales charge (or CDSC) and, except for class Y shares, the higher operating expenses for such shares.
For a portion of the periods, this fund may have limited expenses, without which returns would have been lower.
Due to market volatility, current performance may be higher or lower than performance shown. A 1% short-term trading fee may be applied to shares exchanged or sold within 90 days of purchase.
* Reflects the fund’s previous fiscal year end of October 31. The fund changed its fiscal year end from October 31 to August 31.
Change in the value of a $10,000 investment ($9,425 after sales charge) Cumulative total return from 8/31/99 to 8/31/09
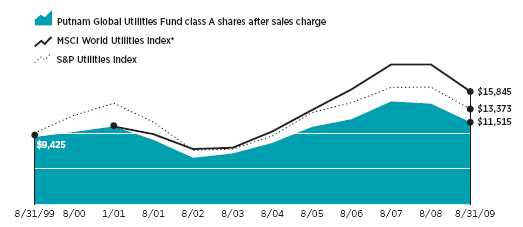
Past performance does not indicate future results. At the end of the same time period, a $10,000 investment in the fund’s class B and class C shares would have been valued at $11,331 and $11,328, respectively, and no contingent deferred sales charges would apply. A $10,000 investment in the fund’s class M shares ($9,650 after sales charge) would have been valued at $11,209 at public offering price. A $10,000 investment in the fund’s class R and class Y shares would have been valued at $11,916 and $12,332, respectively.
* The fund’s benchmark, the MSCI World Utilities Index, was introduced on 1/1/01, which post-dates the inception date of the fund’s class A shares.
9
Comparative index returns For periods ended 8/31/09
| Lipper Utility Funds | |||
| MSCI World Utilities Index* | S&P Utilities Index | category average† | |
| Annual average (life of fund) | — | 7.16% | 7.82% |
| 10 years | — | 33.73 | 43.22 |
| Annual average | — | 2.95 | 3.43 |
| 5 years | 54.95% | 39.55 | 38.53 |
| Annual average | 9.15 | 6.89 | 6.66 |
| 3 years | –1.94 | –6.35 | –7.01 |
| Annual average | –0.65 | –2.16 | –2.48 |
| 1 year | –19.44 | –18.79 | –19.76 |
| 10 months‡ | 5.52 | 3.81 | 7.42 |
Index and Lipper results should be compared to fund performance at net asset value.
Putnam Management has recently undertaken a review of the fund’s benchmark. The MSCI World Utilities Index replaces the S&P Utilities Index as the primary benchmark for this fund because, in Putnam Management’s opinion, the securities tracked by this index more accurately reflect the types of securities generally held by the fund.
* The fund’s benchmark, the MSCI World Utilities Index, was introduced on 1/1/01, which post-dates the inception date of the fund’s class A shares.
† Over the 10-month, 1-year, 3-year, 5-year, 10-year, and life-of-fund periods ended 8/31/09, there were 99, 98, 84, 69, 45, and 3 funds, respectively, in this Lipper category.
‡ Reflects the fund’s previous fiscal year end of October 31. The fund changed its fiscal year end from October 31 to August 31.
Fund price and distribution information For the 10-month period ended 8/31/09
| Distributions | Class A | Class B | Class C | Class M | Class R | Class Y | ||
| Number | 3 | 3 | 3 | 3 | 3 | 3 | ||
| Income | $0.270 | $0.208 | $0.212 | $0.231 | $0.252 | $0.289 | ||
| Capital gains | — | — | — | — | — | — | ||
| Total | $0.270 | $0.208 | $0.212 | $0.231 | $0.252 | $0.289 | ||
| Share value | NAV | POP | NAV | NAV | NAV | POP | NAV | NAV |
| 10/31/08* | $10.69 | $11.34 | $10.64 | $10.62 | $10.67 | $11.06 | $10.66 | $10.69 |
| 8/31/09 | 11.04 | 11.71 | 10.99 | 10.96 | 11.02 | 11.42 | 11.01 | 11.04 |
The classification of distributions, if any, is an estimate. Final distribution information will appear on your year-end tax forms.
* Previous fiscal year-end date for the fund.
Fund performance as of most recent calendar quarter Total return for periods ended 9/30/09
| Class A | Class B | Class C | Class M | Class R | Class Y | |||||
| (inception dates) | (11/19/90) | (4/27/92) | (7/26/99) | (3/1/95) | (12/1/03) | (10/4/05) | ||||
| NAV | POP | NAV | CDSC | NAV | CDSC | NAV | POP | NAV | NAV | |
| Annual average (life of fund) | 7.13% | 6.79% | 6.33% | 6.33% | 6.33% | 6.33% | 6.60% | 6.40% | 6.86% | 7.19% |
| 10 years | 25.22 | 18.01 | 16.04 | 16.04 | 16.22 | 16.22 | 19.03 | 14.88 | 22.16 | 26.49 |
| Annual average | 2.27 | 1.67 | 1.50 | 1.50 | 1.51 | 1.51 | 1.76 | 1.40 | 2.02 | 2.38 |
| 5 years | 34.49 | 26.78 | 29.41 | 27.41 | 29.53 | 29.53 | 31.03 | 26.50 | 32.71 | 35.84 |
| Annual average | 6.11 | 4.86 | 5.29 | 4.96 | 5.31 | 5.31 | 5.55 | 4.81 | 5.82 | 6.32 |
| 3 years | –2.16 | –7.77 | –4.43 | –7.18 | –4.33 | –4.33 | –3.64 | –7.01 | –2.95 | –1.41 |
| Annual average | –0.73 | –2.66 | –1.50 | –2.45 | –1.46 | –1.46 | –1.23 | –2.39 | –0.99 | –0.47 |
| 1 year | –5.16 | –10.60 | –5.87 | –10.46 | –5.81 | –6.73 | –5.63 | –8.93 | –5.39 | –4.84 |
Your fund’s expenses
As a mutual fund investor, you pay ongoing expenses, such as management fees, distribution fees (12b-1 fees), and other expenses. In the most recent six-month period, your fund limited these expenses; had it not done so, expenses would have been higher. Using the following information, you can estimate how these expenses affect your investment and compare them with the expenses of other funds. You may also pay one-time transaction expenses, including sales charges (loads) and redemption fees, which are not shown in this section and would have resulted in higher total expenses. For more information, see your fund’s prospectus or talk to your financial representative.
10
| Expense ratios | ||||||
| Class A | Class B | Class C | Class M | Class R | Class Y | |
| Net expenses for the fiscal year ended 10/31/08* | 1.36% | 2.11% | 2.11% | 1.86% | 1.61% | 1.11% |
| Total annual operating expenses for the fiscal year | ||||||
| ended 10/31/08 | 1.42% | 2.17% | 2.17% | 1.92% | 1.67% | 1.17% |
| Annualized expense ratio for the six-month period | ||||||
| ended 8/31/09† | 1.39% | 2.14% | 2.14% | 1.89% | 1.64% | 1.14% |
* Reflects Putnam Management’s decision to contractually limit expenses through 7/31/10.
† For the fund’s most recent fiscal half year; may differ from expense ratios based on data in the financial highlights.
Fiscal year expense information in this table is taken from the most recent prospectus, is subject to change, and may differ from that shown for the annualized expense ratio and in the financial highlights of this report. Expenses are shown as a percentage of average net assets.
Expenses, per $1,000
The following table shows the expenses you would have paid on a $1,000 investment in Putnam Global Utilities Fund from March 1, 2009, to August 31, 2009. It also shows how much a $1,000 investment would be worth at the close of the period, assuming actual returns and expenses.
| Class A | Class B | Class C | Class M | Class R | Class Y | |
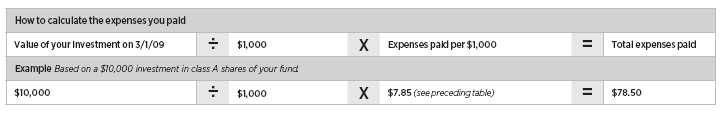
| Expenses paid per $1,000* | $7.85 | $12.06 | $12.05 | $10.66 | $9.26 | $6.44 |
| Ending value (after expenses) | $1,240.30 | $1,236.40 | $1,234.90 | $1,237.70 | $1,239.60 | $1,241.90 |
* Expenses for each share class are calculated using the fund’s annualized expense ratio for each class, which represents the ongoing expenses as a percentage of average net assets for the six months ended 8/31/09. The expense ratio may differ for each share class. Expenses are calculated by multiplying the expense ratio by the average account value for the period; then multiplying the result by the number of days in the period; and then dividing that result by the number of days in the year.
Estimate the expenses you paid
To estimate the ongoing expenses you paid for the six months ended August 31, 2009, use the following calculation method. To find the value of your investment on March 1, 2009, call Putnam at 1-800-225-1581.
Compare expenses using the SEC’s method
The Securities and Exchange Commission (SEC) has established guidelines to help investors assess fund expenses. Per these guidelines, the following table shows your fund’s expenses based on a $1,000 investment, assuming a hypothetical 5% annualized return. You can use this information to compare the ongoing expenses (but not transaction expenses or total costs) of investing in the fund with those of other funds. All mutual fund shareholder reports will provide this information to help you make this comparison. Please note that you cannot use this information to estimate your actual ending account balance and expenses paid during the period.
| Class A | Class B | Class C | Class M | Class R | Class Y | |
| Expenses paid per $1,000* | $7.07 | $10.87 | $10.87 | $9.60 | $8.34�� | $5.80 |
| Ending value (after expenses) | $1,018.20 | $1,014.42 | $1,014.42 | $1,015.68 | $1,016.94 | $1,019.46 |
* Expenses for each share class are calculated using the fund’s annualized expense ratio for each class, which represents the ongoing expenses as a percentage of average net assets for the six months ended 8/31/09. The expense ratio may differ for each share class. Expenses are calculated by multiplying the expense ratio by the average account value for the period; then multiplying the result by the number of days in the period; and then dividing that result by the number of days in the year.
11
Terms and definitions
Important terms
Total return shows how the value of the fund’s shares changed over time, assuming you held the shares through the entire period and reinvested all distributions in the fund.
Net asset value (NAV) is the price, or value, of one share of a mutual fund, without a sales charge. NAVs fluctuate with market conditions. NAV is calculated by dividing the net assets of each class of shares by the number of outstanding shares in the class.
Public offering price (POP) is the price of a mutual fund share plus the maximum sales charge levied at the time of purchase. POP performance figures shown here assume the 5.75% maximum sales charge for class A shares and 3.50% for class M shares.
Contingent deferred sales charge (CDSC) is generally a charge applied at the time of the redemption of class B or C shares and assumes redemption at the end of the period. Your fund’s class B CDSC declines from a 5% maximum during the first year to 1% during the sixth year. After the sixth year, the CDSC no longer applies. The CDSC for class C shares is 1% for one year after purchase.
Share classes
Class A shares are generally subject to an initial sales charge and no CDSC (except on certain redemptions of shares bought without an initial sales charge).
Class B shares are not subject to an initial sales charge. They may be subject to a CDSC.
Class C shares are not subject to an initial sales charge and are subject to a CDSC only if the shares are redeemed during the first year.
Class M shares have a lower initial sales charge and a higher 12b-1 fee than class A shares and no CDSC (except on certain redemptions of shares bought without an initial sales charge).
Class R shares are not subject to an initial sales charge or CDSC and are available only to certain defined contribution plans.
Class Y shares are not subject to an initial sales charge or CDSC, and carry no 12b-1 fee. They are generally only available to corporate and institutional clients and clients in other approved programs.
Comparative indexes
Barclays Capital Aggregate Bond Index is an unmanaged index of U.S. investment-grade fixed-income securities.
Merrill Lynch U.S. 3-Month Treasury Bill Index is an unmanaged index that seeks to measure the performance of U.S. Treasury bills available in the marketplace.
Morgan Stanley Capital International (MSCI) World Utilities Index is a free float-adjusted market capitalization weighted index that is designed to measure the equity market performance of developed markets in the utilities sector.
S&P 500 Index is an unmanaged index of common stock performance.
S&P Utilities Index is an unmanaged index of common stocks issued by utility companies.
Indexes assume reinvestment of all distributions and do not account for fees. Securities and performance of a fund and an index will differ. You cannot invest directly in an index.
Lipper is a third-party industry-ranking entity that ranks mutual funds. Its rankings do not reflect sales charges. Lipper rankings are based on total return at net asset value relative to other funds that have similar current investment styles or objectives as determined by Lipper. Lipper may change a fund’s category assignment at its discretion. Lipper category averages reflect performance trends for funds within a category.
12
Trustee approval of management contract
General conclusions
The Board of Trustees of the Putnam funds oversees the management of each fund and, as required by law, determines annually whether to approve the continuance of your fund’s management contract with Putnam Investment Management (“Putnam Management”), the sub-management contract, with respect to your fund, between Putnam Management and its affiliate, Putnam Investments Limited (“PIL”), and the sub-advisory contract among Putnam Management, PIL, and another affiliate, Putnam Advisory Company (“PAC”).
In this regard, the Board of Trustees, with the assistance of its Contract Committee consisting solely of Trustees who are not “interested persons” (as such term is defined in the Investment Company Act of 1940, as amended) of the Putnam funds (the “Independent Trustees”), requests and evaluates all information it deems reasonably necessary under the circumstances. Over the course of several months ending in June 2009, the Contract Committee met several times to consider the information provided by Putnam Management and other information developed with the assistance of the Board’s independent counsel and independent staff. The Contract Committee reviewed and discussed key aspects of this information with all of the Independent Trustees. At the Trustees’ June 12, 2009 meeting, the Contract Committee recommended, and the Independent Trustees approved, the continuance of your fund’s management, sub-management, and sub-a dvisory contracts, effective July 1, 2009. (Because PIL and PAC are affiliates of Putnam Management and Putnam Management remains fully responsible for all services provided by PIL and PAC, the Trustees have not evaluated PIL or PAC as separate entities, and all subsequent references to Putnam Management below should be deemed to include reference to PIL and PAC as necessary or appropriate in the context.)
The Independent Trustees’ approval was based on the following conclusions:
• That the fee schedule in effect for your fund represented reasonable compensation in light of the nature and quality of the services being provided to the fund, the fees paid by competitive funds and the costs incurred by Putnam Management in providing such services, and
• That such fee schedule represented an appropriate sharing between fund shareholders and Putnam Management of such economies of scale as may exist in the management of the fund at current asset levels.
These conclusions were based on a comprehensive consideration of all information provided to the Trustees, were subject to the continued application of certain expense reductions and waivers pending other considerations noted below, and were not the result of any single factor. Some of the factors that figured particularly in the Trustees’ deliberations and how the Trustees considered these factors are described below, although individual Trustees may have evaluated the information presented differently, giving different weights to various factors. It is also important to recognize that the fee arrangements for your fund and the other Putnam funds are the result of many years of review and discussion between the Independent Trustees and Putnam Management, that certain aspects of the arrangements may receive greater scrutiny in some years than others, and that the Trustees’ conclusions may be based, in part, on their consideration of these sam e arrangements in prior years.
Consideration of strategic
pricing proposal
The Trustees considered that the Contract Committee had been engaged in a detailed review of Putnam Management’s strategic pricing proposal that was first presented to the Committee at its May 2009 meeting. The proposal included proposed changes to the basic structure of the management fees in place for all open-end funds (except the Putnam RetirementReady® Funds and Putnam Money Market Liquidity Fund), including implementation of a breakpoint structure based on the aggregate net assets of all such funds in lieu of the individual breakpoint structures in place for each fund, as well as implementation of performance fees for certain funds. In addition, the proposal recommended substituting separate expense limitations on investor servicing fees and on other expenses as a group in lieu of the total expense limitations in place for many funds.
While the Contract Committee noted the likelihood that the Trustees and Putnam Management would reach agreement on the strategic pricing matters in later months, the terms of the management contracts required that the Trustees approve the continuance of the contracts in order to prevent their expiration at June 30, 2009. The Contract Committee’s recommendations in June reflect its conclusion that the terms of the contractual arrangements for your fund continued to be appropriate for the upcoming term, absent any possible agreement with respect to the matters addressed in Putnam Management’s proposal.
The Trustees were mindful of the signifi-cant changes that had occurred at Putnam Management in the past two years, including a change of ownership, the installation of a new senior management team at Putnam Management, the substantial decline in assets under management resulting from extraordinary market forces as well as continued net redemptions in many funds, the introduction of new fund products representing novel investment strategies and the introduction of performance fees for certain new funds. The Trustees were also mindful that many other leading firms in the industry had also been experiencing significant challenges due to the changing financial and competitive environment. For these reasons, even though the Trustees believed that the current contractual arrangements in place between the funds and Putnam Management and its affiliates have
13
served shareholders well and continued to be appropriate for the near term, the Trustees believed that it was an appropriate time to reconsider the current structure of the funds’ contractual arrangements with Putnam Management with a view to possible changes that might better serve the interests of shareholders in this new environment. The Trustees concluded their review of Putnam Management’s strategic pricing proposal in July 2009, and their considerations regarding the proposal are discussed below under the heading “Subsequent approval of strategic pricing proposal.” With the exception of the discussion under this heading, the following discussion generally addresses only the Trustees’ reasons for recommending the continuance of the current contractual arrangements as, at the time the Trustees determined to make this recommendation, the Trustees had not yet reached any conclusions with respect to the strategic pricing propo sal.
Management fee schedules and
categories; total expenses
The Trustees reviewed the management fee schedules in effect for all Putnam funds, including fee levels and breakpoints, and the assignment of funds to particular fee categories. The general fee structure has been carefully developed over the years and re-examined on many occasions and adjusted where appropriate. In this regard, the Trustees noted that shareholders of all funds voted by overwhelming majorities in 2007 to approve new management contracts containing identical fee schedules.
In reviewing fees and expenses, the Trustees generally focused their attention on material changes in circumstances — for example, changes in a fund’s size or investment style, changes in Putnam Management’s operating costs, or changes in competitive practices in the mutual fund industry — that suggest that consideration of fee changes might be warranted. The Trustees concluded that the circumstances did not warrant changes to the management fee structure of your fund at that time but, as indicated above, based on their detailed review of the current fee structure, were prepared to consider possible changes to this arrangement that might better serve the interests of shareholders in the future. The Trustees focused on two areas of particular interest, as discussed further below:
• Competitiveness. The Trustees reviewed comparative fee and expense information for competitive funds, which indicated that, in a custom peer group of competitive funds selected by Lipper Inc., your fund ranked in the 67th percentile in management fees and in the 40th percentile in total expenses (less any applicable 12b-1 fees) as of December 31, 2008 (the first percentile being the least expensive funds and the 100th percentile being the most expensive funds).
The Trustees noted that expense ratios for a number of Putnam funds, which show the percentage of fund assets used to pay for management and administrative services, distribution (12b-1) fees and other expenses, had been increasing recently as a result of declining net assets and the natural operation of fee breakpoints. The Trustees expressed their intention to monitor the funds’ percentile rankings in management fees and in total expenses to ensure that fees and expenses of the funds continue to meet evolving competitive standards.
The Trustees noted that the expense ratio increases described above were being controlled by expense limitations initially implemented in January 2004. These expense limitations give effect to a commitment by Putnam Management that the expense ratio of each open-end fund would be no higher than the average expense ratio of the competitive funds included in the fund’s relevant Lipper universe (exclusive of any applicable 12b-1 charges in each case). The Trustees observed that this commitment to limit fund expenses has served shareholders well since its inception and, while the Contract Committee was reviewing proposed alternative expense limitation arrangements as noted above, the Trustees received a commitment from Putnam Management and its parent company to continue this program through at least June 30, 2010, or such earlier time as the Trustees and Putnam Management reach agreement on alternative arrangements.
In order to ensure that the expenses of the Putnam funds continue to meet evolving competitive standards, the Trustees requested, and Putnam Management agreed, to extend for the twelve months beginning July 1, 2009, or until such earlier time as the Trustees and Putnam Management reach agreement on alternative expense limitation arrangements, an additional expense limitation for certain funds at an amount equal to the average expense ratio (exclusive of 12b-1 charges) of a custom peer group of competitive funds selected by Lipper to correspond to the size of the fund. This additional expense limitation will be applied to those open-end funds that had above-average expense ratios (exclusive of 12b-1 charges) based on the custom peer group data for the period ended December 31, 2007. This additional expense limitation was not applied to your fund because it had a below-average expense ratio relative to its custom peer group.
• Economies of scale. Your fund currently has the benefit of breakpoints in its management fee that provide shareholders with significant economies of scale, which means that the effective management fee rate of the fund (as a percentage of fund assets) declines as the fund grows in size and crosses specified asset thresholds. Conversely, as the fund shrinks in size — as has been the case for many Putnam funds in recent years — these breakpoints result in increasing fee levels. In recent years, the Trustees have examined the operation of the existing breakpoint structure during periods of both growth and decline in asset levels. The Trustees concluded that the fee schedule in effect for your fund represented an appropriate sharing of economies of scale at that time but, as noted above, were in the process of reviewing a prop osal to eliminate individual fund breakpoints for all of the open-end funds (except for the Putnam RetirementReady® Funds and Putnam Money Market Liquidity Fund) in favor of a breakpoint structure based on the aggregate net assets of all such funds.
In connection with their review of the management fees and total expenses of the Putnam funds, the Trustees also reviewed
14
the costs of the services provided and profits realized by Putnam Management and its affiliates from their contractual relationships with the funds. This information included trends in revenues, expenses and profitability of Putnam Management and its affiliates relating to the investment management and distribution services provided to the funds. In this regard, the Trustees also reviewed an analysis of Putnam Management’s revenues, expenses and profitability with respect to the funds’ management contracts, allocated on a fund-by-fund basis.
Investment performance
The quality of the investment process provided by Putnam Management represented a major factor in the Trustees’ evaluation of the quality of services provided by Putnam Management under your fund’s management contract. The Trustees were assisted in their review of the Putnam funds’ investment process and performance by the work of the Investment Oversight Coordinating Committee of the Trustees and the Investment Oversight Committees of the Trustees, which had met on a regular monthly basis with the funds’ portfolio teams throughout the year. The Trustees concluded that Putnam Management generally provides a high-quality investment process — as measured by the experience and skills of the individuals assigned to the management of fund portfolios, the resources made available to such personnel, and in general the ability of Putnam Management to attract and retain high-quality personnel — but also recognized that this does no t guarantee favorable investment results for every fund in every time period. The Trustees considered the investment performance of each fund over multiple time periods and considered information comparing each fund’s performance with various benchmarks and with the performance of competitive funds.
The Trustees noted the disappointing investment performance of many of the funds for periods ended March 31, 2009. They discussed with senior management of Putnam Management the factors contributing to such underperformance and the actions being taken to improve performance. The Trustees recognized that, in recent years, Putnam Management has taken steps to strengthen its investment personnel and processes to address areas of underperformance, including Putnam Management’s continuing efforts to strengthen the equity research function, recent changes in portfolio managers including increased accountability of individual managers rather than teams, recent changes in Putnam Management’s approach to incentive compensation, including emphasis on top quartile performance over a rolling three-year period, and the recent arrival of a new chief investment officer. The Trustees also recognized the substantial improvement in performance of many funds si nce the implementation of those changes. The Trustees indicated their intention to continue to monitor performance trends to assess the effectiveness of these efforts and to evaluate whether additional changes to address areas of underperformance are warranted.
In the case of your fund, the Trustees considered that your fund’s class A share cumulative total return performance at net asset value was in the following percentiles of its Lipper Inc. peer group (Lipper Utility Funds) for the one-year, three-year and five-year periods ended December 31, 2008* (the first percentile being the best-performing funds and the 100th percentile being the worst-performing funds):
| One-year period | 26th | ||
| Three-year period | 22nd | ||
| Five-year period | 50th | ||
Over the one-year, three-year and five-year periods ended December 31, 2008, there were 101, 91 and 70 funds, respectively, in your fund’s Lipper peer group. Past performance is no guarantee of future results.
As a general matter, the Trustees believe that cooperative efforts between the Trustees and Putnam Management represent the most effective way to address investment performance problems. The Trustees noted that investors in the Putnam funds have, in effect, placed their trust in the Putnam organization, under the oversight of the funds’ Trustees, to make appropriate decisions regarding the management of the funds. Based on the responsiveness of Putnam Management in the recent past to Trustee concerns about investment performance, the Trustees concluded that it is preferable to seek change within Putnam Management to address performance shortcomings. In the Trustees’ view, the alternative of engaging a new investment adviser for an underperforming fund would entail significant disruptions and would not provide any greater assurance of improved investment performance.
Brokerage and soft-dollar
allocations; other benefits
The Trustees considered various potential benefits that Putnam Management may receive in connection with the services it provides under the management contract with your fund. These include benefits related to brokerage and soft-dollar allocations, whereby a portion of the commissions paid by a fund for brokerage may be used to acquire research services that may be useful to Putnam Management in managing the assets of the fund and of other clients. The Trustees considered a change made, at Putnam Management’s request, to the Putnam funds’ brokerage allocation policy commencing in 2009, which increased the permitted soft dollar allocation to third-party services over what had been authorized in previous years. The Trustees noted that a portion of available soft dollars continue to be allocated to the payment of fund expenses, although the amount allocated for this purpose has declined
* As of 1/1/09, Putnam Management no longer evaluates this fund’s performance versus its Lipper peer group and instead evaluates the fund’s performance against the performance of its benchmark.
15
in recent years. The Trustees indicated their continued intent to monitor regulatory developments in this area with the assistance of their Brokerage Committee and also indicated their continued intent to monitor the potential benefits associated with the allocation of fund brokerage and trends in industry practice to ensure that the principle of seeking best price and execution remains paramount in the portfolio trading process.
The Trustees’ annual review of your fund’s management contract also included the review of the investor servicing agreement with Putnam Investor Services, Inc. (“PSERV”), which agreement provides benefits to an affiliate of Putnam Management. The Trustees considered that effective January 1, 2009, the Trustees, PSERV and Putnam Fiduciary Trust Company entered into a new fee schedule that includes for the open-end funds (other than funds of Putnam Variable Trust and Putnam Money Market Liquidity Fund) an expense limitation but, as noted above, also considered that this expense limitation is subject to review as part of the Trustees’ pending review of Putnam’s strategic pricing proposal.
In the case of your fund, the Trustees’ annual review of the fund’s management contract also included the review of the fund’s distributor’s contract and distribution plans with Putnam Retail Management Limited Partnership, which contract and plans also provide benefits to an affiliate of Putnam Management.
Comparison of retail and
institutional fee schedules
The information examined by the Trustees as part of their annual contract review has included for many years information regarding fees charged by Putnam Management and its affiliates to institutional clients such as defined benefit pension plans, college endowments, etc. This information included comparisons of such fees with fees charged to the funds, as well as a detailed assessment of the differences in the services provided to these two types of clients. The Trustees observed, in this regard, that the differences in fee rates between institutional clients and mutual funds are by no means uniform when examined by individual asset sectors, suggesting that differences in the pricing of investment management services to these types of clients reflect to a substantial degree historical competitive forces operating in separate market places. The Trustees considered the fact that fee rates across different asset classe s are typically higher on average for mutual funds than for institutional clients, as well as the differences between the services that Putnam Management provides to the Putnam funds and those that it provides to institutional clients of the firm, but did not rely on such comparisons to any significant extent in concluding that the management fees paid by your fund are reasonable.
Subsequent approval of strategic
pricing proposal
As mentioned above, at a series of meetings beginning in May 2009 and ending on July 10, 2009, the Contract Committee and the Trustees engaged in a detailed review of Putnam Management’s strategic pricing proposal. Following this review, the Trustees of each fund, including all of the Independent Trustees, voted unanimously on July 10, 2009 to approve proposed management contracts reflecting the proposal, as modified based on discussions between the Independent Trustees and Putnam Management, for each fund. In considering the proposed contracts, the Independent Trustees focused largely on the specific proposed changes described below relating to management fees. They also took into account the factors that they considered in connection with their most recent annual approval on June 12, 2009 of the continuance of the funds’ current management contracts and the extensive materials that they had reviewed in connection with that approval pr ocess, as described above.
The proposed management contracts are subject to shareholder approval. The Trustees have called a shareholder meeting for each of the funds for November 19, 2009 and have recommended unanimously that shareholders approve the proposed contracts.
• Considerations relating to Fund Family fee rate calculations. The Independent Trustees considered that the proposed management contracts would change the manner in which fund shareholders share in potential economies of scale associated with the management of the funds. Under the current management contracts, shareholders of a fund benefit from increased fund size through reductions in the effective management fee paid to Putnam Management once the fund’s net assets exceed the first breakpoint in the fund’s fee schedule ($500 million for most funds). Conversely, in the case of funds with net assets above the level of the first breakpoint, the effective management fee increases as the fund’s average net assets decline below a breakpoint. These breakpoints are measured solely by the net assets of each individual fund and are not affected by possible growt h (or decline) of net assets of other funds in the Fund Family. (“Fund Family” for purposes of this discussion refers to all open-end mutual funds sponsored by Putnam Management, except for the Putnam RetirementReady® Funds and Putnam Money Market Liquidity Fund.) Under the proposed management contracts, potential economies of scale would be shared ratably among shareholders of all funds, regardless of their size. The management fees paid by a fund (and indirectly by shareholders) would no longer be affected by the growth (or decline) of assets of the particular fund, but rather would be affected solely by the growth (or decline) of the aggregate net assets of all funds in the Fund Family, regardless of whether the net assets of the particular fund are growing or declining.
The table that follows shows the proposed effective management fee rate for your fund, based on June 30, 2009 net assets of the Fund Family ($52.3 billion). This table also shows the effective management fee rate payable by your fund under its current management contract, based on the net assets of the fund as of June 30, 2009. Finally, this table shows the difference in the effective management fees, based on net assets as of June 30, 2009, between the proposed management contract and the current contract.
16
| Name of Fund | Proposed Effective Contractual Rate | Current Effective Contractual Rate | Difference |
| Putnam Global Utilities Fund | 0.642% | 0.700% | (0.058)% |
As shown in the foregoing table, based on June 30, 2009 net asset levels, the proposed management contract would provide for payment of a management fee rate that is lower for your fund than the management fee rate payable under the current management contract. For a small number of funds (although not your fund), the management fee rate would be slightly higher under the proposed contract at these asset levels, but by only immaterial amounts. In the aggregate, the financial impact on Putnam Management of implementing this proposed change for all funds at June 30, 2009 net asset levels is a reduction in annual management fee revenue of approximately $24.0 million. (Putnam Management has already incurred a significant portion of this revenue reduction through the waiver of a portion of its current management fees for certain funds pending shareholder consideration of the proposed management contracts. Putnam is not obliged to continue such waivers beyon d July 31, 2010 in the event that the proposed contracts are not approved by shareholders.) The Independent Trustees carefully considered the implications of this proposed change under a variety of economic circumstances. They considered the fact that at current asset levels the management fees paid by the funds under the proposed contract would be lower for almost all funds, and would not be materially higher for any fund. They considered the possibility that under some circumstances, the current management contract could result in a lower fee for a particular fund than the proposed management contract. Such circumstances might occur, for example, if the aggregate net assets of the Fund Family remain largely unchanged and the net assets of an individual fund grew substantially, or if the net assets of an individual fund remain largely unchanged and the aggregate net assets of the Fund Family declined substantially.
The Independent Trustees noted that future changes in the net assets of individual funds are inherently unpredictable and that experience has shown that funds often grow in size and decline in size over time depending on market conditions and the changing popularity of particular investment styles and asset classes. They noted that, while the aggregate net assets of the Fund Family have changed substantially over time, basing a management fee on the aggregate level of assets of the Fund Family would likely reduce fluctuations in costs paid by individual funds and lead to greater stability and predictability of fund operating costs over time.
The Independent Trustees considered that the proposed management contract would likely be advantageous for newly organized funds that have yet to attract significant assets and for funds in specialty asset classes that are unlikely to grow to a significant size. In each case, such funds would participate in the benefits of scale made possible by the aggregate size of the Fund Family to an extent that would not be possible based solely on their individual size.
The Independent Trustees also considered that for funds that have achieved or are likely to achieve considerable scale on their own, the proposed management contract could result in sharing of economies which might lead to slightly higher costs under some circumstances, but they noted that any such increases are immaterial at current asset levels and that over time such funds are likely to realize offsetting benefits from their opportunity to participate, both through the exchange privilege and through the Fund Family breakpoint fee structure, in the improved growth prospects of a diversified Fund Family able to offer competitively priced products.
The Independent Trustees noted that the implementation of the proposed management contracts would result in a reduction in aggregate fee revenues for Putnam Management at current asset levels. They also noted that applying various projections of growth equally to the aggregate net assets of the Fund Family and to the net assets of individual funds also showed revenue reductions for Putnam Management. They recognized, however, the possibility that under some scenarios Putnam Management might realize greater future revenues, with respect to certain funds, under the proposed contracts than under the current contracts, but considered such circumstances to be both less likely and inherently unpredictable.
The Independent Trustees considered the extent to which Putnam Management may realize economies of scale in connection with the management of the funds. In this regard, they considered the possibility that such economies of scale as may exist in the management of mutual funds may be associated more closely with the size of the aggregate assets of the mutual fund complex than with the size of any individual fund. In this regard the Independent Trustees considered the financial information provided to them by Putnam Management over a period of many years regarding the allocation of costs involved in calculating the profitability of its mutual fund business as a whole and the profitability of individual funds. The Independent Trustees noted that the methodologies for such cost allocations had been reviewed on a number of occasions in the past by independent financial consultants engaged by the Independent Trustees. The Independent Trustees noted that thes e methodologies support Putnam Management’s assertion that many of its operating costs and any associated economies of scale are related more to the aggregate net assets under management in various sectors of its business than to the size of individual funds. They noted that on a number of occasions in the past the Independent Trustees had separately considered the possibility of calculating management fees in whole or in part based on aggregate net assets of the Putnam funds.
The Independent Trustees considered the fact that the proposed contracts would result in a sharing among the affected funds of economies of scale that for the most part are now enjoyed by the larger funds, without
17
materially increasing the current costs of any of the larger funds. They concluded that this sharing of economies among funds was appropriate in light of the diverse investment opportunities available to shareholders of all funds through the existence of the exchange privilege. They also considered that the proposed change in management fee structure would allow Putnam Management to introduce new investment products at more attractive pricing levels than may be currently be the case.
After considering all of the foregoing, the Independent Trustees concluded that the proposed calculation of management fees based on the aggregate net assets of the Fund Family represented a fair and reasonable means of sharing possible economies of scale among the shareholders of all funds.
• Considerations relating to addition of fee rate adjustments based on investment performance for certain funds. The Independent Trustees considered that Putnam’s proposal to add fee rate adjustments based on investment performance to the management contracts of certain funds reflected a desire by Putnam Management to align its fee revenues more closely with investment performance in the case of certain funds. They noted that Putnam Management already has a significant financial interest in achieving good performance results for the funds it manages. Putnam Management’s fees are based on the assets under its management (whether calculated on an individual fund or complex-wide basis). Good performance results in higher asset levels and therefore higher revenues to Putnam Management. Moreover, good performance also tends to at tract additional investors to particular funds or the complex generally, also resulting in higher revenues. Nevertheless, the Independent Trustees concluded that adjusting management fees based on performance for certain selected funds could provide additional benefits to shareholders.
The Independent Trustees noted that Putnam Management proposed the addition of performance adjustments only for certain of the funds (performance adjustments were not proposed for your fund) and considered whether similar adjustments might be appropriate for other funds. In this regard, they considered Putnam Management’s belief that the addition of performance adjustments would be most appropriate for shareholders of U.S. growth funds, international equity funds and Putnam Global Equity Fund. They also considered Putnam Management’s view that it would continue to monitor whether performance fees would be appropriate for other funds. Accordingly, the Independent Trustees concluded that it would be desirable to gain further experience with the operation of performance adjustments for certain funds and the market’s receptivity to such fee structures before giving further consideration to whether similar performance adjustments would be appropriate for other funds as well.
• Considerations relating to standardization of payment terms. The proposed management contracts for all funds provide that management fees will be computed and paid monthly within 15 days after the end of each month. The current contracts of the funds contain quarterly computation and payment terms in some cases. These differences largely reflect practices in place at earlier times when many of the funds were first organized. Under the proposed contract, certain funds would make payments to Putnam Management earlier than they do under their current contract. This would reduce a fund’s opportunity to earn income on accrued but unpaid management fees by a small amount, but would not have a material effect on a fund’s operating costs.
The Independent Trustees considered the fact that standardizing the payment terms for all funds would involve an acceleration in the timing of payments to Putnam Management for some funds and a corresponding loss of a potential opportunity for such funds to earn income on accrued but unpaid management fees. The Independent Trustees did not view this change as having a material impact on shareholders of any fund. In this regard, the Independent Trustees noted that the proposed contracts conform to the payment terms included in management contracts for all Putnam funds organized in recent years and that standardizing payment terms across all funds would reduce administrative burdens for both the funds and Putnam Management.
• Considerations relating to comparisons with management fees and total expenses of competitive funds. As part of their evaluation of the proposed management contracts, the Independent Trustees also reviewed the general approach taken by Putnam Management and the Independent Trustees in recent years in imposing appropriate limits on total fund expenses. As part of the annual contract review process in recent years, Putnam Management agreed to waive fees as needed to limit total fund expenses to a maximum level equal to the average total expenses of comparable competitive funds in the mutual fund industry. In connection with its proposal to implement new management contracts, Putnam Management also proposed, and the Independent Trustees approved, certain changes in this approach that shift the focus from controlling total expenses to imposing separate limits on certain c ategories of expenses, as required. As a general matter, Putnam Management and the Independent Trustees concluded that management fees for the Putnam funds are competitive with the fees charged by comparable funds in the industry. Nevertheless, the Independent Trustees considered specific management fee waivers proposed to be implemented as of August 1, 2009 by Putnam Management with respect to the current management fees of certain funds, as well as projected reductions in management fees for almost all funds that would result under the proposed contracts. Putnam Management and the Independent Trustees also agreed to impose separate expense limitations of 37.5 basis points on the general category of shareholder servicing expenses and 20 basis points on the general category of other ordinary operating expenses. These new expense limitations, as well as the fee waivers, were implemented for all funds effective as of August 1, 2009, replacing the expense limitation referred to above.
These changes resulted in lower total expenses for many funds, but in the case
18
of some funds total expenses increased after application of the new waivers and expense limitations (as compared with the results obtained using the expense limitation method previously in place). In this regard, the Independent Trustees considered the likelihood that total expenses for most of these funds would have increased in any event in the normal course under the previous expense limitation arrangement, as the reported total expense levels of many competitive funds increased in response to the major decline in asset values that began in September 2008. These new waivers and expense limitations will continue in effect until at least July 31, 2010 and will be re-evaluated by the Independent Trustees as part of the annual contract review process prior to their scheduled expiration. However, the management fee waivers referred to above would largely become permanent reductions in fees as a result of the implementation of the proposed management cont racts.
Under these new expense limitation arrangements effective August 1, 2009, your fund is subject to a management fee waiver that reduces the fund’s management fee pending implementation of the proposed management contract. In addition, your fund is subject to expense limitations of 37.5 basis points on the category of shareholder servicing fees and 20 basis points on the general category of other ordinary operating expenses.
19
Other information for shareholders
Upcoming shareholder vote
The Putnam Funds will hold a shareholder meeting on November 19, 2009, in Boston, Massachusetts, to decide several proposals that affect your fund. While you are welcome to attend in person, the vast majority of shareholders vote by “proxy,” which means they give instructions to persons designated by their fund’s Board of Trustees to vote on their behalf.
Shareholder proposals
1.Election of Trustees. The Putnam Funds’ Board of Trustees is responsible for overseeing the operation of the Putnam funds and for assuring that each fund is managed in the best interests of its shareholders. All but one of the Trustees are independent of Putnam Investments. All of the current Trustees work on your behalf and are up for re-election. The Trustees recommend you vote to elect all Trustees.
2. Shareholder-friendly changes to Putnam fund management fees. As a Putnam fund shareholder, you pay a management fee that covers key services such as portfolio management, securities trading, and accounting. The management fee typically represents the single largest component of a fund’s total expenses. Key benefits of the proposal include:
a. Lower management fees The change will result in reduced management fees for virtually all Putnam funds, including significantly lower management fees for fixed-income and asset allocation funds.
b. Fund family breakpoints Asset-level discounts for management fees will be based on the growth of all Putnam mutual fund assets, rather than an individual Putnam fund’s assets. This change will allow shareholders to benefit from the growth of the Putnam fund family as a whole, even if their specific fund is not growing.
c. Performance fees on U.S. growth funds, international funds, and Putnam Global Equity Fund These equity funds would have performance fees reflecting the strength or weakness of the investment performance of a given fund. Management fees for these funds would decline from their standard fee if the funds underperform their benchmarks and would rise if the funds outperform.
The Trustees recommend you vote for the proposed new management contracts that include these fee changes.
3. Updating investment restrictions of certain funds. Several different fund-specific proposals are included. However, all involve updating and standardizing investment restrictions in certain areas to provide portfolio managers with added investment flexibility, as well as to reduce administrative and compliance burdens for the funds. The Trustees recommend you vote to update and standardize these investment restrictions.
Please remember to vote
Delaying your vote will increase fund expenses if further mailings are required. If you complete your proxy card, your shares will be voted on your behalf exactly as you have instructed. If you simply sign the proxy card, your shares will be voted in accordance with the Trustees’ recommendations.
20
Putnam’s policy on confidentiality
In order to conduct business with our shareholders, we must obtain certain personal information such as account holders’ addresses, telephone numbers, Social Security numbers, and the names of their financial representatives. We use this information to assign an account number and to help us maintain accurate records of transactions and account balances. It is our policy to protect the confidentiality of your information, whether or not you currently own shares of our funds, and, in particular, not to sell information about you or your accounts to outside marketing firms. We have safeguards in place designed to prevent unauthorized access to our computer systems and procedures to protect personal information from unauthorized use. Under certain circumstances, we share this information with outside vendors who provide services to us, such as mailing and proxy solicitation. In those cases, the service providers enter into confidentiality agreements with us, and we provide only the information necessary to process transactions and perform other services related to your account. We may also share this information with our Putnam affiliates to service your account or provide you with information about other Putnam products or services. It is also our policy to share account information with your financial representative, if you’ve listed one on your Putnam account. If you would like clarification about our confidentiality policies or have any questions or concerns, please don’t hesitate to contact us at 1-800-225-1581, Monday through Friday, 8:30 a.m. to 8:00 p.m., or Saturdays from 9:00 a.m. to 5:00 p.m. Eastern Time.
Proxy voting
Putnam is committed to managing our mutual funds in the best interests of our shareholders. The Putnam funds’ proxy voting guidelines and procedures, as well as information regarding how your fund voted proxies relating to portfolio securities during the 12-month period ended June 30, 2009, are available in the Individual Investors section at putnam.com, and on the SEC’s Web site, www.sec.gov. If you have questions about finding forms on the SEC’s Web site, you may call the SEC at 1-800-SEC-0330. You may also obtain the Putnam funds’ proxy voting guidelines and procedures at no charge by calling Putnam’s Shareholder Services at 1-800-225-1581.
Fund portfolio holdings
The fund will file a complete schedule of its portfolio holdings with the SEC for the first and third quarters of each fiscal year on Form N-Q. Shareholders may obtain the fund’s Forms N-Q on the SEC’s Web site at www.sec.gov. In addition, the fund’s Forms N-Q may be reviewed and copied at the SEC’s Public Reference Room in Washington, D.C. You may call the SEC at 1-800-SEC-0330 for information about the SEC’s Web site or the operation of the Public Reference Room.
Trustee and employee fund ownership
Putnam employees and members of the Board of Trustees place their faith, confidence, and, most importantly, investment dollars in Putnam mutual funds. As of August 31, 2009, Putnam employees had $298,000,000 and the Trustees had $34,000,000 invested in Putnam mutual funds. These amounts include investments by the Trustees’ and employees’ immediate family members as well as investments through retirement and deferred compensation plans.
21
Financial statements
These sections of the report, as well as the accompanying Notes, preceded by the Report of Independent Registered Public Accounting Firm, constitute the fund’s financial statements.
The fund’s portfolio lists all the fund’s investments and their values as of the last day of the reporting period. Holdings are organized by asset type and industry sector, country, or state to show areas of concentration and diversification.
Statement of assets and liabilities shows how the fund’s net assets and share price are determined. All investment and noninvestment assets are added together. Any unpaid expenses and other liabilities are subtracted from this total. The result is divided by the number of shares to determine the net asset value per share, which is calculated separately for each class of shares. (For funds with preferred shares, the amount subtracted from total assets includes the liquidation preference of preferred shares.)
Statement of operations shows the fund’s net investment gain or loss. This is done by first adding up all the fund’s earnings —from dividends and interest income — and subtracting its operating expenses to determine net investment income (or loss). Then, any net gain or loss the fund realized on the sales of its holdings — as well as any unrealized gains or losses over the period — is added to or subtracted from the net investment result to determine the fund’s net gain or loss for the fiscal year.
Statement of changes in net assets shows how the fund’s net assets were affected by the fund’s net investment gain or loss, by distributions to shareholders, and by changes in the number of the fund’s shares. It lists distributions and their sources (net investment income or realized capital gains) over the current reporting period and the most recent fiscal year-end. The distributions listed here may not match the sources listed in the Statement of operations because the distributions are determined on a tax basis and may be paid in a different period from the one in which they were earned.
Financial highlights provide an overview of the fund’s investment results, per-share distributions, expense ratios, net investment income ratios, and portfolio turnover in one summary table, reflecting the five most recent reporting periods. In a semiannual report, the highlight table also includes the current reporting period.
22
Report of Independent Registered Public Accounting Firm
To the Trustees and Shareholders of
Putnam Global Utilities Fund:
In our opinion, the accompanying statement of assets and liabilities, including the portfolio, and the related statements of operations and of changes in net assets and the financial highlights present fairly, in all material respects, the financial position of Putnam Global Utilities Fund (the “fund”), formally the Putnam Utilities Growth and Income Fund, at August 31, 2009, and the results of its operations, the changes in its net assets and the financial highlights for each of the periods indicated, in conformity with accounting principles generally accepted in the United States of America. These financial statements and financial highlights (hereafter referred to as “financial statements”) are the responsibility of the fund’s management. Our responsibility is to express an opinion on these financial statements based on our audits. We conducted our audits of these financial statements in accordance with the standards of the Public Company Accounting Oversight Board (United States). Those standards require that we plan and perform the audit to obtain reasonable assurance about whether the financial statements are free of material misstatement. An audit includes examining, on a test basis, evidence supporting the amounts and disclosures in the financial statements, assessing the accounting principles used and significant estimates made by management, and evaluating the overall financial statement presentation. We believe that our audits, which included confirmation of investments owned at August 31, 2009 by correspondence with the custodian and brokers, provide a reasonable basis for our opinion.
PricewaterhouseCoopers LLP
Boston, Massachusetts
October 14, 2009
23
The fund’s portfolio 8/31/09
| COMMON STOCKS (98.6%)* | Shares | Value |
| Electric utilities (73.0%) | ||
| Allegheny Energy, Inc. | 103,200 | $2,725,512 |
| Alliant Energy Corp. | 88,234 | 2,324,084 |
| American Electric Power Co., Inc. S | 247,250 | 7,771,068 |
| Chubu Electric Power, Inc. (Japan) | 85,000 | 1,979,402 |
| CMS Energy Corp. S | 710,090 | 9,522,307 |
| Constellation Energy Group, Inc. | 97,000 | 3,070,050 |
| Dominion Resources, Inc. S | 85,350 | 2,823,378 |
| Duke Energy Corp. S | 360,301 | 5,581,062 |
| E.ON AG (Germany) | 827,172 | 35,033,009 |
| EDF (France) | 133,196 | 6,994,042 |
| Edison International | 222,645 | 7,438,569 |
| Entergy Corp. S | 140,807 | 11,123,753 |
| Exelon Corp. | 261,852 | 13,097,837 |
| FirstEnergy Corp. | 41,956 | 1,893,474 |
| FPL Group, Inc. S | 118,896 | 6,679,577 |
| Great Plains Energy, Inc. S | 294,200 | 5,154,384 |
| Hong Kong Electric Holdings, Ltd. | ||
| (Hong Kong) | 690,500 | 3,857,791 |
| Iberdrola SA (Spain) | 1,237,067 | 11,478,126 |
| ITC Holdings Corp. | 46,900 | 2,184,602 |
| Kansai Electric Power, Inc. (Japan) | 149,400 | 3,438,916 |
| Kyushu Electric Power Co., Inc. (Japan) | 147,800 | 3,266,957 |
| Northeast Utilities | 187,205 | 4,453,607 |
| NV Energy, Inc. | 780,225 | 9,409,514 |
| PG&E Corp. | 380,056 | 15,426,473 |
| COMMON STOCKS (98.6%)* cont. | Shares | Value |
| Electric utilities cont. | ||
| Pinnacle West Capital Corp. | 69,600 | $2,290,536 |
| Public Power Corp. SA (Greece) † | 365,248 | 8,596,987 |
| Public Service Enterprise Group, Inc. | 140,840 | 4,460,403 |
| RWE AG (Germany) | 192,280 | 17,826,872 |
| Scottish and Southern Energy PLC | ||
| (United Kingdom) | 466,634 | 8,472,537 |
| Southern Co. (The) | 67,400 | 2,102,880 |
| Tohoku Electric Power Co., Inc. (Japan) | 143,100 | 3,101,500 |
| Tokyo Electric Power Co. (Japan) | 636,200 | 16,594,439 |
| Wisconsin Energy Corp. | 83,378 | 3,791,198 |
| 243,964,846 | ||
| Natural gas utilities (20.1%) | ||
| Centrica PLC (United Kingdom) | 4,015,868 | 16,397,225 |
| Gaz de France SA (France) | 453,939 | 19,158,263 |
| Osaka Gas Co., Ltd. (Japan) | 1,574,000 | 5,451,522 |
| Sempra Energy | 133,143 | 6,679,784 |
| Snam Rete Gas SpA (Italy) | 1,236,597 | 5,746,441 |
| Tokyo Gas Co., Ltd. (Japan) | 3,467,000 | 13,909,767 |
| 67,343,002 | ||
| Power producers (4.7%) | ||
| AES Corp. (The) † | 756,548 | 10,342,010 |
| International Power PLC (United Kingdom) | 1,142,377 | 5,206,212 |
| 15,548,222 | ||
| Water Utilities (0.8%) | ||
| United Utilities Group PLC (United Kingdom) | 369,070 | 2,709,078 |
| 2,709,078 | ||
| Total common stocks (cost $290,978,380) | $329,565,148 | |
| SHORT-TERM INVESTMENTS (12.8%)* | Principal amount/shares | Value |
| U.S. Treasury Cash Management Bills for an effective yield of 0.437%, April 1, 2010 ## | $150,000 | $149,701 |
| Short-term investments held as collateral for loaned securities with yields ranging from | ||
| 0.45% to 0.47% and due dates ranging from September 1, 2009 to September 10, 2009 d | 39,759,291 | 39,758,700 |
| Putnam Money Market Liquidity Fund e | 2,870,214 | 2,870,214 |
| Total short-term investments (cost $42,778,525) | $42,778,615 | |
| TOTAL INVESTMENTS | ||
| Total investments (cost $333,756,905) | $372,343,763 | |
* Percentages indicated are based on net assets of $334,309,820.
† Non-income-producing security.
## This security, in part or in entirety, was pledged and segregated with the custodian for collateral on certain derivative contracts at August 31, 2009.
d See Note 1 to the financial statements.
e See Note 6 to the financial statements regarding investments in Putnam Money Market Liquidity Fund.
S Securities on loan, in part or in entirety, at August 31, 2009.
At August 31, 2009, liquid assets totaling $103,050 have been designated as collateral for open forward contracts.
| |||||||
| DIVERSIFICATION BY COUNTRY | |||||||
| Distribution of investments by country of risk at August 31, 2009 (as a percentage of Portfolio Value): | |||||||
| United States | 43.1% | United Kingdom | 9.9% | Greece | 2.6% | ||
| Germany | 15.9 | France | 7.9 | Italy | 1.7 | ||
| Japan | 14.3 | Spain | 3.4 | Hong Kong | 1.2 | ||
| Total | 100.0% | ||||||
24
| FORWARD CURRENCY CONTRACTS TO BUY at 8/31/09 | Aggregate | Delivery | Unrealized appreciation/ | ||
| (aggregate face value $36,517,412) | Value | face value | date | (depreciation) | |
| Australian Dollar | $2,449,200 | $2,427,033 | 9/17/09 | $22,167 | |
| British Pound | 1,603,349 | 1,667,772 | 9/17/09 | (64,423) | |
| Canadian Dollar | 3,531,481 | 3,586,247 | 9/17/09 | (54,766) | |
| Euro | 21,344,359 | 21,467,688 | 9/17/09 | (123,329) | |
| Hong Kong Dollar | 7,368,036 | 7,368,672 | 9/17/09 | (636) | |
| Total | $(220,987) | ||||
| FORWARD CURRENCY CONTRACTS TO SELL at 8/31/09 | Aggregate | Delivery | Unrealized appreciation/ | ||
| (aggregate face value $17,439,347) | Value | face value | date | (depreciation) | |
| British Pound | $6,480,733 | $6,680,800 | 9/17/09 | $200,067 | |
| Euro | 6,739,962 | 6,770,659 | 9/17/09 | 30,697 | |
| Japanese Yen | 4,100,715 | 3,987,888 | 9/17/09 | (112,827) | |
| Total | $117,937 | ||||
In September 2006, the FASB issued Statement of Financial Accounting Standards No. 157, Fair Value Measurements (“SFAS 157”). SFAS 157 is effective for financial statements issued for fiscal years beginning after November 15, 2007 and interim periods within those fiscal years. While the adoption of SFAS 157 does not have a material effect on the fund’s net asset value, it does require additional disclosures about fair value measurements. SFAS 157 establishes a three-level hierarchy for disclosure of fair value measurements. The valuation hierarchy is based upon the transparency of inputs to the valuation of the fund’s investments. The three levels are defined as follows:
Level 1 — Valuations based on quoted prices for identical securities in active markets.
Level 2 — Valuations based on quoted prices in markets that are not active or for which all significant inputs are observable, either directly or indirectly.
Level 3 — Valuations based on inputs that are unobservable and significant to the fair value measurement.
The following is a summary of the inputs used to value the fund’s net assets as of August 31, 2009:
| Valuation inputs | |||
| Investments in securities: | Level 1 | Level 2 | Level 3 |
| Common stocks: | |||
| Utilities and power | $191,946,356 | $137,618,792 | $— |
| Total common stocks | 191,946,356 | 137,618,792 | — |
| Short-term investments | 2,870,214 | 39,908,401 | — |
| Totals by level | $194,816,570 | $177,527,193 | $— |
| Level 1 | Level 2 | Level 3 | |
| Other financial instruments: | $— | $(103,050) | $— |
Other financial instruments include forward contracts.
The accompanying notes are an integral part of these financial statements.
25
| Statement of assets and liabilities 8/31/09 | |
| ASSETS | |
| Investment in securities, at value, including $38,651,394 of | |
| securities on loan (Note 1): | |
| Unaffiliated issuers (identified cost $330,886,691) | $369,473,549 |
| Affiliated issuers (identified cost $2,870,214) (Note 6) | 2,870,214 |
| Foreign currency (cost $8) (Note 1) | 9 |
| Dividends, interest and other receivables | 1,272,070 |
| Foreign tax reclaim | 191,405 |
| Receivable for shares of the fund sold | 23,955 |
| Receivable for investments sold | 3,215,046 |
| Unrealized appreciation on forward currency contracts (Note 1) | 253,649 |
| Total assets | 377,299,897 |
| LIABILITIES | |
| Payable for investments purchased | 1,364,750 |
| Payable for shares of the fund repurchased | 455,729 |
| Payable for compensation of Manager (Note 2) | 478,962 |
| Payable for investor servicing fees (Note 2) | 95,854 |
| Payable for custodian fees (Note 2) | 22,902 |
| Payable for Trustee compensation and expenses (Note 2) | 153,104 |
| Payable for administrative services (Note 2) | 2,261 |
| Payable for distribution fees (Note 2) | 143,471 |
| Unrealized depreciation on forward currency contracts (Note 1) | 356,699 |
| Collateral on securities loaned, at value (Note 1) | 39,758,700 |
| Other accrued expenses | 157,645 |
| Total liabilities | 42,990,077 |
| Net assets | $334,309,820 |
| REPRESENTED BY | |
| Paid-in capital (Unlimited shares authorized) (Notes 1 and 4) | $332,673,709 |
| Undistributed net investment income (Note 1) | 6,096,401 |
| Accumulated net realized loss on investments and | |
| foreign currency transactions (Note 1) | (42,955,454) |
| Net unrealized appreciation of investments and | |
| assets and liabilities in foreign currencies | 38,495,164 |
| Total — Representing net assets applicable to | |
| capital shares outstanding | $334,309,820 |
| COMPUTATION OF NET ASSET VALUE AND OFFERING PRICE | |
| Net asset value and redemption price per class A share | |
| ($309,087,820 divided by 27,995,864 shares) | $11.04 |
| Offering price per class A share (100/94.25 of $11.04)* | $11.71 |
| Net asset value and offering price per class B share | |
| ($14,064,116 divided by 1,280,027 shares)** | $10.99 |
| Net asset value and offering price per class C share | |
| ($4,043,230 divided by 368,788 shares)** | $10.96 |
| Net asset value and redemption price per class M share | |
| ($2,005,282 divided by 181,933 shares) | $11.02 |
| Offering price per class M share (100/96.50 of $11.02)* | $11.42 |
| Net asset value, offering price and redemption price | |
| per class R share ($1,207,205 divided by 109,668 shares) | $11.01 |
| Net asset value, offering price and redemption price | |
| per class Y share ($3,902,167 divided by 353,380 shares) | $11.04 |
* On single retail sales of less than $50,000. On sales of $50,000 or more the offering price is reduced.
** Redemption price per share is equal to net asset value less any applicable contingent deferred sales charge.
| Statement of operations | ||
| INVESTMENT INCOME | ||
| Ten months ended | Year ended | |
| 8/31/09* | 10/31/08 | |
| Dividends (net of foreign tax of | ||
| $478,320 and $667,621, respectively) | $12,804,486 | $19,177,322 |
| Interest (including interest income of | ||
| $3,162 and $222,563, respectively, | ||
| from investments in affiliated issuers) (Note 6) | 50,948 | 242,221 |
| Securities lending | 247,060 | 225,905 |
| Total investment income | 13,102,494 | 19,645,448 |
| EXPENSES | ||
| Compensation of Manager (Note 2) | 1,934,639 | 3,996,120 |
| Investor servicing fees (Note 2) | 1,116,393 | 1,153,160 |
| Custodian fees (Note 2) | 25,767 | 24,184 |
| Trustee compensation and expenses (Note 2) | 31,831 | 40,341 |
| Administrative services (Note 2) | 21,654 | 27,847 |
| Distribution fees — Class A (Note 2) | 632,916 | 1,319,646 |
| Distribution fees — Class B (Note 2) | 141,201 | 402,997 |
| Distribution fees — Class C (Note 2) | 33,253 | 68,878 |
| Distribution fees — Class M (Note 2) | 12,281 | 26,659 |
| Distribution fees — Class R (Note 2) | 4,437 | 4,615 |
| Other | 254,723 | 257,203 |
| Non-recurring costs (Notes 2 and 7) | — | 1,072 |
| Costs assumed by Manager (Notes 2 and 7) | — | (1,072) |
| Fees waived and reimbursed by Manager | ||
| (Note 2) | (712,898) | (69,888) |
| Total expenses | 3,496,197 | 7,251,762 |
| Expense reduction (Note 2) | (36,949) | (108,403) |
| Net expenses | 3,459,248 | 7,143,359 |
| Net investment income | 9,643,246 | 12,502,089 |
| Net realized gain (loss) on investments | ||
| (Notes 1 and 3) | (35,427,447) | 3,240,869 |
| Net realized gain (loss) on foreign | ||
| currency transactions (Note 1) | 1,795,467 | (28,818) |
| Net unrealized appreciation (depreciation) | ||
| of assets and liabilities in foreign currencies | ||
| during the period | (109,137) | 11,816 |
| Net unrealized appreciation (depreciation) | ||
| of investments during the period | 38,140,658 | (225,034,916) |
| Net gain (loss) on investments | 4,399,541 | (221,811,049) |
| Net increase (decrease) in net assets | ||
| resulting from operations | $14,042,787 | $(209,308,960) |
* The fund changed its fiscal year end from October 31 to August 31.
The accompanying notes are an integral part of these financial statements.
26
Statement of changes in net assets
| INCREASE (DECREASE) IN NET ASSETS | |||
| Ten months ended | Year ended | Year ended | |
| 8/31/09* | 10/31/08 | 10/31/07 | |
| Operations: | |||
| Net investment income | $9,643,246 | $12,502,089 | $9,174,598 |
| Net realized gain (loss) on investments and foreign currency transactions | (33,631,980) | 3,212,051 | 63,097,016 |
| Net unrealized appreciation (depreciation) of investments and assets | |||
| and liabilities in foreign currencies | 38,031,521 | (225,023,100) | 85,590,961 |
| Net increase (decrease) in net assets resulting from operations | 14,042,787 | (209,308,960) | 157,862,575 |
| Distributions to shareholders (Note 1): | |||
| From ordinary income | |||
| Net investment income | |||
| Class A | (8,292,606) | (9,549,179) | (7,567,576) |
| Class B | (376,848) | (392,574) | (325,961) |
| Class C | (86,265) | (74,242) | (33,792) |
| Class M | (45,714) | (45,864) | (31,274) |
| Class R | (26,923) | (15,719) | (5,314) |
| Class Y | (100,333) | (107,869) | (74,156) |
| Redemption fees (Note 1) | 924 | 4,276 | 5,875 |
| Decrease from capital share transactions (Note 4) | (64,134,168) | (50,924,650) | (80,008,219) |
| Total increase (decrease) in net assets | (59,019,146) | (270,414,781) | 69,822,158 |
| NET ASSETS | |||
| Beginning of period | 393,328,966 | 663,743,747 | 593,921,589 |
| End of period (including undistributed net investment income of | |||
| $6,096,401, $3,706,455 and $1,375,830, respectively) | $334,309,820 | $393,328,966 | $663,743,747 |
| *The fund changed its fiscal year end from October 31 to August 31. | |||
The accompanying notes are an integral part of these financial statements.
27
Financial highlights (For a common share outstanding throughout the period)
| INVESTMENT OPERATIONS: | LESS DISTRIBUTIONS: | RATIOS AND SUPPLEMENTAL DATA: | |||||||||||
| Ratio of net | |||||||||||||
| Net realized and | Total return | Net assets, | Ratio of expenses | investment income | |||||||||
| Net asset value, | Net investment | unrealized gain (loss) | Total from investment | From net | Total | Redemption | Net asset value, | at net asset | end of period | to average | (loss) to average | Portfolio | |
| Period ended | beginning of period | income (loss) a | on investments | operations | investment income | distributions | fees | end of period | value (%) b | (in thousands) | net assets (%) c,d | net assets (%) d | turnover (%) |
| Class A | |||||||||||||
| August 31, 2009 ‡ | $10.69 | .29 | .33 | .62 | (.27) | (.27) | — e | $11.04 | 6.07 * | $309,088 | 1.02 * | 2.95 * | 76.94 * |
| October 31, 2008 | 16.27 | .32 | (5.63) | (5.31) | (.27) | (.27) | — e | 10.69 | (33.07) | 358,048 | 1.18 | 2.21 | 28.33 |
| October 31, 2007 | 12.82 | .22 | 3.43 | 3.65 | (.20) | (.20) | — e | 16.27 | 28.64 | 595,786 | 1.18 | 1.51 | 41.51 |
| October 31, 2006 | 10.97 | .22 g | 1.86 | 2.08 | (.23) | (.23) | — e | 12.82 | 19.22 | 519,557 | 1.22 g | 1.88 g | 64.90 |
| October 31, 2005 | 9.58 | .22 f | 1.38 | 1.60 | (.21) | (.21) | — e | 10.97 | 16.76 f | 473,589 | 1.22 | 2.11 f | 38.79 |
| October 31, 2004 | 8.06 | .18 | 1.51 | 1.69 | (.17) | (.17) | — | 9.58 | 21.18 | 444,698 | 1.28 | 2.11 | 29.95 |
| Class B | |||||||||||||
| August 31, 2009 ‡ | $10.64 | .23 | .33 | .56 | (.21) | (.21) | — e | $10.99 | 5.44 * | $14,064 | 1.64 * | 2.30 * | 76.94* |
| October 31, 2008 | 16.19 | .21 | (5.61) | (5.40) | (.15) | (.15) | — e | 10.64 | (33.61) | 23,825 | 1.93 | 1.45 | 28.33 |
| October 31, 2007 | 12.75 | .11 | 3.41 | 3.52 | (.08) | (.08) | — e | 16.19 | 27.71 | 51,537 | 1.93 | .79 | 41.51 |
| October 31, 2006 | 10.91 | .13 g | 1.85 | 1.98 | (.14) | (.14) | — e | 12.75 | 18.31 | 62,195 | 1.97 g | 1.18 g | 64.90 |
| October 31, 2005 | 9.53 | .14 f | 1.37 | 1.51 | (.13) | (.13) | — e | 10.91 | 15.86 f | 81,553 | 1.97 | 1.37 f | 38.79 |
| October 31, 2004 | 8.02 | .12 | 1.49 | 1.61 | (.10) | (.10) | — | 9.53 | 20.21 | 92,191 | 2.03 | 1.37 | 29.95 |
| Class C | |||||||||||||
| August 31, 2009 ‡ | $10.62 | .23 | .32 | .55 | (.21) | (.21) | — e | $10.96 | 5.39 * | $4,043 | 1.64 * | 2.34 * | 76.94 * |
| October 31, 2008 | 16.17 | .22 | (5.61) | (5.39) | (.16) | (.16) | — e | 10.62 | (33.61) | 4,473 | 1.93 | 1.50 | 28.33 |
| October 31, 2007 | 12.74 | .11 | 3.41 | 3.52 | (.09) | (.09) | — e | 16.17 | 27.74 | 6,247 | 1.93 | .74 | 41.51 |
| October 31, 2006 | 10.91 | .13 g | 1.84 | 1.97 | (.14) | (.14) | — e | 12.74 | 18.24 | 4,699 | 1.97 g | 1.15 g | 64.90 |
| October 31, 2005 | 9.53 | .14 f | 1.37 | 1.51 | (.13) | (.13) | — e | 10.91 | 15.91 f | 4,333 | 1.97 | 1.37 f | 38.79 |
| October 31, 2004 | 8.02 | .12 | 1.50 | 1.62 | (.11) | (.11) | — | 9.53 | 20.27 | 3,655 | 2.03 | 1.36 | 29.95 |
| Class M | |||||||||||||
| August 31, 2009 ‡ | $10.67 | .25 | .33 | .58 | (.23) | (.23) | — e | $11.02 | 5.66 * | $2,005 | 1.43 * | 2.53 * | 76.94* |
| October 31, 2008 | 16.25 | .25 | (5.64) | (5.39) | (.19) | (.19) | — e | 10.67 | (33.47) | 2,368 | 1.68 | 1.69 | 28.33 |
| October 31, 2007 | 12.80 | .15 | 3.42 | 3.57 | (.12) | (.12) | — e | 16.25 | 28.05 | 3,946 | 1.68 | 1.01 | 41.51 |
| October 31, 2006 | 10.95 | .16 g | 1.86 | 2.02 | (.17) | (.17) | — e | 12.80 | 18.64 | 3,438 | 1.72 g | 1.42 g | 64.90 |
| October 31, 2005 | 9.57 | .17 f | 1.37 | 1.54 | (.16) | (.16) | — e | 10.95 | 16.11 f | 3,925 | 1.72 | 1.62 f | 38.79 |
| October 31, 2004 | 8.05 | .14 | 1.51 | 1.65 | (.13) | (.13) | — | 9.57 | 20.58 | 3,613 | 1.78 | 1.61 | 29.95 |
| Class R | |||||||||||||
| August 31, 2009 ‡ | $10.66 | .28 | .32 | .60 | (.25) | (.25) | — e | $11.01 | 5.89 * | $1,207 | 1.22 * | 2.78 * | 76.94* |
| October 31, 2008 | 16.24 | .28 | (5.63) | (5.35) | (.23) | (.23) | — e | 10.66 | (33.28) | 1,046 | 1.43 | 1.95 | 28.33 |
| October 31, 2007 | 12.80 | .17 | 3.44 | 3.61 | (.17) | (.17) | — e | 16.24 | 28.35 | 702 | 1.43 | 1.16 | 41.51 |
| October 31, 2006 | 10.96 | .18 g | 1.86 | 2.04 | (.20) | (.20) | — e | 12.80 | 18.88 | 309 | 1.47 g | 1.59 g | 64.90 |
| October 31, 2005 | 9.57 | .20 f | 1.38 | 1.58 | (.19) | (.19) | — e | 10.96 | 16.53 f | 221 | 1.47 | 1.84f | 38.79 |
| October 31, 2004† | 8.20 | .15 | 1.38 | 1.53 | (.16) | (.16) | — | 9.57 | 18.86 * | 95 | 1.41 * | 1.71 * | 29.95 |
| Class Y | |||||||||||||
| August 31, 2009 ‡ | $10.69 | .32 | .32 | .64 | (.29) | (.29) | — e | $11.04 | 6.27 * | $3,902 | .81 * | 3.18 * | 76.94* |
| October 31, 2008 | 16.28 | .36 | (5.65) | (5.29) | (.30) | (.30) | — e | 10.69 | (32.94) | 3,570 | .93 | 2.47 | 28.33 |
| October 31, 2007 | 12.82 | .25 | 3.44 | 3.69 | (.23) | (.23) | — e | 16.28 | 29.03 | 5,526 | .93 | 1.75 | 41.51 |
| October 31, 2006 | 10.97 | .24 g | 1.86 | 2.10 | (.25) | (.25) | — e | 12.82 | 19.51 | 3,723 | .97 g | 2.14 g | 64.90 |
| October 31, 2005†† | 11.59 | .10 | (.72) | (.62) | — | — | — e | 10.97 | (5.35) * | 3,781 | .07 * | .07 * | 38.79 |
* Not annualized.
† For the period December 1, 2003 (commencement of operations) to October 31, 2004.
†† For the period October 4, 2005(commencement of operations) to October 31, 2005.
‡ For the ten months ended August 31, 2009. The fund changed its fiscal year end from October 31 to August 31.
a Per share net investment income (loss) has been determined on the basis of the weighted average number of shares outstanding during the period
b Total return assumes dividend reinvestment and does not reflect the effect of sales charges.
c Includes amounts paid through expense offset and brokerage/service arrangements (Note 2).
d Reflects an involuntary contractual expense limitation in effect during the period. For periods prior to August 31, 2009, certain fund expenses were waived in connection with the fund’s investment in Putnam Prime Money Market Fund. As a result of such limitation and/or waivers, the expenses of each class reflect a reduction of the following amounts (Notes 2 and 6):
| Percentage of average net assets | |
| August 31, 2009 | 0.22% |
| October 31, 2008 | 0.01 |
| October 31, 2007 | <0.01 |
| October 31, 2006 | 0.01 |
| October 31, 2005 | <0.01 |
| October 31, 2004 | <0.01 |
e Amount represents less than $0.01 per share.
f Reflects a non-recurring accrual related to Putnam Management’s settlement with the SEC regarding brokerage allocation practices, which amounted to the following amounts:
| Percentage | ||
| of average | ||
| Per share | net assets | |
| Class A | $0.01 | 0.06% |
| Class B | 0.01 | 0.06 |
| Class C | 0.01 | 0.06 |
| Class M | 0.01 | 0.06 |
| Class R | 0.01 | 0.06 |
g Reflects a non-recurring reimbursement from Putnam Investments relating to the calculation of certain amounts paid by the fund to Putnam in previous years for transfer agent services, which amounted to less than $0.01 per share and 0.01% of average net assets for the period ended October 31, 2006.
The accompanying notes are an integral part of these financial statements.
| 28 | 29 |
Notes to financial statements 8/31/09
Note 1: Significant accounting policies
Putnam Global Utilities Fund (the “fund”), formerly Putnam Utilities Growth and Income Fund, a Massachusetts business trust, is registered under the Investment Company Act of 1940, as amended, as a diversified, open-end management investment company. The fund seeks capital growth and current income primarily through investments in equity securities issued by public utility companies. The fund concentrates its investments in a limited number of sectors and involves more risk than a fund that invests more broadly.
The fund offers class A, class B, class C, class M, class R and class Y shares. Class A and class M shares are sold with a maximum front-end sales charge of 5.75% and 3.50%, respectively, and generally do not pay a contingent deferred sales charge. Class B shares, which convert to class A shares after approximately eight years, do not pay a front-end sales charge and are subject to a contingent deferred sales charge, if those shares are redeemed within six years of purchase. Class C shares have a one-year 1.00% contingent deferred sales charge and do not convert to class A shares. Class R shares, which are offered to qualified employee-benefit plans, are sold at net asset value. The expenses for class A, class B, class C, class M and class R shares may differ based on the distribution fee of each class, which is identified in Note 2. Class Y shares, which are sold at net asset value, are generally subject to the same expenses as class A, class B, class C, class M and class R shares, but do not bear a distribution fee. Class Y shares are generally only available to corporate and institutional clients and clients in other approved programs.
A 1.00% redemption fee may apply on any shares that are redeemed (either by selling or exchanging into another fund) within 90 days of purchase. The redemption fee is accounted for as an addition to paid-in-capital. Prior to January 2, 2009, a 1.00% redemption fee applied on any shares that were redeemed (either by selling or exchanging into another fund) within 7 days of purchase.
Investment income, realized and unrealized gains and losses and expenses of the fund are borne pro-rata based on the relative net assets of each class to the total net assets of the fund, except that each class bears expenses unique to that class (including the distribution fees applicable to such classes). Each class votes as a class only with respect to its own distribution plan or other matters on which a class vote is required by law or determined by the Trustees. If the fund were liquidated, shares of each class would receive their pro-rata share of the net assets of the fund. In addition, the Trustees declare separate dividends on each class of shares.
In the normal course of business, the fund enters into contracts that may include agreements to indemnify another party under given circumstances. The fund’s maximum exposure under these arrangements is unknown, as this would involve future claims that may be, but have not yet been, made against the fund. However, the fund’s management team expects the risk of material loss to be remote.
The following is a summary of significant accounting policies consistently followed by the fund in the preparation of its financial statements. The preparation of financial statements is in conformity with accounting principles generally accepted in the United States of America and requires management to make estimates and assumptions that affect the reported amounts of assets and liabilities in the financial statements and the reported amounts of increases and decreases in net assets from operations during the reporting period. Actual results could differ from those estimates. Subsequent events after the balance sheet date through the date that the financial statements were issued, October 14, 2009, have been evaluated in the preparation of the financial statements.
A) Security valuation Investments for which market quotations are readily available are valued at the last reported sales price on their principal exchange, or official closing price for certain markets. If no sales are reported — as in the case of some securities traded over-the-counter — a security is valued at its last reported bid price. Many securities markets and exchanges outside the U.S. close prior to the close of the New York Stock Exchange and therefore the closing prices for securities in such markets or on such exchanges may not fully reflect events that occur after such close but before the close of the New York Stock Exchange. Accordingly, on certain days, the fund will fair value foreign equity securities taking into account multiple factors, including movements in the U.S. securities markets. The number of days on which fair value prices will be us ed will depend on market activity and it is possible that fair value prices will be used by the fund to a significant extent. At August 31, 2009, fair value pricing was used for certain foreign securities in the portfolio. Securities quoted in foreign currencies, if any, are translated into U.S. dollars at the current exchange rate. To the extent a pricing service or dealer is unable to value a security or provides a valuation which Putnam Investment Management, LLC (“Putnam Management”), the fund’s manager, a wholly-owned subsidiary of Putnam Investments, LLC, does not believe accurately reflects the security’s fair value, the security will be valued at fair value by Putnam Management. Certain investments, including certain restricted and illiquid securities and derivatives, are also valued at fair value following procedures approved by the Trustees. Such valuations and procedures are reviewed periodically by the Trustees. The fair value of securities is generally determined as the amoun t that the fund could reasonably expect to realize from an orderly disposition of such securities over a reasonable period of time. By its nature, a fair value price is a good faith estimate of the value of a security in a current sale and does not reflect an actual market price, which may be different by a material amount.
B) Joint trading account Pursuant to an exemptive order from the Securities and Exchange Commission (the “SEC”), the fund may transfer uninvested cash balances, including cash collateral received under security lending arrangements, into a joint trading account along with the cash of other registered investment companies and certain other accounts managed by Putnam Management. These balances may be invested in issues of short-term investments having maturities of up to 397 days for collateral received under security lending arrangements and up to 90 days for other cash investments.
C) Security transactions and related investment income Security transactions are recorded on the trade date (the date the order to buy or sell is executed). Gains or losses on securities sold are determined on the identified cost basis.
Interest income is recorded on the accrual basis. Dividend income, net of applicable withholding taxes, is recognized on the ex-dividend date except that certain dividends from foreign securities, if any, are recognized as soon as the fund is informed of the ex-dividend date. Non-cash dividends, if any, are recorded at the fair market value of the securities received. Dividends representing a return of capital or capital gains, if any, are reflected as a reduction of cost and/or as a realized gain.
D) Foreign currency translation The accounting records of the fund are maintained in U.S. dollars. The market value of foreign securities, currency holdings, and other assets and liabilities is recorded in the books and records of the fund after translation to U.S. dollars based on the exchange rates on that day. The cost of each security is determined using historical exchange rates. Income and withholding taxes are translated at prevailing exchange rates when earned or incurred. The fund does not isolate that portion of realized or unrealized gains or losses resulting from changes in the foreign exchange rate on investments from fluctuations arising from changes in the market prices of the securities. Such gains and losses are included with the net realized and unrealized gain or loss on investments. Net realized gains and losses on foreign currency transactions represent net realized exchange gains or losse s on closed forward currency contracts, disposition of foreign currencies, currency gains and losses realized between the trade and settlement dates on securities transactions and the difference between the amount of investment income and foreign withholding taxes recorded on the fund’s books and the U.S. dollar equivalent amounts actually received or paid. Net unrealized appreciation and depreciation of assets and
30
liabilities in foreign currencies arise from changes in the value of open forward currency contracts and assets and liabilities other than investments at the period end, resulting from changes in the exchange rate. Investments in foreign securities involve certain risks, including those related to economic instability, unfavorable political developments, and currency fluctuations, not present with domestic investments.
E) Forward currency contracts The fund may buy and sell forward currency contracts, which are agreements between two parties to buy and sell currencies at a set price on a future date. These contracts are used to protect against a decline in value relative to the U.S. dollar of the currencies in which its portfolio securities are denominated or quoted (or an increase in the value of a currency in which securities a fund intends to buy are denominated, when a fund holds cash reserves and short term investments), or for other investment purposes. The U.S. dollar value of forward currency contracts is determined using current forward currency exchange rates supplied by a quotation service. The market value of the contract will fluctuate with changes in currency exchange rates. The contract is marked to market daily and the change in market value is recorded as an unrealized gain or loss. When the contract is clos ed, the fund records a realized gain or loss equal to the difference between the value of the contract at the time it was opened and the value at the time it was closed. The fund could be exposed to risk if the value of the currency changes unfavorably, if the counterparties to the contracts are unable to meet the terms of their contracts or if the fund is unable to enter into a closing position. Risks may exceed amounts recognized on the Statement of assets and liabilities. Forward currency contracts outstanding at period end, if any, are listed after the fund’s portfolio. Outstanding contracts at period end are indicative of the volume of activity during the period.
F) Master agreements The fund is a party to ISDA (International Swap and Derivatives Association, Inc.) Master Agreements (“Master Agreements”) with certain counterparties that govern over the counter derivative and foreign exchange contracts entered into from time to time. The Master Agreements may contain provisions regarding, among other things, the parties’ general obligations, representations, agreements, collateral requirements, events of default and early termination. With respect to certain counterparties, in accordance with the terms of the Master Agreements, collateral posted to the fund is held in a segregated account by the fund’s custodian and with respect to those amounts which can be sold or repledged, are presented in the fund’s portfolio. Collateral pledged by the fund is segregated by the fund’s custodian and identified in the fund’s portfolio. Collateral ca n be in the form of cash or debt securities issued by the U.S. government or related agencies or other securities as agreed to by the fund and the applicable counterparty. Collateral requirements are determined based on the fund’s net position with each counterparty. Termination events applicable to the fund may occur upon a decline in the fund’s net assets below a specified threshold over a certain period of time. Termination events applicable to counterparties may occur upon a decline in the counterparty’s long-term and short-term credit ratings below a specified level. In each case, upon occurrence, the other party may elect to terminate early and cause settlement of all derivative and foreign exchange contracts outstanding, including the payment of any losses and costs resulting from such early termination, as reasonably determined by the terminating party. Any decision by one or more of the fund’s counterparties to elect early termination could impact the fund’s future derivativ e activity.
At August 31, 2009, the fund had a net liability position of $211,048 on derivative contracts subject to the Master Agreements. Collateral posted by the fund totaled $59,898.
G) Securities lending The fund may lend securities, through its agents, to qualified borrowers in order to earn additional income. The loans are collateralized by cash and/or securities in an amount at least equal to the market value of the securities loaned. The market value of securities loaned is determined daily and any additional required collateral is allocated to the fund on the next business day. The risk of borrower default will be borne by the fund’s agents; the fund will bear the risk of loss with respect to the investment of the cash collateral. Income from securities lending is included in investment income on the Statement of operations. At August 31, 2009, the value of securities loaned amounted to $38,651,394. The fund received cash collateral of $39,758,700, which is pooled with collateral of other Putnam funds into 2 issues of short-term investments.
H) Federal taxes It is the policy of the fund to distribute all of its taxable income within the prescribed time and otherwise comply with the provisions of the Internal Revenue Code of 1986, as amended (the “Code”), applicable to regulated investment companies. It is also the intention of the fund to distribute an amount sufficient to avoid imposition of any excise tax under Section 4982 of the Code. The fund is subject to the provisions of FASB Interpretation No. 48, Accounting for Uncertainties in Income Taxes (“FIN 48”). FIN 48 sets forth a minimum threshold for financial statement recognition of the benefit of a tax position taken or expected to be taken in a tax return. The fund did not have any unrecognized tax benefits in the accompanying financial statements. No provision has been made for federal taxes on income, capital gains or unrealized appreciation on securities held nor for excise tax on income and capital gains. Each of the fund’s federal tax returns for the prior three fiscal years remains subject to examination by the Internal Revenue Service and state departments of revenue.
At August 31, 2009 the fund had a capital loss carryover of $42,417,599 available to the extent allowed by the Code to offset future net capital gain, if any. The amounts of the carryovers and the expiration dates are:
| Loss Carryover | Expiration | ||
| $7,016,122 | August 31, 2011 | ||
| 35,401,477 | August 31, 2017 | ||
I) Distributions to shareholders Distributions to shareholders from net investment income are recorded by the fund on the ex-dividend date. Distributions from capital gains, if any, are recorded on the ex-dividend date and paid at least annually. The amount and character of income and gains to be distributed are determined in accordance with income tax regulations, which may differ from generally accepted accounting principles. These differences include temporary and/or permanent differences of losses on wash sale transactions and foreign currency gains and losses. Reclassifications are made to the fund’s capital accounts to reflect income and gains available for distribution (or available capital loss carryovers) under income tax regulations. For the period ended August 31, 2009, the fund reclassified $1,675,389 to increase undistributed net investment income with an increase to accumulated net realized loss of $1,675,389.
The tax basis components of distributable earnings and the federal tax cost as of August 31, 2009 were as follows:
| Unrealized appreciation | $53,778,846 | ||
| Unrealized depreciation | (15,729,843) | ||
| Net unrealized appreciation | 38,049,003 | ||
| Undistributed ordinary income | 5,994,331 | ||
| Capital loss carryforward | (42,417,599) | ||
| Cost for federal income tax purposes | $334,294,760 | ||
| Note 2: Management fee, administrative services and | |||
| other transactions | |||
The fund pays Putnam Management for management and investment advisory services quarterly based on the average net assets of the fund. Such fee is based on the following annual rates: 0.70% of the first $500 million of average net assets, 0.60% of the next $500 million, 0.55% of the next $500 million, 0.50% of the next $5 billion, 0.475% of the next $5 billion, 0.455% of the next $5 billion, 0.44% of the next $5 billion and 0.43% thereafter.
31
Putnam Management has agreed to waive fees and reimburse expenses of the fund through July 31, 2009 to the extent necessary to ensure that the fund’s expenses do not exceed the simple average of the expenses of all front-end load funds viewed by Lipper, Inc. as having the same investment classification or objective as the fund. The expense reimbursement is based on a comparison of the fund’s expenses with the average annualized operating expenses of the funds in its Lipper peer group for each calendar quarter during the fund’s last fiscal year, excluding 12b-1 fees and without giving effect to any expense offset and brokerage/service arrangements that may reduce fund expenses. During the period ended August 31, 2009 and the year ended October 31, 2008, the fund’s expenses were reduced by $697,263 and $64,568, respectively, as a result of this limit.
Effective August 1, 2009 through July 31, 2010, Putnam Management has also contractually agreed to reimburse the fund’s expenses to the extent necessary to limit the cumulative expenses of the fund, exclusive of brokerage, interest, taxes, investment-related expenses, extraordinary expenses and payments under the fund’s investor servicing contract, investment management contract and distribution plans, on a fiscal year-to-date basis (or from August 1, 2009 through the fund’s next fiscal year end, as applicable), to an annual rate of 0.20% of the fund’s average net assets over such fiscal year-to-date period (or since August 1, 2009, as applicable). During the period ended August 31, 2009, the fund’s expenses were not reduced as a result of this limit.
Putnam Management has also contractually agreed, from August 1, 2009 through July 31, 2010, to limit the management fee for the fund to an annual rate of 0.642% of the fund’s average net assets. During the period ended August 31, 2009, the fund’s expenses were reduced by $15,635 as a result of this limit.
Putnam Investments Limited (“PIL”), an affiliate of Putnam Management, is authorized by the Trustees to manage a separate portion of the assets of the fund as determined by Putnam Management from time to time. Putnam Management pays a quarterly sub-management fee to PIL for its services at an annual rate of 0.35% of the average net assets of the portion of the fund managed by PIL.
Effective February 28, 2009, The Putnam Advisory Company, LLC (“PAC”), an affiliate of Putnam Management, is authorized by the Trustees to manage and provide investment recommendations with respect to a portion of the assets of the fund, as designated from time to time by Putnam Management or PIL. Putnam Management or PIL, as applicable, pays a quarterly sub-advisory fee to PAC for its services at the annual rate of 0.35% of the average net assets of the portion of the fund’s assets managed and 0.10% of the average net assets of the portion of the fund’s assets for which PAC provides investment recommendations.
The fund reimburses Putnam Management an allocated amount for the compensation and related expenses of certain officers of the fund and their staff who provide administrative services to the fund. The aggregate amount of all such reimbursements is determined annually by the Trustees.
Custodial functions for the fund’s assets are provided by State Street Bank and Trust Company (“State Street”). Custody fees are based on the fund’s asset level, the number of its security holdings and transaction volumes.
Putnam Investor Services, Inc., an affiliate of Putnam Management, provided investor servicing agent functions to the fund. Prior to December 31, 2008, these services were provided by Putnam Investor Services, a division of Putnam Fiduciary Trust Company (“PFTC”), which is an affiliate of Putnam Management. Putnam Investor Services, Inc. and Putnam Investor Services received fees for investor servicing, subject to certain limitations, based on the fund’s retail asset level, the number of shareholder accounts in the fund and the level of defined contribution plan assets in the fund. The amounts incurred for investor servicing agent functions provided by affiliates of Putnam Management during the period ended August 31, 2009 are included in Investor servicing fees in the Statement of operations.
The fund has entered into expense offset arrangements with PFTC and State Street whereby PFTC’s and State Street’s fees are reduced by credits allowed on cash balances. The fund also reduced expenses through brokerage/service arrangements. For the period ended August 31, 2009 and the year ended October 31, 2008, the fund’s expenses were reduced by $2,227 and $26,264, respectively, under the expense offset arrangements and by $34,722 and $82,139, respectively, under the brokerage/service arrangements.
Each independent Trustee of the fund receives an annual Trustee fee, of which $266, as a quarterly retainer, has been allocated to the fund, and an additional fee for each Trustees meeting attended. Trustees receive additional fees for attendance at certain committee meetings and industry seminars and for certain compliance-related matters. Trustees also are reimbursed for expenses they incur relating to their services as Trustees.
The fund has adopted a Trustee Fee Deferral Plan (the “Deferral Plan”) which allows the Trustees to defer the receipt of all or a portion of Trustees fees payable on or after July 1, 1995. The deferred fees remain invested in certain Putnam funds until distribution in accordance with the Deferral Plan.
The fund has adopted an unfunded noncontributory defined benefit pension plan (the “Pension Plan”) covering all Trustees of the fund who have served as a Trustee for at least five years and were first elected prior to 2004. Benefits under the Pension Plan are equal to 50% of the Trustee’s average annual attendance and retainer fees for the three years ended December 31, 2005. The retirement benefit is payable during a Trustee’s lifetime, beginning the year following retirement, for the number of years of service through December 31, 2006. Pension expense for the fund is included in Trustee compensation and expenses in the Statement of operations. Accrued pension liability is included in Payable for Trustee compensation and expenses in the Statement of assets and liabilities. The Trustees have terminated the Pension Plan with respect to any Trustee first elected after 2003.
The fund has adopted distribution plans (the “Plans”) with respect to its class A, class B, class C, class M and class R shares pursuant to Rule 12b-1 under the Investment Company Act of 1940. The purpose of the Plans is to compensate Putnam Retail Management Limited Partnership, a wholly-owned subsidiary of Putnam Investments, LLC and Putnam Retail Management GP, Inc., for services provided and expenses incurred in distributing shares of the fund. The Plans provide for payments by the fund to Putnam Retail Management Limited Partnership at an annual rate of up to 0.35%, 1.00%, 1.00%, 1.00% and 1.00% of the average net assets attributable to class A, class B, class C, class M and class R shares, respectively. The Trustees have approved payment by the fund at an annual rate of 0.25%, 1.00%, 1.00%, 0.75% and 0.50% of the average net assets attributable to class A, class B, class C, class M and class R shares, respectively.
For the period ended August 31, 2009 Putnam Retail Management Limited Partnership, acting as underwriter, received net commissions of $16,888 and $96 from the sale of class A and class M shares, respectively, and received $14,367 and $180 in contingent deferred sales charges from redemptions of class B and class C shares, respectively. A deferred sales charge of up to 1.00% and 0.65% is assessed on certain redemptions of class A and class M shares, respectively. For the period ended August 31, 2009, Putnam Retail Management Limited Partnership, acting as underwriter, received $1 and no monies on class A and class M redemptions, respectively.
Note 3: Purchases and sales of securities
During the period ended August 31, 2009, cost of purchases and proceeds from sales of investment securities other than short-term investments aggregated $256,171,414 and $311,866,076, respectively. There were no purchases or sales of U.S. government securities.
32
Note 4: Capital shares
At August 31, 2009, there was an unlimited number of shares of beneficial interest authorized. Transactions in capital shares were as follows:
| Ten months ended 8/31/09 | Year ended 10/31/08 | Year ended 10/31/07 | ||||
| Class A | Shares | Amount | Shares | Amount | Shares | Amount |
| Shares sold | 1,624,262 | $16,306,760 | 5,186,848 | $78,073,106 | 5,982,143 | $86,767,209 |
| Shares issued in connection with reinvestment of distributions | 731,905 | 7,387,748 | 596,936 | 8,590,083 | 468,792 | 6,786,835 |
| 2,356,167 | 23,694,508 | 5,783,784 | 86,663,189 | 6,450,935 | 93,554,044 | |
| Shares | ||||||
| repurchased | (7,869,636) | (77,888,615) | (8,882,858) | (125,959,253) | (10,377,765) | (150,341,671) |
| Net decrease | (5,513,469) | $(54,194,107) | (3,099,074) | $(39,296,064) | (3,926,830) | $(56,787,627) |
| Ten months ended 8/31/09 | Year ended 10/31/08 | Year ended 10/31/07 | ||||
| Class B | Shares | Amount | Shares | Amount | Shares | Amount |
| Shares sold | 98,149 | $975,514 | 607,699 | $9,044,292 | 615,862 | $8,869,457 |
| Shares issued in connection with reinvestment of distributions | 32,480 | 328,774 | 23,937 | 343,499 | 20,027 | 286,760 |
| 130,629 | 1,304,288 | 631,636 | 9,387,791 | 635,889 | 9,156,217 | |
| Shares | ||||||
| repurchased | (1,090,244) | (10,701,992) | (1,575,128) | (22,612,380) | (2,331,713) | (33,319,587) |
| Net decrease | (959,615) | $(9,397,704) | (943,492) | $(13,224,589) | (1,695,824) | $(24,163,370) |
| Ten months ended 8/31/09 | Year ended 10/31/08 | Year ended 10/31/07 | ||||
| Class C | Shares | Amount | Shares | Amount | Shares | Amount |
| Shares sold | 37,401 | $380,928 | 221,749 | $3,358,880 | 125,984 | $1,837,921 |
| Shares issued in connection with reinvestment of distributions | 6,727 | 67,685 | 4,059 | 57,831 | 1,995 | 28,709 |
| 44,128 | 448,613 | 225,808 | 3,416,711 | 127,979 | 1,866,630 | |
| Shares | ||||||
| repurchased | (96,606) | (950,368) | (190,876) | (2,393,202) | (110,496) | (1,575,421) |
| Net increase (decrease) | (52,478) | $(501,755) | 34,932 | $1,023,509 | 17,483 | $ 291,209 |
| Ten months ended 8/31/09 | Year ended 10/31/08 | Year ended 10/31/07 | ||||
| Class M | Shares | Amount | Shares | Amount | Shares | Amount |
| Shares sold | 17,608 | $180,434 | 67,398 | $1,013,301 | 36,167 | $ 533,387 |
| Shares issued in connection with reinvestment of distributions | 4,133 | 41,760 | 2,955 | 42,442 | 2,000 | 28,885 |
| 21,741 | 222,194 | 70,353 | 1,055,743 | 38,167 | 562,272 | |
| Shares | ||||||
| repurchased | (61,697) | (609,867) | (91,270) | (1,296,404) | (63,992) | (919,175) |
| Net decrease | (39,956) | $(387,673) | (20,917) | $(240,661) | (25,825) | $ (356,903) |
| Ten months ended 8/31/09 | Year ended 10/31/08 | Year ended 10/31/07 | ||||
| Class R | Shares | Amount | Shares | Amount | Shares | Amount |
| Shares sold | 41,002 | $406,544 | 68,126 | $993,484 | 26,667 | $ 386,848 |
| Shares issued in connection with reinvestment of distributions | 2,115 | 21,244 | 957 | 13,506 | 364 | 5,314 |
| 43,117 | 427,788 | 69,083 | 1,006,990 | 27,031 | 392,162 | |
| Shares | ||||||
| repurchased | (31,606) | (308,572) | (14,137) | (205,974) | (7,933) | (108,592) |
| Net increase | 11,511 | $119,216 | 54,946 | $801,016 | 19,098 | $ 283,570 |
| Ten months ended 8/31/09 | Year ended 10/31/08 | Year ended 10/31/07 | ||||
| Class Y | Shares | Amount | Shares | Amount | Shares | Amount |
| Shares sold | 94,186 | $950,403 | 95,737 | $1,450,906 | 163,689 | $2,388,069 |
| Shares issued in connection with reinvestment of distributions | 9,919 | 99,638 | 7,461 | 107,179 | 5,055 | 73,469 |
| 104,105 | 1,050,041 | 103,198 | 1,558,085 | 168,744 | 2,461,538 | |
| Shares | ||||||
| repurchased | (84,796) | (822,186) | (108,583) | (1,545,946) | (119,723) | (1,736,636) |
| Net increase (decrease) | 19,309 | $227,855 | (5,385) | $12,139 | 49,021 | $ 724,902 |
33
Note 5: Summary of derivative activity
The following is a summary of the market values of derivative instruments as of August 31, 2009:
Market values of derivative instruments as of August 31, 2009
| Asset derivatives | Liability derivatives | |||
| Derivatives not | ||||
| accounted for | Statement of | Statement of | ||
| as hedging | assets and | assets and | ||
| instruments under | liabilities | Market | liabilities | Market |
| Statement 133 | location | value | location | value |
| Foreign exchange | ||||
| contracts | Receivables | $253,649 | Payables | $356,699 |
| Total | $253,649 | $356,699 | ||
The following is a summary of realized and unrealized gains or losses of derivative instruments on the Statement of operations for the period ended August 31, 2009 (see Note 1):
Change in Unrealized Appreciation or (Depreciation) on Derivatives Recognized in Income
| Forward | ||
| Derivatives not accounted for as hedging | currency | |
| instruments under Statement 133 | contracts | Total |
| Foreign exchange contracts | $(103,050) | $(103,050) |
| Total | $(103,050) | $(103,050) |
Amount of Realized Gain or (Loss) on Derivatives Recognized in Income
| Forward | ||
| Derivatives not accounted for as hedging | currency | |
| instruments under Statement 133 | contracts | Total |
| Foreign exchange contracts | $1,664,098 | $1,664,098 |
| Total | $1,664,098 | $1,664,098 |
Note 6: Investment in Putnam Prime Money Market Fund and
Putnam Money Market Liquidity Fund
The fund invested in Putnam Prime Money Market Fund, an open-end management investment company managed by Putnam Management. Investments in Putnam Prime Money Market Fund were valued at its closing net asset value each business day. Management fees paid by the fund were reduced by an amount equal to the management fees paid by Putnam Prime Money Market Fund with respect to assets invested by the fund in Putnam Prime Money Market Fund. For the year ended October 31, 2008, management fees paid were reduced by $5,320 relating to the fund’s investment in Putnam Prime Money Market Fund. Income distributions earned by the fund were recorded as interest income in the Statement of operations and totaled $222,563 for the year ended October 31, 2008. During the year ended October 31, 2008, cost of purchases and proceeds of sales of investments in Putnam Prime Money Market Fund aggregated $141,681,143 and $150,183,225, respectively.
On September 17, 2008, the Trustees of the Putnam Prime Money Market Fund voted to close that fund effective September 17, 2008. On September 24, 2008, the fund received shares of Federated Prime Obligations Fund, an unaffiliated management investment company registered under the Investment Company Act of 1940, in liquidation of its shares of Putnam Prime Money Market Fund.
In April 2009, the fund invested in Putnam Money Market Liquidity Fund, an open-end management investment company managed by Putnam Management. Investments in Putnam Money Market Liquidity Fund are valued at its closing net asset value each business day. Income distributions earned by the fund are recorded as interest income in the Statement of operations and totaled $3,162 for the period ended August 31, 2009. During the period ended August 31, 2009, cost of purchases and proceeds of sales of investments in Putnam Money Market Liquidity Fund aggregated $28,915,382 and $26,045,168, respectively. Management fees charged to Putnam Money Market Liquidity Fund have been waived by Putnam Management.
Note 7: Regulatory matters and litigation
In late 2003 and 2004, Putnam Management settled charges brought by the Securities and Exchange Commission (the “SEC”) and the Massachusetts Securities Division in connection with excessive short-term trading in Putnam funds. Distribution of payments from Putnam Management to certain open-end Putnam funds and their shareholders is expected to be completed in the next several months. These allegations and related matters have served as the general basis for certain lawsuits, including purported class action lawsuits against Putnam Management and, in a limited number of cases, some Putnam funds. Putnam Management believes that these lawsuits will have no material adverse effect on the funds or on Putnam Management’s ability to provide investment management services. In addition, Putnam Management has agreed to bear any costs incurred by the Putnam funds as a result of these matters.
Note 8: Other
At their July 2009 meeting, the Board of Trustees approved a new management contract for the fund, which will be submitted to shareholders for approval at a meeting expected to be held in the fourth quarter of 2009. Under the proposed management contract, management fee breakpoints would be determined by reference to the assets of all of the open-end Putnam Funds, rather than only the assets of the fund.
Note 9: Market and credit risk
In the normal course of business, the fund trades financial instruments and enters into financial transactions where risk of potential loss exists due to changes in the market (market risk) or failure of the contracting party to the transaction to perform (credit risk). The fund may be exposed to additional credit risk that an institution or other entity with which the fund has unsettled or open transactions will default.
34
Federal tax information (unaudited)
For the period, interest and dividends from foreign countries were $7,059,949 or $0.233 per share (for all classes of shares). Taxes paid to foreign countries were $478,320 or $0.016 per share (for all classes of shares).
The fund designated 52.98% of ordinary income distributions as qualifying for the dividends received deduction for corporations.
For its tax period ended August 31, 2009, the fund hereby designates 89.64%, or the maximum amount allowable, of its taxable ordinary income distributions as qualified dividends taxed at the individual net capital gain rates.
For the tax period ended August 31, 2009, pursuant to §871(k) of the Internal Revenue Code, the fund hereby designates $1,556,848 of distributions paid as qualifying to be taxed as interest-related dividends, and $— to be taxed as short-term capital gain dividends for nonresident alien shareholders.
The Form 1099 you receive in January 2010 will show the tax status of all distributions paid to your account in calendar 2009.
35
About the Trustees
Ravi Akhoury
Born 1947, Trustee since 2009
Mr. Akhoury serves as Advisor to New York Life Insurance Company, and previously was a Member of its Executive Management Committee. He is also a Director of Jacob Ballas Capital India (a non-banking finance company focused on private equity advisory services) and is a member of its Compensation Committee. In addition, he serves as a Trustee of American India Foundation and of the Rubin Museum, serving on its Investment Committee.
Previously, Mr. Akhoury was a Director and on the Compensation Committee of MaxIndia/New York Life Insurance Company in India. He was also Vice President and Investment Policy Committee Member of Fischer, Francis, Trees and Watts (a fixed-income portfolio management firm). He has also served on the Board of Bharti Telecom (an Indian telecommunications company), serving as a member of its Audit and Compensation committees, and as a member of the Audit Committee on the Board of Thompson Press (a publishing company). From 1992 to 2007, he was Chairman and CEO of MacKay Shields, a multi-product investment management firm with over $40 billion in assets under management.
Mr. Akhoury graduated from the Indian Institute of Technology and holds an M.S. from State University of New York at Stonybrook.
Jameson A. Baxter
Born 1943, Trustee since 1994,
Vice Chairman since 2005
Ms. Baxter is the President of Baxter Associates, Inc., a private investment firm.
Ms. Baxter serves as a Director of ASHTA Chemicals, Inc., and the Mutual Fund Directors Forum. Until 2007, she was a Director of Banta Corporation (a printing and supply chain management company), Ryerson, Inc. (a metals service corporation), and Advocate Health Care. Until 2004, she was a Director of BoardSource (formerly the National Center for Nonprofit Boards); and until 2002, she was a Director of Intermatic Corporation (a manufacturer of energy control products). She is Chairman Emeritus of the Board of Trustees, Mount Holyoke College, having served as Chairman for five years.
Ms. Baxter has held various positions in investment banking and corporate finance, including Vice President of and Consultant to First Boston Corporation and Vice President and Principal of the Regency Group. She is a graduate of Mount Holyoke College.
Charles B. Curtis
Born 1940, Trustee since 2001
Mr. Curtis is President and Chief Operating Officer of the Nuclear Threat Initiative (a private foundation dealing with national security issues), and serves as Senior Advisor to the United Nations Foundation.
Mr. Curtis is a member of the Council on Foreign Relations and the National Petroleum Council. He also serves as Director of Edison International and Southern California Edison. Until 2006, Mr. Curtis served as a member of the Trustee Advisory Council of the Applied Physics Laboratory, Johns Hopkins University.
From August 1997 to December 1999, Mr. Curtis was a Partner at Hogan & Hartson LLP, an international law firm headquartered in Washington, D.C. Prior to May 1997, Mr. Curtis was Deputy Secretary of Energy and Under Secretary of the U.S. Department of Energy. In addition, he was a founding member of the law firm of Van Ness Feldman. Mr. Curtis served as Chairman of the Federal Energy Regulatory Commission from 1977 to 1981 and has held positions on the staff of the U.S. House of Representatives, the U.S. Treasury Department, and the SEC.
Robert J. Darretta
Born 1946, Trustee since 2007
Mr. Darretta serves as Director of United Health Group, a diversified health-care company.
Until April 2007, Mr. Darretta was Vice Chairman of the Board of Directors of Johnson & Johnson, one of the world’s largest and most broadly based health-care companies. Prior to 2007, he had responsibility for Johnson & Johnson’s finance, investor relations, information technology, and procurement function. He served as Johnson & Johnson Chief Financial Officer for a decade, prior to which he spent two years as Treasurer of the corporation and over ten years leading various Johnson & Johnson operating companies.
Mr. Darretta received a B.S. in Economics from Villanova University.
Myra R. Drucker
Born 1948, Trustee since 2004
Ms. Drucker is Chair of the Board of Trustees of Commonfund (a not-for-profit firm specializing in managing assets for educational endowments and foundations), Vice Chair of the Board of Trustees of Sarah Lawrence College, and a member of the Investment Committee of the Kresge Foundation (a charitable trust). She is also a Director of Interactive Data Corporation (a provider of financial market data and analytics to financial institutions and investors).
Ms. Drucker is an ex-officio member of the New York Stock Exchange (NYSE) Pension Managers Advisory Committee, having served as Chair for seven years. She serves as an advisor to RCM Capital Management (an investment management firm) and to the Employee Benefits Investment Committee of The Boeing Company (an aerospace firm).
From November 2001 until August 2004, Ms. Drucker was Managing Director and a member of the Board of Directors of General Motors Asset Management and Chief Investment Officer of General Motors Trust Bank. From December 1992 to November 2001, Ms. Drucker served as Chief Investment Officer of Xerox Corporation (a document company).
36
Prior to December 1992, Ms. Drucker was Staff Vice President and Director of Trust Investments for International Paper (a paper and packaging company).
Ms. Drucker received a B.A. in Literature and Psychology from Sarah Lawrence College and pursued graduate studies in economics, statistics, and portfolio theory at Temple University.
John A. Hill
Born 1942, Trustee since 1985 and
Chairman since 2000
Mr. Hill is founder and Vice-Chairman of First Reserve Corporation, the leading private equity buyout firm specializing in the worldwide energy industry, with offices in Greenwich, Connecticut; Houston, Texas; London, England; and Shanghai, China. The firm’s investments on behalf of some of the nation’s largest pension and endowment funds are currently concentrated in 31 companies with annual revenues in excess of $13 billion, which employ over 100,000 people in 23 countries.
Mr. Hill is Chairman of the Board of Trustees of the Putnam Mutual Funds, a Director of Devon Energy Corporation and various private companies owned by First Reserve, and serves as a Trustee of Sarah Lawrence College where he serves as Chairman and also chairs the Investment Committee. He is also a member of the Advisory Board of the Millstein Center for Corporate Governance and Performance at the Yale School of Management.
Prior to forming First Reserve in 1983, Mr. Hill served as President of F. Eberstadt and Company, an investment banking and investment management firm. Between 1969 and 1976, Mr. Hill held various senior positions in Washington, D.C. with the federal government, including Deputy Associate Director of the Office of Management and Budget and Deputy Administrator of the Federal Energy Administration during the Ford Administration.
Born and raised in Midland, Texas, Mr. Hill received his B.A. in Economics from Southern Methodist University and pursued graduate studies as a Woodrow Wilson Fellow.
Paul L. Joskow
Born 1947, Trustee since 1997
Dr. Joskow is an economist and President of the Alfred P. Sloan Foundation (a philanthropic institution focused primarily on research and education on issues related to science, technology, and economic performance). He is on leave from his position as the Elizabeth and James Killian Professor of Economics and Management at the Massachusetts Institute of Technology (MIT), where he has been on the faculty since 1972. Dr. Joskow was the Director of the Center for Energy and Environmental Policy Research at MIT from 1999 through 2007.
Dr. Joskow serves as a Trustee of Yale University, as a Director of TransCanada Corporation (an energy company focused on natural gas transmission and power services) and of Exelon Corporation (an energy company focused on power services), and as a member of the Board of Overseers of the Boston Symphony Orchestra. Prior to August 2007, he served as a Director of National Grid (a UK-based holding company with interests in electric and gas transmission and distribution and telecommunications infrastructure). Prior to July 2006, he served as President of the Yale University Council. Prior to February 2005, he served on the board of the Whitehead Institute for Biomedical Research (a non-profit research institution). Prior to February 2002, he was a Director of State Farm Indemnity Company (an automobile insurance company), and prior to March 2000, he was a Director of New England Electric System (a public utility holding company).
Dr. Joskow has published six books and numerous articles on industrial organization, government regulation of industry, and competition policy. He is active in industry restructuring, environmental, energy, competition, and privatization policies —serving as an advisor to governments and corporations worldwide. Dr. Joskow holds a Ph.D. and MPhil from Yale University and a B.A. from Cornell University.
Elizabeth T. Kennan
Born 1938, Trustee since 1992
Dr. Kennan is a Partner of Cambus-Kenneth Farm (thoroughbred horse and cattle breeding). She is President Emeritus of Mount Holyoke College.
Dr. Kennan served as Chairman and is now Lead Director of Northeast Utilities. She is a Trustee of the National Trust for Historic Preservation and of Centre College in Danville, Kentucky. Until 2006, she was a member of The Trustees of Reservations. Prior to 2001, Dr. Kennan served on the oversight committee of the Folger Shakespeare Library. Prior to June 2005, she was a Director of Talbots, Inc., and she has served as Director on a number of other boards, including Bell Atlantic, Chastain Real Estate, Shawmut Bank, Berkshire Life Insurance, and Kentucky Home Life Insurance. Dr. Kennan has also served as President of Five Colleges Incorporated and as a Trustee of the University of Notre Dame, and is active in various educational and civic associations.
As a member of the faculty of Catholic University for twelve years, until 1978, Dr. Kennan directed the post-doctoral program in Patristic and Medieval Studies, taught history, and published numerous articles and two books. Dr. Kennan holds a Ph.D. from the University of Washington in Seattle, an M.A. from Oxford University, and an A.B. from Mount Holyoke College. She holds several honorary doctorates.
Kenneth R. Leibler
Born 1949, Trustee since 2006
Mr. Leibler is a founder and former Chairman of the Boston Options Exchange, an electronic marketplace for the trading of derivative securities.
Mr. Leibler currently serves as a Trustee of Beth Israel Deaconess Hospital in Boston. He is also Lead Director of Ruder Finn Group, a global communications and advertising firm, and a Director of Northeast Utilities, which operates New England’s largest energy delivery system. Prior to December 2006, he served as a Director of the Optimum Funds group.
37
Prior to October 2006, he served as a Director of ISO New England, the organization responsible for the operation of the electric generation system in the New England states. Prior to 2000, Mr. Leibler was a Director of the Investment Company Institute in Washington, D.C.
Prior to January 2005, Mr. Leibler served as Chairman and Chief Executive Officer of the Boston Stock Exchange. Prior to January 2000, he served as President and Chief Executive Officer of Liberty Financial Companies, a publicly traded diversified asset management organization. Prior to June 1990, Mr. Leibler served as President and Chief Operating Officer of the American Stock Exchange (AMEX), and at the time was the youngest person in AMEX history to hold the title of President. Prior to serving as AMEX President, he held the position of Chief Financial Officer, and headed its management and marketing operations.
Mr. Leibler graduated magna cum laude with a degree in Economics from Syracuse University, where he was elected Phi Beta Kappa.
Robert E. Patterson
Born 1945, Trustee since 1984
Mr. Patterson is Senior Partner of Cabot Properties, LP and Chairman of Cabot Properties, Inc. (a private equity firm investing in commercial real estate).
Mr. Patterson serves as Chairman Emeritus and Trustee of the Joslin Diabetes Center. Prior to June 2003, he was a Trustee of Sea Education Association. Prior to December 2001, Mr. Patterson was President and Trustee of Cabot Industrial Trust (a publicly traded real estate investment trust). Prior to February 1998, he was Executive Vice President and Director of Acquisitions of Cabot Partners Limited Partnership (a registered investment adviser involved in institutional real estate investments). Prior to 1990, he served as Executive Vice President of Cabot, Cabot & Forbes Realty Advisors, Inc. (the predecessor company of Cabot Partners).
Mr. Patterson practiced law and held various positions in state government, and was the founding Executive Director of the Massachusetts Industrial Finance Agency. Mr. Patterson is a graduate of Harvard College and Harvard Law School.
George Putnam, III
Born 1951, Trustee since 1984
Mr. Putnam is Chairman of New Generation Research, Inc. (a publisher of financial advisory and other research services), and President of New Generation Advisors, Inc. (a registered investment adviser to private funds). Mr. Putnam founded the New Generation companies in 1986.
Mr. Putnam is a Director of The Boston Family Office, LLC (a registered investment adviser). He is a Trustee of St. Mark’s School, a Trustee of Epiphany School, and a Trustee of the Marine Biological Laboratory in Woods Hole, Massachusetts. Until 2006, he was a Trustee of Shore Country Day School, and until 2002, was a Trustee of the Sea Education Association.
Mr. Putnam previously worked as an attorney with the law firm of Dechert LLP (formerly known as Dechert Price & Rhoads) in Philadelphia. He is a graduate of Harvard College, Harvard Business School, and Harvard Law School.
Robert L. Reynolds*
Born 1952, Trustee since 2008 and President of the Funds since 2009
Mr. Reynolds is President and Chief Executive Officer of Putnam Investments, a member of Putnam Investments’ Executive Board of Directors, and President of the Putnam Funds. He has more than 30 years of investment and financial services experience.
Prior to joining Putnam Investments in 2008, Mr. Reynolds was Vice Chairman and Chief Operating Officer of Fidelity Investments from 2000 to 2007. During this time, he served on the Board of Directors for FMR Corporation, Fidelity Investments Insurance Ltd., Fidelity Investments Canada Ltd., and Fidelity Management Trust Company. He was also a Trustee of the Fidelity Family of Funds. From 1984 to 2000, Mr. Reynolds served in a number of increasingly responsible leadership roles at Fidelity.
Mr. Reynolds serves on several not-for-profit boards, including those of the West Virginia University Foundation, Concord Museum, Dana-Farber Cancer Institute, Lahey Clinic, and Initiative for a Competitive Inner City in Boston. He is a member of the Chief Executives Club of Boston, the National Innovation Initiative, and the Council on Competitiveness.
Mr. Reynolds received a B.S. in Business Administration/Finance from West Virginia University.
W. Thomas Stephens
Born 1942, Trustee since 2009
Mr. Stephens is a Director of TransCanada Pipelines, Ltd. (an energy infrastructure company). From 1997 to 2008, Mr. Stephens served as a Trustee on the Board of the Putnam Funds, which he rejoined as a Trustee in 2009.
Mr. Stephens retired as Chairman and Chief Executive Officer of Boise Cascade, L.L.C. (a paper, forest products, and timberland assets company) in December 2008. Until 2004, Mr. Stephens was a Director of Xcel Energy Incorporated (a public utility company), Qwest Communications, and Norske Canada, Inc. (a paper manufacturer). Until 2003, Mr. Stephens was a Director of Mail-Well, Inc. (a diversified printing company). He served as Chairman of Mail-Well until 2001 and as CEO of MacMillan Bloedel, Ltd. (a forest products company) until 1999. Prior to 1996, Mr. Stephens was Chairman and Chief Executive Officer of Johns Manville Corporation.
He holds B.S. and M.S. degrees from the University of Arkansas.
Richard B. Worley
Born 1945, Trustee since 2004
Mr. Worley is Managing Partner of Permit Capital LLC, an investment management firm.
Mr. Worley serves as a Trustee of the University of Pennsylvania Medical Center, The Robert Wood Johnson Foundation (a philanthropic organization devoted
38
to health-care issues), and the National Constitution Center. He is also a Director of The Colonial Williamsburg Foundation (a historical preservation organization), and the Philadelphia Orchestra Association. Mr. Worley also serves on the Investment committees of Mount Holyoke College and World Wildlife Fund (a wildlife conservation organization).
Prior to joining Permit Capital LLC in 2002, Mr. Worley served as President, Chief Executive Officer, and Chief Investment Officer of Morgan Stanley Dean Witter Investment Management and as a Managing Director of Morgan Stanley, a financial services firm. Mr. Worley also was the Chairman of Miller Anderson & Sherrerd, an investment management firm that was acquired by Morgan Stanley in 1996.
Mr. Worley holds a B.S. from the University of Tennessee and pursued graduate studies in economics at the University of Texas.
The address of each Trustee is One Post Office Square, Boston, MA 02109.
As of August 31, 2009, there were over 100 Putnam funds. All Trustees serve as Trustees of all Putnam funds.
Each Trustee serves for an indefinite term, until his or her resignation, retirement at age 72, death, or removal.
* Trustee who is an “interested person” (as defined in the Investment Company Act of 1940) of the fund, Putnam Management, and/or Putnam Retail Management.
Mr. Reynolds is President and Chief Executive Officer of Putnam Investments, as well as the President of your fund and each of the other Putnam funds.
39
Officers
In addition to Robert L. Reynolds, the other officers of the fund are shown below:
| Charles E. Porter (Born 1938) | James P. Pappas (Born 1953) | Wanda M. McManus (Born 1947) |
| Executive Vice President, Principal | Vice President | Vice President, Senior Associate |
| Executive Officer, Associate Treasurer, | Since 2004 | Treasurer and Assistant Clerk |
| and Compliance Liaison | Managing Director, Putnam Investments | Since 2005 |
| Since 1989 | and Putnam Management. During 2002, | Senior Associate Treasurer/Assistant Clerk |
| Chief Operating Officer, Atalanta/Sosnoff | of Funds | |
| Jonathan S. Horwitz (Born 1955) | Management Corporation | |
| Senior Vice President and Treasurer | Nancy E. Florek (Born 1957) | |
| Since 2004 | Francis J. McNamara, III (Born 1955) | Vice President, Assistant Clerk, |
| Prior to 2004, Managing Director, | Vice President and Chief Legal Officer | Assistant Treasurer and Proxy Manager |
| Putnam Investments | Since 2004 | Since 2005 |
| Senior Managing Director, Putnam | Manager, Mutual Fund Proxy Voting | |
| Steven D. Krichmar (Born 1958) | Investments, Putnam Management and | |
| Vice President and | Putnam Retail Management. Prior to 2004, | |
| Principal Financial Officer | General Counsel, State Street Research & | |
| Since 2002 | Management Company | |
| Senior Managing Director, | ||
| Putnam Investments | Robert R. Leveille (Born 1969) | |
| Vice President and | ||
| Janet C. Smith (Born 1965) | Chief Compliance Officer | |
| Vice President, Principal Accounting | Since 2007 | |
| Officer and Assistant Treasurer | Managing Director, Putnam Investments, | |
| Since 2007 | Putnam Management, and Putnam Retail | |
| Managing Director, Putnam Investments | Management. Prior to 2004, member of | |
| and Putnam Management | Bell Boyd & Lloyd LLC. Prior to 2003, | |
| Vice President and Senior Counsel, | ||
| Susan G. Malloy (Born 1957) | Liberty Funds Group LLC | |
| Vice President and Assistant Treasurer | ||
| Since 2007 | Mark C. Trenchard (Born 1962) | |
| Managing Director, Putnam Investments | Vice President and | |
| BSA Compliance Officer | ||
| Beth S. Mazor (Born 1958) | Since 2002 | |
| Vice President | Managing Director, Putnam Investments | |
| Since 2002 | ||
| Managing Director, Putnam Investments | Judith Cohen (Born 1945) | |
| Vice President, | ||
| Clerk and Assistant Treasurer | ||
| Since 1993 | ||
The address of each Officer is One Post Office Square, Boston, MA 02109.
40
Fund information
Founded over 70 years ago, Putnam Investments was built around the concept that a balance between risk and reward is the hallmark of a well-rounded financial program. We manage over 100 mutual funds across income, value, blend, growth, asset allocation, absolute return, and global sector categories.
| Investment Manager | Trustees | Susan G. Malloy |
| Putnam Investment | John A. Hill, Chairman | Vice President and Assistant Treasurer |
| Management, LLC | Jameson A. Baxter, Vice Chairman | |
| One Post Office Square | Ravi Akhoury | Beth S. Mazor |
| Boston, MA 02109 | Charles B. Curtis | Vice President |
| Robert J. Darretta | ||
| Investment Sub-Manager | Myra R. Drucker | James P. Pappas |
| Putnam Investments Limited | Paul L. Joskow | Vice President |
| 57–59 St James’s Street | Elizabeth T. Kennan | |
| London, England SW1A 1LD | Kenneth R. Leibler | Francis J. McNamara, III |
| Robert E. Patterson | Vice President and Chief Legal Officer | |
| Investment Sub-Advisor | George Putnam, III | |
| The Putnam Advisory | Robert L. Reynolds | Robert R. Leveille |
| Company, LLC | W. Thomas Stephens | Vice President and Chief |
| One Post Office Square | Richard B. Worley | Compliance Officer |
| Boston, MA 02109 | ||
| Officers | Mark C. Trenchard | |
| Marketing Services | Robert L. Reynolds | Vice President and BSA Compliance Officer |
| Putnam Retail Management | President | |
| One Post Office Square | Judith Cohen | |
| Boston, MA 02109 | Charles E. Porter | Vice President, Clerk |
| Executive Vice President, Principal | and Assistant Treasurer | |
| Custodian | Executive Officer, Associate Treasurer | |
| State Street Bank and Trust Company | and Compliance Liaison | Wanda M. McManus |
| Vice President, Senior Associate Treasurer | ||
| Legal Counsel | Jonathan S. Horwitz | and Assistant Clerk |
| Ropes & Gray LLP | Senior Vice President and Treasurer | |
| Nancy E. Florek | ||
| Independent Registered Public | Steven D. Krichmar | Vice President, Assistant Clerk, |
| Accounting Firm | Vice President and Principal | Assistant Treasurer and Proxy Manager |
| PricewaterhouseCoopers LLP | Financial Officer | |
| Janet C. Smith | ||
| Vice President, Principal Accounting | ||
| Officer and Assistant Treasurer | ||
This report is for the information of shareholders of Putnam Global Utilities Fund. It may also be used as sales literature when preceded or accompanied by the current prospectus, the most recent copy of Putnam’s Quarterly Performance Summary, and Putnam’s Quarterly Ranking Summary. For more recent performance, please visit putnam.com. Investors should carefully consider the investment objective, risks, charges, and expenses of a fund, which are described in its prospectus. For this and other information or to request a prospectus, call 1-800-225-1581 toll free. Please read the prospectus carefully before investing. The fund’s Statement of Additional Information contains additional information about the fund’s Trustees and is available without charge upon request by calling 1-800-225-1581.

Item 2. Code of Ethics:
(a) The fund’s principal executive, financial and accounting officers are employees of Putnam Investment Management, LLC, the Fund's investment manager. As such they are subject to a comprehensive Code of Ethics adopted and administered by Putnam Investments which is designed to protect the interests of the firm and its clients. The Fund has adopted a Code of Ethics which incorporates the Code of Ethics of Putnam Investments with respect to all of its officers and Trustees who are employees of Putnam Investment Management, LLC. For this reason, the Fund has not adopted a separate code of ethics governing its principal executive, financial and accounting officers.
(c) In May 2008, the Code of Ethics of Putnam Investment Management, LLC was updated in its entirety to include the amendments adopted in August 2007 as well as a several additional technical, administrative and non-substantive changes. In May of 2009, the Code of Ethics of Putnam Investment Management, LLC was amended to reflect that all employees will now be subject to a 90-day blackout restriction on holding Putnam open-end funds, except for portfolio managers and their supervisors (and each of their immediate family members), who will be subject to a one-year blackout restriction on the funds that they manage or supervise.
Item 3. Audit Committee Financial Expert:
The Funds' Audit and Compliance Committee is comprised solely of Trustees who are "independent" (as such term has been defined by the Securities and Exchange Commission ("SEC") in regulations implementing Section 407 of the Sarbanes-Oxley Act (the "Regulations")). The Trustees believe that each of the members of the Audit and Compliance Committee also possess a combination of knowledge and experience with respect to financial accounting matters, as well as other attributes, that qualify them for service on the Committee. In addition, the Trustees have determined that each of Mr. Patterson, Mr. Leibler, Mr. Hill, Mr. Darretta and Mr. Stephens qualifies as an "audit committee financial expert" (as such term has been defined by the Regulations) based on their review of his pertinent experience and education. The SEC has stated that the designation or identification of a person as an audit committee financial expert pursuant to this Item 3 of Form N-CSR do es not impose on such person any duties, obligations or liability that are greater than the duties, obligations and liability imposed on such person as a member of the Audit and Compliance Committee and the Board of Trustees in the absence of such designation or identification.
Item 4. Principal Accountant Fees and Services:
The following table presents fees billed in each of the last two fiscal years for services rendered to the fund by the fund’s independent auditor:
| Fiscal | Audit- | |||
| year | Audit | Related | Tax | All Other |
| ended | Fees | Fees | Fees | Fees |
| August 31, 2009** | $66,547 | $-- | $8,999 | $783* |
| October 31, 2008 | $76,808 | $-- | $6,412 | $177* |
**The Fund changed its fiscal year end to August 31, 2009.
* Includes fees of $783 and $177 billed by the fund’s independent auditor to the fund for procedures necessitated by regulatory and litigation matters for the fiscal years ended August 31,
2009 and October 31, 2008, respectively. These fees were reimbursed to the fund by Putnam Investment Management, LLC (“Putnam Management”).
For the fiscal years ended August 31, 2009 and October 31, 2008, the fund’s independent auditor billed aggregate non-audit fees in the amounts of $530,666 and $ 84,828 respectively, to the fund, Putnam Management and any entity controlling, controlled by or under common control with Putnam Management that provides ongoing services to the fund.
Audit Fees represent fees billed for the fund's last two fiscal years relating to the audit and review of the financial statements included in annual reports and registration statements, and other services that are normally provided in connection with statutory and regulatory filings or engagements.
Audit-Related Fees represent fees billed in the fund’s last two fiscal years for services traditionally performed by the fund’s auditor, including accounting consultation for proposed transactions or concerning financial accounting and reporting standards and other audit or attest services not required by statute or regulation.
Tax Fees represent fees billed in the fund’s last two fiscal years for tax compliance, tax planning and tax advice services. Tax planning and tax advice services include assistance with tax audits, employee benefit plans and requests for rulings or technical advice from taxing authorities.
All Other Fees represent fees billed for services relating to an analysis of recordkeeping fees and procedures necessitated by regulatory and litigation matters.
Pre-Approval Policies of the Audit and Compliance Committee. The Audit and Compliance Committee of the Putnam funds has determined that, as a matter of policy, all work performed for the funds by the funds’ independent auditors will be pre-approved by the Committee itself and thus will generally not be subject to pre-approval procedures.
The Audit and Compliance Committee also has adopted a policy to pre-approve the engagement by Putnam Management and certain of its affiliates of the funds’ independent auditors, even in circumstances where pre-approval is not required by applicable law. Any such requests by Putnam Management or certain of its affiliates are typically submitted in writing to the Committee and explain, among other things, the nature of the proposed engagement, the estimated fees, and why this work should be performed by that particular audit firm as opposed to another one. In reviewing such requests, the Committee considers, among other things, whether the provision of such services by the audit firm are compatible with the independence of the audit firm.
The following table presents fees billed by the fund’s independent auditor for services required to be approved pursuant to paragraph (c)(7)(ii) of Rule 2-01 of Regulation S-X.
| Fiscal | Audit- | All | Total | |
| year | Related | Tax | Other | Non-Audit |
| ended | Fees | Fees | Fees | Fees |
| August 31, 2009 | $ - | $ 485,847 | $ - | $ - |
| October 31, 2008 | $ - | $ 15,000 | $ - | $ - |
Item 5. Audit Committee of Listed Registrants
Not applicable
Item 6. Schedule of Investments:
The registrant’s schedule of investments in unaffiliated issuers is included in the report to shareholders in Item 1 above.
Item 7. Disclosure of Proxy Voting Policies and Procedures For Closed-End Management Investment Companies:
Not applicable
Item 8. Portfolio Managers of Closed-End Investment Companies
Not Applicable
Item 9. Purchases of Equity Securities by Closed-End Management Investment Companies and Affiliated Purchasers:
Not applicable
Item 10. Submission of Matters to a Vote of Security Holders:
Not applicable
Item 11. Controls and Procedures:
(a) The registrant's principal executive officer and principal financial officer have concluded, based on their evaluation of the effectiveness of the design and operation of the registrant's disclosure controls and procedures as of a date within 90 days of the filing date of this report, that the design and operation of such procedures are generally effective to provide reasonable assurance that information required to be disclosed by the registrant in this report is recorded, processed, summarized and reported within the time periods specified in the Commission's rules and forms.
(b) Changes in internal control over financial reporting: Not applicable
Item 12. Exhibits:
(a)(1) The Code of Ethics of The Putnam Funds, which incorporates the Code of Ethics of Putnam Investments, is filed herewith.
(a)(2) Separate certifications for the principal executive officer and principal financial officer of the registrant as required by Rule 30a-2(a) under the Investment Company Act of 1940, as amended, are filed herewith.
(b) The certifications required by Rule 30a-2(b) under the Investment Company Act of 1940, as amended, are filed herewith.
SIGNATURES
Pursuant to the requirements of the Securities Exchange Act of 1934 and the Investment Company Act of 1940, the registrant has duly caused this report to be signed on its behalf by the undersigned, thereunto duly authorized.
Putnam Global Utilities Fund
By (Signature and Title):
/s/Janet C. Smith
Janet C. Smith
Principal Accounting Officer
Date: October 30, 2009
Pursuant to the requirements of the Securities Exchange Act of 1934 and the Investment Company Act of 1940, this report has been signed below by the following persons on behalf of the registrant and in the capacities and on the dates indicated.
By (Signature and Title):
/s/Charles E. Porter
Charles E. Porter
Principal Executive Officer
Date: October 30, 2009
By (Signature and Title):
/s/Steven D. Krichmar
Steven D. Krichmar
Principal Financial Officer
Date: October 30, 2009