Table of Contents
UNITED STATES
SECURITIES AND EXCHANGE COMMISSION
Washington, D.C. 20549
FORM N-CSR
CERTIFIED SHAREHOLDER REPORT OF
REGISTERED MANAGEMENT INVESTMENT COMPANIES
Investment Company Act file number 811-06174
MFS INSTITUTIONAL TRUST
(Exact name of registrant as specified in charter)
111 Huntington Avenue, Boston, Massachusetts 02199
(Address of principal executive offices) (Zip code)
Christopher R. Bohane
Massachusetts Financial Services Company
111 Huntington Avenue
Boston, Massachusetts 02199
(Name and address of agents for service)
Registrant’s telephone number, including area code: (617) 954-5000
Date of fiscal year end: June 30
Date of reporting period: December 31, 2020
Table of Contents
| ITEM 1. | REPORTS TO STOCKHOLDERS. |
Item 1(a):
Table of Contents
Semiannual Report
December 31, 2020

MFS® Institutional International Equity Fund

IIE-SEM
Table of Contents
MFS® Institutional International Equity Fund
| Contact information | back cover |
The report is prepared for the general information of shareholders.
It is authorized for distribution to prospective investors only when preceded or accompanied by a current prospectus.
NOT FDIC INSURED • MAY LOSE VALUE • NO BANK GUARANTEE
Table of Contents

Dear Shareholders:
Markets experienced dramatic swings this year as the coronavirus pandemic brought the global economy to a standstill for several months early in the year. The speedy
development of vaccines and therapeutics later brightened the economic and market outlook, but a great deal of uncertainty remains as case counts remain high, new variants of the virus are appearing and questions persist over how fast the vaccine can be made widely available. In the United States, political uncertainty eased after former Vice President Joe Biden won the presidential election and the Democrats gained control of a closely divided Senate.
Global central banks have taken aggressive steps to cushion the economic and market fallout related to the virus, and governments are deploying unprecedented levels of fiscal support. Additional U.S. stimulus is anticipated with the Democrats in the White House
and in control of both houses of Congress. The measures already put in place have helped build a supportive environment and are encouraging economic recovery; however, if markets disconnect from fundamentals, they can sow the seeds of instability. As such, dramatic increases in speculative retail trading bear watching.
In the aftermath of the crisis, we could see societal changes as households, businesses, and governments adjust to a new reality, and any such alterations could affect the investment landscape. For investors, events such as the COVID-19 outbreak demonstrate the importance of having a deep understanding of company fundamentals, and we have built our global research platform to do just that.
At MFS®, we put our clients’ assets to work responsibly by carefully navigating the increasing complexity of our global markets and economies. Guided by our long-term philosophy and adhering to our commitment to sustainable investing, we tune out the noise and aim to uncover what we believe are the best, most durable investment opportunities in the market. Our unique global investment platform combines collective expertise, long-term discipline and thoughtful risk management to create sustainable value for investors.
Respectfully,

Michael W. Roberge
Chief Executive Officer
MFS Investment Management
February 16, 2021
The opinions expressed in this letter are subject to change and may not be relied upon for investment advice. No forecasts can be guaranteed.
1
Table of Contents
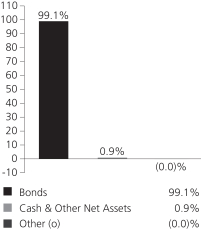
Portfolio structure
| Top ten holdings | ||||
| Nestle S.A. | 3.7% | |||
| Schneider Electric SE | 3.4% | |||
| Roche Holding AG | 3.1% | |||
| AIA Group Ltd. | 3.0% | |||
| L’Air Liquide S.A. | 2.8% | |||
| Hoya Corp. | 2.4% | |||
| Daikin Industries Ltd. | 2.4% | |||
| LVMH Moet Hennessy Louis Vuitton SE | 2.3% | |||
| SAP SE | 2.3% | |||
| Canadian National Railway Co. | 2.0% |
| GICS equity sectors (g) | ||||
| Industrials | 18.2% | |||
| Health Care | 17.6% | |||
| Consumer Staples | 16.7% | |||
| Financials | 13.8% | |||
| Information Technology | 13.2% | |||
| Materials | 8.1% | |||
| Consumer Discretionary | 7.8% | |||
| Energy | 1.6% | |||
| Communication Services | 1.1% | |||
| Utilities | 1.0% | |||
| Issuer country weightings (x) |
| |||
| France | 18.2% | |||
| Japan | 16.5% | |||
| Switzerland | 14.4% | |||
| United Kingdom | 10.3% | |||
| Germany | 9.5% | |||
| Netherlands | 5.1% | |||
| Hong Kong | 3.0% | |||
| India | 2.7% | |||
| Denmark | 2.7% | |||
| Other Countries | 17.6% | |||
| Currency exposure weightings (y) |
| |||
| Euro | 41.2% | |||
| Japanese Yen | 16.5% | |||
| Swiss Franc | 14.4% | |||
| British Pound Sterling | 9.3% | |||
| United States Dollar | 5.0% | |||
| Hong Kong Dollar | 4.0% | |||
| Indian Rupee | 2.7% | |||
| Danish Krone | 2.7% | |||
| Taiwan Dollar | 1.7% | |||
| Other Currencies | 2.5% | |||
2
Table of Contents
Portfolio Composition – continued
| (g) | The Global Industry Classification Standard (GICS®) was developed by and/or is the exclusive property of MSCI, Inc. and S&P Global Market Intelligence Inc. (“S&P Global Market Intelligence”). GICS is a service mark of MSCI and S&P Global Market Intelligence and has been licensed for use by MFS. MFS has applied its own internal sector/industry classification methodology for equity securities and non-equity securities that are unclassified by GICS. |
| (o) | Less than 0.1%. |
| (x) | Represents the portfolio’s exposure to issuer countries as a percentage of a portfolio’s net assets. For purposes of this presentation, United States includes Cash & Cash Equivalents. |
| (y) | Represents the portfolio’s exposure to a particular currency as a percentage of a portfolio’s net assets. For purposes of this presentation, United States Dollar includes Cash & Cash Equivalents. |
Cash & Cash Equivalents includes any cash, investments in money market funds, short-term securities, and other assets less liabilities. Please see the Statement of Assets and Liabilities for additional information related to the fund’s cash position and other assets and liabilities.
Other includes equivalent exposure from currency derivatives and/or any offsets to derivative positions and may be negative.
Percentages are based on net assets as of December 31, 2020.
The portfolio is actively managed and current holdings may be different.
3
Table of Contents
Fund expenses borne by the shareholders during the period,
July 1, 2020 through December 31, 2020
As a shareholder of the fund, you incur ongoing costs, including management fees and other fund expenses. This example is intended to help you understand your ongoing costs (in dollars) of investing in the fund and to compare these costs with the ongoing costs of investing in other mutual funds.
The example is based on an investment of $1,000 invested at the beginning of the period and held for the entire period July 1, 2020 through December 31, 2020.
Actual Expenses
The first line of the following table provides information about actual account values and actual expenses. You may use the information in this line, together with the amount you invested, to estimate the expenses that you paid over the period. Simply divide your account value by $1,000 (for example, an $8,600 account value divided by $1,000 = 8.6), then multiply the result by the number in the first line under the heading entitled “Expenses Paid During Period” to estimate the expenses you paid on your account during this period.
Hypothetical Example for Comparison Purposes
The second line of the following table provides information about hypothetical account values and hypothetical expenses based on the fund’s actual expense ratio and an assumed rate of return of 5% per year before expenses, which is not the fund’s actual return. The hypothetical account values and expenses may not be used to estimate the actual ending account balance or expenses you paid for the period. You may use this information to compare the ongoing costs of investing in the fund and other funds. To do so, compare this 5% hypothetical example with the 5% hypothetical examples that appear in the shareholder reports of the other funds.
Please note that the expenses shown in the table are meant to highlight your ongoing costs only and do not reflect any transactional costs, such as sales charges (loads). Therefore, the second line of the table is useful in comparing ongoing costs only, and will not help you determine the relative total costs of owning different funds. In addition, if these transactional costs were included, your costs would have been higher.
| Annualized Expense Ratio | Beginning Account Value 7/01/20 | Ending Account Value 12/31/20 | Expenses Paid During Period (p) 7/01/20-12/31/20 | |||||
| Actual | 0.68% | $1,000.00 | $1,209.13 | $3.79 | ||||
| Hypothetical (h) | 0.68% | $1,000.00 | $1,021.78 | $3.47 |
| (h) | 5% fund return per year before expenses. |
| (p) | “Expenses Paid During Period” are equal to the fund’s annualized expense ratio, as shown above, multiplied by the average account value over the period, multiplied by 184/365 (to reflect the one-half year period). |
4
Table of Contents
12/31/20 (unaudited)
The Portfolio of Investments is a complete list of all securities owned by your fund. It is categorized by broad-based asset classes.
| Issuer | Shares/Par | Value ($) | ||||||
| Common Stocks – 99.1% | ||||||||
| Aerospace – 1.3% | ||||||||
| MTU Aero Engines Holding AG | 281,783 | $ | 73,460,859 | |||||
| Rolls-Royce Holdings PLC (a) | 57,064,996 | 86,815,476 | ||||||
|
| |||||||
| $ | 160,276,335 | |||||||
| Airlines – 1.2% | ||||||||
| Ryanair Holdings PLC, ADR (a) | 1,283,766 | $ | 141,188,585 | |||||
| Alcoholic Beverages – 4.3% | ||||||||
| Ambev S.A., ADR | 12,680,172 | $ | 38,801,326 | |||||
| Carlsberg Group | 578,733 | 92,636,797 | ||||||
| Diageo PLC | 4,567,123 | 180,497,646 | ||||||
| Pernod Ricard S.A. | 1,059,502 | 202,952,610 | ||||||
|
| |||||||
| $ | 514,888,379 | |||||||
| Apparel Manufacturers – 3.4% | ||||||||
| Compagnie Financiere Richemont S.A. | 1,531,480 | $ | 138,530,349 | |||||
| LVMH Moet Hennessy Louis Vuitton SE | 440,896 | 275,181,266 | ||||||
|
| |||||||
| $ | 413,711,615 | |||||||
| Automotive – 1.3% | ||||||||
| DENSO Corp. | 1,106,700 | $ | 65,744,979 | |||||
| Koito Manufacturing Co. Ltd. | 1,412,400 | 96,024,870 | ||||||
|
| |||||||
| $ | 161,769,849 | |||||||
| Brokerage & Asset Managers – 1.5% | ||||||||
| Deutsche Boerse AG | 1,030,823 | $ | 175,358,211 | |||||
| Business Services – 6.4% | ||||||||
| Capgemini | 1,252,213 | $ | 193,974,332 | |||||
| Compass Group PLC | 6,900,505 | 128,618,686 | ||||||
| Experian PLC | 4,516,255 | 172,091,937 | ||||||
| Randstad Holding N.V. (a) | 1,812,087 | 117,859,310 | ||||||
| Tata Consultancy Services Ltd. | 3,870,175 | 151,631,621 | ||||||
|
| |||||||
| $ | 764,175,886 | |||||||
| Computer Software – 4.2% | ||||||||
| Check Point Software Technologies Ltd. (a) | 1,181,171 | $ | 156,989,438 | |||||
| Dassault Systemes S.A. | 396,358 | 80,451,617 | ||||||
| SAP SE | 2,074,706 | 271,756,016 | ||||||
|
| |||||||
| $ | 509,197,071 | |||||||
5
Table of Contents
Portfolio of Investments (unaudited) – continued
| Issuer | Shares/Par | Value ($) | ||||||
| Common Stocks – continued | ||||||||
| Computer Software – Systems – 3.2% | ||||||||
| Amadeus IT Group S.A. | 2,687,102 | $ | 194,540,113 | |||||
| Hitachi Ltd. | 4,750,900 | 187,036,061 | ||||||
|
| |||||||
| $ | 381,576,174 | |||||||
| Conglomerates – 0.6% | ||||||||
| Smiths Group PLC | 3,618,560 | $ | 74,892,848 | |||||
| Consumer Products – 5.5% | ||||||||
| Beiersdorf AG | 1,640,530 | $ | 189,272,255 | |||||
| Essity AB | 2,907,617 | 93,473,759 | ||||||
| Kose Corp. | 516,600 | 88,055,397 | ||||||
| L’Oréal S.A. | 414,757 | 157,478,597 | ||||||
| Reckitt Benckiser Group PLC | 1,470,211 | 131,527,797 | ||||||
|
| |||||||
| $ | 659,807,805 | |||||||
| Electrical Equipment – 4.4% | ||||||||
| Legrand S.A. | 1,246,705 | $ | 111,181,714 | |||||
| Schneider Electric SE | 2,862,403 | 413,677,905 | ||||||
|
| |||||||
| $ | 524,859,619 | |||||||
| Electronics – 5.2% | ||||||||
| Hoya Corp. | 2,071,300 | $ | 286,256,849 | |||||
| Kyocera Corp. | 2,235,800 | 136,978,072 | ||||||
| Taiwan Semiconductor Manufacturing Co. Ltd., ADR | 1,885,944 | 205,643,334 | ||||||
|
| |||||||
| $ | 628,878,255 | |||||||
| Energy – Integrated – 1.6% | ||||||||
| Eni S.p.A. | 5,856,066 | $ | 61,152,931 | |||||
| Galp Energia SGPS S.A. | 6,952,525 | 74,352,556 | ||||||
| Suncor Energy, Inc. | 3,152,071 | 52,868,816 | ||||||
|
| |||||||
| $ | 188,374,303 | |||||||
| Food & Beverages – 5.0% | ||||||||
| Danone S.A. | 2,325,561 | $ | 152,733,322 | |||||
| Nestle S.A. | 3,779,556 | 445,110,707 | ||||||
|
| |||||||
| $ | 597,844,029 | |||||||
| Food & Drug Stores – 1.2% | ||||||||
| Tesco PLC | 44,627,854 | $ | 140,897,074 | |||||
| Insurance – 4.4% | ||||||||
| AIA Group Ltd. | 28,969,489 | $ | 356,836,528 | |||||
| Zurich Insurance Group AG | 396,153 | 167,905,830 | ||||||
|
| |||||||
| $ | 524,742,358 | |||||||
6
Table of Contents
Portfolio of Investments (unaudited) – continued
| Issuer | Shares/Par | Value ($) | ||||||
| Common Stocks – continued | ||||||||
| Internet – 1.1% | ||||||||
| NetEase, Inc. | 1,589,200 | $ | 30,408,562 | |||||
| Tencent Holdings Ltd. | 1,336,400 | 97,647,041 | ||||||
|
| |||||||
| $ | 128,055,603 | |||||||
| Machinery & Tools – 4.6% | ||||||||
| Daikin Industries Ltd. | 1,274,600 | $ | 282,928,982 | |||||
| Fanuc Ltd. | 148,000 | 36,349,620 | ||||||
| Kubota Corp. | 8,796,900 | 191,775,913 | ||||||
| SMC Corp. | 72,200 | 44,017,142 | ||||||
|
| |||||||
| $ | 555,071,657 | |||||||
| Major Banks – 2.5% | ||||||||
| DBS Group Holdings Ltd. | 6,312,451 | $ | 119,399,266 | |||||
| UBS Group AG | 13,177,713 | 184,309,153 | ||||||
|
| |||||||
| $ | 303,708,419 | |||||||
| Medical & Health Technology & Services – 0.2% | ||||||||
| Alcon, Inc. (a) | 415,547 | $ | 27,741,768 | |||||
| Medical Equipment – 6.8% | ||||||||
| EssilorLuxottica | 876,770 | $ | 136,619,580 | |||||
| Koninklijke Philips N.V. (a) | 3,604,568 | 192,786,129 | ||||||
| Olympus Corp. | 8,620,800 | 188,396,060 | ||||||
| QIAGEN N.V. (a) | 1,824,716 | 94,628,025 | ||||||
| Terumo Corp. | 4,742,600 | 198,054,247 | ||||||
|
| |||||||
| $ | 810,484,041 | |||||||
| Metals & Mining – 1.1% | ||||||||
| Rio Tinto PLC | 1,727,849 | $ | 129,246,994 | |||||
| Natural Gas – Distribution – 1.0% | ||||||||
| ENGIE S.A. (a) | 7,766,384 | $ | 118,787,294 | |||||
| Other Banks & Diversified Financials – 5.5% | ||||||||
| HDFC Bank Ltd. (a) | 2,558,295 | $ | 50,393,180 | |||||
| Housing Development Finance Corp. Ltd. | 3,361,824 | 118,538,663 | ||||||
| ING Groep N.V. (a) | 13,075,713 | 123,871,042 | ||||||
| Intesa Sanpaolo S.p.A. (a) | 46,518,135 | 108,690,916 | ||||||
| Julius Baer Group Ltd. | 1,592,351 | 92,236,028 | ||||||
| KBC Group N.V. (a) | 2,305,237 | 161,311,523 | ||||||
|
| |||||||
| $ | 655,041,352 | |||||||
| Pharmaceuticals – 9.4% | ||||||||
| Bayer AG | 2,723,647 | $ | 160,228,220 | |||||
| Merck KGaA | 1,010,528 | 173,263,695 | ||||||
7
Table of Contents
Portfolio of Investments (unaudited) – continued
| Issuer | Shares/Par | Value ($) | ||||||
| Common Stocks – continued | ||||||||
| Pharmaceuticals – continued | ||||||||
| Novartis AG | 2,077,726 | $ | 196,319,643 | |||||
| Novo Nordisk A.S., “B” | 3,251,598 | 227,708,996 | ||||||
| Roche Holding AG | 1,062,575 | 370,875,042 | ||||||
|
| |||||||
| $ | 1,128,395,596 | |||||||
| Printing & Publishing – 1.6% | ||||||||
| RELX PLC | 2,655,917 | $ | 65,327,347 | |||||
| RELX PLC | 5,397,571 | 132,691,754 | ||||||
|
| |||||||
| $ | 198,019,101 | |||||||
| Railroad & Shipping – 2.0% | ||||||||
| Canadian National Railway Co. | 2,165,455 | $ | 237,875,232 | |||||
| Restaurants – 0.8% | ||||||||
| Yum China Holdings, Inc. | 1,736,390 | $ | 99,130,505 | |||||
| Specialty Chemicals – 7.0% | ||||||||
| Akzo Nobel N.V. | 1,686,431 | $ | 181,011,671 | |||||
| L’Air Liquide S.A. | 2,056,443 | 337,270,047 | ||||||
| Linde PLC | 520,125 | 135,342,481 | ||||||
| Shin-Etsu Chemical Co. Ltd. | 475,800 | 83,128,488 | ||||||
| Sika AG | 399,936 | 109,233,621 | ||||||
|
| |||||||
| $ | 845,986,308 | |||||||
| Tobacco – 0.8% | ||||||||
| Japan Tobacco, Inc. | 4,724,000 | $ | 96,168,205 | |||||
| Total Common Stocks (Identified Cost, $7,421,850,734) |
| $ | 11,896,150,471 | |||||
| Strike Price | First Exercise | |||||||||||||||
| Warrants – 0.0% | ||||||||||||||||
| Apparel Manufacturers – 0.0% | ||||||||||||||||
| Compagnie Financiere Richemont S.A. (1 share for 2 warrants, Expiration 12/04/23) (a)(n) (Identified Cost, $0) | CHF 67.00 | 11/20/23 | 3,062,960 | $ | 795,754 | |||||||||||
| Investment Companies (h) – 0.8% | ||||||||||||||||
| Money Market Funds – 0.8% | ||||||||||||||||
| MFS Institutional Money Market Portfolio, 0.1% (v) (Identified Cost, $91,429,725) |
| 91,429,725 | $ | 91,429,725 | ||||||||||||
| Other Assets, Less Liabilities – 0.1% |
| 9,247,787 | ||||||||||||||
| Net Assets – 100.0% | $ | 11,997,623,737 | ||||||||||||||
8
Table of Contents
Portfolio of Investments (unaudited) – continued
| (a) | Non-income producing security. |
| (h) | An affiliated issuer, which may be considered one in which the fund owns 5% or more of the outstanding voting securities, or a company which is under common control. At period end, the aggregate values of the fund’s investments in affiliated issuers and in unaffiliated issuers were $91,429,725 and $11,896,946,225, respectively. |
| (n) | Securities exempt from registration under Rule 144A of the Securities Act of 1933. These securities may be sold in the ordinary course of business in transactions exempt from registration, normally to qualified institutional buyers. At period end, the aggregate value of these securities was $795,754, representing 0.0% of net assets. |
| (v) | Affiliated issuer that is available only to investment companies managed by MFS. The rate quoted for the MFS Institutional Money Market Portfolio is the annualized seven-day yield of the fund at period end. |
The following abbreviations are used in this report and are defined:
| ADR | American Depositary Receipt |
Abbreviations indicate amounts shown in currencies other than the U.S. dollar. All amounts are stated in U.S. dollars unless otherwise indicated. A list of abbreviations is shown below:
| CHF | Swiss Franc |
See Notes to Financial Statements
9
Table of Contents
Financial Statements
STATEMENT OF ASSETS AND LIABILITIES
At 12/31/20 (unaudited)
This statement represents your fund’s balance sheet, which details the assets and liabilities comprising the total value of the fund.
| Assets | ||||
Investments in unaffiliated issuers, at value (identified cost, $7,421,850,734) | $11,896,946,225 | |||
Investments in affiliated issuers, at value (identified cost, $91,429,725) | 91,429,725 | |||
Receivables for | ||||
Fund shares sold | 10,710,085 | |||
Interest and dividends | 50,001,533 | |||
Other assets | 33,505 | |||
Total assets | $12,049,121,073 | |||
| Liabilities | ||||
Payables for | ||||
Fund shares reacquired | $37,550,789 | |||
Payable to affiliates | ||||
Investment adviser | 426,627 | |||
Administrative services fee | 2,740 | |||
Shareholder servicing costs | 3,889 | |||
Payable for independent Trustees’ compensation | 9,044 | |||
Deferred country tax expense payable | 12,949,120 | |||
Accrued expenses and other liabilities | 555,127 | |||
Total liabilities | $51,497,336 | |||
Net assets | $11,997,623,737 | |||
| Net assets consist of | ||||
Paid-in capital | $7,517,589,621 | |||
Total distributable earnings (loss) | 4,480,034,116 | |||
Net assets | $11,997,623,737 | |||
Shares of beneficial interest outstanding | 391,565,613 | |||
Net asset value per share (net assets of $11,997,623,737 / 391,565,613 shares of beneficial interest outstanding) | $30.64 | |||
See Notes to Financial Statements
10
Table of Contents
Financial Statements
Six months ended 12/31/20 (unaudited)
This statement describes how much your fund earned in investment income and accrued in expenses. It also describes any gains and/or losses generated by fund operations.
| Net investment income (loss) | ||||
Income | ||||
Dividends | $62,422,010 | |||
Income on securities loaned | 74,895 | |||
Dividends from affiliated issuers | 40,045 | |||
Other | 1,273 | |||
Foreign taxes withheld | (6,276,250 | ) | ||
Total investment income | $56,261,973 | |||
Expenses | ||||
Management fee | $36,588,401 | |||
Shareholder servicing costs | 99,499 | |||
Administrative services fee | 277,849 | |||
Independent Trustees’ compensation | 47,662 | |||
Custodian fee | 707,561 | |||
Shareholder communications | 45,696 | |||
Audit and tax fees | 32,086 | |||
Legal fees | 44,216 | |||
Miscellaneous | 150,228 | |||
Total expenses | $37,993,198 | |||
Fees paid indirectly | (699 | ) | ||
Reduction of expenses by investment adviser | (616,254 | ) | ||
Net expenses | $37,376,245 | |||
Net investment income (loss) | $18,885,728 | |||
| Realized and unrealized gain (loss) | ||||
Realized gain (loss) (identified cost basis) | ||||
Unaffiliated issuers (net of $408,194 country tax) | $209,185,599 | |||
Affiliated issuers | (8,211 | ) | ||
Foreign currency | (81,306 | ) | ||
Net realized gain (loss) | $209,096,082 | |||
Change in unrealized appreciation or depreciation | ||||
Unaffiliated issuers (net of $11,392,324 increase in deferred country tax) | $1,869,292,466 | |||
Affiliated issuers | 1 | |||
Translation of assets and liabilities in foreign currencies | 3,086,035 | |||
Net unrealized gain (loss) | $1,872,378,502 | |||
Net realized and unrealized gain (loss) | $2,081,474,584 | |||
Change in net assets from operations | $2,100,360,312 | |||
See Notes to Financial Statements
11
Table of Contents
Financial Statements
STATEMENTS OF CHANGES IN NET ASSETS
These statements describe the increases and/or decreases in net assets resulting from operations, any distributions, and any shareholder transactions.
| Six months ended | Year ended | |||||||
| 12/31/20 | 6/30/20 | |||||||
| (unaudited) | ||||||||
| Change in net assets | ||||||||
| From operations | ||||||||
Net investment income (loss) | $18,885,728 | $125,825,034 | ||||||
Net realized gain (loss) | 209,096,082 | 181,554,545 | ||||||
Net unrealized gain (loss) | 1,872,378,502 | (351,537,105 | ) | |||||
Change in net assets from operations | $2,100,360,312 | $(44,157,526 | ) | |||||
Total distributions to shareholders | $(119,428,669 | ) | $(341,381,556 | ) | ||||
Change in net assets from fund share transactions | $(222,865,134 | ) | $83,835,696 | |||||
Total change in net assets | $1,758,066,509 | $(301,703,386 | ) | |||||
| Net assets | ||||||||
At beginning of period | 10,239,557,228 | 10,541,260,614 | ||||||
At end of period | $11,997,623,737 | $10,239,557,228 | ||||||
See Notes to Financial Statements
12
Table of Contents
Financial Statements
The financial highlights table is intended to help you understand the fund’s financial performance for the semiannual period and the past 5 fiscal years. Certain information reflects financial results for a single fund share. The total returns in the table represent the rate that an investor would have earned (or lost) on an investment in the fund share class (assuming reinvestment of all distributions) held for the entire period.
Six months ended 12/31/20 | Year ended | |||||||||||||||||||||||
| 6/30/20 | 6/30/19 | 6/30/18 | 6/30/17 | 6/30/16 | ||||||||||||||||||||
| (unaudited) | ||||||||||||||||||||||||
Net asset value, beginning of | $25.60 | $26.61 | $25.15 | $23.90 | $19.83 | $22.42 | ||||||||||||||||||
| Income (loss) from investment operations |
| |||||||||||||||||||||||
Net investment income | $0.05 | $0.31 | $0.52 | $0.45 | $0.38 | $0.38 | ||||||||||||||||||
Net realized and unrealized | 5.30 | (0.45 | ) | 1.30 | 1.27 | 4.05 | (2.62 | ) | ||||||||||||||||
Total from investment | $5.35 | $(0.14 | ) | $1.82 | $1.72 | $4.43 | $(2.24 | ) | ||||||||||||||||
| Less distributions declared to shareholders |
| |||||||||||||||||||||||
From net investment income | $(0.24 | ) | $(0.63 | ) | $(0.33 | ) | $(0.47 | ) | $(0.36 | ) | $(0.34 | ) | ||||||||||||
From net realized gain | (0.07 | ) | (0.24 | ) | (0.03 | ) | — | — | (0.01 | ) | ||||||||||||||
Total distributions declared | $(0.31 | ) | $(0.87 | ) | $(0.36 | ) | $(0.47 | ) | $(0.36 | ) | $(0.35 | ) | ||||||||||||
Net asset value, end of | $30.64 | $25.60 | $26.61 | $25.15 | $23.90 | $19.83 | ||||||||||||||||||
Total return (%) (r)(s)(x) | 20.91 | (n) | (0.73 | ) | 7.48 | 7.20 | 22.68 | (10.03 | ) | |||||||||||||||
| Ratios (%) (to average net assets) and Supplemental data: |
| |||||||||||||||||||||||
Expenses before expense | 0.69 | (a) | 0.69 | 0.70 | 0.70 | 0.71 | 0.71 | |||||||||||||||||
Expenses after expense | 0.68 | (a) | 0.68 | 0.69 | 0.69 | 0.70 | 0.70 | |||||||||||||||||
Net investment income | 0.34 | (a)(l) | 1.22 | 2.10 | 1.77 | 1.76 | 1.87 | |||||||||||||||||
Portfolio turnover | 6 | (n) | 13 | 12 | 14 | 17 | 12 | |||||||||||||||||
Net assets at end of period | $11,997,624 | $10,239,557 | $10,541,261 | $10,015,793 | $8,893,966 | $7,401,550 | ||||||||||||||||||
13
Table of Contents
Financial Highlights – continued
| (a) | Annualized. |
| (d) | Per share data is based on average shares outstanding. |
| (f) | Ratios do not reflect reductions from fees paid indirectly, if applicable. |
| (l) | Recognition of net investment income by the fund may be affected by the timing of the declaration of dividends by companies in which the fund invests and the actual annual net investment income ratio may differ. |
| (n) | Not annualized. |
| (r) | Certain expenses have been reduced without which performance would have been lower. |
| (s) | From time to time the fund may receive proceeds from litigation settlements, without which performance would be lower. |
| (x) | The net asset values and total returns have been calculated on net assets which include adjustments made in accordance with U.S. generally accepted accounting principles required at period end for financial reporting purposes. |
See Notes to Financial Statements
14
Table of Contents
(unaudited)
(1) Business and Organization
MFS Institutional International Equity Fund (the fund) is a diversified series of MFS Institutional Trust (the trust). The trust is organized as a Massachusetts business trust and is registered under the Investment Company Act of 1940, as amended, as an open-end management investment company.
The fund is an investment company and accordingly follows the investment company accounting and reporting guidance of the Financial Accounting Standards Board (FASB) Accounting Standards Codification Topic 946 Financial Services – Investment Companies.
(2) Significant Accounting Policies
General – The preparation of financial statements in conformity with U.S. generally accepted accounting principles requires management to make estimates and assumptions that affect the reported amounts of assets and liabilities, and disclosure of contingent assets and liabilities at the date of the financial statements and the reported amounts of increases and decreases in net assets from operations during the reporting period. Actual results could differ from those estimates. In the preparation of these financial statements, management has evaluated subsequent events occurring after the date of the fund’s Statement of Assets and Liabilities through the date that the financial statements were issued. The fund invests in foreign securities. Investments in foreign securities are vulnerable to the effects of changes in the relative values of the local currency and the U.S. dollar and to the effects of changes in each country’s market, economic, industrial, political, regulatory, geopolitical, environmental, public health, and other conditions.
In March 2020, the FASB issued Accounting Standards Update 2020-04, Reference Rate Reform (Topic 848) – Facilitation of the Effects of Reference Rate Reform on Financial Reporting (“ASU 2020-04”), which provides optional, temporary relief with respect to the financial reporting of contracts subject to certain types of modifications due to the planned discontinuation of the London Interbank Offered Rate (LIBOR) and other IBOR-based reference rates as of the end of 2021. The temporary relief provided by ASU 2020-04 is effective for certain reference rate-related contract modifications that occur during the period from March 12, 2020 through December 31, 2022. Management is evaluating the impact of ASU 2020-04 on the fund’s investments, derivatives, debt and other contracts that will undergo reference rate-related modifications as a result of the reference rate reform.
Balance Sheet Offsetting – The fund’s accounting policy with respect to balance sheet offsetting is that, absent an event of default by the counterparty or a termination of the agreement, the International Swaps and Derivatives Association (ISDA) Master Agreement, or similar agreement, does not result in an offset of reported amounts of financial assets and financial liabilities in the Statement of Assets and Liabilities across transactions between the fund and the applicable counterparty. The fund’s right to setoff may be restricted or prohibited by the bankruptcy or insolvency laws of the particular jurisdiction to which a specific master netting agreement counterparty is subject. Balance sheet offsetting disclosures, to the extent applicable to the fund, have
15
Table of Contents
Notes to Financial Statements (unaudited) – continued
been included in the fund’s Significant Accounting Policies note under the captions for each of the fund’s in-scope financial instruments and transactions.
Investment Valuations – Equity securities, including restricted equity securities, are generally valued at the last sale or official closing price on their primary market or exchange as provided by a third-party pricing service. Equity securities, for which there were no sales reported that day, are generally valued at the last quoted daily bid quotation on their primary market or exchange as provided by a third-party pricing service. Short-term instruments with a maturity at issuance of 60 days or less may be valued at amortized cost, which approximates market value. Open-end investment companies are generally valued at net asset value per share. Securities and other assets generally valued on the basis of information from a third-party pricing service may also be valued at a broker/dealer bid quotation. In determining values, third-party pricing services can utilize both transaction data and market information such as yield, quality, coupon rate, maturity, type of issue, trading characteristics, and other market data. The values of foreign securities and other assets and liabilities expressed in foreign currencies are converted to U.S. dollars using the mean of bid and asked prices for rates provided by a third-party pricing service.
The Board of Trustees has delegated primary responsibility for determining or causing to be determined the value of the fund’s investments (including any fair valuation) to the adviser pursuant to valuation policies and procedures approved by the Board. If the adviser determines that reliable market quotations are not readily available, investments are valued at fair value as determined in good faith by the adviser in accordance with such procedures under the oversight of the Board of Trustees. Under the fund’s valuation policies and procedures, market quotations are not considered to be readily available for most types of debt instruments and floating rate loans and many types of derivatives. These investments are generally valued at fair value based on information from third-party pricing services. In addition, investments may be valued at fair value if the adviser determines that an investment’s value has been materially affected by events occurring after the close of the exchange or market on which the investment is principally traded (such as foreign exchange or market) and prior to the determination of the fund’s net asset value, or after the halt of trading of a specific security where trading does not resume prior to the close of the exchange or market on which the security is principally traded. Events that occur after foreign markets close (such as developments in foreign markets and significant movements in the U.S. markets) and prior to the determination of the fund’s net asset value may be deemed to have a material effect on the value of securities traded in foreign markets. Accordingly, the fund’s foreign equity securities may often be valued at fair value. The adviser generally relies on third-party pricing services or other information (such as the correlation with price movements of similar securities in the same or other markets; the type, cost and investment characteristics of the security; the business and financial condition of the issuer; and trading and other market data) to assist in determining whether to fair value and at what value to fair value an investment. The value of an investment for purposes of calculating the fund’s net asset value can differ depending on the source and method used to determine value. When fair valuation is used, the value of an investment used to determine the fund’s net asset value may differ from quoted or published prices for the same investment. There can be no assurance that the fund
16
Table of Contents
Notes to Financial Statements (unaudited) – continued
could obtain the fair value assigned to an investment if it were to sell the investment at the same time at which the fund determines its net asset value per share.
Various inputs are used in determining the value of the fund’s assets or liabilities. These inputs are categorized into three broad levels. In certain cases, the inputs used to measure fair value may fall into different levels of the fair value hierarchy. In such cases, an investment’s level within the fair value hierarchy is based on the lowest level of input that is significant to the fair value measurement. The fund’s assessment of the significance of a particular input to the fair value measurement in its entirety requires judgment, and considers factors specific to the investment. Level 1 includes unadjusted quoted prices in active markets for identical assets or liabilities. Level 2 includes other significant observable market-based inputs (including quoted prices for similar securities, interest rates, prepayment speed, and credit risk). Level 3 includes unobservable inputs, which may include the adviser’s own assumptions in determining the fair value of investments. The following is a summary of the levels used as of December 31, 2020 in valuing the fund’s assets or liabilities:
| Financial Instruments | Level 1 | Level 2 | Level 3 | Total | ||||||||||||
| Equity Securities: | ||||||||||||||||
France | $2,180,308,284 | $— | $— | $2,180,308,284 | ||||||||||||
Japan | 1,980,914,885 | — | — | 1,980,914,885 | ||||||||||||
Switzerland | 1,260,865,116 | 472,192,779 | — | 1,733,057,895 | ||||||||||||
United Kingdom | 476,208,953 | 766,398,606 | — | 1,242,607,559 | ||||||||||||
Germany | 1,137,967,281 | — | — | 1,137,967,281 | ||||||||||||
Netherlands | 491,657,110 | 123,871,042 | — | 615,528,152 | ||||||||||||
Hong Kong | — | 356,836,528 | — | 356,836,528 | ||||||||||||
India | 151,631,621 | 168,931,843 | — | 320,563,464 | ||||||||||||
Denmark | 320,345,793 | — | — | 320,345,793 | ||||||||||||
Other Countries | 1,566,821,402 | 441,994,982 | — | 2,008,816,384 | ||||||||||||
| Mutual Funds | 91,429,725 | — | — | 91,429,725 | ||||||||||||
| Total | $9,658,150,170 | $2,330,225,780 | $— | $11,988,375,950 | ||||||||||||
For further information regarding security characteristics, see the Portfolio of Investments.
Foreign Currency Translation – Purchases and sales of foreign investments, income, and expenses are converted into U.S. dollars based upon currency exchange rates prevailing on the respective dates of such transactions or on the reporting date for foreign denominated receivables and payables. Gains and losses attributable to foreign currency exchange rates on sales of securities are recorded for financial statement purposes as net realized gains and losses on investments. Gains and losses attributable to foreign exchange rate movements on receivables, payables, income and expenses are recorded for financial statement purposes as foreign currency transaction gains and losses. That portion of both realized and unrealized gains and losses on investments that results from fluctuations in foreign currency exchange rates is not separately disclosed.
Security Loans – Under its Securities Lending Agency Agreement with the fund, JPMorgan Chase and Co., as lending agent, loans the securities of the fund to certain qualified institutions (the “Borrowers”) approved by the fund. Security loans can be
17
Table of Contents
Notes to Financial Statements (unaudited) – continued
terminated at the discretion of either the lending agent or the fund and the related securities must be returned within the earlier of the standard trade settlement period for such securities or within three business days. The loans are collateralized by cash and/or U.S. Treasury and federal agency obligations in an amount typically at least equal to the market value of the securities loaned. On loans collateralized by cash, the cash collateral is invested in a money market fund. The market value of the loaned securities is determined at the close of business of the fund and any additional required collateral is delivered to the fund on the next business day. The lending agent provides the fund with indemnification against Borrower default. In the event of Borrower default, the lending agent will, for the benefit of the fund, either purchase securities identical to those loaned or, when such purchase is commercially impracticable, pay the fund the market value of the loaned securities. In return, the lending agent assumes the fund’s rights to the related collateral. If the collateral value is less than the cost to purchase identical securities, the lending agent is responsible for the shortfall, but only to the extent that such shortfall is not due to a decline in collateral value resulting from collateral reinvestment for which the fund bears the risk of loss. A portion of the income generated upon investment of the collateral is remitted to the Borrowers, and the remainder is allocated between the fund and the lending agent. On loans collateralized by U.S. Treasury and/or federal agency obligations, a fee is received from the Borrower, and is allocated between the fund and the lending agent. Income from securities lending is separately reported in the Statement of Operations. The dividend and interest income earned on the securities loaned is accounted for in the same manner as other dividend and interest income. At December 31, 2020, there were no securities on loan or collateral outstanding.
Indemnifications – Under the fund’s organizational documents, its officers and Trustees may be indemnified against certain liabilities and expenses arising out of the performance of their duties to the fund. Additionally, in the normal course of business, the fund enters into agreements with service providers that may contain indemnification clauses. The fund’s maximum exposure under these agreements is unknown as this would involve future claims that may be made against the fund that have not yet occurred.
Investment Transactions and Income – Investment transactions are recorded on the trade date. Interest income is recorded on the accrual basis. Dividends received in cash are recorded on the ex-dividend date. Certain dividends from foreign securities will be recorded when the fund is informed of the dividend if such information is obtained subsequent to the ex-dividend date. Dividend payments received in additional securities are recorded on the ex-dividend date in an amount equal to the value of the security on such date.
The fund may receive proceeds from litigation settlements. Any proceeds received from litigation involving portfolio holdings are reflected in the Statement of Operations in realized gain/loss if the security has been disposed of by the fund or in unrealized gain/loss if the security is still held by the fund. Any other proceeds from litigation not related to portfolio holdings are reflected as other income in the Statement of Operations.
18
Table of Contents
Notes to Financial Statements (unaudited) – continued
Fees Paid Indirectly – The fund’s custody fee may be reduced by a credit earned under an arrangement that measures the value of U.S. dollars deposited with the custodian by the fund. The amount of the credit, for the six months ended December 31, 2020, is shown as a reduction of total expenses in the Statement of Operations.
Tax Matters and Distributions – The fund intends to qualify as a regulated investment company, as defined under Subchapter M of the Internal Revenue Code, and to distribute all of its taxable income, including realized capital gains. As a result, no provision for federal income tax is required. The fund’s federal tax returns, when filed, will remain subject to examination by the Internal Revenue Service for a three year period. Management has analyzed the fund’s tax positions taken on federal and state tax returns for all open tax years and does not believe that there are any uncertain tax positions that require recognition of a tax liability. Foreign taxes, if any, have been accrued by the fund in the accompanying financial statements in accordance with the applicable foreign tax law. Foreign income taxes may be withheld by certain countries in which the fund invests. Additionally, capital gains realized by the fund on securities issued in or by certain foreign countries may be subject to capital gains tax imposed by those countries.
Distributions to shareholders are recorded on the ex-dividend date. Income and capital gain distributions are determined in accordance with income tax regulations, which may differ from U.S. generally accepted accounting principles. Certain capital accounts in the financial statements are periodically adjusted for permanent differences in order to reflect their tax character. These adjustments have no impact on net assets or net asset value per share. Temporary differences which arise from recognizing certain items of income, expense, gain or loss in different periods for financial statement and tax purposes will reverse at some time in the future.
Book/tax differences primarily relate to passive foreign investment companies, wash sale loss deferrals, and redemptions in-kind.
The tax character of distributions made during the current period will be determined at fiscal year end. The tax character of distributions declared to shareholders for the last fiscal year is as follows:
| Year ended 6/30/20 | ||||
| Ordinary income (including any short-term capital gains) | $248,002,169 | |||
| Long-term capital gains | 93,379,387 | |||
| Total distributions | $341,381,556 | |||
19
Table of Contents
Notes to Financial Statements (unaudited) – continued
The federal tax cost and the tax basis components of distributable earnings were as follows:
| As of 12/31/20 | ||||
| Cost of investments | $7,615,785,407 | |||
| Gross appreciation | 4,723,027,468 | |||
| Gross depreciation | (350,436,925 | ) | ||
| Net unrealized appreciation (depreciation) | $4,372,590,543 | |||
| As of 6/30/20 | ||||
| Undistributed ordinary income | 78,282,483 | |||
| Post-October capital loss deferral | (69,316,666 | ) | ||
| Other temporary differences | (346,143 | ) | ||
| Net unrealized appreciation (depreciation) | 2,490,482,799 | |||
The aggregate cost above includes prior fiscal year end tax adjustments, if applicable.
(3) Transactions with Affiliates
Investment Adviser – The fund has an investment advisory agreement with MFS to provide overall investment management and related administrative services and facilities to the fund. The management fee is computed daily and paid monthly at the following annual rates based on the fund’s average daily net assets:
| Up to $1 billion | 0.75 | % | ||
| In excess of $1 billion and up to $2.5 billion | 0.70 | % | ||
| In excess of $2.5 billion and up to $10 billion | 0.65 | % | ||
| In excess of $10 billion and up to $20 billion | 0.60 | % | ||
| In excess of $20 billion | 0.55 | % |
MFS has agreed in writing to reduce its management fee by a specified amount if certain MFS mutual fund assets exceed thresholds agreed to by MFS and the fund’s Board of Trustees. For the six months ended December 31, 2020, this management fee reduction amounted to $616,254, which is included in the reduction of total expenses in the Statement of Operations. The management fee incurred for the six months ended December 31, 2020 was equivalent to an annual effective rate of 0.65% of the fund’s average daily net assets.
The investment adviser has agreed in writing to pay a portion of the fund’s total annual operating expenses, excluding interest, taxes, extraordinary expenses, brokerage and transaction costs, and investment-related expenses, such that total fund operating expenses do not exceed 0.75% annually of the fund’s average daily net assets. This written agreement will continue until modified by the fund’s Board of Trustees, but such agreement will continue at least until October 31, 2021. For the six months ended December 31, 2020, the fund’s actual operating expenses did not exceed the limit and therefore, the investment adviser did not pay any portion of the fund’s expenses related to this agreement.
Shareholder Servicing Agent – MFS Service Center, Inc. (MFSC), a wholly-owned subsidiary of MFS, receives a fee from the fund, for its services as shareholder servicing agent. For the six months ended December 31, 2020, the fee was $92,379, which equated to 0.0017% annually of the fund’s average daily net assets. MFSC also
20
Table of Contents
Notes to Financial Statements (unaudited) – continued
receives reimbursement from the fund for out-of-pocket expenses paid by MFSC on behalf of the fund. For the six months ended December 31, 2020, these costs amounted to $7,120.
Administrator – MFS provides certain financial, legal, shareholder communications, compliance, and other administrative services to the fund. Under an administrative services agreement, the fund reimburses MFS the costs incurred to provide these services. The fund is charged an annual fixed amount of $17,500 plus a fee based on average daily net assets. The administrative services fee incurred for the six months ended December 31, 2020 was equivalent to an annual effective rate of 0.0050% of the fund’s average daily net assets.
Trustees’ and Officers’ Compensation – The fund pays compensation to independent Trustees in the form of a retainer, attendance fees, and additional compensation to Board and Committee chairpersons. The fund does not pay compensation directly to Trustees or officers of the fund who are also officers of the investment adviser, all of whom receive remuneration from MFS for their services to the fund. Certain officers and Trustees of the fund are officers or directors of MFS, MFD, and MFSC.
Other – The fund invests in the MFS Institutional Money Market Portfolio which is managed by MFS and seeks current income consistent with preservation of capital and liquidity. This money market fund does not pay a management fee to MFS but does incur investment and operating costs.
The fund is permitted to engage in purchase and sale transactions with funds and accounts for which MFS serves as investment adviser or sub-adviser (“cross-trades”) pursuant to a policy adopted by the Board of Trustees. This policy has been designed to ensure that cross-trades conducted by the fund comply with Rule 17a-7 under the Investment Company Act of 1940. During the six months ended December 31, 2020, the fund engaged in purchase and sale transactions pursuant to this policy, which amounted to $203,150 and $2,313,210, respectively. The sales transactions resulted in net realized gains (losses) of $152,965.
(4) Portfolio Securities
For the six months ended December 31, 2020, purchases and sales of investments, other than in-kind transactions and short-term obligations, aggregated $609,636,308 and $723,807,050, respectively.
(5) Shares of Beneficial Interest
The fund’s Declaration of Trust permits the Trustees to issue an unlimited number of full and fractional shares of beneficial interest. Transactions in fund shares were as follows:
| Six months ended 12/31/20 | Year ended 6/30/20 | |||||||||||||||
| Shares | Amount | Shares | Amount | |||||||||||||
| Shares sold | 37,630,902 | $1,052,207,742 | 92,717,578 | $2,332,431,240 | ||||||||||||
| Shares issued to shareholders in reinvestment of distributions | 3,759,579 | 112,561,795 | 11,822,277 | 321,920,593 | ||||||||||||
| Shares reacquired | (49,865,002 | ) | (1,387,634,671 | ) | (100,580,612 | ) | (2,570,516,137 | ) | ||||||||
| Net change | (8,474,521 | ) | $(222,865,134 | ) | 3,959,243 | $83,835,696 | ||||||||||
21
Table of Contents
Notes to Financial Statements (unaudited) – continued
The fund is one of several mutual funds in which certain MFS funds may invest. The MFS funds do not invest in the underlying funds for the purpose of exercising management or control. At the end of the period, the MFS Managed Wealth Fund was the owner of record of less than 1% of the value of outstanding voting shares of the fund.
(6) Line of Credit
The fund and certain other funds managed by MFS participate in a $1.25 billion unsecured committed line of credit of which $1 billion is reserved for use by the fund and certain other U.S. funds. The line of credit is provided by a syndicate of banks under a credit agreement. Borrowings may be made for temporary financing needs. Interest is charged to each fund, based on its borrowings, generally at a rate equal to the highest of one month LIBOR, the Federal Funds Effective Rate and the Overnight Bank Funding Rate, plus an agreed upon spread. A commitment fee, based on the average daily, unused portion of the committed line of credit, is allocated among the participating funds. In addition, the fund and other funds managed by MFS have established unsecured uncommitted borrowing arrangements with certain banks for temporary financing needs. Interest is charged to each fund, based on its borrowings, at rates equal to customary reference rates plus an agreed upon spread. For the six months ended December 31, 2020, the fund’s commitment fee and interest expense were $25,175 and $0, respectively, and are included in “Miscellaneous” expense in the Statement of Operations.
(7) Investments in Affiliated Issuers
An affiliated issuer may be considered one in which the fund owns 5% or more of the outstanding voting securities, or a company which is under common control. For the purposes of this report, the following were affiliated issuers:
| Affiliated Issuers | Beginning Value | Purchases | Sales Proceeds | Realized Gain (Loss) | Change in Unrealized Appreciation or Depreciation | Ending Value | ||||||||||||||||||
| MFS Institutional Money Market Portfolio | $37,287,276 | $929,353,598 | $875,202,939 | $(8,211 | ) | $1 | $91,429,725 | |||||||||||||||||
| Affiliated Issuers | Dividend Income | Capital Gain Distributions | ||||||||||||||||||||||
| MFS Institutional Money Market Portfolio |
| $40,045 | $— | |||||||||||||||||||||
(8) Redemptions In-Kind
On October 16, 2020, the fund recorded a redemption in-kind of portfolio securities and cash that was valued at $119,038,709. The redeeming shareholder generally receives a pro rata share of the securities held by the fund. The distribution of such securities generated a realized gain of $56,891,897 for the fund, which is included in Net realized gain (loss) in the Statement of Operations. For tax purposes, no gains or losses were recognized with respect to the portfolio securities redeemed in-kind.
22
Table of Contents
Notes to Financial Statements (unaudited) – continued
(9) Impacts of COVID-19
The pandemic related to the global spread of novel coronavirus disease (COVID-19), which was first detected in December 2019, has resulted in significant disruptions to global business activity and the global economy, as well as the economies of individual countries, the financial performance of individual companies and sectors, and the securities and commodities markets in general. This pandemic, the full effects of which are still unknown, has resulted in substantial market volatility and may have adversely impacted the prices and liquidity of the fund’s investments and the fund’s performance.
23
Table of Contents
BOARD REVIEW OF INVESTMENT ADVISORY AGREEMENT
MFS Institutional International Equity Fund
The Investment Company Act of 1940 requires that both the full Board of Trustees and a majority of the non-interested (“independent”) Trustees, voting separately, annually approve the continuation of the Fund’s investment advisory agreement with MFS. The Trustees consider matters bearing on the Fund and its advisory arrangements at their meetings throughout the year, including a review of performance data at each regular meeting. In addition, the independent Trustees met several times by videoconference (in accordance with Securities and Exchange Commission relief) over the course of three months beginning in May and ending in July, 2020 (“contract review meetings”) for the specific purpose of considering whether to approve the continuation of the investment advisory agreement for the Fund and the other investment companies that the Board oversees (the “MFS Funds”). The independent Trustees were assisted in their evaluation of the Fund’s investment advisory agreement by independent legal counsel, from whom they received separate legal advice and with whom they met separately from MFS during various contract review meetings. The independent Trustees were also assisted in this process by an independent consultant who was retained by and reported to the independent Trustees.
In connection with their deliberations regarding the continuation of the investment advisory agreement, the Trustees, including the independent Trustees, considered such information and factors as they believed, in light of the legal advice furnished to them and their own business judgment, to be relevant. The investment advisory agreement for the Fund was considered separately, although the Trustees also took into account the common interests of all MFS Funds in their review. As described below, the Trustees considered the nature, quality, and extent of the various investment advisory, administrative, and shareholder services performed by MFS under the existing investment advisory agreement and other arrangements with the Fund.
In connection with their contract review meetings, the Trustees received and relied upon materials that included, among other items: (i) information provided by Broadridge Financial Solutions, Inc. (“Broadridge”), an independent third party, on the investment performance of the Fund for various time periods ended December 31, 2019 and the investment performance of a group of funds with substantially similar investment classifications/objectives (the “Broadridge performance universe”), (ii) information provided by Broadridge on the Fund’s advisory fees and other expenses and the advisory fees and other expenses of comparable funds identified by Broadridge as well as all other funds in the same investment classification/category (the “Broadridge expense group and universe”), (iii) information provided by MFS on the advisory fees of portfolios of other clients of MFS, including institutional separate accounts and other clients, (iv) information as to whether and to what extent applicable expense waivers, reimbursements or fee “breakpoints” are observed for the Fund, (v) information regarding MFS’ financial results and financial condition, including MFS’ and certain of its affiliates’ estimated profitability from services performed for the Fund and the MFS Funds as a whole, and compared to MFS’ institutional business, (vi) MFS’ views regarding the outlook for the mutual fund industry and the strategic business plans of MFS, (vii) descriptions of various functions performed by MFS for the Funds, such as
24
Table of Contents
Board Review of Investment Advisory Agreement – continued
compliance monitoring and portfolio trading practices, and (viii) information regarding the overall organization of MFS, including information about MFS’ senior management and other personnel providing investment advisory, administrative and other services to the Fund and the other MFS Funds. The comparative performance, fee and expense information prepared and provided by Broadridge was not independently verified and the independent Trustees did not independently verify any information provided to them by MFS.
The Trustees’ conclusion as to the continuation of the investment advisory agreement was based on a comprehensive consideration of all information provided to the Trustees and not the result of any single factor. Some of the factors that figured particularly in the Trustees’ deliberations are described below, although individual Trustees may have evaluated the information presented differently from one another, giving different weights to various factors. It is also important to recognize that the fee arrangements for the Fund and other MFS Funds are the result of years of review and discussion between the independent Trustees and MFS, that certain aspects of such arrangements may receive greater scrutiny in some years than in others, and that the Trustees’ conclusions may be based, in part, on their consideration of these same arrangements during the course of the year and in prior years.
Based on information provided by Broadridge and MFS, the Trustees reviewed the Fund’s total return investment performance as well as the Broadridge performance universe over various time periods. The Trustees placed particular emphasis on the Fund’s total return performance in comparison to the performance of funds in its Broadridge performance universe over the five-year period ended December 31, 2019, which the Trustees believed was a long enough period to reflect differing market conditions. The total return performance of the Fund’s shares was in the 1st quintile relative to the other funds in the universe for this five-year period (the 1st quintile being the best performers and the 5th quintile being the worst performers). The total return performance of the Fund’s shares was in the 2nd quintile for each of the one- and three-year periods ended December 31, 2019 relative to the Broadridge performance universe. Because of the passage of time, these performance results may differ from the performance results for more recent periods, including those shown elsewhere in this report.
In the course of their deliberations, the Trustees took into account information provided by MFS in connection with the contract review meetings, as well as during investment review meetings conducted with portfolio management personnel during the course of the year regarding the Fund’s performance. After reviewing these and related factors, the Trustees concluded, within the context of their overall conclusions regarding the investment advisory agreement, that they were satisfied with MFS’ responses and efforts relating to investment performance.
In assessing the reasonableness of the Fund’s advisory fee, the Trustees considered, among other information, the Fund’s advisory fee and the total expense ratio of the Fund’s shares as a percentage of average daily net assets and the advisory fee and total expense ratios of the Broadridge expense group based on information provided by Broadridge. The Trustees considered that MFS currently observes an expense limitation for the Fund, which may not be changed without the Trustees’ approval. The Trustees also considered that, according to the data provided by Broadridge (which takes into
25
Table of Contents
Board Review of Investment Advisory Agreement – continued
account any fee reductions or expense limitations that were in effect during the Fund’s last fiscal year), the Fund’s effective advisory fee rate and total expense ratio were each lower than the Broadridge expense group median.
The Trustees also considered the advisory fees charged by MFS to any institutional separate accounts advised by MFS (“separate accounts”) and unaffiliated investment companies for which MFS serves as subadviser (“subadvised funds”) that have comparable investment strategies to the Fund, if any. In comparing these fees, the Trustees considered information provided by MFS as to the generally broader scope of services provided by MFS to the Fund, as well as the more extensive regulatory burdens imposed on MFS in managing the Fund, in comparison to separate accounts and subadvised funds. The Trustees also considered the higher demands placed on MFS’ investment personnel and trading infrastructure as a result of the daily cash in-flows and out-flows of the Fund in comparison to separate accounts.
The Trustees also considered whether the Fund may benefit from any economies of scale in the management of the Fund in the event of growth in assets of the Fund and/or growth in assets of the MFS Funds as a whole. They noted that the Fund’s advisory fee rate schedule is subject to contractual breakpoints that reduce the Fund’s advisory fee rate on average daily net assets over $1 billion, $2.5 billion, $10 billion, and $20 billion. The Trustees also noted that MFS has agreed in writing to waive a portion of the management fees of certain MFS Funds, including the Fund, if the total combined assets of certain funds within the MFS Funds’ complex increase above agreed upon thresholds (the “group fee waiver”), enabling the Fund’s shareholders to share in the benefits from any economies of scale at the complex level. The group fee waiver is reviewed and renewed annually between the Board and MFS. The Trustees concluded that the breakpoints and the group fee waiver were sufficient to allow the Fund to benefit from economies of scale as its assets and overall complex assets grow.
The Trustees also considered information prepared by MFS relating to MFS’ costs and profits with respect to the Fund, the MFS Funds considered as a group, and other investment companies and accounts advised by MFS, as well as MFS’ methodologies used to determine and allocate its costs to the MFS Funds, the Fund and other accounts and products for purposes of estimating profitability.
After reviewing these and other factors described herein, the Trustees concluded, within the context of their overall conclusions regarding the investment advisory agreement, that the advisory fees charged to the Fund represent reasonable compensation in light of the services being provided by MFS to the Fund.
In addition, the Trustees considered MFS’ resources and related efforts to continue to retain, attract and motivate capable personnel to serve the Fund. The Trustees also considered current and developing conditions in the financial services industry, including the presence of large and well-capitalized companies which are spending, and appear to be prepared to continue to spend, substantial sums to engage personnel and to provide services to competing investment companies. In this regard, the Trustees also considered the financial resources of MFS and its ultimate parent, Sun Life Financial Inc. The Trustees also considered the advantages and possible disadvantages to the Fund of having an adviser that also serves other investment companies as well as other accounts.
26
Table of Contents
Board Review of Investment Advisory Agreement – continued
The Trustees also considered the nature, quality, cost, and extent of administrative, transfer agency, and distribution services provided to the Fund by MFS and its affiliates under agreements and plans other than the investment advisory agreement. The Trustees also considered the nature, extent and quality of certain other services MFS performs or arranges for on the Fund’s behalf, which may include securities lending programs, directed expense payment programs, class action recovery programs, and MFS’ interaction with third-party service providers, principally custodians and sub-custodians. The Trustees concluded that the various non-advisory services provided by MFS and its affiliates on behalf of the Fund were satisfactory.
The Trustees considered so-called “fall-out benefits” to MFS such as reputational value derived from serving as investment manager to the MFS Funds. The Trustees also considered that MFS discontinued its historic practice of obtaining investment research from portfolio brokerage commissions paid by certain MFS Funds effective January 2018, and directly pays or voluntarily reimburses a Fund, if applicable, for the costs of external research acquired through the use of the Fund’s portfolio brokerage commissions.
Based on their evaluation of factors that they deemed to be material, including those factors described above, the Board of Trustees, including the independent Trustees, concluded that the Fund’s investment advisory agreement with MFS should be continued for an additional one-year period, commencing August 1, 2020.
27
Table of Contents
PROXY VOTING POLICIES AND INFORMATION
MFS votes proxies on behalf of the fund pursuant to proxy voting policies and procedures that are available without charge, upon request, by calling 1-800-225-2606, by visiting mfs.com/proxyvoting, or by visiting the SEC Web site at http://www.sec.gov.
Information regarding how the fund voted proxies relating to portfolio securities during the most recent twelve-month period ended June 30 is available by August 31 of each year without charge by visiting mfs.com/proxyvoting, or by visiting the SEC’s Web site at http://www.sec.gov.
QUARTERLY PORTFOLIO DISCLOSURE
The fund files a complete schedule of portfolio holdings with the SEC for the first and third quarters of each fiscal year as an exhibit to its reports on Form N-PORT. The fund’s Form N-PORT reports are available on the SEC’s Web site at http://www.sec.gov. A shareholder can obtain the portfolio holdings report for the first and third quarters of the fund’s fiscal year at mfs.com/iie (after scrolling to the “Resources” section and clicking on the “Prospectus and Reports” tab).
From time to time, MFS may post important information about the fund or the MFS funds on the MFS Web site (mfs.com). This information is available at https://www.mfs.com/announcements or at mfs.com/iie and then scrolling to the “Resources” section and clicking on the “Announcements” tab, if any.
INFORMATION ABOUT FUND CONTRACTS AND LEGAL CLAIMS
The fund has entered into contractual arrangements with an investment adviser, administrator, distributor, shareholder servicing agent, 529 program manager (if applicable), and custodian who each provide services to the fund. Unless expressly stated otherwise, shareholders are not parties to, or intended beneficiaries of these contractual arrangements, and these contractual arrangements are not intended to create any shareholder right to enforce them against the service providers or to seek any remedy under them against the service providers, either directly or on behalf of the fund.
Under the Trust’s By-Laws and Declaration of Trust, any claims asserted against or on behalf of the MFS Funds, including claims against Trustees and Officers, must be brought in state and federal courts located within the Commonwealth of Massachusetts.
28
Table of Contents
WEBSITE
mfs.com
CALL
1-800-637-2262
WRITE
MFS Investment Management®
111 Huntington Avenue
Boston, MA 02199-7618
Table of Contents
| Item 1(b): |
Not applicable.
Table of Contents
| ITEM 2. | CODE OF ETHICS. |
During the period covered by this report, the Registrant has not amended any provision in its Code of Ethics (the “Code”) that relates to an element of the Code’s definition enumerated in paragraph (b) of Item 2 of this Form N-CSR. During the period covered by this report, the Registrant did not grant a waiver, including an implicit waiver, from any provision of the Code.
| ITEM 3. | AUDIT COMMITTEE FINANCIAL EXPERT. |
Not applicable for semi-annual reports.
| ITEM 4. | PRINCIPAL ACCOUNTANT FEES AND SERVICES. |
Not applicable for semi-annual reports.
| ITEM 5. | AUDIT COMMITTEE OF LISTED REGISTRANTS. |
Not applicable to the Registrant.
| ITEM 6. | INVESTMENTS |
A schedule of investments of MFS Institutional International Equity Fund is included as part of the report to shareholders of such series under Item 1(a) of this Form N-CSR.
| ITEM 7. | DISCLOSURE OF PROXY VOTING POLICIES AND PROCEDURES FOR CLOSED-END MANAGEMENT INVESTMENT COMPANIES. |
Not applicable to the Registrant.
| ITEM 8. | PORTFOLIO MANAGERS OF CLOSED-END MANAGEMENT INVESTMENT COMPANIES. |
Not applicable to the Registrant.
| ITEM 9. | PURCHASES OF EQUITY SECURITIES BY CLOSED-END MANAGEMENT INVESTMENT COMPANY AND AFFILIATED PURCHASERS. |
Not applicable to the Registrant.
| ITEM 10. | SUBMISSION OF MATTERS TO A VOTE OF SECURITY HOLDERS. |
There were no material changes to the procedures by which shareholders may send recommendations to the Board for nominees to the Registrant’s Board since the Registrant last provided disclosure as to such procedures in response to the requirements of Item 407 (c)(2)(iv) of Regulation S-K or this Item.
Table of Contents
| ITEM 11. | CONTROLS AND PROCEDURES. |
| (a) | Based upon their evaluation of the effectiveness of the registrant’s disclosure controls and procedures (as defined in Rule 30a-3(c) under the Investment Company Act of 1940 (the “Act”)) as conducted within 90 days of the filing date of this report on Form N-CSR, the registrant’s principal financial officer and principal executive officer have concluded that those disclosure controls and procedures provide reasonable assurance that the material information required to be disclosed by the registrant on this report is recorded, processed, summarized and reported within the time periods specified in the Securities and Exchange Commission’s rules and forms. |
| (b) | There were no changes in the registrant’s internal controls over financial reporting (as defined in Rule 30a-3(d) under the Act) that occurred during the period covered by the report that have materially affected, or are reasonably likely to materially affect, the registrant’s internal control over financial reporting. |
| ITEM 12. | DISCLOSURE OF SECURITIES LENDING ACTIVITIES FOR CLOSED-END MANAGEMENT INVESTMENT COMPANIES. |
Not applicable to the Registrant.
| ITEM 13. | EXHIBITS. |
| (a) (1) | Any code of ethics, or amendment thereto, that is the subject of the disclosure required by Item 2, to the extent that the registrant intends to satisfy the Item 2 requirements through filing of an exhibit: Not applicable. |
| (2) | A separate certification for each principal executive officer and principal financial officer of the registrant as required by Rule 30a-2(a) under the Act (17 CFR 270.30a-2): Attached hereto as EX-99.302CERT. |
| (3) | Any written solicitation to purchase securities under Rule 23c-1 under the Act (17 CFR 270.23c-1) sent or given during the period covered by the report by or on behalf of the registrant to 10 or more persons. Not applicable. |
| (4) | Change in the registrant’s independent public accountant. Not applicable. |
| (b) | If the report is filed under Section 13(a) or 15(d) of the Exchange Act, provide the certifications required by Rule 30a-2(b) under the Act (17 CFR 270.30a-2(b)), Rule 13a-14(b) or Rule 15d-14(b) under the Exchange Act (17 CFR 240.13a-14(b) or 240.15d-14(b)) and Section 1350 of Chapter 63 of Title 18 of the United States Code (18 U.S.C. 1350) as an exhibit. A certification furnished pursuant to this paragraph will not be deemed “filed” for the purposes of Section 18 of the Exchange Act (15 U.S.C. 78r), or otherwise subject to the liability of that section. Such certification will not be deemed to be incorporated by reference into any filing under the Securities Act of 1933 or the Exchange Act, except to the extent that the registrant specifically incorporates it by reference. Attached hereto as EX-99.906CERT. |
Table of Contents
Notice
A copy of the Amended and Restated Declaration of Trust, as amended, of the Registrant is on file with the Secretary of State of The Commonwealth of Massachusetts and notice is hereby given that this instrument is executed on behalf of the Registrant by an officer of the Registrant as an officer and not individually and the obligations of or arising out of this instrument are not binding upon any of the Trustees or shareholders individually, but are binding only upon the assets and property of the respective constituent series of the Registrant.
Table of Contents
SIGNATURES
Pursuant to the requirements of the Securities Exchange Act of 1934 and the Investment Company Act of 1940, the registrant has duly caused this report to be signed on its behalf by the undersigned, thereunto duly authorized.
(Registrant) MFS INSTITUTIONAL TRUST
| By (Signature and Title)* | /S/ DAVID L. DILORENZO | |
| David L. DiLorenzo, President |
Date: February 16, 2021
Pursuant to the requirements of the Securities Exchange Act of 1934 and the Investment Company Act of 1940, this report has been signed below by the following persons on behalf of the registrant and in the capacities and on the dates indicated.
| By (Signature and Title)* | /S/ DAVID L. DILORENZO | |
| David L. DiLorenzo, President (Principal Executive Officer) |
Date: February 16, 2021
| By (Signature and Title)* | /S/ JAMES O. YOST | |
| James O. Yost, Treasurer (Principal Financial Officer and Accounting Officer) |
Date: February 16, 2021
| * | Print name and title of each signing officer under his or her signature. |