UNITED STATES
SECURITIES AND EXCHANGE COMMISSION
Washington, D.C. 20549
FORM N-CSR
CERTIFIED SHAREHOLDER REPORT OF REGISTERED
MANAGEMENT INVESTMENT COMPANIES
Investment Company Act file number 811-06174
MFS SERIES TRUST XVII*
(Exact name of registrant as specified in charter)
111 Huntington Avenue, Boston, Massachusetts 02199 (Address of principal executive offices) (Zip code)
Christopher R. Bohane
Massachusetts Financial Services Company
111Huntington Avenue Boston, Massachusetts 02199
(Name and address of agents for service)
Registrant's telephone number, including area code: (617) 954-5000
Date of fiscal year end: June 30
Date of reporting period: December 31, 2022
*Prior to October 24, 2022, the Registrant was named MFS Institutional Trust. Effective October 24, 2022, MFS Institutional Trust was renamed MFS Series Trust XVII, and the series of the Registrant to which this Form N-CSR pertains changed its name from MFS Institutional International Equity Fund to MFS International Equity Fund.
ITEM 1. REPORTS TO STOCKHOLDERS.
Item 1(a):


| 1 | |
| 2 | |
| 4 | |
| 6 | |
| 11 | |
| 12 | |
| 13 | |
| 14 | |
| 16 | |
| 25 | |
| 29 | |
| 29 | |
| 29 | |
| 29 |
| back cover |


| Nestle S.A. | 3.6% |
| Roche Holding AG | 3.0% |
| Schneider Electric SE | 2.9% |
| L'Air Liquide S.A. | 2.7% |
| LVMH Moet Hennessy Louis Vuitton SE | 2.5% |
| Novo Nordisk A.S., “B” | 2.5% |
| AIA Group Ltd. | 2.4% |
| UBS AG | 2.1% |
| Hitachi Ltd. | 2.1% |
| Merck KGaA | 2.0% |
| Financials | 18.4% |
| Industrials | 17.5% |
| Health Care | 17.0% |
| Consumer Staples | 13.0% |
| Consumer Discretionary | 10.5% |
| Information Technology | 9.5% |
| Materials | 7.5% |
| Energy | 2.7% |
| Communication Services | 1.6% |
| Utilities | 1.4% |
| France | 18.6% |
| Switzerland | 16.1% |
| Japan | 13.5% |
| United Kingdom | 11.8% |
| Germany | 10.7% |
| Canada | 4.0% |
| Denmark | 3.3% |
| Netherlands | 3.0% |
| Hong Kong | 2.4% |
| Other Countries | 16.6% |
| Euro | 39.4% |
| Swiss Franc | 16.1% |
| Japanese Yen | 13.5% |
| British Pound Sterling | 11.8% |
| United States Dollar | 4.6% |
| Hong Kong Dollar | 4.0% |
| Danish Krone | 3.3% |
| Canadian Dollar | 2.4% |
| Indian Rupee | 2.3% |
| Other Currencies | 2.6% |
| (g) | The Global Industry Classification Standard (GICS®) was developed by and/or is the exclusive property of MSCI, Inc. and S&P Global Market Intelligence Inc. (“S&P Global Market Intelligence”). GICS is a service mark of MSCI and S&P Global Market Intelligence and has been licensed for use by MFS. MFS has applied its own internal sector/industry classification methodology for equity securities and non-equity securities that are unclassified by GICS. |
| (x) | Represents the portfolio’s exposure to issuer countries as a percentage of a portfolio’s net assets. For purposes of this presentation, United States includes Cash & Cash Equivalents. |
| (y) | Represents the portfolio’s exposure to a particular currency as a percentage of a portfolio's net assets. For purposes of this presentation, United States Dollar includes Cash & Cash Equivalents. |
July 1, 2022 through December 31, 2022
| Share Class | Annualized Expense Ratio | Beginning Account Value 7/01/22 | Ending Account Value 12/31/22 | Expenses Paid During Period (p) 7/01/22-12/31/22 | |
| R6 (formerly shares of the fund) (y) | Actual | 0.68% | $1,000.00 | $1,061.86 | $3.53 |
| Hypothetical (h) | 0.68% | $1,000.00 | $1,021.78 | $3.47 |
| (h) | 5% fund return per year before expenses. |
| (p) | “Expenses Paid During Period” are equal to the fund’s annualized expense ratio, as shown above, multiplied by the average account value over the period, multiplied by 184/365 (to reflect the one-half year period). |
| (y) | Prior to October 24, 2022, the fund's shares did not have a share class designation. Effective October 24, 2022, the fund's outstanding shares were designated Class R6 shares. |
| Issuer | Shares/Par | Value ($) | ||
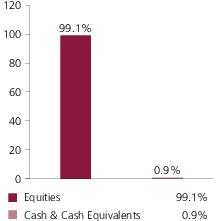
| Common Stocks – 99.1% | ||||
| Aerospace & Defense – 1.1% | ||||
| MTU Aero Engines Holding AG | 309,688 | $67,030,417 | ||
| Rolls-Royce Holdings PLC (a) | 43,851,819 | 49,409,660 | ||
| $116,440,077 | ||||
| Airlines – 1.0% | ||||
| Ryanair Holdings PLC, ADR (a) | 1,469,140 | $109,832,907 | ||
| Alcoholic Beverages – 4.2% | ||||
| Carlsberg Group | 687,485 | $91,363,815 | ||
| Diageo PLC | 3,788,304 | 167,165,261 | ||
| Pernod Ricard S.A. | 933,797 | 183,673,378 | ||
| $442,202,454 | ||||
| Apparel Manufacturers – 4.5% | ||||
| Compagnie Financiere Richemont S.A. | 1,565,738 | $202,615,327 | ||
| LVMH Moet Hennessy Louis Vuitton SE | 363,204 | 263,847,822 | ||
| $466,463,149 | ||||
| Automotive – 2.0% | ||||
| Compagnie Generale des Etablissements Michelin | 2,530,427 | $70,385,455 | ||
| DENSO Corp. | 1,934,400 | 94,827,371 | ||
| Koito Manufacturing Co. Ltd. | 3,235,400 | 48,193,799 | ||
| $213,406,625 | ||||
| Brokerage & Asset Managers – 2.7% | ||||
| Deutsche Boerse AG | 1,130,435 | $195,305,969 | ||
| London Stock Exchange Group PLC | 1,030,731 | 88,921,857 | ||
| $284,227,826 | ||||
| Business Services – 5.2% | ||||
| Compass Group PLC | 9,055,377 | $209,918,277 | ||
| Experian PLC | 5,048,000 | 171,671,192 | ||
| Randstad Holding N.V. | 1,277,691 | 77,904,439 | ||
| Tata Consultancy Services Ltd. | 2,140,015 | 84,242,558 | ||
| $543,736,466 | ||||
| Computer Software – 4.4% | ||||
| Check Point Software Technologies Ltd. (a) | 1,151,968 | $145,332,283 | ||
| Dassault Systemes SE | 1,557,010 | 56,156,821 | ||
| NetEase, Inc. | 4,675,700 | 68,155,541 | ||
| Issuer | Shares/Par | Value ($) | ||
| Common Stocks – continued | ||||
| Computer Software – continued | ||||
| SAP SE | 1,878,999 | $193,876,387 | ||
| $463,521,032 | ||||
| Computer Software - Systems – 6.0% | ||||
| Amadeus IT Group S.A. (a) | 1,426,819 | $73,581,159 | ||
| Capgemini | 1,192,787 | 200,047,002 | ||
| Hitachi Ltd. | 4,358,700 | 219,350,899 | ||
| Sony Group Corp. | 1,787,900 | 136,337,936 | ||
| $629,316,996 | ||||
| Construction – 0.9% | ||||
| Compagnie de Saint-Gobain | 1,912,677 | $93,900,597 | ||
| Consumer Products – 4.3% | ||||
| Beiersdorf AG | 1,683,046 | $193,133,300 | ||
| Kose Corp. (l) | 762,800 | 82,869,116 | ||
| L’Oréal S.A. | 224,723 | 80,617,805 | ||
| Reckitt Benckiser Group PLC | 1,333,362 | 92,752,639 | ||
| $449,372,860 | ||||
| Electrical Equipment – 3.8% | ||||
| Legrand S.A. | 1,129,107 | $90,912,845 | ||
| Schneider Electric SE | 2,196,189 | 308,870,936 | ||
| $399,783,781 | ||||
| Electronics – 3.4% | ||||
| Hoya Corp. | 1,126,900 | $109,092,232 | ||
| Kyocera Corp. | 2,389,600 | 119,297,921 | ||
| Taiwan Semiconductor Manufacturing Co. Ltd., ADR | 1,683,390 | 125,395,721 | ||
| $353,785,874 | ||||
| Energy - Integrated – 2.7% | ||||
| Eni S.p.A. | 8,676,470 | $123,396,746 | ||
| Galp Energia SGPS S.A., “B” | 6,296,675 | 85,203,199 | ||
| Suncor Energy, Inc. | 2,221,378 | 70,463,948 | ||
| $279,063,893 | ||||
| Food & Beverages – 3.6% | ||||
| Nestle S.A. | 3,308,492 | $382,082,797 | ||
| Food & Drug Stores – 0.8% | ||||
| Tesco PLC | 31,908,910 | $86,488,013 | ||
| Issuer | Shares/Par | Value ($) | ||
| Common Stocks – continued | ||||
| Insurance – 5.7% | ||||
| AIA Group Ltd. | 22,994,289 | $253,328,171 | ||
| Intact Financial Corp. | 561,193 | 80,784,437 | ||
| Prudential PLC | 6,598,428 | 89,942,587 | ||
| Zurich Insurance Group AG | 358,787 | 171,455,459 | ||
| $595,510,654 | ||||
| Internet – 1.0% | ||||
| Tencent Holdings Ltd. | 2,441,600 | $103,773,385 | ||
| Machinery & Tools – 3.1% | ||||
| Daikin Industries Ltd. | 992,800 | $152,808,290 | ||
| Kubota Corp. (l) | 5,103,700 | 70,305,180 | ||
| SMC Corp. | 239,600 | 101,470,344 | ||
| $324,583,814 | ||||
| Major Banks – 5.9% | ||||
| DBS Group Holdings Ltd. | 5,717,551 | $144,795,677 | ||
| ING Groep N.V. | 11,432,869 | 139,369,928 | ||
| Toronto-Dominion Bank | 1,642,683 | 106,361,904 | ||
| UBS AG | 12,006,759 | 223,801,002 | ||
| $614,328,511 | ||||
| Medical Equipment – 5.4% | ||||
| EssilorLuxottica | 997,046 | $181,558,286 | ||
| Olympus Corp. | 6,814,400 | 120,449,286 | ||
| QIAGEN N.V. (a) | 2,153,131 | 108,349,546 | ||
| Sonova Holding AG | 203,589 | 48,441,380 | ||
| Terumo Corp. | 3,830,900 | 108,333,432 | ||
| $567,131,930 | ||||
| Metals & Mining – 1.0% | ||||
| Rio Tinto PLC | 1,564,862 | $109,688,879 | ||
| Natural Gas - Distribution – 1.4% | ||||
| ENGIE S.A. | 10,004,626 | $143,378,143 | ||
| Other Banks & Diversified Financials – 4.2% | ||||
| HDFC Bank Ltd. | 2,946,668 | $57,991,267 | ||
| Housing Development Finance Corp. Ltd. | 3,065,020 | 97,592,891 | ||
| Intesa Sanpaolo S.p.A. | 55,531,627 | 123,524,280 | ||
| Julius Baer Group Ltd. | 1,442,148 | 83,826,276 | ||
| KBC Group N.V. | 1,122,587 | 72,078,272 | ||
| $435,012,986 | ||||
| Issuer | Shares/Par | Value ($) | ||
| Common Stocks – continued | ||||
| Pharmaceuticals – 10.5% | ||||
| Bayer AG | 2,953,249 | $152,770,084 | ||
| Merck KGaA | 1,088,365 | 210,755,794 | ||
| Novartis AG | 1,881,733 | 170,449,844 | ||
| Novo Nordisk A.S., “B” | 1,920,402 | 259,304,583 | ||
| Roche Holding AG | 993,166 | 312,025,873 | ||
| $1,105,306,178 | ||||
| Printing & Publishing – 1.6% | ||||
| RELX PLC | 6,043,733 | $167,174,346 | ||
| Railroad & Shipping – 1.5% | ||||
| Canadian National Railway Co. | 1,350,449 | $160,541,377 | ||
| Restaurants – 0.8% | ||||
| Yum China Holdings, Inc. | 1,479,705 | $80,865,878 | ||
| Specialty Chemicals – 6.4% | ||||
| Akzo Nobel N.V. | 1,501,629 | $100,560,119 | ||
| L'Air Liquide S.A. | 1,981,240 | 281,810,308 | ||
| Linde PLC | 452,720 | 148,025,385 | ||
| Shin-Etsu Chemical Co. Ltd. | 431,700 | 52,596,378 | ||
| Sika AG | 368,346 | 88,877,983 | ||
| $671,870,173 | ||||
| Total Common Stocks (Identified Cost, $7,392,196,746) | $10,392,791,601 | |||
| Investment Companies (h) – 0.8% | ||||
| Money Market Funds – 0.8% | ||||
| MFS Institutional Money Market Portfolio, 4.02% (v) (Identified Cost, $80,017,449) | 80,009,411 | $80,033,414 | ||
| Collateral for Securities Loaned – 0.7% | ||||
| JPMorgan U.S. Government Money Market Fund - Class IM Shares, 4.12% (j) (Identified Cost, $73,325,998) | 73,325,998 | $73,325,998 | ||
| Other Assets, Less Liabilities – (0.6)% | (59,195,248) | |||
| Net Assets – 100.0% | $10,486,955,765 | |||
| (a) | Non-income producing security. | |||
| (h) | An affiliated issuer, which may be considered one in which the fund owns 5% or more of the outstanding voting securities, or a company which is under common control. At period end, the aggregate values of the fund's investments in affiliated issuers and in unaffiliated issuers were $80,033,414 and $10,466,117,599, respectively. | |||
| (j) | The rate quoted is the annualized seven-day yield of the fund at period end. | |||
| (l) | A portion of this security is on loan. See Note 2 for additional information. |
| (v) | Affiliated issuer that is available only to investment companies managed by MFS. The rate quoted for the MFS Institutional Money Market Portfolio is the annualized seven-day yield of the fund at period end. |
| The following abbreviations are used in this report and are defined: | |
| ADR | American Depositary Receipt |
| Assets | |
| Investments in unaffiliated issuers, at value, including $70,440,462 of securities on loan (identified cost, $7,465,522,744) | $10,466,117,599 |
| Investments in affiliated issuers, at value (identified cost, $80,017,449) | 80,033,414 |
| Cash | 353,242 |
| Foreign currency, at value (identified cost, $147,407) | 148,965 |
| Receivables for | |
| Fund shares sold | 17,891,912 |
| Interest and dividends | 39,381,334 |
| Other assets | 54,477 |
| Total assets | $10,603,980,943 |
| Liabilities | |
| Payables for | |
| Fund shares reacquired | $29,789,772 |
| Collateral for securities loaned, at value | 73,325,998 |
| Payable to affiliates | |
| Investment adviser | 562,661 |
| Administrative services fee | 4,898 |
| Shareholder servicing costs | 3,837 |
| Deferred country tax expense payable | 12,759,487 |
| Accrued expenses and other liabilities | 578,525 |
| Total liabilities | $117,025,178 |
| Net assets | $10,486,955,765 |
| Net assets consist of | |
| Paid-in capital | $7,545,220,211 |
| Total distributable earnings (loss) | 2,941,735,554 |
| Net assets | $10,486,955,765 |
| Shares of beneficial interest outstanding | 372,706,205 |
| Net assets | Shares outstanding | Net asset value per share | |
| Class R6 (formerly shares of the fund) | $10,486,955,765 | 372,706,205 | $28.14 |
| Net investment income (loss) | |
| Income | |
| Dividends | $65,996,998 |
| Dividends from affiliated issuers | 941,252 |
| Income on securities loaned | 224,506 |
| Other | 5,568 |
| Foreign taxes withheld | (6,397,944) |
| Total investment income | $60,770,380 |
| Expenses | |
| Management fee | $34,241,378 |
| Shareholder servicing costs | 80,530 |
| Administrative services fee | 342,293 |
| Independent Trustees' compensation | 58,437 |
| Custodian fee | 790,952 |
| Shareholder communications | 59,069 |
| Audit and tax fees | 31,829 |
| Legal fees | 24,579 |
| Miscellaneous | 235,773 |
| Total expenses | $35,864,840 |
| Fees paid indirectly | (12,751) |
| Reduction of expenses by investment adviser | (703,699) |
| Net expenses | $35,148,390 |
| Net investment income (loss) | $25,621,990 |
| Realized and unrealized gain (loss) | |
| Realized gain (loss) (identified cost basis) | |
| Unaffiliated issuers (net of $2,231,201 country tax) | $61,293,311 |
| Affiliated issuers | 9,213 |
| Foreign currency | (143,579) |
| Net realized gain (loss) | $61,158,945 |
| Change in unrealized appreciation or depreciation | |
| Unaffiliated issuers (net of $4,963,714 increase in deferred country tax) | $528,438,476 |
| Affiliated issuers | 21,639 |
| Translation of assets and liabilities in foreign currencies | 907,319 |
| Net unrealized gain (loss) | $529,367,434 |
| Net realized and unrealized gain (loss) | $590,526,379 |
| Change in net assets from operations | $616,148,369 |
| Six months ended | Year ended | |
| 12/31/22 (unaudited) | 6/30/22 | |
| Change in net assets | ||
| From operations | ||
| Net investment income (loss) | $25,621,990 | $175,325,811 |
| Net realized gain (loss) | 61,158,945 | 592,284,458 |
| Net unrealized gain (loss) | 529,367,434 | (2,534,837,683) |
| Change in net assets from operations | $616,148,369 | $(1,767,227,414) |
| Total distributions to shareholders | $(132,637,764) | $(669,932,532) |
| Change in net assets from fund share transactions | $(417,056,090) | $285,609,550 |
| Total change in net assets | $66,454,515 | $(2,151,550,396) |
| Net assets | ||
| At beginning of period | 10,420,501,250 | 12,572,051,646 |
| At end of period | $10,486,955,765 | $10,420,501,250 |
| Class R6 (formerly shares of the fund) (y) | Six months ended | Year ended | ||||
| 12/31/22 (unaudited) | 6/30/22 | 6/30/21 | 6/30/20 | 6/30/19 | 6/30/18 | |
| Net asset value, beginning of period | $26.83 | $33.11 | $25.60 | $26.61 | $25.15 | $23.90 |
| Income (loss) from investment operations | ||||||
| Net investment income (loss) (d) | $0.07 | $0.46 | $0.42 | $0.31 | $0.52 | $0.45 |
| Net realized and unrealized gain (loss) | 1.59 | (4.93) | 7.40 | (0.45) | 1.30 | 1.27 |
| Total from investment operations | $1.66 | $(4.47) | $7.82 | $(0.14) | $1.82 | $1.72 |
| Less distributions declared to shareholders | ||||||
| From net investment income | $(0.24) | $(0.69) | $(0.24) | $(0.63) | $(0.33) | $(0.47) |
| From net realized gain | (0.11) | (1.12) | (0.07) | (0.24) | (0.03) | — |
| Total distributions declared to shareholders | $(0.35) | $(1.81) | $(0.31) | $(0.87) | $(0.36) | $(0.47) |
| Net asset value, end of period (x) | $28.14 | $26.83 | $33.11 | $25.60 | $26.61 | $25.15 |
| Total return (%) (r)(s)(x) | 6.19(n) | (14.52) | 30.66 | (0.73) | 7.48 | 7.20 |
| Ratios (%) (to average net assets) and Supplemental data: | ||||||
| Expenses before expense reductions (f) | 0.70(a) | 0.68 | 0.68 | 0.69 | 0.70 | 0.70 |
| Expenses after expense reductions (f) | 0.68(a) | 0.67 | 0.67 | 0.68 | 0.69 | 0.69 |
| Net investment income (loss) | 0.50(a)(l) | 1.44 | 1.40 | 1.22 | 2.10 | 1.77 |
| Portfolio turnover | 7(n) | 12 | 13 | 13 | 12 | 14 |
| Net assets at end of period (000 omitted) | $10,486,956 | $10,420,501 | $12,572,052 | $10,239,557 | $10,541,261 | $10,015,793 |
| (a) | Annualized. |
| (d) | Per share data is based on average shares outstanding. |
| (f) | Ratios do not reflect reductions from fees paid indirectly, if applicable. See Note 2 in the Notes to Financial Statements for additional information. |
| (l) | Recognition of net investment income by the fund may be affected by the timing of the declaration of dividends by companies in which the fund invests and the actual annual net investment income ratio may differ. |
| (n) | Not annualized. |
| (r) | Certain expenses have been reduced without which performance would have been lower. |
| (s) | From time to time the fund may receive proceeds from litigation settlements, without which performance would be lower. |
| (x) | The net asset values and total returns have been calculated on net assets which include adjustments made in accordance with U.S. generally accepted accounting principles required at period end for financial reporting purposes. |
| (y) | Prior to October 24, 2022, the fund's shares did not have a share class designation. Effective October 24, 2022, the fund's outstanding shares were designated Class R6 shares. |
| Financial Instruments | Level 1 | Level 2 | Level 3 | Total |
| Equity Securities: | ||||
| France | $397,436,976 | $1,557,722,422 | $— | $1,955,159,398 |
| Switzerland | 312,025,873 | 1,371,550,068 | — | 1,683,575,941 |
| Japan | 482,668,787 | 933,263,397 | — | 1,415,932,184 |
| United Kingdom | 1,233,132,711 | — | — | 1,233,132,711 |
| Germany | 1,121,221,497 | — | — | 1,121,221,497 |
| Canada | 418,151,666 | — | — | 418,151,666 |
| Denmark | 350,668,398 | — | — | 350,668,398 |
| Netherlands | 317,834,486 | — | — | 317,834,486 |
| Hong Kong | — | 253,328,171 | — | 253,328,171 |
| Other Countries | 1,143,402,702 | 500,384,447 | — | 1,643,787,149 |
| Mutual Funds | 153,359,412 | — | — | 153,359,412 |
| Total | $5,929,902,508 | $4,616,248,505 | $— | $10,546,151,013 |
| Year ended 6/30/22 | |
| Ordinary income (including any short-term capital gains) | $260,775,225 |
| Long-term capital gains | 409,157,307 |
| Total distributions | $669,932,532 |
| As of 12/31/22 | |
| Cost of investments | $7,669,813,528 |
| Gross appreciation | 3,296,789,802 |
| Gross depreciation | (420,452,317) |
| Net unrealized appreciation (depreciation) | $2,876,337,485 |
| As of 6/30/22 | |
| Undistributed ordinary income | 83,765,515 |
| Undistributed long-term capital gain | 41,631,070 |
| Other temporary differences | (2,289,518) |
| Net unrealized appreciation (depreciation) | 2,335,117,882 |
| Up to $1 billion | 0.75% |
| In excess of $1 billion and up to $2.5 billion | 0.70% |
| In excess of $2.5 billion and up to $10 billion | 0.65% |
| In excess of $10 billion and up to $20 billion | 0.60% |
| In excess of $20 billion | 0.55% |
| Six months ended 12/31/22 | Year ended 6/30/22 | ||||
| Shares | Amount | Shares | Amount | ||
| Shares sold | |||||
| Class R6 (formerly shares of the fund) | 44,669,305 | $1,206,717,367 | 100,208,599 | $3,189,502,544 | |
| Shares issued to shareholders in reinvestment of distributions | |||||
| Class R6 (formerly shares of the fund) | 4,231,693 | $120,941,799 | 19,058,332 | $627,400,299 | |
| Shares reacquired | |||||
| Class R6 (formerly shares of the fund) | (64,547,286) | $(1,744,715,256) | (110,654,702) | $(3,531,293,293) | |
| Net change | |||||
| Class R6 (formerly shares of the fund) | (15,646,288) | $(417,056,090) | 8,612,229 | $285,609,550 | |
| Affiliated Issuers | Beginning Value | Purchases | Sales Proceeds | Realized Gain (Loss) | Change in Unrealized Appreciation or Depreciation | Ending Value |
| MFS Institutional Money Market Portfolio | $68,776,310 | $700,436,502 | $689,210,250 | $9,213 | $21,639 | $80,033,414 |
| Affiliated Issuers | Dividend Income | Capital Gain Distributions |
| MFS Institutional Money Market Portfolio | $941,252 | $— |
| Redemption in-kind Date | Portfolio Securities and Cash Amount | Realized Gain (Loss) | ||
| July 29, 2022 | $64,841,393 | $28,820,371 | ||
| September 6, 2022 | $110,297,561 | $43,701,434 | ||
| October 5, 2022 | $20,037,709 | $7,782,294 | ||
| October 17, 2022 | $77,989,062 | $28,776,566 | ||
| December 12, 2022 | $30,916,275 | $13,996,921 | ||
| December 14, 2022 | $35,916,818 | $16,552,912 | ||
| December 22, 2022 | $78,306,709 | $33,471,714 |

Item 1(b):
Not applicable.
ITEM 2. CODE OF ETHICS.
During the period covered by this report, the Registrant has not amended any provision in its Code of Ethics (the "Code") that relates to an element of the Code's definition enumerated in paragraph (b) of Item 2 of this Form N-CSR. During the period covered by this report, the Registrant did not grant a waiver, including an implicit waiver, from any provision of the Code.
ITEM 3. AUDIT COMMITTEE FINANCIAL EXPERT.
Not applicable for semi-annual reports.
ITEM 4. PRINCIPAL ACCOUNTANT FEES AND SERVICES.
Not applicable for semi-annual reports.
ITEM 5. AUDIT COMMITTEE OF LISTED REGISTRANTS.
Not applicable to the Registrant.
ITEM 6. INVESTMENTS
A schedule of investments for each series covered by this Form N-CSR is included as part of the report to shareholders of such series under Item 1(a) of this Form N-CSR.
ITEM 7. DISCLOSURE OF PROXY VOTING POLICIES AND PROCEDURES FOR CLOSED-END MANAGEMENT INVESTMENT COMPANIES.
Not applicable to the Registrant.
ITEM 8. PORTFOLIO MANAGERS OF CLOSED-END MANAGEMENT INVESTMENT COMPANIES.
Not applicable to the Registrant.
ITEM 9. PURCHASES OF EQUITY SECURITIES BY CLOSED-END MANAGEMENT INVESTMENT COMPANY AND AFFILIATED PURCHASERS.
Not applicable to the Registrant.
ITEM 10. SUBMISSION OF MATTERS TO A VOTE OF SECURITY HOLDERS.
There were no material changes to the procedures by which shareholders may send recommendations to the Board for nominees to the Registrant's Board since the Registrant last provided disclosure as to such procedures in response to the requirements of Item 407 (c)(2)(iv) of Regulation S-K or this Item.
ITEM 11. CONTROLS AND PROCEDURES.
(a)Based upon their evaluation of the effectiveness of the registrant's disclosure controls and procedures (as defined in Rule 30a-3(c) under the Investment Company Act of 1940 (the "Act")) as conducted within 90 days of the filing date of this report on Form N-CSR, the Registrant's principal financial officer and principal executive officer have concluded that those disclosure controls and procedures provide reasonable assurance that the material information required to be disclosed by the Registrant on this report is recorded, processed, summarized and reported within the time periods specified in the Securities and Exchange Commission's rules and forms.
(b)There were no changes in the Registrant's internal controls over financial reporting (as defined in Rule 30a-3(d) under the Act) that occurred during the period covered by the report that have materially affected, or are reasonably likely to materially affect, the Registrant's internal control over financial reporting.
ITEM 12. DISCLOSURE OF SECURITIES LENDING ACTIVITIES FOR CLOSED-END MANAGEMENT INVESTMENT COMPANIES.
Not applicable to the Registrant.
ITEM 13. EXHIBITS.
(a)(1) Any code of ethics, or amendment thereto, that is the subject of the disclosure required by Item 2, to the extent that the registrant intends to satisfy the Item 2 requirements through filing of an exhibit: Not applicable.
(2)A separate certification for each principal executive officer and principal financial officer of the registrant as required by Rule 30a-2(a) under the Act (17 CFR 270.30a-2): Attached hereto as EX-99.302CERT.
(3)Any written solicitation to purchase securities under Rule 23c-1 under the Act (17 CFR 270.23c-1) sent or given during the period covered by the report by or on behalf of the registrant to 10 or more persons. Not applicable.
(4)Change in the registrant's independent public accountant. Not applicable.
(b)If the report is filed under Section 13(a) or 15(d) of the Exchange Act, provide the certifications required by Rule 30a-2(b) under the Act (17 CFR 270.30a-2(b)), Rule 13a-14(b) or Rule 15d-14(b) under the Exchange Act (17 CFR 240.13a-14(b) or 240.15d-14(b)) and Section 1350 of Chapter 63 of Title 18 of the United States Code (18 U.S.C. 1350) as an exhibit. A certification furnished pursuant to this paragraph will not be deemed "filed" for the purposes of Section 18 of the Exchange Act (15 U.S.C. 78r), or otherwise subject to the liability of that section. Such certification will not be deemed to be incorporated by reference into any filing under the Securities Act of 1933 or the Exchange Act, except to the extent that the registrant specifically incorporates it by reference. Attached hereto as EX-99.906CERT.
Notice
A copy of the Amended and Restated Declaration of Trust, as amended, of the Registrant is on file with the Secretary of State of The Commonwealth of Massachusetts and notice is hereby given that this instrument is executed on behalf of the Registrant by an officer of the Registrant as an officer and not individually and the obligations of or arising out of this instrument are not binding upon any of the Trustees or shareholders individually, but are binding only upon the assets and property of the respective constituent series of the Registrant.
SIGNATURES
Pursuant to the requirements of the Securities Exchange Act of 1934 and the Investment Company Act of 1940, the registrant has duly caused this report to be signed on its behalf by the undersigned, thereunto duly authorized.
(Registrant) MFS SERIES TRUST XVII
By (Signature and Title)*
/S/ DAVID L. DILORENZO
David L. DiLorenzo, President
Date: February 15, 2023
Pursuant to the requirements of the Securities Exchange Act of 1934 and the Investment Company Act of 1940, this report has been signed below by the following persons on behalf of the registrant and in the capacities and on the dates indicated.
By (Signature and Title)*
/S/ DAVID L. DILORENZO
David L. DiLorenzo, President (Principal Executive Officer)
Date: February 15, 2023
By (Signature and Title)*
/S/ JAMES O. YOST
James O. Yost, Treasurer (Principal Financial Officer and Accounting Officer) Date: February 15, 2023
* Print name and title of each signing officer under his or her signature.