SUMMARY REPORT
ON THE
BENZDORP PROJECT
SURINAME
Latitude 3º 42’ 00” N, Longitude 54º 9’ 00”
Prepared for:
Canarc Resource Corp.
800-850 West Hastings Street
Vancouver, BC
V6C 1E1
Prepared by:
John A. McClintock, P.Eng (B.C.)
800-850 West Hastings Street
Vancouver, BC
V6C 1E1
Effective Date: October 1, 2006
Table of Contents
|
|
|
|
Item 3 | Summary | Page | 5 |
Item 4 | Introduction and terms of reference | Page | 6 |
Item 5 | Disclaimer | Page | 6 |
Item 6 | Property Description and Location | Page | 6 |
Item 7 | Accessibility, Local Resources, Infrastructure, Physiograph and Climate | Page | 9 |
Item 8 | History | Page | 10 |
Item 9 | Geological Setting | Page | 13 |
Item 10 | Deposit Types | Page | 21 |
Item 11 | Mineralization | Page | 21 |
Item 12 | Exploration | Page | 28 |
Item 13 | Drilling | Page | 42 |
Item 14 | Sample Method and Approach | Page | 46 |
Item 15 | Sample Preparation, Analyses and Security | Page | 47 |
Item 16 | Data Verification | Page | 49 |
Item 17 | Adjacent Properties | Page | 49 |
Item 18 | Mineral Processing and Metallurgical Testing | Page | 49 |
Item 19 | Mineral Resource and Reserve Estimate | Page | 49 |
Item 20 | Other Relevant Data and Information | Page | 49 |
Item 21 | Interpretation and conclusions | Page | 50 |
Item 22 | Recommendations | Page | 50 |
Item 23 | References | Page | 51 |
Item 24 | Date | Page | 52 |
| Certificate of Author | Page | 53 |
| Consent of Author | Page | 55 |
Illustrations
Figure | Title |
|
|
|
|
|
|
|
|
1 | Benzdorp Property Location Map |
| Page | 5 |
2 3 | Concession Location Map Occurrence Location Map |
| Page Page | 7 8 |
4 5 | Results of GDM Sampling Regional Geology of Guyana Shield |
| Page Page | 12 15 |
6 | Regional Geology of Suriname |
| Page | 16 |
7 8 | Benzdorp Property Geology Location of Mineralization |
| Page Page | 18 23 |
9 10 | JQA Trench Map Trench 1 Map |
| Page Page | 24 25 |
11 12 | Poknokker Pits West of Camp Location Map Rufin and Pointu Kreek Sampling |
| Page Page | 28 29 |
13 | Location Map of Auger soil sampling |
| Page | 31 |
14 | JQA Auger Sampling Results |
| Page | 33 |
15 16 | JQB Auger Sampling Map Deep Auger Sampling JQB |
| Page Page | 34 35 |
17 18 19 20 21 22 23 24 25 26 27 | Van Heemstra Auger Sampling Results Eureka Auger Sampling Results Pichevin Auger Sample Results Location map of Airborne Geophysical Surveys Interpretation of Magnetic Data CVG Shadow Map Detailed Magnetic Inversion Location Phase I Drill Holes Phase 2 Drill Hole Location Map Simplified Section JQA line 20400N Original vs. Duplicate Sample Plot |
| Page Page Page Page Page Page Page Page Page Page Page | 36 37 39 40 41 42 43 44 46 47 51 |
| Appendices |
|
|
|
|
|
|
|
|
| Appendix I Drill Sections |
| Page | 65 |
Item 3: Summary
The 138,000-hectare Benzdorp property is situated in Southeastern Suriname approximately 250 km south-southeast of Paramaribo. Canarc has an option to earn up to 80% in the property by spending US $5 million on exploration and making US$ 300,000 in payments to the Grasshopper Aluminum Company (Grassalco).
Since 1996, Canarc Resource Corp. has spent over US $5 million exploring the Benzdorp property for porphyry gold-copper and shear-hosted vein deposits. Nearly all of the expenditure has been on the Precambrian sequence of mafic to intermediate volcanic and intrusive rocks located in the eastern most part of the property. The work on the property was grid auger sampling, geological mapping, airborne magnetics and radiometric surveys, trenching and diamond drilling. Grid auger sampling has been completed over most of the volcanic package. Trenching and drilling, with the exception of a few holes, were focused on the JQA target.
The JQA target covers an elliptical shaped stock of quartz diorite intruding older andesitic volcanic rocks. The mineralization is dominantly chalcopyrite with lesser pyrite as disseminations and in quartz vein stock work. Gold occurs with the copper mineralization. Tropical weathering of the mineralization resulted in laterization and saprolitization of the upper 30 to 70 metres of the mineralized body. In this part of the mineralization, all of the copper minerals were removed leaving only gold. Based on drilling to date, the average gold grade of the mineralization is 0.45 gpt and 0.13% for copper. The zone is closed off except at depth by drilling and sufficient drilling has been carried out such that more drilling is unlikely to significantly alter the grades. In the writer’s opinion, the size and grade potential of the JQA is insufficient to warrant additional drilling. However, should other mineralized bodies be discovered nearby, the JQ A mineralization may contribute to an economic cluster of deposits.
Grid soil sampling has highlighted a number of partially tested and untested gold-in-soil anomalies. These include: the VHA and VHB anomalies on the Van Heemstra grid; an anomaly in the northern part of the Eureka Kreek Grid; and several anomalies on the Pichevin Kreek Grid. The size of these anomalies suggests their sources are likely to be shear-hosted veins and not porphyry gold-copper mineralization. Additionally, other gold anomalies may come out of the 50% of soil samples yet to be analyzed.
It is recommended that exploration continue with the objective of both locating additional low-grade grade gold-copper and high-grade vein-type mineralization in order to identify an economically viable deposit. To this end, exploration should focus both on targets identified by the shallow auger sampling including the VHA and VHB anomalies, JQB, Eureka Kreek and Pichivin Kreek areas as well as any other anomalies that come from analysis of the remaining samples.
Upon receipt of the all of the soil results and interpretation of the geochemical data, it is recommended that a preliminary program of 3,000 m of diamond drilling be completed on the soil anomalies. Cost of this program is estimated at US $497,250.
Item 4: Introduction and Terms of Reference
This report was prepared at the request of Mr. Bradford Cooke, Chairman and CEO of Canarc Resource Corp. to provide Canarc Resource Corp a report summarizing the geology and mineralization of the Benzdorp Property in Southeastern Suriname. The report will be used to support a revised Annual Information Form (AIF) as required by the provincial securities regulations. This report has been completed in a format consistent with National Instrument 43-101. The author visited the property on February 18 and 19, 2006. While on the property, the Author examined core from the JQA zone and visited showings in the Pinchevin, Poknokker and Eureka grid areas.
The data in this report is based upon data and reports provided to the Author by Canarc Resource Corp. as well as observations made by the Author while visiting the project site. The main sources of data are internal memos, maps, sections authored by a number of Canarc employees. The main sources of information are listed in Item 23.
All dollar values given in this report are in U.S. currency.
![[tech2001.jpg]](https://capedge.com/proxy/6-K/0001137171-07-000955/tech2001.jpg)
Figure 1 Property Location
Item 5: Disclaimer
For this report, the author undertook a review of government maps, company and private reports provided by Canarc Resource Corp. The section on metallurgy is from reports by RDi, Process Research Associates and Knelson Research and Technology Centre that document testing of samples while that on geophysical result is based on a report by Trent Pizot PGeo. The Author has full confidence in the quality of work on metallurgy and geophysics as well as their recommendations and conclusions.
Item 6: Property Description and Location
The Benzdorp Property is located in southeastern Suriname approximately 250 km south southeast of the capital Paramaribo and is defined by 4 exploration concessions covering 138,000 hectares. The status of these claims is summarized below and the relative locations are plotted as figure 2. The concessions were granted on July 15, 2000 by The Minister of Natural Resources of Suriname. The boundary of the concessions is defined by latitude and longitude as shown on the attached figure 2. Contained with in concession 764/97, are two alluvial mining rights held by Grassalco.
| |
Concession Name | Expiry |
|
|
764/97 (formerly 596) | July 15, 2007 |
094/99 (formerly 594) | July 15, 2007 |
629/98 (formerly 596) | July 15, 2007 |
631/98 (formerly 597) | July 15, 2007 |

Figure 2 Concession Location Map
The exploration concessions are convertible to a Mining Concession on or before the expiry date by providing a feasibility study and production schedule. If a feasibility study has not been completed by the expiry date, the Suriname Mining Act allows for the term of the exploration concession to be extended at the discretion of the Mines Minister. However, there is no guarantee that an extension of the exploration concessions will be granted by the Mines Minister.
The exploration concessions are registered in the name of Benzdorp Gold NV, a company held 60% by Grassalco and 40% by Canarc Resource Corp.
In April 1996, Canarc Resource Corp. entered into an option agreement with Grasshopper Aluminum Company NV (“Grassalco”) to earn up to an 80% interest in the Benzdorp property by making cash payments of US $750,000 and property expenditures totaling US $5 million over a four year period. In August 2002, Canarc Resource Corp. amended its option agreement. Cash prior to commercial production were reduced to US $300,000 and the period to incur exploration expenditures totaling US $5 million was extended to April 2005, which was then extended to December 2005 pursuant to amendments in April 2005, subject to a payment of US $40,000, which was paid in April 2005. Also, Canarc Resource Corp. will owe Grassalco an additional US $250,000 payable on or before 30 days after the commencement of commercial production if a feasibility study has not been completed by October 6, 2005. Each
year thereafter, Canarc Resource Corp. will owe an additional US $250,000 payable on or before 30 days after the commencement of commercial production. However, if a feasibility study has not been completed by October 6, 2008, then the additional annual cash payments of US $250,000 will increase at that time to US $500,000. These additional cash payments shall be treated as advanced payments against the Grassalco’s shareholder ownership interest and shall be deductible from Grassalco’s net profit share or net smelter profit from exploiting the deposits. In 2004, Canarc Resource Corp. earned a 40% interest in the Benzdorp property. At the end of December 2005, Canarc Resource Corp. notified Grassalco it had met the US $5 million expenditure. Grassalco is currently reviewing the expenditure statement to confirm the US $5 million expenditure was met.

Figure 3 Location of mineral occurrences
There are alluvial gold deposits in many of the drainages of the eastern most part of the property. This area is subject to two alluvial mining concessions. Rights to any gold deposit found within 5 metres of surface with in the area of these two mining concessions belong to Grassalco and are excluded from the Grassalco-Canarc Joint Venture. Past and current surface mining created extensive surface disturbances along the creek drainages Canarc Resource Corp.’s responsibility for reclamation on the property is limited to disturbances created by exploration and exploitation of under surface deposits. At the date of this report, with the exception of several bulldozer trenches, there is no reclamation of under surface exploration or exploitation disturbances required.
The Exploration Concessions grant the right for Benzdorp Gold NV to carry out exploration within the area of the concessions. The holder of the Right of Exploration is required to submit to the Head of Geological Mining Service a detailed working program with the activities as they will be performed during the first month. Thereafter, quarterly reports must be submitted to the Head of Geological Mining Service describing all data and results obtained by the work as well as a work plan for the subsequent quarter. As of the effective date of this report, all required reports had been filed with the Head of Geological Mining Service. No additional permits or authorization are required prior to commencing a work program.
Item 7: Accessibility, Climate, Local Resources, Infrastructure and Physiography
Suriname, formerly Dutch Guyana, is bounded on the north by the Atlantic Ocean, on the east by French Guyana, on the south by Brazil, and on the west by Guyana. The total population of Suriname is just under 500,000, with 40% living in Paramaribo, the capitol.
Suriname consists of a swampy coastal plain, ranging up to 80 kilometres in width; a central plateau region containing broad savannas, tracts of dunes, and forested areas; and, to the south, a densely forested mountainous region. Suriname’s chief resources are bauxite, gold and extensive forests.
Transportation facilities in Suriname are concentrated in the northern part of the country. The nation has about 8,500 kilometers of roads, but less than ten percent of which are improved. Transport on Suriname’s roughly 1,200 kilometers of inland rivers and canals is very important. Paramaribo and Nieuw-Nickerie are the chief seaports, with other ports at Moengo, Paranam and Smalkalden.
Paramaribo is the capital city, located in north central Suriname. The city is served by an international airport, located 50 kilometers south of the city. Paved road infrastructure in confined to the coastal belt. Laterite capped logging roads provide reasonable access to the northeastern part of the country. Access to areas south of Van Blommestein (a man-made lake) is made either by aircraft (presence of airstrip permitting) or seasonally by boat via the extensive network of rivers in the interior, and then by bush roads.
Van Blommestein in a man-made reservoir built in the 1960’s to generate power for the much-relied-upon bauxite industry. The dam may be reached via a two-hour drive directly south of Paramaribo.
The Benzdorp Property is located in the Lawa region on southeastern Suriname, along the border with French Guyana. Benzdorp is located approximately 250 km in a direct line SSE of Paramaribo (Figure 1).
Access to the property can be gained either by air or by boat along the Lawa River via the Marowijne River. Air access by fixed-wing aircraft is available to the Tabiki airstrip, which lies on an island in the middle of the Lawa River (Figure 2) adjacent to Benzdorp. The Cottica, Antino, and Anapaike airstrips (to the N, S and SE, respectively) can be used as alternative landing points, especially during the long wet season when the Tabiki airstrip is often closed. The flight time from Paramaribo to the Tabiki airstrip is approximately 1.25 hours.
The overland route is considerably more arduous, involving a 2-hour road trip to Albina (a town located east of Paramaribo on the Marowijne River) followed by a 2 to 5 day boat trip to Benzdorp along the Marowijne River and the Lawa River, the duration of travel being dependant on the water level of the river.
All food, field supplies and staff rotations were supplied to the programme using chartered or scheduled planes (Gumair and/or Blue Wing). Fuel was supplied by the overland route.
Suriname lies very close to the equator, in the humid tropics. Annual variation in mean temperature is slight: the mean annual temperature in Paramaribo is 27.1 degrees C, and the average temperature of the hottest month, October (27.9ºC) is less than 2 degrees above the average temperature of the coolest month, January (26.2º C). On the other hand, the mean daily fluctuation in temperature is much greater, about 8º in Paramaribo, and even more inland, to 11º at Sipaliwini. As is to be expected, temperatures at the higher elevations are lower than those of Paramaribo, and the deep shadow of the high forest lowers the temperature even further.
Four seasons can in general be differentiated in Suriname: two wet and two dry. The approximate dates of the four seasons are as follows:
Short rainy season: | December 1-January 31 |
Short dry season: | February 1-April 30 |
Long or Peak rainy season: | May 1-August 15 |
Long or Peak dry season: | August 16-November 30 |
Suriname lies completely outside the path of the North Atlantic cyclones. Therefore, nearly all winds are comparatively light; however, sudden gusts may occur, preceding the periodically frequent thunderstorms, and a squall usually heralds the afternoon downpour of the wet seasons. May, June and July are Suriname’s wettest
months, with approximately 40 percent of the year’s rain occurring in these three months. Annual rainfall varies from more than 200 centimeters per year in coastal areas to 150 centimeters in inland areas.
With the exception of the alluvial mining rights held by Grassalco, surface rights for the area are held by the government of Suriname. That being said, there are approximately 1000 informal alluvial miners who occupy areas of the southeastern part of the property and work alluvial deposits along the valley bottoms. Grassalco collects a portion of the gold recovered by the informal miners as a royalty.
The topography is gentle and there is apple room for tailings and waste dumps on the property. The agreement with Grassalco allows Benzdorp Gold priority over the alluvial mining in development of a project. The project is very remote and there is no power grid or road access to the property. Power will most likely have to be generated on site. There is sufficient water for a mining operation.
Item 8: History
The Benzdorp region has a long history of alluvial gold mining and is known as the most prolific alluvial gold producing area in Suriname, with recorded gold production commencing in 1861 (de Vletter, 1984). In 1908 a gold production peak of 1,209 Kg was recorded from the property.
In 1935 Sara Kreek Goudvelden N.V. operated in the area. The Billiton Mining Company carried out systematic prospecting for alluvial gold deposits in 1941 and again in 1946/47 in selected areas. Lawa Goudvelden N.V., a working company of Sara Kreek Goudvelden N.V., began a dredge project in the Rufin Valley in 1956. From 1963 to 1969 this company operated the Jungle Queen dredge, which now lies rusting and overgrown in the Eau Claire Valley.
Systematic reconnaissance exploration for primary lode gold mineralization in the Benzdorp area commenced in 1973 and 1974 with the Geological and Mining Department of Suriname (GMD) carrying out a low-density soil and stream sediment sampling survey over the eastern portion of the Benzdorp property (Oosterbaan, 1974, Oosterbaan, 1975). The GMD assayed samples for a wide range of elements. However, samples from the area surrounding the alluvial workings in the far east of the property were the only ones to be assayed for gold.
From 1983 to 1986 the GMD carried out a soil-sampling program immediately west of the old Benzdorp community. The sampling covered most of the southeastern exploitation license. The 200 m x 40 m density grid was oriented WNW-ESE, with samples collected from depths ranging from 30 cm to 50 cm (Hakstege, 1994). A significant gold-in-soil anomaly (>100 ppb) was discovered, measuring 3 km east west by 2.5 km north south at its widest points (figure ---). A deep-augering program to test this anomaly was started in 1986, but the program was halted due to the outbreak of the interior ‘war’.
![[tech2003.gif]](https://capedge.com/proxy/6-K/0001137171-07-000955/tech2003.gif)
Figure Results of GDM Soil Sampling
Interest in exploiting alluvial gold at Benzdorp resumed again in 1992. Since that time the activity increased to the point where approximately 300 poknokkers were active from 1995-1998 and more than 1000 were active in 2003.
Canarc conducted a short evaluation program in 1994 confirming some of the results obtained by previous GMD projects. After acquiring an option on the Benzdorp property in 1996, Canarc concentrated its exploration in the greenstone belt on the easternmost part of the property, where most of the historical activity has been focused and where it is thought there is the best potential for the discovery of an economic gold deposit. To date, Canarc has spent over US $5 million on the Benzdorp property. Work consisted of regional surveys of soil augering, geological
mapping and prospecting, as well as intensive work in the area of main soil anomalies. Work in these anomalous areas consisted of deep augering on 20 m x 100 m spaced grids covering the anomalies, followed by bulldozer trenching.
From October 3rd until December 13th 2002, Canarc carried out a field program on the Benzdorp property to further evaluate the potential for economic gold mineralization. The program focused on trenching along the deep auger grid lines in the JQA anomaly where average grades over the entire depth of the auger holes exceeded 0.5 g/t gold.
In order to sample true saprolite, the trenches were dug to a depth of at least 6 metres. This depth was accomplished by making a 3 metre deep, 5.5 metre wide trench with a bulldozer. Due to persistent mechanical problems with both machines, only 281 metres of bulldozer trench and 201 metres of excavator trench were completed out of the planned 1000 metres. This work on what is refered to as the JQA zone found gold mineralization assaying up to several grams per tonne over a metre.
In 2003, the first phase of the drilling program was started using a prospecting drill rig to complete holes up to 100 metres to provide an initial test of the mineralization on the property. A total of 38 drill holes were completed by December 2003 for a depth of 3286.03 metres. The targets drilled were located on the JQA, JQE, JQW, JQS and Roche Kreek area.
The drilling at JQA, JQE and JQW roughly outlined the extent of a stockwork zone with discontinuities between high-grade intersections and low-grade holes. Drill holes planned as ‘scissors’ often returned higher-grade gold intersections in the westerly drilled holes leading to the speculation that the stockwork bodies dip shallowly to the east-southeast and are possibly stacked.
Based on the trenching and drilling results in the JQA prospect area, Canarc believed it had discovered a significant new gold-copper deposit on the Benzdorp property. Twelve holes (BZD-1,2,4,5,6,7,8,13,15,16,18 and 20) within a 500m by 500m area all intersected continuous stockwork mineralization within a quartz diorite stock. Other holes in JQA, JQE and JQW also intersected similar, but lower grade mineralization and weaker alteration.
In 2004 the work program on JQA continued. The smaller drill was determined to be underpowered for further deep drilling in the JQA area, so Canarc van Suriname’s Longyear 38 was rehabilitated and commenced drilling on section line 20400N of the JQA grid. 13 drill holes totaling 3983.9 metres were completed on the JQA anomaly. Six holes were drilled on section 20400N, three holes on 20300N, and two holes on section line 20200N. This work found low-grade copper and gold mineralization below the saprolite layer.
2004 also saw the delivery of approximately 20 kg of drill-core rejects from this program shipped to Resource Development Inc. (RDI) of Denver, Colorado, U.S.A. for preliminary metallurgical testwork. This work showed that the gold in the JQA is very fine grained with little recoverable by gravitation. However, floatation and direct cyanidation show acceptable recoveries.
In 2005, work on the JQA consisted of metallurgical studies aimed at evaluating gold and copper recoveries. Additionally, further geochemical and geophysical surveys commenced to look for additional mineralized areas.
In 2006, grid auger sample was extended to cover all of the favorable greenstone lithologies in the eastern part of the property. As of the effective date of this report, only about 50% of the results of the program had been received. Concurrently with the auger sampling, a low-level, high-resolution magnetometer and radiometric survey was flown over the eastern area of the property.
Item 9: Geological Setting
The Benzdorp property is situated in Precambrian rocks of the Guyana shield. The geology of the shield has been described in detail by Bosma et al. (1983) (Figure 3).
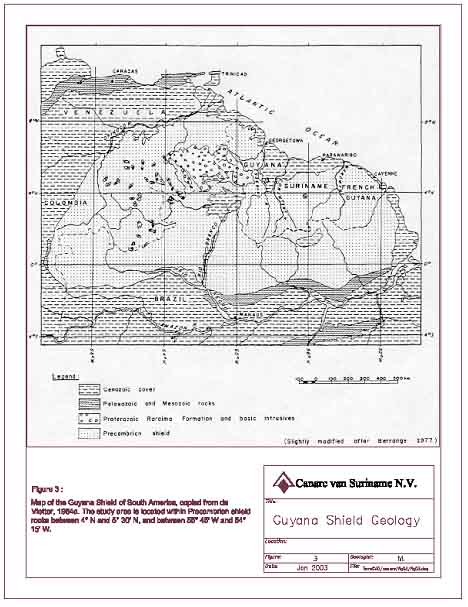
Figure 3 Regional Geology of the Guyana Shield
The oldest rocks present in the Guyana Shield are Archean granulites, which may represent remnant fragments of an Archean continent (Bosma et al., 1984). A single inlier of possible Archean age crust, correlative with these fragments, exists in western Suriname (Figure 4).

Figure 4 Regional Geology of Suriname
During the Early Proterozoic Trans-Amazonian Orogenic event (2020-1840 Ma), a sequence of marine sedimentary rocks, and volcanic and intrusive rocks was deposited/emplaced, deformed and metamorphosed to form the crystalline Precambrian basement of the Guyana Shield (Bosma et al., 1984).
Structurally, this event is characterized by west to northwest trending greenstone belts interfolded with clastic sedimentary rocks (Gibbs and Barron, 1993). Folding is near isoclinal, and foliation and compositional banding are transposed to sub-parallel in most places (Bosma st al., 1984). Foliation and faults are steeply dipping to sub-vertical (Bosma et al., 1984).
Middle and Upper Proterozoic units (1655 Ma) postdate deformation associated with the Trans-Amazonian Orogenic event and include clastic sedimentary strata, pyroclastic volcanic rocks (de Vletter, 1984), and multiple stages of intrusions, including s-type granites and possibly kimberlites (Gibbs and Barron, 1993).
A late Proterozoic tectonic and metamorphic event is recorded by mylonite zones, formed during the Nikerian Episode (1200 Ma), which may have involved older, reactivated zones of crustal weakness. These zones occur throughout the Guyana Shield, and presently strike east to northeast. Shorter NW-striking coeval mylonite zones
demonstrate little or no offset, and the two orientations may have formed as regional conjugate structures (Gibbs and Barron, 1993).
Rocks of Permo-Triassic age (230 Ma) are limited to dolerite dykes which formed during the initial rifting phase of the Atlantic Ocean, related to the onset of seafloor spreading (Gibbs and Barron, 1993; Bosma et al., 1984). Individual dykes seldom exceed 50 metres in width, although dyke swarms in eastern Suriname have been traced for more than 300 kilometres along strike (Gibbs and Barron, 1993). In much of the Guyana Shield, dyke swarms trend northeasterly however where they are well exposed in eastern Suriname, they trend north to northwest.
An overlying sequence of less deformed Mesozoic and Cenozoic rocks records sedimentation within an active rift setting. Brittle deformation was active throughout the Mesozoic and Cenozoic, evidenced by growth faults interpreted in seismic sections along the coastal plain (Bosma et al., 1984) (Figure 4).
The Benzdorp property can be divided into three distinct geological environments (Figure 5). These are:
a)
The Eastern Greenstone Belt
b)
The Central Granitoid Area
c)
The Assici-Emma Complex in the south.
Each of these is discussed below:
![[tech2005.gif]](https://capedge.com/proxy/6-K/0001137171-07-000955/tech2005.gif)
Figure 5 Benzdorp Property Geology
a)
The Eastern Greenstone Belt
This area is characterized topographically by the presence of a chain of hills (Fatoe Swietie) reaching up to 440m in elevation. The Fatoe Swietie hills mark the central spine of the greenstone belt and forms an arcuate belt trending NW at its’ southern extreme to NE at the northern extent of the hills.
According to compilation work carried out by the GMD, this belt is characterized by the presence of greenstone to amphibolite facies metaquartz andesites, metabasalts, dacites and occasionally metacherts and phyllites belonging to the Paramakka Formation of the Marowijne Group. The regional lithologic and structural trends are mapped as predominantly NNW-SSE trending, although local variations are common. Outcrops are rare, usually confined to steep-sided gulleys and creeks. In-situ fresh rock occurrences are rarer still, usually in deeply incised channels that have penetrated the saprolitic profile, or exposures in pits excavated by porknockers exploiting the alluvial gold deposits.
Geological mapping by Canarc van Suriname identified four main sequences/rock types within this belt, provisionally named:
The Benzdorp Volcaniclastic Sequence
The Haut Pointu Tuff Sequence
The Fatoe Swietie Sedimentary Sequence
Intrusive Lithologies
The Benzdorp Volcaniclastic Sequence (BVS)
This sequence forms the highest proportion of the rock units occurring in the area. The BVS has been mapped from the Lawa River in the east to the Central Rufin and Pointu Kreeks in the west.
The majority of the BVS comprises intermediate volcanic and volcaniclastic rocks. Previously the sequence had been recorded as meta-basalt, -andesite and –dacite lavas. Later, due to both excellent exposures from the poknokker pits and increased accessibility to good rock samples, the true volcaniclastic nature and large areal extent of these lithologies is becoming apparent.
Lavas, pyroclastic deposits, and other such rocks associated proximal to volcanic centres also occur in this sequence. Pyroclasts ranging from millimetric lapilli to bombs up to a metre or more are found throughout this sequence.
Meta-andesitic breccias, previously identified as meta-pillow basalts by earlier mapping campaigns, are exposed in the Lawa River beside the original Lawa Basecamp. These rocks exhibit good preservation of original feldspar micro-phemocrysts, as well as zeolites and calcite forming amygdules within the rock. On the basis of restricted petrographic work, the rock here appears to represent a vent-proximal andesitic breccia (flow-top breccia?).
In some areas (notably the central Rufin Kreek area), lapilli and bombs of felsic composition occur in a matrix of intermediate material. This appears to indicate differentation of the various magmatic sequences over time. This is further supported by the thickness of the BVS sequence, which appears to exceed 6,000 metres.
Within the BVS, areas of chloritic schist have been observed, notably around the central Pointu and upper Danae Kreek drainages. These rocks have previously beem interpreted to represent meta-sedimentary rocks, derived from volcanic activity (possibly lagoonal or ‘crater facies’ from within the volcanic area). However, in some areas, they appear to represent the tectonised equivalent of both granitic intrusives and the pyroclastic rocks. This latter hypothesis is supported by the observation of ‘chlorite schist’ saprolite in areas of sheared granitic material.
The Haut Pointu Tuff Sequence
The Haut Pointu Tuff Sequence occurs west of a north-south line from the Central Rufin and Central Pointu Kreeks, and outcrops westwards to the upper Rufin and upper Pointu Kreeks. This bedded sequence has been inferred to be approximately 1,500 metres thick, and comprises finely laminated tuffs, interbedded with crystal tuffs and greywackes. Some layers show evidence of upright graded bedding and soft sediment deformational textures, indicating that the sequence ‘youngs’ towards the west.
Rocks found in the area of the confluence of Eau Clair and Rufin Kreeks are locally silicified, and are thus very well preserved. Silicification has been dominant along the fluid conduits of the bedding planes. The silicified tuffs are located in close proximity to quartz porphyry and dioritic intrusives, which occupy the recessively weathered valley.
Varying degrees of sulphide mineralization have been noted within the tuff sequence. Observed sulphides are predominantly pyrite, and minor arsenopyrite. Pyrtite occurs as disseminastions or in fine fractures and stringers.
The Fatoe Swietie Sedimentary Sequence
With a minimum thickness of 1,000 metres, this sequence occurs west of the Haut Pointu Tuff Sequence and has been mostly observed in the upper Rufin Upper Eureka and Upper Antino drainages close to the boundary with Nana Resources’ Antino property. For the most part, the rocks observed are black to brown, fine grained, micaceous and carbonaceous metasedimentary siltstones and mudstones with intercalated quartzite horizons. Quartz veining is a common occurrence and areas of intense silicification (with or without sulphides) and shearing have been observed.
In summary, the changes from BVS through the Fatoe Swietie Sedimentary Sequence described above appear to reflect the change from vent-proximal volcanic deposits in the east, through vent-distal volcanic deposits (areal and water-lain tuffs) to reworked water-lain sediments in the west. This whole sequence has been intruded by rocks of varying composition, some of which may be contemporaneous with the volcanic sequence.
Intrusive Lithologies
Basic intrusives include meta-gabbro and meta-norite. Generally, these rocks are course grained, composed of cloudy, altered feldspar crystals (often epidotized) and secondary amphiboles (tremolite-actinolite-hornblende) after pyroxene. This lithology generally exhibits a sub-ophitic texture. Sulphides (pyrrhotite, chalcopyrite and pyrite) have been observed both disseminated and in quartz veins. These intrusives, rarely observed elsewhere, have been noted in the van Heemstra grid area.
The Fatoe Swietie Amphibolite (the spine of the Fatoe Swietie Hills), basic to intermediate in composition, may also represent an intrusive body, rather than the metamorphosed equivalent of the main greenstone sequence. Its contact relations are poorly understood and more work is required to gain a better understanding of its geological properties.
Intermediate to acidic intrusive rocks are relatively common occurrences, much more so than interpreted by previous mapping campaigns. Samples of these rock types are found as float and saprolite (in poknocker pits) in many of the kreeks in the area. A broad range of compositions from diorite, quartz diorite, granodiorite to true granites have been observed, with each type often exhibiting much variation in composition (e.g. biotite granites, aplites, leucogranites) and deformational history (e.g. undeformed to cataclastised granites). Porphyries of dioritic to granitic composition are frequently encountered, the main lithologies being feldspar-, and quartz-feldspar porphyry. These porphyries tend to have variable amounts of disseminated sulphides present, and are often host to millimetric and centimetric quartz-stockwork veining.
Whilst contact relationships of these acid/intermediate rocks are rarely observed, it is unlikely that all intrusive bodies occur as small scale lenses, sheets and stocks. It appears that some of these bodies may have polyphase intrusive histories – with intrusive rocks of varying compositions seemingly occurring within the same stock (such as the JQA intrusion). Many of these felsic rocks exhibit whole or partial kaolinization.
Permo-Triassic (P-T) dykes
A series of P-T dolerite dykes intrude the country rocks at Benzdorp. These dykes trend NNW-SSE and are possibly up to 20 metres in thickness. In hand specimen these dolerites are dark greenish black and exhibit a medium grained assemblage of unaltered feldspar and pyroxene. These dykes are relatively resistant to weathering. They can be distinguished from the Lower Proterozoic dykes by their lack of deformational fabric and by the absence of metamorphic alteration mineral assemblages – a common feature associated with the older rock-types.
b)
The Central Granitoid Area
The Central Granitoid area covers the central, western and northern part of the property, and is characterized by low-lying topography. The granites are mapped as biotite granites and biotite tonalities. Canarc has undertaken very little exploration work in this area in the past, so these rocks are not as well understood.
Limited evaluation of aerial photographs and aeromagnetic maps appears to indicate the presence in this area of small relicts of greenstone belt in the granitic terrain. These would represent the most likely target for any exploration work in the area.
c)
The Assici-Emma Complex
The Assici-Emma Complex in the south of the Benzdorp property is characterized by the presence of a strong WNW-ESE trending structural lineament. This lineament extends westwards to the Tapanahony River and eastwards into French Guyana, covering a distance of approximately 150 kilometres. Large mafic intrusions (e.g. the De Goeje Gebergte) and slivers of greenstone are present along the lineament.
Item 10: Deposit Types
The Benzdorp property is being evaluated for its potential to host economic gold and gold-copper deposits. The possibilities for discovery of a copper-gold porphyry deposit as well as shear-hosted orogenic lode gold deposits exist on the property.
Examples of copper-gold deposits being sought on the Benzdorp property are the Boddington deposit in Australia. The Boddington mineralization occurs in Archean mafic to intermediate volcanic rocks cut by intrusive rocks. Exploration on the JQA zone at Benzdorp has identified copper and gold mineralization associated with a tonalite stock that intrudes into mafic to intermediate volcanic rocks.
The second deposit type is orogenic lode gold deposits similar to the Gros Rosebel mine of Cambior (proven and probable reserves of 3.2 million ounces). The Gros Rosebel mineralization mostly occurs in quartz and quartz-carbonate veins that are generally restricted to lithological contacts fold closures and subvertical shear corridors. The
deposit consists of 6 separate deposits. Exploration to date on the Benzdorp property has identified similar lithologies to those at Gros Rosebel and several shear-hosted gold-bearing quartz vein systems have been identified.
Item 11: Mineralization
Exploration of the Benzdorp by Canarc Resource Corp. located a number of areas of gold mineralization. These include the JQA, JQB, Pichevin Kreek and Eureka Kreek zones. Mineralization present in each zone is discussed separately below (Fig. 6).
![[tech2007.gif]](https://capedge.com/proxy/6-K/0001137171-07-000955/tech2007.gif)
Figure 6 Location of Mineralization
JQA
Mineralization in the JQA zone is centered on a tonalite porphyry intrusive intruding mafic volcanic rocks of the Benzdorp Volcanic Sequence. Based on the drilling results, the mineralizing intrusive has a dimension of approximately 900 by 300 metres.
The intrusive bodies appear to be spatially related to gold mineralization. At the northern end of the JQA anomaly, gold is hosted within a saprolitised quartz-stockwork, and veined and fractured tonalite. The contact zone between stock- and dyke-intrusives and the host greenstone rocks is where higher-grade gold occurrences are predominantly located.
Where fresh rocks have been found, gold mineralization is associated with silicification and potassic alteration. Silicification is characterized by silica flooding, giving the rock a glassy appearance and a stockwork of quartz veins. Potassic alteration is manifested by the development of K-feldspar, giving altered rocks a pink colouration in the groundmass (this style of alteration appears to be confined to the intrusive rocks only).
Sulphide mineralization consists of pyrite, pyrrhotite and lesser chalcopyrite occurring as disseminations in the intrusive and surrounding volcanics and within quartz veins. Total sulphide content is generally less than 5% of the rock by weight.
In the initial 30 to 70 metres from surface, the rock is saprolitized and all sulphides are oxidized to various forms of iron oxide. The intrusive and volcanic rocks in the saprolite zone are deeply weathered and decomposed. The oxidation of sulphides in the rock and the acid generated by this process assisted the natural process of weathering and resulted in a deeper weathering profile within the JQA mineralized area.
Two trenches were excavated in the JQA zone (Figure 7). The trenches were made using a D-6 bulldozer and were dug to a depth of 6 to 8 metres into the saprolitized rock. Neither trench reached non-weathered rock. Two metre long channel samples were cut from the lower wall of the trench and analysed for gold.
![[tech2009.gif]](https://capedge.com/proxy/6-K/0001137171-07-000955/tech2009.gif)
Figure 7 JQA Trench Map
In trench TR-02-01, the porphyry has locally been sheared, with numerous hematitic shears, ranging from 10 cm to 25 cm width (Figure 8). One main shear is present at samples 117750, 117751, and 117752, which measures 5 metres in width, with several more narrow ones within the adjacent few metres. All of these shears are hematitic, with a fine, sub-parallel stockwork of quartz stringers. The feldspar phenocrysts in these zones have been flattened along the shear plane. These shears trend very consistently at 160º to 175º, dipping 80º to 85º W in the eastern part of the trench. Towards the west, they start dipping vertical and then easterly to as shallow as 45º E. Quartz stringer stockwork zones with up to 20 stringers per metre increase towards the area of, and occur sub-parallel to, the shears.
![[tech2011.gif]](https://capedge.com/proxy/6-K/0001137171-07-000955/tech2011.gif)
Figure 8 Trench 1 Map
The shear zones occasionally offset quartz veins (sinistral) 10 cm to 1 metre. In turn, these shears are also offset (sinistral) 20 to 30 cm, along very clean, single sub-horizontal to shallow westerly dipping faults. These faults often have no measurable width, and may contain quartz, gouge or oxides.
Although granular (saccharoidal) quartz veins up to 2 cm width are common throughout, there are very few zones of significant stockwork or sheeted quartz veins. Hematite and a pyrolusite are common in the quartz veins. Folding of the quartz veins has been noted at several locations with the dominant fold axis at approximately 30º→ 045º.
The most pervasive oxidized zone occupies the western 60 metres of the trench. Intense laterization occurs in the eastern part of the trench and saprolite was not reached. Samples were collected from the mottled zone. Trench TR-02-01 averaged 0.802 gpt over the 146m length sampled. Towards the eastern part of the trench, gold values are lower averaging 0.539 gpt over 20 metres.
Of the 59 metres excavated, saprolite was not reached for a 26 metre length. The saprolite that was exposed was very oxidized and limonitic, with patches of mottled zone included. The samples are still considered to be of the ‘transition’ zone between the laterite cap and the underlying saprolite. Structural features were difficult to observe. Numerous shears were noted, and are moderately limonitized. These shears have also been offset numerous times by the same sub-horizontal faults as described above (TR-02-01). However, the shears in this trench are not as consistent in their orientations as those in TR-02-01, and generally dip shallower. Magnetite and pyrolusite are common in many of the quartz veins. There is a fairly dense quartz vein stockwork from sample 117828 to 117832, with quartz veins up to 5 mm in various directions, although more sheeted than in TR-02-01, with vein densities up to 20 veins per metre.
Trench TR-02-02 averaged 0.896gpt gold over the 59 metres sampled. If the 28.4 metre interval of mottled zone is excluded, the trench samples average 1.024 gpt gold over 34.2 metres.
No significant change in gold grades was noted in the zones of shearing and zones with increased quartz veining. The gold grade is fairly consistent over the entire intrusion tested by the trenches. Only a slight decrease in gold values occurs in the oxidized zone at the top of the saprolite, decreasing further into the mottled zone.
The JQA anomaly was tested by a number of drill holes the results of which are discussed under Item 13 Drilling.
JQS
The JQS lies to the south of the main JQA anomaly and is an extension of the mineralization exposed there. The mineralization occurs in altered mafic volcanics rocks consisting of tuffs and flows. Alteration consists of potassic and proplytic facies along with a quartz stockwork.
The JQS was drilled with a number of holes and is discussed as part of the JQA in Item 13 Drilling.
JQB
Mineralization in the JQB is exposed in Poknokker pits and consists of quartz vein swarms and stockworks localized along the contact of quartz diorite porphyry dykes and sheared and altered mafic volcanic and volcano clastic rocks. Alteration and mineralization is similar to that at JQB, but is restricted to several metre thick zones along the intrusive-volcanic contact. Other than grab samples, no systematic sampling of the JQB was done.
Pinchevin Kreek
Activities by Poknokkers exposed shear-hosted mineralization within meta volcanilastic rocks. The shears are of variable width ranging from 1 to 5 metres. Within the shears, quartz veining forms 10 to 30% of the rock and consists of massive white quartz in anastimosing vein systems that locally coalesce into single veins up to 1 metre thick. Limonite box works in the veins and wall rock suggest sulphide minerals formed approximately 5% of the unweathered rock. Short 1.5 metre channel samples of the saprolite exposed in shallow poknokker pits was carried out in 1997. These samples were not sent to a laboratory for analysis, but were evaluated by hand panning. Gold grain counts are reported, but due to the inaccuracy of this type of analysis no comment can be made on the actual gold grades of these samples. It is assumed that some amount of gold was present in the saprolite as areas with high gold grain counts were extensively mined by the poknokkers.
Eureka Kreek
As in the case of Pinchevin Kreek, mineralization at Eureka Kreek occurs in quartz veining localized in shears cutting meta volcanoclastic rocks exposed in Poknokker pits. Numerous grab and channel samples collected from the poknokker pits returned generally low gold values with the highest value being 2.92 gpt across 1.5 metres.
Pork Knocker Pits West of Camp (JQW)
Two active poknokker workings immediately west of the JQA grid have been mapped as various lithologies of the Benzdorp Volcaniclastic Sequence as well tonalitic porphyry intrusive rocks. These rocks display local zones of brecciation, which are believed to be a primary texture. These breccias are pyroclastic flows and lithic tuff. Minor quartz vein zones have been noted in these workings. A small outcrop of white saprolite, rich in quartz grains, appears to be part of a small granitic plug or dyke.
The JQW was drilled with 5 holes. The results of this drilling is discussed in Item 13 Drilling.
![[tech2012.jpg]](https://capedge.com/proxy/6-K/0001137171-07-000955/tech2012.jpg)
Figure 9 Sampling Poknokker Pits
Several samples collected from the poknokker workings west of base camp returned significant gold assays (Figure 9). The highest return is a 2.0 metre chip sample taken from a zone of quartz veining in BVS exposed in one of the poknokker pits. It assayed 10.873 g/t gold. Including adjacent samples, this zone averages 2.815 g/t Au over 12 metres, including 8 m of 3.968 g/t gold. Although sample 117010 is not directly contiguous, it is nearby, and with this sample included, there is a 17 metre wide zone averaging 2.496 g/t gold. These poknokker pits have been sampled directly below the ‘paydirt’ zone of the placer workings, so these samples could have been contaminated by free gold from the sediments above. However, every effort was made to ensure a clean, uncontaminated sample. The exposed saprolite/rock was washed clean, and the channel samples were cut approximately 5 cm deep into true saprolite. Samples from the granitic saprolite did no t return significant assays. This anomaly was tested with 5 diamond drill holes as part of the drill test of the adjacent JQA Zone.
Rufin Kreek and Pointu Kreek
Extensive sampling of Poknokker pits in the Rufin and Pointu Kreek drainages were channeled sampled in 2005. The location of the sampling is displayed in Figure 10. Results of the sampling are provided in Appendix I. With the exception of a few samples with less than 2 gpt, the values are low for gold.
![[tech2013.jpg]](https://capedge.com/proxy/6-K/0001137171-07-000955/tech2013.jpg)
Figure 10 Location Map Rufin and Pointu Kreek Sampling
Item 12: Exploration
Most of the geologically favorable greenstone rocks of the easternmost part of the Benzdorp property (Figure 11) have been explored with deep auger soil sampling. As a first pass, 1 metre deep, vertical auger holes were drilled by Canarc employees in order to penetrate the laterite. Soil from the bottom 20 cm was placed in cloth bags, carefully numbered and sent to a laboratory. Samples collected prior to 2003 were shipped to FILAB in Cayenne, French Guyana. Since 2003, samples have been shipped to a laboratory in Paramaribo called “The Assay Lab” associated with Inspectorate Labs. The change in laboratories was made so that analysis would have ISO 2002 quality assurance required by stock exchanges in Canada and the U.S.
![[tech2015.gif]](https://capedge.com/proxy/6-K/0001137171-07-000955/tech2015.gif)
Figure 11 Area Covered by Grid Auger Sampling
Soil samples were collected at 20 metre spacing along lines. Line spacing varies from 100 to 400 metres with closer line spacing over areas of known mineralization. As the soil sampling just completed on July 31st, many of the analytical results are pending; in particular the results from the 400m spaced sampling.
Soil samples from the auger sampling program were analyzed for gold by atomic absorption. Analytical results and logs from the auger holes are available in Appendix - and results are plotted on figures 12 to 16.
Results show 5 main areas of anomalous gold in soil. These are referred to as JQA, JQB, Van Heenstra, Eureka and Pinchevin. Each anomaly is discussed separately below.
JQA-JQS
The JQA - JQS anomaly is the largest and best defined of the gold-in-soil anomalies. At the 0.25 gpt contour, the anomaly measures 1700 by 800 metres (Figure 12). Peak values are up to 10 gpt. The size of the anomaly, coupled with the high gold values, resulted in most of the drilling and trenching being focused on this anomaly. To better define the bedrock source of the gold-in-soil anomaly, 5 to 15 metre long auger holes drilled at 20m spacing along lines 100m apart within the areas of the anomaly with values greater than 0.5 gpt gold. Results from the deep auger drilling showed consistent gold values in the 0.1 to 10 gpt range within an area measuring 500 metres by 500 metres. None of the auger holes penetrated the saprolite layer. The encouraging results prompted a next phase of diamond drilling, which is discussed under Item 13.
![[tech2017.gif]](https://capedge.com/proxy/6-K/0001137171-07-000955/tech2017.gif)
Figure 12 JQA-JQS Soil Results
JQB
The JQB anomaly lies to the southeast of the JQA anomaly. Results of the initial 1 metre deep auger sampling showed an area 1000m by 600m where gold-in-soil values exceeded 0.1 gpt (Figure 13). To better define the source of the gold-in-soil, a subsequent program of 5 to 15 metre deep auger drilling was carried out within the areas of highest gold values. Results of the deep auger holes show that gold at depth is restricted to narrow zones generally
less than 40 metres wide and 600 metres long. This fits well with observations made in Poknokker pits where gold mineralization occurs in the sheared contacts of quartz diorite porphyry and meta volcanic rocks.
![[tech2019.gif]](https://capedge.com/proxy/6-K/0001137171-07-000955/tech2019.gif)
Figure 13 JQB Soil Results
![[tech2021.gif]](https://capedge.com/proxy/6-K/0001137171-07-000955/tech2021.gif)
Figure 14 1 Deep Auger Results JQB
Van Heemstra
In the Van Heemstra area, shallow auger-soil samples were collected at 20 metre spacings along lines spaced 100 metres apart. Results of the gold analysis of these samples are plotted on Figure 14.
At a 0.3 gpt gold value, two prominent anomalies are identified. These are referred to as the VHA and VHB anomalies. The VHA anomaly covers an area measuring 600m by 200 to 300m wide. This anomaly occurs in an area without outcrop, therefore at this time there is no explanation for the source of the anomaly.
The VHB anomaly has a smaller areal extent than VHA. The anomaly measures 200m by 100m at the 0.3 gpt gold contour. As in the case of VHA, there is no explanation for the source of the anomaly.
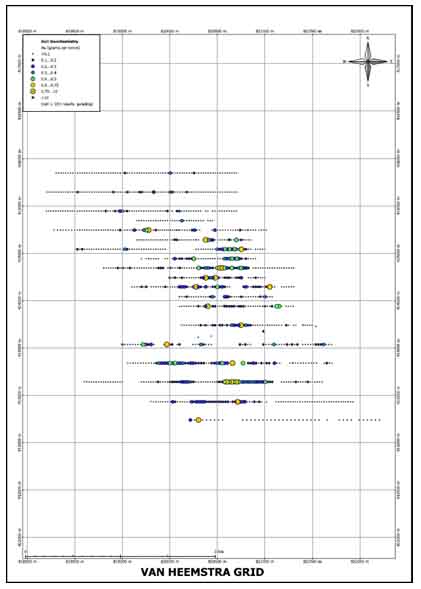
Figure 15 Van Heemstra Auger Sampling results
Eureka
Auger sampling from the initial sampling of the Eureka Grid were evaluated by panning a 1 litre sample of the cuttings from the bottom 20 cm of the auger hole. The resulting concentrate from the panning was visually examined and the number of gold grains counted. This method of evaluating the auger samples was used to determine where
subsequent deeper auger sampling would be focused. As this form of sample analysis is considered only a crude estimate of gold-in-soil content, no comment on the results is made (Figure 16).
![[tech2023.gif]](https://capedge.com/proxy/6-K/0001137171-07-000955/tech2023.gif)
Figure 16 Eureka Soil Results
Some areas of auger samples were analyzed by conventional analytical methods. In the northern most part of the grid area there are a number of single point anomalies and one three point anomaly. These anomalies occur in areas of Poknokker activities where shear-hosted veining was noted. The limited extent of the anomalies and the presence of shear-hosted veins in areas of Pork Knocker activity, implies the source of the gold is from the relatively narrow shear-hosted veins. Further work is required to determine the source of the gold-in-soil anomalies.
Pinchevin-Cenac Grid
The Pinchevin-Cenac grid area covers the southeastern part of Benzdorp property (Figure 17) and is in an area of extensive alluvial mining. Results of the soil sampling highlight a number of areas of anomalous sampling. Of most interest are the anomalies north of Cenac Kreek and north of Pinchevin Kreek. Both anomalies were originally identified on the basis of gold “eye” as grain counts in auger sampling. Subsequent analysis of samples over the same area determined the extent of the greater than 0.3 gpt gold contour to be more limited than the area defined by gold grain counts. The anomalies as defined by analytical methods show both Cenac and Pinchevin to be restricted to
point anomalies. As in the case of Eureka, the source of the gold-in-soil anomalies appears to be quartz veining hosted in shear zones cutting mafic volcanic flows, breccias and tuffs.
![[tech2025.gif]](https://capedge.com/proxy/6-K/0001137171-07-000955/tech2025.gif)
Figure 17 Pinchevin-Cenac Grid
With the exception of two holes drilled in the Pinchevin anomaly, no systematic sampling or trending has been carried out on these two anomalies.
Elsewhere on the Pinchevin Grid are numerous single point anomalies greater than 0.3 gpt. None of these anomalies have yet been investigated to determine their source. The limited extent of the anomalies suggests the sources are likely narrow shear-hosted quartz veining.
Geophysical Survey
Terraquest Surveys of Toronto was contracted to fly 1900 line kilometers of airborne magnetics and radiometric geophysical surveys over the eastern portion of the Benzdorp Property. The survey was flown along east-west oriented lines spaced 150 metres apart with a ground clearance of 30 metres. The survey was completed on March 30, 2006 and data was received on May 19, 2006. S.J. Geophysics of Richmond, BC was contracted to carry out inversion of the data and other processing (Figures 18 to 21).
![[tech2027.gif]](https://capedge.com/proxy/6-K/0001137171-07-000955/tech2027.gif)
Figure 18 Location of Airborne Survey
The radiometric survey was hindered by thick forest cover. Areas of active Pork Knocker workings and the banks of the Lawa River where vegetation is removed are the only places where a response is observed.
Processed magnetic data has assisted in better defining the bed rock geology and in particular the favourable Benzdorp Volcaniclastic Sequence (BVS) and the quartz diorite intrusives. A key observation is the BVS unit is not as extensive as previously mapped, lying further to the east (Figure 19).
![[tech2029.gif]](https://capedge.com/proxy/6-K/0001137171-07-000955/tech2029.gif)
Figure 19 Interpreted Magnetic Structural Trends
![[tech2031.gif]](https://capedge.com/proxy/6-K/0001137171-07-000955/tech2031.gif)
Figure 20 CVG Shadow Map
The processed data also identified several major structures including an east-west fault with apparent left lateral movement that moved the BVS to the west to the north of the fault. Also of note is a major structure along the Lawa River that marks the eastern boundary of the BVS. The magnetic data also identified the main bodies of quartz diorite. This show the main intrusive bodies are concentrated in the southern part of the BVS around the JQA. This implies that it is unlikely there are additional JQA in the northern part of the BVS on the Benzdorp property.
![[tech2033.gif]](https://capedge.com/proxy/6-K/0001137171-07-000955/tech2033.gif)
Figure 21 Detailed Magnetic Inversion
It was hoped the magnetic data would identify smaller structures hosting the mineralized shear zones. Based on the processing done to date, the resolution of the survey is insufficient to be a direct targeting tool. Further processing of the data might assist in identifying smaller structures and intrusive bodies.
Item 13: Drilling
In 2003 the first phase of drilling was undertaken using a prospecting rig to complete holes to a maximum depth of 100 metres. With the exception of 1 hole drilled at Cenac and two holes in the Roche Creek and 1 hole at JQB areas, holes tested the JQA-JQS-JQW soil anomaly area. Encouraging results from the 2003 program prompted a second drill program in 2004. In the second drill program, a Longyear 38 was used. Location of the drill holes and sections are presented in Appendix III.
![[tech2035.gif]](https://capedge.com/proxy/6-K/0001137171-07-000955/tech2035.gif)
Figure 22 Location Phase 1 Drill Holes
Drilling in the JQA area outlined a 500m by 500m area of the gold-in-soil anomaly where porphyry-type alteration and quartz vein stockwork carried appreciable amounts of gold and/or copper. In the upper 30 to 70 metre thick saprolite layer leaching has removed much of the copper leaving only anomalous levels of copper (100 to 1000 ppm). Gold values in the saprolite based on analysis of both core and deep auger holes averages 0.5 gpt gold. In the non-weathered rock below the saprolite, gold grades in core are similar however, copper averages 0.15%. The composited value of all drill core was 0.514 gpt gold and 0.05% copper (assuming 0 value for samples not analyzed for copper). Despite the leaching of copper from the saprolite, there is no secondary enrichment of copper at the base of the saprolite. Copper leached from the saprolite must have traveled laterally away from the mineralized rock and was not preserved. The following table summarizes signif icant gold intersections from the 2003 and 2004 drilling on the JQA target. The averaged copper values in the table include the saprolite, which was not assayed for this metal.
Table: Au and Cu Composites for Benzdorp JQA Prospect | |||||
Hole ID | From (m) | To (m) | Length (m) | Gold (gpt) | Cu (ppm) |
BZD-03-01 | 0.00 | 74.37 | 74.37 | 0.47 | 605.63 |
BZD-03-02 | 0.00 | 71.32 | 71.32 | 0.58 | 591.77 |
BZD-03-03 | 0.00 | 71.63 | 71.63 | 0.37 | 19.44 |
BZD-03-04 | 0.00 | 113.39 | 113.39 | 0.63 | 500.64 |
BZD-03-05 | 0.00 | 79.25 | 79.25 | 0.55 | 846.30 |
BZD-03-06 | 0.00 | 65.53 | 65.53 | 0.56 | 201.88 |
BZD-03-07 | 0.00 | 44.20 | 44.20 | 0.69 | 189.92 |
BZD-03-08 | 0.00 | 60.96 | 60.96 | 0.56 | 27.18 |
BZD-03-09 | 0.00 | 3.05 | 3.05 | 0.28 | 109.14 |
BZD-03-10 | 0.00 | 41.15 | 41.15 | 0.32 | 192.30 |
BZD-03-13 | 0.00 | 100.58 | 100.58 | 0.82 | 572.64 |
BZD-03-14 | 0.00 | 4.57 | 4.57 | 0.36 | 517.38 |
BZD-03-15 | 0.00 | 81.49 | 81.49 | 0.48 | 409.54 |
BZD-03-16 | 0.00 | 88.39 | 88.39 | 0.51 | 195.54 |
BZD-03-17 | 0.00 | 24.38 | 24.38 | 0.43 | 72.13 |
BZD-03-18 | 0.00 | 67.80 | 67.80 | 0.55 | 1103.89 |
BZD-03-19 | 0.00 | 16.76 | 16.76 | 0.58 | 501.69 |
BZD-03-20 | 0.00 | 56.39 | 56.39 | 0.61 | 527.65 |
BZD-03-21 | 0.00 | 16.76 | 16.76 | 0.44 | 259.71 |
BZD-03-29 | 0.00 | 42.67 | 42.67 | 0.25 | NA |
BZD-03-30 | 0.00 | 57.91 | 57.91 | 0.34 | NA |
BZD-03-31 | 0.00 | 24.38 | 24.38 | 0.28 | NA |
BZD-03-32 | 0.00 | 65.53 | 65.53 | 0.31 | NA |
BZD-04-39 | 0.00 | 169.00 | 169.00 | 0.59 | 781.51 |
BZD-04-40 | 0.00 | 86.87 | 86.87 | 0.41 | 90.03 |
BZD-04-41 | 0.00 | 59.44 | 59.44 | 0.40 | 170.76 |
BZD-04-42 | 0.00 | 182.88 | 182.88 | 0.84 | 630.97 |
BZD-04-43 | 0.00 | 175.26 | 175.26 | 0.35 | 887.93 |
BZD-04-45 | 0.00 | 199.11 | 199.11 | 0.50 | 986.69 |
BZD-04-46 | 0.00 | 125.33 | 125.33 | 0.39 | 100.51 |
BZD-04-47 | 0.00 | 98.94 | 98.94 | 0.60 | 692.26 |
BZD-04-48 | 0.00 | 81.72 | 81.72 | 0.36 | NA |
BZD-04-49 | 0.00 | 4.57 | 4.57 | 0.58 | NA |
BZD-04-50 | 0.00 | 172.21 | 172.21 | 0.40 | 973.25 |
BZD-04-51 | 0.00 | 187.42 | 187.42 | 0.55 | 606.60 |
|
|
|
|
|
|
![[tech2036.jpg]](https://capedge.com/proxy/6-K/0001137171-07-000955/tech2036.jpg)
Figure 23 Phase 2 Dill Hole Location Map
The mineralization forms a funnel shaped body approximately 500 metres in diameter at surface that narrows at depth below the saprolite layer. The process of laterization and saprolitization caused lateral dispersion of the gold in the laterite and saprolite layers and is responsible for the upward flaring of the gold mineralization.
Drilling at the JQS was disappointing. Although alteration was similar to the JQA, the results for gold were low. No further work is warranted.
Drilling of the JQW and Poknokker area found the area to be underlain by a suite of meta sedimentary rocks (amphibolites, chlorite schist, and meta tuffs) and tonalite intrusive rocks. The alteration varied from potassic to propylitic. Drill hole depths varied from 100.6 metres to 144.8 metres with the upper 30 to 70 metres in laterite and saprolite material with no sulphide minerals present. Sulphide mineralization consists of pyrite and minor chalcopyrite in a quartz vein stockwork, fractures and disseminations were only observed at the bottom of the holes where oxidation was not intense. Gold values were disappointing with gold being restricted to short intervals. The best gold value was 1.2 gpt over 6 metres and highest value was 26.54 gpt over 1.52 metres at the collar of hole 24. This high value is from quartz vein fragments in lateritic material and is not considered to be in place. The overall low – grade values of the JQW do not warrant additional drilling.
The drill holes at Roche Kreek , JQB and Cenac were disappointing and did not return significant values in gold or copper. As the gold mineralization is believed to be sourced from relatively narrow structures, the failure to intersect a gold mineralization may be the result done to the drill holes not cutting the mineralized structures.
Item 14: Sampling Method and Approach
Scarce outcrop, heavy vegetation and laterite make conventional prospecting for mineralization on the Benzdorp property slow and ineffective. The approach to exploration has been to focus efforts within the drainages where Poknokkers have extracted alluvial gold.
To highlight prospective areas of the bedrock, vertical auger-soil sampling has been the primary tool. A hand auger is used by Canarc employees to penetrate the laterite layer. Holes are drilled to a one metre depth and soil collected from the lower-most 20 cm of the hole. To date most of the area underlain by the favourable greenstone rocks has been tested with auger sampling.
Areas where the initial auger sampling had values in excess of 0.25 gpt Au were tested with deep vertical auger holes up to 15m in length. One to three metre intervals of the cuttings were bagged and sent to FILAB (before 2004) or The Assay Lab (since 2004) and analyzed in an identical manner as the earlier auger samples.
Where appreciable gold mineralization was encountered in the deep auger holes either bulldozer trenching or diamond drilling was carried out. The need to excavate 6 to 8 metres coupled with the poor state of the bulldozer made trenching slow and expensive. For this reason, trenching was abandoned in favour of shallow diamond drilling.
Follow-up diamond drilling used NQ sized cone and were angled holes drilled in an orientation to cut the main trend of quartz veining as observed in trenches or Pork Knocker pits. Initially, a small prospector drill was used, but later a Longyear 38 was used, as there was no material cost saving by using the prospector drill. Both drills were operated by employees of Quest Drilling of Langley B.C.
A one-metre depth for initial auger sampling was chosen as this was deemed to be the maximum thickness of the laterite. A look through the logs of the holes shows this is the case in most areas of the property sampled. However, some of the auger holes did not penetrate the laterite and therefore the results do not represent the metal values in the underlying saprolite. It would have been better to drill the holes to a 2 metre depth. That being said, only a small portion of the auger holes failed to penetrate the laterite and the survey results are not materially affected by the portion of holes that failed to penetrate the laterite.
In addition to the auger sampling, channel and to a lesser extent grab samples were collected in pits and other alluvial workings of the poknokkers by Canarc geologists. The purpose of this sampling was to determine the gold content of the saprolite exposed in the pits. Channel samples were 2 metres in length.
Drilling used NQ-sized core. The core was collected from the drill site by a Canarc geologist and taken to a core logging facility in the main camp. The geology of the core was logged by a geologist who also marked out intervals for sampling. The sample interval was generally kept at 1 or 1.5 metres although where there were changes in rock type or increases in mineralization intensity, the lengths were varied to separate the mineralization types. The core was cut with a diamond saw by a company employee with one half of the sample placed in a core box for a permanent record.
The initial prospector drill had poorer core recoveries in the saprolite material than the Long Year 38. As the results in the saprolite obtained by the prospector drill were lower than that in the core from the Long Year 38, it was speculated that there may be gold lost from the friable material not recovered by coring. This supposition was based on experience of the geologists working on other projects in the Guyana Shield. Although the average grade of the saprolite is lower in the prospector collected core, the difference is not statistically significant.
The mineralization tested in the JQA zone is porphyry-type. As such, the angle diamond drill holes as well as the deep auger holes give an accurate prediction of both the copper and gold grades of the JQA. Further drilling of the zone will not materially change either the average grades or the size of the mineralized body. As the mineralization is in the form of disseminations and a stockwork of fracture and quartz vein stock work, sample intervals were mainly 1.5 metre intervals.
At the JQB, Roche and Cenac targets, drill holes may not have been optimally placed and therefore may have been drilled parallel to the mineralized structure or stopped short of the target. As none of these holes intersected mineralization, sampling of the core was kept to regular 1.5 metre intervals.
Item 15: Sample Preparation, Analysis and Security
The initial shallow auger samples were collected by employees of the company. Holes were drilled to 1 metre depth with a soil sample collected from the bottom 20 cm of the hole. In order to ensure reliable assay returns, a quality control/quality assurance program was implemented. In the field, a duplicate sample was collected approximately every twentieth sample. The two samples were sent with different sample numbers, and assayed separately to compare them for consistency. Also, for every 20 samples a “blank” was sent in to ensure proper cleaning and recalibration of the equipment at the laboratory. The collected soil was placed in cloth bags, carefully numbered, and then sent to a laboratory for analysis for gold and a number of other elements.
Prior to 2004, samples were sent to FILAB in Cayenne, French Guyana. Since 2004, soil samples have been sent to The Assay Lab (associated with Inspectorate Labs). The switch from FILAB was made because the FILAB is not certified while The Assay Lab was ISO 2002 approved.
Both laboratories used the same analytical procedure. The auger samples were dried and sieved and a 30 gram sub-sample separated. This 30 gram sub sample was analyzed for gold by atomic absorption. Other elements were analyzed by ICP. As a further quality control, FILAB and The Assay Lab both inserted their own blanks. Furthermore, every 12 to 15 samples were assayed one or more times in order to check for consistency of results. A standard sample was also inserted and routinely assayed and recorded.
With the deeper auger holes, the length of the hole was divided into intervals from 1 to 3 metres by Canarc employees. Sample from the intervals were bagged, numbered and sent to FILAB in Cayene French Guyana. The sample control and quality assurance was identical to that used in the shallower auger holes.
Rock samples collected from the poknokker pits were for the most part 2 metre channel samples cut in the saprolite. Approximately 1 kilogram of the cuttings were placed in to a carefully marked cloth bag, sealed with a locking tie and sent to either FILAB or The Assay Lab. Analysis of these samples was identical to the auger samples.
Core from diamond drilling was cut by company employees and one half of the core placed back into the core boxes. The other half of the sample was placed into cloth bags that were sealed with locking straps. The samples were carefully tagged with the sample number and bundled for shipment to FILAB (prior to 2004) or The Assay Lab (since 2004). Duplicate and blanks were inserted into the samples sent to the laboratories. Duplicate samples were quarter core. Additionally, the laboratories inserted their own blanks and standards into the sample stream.
At the laboratories, the core was dried, crushed and split with a 30 gram sub sample separated for analysis. The 30 gram sub sample was analyzed by fire assay methods with a gravimetric finish for samples with greater than 1 gpt.
Samples sent to The Assay Lab were in the custody of company employees from the time they were collected until they were delivered to the airline. In Paramaribo, the samples were collected at the airport by a company employee and delivered to the laboratory. Prior to 2004 the samples were shipped to Paramaribo in the same manner as for the samples destined for The Assay Lab. However, in the case of these samples, the Canarc employee delivered the
samples to a customs boker to be sent to FILAB in Cayenne, French Guyana. The samples were often delayed in customs waiting for clearance.
The Author reviewed the blank and duplicate comparisons and has the following comments. The blank sample was prepared by Canarc employees by collecting saprolite exposed in an area where no known mineralization existed. The sample was neither mixed nor was independent analyses carried out to ascertain the gold content of this blank standard. In reviewing the results of the blank analyses, the Author noted that on average the blank contained 0.1 gpt gold with some analysis up to 0.5 gpt. The Author did note that the blanks done by both laboratories were consistently at or very close to 0 gpt gold. For this reason the Author has no concern about the high gold values in the field blanks as these field blanks are not true blank samples or proper standard samples. It is imperative that a proper blank sample be prepared and used in future sampling programs.
The review of the duplicate samples found a correlation coefficient of 0.904 between the original and duplicate samples. There is no bias toward either the duplicate or original sample and the differences appear to be random and due to a nugget effect or possible the size difference between quartered core and half core.
![[tech2038.gif]](https://capedge.com/proxy/6-K/0001137171-07-000955/tech2038.gif)
Figure Original vs Duplicate Samples
In the author’s opinion, with the exception of the blank samples inserted by the field staff, the quality control and assurance measures and security used were adequate. Going forward a proper field blank needs to be prepared and used. There is no indication that any analytical problems exist and the results of the analysis are fair estimates of the metal content of the samples.
Item 16: Data Verification
The writer visited the project on February 18 and 19, 2006. While on the property, core from the JQA was examined and compared with assays and drill logs. The Author’s observations were in agreement those recorded in the logs. Core was properly cut and no bias was noted in the splitting. The Author also visited the Eureka Kreek area, Poknokker (JQW), Cenac and Pichivan areas where he examined Poknokker excavated pits exposing mineralization. The Author also checked recent auger sites to verify that the holes were drilled and that sites were correctly marked.
The writer has reviewed the assay sheets, the duplicates and blanks from work done since 2000. No anomalies or contradictions were noted in the check assays, blanks or standards.
Spot checks of two auger drill sites were made, the sample numbers agreed with those marked on the map. The writer did not walk all sample lines and therefore cannot guarantee that all samples were correctly taken, nor if “pit” sampling occurred. However, as most of the gold anomalies occur in areas of Poknokker pits, and subsequent follow-up work has found a gold source, the risk of fraudulent sampling is considered very low.
The writer visited Poknokker pits in several of the zones and confirmed the style and type of mineralization. The two large trenches on the JQA are no longer accessible and the writer did not enter them.
Prior to 2000, sample quality control and assurance is not well documented. The writer cannot confirm that appropriate measures were taken to ensure samples were properly treated, analyzed and handled. As most of the work done in the property was after 2000, sampling done prior to 2000 does not have a material impact on current status of the property. Furthermore, current programs are re sampling the areas tested prior to 2000.
Item 17: Adjacent Properties
The Antino property of Reunion Gold adjoins the property to the south.
Item 18: Mineral Processing and Metalurgical Testing
To gain an understanding of the metallurgy of the JQA mineralization, preliminary metallurgical tests were carried out on samples taken from the JQA target. Two samples were collected. One sample of drill core reject material was blended from 2004 holes to produce a 20 kilogram sample assaying 0.48 gpt gold and 0.13% copper. This sample was sent to Resource Development Inc. (RDI) of Denver, Colorado, U.S.A. A second sample of saprolite material weighing 44 kilograms was sent to Knelson Research and Technology Centre of Langley, BC, Canada to investigate gravity recovery of gold. The calculated head grade of the saprolite was 1.17 gpt gold. Details of the study methods and findings are provided in Appendix IV.
Test work on the saprolite mineralization shows that gold is very fine grained with poor recoveries of gold by gravity concentration. Flotation tests show 80% of the gold is recovered after subsequent cyanidation.
Test work on the non-weathered mineralization investigated recoveries of gold and copper. Direct cyanidation of the mineralization indicates all of the gold and 53.5% of the copper is soluble. The high percentage of soluble copper makes direct cyanidation problematic due to oxidation of the cyanide solution. Tests confirmed the hard nature of the rock with a band index of 15.75. As in the case of the saprolite, gold is very fine grained and little is recovered by gravity concentration. Floatation tests found 80% of the copper and 57% of the gold is recovered in a rougher concentrate. Fine grinding did not improve recoveries of either copper or gold.
Item 19: Mineral Resource and Mineral Estimate
No independent calculation of the mineral resource has been undertaken.
Item 20: Other Relevant Data and information
To the best of the writer’s knowledge, all relevant data and information pertaining to the Benzdorp property is included in this report.
Item 21: Interpretation and Conclusions
Exploration on the Benzdorp property has identified potential for porphyry gold-copper mineralization and for orogenic lode gold mineralization.
Nearly all of the money and work on the project has focused on the evaluation of the JQA target. This work shows the JQA mineralization is limited to a 500m by 500m area with the average assay grade of deep auger and diamond drill holes being 0.5 gpt gold and 0.05% copper (assuming 0 value for samples not analyzed for copper). There is enough drilling to preclude additional drilling will significantly change the grade and with exception of to depth, the mineralization is closed off. The expected size and grade of the JQA appear well below that required for an economic deposit in a remote location like Benzdorp. For this reason, no additional work is recommended for the JQA target. The upper saprolite portion of the JQA has gold grades close to those of deposits like Paracutu. If significantly more such mineralization is found, JQA might contribute to an economic cluster of deposits.
Auger soil sampling has identified a number of smaller gold-in-soil anomalies. Most have not been followed up and those that have have received only cursory evaluation. None of the anomalies are of sufficient size to indicate another area of gold-copper porphyry mineralization. A more likely source of the gold is shear-hosted vein systems. Additional evaluation of these targets is warranted.
Results from 50% of the recently completed shallow auger sampling are pending. When received, these results may highlight additional gold exploration. If additional gold-in-soil anomalies are identified, these should be followed up.
Item 22: Recommendations
It is recommended that exploration continue with objective of locating both additional low-grade saprolite mineralization and higher-grade vein-type mineralization in order to identify an economically viable deposit. To this end, the exploration should focus both on targets outlined by the shallow auger sampling including the VHA and VHB anomalies on the Van Heemstra grid, the JQB, Eureka Kreek and Pinchivin grids as well as any additional gold-in-soil anomalies that come from the analysis of the remaining samples collected to July 31.
Upon receipt of results and interpretation of all the geochemical data, it is recommended that a preliminary program of 3,000 metres of diamond drilling be completed to assess the anomalies both currently defined and those that may be outlined by the pending sample results. Rather than additional deep auger sampling and trenching, each anomaly should be assessed through the drilling of 3 holes at 50 metre spacing at a dip of -70º to test the lower limits of saprolization at depths of between 70 and 100 metres.
Proposed Budget to Next Key Decision Point | |
|
|
Salaries | 50,500 |
Consultants | 14,400 |
Transportation | 20,300 |
Food & Accommodation | 2,300 |
Geochemical Analyses | 37,500 |
Drilling | 300,000 |
Supplies | 19,000 |
Property Maintenance | 1,000 |
Contingency @ 10% | 19,750 |
SUB TOTAL Contingency @ 7% | 497,250 32,500 |
TOTAL | 497,250 |
|
|
Item 23: References
Canarc Van Suriname, 2003 Annual Report |
| |||||
|
| |||||
Canarc Van Suriname, 2004 Annual Report |
| |||||
|
| |||||
Canarc Van Suriname, 2005 Annual Report |
| |||||
|
| |||||
De Vletter, D.R., (1984) | Economic Geology and Mineral Potential of Suriname. Sur.GMD Meded (Contribution: To Geol. Of Sur. No. 8) No. 27, pp 91-129 | |||||
|
| |||||
Gibbs, A.K., and Barron, C.N., 1993 | The Geology of the Guyana Shield Oxford Monographs on Geology and Geophysics. | |||||
|
| |||||
Lewis, P., 1997.
| Structural Interpretations: JER-I Satellite Radar Images: Suriname | |||||
|
| |||||
McClintock, J. et al. (2006) | Preliminary Economic Evaluation, JQA Zone, Benzdorp Property Suriname. | |||||
|
| |||||
Item 24: Date and Signature Page
The effective date of this report is October 1, 2006
“John McClintock P.Eng,”
John McClintock P.Eng,
October 1, 2006
CERTIFICATE OF AUTHOR
I, John McClintock do hereby certify that:
1.
I am currently employed as President by:
Canarc Resource Corp.
Suite 800-850 West Hastings Street
Vancouver, BC
V6C 1E1
2.
I graduated with a degree in BSc Hons from the University of British
Columbia in 1973.
3.
I am a member of the Association of Professional Engineers and Geoscientists
of the Province (No. 12078).
4.
I have worked as a geologist for a total of 33 years and have examined and reported on a numerous gold deposits and copper gold porphyry deposits through out the world including Brazil, Bolivia, Canada, Mongolia, Australia, Chile, Peru, Argentina, Pakistan and China.
5.
I have read the definition of “qualified person” set out in National Instrument 43-101 (NI 43-101) and certify by reason of my education, affiliation with a professional association (as defined in NI 43-101) and past relevant work experience, I fulfill the requirement to be a “qualified person” for the purposes of NI 43-101.
6.
I am responsible for the preparation of all section of the technical report titled Summary Report Benzdorp Property, Suriname and dated October 1, 2006 (the “Technical Report”) relating to the Benzdorp Property. The information in this report was obtained from reports provided by Canarc Resource Corp. I visited the Benzdorp Property on February 18 and 19, 2006 and examined drill core and surface occurrences of mineralization.
7.
Prior to January 1, 2006 I had no involvement with the Benzdorp Property.
8.
As of the date of this certificate, to the best of the writer’s knowledge, information and belief, this Technical Report contains all scientific and technical information that is required to be disclosed to make the Technical Report not misleading.
9.
I am not independent if the issuer when applying all of the tests in section 1.5 of National Instrument 43-101 as I am an insider.
10.
I have read national Instrument 43-101 and the Technical Report has been prepared in compliance with that instrument.
Dated this 1st day of October, 2006
“John McClintock P.Eng,”
Appendix I Drill Sections
Geological Symbol Key:
ANAM: Amygdaloidal Andesite |
BRE: Breccia |
BRK: Bedrock |
COLL: Colluvium |
DFBP: Dyke Feldspar Biotite Porphyry |
DFE: Felsic Dyke |
DURI: Duricrust |
FHPO: Feldspar Hornblende Porphyry |
FLT: Fault |
FLT: Fault |
FPO: Feldspar Porphyry |
FQBHP: Feldspar Quartz Biotite Hornblende Prophyry |
FQPO: Feldspar Biotite Porphyry |
GOUG: Gouge |
HBPO: Hornblende Biotite Porphyry |
HYBX: Hydrothermal Breccia |
LAT: Laterite |
LPTF: Lapilli Tuff |
MOTL: Mottled Zone |
NC: No Data |
NC: No Data |
OVBR: Overburden |
PISO:Pisoliths |
QG: Vein Quartz Geothite |
SAP: Saprolite |
SDYK: Saprolite Dyke |
SFIN: Felsic Intrusive |
SIIN: Intermediate Intrusive |
SIVO: Intermediate Volcanics |
SRK: Saprolite Transition |
VLI: Vein Limonite |
VLIQ: Vein Quartz Limonite |
WO: Washout |
XENO: Xenolith |
![[tech2039.jpg]](https://capedge.com/proxy/6-K/0001137171-07-000955/tech2039.jpg)
![[tech2040.jpg]](https://capedge.com/proxy/6-K/0001137171-07-000955/tech2040.jpg)
![[tech2041.jpg]](https://capedge.com/proxy/6-K/0001137171-07-000955/tech2041.jpg)
![[tech2042.jpg]](https://capedge.com/proxy/6-K/0001137171-07-000955/tech2042.jpg)
![[tech2043.jpg]](https://capedge.com/proxy/6-K/0001137171-07-000955/tech2043.jpg)
![[tech2044.jpg]](https://capedge.com/proxy/6-K/0001137171-07-000955/tech2044.jpg)
![[tech2045.jpg]](https://capedge.com/proxy/6-K/0001137171-07-000955/tech2045.jpg)
![[tech2046.jpg]](https://capedge.com/proxy/6-K/0001137171-07-000955/tech2046.jpg)