UNITED STATES
SECURITIES AND EXCHANGE COMMISSION
Washington, D.C. 20549
FORM N-CSR
CERTIFIED SHAREHOLDER REPORT OF REGISTERED MANAGEMENT INVESTMENT COMPANIES
Investment Company Act file number 811-06199
Brown Capital Management Mutual Funds
(Exact name of registrant as specified in charter)
1201 N. Calvert Street, Baltimore, Maryland 21202
(Address of principal executive offices) (Zip code)
Capitol Services, Inc.
1675 S. State Street, Suite B, Dover, Delaware 19901
(Name and address of agent for service)
With a copy to:
John H. Lively
Practus, LLP
11300 Tomahawk Creek Parkway, Suite 310
Leawood, Kansas 66211
Registrant’s telephone number, including area code: 410.837.3234
Date of fiscal year end: March 31
Date of reporting period: March 31, 2023
Item 1. | REPORTS TO STOCKHOLDERS. |
Small Company Fund
Investor Shares (BCSIX)
(CUSIP Number 115291833)
Institutional Shares (BCSSX)
(CUSIP Number 115291403)
Mid Company Fund
Investor Shares (BCMSX)
(CUSIP Number 115291809)
Institutional Shares (BCMIX)
(CUSIP Number 115291783)
International All Company Fund*
Investor Shares (BCIIX)
(CUSIP Number 115291858)
Institutional Shares (BCISX)
(CUSIP Number 115291767)
International Small Company Fund
Investor Shares (BCSVX)
(CUSIP Number 115291742)
Institutional Shares (BCSFX)
(CUSIP Number 115291759)
* Formerly International Equity Fund
Annual Report
March 31, 2023
Table of Contents
1 | |
1 | |
8 | |
10 | |
10 | |
16 | |
18 | |
18 | |
23 | |
The Brown Capital Management International Small Company Fund | 26 |
26 | |
31 | |
34 | |
35 | |
36 | |
40 | |
48 | |
57 | |
58 | |
59 | |
64 |
Annual Report | March 31, 20231
The Brown Capital Management Small Company Fund
Management Discussion of Fund Performance (Unaudited)March 31, 2023
The Small Company Fund marked its 30th anniversary in 2022, but our desire to celebrate has been muted. The 12 months ending March 31 (which is the fiscal year for Brown Capital mutual funds) have been difficult indeed. A number of challenges carried over from the previous fiscal year, such as COVID-related shutdowns and supply-chain constraints. On top of that, we have seen the highest inflation rates in decades, and the fastest pace of interest-rate hikes since the 1980s. Then, in March 2023, the failures of Silicon Valley Bank and Signature Bank raised investor concerns about a potential banking crisis. These events drove significant swings in the stock market in the fiscal year’s final weeks, as speculation swirled about which other banks might be at risk, whether there is a need for increased banking regulations, and the risk of a recession.
As the Federal Reserve and other central banks aggressively tightened monetary policy in 2022, equities and other long-duration assets such as Treasury long bonds tanked. Within equities, though, it seemed that the “growthier” the company, the more the stock price fell. Higher inflation caused investors to more heavily discount the value of future cash flows. For a Fund like ours, in which we hold companies with revenue and earnings growth projected years into the future, the damage was particularly acute. For the year, the Small Company Fund (Investor shares) fell 21.26%, trailing the Russell 2000® Growth Index’s decline of 10.60% by more than 1,000 basis points. Those of you who are long-standing investors in the Small Company Fund know that we are a long-term, benchmark-agnostic manager, and volatility in performance relative to the index in short-term time periods is to be expected.
Looking deeper, what is most notable is that our underperformance was spread pretty evenly across the sectors of our portfolio. The reality is, in the fiscal year most of our companies have improved operationally and fundamentally as we have expected, but their share prices have suffered nonetheless. In fact, 85% of the 45 positions we held at some point in the year detracted from performance. This shows that what drove our underperformance was more of a negative shift in market sentiment—a disconnect between fundamentals and stock prices—than blow-ups of the individual companies we hold. (For a discussion of some of the biggest detractors to performance, see below.) Of course, it is natural and expected that our process should go out of favor at some point. Perhaps our outperformance in the first quarter of 2023 (the Fund returned 8.94% vs. 6.07% for the Russell 2000® Growth), when rate increases decelerated and inflation moderated, is an early sign of fundamentals retaking center stage. Of course, with all eyes on the Fed, the banking sector and the risk of a recession, who knows if that will be the case going forward.
As we begin our fourth decade, we remain focused on what we do: identifying and investing in what we call Exceptional Growth Companies (EGCs). These are companies that exhibit durable revenue growth, strong product differentiation, strong balance sheets and other characteristics that allow them to sustain growth over long time periods, regardless of the market environment.
Durable Revenue Growth: Our initial investment horizon is 3-5 years, but around a quarter of the 41 companies in our Fund have been held for more than 10 years. With this long time horizon in mind, we look for EGCs that are exhibiting not only strong growth currently, but also the potential for sustained growth for years into the future.
Strong Product Differentiation: Our portfolio companies provide differentiated products and services that allow them to defend their market presences over a long time period. A number of our EGCs own patents that protect their intellectual property, or offer innovative products and solutions that are difficult to replicate. The average gross margin of the companies in our Fund is more than 60%, demonstrating the strong value-add provided by their products. We do not own companies that offer commodity products, or that have limited pricing power.
Strong Balance Sheets: Many of our EGCs have significant amounts of cash and little to no debt. Specifically, 70% of our portfolio companies are in a net cash position, and nearly 70% of our holdings generated positive cash flow from operations in their last fiscal year. This provides our companies with staying power through uncertain economic times and allows them to invest the necessary resources to enable future growth.
These characteristics and others allow our portfolio companies to execute their growth strategies, even in uncertain economic conditions such as today’s. While the current economic environment might remain volatile and challenging for some time, we are steadfastly focused on the disciplined application of our investment approach. We believe our Fund is well positioned and we are confident that our philosophy of investing in EGCs over a long-term horizon should enable the Fund to outperform in the long run, just as we have throughout the first 30 years of the strategy. Since inception, the Fund has achieved annualized returns of 10.90%, exceeding the Russell 2000 Growth benchmark return of 7.31% by 359 basis points on an annualized basis.
Performance: Contributors
Among the top contributors to performance for the fiscal year ended March 31, 2023 were Abiomed (ABMD) and Ansys (ANSS).
Abiomed manufactures and sells a minimally invasive heart-recovery device called the Impella. The Impella is a small device that pumps blood during cardiac procedures, alleviating pressure from the ventricle wall and allowing the heart to rest. This gives cardiologists time to achieve more complete revascularization, which improves patient outcomes. Superior patient outcomes demonstrated through clinical studies and real-world evidence, together with continued expansion of Abiomed’s portfolio of FDA-approved devices, should drive significantly greater adoption and long-term revenue growth.
2www.browncapital.com
The Brown Capital Management Small Company Fund
Management Discussion of Fund Performance (Unaudited)March 31, 2023
On November 1, Abiomed announced it had entered into a definitive agreement to be acquired by Johnson & Johnson for $380 per share in cash, representing a 51% premium, plus milestone payments worth up to an additional $35 per share to be paid out over the next 5-7 years. The acquisition was completed on December 22.
ANSYS is a provider of engineering-simulation software used in product design and testing across a wide variety of industries, including aerospace and defense, automotive, industrial equipment and electronics. The company’s software reduces the expense of physical prototyping and testing, and cuts the overall time to market. As computing power becomes cheaper, it is increasingly economical to test new product designs using software simulation instead of physical prototyping. In the more than 20 years that we have owned ANSYS in our Fund, the company has demonstrated durable revenue growth, thanks to these long-term market-growth drivers, as well as strong innovation and management execution.
ANSYS’s strong stock-price performance during the year was driven primarily by its robust earnings results and solid execution on the part of management. The company achieved solid revenue growth and increasing profitability as operating margins for the full year 2022 were 29%, improving nearly 200 basis points year over year.
Performance: Detractors
Among the top detractors to performance for the fiscal year ended March 31, 2023, were Xometry (XMTR) and Datadog (DDOG).
Xometry operates an online manufacturing platform that allows customers to receive quotes, place orders and receive custom-manufactured parts meeting their specifications. The platform is based on a network of more than 5,000 manufacturing partners across multiple countries that provides a broad range of manufacturing capabilities, including CNC (Computer Numerically Controlled) machining, injection molding, 3D printing and sheet-metal cutting. Xometry’s products save time and money by making procurement and manufacturing more efficient. Buyers quickly receive quotes and finished parts, and manufacturing partners reduce excess manufacturing capacity by sourcing additional jobs through the Xometry network.
In the second half of the year, Xometry reported lower-than-expected revenue and earnings, and reduced projections for 2023, which sank the stock price. For the full year, the total number of customers purchasing through the platform increased by 45% over the previous year, and the company achieved its greatest number of orders ever in the fourth quarter. Revenue in 2022 increased 75% over 2021, partly aided by an acquisition. However, due to a lower pricing dynamic in the third and fourth quarters, average order sizes were below expectations, hurting revenue growth. Looking forward, company management noted that prices began stabilizing early in the first quarter of 2023, partly due to management adjusting its pricing algorithm. Xometry remains a leader and innovator in its industry, and we believe the company is in the early stages of a growth trajectory that should last for many years.
Datadog is a leading SaaS-based, information technology (IT)-monitoring and analytics software platform for developers, IT operations and business users. The platform automates the monitoring of infrastructure, applications databases, networks, logs and security. Datadog’s platform is differentiated by providing a unified view of these systems via a visual interface configured to the needs of the user. We believe the technology saves time, money and headaches by driving collaboration among development, operations, security and business teams; accelerating time-to-market of new software; reducing the time needed to resolve problems; improving infrastructure efficiency; improving security; and enabling a better understanding of customer behavior.
During the year, the company reported impressive revenue growth of 63% over the prior year period. However, the company provided forward revenue projections that were lower than expected, which negatively impacted the company’s stock price. Datadog was a top contributor for the full year 2021 and is a prime example of an EGC with durable revenue growth. The company is innovating rapidly and is significantly increasing its market opportunity by successfully expanding beyond its core market into adjacent product areas, which we believe provide it with a long runway for growth into the future.
New Additions
During the year, we added eight new companies to the Small Company Fund. In chronological order, they were Xometry (XMTR), Enfusion (ENFN), Cytek Biosciences (CTKB), Vicor (VICR), Clearwater Analytics (CWAN), Workiva (WK), Inari Medical (NARI) and Energy Recovery (ERII).
Xometry is discussed in the Detractors section above.
Enfusion provides an innovative, cloud-based, multi-tenant SaaS platform tailored to the investment-management industry. The platform sits on a single database, easing collaboration and communication between portfolio managers, traders, compliance, accounting, operations and investor reporting. The platform manages several complex workflows including placing orders, reconciling, allocating trades, reporting and producing investor statements. The platform allows investment managers to develop new products, bring them to market faster and reduce the cost of software ownership, thereby saving time, money and headaches. Enfusion has historically served mostly smaller hedge funds with assets under management of $200 million to $5 billion. Now the company is increasingly attracting larger hedge funds and traditional asset managers, significantly expanding its market opportunity.
Annual Report | March 31, 20233
The Brown Capital Management Small Company Fund
Management Discussion of Fund Performance (Unaudited)March 31, 2023
Enfusion has been gaining market share and converting clients from legacy systems that are often fragmented, inflexible, dependent on inefficient manual processes, and costly to upgrade. As the investment-management industry is facing increased complexity from globalization, consolidation, regulatory and investor requirements, and a need for remote access, we believe that Enfusion is well positioned to address these needs and solve problems for its customers for years to come. Enfusion generated revenue of $150 million in 2022.
Cytek Biosciences provides instruments, consumables and software that enable researchers and biopharma companies to perform various types of cell analysis using flow cytometry, which is a technique used to detect and measure physical and chemical characteristics of a population of cells. Cytek’s instruments are used for cell counting and sorting, determining cell characteristics and functions, detecting microorganisms, diagnosing health disorders, and more. These capabilities help in areas such as infectious disease, immuno-oncology, blood-cell disorders, allergies, autoimmune diseases and many other applications. Cytek’s customers comprise many of the leading pharmaceutical companies, academic research centers, clinical research organizations and medical schools. The company’s patented Full Spectrum Profiling optical-detection technology allows for the simultaneous identification of a greater number of biomarkers than can be detected using traditional flow-cytometry methods. This capability saves time, money and headaches for Cytek’s customers due to the increased efficiency of research processes and the high-resolution results produced quicker and cheaper than with competitors’ solutions. The company recently launched its own line of consumable reagents to be used with their instruments, which provides an additional high-margin revenue stream to the company. Due to the current low penetration of Cytek’s products and increasing adoption of its instruments and reagents, we expect Cytek to grow revenue and profitability for many years into the future. Cytek generated revenue of $164 million in 2022.
Vicor has built an industry-leading position in high-performance voltage converters based on decades of innovation. Voltage converters lower or raise electrical voltage to a desired level, with a corresponding opposite change in current. The efficiency and size of power converters is an increasing impediment to advances in the performance of microprocessors, which has driven Vicor to be a leading supplier to manufacturers of supercomputers and artificial intelligence (AI) processors. Vicor’s products deliver superior performance including greater power, smaller size, higher conversion efficiency, less magnetic interference and better reliability. The greater efficiency reduces the Total Cost of Ownership to Vicor’s clients and is more environmentally friendly. That is driving increasing demand from hyper-scale cloud providers. Finally, efficiency and weight are important design criteria for electric vehicle (EV) manufacturers, a new avenue of growth for Vicor. We believe the increasing importance of power-converter performance should drive demand across significant new markets and strong growth for years to come. Vicor generated revenue of $399 million in 2022.
Clearwater Analytics Holdings provides a leading cloud-based, investment-accounting software used for reporting, performance measurement, compliance and risk. The platform automatically ingests more than 2,500 daily data feeds from custodians, trading systems and pricing information sources. It connects, aggregates and reconciles portfolio information, and serves as a single source of truth for every asset in client portfolios. The platform automates client workflows and simplifies reporting and regulatory requirements, saving clients time, money and headaches. Historically, Clearwater’s customers were primarily the treasury departments of large global corporations and insurance companies. Through R&D and acquisitions, Clearwater is expanding the functionality of its software and has begun moving into the market for large asset managers as well as state and local governments. We believe the expansion of Clearwater’s addressable market provides a significant opportunity for future growth. Clearwater Analytics Holdings generated revenue of $303 million in 2022.
Workiva is a cloud content- and workflow-management company that offers a modern, extensible platform for a number of reporting use cases including financial regulatory filings, governance, risk management and ESG (Environmental, Social and Governance). Initially, Workiva provided solutions to help U.S. public companies file SEC reports. Over the past several years, Workiva has developed new products in several adjacent markets including GRC (Governance, Regulatory and Compliance), statutory reporting and ESG. While historically most of Workiva’s clients were U.S.-listed companies, the product expansion has broadened its reach to private, international and government organizations. The company serves more than 5,000 customers across the globe, including 70% of Fortune 1000 companies. We believe Workiva’s expanding portfolio of products and broadening market reach provide the company with a large growth opportunity. Workiva generated revenue of $538 million in 2022.
Inari Medical is a medical-device company that specializes in the treatment of Venous ThromboEmbolism (VTE). VTE represents the third most common vascular diagnosis in the U.S. after myocardial infarction (heart attack) and stroke. Inari’s flagship products, the ClotTriever and the FlowTriever, remove large clots from the venous system. Venous clots and arterial clots differ and require different device characteristics. ClotTriever and FlowTriever are minimally invasive, catheter-based mechanical thrombectomy systems that can handle the specific characteristics of the venous system. The company currently sells its products primarily in the U.S., which has an estimated total addressable market of more than $6 billion, but Inari has additional opportunities for growth in international markets in the future. We estimate the company has less than 10% share in its addressable market for its currently approved products. In addition, Inari has a number of products in its pipeline that we believe can further grow the company’s market opportunity in the future. Inari Medical generated revenue of $384 million in 2022.
Energy Recovery develops and sells products that are primarily used in large water-desalination plants, which turn saltwater into drinkable water. As regions of the world are increasingly experiencing water crises, desalination plants are helping to meet these needs. Water desalination is an energy-intensive process. The benefit of Energy Recovery’s products is that they generally cost less than 2% of the total cost of a plant, yet can reduce the total energy costs of the plant by up to 60%. This is a far greater benefit than what is available from competing products in the market. Energy Recovery’s
4www.browncapital.com
The Brown Capital Management Small Company Fund
Management Discussion of Fund Performance (Unaudited)March 31, 2023
products include a range of proprietary, patented pressure exchangers, turbochargers and pumps. The pressure exchangers have an innovative design that uses ceramic materials, offer 97%-plus efficiency in desalination, and last more than 25 years. Most of the company’s revenue today comes from pressure exchangers used in large Sea Water Reverse Osmosis desalination plants. However, the company is in the early stages of expanding the use of pressure exchangers into a number of additional markets, including CO2 refrigeration and industrial wastewater treatment, which we believe could significantly add to the company’s long-term growth opportunity. Energy Recovery generated revenue of $126 million in 2022.
Deletions
During the year, we eliminated six companies from the Small Company Fund: Anaplan (PLAN), DMC Global (BOOM), Abiomed (ABMD), Blackbaud (BLKB), American Software (AMSWA), and Duck Creek Technologies (DCT), discussed in chronological order.
Anaplan makes enterprise, cloud-based software for businesses to use for strategic planning across finance, sales, supply chain, human resources and marketing. The software allows customers to create and manage planning models using a common data repository, leading to more integrated planning processes. To react quickly to changes in today’s dynamic business environment, companies are looking for more modern, collaborative and integrated planning solutions. Anaplan is the only enterprise platform that can offer connected planning at scale, enabling analysts and managers from multiple areas to work on integrated plans using a single data set.
During the first quarter of 2022, private equity firm Thoma Bravo announced its planned acquisition of Anaplan at a premium of more than 25% to the company’s stock price at the time. This acquisition was completed during the second quarter, which resulted in the company being removed from the Fund.
DMC Global manufactures industrial niche products for the energy, industrial and transportation markets, and operates in two segments: DynaEnergetics and Nobel Clad. DynaEnergetics manufactures explosive perforating systems used to create flow paths for petroleum during well completion in the drilling process for oil and gas. The system’s detonation requires an electronic code, protecting it from interference from currents, static electricity and other causes of unintentional detonation. This improves efficiency and safety during the well-completion process. DMC’s Nobel Clad segment makes explosion-welded (EW) specialty-metal products used where corrosive and temperature-resistant qualities are critical in energy, chemicals, shipbuilding and other industrial applications. The Nobel Clad’s EW products address mission-critical areas where traditional welding products do not suffice. We purchased DMC back in September 2007 for the company’s EW business. During our holding period, the company expanded into DynaEnergetics in pursuit of other growth opportunities. Although each segment has produced solid growth over time, they both sell into cyclical growth industries. Also, the company has significant market share in each of its end markets, suggesting the runway for growth could be limited going forward. DMC would need to make significant acquisitions to add a possible third business segment to enhance growth.
On December 17, 2021, DMC agreed to acquire Arcadia, Inc., a privately held supplier of architectural products and premium windows and doors for the commercial and high-end residential markets. DMC management thinks the companies enjoy similarities as innovative, asset-light, service-model businesses. We did not think the acquisition made sense, and as a result, we decided to sell DMC out of the Fund.
Abiomed is discussed in the Contributors section above.
Blackbaud is a global provider of software systems and services to nonprofit organizations and the K-12 education market. The company offers a wide range of products and services that enable its customers to increase donations, reduce fundraising costs, enhance constituent communications and improve internal operations. We have owned Blackbaud in the Small Company Fund for more than 15 years. During this time, the company grew its revenue from less than $200 million to more than $1 billion. The company also increased its market share in its core markets and entered a number of new markets. However, as the company matured, its organic growth rate slowed to low-to-mid single digits. Also, we thought the company stopped innovating on its platform, and instead relied on acquisitions to expand its product portfolio. For these reasons, we sold Blackbaud out of the Fund during the quarter.
American Software, Inc. provides software solutions that help its small, mid-sized and large enterprise customers better forecast demand and increase efficiency in their supply chains. We first purchased American Software in June 1997. Our thesis for owning the company has been that the demand for supply-chain automation should grow as consumer and retail companies deal with evolving consumer preferences. The company underwent a transition beginning in 2014 from offering its solutions in an on-premise license model to a cloud-based subscription model. While this transition helped drive an increase in the proportion of recurring subscription revenue, the company’s revenue growth slowed to low single digits as the company stopped innovating, and a number of strong competitors gained share. Because of these factors, we decided to sell the company out of the Fund.
Duck Creek Technologies is a provider of SaaS software that runs the mission-critical core processes at property and casualty (P&C) insurance companies. Duck Creek has built an end-to-end, enterprise-scale, SaaS platform to run policy administration, claims management and billing, as well as other add-on products. We added Duck Creek to the portfolio in the third quarter of 2021. On January 9, 2023, Duck Creek announced that it had agreed to be acquired by the private equity firm Vista Equity Partners for $19 per share. The acquisition closed on March 30, 2023, and hence the holding was removed from the Fund.
Annual Report | March 31, 20235
The Brown Capital Management Small Company Fund
Management Discussion of Fund Performance (Unaudited)March 31, 2023
Firm Update
This year, we kicked off a blog series to better share our thoughts with our shareholders. Notable topics of the blog include how we think about performance, why we employ our team structure to manage portfolios, and the case for U.S. small growth companies. The feedback has been very encouraging thus far. Expect to see more blog posts in the year ahead.
As of September 30, 2022, we changed the name of the International Equity Fund to the International All Company Fund. We believe the new name better reflects the fact that this portfolio comprises companies of various sizes and reinforces our practice of using revenue as opposed to market capitalization to gauge company size.
Finally, effective January 1, 2023, Robert Young III assumed the role of President of Brown Capital, taking over the office from Keith Lee, who remains Chief Executive Officer, Chief Investment Officer and Senior Portfolio Manager on the Small Company Team. Rob joined Brown Capital from T. Rowe Price in 1999 to build out the firm’s distribution team. He adds the President title to his current role of Head of Marketing and Sales/Client Service. Rob has served on the firm’s Management Committee since 2007, and is currently the president of the firm’s mutual fund trust. Please join us in congratulating Rob for this well-deserved recognition.
Thank you for your continued support of Brown Capital Management.
6www.browncapital.com
The Brown Capital Management Small Company Fund
March 31, 2023 (Unaudited)
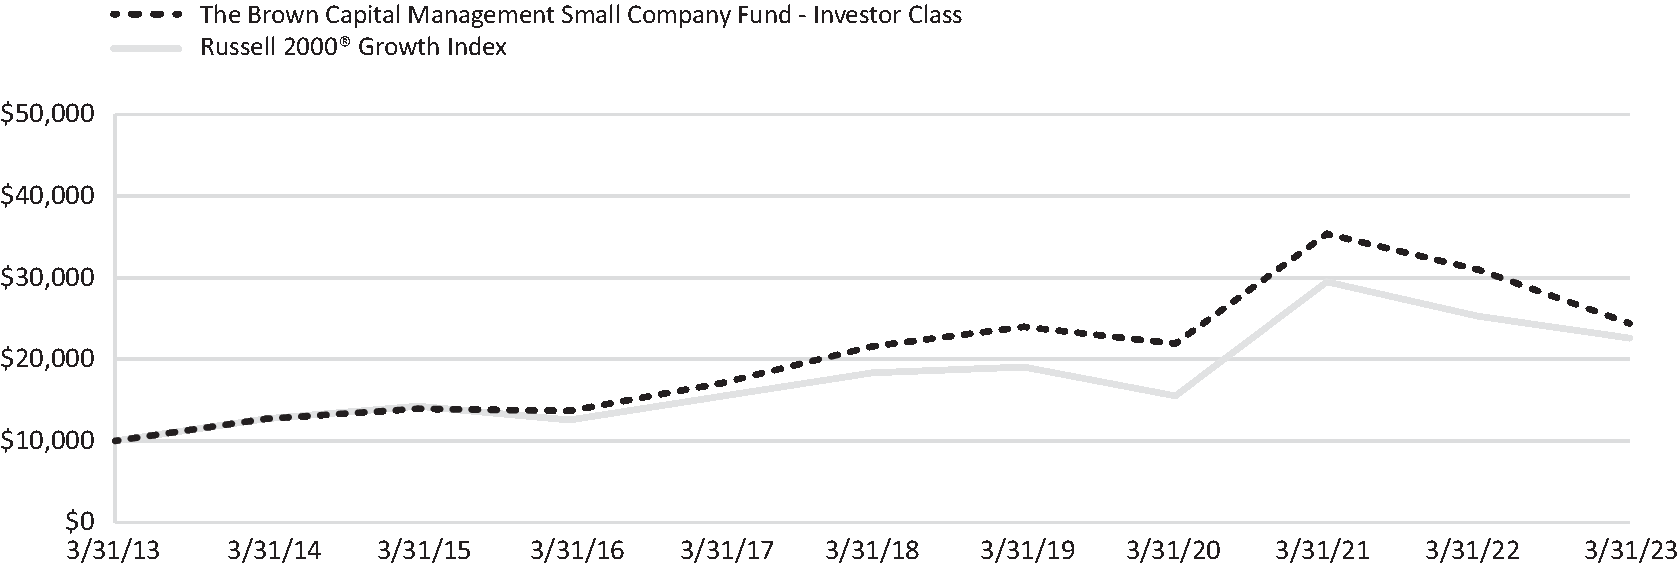
Growth of a hypothetical $10,000 investment - Investor Class
This graph assumes an initial investment of $10,000 at March 31, 2013. All dividends and distributions are reinvested. This graph depicts the performance of the The Brown Capital Management Small Company Fund (the “Fund”) Investor Class versus the Russell 2000® Growth Index. It is important to note that the Fund is a professionally managed mutual fund while the index is not available for investment and is unmanaged. The comparison is shown for illustrative purpose only.
Performance (as of March 31, 2023)
| | Average Annual Total Returns | | Since Inception 12/31/92 |
|
| Total Annual Fund Operating Expenses | ||||||
|
| 1 Year |
| 3 Year |
| 5 Year |
| 10 Year |
| ||||
The Brown Capital Management Small Company Fund | | -21.26% | | 3.62% | | 2.47% | | 9.32% | | 10.90% | | | 1.25% |
The Brown Capital Management Small Company Fund - Institutional Class | | -21.17% | | 3.79% | | 2.66% | | 9.53% | | 10.98% | | | 1.05% |
Russell 2000® Growth Index | | -10.60% | | 13.36% | | 4.26% | | 8.49% | | 7.31% | | | |
Morningstar Small Growth Category | | -12.05% | | 16.20% | | 7.30% | | 9.57% | | 9.06% | | | |
SCF-Investor Percentile Ranking vs | | 92/607 | | 99/576 | | 96/534 | | 55/401 | | N/A | | | |
SCF-Institutional Percentile Ranking vs | | 92/607 | | 99/576 | | 95/534 | | 50/401 | | N/A | | | |
The performance information quoted above represents past performance, which is not a guarantee of future results. Investment return and principal value of an investment will fluctuate so that an investor’s shares, when redeemed, may be worth more or less than their original cost. Current performance may be lower or higher than the performance data quoted. An investor may obtain performance data current to the most recent month-end by visiting www.browncapital.com.
The expense ratios shown are from the Fund’s prospectus dated August 1, 2022. These numbers may vary from the expense ratios shown elsewhere in this report because it is based on a different time period.
The graph and table do not reflect the deduction of taxes that a shareholder would pay in Fund distributions or the redemption of Fund shares. Average annual total returns are historical in nature and measure net investment income and capital gain or loss from portfolio investments assuming reinvestments of distributions.
Annual Report | March 31, 20237
The Brown Capital Management Small Company Fund
March 31, 2023 (Unaudited)
Investing in the securities of small companies generally is perceived to involve greater risk than investing in larger domestic companies. Therefore, investments in the Fund may involve a greater risk than investment in other mutual funds that seek capital growth by larger domestic companies.
The Institutional Class of the Fund commenced operations on December 15, 2011. The historical performance shown for period prior to December 15, 2011 was calculated synthetically using the performance and the fees and expenses of the Investor Class. If the Institutional Class had been available during the periods prior to December 15, 2011, the performance shown may have been difference. Please refer to the Fund’s prospectus for further details concerning historical performance.
The Russell 2000® Growth Index measures the performance of those Russell 2000 companies with higher price-to-book ratios and higher forecasted growth values.
Morningstar Small Growth Category - Small-growth portfolios focus on faster-growing companies whose shares are at the lower end of the market-capitalization range. These portfolios tend to favor companies in up-and-coming industries or young firms in their early growth stages. Because these businesses are fast-growing and often richly valued, their stocks tend to be volatile. Stocks in the bottom 10% of the capitalization of the U.S. equity market are defined as smallcap. Growth is defined based on fast growth (high growth rates for earnings, sales,book value and cash flow) and high valuations(high price ratios and low dividend yields). Morningstar. All Rights Reserved. The information contained herein: (1) is proprietary to Morningstar and/or its content providers; (2) may not be copied or distributed; and (3) is not warranted to be accurate,complete or timely. Neither Morningstar or its content providers are responsible for any damages or losses arising from any use of this information. Past performance is no guarantee of future results.
You cannot invest directly in an index.
Note: Diversification does not eliminate the risk of experiencing investment losses.
8www.browncapital.com
Shares |
|
|
| Value (Note 1) |
|
COMMON STOCKS - 96.75% | | |
| ||
| | Business Services - 25.50% | | |
|
564,640 | | ANSYS, Inc. (a) | | $187,912,192 |
|
946,695 | | Clearwater Analytics Holdings, Inc. (a) | | 15,109,252 |
|
4,904,428 | | Enfusion, Inc.(a)(b) | | 51,496,494 |
|
1,718,239 | | Guidewire Software, Inc. (a) | | 140,981,510 |
|
2,433,491 | | nCino, Inc.(a) | | 60,301,907 |
|
534,420 | | Paycom Software, Inc. (a) | | 162,469,024 |
|
2,708,580 | | PROS Holdings, Inc. (a)(b) | | 74,215,092 |
|
1,663,214 | | Q2 Holdings, Inc. (a) | | 40,948,329 |
|
452,129 | | Tyler Technologies, Inc. (a) | | 160,343,029 |
|
| | | | 893,776,829 |
|
| | | | |
|
| | Consumer Related - 6.35% | | |
|
2,983,278 | | Alarm.com Holding, Inc. (a)(b) | | 149,999,218 |
|
8,881,721 | | Olo, Inc. - Class A (a)(b) | | 72,474,843 |
|
| | | | 222,474,061 |
|
| | | | |
|
| | Industrial Products & Systems - 11.11% | | |
|
132,367 | | Balchem Corp. | | 16,741,778 |
|
3,005,819 | | Cognex Corp. | | 148,938,331 |
|
66,729 | | Energy Recovery, Inc. (a) | | 1,538,103 |
|
1,743,933 | | Helios Technologies, Inc. (b) | | 114,053,218 |
|
306,950 | | Proto Labs, Inc. (a) | | 10,175,392 |
|
1,073,256 | | Vicor Corp. (a) | | 50,378,637 |
|
3,175,509 | | Xometry, Inc. (a)(b) | | 47,537,370 |
|
| | | | 389,362,829 |
|
| | | | |
|
| | Information/Knowledge Management - 21.29% | | |
|
412,951 | | Alteryx, Inc. - Class A (a) | | 24,298,037 |
|
1,552,297 | | AppFolio, Inc. - Class A (a)(b) | | 193,229,930 |
|
2,044,316 | | Datadog, Inc. - Class A (a) | | 148,540,001 |
|
1,124,100 | | Manhattan Associates, Inc. (a) | | 174,066,885 |
|
193,922 | | NextGen Healthcare, Inc. (a) | | 3,376,182 |
|
3,430,721 | | Smartsheet, Inc. - Class A (a) | | 163,988,464 |
|
378,254 | | Workiva Inc. (a) | | 38,736,992 |
|
| | | | 746,236,491 |
|
| | | | |
|
| | Medical/Health Care - 27.98% | | |
|
1,653,265 | | 10X Genomics, Inc. (a) | | 92,235,654 |
|
1,843,654 | | Bio-Techne Corp. | | 136,780,690 |
|
870,575 | | Cardiovascular Systems, Inc. (a) | | 17,289,620 |
|
4,629,057 | | Cytek Biosciences, Inc. (a) | | 42,541,034 |
|
1,654,691 | | Glaukos Corp. (a) | | 82,900,019 |
|
273,963 | | Inari Medical, Inc. (a) | | 16,914,476 |
|
769,900 | | Inogen, Inc. (a) | | 9,608,352 |
|
1,772,312 | | Ironwood Pharmaceuticals, Inc. (a) | | 18,644,722 |
|
Annual Report | March 31, 20239
The Brown Capital Management Small Company Fund
Schedule of InvestmentsMarch 31, 2023
Shares |
|
|
| Value (Note 1) |
|
COMMON STOCKS - 96.75% (continued) | | |
| ||
| | Medical/Health Care - 27.98% (continued) | | |
|
1,854,349 | | OrthoPediatrics Corp. (a)(b) | | $82,129,117 |
|
239,851 | | QuidelOrtho Corp. (a) | | 21,368,326 |
|
795,717 | | Repligen Corp. (a) | | 133,966,914 |
|
1,158,708 | | Tandem Diabetes Care, Inc. (a) | | 47,055,132 |
|
902,129 | | Veeva Systems, Inc. - Class A (a) | | 165,802,289 |
|
3,869,381 | | Vericel Corp. (a)(b) | | 113,450,251 |
|
| | | | 980,686,596 |
|
| | | | |
|
| | Miscellaneous - 4.52% | | |
|
4,458,764 | | Cryoport, Inc. (a)(b) | | 107,010,336 |
|
2,777,503 | | Neogen Corp. (a) | | 51,439,356 |
|
| | | | 158,449,692 |
|
| | | | |
|
Total Common Stocks (Cost: $2,416,913,037) - 96.75% | | 3,390,986,498 |
| ||
| | | | |
|
SHORT TERM INVESTMENTS - 3.60% | | |
| ||
126,078,360 | | First American Treasury Obligation Fund- Institutional Class 4.72%(c) (Cost: $126,078,360) | | 126,078,360 |
|
| | | | |
|
Total Value of Investments (Cost: $2,542,991,397) - 100.35% | | 3,517,064,858 |
| ||
Liabilities in Excess of Other Assets - (0.35%) | | (12,549,215 | ) | ||
Net Assets - 100.00% | | $3,504,515,643 |
|
(a)Non-income producing
(b)Affiliated company - The Fund owns greater than 5% of the outstanding voting securities of this issuer. See Note 1 for more information.
(c)Effective 7 day yield as of March 31, 2023
Summary of Investments by Sector | | | | | |
| | | | | |
Sector |
| % of Net Assets |
| Value |
|
Business Services | | 25.50% | | $893,776,829 | |
Consumer Related | | 6.35% | | 222,474,061 | |
Industrial Products & Systems | | 11.11% | | 389,362,829 | |
Information/Knowledge Management | | 21.29% | | 746,236,491 | |
Medical/Health Care | | 27.98% | | 980,686,596 | |
Miscellaneous | | 4.52% | | 158,449,692 | |
Short Term Investments | | 3.60% | | 126,078,360 | |
Liabilities in Excess of Other Assets | | (0.35% | ) | (12,549,215 | ) |
Total | | 100.00% | | $3,504,515,643 |
The Fund’s classifications of issuers into sectors, industries and sub-industries may differ for financial reporting purposes than for other reporting and compliance purposes. The classification for purposes of this financial report are unaudited.
See Notes to Financial Statements
10www.browncapital.com
The Brown Capital Management Mid Company Fund
Management Discussion of Fund Performance (Unaudited)March 31, 2023
At the close of the mutual fund fiscal year ended March 31, 2023, we are reminded of the lyric from The Shirelles: “Mama said there’ll be days like this.” The Brown Capital Mid Company team carries these words with us, despite the tough year that we have endured.
No question about it, the adverse macroeconomic conditions of the last year have had an impact on the valuations of our investments. Notably, over the past 12 months, inflation has remained persistently high, with the U.S. Consumer Price Index (CPI) peaking at 9.1% in June of 2022, the highest level in more than 40 years. In an attempt to rein in inflation, the Federal Reserve substantially increased its benchmark federal-funds rate from near zero to 4.75-5.00% over the past year. This increase in interest rates particularly hurt the stock prices of faster-growing companies because their valuations are based largely on the promise of bigger profits in the future. To put a present value on yet-to-be-determined earnings, analysts use interest rates. The higher interest rates are, the less valuable those future profits are today. So higher rates particularly hurt high-growth companies like the ones we own in the Mid Company Fund.
Especially in days like these, we remain committed to finding and owning what we call Exceptional Growth Companies (EGCs). At Brown Capital, we do not attempt to forecast interest rates, inflation or other macroeconomic events. Instead, we perform bottom-up fundamental research to forecast the profitability, revenue and earnings growth of each of our EGCs three to five years out. We believe EGCs save time, lives, money and headaches, or provide an exceptional value to consumers. EGCs often solve mission-critical problems, provide products and services that are hard to replicate, and have strong competitive advantages, making them sustainable investments over several years. In our opinion, EGCs are best in class and often have significant intellectual property or immensely valuable brands. In most cases, their products and services have large and growing addressable markets, and they are increasing their market share, with the ability to expand into adjacent markets. In our experience, these attributes often result in significant returns in the long term.
Whether or not we are on the verge of a recession is anybody’s guess. What is important is that recessions are an inevitable, albeit painful, part of the business cycle. Since 1948, the U.S. has experienced 12 recessions, or an average of one every six years. Because economic downturns are a regular part of the business cycle, an essential characteristic of an EGC is resilience. Resilient companies can operate in most economic environments and survive adverse conditions because they sell products or services their customers need. Furthermore, these products and services often have few or no substitutes, creating high switching costs. Resilience may matter little to those worried about the next 6-12 months, but for investors like us who are contemplating the next decade, it matters a great deal, given inevitable market and economic volatility.
EGCs are durable businesses that are less susceptible to economic shocks. Take ANSYS (ANSS), for instance, which we have owned in the Mid Company Fund since 2009. ANSYS is a leading provider of engineering-simulation software. Its technology has greatly reduced the dependency on physical prototyping through the use of highly complex software that incorporates various physics and engineering disciplines. Many customers, particularly in the high-tech, aerospace and automotive industries, spend millions of dollars on ANSYS software and count on ANSYS to operate their businesses. This dependency is evident in ANSYS’s upper-90% customer retention, which is among the highest in the software industry. Importantly, switching costs are high for ANSYS products with few comparable substitutes available.
Another example is Entegris, which is highlighted below as one of the new investments initiated during the year. Entegris sells semiconductor materials to semi manufacturers, semi-equipment companies, chemical companies, and others. As the world digitalizes and semiconductors multiply, Entegris’s products have become more critical. This is especially true with advanced chips that power electric vehicles, data centers and other rapidly growing markets. As compared to legacy chips, advanced chips are less tolerant of contaminants during the manufacturing process. Entegris is one of two companies with the filtering technology able to achieve required purity levels. This makes Entegris a vital partner to customers many times its size, such as Taiwan Semiconductor Manufacturing Company, adding to the company’s resilience.
EGCs are not impervious to failure but should be more resilient than the average company if we do our research properly. The qualities we desire are not a rigid checklist, as we believe investing is both art and science. Rather, we follow guiding principles that improve our chances of unearthing great businesses we can own for many years. We believe our intentionality, long-term investment horizon and discipline in our process should help us withstand various market climates and generate positive excess returns for our clients over time.
For the fiscal year ended March 31, 2023, the Mid Company Fund (Investor shares) fell 13.45%, underperforming the 8.52% decline of the index. As of March 31, 2023, the Fund consisted of 40 holdings with approximately 0.31% in cash.
Performance: Contributors
Among the contributors to performance for the year ending March 31, 2023, were Insulet (PODD) and MarketAxess (MKTX).
Insulet is a leading medical-device company that produces the Omnipod Insulin Management System to administer insulin to diabetics. Historically, insulin-intensive diabetics have used either syringes or tubed insulin pumps to administer insulin. Recently, innovations in diabetic blood-sugar monitoring, coupled with advances in algorithms and medical devices to automatically administer insulin, have dramatically improved the quality of life for insulin-intensive diabetics. Insulet’s Omnipod offers an attractive form factor for insulin delivery: a sleek, disposable, multiday pod that attaches to the body and delivers insulin in response to feedback from blood-sugar-monitoring devices. This is superior to the standard course of care which
Annual Report | March 31, 202311
The Brown Capital Management Mid Company Fund
Management Discussion of Fund Performance (Unaudited)March 31, 2023
involves multiple daily syringe injections of insulin. Additionally, because the Omnipod is disposable and requires a lower upfront cost than competitors’ automated offerings, it is easier for new patients to try Omnipod before committing to it on a long-term basis.
During the year, the company benefitted from the launch of the latest iteration of its product, the Omnipod 5. This innovative product automates insulin delivery without the need for plastic tubing attached to the patient’s body. It is also waterproof and wearable. In January 2022, the company announced that it received long-awaited FDA clearance for the Omnipod 5. The product then entered a limited market release, followed by a full market release in August. Since then, the response to the Omnipod 5 has surpassed expectations, with the product comprising more than 80% of new U.S. patient starts for the company in the third quarter of 2022 and more than 90% in the fourth quarter. Overall, the company has approximately 360,000 global users out of a large, estimated target market of 11 million insulin-intensive diabetics. We think Insulet has a long runway for growth driven by its unique positioning, strong product offering and continued innovation.
MarketAxess is a leading electronic-trading platform for fixed income securities. The company is the largest institutional electronic-trading venue for previously issued emerging-market, U.S. investment-grade and U.S. high-yield debt, with leading market share in each category. Currently, the U.S. fixed income market is transacted largely over the phone. In fact, electronic trading represents less than 20% of trading volume in the fixed income categories that MarketAxess targets. This is well below the penetration rate of other asset classes such as futures and equities, where 70-90% of trades occur electronically. In addition, moving to electronic trading offers fixed income brokers and buyers greater efficiency, cost savings and improved trading liquidity.
Improvements in market conditions and continued execution drove the company’s strong stock-price performance in the year ended March 31, 2023. In past years, mild volatility and low interest rates hurt spreads and weighed on overall volumes. More recently, this dynamic reversed, and the fixed income market benefitted from higher interest rates, wider spreads and macroeconomic uncertainty, which combined to increase the relative attractiveness of bonds. From a company-specific perspective, MarketAxess has continued to execute on several important growth drivers. In its core credit product categories, the company is providing a more efficient and transparent marketplace for fixed-income securities, which facilitates the shift toward electronic bond trading. Beyond this, MarketAxess has expanded its product line into new fixed income markets, such as municipal bonds and U.S. Treasurys. We believe the benefits of the company’s trading platform, combined with the currently low penetration rate of electronic trading, should provide many years of attractive and profitable growth.
Performance: Detractors
Among the detractors to performance for the year ending March 31, 2023, were Omnicell (OMCL) and Charles River Laboratories (CRL).
Omnicell is a leading provider of automated pharmacy and business-analytics software solutions for hospitals, long-term care centers and retail pharmacies. According to the FDA, medication errors cause at least one death every day and injure 1.3 million people annually in the U.S. Furthermore, an estimated 11% of all hospital admissions are related to medication non-adherence. Omnicell’s products and services tackle these challenges through on-site devices and cloud-based solutions to deliver virtually zero dispensing errors in central pharmacies, 66% reduction in intravenous compounding costs compared to outsourcing, 90% medication adherence, and 2-10% reductions in direct drug costs in hospitals. The market has responded positively to Omnicell’s offerings, as it does business with approximately 50% of U.S. hospitals and 80% of U.S. retail pharmacies.
Omnicell shares underperformed, as the company faced a number of challenges over the past year, including supply-chain and inflation issues, as well as macro-related headwinds that are driving capital-budget freezes, implementation delays and longer sales cycles. As hospitals face an uncertain financial environment, many healthcare providers are delaying purchase decisions and implementations. Nevertheless, we view the headwinds as more of a temporary rather than a structural phenomenon, and we continue to like the potential for Omnicell to partner with its customers. Omnicell’s products are mission critical for hospitals, many of which will need to replace and upgrade older versions over the next few years. The company is well positioned longer-term to become hospitals’ trusted partner for pharmacy safety, automation and strategy. Despite the ubiquity of Omnicell’s products, many customers only use a handful of its offerings, and its competitors do not offer a similar array of complementary products. Given the company’s $1.3 billion of sales in 2022, we believe Omnicell can generate many more years of attractive revenue and profit growth as it pursues a $90-billion total addressable market.
Charles River Laboratories is a leading pre-clinical-trial contract research organization involved in the vast majority of FDA-approved drugs. The company provides products and services that help pharmaceutical companies, governments and academic institutions accelerate their drug research-and-development efforts. The company operates three divisions: Discovery & Safety Assessment, Research Model & Services, and Manufacturing Solutions. The company’s research-models business is the industry’s market-share leader, and the biotechnology industry’s increased emphasis on rare diseases is a secular tailwind to Charles River’s three business lines.
Charles River’s share price was negatively impacted by news of the February 2023 U.S. Department of Justice investigation into the illegal smuggling of non-human primates (NHPs) from Cambodia into the U.S. Monkeys and other primates are vital to the safety testing of biologic drugs, and in recent
12www.browncapital.com
The Brown Capital Management Mid Company Fund
Management Discussion of Fund Performance (Unaudited)March 31, 2023
years, Cambodia accounted for 60% of all NHP shipments to the U.S. For example, all COVID-19 vaccines developed in the U.S. and Europe used NHPs. In light of the ongoing investigation, Charles River management voluntarily suspended all NHP imports from Cambodia until proper procedures ensure compliance with international law. The company also began seeking ways to diversify its supplier base. That will take time and adversely affect sales near term, which led management to reduce meaningfully its 2023 revenue and earnings guidance. Given the vital nature of NHPs in drug R&D, we believe U.S. regulators have strong incentives to restore this supply as soon as possible. When this occurs, we believe the secular trends of increasing cell and gene-therapy research should drive strong demand growth for Charles River, which combined with the company’s industry dominance and its unique ability to serve customers, should produce high-single-digit to low-double-digit revenue growth over the long term.
New Additions
During the year, we added two new companies to the Mid Company Fund. In chronological order, we purchased and Entegris (ENTG) and Simpson Manufacturing (SSD).
Entegris supplies advanced materials and process solutions for the semiconductor, life-sciences and other high-tech industries. Semiconductors have become more relevant as the world digitalizes. These transformative technologies require advanced chips that use more materials and are less tolerant of contaminants during manufacturing. Entegris operates at this intersection of material intensity and material purity, which has allowed the company to grow 50% faster than the semiconductor industry over the past five years. Entegris is the largest independent semiconductor-materials supplier with a unique set of assets that boost manufacturing yields, saving customers time and money. Consumables comprise 80% of sales, making it less subject to the industry’s volatile capital-expenditure swings. The company has myriad competitive advantages including scale, reputation and deep materials expertise that create a solid competitive moat.
Simpson Manufacturing designs, engineers and manufactures proprietary connectors, fasteners, anchors and related products used in residential and commercial construction. The Simpson Strong-Tie brand is synonymous with structural connectors, a product category that the company created and in which the company possesses 75% market share in the U.S. As literally “make or break” products, Simpson’s solutions are mission-critical to construction projects, supporting a building’s weight and adding to structural integrity. Simpson’s products are often specified in blueprints by architects and possess load-bearing attributes that are required by building codes. These products save lives, money and headaches while representing an insignificant portion of total construction costs. Simpson is using its dominant position in connectors to expand into complementary growth markets that leverage its strengths, including fasteners, anchors, repair & remodel, mass timber and concrete. The company is also expanding geographically. In 2022, Simpson acquired the Etanco Group, a leading European manufacturer of fixing and fastening solutions in the commercial market. All told, Simpson estimates its total addressable market at $5.5 billion, 50% of which is U.S. residential housing. While construction end markets are currently experiencing a cyclical downturn, we believe that Simpson’s superior pricing power, growing product demand as building codes become more stringent, and expansion into new markets will facilitate a durable growth runway over the long term.
Deletions
During the year, we eliminated two holdings from the Fund. In chronological order, we exited Cerner (CERN) and Coupa Software (COUP).
Cerner supplies healthcare information technology to more than 20,000 facilities across the world, including hospitals, physician practices, laboratories and surgery centers. The company offers digital solutions that enable medical professionals to both deliver better healthcare to patients as well as facilitate the clinical, financial and transactional needs of its clients. Cerner is helping to digitalize medical care through its electronic health record (EHR) platform, which improves the caregiver experience and enables more connected, high-quality patient care. In late 2021, Oracle Corporation announced an all-cash tender offer to acquire Cerner for $95 per share, which represented a 20% premium over Cerner’s market value before the deal discussions became public. The deal closed during the second quarter of calendar 2022, and the position was sold.
Coupa Software helps medium and large enterprises better manage their operating expenses on a unified technology platform. The company’s modules run the gamut from procurement to payment, saving clients time and money, while providing greater visibility into spending. The company also offers supply-chain design and planning software that customers use to proactively manage their cost of goods sold or direct spending. During the first quarter of calendar 2023, private equity firm Thoma Bravo completed its previously announced acquisition of Coupa for $81 per share. The company exited our portfolio after the deal closed.
Firm Update
This year, we kicked off a blog series to better share our thoughts with our shareholders. Notable topics of the blog include how we think about performance, why we employ our team structure to manage portfolios, and the case for U.S. small growth companies. The feedback has been very encouraging thus far. Expect to see more blog posts in the year ahead.
Annual Report | March 31, 202313
The Brown Capital Management Mid Company Fund
Management Discussion of Fund Performance (Unaudited)March 31, 2023
As of September 30, 2022, we changed the name of the International Equity Fund to the International All Company Fund. We believe the new name better reflects the fact that this portfolio comprises companies of various sizes and reinforces our practice of using revenue as opposed to market capitalization to gauge company size.
Finally, effective January 1, 2023, Robert Young III assumed the role of President of Brown Capital, taking over the office from Keith Lee, who remains Chief Executive Officer, Chief Investment Officer and Senior Portfolio Manager on the Small Company Team. Rob joined Brown Capital from T. Rowe Price in 1999 to build out the firm’s distribution team. He adds the President title to his current role of Head of Marketing and Sales/Client Service. Rob has served on the firm’s Management Committee since 2007, and is currently the president of the firm’s mutual fund trust. Please join us in congratulating Rob for this well-deserved recognition.
Thank you for your continued support of Brown Capital Management.
14www.browncapital.com
The Brown Capital Management Mid Company Fund
March 31, 2023 (Unaudited)
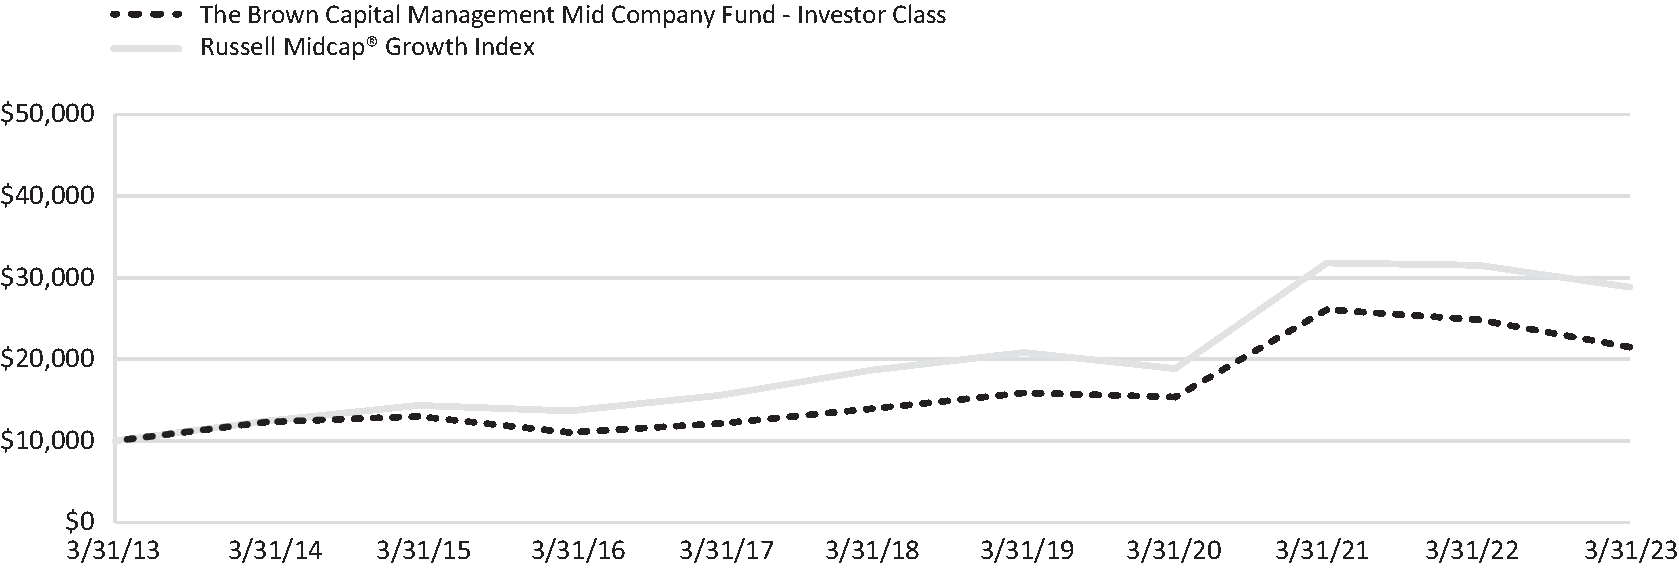
Growth of a hypothetical $10,000 investment - Investor Class
This graph assumes an initial investment of $10,000 at March 31, 2013. All dividends and distributions are reinvested. This graph depicts the performance of The Brown Capital Management Mid Company Fund (the “Fund”) Investor Class versus the Russell MidCap® Growth Index. It is important to note that the Fund is a professionally managed mutual fund while the index is not available for investment and is unmanaged. The comparison is shown for illustrative purposes only.
Performance (as of March 31, 2023)
| | Average Annual Total Returns | | Since |
| Total |
|
| Net Annual Fund Operating Expenses | ||||||
|
| 1 Year |
| 3 Year |
| 5 Year |
| 10 Year |
| ||||||
The Brown Capital Management Mid Company Fund - Investor Class | | -13.45% | | 11.83% | | 9.05% | | 7.95% | | 9.62% | | 1.55% | | | 1.15% |
The Brown Capital Management Mid Company Fund - Institutional Class | | -13.22% | | 12.10% | | 9.33% | | 8.24% | | 9.78% | | 1.30% | | | 0.90% |
Russell Midcap® Growth Index | | -8.52% | | 15.20% | | 9.07% | | 11.17% | | 11.53% | | | | | |
Morningstar Mid-Cap Growth Category | | -11.95% | | 14.85% | | 8.12% | | 10.38% | | 9.56% | | | | | |
SCF-Investor Percentile Ranking vs | | 67/577 | | 80/529 | | 38/498 | | 92/387 | | N/A | | | | | |
SCF-Institutional Percentile Ranking vs | | 65/577 | | 79/529 | | 30/498 | | 90/387 | | N/A | | | | | |
The performance information quoted above represents past performance, which is not a guarantee of future results. Investment return and principal value of an investment will fluctuate so that an investor’s shares, when redeemed, may be worth more or less than their original cost. Current performance may be lower or higher than the performance data quoted. An investor may obtain performance data current to the most recent month-end by visiting www.browncapital.com.
The expense ratios shown are from the Fund’s prospectus dated August 1, 2022. These numbers may vary from the expense ratios shown elsewhere in this report because it is based on a different time period.
Annual Report | March 31, 202315
The Brown Capital Management Mid Company Fund
March 31, 2023 (Unaudited)
The graph and table do not reflect the deduction of taxes that a shareholder would pay in Fund distributions or the redemption of Fund shares. Average annual total returns are historical in nature and measure net investment income and capital gain or loss from portfolio investments assuming reinvestments of distributions.
Investing in the securities of mid-sized companies generally involves greater risk than investing in larger more established companies. Therefore, investments in the Fund may involve a greater degree of risk than investments in other mutual funds that seek capital growth by investing in larger more established companies.
The Institutional Class of the Fund commenced operations on December 15, 2011. The historical performance shown for periods prior to December 15, 2011 was calculated synthetically using the performance and the fees and expenses of the Investor Class. If the Institutional Class had been available during the periods prior to December 15, 2011, the performance shown may have been different. Please refer to the Fund’s prospectus for further details concerning historical performance.
The Russell Midcap® Growth Index measures the performance of those Russell MidCap companies with higher price-to-book ratios and higher forecasted growth values.
Morningstar Mid-Cap Growth Category – Some mid-cap growth portfolios invest in stocks of all sizes, thus leading to a mid-cap profile, but others focus on midsize companies. Mid-cap growth portfolios target U.S. firms that are projected to grow faster than other mid-cap stocks, therefore commanding relatively higher prices. The U.S. mid-cap range for market capitalization typically falls between $1 billion-$8 billion and represents 20% of the total capitalization of the U.S. equity markets. Growth is defined based on fast growth (high growth rates for earnings, sales, book value, and cash flow) and high valuations (high price ratios and low dividend yields). Morningstar. All Rights Reserved. The information contained herein: (1) is proprietary to Morningstar and/or its content providers; (2) may not be copied or distributed; and (3) is not warranted to be accurate, complete or timely. Neither Morningstar or its content providers are responsible for any damages or losses arising from any use of this information. Past performance is no guarantee of future results.
You cannot invest directly in an index.
Note: Diversification does not eliminate the risk of experiencing investment losses.
16www.browncapital.com
Shares |
|
|
| Value (Note 1) |
|
COMMON STOCKS - 99.87% | | | | ||
| | Business Services - 18.28% | | | |
12,380 | | Bright Horizons Family Solutions (a) | | $953,136 |
|
6,619 | | Envestnet, Inc. (a) | | 388,337 |
|
6,769 | | Equifax, Inc. | | 1,373,024 |
|
12,508 | | Five9, Inc. (a) | | 904,203 |
|
5,640 | | Jack Henry & Associates, Inc. | | 850,061 |
|
3,390 | | Paycom Software, Inc. (a) | | 1,030,594 |
|
4,278 | | Tyler Technologies, Inc.(a) | | 1,517,150 |
|
| | | | 7,016,505 |
|
| | | | |
|
| | Consumer Related - 6.65% | | |
|
479 | | Chipotle Mexican Grill, Inc. (a) | | 818,271 |
|
2,447 | | Expedia, Inc. (a) | | 237,432 |
|
460 | | O’Reilly Automotive, Inc. (a) | | 390,531 |
|
1,601 | | Tractor Supply Co. | | 376,299 |
|
1,334 | | Ulta Beauty, Inc. (a) | | 727,924 |
|
| | | | 2,550,457 |
|
| | | | |
|
| | Financial Services - 9.96% | | |
|
7,745 | | Broadridge Financial Solutions | | 1,135,185 |
|
5,280 | | FleetCor Technologies, Inc. (a) | | 1,113,288 |
|
3,238 | | MarketAxess Holdings, Inc. | | 1,266,997 |
|
2,712 | | T. Rowe Price Group, Inc. | | 306,185 |
|
| | | | 3,821,655 |
|
| | | | |
|
| | Industrial Products & Systems - 10.08% | | |
|
20,641 | | Cognex Corp. | | 1,022,762 |
|
9,849 | | Entegris, Inc. | | 807,717 |
|
9,917 | | Fastenal Co. | | 534,923 |
|
1,771 | | IPG Photonics Corp. (a) | | 218,382 |
|
5,100 | | Simpson Manufacturing Co., Inc. | | 559,164 |
|
5,289 | | SiteOne Landscape Supply, Inc. (a) | | 723,905 |
|
| | | | 3,866,853 |
|
| | | | |
|
| | Information/Knowledge Management - 25.79% | | |
|
3,500 | | Ansys, Inc. (a) | | 1,164,800 |
|
7,104 | | Autodesk, Inc. (a) | | 1,478,769 |
|
31,559 | | Bentley Systems, Inc. | | 1,356,721 |
|
10,910 | | Guidewire Software, Inc. (a) | | 895,166 |
|
3,424 | | HubSpot, Inc. (a) | | 1,468,040 |
|
12,013 | | Manhattan Associates, Inc. (a) | | 1,860,213 |
|
34,886 | | Shopify, Inc. (a) | | 1,672,435 |
|
| | | | 9,896,144 |
|
| | | | |
|
Annual Report | March 31, 202317
The Brown Capital Management Mid Company Fund
Schedule of InvestmentsMarch 31, 2023
Shares |
|
|
| Value (Note 1) |
|
COMMON STOCKS - 99.87% (continued) | | |
| ||
| | Medical/Health Care - 29.11% | | |
|
5,696 | | Align Technology, Inc. (a) | | $1,903,261 |
|
7,365 | | Charles River Laboratories International (a) | | 1,486,404 |
|
12,891 | | DexCom, Inc. (a) | | 1,497,676 |
|
17,449 | | Edwards Lifesciences Corp. (a) | | 1,443,556 |
|
4,946 | | Insulet Corp. (a) | | 1,577,576 |
|
1,114 | | Jazz Pharmaceuticals PLC (a) | | 163,011 |
|
1,910 | | Masimo Corp. (a) | | 352,471 |
|
17,771 | | Omnicell, Inc. (a) | | 1,042,625 |
|
2,578 | | Teladoc Health, Inc. (a) | | 66,770 |
|
7,744 | | Veeva Systems, Inc. - Class A (a) | | 1,423,270 |
|
1,301 | | Zoetis, Inc. | | 216,538 |
|
| | | | 11,173,158 |
|
| | | | |
|
Total Common Stocks (Cost: $27,383,067) - 99.87% | | 38,324,772 |
| ||
| | | | | |
SHORT TERM INVESTMENTS - 0.31% | | | | ||
120,374 | | First American Treasury Obligation Fund Institutional Class 4.72(b) (Cost: $120,374) | | 120,374 |
|
| | | | | |
Total Investments (Cost: $27,503,441) - 100.18% | | 38,445,146 | | ||
Liabilities in Excess of Other Assets - (0.18%) | | (70,326 | ) | ||
Net Assets - 100.00% | | $38,374,820 |
|
(a)Non-income producing
(b)Effective 7 day yield as of March 31, 2023
Summary of Investments by Sector | | | | | |
| | | | | |
Sector |
| % of Net Assets |
| Value | |
Business Services | | 18.28% | | $7,016,505 | |
Consumer Related | | 6.65% | | 2,550,457 | |
Financial Services | | 9.96% | | 3,821,655 | |
Industrial Products & Systems | | 10.08% | | 3,866,853 | |
Information/Knowledge Management | | 25.79% | | 9,896,144 | |
Medical/Health Care | | 29.11% | | 11,173,158 | |
Short Term Investments | | 0.31% | | 120,374 | |
Liabilities in Excess of Other Assets | | (0.18% | ) | (70,326 | ) |
Total | | 100.00% | | $38,374,820 |
The Fund’s classifications of issuers into sectors, industries and sub-industries may differ for financial reporting purposes than for other reporting and compliance purposes. The classification for purposes of this financial report are unaudited.
See Notes to Financial Statements
18www.browncapital.com
The Brown Capital Management International All Company Fund
Management Discussion of Fund Performance (Unaudited)March 31, 2023
The fiscal year ending March 31, 2023, was a tough one for investors, with persistent inflation, rapidly rising interest rates, disrupted supply chains, the ongoing war in Ukraine and the rising risk of a global recession. As the year came to a close, we even saw some banks collapse under the pressure of high interest rates, most notably Credit Suisse. All of this created a particularly challenging environment for the types of high-quality international growth companies that the Brown Capital International All Company Fund favors. When any such companies had idiosyncratic or company-specific operational issues this year, their share prices were punished harshly in the market place.
That is reflected in the Fund’s performance this fiscal year. For the 12 months ending March 31, 2023, the International All Company Fund (Investor shares) was down 10.06% versus the MSCI EAFE index, which was down 0.86%. This represents underperformance of 920 basis points for the fiscal year, a disappointing short-term result indeed.
Looking deeper, these poor results were not the result of widespread mistakes or broad portfolio-exposure problems, but rather of a handful of companies with specific issues during a most unusual period. It might seem axiomatic to say that one’s detractors hurt one’s performance, but it is notable that a full 85% of the performance shortfall this year was due to just five companies. In some ways, these companies are like a microcosm of the global, post-COVID, macro-economic landscape we have traversed over the last year. Technology workers lost jobs, recessionary clouds gathered, e-commerce vendors struggled with first overwhelming and then anemic demand, banks suffered from soaring interest rates and healthcare organizations struggled with high cost structures and staffing levels. One can see traces of these themes in our five largest detractors: Atlassian’s collaborative software was needed by fewer technology workers; MonotaRO’s industrial products in Japan showed a modest slowdown in demand (causing revenue growth to fall from 20% to mid-teens); Ocado’s online grocery offering slowed in the U.K. post-COVID as did the development plans of its grocery-store partners; Temenos found that banks were too pinched by rising interest rates to make major operating software changes; and Grifol’s plasma-collection activities faced operational challenges, while its cost structure was too high.
So did we get the themes wrong? No. Long-time investors with us know that we invest bottom-up, not thematically. We are focused on finding, researching and monitoring a compact collection of what we call Exceptional Growth Companies (EGCs). Our EGCs save time, lives, money and headaches, or provide an extraordinary value to the consumer. Our companies often provide goods and services that their customers consider essential or would rather not do without. We believe the EGCs we invest in have durable revenue streams, defendable market positions, deliverable growth plans and profitability to fuel their growth. Finally, and perhaps most notably, we invest in EGCs using a 3-5 year evaluations horizon, and often hold positions for a decade or more.
We discuss the detractors Atlassian and MonotaRO in detail below, as well as some contributors and new additions, but the story is somewhat the same for the other three companies mentioned that struggled this year. These companies may have faced macro headwinds or had temporary operational setback, but we continue to believe in the long-term growth prospects of these EGCs. Having such a long-term, bottom-up perspective keeps us focused on researching our companies, not making short-term predictions about the economy or trends in the market. That, in our view, is the key to long-term investing in EGCs.
Performance: Contributors
Among the contributors to performance for the fiscal year ended March 31, 2023, were Novo Nordisk and Flutter.
Novo Nordisk is a Denmark-based, global pharmaceutical company focused on diabetes and obesity, which together comprise 88% of company revenue. In our view, Novo Nordisk exemplifies an EGC, as it is dominant and innovative, and doing something that is mission-critical in a large and growing global market. Being a top player in diabetes care gives Novo Nordisk the focus and resources necessary to develop modern insulins such as extended-release Tresiba and fast-acting NovaLog. The key to the company’s growth, however, is new medicines in the glucagon-like peptide-1 (GLP-1) class of therapies which stimulate insulin secretion in a glucose-dependent manner, improving patient outcomes and reducing costs. While the GLP-1 class of therapies has been a growth area in the industry overall, Novo-Nordisk’s Ozempic and Rybelsus are notable successes. Also noteworthy is Novo Nordisk’s weight-loss franchise (Wegovy and Saxenda), which doubled in 2022, generating about $2.5 billion in sales, about 10% of Novo’s total sales of $25 billion. The weight-loss opportunity seems significant with the World Obesity Foundation predicting that about half of the world’s population will be obese or overweight by 2035. The doubling of Wegovy sales and strength of the GLP-1 franchise overall contributed to the stock’s 41% increase during the fiscal year.
Flutter, an Ireland-based company, is one of the largest sports-betting and gaming operators in the world. You may have heard of one of its key global brands in the U.S.—FanDuel. In fact, with FanDuel, Flutter is the largest sportsbook in the U.S., with a 50% market share. Flutter has invested heavily and aggressively as the U.S. market opens up to sports betting, albeit slowly and state by state. Although FanDuel is not yet profitable, we believe Flutter’s large investments into the most rapidly growing sports-betting market in the world will pay off, as sports betting tends to yield a small number of very profitable winners that achieve the necessary scale. Group revenue grew 27% and U.S. revenue grew 67% in fiscal year 2022. Strong revenue growth and the anticipation of a significant uptick in operating profitability contributed to the stock’s 56% increase during the fiscal year.
Annual Report | March 31, 202319
The Brown Capital Management International All Company Fund
Management Discussion of Fund Performance (Unaudited)March 31, 2023
Performance: Detractors
Among the detractors from performance for the fiscal year ended March 31, 2023, were Atlassian and MonotaRO.
Atlassian is an Australia-based provider of project-collaboration software and services. The company’s flagship product, Jira, is a workflow engine used by software developers and the rest of an organization to organize, discuss and complete projects. Jira enables seamless flows between teams across functions such as software development, design and marketing, saving clients time and money. Atlassian offers both a cloud version and an on-premise version of Jira, but is strategically shifting to the cloud. Atlassian’s growth strategy involves reaching software developers, technology team members and knowledge workers generally. We estimate that there are one million companies globally that are potential customers, about four times Atlassian’s current customer base of 249,000. However, in the near term, growth is coming at the cost of lower margins, as management invests heavily in engineers and infrastructure to address the opportunities in cloud migrations. During the year, the company reported results and announced an outlook that fell short of expectations, as its seat-based model faces near-term headwinds of layoffs in the technology sector. For fiscal year June 2023, Atlassian now expects mid-teens operating margins, held back by the shift to the cloud and its required investments. We think the company is making the right investments to sustain long-term growth. Atlassian remains a dynamic and market-leading company with a significant and expanding franchise.
MonotaRO is a Japanese company that sells parts that are required in the maintenance, repair and operations (MRO) of factories and offices. MonotaRO’s advantage is its large assortment of products that can be ordered on its website (over 18 million items) and its rapid delivery of products (typically in under 48 hours). MonotaRO has grown quickly, with sales increasing 20% or more each year over the last decade. As the firm strengthens its logistics infrastructure and increases its buying power, we believe it will erect barriers longer term that will be difficult for competitors to scale. Although the company’s growth remains strong, the stock is volatile around small short-term changes in the sales numbers. The December and March quarters showed revenue growth in the mid-teens, which was viewed as a disappointment. We remain excited by MonotaRO’s opportunity to expand its client base and build scale.
New Additions
We added three companies during the fiscal year: Inpost, Dechra Pharmaceuticals and Autostore, discussed in chronological order.
Inpost, a Poland-based company, dominates the last-mile distribution of packages in Poland using automated parcel machines (APMs). It has a 98% market share of APM deliveries and a 43% share of business-to-consumer (B2C) deliveries overall. These delivery lockers are similar to those operated by Amazon in Whole Foods Markets, among other places. Inpost contracts space with retailers, manages the locker operations, and delivers packages to them. As the first-mover and dominant player in Poland, Inpost has secured a density advantage over potential new entrants. We think its market-leading position allows it to provide e-commerce consumers with a cost effective solution (roughly the equivalent of $1.50 versus $2.13 for home delivery) but also provide additional foot traffic to retailers. For example, Lidl in the U.K. has offered Inpost space at all of its locations free of charge. Furthermore, APM deliveries also have a lower carbon footprint. Inpost is expanding into other markets such as France (through the acquisition of Mondial Relay) and the U.K., funded by the company’s already profitable Polish operations.
Dechra Pharmaceuticals is a U.K.-based animal-health company offering prescription-only medications for companion animals, livestock and equines. Dechra specializes in niche pharmaceuticals in therapeutic categories such as endocrinology, dermatology, critical care and pain management. These niche drugs often target small markets up to $10 million in revenue, saving the lives of animals in critical condition, while facing little direct competition from larger animal-health companies. Dechra has developed its own direct salesforce in major markets. This facilitates Dechra’s active M&A strategy to add products and roll them out through its own distribution network. During the year, Dechra announced two such acquisitions, Piedmont Animal Health and Med-Pharmex, funded through a combination of cash, debt and an equity raise, which was viewed unfavorably in the current environment. However, we believe Dechra has a resilient portfolio, strong cash-flow-generation capabilities, and a track record of deleveraging post acquisitions. Furthermore, through conversations with the management team, we see the strategic merits to these two deals. They are a typical example of Dechra’s M&A strategy, offering potential revenue synergies by using existing distribution. We remain favorable on the company’s positioning and execution of its strategy. In April 2023, after the end of the fiscal year, private equity firm EQT proposed a takeover of Dechra at about a 50% premium. We will be disappointed to see this go if a transaction is consummated.
AutoStore is a robotics and software company that provides cubic storage automation. This capability allows customers to significantly reduce warehouse space and achieve higher throughput by storing items in densely packed physical cubes as opposed to open-air stacks in a typical warehouse. Robots shuttle across the top of the bin stacks to pick specific items from specific locations. AutoStore is a market leader with more than 1,000 total installations globally. With a customer payback period of 1-3 years and increasingly expensive and scarce workforces, AutoStore allows its more than 600 customers the ability to cope with the changing logistical and market needs of large and small companies alike. The market is rapidly adopting automated storage and retrieval systems (AS-RS) in general—cubic storage automation is a subset of AS-RS—but the current penetration of AS-RS is just 15% globally. AutoStore’s customers span a broad set of industries, including retail, ecommerce, grocery, industrial, automotive, healthcare and airlines. The company’s dominant position and technological advantage derives from investments in people, robots and software over 20 years.
20www.browncapital.com
The Brown Capital Management International All Company Fund
Management Discussion of Fund Performance (Unaudited)March 31, 2023
Deletions
During the fiscal year, there were no deletions from the portfolio.
Firm Update
This year, we kicked off a blog series to better share our thoughts with our shareholders. Notable topics of the blog include how we think about performance, why we employ our team structure to manage portfolios, and the case for U.S. small growth companies. The feedback has been very encouraging thus far. Expect to see more blog posts in the year ahead.
As of September 30, 2022, we changed the name of the International Equity Fund to the International All Company Fund. We believe the new name better reflects the fact that this portfolio comprises companies of various sizes and reinforces our practice of using revenue as opposed to market capitalization to gauge company size.
Finally, effective January 1, 2023, Robert Young III assumed the role of President of Brown Capital, taking over the office from Keith Lee, who remains Chief Executive Officer, Chief Investment Officer and Senior Portfolio Manager on the Small Company Team. Rob joined Brown Capital from T. Rowe Price in 1999 to build out the firm’s distribution team. He adds the President title to his current role of Head of Marketing and Sales/Client Service. Rob has served on the firm’s Management Committee since 2007, and is currently the president of the firm’s mutual fund trust. Please join us in congratulating Rob for this well-deserved recognition.
Thank you for your continued support of Brown Capital Management.
Annual Report | March 31, 202321
The Brown Capital Management International All Company Fund
March 31, 2023 (Unaudited)
Growth of a hypothetical $10,000 investment - Investor Class
This graph assumes an initial investment of $10,000 at March 31, 2013. All dividends and distributions are reinvested. This graph depicts the performance of The Brown Capital Management International All Company Fund (the “Fund”) Investor Class versus the MSCI EAFE® Index. It is important to note that the Fund is a professionally managed mutual fund while the index is not available for investment and is unmanaged. The comparison is shown for illustrative purposes only.
Performance (as of March 31, 2023)
|
| Average Annual Total Returns |
| Since |
| Total Annual Fund |
|
| Net Annual Fund Operating Expenses | ||||||
1 Year |
| 3 Year |
| 5 Year |
| 10 Year | |||||||||
The Brown Capital Management International All Company Fund - Investor Class | | -10.06% | | 5.33% | | 1.73% | | 4.38% | | 3.73% | | 1.59% | | | 1.26% |
The Brown Capital Management International All Company Fund - Institutional Class | | -9.80% | | 5.61% | | 1.99% | | 4.62% | | 3.84% | | 1.35% | | | 1.01% |
MSCI EAFE® Index | | -0.86% | | 13.51% | | 4.03% | | 5.50% | | 4.72% | | | | | |
Morningstar Foreign Large Growth Category | | -5.62% | | 10.63% | | 3.94% | | 5.79% | | 4.37% | | | | | |
IACF‐Investor Percentile Ranking vs | | 87/449 | | 95/404 | | 87/350 | | 87/231 | | N/A | | | | | |
IACF‐Institutional Percentile Ranking vs | | 87/449 | | 94/404 | | 82/350 | | 81/231 | | N/A | | | | | |
The performance information quoted above represents past performance, which is not a guarantee of future results. Investment return and principal value of an investment will fluctuate so that an investor’s shares, when redeemed, may be worth more or less than their original cost. Current performance may be lower or higher than the performance data quoted. An investor may obtain performance data current to the most recent month-end by visiting www.browncapital.com.
The expense ratios shown are from the Fund’s prospectus dated August 1, 2022. These numbers may vary from the expense ratios shown elsewhere in this report because it is based on a different time period.
22www.browncapital.com
The Brown Capital Management International All Company Fund
March 31, 2023 (Unaudited)
The graph and table do not reflect the deduction of taxes that a shareholder would pay in Fund distributions or the redemption of Fund shares. Average annual total returns are historical in nature and measure net investment income and capital gain or loss from portfolio investments assuming reinvestments of distributions.
Investing in the securities of foreign companies generally involves greater risk than investing in larger, more established domestic companies. Therefore, investments in the Fund may involve a greater degree of risk than investments in other mutual funds that invest in larger, more established domestic companies.
The Institutional Class of the Fund commenced operations on August 1, 2014. The historical performance shown for periods prior to August 1, 2014 was calculated synthetically using the performance and the fees and expenses of the Investor Class. If the Institutional Class had been available during the periods prior to August 1, 2014, the performance shown may have been different. Please refer to the Fund’s prospectus for further details concerning historical performance.
The MSCI EAFE® Index (Europe, Australia, Far East) is a free float-adjusted market capitalization index that is designed to measure the equity market performance of developed markets excluding the U.S. and Canada.
Morningstar Foreign Large Growth Category – portfolios focus on high-priced growth stocks, mainly outside of the United States. Most of these portfolios divide their assets among a dozen or more developed markets, including Japan, Britain, France, and Germany. These portfolios primarily invest in stocks that have market caps in the top 70% of each economically integrated market (such as Europe or Asia ex-Japan). Growth is defined based on fast growth (high growth rates for earnings, sales, book value, and cash flow) and high valuations (high price ratios and low dividend yields). These portfolios typically will have less than 20% of assets invested in U.S. stocks. Morningstar. All Rights Reserved. The information contained herein: (1) is proprietary to Morningstar and/or its content providers; (2) may not be copied or distributed; and (3) is not warranted to be accurate, complete or timely. Neither Morningstar or its content providers are responsible for any damages or losses arising from any use of this information. Past performance is no guarantee of future results.
You cannot invest directly in an index.
Note: Diversification does not eliminate the risk of experiencing investment losses.
Annual Report | March 31, 202323
Shares |
|
|
| Value (Note 1) |
|
COMMON STOCKS - 96.27% | | | | ||
| | Argentina - 3.21% | | | |
1,551 | | Mercadolibre Inc.(a) | | $2,044,311 |
|
| | | | |
|
| | Australia - 8.29% | | |
|
7,289 | | Atlassian Corp. PLC (a) | | 1,247,658 |
|
15,866 | | Cochlear Ltd. | | 2,510,243 |
|
16,565 | | REA Group Ltd. | | 1,528,387 |
|
| | | | 5,286,288 |
|
| | | | |
|
| | Canada - 5.46% | | |
|
30,866 | | The Descartes Systems Group Inc.(a) | | 2,491,205 |
|
20,653 | | Shopify Inc.(a) | | 990,105 |
|
| | | | 3,481,310 |
|
| | | | |
|
| | Denmark - 10.66% | | |
|
29,316 | | Chr Hansen Holding A/S | | 2,223,447 |
|
19,523 | | Novo Nordisk A/S | | 3,085,892 |
|
19,705 | | SimCorp A/S | | 1,488,198 |
|
| | | | 6,797,537 |
|
| | | | |
|
| | France - 4.01% | | |
|
43,574 | | Dassault Systemes SE | | 1,789,829 |
|
6,960 | | Ipsen SA | | 766,137 |
|
| | | | 2,555,966 |
|
| | | | |
|
| | Germany - 7.95% | | |
|
18,546 | | Carl Zeiss Meditec AG | | 2,574,492 |
|
1,787 | | Rational AG | | 1,195,752 |
|
10,328 | | SAP SE | | 1,299,961 |
|
| | | | 5,070,205 |
|
| | | | |
|
| | Hong Kong - 2.73% | | |
|
581,146 | | Kingdee International SoftwareGroup Co. Ltd.(a) | | 941,690 |
|
161,643 | | Kingsoft Corp. Ltd. | | 795,870 |
|
| | | | 1,737,560 |
|
| | | | |
|
| | Ireland - 6.79% | | |
|
9,952 | | Flutter Entertainment PLC(a) | | 1,809,445 |
|
11,807 | | Icon PLC(a) | | 2,521,857 |
|
| | | | 4,331,302 |
|
| | | | |
|
| | Israel - 3.94% | | |
|
7,513 | | Check Point Software Technologies Ltd. (a) | | 976,690 |
|
10,368 | | CyberArk Software Ltd.(a) | | 1,534,257 |
|
| | | | 2,510,947 |
|
24www.browncapital.com
The Brown Capital Management International All Company Fund
Schedule of InvestmentsMarch 31, 2023
Shares |
|
|
| Value (Note 1) |
|
COMMON STOCKS - 96.27% (continued) | | |
| ||
| | Italy - 1.67% | | |
|
49,925 | | Azimut Holding SPA | | $1,066,635 |
|
| | | | |
|
| | Japan - 8.40% | | |
|
109,800 | | CyberAgent Inc. | | 922,064 |
|
15,400 | | GMO Payment Gateway, Inc. | | 1,319,917 |
|
69,000 | | Kakaku.com, Inc. | | 938,015 |
|
32,200 | | M3, Inc. | | 800,544 |
|
110,000 | | MonotaRO Co. Ltd. | | 1,372,773 |
|
| | | | 5,353,313 |
|
| | | | |
|
| | Netherland - 4.43% | | |
|
2,196 | | ASML Holding NV | | 1,488,959 |
|
10,554 | | Wolters Kluwer NV | | 1,331,726 |
|
| ��� | | | 2,820,685 |
|
| | | | |
|
| | New Zealand - 1.94% | | |
|
20,640 | | Xero Ltd.(a) | | 1,233,709 |
|
| | | | |
|
| | Norway - 0.16% | | |
|
47,795 | | Autostore Holdings LTD (a) | | 102,576 |
|
| | | | |
|
| | Poland - 2.03% | | |
|
141,847 | | Inpost S.A.(a) | | 1,294,049 |
|
| | | | |
|
| | Spain - 1.46% | | |
|
94,181 | | Grifols SA(a) | | 930,289 |
|
| | | | |
|
| | Switzerland - 12.94% | | |
|
109 | | Chocoladefabriken Lindt & Sprungli AG | | 1,286,628 |
|
661 | | Givaudan SA | | 2,147,825 |
|
1,468 | | Partners Group Holding AG | | 1,374,701 |
|
4,067 | | Tecan Group AG | | 1,774,465 |
|
24,116 | | Temenos Group AG | | 1,667,917 |
|
| | | | 8,251,536 |
|
| | | | |
|
| | United Kingdom - 10.20% | | |
|
95,741 | | Abcam PLC (a) | | 1,288,674 |
|
341,289 | | AJ Bell PLC | | 1,453,333 |
|
16,569 | | Dechra Pharmaceuticals PLC | | 541,644 |
|
28,186 | | Diageo PLC | | 1,256,590 |
|
101,136 | | Ocado Group PLC (a) | | 667,470 |
|
40,087 | | RELX PLC | | 1,294,628 |
|
| | | | 6,502,339 |
|
| | | | |
|
Total Common Stocks (Cost: $57,300,339) - 96.27% | | 61,370,557 |
| ||
| | | | |
|
Annual Report | March 31, 202325
The Brown Capital Management International All Company Fund
Schedule of InvestmentsMarch 31, 2023
Shares |
|
|
| Value (Note 1) |
|
SHORT TERM INVESTMENTS - 3.52% | | |
| ||
2,246,034 | | First American Treasury Obligation Fund - Institutional Class 4.72%(b) (Cost: $2,246,034) | | $2,246,034 |
|
| | | | |
|
Total Investments (Cost: $59,546,373) - 99.79% | | 63,616,591 |
| ||
Other Assets, Net of Liabilities - 0.21% | | 133,956 |
| ||
Net Assets - 100.00% | | $63,750,547 |
|
(a)Non-income producing
(b)Effective 7 day yield as of March 31, 2023
Summary of Investments by Sector | | | | | |
| | | | | |
Sector |
| % of Net Assets |
| Value |
|
Communication Services | | 5.32% | | $3,388,466 | |
Consumer Discretionary | | 7.09% | | 4,521,225 | |
Consumer Staples | | 3.99% | | 2,543,217 | |
Financials | | 6.11% | | 3,894,668 | |
Health Care | | 26.34% | | 16,794,237 | |
Industrials | | 10.34% | | 6,591,506 | |
Information Technology | | 30.22% | | 19,265,965 | |
Materials | | 6.86% | | 4,371,273 | |
Short Term Investments | | 3.52% | | 2,246,034 | |
Other Assets, Net of Liabilities | | 0.21% | | 133,956 | |
Total | | 100.00% | | $63,750,547 | |
The Fund’s classifications of issuers into sectors, industries and sub-industries may differ for financial reporting purposes than for other reporting and compliance purposes. The classification for purposes of this financial report are unaudited.
See Notes to Financial Statements
26www.browncapital.com
The Brown Capital Management International Small Company Fund
Management Discussion of Fund Performance (Unaudited)March 31, 2023
For the 12 months ending March 31, 2023, the Brown Capital Management International Small Company Fund (Investor shares) was down 9.52% versus the MSCI All Country World ex US Small Cap index, which fell 9.91%. This represents outperformance of 39 basis points for the fiscal year.
This absolute decline came during a period of war in Ukraine, persistent inflation, rapidly rising interest rates and disrupted supply chains. Although things now seem to be normalizing on a few fronts—inflation has peaked, interest-rate increases have slowed and supply-chain disruptions seem to be easing—we do not know what the macro environment will be going forward. A looming recession and a percolating banking crisis bear monitoring closely.
We believe that Exceptional Growth Companies (EGCs) have certain advantages during challenging periods like the fiscal year just ended. EGCs tend to provide important, mission-critical products and services that are not easily replaced or replicated. We think these businesses have distinctive characteristics: a durable revenue stream, a defensible competitive position, an ability to deliver through good execution, and profitability to fuel and sustain earnings growth.
The last of these four criteria, profitability, is a feature that had been out of vogue until recently. From 1990 to 2022, the percentage of initial public offerings of businesses with positive earnings fell from 85% to 21%, according to Partners Group. To some extent, this reflects a shift in business models where network effects, the internet and brand building result in emphasizing rapid revenue growth over profitability. This year, uncertain global financial markets have refocused investors’ attention back on profitability. Rising interest rates have hurt both equity and debt markets, limiting capital-raising options and prompting a renewed awareness of the importance of companies being able to finance themselves through profitability.
We have always thought of profitability as important. Profitability suggests a transaction of mutual benefit, where buyers and sellers develop and sustain a relationship over the long term, forming the basis of durable revenue. Profitability also suggests a viable business model. Until a company demonstrates profitability, it is unclear if the customer base is willing to pay for the full cost of delivering the product or service. The requirement to generate profits also contributes to management discipline. Finally, profitability lessens the chance that a company requires outside equity or debt financing to fund growth, which is dilutive or leveraging, and may not be available to a company when needed. Companies that rely on external financing for cash infusions survive at the mercy of the global financial markets. Now, rising interest rates, tighter credit markets and a percolating banking crisis are making profits all the more important.
Since the International Small Company Fund started in 2015, 60 of the 63 total companies we have owned were profitable on an operating basis at the time of purchase. The Fund’s average operating margin is about 21%, as of March 31, 2023. Of course, there are exceptions. A company we hold may enter an investment phase—say in salespeople, R&D or capital expenditures—that may move it into the red for a while. Furthermore, we sometimes find what we think is an EGC that given its stage or current level of investment is not yet profitable. For such a company, we analyze its path to profitability. A new holding in the 2023 fiscal year, Global-e Online, is one such example. Global-e is in the early stage of a rollout of its cross-border ecommerce-enabling platform, which we expect will be substantial. Although the company is currently generating operating losses, compensating for that is positive operating cash flow, which is increasing in the near term. See the full description in the New Additions section below for our view of this company’s path to profitability.
Performance: Contributors
Among the top contributors to performance for the fiscal year ended March 31, 2023, were Interparfums and The Descartes Systems Group.
Interparfums is a France-based purveyor of fine fragrances and colognes on behalf of a marquee list of global brands. The company saves time and headaches for its customers by designing, manufacturing, marketing and distributing products that are often tangential to their clients’ core businesses and capabilities. For example, Interparfums developed a cologne and packaging for Montblanc that is consistent in quality and style with that brand’s pens, leather goods and watches. This relationship is now about 25% of Interparfums’s revenue. Interparfums posted strong results for the year 2022, with revenue up 26% and operating margins of 18.7%, a 110-basis point improvement. Furthermore, management’s revenue outlook for 2023 is for a very achievable 6% gain. The success of three key brands—Montblanc, Coach and Jimmy Choo—is driving these results. A new relationship with Lacoste (a 15-year agreement), will yield its first products in 2024. We remain enthusiastic about Interparfums’s prospects.
The Descartes Systems Group is a Canada-based company that helps its customers plan and execute cargo shipments, which can be particularly complex when they involve intermodal transportation. For example, shipping a cargo container from Rotterdam to Chicago may require the coordination of various logistics companies and the use of multiple modes of transportation. The shipper of the container must comply with all customs and local regulations, and wants to receive clear pricing and schedules. Descartes Systems delivers its solutions through its Global Logistics Network platform, a cloud-based technology. This platform has allowed Descartes to acquire and assimilate services provided by smaller competitors. Current stresses on today’s supply chains include the transition to e-commerce sales, trade-policy changes, shortages and the urgencies they create, as well as shifting trade relationships. We think exogenous disruptions to supply chains are here to stay, and Descartes helps customers solve supply-chain bottlenecks. The Descartes Systems Group’s fiscal year ended Jan. 31, 2023, demonstrated a robust result. Revenue grew 14% to $486 million, and it was increasingly profitable with operating profit up 26%, on a USD basis.
Annual Report | March 31, 202327
The Brown Capital Management International Small Company Fund
Management Discussion of Fund Performance (Unaudited)March 31, 2023
Performance: Detractors
Among the top detractors from performance for the fiscal year ended March 31, 2023, were Dechra Pharmaceuticals and STRATEC.
Dechra Pharmaceuticals is a U.K.-based animal-health company offering prescription-only medications for companion animals, livestock and equines. Dechra specializes in niche pharmaceuticals in therapeutic categories such as endocrinology, dermatology, critical care and pain management. These niche drugs often target small markets up to $10 million in revenue, saving the lives of animals in critical condition, while facing little direct competition from larger animal-health companies. Dechra has developed its own direct salesforce in major markets. This facilitates Dechra’s active M&A strategy to add products and roll them out through its own distribution network. During the year, Dechra announced two such acquisitions, Piedmont Animal Health and Med-Pharmex, funded through a combination of cash, debt and an equity raise, which was viewed unfavorably in the current environment. However, we believe Dechra has a resilient portfolio, strong cash-flow-generation capabilities, and a track record of deleveraging post acquisitions. Furthermore, through conversations with the management team, we see the strategic merits to these two deals. They are a typical example of Dechra’s M&A strategy, offering potential revenue synergies by using existing distribution. We remain favorable on the company’s positioning and execution of its strategy. In April 2023, after the end of the fiscal year, private equity firm EQT proposed a takeover of Dechra at about a 50% premium. We will be disappointed to see this successful long-term holding go if a transaction is consummated.
STRATEC is a German company that designs and manufactures automated analytical instruments for clinical diagnostics and life-science research, as well as related consumables. These machines are used to diagnose and monitor diseases. STRATEC’s customers, including Roche, Danaher and Thermo Fisher, market the systems, software and consumables, usually with their own reagents, to reference labs, blood banks and research institutes. Industry-wide production of in-vitro diagnostic machines is now 40% outsourced, up from about 27% a decade ago. STRATEC is benefitting as diagnostic companies save time and money by shifting away from the in-house development of machines. STRATEC announced its 2022 results, in which revenue declined 4.4% versus 2021’s pandemic-fueled strong results, and correspondingly, EBIT margins declined from 18.9% to 16.4%, both at the low end of expectations. For 2023, revenue growth is expected to rebound to an 8-12% gain, but margins could stay under pressure, resulting in an expected EBIT range of 12-14%. Product mix, input costs and new product introductions are the culprits. The revenue strength is coming from newly launched systems, as existing systems are still weak after the strong demand for them during the COVID-19 pandemic period. A new efficiency program and proposed price increases may improve STRATEC’s earnings outlook. We continue to think that STRATEC is an EGC because of its differentiated ability to develop and manufacture high-precision instruments.
New Additions
We added three companies during the fiscal year: SES-imagotag, Fortnox and Global-e Online.
SES-imagotag is a France-headquartered provider of digital solutions for traditional brick-and-mortar retailers. SES-imagotag’s specific niche is electronic shelf labels (ESLs) and related systems. ESLs provide an integrated, radio-frequency-based solution that gives retailers the opportunity to alter product prices quickly without having to incur the labor cost to change the labels manually. SES-imagotag is the market leader with more than 50% share in a niche market growing approximately 30% a year. SES-imagotag has more than 300 customers in 60 countries, representing at least 30,000 stores and 300 million labels. According to the company, the top 250 retailers worldwide provide a total addressable market (TAM) of roughly 10 billion units. At present, there are roughly 500 million ESLs installed in the industry, so the overall market-penetration rate is a modest 5%. Given the continuing threat to brick-and-mortar retailers from omnichannel sales, the ability to offer dynamic pricing is essential. Walmart, the world’s largest retailer, recently became a more significant customer of SES-imagotag, after an approximately five-year trial period. Walmart’s potential 500 million ESLs outnumber the unit sales that SES-imagotag has sold in its entire 30-year operating history. We believe SES-imagotag is an EGC because it saves time, money and headaches for its customers by improving revenue and operating margins. At the time of purchase, the company had USD-equivalent revenue of $441.6 million (2021) and a market capitalization of $1.3 billion. SES-imagotag was also profitable for the first time in 2021.
Fortnox is a Swedish cloud-based accounting software company. By moving accounting-related workflows to the cloud, Fortnox helps reduce the complexity and costs of running small businesses in Sweden, typically with 50 employees or fewer. Fortnox is continuously expanding its product suite and is structurally advantaged in R&D and product development, offering features and ease-of-use that are unmatched by the competition. We believe this competitive edge should enable Fortnox to grow its client base from more than 400,000 currently to 700,000 in the medium term. New product functionality should also increase revenue per client. We also like Fortnox’s entry into fintech. Invoicing received and distributed by clients on the Fortnox platform accounts for 20% of the GDP in Sweden. This provides Fortnox accurate and real-time data on its customers, giving the company an edge in understanding the credit profiles of companies on its platform, and therefore the ability to price risks more appropriately. For example, a company with an outstanding receivable can be paid immediately by Fortnox, rather than three months later by its customers, for a smaller charge compared to that charged by a traditional bank, and with the ease of using a single platform. While this initiative is still in its early stages, working-capital financing represents a significantly larger revenue-per-client opportunity than Fortnox’s base business. We like Fortnox as an accounting software company and will monitor its progress on the fintech front. Fortnox is a particularly profitable company, with EBIT margins in the mid-30% range and net margins in the mid-20% range.
28www.browncapital.com
The Brown Capital Management International Small Company Fund
Management Discussion of Fund Performance (Unaudited)March 31, 2023
Global-e Online, headquartered in Israel, provides a turnkey solution for companies that want to sell their products across international borders and direct to consumers. The company employs a SaaS model and a fulfillment network that handles all of the complexities of cross-border transactions, including foreign-exchange calculations, multiple languages, duties and taxes, shipping and handling, as well as product returns. Global-e Online’s customers can give their buyers certainty in landing price and delivery date. These 1,000-plus customers significantly expand their total addressable market and growth opportunities by using Global-e Online. The company’s offering—ecommerce distribution to 200 markets with a localized service—is a transaction of mutual benefit that we think can be delivered profitably despite current operating losses. Although our earnings model has Global-e Online not yet profitable because of significant amortization, operating cash flow for 2022 was about $60 million, and we expect this to improve to about $70 million in 2023. Global-e Online has about $2.5 billion in gross merchandise volume (GMV) with a 17% take rate, yielding $409 million in revenue for 2022. We expect revenue to double in the next 2-3 years for this leading company.
Deletions
During the fiscal year, we eliminated three companies: Schoeller-Bleckmann Oilfield Equipment, Albioma and NNIT, all of which we owned since 2015.
Schoeller-Bleckmann Oilfield Equipment, an Austrian-headquartered company, is a global market leader in providing high-precision components for the oil-service industry. While Schoeller-Bleckmann remains a dominant player in its niche market, the industry fundamentals have changed such that we no longer consider Schoeller-Bleckmann to be an EGC. Global concerns about climate change and fossil fuels have also grown during our ownership. Strong recent share-price performance provided what we think is an attractive exit point.
Albioma is a French alternative-energy company that generates energy from biomass (often bagasse) and photovoltaic sources. Albioma mainly contracts with the French state electricity utility, Électricité de France (EDF), which has a monopoly in supplying power in the French territories. These are small islands that are independent of a power grid, and for which there are not many energy options. Private equity firm KKR acquired Albioma for about a 52% premium over Albioma’s undisturbed closing price. The deal was first announced near the end of fiscal year 2022.
NNIT is a Danish IT-consulting company. We were attracted to NNIT when it spun out of Novo Nordisk and planned to sell its considerable expertise in health care IT to other global companies. We expected NNIT to retain a large portion of its Novo Nordisk business, which it was unable to do, and we anticipated stronger wins with new clients. During the fiscal year, we concluded that NNIT was no longer an EGC and eliminated it from the Fund.
Firm Update
This year, we kicked off a blog series to better share our thoughts with our shareholders. Notable topics of the blog include how we think about performance, why we employ our team structure to manage portfolios, and the case for U.S. small growth companies. The feedback has been very encouraging thus far. Expect to see more blog posts in the year ahead.
As of September 30, 2022, we changed the name of the International Equity Fund to the International All Company Fund. We believe the new name better reflects the fact that this portfolio comprises companies of various sizes and reinforces our practice of using revenue as opposed to market capitalization to gauge company size.
Finally, effective January 1, 2023, Robert Young III assumed the role of President of Brown Capital, taking over the office from Keith Lee, who remains Chief Executive Officer, Chief Investment Officer and Senior Portfolio Manager on the Small Company Team. Rob joined Brown Capital from T. Rowe Price in 1999 to build out the firm’s distribution team. He adds the President title to his current role of Head of Marketing and Sales/Client Service. Rob has served on the firm’s Management Committee since 2007, and is currently the president of the firm’s mutual fund trust. Please join us in congratulating Rob for this well-deserved recognition.
Thank you for your continued support of Brown Capital Management.
Annual Report | March 31, 202329
The Brown Capital Management International Small Company Fund
March 31, 2023 (Unaudited)
Growth of a hypothetical $10,000 investment - Investor Class
This graph assumes an initial investment of $10,000 at September 30, 2015. All dividends and distributions are reinvested. This graph depicts the performance of The Brown Capital Management International Small Company Fund (the “Fund”) Investor Class versus the MSCI All Country World ex USA Small Cap Index. It is important to note that the Fund is a professionally managed mutual fund while the index is not available for investment and is unmanaged. The comparison is shown for illustrative purposes only.
Performance (as of March 31, 2023)
|
| Average Annual Total Returns | | Since Inception 9/30/15 |
|
| Total Annual Fund Operating Expenses | ||||
1 Year |
| 3 Year |
| 5 Year |
| ||||||
The Brown Capital Management International Small Company Fund - | | -9.52% | | 12.78% | | 5.52% | | 10.95% | | | 1.31% |
The Brown Capital Management International Small Company Fund - | | -9.30% | | 13.07% | | 5.79% | | 11.23% | | | 1.06% |
MSCI All Country World ex USA Small Cap Index | | -9.91% | | 15.53% | | 2.10% | | 6.51% | | | |
Morningstar Foreign Small/Mid Growth Category | | -11.91% | | 10.63% | | 1.15% | | 5.31% | | | |
ISCF‐Investor Percentile ranking vs. | | 36/147 | | 34/132 | | 3/117 | | N/A | | | |
ISCF‐Institutional Percentile Ranking vs | | 33/147 | | 28/132 | | 2/117 | | N/A | | | |
The performance information quoted above represents past performance, which is not a guarantee of future results. Investment return and principal value of an investment will fluctuate so that an investor’s shares, when redeemed, may be worth more or less than their original cost. Current performance may be lower or higher than the performance data quoted. An investor may obtain performance data current to the most recent month-end by visiting www.browncapital.com.
The expense ratios shown are from the Fund’s prospectus dated August 1, 2022. These numbers may vary from the expense ratios shown elsewhere in this report because it is based on a different time period.
30www.browncapital.com
The Brown Capital Management International Small Company Fund
March 31, 2023 (Unaudited)
The graph and table do not reflect the deduction of taxes that a shareholder would pay in Fund distributions or the redemption of Fund shares. Average annual total returns are historical in nature and measure net investment income and capital gain or loss from portfolio investments assuming reinvestments of distributions.
Investing in the securities of international small companies generally involves greater risk than investing in larger, more established domestic companies. Therefore, investments in the Fund may involve a greater degree of risk than investments in other mutual funds that invest in larger, more established companies.
The MSCI All Country World ex USA Small Cap Index is a free float-adjusted market capitalization weighted index that is designed to measure the equity market performance of small capitalization developed and emerging markets, excluding the United States. This Index captures small cap representation across 22 of 23 Developed Markets countries (excluding the US) and 24 Emerging Markets countries. With 4,226 constituents, the index covers approximately 14% of the global equity opportunity set outside the U.S.
Morningstar Foreign Small/Mid Growth Category – Foreign small/mid-growth portfolios invest in international stocks that are smaller, growing faster, and higher-priced than other stocks. These portfolios primarily invest in stocks that fall in the bottom 30% of each economically integrated market (such as Europe or Asia ex-Japan). Growth is defined based on fast growth (high growth rates for earnings, sales, book value, and cash flow) and high valuations (high price ratios and low dividend yields). These portfolios typically will have less than 20% of assets invested in U.S. stocks. Morningstar. All Rights Reserved. The information contained herein: (1) is proprietary to Morningstar and/or its content providers;(2) may not be copied or distributed; and (3) is not warranted to be accurate, complete or timely. Neither Morningstar or its content providers are responsible for any damages or losses arising from any use of this information. Past performance is no guarantee of future results.
You cannot invest directly in an index.
Note: Diversification does not eliminate the risk of experiencing investment losses.
Annual Report | March 31, 202331
Shares |
|
|
| Fair Value |
|
COMMON STOCKS - 97.94% | | | | ||
| | Australia - 9.99% | | | |
602,805 | | Pro Medicus Ltd. | | $25,736,066 | |
1,186,547 | | REA Group Ltd. | | 109,477,996 | |
2,182,921 | | WiseTech Global Ltd. | | 95,050,452 |
|
| | | | 230,264,514 |
|
| | | | |
|
| | Canada - 10.25% | | |
|
1,472,019 | | The Descartes Systems Group Inc. (a) | | 118,807,127 |
|
855,940 | | Kinaxis, Inc. (a) | | 117,519,960 |
|
| | | | 236,327,087 |
|
| | | | |
|
| | Denmark - 5.46% | | |
|
5,129,070 | | Ambu A/S (a) | | 76,719,332 |
|
651,118 | | SimCorp A/S | | 49,174,961 |
|
| | | | 125,894,293 |
|
| | | | |
|
| | France - 14.13% | | |
|
278,863 | | Esker Sa | | 39,678,581 |
|
1,868,099 | | Interparfums Sa | | 140,399,163 |
|
2,679,246 | | Lectra (b) | | 105,620,545 |
|
335,715 | | SES-imagotag SA (a) | | 39,830,840 |
|
| | | | 325,529,129 |
|
| | | | |
|
| | Germany - 9.86% | | |
|
3,854,173 | | Evotec SE (a) | | 81,235,742 |
|
1,385,636 | | Nexus AG (b) | | 82,349,528 |
|
936,120 | | Stratec Biomedical AG (b) | | 63,553,175 |
|
| | | | 227,138,445 |
|
| | | | |
|
| | Hong Kong - 1.41% | | |
|
20,007,492 | | Kingdee International Software Group Co. Ltd.(a) | | 32,420,196 |
|
| | | | |
|
| | | | |
|
| | India - 1.81% | | |
|
1,065,494 | | Crisil Ltd. | | 41,729,066 |
|
| | | | |
|
| | Ireland - 0.60% | | |
|
76,127 | | Flutter Entertainment PLC (a) | | 13,841,198 |
|
| | | | |
|
| | Israel - 4.43% | | |
|
603,146 | | CyberArk Software Ltd. (a) | | 89,253,545 |
|
395,316 | | Global-E Online Ltd. (a) | | 12,741,035 |
|
| | | | 101,994,580 |
|
| | | | |
|
| | Italy - 2.21% | | |
|
2,386,695 | | Azimut Holding SPA | | 50,991,120 |
|
32www.browncapital.com
The Brown Capital Management International Small Company Fund
Schedule of InvestmentsMarch 31, 2023
Shares |
|
|
| Fair Value |
|
COMMON STOCKS - 97.94% (continued) | | |
| ||
| | Japan - 10.25% | | |
|
414,435 | | GMO Payment Gateway, Inc. | | $35,520,770 |
|
2,703,918 | | HIDAY HIDAKA Corp. (b) | | 43,722,929 |
|
2,413,387 | | Kakaku.com, Inc. | | 32,808,613 |
|
334,621 | | M3, Inc. | | 8,319,216 |
|
2,269,880 | | SMS Co. Ltd. | | 54,620,724 |
|
483,825 | | Software Service, Inc. (b) | | 32,467,563 |
|
2,011,695 | | Towa Pharmaceutical Co. Ltd. | | 28,711,444 |
|
| | | | 236,171,259 |
|
| | | | |
|
| | New Zealand - 1.92% | | |
|
50,975,341 | | PushPay Holdings Ltd. (a) | | 44,306,148 |
|
| | | | |
|
| | Sweden - 7.11% | | |
|
4,039,842 | | Fortnox AB | | 27,604,354 |
|
3,743,249 | | Hemnet Group AB | | 62,970,544 |
|
554,178 | | MIPS AB | | 27,957,183 |
|
2,904,793 | | Sectra AB | | 45,378,470 |
|
| | | | 163,910,551 |
|
| | | | |
|
| | Switzerland - 1.06% | | |
|
26,121 | | Partners Group Holding AG | | 24,460,870 |
|
| | | | |
|
| | United Kingdom - 17.45% | | |
|
6,053,168 | | Abcam PLC (a) | | 81,475,641 |
|
14,004,881 | | AJ Bell PLC | | 59,637,878 |
|
2,450,833 | | Dechra Pharmaceuticals PLC | | 80,118,270 |
|
3,441,811 | | PayPoint PLC | | 19,318,366 |
|
582,518 | | Playtech PLC (a) | | 3,786,971 |
|
6,292,783 | | Rightmove PLC | | 43,704,195 |
|
2,571,664 | | Victrex PLC | | 50,536,129 |
|
1,922,102 | | Videndum PLC | | 20,984,164 |
|
3,793,946 | | YouGov PLC | | 42,589,693 |
|
| | | | 402,151,307 |
|
| | | | |
|
Total Common Stocks (Cost: $2,238,092,252) - 97.94% | | 2,257,129,763 |
| ||
| | | | |
|
| | | | |
|
SHORT TERM INVESTMENTS - 2.57% | | |
| ||
59,127,751 | | First American Treasury Obligation Fund - Institutional Class 4.72%(c) (Cost: $59,127,751) | | 59,127,751 |
|
| | | | | |
Total Investments (Cost: $2,297,220,003) - 100.51% | | 2,316,257,514 | | ||
Liabilities in Excess of Other Assets - (0.51%) | | (11,641,187 | ) | ||
Net Assets - 100.00% | | $2,304,616,327 |
|
(a)Non-income producing
(b)Affiliated company - The Fund owns greater than 5% of the outstanding voting securities of this issuer. See Note 1 for more information.
(c)Effective 7 day yield as of March 31, 2023
See Notes to Financial Statements
Annual Report | March 31, 202333
The Brown Capital Management International Small Company Fund
Schedule of InvestmentsMarch 31, 2023
Summary of Investments by Sector | | | | | |
| | | | | |
Sector |
| % of Net Assets |
| Value |
|
Business Services | | 29.41% | | $677,670,555 | |
Consumer Related | | 10.88% | | 250,691,608 | |
Industrial Products & Systems | | 6.78% | | 156,156,674 | |
Information/Knowledge Management | | 31.28% | | 720,966,481 | |
Medical/Health Care | | 14.39% | | 331,695,335 | |
Miscellaneous | | 5.20% | | 119,949,110 | |
Short Term Investments | | 2.57% | | 59,127,751 | |
Liabilities in Excess of Other Assets | | (0.51% | ) | (11,641,187 | ) |
Total | | 100.00% | | $2,304,616,327 | |
The Fund’s classifications of issuers into sectors, industries and sub-industries may differ for financial reporting purposes than for other reporting and compliance purposes. The classification for purposes of this financial report are unaudited.
34www.browncapital.com
See Notes to Financial Statements
| Small |
| Mid |
| International All |
| International Small | |
Assets: | | | | | | | | |
Unaffiliated Investments, at cost | $1,454,954,641 | | $27,503,441 | | $59,546,373 | | $1,971,294,515 | |
Affiliated Investments, at cost | 1,088,036,756 |
| — |
| — |
| 325,925,488 | |
Unaffiliated Investments, at value (Note 1) | 2,511,468,989 | | 38,445,146 | | 63,616,591 | | 1,988,543,774 | |
Affiliated Investments, at value (Note 1) | 1,005,595,869 |
| — |
| — |
| 327,713,740 | |
Total Investments, at value (Note 1) | 3,517,064,858 | | 38,445,146 | | 63,616,591 | | 2,316,257,514 | |
Foreign Cash, at value | — | | — | | 782 | * | 13,179 | ** |
Receivables: | | | | | | | | |
Fund shares sold | 4,982,103 | | — | | 25,456 | | 5,584,298 | |
Investments sold | — | | — | | — | | 576,049 | |
Dividends, interest and reclaims, at value | 454,036 | | 6,574 | | 215,879 | * | 3,924,480 | ** |
Unrealized gain on foreign currency spot trades | — | | — | | — | | 2,586 | |
Receivable from investment manager | — | | 12,001 | | — | | — | |
Prepaid expenses | 47,391 |
| 30,644 |
| 31,271 |
| 96,491 | |
Total Assets | 3,522,548,388 |
| 38,494,365 |
| 63,889,979 |
| 2,326,454,597 | |
Liabilities: | | | | | | | | |
Payables: | | | | | | | | |
Fund shares redeemed | 3,153,822 | | 100,004 | | 11,986 | | 18,170,039 | |
Investments purchased | 11,644,239 | | — | | 97,267 | | — | |
Foreign capital gains tax | — | | — | | — | | 1,552,851 | |
Unrealized loss on foreign currency spot trades | — | | — | | 132 | | — | |
Accrued expenses: | | | | | | | | |
Advisory fees | 2,871,470 | | — | | 2,785 | | 1,925,113 | |
Administration, accounting and transfer agent fees (Note 2) | 151,155 | | 13,649 | | 13,114 | | 22,429 | |
12b-1 fees - Investor Class | 135,498 | | 1,989 | | 492 | | 65,339 | |
Printing fees | 34,306 | | — | | — | | — | |
Other expenses | 42,255 |
| 3,903 |
| 13,656 |
| 102,499 | |
Total Liabilities: | 18,032,745 |
| 119,545 |
| 139,432 |
| 21,838,270 | |
Net Assets | $3,504,515,643 |
| $38,374,820 |
| $63,750,547 |
| $2,304,616,327 | |
Net Assets Consist of: | | | | | | | | |
Paid-in-capital | $2,267,593,151 | | $28,510,441 | | $62,309,480 | | $2,467,311,967 | |
Total distributable earnings (accumulated deficit) | 1,236,922,492 | | 9,864,379 | | 1,441,067 | | (162,695,640) | |
Net Assets | $3,504,515,643 |
| $38,374,820 |
| $63,750,547 |
| $2,304,616,327 | |
Investor Class: | | | | | | | | |
Net Asset Value, Maximum Offering Price and Redemption Price Per Share | $70.41 | | $11.89 | | $14.28 | (a) | $19.95 | (a) |
Net Assets | $822,783,288 | | $9,821,528 | | $2,491,720 | | $163,537,726 | |
Shares Outstanding, no par value (unlimited shares authorized) | 11,685,543 | | 825,831 | | 174,467 | | 8,195,988 | |
Institutional Class: | | | | | | | | |
Net Asset Value, Maximum Offering Price and Redemption Price Per Share | $72.94 | | $12.75 | | $14.43 | (a) | $20.34 | (a) |
Net Assets | $2,681,732,355 | | $28,553,292 | | $61,258,827 | | $2,141,078,601 | |
Shares Outstanding , no par value (unlimited shares authorized) | 36,766,872 | | 2,239,221 | | 4,245,531 | | 105,240,272 | |
*At Cost: $690 for Foreign Cash and $215,879 for dividends and reclaims.
**At Cost: $13,082 for Foreign Cash and $3,924,480 for dividends and reclaims.
(a)Redemption price per share may be reduced for any applicable redemption fees. For a description of the possible redemption fees, please see Note 1.
Annual Report | March 31, 202335
See Notes to Financial Statements
| Small |
| Mid |
| International All Company Fund |
| International Small Company Fund | |
Investment Income: | | | | | | | | |
Dividends from unaffiliated investments | $1,815,051 | | $104,747 | | $645,238 | | $23,052,181 | |
Dividends from affiliated investments | 570,254 | | — | | — | | 4,124,867 | |
Interest | 3,172,548 | | 15,878 | | 49,981 | | 1,776,747 | |
Foreign taxes withheld | — | | — | | (120,342) | | (3,740,106) | |
Total investment income | 5,557,853 | | 120,625 | | 574,877 | | 25,213,689 | |
Expenses: | | | | | | | | |
Advisory fees (Note 2) | 38,731,471 | | 282,882 | | 519,120 | | 22,942,108 | |
Fund accounting and administration fees (Note 2) | 156,119 | | 144,915 | | 149,987 | | 170,647 | |
Transfer agent fees (Note 2) | 1,850,958 | | 19,421 | | 3,602 | | 166,585 | |
Custody fees | 229,418 | | 6,157 | | 49,166 | | 663,296 | |
Registration fees | 100,514 | | 52,000 | | 52,000 | | 119,554 | |
12b-1 fees - Investor Class (Note 2) | 2,007,765 | | 24,569 | | 5,688 | | 409,924 | |
Professional fees | 106,666 | | 73,600 | | 73,748 | | 91,538 | |
Trustees’ fees and expenses (Note 7) | 65,673 | | 65,673 | | 65,673 | | 65,673 | |
Compliance services fees (Note 2) | 13,500 | | 13,500 | | 13,500 | | 13,500 | |
Printing fees | 371,202 | | 15,108 | | 14,159 | | 48,119 | |
Other expenses | 54,417 | | 7,896 | | 4,767 | | 20,599 | |
Total expenses | 43,687,703 | | 705,721 | | 951,410 | | 24,711,543 | |
Fees waived and reimbursed by the Advisor - Investor Class (Note 2) | — | | (89,029) | | (14,677) | | — | |
Fees waived and reimbursed by the Advisor - Institutional Class (Note 2) | — |
| (252,665) |
| (354,246) |
| — | |
Net expenses | 43,687,703 |
| 364,027 |
| 582,487 |
| 24,711,543 | |
Net investment income (loss) | (38,129,850) |
| (243,402) |
| (7,610) |
| 502,146 | |
Realized and Unrealized Gain (Loss) on: | | | | | | | | |
Net realized gain (loss) on unaffiliated investments | 497,960,070 | | (11,526) | | (2,498,746) | | (165,042,366) | |
Net realized gain (loss) on affiliated investments | (227,497,072) | | — | | — | | (1,332,861) | |
Net realized gain (loss) on foreign currency transactions | — | | — | | (17,560) | | 206,756 | |
Net change in unrealized appreciation (depreciation) of | (1,171,554,040) | | (6,121,553) | | (4,117,498) | | (51,243,389) | |
Net change in unrealized appreciation (depreciation) of affiliated investments | (225,421,591) | | — | | — | | (52,641,554) | |
Net change in unrealized foreign capital gains tax | — |
| — |
| — |
| 249,512 | |
Net Realized and Unrealized Gain (Loss) on Investments and | (1,126,512,633) |
| (6,133,079) |
| (6,633,804) |
| (269,803,902) | |
Net increase (decrease) in Net Assets Resulting From Operations | $(1,164,642,483) |
| $(6,376,481) |
| $(6,641,414) |
| $(269,301,756) | |
36www.browncapital.com
See Notes to Financial Statements
| Small Company Fund |
| Mid Company Fund | | ||||
| For the Year Ended |
| For the Year Ended |
| For the Year Ended |
| For the Year Ended | |
Increase (decrease) in Net Assets | | | | | | | | |
| | | | | | | | |
Operations: | | | | | | | | |
Net investment income (loss) | $(38,129,850 | ) | $(69,281,666 | ) | $(243,402 | ) | $(382,143 | ) |
Net realized gain (loss) on investments | 270,462,998 | | 787,766,972 | | (11,526 | ) | 2,715,432 | |
Net increase (decrease) in unrealized appreciation (depreciation) of investments | (1,396,975,631 | ) | (1,505,016,204 | ) | (6,121,553 | ) | (4,822,278 | ) |
Net Increase (Decrease) in Net Assets from operations | (1,164,642,483 | ) | (786,530,898 | ) | (6,376,481 | ) | (2,488,989 | ) |
Distributions to Shareholders: (Note 4) | | | | | | | | |
Investor | | | | | | | | |
Distributable earnings | $(91,918,514 | ) | $(158,444,003 | ) | $(867,847 | ) | $(395,334 | ) |
Return of capital | — | | — | | (496,162 | ) | — | |
| $(91,918,514 | ) | $(158,444,003 | ) | $(1,364,009 | ) | $(395,334 | ) |
Institutional | | | | | | | | |
Distributable earnings | $(247,202,430 | ) | $(395,673,002 | ) | $(2,153,986 | ) | $(980,247 | ) |
Return of capital | — | | — | | (1,231,466 | ) | — | |
| $(247,202,430 | ) | $(395,673,002 | ) | $(3,385,452 | ) | $(980,247 | ) |
Decrease in Net Assets from Distributions | (339,120,944 | ) | (554,117,005 | ) | (4,749,461 | ) | (1,375,581 | ) |
Capital Share Transactions: | | | | | | | | |
Shares sold | | | | | | | | |
Investor | 159,074,301 | | 170,211,280 | | 459,996 | | 1,381,185 | |
Institutional | 1,066,418,835 | | 916,374,351 | | 5,603,484 | | 9,090,037 | |
Reinvested dividends and distributions | | | | | | | | |
Investor | 88,775,530 | | 152,196,214 | | 1,350,356 | | 392,941 | |
Institutional | 236,383,164 | | 373,703,767 | | 3,383,180 | | 977,676 | |
Shares redeemed | | | | | | | | |
Investor | (466,692,419 | ) | (645,052,738 | ) | (1,634,192 | ) | (1,840,956 | ) |
Institutional | (1,428,861,419 | ) | (1,201,229,496 | ) | (7,353,429 | ) | (2,033,564 | ) |
Net Increase (Decrease) in Net Assets from | (344,902,008 | ) | (233,796,622 | ) | 1,809,395 |
| 7,967,319 |
|
Net Increase (Decrease) in Net Assets | (1,848,665,435 | ) | (1,574,444,525 | ) | (9,316,547 | ) | 4,102,749 | |
Net Assets: | | | | | | | | |
Beginning of year | 5,353,181,078 |
| 6,927,625,603 |
| 47,691,367 |
| 43,588,618 |
|
End of year | $3,504,515,643 |
| $5,353,181,078 |
| $38,374,820 |
| $47,691,367 |
|
Annual Report | March 31, 202337
The Brown Capital Management Mutual Funds
Statements of Changes in Net Assets
See Notes to Financial Statements
| Small Company Fund |
| Mid Company Fund | | ||||
| For the Year Ended |
| For the Year Ended |
| For the Year Ended |
| For the Year Ended | |
Share Information: | | | | | | | | |
Investor Class: | | | | | | | | |
Shares sold | 2,061,657 | | 1,450,439 | | 37,249 | | 73,463 | |
Reinvested distributions | 1,346,104 | | 1,355,869 | | 126,438 | | 20,551 | |
Shares redeemed | (6,221,288 | ) | (5,446,664 | ) | (134,851 | ) | (99,934 | ) |
Net Increase (Decrease) in Capital Shares | (2,813,527 | ) | (2,640,356 | ) | 28,836 | | (5,920 | ) |
Shares Outstanding, Beginning of Year | 14,499,070 |
| 17,139,426 |
| 796,995 |
| 802,915 |
|
Shares Outstanding, End of Year | 11,685,543 |
| 14,499,070 |
| 825,831 |
| 796,995 |
|
Share Information: | | | | | | | | |
Institutional Class: | | | | | | | | |
Shares sold | 13,735,130 | | 7,616,494 | | 475,452 | | 475,129 | |
Reinvested distributions | 3,461,967 | | 3,231,333 | | 295,733 | | 48,328 | |
Shares redeemed | (18,305,670 | ) | (10,201,921 | ) | (571,658 | ) | (100,413 | ) |
Net Increase (Decrease) in Capital Shares | (1,108,573 | ) | 645,906 | | 199,527 | | 423,044 | |
Shares Outstanding, Beginning of Year | 37,875,445 |
| 37,229,539 |
| 2,039,694 |
| 1,616,650 |
|
Shares Outstanding, End of Year | 36,766,872 |
| 37,875,445 |
| 2,239,221 |
| 2,039,694 |
|
38www.browncapital.com
The Brown Capital Management Mutual Funds
Statements of Changes in Net Assets
See Notes to Financial Statements
| International All Company Fund |
| International Small Company Fund | | ||||
| For the Year Ended |
| For the Year Ended |
| For the Year Ended |
| For the Year Ended | |
Increase (decrease) in Net Assets | | | | | | | | |
| | | | | | | | |
Operations: | | | | | | | | |
Net investment income (loss) | $(7,610 | ) | $(143,336 | ) | $502,146 | | $626,369 | |
Net realized gain (loss) on investments | (2,516,306 | ) | 913,198 | | (166,168,471 | ) | 58,519,321 | |
Net increase (decrease) in unrealized appreciation (depreciation) of investments | (4,117,498 | ) | (7,043,968 | ) | (103,635,431 | ) | (339,159,734 | ) |
Net Increase (Decrease) in Net Assets from operations | (6,641,414 | ) | (6,274,106 | ) | (269,301,756 | ) | (280,014,044 | ) |
Distributions to Shareholders: (Note 4) | | | | | | | | |
Investor | | | | | | | | |
Distributable earnings | $(25,480 | ) | $(21,851 | ) | $— | | $(11,495,488 | ) |
Institutional | | | | | | | | |
Distributable earnings | $(654,448 | ) | $(492,247 | ) | $(409,763 | ) | $(128,556,461 | ) |
Decrease in Net Assets from Distributions | (679,928 | ) | (514,098 | ) | (409,763 | ) | (140,051,949 | ) |
Capital Share Transactions: | | | | | | | | |
Shares sold | | | | | | | | |
Investor | 565,878 | | 1,257,430 | | 37,171,840 | | 105,224,962 | |
Institutional | 16,322,865 | | 13,198,714 | | 583,378,267 | | 1,196,230,799 | |
Reinvested dividends and distributions | | | | | | | | |
Investor | 25,081 | | 18,714 | | — | | 10,946,913 | |
Institutional | 503,178 | | 443,201 | | 363,523 | | 113,907,015 | |
Shares redeemed | | | | | | | | |
Investor | (425,764 | )(A) | (2,062,643 | )(A) | (49,578,439 | )(A) | (60,715,152 | )(A) |
Institutional | (14,636,284 | )(B) | (2,527,191 | )(B) | (752,498,618 | )(B) | (285,031,574 | )(B) |
Net Increase (Decrease) in Net Assets from | 2,354,954 |
| 10,328,225 |
| (181,163,427 | ) | 1,080,562,963 |
|
Net Increase (Decrease) in Net Assets | (4,966,388 | ) | 3,540,021 | | (450,874,946 | ) | 660,496,970 | |
Net Assets: | | | | | | | | |
Beginning of year | 68,716,935 |
| 65,176,914 |
| 2,755,491,273 |
| 2,094,994,303 |
|
End of year | $63,750,547 |
| $68,716,935 |
| $2,304,616,327 |
| $2,755,491,273 |
|
| | | | | | | | |
(A)Includes redemption fees of: | $54 | | $90 | | $35,923 | | $77,906 | |
(B)Includes redemption fees of: | $5,656 | | $920 | | $63,395 | | $104,795 | |
Annual Report | March 31, 202339
The Brown Capital Management Mutual Funds
Statements of Changes in Net Assets
See Notes to Financial Statements
| International All Company Fund | | International Small Company Fund | | ||||
| For the Year Ended |
| For the Year Ended |
| For the Year Ended |
| For the Year Ended | |
Share Information: | | | | | | | | |
Investor Class: | | | | | | | | |
Shares sold | 42,148 | | 66,579 | | 1,982,185 | | 3,963,378 | |
Reinvested distributions | 1,876 | | 998 | | — | | 412,313 | |
Shares redeemed | (32,542 | ) | (110,967 | ) | (2,633,016 | ) | (2,383,908 | ) |
Net Increase (Decrease) in Capital Shares | 11,482 | | (43,390 | ) | (650,831 | ) | 1,991,783 | |
Shares Outstanding, Beginning of Year | 162,985 |
| 206,375 |
| 8,846,819 |
| 6,855,036 |
|
Shares Outstanding, End of Year | 174,467 |
| 162,985 |
| 8,195,988 |
| 8,846,819 |
|
Share Information: | | | | | | | | |
Institutional Class: | | | | | | | | |
Shares sold | 1,196,172 | | 700,480 | | 30,427,991 | | 45,172,712 | |
Reinvested distributions | 37,272 | | 23,479 | | 19,336 | | 4,220,341 | |
Shares redeemed | (1,072,336 | ) | (138,697 | ) | (39,341,380 | ) | (11,022,881 | ) |
Net Increase (Decrease) in Capital Shares | 161,108 | | 585,262 | | (8,894,053 | ) | 38,370,172 | |
Shares Outstanding, Beginning of Year | 4,084,423 |
| 3,499,161 |
| 114,134,325 |
| 75,764,153 |
|
Shares Outstanding, End of Year | 4,245,531 |
| 4,084,423 |
| 105,240,272 |
| 114,134,325 |
|
40www.browncapital.com
See Notes to Financial Statements
The Brown Capital Management Small Company Fund
Financial HighlightsFor a share outstanding throughout the years presented.
| For the Years Ended March 31, | | ||||||||
Investor Class | 2023 |
| 2022 |
| 2021 |
| 2020 |
| 2019 | |
Net Asset Value, Beginning of Year | $99.97 | | $125.17 | | $83.73 | | $99.54 | | $95.37 | |
Income (Loss) from Investment Operations: | | | | | | | | | | |
Net investment income (loss)(a) | (0.88 | ) | (1.45 | ) | (1.22 | ) | (1.07 | ) | (0.99 | ) |
Net Realized and Unrealized Gain (Loss) on Investments | (20.90 | ) | (12.90 | ) | 52.60 | | (6.21 | ) | 10.86 | |
Total from Investment Operations | (21.78 | ) | (14.35 | ) | 51.38 | | (7.28 | ) | 9.87 | |
Less Distributions: | | | | | | | | | | |
Distributions (from capital gains) | (7.78 | ) | (10.85 | ) | (9.94 | ) | (8.53 | ) | (5.70 | ) |
Total distributions | (7.78 | ) | (10.85 | ) | (9.94 | ) | (8.53 | ) | (5.70 | ) |
Net Asset Value, End of Year | $70.41 | | $99.97 | | $125.17 | | $83.73 | | $99.54 | |
| | | | | | | | | | |
Total Return(b) | (21.26 | %) | (12.41 | %) | 61.30 | % | (8.55 | %) | 11.05 | % |
| | | | | | | | | | |
Ratios/Supplemental Data: | | | | | | | | | | |
Net Assets, End of Year (000’s) | $822,783 | | $1,449,535 | | $2,145,380 | | $1,722,739 | | $2,194,657 | |
Average Net Assets for the Year (000’s) | $1,003,882 | | $1,881,373 | | $2,185,619 | | $2,193,187 | | $2,241,764 | |
Ratio of Expenses to Average Net Assets(c) | 1.28 | % | 1.25 | % | 1.24 | % | 1.25 | % | 1.25 | % |
Ratio of Net Investment Income (Loss) to Average Net Assets | (1.13 | %) | (1.20 | %) | (1.01 | %) | (1.05 | %) | (97.00 | %) |
Portfolio Turnover Rate | 22 | % | 14 | % | 9 | % | 17 | % | 17 | % |
(a)Calculated using average shares method.
(b)Includes adjustments in accordance with accounting principles generally accepted in the United States of America and, consequently, the net asset values for financial reporting purposes and the returns based upon those net asset values may differ from the net asset values and returns for shareholder transactions.
(c)Includes 12b-1 Plan expenses, based upon the 12b-1 Plan adopted by the Fund on December 1, 2011.
Annual Report | March 31, 202341
See Notes to Financial Statements
The Brown Capital Management Small Company Fund
Financial HighlightsFor a share outstanding throughout the years presented.
| For the Years Ended March 31, | | ||||||||
Institutional Class | 2023 |
| 2022 |
| 2021 |
| 2020 |
| 2019 | |
Net Asset Value, Beginning of Year | $103.07 | | $128.45 | | $85.60 | | $101.39 | | $96.83 | |
Income (Loss) from Investment Operations: | | | | | | | | | | |
Net investment income (loss)(a) | (0.74 | ) | (1.24 | ) | (1.00 | ) | (0.88 | ) | (0.80 | ) |
Net Realized and Unrealized Gain (Loss) on Investments | (21.61 | ) | (13.29 | ) | 53.79 | | (6.38 | ) | 11.06 | |
Total from Investment Operations | (22.35 | ) | (14.53 | ) | 52.79 | | (7.26 | ) | 10.26 | |
Less Distributions: | | | | | | | | | | |
Distributions (from capital gains) | (7.78 | ) | (10.85 | ) | (9.94 | ) | (8.53 | ) | (5.70 | ) |
Total distributions | (7.78 | ) | (10.85 | ) | (9.94 | ) | (8.53 | ) | (5.70 | ) |
Net Asset Value, End of Year | $72.94 | | $103.07 | | $128.45 | | $85.60 | | $101.39 | |
| | | | | | | | | | |
Total Return(b) | (21.17 | %) | (12.23 | %) | 61.61 | % | (8.37 | %) | 11.29 | % |
| | | | | | | | | | |
Ratios/Supplemental Data: | | | | | | | | | | |
Net Assets, End of Year (000’s) | $2,681,732 | | $3,903,646 | | $4,782,245 | | $2,754,789 | | $2,878,945 | |
Average Net Assets for the Year (000’s) | $2,869,265 | | $4,649,124 | | $4,266,513 | | $3,096,903 | | $2,770,899 | |
Ratio of Expenses to Average Net Assets | 1.08 | % | 1.05 | % | 1.04 | % | 1.05 | % | 1.05 | % |
Ratio of Net Investment Income (Loss) to Average Net Assets | (0.93 | %) | (1.00 | %) | (0.81 | %) | (0.85 | %) | (0.77 | %) |
Portfolio Turnover Rate | 22 | % | 14 | % | 9 | % | 17 | % | 17 | % |
(a)Calculated using average shares method.
(b)Includes adjustments in accordance with accounting principles generally accepted in the United States of America and, consequently, the net asset values for financial reporting purposes and the returns based upon those net asset values may differ from the net asset values and returns for shareholder transactions.
42www.browncapital.com
See Notes to Financial Statements
The Brown Capital Management Mid Company Fund
Financial HighlightsFor a share outstanding throughout the years presented.
| For the Years Ended March 31, | | ||||||||
Investor Class | 2023 |
| 2022 |
| 2021 |
| 2020 |
| 2019 | |
Net Asset Value, Beginning of Year | $16.13 | | $17.38 | | $10.52 | | $11.40 | | $11.17 | |
Income (Loss) from Investment Operations: | | | | | | | | | | |
Net investment income (loss)(a) | (0.10 | ) | (0.17 | ) | (0.12 | ) | (0.09 | ) | (0.07 | ) |
Net Realized and Unrealized Gain (Loss) on Investments | (2.28 | ) | (0.58 | ) | 7.43 | | (0.18 | ) | 1.44 | |
Total from Investment Operations | (2.38 | ) | (0.75 | ) | 7.31 | | (0.27 | ) | 1.37 | |
Less Distributions: | | | | | | | | | | |
Distributions (from capital gains) | (1.18 | ) | (0.50 | ) | (0.45 | ) | (0.61 | ) | (1.14 | ) |
Return of capital | (0.68 | ) | — | | — | | — | | — | |
Total distributions | (1.86 | ) | (0.50 | ) | (0.45 | ) | (0.61 | ) | (1.14 | ) |
Net Asset Value, End of Year | $11.89 | | $16.13 | | $17.38 | | $10.52 | | $11.40 | |
| | | | | | | | | | |
Total Return(b) | (13.45 | %) | (4.76 | %) | 69.70 | % | (3.22 | %) | 13.93 | % |
| | | | | | | | | | |
Ratios/Supplemental Data: | | | | | | | | | | |
Net Assets, End of Year (000’s) | $9,822 | | $12,854 | | $13,953 | | $7,527 | | $8,381 | |
Average Net Assets for the Year (000’s) | $9,828 | | $14,770 | | $11,814 | | $9,370 | | $8,338 | |
Ratio of Expenses to Average Net Assets | | | | | | | | | | |
Excluding Fee Waivers and Reimbursements(c) | 2.06 | % | 1.55 | % | 1.64 | % | 1.84 | % | 2.05 | % |
Ratio of Expenses to Average Net Assets | | | | | | | | | | |
Including Fee Waivers and Reimbursements(c) | 1.15 | % | 1.15 | % | 1.15 | % | 1.15 | % | 1.15 | % |
Ratio of Net Investment Income (Loss) to Average Net Assets | (0.83 | %) | (0.90 | %) | (0.75 | %) | (0.71 | %) | (0.64 | %) |
Portfolio Turnover Rate | 18 | % | 11 | % | 10 | % | 12 | % | 25 | % |
(a)Calculated using average shares method.
(b)Includes adjustments in accordance with accounting principles generally accepted in the United States of America and, consequently, the net asset values for financial reporting purposes and the returns based upon those net asset values may differ from the net asset values and returns for shareholder transactions.
(c)Includes 12b-1 Plan expenses, based upon the 12b-1 Plan adopted by the Fund on December 1, 2011.
Annual Report | March 31, 202343
See Notes to Financial Statements
The Brown Capital Management Mid Company Fund
Financial HighlightsFor a share outstanding throughout the years presented.
| For the Years Ended March 31, | | ||||||||
Institutional Class | 2023 |
| 2022 |
| 2021 |
| 2020 |
| 2019 | |
Net Asset Value, Beginning of Year | $17.08 | | $18.33 | | $11.06 | | $11.93 | | $11.60 | |
Income (Loss) from Investment Operations: | | | | | | | | | | |
Net investment income (loss)(a) | (0.08 | ) | (0.13 | ) | (0.08 | ) | (0.06 | ) | (0.05 | ) |
Net Realized and Unrealized Gain (Loss) on Investments | (2.39 | ) | (0.62 | ) | 7.80 | | (0.20 | ) | 1.52 | |
Total from Investment Operations | (2.47 | ) | (0.75 | ) | 7.72 | | (0.26 | ) | 1.47 | |
Less Distributions: | | | | | | | | | | |
Distributions (from capital gains) | (1.18 | ) | (0.50 | ) | (0.45 | ) | (0.61 | ) | (1.14 | ) |
Return of capital | (0.68 | ) | — | | — | | — | | — | |
Total distributions | (1.86 | ) | (0.50 | ) | (0.45 | ) | (0.61 | ) | (1.14 | ) |
Net Asset Value, End of Year | $12.75 | | $17.08 | | $18.33 | | $11.06 | | $11.93 | |
| | | | | | | | | | |
Total Return(b) | (13.22 | %) | (4.52 | %) | 70.00 | % | (2.99 | %) | 14.29 | % |
| | | | | | | | | | |
Ratios/Supplemental Data: | | | | | | | | | | |
Net Assets, End of Year (000’s) | $28,553 | | $34,827 | | $29,635 | | $16,590 | | $15,260 | |
Average Net Assets for the Year (000’s) | $27,890 | | $37,933 | | $27,706 | | $17,753 | | $13,043 | |
Ratio of Expenses to Average Net Assets | | | | | | | | | | |
Excluding Fee Waivers and Reimbursements | 1.81 | % | 1.30 | % | 1.39 | % | 1.59 | % | 1.81 | % |
Ratio of Expenses to Average Net Assets | | | | | | | | | | |
Including Fee Waivers and Reimbursements | 0.90 | % | 0.90 | % | 0.90 | % | 0.90 | % | 0.90 | % |
Ratio of Net Investment Income (Loss) to Average Net Assets | (0.58 | %) | (0.66 | %) | (0.51 | %) | (0.46 | %) | (0.39 | %) |
Portfolio Turnover Rate | 18 | % | 11 | % | 10 | % | 12 | % | 25 | % |
(a)Calculated using average shares method.
(b)Includes adjustments in accordance with accounting principles generally accepted in the United States of America and, consequently, the net asset values for financial reporting purposes and the returns based upon those net asset values may differ from the net asset values and returns for shareholder transactions.
44www.browncapital.com
See Notes to Financial Statements
The Brown Capital Management International All Company Fund
Financial HighlightsFor a share outstanding throughout the years presented.
| For the Years Ended March 31, | | ||||||||
Investor Class | 2023 |
| 2022 |
| 2021 |
| 2020 |
| 2019 | |
Net Asset Value, Beginning of Year | $16.06 | | $17.51 | | $12.83 | | $13.71 | | $13.96 | |
Income (Loss) from Investment Operations: | | | | | | | | | | |
Net investment income (loss)(a) | (0.03 | ) | (0.06 | ) | (0.07 | ) | 0.06 | | 0.10 | |
Net Realized and Unrealized Gain (Loss) on Investments | (1.60 | ) | (1.26 | ) | 5.29 | | (0.85 | ) | (0.26 | ) |
Total from Investment Operations | (1.63 | ) | (1.32 | ) | 5.22 | | (0.79 | ) | (0.16 | ) |
Less Distributions: | | | | | | | | | | |
Distributions (from net investment income) | — | | (0.01 | ) | — | | (0.09 | ) | (0.10 | ) |
Distributions (from capital gains) | (0.15 | ) | (0.12 | ) | (0.54 | ) | — | | — | |
Total distributions | (0.15 | ) | (0.13 | ) | (0.54 | ) | (0.09 | ) | (0.10 | ) |
Redemption Fees Added to Paid-in Capital (Note 1)(a) | — | (b) | — | (b) | — | (b) | — | (b) | 0.01 |
|
Net Asset Value, End of Year | $14.28 |
| $16.06 |
| $17.51 |
| $12.83 |
| $13.71 |
|
| | | | | | | | | | |
Total Return(c) | (10.06 | %) | (7.68 | %) | 40.73 | % | (5.85 | %) | (0.99 | %) |
| | | | | | | | | | |
Ratios/Supplemental Data: | | | | | | | | | | |
Net Assets, End of Year (000’s) | $2,492 | | $2,618 | | $3,613 | | $2,346 | | $2,991 | |
Average Net Assets for the Year (000’s) | $2,275 | | $3,356 | | $3,151 | | $3,162 | | $2,930 | |
Ratio of Expenses to Average Net Assets | | | | | | | | | | |
Excluding Fee Waivers and Reimbursements(d) | 1.90 | % | 1.58 | % | 1.79 | % | 1.91 | % | 1.83 | % |
Ratio of Expenses to Average Net Assets | | | | | | | | | | |
Including Fee Waivers and Reimbursements(d) | 1.25 | % | 1.25 | % | 1.25 | % | 1.25 | % | 1.25 | % |
Ratio of Net Investment Income (Loss) to Average Net Assets | (0.25 | %) | (0.34 | %) | (0.42 | %) | 0.42 | % | 0.72 | % |
Portfolio Turnover Rate | 20 | % | 8 | % | 11 | % | 25 | % | 28 | % |
(a)Calculated using average shares method.
(b)Less than 0.005 per share.
(c)Includes adjustments in accordance with accounting principles generally accepted in the United States of America and, consequently, the net asset values for financial reporting purposes and the returns based upon those net asset values may differ from the net asset values and returns for shareholder transactions.
(d)Includes 12b-1 Plan expenses, based upon the 12b-1 Plan adopted by the Fund on December 1, 2011.
Annual Report | March 31, 202345
See Notes to Financial Statements
The Brown Capital Management International All Company Fund
Financial HighlightsFor a share outstanding throughout the years presented.
| For the Years Ended March 31, | | ||||||||
Institutional Class | 2023 |
| 2022 |
| 2021 |
| 2020 |
| 2019 | |
Net Asset Value, Beginning of Year | $16.18 | | $17.59 | | $12.86 | | $13.74 | | $13.98 | |
Income (Loss) from Investment Operations: | | | | | | | | | | |
Net investment income (loss)(a) | — | (b) | (0.03 | ) | (0.03 | ) | 0.10 | | 0.13 | |
Net Realized and Unrealized Gain (Loss) on Investments | (1.60 | ) | (1.25 | ) | 5.30 | | (0.86 | ) | (0.26 | ) |
Total from Investment Operations | (1.60 | ) | (1.28 | ) | 5.27 | | (0.76 | ) | (0.13 | ) |
Less Distributions: | | | | | | | | | | |
Distributions (from net investment income) | — | | (0.01 | ) | — | | (0.12 | ) | (0.12 | ) |
Distributions (from capital gains) | (0.15 | ) | (0.12 | ) | (0.54 | ) | — | | — | |
Total distributions | (0.15 | ) | (0.13 | ) | (0.54 | ) | (0.12 | ) | (0.12 | ) |
Redemption Fees Added to Paid-in Capital (Note 1)(a) | — | (b) | — | (b) | — | (b) | — | (b) | 0.01 | |
Net Asset Value, End of Year | $14.43 |
| $16.18 |
| $17.59 |
| $12.86 |
| $13.74 | |
| | | | | | | | | | |
Total Return(c) | (9.80 | %) | (7.42 | %) | 41.03 | % | (5.63 | %) | (0.71 | %) |
| | | | | | | | | | |
Ratios/Supplemental Data: | | | | | | | | | | |
Net Assets, End of Year (000’s) | $61,259 | | $66,099 | | $61,564 | | $25,969 | | $32,979 | |
Average Net Assets for the Year (000’s) | $55,405 | | $71,346 | | $40,540 | | $31,739 | | $35,068 | |
Ratio of Expenses to Average Net Assets | | | | | | | | | | |
Excluding Fee Waivers and Reimbursements | 1.64 | % | 1.34 | % | 1.54 | % | 1.66 | % | 1.58 | % |
Ratio of Expenses to Average Net Assets | | | | | | | | | | |
Including Fee Waivers and Reimbursements | 1.00 | % | 1.00 | % | 1.00 | % | 1.00 | % | 1.00 | % |
Ratio of Net Investment Income (Loss) to Average Net Assets | 0.00 | %(d) | (0.14 | %) | (0.16 | %) | 0.71 | % | 0.97 | % |
Portfolio Turnover Rate | 20 | % | 8 | % | 11 | % | 25 | % | 28 | % |
(a)Calculated using average shares method.
(b)Less than 0.005 per share.
(c)Includes adjustments in accordance with accounting principles generally accepted in the United States of America and, consequently, the net asset values for financial reporting purposes and the returns based upon those net asset values may differ from the net asset values and returns for shareholder transactions.
(d)Less than 0.005 percent.
46www.browncapital.com
See Notes to Financial Statements
The Brown Capital Management International Small Company Fund
Financial HighlightsFor a share outstanding throughout the years presented.
| For the Years Ended March 31, | | ||||||||
Investor Class | 2023 |
| 2022 |
| 2021 |
| 2020 |
| 2019 | |
Net Asset Value, Beginning of Year | $22.05 | | $25.03 | | $14.75 | | $16.76 | | $16.27 | |
Income (Loss) from Investment Operations: | | | | | | | | | | |
Net investment income (loss)(a) | (0.04 | ) | (0.06 | ) | (0.15 | ) | (0.03 | ) | (0.05 | ) |
Net Realized and Unrealized Gain (Loss) on Investments | (2.06 | ) | (1.54 | ) | 10.62 | | (1.93 | ) | 0.58 | |
Total from Investment Operations | (2.10 | ) | (1.60 | ) | 10.47 | | (1.96 | ) | 0.53 | |
Less Distributions: | | | | | | | | | | |
Distributions (from capital gains) | — | | (1.39 | ) | (0.19 | ) | (0.05 | ) | (0.04 | ) |
Total distributions | — |
| (1.39 | ) | (0.19 | ) | (0.05 | ) | (0.04 | ) |
Redemption Fees Added to Paid-in Capital (Note 1)(a) | — | (b) | 0.01 |
| — | (b) | — | (b) | — | (b) |
Net Asset Value, End of Year | $19.95 |
| $22.05 |
| $25.03 |
| $14.75 |
| $16.76 | |
| | | | | | | | | | |
Total Return(c) | (9.52 | %) | (7.30 | %) | 71.05 | % | (11.72 | %) | 3.32 | % |
| | | | | | | | | | |
Ratios/Supplemental Data: | | | | | | | | | | |
Net Assets, End of Year (000’s) | $163,538 | | $195,057 | | $171,603 | | $50,516 | | $40,248 | |
Average Net Assets for the Year (000’s) | $163,970 | | $214,710 | | $110,704 | | $51,728 | | $23,846 | |
Ratio of Expenses to Average Net Assets | | | | | | | | | | |
Excluding Fee Waivers and Reimbursements(d) | 1.31 | % | 1.30 | % | 1.32 | % | 1.39 | % | 1.75 | % |
Ratio of Expenses to Average Net Assets | | | | | | | | | | |
Including Fee Waivers and Reimbursements(d) | 1.31 | % | 1.30 | % | 1.32 | % | 1.39 | % | 1.46 | % |
Ratio of Net Investment Income (Loss) to Average Net Assets | (0.20 | %) | (0.22 | %) | (0.68 | %) | (0.15 | %) | (0.34 | %) |
Portfolio Turnover Rate | 19 | % | 8 | % | 18 | % | 4 | % | 7 | % |
(a)Calculated using average shares method.
(b)Less than 0.005 per share.
(c)Includes adjustments in accordance with accounting principles generally accepted in the United States of America and, consequently, the net asset values for financial reporting purposes and the returns based upon those net asset values may differ from the net asset values and returns for shareholder transactions.
(d)Includes 12b-1 Plan expenses, based upon the 12b-1 Plan adopted by the Fund on September 30, 2015.
Annual Report | March 31, 202347
See Notes to Financial Statements
The Brown Capital Management International Small Company Fund
Financial HighlightsFor a share outstanding throughout the years presented.
| For the Years Ended March 31, | | ||||||||
Institutional Class | 2023 |
| 2022 |
| 2021 |
| 2020 |
| 2019 | |
Net Asset Value, Beginning of Year | $22.43 | | $25.39 | | $14.92 | | $16.91 | | $16.38 | |
Income (Loss) from Investment Operations: | | | | | | | | | | |
Net investment income (loss)(a) | 0.01 | | 0.01 | | (0.10 | ) | — | (b) | (0.01 | ) |
Net Realized and Unrealized Gain (Loss) on Investments | (2.10 | ) | (1.58 | ) | 10.76 | | (1.94 | ) | 0.58 | |
Total from Investment Operations | (2.09 | ) | (1.57 | ) | 10.66 | | (1.94 | ) | 0.57 | |
Less Distributions: | | | | | | | | | | |
Distributions (from net investment income) | — | (b) | — | | — | | — | (b) | — | |
Distributions (from capital gains) | — | | (1.39 | ) | (0.19 | ) | (0.05 | ) | (0.04 | ) |
Total distributions | — |
| (1.39 | ) | (0.19 | ) | (0.05 | ) | (0.04 | ) |
Redemption Fees Added to Paid-in Capital (Note 1)(a) | — | (b) | — | (b) | — | (b) | — | (b) | — | (b) |
Net asset Value, End of Year | $20.34 |
| $22.43 |
| $25.39 |
| $14.92 |
| $16.91 | |
| | | | | | | | | | |
Total Return(c) | (9.30 | %) | (7.11 | %) | 71.51 | % | (11.48 | %) | 3.54 | % |
| | | | | | | | | | |
Ratios/Supplemental Data: | | | | | | | | | | |
Net Assets, End of Year (000’s) | $2,141,079 | | $2,560,435 | | $1,923,391 | | $693,460 | | $322,439 | |
Average Net Assets for the Year (000’s) | $2,130,241 | | $2,452,659 | | $1,344,547 | | $598,865 | | $107,782 | |
Ratio of Expenses to Average Net Assets | | | | | | | | | | |
Excluding Fee Waivers and Reimbursements | 1.06 | % | 1.05 | % | 1.07 | % | 1.14 | % | 1.41 | % |
Ratio of Expenses to Average Net Assets | | | | | | | | | | |
Including Fee Waivers and Reimbursements | 1.06 | % | 1.05 | % | 1.07 | % | 1.14 | % | 1.19 | % |
Ratio of Net Investment Income (Loss) to Average Net Assets | 0.04 | % | 0.04 | % | (0.42 | %) | 0.02 | % | (0.04 | %) |
Portfolio Turnover Rate | 19 | % | 8 | % | 18 | % | 4 | % | 7 | % |
(a)Calculated using average shares method.
(b)Less than 0.005 per share.
(c)Includes adjustments in accordance with accounting principles generally accepted in the United States of America and, consequently, the net asset values for financial reporting purposes and the returns based upon those net asset values may differ from the net asset values and returns for shareholder transactions.
48www.browncapital.com
1. ORGANIZATION AND SIGNIFICANT ACCOUNTING POLICIES
The Brown Capital Management Small Company Fund (“Small Company Fund”), The Brown Capital Management Mid Company Fund (“Mid Company Fund”), The Brown Capital Management International All Company Fund (“International All Company Fund”) and The Brown Capital Management International Small Company Fund (“International Small Company Fund”) (each a “Fund” and collectively the “Funds”) are each a series portfolio of Brown Capital Management Mutual Funds (the “Trust”). The Trust is a Delaware statutory trust and is registered under the Investment Company Act of 1940, as amended (the “1940 Act”), as an open‐ended management investment company. Each of the Funds in this report are classified as a diversified, open‐end management investment company, as those terms are defined in the 1940 Act. The Funds currently offer Investor Class and Institutional Class Shares.
The primary investment objective of the Small Company Fund is to seek long‐term capital appreciation. Current income is a secondary consideration in selecting portfolio investments. The Small Company Fund seeks to achieve its investment objective by investing at least 80% of its net assets (plus any borrowings for investment purposes) in equity securities of those companies with operating revenues of $500 million or less at the time of initial investment.
The primary investment objective of the Mid Company Fund is to seek long‐term capital appreciation. Current income is a secondary consideration in selecting portfolio investments. The Mid Company Fund seeks to achieve its investment objective by investing at least 80% of its net assets (plus any borrowings for investment purposes) in equity securities of companies that have total operating revenues of $500 million to $2.5 billion at the time of initial investment.
The primary investment objective of the International All Company Fund is to seek long‐term capital appreciation. Current income is a secondary consideration in selecting portfolio investments. The International All Company Fund seeks to achieve its investment objective by investing substantially of its assets in equity securities of non‐U.S. based companies.
The primary investment objective of the International Small Company Fund is to seek long‐term capital appreciation. Current income is a secondary consideration in selecting portfolio investments. The International Small Company Fund seeks to achieve its investment objective by investing at least 80% of its net assets (plus any borrowings for investment purposes) in equity securities of non‐U.S. based companies with total operating revenues of $500 million or less at the time of the initial investment. The Fund commenced operations on September 30, 2015 and offers Investor and Institutional shares classes.
Income, expenses (other than distribution and service fees, which were only attributable to the Investor Shares), and realized and unrealized gains or losses on investments and foreign currencies were allocated to each class of shares based upon its relative net assets.
The following accounting policies have been consistently followed by the Funds and are in conformity with United States generally accepted accounting principles (“GAAP”). Each Fund is an investment company and accordingly follows the investment company accounting and reporting guidance of the Financial Accounting Standards Board Accounting Standards Codification Topic 946 Financial Services – Investment Companies.
Investment Valuation
The Funds’ investments in securities are carried at value. Securities listed on an exchange or quoted on a national market system are valued at the last sales price as of 4:00 p.m. Eastern Time, Monday through Friday. Securities that are principally traded on the National Association of Securities Dealers Automated Quotation (“NASDAQ”) exchange are generally valued at the NASDAQ Official Closing Price (“NOCP”). Other securities that are traded in the domestic over‐the‐counter market and listed securities for which last sales price is available, are generally valued at the last sales price as of the valuation time. In the absence of sales and NOCP, such securities are valued at the most recent bid price. Securities and assets for which representative market quotations are not readily available or which cannot be accurately valued using the Funds’ normal pricing procedures are valued at fair value as determined in good faith under policies approved by the Trust’s Board of Trustees. The Board has appointed the Advisor as valuation designee to be responsible for all fair value determinations for the Funds. Fair value pricing may be used, for example, in situations where (i) a security, such as a small‐cap stock, mid‐cap stock, or foreign security, is so thinly traded that there have been no transactions for that stock over an extended period of time or the validity of a market quotation received is questionable; (ii) an event occurs after the close of the exchange on which a portfolio security is principally traded that is likely to have changed the value of the security prior to a Fund’s net asset value calculation; (iii) the exchange on which the security is principally traded closes early; or (iv) trading of the particular portfolio security is halted during the day and does not resume prior to a Fund’s net asset value calculation. A security’s “fair value” price may differ from the price next available for that security using the Funds’ normal pricing procedures. Instruments with maturities of 60 days or less are valued at amortized cost, which approximates market value.
Fair Value Measurement
In accordance with GAAP, the Funds use a three‐tier hierarchy to establish classification of fair value measurements for disclosure purposes. Inputs refer broadly to the assumptions that market participants would use in pricing the asset or liability, including assumptions about risk. Inputs may be observable or unobservable. Observable inputs are inputs that reflect the assumptions market participants would use in pricing the asset or liability that are developed based on market data obtained from sources independent of the reporting entity. Unobservable inputs are inputs that reflect the reporting entity’s own assumptions about the assumptions market participants would use in pricing the asset or liability that are developed based on the best information available.
Annual Report | March 31, 202349
The Brown Capital Management Mutual Funds
Notes to Financial StatementsMarch 31, 2023
Various inputs are used in determining the value of the Funds’ investments. These inputs are summarized in the three broad levels listed below:
Level 1 –
Unadjusted quoted prices in active markets for identical, unrestricted assets or liabilities that a Fund has the ability to access at the measurement date;
Level 2 –
Quoted prices which are not active, quoted prices for similar assets or liabilities in active markets or inputs other than quoted prices that are observable (either directly or indirectly) for substantially the full term of the asset or liability; and
Level 3 –
Significant unobservable prices or inputs (including the Fund’s own assumptions in determining the fair value of investments) where there is little or no market activity for the asset or liability at the measurement date.
The availability of observable inputs can vary from security to security and is affected by a wide variety of factors, including, for example, the type of security, whether the security is new and not yet established in the marketplace, the liquidity of markets, and other characteristics particular to the security. To the extent that valuation is based on models or inputs that are less observable or unobservable in the market, the determination of fair value requires more judgment. Accordingly, the degree of judgment exercised in determining fair value is greatest for instruments categorized in Level 3.
An investment’s level within the fair value hierarchy is based on the lowest level input, individually or in the aggregate, that is significant to fair value measurement. The valuation techniques used by the Funds to measure fair value during the year ended March 31, 2023 maximized the use of observable inputs and minimized the use of unobservable inputs.
The inputs or methodology used for valuing securities are not necessarily an indication of the risk or liquidity associated with investing in those securities. The following is a summary of the inputs used in valuing the Funds’ assets as of March 31, 2023:
Small Company Fund: | | | | | ||||
| Valuation Inputs | | | | ||||
Investments in Securities at Value* | Level 1 |
| Level 2 |
| Level 3 |
| Total |
|
Common Stocks | $3,390,986,498 | | $— | | $— | | $3,390,986,498 | |
Short Term Investments | 126,078,360 | | — | | — | | 126,078,360 | |
Total | $3,517,064,858 | | $— | | $— | | $3,517,064,858 | |
Mid Company Fund: | | | | | ||||
| Valuation Inputs | | | | ||||
Investments in Securities at Value* | Level 1 |
| Level 2 |
| Level 3 |
| Total |
|
Common Stocks | $38,324,772 | | $— | | $— | | $38,324,772 | |
Short Term Investments | 120,374 | | — | | — | | 120,374 | |
Total | $38,445,146 | | $— | | $— | | $38,445,146 | |
International All Company Fund: | | | | | ||||
| Valuation Inputs | | | | ||||
Investments in Securities at Value* | Level 1 |
| Level 2 |
| Level 3 |
| Total |
|
Common Stocks | $61,370,557 | | $— | | $— | | $61,370,557 | |
Short Term Investments | 2,246,034 | | — | | — | | 2,246,034 | |
Total | $63,616,591 | | $— | | $— | | $63,616,591 | |
International Small Company Fund: | | | | | ||||
| Valuation Inputs | | | | ||||
Investments in Securities at Value* | Level 1 |
| Level 2 |
| Level 3 |
| Total |
|
Common Stocks | $2,257,129,763 | | $— | | $— | | $2,257,129,763 | |
Short Term Investments | 59,127,751 | | — | | — | | 59,127,751 | |
Total | $2,316,257,514 | | $— | | $— | | $2,316,257,514 | |
*See Schedule of Investments for sector/country classifications.
For the year ended March 31, 2023, the Funds did not have investments with significant unobservable inputs (Level 3) used in determining fair value.
50www.browncapital.com
The Brown Capital Management Mutual Funds
Notes to Financial StatementsMarch 31, 2023
Foreign Currency Translation (International All Company Fund and International Small Company Fund)
Portfolio securities and other assets and liabilities denominated in foreign currencies are translated into U.S. dollars based on the exchange rate of such currencies against U.S. dollars on the date of valuation. Purchases and sales of securities and income items denominated in foreign currencies are translated into U.S. dollars at the exchange rate in effect on the transaction date.
The Funds do not separately report the effect of changes in foreign exchange rates from changes in market prices on securities held. Such changes are included in net realized gain/(loss) or unrealized appreciation/(depreciation) from investments.
Realized foreign exchange gains or losses arise from sales of foreign currencies, currency gains or losses realized between the trade and settlement dates on securities transactions and the difference between the recorded amounts of dividends, interest, and foreign taxes withheld, and the U.S. dollar equivalent of the amounts actually received or paid. Net unrealized foreign exchange gains and losses arise from changes in foreign exchange rates on foreign denominated assets and liabilities other than investments in securities held at the end of the reporting period.
Foreign Currency Spot Contracts (International All Company Fund and International Small Company Fund)
Derivative instruments include foreign currency spot trades. The Funds may enter into such derivative instruments primarily to hedge against foreign currency exchange rate risks on its non-U.S. dollar denominated investment securities. When entering into a foreign currency spot contract the Fund agrees to receive or deliver a fixed quantity of foreign currency for an agreed-upon price typically within two business days. These contracts are valued daily, and the Fund’s net equity therein, representing unrealized gain or loss on the contracts as measured by the difference between the foreign exchange rates at the dates of entry into the contracts and the exchange rates at the reporting date, is included in the Statements of Assets and Liabilities. Realized and unrealized gains and losses are included in the Statements of Operations. These instruments often involve market risk, credit risk, or both risks, in excess of the amount recognized in the Statement of Assets and Liabilities. Risks may also arise from the possible inability of counterparties to meet the terms of their contracts and from unanticipated movements in currency and securities values and interest rates.
Affiliated Companies
If a Fund owns 5% or more of the outstanding voting securities, either directly or indirectly, of a particular issuer, the 1940 Act deems such an issuer to be an “affiliate” of the Fund. As of and during the year ended March 31, 2023, the Small Company Fund and International Small Company Fund owned 5% or more of the outstanding voting securities of the issuers identified in the tables below and therefore those issuers are considered affiliates of that Fund for purposes of the 1940 Act.
Small Company Fund
Security Name |
| Market Value |
| Purchases |
| Corporate |
| Sales |
| Market Value |
| Share Balance |
| Dividends |
| Change in |
| Realized |
|
Alarm.com Holdings, Inc. | | $199,066,242 | | $— | | $— | | $(848,711 | ) | $149,999,218 | | 2,983,278 | | $— | | $(47,928,904 | ) | $(289,409 | ) |
AppFolio Inc. | | 208,306,060 | | — | | — | | (31,586,081 | ) | 193,229,930 | | 1,552,297 | | — | | 27,836,925 | | (11,326,974 | ) |
Cryoport, Inc. | | 60,280,424 | | 71,551,565 | | — | | (330,200 | ) | 107,010,336 | | 4,458,764 | | — | | (24,017,507 | ) | (473,946 | ) |
Enfusion, Inc. | | — | | 57,019,048 | | — | | (103,556 | ) | 51,496,494 | | 4,904,428 | | — | | (5,423,166 | ) | 4,169 | |
Helios Technologies, Inc. | | 117,482,309 | | 16,662,904 | | — | | (351,498 | ) | 114,053,218 | | 1,743,933 | | 570,254 | | (19,661,958 | ) | (78,538 | ) |
Olo Inc. | | 61,322,961 | | 46,759,934 | | — | | (8,117,907 | ) | 72,474,843 | | 8,881,721 | | — | | (6,850,470 | ) | (20,639,674 | ) |
OrthoPediatrics Corp. | | 97,309,956 | | 2,588,146 | | — | | (361,100 | ) | 82,129,117 | | 1,854,349 | | — | | (17,334,571 | ) | (73,314 | ) |
PROS Holdings, Inc. | | 94,024,104 | | — | | — | | (2,675,450 | ) | 74,215,092 | | 2,708,580 | | — | | (14.829.886 | ) | (2,303,676 | ) |
Vericel Corp. | | 125,950,647 | | 15,409,603 | | — | | (393,042 | ) | 113,450,251 |
| 3,869,381 |
| — |
| (27,091,246 | ) | (425,711 | ) |
Xometry, Inc. | | — | | 113,366,526 | | — | | (276,122 | ) | 47,537,370 |
| 3,175,509 |
| — |
| (65,613,083 | ) | 60,048 |
|
| | | | | | | | | | $1,005,595,869 |
| 36,132,240 |
| $570,254 |
| $(200,913,866 | ) | $(35,547,025 | ) |
Investments no longer affiliated as of March 31, 2023 | | | | | | | | | | | | | | ||||||
Cardiovascular Systems, Inc. | | $70,921,331 | | $— | | $— | | $(32,913,653 | ) | $17,289,620 | | 870,575 | | $— | | $36,902,344 | | $(57,620,402 | ) |
Inogen, Inc. | | 70,121,737 | | 11,967,026 | | — | | (48,145,191 | ) | 9,608,352 | | 769,900 | | — | | 82,292,757 | | (106,627,977 | ) |
Ironwood Pharmaceuticals, Inc. | | 100,565,011 | | — | | — | | (72,931,621 | ) | 18,644,722 | | 1,772,312 | | — | | (12,576,380 | ) | 3,587,712 | |
Neogen Corp. | | 177,514,670 | | — | | — | | (58,613,350 | ) | 51,439,356 | | 2,777,503 | | — | | (98,651,622 | ) | 31,189,658 | |
Q2 Holdings., Inc. | | 177,367,173 | | 6,027,986 | | — | | (47,492,968 | ) | 40,948,329 |
| 1,663,214 |
| — |
| (32,474,824 | ) | (62,479,038 | ) |
| | | | | | | | | | $137,930,379 |
| 7,853,504 |
| $— |
| (24,507,725 | ) | $(191,950,047 | ) |
| | | | | | | | | | | | | | | | | | | |
GRAND TOTAL | | | | | | | | | | $1,143,526,248 | | 43,985,744 | | $570,254 | | $(225,421,591 | ) | $(227,497,072 | ) |
Annual Report | March 31, 202351
The Brown Capital Management Mutual Funds
Notes to Financial StatementsMarch 31, 2023
International Small Company Fund
Security Name |
| Market Value |
| Purchases |
| Corporate |
| Sales |
| Market Value |
| Share Balance |
| Dividends |
| Change in |
| Realized |
|
HIDAY HIDAKA Corp. | | $37,421,386 | | $ 7,194,359 | | $— | | $(4,789,116 | ) | $43,722,929 | | 2,703,918 | | $385,659 | | $5,292,748 | | $(1,396,448 | ) |
Lectra | | 121,335,595 | | 16,834,996 | | — | | (13,028,944 | ) | 105,620,545 | | 2,679,246 | | 731,503 | | (17,061,596 | ) | (2,459,506 | ) |
Nexus AG | | 94,087,111 | | — | | — | | (10,430,608 | ) | 82,349,528 | | 1,385,636 | | 245,077 | | 2,202,875 | | (3,509,850 | ) |
Software Service, Inc. | | 28,120,739 | | — | | — | | (4,036,009 | ) | 32,467,563 | | 483,825 | | 345,554 | | 11,035,354 | | (2,652,521 | ) |
Stratec Biomedical AG | | 98,894,214 | | 15,321,300 | | — | | (10,677,564 | ) | 63,553,175 | | 936,120 | | 665,885 | | (32,304,283 | ) | (7,680,492 | ) |
| | | | | | | | | | $327,713,740 | | 8,188,745 | | $2,373,678 | | $(30,834,902 | ) | $(17,698,817 | ) |
Investments no longer affiliated as of March 31, 2023 | | | | | | | | | | | | | | | | ||||
Albioma SA | | $116,125,333 | | $— | | $— | | $(122,219,409 | ) | $— | | — | | $1,751,189 | | $(31,817,597 | ) | $37,911,673 | |
NNIT SA | | 27,563,657 | | 226,083 | | — | | (16,254,968 | ) | — | | — | | — | | 10,010,945 | | (21,545,717 | ) |
| | | | | | | | | | $— | | — | | $1,751,189 | | $(21,806,652 | ) | $16,365,956 | |
| | | | | | | | | | | | | | | | | | | |
GRAND TOTAL | | | | | | | | | | $327,713,740 | | 8,188,745 | | $4,124,867 | | $(52,641,554 | ) | $(1,332,861 | ) |
Investment Transactions and Investment Income
Investment transactions are accounted for as of the date purchased or sold (trade date). Dividend income is recorded on the ex‐dividend date. Certain dividends from foreign securities will be recorded as soon as the Trust is informed of the dividend if such information is obtained subsequent to the ex‐dividend date. Withholding taxes on foreign dividends have been provided for in accordance with the Funds’ understanding of the applicable country’s tax rules. Interest income is recorded on the accrual basis and includes amortization of discounts and premiums. Gains and losses are determined on the high cost basis, which is the same basis used for federal income tax purposes. The Funds accrue any taxes withheld from foreign investments by foreign countries. Amounts that may be reclaimed are recorded as receivables and amounts that may not be reclaimed are recorded at the same time as the related income on each income recognition date if the tax rate is fixed and known. When investment income is received net of the tax withheld, a separate realized foreign currency gain or loss is computed on the gross income receivable and the accrued tax expense. If the tax rate is not known or estimable, such expense or receivable is recorded on the date that the net amount is received.
Expenses
Each Fund bears expenses incurred specifically on its behalf, as well as a portion of general Trust expenses, which are allocated according to methods reviewed annually by the Trustees. Class specific expenses are charged directly to the class incurring the expense. Common expenses, which are not attributable to a specific class, are allocated daily to each class of shares based upon its proportionate share of total net assets of the Fund. Expenses not directly billed to a particular Fund are allocated proportionally among all Funds daily in relation to net assets of each Fund or another reasonable measurement. Fees provided under the distribution (Rule 12b‐1) and/or shareholder service plans for a particular class of the Funds’ are charged to the operations of such class.
Dividend Distributions
Each of the Funds may declare and distribute dividends from net investment income (if any) annually. Distributions from capital gains (if any) are generally declared and distributed annually. Dividends and distributions to shareholders are recorded on ex‐date. Income and capital gain distributions are determined in accordance with income tax regulations which may differ from GAAP.
Estimates
The preparation of financial statements in conformity with GAAP requires management to make estimates and assumptions that affect the reported amounts of assets and liabilities and disclosure of contingent assets and liabilities at the date of the financial statements and the reported amounts of increases and decreases in the net assets from operations during the reported period. Actual results could differ from those estimates. Management believes the estimates and security valuations are appropriate; however, actual results may differ from those estimates, and the security valuations reflected in the financial statements may differ from the value the Funds ultimately realize upon sale of the securities.
Federal Income Taxes
No provision for income taxes is included in the accompanying financial statements, as each Fund intends to distribute to shareholders all taxable investment income and realized gains and otherwise comply with Subchapter M of the Internal Revenue Code of 1986, as amended, applicable to regulated investment companies.
52www.browncapital.com
The Brown Capital Management Mutual Funds
Notes to Financial StatementsMarch 31, 2023
Foreign Taxes
The Funds may be subject to taxes imposed by countries in which they invest. Such taxes are generally based on either income or gains earned or repatriated. The Funds accrue and apply such taxes to net investment income, net realized gains and net unrealized gains as income and/or capital gains earned.
Fees on Redemptions
Shares of the International All Company Fund and the International Small Company Fund will be assessed a fee of 2.00% of the redemption amount if such shares are redeemed within 60 days of purchase. The redemption fee is paid directly to the Fund and is intended to offset the cost of liquidating a shareholders’ investment in the Fund, discourage short‐term trading of shares, and protect long‐term shareholders – the redemption fee is not a sales charge or other fee intended to finance sales or marketing expenses. No redemption fee will be imposed on redemptions initiated by the Funds. Redemption fees are disclosed on the Statements of Changes.
2. TRANSACTIONS WITH RELATED PARTIES AND OTHER SERVICE PROVIDERS
Advisor
Each Fund pays a monthly advisory fee to Brown Capital Management, LLC (the “Advisor”) based upon the average daily net assets of each Fund and is calculated at the following annual rates:
| | Advisory Fees | | | | | | | | | ||
Fund |
| Average Net Assets |
| Rate |
| Expense Limitation Ratio |
| Advisory Fees Waived |
| Expenses Reimbursed | ||
Small Company Fund | | On all assets | | 1.00% | | 1.25% | | $— | | | $— | |
Mid Company Fund | | On all assets | | 0.75% | | 0.90% | | 282,882 | | | 58,812 | |
International All Company Fund | | First $100 million | | 0.90% | | 1.00% | | 368,923 | | | — | |
| | Over $100 million | | 0.75% | | 1.00% | | — | | | — | |
International Small Company Fund | | On all assets | | 1.00% | | 1.15% | | — | | | — | |
In the interest of limiting expenses of the Funds, the Advisor has entered into expense limitation agreements with the Trust, with respect to each of the Funds (“Expense Limitation Agreements”), pursuant to which the Advisor has agreed to waive or limit its fees and to assume other expenses so that the total annual operating expenses of the Funds (other than interest, taxes, brokerage commissions, acquired fund fees and expenses, other expenditures which are capitalized in accordance with generally accepted accounting principles, other extraordinary expenses not incurred in the ordinary course of each Fund’s business, and amounts, if any, payable under a Rule 12b‐1 distribution plan) do not exceed certain limits, which are (at the time this report is being produced) for the Small Company Fund, the Mid Company Fund, the International All Company Fund and the International Small Company Fund, 1.25%, 0.90%, 1.00% and 1.15% of the average daily net assets of those Funds, respectively.
Each of the Funds may reimburse the Advisor the management fees waived or limited and other expenses assumed and paid by the Advisor pursuant to the Expense Limitation Agreements during any of the previous three (3) years, provided that the particular fund has reached a sufficient asset size to permit such reimbursement to be made without causing the total annual expense ratio of the particular fund to exceed the lesser of the percentage limits in place at the time of the waiver and/or reimbursement or current waiver and/or reimbursement arrangement. Consequently, no reimbursement by any of the Funds will be made unless: (i) the particular fund’s assets exceed $20 million for the Small Company Fund, the International All Company Fund, and the International Small Company Fund, or $15 million for the Mid Company Fund; (ii) the particular fund’s total annual expense ratio is less than the percentage described above; and (iii) the payment of such reimbursement has been approved by the Trustees on a quarterly basis.
Fund |
| Expires 2024 |
| Expires 2025 |
| Expires 2026 | |
Small Company Fund | | $— | | $— | | $— | |
Mid Company Fund | | 192,788 | | 213,219 | | 341,694 | |
International All Company Fund | | 235,911 | | 250,676 | | 368,923 | |
International Small Company Fund | | — | | — | | — | |
Annual Report | March 31, 202353
The Brown Capital Management Mutual Funds
Notes to Financial StatementsMarch 31, 2023
Administrator, Transfer Agent and Fund Accountant
Pursuant to the Purchase and Sale Agreement dated June 30, 2021 Brown Capital Management Holdings, Inc. (“BCM”) acquired 50.1% of the outstanding shares of Commonwealth Fund Services, Inc. (“CFS”), becoming its majority owner. The remaining 49.9% of the outstanding shares are owned by Stony Point Holdings, LLC (“SPH”). Prior to this transaction SPH owned 100% of CFS. Management and operation of CFS is governed by the Stockholder Agreement between CFS, BCM and SPH dated June 30, 2021. Following the closing of the transaction discussed above, the Board of Trustees (the “Trustees”) of Brown Capital Management Mutual Funds (the “Trust”) approved CFS to serve as the administrator, fund accounting agent and transfer agent to the 4 mutual funds of the Trust. The transition from SS&C ALPS Fund Services, Inc. (“ALPS”), the previous service provider to the 4 mutual funds, to CFS took place on April 4, 2022. Notice of this transaction and change in service provider was provided to the shareholders of the mutual funds by supplement dated October 1, 2021. As compensation for its services to the Trust, fees to CFS are computed daily and paid monthly. For its fees, CFS is paid $150,000 per Fund per year for Administration and Fund Accounting and $12,000 per Fund per year for Regulatory Compliance. Transfer Agency fees are based on the number and type of accounts serviced. In addition, the Trust shall reimburse CFS from the assets of each Fund certain reasonable expenses incurred by CFS on behalf of each Fund individually in connection with the performance of the Administration Agreement. For the year ended March 31, 2023, the following fees were paid by the Funds to CFS:
Fund |
| Fund accounting |
| Transfer agent | |
Small Company Fund | | $137,400 | | $1,520,375 | |
Mid Company Fund | | 137,400 | | 4,534 | |
International All Company Fund | | 137,400 | | 3,423 | |
International Small Company Fund | | 137,400 | | 119,530 | |
The amounts reflected on the Statements of Operations for Fund accounting and administration fees and transfer agent fees include some out of pocket expenses not paid to CFS.
Compliance Services
The principal owner of Watermark Solutions, LLC serves as the Trust’s Chief Compliance Officer pursuant to an agreement with the Trust. As compensation for its services to the Trust, Watermark Solutions, LLC receives an annual compliance services fee. CFS provides services which assist the Trust’s Chief Compliance Officer in monitoring and testing the policies and procedures of the Trust in conjunction with requirements under Rule 38a‐1 under the 1940 Act. CFS is compensated under the Administration Agreement for these services.
Distributor
ALPS Distributors, Inc. (the “Distributor”) serves as the Funds’ distributor. The Distributor acts as the principal underwriter of the Trust’s shares.
12b‐1 Plan
Each Fund has adopted, with respect to its Investor Class shares, a plan pursuant to Rule 12b‐1 under the 1940 Act (each a “Plan” and collectively, the “Plans”) under which each Fund may incur expenses related to distribution of its shares and for services provided to shareholders. Payments under a Plan are made to the distributor, which uses them to pay distribution and shareholder service expenses on behalf of and as agent of the Fund. The amount payable by the Mid Company Fund, the International All Company Fund and the International Small Company Fund under the Plan is 0.25% of average daily net assets for the year and 0.20% of average daily net assets for the Small Company Fund. The Plans are compensation plans, which means that payments are made to the Distributor regardless of 12b‐1 expenses actually incurred. Therefore, payments under a Plan may exceed distribution and shareholder service expenses incurred pursuant to the Plan. The Distributor may reimburse the Advisor for expenditures that it incurs for marketing and distributions related services for the Funds. It is also possible that 12b‐1 expenses for a period will exceed the payments made to the Distributor by the Funds, in which case the Advisor may pay such excess expenses out of its own resources. The Plans require that the Distributor act in the Funds’ best interests in expending the payments it receives from the Funds and use payments solely for the purpose of paying distribution expenses on behalf of the Funds. The Funds’ Distributor verifies all payment amounts to be made to brokers that have properly executed dealer agreements with the Funds before such payments are made.
Legal Counsel to the Trust
Practus, LLP serves as legal counsel to the Trust. John H. Lively, Secretary of the Trust, is the managing partner of Practus, LLP, but he receives no direct special compensation from the Trust or the Funds for serving as an officer of the Trust.
Any Trustee and/or officer of the Trust that also is an employee and/or officer of the Advisor does not receive compensation from the Trust for serving in such roles.
54www.browncapital.com
The Brown Capital Management Mutual Funds
Notes to Financial StatementsMarch 31, 2023
3. PURCHASES AND SALES OF INVESTMENT SECURITIES
For the year ended March 31, 2023, the aggregate cost of purchases and proceeds from sales of investment securities, excluding short‐term securities, are shown in the following table.
Fund |
| Purchases of Securities |
| Proceeds From Sales of Securities | |
Small Company Fund | | $829,288,757 | | $1,494,366,196 | |
Mid Company Fund | | 6,858,054 | | 9,134,837 | |
International All Company Fund | | 12,394,438 | | 11,075,123 | |
International Small Company Fund | | 423,950,243 | | 567,439,165 | |
4. FEDERAL INCOME TAX
Distributions are determined in accordance with Federal income tax regulations, which may differ from GAAP, and, therefore, may differ significantly in amount or character from net investment income and realized gains for financial reporting purposes. Financial reporting records are adjusted for permanent book/tax differences to reflect tax character but are not adjusted for temporary differences.
Reclassifications to paid-in capital relate primarily to differing book/tax treatment of ordinary net investment losses. For the fiscal year ended March 31, 2023, the following reclassifications, which had no impact on results of operations or net assets, were recorded to reflect tax character:
|
| Paid-in Capital |
| Total Distributable | |
Small Company Fund | | $(45,010,819 | ) | $45,010,819 | |
Mid Company Fund | | (271,200 | ) | 271,200 | |
International All Company Fund | | (25,165 | ) | 25,165 | |
International Small Company Fund | | — | | — | |
The Funds recognize the tax benefit or expenses of uncertain tax positions only when the position is “more likely than not” to be sustained assuming examination by tax authorities. Management reviewed the tax positions in the open tax years of 2020‐2022 and as of and during the year ended March 31, 2023, and determined that the Funds do not have a liability for uncertain tax positions. The Funds recognize interest and penalties, if any, related to unrecognized tax benefits as income tax expense in the Statements of Operations. During the year, the Funds did not incur any interest or penalties.
At March 31, 2023, the tax‐basis cost of investments was as follows:
| Small Company Fund |
| Mid Company Fund |
| International All Company Fund |
| International Small Company Fund | |
Gross unrealized appreciation (excess of value over tax cost) | $1,378,193,048 | | $13,193,079 | | $13,847,133 | | $397,941,242 | |
Gross unrealized depreciation (excess of tax cost over value) | (425,218,135 | ) | (2,894,482 | ) | (11,773,726 | ) | (405,206,401 | ) |
Net appreciation (depreciation) of foreign currency and | — | | — | | (174 | ) | (1,539,688 | ) |
Net unrealized appreciation (depreciation) | $952,974,913 | | $10,298,597 | | $2,073,233 | | $(8,804,847 | ) |
Cost of investments for income tax purposes | $2,564,089,945 | | $28,146,549 | | $61,543,184 | | $2,323,522,673 | |
The difference between book basis and tax basis unrealized appreciation (depreciation) is attributable primarily to the deferral of wash sale losses.
At March 31, 2023, the distributable earnings (accumulated deficits) on a tax basis were as follows:
| Small Company Fund |
| Mid Company Fund |
| International All Company Fund |
| International Small Company Fund | |
Accumulated Ordinary Income/(Loss) | $— | | $— | | $— | | $193,665 | |
Accumulated Capital Gain/(Loss) | 291,561,545 | | — | | (632,166 | ) | (154,084,458 | ) |
Unrealized Appreciation/(Depreciation) | 952,974,913 | | 10,298,597 | | 2,073,233 | | (8,804,847 | ) |
Other Cumulative effect of Timing Differences | (7,613,966 | ) | (434,218 | ) | — | | — | |
Total | $1,236,922,492 | | $9,864,379 | | $1,441,067 | | $(162,695,640 | ) |
Annual Report | March 31, 202355
The Brown Capital Management Mutual Funds
Notes to Financial StatementsMarch 31, 2023
Under current law, post October 31 capital losses and late-year ordinary losses realized after December 31 of a fund’s fiscal year may be deferred and treated as occurring on the first business day of the following fiscal year for tax purposes. The Funds elected to defer these losses as follows:
|
| Post October Capital Losses |
| Late-Year Ordinary Losses |
Small Company Fund | | $— | | $7,613,966 |
Mid Company Fund | | 377,741 | | 56,477 |
International All Company Fund | | — | | — |
International Small Company Fund | | — | | — |
As of March 31, 2023, the Funds had capital loss carryforwards. These losses may be carried forward indefinitely. The tax character of these losses is as follows:
|
| Short Term |
| Long Term |
| Total |
Small Company Fund | | $— | | $— | | $— |
Mid Company Fund | | — | | — | | — |
International All Company Fund | | 565,393 | | 66,773 | | 632,166 |
International Small Company Fund | | 35,876,557 | | 118,207,901 | | 154,084,458 |
Distributions during the fiscal year shown were characterized for tax purposes as follows:
| | Small Company Fund |
| Mid Company Fund |
| International |
| International | ||||||||
Distributions paid from: |
| Year ended |
| Year ended |
| Year ended |
| Year ended |
| Year ended |
| Year ended |
| Year ended |
| Year ended |
Ordinary income | | $— | | $— | | $— | | $— | | $116,151 | | $209,312 | | $409,763 | | $29,318,014 |
Realized gains | | 339,120,944 | | 554,117,005 | | 3,021,833 | | 1,375,581 | | 563,777 | | 304,786 | | — | | 110,733,935 |
Return of capital | | — | | — | | 1,727,628 | | — | | — | | — | | — | | — |
| | $339,120,944 | | $554,117,005 | | $4,749,461 | | $1,375,581 | | $679,928 | | $514,098 | | $409,763 | | $140,051,949 |
5. SECTOR RISK
If a fund has significant investments in the securities of issuers in industries within a particular sector, any development affecting that sector will have a greater impact on the value of the net assets of that fund than would be the case if the fund did not have significant investments in that sector. In addition, this may increase the risk of loss of an investment in the fund and increase the volatility of the fund’s NAV per share. From time to time, circumstances may affect a particular sector and the companies within such sector. For instance, economic or market factors, regulation or deregulation, and technological or other developments may negatively impact all companies in a particular sector and therefore the value of a fund’s portfolio will be adversely affected. As March 31, 2023, 27.98% and 25.50% of the value of the net assets of the Small Company Fund were invested in securities within the Medical/Health Care and Business Services sectors, respectively; 29.11% and 25.79% of the value of the net assets of the Mid Company Fund were invested in securities within the Medical/Health Care and Information/Knowledge Management sectors, respectively; 30.22% and 26.34% of the value of the net assets of the International All Company Fund were invested in securities within the Information Technology and Health Care sectors, respectively; 31.28% and 29.41% of the value of the net assets of the International Small Company Fund were invested in securities within the Information/Knowledge Management and Business Services sectors, respectively.
6. COMMITMENTS AND CONTINGENCIES
Under the Funds’ organizational documents, its officers and Trustees are indemnified against certain liabilities arising out of the performance of their duties to the Funds. In addition, in the normal course of business, the Funds enter into contracts with its vendors and others that provide for general indemnifications. The Funds’ maximum exposure under these arrangements is unknown, as this would involve future claims that may be made against the Funds. The Funds expect the risk of loss to be remote.
56www.browncapital.com
See Notes to Financial Statements
The Brown Capital Management Mutual Funds
Notes to Financial StatementsMarch 31, 2023 (Unaudited)
7. TRUSTEE AND OFFICER FEES
Officers of the Trust, except the Chief Compliance Officer, and Trustees who are interested persons of the Trust, will receive no salary or fees from the Funds for their services to the Trust. As of March 31, 2023, there were five Trustees, three of whom are not “interested persons” of the Trust within the meaning of that term under the 1940 Act (each, an “Independent Trustee”). Effective December 11, 2020 and retroactive to January 1, 2020, each Independent Trustee of the Trust receives a $79,000 annual retainer and a $1,500 per meeting fee. All Trustees and officers are reimbursed for any out‐of‐pocket expenses incurred in connection with attendance at meetings. Prior to December 11, 2020 each Independent Trustee of the Trust received a $54,000 annual retainer and a $1,500 per meeting fee.
8. CHANGE IN INDEPENDENT REGISTERED PUBLIC ACCOUNTING FIRM
On March 13, 2023, BBD LLP (“BBD”) ceased to serve as the independent registered public accounting firm of Brown Capital Management Small Company Fund, Brown Capital Management Mid Company Fund, Brown Capital Management International All Company Fund and Brown Capital Management International Small Company Fund (the “Funds”), each a series of Brown Capital Management Mutual Funds (The “Trust”). The Audit Committee of the Board of Trustees approved the replacement of BBD as a result of Cohen & Company, Ltd.’s (“Cohen”) acquisition of BBD’s investment management group.
The reports of BBD on the financial statements of the Funds as of and for the fiscal years ended March 31, 2022 and March 31, 2021 did not contain an adverse opinion or a disclaimer of opinion, and were not qualified or modified as to uncertainties, audit scope or accounting principles. During the fiscal years March 31, 2022 and March 31, 2021: (i) there were no disagreements between the registrant and BBD on any matter of accounting principles or practices, financial statement disclosure, or auditing scope or procedure, which disagreements, if not resolved to the satisfaction of BBD, would have caused it to make reference to the subject matter of the disagreements in its reports on the financial statements of the Funds for such years; and (ii) there were no “reportable events,” as defined in Item 304(a)(1)(v) of Regulation S-K under the Securities Exchange Act of 1934, as amended.
The registrant requested that BBD furnish it with a letter addressed to the U.S. Securities and Exchange Commission stating that it agrees with the above statements.
On March 22, 2023, the Audit Committee of the Board of Trustees recommended and approved the appointment of Cohen as the Funds’ independent registered public accounting firm for the fiscal year ending March 31, 2023 and March 31, 2024.
During the fiscal years ended March 31, 2022 and March 31, 2021, neither the registrant, nor anyone acting on its behalf, consulted with Cohen on behalf of the Funds regarding the application of accounting principles to a specified transaction (either completed or proposed), the type of audit opinion that might be rendered on the Funds’ financial statements, or any matter that was either: (i) the subject of a “disagreement,” as defined in Item 304(a)(1)(iv) of Regulation S-K and the instructions thereto; or (ii) “reportable events,” as defined in Item 304(a)(1)(v) of Regulation S-K.
9. SUBSEQUENT EVENTS
The Funds evaluated subsequent events from March 31, 2023, the date of these financial statements, through the date these financial statements were issued and available and has noted no additional items require disclosure.
Annual Report | March 31, 202357
To the Shareholders and Board of Trustees of Brown Capital Management Mutual Funds
Opinion on the Financial Statements
We have audited the accompanying statements of assets and liabilities, including the schedules of investments of The Brown Capital Management Small Company Fund, The Brown Capital Management Mid Company Fund, The Brown Capital Management International All Company Fund (formerly, The Brown Capital Management International Equity Fund) and The Brown Capital Management International Small Company Fund (the “Funds”), each a series of Brown Capital Management Mutual Funds, as of March 31, 2023, and the related statements of operations and changes in net assets and the financial highlights for the year then ended and the related notes, (collectively referred to as the “financial statements”). In our opinion, the financial statements present fairly, in all material respects, the financial position of each of the Funds as of March 31, 2023, and the results of their operations, the changes in net assets, and the financial highlights for the year then ended, in conformity with accounting principles generally accepted in the United States of America.
The Funds’ statements of changes in net assets for the year ended March 31, 2022, and the financial highlights for each of the years in the four-year period then ended, were audited by other auditors whose report dated May 27, 2022, expressed an unqualified opinion on those financial statements and financial highlights.
Basis for Opinion
These financial statements are the responsibility of the Funds’ management. Our responsibility is to express an opinion on the Funds’ financial statements based on our audits. We are a public accounting firm registered with the Public Company Accounting Oversight Board (United States) (“PCAOB”) and are required to be independent with respect to the Funds in accordance with the U.S. federal securities laws and the applicable rules and regulations of the Securities and Exchange Commission and the PCAOB.
We conducted our audits in accordance with the standards of the PCAOB. Those standards require that we plan and perform the audits to obtain reasonable assurance about whether the financial statements are free of material misstatement whether due to error or fraud.
Our audits included performing procedures to assess the risks of material misstatement of the financial statements, whether due to error or fraud, and performing procedures that respond to those risks. Such procedures included examining, on a test basis, evidence regarding the amounts and disclosures in the financial statements. Our procedures included confirmation of securities owned as of March 31, 2023, by correspondence with the custodian and brokers; when replies were not received from brokers, we performed other auditing procedures. Our audits also included evaluating the accounting principles used and significant estimates made by management, as well as evaluating the overall presentation of the financial statements. We believe that our audits provide a reasonable basis for our opinion.
We have served as the Funds’ auditor since 2023.
COHEN & COMPANY, LTD.
Philadelphia, Pennsylvania
May 31, 2023
58www.browncapital.com
As a shareholder of the Funds, you incur ongoing costs, including management fees and other fund expenses. This example is intended to help you understand your ongoing costs (in dollars) of investing in each Fund and to compare these costs with the ongoing costs of investing in other mutual funds. The example is based on an investment of $1,000 invested at the beginning of the period and held for the entire period as indicated below.
Actual Expenses – The first line of the table below provides information about the actual account values and actual expenses. You may use the information in this line, together with the amount you invested, to estimate the expenses that you paid over the period. Simply divide your account value by $1,000 (for example, an $8,600 account value divided by $1,000 = 8.6), then multiply the result by the number in the first line under the heading entitled “Expenses Paid During Period” to estimate the expenses you paid on your account during this period.
Hypothetical Example for Comparison Purposes – The second line of the table below provides information about hypothetical account values and hypothetical expenses based on each Fund’s actual expense ratio and an assumed annual rate of return of 5% before expenses, which is not each Fund’s actual return. The hypothetical account values and expenses may not be used to estimate the actual ending account balance or expenses you paid for the period. You may use this information to compare the ongoing costs of investing in each Fund and other funds by comparing these 5% hypothetical examples with the 5% hypothetical examples that appear in the shareholder reports of other funds. Please note that the expenses shown in the table are meant to highlight your ongoing costs only and do not reflect any transactional costs, such as sales charges (loads), redemption fees, or exchange fees. Therefore, the second line of the table is useful in comparing ongoing costs only, and will not help you determine the relative total costs of owning different funds. In addition, if these transactional costs were included, your costs would have been higher.
| Beginning |
| Ending |
| Expense |
| Expenses Paid | ||||||||
Small Company Fund | | | | | | | | | | | | | | | |
Investor | | | | | | | | | | | | | | | |
Actual | | $1,000.00 | | | | $1,028.22 | | | | 1.28% | | | | $6.47 | |
Hypothetical (5% return before expenses) | | $1,000.00 | | | | $1,018.55 | | | | 1.28% | | | | $6.44 | |
Institutional | | | | | | | | | | | | | | | |
Actual | | $1,000.00 | | | | $1,028.76 | | | | 1.08% | | | | $5.46 | |
Hypothetical (5% return before expenses) | | $1,000.00 | | | | $1,019.55 | | | | 1.08% | | | | $5.44 | |
| | | | | | | | | | | | | | | |
Mid Company Fund | | | | | | | | | | | | | | | |
Investor | | | | | | | | | | | | | | | |
Actual | | $1,000.00 | | | | $1,103.71 | | | | 1.15% | | | | $6.03 | |
Hypothetical (5% return before expenses) | | $1,000.00 | | | | $1,019.20 | | | | 1.15% | | | | $5.79 | |
Institutional | | | | | | | | | | | | | | | |
Actual | | $1,000.00 | | | | $1,102.99 | | | | 0.90% | | | | $4.72 | |
Hypothetical (5% return before expenses) | | $1,000.00 | | | | $1,020.44 | | | | 0.90% | | | | $4.53 | |
| | | | | | | | | | | | | | | |
International All Company Fund | | | | | | | | | | | | | | | |
Investor | | | | | | | | | | | | | | | |
Actual | | $1,000.00 | | | | $1,111.25 | | | | 1.25% | | | | $6.58 | |
Hypothetical (5% return before expenses) | | $1,000.00 | | | | $1,018.70 | | | | 1.25% | | | | $6.29 | |
Institutional | | | | | | | | | | | | | | | |
Actual | | $1,000.00 | | | | $1,111.42 | | | | 1.00% | | | | $5.27 | |
Hypothetical (5% return before expenses) | | $1,000.00 | | | | $1,019.95 | | | | 1.00% | | | | $5.04 | |
| | | | | | | | | | | | | | | |
International Small Company Fund | | | | | | | | | | | | | | | |
Investor | | | | | | | | | | | | | | | |
Actual | | $1,000.00 | | | | $1,108.31 | | | | 1.31% | | | | $6.89 | |
Hypothetical (5% return before expenses) | | $1,000.00 | | | | $1,018.40 | | | | 1.31% | | | | $6.59 | |
Institutional | | | | | | | | | | | | | | | |
Actual | | $1,000.00 | | | | $1,109.15 | | | | 1.06% | | | | $5.57 | |
Hypothetical (5% return before expenses) | | $1,000.00 | | | | $1,019.65 | | | | 1.06% | | | | $5.34 | |
(a)Annualized, based on the Fund’s most recent fiscal half-year expenses.
(b)Expenses are equal to the Fund’s annualized expense ratio multiplied by the average account value over the period, multiplied by the number of days in the most recent fiscal half-year (182), divided by 365.
Annual Report | March 31, 202359
PROXY VOTING POLICIES AND VOTING RECORD
A copy of the Trust’s Proxy Voting and Disclosure Policy and the Advisor’s Proxy Voting and Disclosure Policy are included as Appendix A to the Funds’ Statement of Additional Information and are available, (1) without charge, upon request, by calling 877-892-4226 and (2) on the U.S. Securities and Exchange Commission’s (“SEC”) website at https://www.sec.gov. Information regarding how the Funds voted proxies relating to portfolio securities during the most recent 12-month period ended June 30 is available (1) without charge, upon request, by calling the Funds at the number above and (2) on the SEC’s website at https://www.sec.gov.
QUARTERLY PORTFOLIO HOLDINGS
The Funds file their complete schedule of portfolio holdings with the SEC for the first and third quarters of each fiscal year on Form N-PORT. The Funds Form N-PORT is available on the SEC’s website at https://www.sec.gov. Information included in the Funds’ N-PORT will also be available upon request by calling 877-892-4226.
ANNUAL RENEWAL OF INVESTMENT ADVISORY AGREEMENT
Brown Capital Management, LLC (“BCM” or “Advisor”) supervises the investments of The Brown Capital Management Small Company Fund (the “Small Company Fund”), The Brown Capital Management International All Company Fund (the “International All Company Fund”), The Brown Capital Management Mid Company Fund (the “Mid Company Fund”), and The Brown Capital Management International Small Company Fund (the “International Small Company Fund”) (each a “Fund” and collectively, the “Funds”) pursuant to an Investment Advisory Agreement (“Agreement”) between BCM and Brown Capital Management Mutual Funds (the “Trust”). At a meeting of the Trust’s Board of Trustees (“Board”) held on March 22, 2023, the Trustees unanimously approved the continuation of the Agreement. At that meeting, legal counsel to the Trust (“Counsel”) reviewed with the Board a memorandum from Counsel and addressed to the Trustees that summarized, among other things, the fiduciary duties and responsibilities of the Board in reviewing and approving the continuation of the Agreement for the Funds. Counsel discussed with the Trustees the types of information and factors that should be considered by the Board in order to make an informed decision regarding the approval of the continuation of the Agreement.
In deciding whether to approve the continuation of the Agreement between the Trust and BCM, with respect to the Small Company Fund, the International All Company Fund, the Mid Company Fund, and the International Small Company Fund, the Trustees considered numerous factors, including: (i) the nature, extent, and quality of the services provided by BCM; (ii) the investment performance of the Funds and BCM; (iii) the costs of the services to be provided and profits to be realized by BCM from the relationship with the Funds; (iv) the extent to which economies of scale would be realized as the Funds grow and whether advisory fee levels reflect those economies of scale for the benefit of the Funds’ investors; and (v) BCM’s practices regarding possible conflicts of interest.
In assessing these factors and reaching its decisions, the Board took into consideration information furnished for the Board’s review and consideration throughout the year at regular Board meetings, as well as information specifically prepared and/or presented in connection with the annual renewal process, including information presented at the Meeting. The Board also reported that it met with Counsel prior to the Board Meeting to discuss the 15c responses and any relevant exhibits provided by the Advisor. It was noted that the Board requested and was provided with information and reports relevant to the annual renewal of the Agreement, including: (i) reports regarding the services and support provided to the Funds and their shareholders by the Advisor; (ii) assessments of the investment performance of the Funds by personnel of the Advisor; (iii) commentary on the reasons for the performance; (iv) presentations addressing the Advisor’s investment philosophy, investment strategy, personnel and operations; (v) compliance and audit reports concerning the Funds and the Advisor; (vi) disclosure information contained in the registration statement of the Trust and the Form ADV of the Advisor; and (vii) a memorandum from Counsel that summarized the fiduciary duties and responsibilities of the Board in reviewing and approving the Agreement, including the material factors set forth above and the types of information included in each factor that should be considered by the Board in order to make an informed decision. The Board also requested and received various informational materials including, without limitation: (i) documents containing information about the Advisor, including financial information on the firm’s operations along with its investment in a mutual fund servicing company, a description of personnel and the services provided to the Funds, information on investment advice, performance, summaries of Fund expenses, compliance program, current legal matters, succession planning and other general information; (ii) comparative expense and performance information for other mutual funds with strategies similar to the Funds that was prepared by the Advisor and obtained from an independent third-party ranking organization; (iii) the anticipated effect of size on the Funds’ performance and expenses; and (iv) benefits to be realized by the Advisor from its relationship with the Funds, including any potential benefits it could receive from its investment in a mutual fund servicing company that has been hired by the Board to provide transfer agency, fund accounting and administration services to the Funds. The Board did not identify any information that was most relevant to its consideration to approve the Agreement and each Trustee may have afforded different weight to the various factors.
60www.browncapital.com
The Brown Capital Management Mutual Funds
Additional InformationMarch 31, 2023 (Unaudited)
Nature, Extent and Quality of the Services Provided by the Advisor
In considering the nature, extent, and quality of the services provided by the Advisor, the Trustees reviewed the responsibilities of the Advisor under the Agreement. The Trustees reviewed the services currently being provided by the Advisor to the Funds including, without limitation, the quality of its investment advisory services since each Fund’s commencement of operations (including research and recommendations with respect to portfolio securities); its procedures for formulating investment decisions and assuring compliance with each Fund’s investment objectives and limitations; and its efforts to promote the Funds and grow the Funds’ assets. The Trustees noted that certain employees of the Advisor serve as officers of the Trust, including as a principal executive officer and principal financial officer, without additional compensation. The Trustees considered the coordination of services for the Funds among the Advisor and the service providers and the Independent Trustees. The Trustees noted the Advisor’s commitment to enhance its resources and systems, and the continued cooperation with the Independent Trustees, Independent Trustee Counsel and Counsel for the Funds. The Trustees evaluated the Advisor’s personnel, including the education and experience of its personnel. The Trustees considered strategic initiatives described by the Advisor in its on-going discussions with the Trustees that are intended to benefit the Funds, including the possible re-opening of the Small Company Fund to new investors. After reviewing the foregoing information and further information in the materials provided by the Advisor (including the Advisor’s Form ADV), the Board concluded that, in light of all the facts and circumstances, the nature, extent, and quality of the services provided by the Advisor were satisfactory and adequate for the Funds.
Investment Performance of the Funds and the Advisor
In considering the investment performance of the Funds and the Advisor, the Trustees compared the short and long-term performance of each Fund with the performance of its benchmark index, or indices, as applicable and comparable peer group indices (e.g., Morningstar category averages). The Trustees also considered the consistency of the Advisor’s management of each Fund with its investment objective and policies. The Trustees observed that the Small Company Fund underperformed its Morningstar category average and benchmark index for the 1-year, 3-year and 5-year periods ended December 31, 2022. The Fund also underperformed its Morningstar category average for the 10-year period ended December 31, 2022, but outperformed its benchmark index during this period. They discussed the Small Company Fund’s recent underperformance, noting that investments in smaller companies are susceptible to greater volatility than investments in larger more established companies, and that a combination of the portfolio’s concentration in a limited number of stocks, and the focus on long-term fundamentals had adversely affected Fund performance. The Trustees observed that the Mid Company Fund underperformed its Morningstar category average and benchmark index for the 1-, 3-, 5- and 10- year periods ended December 31, 2022. They discussed the reasons for the Fund’s underperformance, noting certain macroeconomic factors and the Fund’s investments in exceptional growth companies, rather than analyzing indexes, which adversely affected Fund performance. The Trustees observed that the International All Company Fund underperformed its Morningstar category average and benchmark indices for the 1- year, 3-year and 5-year periods ended December 31, 2022. They also considered the International All Company Fund’s performance for the 10-year period ended December 31, 2022, noting that the Fund underperformed its Morningstar category average and its MSCI EAFE benchmark index but outperformed the MSCI AC World ex US index. The Trustees discussed the Advisor’s efforts to improve the performance of the International All Company Fund. The Trustees next observed that the International Small Company Fund underperformed its benchmark index and Morningstar category average for the one-year period ended December 31, 2022, and outperformed its benchmark index and Morningstar category average for the 3- and 5- year periods ended December 31, 2022. The Trustees noted that the performance of the Funds was generally lower than the performance of the composites representing separate accounts managed by the Advisor having substantially similar strategies as the respective Funds. They considered the Advisor’s representation that the differences in performance are generally attributed to differences in cash flows and expenses. Although not the determining factor in the Trustees’ considerations, these foregoing observations assisted the Trustees in concluding to approve the Agreement by allowing them to measure how the Funds compared to other similar products and the markets generally, as well as how the performance compared to similar services offered by BCM. The Trustees weighed the Funds’ relatively poor recent performance compared to other mutual funds with similar investment strategies and considered the Advisor’s commitment to managing the Funds within their strategy, the Funds’ longer-term performance, and the resources the Advisor has dedicated to the Funds. The Trustees noted the Advisor’s commitment to improving Fund performance, and determined to continue to monitor the Funds’ performance. After reviewing the investment performance of the Funds further, the Advisor’s experience managing the Funds and other advisory accounts, the Advisor’s historical investment performance, and other factors, the Board of Trustees concluded, in light of all the facts and circumstances, that they were satisfied with the Advisor’s commitment to improving the Funds’ investment performance and they noted that they would continue to monitor the performance of each of the Funds closely.
Costs of the Services to be Provided and Profits to be Realized by the Advisor
In considering the costs of the services to be provided and profits to be realized by the Advisor from its relationship with the Funds, the Trustees considered the Advisor’s staffing, personnel, and methods of operating; the Advisor’s compliance policies and procedures; the financial condition of the Advisor and the level of commitment to the Funds by the Advisor; the asset levels of the Funds; the overall expenses of the Funds in light of the expense limitation arrangements with the Advisor; the Advisor’s strategic initiatives that are designed to benefit the Funds, including its investment in a mutual fund servicing company; and the nature and frequency of advisory fee payments. The Trustees reviewed the financial statements for the Advisor and considered the financial stability and profitability of the firm. The Trustees also considered potential benefits for the Advisor in managing
Annual Report | March 31, 202361
The Brown Capital Management Mutual Funds
Additional InformationMarch 31, 2023 (Unaudited)
the Funds, noting that an affiliate of the Advisor provides transfer agency, administration and fund accounting services to the Funds. The Trustees then compared the fees and expenses of each Fund (including the management fee) to their respective Morningstar category averages. With respect to the Small Company Fund, the Trustees observed that the management fee was higher than the Morningstar category average, but the overall net expense ratio of the Institutional Class was below the Morningstar category average while the Investor Class was higher than the Morningstar category average. With respect to the Mid Company Fund, the Trustees observed that the management fee was slightly higher than the Morningstar category average and the overall net expense ratio of the Institutional Class was below the Morningstar category average while the Investor Class was higher than the Morningstar category average. With respect to the International All Company Fund, the Trustees observed that the management fee was higher than the Morningstar category average and the net expense ratio of Institutional Class and the Investor Class was higher than the Morningstar category average. With respect to the International Small Company Fund, the Trustees observed that the management fee was slightly higher than the Morningstar category average and the overall net expense ratio for the Institutional Class was below the Morningstar category average while the net expense ratio for the Investor Class was slightly higher than the Morningstar category average. Although not the determining factor in the Trustees’ considerations, this information assisted the Trustees in concluding to approve the renewal of the Agreement by allowing them to determine how the Funds compared to other similar products. The Trustees also considered the management fees of the Funds compared to the management fees paid to the Advisor by its separately managed accounts with substantially similar strategies. It was noted that the differences in management fees paid by the Mid Company Fund and International All Company Fund when compared to their respective separately managed accounts were largely due to the Advisor’s costs being higher to manage these disciplines in a mutual fund structure. The Trustees noted that the management fees charged to the Small Company Fund and International Small Company Fund were the same as the management fees charged to their respective separately managed accounts. The Trustees discussed the Advisor’s profitability as it relates to each Fund. The Trustees noted that the Advisor earned a profit with respect to each Fund and that these profits were reasonable when considering the services provided to Fund shareholders.
Following this comparison and upon further consideration and discussion of the foregoing, the Board of Trustees concluded, in light of all the facts and circumstances, that the fees to be paid to the Advisor by each Fund were fair and reasonable in relation to the nature and quality of the services provided by the Advisor and that they reflected charges that were within a range of what could have been negotiated at arm’s length.
Economies of Scale
In considering the extent to which economies of scale would be realized as the Funds grow and whether advisory fee levels reflect those economies of scale for the benefit of the Funds’ investors, the Trustees considered that each Fund’s fee arrangements with the Advisor involved both the management fee and an expense limitation arrangement. For each of the Small Company Fund, the Mid Company Fund and the International Small Company Fund, the Trustees considered that, while the management fee would remain the same at all asset levels, those Funds’ shareholders benefited from economies of scale under the Funds’ agreements with service providers other than the Advisor. It was noted that the Advisor is of the view that the strategies followed by the Small Company Fund, International Small Company Fund and Mid Company Fund are all capacity constrained; therefore, making breakpoints less appropriate for these strategies. The Trustees concluded that the advisory fee structure of the Small Company Fund, the Mid Company Fund, and the International Small Company Fund would not directly result in economies of scale for shareholders. For the International All Company Fund, the Trustees noted that the Fund utilizes breakpoints in its advisory fee schedule and determined that the Fund’s shareholders would benefit from economies of scale as the Fund grows. The Trustees observed that at its low asset levels, the advisory fee of the International All Company Fund did not, at this time, reflect those economies of scale.
The Trustees also considered that shareholders of the Mid Company Fund and the International All Company Fund would continue to benefit from their respective expense limitation arrangements until such point where a Fund’s assets grow to a level where the Fund will be operating below the expense cap. The Trustees noted that the Small Company Fund and the International Small Company Fund were currently operating below their expense caps and, as a result, shareholders were not directly benefiting from the expense caps being in place at this time.
Following further discussion of the Funds’ asset levels, expectations for growth, and fee levels, the Board of Trustees determined, in light of all the facts and circumstances, that each Fund’s fee arrangements were fair and reasonable in relation to the nature and quality of the services provided by the Advisor, and that each Fund’s expense limitation arrangement provided potential savings for the benefit of such Fund’s investors.
Advisor’s Practices Regarding Possible Conflicts of Interest and Benefits to the Advisor
In considering the Advisor’s practices regarding conflicts of interest, the Trustees evaluated the potential for conflicts of interest and considered such matters as the experience and ability of the advisory personnel assigned to each Fund; the impact of an affiliated company and its relationship with the Funds; the basis for soft-dollar payments with broker-dealers; the basis of decisions to buy or sell securities for the Funds and the Advisor’s other accounts; the method for bunching portfolio securities transactions; and the substance and administration of the Advisor’s code of ethics. The Trustees considered the Advisor’s purchase of a controlling interest in a mutual fund servicing company that has been hired by the Board to provide transfer agency, administration, and fund accounting services to the Funds. The affiliated servicing company began receiving fees from the Funds in April 2022. It was noted by the Board that the Advisor could receive additional revenues from the fees paid by the Funds to the Advisor’s affiliated servicing company,
62www.browncapital.com
The Brown Capital Management Mutual Funds
Additional InformationMarch 31, 2023 (Unaudited)
although the acquisition of the servicing company has had no material impact on the Advisor’s corporate structure or principal business activities. The Trustees discussed the financial impact this may have on the Advisor, noting that based on the information provided by the Advisor the financial impact from the acquisition of the service company is not expected to be meaningful to the Advisor’s operations for the foreseeable future. The Trustees also considered the Advisor’s representations that since the affiliated servicer began providing transfer agency, administration and fund accounting services to the Funds, the Adviser is confident in its ability to better monitor and control these fees for Fund shareholders over time. The Board noted that services provided to the Funds by the affiliated servicer have been satisfactory, and that the Advisor believes that the fee commitments by the affiliated servicer are expected to have a positive impact on the Funds’ long-term cost structure. They discussed the importance of closely monitoring this conflict to ensure Fund shareholders’ best interests are being served. The Trustees also noted certain conflicts of interest in the Advisor’s management of other accounts along with the Funds, and they considered the Advisor’s policies and procedures to manage these conflicts. Following further consideration and discussion, the Board of Trustees indicated that the Advisor’s standards and practices relating to the identification and mitigation of possible and actual conflicts of interests were satisfactory. The Board of Trustees considered that the Advisor may benefit from the Funds by being able to place a smaller account with or in the Funds.
Based upon all of the foregoing considerations, the Board of Trustees, including a majority of the Independent Trustees who are not parties to any investment advisory agreement between the Trust and its investment advisers or interested persons of any such party, determined that it was appropriate to approve the Agreement upon the terms and for the compensation described therein.
TAX DESIGNATIONS
The Brown Capital Management International All Company Fund designates the following as a percentage of taxable ordinary income distributions, or up to the maximum amount allowable, for the calendar year ended December 31.2022:
Qualified Dividend Income: 100%
Dividend Received Deduction: 0.00%
The Brown Capital Management International Small Company Fund designates the following as a percentage of taxable ordinary income distributions, or up to the maximum amount allowable, for the calendar year ended December 31.2022:
Qualified Dividend Income: 80.87%
Dividend Received Deduction: 0.00%
In early 2023, if applicable, shareholders of record received this information for the distributions paid to them by the Fund during the calendar year 2022 via Form 1099. The Fund will notify shareholders in early 2024 of amounts paid to them by the Fund, if any, during the calendar year 2023.
Pursuant to Section 852(b)(3) of the Internal Revenue Code, the Brown Capital Management Small Company Fund designated $399,120,944 as long-term capital gain dividends. Brown Capital Management Mid Company Fund designated $1,375,581 as long-term gain capital dividends. Brown Capital Management International Small Company Fund designated $110,733,935 as long-term capital gain dividends.
The Brown Capital Management International All Company Fund designates foreign taxes paid in the amount of $66,451 and foreign source income in the amount of $678,914 for federal income tax purposes for the year ended March 31, 2023. The Brown International Small Company Fund designates foreign taxes paid in the amount of $1,666,558 and foreign source income in the amount of $30,476,945 for federal income tax purposes for the year ended March 31, 2023.
PRIVACY NOTICE
The following is a description of the Funds’ policies regarding disclosure of nonpublic personal information that you provide to the Funds or that the Funds collect from other sources. In the event that you hold shares of the Funds through a broker-dealer or other financial intermediary, the privacy policy of your financial intermediary would govern how your nonpublic personal information would be shared with unaffiliated third parties.
Categories of Information the Funds Collect. The Funds collect the following nonpublic personal information about you:
•Information the Funds receive from you on or in applications or other forms, correspondence, or conversations (such as your name, address, phone number, social security number, assets, income and date of birth); and
•Information about your transactions with the Funds, their affiliates, or others (such as your account number and balance, payment history, parties to transactions, cost basis information, and other financial information).
Annual Report | March 31, 202363
The Brown Capital Management Mutual Funds
Additional InformationMarch 31, 2023 (Unaudited)
Categories of Information the Funds Disclose. The Funds do not disclose any non-public personal information about their current or former shareholders to unaffiliated third parties, except as required or permitted by law. The Funds are permitted by law to disclose all of the information it collects, as described above, to their service providers (such as the Funds’ custodian, administrator and transfer agent) to process your transactions and otherwise provide services to you.
Confidentiality and Security. The Funds restrict access to your nonpublic personal information to those persons who require such information to provide products or services to you. The Funds maintain physical, electronic, and procedural safeguards that comply with federal standards to guard your nonpublic personal information.
The Funds’ Privacy Notice is not part of this annual report.
64www.browncapital.com
The Trustees are responsible for the management and supervision of the Funds. The Trustees set broad policies for the Funds and choose the Funds’ officers. The Trustees also approve all significant agreements between the Trust, on behalf of the Funds, and those companies that furnish services to the Funds; review performance of the Advisor and Funds; and oversee activities of the Funds. Generally, each Trustee and officer serves an indefinite term or until certain circumstances such as their resignation, death, or otherwise as specified in the Trust’s organizational documents. Any Trustee may be removed at a meeting of shareholders by a vote meeting the requirements of the Trust’s organizational documents. The Statement of Additional Information of the Funds includes additional information about the Trustees and officers and is available, without charge, upon request by calling the Funds toll‐free at 1‐877‐892‐4226. The address of each Trustee and officer is 1201 N. Calvert Street, Baltimore, Maryland 21202.
Name, Age, |
| Position(s) |
| Length of |
| Principal |
| Number of |
| Other Directorships |
Independent Trustees | | | | | | | | | | |
James H. Speed, Jr., 69 | | Trustee | | Since September 2002 | | Private investor since January 2016; President and CEO of NC Mutual Insurance Company (insurance company) from May 2003 to December 2015; President of Speed Financial Group, Inc. (consulting/private investments) from March 2000 to April 2003. | | 4 | | Independent Trustee of the following: Starboard Investment Trust for its 11 series; WST Investment Trust for its one series; Chesapeake Investment Trust for its one series; Centaur Mutual Funds for its two series (all registered investment companies). Member of the Board of Directors of Investors Title Company (title insurance company) and M&F Bancorp Inc. (banking). |
Chairman | | Since 2012 | | |||||||
Louis G. Hutt, Jr., 69 | | Trustee | | Since October 2014 | | Managing Member of The Hutt Co., LLC (certified public accountants) from 1983 to present; Managing Member of The Hutt Law Firm from 1983 to present. | | 4 | | Member of Board of Trustees and Chair of Audit Committee of Washington University, St. Louis; and Independent Trustee and Audit Committee Chairman of the Boston Trust Walden Funds for its 10 series (registered investment company). |
Claude Z. Demby, 58 | | Trustee | | Since October 2014 | | President of Cree‐LED Business a “Smart Global Holding Company” since March 2021; Senior Vice President and General Manager of LED Business for Cree from December 2018 to March 2021; Senior Vice President of Strategy and Business Development between 2017 to December 2018. Vice president and General Manager of Semi Conductor Materials Business between 2014 to 2017; President and CEO of Noel Group (international group of manufacturing businesses) from 2008 to 2014. | | 4 | | Member of the Board, Federal Reserve Bank of Richmond‐Charlotte Branch; Director, Valour Academy Schools; Chair‐Elect Greater Raleigh Chamber of Commerce; and Board Member Duke‐Raleigh Hospital; Board Member of EOS Energy Storage; and Board Member of Piedmont Lithium Incorporated. |
Annual Report | March 31, 202365
The Brown Capital Management Mutual Funds
Trustees and OfficersMarch 31, 2023
Name, Age, |
| Position(s) Held with |
| Length of |
| Principal |
| Number of Portfolios in Fund Complex Overseen |
| Other Directorships |
Interested Trustees* | | | | | | | | | | |
Robert L. Young, III, 54 | | Trustee; President; Principal Executive Officer | | Trustee since October 2019; President and Principal Executive Officer since July 2022 | | President, Brown Capital Management, LLC since January 2023; Managing Director/Head of Marketing and Sales/Client Services, Brown Capital Management, LLC, April 1999 to present. | | 4 | | None |
Amy Perez Jackson, 47 | | Trustee; Vice President | | Trustee since July 2022; Vice President since July 2022 | | Managing Director of Marketing/Client Services, Brown Capital Management, LLC, March 2017 to present. | | 4 | | None |
Other Officers | | | | | | | | | | |
John H. Lively, 54 | | Secretary | | Since 2011 | | Attorney, Practus LLP (law firm) May 2017 to present; Attorney, The Law Offices of John H. Lively & Associates, Inc. (law firm), March 2010 to 2017. | | n/a | | n/a |
Michael L. Forster, 56 | | Treasurer, and Principal Financial Officer | | Since 2020 | | Chief Operating Officer and Chief Financial Officer, Brown Capital Management, LLC, January 2020 to present. | | n/a | | n/a |
Julian G. Winters, 54 | | Chief Compliance Officer | | Since 2004 | | Managing Member of Watermark Solutions, LLC (investment compliance and consulting) since March 2007. | | n/a | | n/a |
*Mr. Young and Ms. Perez Jackson are considered Interested Trustees because they are officers of Brown Capital Management, LLC, the advisor of the Funds.
Must be accompanied or preceded by a prospectus.
Funds distributed by ALPS Distributors, Inc. 1290 Broadway, Suite 1000, Denver, CO 80203
Item 2. | Code of Ethics. |
As of the end of the period covered by this report, the registrant had adopted a code of ethics (the “Code”) that applies to the registrant’s principal executive officer (“PEO”) and principal financial officer (“PFO”). There were no amendments to the Code during the period covered by the report. The Registrant did not grant any waivers, including implicit waivers, from any provisions of the Code to the PEOs or PFO during the period covered by this report. A copy of the Code is filed pursuant to Item 12(a)(1) below.
Item 3. | AUDIT COMMITTEE FINANCIAL EXPERT. |
The registrant’s Board of Trustees has determined that the registrant has an audit committee financial expert, as defined in Item 3 of Form N-CSR, serving on its audit committee.
As of the date of the report, March 31, 2023, the registrant’s audit committee financial experts are James H. Speed, Jr., Louis G. Hutt and Claude Z. Demby. Mr. Speed, Mr. Hutt and Mr. Demby are “independent” for purposes of Item 3 of Form N-CSR.
Item 4. | PRINCIPAL ACCOUNTANT FEES AND SERVICES. |
(a) | Audit Fees – Audit fees for the registrant for the fiscal years ended March 31, 2022 and March 31, 2023 are reflected in the table below. These amounts represent aggregate fees billed by the registrant’s independent accountants in connection with the annual audits of the registrant’s financial statements and for services normally provided by the accountant in connection with the registrant’s statutory and regulatory filings. BBD, LLP served as the registrant’s independent accountant for the fiscal year ended March 31, 2022, and Cohen & Company, Ltd. served as the registrant’s independent accountant for the fiscal year ended March 31, 2023. BBD, LLP and Cohen & Company, Ltd. are the “Accountants” for purposes of this Item. |
Fund | 2022 | 2023 |
The Brown Capital Management Small Company Fund | $14,000 | $14,000 |
The Brown Capital Management International All Company Fund | $12,500 | $12,500 |
The Brown Capital Management Mid Company Fund | $12,500 | $12,500 |
The Brown Capital Management International Small Company Fund | $12,500 | $12,500 |
(b) | Audit-Related Fees – There were no additional fees billed in the fiscal years ended March 31, 2022 and March 31, 2023 for assurance and related services by the Accountants that were reasonably related to the performance of the audit of the registrant’s financial statements that were not reported under paragraph (a) of this Item. |
(c) | Tax Fees – The tax fees billed in the fiscal years ended March 31, 2022 and March 31, 2023 for professional services rendered by the Accountants for tax compliance, tax advice, and tax planning are reflected in the table below. These services were for the completion of each fund’s federal and state income tax returns, excise tax returns, and assistance with distribution calculations. |
Fund | 2022 | 2023 |
The Brown Capital Management Small Company Fund | $2,500 | $3,000 |
The Brown Capital Management International All Company Fund | $2,500 | $3,000 |
The Brown Capital Management Mid Company Fund | $2,500 | $3,000 |
The Brown Capital Management International Small Company Fund | $2,500 | $3,000 |
(d) | All Other Fees –There were no other fees billed by the Accountants, which were not disclosed in Items (a) through (c) above during the last two fiscal years. |
(e)(1) | The registrant’s Board of Trustees pre-approved the engagement of the Accountants for each of the last two fiscal years at meetings of the audit and compliance committee of the Board of Trustees called for such purpose and will pre-approve any future engagements of the Accountant for each fiscal year thereafter at audit and compliance committee meetings called for such purpose. The charter of the audit and compliance committee states that the committee should pre-approve any audit services and, when appropriate, evaluate and pre-approve any non-audit services provided by the Accountant to the registrant and to pre-approve, when appropriate, any non-audit services provided by the Accountant to the registrant’s investment adviser, or any entity controlling, controlled by, or under common control with the investment adviser that provides ongoing services to the registrant if the engagement relates directly to the operations and financial reporting of the registrant. |
(2) | There were no services as described in each of paragraph (b) through (d) of this Item that were approved by the audit committee pursuant to paragraph (c)(7)(i)(C) of Rule 2-01 of Regulation S-X. |
(f) | Not Applicable. |
(g) | Aggregate non-audit fees billed by the Accountants to the registrant for services rendered during the fiscal years ended March 31, 2022 were $10,000 and March 31, 2023 are $12,000. There were no non-audit fees billed by the Accountants for services rendered to the registrant’s investment advisers, or any other entity controlling, controlled by, or under common control with the registrant’s investment advisers. |
(h) | Not applicable. |
(i) | Not applicable. |
(j) | Not applicable. |
Item 5. | AUDIT COMMITTEE OF LISTED REGISTRANTS. |
Not applicable.
Item 6. | SCHEDULE OF INVESTMENTS. |
A copy of the schedule of investments of unaffiliated issuers as of the close of the reporting period is included as part of the report to shareholders filed under Item 1 of this Form.
Item 7. | DISCLOSURE OF PROXY VOTING POLICIES AND PROCEDURES FOR CLOSED-END MANAGEMENT INVESTMENT COMPANIES. |
Not applicable.
Item 8. | PORTFOLIO MANAGERS OF CLOSED-END MANAGEMENT INVESTMENT COMPANIES. |
Not applicable.
Item 9. | PURCHASES OF EQUITY SECURITIES BY CLOSED-END MANAGEMENT INVESTMENT COMPANY AND AFFILIATED PURCHASERS. |
Not applicable.
Item 10. | SUBMISSION OF MATTERS TO A VOTE OF SECURITYHOLDERS. |
None.
Item 11. | CONTROLS AND PROCEDURES. |
(a) | The registrant’s principal executive officer and principal financial officer have concluded that the registrant’s disclosure controls and procedures (as defined in Rule 30a-3(c) under the Investment Company Act of 1940, as amended) are effective based on their evaluation of these disclosure controls and procedures (as required by Rule 30a-3(b) under the Investment Company Act of 1940, as amended) as of a date within 90 days of the filing of this report. |
(b) | There were no changes in the registrant’s internal control over financial reporting (as defined in Rule 30a-3(d) under the Investment Company Act of 1940, as amended) that occurred during the period covered by this report that have materially affected, or are reasonably likely to materially affect, the registrant’s internal control over financial reporting. |
Item 12. | DISCLOSURE OF SECURITIES LENDING ACTIVITIES FOR CLOSED-END MANAGEMENT INVESTMENT COMPANIES. |
Not applicable to the registrant. The Brown Capital Management Funds are open-end management investment companies.
Item 13. | EXHIBITS. |
(a)(1) | Code of Ethics required by Item 2 of Form N-CSR is filed herewith as Exhibit 13.(a)(1). |
(a)(2) | Certifications required by Item 13.(a)(2) of Form N-CSR are filed herewith as Exhibit 13.(a)(2). |
(a)(3) | Not applicable. |
(a)(4) | Change in registrant’s independent public account: |
On March 13, 2023, BBD LLP (“BBD”) ceased to serve as the independent registered public accounting firm of Brown Capital Management Small Company Fund, Brown Capital Management Mid Company Fund, Brown Capital Management International All Company Fund and Brown Capital Management International Small Company Fund (the “Funds”), each a series of Brown Capital Management Mutual Funds (The “Trust”). The Audit Committee of the Board of Trustees approved the replacement of BBD as a result of Cohen & Company, Ltd.’s (“Cohen”) acquisition of BBD’s investment management group.
The reports of BBD on the financial statements of the Funds as of and for the fiscal years ended March 31, 2022 and March 31, 2021 did not contain an adverse opinion or a disclaimer of opinion, and were not qualified or modified as to uncertainties, audit scope or accounting principles. During the fiscal years March 31, 2022 and March 31, 2021: (i) there were no disagreements between the registrant and BBD on any matter of accounting principles or practices, financial statement disclosure, or auditing scope or procedure, which disagreements, if not resolved to the satisfaction of BBD, would have caused it to make reference to the subject matter of the disagreements in its reports on the financial statements of the Funds for such years; and (ii) there were no “reportable events,” as defined in Item 304(a)(1)(v) of Regulation S-K under the Securities Exchange Act of 1934, as amended.
The registrant requested that BBD furnish it with a letter addressed to the U.S. Securities and Exchange Commission stating that it agrees with the above statements. A copy of such letter is filed as an exhibit hereto.
On March 22, 2023, the Audit Committee of the Board of Trustees recommended and approved the appointment of Cohen as the Funds’ independent registered public accounting firm for the fiscal year ending March 31, 2023 and March 31, 2024.
During the fiscal years ended March 31, 2022 and March 31, 2021, neither the registrant, nor anyone acting on its behalf, consulted with Cohen on behalf of the Funds regarding the application of accounting principles to a specified transaction (either completed or proposed), the type of audit opinion that might be rendered on the Funds’ financial statements, or any matter that was either: (i) the subject of a “disagreement,” as defined in Item 304(a)(1)(iv) of Regulation S-K and the instructions thereto; or (ii) “reportable events,” as defined in Item 304(a)(1)(v) of Regulation S-K.
(b) | Certifications required by Item 13.(b) of Form N-CSR are filed herewith as Exhibit 13.(b). |
SIGNATURES
Pursuant to the requirements of the Securities Exchange Act of 1934 and the Investment Company Act of 1940, the registrant has duly caused this report to be signed on its behalf by the undersigned, thereunto duly authorized.
Brown Capital Management Mutual Funds
By: (Signature and Title) | /s/ Robert L. Young, III Robert L. Young, III Trustee, President and Principal Executive Officer |
Date: June 6, 2023
Pursuant to the requirements of the Securities Exchange Act of 1934 and the Investment Company Act of 1940, this report has been signed below by the following persons on behalf of the registrant and in the capacities and on the dates indicated.
By: (Signature and Title) | /s/ Robert L. Young, III Robert L. Young, III Trustee, President and Principal Executive Officer Brown Capital Management Mutual Funds |
Date: June 6, 2023
By: (Signature and Title)
| /s/ Michael L. Forster Michael L. Forster Treasurer and Principal Financial Officer Brown Capital Management Mutual Funds |
Date: June 6, 2023