UNITED STATES
SECURITIES AND EXCHANGE COMMISSION
Washington, D.C. 20549
FORM N-CSR
CERTIFIED SHAREHOLDER REPORT OF
REGISTERED MANAGEMENT INVESTMENT COMPANIES
Investment Company Act file number: 811-06223
Legg Mason
Tax Free Income Fund
Name of Fund:
55 Water Street, New York NY 10041
Address of Principal Executive Offices:
Robert I. Frenkel, Esq.
Legg Mason & Co., LLC
100 First Stamford Place
Stamford, CT 06902
Name and address of agent for service:
Registrant’s telephone number, including area code:
Funds Investor Services 1-800-822-5544
or
Institutional Shareholder Services 1-888-425-6432
Date of fiscal year end: March 31
Date of reporting period: September 30, 2009
| Item 1. | Semi-Annual Report to Shareholders |
Legg Mason Investment Counsel
Maryland Tax-Free Income Trust
Investment Commentary and Semi-Annual Report to Shareholders September 30, 2009

Fund Name Change
Prior to October 5, 2009, the Fund was known as Legg Mason Maryland Tax-Free Income Trust. There was no change in the Fund’s investment objective or investment policies as a result of the name change.
Legg Mason Investment Counsel Maryland Tax-Free Income Trust
Total returns for the Fund for various periods ended September 30, 2009 are presented below, along with those of comparative indices:
| | | | | | | | | | |
| | | | | Average Annual Total Returns |
| | | Six
Months | | One
Year | | Five
Years | | Ten
Years | | Since
Inception |
Without Sales Charges | | | | | | | | | | |
Class A* | | 9.10% | | 13.74% | | 4.36% | | 5.24% | | 5.73% |
Class C | | 8.77% | | N/A | | N/A | | N/A | | 9.35% |
Class I* | | 9.29% | | 14.00% | | N/A | | N/A | | 9.34% |
Barclays Capital Municipal Bond IndexA | | 9.38% | | 14.85% | | 4.78% | | 5.77% | | 6.32% |
Lipper Maryland Municipal Debt Funds Category AverageB | | 13.49% | | 13.34% | | 3.51% | | 4.71% | | 5.49% |
| | | | | |
With Sales Charges | | | | | | | | | | |
Class A* | | 4.47% | | 8.90% | | 3.46% | | 4.79% | | 5.48% |
Class C | | 7.77% | | N/A | | N/A | | N/A | | 8.35% |
Class I* | | 9.29% | | 14.00% | | N/A | | N/A | | 9.34% |
The performance data quoted represent past performance and do not guarantee future results. Current performance may be lower or higher than the performance data quoted. To obtain performance data current to the most recent month-end, please visit our website at www.leggmason.com/individualinvestors. The investment return and principal value of the Fund will fluctuate so that an investor’s shares, when redeemed, may be worth more or less than the original cost. Calculations assume the reinvestment of dividends and capital gain distributions. Performance would have been lower if fees and expenses had not been waived and/or reimbursed in various periods. Performance figures for periods shorter than one year represent cumulative figures and are not annualized. Please note that Class C has been in existence for less than one year. Results for longer periods may differ, in some cases, substantially.
For performance data including the effects of sales charges, Class A shares reflect the deduction of a maximum initial sales charge of 4.25%, and Class C shares reflect the deduction of a contingent deferred sales charge of 1.00%, which applies if shares are redeemed within one year of purchase.
The inception dates of Classes A, C and I are May 1, 1991, February 5, 2009 and July 30, 2008, respectively. The Index return is for the period beginning April 30, 1991. The Lipper return is for the period beginning April 30, 1991. All Index performance reflects no deduction for fees, expenses or taxes. Please note that an investor cannot invest directly in an index.
The Investment Commentary is not a part of the Semi-Annual Report to Shareholders.
| | |
Investment Commentary | | iii |
The gross expense ratios for Classes A, C and I were 1.03%, 1.99% and 1.22%, respectively, as indicated in the Fund’s most current prospectus dated August 1, 2009. These expenses include management fees, 12b-1 distribution and/or service fees and other expenses. As a result of expense limitations, the ratio of expenses, other than interest, brokerage, taxes and extraordinary expenses, to average net assets will not exceed 0.70% for Class A shares, 1.25% for Class C shares and 0.45% for Class I shares. These expense limitations may be reduced or terminated at any time.
Actual expenses may be higher. For example, expenses may be higher than those shown if average net assets decrease. Net assets are more likely to decrease and Fund expense ratios are more likely to increase when markets are volatile.
* Prior to February 1, 2009, Class A was known as the Primary Class. In addition, on February 1, 2009, the class lowered its 12b-1 fee and began to charge an initial sales charge on sales made on and after that date. Prior to October 5, 2009, Class I was known as the Institutional Class.
For the six months ended September 30, 2009, Class A shares of Legg Mason Investment Counsel Maryland Tax-Free Income Trust, excluding sales charges, returned 9.10%. The Fund’s unmanaged benchmark, the Barclays Capital Municipal Bond Index, returned 9.38% for the same period. The Lipper Maryland Municipal Debt Funds Category Average returned 13.49% over the same time frame.
Municipal bonds provided solid returns over the past six months. The dislocations that hindered returns in 2008 appeared to be predominantly resolved with the extinction of the auction rate preferred market and the forced selling among leveraged hedge funds running its course. Many factors have buoyed tax-free bonds of late. After being sellers last year due to heavy investor withdrawals, municipal bond mutual funds have experienced record inflows calendar year-to-date through September 30th. Individual investors facing higher tax rates appear to be more comfortable with municipal credit quality following the passage of the American Recovery & Reinvestment Act, the stimulus plan crafted by the Obama Administration in February. In addition, the surge of borrowing feared by many failed to materialize, creating a shortage of bonds in many states, including Maryland, where issuance is down 44.1% calendar year-to-date through September 30, 2009 versus the same period in 2008.
The supply shortfall is attributable to many factors. While borrowing costs for high-quality issuers dropped considerably, spreads on lower-quality names remained elevated, forcing many to postpone borrowing plans for the time being. The Health Care and Hospital sector, typically a large issuer in the municipal market, is the most notable example with a 37.8% drop in new deals January 1, 2009 through September 30th versus the same period in 2008.C Also, an innovative new security structure called the “Build America Bond” program allowed municipalities, as well as
The Investment Commentary is not a part of the Semi-Annual Report to Shareholders.
certain public education facilities, to funnel much of their issuance for capital projects into the taxable bond market tapping a deeper, institutional buyer base. While paying a higher “taxable” coupon, the issuer receives a 35% subsidy from the federal government, resulting in lower net borrowing costs than could be achieved in the traditional municipal market. The popularity of the program has resulted in fewer deals in the tax-free market in tandem with a revival of demand from individuals facing higher taxes, keeping yields in check.
Despite flagging tax revenues and softer credit metrics, the rally in the tax-free market remained unrelenting. Tax revenues were down a record 16.6% in the second quarter of 2009, following a disappointing 11.7% annual drop in the first quarter. Although Maryland has fared better than the nation as a whole, the state still expects a 2010 budget deficit nearing $2 billion, and cuts in government services and employment persist. Many states, including Maryland, balanced their budgets with the generous American Recovery & Reinvestment Act that funneled much of the stimulus funds through the states in the form of Medicaid dollars, as well as infrastructure and K-12 education funds. Those funds are set to be withdrawn at the end of 2010, and we believe it is unlikely that the economy will have grown sufficiently by then to absorb these structural deficits, especially considering tax revenue lags economic activity. It seems likely that aid to the states will be extended if necessary since President Obama will still be in office and mid-term elections would be contentious should drastic service cuts continue.
Nonetheless, we remain cautious in the current environment. Absolute yields now reside at multi-year lows on longer maturities and at all-time lows on the shortest maturities, compared to yields approaching the highest of the decade at the beginning of the year. With municipals now at fair value relative to Treasuries, the path of Treasury yields will now determine the fate of the municipal market. Thus far, Treasury yields remain well behaved, which is somewhat surprising given the Treasury’s borrowing needs. While a slow, albeit recovering economy and a weak pricing environment would normally argue for lower rates, we anticipated the principal buyers at auctions, primarily foreign central banks, would require higher yields to absorb the volume of bonds. In addition, we also believed the tapering off of the $300 billion program designed by the Federal Reserve Board (“Fed”)D to reduce the supply of Treasuries would push rates modestly higher. Until recently, this had not been the case. Nonetheless, with Treasury issuance this year and next expected to be nearly four times 2008 levels, we are positioning the Fund more defensively and remain committed to a high-quality portfolio given the stress on the local government sector.
R. Scott Pierce, CFA
October 16, 2009
The Investment Commentary is not a part of the Semi-Annual Report to Shareholders.
Investment risks: All investments involve risk, including the loss of principal. Bonds are subject to a variety of risks including interest rate, credit and inflation risk. As interest rates rise, bond prices fall, reducing the value of a fixed-income investment. Past performance is no guarantee of future results.
As a “non-diversified” fund, an investment in the Fund will entail greater price risk than an investment in a diversified fund because a higher percentage of investments among fewer issuers may result in greater fluctuation in the total market value of the Fund’s portfolio. An investor may be subject to the federal alternative minimum tax, and state and local taxes may apply. Capital gains, if any, are fully taxable. Please see the Fund’s prospectus for more information on these and other risks.
The views expressed in this commentary reflect those solely of the portfolio manager as of the date of this commentary and may differ from those of Legg Mason, Inc. as a whole or the other portfolio managers of its affiliates. Any such views are subject to change at any time based on market or other conditions, and the portfolio manager, Legg Mason Investment Counsel Maryland Tax-Free Income Trust and Legg Mason Investor Services, LLC disclaim any responsibility to update such views. These views are not intended to be a forecast of future events, a guarantee of future results or investment advice. Because investment decisions for the Legg Mason Funds are based on numerous factors, these views may not be relied upon as an indication of trading intent on behalf of any Legg Mason Fund. The information contained herein has been prepared from sources believed to be reliable, but is not guaranteed by the portfolio manager, Legg Mason Investment Counsel Maryland Tax-Free Income Trust or Legg Mason Investor Services, LLC as to its accuracy or completeness. Predictions are inherently limited and should not be relied upon as an indication of actual or future performance.
Please note that an investor cannot invest directly in an index.
| A | The Barclays Capital Municipal Bond Index is a market value weighted index of investment grade municipal bonds with maturities of one year or more. |
| B | Lipper, Inc., a wholly-owned subsidiary of Reuters, provides independent insight on global collective investments. The Lipper Maryland Municipal Debt Funds Category Average is comprised of the Fund’s peer group of mutual funds. |
| C | Source: The Bond Buyer, October 1, 2009. |
| D | The Federal Reserve Board (“Fed”) is responsible for the formulation of policies designed to promote economic growth, full employment, stable prices and a sustainable pattern of international trade and payments. |
The Investment Commentary is not a part of the Semi-Annual Report to Shareholders.
Semi-Annual Report to Shareholders
Legg Mason Investment Counsel
Maryland Tax-Free Income Trust
September 30, 2009
| | |
Semi-Annual Report to Shareholders | | 1 |
To Our Shareholders,
We are pleased to provide you with Legg Mason Investment Counsel Maryland Tax-Free Income Trust’s semi-annual report for the six months ended September 30, 2009.
The following table summarizes key statistics for the Fund as of September 30, 2009:
| | | | | |
| | | Six-Month Total Return
(excluding sales charges) | | Net Asset Value
Per Share |
Class A* | | 9.10% | | $ | 16.66 |
Class C | | 8.77% | | $ | 16.66 |
Class I* | | 9.29% | | $ | 16.67 |
The performance data quoted represent past performance and do not guarantee future results. Current performance may be lower or higher than the performance data quoted. To obtain performance data current to the most recent month-end, please visit our website at www.leggmason.com/individualinvestors. The investment return, yield and principal value of the Fund will fluctuate so that an investor’s shares, when redeemed, may be worth more or less than the original cost. Calculations assume the reinvestment of dividends and capital gain distributions. Returns have not been adjusted to include sales charges that may apply or the deduction of taxes that a shareholder would pay on Fund distributions. If sales charges were reflected, the performance quoted would be lower. Performance would have been lower if fees and expenses had not been waived and/or reimbursed in various periods. Performance figures for periods shorter than one year represent cumulative figures and are not annualized.
The 30-Day SEC Yields for the period ended September 30, 2009 for the Class A, C and I shares were 2.99%, 2.55% and 3.35%, respectively. Current expense reimbursements and/or fee waivers are voluntary and may be reduced or terminated at any time. Absent current expense reimbursements and/or fee waivers, the 30-Day SEC Yields for Class A, C and I shares would have been 2.80%, 2.15% and 2.87%, respectively. The 30-Day SEC Yield is the average annualized net investment income per share for the 30-day period indicated and is subject to change.
* Prior to February 1, 2009, Class A was known as the Primary Class. In addition, on February 1, 2009, the class lowered its 12b-1 fee and began to charge an initial sales charge on sales made on and after that date. Prior to October 5, 2009, Class I was known as the Institutional Class.
| | |
2 | | Semi-Annual Report to Shareholders |
The Fund may purchase only securities which have received investment grade ratings from Moody’s Investors Service or Standard & Poor’s or which are judged by the investment adviser to be of comparable quality. Moody’s ratings of the portfolio as of September 30, 2009 are:
| | |
| | | Maryland Tax-Free
Income Trust |
Aaa | | 26.5% |
Aa | | 24.8% |
A | | 24.7% |
Baa | | 11.2% |
Cash | | 11.1% |
Not Rated | | 1.7% |
Dramatically higher volatility in the financial markets has been very challenging for many investors. Market movements have been rapid — sometimes in reaction to economic news, and sometimes creating the news. In the midst of this evolving market environment, we at Legg Mason want to do everything we can to help you reach your financial goals. Now, as always, we remain committed to providing you with excellent service and a full spectrum of investment choices. Rest assured, we will continue to work hard to ensure that our investment managers make every effort to deliver strong long-term results.
We also remain committed to supplementing the support you receive from your financial advisor. One way we accomplish this is through our enhanced website, www.leggmason.com/individualinvestors. Here you can gain immediate access to many special features to help guide you through difficult times, including:
| | • | | Fund prices and performance, |
| | • | | Market insights and commentaries from our portfolio managers, and |
| | • | | A host of educational resources. |
During periods of market unrest, it is especially important to work closely with your financial advisor and remember that reaching one’s investment goals unfolds over time and through multiple market cycles. Time and again, history has shown that, over the long run, the markets have eventually recovered and grown.
Information about the Fund’s performance over longer periods of time is shown in the Performance Information section within this report. For more information about the Fund share classes included in this report, please contact your financial advisor.
Many Class A and Class C shareholders invest regularly in Fund shares on a dollar cost averaging basis. Most do so by authorizing automatic, monthly transfers of $50 or more from their bank checking or brokerage accounts. Dollar cost averaging is a convenient and sensible way to invest, as it encourages continued purchases over time regardless of fluctuating price levels. Of course, it does not ensure a profit nor protect
| | |
Semi-Annual Report to Shareholders | | 3 |
against declines in the value of your investment. Your financial advisor will be happy to help you establish a dollar cost averaging account should you wish to do so.
On behalf of the Board and the entire team at Legg Mason, we appreciate your support.
| | |
Sincerely, 
| | 
|
Mark R. Fetting Chairman | | David Odenath President |
October 30, 2009
| | |
4 | | Semi-Annual Report to Shareholders |
Expense Example (Unaudited)
Legg Mason Investment Counsel Maryland Tax-Free Income Trust
As a shareholder of the Fund, you may incur two types of costs: (1) transaction costs, including front-end and back-end sales charges (loads) on purchase payments; and (2) ongoing costs, including management fees; distribution and/or service (12b-1) fees; and other Fund expenses. This example is intended to help you understand your ongoing costs (in dollars) of investing in the Fund and to compare these costs with the ongoing costs of investing in other mutual funds.
This example is based on an investment of $1,000 invested on April 1, 2009 and held through September 30, 2009. The ending values assume dividends were reinvested at the time they were paid.
Actual Expenses
The first line for each class in the table on the next page provides information about actual account values and actual expenses. You may use the information in this line, together with the amount you invested, to estimate the expenses that you paid over the period. Simply divide your account value by $1,000 (for example, an $8,600 account value divided by $1,000 = 8.6), then multiply the result by the number in the first line for the Fund under the heading entitled “Expenses Paid During the Period” to estimate the expenses you paid on your account if your shares were held through the entire period.
Hypothetical Example for Comparison Purposes
The second line for each class in the table on the next page provides information about hypothetical account values and hypothetical expenses based on the relevant class’s actual expense ratio and an assumed rate of return of 5% per year before expenses, which is not the class’s actual return. The hypothetical account values and expenses may not be used to estimate the actual ending account balance or expenses you paid for the period. You may use this information to compare the ongoing costs of investing in the Fund and other funds. To do so, compare these 5% hypothetical examples, with the 5% hypothetical examples for the relevant class that appear in the shareholder reports of other funds. Because the example is intended to be comparable to the examples provided by other funds, it is based on a hypothetical investment of $1,000 invested on April 1, 2009 and held through September 30, 2009. The ending values assume dividends were reinvested at the time they were paid.
| | |
Semi-Annual Report to Shareholders | | 5 |
Please note that the expenses shown in the table are meant to highlight your ongoing costs only and do not reflect any transactional costs, such as front-end or back-end sales charges (loads). Therefore the second line for each class of the table is useful in comparing ongoing costs only, and will not help you determine the relative total costs of owning different funds. In addition, if these transactional costs were included, your costs would have been higher.
| | | | | | | | | | | |
| | | Beginning
Account
Value
4/1/09 | | | Ending
Account
Value
9/30/09 | | Expenses Paid
During the
Period1
4/1/09-9/30/09 | |
Class A: | | | | | | | | | | | |
Actual | | $ | 1,000.00 | | | $ | 1,091.00 | | $ | 3.51 | |
Hypothetical (5% return before expenses) | | | 1,000.00 | | | | 1,021.71 | | | 3.40 | |
Class C: | | | | | | | | | | | |
Actual | | $ | 1,000.00 | | | $ | 1,087.70 | | $ | 6.54 | |
Hypothetical (5% return before expenses) | | | 1,000.00 | | | | 1,018.80 | | | 6.33 | |
Class I2: | | | | | | | | | | | |
Actual | | $ | 1,000.00 | | | $ | 1,092.90 | | $ | 2.36 | |
Hypothetical (5% return before expenses) | | | 1,000.00 | | | | 1,022.81 | | | 2.28 | |
| 1 | These calculations are based on expenses incurred in the most recent fiscal half year. The dollar amount shown as “Expenses Paid” is equal to the annualized expense ratio of 0.67%, 1.25% and 0.45% for the Class A, Class C and Class I shares, respectively, multiplied by the average values over the period, multiplied by the number of days in the most recent fiscal half-year (183) and divided by 365. |
| 2 | Effective October 5, 2009, Institutional Class shares were renamed Class I shares. |
| | |
6 | | Semi-Annual Report to Shareholders |
Performance Information (Unaudited)
Fund Performance
| | | | | | | | | |
Average Annual Total Returns1 | | | |
| | | Without Sales Charges2 | |
| | | Class A | | | Class C | | | Class I3 | |
Six Months Ended 9/30/09 | | 9.10 | %† | | 8.77 | %† | | 9.29 | %† |
Twelve Months Ended 9/30/09 | | 13.74 | | | N/A | | | 14.00 | |
Five Years Ended 9/30/09 | | 4.36 | | | N/A | | | N/A | |
Ten Years Ended 9/30/09 | | 5.24 | | | N/A | | | N/A | |
Inception* through 9/30/09 | | 5.73 | | | 9.35 | † | | 9.34 | |
| |
| | | With Sales Charges4 | |
| | | Class A | | | Class C | | | Class I3 | |
Six Months Ended 9/30/09 | | 4.47 | %† | | 7.77 | %† | | 9.29 | %† |
Twelve Months Ended 9/30/09 | | 8.90 | | | N/A | | | 14.00 | |
Five Years Ended 9/30/09 | | 3.46 | | | N/A | | | N/A | |
Ten Years Ended 9/30/09 | | 4.79 | | | N/A | | | N/A | |
Inception* through 9/30/09 | | 5.48 | | | 8.35 | † | | 9.34 | |
| | | |
Cumulative Total Returns1 | | | |
| | | Without Sales Charges2 | |
Class A (9/30/99 through 9/30/09) | | 66.69 | % |
Class C (Inception date of 2/5/09 through 9/30/09) | | 9.35 | |
Class I (Inception date of 7/30/08 through 9/30/09) | | 11.01 | |
| 1 | All figures represent past performance and are not a guarantee of future results. Investment return and principal value of an investment will fluctuate so that an investor’s shares, when redeemed, may be worth more or less than their original cost. Total returns shown do not reflect the deduction of taxes that a shareholder would pay on Fund distributions or the redemption of Fund shares. Performance figures may reflect fee waivers and/or expense reimbursements. In the absence of fee waivers and/or expense reimbursements, the total return would have been lower. |
| 2 | Assumes the reinvestment of all distributions, including returns of capital, if any, at net asset value and does not reflect the deduction of the applicable sales charge with respect to Class A shares or the applicable contingent deferred sales charge (“CDSC”) with respect to Class C shares. |
| 3 | Effective October 5, 2009, Institutional Class shares were renamed Class I shares. |
| 4 | Assumes the reinvestment of all distributions, including returns of capital, if any, at net asset value. In addition, Class A shares reflect the deduction of the maximum initial sales charge of 4.25%. Class C shares reflect the deduction of 1.00% CDSC, which applies if shares are redeemed within one year from purchase payment. |
| * | Inception dates for Class A, Class C and Class I shares are May 1, 1991, February 5, 2009 and July 30, 2008, respectively. |
| | |
Semi-Annual Report to Shareholders | | 7 |
Legg Mason Investment Counsel Maryland Tax-Free Income Trust
The graphs on the following pages compare the Fund’s Class A, Class C and Class I1 shares’ total returns to those of the Barclays Capital Municipal Bond Index. The graph illustrates the cumulative total return of an initial $10,000 investment in Class A and Class C and an initial $1,000,000 investment in Class I, for the periods indicated. The lines for the Fund represent the total return after deducting all Fund investment management and other administrative expenses and the transaction costs of buying and selling portfolio securities. The lines representing the securities market index do not take into account any transaction costs associated with buying and selling portfolio securities in the index or other administrative expenses.
Total return measures investment performance in terms of appreciation or depreciation in a fund’s net asset value per share, plus dividends and any capital gain distributions. Both the Fund’s results and the Index’s results assume the reinvestment of all dividends and distributions at the time they were paid. Average annual returns tend to smooth out variations in a fund’s return, so that they differ from actual year-to-year results.
| 1 | Effective October 5, 2009, Institutional Class shares were renamed Class I shares. |
| | |
8 | | Semi-Annual Report to Shareholders |
Performance Information (Unaudited) — Continued
Growth of a $10,000 Investment — Class A Shares
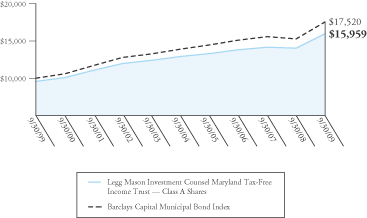
Hypothetical illustration of $10,000 invested in Class A shares on September 30, 1999, assuming the deduction of the maximum initial sales charge of 4.25% at the time of investment and the reinvestment of all distributions, including returns of capital, if any, at net asset value through September 30, 2009. The performance data quoted represent past performance and do not guarantee future results. The performance stated may have been due to extraordinary market conditions, which may not be duplicated in the future. Current performance may be lower or higher than the performance data quoted. To obtain the most recent month-end performance information, please visit www.leggmason.com/individualinvestors. The investment return and principal value of the Fund will fluctuate so that an investor’s shares, when redeemed, may be worth more or less than the original cost. Performance would have been lower if fees and expenses had not been waived and/or reimbursed in various periods. Performance for other share classes will vary due to differences in sales charge structure and class expenses.
The graph does not reflect the deduction of taxes that a shareholder would pay on Fund distributions or the redemption of Fund shares.
| | |
Semi-Annual Report to Shareholders | | 9 |
Growth of a $10,000 Investment — Class C Shares
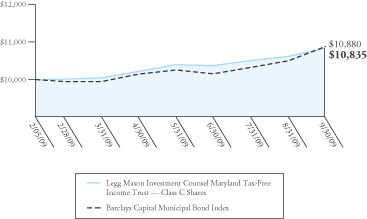
Hypothetical illustration of $10,000 invested in Class C shares on February 5, 2009 (commencement of operations), assuming the reinvestment of all distributions, including returns of capital, if any, at net asset value through September 30, 2009. The performance data quoted represent past performance and do not guarantee future results. The performance stated may have been due to extraordinary market conditions, which may not be duplicated in the future. Current performance may be lower or higher than the performance data quoted. To obtain the most recent month-end performance information, please visit www.leggmason.com/individualinvestors. The investment return and principal value of the Fund will fluctuate so that an investor’s shares, when redeemed, may be worth more or less than the original cost. Performance would have been lower if fees and expenses had not been waived and/or reimbursed in various periods. Performance for other share classes will vary due to differences in sales charge structure and class expenses.
The graph does not reflect the deduction of taxes that a shareholder would pay on Fund distributions or the redemption of Fund shares.
| | |
10 | | Semi-Annual Report to Shareholders |
Performance Information (Unaudited) — Continued
Growth of a $1,000,000 Investment — Class I1 Shares

Hypothetical illustration of $1,000,000 invested in Class I shares (formerly Institutional Class shares) on July 30, 2008 (commencement of operations), assuming the reinvestment of all distributions, including returns of capital, if any, at net asset value through September 30, 2009. The performance data quoted represent past performance and do not guarantee future results. The performance stated may have been due to extraordinary market conditions, which may not be duplicated in the future. Current performance may be lower or higher than the performance data quoted. To obtain the most recent month-end performance information, please visit www.leggmason.com/individualinvestors. The investment return and principal value of the Fund will fluctuate so that an investor’s shares, when redeemed, may be worth more or less than the original cost. Performance would have been lower if fees and expenses had not been waived and/or reimbursed in various periods. Performance for other share classes will vary due to differences in sales charge structure and class expenses.
The graph does not reflect the deduction of taxes that a shareholder would pay on Fund distributions or the redemption of Fund shares.
| 1 | Effective October 5, 2009, Institutional Class shares were renamed Class I shares. |
| | |
Semi-Annual Report to Shareholders | | 11 |
Portfolio of Investments
Legg Mason Investment Counsel Maryland Tax-Free Income Trust
September 30, 2009 (Unaudited)
| | | | | | | | | | | |
| | | Rate | | Maturity
Date | | Par | | Value | |
| | | | | | | | | | | |
Municipal Bonds — 89.2% | | | | | | | |
| | | | |
Maryland — 88.1% | | | | | | | | | | | |
Anne Arundel County, Maryland, GO Bonds, Consolidated General Improvement Bonds, Series 2007 | | 4.500% | | 3/1/23 | | $ | 1,000,000 | | $ | 1,094,060 | |
Baltimore County, Maryland, GO Bonds, Metropolitan District Bonds (70th Issue), | | 4.250% | | 9/1/26 | | | 1,000,000 | | | 1,050,010 | |
Baltimore County, Maryland, Revenue Bonds, (Oak Crest Village Inc.), Series 2007A | | 5.000% | | 1/1/22 | | | 1,550,000 | | | 1,600,220 | |
Baltimore County, Maryland, Revenue Bonds, Catholic Health Initiatives, Series 2006A | | 5.000% | | 9/1/20 | | | 1,050,000 | | | 1,137,129 | |
City of Annapolis, Maryland, Economic Development Revenue and Refunding Revenue Bonds (St. John's College Facility), | | | | | | | | | | | |
Series 1998 | | 5.500% | | 10/1/18 | | | 240,000 | | | 240,446 | |
Series 1998 | | 5.500% | | 10/1/23 | | | 490,000 | | | 491,210 | |
Series 2007B | | 5.000% | | 10/1/27 | | | 1,135,000 | | | 1,075,651 | |
Series B | | 5.000% | | 10/1/36 | | | 2,465,000 | | | 2,238,121 | |
City of Baltimore, Maryland, (Mayor and City Council of Baltimore), Project and Refunding Revenue Bonds (Wastewater Projects), Series 1994A (FGIC insured) | | 5.000% | | 7/1/22 | | | 1,910,000 | | | 2,064,462 | |
City of Baltimore, Maryland, (Mayor and City Council of Baltimore), Project and Refunding Revenue Bonds (Water Projects), | | | | | | | | | | | |
Series 1994A | | 5.000% | | 7/1/24 | | | 3,800,000 | | | 4,584,966 | A |
Series 1994A | | 5.000% | | 7/1/24 | | | 1,890,000 | | | 2,103,419 | |
| | |
12 | | Semi-Annual Report to Shareholders |
Portfolio of Investments — Continued
Legg Mason Investment Counsel Maryland Tax-Free Income Trust — Continued
| | | | | | | | | | |
| | | Rate | | Maturity
Date | | Par | | Value |
| | | | | | | | | | |
Maryland — Continued | | | | | | | | | | |
Series 2002A
(FGIC insured) | | 5.125% | | 7/1/42 | | $ | 1,000,000 | | $ | 1,023,890 |
City of Baltimore, Maryland, (Mayor and City Council of Baltimore), Project and Revenue Bonds (Wastewater Projects), Series 2008A (FSA insured) | | 5.000% | | 7/1/33 | | | 4,000,000 | | | 4,326,040 |
City of Baltimore, Maryland, Project Revenue Bonds, Series 2007 C (AMBAC insured) | | 5.000% | | 7/1/23 | | | 1,000,000 | | | 1,094,480 |
Community Development Administration, Maryland Department of Housing and Community Development Residential Revenue Bonds, | | | | | | | | | | |
Series 1999D AMT | | 5.375% | | 9/1/24 | | | 2,000,000 | | | 2,013,200 |
Series 2001B AMT | | 5.375% | | 9/1/22 | | | 310,000 | | | 311,900 |
Series 2001H AMT | | 5.200% | | 9/1/22 | | | 1,790,000 | | | 1,799,022 |
Series 2008 | | 5.375% | | 9/1/39 | | | 1,500,000 | | | 1,553,040 |
Series 2009A | | 4.750% | | 9/1/29 | | | 1,000,000 | | | 1,017,400 |
Series 2009A | | 5.050% | | 9/1/39 | | | 1,980,000 | | | 2,006,849 |
Series 2009B | | 4.500% | | 9/1/29 | | | 2,490,000 | | | 2,498,989 |
Community Development Administration, Maryland Department of Housing and Community Development Residential Revenue Bonds, Capital Funding Securitization, Series 2008 (FSA insured) | | 4.400% | | 7/1/21 | | | 1,000,000 | | | 1,033,370 |
Department of Transportation of Maryland, Consolidated Transportation Bonds, Series 2002 | | 5.500% | | 2/1/15 | | | 3,000,000 | | | 3,547,500 |
Frederick County, Maryland, GO Bonds, Public Facilities Refunding Bonds, Series 1998A | | 5.000% | | 7/1/15 | | | 1,000,000 | | | 1,164,810 |
| | |
Semi-Annual Report to Shareholders | | 13 |
| | | | | | | | | | |
| | | Rate | | Maturity
Date | | Par | | Value |
| | | | | | | | | | |
Maryland — Continued | | | | | | | | | | |
Howard County, Maryland, GO Bonds, Consolidated Public Improvement Project and Refunding Bonds, Series 2004A | | 5.000% | | 8/15/19 | | $ | 1,000,000 | | $ | 1,209,480 |
IDA of Prince George's County, Maryland, Subordinated Lease Revenue Bonds (Upper Marlboro Justice Center Expansion Project), (NATL insured), | | | | | | | | | | |
Series 2003B | | 5.125% | | 6/30/15 | | | 3,340,000 | | | 3,727,908 |
Series 2003B | | 5.000% | | 6/30/19 | | | 1,000,000 | | | 1,092,350 |
Maryland Economic Development Corporation, Economic Development Revenue (Lutheran World Relief Inc. and Immigration and Refugee Service), Series 2007 | | 5.250% | | 4/1/29 | | | 565,000 | | | 530,027 |
Maryland Economic Development Corporation, Student Housing Revenue Bonds (University of Maryland, College Park Project), | | | | | | | | | | |
Series 2008 | | 5.750% | | 6/1/33 | | | 500,000 | | | 507,100 |
Series 2008 | | 5.800% | | 6/1/38 | | | 1,500,000 | | | 1,521,255 |
Maryland Economic Development Corporation, Utility Infrastructure Revenue Bonds (University of Maryland, College Park Project), Series 2001 (AMBAC insured) | | 5.375% | | 7/1/16 | | | 985,000 | | | 1,034,408 |
Maryland Health and Higher Educational Facilities Authority, Refunding Revenue Bonds, Kennedy Krieger Issue, Series 1997 | | 5.125% | | 7/1/22 | | | 3,000,000 | | | 2,847,600 |
| | |
14 | | Semi-Annual Report to Shareholders |
Portfolio of Investments — Continued
Legg Mason Investment Counsel Maryland Tax-Free Income Trust — Continued
| | | | | | | | | | |
| | | Rate | | Maturity
Date | | Par | | Value |
| | | | | | | | | | |
Maryland — Continued | | | | | | | | | | |
Maryland Health and Higher Educational Facilities Authority, Refunding Revenue Bonds, Maryland Institute College of Art Issue,
Series 2007 | | 5.000% | | 6/1/36 | | $ | 5,000,000 | | $ | 4,216,200 |
Maryland Health and Higher Educational Facilities Authority, Refunding Revenue Bonds, MedStar Health Issue, Series 2004 | | 5.500% | | 8/15/25 | | | 785,000 | | | 814,375 |
Maryland Health and Higher Educational Facilities Authority, Revenue Bonds, Anne Arundel Health System Series 2009A | | 6.750% | | 7/1/29 | | | 2,000,000 | | | 2,375,840 |
Maryland Health and Higher Educational Facilities Authority, Revenue Bonds, Board of Child Care Issue, Series 2002 | | 5.500% | | 7/1/18 | | | 1,110,000 | | | 1,170,106 |
Maryland Health and Higher Educational Facilities Authority, Revenue Bonds, Calvert Health Systems Issue, Series 2004 | | 5.500% | | 7/1/39 | | | 2,000,000 | | | 2,018,900 |
Maryland Health and Higher Educational Facilities Authority, Revenue Bonds, Carroll County General Hospital Issue, | | | | | | | | | | |
Series 2002 | | 5.750% | | 7/1/22 | | | 1,000,000 | | | 1,047,360 |
Series 2002 | | 6.000% | | 7/1/26 | | | 2,000,000 | | | 2,087,920 |
Series 2002 | | 5.750% | | 7/1/27 | | | 1,050,000 | | | 1,083,936 |
Series 2002 | | 5.800% | | 7/1/32 | | | 2,000,000 | | | 2,051,620 |
Series 2002 | | 6.000% | | 7/1/37 | | | 1,000,000 | | | 1,024,440 |
Maryland Health and Higher Educational Facilities Authority, Revenue Bonds, College of Notre Dame of Maryland Issue, Series 1998 (NATL insured) | | 5.300% | | 10/1/18 | | | 925,000 | | | 1,058,357 |
| | |
Semi-Annual Report to Shareholders | | 15 |
| | | | | | | | | | | |
| | | Rate | | Maturity
Date | | Par | | Value | |
| | | | | | | | | | | |
Maryland — Continued | | | | | | | | | | | |
Maryland Health and Higher Educational Facilities Authority, Revenue Bonds, Hebrew Home of Greater Washington Issue,
Series 2002 | | 5.800% | | 1/1/32 | | $ | 2,250,000 | | $ | 2,272,297 | |
Maryland Health and Higher Educational Facilities Authority, Revenue Bonds, Helix Health Issue, | | | | | | | | | | | |
Series 1997
(AMBAC insured) | | 5.125% | | 7/1/11 | | | 2,000,000 | | | 2,147,600 | A |
Series 1998
(AMBAC insured) | | 5.250% | | 8/15/38 | | | 3,000,000 | | | 3,109,950 | |
Maryland Health and Higher Educational Facilities Authority, Revenue Bonds, Howard County General Hospital Issue, Series 1993 | | 5.500% | | 7/1/21 | | | 2,825,000 | | | 3,176,486 | A |
Maryland Health and Higher Educational Facilities Authority, Revenue Bonds, Johns Hopkins Medicine, Howard County General Hospital Acquisition Issue, Series 1998 (NATL insured) | | 5.000% | | 7/1/29 | | | 2,000,000 | | | 1,987,440 | |
Maryland Health and Higher Educational Facilities Authority, Revenue Bonds, LifeBridge Health Issue,
Series 2004A
(Pre-refunded 7/1/14) | | 5.250% | | 7/1/18 | | | 1,640,000 | | | 1,899,087 | B |
Maryland Health and Higher Educational Facilities Authority, Revenue Bonds, Loyola College Issue,
Series 2006A | | 5.000% | | 10/1/40 | | | 2,000,000 | | | 2,045,660 | |
| | |
16 | | Semi-Annual Report to Shareholders |
Portfolio of Investments — Continued
Legg Mason Investment Counsel Maryland Tax-Free Income Trust — Continued
| | | | | | | | | | | |
| | | Rate | | Maturity
Date | | Par | | Value | |
| | | | | | | | | | | |
Maryland — Continued | | | | | | | | | | | |
Maryland Health and Higher Educational Facilities Authority, Revenue Bonds, Maryland Institute College of Art Series 2007 | | 5.000% | | 6/1/42 | | $ | 800,000 | | $ | 665,216 | |
Maryland Health and Higher Educational Facilities Authority, Revenue Bonds, Peninsula Regional Medical Center Issue, | | | | | | | | | | | |
Series 2006 | | 5.000% | | 7/1/19 | | | 1,000,000 | | | 1,074,390 | |
Series 2006 | | 5.000% | | 7/1/26 | | | 2,435,000 | | | 2,514,941 | |
Maryland Health and Higher Educational Facilities Authority, Revenue Bonds, Refunding, Mercy Ridge Series 2007 | | 4.750% | | 7/1/34 | | | 3,200,000 | | | 2,925,792 | |
Maryland Health and Higher Educational Facilities Authority, Revenue Bonds, Suburban Hospital Issue, Series 2004A | | 5.500% | | 7/1/16 | | | 500,000 | | | 535,840 | |
Maryland Health and Higher Educational Facilities Authority, Revenue Bonds, The Johns Hopkins Hospital Issue, Series 1990 | | 0.000% | | 7/1/19 | | | 4,000,000 | | | 2,671,000 | C |
Maryland Health and Higher Educational Facilities Authority, Revenue Bonds, The Johns Hopkins University Issue, Series 2004A | | 5.000% | | 7/1/33 | | | 3,000,000 | | | 3,138,720 | |
Maryland Health and Higher Educational Facilities Authority, Revenue Bonds, Union Hospital of Cecil County Issue, Series 2002 | | 5.500% | | 7/1/22 | | | 250,000 | | | 254,550 | |
| | |
Semi-Annual Report to Shareholders | | 17 |
| | | | | | | | | | | |
| | | Rate | | Maturity
Date | | Par | | Value | |
| | | | | | | | | | | |
Maryland — Continued | | | | | | | | | | | |
Maryland Health and Higher Educational Facilities Authority, Revenue Bonds, University of Maryland Medical System Issue, | | | | | | | | | | | |
Series 2000
(Pre-refunded 7/1/10) | | 6.750% | | 7/1/30 | | $ | 1,250,000 | | $ | 1,319,500 | B |
Series 2001
(Pre-refunded 7/1/11) | | 5.750% | | 7/1/21 | | | 3,000,000 | | | 3,256,440 | B |
Series 2002
(Pre-refunded 7/1/12) | | 6.000% | | 7/1/32 | | | 1,000,000 | | | 1,129,510 | B |
Maryland Health And Higher Educational Facilities Authority, Revenue Bonds, Washington County Hospital Issue, | | | | | | | | | | | |
Series 2008 | | 4.000% | | 1/1/15 | | | 1,000,000 | | | 998,080 | |
Series 2008 | | 4.750% | | 1/1/16 | | | 1,000,000 | | | 1,024,880 | |
Series 2008 | | 6.000% | | 1/1/43 | | | 1,000,000 | | | 1,031,330 | |
Maryland IDA, Economic Development Revenue Bonds (National Aquarium in Baltimore Facility),
Series 2002B | | 5.000% | | 11/1/19 | | | 500,000 | | | 501,250 | |
Maryland IDA, Refunding Revenue Bonds (American Center for Physics Headquarters Facility),
Series 2001 | | 5.250% | | 12/15/15 | | | 320,000 | | | 341,427 | |
Mayor and City Council of Baltimore (City of Baltimore, Maryland), GO Bonds, Consolidated Public Improvement Refunding Bonds, Series 1995A
(FGIC insured) | | 0.000% | | 10/15/11 | | | 940,000 | | | 832,229 | C |
Mayor and City Council of Baltimore, Port Facilities Revenue Bonds (Consolidation Coal Sales Company Project), | | | | | | | | | | | |
Series 1984A | | 6.500% | | 10/1/11 | | | 5,000,000 | | | 5,180,250 | |
Series 1984B | | 6.500% | | 10/1/11 | | | 1,000,000 | | | 1,036,050 | |
| | |
18 | | Semi-Annual Report to Shareholders |
Portfolio of Investments — Continued
Legg Mason Investment Counsel Maryland Tax-Free Income Trust — Continued
| | | | | | | | | | | |
| | | Rate | | Maturity
Date | | Par | | Value | |
| | | | | | | | | | | |
Maryland — Continued | | | | | | | | | | | |
Montgomery County, Maryland, GO Bonds, Consolidated Public Improvement, Refunding Bonds, Series 1992A | | 0.000% | | 7/1/10 | | $ | 3,000,000 | | $ | 2,979,510 | C |
Montgomery County, Maryland, Revenue Bonds, Housing Opportunities Commission Single Family Mortgage, Series 2007D AMT | | 5.000% | | 7/1/27 | | | 1,535,000 | | | 1,522,413 | |
Montgomery County, Maryland, Revenue Bonds, Housing Opportunities Commission Single Family Mortgage, Revenue Bonds, Series 2009 | | 4.875% | | 7/1/25 | | | 1,000,000 | | | 1,037,600 | |
Northeast Maryland Waste Disposal Authority, Solid Waste Refunding Revenue Bonds (Montgomery County Solid Waste Disposal System), Series 2003 AMT
(AMBAC insured) | | 5.500% | | 4/1/16 | | | 3,425,000 | | | 3,551,211 | |
Prince George's County, Maryland, GO Bonds, Consolidated Public Improvement Bonds,
(FSA insured) | | | | | | | | | | | |
Series 1999
(Pre-refunded 10/1/09) | | 5.500% | | 10/1/13 | | | 2,000,000 | | | 2,020,000 | B |
Series 1999
(Pre-refunded 10/1/09) | | 5.500% | | 10/1/13 | | | 170,000 | | | 171,700 | B |
Queen Anne's County, Maryland, Public Facilities Refunding Bonds, Series 2005 (NATL insured) | | 5.000% | | 11/15/16 | | | 500,000 | | | 567,990 | |
| | |
Semi-Annual Report to Shareholders | | 19 |
| | | | | | | | | | |
| | | Rate | | Maturity
Date | | Par | | Value |
| | | | | | | | | | |
Maryland — Continued | | | | | | | | | | |
State of Maryland, GO Bonds, State and Local Facilities Loan, | | | | | | | | | | |
Series 2000, First Series | | 5.500% | | 8/1/10 | | $ | 2,000,000 | | $ | 2,084,480 |
Series 2001, First Series | | 5.500% | | 3/1/15 | | | 5,000,000 | | | 5,957,300 |
The Maryland-National Capital Park and Planning Commission, Prince George's County, Maryland, Park Acquisition and Development GO Bonds, Series 2001Z-2 | | 5.125% | | 5/1/21 | | | 1,310,000 | | | 1,381,998 |
University System of Maryland Auxiliary Facility and Tuition Revenue Bonds, Series 2006A | | 5.000% | | 10/1/21 | | | 2,500,000 | | | 2,828,275 |
Washington Suburban Sanitary District, Maryland, (Montgomery and Prince George's Counties), Water Supply Refunding Bonds, | | | | | | | | | | |
Series 1997 | | 5.250% | | 6/1/16 | | | 1,650,000 | | | 1,978,020 |
Series 1997 | | 5.750% | | 6/1/17 | | | 2,000,000 | | | 2,489,680 |
Series 1997 | | 6.000% | | 6/1/18 | | | 2,705,000 | | | 3,454,610 |
Series 1997 | | 6.000% | | 6/1/19 | | | 3,665,000 | | | 4,737,379 |
Westminster, Maryland, Education Facilities Refunding Revenue Bonds, (McDaniel College Inc.) | | | | | | | | | | |
Series 2006 | | 5.000% | | 11/1/21 | | | 1,160,000 | | | 1,211,191 |
Series 2006 | | 5.000% | | 11/1/22 | | | 250,000 | | | 259,962 |
Series 2006 | | 5.000% | | 11/1/31 | | | 3,500,000 | | | 3,522,645 |
| | | | | | | | | | |
| | | | | | | | | | 161,315,245 |
| | | | | | | | | | |
| | | | |
Puerto Rico — 1.1% | | | | | | | | | | |
Commonwealth of Puerto Rico, GO Bonds, Public Improvement Bonds,
Series 2005A | | 5.000% | | 7/1/25 | | | 2,000,000 | | | 1,991,221 |
| | | | | | | | | | |
Total Municipal Bonds (Cost — $150,187,034) | | | | | | 163,306,466 |
| | |
20 | | Semi-Annual Report to Shareholders |
Portfolio of Investments — Continued
Legg Mason Investment Counsel Maryland Tax-Free Income Trust — Continued
| | | | | | | | | | |
| | | Rate | | Maturity
Date | | Par | | Value |
| | | | | | | | | | |
Variable Rate Demand ObligationsD — 9.4% | | | |
| | | | |
Maryland — 9.4% | | | | | | | | | | |
Baltimore County, Maryland, Economic Development Revenue, (Garrison Forest School Inc. Project),
Series 2006 | | 0.410% | | 10/1/09 | | $ | 4,800,000 | | $ | 4,800,000 |
Maryland Health and Higher Educational Facilities Authority, Revenue Bonds, Anne Arundel Health System, Series 2009 | | 0.400% | | 10/1/09 | | | 5,000,000 | | | 5,000,000 |
Maryland Health and Higher Educational Facilities Authority, Revenue Bonds, Bryn Mawr School, Series 2005 | | 0.850% | | 10/7/09 | | | 1,100,000 | | | 1,100,000 |
Maryland Industrial Development Financing Authority, EDR, Series 2001 | | 0.850% | | 10/7/09 | | | 5,325,000 | | | 5,325,000 |
Maryland State Economic Development Corporation Revenue, (American Urological Association),
Series 2009 | | 0.850% | | 10/7/09 | | | 1,000,000 | | | 1,000,000 |
| | | | | | | | | | |
Total Variable Rate Demand Obligations (Cost — $17,225,000) | | | 17,225,000 |
Total Investments — 98.6% (Cost — $167,412,034)E | | | 180,531,466 |
Other Assets Less Liabilities — 1.4% | | | | | | | | 2,623,948 |
| | | | | | | | | | |
| | | | |
Net Assets — 100.0% | | | | | | | | | $ | 183,155,414 |
| | | | | | | | | | |
| | |
Semi-Annual Report to Shareholders | | 21 |
| A | Bonds are escrowed to maturity by government securities and/or U.S. government agency securities and are considered by the manager to be triple-A rated even if issuer has not applied for new ratings. |
| B | Pre-refunded bond — Bonds are referred to as pre-refunded when the issue has been advance refunded by a subsequent issue. The original issue is usually escrowed with U.S. Treasury securities in an amount sufficient to pay the interest, principal and call premium, if any, to the earliest call date. On that call date, the bond "matures." The pre-refunded date is used in determining weighted average portfolio maturity. |
| C | Zero coupon bond — A bond with no periodic interest payments which is sold at such a discount as to produce a current yield to maturity. |
| D | The rate shown is the rate as of September 30, 2009, and the maturity shown is the longer of the next interest readjustment date or the date the original principal amount owed can be recovered through demand. |
| E | Aggregate cost for federal income tax purposes is substantially the same as book cost. At September 30, 2009, the aggregate gross unrealized appreciation and depreciation of investments for federal income tax purposes were substantially as follows: |
| | | | |
| Gross unrealized appreciation | | $ | 13,267,409 | |
| Gross unrealized depreciation | | | (147,977 | ) |
| | | | |
| Net unrealized appreciation | | $ | 13,119,432 | |
| | | | |
Abbreviations used in this schedule:
| | |
AMBAC | | American Municipal Bond Assurance Corporation — Insured Bonds |
AMT | | Alternative Minimum Tax |
EDR | | Economic Development Revenue |
FGIC | | Financial Guaranty Insurance Company — Insured Bonds |
FSA | | Financial Security Assurance — Insured Bonds |
GO | | General Obligation |
IDA | | Industrial Development Authority |
NATL | | National Public Finance Guarantee Corporation — Insured Bonds |
See notes to financial statements.
| | |
22 | | Semi-Annual Report to Shareholders |
Portfolio of Investments — Continued
Legg Mason Investment Counsel Maryland Tax-Free Income Trust — Continued
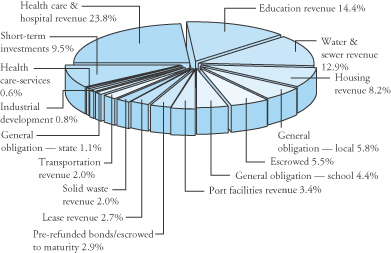
Summary of Investments by Sector (Unaudited) (as of September 30, 2009)
| | |
Semi-Annual Report to Shareholders | | 23 |
Statement of Assets and Liabilities
Legg Mason Investment Counsel Maryland Tax-Free Income Trust
September 30, 2009 (Unaudited)
| | | | | | | |
Assets: | | | | | | | |
Investment securities at value
(Cost – $150,187,034) | | | | | $ | 163,306,466 | |
Short-term securities at value
(Cost – $17,225,000) | | | | | | 17,225,000 | |
Cash | | | | | | 3,051,785 | |
Interest receivable | | | | | | 2,190,439 | |
Receivable for fund shares sold | | | | | | 393,862 | |
Other assets | | | | | | 2,132 | |
| | | | | | | |
Total assets | | | | | | 186,169,684 | |
Liabilities: | | | | | | | |
Payable for securities purchased | | $ | 2,490,255 | | | | |
Payable for fund shares repurchased | | | 289,250 | | | | |
Income distribution payable | | | 64,536 | | | | |
Accrued management fee | | | 46,829 | | | | |
Accrued distribution and service fees | | | 26,202 | | | | |
Accrued expenses | | | 97,198 | | | | |
| | | | | | | |
Total liabilities | | | | | | 3,014,270 | |
| | | | | | | |
Net Assets | | | | | $ | 183,155,414 | |
| | | | | | | |
Net assets consist of: | | | | | | | |
Accumulated paid-in-capital | | | | | $ | 170,525,781 | |
Undistributed net investment income | | | | | | 22,370 | |
Accumulated net realized loss on investments | | | | | | (512,169 | ) |
Unrealized appreciation of investments | | | | | | 13,119,432 | |
| | | | | | | |
Net Assets | | | | | $ | 183,155,414 | |
| | | | | | | |
Net Asset Value Per Share: | | | | | | | |
Class A (and redemption price)
(9,785,119 shares outstanding) | | | | | | $16.66 | |
| | | | | | | |
Class C1 (780,818 shares outstanding) | | | | | | $16.66 | |
| | | | | | | |
Class I2 (and redemption price)
(426,226 shares outstanding) | | | | | | $16.67 | |
| | | | | | | |
Maximum Public Offering Price Per Share: | | | | | | | |
Class A (based on maximum initial sales charge of 4.25%) | | | $17.40 | |
| | | | | | | | |
| 1 | Redemption price per share is NAV of Class C shares reduced by a 1.00% CDSC, if shares are redeemed within one year of purchase payment. |
| 2 | Effective October 5, 2009, Institutional Class shares were renamed Class I shares. |
See notes to financial statements.
| | |
24 | | Semi-Annual Report to Shareholders |
Statement of Operations
Legg Mason Investment Counsel Maryland Tax-Free Income Trust
For the Six Months Ended September 30, 2009 (Unaudited)
| | | | | | |
Investment Income: | | | | | | |
Interest | | | | | $ | 3,883,323 |
| | | | | | |
Expenses: | | | | | | |
Management fees (Note 3) | | 455,413 | | | | |
Distribution and service fees (Notes 3 and 5) | | 139,204 | | | | |
Transfer agent and shareholder servicing expenses (Note 5) | | 53,460 | | | | |
Audit and legal fees | | 26,524 | | | | |
Trustees' fees and expenses | | 25,359 | | | | |
Shareholder reports expenses (Note 5) | | 19,600 | | | | |
Registration fees | | 17,032 | | | | |
Custodian fees | | 16,309 | | | | |
Other expenses | | 22,394 | | | | |
| | | | | | |
| | 775,295 | | | | |
Less: Fees waived (Note 3) | | (205,082 | ) | | | |
Compensating balance credits (Note 1) | | (137 | ) | | | |
| | | | | | |
Net expenses | | | | | | 570,076 |
| | | | | | |
Net Investment Income | | | | | | 3,313,247 |
Net Realized and Unrealized Gain/(Loss) on Investments: | | | | | | |
Net realized gain on investments | | 203,806 | | | | |
Change in unrealized appreciation/(depreciation) of investments | | 11,049,773 | | | | |
| | | | | | |
Net Realized and Unrealized Gain on Investments | | | | | | 11,253,579 |
Change in Net Assets Resulting From Operations | | | | | $ | 14,566,826 |
See notes to financial statements.
| | |
Semi-Annual Report to Shareholders | | 25 |
Statement of Changes in Net Assets
Legg Mason Investment Counsel Maryland Tax-Free Income Trust
| | | | | | | | |
| | | For the Six
Months Ended
September 30, 2009 | | | For the
Year Ended
March 31, 2009 | |
| | | (Unaudited) | | | | |
Change in Net Assets: | | | | | | | | |
Net investment income | | $ | 3,313,247 | | | $ | 6,519,362 | |
Net realized gain/(loss) | | | 203,806 | | | | (531,010 | ) |
Change in unrealized appreciation/(depreciation) | | | 11,049,773 | | | | (2,939,284 | ) |
Change in net assets resulting from operations | | | 14,566,826 | | | | 3,049,068 | |
Distributions to shareholders from: | | | | | | | | |
Net investment income: | | | | | | | | |
Class A | | | (3,097,530 | ) | | | (6,485,887 | ) |
Class C | | | (112,093 | ) | | | (4,338 | )1 |
Class I2 | | | (103,566 | ) | | | (29,168 | )3 |
Change in net assets from fund share transactions: | | | | | | | | |
Class A | | | 6,986,925 | | | | (256,995 | ) |
Class C | | | 10,532,057 | | | | 1,963,721 | 1 |
Class I2 | | | 3,449,976 | | | | 3,304,168 | 3 |
Change in net assets | | | 32,222,595 | | | | 1,540,569 | |
Net Assets: | | | | | | | | |
Beginning of period | | | 150,932,819 | | | | 149,392,250 | |
End of period | | $ | 183,155,414 | | | $ | 150,932,819 | |
Undistributed net investment income | | $ | 22,370 | | | $ | 22,312 | |
| 1 | For the period February 5, 2009 (commencement of operations) to March 31, 2009. |
| 2 | Effective October 5, 2009, Institutional Class shares were renamed Class I shares. |
| 3 | For the period July 30, 2008 (commencement of operations) to March 31, 2009. |
See notes to financial statements.
| | |
26 | | Semi-Annual Report to Shareholders |
Financial Highlights
Legg Mason Investment Counsel Maryland Tax-Free Income Trust
For a share of each class of beneficial interest outstanding:
Class A:
| | | | | | | | | | | | | | | | | | |
| | | Six Months
Ended
September 30, 2009A | | | Years Ended March 31, | |
| | | | 2009A | | | 2008A | | | 2007A | | | 2006 | | | 2005 | |
| | | (Unaudited) | | | | | | | | | | | | | | | | |
Net asset value, beginning of period | | $15.58 | | | $15.89 | | | $16.28 | | | $16.25 | | | $16.40 | | | $16.77 | |
Investment operations: | | | | | | | | | | | | | | | | | | |
Net investment income | | .32 | | | .68 | | | .67 | | | .68 | | | .67 | | | .65 | |
Net realized and
unrealized gain/(loss) | | 1.08 | | | (.31 | ) | | (.39 | ) | | .06 | | | (.15 | ) | | (.28 | ) |
Total from investment operations | | 1.40 | | | .37 | | | .28 | | | .74 | | | .52 | | | .37 | |
Distributions from: | | | | | | | | | | | | | | | | | | |
Net investment income | | (.32 | ) | | (.68 | ) | | (.67 | ) | | (.68 | ) | | (.67 | ) | | (.66 | ) |
Net realized gain on investments | | — | | | — | | | (.00 | )B | | (.03 | ) | | (.00 | )B | | (.08 | ) |
Total distributions | | (.32 | ) | | (.68 | ) | | (.67 | ) | | (.71 | ) | | (.67 | ) | | (.74 | ) |
Net asset value, end of period | | $16.66 | | | $15.58 | | | $15.89 | | | $16.28 | | | $16.25 | | | $16.40 | |
Total returnC | | 9.10 | % | | 2.46 | % | | 1.76 | % | | 4.64 | % | | 3.22 | % | | 2.22 | % |
Ratios to Average Net
Assets: | | | | | | | | | | | | | | | | | | |
Total expensesD | | .90 | %E | | 1.03 | % | | .96 | % | | .97 | % | | .97 | % | | .93 | % |
Expenses net of waivers
and/or expense reimbursements, if
anyD,F | | .67 | %E | | .70 | % | | .71 | % | | .70 | % | | .70 | % | | .70 | % |
Expenses net of all reductionsD,F | | .67 | %E | | .70 | % | | .70 | % | | .70 | % | | .70 | % | | .70 | % |
Net investment income | | 4.03 | %E | | 4.40 | % | | 4.15 | % | | 4.16 | % | | 4.10 | % | | 3.91 | % |
Supplemental Data: | | | | | | | | | | | | | | | | | | |
Portfolio turnover rate | | 0.0 | % | | 7.5 | % | | 6.3 | % | | 8.9 | % | | 4.7 | % | | 9.2 | % |
Net assets, end of period
(in thousands) | | $163,04 | 2 | | $145,67 | 2 | | $149,39 | 2 | | $144,55 | 9 | | $145,84 | 5 | | $156,06 | 6 |
| A | Computed using average daily shares outstanding. |
| B | Amount represents less than $0.005 per share. |
| C | Performance figures, exclusive of sales charges, may reflect compensating balance credits, fee waivers and/or expense reimbursements. In the absence of compensating balance credits, fee waivers and/or expense reimbursements, the total return would have been lower. Past performance is no guarantee of future results. Total returns for periods of less than one year are not annualized. |
| D | Total expenses reflects operating expenses prior to any voluntary expense waivers, expense reimbursements and/or compensating balance credits. Expenses net of waivers and/or expense reimbursements reflects total expenses before compensating balance credits but net of any voluntary expense waivers and/or expense reimbursements. Expenses net of all reductions reflects expenses less any compensating balance credits, voluntary expense waivers and/or expense reimbursements. |
| F | As a result of a voluntary expense limitation, the ratio of expenses, other than interest, brokerage, taxes and extraordinary expenses, to average net assets of Class A will not exceed 0.70%. |
See notes to financial statements.
| | |
Semi-Annual Report to Shareholders | | 27 |
For a share of each class of beneficial interest outstanding:
Class C:
| | | | | | |
| | | Six Months
Ended
September 30, 2009A | | | Period
Ended
March 31, 2009A,B | |
| | | |
| | | |
| | | (Unaudited) | | | | |
Net asset value, beginning of period | | $15.58 | | | $15.59 | |
Investment operations: | | | | | | |
Net investment income | | .26 | | | .07 | |
Net realized and unrealized gain | | 1.08 | | | .01 | |
Total from investment operations | | 1.34 | | | .08 | |
Distributions from: | | | | | | |
Net investment income | | (.26 | ) | | (.09 | ) |
Total distributions | | (.26 | ) | | (.09 | ) |
Net asset value, end of period | | $16.66 | | | $15.58 | |
Total returnC | | 8.77 | % | | .53 | % |
Ratios to Average Net Assets:D | | | | | | |
Total expensesE | | 1.70 | % | | 1.99 | % |
Expenses net of waivers and/or expense reimbursements, if anyE,F | | 1.25 | % | | 1.18 | % |
Expenses net of all reductionsE,F | | 1.25 | % | | 1.17 | % |
Net investment income | | 3.30 | % | | 3.51 | % |
Supplemental Data: | | | | | | |
Portfolio turnover rate | | 0.0 | % | | 7.5 | % |
Net assets, end of period (in thousands) | | $13,009 | | | $1,965 | |
| A | Computed using average daily shares outstanding. |
| B | For the period February 5, 2009 (commencement of operations) to March 31, 2009. |
| C | Performance figures, exclusive of CDSC, may reflect compensating balance credits, fee waivers and/or expense reimbursements. In the absence of compensating balance credits, fee waivers and/or expense reimbursements, the total return would have been lower. Past performance is no guarantee of future results. Total returns for periods of less than one year are not annualized. |
| E | Total expenses reflects operating expenses prior to any voluntary expense waivers, expense reimbursements and/or compensating balance credits. Expenses net of waivers and/or expense reimbursements reflects total expenses before compensating balance credits but net of any voluntary expense waivers and/or expense reimbursements. Expenses net of all reductions reflects expenses less any compensating balance credits, voluntary expense waivers and/or expense reimbursements. |
| F | As a result of a voluntary expense limitation, the ratio of expenses, other than interest, brokerage, taxes and extraordinary expenses, to average net assets of Class C will not exceed 1.25%. |
See notes to financial statements.
| | |
28 | | Semi-Annual Report to Shareholders |
Financial Highlights — Continued
Legg Mason Investment Counsel Maryland Tax-Free Income Trust
For a share of each class of beneficial interest outstanding:
Class IA:
| | | | | | |
| | | Six Months
Ended
September 30, 2009B | | | Period
Ended
March 31, 2009B,C | |
| | | |
| | | |
| | | (Unaudited) | | | | |
Net asset value, beginning of period | | $15.58 | | | $15.83 | |
Investment operations: | | | | | | |
Net investment income | | .34 | | | .47 | |
Net realized and unrealized gain/(loss) | | 1.09 | | | (.24 | ) |
Total from investment operations | | 1.43 | | | .23 | |
Distributions from: | | | | | | |
Net investment income | | (.34 | ) | | (.48 | ) |
Total distributions | | (.34 | ) | | (.48 | ) |
Net asset value, end of period | | $16.67 | | | $15.58 | |
Total returnD | | 9.29 | % | | 1.58 | % |
Ratios to Average Net Assets:E | | | | | | |
Total expensesF | | .99 | % | | 1.22 | % |
Expenses net of waivers and/or expense reimbursements, if anyF,G | | .45 | % | | .45 | % |
Expenses net of all reductionsF,G | | .45 | % | | .45 | % |
Net investment income | | 4.22 | % | | 4.72 | % |
Supplemental Data: | | | | | | |
Portfolio turnover rate | | 0.0 | % | | 7.5 | % |
Net assets, end of period (in thousands) | | $7,104 | | | $3,296 | |
| A | Effective October 5, 2009, Institutional Class shares were renamed Class I shares. |
| B | Computed using average daily shares outstanding. |
| C | For the period July 30, 2008 (commencement of operations) to March 31, 2009. |
| D | Performance figures may reflect compensating balance credits, fee waivers and/or expense reimbursements. In the absence of compensating balance credits, fee waivers and/or expense reimbursements, the total return would have been lower. Past performance is no guarantee of future results. Total returns for periods of less than one year are not annualized. |
| F | Total expenses reflects operating expenses prior to any voluntary expense waivers, expense reimbursements and/or compensating balance credits. Expenses net of waivers and/or expense reimbursements reflects total expenses before compensating balance credits but net of any voluntary expense waivers and/or expense reimbursements. Expenses net of all reductions reflects expenses less any compensating balance credits, voluntary expense waivers and/or expense reimbursements. |
| G | As a result of a voluntary expense limitation, the ratio of expenses, other than interest, brokerage, taxes and extraordinary expenses, to average net assets of class I will not exceed 0.45%. |
See notes to financial statements.
| | |
Semi-Annual Report to Shareholders | | 29 |
Notes to Financial Statements
Legg Mason Investment Counsel Maryland Tax-Free Income Trust
(Unaudited)
1. Organization and Significant Accounting Policies:
Legg Mason Tax-Free Income Fund (“Trust”), consisting of the Legg Mason Investment Counsel Maryland Tax-Free Income Trust (“the Fund”) (formerly known as Legg Mason Maryland Tax-Free Income Trust), is registered under the Investment Company Act of 1940, as amended (“1940 Act”), as an open-end management investment company. The Fund is non-diversified.
The Fund consists of four classes of shares: Class A, Class C, Class I (formerly known as Institutional Class) and Class FI (formerly known as Financial Intermediary Class) (currently not active). The income and expenses of the Fund are allocated proportionately to each class of shares based on daily net assets, except for Rule 12b-1 distribution and service fees, which are charged only on Class A and Class C shares. Transfer agent and shareholder servicing expenses are charged separately to each class.
The following are significant accounting policies consistently followed by the Fund and are in conformity with U.S. generally accepted accounting principles (“GAAP”). Estimates and assumptions are required to be made regarding assets, liabilities and changes in net assets resulting from operations when financial statements are prepared. Changes in the economic environment, financial markets and any other parameters used in determining these estimates could cause actual results to differ. Subsequent events have been evaluated through November 19, 2009, the issuance date of the financial statements.
Investment Valuation
The Fund's securities are valued under policies approved by and under the general oversight of the Board of Trustees. The Fund has adopted Financial Accounting Standards Board Codification Section 820 (formerly Statement of Financial Accounting Standards No. 157) (“ASC Section 820”). ASC Section 820 establishes a single definition of fair value, creates a three-tier hierarchy as a framework for measuring fair value based on inputs used to value the Fund’s investments, and requires additional disclosure about fair value. The hierarchy of inputs is summarized below.
| | • | | Level 1 – quoted prices in active markets for identical investments |
| | • | | Level 2 – other significant observable inputs (including quoted prices for similar investments, interest rates, prepayment speeds, credit risk, etc.) |
| | • | | Level 3 – significant unobservable inputs (including the Fund’s own assumptions in determining the fair value of investments) |
Debt securities are valued at the last quoted bid prices provided by an independent pricing service that are based on transactions in debt obligations, quotations from bond dealers, market transactions in comparable securities and various other relationships between securities. When prices are not readily available, or are determined not to
| | |
30 | | Semi-Annual Report to Shareholders |
Notes to Financial Statements — Continued
Legg Mason Investment Counsel Maryland Tax-Free Income Trust — Continued
reflect fair value, such as when the value of a security has been significantly affected by events after the close of the exchange or market on which the security is principally traded, but before the Fund calculates its net asset value, the Fund values these securities at fair value as determined in accordance with the procedures approved by the Fund’s Board of Trustees. Short-term obligations with maturities of 60 days or less are valued at amortized cost, which approximates fair value.
The inputs or methodology used for valuing securities are not necessarily an indication of the risk associated with investing in those securities.
The Fund uses valuation techniques to measure fair value that are consistent with the market approach, income approach and/or cost approach, depending on the type of the security and the particular circumstance.
The following is a summary of the inputs used in valuing the Fund’s assets carried at fair value:
| | | | | | | | | | |
| Description | | Quoted Prices
(Level 1) | | Other Significant
Observable Inputs
(Level 2) | | Significant
Unobservable
Inputs
(Level 3) | | Total |
Municipal bonds† | | — | | $ | 163,306,466 | | — | | $ | 163,306,466 |
Variable rate demand obligations† | | — | | | 17,225,000 | | — | | | 17,225,000 |
| | | | | | | | | | |
Total | | — | | $ | 180,531,466 | | — | | $ | 180,531,466 |
| | | | | | | | | | |
| † | See Portfolio of Investments for additional security detail. |
Security Transactions
Security transactions are accounted for as of the trade date. Realized gains and losses from security transactions are reported on an identified cost basis for both financial reporting and federal income tax purposes.
For the six months ended September 30, 2009, security transactions (excluding short-term investments) were as follows:
| | | |
| Purchases | | Proceeds From Sales |
| $15,350,381 | | $ | 0 |
Investment Income and Distributions to Shareholders
Interest income and expenses are recorded on the accrual basis. Bond premiums and discounts are amortized for financial reporting and federal income tax purposes. Dividend income and distributions to shareholders are recorded on the ex-dividend date. Dividends from net investment income are declared daily and paid monthly. When available, net capital gain distributions are declared and paid annually in June, if
| | |
Semi-Annual Report to Shareholders | | 31 |
available. An additional distribution may be made in December, to the extent necessary, in order to comply with Federal excise tax requirements. Distributions are determined in accordance with federal income tax regulations, which may differ from those determined in accordance with GAAP. Accordingly, periodic reclassifications are made within the Fund’s capital accounts to reflect income and gains available for distribution under federal income tax regulations.
Compensating Balance Credits
The Fund has an arrangement with its custodian bank, whereby a portion of the custodian’s fee is paid indirectly by credits earned on the Fund’s cash on deposit with the bank. This deposit arrangement is an alternative to purchasing overnight investments.
Credit and Market Risk
The Fund invests substantially all of its assets in securities issued by or on behalf of the State of Maryland its political subdivisions, municipalities, agencies, instrumentalities, and public authorities. Changes in economic conditions in, or governmental policies of, the State of Maryland could have a significant impact on the performance of the Fund.
The Fund may focus a significant amount of its investments in a single sector of the municipal securities market. In doing so, the Fund is more susceptible to factors adversely affecting that sector than would a fund not following that practice. The Fund may invest a significant portion of assets in securities issued by local governments or public authorities that are rated according to their particular creditworthiness, which may vary significantly from the state’s general obligations. The value of the Fund’s shares will be more susceptible to being materially impacted by a single economic, political or regulatory event affecting those issuers or their securities than shares of a diversified fund.
Other
In the normal course of business, the Fund enters into contracts that provide general indemnifications. The Fund’s maximum exposure under these arrangements is dependent upon claims that may be made against the Fund in the future and, therefore, cannot be estimated; however, based on experience, the risk of material loss from such claims is considered remote.
2. Federal Income Taxes:
It is the Fund’s policy to comply with the federal income and excise tax requirements of the Internal Revenue Code of 1986 (the “Code”), as amended, applicable to regulated investment companies. Accordingly, the Fund intends to
| | |
32 | | Semi-Annual Report to Shareholders |
Notes to Financial Statements — Continued
Legg Mason Investment Counsel Maryland Tax-Free Income Trust — Continued
distribute its taxable income and net realized gains, if any, to shareholders in accordance with timing requirements imposed by the Code. Therefore, no federal income tax provision is required in the Fund’s financial statements.
Management has analyzed the Fund’s tax positions taken on federal income tax returns for all open tax years and has concluded that as of September 30, 2009, no provision for income tax would be required in the Fund’s financial statements. The Fund’s federal and state income and federal excise tax returns for tax years for which the applicable statutes of limitations have not expired are subject to examination by Internal Revenue Service and state departments of revenue.
Reclassification
GAAP requires that certain components of net assets be adjusted to reflect permanent differences between financial and tax reporting. These reclassifications have no effect on net assets or net asset values per share.
Capital loss carryforwards
As of March 31, 2009, the Fund had net capital loss carryforwards of the following:
| | |
| Year of Expiration | | Amount |
| 3/31/2016 | | $(112,575) |
| 3/31/2017 | | (603,400) |
| | |
| | $(715,975) |
| | |
These amounts will be available to offset any future taxable gains.
3. Transactions With Affiliates:
During the period, the Fund had an investment advisory and management agreement with Legg Mason Fund Adviser, Inc. (“LMFA”). Pursuant to the agreement, LMFA provided the Fund with investment management and administrative services for which the Fund paid a fee, computed daily and payable monthly, at an annual rate of 0.55% of the Fund’s average daily net assets.
| | |
Semi-Annual Report to Shareholders | | 33 |
The Fund’s manager has voluntarily agreed to waive its fees in any month to the extent the Fund’s expenses (exclusive of taxes, interest, brokerage and extraordinary expenses) exceed during that month certain annual rates of each class of the Fund’s average daily net assets shown in the table below. These waivers may be terminated at any time. The following chart summarizes the management fees and expense limitations for the Fund:
| | | | | | | | | |
| | | | | | | | | Six Months Ended
September 30, 2009 |
| | | Advisory
Fee | | | Expense
Limitation | | | Management
Fees Waived |
Maryland Tax-Free | | | | | | | | | |
Class A | | 0.55 | % | | 0.70 | % | | $ | 176,545 |
Class C | | 0.55 | % | | 1.25 | % | | | 15,247 |
Class IA | | 0.55 | % | | 0.45 | % | | | 13,290 |
| A | Effective October 5, 2009, Institutional Class shares were renamed Class I shares. |
Legg Mason Investment Counsel, LLC (“LMIC”) serves as investment adviser to the Fund pursuant to a sub-advisory agreement with the Fund’s manager. The Fund’s manager (not the Fund) pays LMIC a fee, computed daily and payable monthly, at an annual rate of 0.50% of the Fund’s average daily net assets.
As of September 30, 2009, Legg Mason Partners Funds Advisor, LLC (“LMPFA”) replaced LMFA. Effective upon the substitution, LMPFA assumed the rights and responsibilities of LMFA under its management agreements regarding the Fund as described in the Fund’s prospectus.
The manager is permitted to recapture amounts previously voluntarily forgone or reimbursed by the manager to the Fund during the same fiscal year if the Fund’s total annual operating expenses have fallen to a level below the voluntary fee waiver/reimbursement (“expense cap”) shown in the fee table of the Fund’s prospectus. In no case will the manager recapture any amount that would result, on any particular business day of the Fund, in the Fund’s total annual operating expenses exceeding the expense cap.
Legg Mason Investor Services, LLC (“LMIS”) serves as the Fund’s sole and exclusive distributor.
LMFA, LMIC, LMPFA and LMIS are corporate affiliates and wholly owned subsidiaries of Legg Mason, Inc.
There is a maximum initial sales charge of 4.25% for Class A shares. In addition, on February 1, 2009 Class C shares began charging a contingent deferred sales charge (“CDSC”) of 1.00%, on shares bought by investors on and after that date, which applies if redemption occurs within one year from purchase payment. In certain cases, Class A shares have a 1.00% CDSC, which applies to certain redemptions made within 12 months following purchases of $1,000,000 or more without an initial sales charge.
| | |
34 | | Semi-Annual Report to Shareholders |
Notes to Financial Statements — Continued
Legg Mason Investment Counsel Maryland Tax-Free Income Trust — Continued
For the six months ended September 30, 2009, LMIS and its affiliates received sales charges of approximately $18,500 on sales of the Fund’s Class A shares. In addition, for the six months ended September 30, 2009, CDSCs paid to LMIS and its affiliates were approximately $200 for Class C shares.
Under a Deferred Compensation Plan (the “Plan”), trustees may elect to defer receipt of all or a specified portion of their compensation. A participating trustee may select one or more funds in which his or her deferred trustee’s fees will be deemed to be invested. Deferred fees remain in the fund until distributed in accordance with the Plan.
4. Derivative Instruments and Hedging Activities:
Financial Accounting Standards Board Codification Section 815 (formerly Statement of Financial Accounting Standards No. 161) (“ASC Topic 815”) requires enhanced disclosure about an entity’s derivative and hedging activities.
During the six months ended September 30, 2009, the Fund did not invest in any derivative instruments.
5. Class Specific Expenses:
The Fund has adopted Rule 12b-1 distribution plans and under the plans the Fund pays a service fee with respect to its Class A and Class C shares calculated at the annual rate of 0.15% and 0.25% of the average daily net assets of each respective class. The Fund also pays a distribution fee with respect to its Class C shares calculated at the annual rate of 0.45% of the average daily net assets of its Class C shares. Distribution fees are accrued daily and paid monthly.
For the six months ended September 30, 2009, class specific expenses were as follows:
| | | | | | | | | |
| | | Distribution Fees | | Transfer
Agent and
Shareholder
Servicing
Expenses | | Shareholder Reports
Expenses* |
Class A | | $ | 115,426 | | $ | 38,738 | | $ | 12,067 |
Class C | | | 23,778 | | | 8,457 | | | 2,459 |
Class IA | | | — | | | 6,265 | | | 1,273 |
| | | | | | | | | |
Total | | $ | 139,204 | | $ | 53,460 | | $ | 15,799 |
| | | | | | | | | |
| A | Effective October 5, 2009, Institutional Class shares were renamed Class I shares. |
| * | For the period April 1, 2009 through September 10, 2009. Subsequent to September 10, 2009, these expenses were accrued as common fund expenses. |
| | |
Semi-Annual Report to Shareholders | | 35 |
6. Line of Credit:
The Fund, along with certain other Legg Mason Funds, participates in a $200 million line of credit (“Credit Agreement”) to be used for temporary or emergency purposes. Pursuant to the Credit Agreement, each participating fund is liable only for principal and interest payments related to borrowings made by that fund. Borrowings under the Credit Agreement bear interest at a rate equal to the prevailing federal funds rate plus the federal funds rate margin. The Fund did not utilize the line of credit during the six months ended September 30, 2009.
7. Fund Share Transactions:
At September 30, 2009, there were unlimited shares authorized at $0.001 par value for the Fund. Share transactions for the Fund were as follows:
| | | | | | | | | | | | | | |
| | | Six Months Ended
September 30, 2009 | | | Year Ended
March 31, 2009 | |
| | | Shares | | | Amount | | | Shares | | | Amount | |
Class AA | | | | | | | | | | | | | | |
Shares sold | | 702,985 | | | $ | 11,304,552 | | | 1,863,617 | | | $ | 28,855,036 | |
Shares issued on reinvestment | | 176,226 | | | | 2,839,007 | | | 431,972 | | | | 6,683,580 | |
Shares repurchased | | (445,416 | ) | | | (7,156,634 | ) | | (2,345,840 | ) | | | (35,795,611 | ) |
| | | | | | | | | | | | | | |
Net Increase (Decrease) | | 433,795 | | | $ | 6,986,925 | | | (50,251 | ) | | $ | (256,995 | ) |
| | | | | | | | | | | | | | |
Class C | | | | | | | | | | | | | | |
Shares sold | | 663,266 | | | $ | 10,669,788 | | | 126,699 | B | | $ | 1,972,745 | B |
Shares issued on reinvestment | | 5,517 | | | | 89,434 | | | 270 | B | | | 4,212 | B |
Shares repurchased | | (14,082 | ) | | | (227,165 | ) | | (852 | )B | | | (13,236 | )B |
| | | | | | | | | | | | | | |
Net Increase | | 654,701 | | | $ | 10,532,057 | | | 126,117 | B | | $ | 1,963,721 | B |
| | | | | | | | | | | | | | |
Class I C | | | | | | | | | | | | | | |
Shares sold | | 240,548 | | | $ | 3,863,210 | | | 211,466 | D | | $ | 3,303,003 | D |
Shares issued on reinvestment | | 2,061 | | | | 33,614 | | | 238 | D | | | 3,614 | D |
Shares repurchased | | (27,929 | ) | | | (446,848 | ) | | (158 | )D | | | (2,449 | )D |
| | | | | | | | | | | | | | |
Net Increase | | 214,680 | | | $ | 3,449,976 | | | 211,546 | D | | $ | 3,304,168 | D |
| | | | | | | | | | | | | | |
| A | On February 1, 2009, Primary Class shares were renamed Class A shares. |
| B | For the period February 5, 2009 (commencement of operations) to March 31, 2009. |
| C | Effective October 5, 2009, Institutional Class shares were renamed Class I shares. |
| D | For the period July 30, 2008 (commencement of operations) to March 31, 2009. |
Investment Manager
Legg Mason Partners Fund Advisor, LLC
New York, NY
Investment Sub-Adviser
Legg Mason Investment Counsel, LLC
Baltimore, MD
Board of Trustees
Mark R. Fetting, Chairman
David R. Odenath, President
Dr. Ruby P. Hearn
Arnold L. Lehman
Robin J.W. Masters
Dr. Jill E. McGovern
Arthur S. Mehlman
G. Peter O’Brien
S. Ford Rowan
Robert M. Tarola
Officers
R. Jay Gerken, Vice President
Kaprel Ozsolak, Chief Financial Officer and Treasurer
Robert I. Frenkel, Secretary and Chief Legal Officer
Ted P. Becker, Vice President and Chief Compliance Officer
Transfer and Shareholder Servicing Agent
Boston Financial Data Services, Inc.
Quincy, MA
Custodian
State Street Bank & Trust Company
Boston, MA
Counsel
K&L Gates LLP
Washington, DC
Independent Registered Public Accounting Firm
PricewaterhouseCoopers LLP
Baltimore, MD
Legg Mason Investment Counsel Maryland Tax-Free Income Trust
LEGG MASON INVESTMENT COUNSEL MARYLAND TAX-FREE INCOME TRUST
Legg Mason Funds
55 Water Street
New York, New York 10041
The Fund files its complete schedule of portfolio holdings with the Securities and Exchange Commission (“SEC”) for the first and third quarters of each fiscal year on Form N-Q. The Fund’s Forms N-Q are available on the SEC’s website at www.sec.gov. The Fund’s Forms N-Q may be reviewed and copied at the SEC’s Public Reference Room in Washington, D.C., and information on the operation of the Public Reference Room may be obtained by calling 1-800-SEC-0330. To obtain information on Form N-Q from the Fund, shareholders can call Funds Investor Services at 1-800-822-5544 or Institutional Shareholder Services at 1-888-425-6432.
Information on how the Fund voted proxies relating to portfolio securities during the prior 12-month period ended June 30th of each year and a description of the policies and procedures that the Fund uses to determine how to vote proxies related to portfolio transactions are available (1) without charge, upon request, by calling Funds Investor Services at 1-800-822-5544 or Institutional Shareholder Services at 1-888-425-6432, (2) on the Fund’s website at www.leggmason.com/individualinvestors and (3) on the SEC’s website at www.sec.gov.
This report is submitted for the general information of the shareholders of Legg Mason Investment Counsel Maryland Tax-Free Income Trust. This report is not authorized for distribution to prospective investors in the Fund unless preceded or accompanied by a current prospectus.
Investors should consider the Fund’s investment objectives, risks, charges and expenses carefully before investing. The prospectus contains this and other important information about the Fund. Please read the prospectus carefully before investing.
www.leggmason.com/individualinvestors
©2009 Legg Mason Investor Services, LLC
Member FINRA, SIPC
BUILT TO WINSM

At Legg Mason, we’ve assembled a collection of experienced investment management firms and empowered each of them with the tools, the resources and, most importantly, the independence to pursue the strategies they know best.
| • | | Each was purposefully chosen for their commitment to investment excellence. |
| • | | Each is focused on specific investment styles and asset classes. |
| • | | Each exhibits thought leadership in their chosen area of focus. |
Together, we’ve built a powerful portfolio of solutions for financial advisors and their clients. And it has made us a world leader in money management.*
| * | Ranked eleventh-largest money manager in the world, according to Pensions & Investments, May 18, 2009, based on 12/31/08 worldwide assets under management. |
www.leggmason.com/individualinvestors
©2009 Legg Mason Investor Services, LLC Member FINRA, SIPC
LMF-030/S (11/09) SR09-943
NOT PART OF THE SEMI-ANNUAL REPORT
| Item 2. | Code of Ethics Applicable to Registrant’s Principal Executive Officer and Principal Financial Officer |
Not applicable for semi-annual reports.
| Item 3. | Audit Committee Financial Expert |
Not applicable for semi-annual reports.
| Item 4. | Principal Accounting Fees and Services |
Not applicable for semi-annual reports.
| Item 5. | Audit Committee of Listed Registrants |
The Registrant is not a listed issuer as defined in Rule 10A-3 under the Securities Exchange Act of 1934.
| Item 6. | Schedule of Investments |
The schedule of investments in securities of unaffiliated issuers is included in the annual report.
| Item 7. | Disclosure of Proxy Voting Policies and Procedures for Closed-End Management Investment Companies |
Not applicable.
| Item 8. | Portfolio Managers of Closed-End Management Investment Companies |
Not applicable.
| Item 9. | Purchases of Equity Securities by Closed-End Management Investment Companies and Affiliated Purchasers |
Not applicable.
| Item 10. | Submission of Matters to a Vote of Security Holders |
The Nominating Committee will accept recommendations for nominations from shareholders. Shareholders may forward recommendations to the Fund Secretary at 100 International Drive, 7th Floor, Baltimore Maryland 21202, Attn.: Fund Secretary.
| Item 11. | Controls and Procedures |
| | (a) | The Registrant’s principal executive and principal financial officers have concluded, based on their evaluation of the effectiveness of the design and operation of the Registrant’s disclosure controls and procedures (as defined in Rule 30a-3(c) under the Investment Company Act of 1940) as of a date within 90 days of the filing date of this report, that the Registrant’s disclosure controls and procedures are reasonably designed to ensure that information required to be disclosed by the Registrant on Form N-CSR is recorded, processed, summarized and reported within the time periods specified in the SEC’s rule and forms and that information required to be disclosed by the Registrant in the reports that it files or submits on Form N-CSR is accumulated and communicated to the Registrant’s management, including its principal executive and principal financial officers, as appropriate to allow timely decisions regarding required disclosure. |
| | (b) | There were no changes in the Registrant’s internal control over financial reporting (as defined in Rule 30a-3(d) under the Investment Company Act of 1940) during the Registrant’s second fiscal quarter of the period covered by this report that have materially affected, or are reasonably likely to materially affect, the Registrant’s internal control over financial reporting. |
| | |
| (a) (1) | | Not applicable. |
| | Exhibit 99.CODE ETH |
| |
| (a) (2) | | Certifications pursuant to section 302 of the Sarbanes-Oxley Act of 2002 attached hereto. Exhibit 99.CERT |
| |
| (b) | | Certifications pursuant to Section 906 of the Sarbanes-Oxley Act of 2002 attached hereto. Exhibit 99.906CERT |
SIGNATURES
Pursuant to the requirements of the Securities Exchange Act of 1934 and the Investment Company Act of 1940, the Registrant has duly caused this report to be signed on its behalf by the undersigned, thereunto duly authorized.
| | |
| Legg Mason Investment Counsel Maryland Tax-Free Income Trust |
| | |
| |
| By: | | David R. Odenath |
| | David R. Odenath |
| | President, Legg Mason Investment Counsel Maryland Tax-Free Income Trust |
| |
Date: | | November 27, 2009 |
Pursuant to the requirements of the Securities Exchange Act of 1934 and the Investment Company Act of 1940, this report has been signed below by the following persons on behalf of the Registrant and in the capacities and on the dates indicated.
| | |
| |
| By: | | David R. Odenath |
| | David R. Odenath |
| | President, Legg Mason Investment Counsel Maryland Tax-Free Income Trust |
| |
| Date: | | November 27, 2009 |
| |
| By: | | Kaprel Ozsolak |
| | Kaprel Ozsolak |
| | Chief Financial Officer and Treasurer, Legg Mason Investment Counsel Maryland Tax-Free Income Trust |
| |
| Date: | | November 27, 2009 |