UNITED STATES
SECURITIES AND EXCHANGE COMMISSION
Washington, D.C. 20549
FORM N-CSR
CERTIFIED SHAREHOLDER REPORT OF REGISTERED
MANAGEMENT INVESTMENT COMPANIES
Investment Company Act file number 811-06223
Legg Mason Tax Free Income Fund
(Exact name of registrant as specified in charter)
55 Water Street, New York, NY 10041
(Address of principal executive offices) (Zip code)
Robert I. Frenkel, Esq.
Legg Mason & Co., LLC
100 First Stamford Place
Stamford, CT 06902
(Name and address of agent for service)
Registrant’s telephone number, including area code: 1-877-721-1926
Date of fiscal year end: March 31
Date of reporting period: September 30, 2011
| ITEM 1. | REPORT TO STOCKHOLDERS. |
The Semi-Annual Report to Stockholders is filed herewith.
September 30, 2011

Semi-Annual Repor t
Legg Mason
Investment Counsel
Maryland Tax-Free Income Trust
INVESTMENT PRODUCTS: NOT FDIC INSURED • NO BANK GUARANTEE • MAY LOSE VALUE
| | |
| II | | Legg Mason Investment Counsel Maryland Tax-Free Income Trust |
Fund objective
The Fund seeks a high level of current income exempt from federal and Maryland state and local income taxes*, consistent with prudent investment risk and preservation of capital.
| * | Certain investors may be subject to the federal alternative minimum tax (“AMT”), and state and local taxes may apply. Capital gains, if any, are fully taxable. Please consult your personal tax or legal adviser. |
Letter to our shareholders
Dear Shareholder,
We are pleased to provide the semi-annual report of Legg Mason Investment Counsel Maryland Tax-Free Income Trust for the six-month reporting period ended September 30, 2011. Please read on for Fund performance information and a detailed look at prevailing economic and market conditions during the Fund’s reporting period.
As always, we remain committed to providing you with excellent service and a full spectrum of investment choices. We also remain committed to supplementing the support you receive from your financial advisor. One way we accomplish this is through our website, www.leggmason.com/individualinvestors. Here you can gain immediate access to market and investment information, including:
| Ÿ | | Fund prices and performance, |
| Ÿ | | Market insights and commentaries from our portfolio managers, and |
| Ÿ | | A host of educational resources. |
We look forward to helping you meet your financial goals.
Sincerely,
| | |
 | |  |
| |
| Mark R. Fetting | | R. Jay Gerken, CFA |
| Chairman | | President |
October 28, 2011
| | | | |
| Legg Mason Investment Counsel Maryland Tax-Free Income Trust | | | III | |
Investment commentary
Economic review
Although the U.S. economy continued to grow over the six months ended September 30, 2011, the pace of the expansion was disappointing, which resulted in a significant shift in investor sentiment. During the first month of the period, there were expectations of an improving economy and generally robust investor risk appetite. However, as the reporting period progressed, weakening economic data, the downgrading of U.S. government securities by Standard & Poor’s (“S&P”) and the European debt crisis resulted in increased investor risk aversion.
U.S. gross domestic product (“GDP”)i growth, as reported by the U.S. Department of Commerce, has been less robust than during most other periods exiting a severe recession. GDP growth was 2.3% during the fourth quarter of 2010 and 3.0% for calendar 2010 as a whole. The Commerce Department then reported that first and second quarter 2011 GDP growth were 0.4% and 1.3%, respectively. This moderation in growth during the first half of the calendar year was due to a variety of factors, including less robust export activity and a deceleration in consumer spending given higher oil and food prices. The advance estimate for third quarter GDP growth was 2.5%. Accelerating growth was attributed, in part, to higher consumer spending, which grew 2.4% in the third quarter, versus a modest 0.7% gain in the second quarter.
Turning to the job market, while there was some modest improvement in early 2011 (before the reporting period began), unemployment again moved higher and remained elevated throughout the reporting period. After dipping below 9.0% in February and March 2011 (to 8.9% and 8.8%, respectively), unemployment, as reported by the U.S. Department of Labor, moved back to 9.0% in April. Unemployment stayed above 9.0% over the next five months and ended September at 9.1%. Additionally, as of the end of the reporting period, approximately fourteen million Americans looking for work had yet to find a job, and more than 44% of these individuals have been out of work for more than six months.
The housing market continued to experience challenges during the reporting period. Looking back, existing-home sales moved somewhat higher toward the end of 2010 and in January 2011, according to the National Association of Realtors (“NAR”). However, existing-home sales then declined during five of the next eight months. At the end of September, the inventory of unsold homes was an 8.5 month supply at the current sales level, versus an 8.4 month supply in August. Existing-home prices were weak versus a year ago, with the NAR reporting that the median existing-home price for all housing types was $165,400 in September 2011, down 3.5% from September 2010.
Even the manufacturing sector, one of the stalwarts of the economy in recent years, softened during much of the reporting period. Based on the Institute for Supply Management’s PMI (“PMI”)ii, the manufacturing sector grew twenty-six consecutive months since it began expanding in August 2009. In February 2011 (before the reporting period began), the manufacturing sector expanded at its fastest pace since May 2004, with a reading of 61.4 (a reading below 50 indicates a contraction, whereas a reading above 50 indicates an expansion). The PMI generally moderated during the reporting period, reaching a low of 50.6 in August — the worst reading in two years. Manufacturing activity then modestly increased to 51.6 in September.
Financial market overview
While lower-quality U.S. bonds generated positive results early in the reporting period, these gains were later erased. This setback was triggered by a variety of factors, including concerns regarding the global economy, the ongoing European sovereign debt crisis and the S&P down-
| | |
| IV | | Legg Mason Investment Counsel Maryland Tax-Free Income Trust |
Investment commentary (cont’d)
grade of U.S. Treasuries. Against this backdrop, investors sought refuge in higher-quality securities as their sentiment became generally more negative.
The Federal Reserve Board (“Fed”)iii took a number of actions as it sought to meet its dual mandate of fostering maximum employment and price stability. In November 2010 (prior to the beginning of the reporting period), the Fed announced a second round of quantitative easing (often referred to as “QE2”) to help stimulate the economy, entailing the purchase of $600 billion of long-term U.S. Treasury securities by the end of the second quarter of 2011.
In June, the Fed announced that QE2 would end on schedule at the end of the month. However, given ongoing strains on the economy, it made no overtures toward reversing any of its accommodative policies, and stated it would “maintain its existing policy of reinvesting principal payments from its securities holdings” rather than seeking to reduce the size of its balance sheet.
Also, as has been the case since December 2008, the Fed kept the federal funds rateiv at a historically low range between zero and 0.25%. In addition, in August 2011, the Fed declared its intention to keep the federal funds rate between zero and 0.25% until mid-2013.
At its meeting in September 2011, the Fed announced its intention to purchase $400 billion of longer-term Treasury securities and to sell an equal amount of shorter-term Treasury securities by June 2012 (often referred to as “Operation Twist”). The Fed said, “This program should put downward pressure on longer-term interest rates and help make broader financial conditions more accommodative.”
Fixed income market review
The spread sectors (non-Treasuries) began the reporting period on a positive note, as they rallied in April 2011. Risk aversion then increased given a host of disappointing economic data, a further escalation of the European sovereign debt crisis and the S&P rating downgrade of U.S. sovereign debt. While the spread sectors generally posted positive results during the six-month reporting period, they tended to underperform equal-durationv Treasuries.
Both short- and long-term Treasury yields fluctuated but, overall, moved lower during the six months ended September 30, 2011. When the period began, two- and ten-year Treasury yields were 0.80% and 3.47%, respectively. In the beginning of the reporting period, yields initially moved higher given expectations for stronger growth in 2011 and the potential for rising inflation, with two- and ten-year Treasury yields peaking at 0.85% and 3.59%, respectively, in April 2011. Yields then declined during much of the remainder of the period due to disappointing economic data and increased risk aversion. During the height of the flight to quality in September, two-year Treasuries hit their low for the reporting period of 0.16% and ten-year Treasuries reached their reporting period trough of 1.72%. When the period ended on September 30, 2011, two-year Treasury yields were 0.25% and ten-year Treasury yields were 1.92%.
The municipal bond market outperformed its taxable bond counterpart over the six months ended September 30, 2011. Over that period, the Barclays Capital Municipal Bond Indexvi and the Barclays Capital U.S. Aggregate Indexvii returned 7.85% and 6.20%, respectively. The municipal bond market outperformed the taxable bond market during five of the six months of the period given improving tax revenues, a sharp decline in new issuance, increased demand and low default rates. Additionally, investor sentiment improved as a number of states made progress toward shoring up their financial situation by raising taxes and cutting expenses.
| | | | |
| Legg Mason Investment Counsel Maryland Tax-Free Income Trust | | | V | |
Performance review
For the six months ended September 30, 2011, Class A shares of Legg Mason Investment Counsel Maryland Tax-Free Income Trust, excluding sales charges, returned 7.63%. The Fund’s unmanaged benchmark, the Barclays Capital Municipal Bond Index, returned 7.85% for the same period. The Lipper Maryland Municipal Debt Funds Category Average1 returned 7.84% over the same time frame.
Certain investors may be subject to the federal alternative minimum tax, and state and local taxes may apply. Capital gains, if any, are fully taxable. Please consult your personal tax or legal adviser.
| | | | |
Performance Snapshot as of September 30, 2011
(unaudited) | |
| (excluding sales charges) | | 6 months | |
| Legg Mason Investment Counsel Maryland Tax-Free Income Trust: | |
Class A | | | 7.63 | % |
Class C | | | 7.32 | % |
Class I | | | 7.80 | % |
| Barclays Capital Municipal Bond Index | | | 7.85 | % |
| Lipper Maryland Municipal Debt Funds Category Average | | | 7.84 | % |
The performance shown represents past performance. Past performance is no guarantee of future results and current performance may be higher or lower than the performance shown above. Principal value, investment returns and yields will fluctuate and investors’ shares, when redeemed, may be worth more or less than their original cost. To obtain performance data current to the most recent month-end, please visit our website at www.leggmason.com/individualinvestors.
All share class returns assume the reinvestment of all distributions, including returns of capital, if any, at net asset value and the deduction of all Fund expenses. Returns have not been adjusted to include sales charges that may apply or the deduction of taxes that a shareholder would pay on Fund distributions. If sales charges were reflected, the performance quoted would be lower. Performance figures for periods shorter than one year represent cumulative figures and are not annualized.
Fund performance figures reflect fee waivers and/or expense reimbursements, without which the performance would have been lower.
The 30-Day SEC Yields for the period ended September 30, 2011 for Class A, Class C and Class I shares were 3.15%, 2.69% and 3.47%, respectively. Absent fee waivers and/or expense reimbursements, the 30-Day SEC Yields for Class A, Class C and Class I shares would have been 2.94%, 2.47% and 3.21%, respectively. The 30-Day SEC Yield is subject to change and is based on the yield to maturity of the Fund’s investments over a 30-day period and not on the dividends paid by the Fund, which may differ.
|
| Total Annual Operating Expenses (unaudited) |
As of the Fund’s current prospectus dated July 31, 2011, the gross total annual operating expense ratios for Class A, Class C and Class I shares were 0.84%, 1.43% and 0.78%, respectively.
Actual expenses may be higher. For example, expenses may be higher than those shown if average net assets decrease. Net assets are more likely to decrease and Fund expense ratios are more likely to increase when markets are volatile.
As a result of expense limitation arrangements, the ratio of expenses, other than brokerage, interest, dividend expense on short sales, taxes, extraordinary expenses and acquired fund fees and expenses, to average net assets is not expected to exceed 0.70% for Class A shares, 1.25% for Class C shares and 0.45% for Class I shares. These expense limitation arrangements cannot be terminated prior to December 31, 2013 without the Board of Trustees’ consent.
The manager is permitted to recapture amounts waived or reimbursed to a class within three years after the year in which the manager earned the fee or incurred the expense if the class’ total annual operating expenses have fallen to a level below the expense limitation in effect at the time the fees were earned or the expenses incurred.
| 1 | Lipper, Inc., a wholly-owned subsidiary of Reuters, provides independent insight on global collective investments. Returns are based on the six-month period ended September 30, 2011, including the reinvestment of all distributions, including returns of capital, if any, calculated among the 35 funds in the Fund’s Lipper category, and excluding sales charges. |
| | |
| VI | | Legg Mason Investment Counsel Maryland Tax-Free Income Trust |
Investment commentary (cont’d)
As always, thank you for your confidence in our stewardship of your assets.
Sincerely,

R. Jay Gerken, CFA
President
October 28, 2011
RISKS: Bonds are subject to a variety of risks, including interest rate, credit and inflation risks. As interest rates rise, bond prices fall, reducing the value of a fixed-income investment. Municipal securities purchased by the Fund may be adversely affected by changes in the financial condition of municipal issuers and insurers, regulatory and political developments, uncertainties and public perceptions, and other factors. As a “non-diversified” fund, an investment in the Fund will entail greater price risk than an investment in a diversified fund because a higher percentage of investments among fewer issuers may result in greater fluctuation in the total market value of the Fund’s portfolio. Please see the Fund’s prospectus for a more complete discussion of these and other risks, and the Fund’s investment strategies.
All investments are subject to risk including the possible loss of principal. Past performance is no guarantee of future results. All index performance reflects no deduction for fees, expenses or taxes. Please note that an investor cannot invest directly in an index.
The information provided is not intended to be a forecast of future events, a guarantee of future results or investment advice. Views expressed may differ from those of the firm as a whole.
| i | Gross domestic product (“GDP”) is the market value of all final goods and services produced within a country in a given period of time. |
| ii | The Institute for Supply Management's PMI is based on a survey of purchasing executives who buy the raw materials for manufacturing at more than 350 companies. It offers an early reading on the health of the manufacturing sector. |
| iii | The Federal Reserve Board (“Fed”) is responsible for the formulation of policies designed to promote economic growth, full employment, stable prices and a sustainable pattern of international trade and payments. |
| iv | The federal funds rate is the rate charged by one depository institution on an overnight sale of immediately available funds (balances at the Federal Reserve) to another depository institution; the rate may vary from depository institution to depository institution and from day to day. |
| v | Duration is the measure of the price sensitivity of a fixed-income security to an interest rate change of 100 basis points. Calculation is based on the weighted average of the present values for all cash flows. |
| vi | The Barclays Capital Municipal Bond Index is a market value weighted index of investment grade municipal bonds with maturities of one year or more. |
| vii | The Barclays Capital U.S. Aggregate Index is a broad-based bond index comprised of government, corporate, mortgage- and asset-backed issues, rated investment grade or higher, and having at least one year to maturity. |
| | | | |
| Legg Mason Investment Counsel Maryland Tax-Free Income Trust 2011 Semi-Annual Report | | | 1 | |
Fund at a glance† (unaudited)
Investment breakdown (%) as a percent of total investments
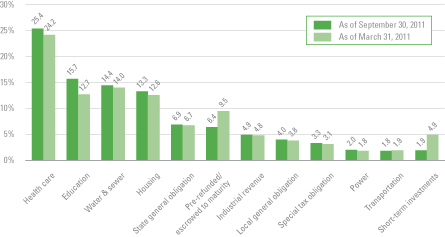
| † | The bar graph above represents the composition of the Fund’s investments as of September 30, 2011 and March 31, 2011. The Fund is actively managed. As a result, the composition of the Fund’s investments is subject to change at any time. |
| | |
| 2 | | Legg Mason Investment Counsel Maryland Tax-Free Income Trust 2011 Semi-Annual Report |
Fund expenses (unaudited)
Example
As a shareholder of the Fund, you may incur two types of costs: (1) transaction costs, including front-end and back-end sales charges (loads) on purchase payments; and (2) ongoing costs, including management fees; service and/or distribution (12b-1) fees; and other Fund expenses. This example is intended to help you understand your ongoing costs (in dollars) of investing in the Fund and to compare these costs with the ongoing costs of investing in other mutual funds.
This example is based on an investment of $1,000 invested on April 1, 2011 and held for the six months ended September 30, 2011.
Actual expenses
The table below titled “Based on Actual Total Return” provides information about actual account values and actual expenses. You may use the information provided in this table, together with the amount you invested, to estimate the expenses that you paid over the period. To estimate the expenses you paid on your account, divide your ending account value by $1,000 (for example, an $8,600 ending account value divided by $1,000 = 8.6), then multiply the result by the number under the heading entitled “Expenses Paid During the Period”.
Hypothetical example for comparison purposes
The table below titled “Based on Hypothetical Total Return” provides information about hypothetical account values and hypothetical expenses based on the actual expense ratio and an assumed rate of return of 5.00% per year before expenses, which is not the Fund’s actual return. The hypothetical account values and expenses may not be used to estimate the actual ending account balance or expenses you paid for the period. You may use the information provided in this table to compare the ongoing costs of investing in the Fund and other funds. To do so, compare the 5.00% hypothetical example relating to the Fund with the 5.00% hypothetical examples that appear in the shareholder reports of the other funds.
Please note that the expenses shown in the table below are meant to highlight your ongoing costs only and do not reflect any transactional costs, such as front-end or back-end sales charges (loads). Therefore, the table is useful in comparing ongoing costs only, and will not help you determine the relative total costs of owning different funds. In addition, if these transaction costs were included, your costs would have been higher.
| | | | | | | | | | | | | | | | | | | | | | | | | | | | | | | | | | | | | | | | | | | | |
| Based on actual total return1 | | | | | | | | Based on hypothetical total return1 | | | | |
| | | Actual Total
Return
Without
Sales
Charges2 | | | Beginning
Account
Value | | | Ending
Account
Value | | | Annualized
Expense
Ratio | | | Expenses
Paid
During
the
Period3 | | | | | | | Hypothetical
Annualized
Total Return | | | Beginning
Account
Value | | | Ending
Account
Value | | | Annualized
Expense
Ratio | | | Expenses
Paid
During
the
Period3 | |
| Class A | | | 7.63 | % | | $ | 1,000.00 | | | $ | 1,076.30 | | | | 0.64 | % | | $ | 3.32 | | | | | Class A | | | 5.00 | % | | $ | 1,000.00 | | | $ | 1,021.80 | | | | 0.64 | % | | $ | 3.23 | |
| Class C | | | 7.32 | | | | 1,000.00 | | | | 1,073.20 | | | | 1.24 | | | | 6.43 | | | | | Class C | | | 5.00 | | | | 1,000.00 | | | | 1,018.80 | | | | 1.24 | | | | 6.26 | |
| Class I | | | 7.80 | | | | 1,000.00 | | | | 1,078.00 | | | | 0.45 | | | | 2.34 | | | | | Class I | | | 5.00 | | | | 1,000.00 | | | | 1,022.75 | | | | 0.45 | | | | 2.28 | |
| 1 | For the six months ended September 30, 2011. |
| 2 | Assumes the reinvestment of all distributions, including the returns of capital, if any, at net asset value and does not reflect the deduction of the applicable sales charge with respect to Class A shares or the applicable contingent deferred sales charges (“CDSC”) with respect to Class C shares. Total return is not annualized, as it may not be representative of the total return for the year. Performance figures may reflect compensating balance arrangements, fee waivers and/or expense reimbursements. In the absence of compensating balance arrangements, fee waivers and/or expense reimbursements, the total return would have been lower. Past performance is no guarantee of future results. |
| 3 | Expenses (net of compensating balance arrangements, fee waivers and/or expense reimbursements) are equal to each class’ respective annualized expense ratio multiplied by the average account value over the period, multiplied by the number of days in the most recent fiscal half-year (183), then divided by 366. |
| | | | |
| Legg Mason Investment Counsel Maryland Tax-Free Income Trust 2011 Semi-Annual Report | | | 3 | |
Schedule of investments (unaudited)
September 30, 2011
Legg Mason Investment Counsel Maryland Tax-Free Income Trust
| | | | | | | | | | | | | | |
| Security | | Rate | | | Maturity
Date | | Face
Amount | | | Value | |
| Municipal Bonds — 95.3% | | | | | | | | | | | | | | |
Education — 15.2% | | | | | | | | | | | | | | |
City of Annapolis, Maryland, EDR and Refunding Revenue Bonds: | | | | | | | | | | | | | | |
St. John’s College Facility | | | 5.500 | % | | 10/1/18 | | $ | 220,000 | | | $ | 220,752 | |
St. John’s College Facility | | | 5.500 | % | | 10/1/23 | | | 490,000 | | | | 491,397 | |
St. John’s College Facility | | | 5.000 | % | | 10/1/27 | | | 1,135,000 | | | | 1,132,514 | |
St. John’s College Facility | | | 5.000 | % | | 10/1/36 | | | 2,465,000 | | | | 2,399,826 | |
Maryland Health & Higher EFA Revenue Bonds: | | | | | | | | | | | | | | |
College of Notre Dame of Maryland Issue, NATL | | | 5.300 | % | | 10/1/18 | | | 925,000 | | | | 1,043,594 | |
Loyola College Issue | | | 5.000 | % | | 10/1/40 | | | 2,000,000 | | | | 2,050,800 | |
Maryland Institute College of Art | | | 5.000 | % | | 6/1/36 | | | 5,000,000 | | | | 4,868,350 | |
Maryland Institute College of Art | | | 5.000 | % | | 6/1/42 | | | 800,000 | | | | 768,448 | |
The Johns Hopkins University Issue | | | 5.000 | % | | 7/1/33 | | | 3,000,000 | | | | 3,111,630 | |
Maryland State EDC, Student Housing Revenue Bonds: | | | | | | | | | | | | | | |
University of Maryland, College Park Projects | | | 5.750 | % | | 6/1/33 | | | 500,000 | | | | 510,755 | |
University of Maryland, College Park Projects | | | 5.800 | % | | 6/1/38 | | | 1,500,000 | | | | 1,522,170 | |
Maryland State EDC, Utility Infrastructure Revenue: | | | | | | | | | | | | | | |
University of Maryland, College Park Project | | | 5.000 | % | | 7/1/16 | | | 3,700,000 | | | | 4,130,125 | |
University of Maryland, College Park Project | | | 5.000 | % | | 7/1/17 | | | 1,000,000 | | | | 1,126,010 | |
University System of Maryland Auxiliary Facility and Tuition Revenue Bonds | | | 5.000 | % | | 10/1/21 | | | 2,500,000 | | | | 2,835,350 | |
Westminster, Maryland, Education Facilities Refunding Revenue Bonds, McDaniel College Inc. | | | 5.000 | % | | 11/1/31 | | | 3,500,000 | | | | 3,329,550 | |
Total Education | | | | | | | | | | | | | 29,541,271 | |
Health Care — 24.7% | | | | | | | | | | | | | | |
Baltimore County, Maryland, Revenue Bonds, Catholic Health Initiatives | | | 5.000 | % | | 9/1/20 | | | 1,050,000 | | | | 1,152,133 | |
Maryland State Health & Higher EFA Revenue: | | | | | | | | | | | | | | |
Carroll County General Hospital Issue | | | 6.000 | % | | 7/1/37 | | | 1,000,000 | | | | 1,006,280 | |
Suburban Hospital | | | 5.500 | % | | 7/1/16 | | | 500,000 | | | | 547,240 | |
Maryland State Health & Higher EFA Revenue Bonds: | | | | | | | | | | | | | | |
Anne Arundel Health System | | | 6.750 | % | | 7/1/29 | | | 2,000,000 | | | | 2,275,760 | |
Board of Child Care Issue | | | 5.500 | % | | 7/1/18 | | | 1,110,000 | | | | 1,131,878 | |
Calvert Health Systems Issue | | | 5.500 | % | | 7/1/39 | | | 2,000,000 | | | | 2,043,600 | |
Carroll County General Hospital Issue | | | 5.750 | % | | 7/1/22 | | | 1,000,000 | | | | 1,010,580 | |
Carroll County General Hospital Issue | | | 6.000 | % | | 7/1/26 | | | 2,000,000 | | | | 2,022,280 | |
Carroll County General Hospital Issue | | | 5.750 | % | | 7/1/27 | | | 1,050,000 | | | | 1,056,762 | |
Carroll County General Hospital Issue | | | 5.800 | % | | 7/1/32 | | | 2,000,000 | | | | 2,010,720 | |
College of Notre Dame of Maryland | | | 4.000 | % | | 10/1/25 | | | 1,645,000 | | | | 1,648,701 | |
See Notes to Financial Statements.
| | |
| 4 | | Legg Mason Investment Counsel Maryland Tax-Free Income Trust 2011 Semi-Annual Report |
Schedule of investments (unaudited) (cont’d)
September 30, 2011
Legg Mason Investment Counsel Maryland Tax-Free Income Trust
| | | | | | | | | | | | | | |
| Security | | Rate | | | Maturity
Date | | Face
Amount | | | Value | |
Health Care — continued | | | | | | | | | | | | | | |
Helix Health Issue, AMBAC | | | 5.250 | % | | 8/15/38 | | $ | 3,000,000 | | | $ | 3,100,980 | |
Johns Hopkins Medical Institutions | | | 5.000 | % | | 5/15/35 | | | 1,300,000 | | | | 1,361,958 | |
Johns Hopkins Medicine, Howard County General Hospital Acquisition Issue, NATL | | | 5.000 | % | | 7/1/29 | | | 2,000,000 | | | | 2,000,440 | |
Mercy Medical Center Inc. | | | 5.500 | % | | 7/1/42 | | | 3,445,000 | | | | 3,316,295 | |
Peninsula Regional Medical Center Issue | | | 5.000 | % | | 7/1/19 | | | 1,000,000 | | | | 1,063,580 | |
Peninsula Regional Medical Center Issue | | | 5.000 | % | | 7/1/26 | | | 2,435,000 | | | | 2,492,539 | |
Refunding, Kennedy Krieger Issue | | | 5.125 | % | | 7/1/22 | | | 3,000,000 | | | | 2,949,960 | |
Refunding, MedStar Health Issue | | | 5.500 | % | | 8/15/25 | | | 785,000 | | | | 824,297 | |
Refunding, Mercy Ridge | | | 4.750 | % | | 7/1/34 | | | 3,200,000 | | | | 2,859,936 | |
The Johns Hopkins Hospital Issue | | | 0.000 | % | | 7/1/19 | | | 4,000,000 | | | | 2,989,120 | |
Union Hospital of Cecil County Issue | | | 5.500 | % | | 7/1/22 | | | 250,000 | | | | 252,723 | |
University of Maryland Medical System | | | 5.000 | % | | 7/1/34 | | | 1,000,000 | | | | 1,020,500 | |
University of Maryland Medical System | | | 5.000 | % | | 7/1/41 | | | 1,500,000 | | | | 1,516,275 | |
Washington County Hospital Association | | | 5.000 | % | | 1/1/17 | | | 500,000 | | | | 526,290 | |
Washington County Hospital Issue | | | 4.000 | % | | 1/1/15 | | | 1,000,000 | | | | 1,026,250 | |
Washington County Hospital Issue | | | 4.750 | % | | 1/1/16 | | | 1,000,000 | | | | 1,047,990 | |
Washington County Hospital Issue | | | 5.250 | % | | 1/1/23 | | | 500,000 | | | | 513,325 | |
Washington County Hospital Issue | | | 5.750 | % | | 1/1/38 | | | 2,000,000 | | | | 1,999,800 | |
Washington County Hospital Issue | | | 6.000 | % | | 1/1/43 | | | 1,000,000 | | | | 1,010,760 | |
Total Health Care | | | | | | | | | | | | | 47,778,952 | |
Housing — 12.9% | | | | | | | | | | | | | | |
Community Development Administration, Maryland Department of Housing and Community Development Residential Revenue Bonds | | | 5.200 | % | | 9/1/22 | | | 1,790,000 | | | | 1,790,609 | (a) |
Community Development Administration, Maryland Department of Housing and Community Development Residential Revenue Bonds | | | 5.375 | % | | 9/1/22 | | | 145,000 | | | | 145,061 | (a) |
Community Development Administration, Maryland Department of Housing and Community Development Residential Revenue Bonds | | | 5.375 | % | | 9/1/24 | | | 2,000,000 | | | | 2,000,660 | (a) |
Community Development Administration, Maryland Department of Housing and Community Development Residential Revenue Bonds | | | 4.500 | % | | 9/1/29 | | | 2,490,000 | | | | 2,495,777 | |
Community Development Administration, Maryland Department of Housing and Community Development Residential Revenue Bonds | | | 4.750 | % | | 9/1/29 | | | 1,000,000 | | | | 1,015,850 | |
Community Development Administration, Maryland Department of Housing and Community Development Residential Revenue Bonds | | | 5.050 | % | | 9/1/39 | | | 1,980,000 | | | | 1,998,295 | |
See Notes to Financial Statements.
| | | | |
| Legg Mason Investment Counsel Maryland Tax-Free Income Trust 2011 Semi-Annual Report | | | 5 | |
Legg Mason Investment Counsel Maryland Tax-Free Income Trust
| | | | | | | | | | | | | | |
| Security | | Rate | | | Maturity
Date | | Face
Amount | | | Value | |
Housing — continued | | | | | | | | | | | | | | |
Maryland State Community Development Administration, Department of Housing & Community Development | | | 5.375 | % | | 9/1/39 | | $ | 1,500,000 | | | $ | 1,531,560 | |
Maryland State Community Development Administration, Department of Housing & Community Development | | | 4.800 | % | | 9/1/42 | | | 4,165,000 | | | | 4,021,724 | (a) |
Maryland State Community Development Administration, Department of Housing and Community Development, Local Government Infrastructure | | | 4.000 | % | | 6/1/30 | | | 5,485,000 | | | | 5,538,637 | |
Montgomery County, Maryland, Revenue Bonds: | | | | | | | | | | | | | | |
Housing Opportunities Commission, Single Family Mortgage | | | 4.875 | % | | 7/1/25 | | | 1,000,000 | | | | 1,037,590 | |
Housing Opportunities Commission, Single Family Mortgage | | | 5.000 | % | | 7/1/27 | | | 1,395,000 | | | | 1,402,547 | (a) |
Montgomery County, MD, Housing Opportunities Commission, Multi-Family Revenue, Housing Development | | | 4.625 | % | | 7/1/41 | | | 2,000,000 | | | | 2,015,560 | |
Total Housing | | | | | | | | | | | | | 24,993,870 | |
Industrial Revenue — 4.7% | | | | | | | | | | | | | | |
IDA of Prince George’s County, Maryland, Subordinated Lease Revenue Bonds: | | | | | | | | | | | | | | |
Upper Marlboro Justice Center Expansion Project, NATL | | | 5.125 | % | | 6/30/15 | | | 3,340,000 | | | | 3,604,228 | |
Upper Marlboro Justice Center Expansion Project, NATL | | | 5.000 | % | | 6/30/19 | | | 1,000,000 | | | | 1,062,220 | |
Maryland EDC, EDR, Lutheran World Relief Inc. and Immigration and Refugee Service | | | 5.250 | % | | 4/1/29 | | | 565,000 | | | | 539,490 | |
Maryland IDA, EDR Bonds, National Aquarium in Baltimore Facility | | | 5.000 | % | | 11/1/19 | | | 500,000 | | | | 500,290 | |
Maryland IDA, Refunding Revenue Bonds, American Center for Physics Headquarters Facility | | | 5.250 | % | | 12/15/15 | | | 320,000 | | | | 322,877 | |
Puerto Rico Commonwealth Government Development Bank, NATL | | | 4.750 | % | | 12/1/15 | | | 3,000,000 | | | | 3,121,950 | |
Total Industrial Revenue | | | | | | | | | | | | | 9,151,055 | |
Local General Obligation — 3.8% | | | | | | | | | | | | | | |
Anne Arundel County, Maryland, GO Bonds, Consolidated General Improvement Bonds | | | 4.500 | % | | 3/1/23 | | | 1,000,000 | | | | 1,105,850 | |
Baltimore County, Maryland, GO Bonds | | | 4.000 | % | | 8/1/23 | | | 1,270,000 | | | | 1,409,332 | |
Baltimore County, Maryland, GO Bonds, Metropolitan District Bonds, 70th Issue | | | 4.250 | % | | 9/1/26 | | | 1,000,000 | | | | 1,053,330 | |
Frederick County, Maryland, GO Bonds, Public Facilities Refunding Bonds | | | 5.000 | % | | 7/1/15 | | | 1,000,000 | | | | 1,158,400 | |
Howard County, Maryland, GO Bonds, Consolidated Public Improvement Project and Refunding Bonds | | | 5.000 | % | | 8/15/19 | | | 1,000,000 | | | | 1,226,170 | |
See Notes to Financial Statements.
| | |
| 6 | | Legg Mason Investment Counsel Maryland Tax-Free Income Trust 2011 Semi-Annual Report |
Schedule of investments (unaudited) (cont’d)
September 30, 2011
Legg Mason Investment Counsel Maryland Tax-Free Income Trust
| | | | | | | | | | | | | | |
| Security | | Rate | | | Maturity
Date | | Face
Amount | | | Value | |
Local General Obligation — continued | | | | | | | | | | | | | | |
Mayor and City Council of Baltimore, City of Baltimore, Maryland, GO Bonds, Consolidated Public Improvement Refunding Bonds, FGIC | | | 0.000 | % | | 10/15/11 | | $ | 940,000 | | | $ | 939,840 | |
Queen Anne’s County, Maryland, Public Facilities Refunding Bonds, NATL | | | 5.000 | % | | 11/15/16 | | | 500,000 | | | | 576,640 | |
Total Local General Obligation | | | | | | | | | | | | | 7,469,562 | |
Power — 2.0% | | | | | | | | | | | | | | |
Puerto Rico Electric Power Authority, Power Revenue | | | 5.000 | % | | 7/1/28 | | | 3,740,000 | | | | 3,816,707 | |
Pre-Refunded/Escrowed to Maturity — 6.2% | | | | | | | | | | | | | | |
City of Baltimore, Maryland, Mayor and City Council of Baltimore, Project and Refunding Revenue Bonds, Water Projects | | | 5.000 | % | | 7/1/24 | | | 3,800,000 | | | | 4,785,682 | (b) |
Maryland State Health & Higher EFA Revenue: | | | | | | | | | | | | | | |
Howard County General Hospital Issue | | | 5.500 | % | | 7/1/21 | | | 2,825,000 | | | | 3,058,458 | (b) |
LifeBridge Health Issue | | | 5.250 | % | | 7/1/18 | | | 1,640,000 | | | | 1,849,707 | (c) |
University of Maryland Medical Systems | | | 6.000 | % | | 7/1/32 | | | 1,000,000 | | | | 1,042,490 | (c) |
Maryland-National Capital Park and Planning Commission, Prince George’s County, Maryland, Park Acquisition and Development GO Bonds | | | 5.125 | % | | 5/1/21 | | | 1,310,000 | | | | 1,314,755 | (c) |
Total Pre-Refunded/Escrowed to Maturity | | | | | | | | | | | | | 12,051,092 | |
Special Tax Obligation — 3.3% | | | | | | | | | | | | | | |
Frederick County, MD, Special Obligation, Urbana Community Development Authority | | | 5.000 | % | | 7/1/30 | | | 3,000,000 | | | | 3,046,470 | |
Puerto Rico Sales Tax Financing Corp., Sales Tax Revenue | | | 5.500 | % | | 8/1/28 | | | 2,000,000 | | | | 2,180,040 | |
Puerto Rico Sales Tax Financing Corp., Sales Tax Revenue | | | 6.000 | % | | 8/1/39 | | | 1,000,000 | | | | 1,090,660 | |
Total Special Tax Obligation | | | | | | | | | | | | | 6,317,170 | |
State General Obligation — 6.7% | | | | | | | | | | | | | | |
Commonwealth of Puerto Rico, GO Bonds: | | | | | | | | | | | | | | |
Public Improvement Bonds | | | 5.000 | % | | 7/1/25 | | | 2,000,000 | | | | 2,015,100 | |
Public Improvement Bonds | | | 6.000 | % | | 7/1/39 | | | 5,000,000 | | | | 5,177,650 | |
State of Maryland, GO Bonds, State and Local Facilities Loan | | | 5.500 | % | | 3/1/15 | | | 5,000,000 | | | | 5,813,600 | |
Total State General Obligation | | | | | | | | | | | | | 13,006,350 | |
Transportation — 1.8% | | | | | | | | | | | | | | |
Department of Transportation of Maryland, Consolidated Transportation Bonds | | | 5.500 | % | | 2/1/15 | | | 3,000,000 | | | | 3,470,970 | |
See Notes to Financial Statements.
| | | | |
| Legg Mason Investment Counsel Maryland Tax-Free Income Trust 2011 Semi-Annual Report | | | 7 | |
Legg Mason Investment Counsel Maryland Tax-Free Income Trust
| | | | | | | | | | | | | | |
| Security | | Rate | | | Maturity
Date | | Face
Amount | | | Value | |
Water & Sewer — 14.0% | | | | | | | | | | | | | | |
City of Baltimore, Maryland, Mayor and City Council of Baltimore, Project and Refunding Revenue Bonds: | | | | | | | | | | | | | | |
Wastewater Projects, FGIC | | | 5.000 | % | | 7/1/22 | | $ | 1,910,000 | | | $ | 2,225,245 | |
Water Projects, FGIC | | | 5.000 | % | | 7/1/24 | | | 1,890,000 | | | | 2,201,944 | |
Water Projects, FGIC | | | 5.125 | % | | 7/1/42 | | | 1,000,000 | | | | 1,008,990 | |
City of Baltimore, Maryland, Mayor and City Council of Baltimore, Project and Revenue Bonds, Wastewater Projects, AGM | | | 5.000 | % | | 7/1/33 | | | 4,000,000 | | | | 4,295,080 | |
City of Baltimore, Maryland, Project Revenue Bonds, Water Projects, AMBAC | | | 5.000 | % | | 7/1/23 | | | 1,000,000 | | | | 1,131,700 | |
Northeast Maryland Waste Disposal Authority, Solid Waste Revenue, AMBAC | | | 5.500 | % | | 4/1/16 | | | 3,425,000 | | | | 3,643,241 | (a) |
Washington Suburban Sanitary District, Maryland, Montgomery and Prince George’s Counties, Water Supply Refunding Bonds | | | 5.250 | % | | 6/1/16 | | | 1,650,000 | | | | 1,963,220 | |
Washington Suburban Sanitary District, Maryland, Montgomery and Prince George’s Counties, Water Supply Refunding Bonds | | | 5.750 | % | | 6/1/17 | | | 2,000,000 | | | | 2,482,500 | |
Washington Suburban Sanitary District, Maryland, Montgomery and Prince George’s Counties, Water Supply Refunding Bonds | | | 6.000 | % | | 6/1/18 | | | 2,705,000 | | | | 3,451,553 | |
Washington Suburban Sanitary District, Maryland, Montgomery and Prince George’s Counties, Water Supply Refunding Bonds | | | 6.000 | % | | 6/1/19 | | | 3,665,000 | | | | 4,730,819 | |
Total Water & Sewer | | | | | | | | | | | | | 27,134,292 | |
Total Investments before Short-Term Investments (Cost — $171,621,915) | | | | 184,731,291 | |
| Short-Term Investments — 1.9% | | | | | | | | | | | | | | |
General Obligation — 1.0% | | | | | | | | | | | | | | |
Washington Suburban Sanitation District, MD, GO, BAN, SPA-Helaba | | | 0.220 | % | | 6/1/23 | | | 1,800,000 | | | | 1,800,000 | (d)(e) |
Health Care — 0.8% | | | | | | | | | | | | | | |
Maryland State Health & Higher EFA Revenue, Johns Hopkins University | | | 0.080 | % | | 7/1/36 | | | 1,600,000 | | | | 1,600,000 | (d)(e) |
Industrial Revenue — 0.1% | | | | | | | | | | | | | | |
Maryland State EDC Revenue, American Urological Association | | | 0.370 | % | | 9/1/32 | | | 190,000 | | | | 190,000 | (d)(e) |
Total Short-Term Investments (Cost — $3,590,000) | | | | | | | | | | 3,590,000 | |
Total Investments — 97.2 % (Cost — $175,211,915#) | | | | | | | | | | | | | 188,321,291 | |
Other Assets in Excess of Liabilities — 2.8% | | | | | | | | | | | | | 5,431,492 | |
Total Net Assets — 100.0% | | | | | | | | | | | | $ | 193,752,783 | |
See Notes to Financial Statements.
| | |
| 8 | | Legg Mason Investment Counsel Maryland Tax-Free Income Trust 2011 Semi-Annual Report |
Schedule of investments (unaudited) (cont’d)
September 30, 2011
Legg Mason Investment Counsel Maryland Tax-Free Income Trust
| (a) | Income from this issue is considered a preference item for purposes of calculating the alternative minimum tax (“AMT”). |
| (b) | Bonds are escrowed to maturity by government securities and/or U.S. government agency securities and are considered by the manager to be triple-A rated even if issuer has not applied for new ratings. |
| (c) | Pre-Refunded bonds are escrowed with U.S. government obligations and/or U.S. government agency securities and are considered by the manager to be triple-A rated even if issuer has not applied for new ratings. |
| (d) | Variable rate demand obligations have a demand feature under which the Fund can tender them back to the issuer or liquidity provider on no more than 7 days notice. |
| (e) | Maturity date shown is the final maturity date. The security may be sold back to the issuer before final maturity. |
| # | Aggregate cost for federal income tax purposes is substantially the same. |
| | |
Abbreviations used in this schedule: |
| AGM | | — Assured Guaranty Municipal Corporation — Insured Bonds |
| AMBAC | | — American Municipal Bond Assurance Corporation — Insured Bonds |
| BAN | | — Bond Anticipation Notes |
| EDC | | — Economic Development Corporation |
| EDR | | — Economic Development Revenue |
| EFA | | — Educational Facilities Authority |
| FGIC | | — Financial Guaranty Insurance Company — Insured Bonds |
| GO | | — General Obligation |
| IDA | | — Industrial Development Authority |
| NATL | | — National Public Finance Guarantee Corporation — Insured Bonds |
| SPA | | — Standby Bond Purchase Agreement — Insured Bonds |
| | | | |
| Ratings table* | | | |
| Standard & Poor’s/Moody’s/Fitch** | | | | |
| AAA/Aaa | | | 18.2 | % |
| AA/Aa | | | 33.3 | |
| A | | | 24.9 | |
| BBB/Baa | | | 20.7 | |
| A-1/VMIG 1 | | | 1.9 | |
| NR | | | 1.0 | |
| | | | 100.0 | % |
| * | As a percentage of total investments. |
| ** | The ratings shown are based on each portfolio security’s rating as determined by Standard & Poor’s, Moody’s or Fitch, each a Nationally Recognized Statistical Rating Organization (“NRSRO”). These ratings are the opinions of the NRSRO and are not measures of quality or guarantees of performance. Securities may be rated by other NRSROs, and these ratings may be higher or lower. In the event that a security is rated by multiple NRSROs and receives different ratings, the Fund will treat the security as being rated in the highest rating category received from a NRSRO. |
| | See pages 9 through 13 for definitions of ratings. |
See Notes to Financial Statements.
| | | | |
| Legg Mason Investment Counsel Maryland Tax-Free Income Trust 2011 Semi-Annual Report | | | 9 | |
Bond ratings
The definitions of the applicable rating symbols are set forth below:
Long-term security ratings (unaudited)
Standard & Poor’s Ratings Service (“Standard & Poor’s”) Long-term Issue Credit Ratings — Ratings from “AA” to “CCC” may be modified by the addition of a plus (+) or minus (–) sign to show relative standings within the major rating categories.
AAA | — | An obligation rated “AAA” has the highest rating assigned by Standard & Poor’s. The obligor’s capacity to meet its financial commitment on the obligation is extremely strong. |
AA | — | An obligation rated “AA” differs from the highest-rated obligations only to a small degree. The obligor’s capacity to meet its financial commitment on the obligation is very strong. |
A | — | An obligation rated “A” is somewhat more susceptible to the adverse effects of changes in circumstances and economic conditions than obligations in higher-rated categories. However, the obligor’s capacity to meet its financial commitment on the obligation is still strong. |
BBB | — | An obligation rated “BBB” exhibits adequate protection parameters. However, adverse economic conditions or changing circumstances are more likely to lead to a weakened capacity of the obligor to meet its financial commitment on the obligation. |
BB | — | An obligation rated “BB” is less vulnerable to nonpayment than other speculative issues. However, it faces major ongoing uncertainties or exposure to adverse business, financial, or economic conditions, which could lead to the obligor’s inadequate capacity to meet its financial commitment on the obligation. |
B | — | An obligation rated “B” is more vulnerable to nonpayment than obligations rated “BB”, but the obligor currently has the capacity to meet its financial commitment on the obligation. Adverse business, financial, or economic conditions will likely impair the obligor’s capacity or willingness to meet its financial commitment on the obligation. |
CCC | — | An obligation rated “CCC” is currently vulnerable to nonpayment, and is dependent upon favorable business, financial, and economic conditions for the obligor to meet its financial commitment on the obligation. In the event of adverse business, financial, or economic conditions, the obligor is not likely to have the capacity to meet its financial commitment on the obligation. |
CC | — | An obligation rated “CC” is currently highly vulnerable to nonpayment. |
C | — | The “C” rating may be used to cover a situation where a bankruptcy petition has been filed or similar action has been taken, but payments on this obligation are being continued. |
D | — | An obligation rated “D” is in payment default. The “D” rating category is used when payments on an obligation are not made on the date due, even if the applicable grace period has not expired, unless Standard & Poor’s believes that such payments will be made during |
| | |
| 10 | | Legg Mason Investment Counsel Maryland Tax-Free Income Trust 2011 Semi-Annual Report |
Long-term security ratings (unaudited) (cont’d)
| | such grace period. The “D” rating also will be used upon the filing of a bankruptcy petition or the taking of a similar action if payments of an obligation are jeopardized. |
Moody’s Investors Service (“Moody’s”) Long-term Obligation Ratings — Numerical modifiers 1, 2 and 3 may be applied to each generic rating from “Aa” to “Caa,” where 1 is the highest and 3 the lowest ranking within its generic category.
Aaa | — | Obligations rated “Aaa” are judged to be of the highest quality, with minimal credit risk. |
Aa | — | Obligations rated “Aa” are judged to be of high quality and are subject to very low credit risk. |
A | — | Obligations rated “A” are considered upper-medium grade and are subject to low credit risk. | |
Baa | — | Obligations rated “Baa” are subject to moderate credit risk. They are considered medium grade and as such may possess certain speculative characteristics. |
Ba | — | Obligations rated “Ba” are judged to have speculative elements and are subject to substantial credit risk. |
B | — | Obligations rated “B” are considered speculative and are subject to high credit risk. |
Caa | — | Obligations rated “Caa” are judged to be of poor standing and are subject to very high credit risk. |
Ca | — | Obligations rated “Ca” are highly speculative and are likely in, or very near, default, with some prospect of recovery for principal and interest. |
C | — | Obligations rated “C” are the lowest rated class and are typically in default, with little prospect of recovery for principal and interest. |
Fitch Ratings Service (“Fitch”) Structured, Project & Public Finance Obligations — Ratings from “AA” to “CCC” may be modified by the addition of a plus (+) or minus (–) sign to show relative standings within the major rating categories.
AAA | — | Obligations rated “AAA” by Fitch denote the lowest expectation of default risk. They are assigned only in cases of exceptionally strong capacity for payment of financial commitments. This capacity is highly unlikely to be adversely affected by foreseeable events. |
AA | — | Obligations rated “AA” denote expectations of very low default risk. They indicate very strong capacity for payment of financial commitments. This capacity is not significantly vulnerable to foreseeable events. |
A | — | Obligations rated “A” denote expectations of low default risk. The capacity for payment of financial commitments is considered strong. This capacity may, nevertheless, be more vulnerable to adverse business or economic conditions than is the case for higher ratings. |
BBB | — | Obligations rated “BBB” indicate that expectations of default risk are currently low. The capacity for payment of financial commitments is considered adequate but adverse business or economic conditions are more likely to impair this capacity. |
| | | | |
| Legg Mason Investment Counsel Maryland Tax-Free Income Trust 2011 Semi-Annual Report | | | 11 | |
BB | — | Obligations rated “BB” indicate an elevated vulnerability to default risk, particularly in the event of adverse changes in business or economic conditions over time; however, business or financial flexibility exists which supports the servicing of financial commitments. |
B | — | Obligations rated “B” indicate that material default risk is present, but a limited margin of safety remains. Financial commitments are currently being met; however, capacity for continued payment is vulnerable to deterioration in the business and economic environment. |
CCC | — | Default is a real possibility. |
CC | — | Default of some kind appears probable. |
C | — | Default is imminent or inevitable, or the issuer is in standstill. |
NR | — | Indicates that the obligation is not rated by Standard & Poor’s, Moody’s or Fitch. |
Short-term security ratings (unaudited)
Standard & Poor’s Municipal Short-Term Notes Ratings
SP-1 | — | A short-term obligation rated “SP-1” is rated in the highest category by Standard & Poor’s. Strong capacity to pay principal and interest. An issue determined to possess a very strong capacity to pay debt service is given a plus (+) designation. |
SP-2 | — | A short-term obligation rated “SP-2” is a Standard & Poor’s rating indicating satisfactory capacity to pay principal and interest, with some vulnerability to adverse financial and economic changes over the term of the notes. |
SP-3 | — | A short-term obligation rated “SP-3” is a Standard & Poor’s rating indicating speculative capacity to pay principal and interest. |
Standard & Poor’s Short-Term Issues Credit Ratings
A-1 | — | A short-term obligation rated “A-1” is rated in the highest category by Standard & Poor’s. The obligor’s capacity to meet its financial commitment on the obligation is strong. Within this category, certain obligations are designated with a plus sign (+). This indicates that the obligor’s capacity to meet its financial commitment on these obligations is extremely strong. |
A-2 | — | A short-term obligation rated “A-2” by Standard & Poor’s is somewhat more susceptible to the adverse effects of changes in circumstances and economic conditions than obligations in higher rating categories. However, the obligor’s capacity to meet its financial commitment on the obligation is satisfactory. |
A-3 | — | A short-term obligation rated “A-3” by Standard & Poor’s exhibits adequate protection parameters. However, adverse economic conditions or changing circumstances are more likely to lead to a weakened capacity of the obligor to meet its financial commitment on the obligation. |
| | |
| 12 | | Legg Mason Investment Counsel Maryland Tax-Free Income Trust 2011 Semi-Annual Report |
Short-term security ratings (unaudited) (cont’d)
B | — | A short-term obligation rated “B” by Standard & Poor’s is regarded as having significant speculative characteristics. Ratings of “B-1”, “B-2” and “B-3” may be assigned to indicate finer distinctions within the “B” category. The obligor currently has the capacity to meet its financial commitment on the obligation; however, it faces major ongoing uncertainties which could lead to the obligor’s inadequate capacity to meet its financial commitment on the obligation. |
Moody’s Variable Rate Demand Obligations (VRDO) Ratings
VMIG 1 | — | Moody’s highest rating for issues having a variable rate demand feature — VRDO. This designation denotes superior credit quality. Excellent protection is afforded by the superior short-term credit strength of the liquidity provider and structural and legal protections that ensure the timely payment of purchase price on demand. |
VMIG 2 | — | This designation denotes strong credit quality. Good protection is afforded by the strong short-term credit strength of the liquidity provider and structural and legal protections that ensure the timely payment of purchase price on demand. |
VMIG 3 | — | This designation denotes acceptable credit quality. Adequate protection is afforded by the strong short-term credit strength of the liquidity provider and structural and legal protections that ensure the timely payment of purchase price on demand. |
Moody’s Short-Term Municipal Obligations Ratings
MIG 1 | — | Moody’s highest rating for short-term municipal obligations. This designation denotes superior credit quality. Excellent protection is afforded by established cash flows, highly reliable liquidity support, or demonstrated broad-based access to the market for refinancing. |
MIG 2 | — | This designation denotes strong credit quality. Margins of protection are ample, although not as large as the preceding group. |
MIG 3 | — | This designation denotes acceptable credit quality. Liquidity and cash flow protection may be narrow, and market access for refinancing is likely to be less well-established. |
SG | — | This designation denotes speculative-grade credit quality. Debt instruments in this category may lack sufficient margins of protection. |
Moody’s Short-Term Obligations Ratings
P-1 | — | Moody’s highest rating for commercial paper and for VRDO prior to the advent of the VMIG 1 rating. Have a superior ability to repay short-term debt obligations. |
P-2 | — | Have a strong ability to repay short-term debt obligations. |
P-3 | — | Have an acceptable ability to repay short-term debt obligations. |
NP | — | Issuers do not fall within any of the Prime rating categories. |
Fitch’s Short-Term Issuer or Obligations Ratings
F1 | — | Fitch’s highest rating indicating the strongest intrinsic capacity for timely payment of financial commitments; may have an added “+” to denote any exceptionally strong credit feature. |
| | | | |
| Legg Mason Investment Counsel Maryland Tax-Free Income Trust 2011 Semi-Annual Report | | | 13 | |
F2 | — | Fitch rating indicating good intrinsic capacity for timely payment of financial commitments. |
F3 | — | Fitch rating indicating intrinsic capacity for timely payment of financial commitments is adequate. |
NR | — | Indicates that the obligation is not rated by Standard & Poor’s, Moody’s or Fitch. |
| | |
| 14 | | Legg Mason Investment Counsel Maryland Tax-Free Income Trust 2011 Semi-Annual Report |
Statement of assets and liabilities (unaudited)
September 30, 2011
| | | | |
|
| Assets: | |
Investments, at value (Cost — $175,211,915) | | $ | 188,321,291 | |
Cash | | | 3,467,324 | |
Interest receivable | | | 2,320,672 | |
Receivable for Fund shares sold | | | 187,678 | |
Prepaid expenses | | | 21,662 | |
Other assets | | | 1,404 | |
Total Assets | | | 194,320,031 | |
| |
| Liabilities: | | | | |
Payable for Fund shares repurchased | | | 319,844 | |
Investment management fee payable | | | 52,181 | |
Distributions payable | | | 50,836 | |
Service and/or distribution fees payable | | | 34,801 | |
Accrued expenses | | | 109,586 | |
Total Liabilities | | | 567,248 | |
| Total Net Assets | | $ | 193,752,783 | |
| |
| Net Assets: | | | | |
Par value (Note 8) | | $ | 11,605 | |
Paid-in capital in excess of par value | | | 181,383,870 | |
Undistributed net investment income | | | 22,162 | |
Accumulated net realized loss on investments | | | (774,230) | |
Net unrealized appreciation on investments | | | 13,109,376 | |
| Total Net Assets | | $ | 193,752,783 | |
| |
| Shares Outstanding: | | | | |
Class A | | | 8,762,956 | |
Class C | | | 1,748,894 | |
Class I | | | 1,093,544 | |
| |
| Net Asset Value: | | | | |
Class A (and redemption price) | | | $16.69 | |
Class C* | | | $16.69 | |
Class I (and redemption price) | | | $16.70 | |
| Maximum Public Offering Price Per Share: | | | | |
Class A (based on maximum initial sales charge of 4.25%) | | | $17.43 | |
| * | Redemption price per share is NAV of Class C shares reduced by a 1.00% CDSC if shares are redeemed within one year from purchase payment (See Note 2). |
See Notes to Financial Statements.
| | | | |
| Legg Mason Investment Counsel Maryland Tax-Free Income Trust 2011 Semi-Annual Report | | | 15 | |
Statement of operations (unaudited)
For the Six Months Ended September 30, 2011
| | | | |
|
| Investment Income: | |
Interest | | $ | 4,426,206 | |
| |
| Expenses: | | | | |
Investment management fee (Note 2) | | | 521,784 | |
Service and/or distribution fees (Notes 2 and 5) | | | 210,108 | |
Transfer agent fees (Note 5) | | | 47,741 | |
Registration fees | | | 20,318 | |
Shareholder reports | | | 20,059 | |
Legal fees | | | 16,569 | |
Trustees’ fees | | | 15,432 | |
Custody fees | | | 15,180 | |
Audit and tax | | | 14,729 | |
Fund accounting fees | | | 671 | |
Insurance | | | 589 | |
Miscellaneous expenses | | | 7,120 | |
Total Expenses | | | 890,300 | |
Less: Fee waivers and/or expense reimbursements (Notes 2 and 5) | | | (210,869) | |
Net Expenses | | | 679,431 | |
| Net Investment Income | | | 3,746,775 | |
| |
| Unrealized Gain on Investments (Notes 1 and 3): | | | | |
Change in Net Unrealized Appreciation (Depreciation) on Investments | | | 10,200,619 | |
| Increase in Net Assets from Operations | | $ | 13,947,394 | |
See Notes to Financial Statements.
| | |
| 16 | | Legg Mason Investment Counsel Maryland Tax-Free Income Trust 2011 Semi-Annual Report |
Statements of changes in net assets
| | | | | | | | |
For the Six Months Ended September 30, 2011 (unaudited) and the Year Ended March 31, 2011 | | September 30 | | | March 31 | |
|
| Operations: | |
Net investment income | | $ | 3,746,775 | | | $ | 7,749,813 | |
Net realized loss | | | — | | | | (262,061) | |
Change in net unrealized appreciation (depreciation) | | | 10,200,619 | | | | (8,444,657) | |
Increase (Decrease) in Net Assets From Operations | | | 13,947,394 | | | | (956,905) | |
| | |
| Distributions to Shareholders From (Notes 1 and 7): | | | | | | | | |
Net investment income | | | (3,746,775) | | | | (7,749,813) | |
Decrease in Net Assets From Distributions to Shareholders | | | (3,746,775) | | | | (7,749,813) | |
| | |
| Fund Share Transactions (Note 8): | | | | | | | | |
Net proceeds from sale of shares | | | 11,516,956 | | | | 36,499,368 | |
Reinvestment of distributions | | | 3,430,168 | | | | 6,994,545 | |
Cost of shares repurchased | | | (18,355,097) | | | | (45,637,540) | |
Decrease in Net Assets From Fund Share Transactions | | | (3,407,973) | | | | (2,143,627) | |
Increase (Decrease) in Net Assets | | | 6,792,646 | | | | (10,850,345) | |
| | |
| Net Assets: | | | | | | | | |
Beginning of period | | | 186,960,137 | | | | 197,810,482 | |
End of period* | | $ | 193,752,783 | | | $ | 186,960,137 | |
* Includes undistributed net investment income of: | | | $22,162 | | | | $22,162 | |
See Notes to Financial Statements.
| | | | |
| Legg Mason Investment Counsel Maryland Tax-Free Income Trust 2011 Semi-Annual Report | | | 17 | |
Financial highlights
| | | | | | | | | | | | | | | | | | | | | | | | |
For a share of each class of beneficial interest outstanding throughout each year ended March 31,
unless otherwise noted: | |
| Class A Shares1 | | 20112 | | | 2011 | | | 2010 | | | 2009 | | | 2008 | | | 2007 | |
| | | | | | |
| Net asset value, beginning of period | | | $15.82 | | | | $16.50 | | | | $15.58 | | | | $15.89 | | | | $16.28 | | | | $16.25 | |
| | | | | | |
| Income (loss) from operations: | | | | | | | | | | | | | | | | | | | | | | | | |
Net investment income | | | 0.33 | | | | 0.64 | | | | 0.63 | | | | 0.68 | | | | 0.67 | | | | 0.68 | |
Net realized and unrealized gain (loss) | | | 0.87 | | | | (0.68) | | | | 0.92 | | | | (0.31) | | | | (0.39) | | | | 0.06 | |
Total income (loss) from operations | | | 1.20 | | | | (0.04) | | | | 1.55 | | | | 0.37 | | | | 0.28 | | | | 0.74 | |
| | | | | | |
| Less distributions from: | | | | | | | | | | | | | | | | | | | | | | | | |
Net investment income | | | (0.33) | | | | (0.64) | | | | (0.63) | | | | (0.68) | | | | (0.67) | | | | (0.68) | |
Net realized gains | | | — | | | | — | | | | — | | | | — | | | | (0.00) | 3 | | | (0.03) | |
Total distributions | | | (0.33) | | | | (0.64) | | | | (0.63) | | | | (0.68) | | | | (0.67) | | | | (0.71) | |
| | | | | | |
| Net asset value, end of period | | | $16.69 | | | | $15.82 | | | | $16.50 | | | | $15.58 | | | | $15.89 | | | | $16.28 | |
Total return4 | | | 7.63 | % | | | (0.32) | % | | | 10.08 | % | | | 2.46 | % | | | 1.76 | % | | | 4.64 | % |
| | | | | | |
| Net assets, end of period (000s) | | | $146,296 | | | | $145,959 | | | | $168,589 | | | | $145,672 | | | | $149,392 | | | | $144,559 | |
| | | | | | |
| Ratios to average net assets: | | | | | | | | | | | | | | | | | | | | | | | | |
Gross expenses | | | 0.86 | %5 | | | 0.84 | % | | | 0.89 | % | | | 1.03 | % | | | 0.96 | % | | | 0.97 | % |
Net expenses6,7,8 | | | 0.64 | 5 | | | 0.63 | | | | 0.65 | | | | 0.70 | | | | 0.70 | | | | 0.70 | |
Net investment income | | | 4.03 | 5 | | | 3.88 | | | | 3.88 | | | | 4.40 | | | | 4.15 | | | | 4.16 | |
| | | | | | |
| Portfolio turnover rate | | | 2 | % | | | 15 | % | | | 6 | % | | | 8 | % | | | 6 | % | | | 9 | % |
| 1 | Per share amounts have been calculated using the average shares method. |
| 2 | For the six months ended September 30, 2011 (unaudited). |
| 3 | Amount represents less than $0.005 per share. |
| 4 | Performance figures, exclusive of sales charges, may reflect compensating balance arrangements, fee waivers and/or expense reimbursements. In the absence of compensating balance arrangements, fee waivers and/or expense reimbursements, the total return would have been lower. Past performance is no guarantee of future results. Total returns for periods of less than one year are not annualized. |
| 6 | As a result of an expense limitation arrangement, the ratio of expenses, other than brokerage, interest, dividend expense on short sales, taxes, extraordinary expenses and acquired fund fees and expenses, to average net assets of Class A shares did not exceed 0.70%. This expense limitation arrangement cannot be terminated prior to December 31, 2013 without the Board of Trustees’ consent. |
| 7 | Reflects fee waivers and/or expense reimbursements. |
| 8 | The impact of compensating balance arrangements, if any, was less than 0.01%. |
See Notes to Financial Statements.
| | |
| 18 | | Legg Mason Investment Counsel Maryland Tax-Free Income Trust 2011 Semi-Annual Report |
Financial highlights (cont’d)
| | | | | | | | | | | | | | | | |
For a share of each class of beneficial interest outstanding throughout each year ended March 31, unless otherwise noted: | |
| Class C Shares1 | | 20112 | | | 2011 | | | 2010 | | | 20093 | |
| | | | |
| Net asset value, beginning of period | | | $15.82 | | | | $16.50 | | | | $15.58 | | | | $15.59 | |
| | | | |
| Income (loss) from operations: | | | | | | | | | | | | | | | | |
Net investment income | | | 0.28 | | | | 0.54 | | | | 0.52 | | | | 0.07 | |
Net realized and unrealized gain (loss) | | | 0.87 | | | | (0.68) | | | | 0.94 | | | | 0.01 | |
Total income (loss) from operations | | | 1.15 | | | | (0.14) | | | | 1.46 | | | | 0.08 | |
| | | | |
| Less distributions from: | | | | | | | | | | | | | | | | |
Net investment income | | | (0.28) | | | | (0.54) | | | | (0.54) | | | | (0.09) | |
Total distributions | | | (0.28) | | | | (0.54) | | | | (0.54) | | | | (0.09) | |
| | | | |
| Net asset value, end of period | | | $16.69 | | | | $15.82 | | | | $16.50 | | | | $15.58 | |
Total return4 | | | 7.32 | % | | | (0.90) | % | | | 9.44 | % | | | 0.53 | % |
| | | | |
| Net assets, end of period (000s) | | | $29,196 | | | | $28,186 | | | | $21,000 | | | | $1,965 | |
| | | | |
| Ratios to average net assets: | | | | | | | | | | | | | | | | |
Gross expenses | | | 1.45 | %5 | | | 1.43 | % | | | 1.52 | % | | | 1.99 | %5 |
Net expenses6,7,8 | | | 1.24 | 5 | | | 1.21 | | | | 1.20 | | | | 1.17 | 5 |
Net investment income | | | 3.43 | 5 | | | 3.31 | | | | 3.22 | | | | 3.51 | 5 |
| | | | |
| Portfolio turnover rate | | | 2 | % | | | 15 | % | | | 6 | % | | | 8 | % |
| 1 | Per share amounts have been calculated using the average shares method. |
| 2 | For the six months ended September 30, 2011 (unaudited). |
| 3 | For the period February 5, 2009 (inception date) to March 31, 2009. |
| 4 | Performance figures, exclusive of CDSC, may reflect compensating balance arrangements, fee waivers and/or expense reimbursements. In the absence of compensating balance arrangements, fee waivers and/or expense reimbursements, the total return would have been lower. Past performance is no guarantee of future results. Total returns for periods of less than one year are not annualized. |
| 6 | As a result of an expense limitation arrangement, the ratio of expenses, other than brokerage, interest, dividend expense on short sales, taxes, extraordinary expenses and acquired fund fees and expenses, to average net assets of Class C shares did not exceed 1.25%. This expense limitation arrangement cannot be terminated prior to December 31, 2013 without the Board of Trustees’ consent. |
| 7 | Reflects fee waivers and/or expense reimbursements. |
| 8 | The impact of compensating balance arrangements, if any, was less than 0.01%. |
See Notes to Financial Statements.
| | | | |
| Legg Mason Investment Counsel Maryland Tax-Free Income Trust 2011 Semi-Annual Report | | | 19 | |
| | | | | | | | | | | | | | | | |
For a share of each class of beneficial interest outstanding throughout each year ended March 31, unless otherwise noted: | |
| Class I Shares1,2 | | 20113 | | | 2011 | | | 2010 | | | 20094 | |
| | | | |
| Net asset value, beginning of period | | | $15.82 | | | | $ 16.51 | | | | $15.58 | | | | $15.83 | |
| | | | |
| Income (loss) from operations: | | | | | | | | | | | | | | | | |
Net investment income | | | 0.34 | | | | 0.67 | | | | 0.66 | | | | 0.47 | |
Net realized and unrealized gain (loss) | | | 0.88 | | | | (0.69) | | | | 0.94 | | | | (0.24) | |
Total income (loss) from operations | | | 1.22 | | | | (0.02) | | | | 1.60 | | | | 0.23 | |
| | | | |
| Less distributions from: | | | | | | | | | | | | | | | | |
Net investment income | | | (0.34) | | | | (0.67) | | | | (0.67) | | | | (0.48) | |
Total distributions | | | (0.34) | | | | (0.67) | | | | (0.67) | | | | (0.48) | |
| | | | |
| Net asset value, end of period | | | $16.70 | | | | $15.82 | | | | $16.51 | | | | $15.58 | |
Total return5 | | | 7.80 | % | | | (0.21) | % | | | 10.38 | % | | | 1.58 | % |
| | | | |
| Net assets, end of period (000s) | | | $18,261 | | | | $12,815 | | | | $8,221 | | | | $3,296 | |
| | | | |
| Ratios to average net assets: | | | | | | | | | | | | | | | | |
Gross expenses | | | 0.73 | %6 | | | 0.78 | % | | | 0.90 | % | | | 1.22 | %6 |
Net expenses7,8,9 | | | 0.45 | 6 | | | 0.45 | | | | 0.45 | | | | 0.45 | 6 |
Net investment income | | | 4.20 | 6 | | | 4.08 | | | | 4.04 | | | | 4.72 | 6 |
| | | | |
| Portfolio turnover rate | | | 2 | % | | | 15 | % | | | 6 | % | | | 8 | % |
| 1 | Effective October 5, 2009, Institutional Class shares were renamed as Class I shares. |
| 2 | Per share amounts have been calculated using the average shares method. |
| 3 | For the six months ended September 30, 2011 (unaudited). |
| 4 | For the period July 30, 2008 (inception date) to March 31, 2009. |
| 5 | Performance figures may reflect compensating balance arrangements, fee waivers and/or expense reimbursements. In the absence of compensating balance arrangements, fee waivers and/or expense reimbursements, the total return would have been lower. Past performance is no guarantee of future results. Total returns for periods of less than one year are not annualized. |
| 7 | As a result of an expense limitation arrangement, the ratio of expenses, other than brokerage, interest, dividend expense on short sales, taxes, extraordinary expenses and acquired fund fees and expenses, to average net assets of Class I shares did not exceed 0.45%. This expense limitation arrangement cannot be terminated prior to December 31, 2013 without the Board of Trustees’ consent. |
| 8 | Reflects fee waivers and/or expense reimbursements. |
| 9 | The impact of compensating balance arrangements, if any, was less than 0.01%. |
See Notes to Financial Statements.
| | |
| 20 | | Legg Mason Investment Counsel Maryland Tax-Free Income Trust 2011 Semi-Annual Report |
Notes to financial statements (unaudited)
1. Organization and significant accounting policies
Legg Mason Investment Counsel Maryland Tax-Free Income Trust (the “Fund”) is a separate non-diversified investment series of Legg Mason Tax-Free Income Fund (the “Trust”). The Trust, a Massachusetts business trust, is registered under the Investment Company Act of 1940, as amended (the “1940 Act”), as an open-end management investment company.
The following are significant accounting policies consistently followed by the Fund and are in conformity with U.S. generally accepted accounting principles (“GAAP”). Estimates and assumptions are required to be made regarding assets, liabilities and changes in net assets resulting from operations when financial statements are prepared. Changes in the economic environment, financial markets and any other parameters used in determining these estimates could cause actual results to differ. Subsequent events have been evaluated through the date the financial statements were issued.
(a) Investment valuation. The valuations for fixed income securities and certain derivative instruments are typically the prices supplied by independent third party pricing services, which may use market prices or broker/dealer quotations or a variety of fair valuation techniques and methodologies. Short-term fixed income securities that will mature in 60 days or less are valued at amortized cost, unless it is determined that using this method would not reflect an investment’s fair value. Equity securities for which market quotations are available are valued at the last reported sales price or official closing price on the primary market or exchange on which they trade. If independent third party pricing services are unable to supply prices for a portfolio investment, or if the prices supplied are deemed by the manager to be unreliable, the market price may be determined by the manager using quotations from one or more broker/dealers. When reliable prices are not readily available, such as when the value of a security has been significantly affected by events after the close of the exchange or market on which the security is principally traded, but before the Fund calculates its net asset value, the Fund values these securities as determined in accordance with procedures approved by the Fund’s Board of Trustees.
The Fund has adopted Financial Accounting Standards Board Codification Topic 820 (“ASC Topic 820”). ASC Topic 820 establishes a single definition of fair value, creates a three-tier hierarchy as a framework for measuring fair value based on inputs used to value the Fund’s investments, and requires additional disclosure about fair value. The hierarchy of inputs is summarized below.
| Ÿ | | Level 1 — quoted prices in active markets for identical investments |
| Ÿ | | Level 2 — other significant observable inputs (including quoted prices for similar investments, interest rates, prepayment speeds, credit risk, etc.) |
| Ÿ | | Level 3 — significant unobservable inputs (including the Fund’s own assumptions in determining the fair value of investments) |
The inputs or methodology used for valuing securities are not necessarily an indication of the risk associated with investing in those securities.
| | | | |
| Legg Mason Investment Counsel Maryland Tax-Free Income Trust 2011 Semi-Annual Report | | | 21 | |
The Fund uses valuation techniques to measure fair value that are consistent with the market approach and/or income approach, depending on the type of security and the particular circumstance. The market approach uses prices and other relevant information generated by market transactions involving identical or comparable securities. The income approach uses valuation techniques to discount estimated future cash flows to present value.
The following is a summary of the inputs used in valuing the Fund’s assets carried at fair value:
| | | | | | | | | | | | | | | | |
| ASSETS | |
| Description | | Quoted Prices (Level 1) | | | Other Significant
Observable Inputs (Level 2) | | | Significant
Unobservable
Inputs (Level 3) | | | Total | |
| Municipal bonds† | | | — | | | $ | 184,731,291 | | | | — | | | $ | 184,731,291 | |
| Short-term investments† | | | — | | | | 3,590,000 | | | | — | | | | 3,590,000 | |
| Total investments | | | — | | | $ | 188,321,291 | | | | — | | | $ | 188,321,291 | |
| † | See Schedule of Investments for additional detailed categorizations. |
(b) Concentration risk. The Fund invests substantially all of its assets in securities issued by or on behalf of the State of Maryland, its political subdivisions, municipalities, agencies, instrumentalities, and public authorities. Changes in economic conditions in, or governmental policies of, the State of Maryland could have a significant impact on the performance of the Fund.
The Fund may focus a significant amount of its investments in a single sector of the municipal securities market. In doing so, the Fund is more susceptible to factors adversely affecting that sector than a fund not following that practice.
The Fund may invest a significant portion of assets in securities issued by local governments or public authorities that are rated according to their particular creditworthiness, which may vary significantly from the state’s general obligations. The value of the Fund’s shares will be more susceptible to being materially impacted by a single economic, political or regulatory event affecting those issuers or their securities than shares of a diversified fund.
(c) Security transactions and investment income. Security transactions are accounted for on a trade date basis. Interest income, adjusted for amortization of premium and accretion of discount, is recorded on the accrual basis. The cost of investments sold is determined by use of the specific identification method. To the extent any issuer defaults or a credit event occurs that impacts the issuer, the Fund may halt any additional interest income accruals and consider the realizability of interest accrued up to the date of default or credit event.
(d) Distributions to shareholders. Distributions from net investment income of the Fund are declared each business day to shareholders of record, and are paid monthly. The Fund intends to satisfy conditions that will enable interest from municipal securities, which is exempt from federal and certain state income taxes, to retain such tax-exempt status when distributed to the shareholders of the Fund.
| | |
| 22 | | Legg Mason Investment Counsel Maryland Tax-Free Income Trust 2011 Semi-Annual Report |
Notes to financial statements (unaudited) (cont’d)
Distributions of net realized gains, if any, are taxable and are declared at least annually. Distributions to shareholders of the Fund are recorded on the ex-dividend date and are determined in accordance with income tax regulations, which may differ from GAAP.
(e) Share class accounting. Investment income, common expenses and realized/unrealized gains (losses) on investments are allocated to the various classes of the Fund on the basis of daily net assets of each class. Fees relating to a specific class are charged directly to that share class.
(f) Compensating balance arrangements. The Fund has an arrangement with its custodian bank whereby a portion of the custodian’s fees is paid indirectly by credits earned on the Fund’s cash on deposit with the bank.
(g) Federal and other taxes. It is the Fund’s policy to comply with the federal income and excise tax requirements of the Internal Revenue Code of 1986 (the “Code”), as amended, applicable to regulated investment companies. Accordingly, the Fund intends to distribute its taxable income and net realized gains, if any, to shareholders in accordance with timing requirements imposed by the Code. Therefore, no federal or state income tax provision is required in the Fund’s financial statements.
Management has analyzed the Fund’s tax positions taken on income tax returns for all open tax years and has concluded that as of September 30, 2011, no provision for income tax is required in the Fund’s financial statements. The Fund’s federal and state income and federal excise tax returns for tax years for which the applicable statutes of limitations have not expired are subject to examination by Internal Revenue Service and state departments of revenue.
(h) Reclassification. GAAP requires that certain components of net assets be reclassified to reflect permanent differences between financial and tax reporting. These reclassifications have no effect on net assets or net asset value per share.
2. Investment management agreement and other transactions with affiliates
Legg Mason Partners Fund Advisor, LLC (“LMPFA”) is the Fund’s investment manager and Legg Mason Investment Counsel, LLC (“LMIC”) is the Fund’s subadviser. LMPFA and LMIC are wholly-owned subsidiaries of Legg Mason, Inc. (“Legg Mason”).
Under the investment management agreement, the Fund pays an investment management fee, calculated daily and paid monthly, at an annual rate of 0.55% of the Fund’s average daily net assets.
LMIC serves as investment adviser to the Fund pursuant to a sub-advisory agreement with LMPFA. LMPFA (not the Fund) pays LMIC a fee, computed daily and payable monthly, at an annual rate of 0.50% of the Fund’s average daily net assets, net of any fee waivers and/or expense reimbursements.
As a result of expense limitation arrangements between the Fund and LMPFA, the ratio of expenses other than brokerage, interest, dividend expense on short sales,
| | | | |
| Legg Mason Investment Counsel Maryland Tax-Free Income Trust 2011 Semi-Annual Report | | | 23 | |
taxes, extraordinary expenses and acquired fund fees and expenses, to average net assets of Class A, C and I shares did not exceed 0.70%, 1.25% and 0.45%, respectively. These expense limitation arrangements cannot be terminated prior to December 31, 2013 without the Board of Trustees’ consent.
During the six months ended September 30, 2011, fees waived and/or expenses reimbursed amounted to $210,869.
The investment manager is permitted to recapture amounts previously waived or reimbursed to a class within three years in which the investment manager earned the fee or incurred the expense if the class’ total annual operating expenses have fallen to a level below the expense limitation (“expense cap”) in effect at the time the fees were earned or the expense incurred. In no case will the investment manager recapture any amount that would result, on any particular business day of the Fund, in the class’ total annual operating expenses exceeding the expense cap or any other lower limit then in effect.
Pursuant to these arrangements, at September 30, 2011, the Fund had remaining fee waivers and expense reimbursements subject to recapture by LMPFA and respective dates of expiration as follows:
| | | | | | | | | | | | |
| | | Class A | | | Class C | | | Class I | |
| Expires March 31, 2012 | | $ | 484,832 | | | $ | 984 | | | $ | 4,731 | |
| Expires March 31, 2013 | | | 375,161 | | | | 37,313 | | | | 28,403 | |
| Expires March 31, 2014 | | | 355,243 | | | | 59,025 | | | | 37,384 | |
| Expires March 31, 2015 | | | 157,300 | | | | 31,324 | | | | 22,245 | |
| Fee waivers/expense reimbursements subject to recapture | | $ | 1,372,536 | | | $ | 128,646 | | | $ | 92,763 | |
During the six months ended September 30, 2011, LMPFA did not recapture any fees.
Legg Mason Investor Services, LLC (“LMIS”), a wholly-owned broker-dealer subsidiary of Legg Mason, serves as the Fund’s sole and exclusive distributor.
There is a maximum initial sales charge of 4.25% for Class A shares. There is a contingent deferred sales charge (“CDSC”) of 1.00% on Class C shares, which applies if redemption occurs within one year from purchase payment. In certain cases, Class A shares have a 1.00% CDSC, which applies if redemption occurs within one year from purchase payment. This CDSC only applies to those purchases of Class A shares, which, when combined with current holdings of other shares of funds sold by LMIS, equal or exceed $1,000,000 in the aggregate. These purchases do not incur an initial sales charge.
For the six months ended September 30, 2011, LMIS and its affiliates received sales charges of approximately $5,000 on sales of the Fund’s Class A shares. In addition, for the six months ended September 30, 2011, CDSCs paid to LMIS and its affiliates for Class C shares were approximately $1,000.
| | |
| 24 | | Legg Mason Investment Counsel Maryland Tax-Free Income Trust 2011 Semi-Annual Report |
Notes to financial statements (unaudited) (cont’d)
Under a Deferred Compensation Plan (the “Plan”), Trustees may elect to defer receipt of all or a specified portion of their compensation. A participating Trustee may select one or more funds managed by affiliates of Legg Mason in which his or her deferred Trustee’s fees will be deemed to be invested. Deferred amounts remain in the Fund until distributed in accordance with the Plan.
All officers and two Trustees of the Trust are employees of Legg Mason or its affiliates and do not receive compensation from the Trust.
3. Investments
During the six months ended September 30, 2011, the aggregate cost of purchases and proceeds from sales of investments (excluding short-term investments) were as follows:
| | | | |
| Purchases | | $ | 4,104,669 | |
| Sales | | | 6,000,000 | |
At September 30, 2011, the aggregate gross unrealized appreciation and depreciation of investments for federal income tax purposes were substantially as follows:
| | | | |
| Gross unrealized appreciation | | $ | 13,363,825 | |
| Gross unrealized depreciation | | | (254,449) | |
| Net unrealized appreciation | | $ | 13,109,376 | |
4. Derivative instruments and hedging activities
Financial Accounting Standards Board Codification Topic 815 requires enhanced disclosure about an entity’s derivative and hedging activities.
During the six months ended September 30, 2011, the Fund did not invest in any derivative instruments.
5. Class specific expenses, waivers and/or expense reimbursements
The Fund has adopted Rule 12b-1 distribution plans and under those plans the Fund pays a service fee with respect to its Class A and Class C shares calculated at the annual rate of 0.15% and 0.25% of the average daily net assets of each respective class. The Fund also pays a distribution fee with respect to its Class C shares calculated at the annual rate of 0.45% of the average daily net assets of its Class C shares. Service and distribution fees are accrued daily and paid monthly.
For the six months ended September 30, 2011, class specific expenses were as follows:
| | | | | | | | |
| | | Service and/or
Distribution Fees | | | Transfer Agent
Fees | |
| Class A | | $ | 108,843 | | | $ | 29,891 | |
| Class C | | | 101,265 | | | | 12,568 | |
| Class I | | | — | | | | 5,282 | |
| Total | | $ | 210,108 | | | $ | 47,741 | |
| | | | |
| Legg Mason Investment Counsel Maryland Tax-Free Income Trust 2011 Semi-Annual Report | | | 25 | |
For the six months ended September 30, 2011, waivers and/or expense reimbursements by class were as follows:
| | | | |
| | | Waivers/Expense
Reimbursements | |
| Class A | | $ | 157,300 | |
| Class C | | | 31,324 | |
| Class I | | | 22,245 | |
| Total | | $ | 210,869 | |
6. Line of credit
The Fund, along with certain other Legg Mason Funds, participates in a $200 million line of credit (“Credit Agreement”) to be used for temporary or emergency purposes. This 364-day revolving Credit Agreement matures on March 1, 2012. Pursuant to the Credit Agreement, each participating fund is liable only for principal and interest payments related to borrowings made by that fund. Borrowings under the Credit Agreement bear interest at a rate equal to the prevailing LIBOR rate plus the LIBOR rate margin. The Fund did not utilize the line of credit during the six months ended September 30, 2011.
7. Distributions to shareholders by class
| | | | | | | | |
| | | Six Months Ended
September 30, 2011 | | | Year Ended
March 31, 2011 | |
| Net Investment Income: | |
| Class A | | $ | 2,921,402 | | | $ | 6,388,169 | |
| Class C | | | 495,884 | | | | 898,715 | |
| Class I | | | 329,489 | | | | 462,929 | |
| Total | | $ | 3,746,775 | | | $ | 7,749,813 | |
8. Shares of beneficial interest
At September 30, 2011, the Trust had an unlimited number of shares of beneficial interest authorized with a par value of $0.001 per share. The Fund has the ability to issue multiple classes of shares. Each class of shares represents an identical interest and has the same rights, except that each class bears certain direct expenses, including those specifically related to the distribution of its shares.
Transactions in shares of each class were as follows:
| | | | | | | | | | | | | | | | |
| | | Six Months Ended
September 30, 2011 | | | Year Ended
March 31, 2011 | |
| | | Shares | | | Amount | | | Shares | | | Amount | |
| Class A | |
| Shares sold | | | 200,615 | | | $ | 3,262,675 | | | | 953,704 | | | $ | 15,798,472 | |
| Shares issued on reinvestment | | | 168,694 | | | | 2,759,146 | | | | 361,143 | | | | 5,942,046 | |
| Shares repurchased | | | (833,038) | | | | (13,523,254) | | | | (2,304,579) | | | | (37,638,646) | |
| Net decrease | | | (463,729) | | | $ | (7,501,433) | | | | (989,732) | | | $ | (15,898,128) | |
| | |
| 26 | | Legg Mason Investment Counsel Maryland Tax-Free Income Trust 2011 Semi-Annual Report |
Notes to financial statements (unaudited) (cont’d)
| | | | | | | | | | | | | | | | |
| | | Six Months Ended
September 30, 2011 | | | Year Ended
March 31, 2011 | |
| | | Shares | | | Amount | | | Shares | | | Amount | |
| | | | |
| Class C | | | | | | | | | | | | | | | | |
| Shares sold | | | 157,356 | | | $ | 2,564,269 | | | | 742,077 | | | $ | 12,308,552 | |
| Shares issued on reinvestment | | | 26,197 | | | | 428,437 | | | | 47,224 | | | | 775,286 | |
| Shares repurchased | | | (216,520) | | | | (3,541,011) | | | | (280,102) | | | | (4,532,070) | |
| Net increase (decrease) | | | (32,967) | | | $ | (548,305) | | | | 509,199 | | | $ | 8,551,768 | |
| | | | |
| Class I | | | | | | | | | | | | | | | | |
| Shares sold | | | 349,448 | | | $ | 5,690,012 | | | | 507,235 | | | $ | 8,392,344 | |
| Shares issued on reinvestment | | | 14,796 | | | | 242,585 | | | | 16,906 | | | | 277,213 | |
| Shares repurchased | | | (80,551) | | | | (1,290,832) | | | | (212,340) | | | | (3,466,824) | |
| Net increase | | | 283,693 | | | $ | 4,641,765 | | | | 311,801 | | | $ | 5,202,733 | |
9. Capital loss carryforward
As of March 31, 2011, the Fund had a net capital loss carryforward of approximately $479,220, which expires in 2017. This amount will be available to offset any future taxable capital gains.
Under the recently enacted Regulated Investment Company Modernization Act of 2010, the Fund will be permitted to carry forward capital losses incurred in taxable years beginning after December 22, 2010 for an unlimited period. However, any losses incurred during those future years will be required to be utilized prior to the losses incurred in pre-enactment taxable years. As a result of this ordering rule, pre-enactment capital loss carryforwards may be more likely to expire unused. Additionally, post-enactment capital losses that are carried forward will retain their character as either short-term or long-term capital losses rather than being considered all short-term as under previous law.
10. Other tax information
On December 22, 2010, President Obama signed into law the Regulated Investment Company Modernization Act of 2010 (the “Act”). The Act updates certain tax rules applicable to regulated investment companies (“RICs”). The various provisions of the Act will generally be effective for RICs with taxable years beginning after December 22, 2010. Additional information regarding the impact of the Act on the Fund, if any, will be contained within the relevant sections of the notes to the financial statements for the fiscal year ending March 31, 2012.
Legg Mason Investment Counsel
Maryland Tax-Free Income Trust
Trustees
Mark R. Fetting Chairman
R. Jay Gerken President
Ruby P. Hearn
Arnold L. Lehman
Robin J.W. Masters
Jill E. McGovern
Arthur S. Mehlman
G. Peter O’Brien
S. Ford Rowan
Robert M. Tarola
Investment manager
Legg Mason Partners Fund Advisor, LLC
Investment sub-adviser
Legg Mason Investment Counsel, LLC
Custodian
State Street Bank & Trust Company
Transfer agent
Boston Financial Data Services, Inc.
2000 Crown Colony Drive Quincy, MA 02169
Independent registered public accounting firm
PricewaterhouseCoopers LLP
Baltimore, MD
Legg Mason Investment Counsel Maryland Tax-Free Income Trust
The Fund is a separate investment series of Legg Mason Tax-Free Income Fund, a Massachusetts business trust.
Legg Mason Investment Counsel Maryland Tax-Free Income Trust
Legg Mason Funds
55 Water Street
New York, NY 10041
The Fund files its complete schedule of portfolio holdings with the Securities and Exchange Commission (“SEC”) for the first and third quarters of each fiscal year on Form N-Q. The Fund’s Forms N-Q are available on the SEC’s website at www.sec.gov. The Fund’s Forms N-Q may be reviewed and copied at the SEC’s Public Reference Room in Washington, D.C., and information on the operation of the Public Reference Room may be obtained by calling 1-800-SEC-0330. To obtain information on Form N-Q, shareholders can call the Fund at 1-877-721-1926.
Information on how the Fund voted proxies relating to portfolio securities during the prior 12-month period ended June 30th of each year and a description of the policies and procedures that the Fund uses to determine how to vote proxies related to portfolio transactions are available (1) without charge, upon request, by calling the Fund at 1-877-721-1926, (2) on the Fund’s website at www.leggmason.com/individualinvestors and (3) on the SEC’s website at www.sec.gov.
This report is submitted for the general information of the shareholders of Legg Mason Investment Counsel Maryland Tax-Free Income Trust. This report is not authorized for distribution to prospective investors in the Fund unless preceded or accompanied by a current prospectus.
Investors should consider the Fund’s investment objectives, risks, charges and expenses carefully before investing. The prospectus contains this and other important information about the Fund. Please read the prospectus carefully before investing.
www.leggmason.com/individualinvestors
©2011 Legg Mason Investor Services, LLC
Member FINRA, SIPC
Legg Mason Funds Privacy and Security Notice
Your Privacy and the Security of Your Personal Information is Very Important to the Legg Mason Funds
This Privacy and Security Notice (the “Privacy Notice”) addresses the Legg Mason Funds’ privacy and data protection practices with respect to nonpublic personal information the Funds receive. The Legg Mason Funds include any funds sold by the Funds’ distributor, Legg Mason Investor Services, LLC, as well as Legg Mason-sponsored closed-end funds and certain closed-end funds managed or sub-advised by Legg Mason or its affiliates. The provisions of this Privacy Notice apply to your information both while you are a shareholder and after you are no longer invested with the Funds.
The Type of Nonpublic Personal Information the Funds Collect About You
The Funds collect and maintain nonpublic personal information about you in connection with your shareholder account. Such information may include, but is not limited to:
| Ÿ | | Personal information included on applications or other forms; |
| Ÿ | | Account balances, transactions, and mutual fund holdings and positions; |
| Ÿ | | Online account access user IDs, passwords, security challenge question responses; and |
| Ÿ | | Information received from consumer reporting agencies regarding credit history and creditworthiness (such as the amount of an individual’s total debt, payment history, etc.). |
How the Funds Use Nonpublic Personal Information About You
The Funds do not sell or share your nonpublic personal information with third parties or with affiliates for their marketing purposes, or with other financial institutions or affiliates for joint marketing purposes, unless you have authorized the Funds to do so. The Funds do not disclose any nonpublic personal information about you except as may be required to perform transactions or services you have authorized or as permitted or required by law. The Funds may disclose information about you to:
| Ÿ | | Employees, agents, and affiliates on a “need to know” basis to enable the Funds to conduct ordinary business or comply with obligations to government regulators; |
| Ÿ | | Service providers, including the Funds’ affiliates, who assist the Funds as part of the ordinary course of business (such as printing, mailing services, or processing or servicing your account with us) or otherwise perform services on the Funds’ behalf, including companies that may perform marketing services solely for the Funds; |
| Ÿ | | The Funds’ representatives such as legal counsel, accountants and auditors; and |
| Ÿ | | Fiduciaries or representatives acting on your behalf, such as an IRA custodian or trustee of a grantor trust. |
|
| NOT PART OF THE SEMI-ANNUAL REPORT |
Legg Mason Funds Privacy and Security Notice (cont’d)
Except as otherwise permitted by applicable law, companies acting on the Funds’ behalf are contractually obligated to keep nonpublic personal information the Funds provide to them confidential and to use the information the Funds share only to provide the services the Funds ask them to perform.
The Funds may disclose nonpublic personal information about you when necessary to enforce their rights or protect against fraud, or as permitted or required by applicable law, such as in connection with a law enforcement or regulatory request, subpoena, or similar legal process. In the event of a corporate action or in the event a Fund service provider changes, the Funds may be required to disclose your nonpublic personal information to third parties. While it is the Funds’ practice to obtain protections for disclosed information in these types of transactions, the Funds cannot guarantee their privacy policy will remain unchanged.
Keeping You Informed of the Funds’ Privacy and Security Practices
The Funds will notify you annually of their privacy policy as required by federal law. While the Funds reserve the right to modify this policy at any time they will notify you promptly if this privacy policy changes.
The Funds’ Security Practices
The Funds maintain appropriate physical, electronic and procedural safeguards designed to guard your nonpublic personal information. The Funds’ internal data security policies restrict access to your nonpublic personal information to authorized employees, who may use your nonpublic personal information for Fund business purposes only.
Although the Funds strive to protect your nonpublic personal information, they cannot ensure or warrant the security of any information you provide or transmit to them, and you do so at your own risk. In the event of a breach of the confidentiality or security of your nonpublic personal information, the Funds will attempt to notify you as necessary so you can take appropriate protective steps. If you have consented to the Funds using electronic communications or electronic delivery of statements, they may notify you under such circumstances using the most current email address you have on record with them.
In order for the Funds to provide effective service to you, keeping your account information accurate is very important. If you believe that your account information is incomplete, not accurate or not current, or if you have questions about the Funds’ privacy practices, write the Funds using the contact information on your account statements, email the Funds by clicking on the Contact Us section of the Funds’ website at www.leggmason.com, or contact the Fund at 1-877-721-1926.
Revised April 2011
|
| NOT PART OF THE SEMI-ANNUAL REPORT |
www.leggmason.com/individualinvestors
©2011 Legg Mason Investor Services, LLC Member FINRA, SIPC
LMF-030/S 11/11 SR11-1505
Not applicable.
| ITEM 3. | AUDIT COMMITTEE FINANCIAL EXPERT. |
Not applicable.
| ITEM 4. | PRINCIPAL ACCOUNTANT FEES AND SERVICES. |
Not applicable.
| ITEM 5. | AUDIT COMMITTEE OF LISTED REGISTRANTS. |
Not applicable.
| ITEM 6. | SCHEDULE OF INVESTMENTS. |
Included herein under Item 1.
| ITEM 7. | DISCLOSURE OF PROXY VOTING POLICIES AND PROCEDURES FOR CLOSED-END MANAGEMENT INVESTMENT COMPANIES. |
Not applicable.
| ITEM 8. | PORTFOLIO MANAGERS OF CLOSED-END MANAGEMENT INVESTMENT COMPANIES. |
Not applicable.
| ITEM 9. | PURCHASES OF EQUITY SECURITIES BY CLOSED-END MANAGEMENT INVESTMENT COMPANY AND AFFILIATED PURCHASERS. |
Not applicable.
| ITEM 10. | SUBMISSION OF MATTERS TO A VOTE OF SECURITY HOLDERS. |
Not applicable.
| ITEM 11. | CONTROLS AND PROCEDURES. |
| | (a) | The registrant’s principal executive officer and principal financial officer have concluded that the registrant’s disclosure controls and procedures (as defined in Rule 30a- 3(c) under the Investment Company Act of 1940, as amended (the “1940 Act”)) are effective as of a date within 90 days of the filing date of this report that includes the disclosure required by this paragraph, based on their evaluation of the disclosure controls and procedures required by Rule 30a-3(b) under the 1940 Act and 15d-15(b) under the Securities Exchange Act of 1934. |
| | (b) | There were no changes in the registrant’s internal control over financial reporting (as defined in Rule 30a-3(d) under the 1940 Act) that occurred during the registrant’s last fiscal half-year (the registrant’s second fiscal half-year in the case of an annual report) that have materially affected, or are likely to materially affect the registrant’s internal control over financial reporting. |
(a) (1) Not applicable.
Exhibit 99.CODE ETH
(a) (2) Certifications pursuant to section 302 of the Sarbanes-Oxley Act of 2002 attached hereto.
Exhibit 99.CERT
(b) Certifications pursuant to Section 906 of the Sarbanes-Oxley Act of 2002 attached hereto.
Exhibit 99.906CERT
SIGNATURES
Pursuant to the requirements of the Securities Exchange Act of 1934 and the Investment Company Act of 1940, the registrant has duly caused this Report to be signed on its behalf by the undersigned, there unto duly authorized.
| | |
| Legg Mason Tax Free Income Fund |
| |
| By: | | /S/ R. JAY GERKEN |
| | (R. Jay Gerken) |
| | President of |
| | Legg Mason Tax Free Income Fund |
|
| Date: November 28, 2011 |
Pursuant to the requirements of the Securities Exchange Act of 1934 and the Investment Company Act of 1940, this report has been signed below by the following persons on behalf of the registrant and in the capacities and on the dates indicated.
| | |
| By: | | /S/ R. JAY GERKEN |
| | (R. Jay Gerken) |
| | President of |
| | Legg Mason Tax Free Income Fund |
|
| Date: November 28, 2011 |
| |
By: | | /S/ KAPREL OZSOLAK |
| | (Kaprel Ozsolak) |
| | Chief Financial Officer of |
| | Legg Mason Tax Free Income Fund |
|
| Date: November 28, 2011 |