UNITED STATES
SECURITIES AND EXCHANGE COMMISSION
Washington, D.C. 20549
FORM N-CSR
CERTIFIED SHAREHOLDER REPORT OF REGISTERED
MANAGEMENT INVESTMENT COMPANIES
Investment Company Act file number 811-06223
Legg Mason Tax-Free Income Fund
(Exact name of Registrant as specified in charter)
55 Water Street, New York, NY 10041
(Address of principal executive offices) (Zip code)
Robert I. Frenkel, Esq.
Legg Mason & Co., LLC
100 First Stamford Place
Stamford, CT 06902
(Name and address of agent for service)
Registrant’s telephone number, including area code:
Funds Investor Services 1-800-822-5544
or
Institutional Shareholder Services 1-888-425-6432
Date of fiscal year end: March 31
Date of reporting period: March 31, 2010
| ITEM 1. | REPORT TO STOCKHOLDERS. |
The Annual Report to Stockholders is filed herewith.
March 31, 2010

Annual Report
Legg Mason
Investment Counsel
Maryland
Tax-Free Income
Trust
INVESTMENT PRODUCTS: NOT FDIC INSURED • NO BANK GUARANTEE • MAY LOSE VALUE
| | |
| II | | Legg Mason Investment Counsel Maryland Tax-Free Income Trust |
Fund objective
The Fund seeks a high level of current income exempt from federal and Maryland state and local income taxes, consistent with prudent investment risk and preservation of capital.
Fund name change
Prior to October 5, 2009, the Fund was known as Legg Mason Maryland Tax-Free Income Trust. There was no change in the Fund’s investment objective or investment policies as a result of the name change.
Letter from the chairman
Dear Shareholder,
We are pleased to provide the annual report of Legg Mason Investment Counsel Maryland Tax-Free Income Trust for the twelve-month reporting period ended March 31, 2010.
Please read on for a detailed look at prevailing economic and market conditions during the Fund’s reporting period and to learn how those conditions have affected Fund performance. Important information with regard to recent regulatory developments that may affect the Fund is contained in the Notes to Financial Statements included in this report.
As always, we remain committed to providing you with excellent service and a full spectrum of investment choices. We also remain committed to supplementing the support you receive from your financial advisor. One way we accomplish this is through our website, www.leggmason.com/individualinvestors. Here you can gain immediate access to market and investment information, including:
| Ÿ | | Fund prices and performance, |
| Ÿ | | Market insights and commentaries from our portfolio managers, and |
| Ÿ | | A host of educational resources. |
We look forward to helping you meet your financial goals.
Sincerely,
| | |

| |  |
Mark R. Fetting Chairman | | David Odenath President |
April 30, 2010
| | |
| Legg Mason Investment Counsel Maryland Tax-Free Income Trust | | III |
Investment commentary
Economic review
The lengthiest recession since the Great Depression finally appeared to have ended during the reporting period. This, in turn, had significant implications for the financial markets.
Looking back, the U.S. Department of Commerce reported that U.S. gross domestic product (“GDP”)i contracted four consecutive quarters, beginning in the third quarter of 2008 through the second quarter of 2009. Economic conditions then began to improve in the third quarter of 2009, as GDP growth was 2.2%. A variety of factors helped the economy to regain its footing, including the government’s $787 billion stimulus program, its “Cash for Clunkers” car rebate program, which helped spur an increase in car sales, and tax credits for first-time home buyers. Economic growth then accelerated during the fourth quarter of 2009, as GDP growth was 5.6%. The Commerce Department cited a slower drawdown in business inventories and renewed consumer spending as contributing factors spurring the economy’s higher growth rate. The recovery continued during the first quarter of 2010, as the advance estimate for GDP growth was a solid 3.2%. The ongoing economic expansion was largely the result of increased consumer spending, as it grew 3.6% during the quarter, versus a tepid 1.6% advance during the last three months of 2009.
Even before GDP growth turned positive, there were signs that the economy was on the mend. The manufacturing sector, as measured by the Institute for Supply Management’s PMIii, rose to 52.8 in August 2009, the first time it surpassed 50 since January 2008 (a reading below 50 indicates a contraction, whereas a reading above 50 indicates an expansion). According to PMI data, manufacturing has now expanded eight consecutive months and March 2010’s PMI reading of 59.6 was the highest since July 2004.
While the housing market has shown signs of life, a continued large inventory of unsold homes and the end of a government tax credit for first-time buyers could lead to a choppy recovery. At the end of March 2010, there was an 8.0 month supply of unsold homes, a slight improvement from the 8.5 month supply the prior month. Based on its most recent data, the S&P/Case-Shiller Home Price Indexiii indicated that U.S. home prices in February 2010 rose from a year earlier for the first time in more than three years. According to the National Association of Realtors, after existing home sales fell from December 2009 through February 2010, they increased 6.8% in March as people rushed to take advantage of the government’s $8,000 tax credit for first-time home buyers that is set to expire at the end of April.
While there was some positive news in the labor market in March, continued high unemployment could negatively impact the pace of the economic recovery. The U.S. Department of Labor reported that employers added 162,000 jobs in March, the largest monthly gain in three years. However, upon closer inspection, the data showed that nearly 30% of these new hires were temporary government jobs for the 2010 Census. In addition, the unemployment rate remained at 9.7% in March, where it has stood since January 2010.
Financial market overview
The twelve-month period ended March 31, 2010 was largely characterized by a return to more normal conditions and robust investor risk appetite. This was in sharp contrast to the last three months of 2008 and early 2009, when upheaval in the financial markets, periods of extreme volatility and illiquidity triggered heightened risk aversion and extreme “flights to quality.”
In the fixed-income market, riskier sectors, such as high-yield bonds and emerging market debt, significantly outperformed U.S. Treasuries during the reporting period. There were a number of factors contributing to the turnaround in the financial markets, including improving economic conditions, renewed investor confidence and the accommodative monetary policy by the Federal Reserve Board (“Fed”)iv.
While economic data often surpassed expectations during the reporting period, the Fed remained cautious. As stated by Fed Chairman Bernanke in April 2010 (subsequent to the close of the reporting period), the economy was “far from being out of the woods.” Given this, it was no surprise that the Fed kept the federal funds ratev in a historically low range of 0 to 1/4 percent during the reporting period. At its meeting in April 2010, the Fed said it “will maintain the target range for the federal funds rate at 0 to 1/4 percent and continues to anticipate that economic conditions, including low rates of resource utilization, subdued inflation trends, and stable inflation expectations, are likely to warrant exceptionally low levels of the federal funds rate for an extended period.”
However, the Fed did take a first step in reversing its accommodative monetary stance. On February 18, 2010, the Fed raised the discount rate, the interest
| | |
| IV | | Legg Mason Investment Counsel Maryland Tax-Free Income Trust |
rate it charges banks for temporary loans, from 0.50% to 0.75%. The Fed also announced the conclusion of its $1.25 trillion mortgage securities purchase program at the end of the first quarter of 2010.
Fixed-income market review
In a turnaround from the fourth quarter of 2008 and early 2009, when investors fled fixed-income securities that were seen as being risky and flocked to the relative safety of short-term Treasuries, investor risk aversion abated during the reporting period. Toward the beginning of the period, some encouraging economic data and a thawing of the once frozen credit markets helped bolster investor confidence, and risk aversion was replaced by robust demand for riskier, and higher-yielding, fixed-income securities. Despite some temporary setbacks, riskier assets continued to perform well during the remainder of the reporting period.
Both short- and long-term Treasury yields fluctuated during the reporting period. When the period began, Treasury yields remained relatively low, given numerous flights to quality that were triggered by the fallout from the financial crisis in 2008. After starting the period at 0.81% and 2.71%, respectively, two- and ten-year Treasury yields then generally moved higher (and their prices lower) until early June. Two- and ten-year yields peaked at 1.42% and 3.98%, respectively, before falling through the end of February, and then moving upward in March. At the end of the reporting period, two- and ten-year Treasury yields were 1.02% and 3.84%, respectively.
Over the twelve months ended March 31, 2010, longer-term Treasury yields increased more than their shorter-term counterparts. This was largely the result of the Fed repeatedly saying it would keep short-term rates low “for an extended period,” whereas improving economic data triggered fears of future inflation given the government’s massive stimulus program. At the same time, with risk aversion being replaced with robust risk appetite, spread sector (non-Treasury) prices moved higher.
The municipal bond market outperformed its taxable bond counterpart over the twelve months ended March 31, 2010. Over that period, the Barclays Capital Municipal Bond Indexvi and the Barclays Capital U.S. Aggregate Indexvii returned 9.69% and 7.69%, respectively. Despite falling tax receipts and budgetary challenges, the municipal market generated solid results due to strong demand from investors seeking tax-free income. The decline in new issuance of tax-free bonds also fed the market’s demand.
As always, thank you for your confidence in our stewardship of your assets.
Sincerely,

R. Jay Gerken, CFA
Vice President
April 30, 2010
All investments are subject to risk including the possible loss of principal. All index performance reflects no deduction for fees, expenses or taxes. Please note that an investor cannot invest directly in an index.
| i | Gross domestic product (“GDP”) is the market value of all final goods and services produced within a country in a given period of time. |
| ii | The Institute for Supply Management’s PMI is based on a survey of purchasing executives who buy the raw materials for manufacturing at more than 350 companies. It offers an early reading on the health of the manufacturing sector. |
| iii | The S&P/Case-Shiller Home Price Index measures the residential housing market, tracking changes in the value of the residential real estate market in twenty metropolitan regions across the United States. |
| iv | The Federal Reserve Board (“Fed”) is responsible for the formulation of policies designed to promote economic growth, full employment, stable prices and a sustainable pattern of international trade and payments. |
| v | The federal funds rate is the rate charged by one depository institution on an overnight sale of immediately available funds (balances at the Federal Reserve) to another depository institution; the rate may vary from depository institution to depository institution and from day to day. |
| vi | The Barclays Capital Municipal Bond Index is a market value weighted index of investment grade municipal bonds with maturities of one year or more. |
| vii | The Barclays Capital U.S. Aggregate Index is a broad-based bond index comprised of government, corporate, mortgage- and asset-backed issues, rated investment grade or higher, and having at least one year to maturity. |
| | |
| Legg Mason Investment Counsel Maryland Tax-Free Income Trust 2010 Annual Report | | 1 |
Fund overview
Q. What is the Fund’s investment strategy?
A. The Fund seeks to generate a high level of current income exempt from federal and Maryland State and local income taxes, consistent with prudent investment risk and preservation of capital. Under normal circumstances, the Fund invests at least 80% of its net assets in debt instruments issued by or on behalf of the state of Maryland, its political subdivisions, municipalities, agencies, instrumentalities or public authorities, the interest on which is exempt from Maryland State and local taxes, and is not considered a tax preference item for the purpose of the alternative minimum tax (“AMT”). Securities considered for investment must be investment grade. The Fund may invest in securities of any maturity.
We anticipate that the dollar-weighted average maturity for the Fund will be in the long-intermediate to long-term range (generally from seven to twenty years) although, at times, depending on our market outlook, the average maturity may be somewhat longer or shorter than this. We establish a durationi target for the Fund based on our investment outlook. This outlook is determined by our analysis of the economy, fiscal and monetary policy and international events. Factors directly impacting the municipal market, such as supply, demand and legislative developments, are also incorporated into our outlook. We analyze each industry and issuer to determine its credit fundamentals and outlook. Issuers are scrutinized not only for their ability to make timely interest and principal payments, but for the stability of their financial position and ratings. The tax consequences of trading activity are always considered.
Q. What were the overall market conditions during the Fund’s reporting period?
A. Despite poor credit fundamentals among municipal issuers, tax-free bonds continued to benefit from a favorable technical environment. Investors are mindful that marginal tax rates are on the rise with the expiration of the Bush tax cuts. In addition, many states will likewise be searching for additional revenues via tax hikes, most likely following the November elections. In such an environment, the value of a tax-free income stream is enhanced, and investors are clamoring for exposure as evidenced by the continued strong flows into municipal mutual funds. As states increasingly utilized the Build America Bond (“BAB”) program for funding needs, a significant portion of tax-free volume was being steered into the taxable bond market, resulting in a shortage of bonds in many states, Maryland included. Yields collapsed to five-month lows by mid-February as a result, before rebounding toward the end of the reporting period in sympathy with the Treasury sell-off.
Federal Reserve Board (“Fed”)ii policy was highly scrutinized over the period, as the market remained focused on when and how the Fed will tighten policy and shrink its sizable balance sheet. While many investors are obsessed with the seemingly difficult predicament the Fed is in, we do not share their concern, being of the view that the Fed has the necessary tools to move if need be, and that any move is not imminent. The main concern is that the massive excess reserves the Fed holds on its balance sheet in the form of Treasury, agency and mortgage-backed securities will eventually result in a revival of bank lending which subsequently will fuel inflationary pressures. While an economic recovery would foster more lending, loan demand remains weak in aggregate, and banks are more than willing at this point to pocket the difference in the historically steep yield curveiii, borrowing at near 0% and investing the proceeds in higher-yielding Treasuries. Recent comments by Chairman Bernanke and Janet Yellen (the President of the San Francisco Fed and likely successor to Vice Chairman Donald Kohn, who is retiring from the Fed this year) have indicated no hurry to raise interest rates, noting the fragile nature of the recovery.
During the reporting period, credit agencies Moody’s Investors Service and Fitch Ratings announced a new global rating scale that will rate municipalities on par with corporate issuers on the basis of default frequency and recovery rates. The result will be credit upgrades for 70% of municipalities and essential service authorities, despite weak credit fundamentals among many issuers. While the timing is somewhat awkward, the impressive default history of local government debt versus similarly rated corporate debt makes the adjustments, in our opinion, appropriate, especially considering these issuers are borrowing heavily in the taxable market. The pending change in rating philosophy does not mitigate the tremendous stress confronting the states. Tax revenues have decreased year-over-year for a record five straight quarters according to the Nelson A. Rockefeller Institute of Government, a dismal showing highlighting the depth of the recent downturn. In addition, pension and other post-retirement benefits remain massively underfunded as local governments reel from poor investment performance and skip contributions to plans to conserve cash.
| | |
| 2 | | Legg Mason Investment Counsel Maryland Tax-Free Income Trust 2010 Annual Report |
Fund overview (cont’d)
Despite challenging conditions over the past twelve months ended March 31, 2010, the Barclays Capital Municipal Bond Indexiv, the Fund’s benchmark and a proxy for the overall municipal market, returned 9.69%. Weaker credits performed best, as the dislocations within the market during the credit crisis eased significantly, reviving investors’ appetite for risk. Longer maturities also performed well. Tax-free interest rates on an absolute basis were the highest of the decade at the beginning of the reporting period and relative yields were the highest ever. Subsequent strong inflows into municipal mutual funds in an environment of diminishing supply created a strong technical environment that drove tax-free interest rates lower over the course of the period.
Q. How did we respond to these changing market conditions?
A. Given the low absolute yields available for much of the period, we began the process of shortening the Fund’s average duration and building a cash position in preparation of higher yields. We expect rising Treasury rates will eventually pull municipal yields higher as the record $1.4 trillion federal deficit funded by heavy Treasury borrowing pressures the market. While we expect continued robust demand for tax-free income, the supply shortfall has left the market extremely rich, and the path of Treasury rates will largely determine the fate of the tax-free market.
We also altered the Fund’s yield curve positioning during the period. We structured the portfolio in a barbelled manner, which is an overweight of short maturity securities and longer maturities, while underweighting intermediate maturities. The shorter maturities provided ballast to the portfolio and helped shorten overall portfolio duration. We believe they also should perform well if the Fed tightens monetary policy by raising overnight interest rates. The longer maturities benefited from a historically steep yield curve and added yield to the portfolio.
Performance review
For the twelve months ended March 31, 2010, Class A shares of Legg Mason Investment Counsel Maryland Tax-Free Income Trust, excluding sales charges, returned 10.08%. The Fund’s unmanaged benchmark, the Barclays Capital Municipal Bond Index, returned 9.69% over the same time frame. The Lipper Maryland Municipal Debt Funds Category Average1 returned 13.88% for the same period.
Certain investors may be subject to the AMT, and state and local taxes may apply. Capital gains, if any, are fully taxable. Please consult your personal tax or legal adviser.
| | | | | | |
| Performance Snapshot as of March 31, 2010 | |
| (excluding sales charges) (unaudited) | | 6 months | | | 12 months | |
| Legg Mason Investment Counsel Maryland Tax-Free Income Trust: | | | | | | |
Class A | | 0.90 | % | | 10.08 | % |
Class C | | 0.62 | % | | 9.44 | % |
Class I2 | | 1.00 | % | | 10.38 | % |
| Barclays Capital Municipal Bond Index | | 0.28 | % | | 9.69 | % |
| Lipper Maryland Municipal Debt Funds Category Average1 | | 0.55 | % | | 13.88 | % |
The performance shown represents past performance. Past performance is no guarantee of future results and current performance may be higher or lower than the performance shown above. Principal value, investment returns and yields will fluctuate and investors’ shares, when redeemed, may be worth more or less than their original cost. To obtain performance data current to the most recent month-end, please visit our website at www.leggmason.com/individualinvestors.
All share class returns assume the reinvestment of all distributions, including returns of capital, if any, at net asset value and the deduction of all Fund expenses. Returns have not been adjusted to include sales charges that may apply or the deduction of taxes that a shareholder would pay on Fund distributions. If sales charges were reflected, the performance quoted would be lower. Performance figures for periods shorter than one year represent cumulative figures and are not annualized.
Performance figures reflect expense reimbursements and/or fee waivers, without which the performance would have been lower.
The 30-Day SEC Yields for the period ended March 31, 2010 for Class A, C and I shares were 3.05%, 2.82% and 3.34%, respectively. Absent current expense reimbursements and/or fee waivers, the 30-Day SEC Yields for Class A, C and I shares would have been 2.84%, 2.36% and 3.00%, respectively. The 30-Day SEC Yield is the average annualized net investment income per share for the 30-day period indicated and is subject to change.
| 1 | Lipper, Inc., a wholly-owned subsidiary of Reuters, provides independent insight on global collective investments. Returns are based on the period ended March 31, 2010, including the reinvestment of all distributions, including returns of capital, if any, calculated among the 35 funds for the six-month period and among the 34 funds for the twelve-month period in the Fund’s Lipper category, and excluding sales charges. |
| 2 | Prior to October 5, 2009, Class I was known as the Institutional Class. |
| | |
| Legg Mason Investment Counsel Maryland Tax-Free Income Trust 2010 Annual Report | | 3 |
Total Annual Operating Expenses (unaudited)
As of the Fund’s most current prospectus dated August 1, 2009, the gross total operating expense ratios for Class A, Class C and Class I shares were 1.03%, 1.99% and 1.22%, respectively.
Actual expenses may be higher. For example, expenses may be higher than those shown if average net assets decrease. Net assets are more likely to decrease and Fund expense ratios are more likely to increase when markets are volatile.
As a result of expense limitations, the ratio of expenses, other than interest, brokerage, taxes and extraordinary expenses, to average net assets will not exceed 0.70% for Class A shares, 1.25% for Class C shares and 0.45% for Class I shares. These expense limitations cannot be terminated prior to December 31, 2011 without the Board of Trustees’ consent.
Q. What were the leading contributors to performance?
A. Sector selection was additive to relative performance over the past year, as the Fund’s two most heavily weighted sectors provided the best results. The significant narrowing of credit spreads benefited our heavy weighting to the Hospitals1 sector, which was the main positive contributor to the Fund’s performance. Credit ratings on the Fund’s Hospitals holdings typically reside in the lowest rung of the investment grade spectrum, which was the strongest part of the credit curve over the past year. The Fund’s second largest sector, Higher Education, also made a positive contribution. Much like the Hospitals sector, the A- and BBB-rated securities within the Fund’s Higher Education holdings performed the best, as names such as McDaniel College Inc., St. John’s College Facility, Loyola College Issue and Maryland Institute College of Art generated total returns in excess of 20% during the period.
Security selection outside of the Hospitals and Higher Education sectors augmented performance to a lesser extent. Most notable, recent purchases of Puerto Rico paper contributed positively to the Fund’s performance, as spreads compressed following positive actions enacted by the Commonwealth to improve its financial position. Duration management provided mixed results. While our weighting to long duration securities was helpful, the Fund’s short maturity positions and significant cash balances within the aforementioned barbell structure were not additive to performance.
Q. What were the leading detractors from performance?
A. Our decision to shorten the Fund’s duration and increase cash balances during the reporting period
was too early and detracted from Fund performance. Yields in cash equivalents were painfully low during the period due to the historically low overnight rates engineered by the Fed. As a result, the income component of total return suffered somewhat. While the opportunity cost of cash was high in this environment, a defensive structure should help limit downside risk if the prevailing low yields on tax-free investments rise. Related to the increased weighting in cash equivalents, the barbell structure did not add to results as we hoped. The yield curve remains historically steep, and while the longer-dated securities have performed well, shorter maturities have languished in the low rate environment.
Despite our success with individual Hospitals and Higher Education names of low investment grade quality, we remained committed to high-quality issuers in other sectors of the portfolio. The strong recovery in lower-rated municipal bonds created a difficult environment for the Fund and detracted from performance as a result.
Thank you for your investment in Legg Mason Investment Counsel Maryland Tax-Free Income Trust. As always, we appreciate that you have chosen us to manage your assets and we remain focused on seeking to achieve the Fund’s investment goals.
Sincerely,

R. Scott Pierce, CFA
Portfolio Manager
Legg Mason Investment Counsel, LLC
April 20, 2010
RISKS: All investments involve risk, including the loss of principal. Bonds are subject to a variety of risks, including interest rate, credit and inflation risks. As interest rates rise, bond prices fall, reducing the value of a fixed-income investment. As a “non-diversified” fund, an investment in the Fund will entail greater price risk than an investment in a diversified fund because a higher percentage of investments among fewer issuers may result in greater fluctuation in the total market value of the Fund’s portfolio. An investor may be subject to the federal alternative minimum tax, and state and local taxes may apply. Capital gains, if any, are fully taxable. Please see the Fund’s prospectus for more information on these and other risks.
| 1 | Health Care consists of the following industries: Hospitals/Nursing Facilities, Pharmacy Services, Medical Wholesale Drug Distributors, Drug Delivery Systems, Medical Products/Instruments, Medical & Laboratory Testing, Healthcare Cost Containment and Scientific Instruments. |
| | |
| 4 | | Legg Mason Investment Counsel Maryland Tax-Free Income Trust 2010 Annual Report |
Fund overview (cont’d)
Portfolio holdings and breakdowns are as of March 31, 2010 and are subject to change and may not be representative of the portfolio manager’s current or future investments. Please refer to pages 9 through 15 for a list and percentage breakdown of the Fund’s holdings.
The mention of sector breakdowns is for informational purposes only and should not be construed as a recommendation to purchase or sell any securities. The information provided regarding such sectors is not a sufficient basis upon which to make an investment decision. Investors seeking financial advice regarding the appropriateness of investing in any securities or investment strategies discussed should consult their financial professional. The Fund’s portfolio composition is subject to change at any time.
All index performance reflects no deduction for fees, expenses or taxes. Please note that an investor cannot invest directly in an index.
The information provided is not intended to be a forecast of future events, a guarantee of future results or investment advice. Views expressed may differ from those of the firm as a whole.
| i | Duration is the measure of the price sensitivity of a fixed-income security to an interest rate change of 100 basis points. Calculation is based on the weighted average of the present values for all cash flows. |
| ii | The Federal Reserve Board (“Fed”) is responsible for the formulation of policies designed to promote economic growth, full employment, stable prices and a sustainable pattern of international trade and payments. |
| iii | The yield curve is the graphical depiction of the relationship between the yield on bonds of the same credit quality but different maturities. |
| iv | The Barclays Capital Municipal Bond Index is a market value weighted index of investment grade municipal bonds with maturities of one year or more. |
| | |
| Legg Mason Investment Counsel Maryland Tax-Free Income Trust 2010 Annual Report | | 5 |
Fund at a glance† (unaudited)
Investment breakdown (%) as a percent of total investments
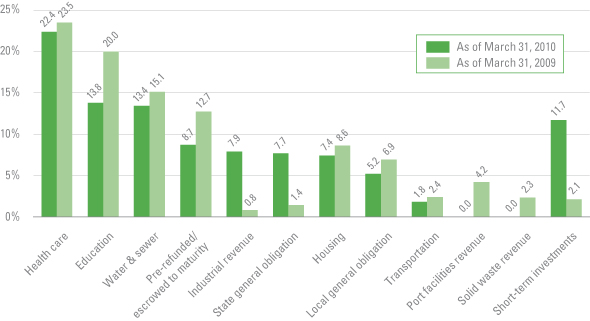
| † | The bar graph above represents the composition of the Fund’s investments as of March 31, 2010 and March 31, 2009 and does not include derivatives. The Fund is actively managed. As a result, the composition of the Fund’s investments is subject to change at any time. |
| | |
| 6 | | Legg Mason Investment Counsel Maryland Tax-Free Income Trust 2010 Annual Report |
Fund expenses (unaudited)
Example
As a shareholder of the Fund, you may incur two types of costs: (1) transaction costs, including front-end and back-end sales charges (loads) on purchase payments; and (2) ongoing costs, including management fees; distribution and/or service (12b-1) fees; and other Fund expenses. This example is intended to help you understand your ongoing costs (in dollars) of investing in the Fund and to compare these costs with the ongoing costs of investing in other mutual funds.
This example is based on an investment of $1,000 invested on October 1, 2009 and held for the six months ended March 31, 2010.
Actual expenses
The table below titled “Based on Actual Total Return” provides information about actual account values and actual expenses. You may use the information provided in this table, together with the amount you invested, to estimate the expenses that you paid over the period. To estimate the expenses you paid on your account, divide your ending account value by $1,000 (for example, an $8,600 ending account value divided by $1,000 = 8.6), then multiply the result by the number under the heading entitled “Expenses Paid During the Period”.
| | | | | | | | | | | | | | | |
| Based on actual total return1 |
| | | Actual Total
Return
Without
Sales
Charges2 | | | Beginning
Account
Value | | Ending
Account
Value | | Annualized
Expense
Ratio | | | Expenses
Paid
During
the
Period3 |
| Class A | | 0.90 | % | | $ | 1,000.00 | | $ | 1,009.00 | | 0.64 | % | | $ | 3.21 |
| Class C | | 0.62 | | | | 1,000.00 | | | 1,006.20 | | 1.18 | | | | 5.90 |
| Class I | | 1.00 | | | | 1,000.00 | | | 1,010.00 | | 0.45 | | | | 2.26 |
Hypothetical example for comparison purposes
The table below titled “Based on Hypothetical Total Return” provides information about hypothetical account values and hypothetical expenses based on the actual expense ratio and an assumed rate of return of 5.00% per year before expenses, which is not the Fund’s actual return. The hypothetical account values and expenses may not be used to estimate the actual ending account balance or expenses you paid for the period. You may use the information provided in this table to compare the ongoing costs of investing in the Fund and other funds. To do so, compare the 5.00% hypothetical example relating to the Fund with the 5.00% hypothetical examples that appear in the shareholder reports of the other funds.
Please note that the expenses shown in the table below are meant to highlight your ongoing costs only and do not reflect any transactional costs, such as front-end or back-end sales charges (loads). Therefore, the table is useful in comparing ongoing costs only, and will not help you determine the relative total costs of owning different funds. In addition, if these transaction costs were included, your costs would have been higher.
| | | | | | | | | | | | | | | |
| Based on hypothetical total return1 |
| | | Hypothetical
Annualized
Total Return | | | Beginning
Account
Value | | Ending
Account
Value | | Annualized
Expense
Ratio | | | Expenses
Paid
During
the
Period3 |
| Class A | | 5.00 | % | | $ | 1,000.00 | | $ | 1,021.74 | | 0.64 | % | | $ | 3.23 |
| Class C | | 5.00 | | | | 1,000.00 | | | 1,019.05 | | 1.18 | | | | 5.94 |
| Class I | | 5.00 | | | | 1,000.00 | | | 1,022.69 | | 0.45 | | | | 2.27 |
| 1 | For the six months ended March 31, 2010. |
| 2 | Assumes the reinvestment of all distributions at net asset value and does not reflect the deduction of the applicable sales charge with respect to Class A shares or the applicable contingent deferred sales charges (“CDSC”) with respect to Class C shares. Total return is not annualized, as it may not be representative of the total return for the year. Performance figures may reflect fee waivers and/or expense reimbursements. In the absence of fee waivers and/or expense reimbursements, the total return would have been lower. Past performance is no guarantee of future results. |
| 3 | Expenses (net of fee waivers and/or expense reimbursements) are equal to each class’ respective annualized expense ratio multiplied by the average account value over the period, multiplied by the number of days in the most recent fiscal half-year, then divided by 365. |
| | |
| Legg Mason Investment Counsel Maryland Tax-Free Income Trust 2010 Annual Report | | 7 |
Fund performance (unaudited)
| | | | | | | | | |
| Average annual total returns | | | |
| Without sales charges1 | | Class A | | | Class C | | | Class I | |
| Twelve Months Ended 3/31/10 | | 10.08 | % | | 9.44 | % | | 10.38 | % |
| Five Years Ended 3/31/10 | | 4.40 | | | N/A | | | N/A | |
| Ten Years Ended 3/31/10 | | 5.12 | | | N/A | | | N/A | |
| Inception* through 3/31/10 | | 5.63 | | | 8.68 | | | 7.10 | |
| | | |
| With sales charges2 | | Class A | | | Class C | | | Class I | |
| Twelve Months Ended 3/31/10 | | 5.41 | % | | 8.44 | % | | 10.38 | % |
| Five Years Ended 3/31/10 | | 3.49 | | | N/A | | | N/A | |
| Ten Years Ended 3/31/10 | | 4.67 | | | N/A | | | N/A | |
| Inception* through 3/31/10 | | 5.38 | | | 8.68 | | | 7.10 | |
| | | |
| Cumulative total returns | | | |
| Without sales charges1 | | | |
| Class A (3/31/00 through 3/31/10) | | 64.72 | % |
| Class C (Inception date of 2/5/09 through 3/31/10) | | 10.03 | |
| Class I (Inception date of 7/30/08 through 3/31/10) | | 12.12 | |
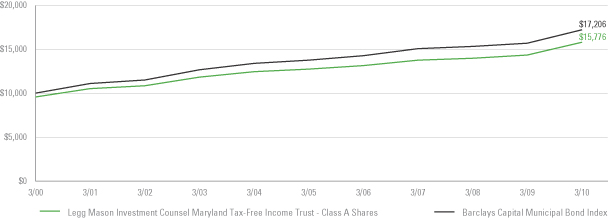
Historical performance
Value of $10,000 invested
Class A Shares of Legg Mason Investment Counsel Maryland Tax-Free Income Trust vs. Barclays Capital Municipal Bond Index† — March 2000 - March 2010
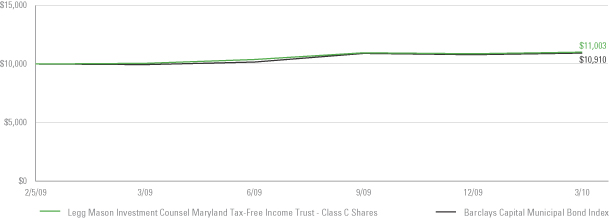
Value of $10,000 invested
Class C Shares of Legg Mason Investment Counsel Maryland Tax-Free Income Trust vs. Barclays Capital Municipal Bond Index† — February 5, 2009 - March 2010
| | |
| 8 | | Legg Mason Investment Counsel Maryland Tax-Free Income Trust 2010 Annual Report |
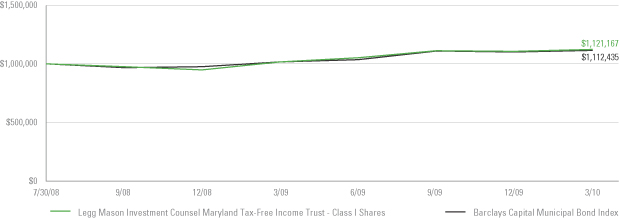
Fund performance (unaudited) (cont’d)
Value of $1,000,000 invested
Class I Shares of Legg Mason Investment Counsel Maryland Tax-Free Income Trust vs. Barclays Capital Municipal Bond Index† —
July 30, 2008 - March 2010
All figures represent past performance and are not a guarantee of future results. Investment return and principal value of an investment will fluctuate so that an investor’s shares, when redeemed, may be worth more or less than their original cost. The returns shown do not reflect the deduction of taxes that a shareholder would pay on Fund distributions or the redemption of Fund shares. Performance figures may reflect fee waivers and/or expense reimbursements. In the absence of fee waivers and/or expense reimbursements, the total return would have been lower.
| 1 | Assumes the reinvestment of all distributions, including returns of capital, if any, at net asset value and does not reflect the deduction of the applicable sales charge with respect to Class A shares or the applicable CDSC with respect to Class C shares. |
| 2 | Assumes the reinvestment of all distributions, including returns of capital, if any, at net asset value. In addition, Class A shares reflect the deduction of the maximum initial sales charge of 4.25% and Class C shares reflect the deduction of a 1.00% CDSC, which applies if shares are redeemed within one year from purchase payment. |
| * | The inception dates for Class A, C and I shares are May 1, 1991, February 5, 2009 and July 30, 2008, respectively. |
| † | Hypothetical illustration of $10,000 invested in Class A and C shares and $1,000,000 in Class I shares of Legg Mason Investment Counsel Maryland Tax-Free Income Trust on March 31, 2000, February 5, 2009 (commencement of operations) and July 30, 2008 (commencement of operations), respectively, assuming the deduction of the maximum initial sales charge of 4.25% at the time of investment for Class A shares and the reinvestment of all distributions, including returns of capital, if any, at net asset value through March 31, 2010. The Barclays Capital Municipal Bond Index is a market value weighted index of investment grade municipal bonds with maturities of one year or more. The Index is unmanaged and is not subject to the same management and trading expenses as a mutual fund. Please note that an investor cannot invest directly in an index. |
| | |
| Legg Mason Investment Counsel Maryland Tax-Free Income Trust 2010 Annual Report | | 9 |
Schedule of investments
March 31, 2010
Legg Mason Investment Counsel Maryland Tax-Free Income Trust
| | | | | | | | | | | |
| Security | | Rate | | | Maturity
Date | | Face
Amount | | Value |
| Municipal Bonds — 87.4% | | | | | | | | | | | |
Education — 13.7% | | | | | | | | | | | |
City of Annapolis, Maryland, EDR and Refunding Revenue Bonds: | | | | | | | | | | | |
St. John’s College Facility | | 5.500 | % | | 10/1/18 | | $ | 240,000 | | $ | 240,792 |
St. John’s College Facility | | 5.500 | % | | 10/1/23 | | | 490,000 | | | 490,897 |
St. John’s College Facility | | 5.000 | % | | 10/1/27 | | | 1,135,000 | | | 1,063,279 |
St. John’s College Facility | | 5.000 | % | | 10/1/36 | | | 2,465,000 | | | 2,221,261 |
Maryland EDC, Student Housing Revenue Bonds, University of Maryland, College Park Project | | 5.750 | % | | 6/1/33 | | | 500,000 | | | 503,190 |
Maryland EDC, Utility Infrastructure Revenue Bonds, University of Maryland, College Park Project, AMBAC | | 5.375 | % | | 7/1/16 | | | 985,000 | | | 1,018,244 |
Maryland Health & Higher EFA Refunding Revenue Bonds, Maryland Institute College of Art Issue | | 5.000 | % | | 6/1/36 | | | 5,000,000 | | | 4,809,200 |
Maryland Health & Higher EFA Revenue Bonds: | | | | | | | | | | | |
AGM | | 4.500 | % | | 1/1/22 | | | 800,000 | | | 785,640 |
College of Notre Dame of Maryland Issue, NATL | | 5.300 | % | | 10/1/18 | | | 925,000 | | | 1,024,521 |
Loyola College Issue | | 5.000 | % | | 10/1/40 | | | 2,000,000 | | | 1,996,880 |
Maryland Institute College of Art | | 5.000 | % | | 6/1/42 | | | 800,000 | | | 759,544 |
The Johns Hopkins University Issue | | 5.000 | % | | 7/1/33 | | | 3,000,000 | | | 3,099,120 |
Maryland State Economic Development Corp. Student Housing Revenue, University of Maryland College Park Projects | | 5.800 | % | | 6/1/38 | | | 1,500,000 | | | 1,502,760 |
University System of Maryland Auxiliary Facility and Tuition Revenue Bonds | | 5.000 | % | | 10/1/21 | | | 2,500,000 | | | 2,740,200 |
Westminster, Maryland, Education Facilities Refunding Revenue Bonds: | | | | | | | | | | | |
McDaniel College Inc. | | 5.000 | % | | 11/1/21 | | | 1,160,000 | | | 1,178,780 |
McDaniel College Inc. | | 5.000 | % | | 11/1/22 | | | 250,000 | | | 253,202 |
McDaniel College Inc. | | 5.000 | % | | 11/1/31 | | | 3,500,000 | | | 3,361,505 |
Total Education | | | | | | | | | | | 27,049,015 |
Health Care — 22.2% | | | | | | | | | | | |
Baltimore County, Maryland, Revenue Bonds: | | | | | | | | | | | |
Catholic Health Initiatives | | 5.000 | % | | 9/1/20 | | | 1,050,000 | | | 1,110,574 |
Oak Crest Village Inc. | | 5.000 | % | | 1/1/22 | | | 1,550,000 | | | 1,495,192 |
Maryland Health & Higher EFA Refunding Revenue Bonds, MedStar Health Issue | | 5.500 | % | | 8/15/25 | | | 785,000 | | | 807,263 |
Maryland Health & Higher EFA Revenue Bonds: | | | | | | | | | | | |
Anne Arundel Health System | | 6.750 | % | | 7/1/29 | | | 2,000,000 | | | 2,281,620 |
Board of Child Care Issue | | 5.500 | % | | 7/1/18 | | | 1,110,000 | | | 1,146,885 |
Calvert Health Systems Issue | | 5.500 | % | | 7/1/39 | | | 2,000,000 | | | 2,026,160 |
Carroll County General Hospital Issue | | 5.750 | % | | 7/1/22 | | | 1,000,000 | | | 1,036,860 |
Carroll County General Hospital Issue | | 6.000 | % | | 7/1/26 | | | 2,000,000 | | | 2,063,880 |
Carroll County General Hospital Issue | | 5.750 | % | | 7/1/27 | | | 1,050,000 | | | 1,073,510 |
Carroll County General Hospital Issue | | 5.800 | % | | 7/1/32 | | | 2,000,000 | | | 2,034,980 |
Hebrew Home of Greater Washington Issue | | 5.800 | % | | 1/1/32 | | | 2,250,000 | | | 2,263,770 |
Helix Health Issue, AMBAC | | 5.250 | % | | 8/15/38 | | | 3,000,000 | | | 3,020,280 |
Johns Hopkins Medicine, Howard County General Hospital Acquisition Issue, NATL | | 5.000 | % | | 7/1/29 | | | 2,000,000 | | | 1,987,620 |
Peninsula Regional Medical Center Issue | | 5.000 | % | | 7/1/19 | | | 1,000,000 | | | 1,042,870 |
Peninsula Regional Medical Center Issue | | 5.000 | % | | 7/1/26 | | | 2,435,000 | | | 2,477,856 |
Refunding, Mercy Ridge | | 4.750 | % | | 7/1/34 | | | 3,200,000 | | | 2,912,416 |
See Notes to Financial Statements.
| | |
| 10 | | Legg Mason Investment Counsel Maryland Tax-Free Income Trust 2010 Annual Report |
Schedule of investments (cont’d)
March 31, 2010
Legg Mason Investment Counsel Maryland Tax-Free Income Trust
| | | | | | | | | | | | |
| Security | | Rate | | | Maturity
Date | | Face
Amount | | Value | |
Health Care — continued | | | | | | | | | | | | |
The Johns Hopkins Hospital Issue, zero coupon bond | | 0.000 | % | | 7/1/19 | | $ | 4,000,000 | | $ | 2,611,520 | |
Union Hospital of Cecil County Issue | | 5.500 | % | | 7/1/22 | | | 250,000 | | | 254,020 | |
Washington County Hospital Issue | | 4.000 | % | | 1/1/15 | | | 1,000,000 | | | 1,008,120 | |
Washington County Hospital Issue | | 4.750 | % | | 1/1/16 | | | 1,000,000 | | | 1,032,350 | |
Washington County Hospital Issue | | 6.000 | % | | 1/1/43 | | | 1,000,000 | | | 991,390 | |
Maryland State Health & Higher EFA Revenue: | | | | | | | | | | | | |
Carroll County General Hospital | | 6.000 | % | | 7/1/37 | | | 1,000,000 | | | 1,017,010 | |
Mercy Medical Center Inc. | | 5.500 | % | | 7/1/42 | | | 1,445,000 | | | 1,363,907 | |
Refunding, Kennedy Krieger Issue | | 5.125 | % | | 7/1/22 | | | 3,000,000 | | | 2,854,320 | |
Suburban Hospital | | 5.500 | % | | 7/1/16 | | | 500,000 | | | 539,640 | |
University of Maryland Medical System | | 5.000 | % | | 7/1/34 | | | 1,000,000 | | | 992,980 | |
Washington County Hospital | | 5.250 | % | | 1/1/23 | | | 500,000 | | | 501,535 | |
Washington County Hospital | | 5.750 | % | | 1/1/38 | | | 2,000,000 | | | 1,935,240 | |
Total Health Care | | | | | | | | | | | 43,883,768 | |
Housing — 7.3% | | | | | | | | | | | | |
Community Development Administration, Maryland Department of Housing and Community Development Residential Revenue Bonds | | 5.200 | % | | 9/1/22 | | | 1,790,000 | | | 1,792,166 | (a) |
Community Development Administration, Maryland Department of Housing and Community Development Residential Revenue Bonds | | 5.375 | % | | 9/1/22 | | | 180,000 | | | 180,306 | (a) |
Community Development Administration, Maryland Department of Housing and Community Development Residential Revenue Bonds | | 5.375 | % | | 9/1/24 | | | 2,000,000 | | | 2,005,560 | (a) |
Community Development Administration, Maryland Department of Housing and Community Development Residential Revenue Bonds | | 4.500 | % | | 9/1/29 | | | 2,490,000 | | | 2,467,640 | |
Community Development Administration, Maryland Department of Housing and Community Development Residential Revenue Bonds | | 4.750 | % | | 9/1/29 | | | 1,000,000 | | | 1,008,230 | |
Community Development Administration, Maryland Department of Housing and Community Development Residential Revenue Bonds | | 5.050 | % | | 9/1/39 | | | 1,980,000 | | | 1,986,633 | |
Community Development Administration, Maryland Department of Housing and Community Development Residential Revenue Bonds, Capital Funding Securitization, AGM | | 4.400 | % | | 7/1/21 | | | 1,000,000 | | | 1,027,570 | |
Maryland State Community Development Administration, Department of Housing & Community Development | | 5.375 | % | | 9/1/39 | | | 1,500,000 | | | 1,536,060 | |
Montgomery County, Maryland, Revenue Bonds: | | | | | | | | | | | | |
Housing Opportunities Commission, Single Family Mortgage | | 4.875 | % | | 7/1/25 | | | 1,000,000 | | | 1,023,510 | |
Housing Opportunities Commission, Single Family Mortgage | | 5.000 | % | | 7/1/27 | | | 1,535,000 | | | 1,529,612 | (a) |
Total Housing | | | | | | | | | | | 14,557,287 | |
Industrial Revenue — 7.8% | | | | | | | | | | | | |
IDA of Prince George’s County, Maryland, Subordinated Lease Revenue Bonds: | | | | | | | | | | | | |
Upper Marlboro Justice Center Expansion Project, NATL | | 5.125 | % | | 6/30/15 | | | 3,340,000 | | | 3,667,320 | |
Upper Marlboro Justice Center Expansion Project, NATL | | 5.000 | % | | 6/30/19 | | | 1,000,000 | | | 1,064,640 | |
Maryland EDC, EDR, Lutheran World Relief Inc. and Immigration and Refugee Service | | 5.250 | % | | 4/1/29 | | | 565,000 | | | 528,897 | |
Maryland IDA, EDR Bonds, National Aquarium in Baltimore Facility | | 5.000 | % | | 11/1/19 | | | 500,000 | | | 496,980 | |
Maryland IDA, Refunding Revenue Bonds, American Center for Physics Headquarters Facility | | 5.250 | % | | 12/15/15 | | | 320,000 | | | 336,656 | |
Mayor and City Council of Baltimore, Port Facilities Revenue Bonds, Consolidation Coal Sales Company Project | | 6.500 | % | | 10/1/11 | | | 6,000,000 | | | 6,219,540 | |
Puerto Rico Commonwealth Government Development Bank | | 4.750 | % | | 12/1/15 | | | 3,000,000 | | | 3,081,780 | |
Total Industrial Revenue | | | | | | | | | | | 15,395,813 | |
See Notes to Financial Statements.
| | |
| Legg Mason Investment Counsel Maryland Tax-Free Income Trust 2010 Annual Report | | 11 |
Legg Mason Investment Counsel Maryland Tax-Free Income Trust
| | | | | | | | | | | | |
| Security | | Rate | | | Maturity
Date | | Face
Amount | | Value | |
Local General Obligation — 5.2% | | | | | | | | | | | | |
Anne Arundel County, Maryland, GO Bonds, Consolidated General
Improvement Bonds | | 4.500 | % | | 3/1/23 | | $ | 1,000,000 | | $ | 1,069,050 | |
Baltimore County, Maryland, GO Bonds, Metropolitan District Bonds, 70th Issue | | 4.250 | % | | 9/1/26 | | | 1,000,000 | | | 1,024,190 | |
Frederick County, Maryland, GO Bonds, Public Facilities Refunding Bonds | | 5.000 | % | | 7/1/15 | | | 1,000,000 | | | 1,151,630 | |
Howard County, Maryland, GO Bonds, Consolidated Public Improvement Project and Refunding Bonds | | 5.000 | % | | 8/15/19 | | | 1,000,000 | | | 1,161,210 | |
Mayor and City Council of Baltimore, City of Baltimore, Maryland, GO Bonds, Consolidated Public Improvement Refunding Bonds, FGIC, zero coupon bond | | 0.000 | % | | 10/15/11 | | | 940,000 | | | 857,224 | |
Montgomery County, Maryland, GO Bonds, Consolidated Public Improvement, Refunding Bonds, zero coupon bond | | 0.000 | % | | 7/1/10 | | | 3,000,000 | | | 2,996,400 | |
Queen Anne’s County, Maryland, Public Facilities Refunding Bonds, NATL | | 5.000 | % | | 11/15/16 | | | 500,000 | | | 554,520 | |
The Maryland-National Capital Park and Planning Commission, Prince George’s County, Maryland, Park Acquisition and Development GO Bonds | | 5.125 | % | | 5/1/21 | | | 1,310,000 | | | 1,402,669 | (b) |
Total Local General Obligation | | | | | | | | | | | 10,216,893 | |
Pre-Refunded/Escrowed to Maturity — 8.6% | | | | | | | | | | | | |
City of Baltimore, Maryland, Mayor and City Council of Baltimore, Project and Refunding Revenue Bonds, Water Projects | | 5.000 | % | | 7/1/24 | | | 3,800,000 | | | 4,424,682 | (c) |
Maryland Health & Higher EFA Revenue Bonds: | | | | | | | | | | | | |
Helix Health Issue, AMBAC | | 5.125 | % | | 7/1/11 | | | 2,000,000 | | | 2,108,960 | (c) |
Howard County General Hospital Issue | | 5.500 | % | | 7/1/21 | | | 2,825,000 | | | 3,080,267 | (c) |
LifeBridge Health Issue | | 5.250 | % | | 7/1/18 | | | 1,640,000 | | | 1,882,015 | (b) |
University of Maryland Medical System Issue | | 5.750 | % | | 7/1/21 | | | 3,000,000 | | | 3,192,270 | (b) |
Maryland State Health & Higher EFA Revenue: | | | | | | | | | | | | |
University of Maryland Medical Systems | | 6.750 | % | | 7/1/30 | | | 1,250,000 | | | 1,281,462 | (b) |
University of Maryland Medical Systems | | 6.000 | % | | 7/1/32 | | | 1,000,000 | | | 1,110,750 | (b) |
Total Pre-Refunded/Escrowed to Maturity | | | | | | | | | | | 17,080,406 | |
State General Obligation — 7.6% | | | | | | | | | | | | |
Commonwealth of Puerto Rico, GO Bonds: | | | | | | | | | | | | |
Public Improvement Bonds | | 5.000 | % | | 7/1/25 | | | 2,000,000 | | | 1,964,300 | |
Public Improvement Bonds | | 6.000 | % | | 7/1/39 | | | 5,000,000 | | | 5,233,950 | |
Maryland State, State and Local Facilities Loan | | 5.500 | % | | 8/1/10 | | | 2,000,000 | | | 2,033,440 | |
State of Maryland, GO Bonds, State and Local Facilities Loan | | 5.500 | % | | 3/1/15 | | | 5,000,000 | | | 5,869,450 | |
Total State General Obligation | | | | | | | | | | | 15,101,140 | |
Transportation — 1.8% | | | | | | | | | | | | |
Department of Transportation of Maryland, Consolidated Transportation Bonds | | 5.500 | % | | 2/1/15 | | | 3,000,000 | | | 3,490,530 | |
Water & Sewer — 13.2% | | | | | | | | | | | | |
City of Baltimore, Maryland, Mayor and City Council of Baltimore, Project and Refunding Revenue Bonds: | | | | | | | | | | | | |
Wastewater Projects, FGIC | | 5.000 | % | | 7/1/22 | | | 1,910,000 | | | 2,001,222 | |
Water Projects | | 5.000 | % | | 7/1/24 | | | 1,890,000 | | | 2,036,229 | |
Water Projects, FGIC | | 5.125 | % | | 7/1/42 | | | 1,000,000 | | | 1,013,080 | |
City of Baltimore, Maryland, Mayor and City Council of Baltimore, Project and Revenue Bonds, Wastewater Projects, AGM | | 5.000 | % | | 7/1/33 | | | 4,000,000 | | | 4,229,160 | |
City of Baltimore, Maryland, Project Revenue Bonds, AMBAC | | 5.000 | % | | 7/1/23 | | | 1,000,000 | | | 1,071,970 | |
Northeast Maryland Waste Disposal Authority, Solid Waste Revenue, AMBAC | | 5.500 | % | | 4/1/16 | | | 3,425,000 | | | 3,560,424 | (a) |
Washington Suburban Sanitary District, Maryland, Montgomery and Prince George’s Counties, Water Supply Refunding Bonds | | 5.250 | % | | 6/1/16 | | | 1,650,000 | | | 1,931,853 | |
Washington Suburban Sanitary District, Maryland, Montgomery and Prince George’s Counties, Water Supply Refunding Bonds | | 5.750 | % | | 6/1/17 | | | 2,000,000 | | | 2,414,520 | |
See Notes to Financial Statements.
| | |
| 12 | | Legg Mason Investment Counsel Maryland Tax-Free Income Trust 2010 Annual Report |
Schedule of investments (cont’d)
March 31, 2010
Legg Mason Investment Counsel Maryland Tax-Free Income Trust
| | | | | | | | | | | | |
| Security | | Rate | | | Maturity
Date | | Face
Amount | | Value | |
Water & Sewer — continued | | | | | | | | | | | | |
Washington Suburban Sanitary District, Maryland, Montgomery and Prince George’s Counties, Water Supply Refunding Bonds | | 6.000 | % | | 6/1/18 | | $ | 2,705,000 | | $ | 3,334,156 | |
Washington Suburban Sanitary District, Maryland, Montgomery and Prince George’s Counties, Water Supply Refunding Bonds | | 6.000 | % | | 6/1/19 | | | 3,665,000 | | | 4,545,773 | |
Total Water & Sewer | | | | | | | | | | | 26,138,387 | |
Total Investments before Short-Term Investments (Cost — $161,559,825) | | | | | | | | | | | 172,913,239 | |
| Short-Term Investments — 11.5% | | | | | | | | | | | | |
Education — 2.4% | | | | | | | | | | | | |
Baltimore County, MD, EDR, Garrison Forest School Inc. Project,
LOC-SunTrust Bank | | 0.460 | % | | 4/1/10 | | | 4,800,000 | | | 4,800,000 | (d) |
Health Care — 5.9% | | | | | | | | | | | | |
Maryland Health & Higher EFA Revenue, University of Maryland Medical System, LOC-Wachovia Bank N.A. | | 0.290 | % | | 4/1/10 | | | 4,420,000 | | | 4,420,000 | (d) |
Maryland Health & Higher EFA Revenue Bonds, Anne Arundel Health System | | 0.290 | % | | 4/1/10 | | | 5,000,000 | | | 5,000,000 | (d) |
Maryland State Health & Higher EFA Revenue, LOC-JPMorgan Chase | | 0.280 | % | | 4/7/10 | | | 1,300,000 | | | 1,300,000 | (d) |
Maryland, HEFA Revenue, Pooled Loan Program, LOC-JPMorgan Chase | | 0.270 | % | | 4/7/10 | | | 900,000 | | | 900,000 | (d) |
Total Health Care | | | | | | | | | | | 11,620,000 | |
Industrial Revenue — 3.2% | | | | | | | | | | | | |
Maryland State EDC Revenue, American Urological Association | | 0.600 | % | | 4/7/10 | | | 1,200,000 | | | 1,200,000 | (d) |
Maryland State IDR, Calvert School Inc., LOC-SunTrust Bank | | 0.600 | % | | 4/7/10 | | | 5,195,000 | | | 5,195,000 | (d) |
Total Industrial Revenue | | | | | | | | | | | 6,395,000 | |
Total Short-Term Investments (Cost — $22,815,000) | | | | | | | | | | | 22,815,000 | |
Total Investments — 98.9% (Cost — $184,374,825#) | | | | | | | | | | | 195,728,239 | |
Other Assets in Excess of Liabilities — 1.1% | | | | | | | | | | | 2,082,243 | |
Total Net Assets — 100.0% | | | | | | | | | | $ | 197,810,482 | |
| (a) | Income from this issue is considered a preference item for purposes of calculating the alternative minimum tax (“AMT”). |
| (b) | Pre-Refunded bonds are escrowed with U.S. government obligations and/or U.S. government agency securities and are considered by the manager to be triple-A rated even if issuer has not applied for new ratings. |
| (c) | Bonds are escrowed to maturity by government securities and/or U.S. government agency securities and are considered by the manager to be triple-A rated even if issuer has not applied for new ratings. |
| (d) | Variable rate demand obligations have a demand feature under which the Fund can tender them back to the issuer or liquidity provider on no more than 7 days notice. Date shown is the date of the next interest rate change. |
| # | Aggregate cost for federal income tax purposes is substantially the same. |
| | |
Abbreviations used in this schedule: |
| AGM | | — Assured Guaranty Municipal Corporation — Insured Bonds |
| AMBAC | | — American Municipal Bond Assurance Corporation — Insured Bonds |
| EDC | | — Economic Development Corporation |
| EDR | | — Economic Development Revenue |
| EFA | | — Educational Facilities Authority |
| FGIC | | — Financial Guaranty Insurance Company — Insured Bonds |
| GO | | — General Obligation |
| HEFA | | — Health & Educational Facilities Authority |
| IDA | | — Industrial Development Authority |
| IDR | | — Industrial Development Revenue |
| LOC | | — Letter of Credit |
| NATL | | — National Public Finance Guarantee Corporation — Insured Bonds |
See Notes to Financial Statements.
| | |
| Legg Mason Investment Counsel Maryland Tax-Free Income Trust 2010 Annual Report | | 13 |
Legg Mason Investment Counsel Maryland Tax-Free Income Trust
| | | |
| Ratings Table† (unaudited) | | | |
| S&P/Moody’s/Fitch‡ | | | |
| AAA/Aaa | | 21.3 | % |
| AA/Aa | | 22.9 | |
| A | | 25.9 | |
| BBB/Baa | | 15.1 | |
| A-1/VMIG 1 | | 11.6 | |
| NR | | 3.2 | |
| | | 100.0 | % |
| † | As a percentage of total investments. |
| ‡ | In the event that a security is rated by multiple nationally recognized statistical rating organizations (“NRSROs”) and receives different ratings, the Fund will treat the security as being rated in the highest rating category received from an NRSRO. |
See pages 14 and 15 for definitions of ratings.
See Notes to Financial Statements.
| | |
| 14 | | Legg Mason Investment Counsel Maryland Tax-Free Income Trust 2010 Annual Report |
Bond ratings (unaudited)
The definitions of the applicable rating symbols are set forth below:
Standard & Poor’s Ratings Service (“Standard & Poor’s”) — Ratings from “AA” to “CCC” may be modified by the addition of a plus (+) or minus (–) sign to show relative standings within the major rating categories.
AAA | — | Bonds rated “AAA” have the highest rating assigned by Standard & Poor’s. Capacity to pay interest and repay principal is extremely strong. |
AA | — | Bonds rated “AA” have a very strong capacity to pay interest and repay principal and differ from the highest rated issues only in a small degree. |
A | — | Bonds rated “A” have a strong capacity to pay interest and repay principal although they are somewhat more susceptible to the adverse effects of changes in circumstances and economic conditions than debt in higher rated categories. |
BBB | — | Bonds rated “BBB” are regarded as having an adequate capacity to pay interest and repay principal. Whereas they normally exhibit adequate protection parameters, adverse economic conditions or changing circumstances are more likely to lead to a weakened capacity to pay interest and repay principal for bonds in this category than in higher rated categories. |
BB, B, CCC, CC and C | — | Bonds rated “BB”, “B”, “CCC”, “CC” and “C” are regarded, on balance, as predominantly speculative with respect to capacity to pay interest and repay principal in accordance with the terms of the obligation. “BB” represents the lowest degree of speculation and “C” the highest degree of speculation. While such bonds will likely have some quality and protective characteristics, these are outweighed by large uncertainties or major risk exposures to adverse conditions. |
D | — | Bonds rated “D” are in default and payment of interest and/or repayment of principal is in arrears. |
Moody’s Investors Service (“Moody’s”) — Numerical modifiers 1, 2 and 3 may be applied to each generic rating from “Aa” to “Caa,” where 1 is the highest and 3 the lowest ranking within its generic category.
Aaa | — | Bonds rated “Aaa” are judged to be of the best quality. They carry the smallest degree of investment risk and are generally referred to as “gilt edge.” Interest payments are protected by a large or by an exceptionally stable margin and principal is secure. While the various protective elements are likely to change, such changes can be visualized as most unlikely to impair the fundamentally strong position of such issues. |
Aa | — | Bonds rated “Aa” are judged to be of high quality by all standards. Together with the “Aaa” group they comprise what are generally known as high grade bonds. They are rated lower than the best bonds because margins of protection may not be as large as in “Aaa” securities or fluctuation of protective elements may be of greater amplitude or there may be other elements present which make the long-term risks appear somewhat larger than in “Aaa” securities. |
A | — | Bonds rated “A” possess many favorable investment attributes and are to be considered as upper medium grade obligations. Factors giving security to principal and interest are considered adequate but elements may be present which suggest a susceptibility to impairment some time in the future. |
Baa | — | Bonds rated “Baa” are considered as medium grade obligations, i.e., they are neither highly protected nor poorly secured. Interest payments and principal security appear adequate for the present but certain protective elements may be lacking or may be characteristically unreliable over any great length of time. Such bonds lack outstanding investment characteristics and in fact have speculative characteristics as well. |
Ba | — | Bonds rated “Ba” are judged to have speculative elements; their future cannot be considered as well assured. Often the protection of interest and principal payments may be very moderate and therefore not well safeguarded during both good and bad times over the future. Uncertainty of position characterizes bonds in this class. |
B | — | Bonds rated “B” generally lack characteristics of desirable investments. Assurance of interest and principal payments or of maintenance of other terms of the contract over any long period of time may be small. |
| | |
| Legg Mason Investment Counsel Maryland Tax-Free Income Trust 2010 Annual Report | | 15 |
Caa | — | Bonds rated “Caa” are of poor standing. These may be in default, or present elements of danger may exist with respect to principal or interest. |
Ca | — | Bonds rated “Ca” represent obligations which are speculative in a high degree. Such issues are often in default or have other marked short-comings. |
C | — | Bonds rated “C” are the lowest class of bonds and issues so rated can be regarded as having extremely poor prospects of ever attaining any real investment standing. |
Fitch Ratings Service (“Fitch”) — Ratings from “AA” to “CCC” may be modified by the addition of a plus (+) or
minus (–) sign to show relative standings within the major rating categories.
AAA | — | Bonds rated “AAA” have the highest rating assigned by Fitch. Capacity to pay interest and repay principal is extremely strong. |
AA | — | Bonds rated “AA” have a very strong capacity to pay interest and repay principal and differ from the highest rated issues only in a small degree. |
A | — | Bonds rated “A” have a strong capacity to pay interest and repay principal although they are somewhat more susceptible to the adverse effects of changes in circumstances and economic conditions than debt in higher rated categories. |
BBB | — | Bonds rated “BBB” are regarded as having an adequate capacity to pay interest and repay principal. Whereas they normally exhibit adequate protection parameters, adverse economic conditions or changing circumstances are more likely to lead to a weakened capacity to pay interest and repay principal for bonds in this category than in higher rated categories. |
BB, B, CCC, CC and C | — | Bonds rated “BB”, “B”, “CCC”, “CC” and “C” are regarded, on balance, as predominantly speculative with respect to capacity to pay interest and repay principal in accordance with the terms of the obligation. “BB” represents the lowest degree of speculation and “C” the highest degree of speculation. While such bonds will likely have some quality and protective characteristics, these are outweighed by large uncertainties or major risk exposures to adverse conditions |
D | — | Bond rated “D” are in default and payment of interest and/or repayment of principal is in arrears. |
NR | — | Indicates that the bond is not rated by Standard & Poor’s, Moody’s or Fitch. |
Short-term security ratings (unaudited)
SP-1 | — | Standard & Poor’s highest rating indicating very strong or strong capacity to pay principal and interest; those issues determined to possess overwhelming safety characteristics are denoted with a plus (+) sign. |
A-1 | — | Standard & Poor’s highest commercial paper and variable-rate demand obligation (VRDO) rating indicating that the degree of safety regarding timely payment is either overwhelming or very strong; those issues determined to possess overwhelming safety characteristics are denoted with a plus (+) sign. |
VMIG 1 | — | Moody’s highest rating for issues having a demand feature — VRDO. |
MIG 1 | — | Moody’s highest rating for short-term municipal obligations. |
P-1 | — | Moody’s highest rating for commercial paper and for VRDO prior to the advent of the VMIG 1 rating. |
F1 | — | Fitch’s highest rating indicating the strongest capacity for timely payment of financial commitments; those issues determined to possess overwhelming strong credit feature are denoted with a plus (+) sign. |
| | |
| 16 | | Legg Mason Investment Counsel Maryland Tax-Free Income Trust 2010 Annual Report |
Statement of assets and liabilities
March 31, 2010
| | | |
| |
| Assets: | | | |
Investments, at value (Cost — $161,559,825) | | $ | 172,913,239 |
Short-term investments (Cost — $22,815,000) | | | 22,815,000 |
Cash | | | 1,362,204 |
Interest receivable | | | 2,337,436 |
Receivable for Fund shares sold | | | 141,573 |
Prepaid expenses | | | 21,636 |
Total Assets | | | 199,591,088 |
| |
| Liabilities: | | | |
Payable for securities purchased | | | 1,300,224 |
Payable for Fund shares repurchased | | | 229,302 |
Distributions payable | | | 56,585 |
Investment management fee payable | | | 55,792 |
Distribution fees payable | | | 33,477 |
Trustees’ fees payable | | | 3,570 |
Accrued expenses | | | 101,656 |
Total Liabilities | | | 1,780,606 |
| Total Net Assets | | $ | 197,810,482 |
| |
| Net Assets: | | | |
Par value (Note 8) | | $ | 11,987 |
Paid-in capital in excess of par value | | | 186,935,088 |
Undistributed net investment income | | | 22,162 |
Accumulated net realized loss on investments | | | (512,169) |
Net unrealized appreciation on investments | | | 11,353,414 |
| Total Net Assets | | $ | 197,810,482 |
| |
| Shares Outstanding: | | | |
Class A | | | 10,216,417 |
Class C | | | 1,272,662 |
Class I* | | | 498,050 |
| |
| Net Asset Value: | | | |
Class A (and redemption price) | | | $16.50 |
Class C† | | | $16.50 |
Class I* (and redemption price) | | | $16.51 |
| Maximum Public Offering Price Per Share: | | | |
Class A (based on maximum initial sales charge of 4.25%) | | | $17.23 |
| * | On October 5, 2009, Institutional Class shares were renamed Class I shares. |
| † | Redemption price per share is NAV of Class C shares reduced by a 1.00% CDSC if shares are redeemed within one year from purchase payment (See Note 2). |
See Notes to Financial Statements.
| | |
| Legg Mason Investment Counsel Maryland Tax-Free Income Trust 2010 Annual Report | | 17 |
Statement of operations
For the Year Ended March 31, 2010
| | | |
| |
| Investment Income: | | | |
Interest | | $ | 8,016,641 |
| |
| Expenses: | | | |
Investment management fee (Note 2) | | | 974,824 |
Distribution fees (Notes 2 and 5) | | | 321,223 |
Transfer agent fees (Note 5) | | | 99,556 |
Shareholder reports (Note 5) | | | 56,578 |
Trustees’ fees | | | 52,997 |
Custody fees | | | 34,640 |
Legal fees | | | 31,029 |
Audit and tax | | | 29,957 |
Registration fees | | | 22,198 |
Insurance | | | 4,031 |
Miscellaneous expenses | | | 27,755 |
Total Expenses | | | 1,654,788 |
Less: Fee waivers and/or expense reimbursements (Notes 2 and 5) | | | (440,877) |
Compensating balance agreements (Note 1) | | | (2,400) |
Net Expenses | | | 1,211,511 |
| Net Investment Income | | | 6,805,130 |
| |
| Realized and Unrealized Gain (loss) on Investments (Notes 1, 3 and 4): | | | |
Net realized gain from investment transactions | | | 203,806 |
Change in Net Unrealized Appreciation/Depreciation on Investments | | | 9,283,755 |
| Net Gain on Investments | | | 9,487,561 |
| Increase in Net Assets from Operations | | $ | 16,292,691 |
See Notes to Financial Statements.
| | |
| 18 | | Legg Mason Investment Counsel Maryland Tax-Free Income Trust 2010 Annual Report |
Statements of changes in net assets
| | | | | | |
| For the Years Ended March 31, | | 2010 | | 2009 |
| | |
| Operations: | | | | | | |
Net investment income | | $ | 6,805,130 | | $ | 6,519,362 |
Net realized gain (loss) | | | 203,806 | | | (531,010) |
Change in net unrealized appreciation/depreciation | | | 9,283,755 | | | (2,939,284) |
Increase in Net Assets From Operations | | | 16,292,691 | | | 3,049,068 |
| | |
| Distributions to Shareholders From (Notes 1 and 7): | | | | | | |
Net investment income | | | (6,805,280) | | | (6,519,393) |
Decrease in Net Assets from Distributions to Shareholders | | | (6,805,280) | | | (6,519,393) |
| | |
| Fund Share Transactions (Note 8): | | | | | | |
Net proceeds from sale of shares | | | 47,774,942 | | | 34,130,784 |
Reinvestment of distributions | | | 6,107,034 | | | 6,691,406 |
Cost of shares repurchased | | | (16,491,724) | | | (35,811,296) |
Increase in Net Assets From Fund Share Transactions | | | 37,390,252 | | | 5,010,894 |
Increase in Net Assets | | | 46,877,663 | | | 1,540,569 |
| | |
| Net Assets: | | | | | | |
Beginning of year | | | 150,932,819 | | | 149,392,250 |
End of year* | | $ | 197,810,482 | | $ | 150,932,819 |
* Includes undistributed net investment income of: | | | $22,162 | | | $22,312 |
See Notes to Financial Statements.
| | |
| Legg Mason Investment Counsel Maryland Tax-Free Income Trust 2010 Annual Report | | 19 |
Financial highlights
| | | | | | | | | | | | | | | |
| For a share of each class of beneficial interest outstanding throughout each year ended March 31: | |
| Class A Shares | | 20101 | | | 20091 | | | 20081 | | | 20071 | | | 2006 | |
| | | | | |
| Net asset value, beginning of year | | $15.58 | | | $15.89 | | | $16.28 | | | $16.25 | | | $16.40 | |
| | | | | |
| Income (loss) from operations: | | | | | | | | | | | | | | | |
Net investment income | | 0.63 | | | 0.68 | | | 0.67 | | | 0.68 | | | 0.67 | |
Net realized and unrealized gain (loss) | | 0.92 | | | (0.31) | | | (0.39) | | | 0.06 | | | (0.15) | |
Total income from operations | | 1.55 | | | 0.37 | | | 0.28 | | | 0.74 | | | 0.52 | |
| | | | | |
| Less distributions from: | | | | | | | | | | | | | | | |
Net investment income | | (0.63) | | | (0.68) | | | (0.67) | | | (0.68) | | | (0.67) | |
Net realized gains | | — | | | — | | | (0.00) | 2 | | (0.03) | | | (0.00) | 2 |
Total distributions | | (0.63) | | | (0.68) | | | (0.67) | | | (0.71) | | | (0.67) | |
| | | | | |
| Net asset value, end of year | | $16.50 | | | $15.58 | | | $15.89 | | | $16.28 | | | $16.25 | |
Total return3 | | 10.08 | % | | 2.46 | % | | 1.76 | % | | 4.64 | % | | 3.22 | % |
| | | | | |
| Net assets, end of year (000s) | | $168,589 | | | $145,672 | | | $149,392 | | | $144,559 | | | $145,845 | |
| | | | | |
| Ratios to average net assets: | | | | | | | | | | | | | | | |
Gross expenses | | 0.89 | % | | 1.03 | % | | 0.96 | % | | 0.97 | % | | 0.97 | % |
Net expenses4,5 | | 0.65 | 6 | | 0.70 | | | 0.70 | | | 0.70 | | | 0.70 | |
Net investment income | | 3.88 | | | 4.40 | | | 4.15 | | | 4.16 | | | 4.10 | |
| | | | | |
| Portfolio turnover rate | | 6 | % | | 8 | % | | 6 | % | | 9 | % | | 5 | % |
| 1 | Per share amounts have been calculated using the average shares method. |
| 2 | Amount represents less than $0.005 per share. |
| 3 | Performance figures, exclusive of sales charges, may reflect fee waivers and/or expense reimbursements. In the absence of fee waivers and/or expense reimbursements, the total return would have been lower. Past performance is no guarantee of future results. |
| 4 | As a result of an expense limitation agreement, the ratio of expenses, other than interest, brokerage, taxes and extraordinary expenses, to average net assets of Class A shares will not exceed 0.70% until December 31, 2011. |
| 5 | Reflects fee waivers and/or expense reimbursements. |
| 6 | The impact to the expense ratio was less than 0.01% as a result of compensating balance agreements. |
See Notes to Financial Statements.
| | |
| 20 | | Legg Mason Investment Counsel Maryland Tax-Free Income Trust 2010 Annual Report |
Financial highlights (cont’d)
| | | | | | |
| For a share of each class of beneficial interest outstanding throughout each year ended March 31, unless otherwise noted: | |
| Class C Shares1 | | 2010 | | | 20092 | |
| | |
| Net asset value, beginning of year | | $15.58 | | | $15.59 | |
| | |
| Income from operations: | | | | | | |
Net investment income | | 0.52 | | | 0.07 | |
Net realized and unrealized gain | | 0.94 | | | 0.01 | |
Total income from operations | | 1.46 | | | 0.08 | |
| | |
| Less distributions from: | | | | | | |
Net investment income | | (0.54) | | | (0.09) | |
Total distributions | | (0.54) | | | (0.09) | |
| | |
| Net asset value, end of year | | $16.50 | | | $15.58 | |
Total return3 | | 9.44 | % | | 0.53 | % |
| | |
| Net assets, end of year (000s) | | $21,000 | | | $1,965 | |
| | |
| Ratios to average net assets: | | | | | | |
Gross expenses | | 1.52 | % | | 1.99 | %4 |
Net expenses5,6 | | 1.20 | 7 | | 1.17 | 4 |
Net investment income | | 3.22 | | | 3.51 | 4 |
| | |
| Portfolio turnover rate | | 6 | % | | 8 | % |
| 1 | Per share amounts have been calculated using the average shares method. |
| 2 | For the period February 5, 2009 (inception date) to March 31, 2009. |
| 3 | Performance figures, exclusive of CDSC, may reflect fee waivers and/or expense reimbursements. In the absence of fee waivers and/or expense reimbursements, the total return would have been lower. Past performance is no guarantee of future results. Total returns for periods of less than one year are not annualized. |
| 5 | As a result of an expense limitation agreement, the ratio of expenses, other than interest, brokerage, taxes and extraordinary expenses, to average net assets of Class C shares will not exceed 1.25% until December 31, 2011. |
| 6 | Reflects fee waivers and/or expense reimbursements. |
| 7 | The impact to the expense ratio was less than 0.01% as a result of compensating balance agreements. |
See Notes to Financial Statements.
| | |
| Legg Mason Investment Counsel Maryland Tax-Free Income Trust 2010 Annual Report | | 21 |
| | | | | | |
| For a share of each class of beneficial interest outstanding throughout each year ended March 31, unless otherwise noted: | |
| Class I Shares1,2 | | 2010 | | | 20093 | |
| | |
| Net asset value, beginning of year | | $15.58 | | | $15.83 | |
| | |
| Income (loss) from operations: | | | | | | |
Net investment income | | 0.66 | | | 0.47 | |
Net realized and unrealized gain (loss) | | 0.94 | | | (0.24) | |
Total income from operations | | 1.60 | | | 0.23 | |
| | |
| Less distributions from: | | | | | | |
Net investment income | | (0.67) | | | (0.48) | |
Total distributions | | (0.67) | | | (0.48) | |
| | |
| Net asset value, end of year | | $16.51 | | | $15.58 | |
Total return4 | | 10.38 | % | | 1.58 | % |
| | |
| Net assets, end of year (000s) | | $8,221 | | | $3,296 | |
| | |
| Ratios to average net assets: | | | | | | |
Gross expenses | | 0.90 | % | | 1.22 | %5 |
Net expenses6,7 | | 0.45 | 8 | | 0.45 | 5 |
Net investment income | | 4.04 | | | 4.72 | 5 |
| | |
| Portfolio turnover rate | | 6 | % | | 8 | % |
| 1 | Effective October 5, 2009, Institutional Class shares were renamed Class I shares. |
| 2 | Per share amounts have been calculated using the average shares method. |
| 3 | For the period July 30, 2008 (inception date) to March 31, 2009. |
| 4 | Performance figures may reflect fee waivers and/or expense reimbursements. In the absence of fee waivers and/or expense reimbursements, the total return would have been lower. Past performance is no guarantee of future results. Total returns for periods of less than one year are not annualized. |
| 6 | As a result of an expense limitation agreement, the ratio of expenses, other than interest, brokerage, taxes and extraordinary expenses, to average net assets of Class I shares will not exceed 0.45% until December 31, 2011. |
| 7 | Reflects fee waivers and/or expense reimbursements. |
| 8 | The impact to the expense ratio was less than 0.01% as a result of compensating balance agreements. |
See Notes to Financial Statements.
| | |
| 22 | | Legg Mason Investment Counsel Maryland Tax-Free Income Trust 2010 Annual Report |
Notes to financial statements
1. Organization and significant accounting policies
Legg Mason Investment Counsel Maryland Tax-Free Income Trust (the “Fund”) (formerly known as Legg Mason Maryland Tax-Free Income Trust) is a separate non-diversified investment series of Legg Mason Tax-Free Income Fund (the “Trust”). The Trust, a Massachusetts business trust, is registered under the Investment Company Act of 1940, as amended (the “1940 Act”), as an open-end management investment company.
The Fund consists of four classes of shares: Class A, Class C, Class I (formerly known as Institutional Class) and Class FI (formerly known as Financial Intermediary Class) (currently not active). The income and expenses of the Fund are allocated proportionately to each class of shares based on daily net assets, except for Rule 12b-1 distribution and service fees, which are charged only on Class A and Class C shares. Transfer agent and shareholder servicing expenses are charged separately to each class.
The following are significant accounting policies consistently followed by the Fund and are in conformity with U.S. generally accepted accounting principles (“GAAP”). Estimates and assumptions are required to be made regarding assets, liabilities and changes in net assets resulting from operations when financial statements are prepared. Changes in the economic environment, financial markets and any other parameters used in determining these estimates could cause actual results to differ. Subsequent events have been evaluated through the issuance date of the financial statements.
(a) Investment Valuation. Securities are valued at the last quoted bid provided by an independent pricing service, which are based on transactions in municipal obligations, quotations from municipal bond dealers, market transactions in comparable securities and various other relationships between securities. When prices are not readily available, or are determined not to reflect fair value, the Fund values these securities at fair value as determined in accordance with procedures approved by the Fund’s Board of Trustees. Short-term obligations with maturities of 60 days or less are valued at amortized cost, which approximates fair value.
The Fund has adopted Financial Accounting Standards Board Codification Topic 820 (formerly, Statement of Financial Accounting Standards No. 157) (“ASC Topic 820”). ASC Topic 820 establishes a single definition of fair value, creates a three-tier hierarchy as a framework for measuring fair value based on inputs used to value the Fund’s investments, and requires additional disclosure about fair value. The hierarchy of inputs is summarized below.
| Ÿ | | Level 1 — quoted prices in active markets for identical investments |
| Ÿ | | Level 2 — other significant observable inputs (including quoted prices for similar investments, interest rates, prepayment speeds, credit risk, etc.) |
| Ÿ | | Level 3 — significant unobservable inputs (including the Fund’s own assumptions in determining the fair value of investments) |
The inputs or methodology used for valuing securities are not necessarily an indication of the risk associated with investing in those securities.
The Fund uses valuation techniques to measure fair value that are consistent with the market approach and/or income approach, depending on the type of the security and the particular circumstance. The market approach uses prices and other relevant information generated by market transactions involving identical or comparable securities. The income approach uses valuation techniques to convert future amounts of cash flow to a single present amount.
The following is a summary of the inputs used in valuing the Fund’s assets carried at fair value:
| | | | | | | | | | |
| Description | | Quoted Prices
(Level 1) | | Other Significant
Observable Inputs
(Level 2) | | Significant
Unobservable
Inputs
(Level 3) | | Total |
| Municipal bonds† | | — | | $ | 172,913,239 | | — | | $ | 172,913,239 |
| Short-term investments† | | — | | | 22,815,000 | | — | | | 22,815,000 |
| Total investments | | — | | $ | 195,728,239 | | — | | $ | 195,728,239 |
| † | See Schedule of Investments for additional detailed categorizations. |
| | |
| Legg Mason Investment Counsel Maryland Tax-Free Income Trust 2010 Annual Report | | 23 |
(b) Concentration Risk. The Fund invests substantially all of its assets in securities issued by or on behalf of the State of Maryland its political subdivisions, municipalities, agencies, instrumentalities, and public authorities. Changes in economic conditions in, or governmental policies of, the State of Maryland could have a significant impact on the performance of the Fund.
The Fund may focus a significant amount of its investments in a single sector of the municipal securities market. In doing so, the Fund is more susceptible to factors adversely affecting that sector than a fund not following that practice. The Fund may invest a significant portion of assets in securities issued by local governments or public authorities that are rated according to their particular creditworthiness, which may vary significantly from the state’s general obligations. The value of the Fund’s shares will be more susceptible to being materially impacted by a single economic, political or regulatory event affecting those issuers or their securities than shares of a diversified fund.
(c) Security Transactions and Investment Income. Security transactions are accounted for on a trade date basis. Interest income, adjusted for amortization of premium and accretion of discount, is recorded on the accrual basis. Dividend income is recorded on the ex-dividend date. The cost of investments sold is determined by use of the specific identification method. To the extent any issuer defaults or a credit event occurs that impacts the issuer, the Fund may halt any additional interest income accruals and consider the realizability of interest accrued up to the date of default or credit event.
(d) Distributions to Shareholders. Distributions from net investment income on the shares of the Fund are declared each business day to shareholders of record, and are paid monthly. The Fund intends to satisfy conditions that will enable interest from municipal securities, which is exempt from federal and certain state income taxes, to retain such tax-exempt status when distributed to the shareholders of the Fund. Distributions of net realized gains, if any, are taxable and are declared at least annually. Distributions are recorded on the ex-dividend date and are determined in accordance with income tax regulations, which may differ from GAAP.
(e) Share Class Accounting. Investment income, common expenses and realized/unrealized gains (losses) on investments are allocated to the various classes of the Fund on the basis of daily net assets of each class. Fees relating to a specific class are charged directly to that share class.
(f) Compensating Balance Agreements. The Fund has an arrangement with its custodian bank whereby a portion of the custodian’s fees is paid indirectly by credits earned on the Fund’s cash on deposit with the bank. The amount is shown as a reduction of expenses in the Statement of Operations.
(g) Federal and Other Taxes. It is the Fund’s policy to comply with the federal income and excise tax requirements of the Internal Revenue Code of 1986 (the “Code”) as amended, applicable to regulated investment companies. Accordingly, the Fund intends to distribute its taxable income and net realized gains, if any, to shareholders in accordance with the timing requirements imposed by the Code. Therefore, no federal income tax provision is required in the Fund’s financial statements.
Management has analyzed the Fund’s tax positions taken on federal income tax returns for all open tax years and has concluded that as of March 31, 2010, no provision for income tax is required in the Fund’s financial statements. The Fund’s federal and state income and federal excise tax returns for tax years for which the applicable statutes of limitations have not expired are subject to examination by Internal Revenue Service and state departments of revenue.
(h) Reclassification. GAAP requires that certain components of net assets be adjusted to reflect permanent differences between financial and tax reporting. These reclassifications have no effect on net assets or net asset value per share. During the current year, the Fund had no reclassifications.
(i) Other. In the normal course of business, the Fund enters into contracts that provide general indemnifications. The Fund’s maximum exposure under these arrangements is dependent upon claims that may be made against the Fund in the future and, therefore, cannot be estimated; however, based on experience, the risk of material loss from such claims is considered remote.
| | |
| 24 | | Legg Mason Investment Counsel Maryland Tax-Free Income Trust 2010 Annual Report |
Notes to financial statements (cont’d)
2. Investment management agreement and other transactions with affiliates
Legg Mason Partners Investment Advisor, LLC (“LMPFA”) is the Fund’s investment manager and Legg Mason Investment Counsel, LLC (“LMIC”) is the Fund’s subadviser. Prior to September 30, 2009, Legg Mason Fund Adviser, Inc. (“LMFA”) was the investment manager. LMFA, LMIC and LMPFA are wholly-owned subsidiaries of Legg Mason, Inc. (“Legg Mason”).
Under the investment management agreement, the Fund pays an investment management fee, calculated daily and paid monthly, at an annual rate of 0.55% of the Fund’s average daily net assets.
LMIC serves as investment adviser to the Fund pursuant to a sub-advisory agreement with the Fund’s manager. The Fund’s manager (not the Fund) pays LMIC a fee, computed daily and payable monthly, at an annual rate of 0.50% of the Fund’s average daily net assets.
Legg Mason Investor Services, LLC (“LMIS”), a wholly-owned broker-dealer subsidiary of Legg Mason, serves as the Fund’s sole and exclusive distributor.
As a result of an expense limitation agreement between the Fund and LMPFA, the ratio of expenses, other than interest, brokerage, taxes, and extraordinary expenses to average net assets of Class A, Class C and Class I shares will not exceed 0.70%, 1.25% and 0.45%, respectively, until December 31, 2011. This expense limitation agreement can not be terminated prior to December 31, 2011 without the Board of Trustees’ consent.
During the year ended March 31, 2010, LMPFA waived a portion of its fee in the amount of $440,877.
The manager is permitted to recapture amounts previously forgone or reimbursed to the Fund during the same fiscal year if the Fund’s total annual operating expenses have fallen to a level below an expense limitation (“expense cap”). In no case will the manager recapture any amount that would result, on any particular business day of the Fund, in the Fund’s total annual operating expenses exceeding the expense cap.
There is a maximum initial sales charge of 4.25% for Class A shares. In addition, on February 1, 2009 Class C shares began charging a contingent deferred sales charge (“CDSC”) of 1.00%, on shares bought by investors on and after that date, which applies if redemption occurs within one year from purchase payment. In certain cases, Class A shares have a 1.00% CDSC, which applies to certain redemptions made within 12 months following purchases of $1,000,000 or more without an initial sales charge.
For the year ended March 31, 2010, LMIS and its affiliates received sales charges of approximately $47,000 on sales of the Fund’s Class A shares. In addition, for the year ended March 31, 2010, CDSCs paid to LMIS and its affiliates were approximately:
Under a Deferred Compensation Plan (the “Plan”), Trustees may elect to defer receipt of all or a specified portion of their compensation. A participating trustee may select one or more funds in which his or her deferred trustee’s fees will be deemed to be invested. Deferred amounts remain in the fund until distributed in accordance with the Plan.
Certain officers and Trustees of the Trust are employees of Legg Mason or its affiliates and do not receive compensation from the Trust.
3. Investments
During the year ended March 31, 2010, the aggregate cost of purchases and proceeds from sales of investments (excluding short-term investments) were as follows:
| | | |
| Purchases | | $ | 29,153,516 |
| Sales | | | 9,251,700 |
| | |
| Legg Mason Investment Counsel Maryland Tax-Free Income Trust 2010 Annual Report | | 25 |
At March 31, 2010, the aggregate gross unrealized appreciation and depreciation of investments for federal income tax purposes were as follows:
| | | | |
| Gross unrealized appreciation | | $ | 11,621,820 | |
| Gross unrealized depreciation | | | (268,406 | ) |
| Net unrealized appreciation | | $ | 11,353,414 | |
4. Derivative instruments and hedging activities
Financial Accounting Standards Board Codification Topic 815 (formerly, Statement of Financial Accounting Standards No. 161) (“ASC Topic 815”) requires enhanced disclosure about an entity’s derivative and hedging activities.
During the year ended March 31, 2010, the Fund did not invest in any derivative instruments.
5. Class specific expenses, waivers and/or reimbursements
The Fund has adopted a Rule 12b-1 distribution plan and under the plan the Fund pays a service fee with respect to its Class A and Class C shares calculated at the annual rate of 0.15% and 0.25% of the average daily net assets of each respective class. The Fund also pays a distribution fee with respect to its Class C shares calculated at the annual rate of 0.45% of the average daily net assets of its Class C shares. Distribution fees are accrued daily and paid monthly.
For the year ended March 31, 2010, class specific expenses were as follows:
| | | | | | | | | |
| | | Distribution
Fees | | Transfer Agent
Fees | | Shareholder Reports
Expenses* |
| Class A | | $ | 238,760 | | $ | 73,706 | | $ | 12,067 |
| Class C | | | 82,463 | | | 13,565 | | | 2,459 |
| Class I† | | | — | | | 12,285 | | | 1,273 |
| Total | | $ | 321,223 | | $ | 99,556 | | $ | 15,799 |
| † | On October 5, 2009 Institutional Class shares were renamed Class I shares. |
| * | For the period April 1, 2009 through September 10, 2009. Subsequent to September 10, 2009, these expenses were accrued as common fund expenses. |
For the year ended March 31, 2010, class specific waivers and/or expense reimbursements were as follows:
| | | |
| | | Waivers/
Reimbursements |
| Class A | | $ | 375,161 |
| Class C | | | 37,313 |
| Class I† | | | 28,403 |
| Total | | $ | 440,877 |
| † | On October 5, 2009 Institutional Class shares were renamed Class I shares. |
6. Line of Credit:
The Fund, along with certain other Legg Mason Funds, participates in a $200 million line of credit (“Credit Agreement”) to be used for temporary or emergency purposes. Pursuant to the Credit Agreement, each participating fund is liable only for principal and interest payments related to borrowings made by that fund. Borrowings under the Credit Agreement bear interest at a rate equal to the prevailing federal funds rate plus the federal funds rate margin. The Fund did not utilize the line of credit during the year ended March 31, 2010.
7. Distributions to shareholders by class
| | | | | | |
| | | Year Ended
March 31, 2010 | | Year Ended
March 31, 2009 |
| Net Investment Income: | | | | | | |
| Class A | | $ | 6,171,811 | | $ | 6,485,887 |
| Class C | | | 379,250 | | | 4,338 |
| Class I† | | | 254,219 | | | 29,168 |
| Total | | $ | 6,805,280 | | $ | 6,519,393 |
| † | On October 5, 2009 Institutional Class shares were renamed Class I shares. |
| | |
| 26 | | Legg Mason Investment Counsel Maryland Tax-Free Income Trust 2010 Annual Report |
Notes to financial statements (cont’d)
8. Shares of beneficial interest
At March 31, 2010, the Trust had an unlimited number of shares of beneficial interest authorized with a par value of $0.001 per share. The Fund has the ability to issue multiple classes of shares. Each share of a class represents an identical interest and has the same rights, except that each class bears certain direct expenses specifically related to the distribution of its shares.
Transactions in shares of each class were as follows:
| | | | | | | | | | | | |
| | | Year Ended
March 31, 2010 | | Year Ended
March 31, 2009 | |
| | | Shares | | Amount | | Shares | | | Amount | |
| | | | |
| Class A | | | | | | | | | | | | |
| Shares sold | | 1,400,587 | | $ | 22,815,472 | | 1,863,617 | | | $ | 28,855,036 | |
| Shares issued on reinvestment | | 348,856 | | | 5,683,109 | | 431,972 | | | | 6,683,580 | |
| Shares repurchased | | (884,350) | | | (14,397,412) | | (2,345,840) | | | | (35,795,611) | |
| Net increase (decrease) | | 865,093 | | $ | 14,101,169 | | (50,251) | | | $ | (256,995) | |
| | | | |
| Class C | | | | | | | | | | | | |
| Shares sold | | 1,188,309 | | $ | 19,337,294 | | 126,699 | * | | $ | 1,972,745 | * |
| Shares issued on reinvestment | | 19,342 | | | 317,256 | | 270 | * | | | 4,212 | * |
| Shares repurchased | | (61,106) | | | (1,002,035) | | (852) | * | | | (13,236) | * |
| Net increase | | 1,146,545 | | $ | 18,652,515 | | 126,117 | * | | $ | 1,963,721 | * |
| | | | |
| Class I† | | | | | | | | | | | | |
| Shares sold | | 347,026 | | $ | 5,622,176 | | 211,466 | ‡ | | $ | 3,303,003 | ‡ |
| Shares issued on reinvestment | | 6,494 | | | 106,669 | | 238 | ‡ | | | 3,614 | ‡ |
| Shares repurchased | | (67,016) | | | (1,092,277) | | (158) | ‡ | | | (2,449) | ‡ |
| Net increase | | 286,504 | | $ | 4,636,568 | | 211,546 | ‡ | | $ | 3,304,168 | ‡ |
| * | For the period February 5, 2009 (commencement of operations) to March 31, 2009. |
| † | On October 5, 2009 Institutional Class shares were renamed Class I shares. |
| ‡ | For the period July 30, 2008 (commencement of operations) to March 31, 2009. |
9. Income tax information and distributions to shareholders
Subsequent to the fiscal year end, the Fund has made the following distributions:
| | | | | | | | | |
Record Date
Payable Date | | Class A | | Class C | | Class I |
Daily
4/30/2010 | | $ | 0.055345 | | $ | 0.046820 | | $ | 0.057723 |
The tax character of distributions paid during the fiscal years ended March 31, were as follows:
| | | | | | |
| | | 2010 | | 2009 |
| | |
| Distributions Paid From: | | | | | | |
| Tax-exempt income | | $ | 6,725,282 | | $ | 6,454,435 |
| Ordinary income | | | 79,998 | | | 64,958 |
| Total taxable distributions | | $ | 79,998 | | $ | 64,958 |
| Total distributions paid | | $ | 6,805,280 | | $ | 6,519,393 |
As of March 31, 2010, the components of accumulated earnings on a tax basis were as follows:
| | | |
| Undistributed tax-exempt income — net | | $ | 93,693 |
| Capital loss carryforward* | | | (512,169) |
| Other book/tax temporary differences(a) | | | (71,531) |
| Unrealized appreciation/(depreciation) | | | 11,353,414 |
| Total accumulated earnings/(losses) — net | | $ | 10,863,407 |
| * | During the taxable year ended March 31, 2010, the Fund utilized $203,806 of its capital loss carryover available from prior years. As of March 31, 2010, the Fund had the following net capital loss carryforward remaining: |
| | | | |
| Year of Expiration | | Amount | |
| 3/31/2017 | | $ | (512,169 | ) |
This amount will be available to offset any future taxable capital gains.
| (a) | Other book/tax temporary differences are attributable primarily to the book/tax differences in the timing of the deductibility of various expenses. |
| | |
| Legg Mason Investment Counsel Maryland Tax-Free Income Trust 2010 Annual Report | | 27 |
Report of independent registered public accounting firm
To the Board of Trustees of Legg Mason Tax-Free Income Fund and Shareholders of Legg Mason Investment Counsel Maryland Tax-Free Income Trust:
In our opinion, the accompanying statement of assets and liabilities, including the portfolio of investments, and the related statements of operations and of changes in net assets and the financial highlights present fairly, in all material respects, the financial position of Legg Mason Investment Counsel Maryland Tax-Free Income Trust (comprising Legg Mason Tax-Free Income Fund, the “Fund”) at March 31, 2010, the results of its operations, the changes in its net assets, and the financial highlights for each of the periods presented, in conformity with accounting principles generally accepted in the United States of America. These financial statements and financial highlights (hereafter referred to as “financial statements”) are the responsibility of the Fund’s management; our responsibility is to express an opinion on these financial statements based on our audits. We conducted our audits of these financial statements in accordance with the standards of the Public Company Accounting Oversight Board (United States). Those standards require that we plan and perform the audit to obtain reasonable assurance about whether the financial statements are free of material misstatement. An audit includes examining, on a test basis, evidence supporting the amounts and disclosures in the financial statements, assessing the accounting principles used and significant estimates made by management, and evaluating the overall financial statement presentation. We believe that our audits, which included confirmation of securities at March 31, 2010 by correspondence with the custodian and brokers, provide a reasonable basis for our opinion.
PricewaterhouseCoopers LLP
Baltimore, Maryland
May 18, 2010
| | |
| 28 | | Legg Mason Investment Counsel Maryland Tax-Free Income Trust |
Board approval of management and subadvisory agreements (unaudited)
At its November 2009 meeting, the Fund’s Board of Trustees (the “Board”) approved the continuation of the advisory and management agreement (the “Management Agreement”) with Legg Mason Partners Fund Advisor, LLC (which contract was transferred by its affiliate, Legg Mason Fund Adviser, Inc., effective September 30, 2009) (the “Manager”) and the sub-advisory agreement (the “Sub-Advisory Agreement”) between Legg Mason Investment Counsel, LLC (the “Adviser”) and the Manager. The Trustees who are not “interested persons” of the Fund (as defined in the Investment Company Act of 1940, as amended (the “1940 Act”) (the “Independent Trustees”), met on October 14, 2009, with the assistance of their independent legal counsel and their contract review consultant, to review and evaluate the materials provided by the Manager and the Adviser to assist the Board, and in particular the Independent Trustees, in considering renewal of the Management and Sub-Advisory Agreements, respectively. At such October meeting the Independent Trustees received presentations from the Manager, as well as a memorandum from their independent legal counsel and materials from the contract review consultant. In follow up to that meeting, the Manager and the Adviser provided supplemental materials as requested. The Independent Trustees further discussed renewal of the Management and Sub-Advisory Agreements in various executive sessions held on November 5 and 6, 2009.
In voting to approve continuance of the Agreements, the Board, including the Independent Trustees, considered whether continuance of the Agreements would be in the best interests of the Fund and its shareholders. No single factor or item of information reviewed by the Board was identified as the principal factor in determining whether to approve the Management Agreement and the Sub-Advisory Agreement. Based upon its evaluation of all material factors, including those described below, the Board concluded that the terms of each Agreement are reasonable and fair and that it was in the best interest of the Fund and its shareholders to approve continuance of the Agreements.
The Board received and considered information regarding the nature, extent and quality of services provided to the Fund by the Manager and the Adviser, under the Management and Sub-Advisory Agreements, respectively. The Trustees also considered the Manager’s supervisory activities over the Adviser. In addition, the Independent Trustees received and considered other information regarding the administrative and other services rendered to the Fund and its shareholders by the Manager and its affiliates. The Board noted information received at regular meetings throughout the year related to the services rendered by the Manager in its management of the Fund’s affairs and the Manager’s role in coordinating the activities of the Adviser and the Fund’s other service providers. The Board’s evaluation of the services provided by the Manager and the Adviser took into account the Board’s knowledge and familiarity gained as Board members of funds in the Legg Mason fund complex, including the scope and quality of the investment management and other capabilities of the Manager and the Adviser and the quality of the Manager’s administrative and other services. The Board observed that the scope of services provided by the Manager had expanded over time as a result of regulatory and other developments, including maintaining and monitoring its own and the Fund’s expanded compliance programs.
The Board reviewed the qualifications, backgrounds and responsibilities of the Fund’s senior personnel and the portfolio management team primarily responsible for the day-to-day portfolio management of the Fund. The Board also considered, based on its knowledge of the Manager and the Manager’s affiliates, the financial resources available through the Manager’s parent organization, Legg Mason, Inc.
The Board considered the division of responsibilities between the Manager and the Adviser and the oversight provided by the Manager. The Board also considered information provided regarding the Adviser’s brokerage policies and practices.
The Board received and reviewed performance information for the Fund and for a group of funds (the “Performance Universe”) selected by Lipper, Inc. (“Lipper”), an independent provider of investment company data. The Board was provided with a description of the methodology Lipper used to determine the similarity of the Fund with the funds included in the Performance Universe. The Lipper data also included a comparison of the Fund’s performance to a benchmark index selected by Lipper. The Board also received from the contract review consultant analysis of the risk adjusted performance of the Fund compared with its
| | |
| Legg Mason Investment Counsel Maryland Tax-Free Income Trust | | 29 |
corresponding Lipper benchmark index. The Board also reviewed performance information for the Fund showing rolling returns based upon trailing performance. In addition, the Trustees noted that they also had received and discussed at periodic intervals information comparing the Fund’s performance to that of its benchmark index.
The Board noted the outstanding performance history of the Fund, which as of June 30, 2009 placed the Fund in the first quartile for each of the 1, 3, 5 and 10 year periods.
The Board concluded that, overall, it was satisfied with the nature, extent and quality of services provided (and expected to be provided) under the respective Agreement by the Manager and the Adviser.
The Board reviewed and considered, the contractual management fee (the “Contractual Management Fee”) payable by the Fund to the Manager in light of the nature, extent and quality of the management and advisory services provided by the Manager and the Adviser, respectively. The Board noted that the Manager, and not the Fund, pays the fee to the Adviser and, accordingly, that the retention of the Adviser does not increase the fees and expenses incurred by the Fund. In addition, the Board reviewed and considered the actual management fee rate (after taking into account fee waivers and expense reimbursements by the Manager which partially reduced the management fee paid to the Manager) (“Actual Management Fee”).
The Board also reviewed information regarding the fees the Manager and the Adviser charged any of their U.S. clients investing primarily in an asset class similar to that of the Fund including, where applicable, separate accounts. The Manager reviewed with the Board the significant differences in the scope of services provided to the Fund and to such other clients, and the Board considered that the Manager coordinates and oversees the provision of services to the Fund by other fund service providers, including the Adviser. The Board considered the fee comparisons in light of the scope of services required to manage these different types of accounts.
The Board received an analysis of complex-wide management fees provided by the Manager, which, among other things, set out the range of fees based on asset classes. In addition, the Manager provided and discussed with the Board a comparison with the fees of other registered investment companies managed by affiliated advisers in the same investment style. Management also discussed with the Board the Fund’s distribution arrangements, including how amounts received by the Fund’s distributors are expended.
Additionally, the Board received and considered information comparing the Fund’s Contractual Management Fee and Actual Management Fee and the Fund’s overall expense ratio with those of a group of funds selected by Lipper as comparable to the Fund and a broader universe of funds also selected by Lipper. With respect to the Fund, the Board noted that Contractual and Actual Management Fees were competitive (third quintile or better) and that actual expenses were lower than the Lipper expense group and expense universe averages.
The Board was provided an overview of the process followed in conducting the profitability study and received a report on the profitability of Legg Mason in providing services to the Fund, based on financial information and business data for the 12 months ended March 31, 2009, which corresponds to Legg Mason’s most recently completed fiscal year. The Trustees considered the profitability study along with the other materials previously provided to the Board and determined that the profitability was not excessive in light of the nature, extent and quality of the services provided to the Fund.
The Board received and considered information regarding whether there have been economies of scale with respect to the management of the Fund as the Fund’s assets grow, whether the Fund has appropriately benefited from any economies of scale, and whether there is potential for realization of any further economies of scale. The Board noted that as a result of market conditions and net redemptions, the Fund complex had suffered a substantial decline in assets over its historic highs. Given the asset size of the Fund and the complex, the Board concluded that any economies of scale currently being realized were appropriately being reflected in the Management Fee paid by the Fund.
| | |
| 30 | | Legg Mason Investment Counsel Maryland Tax-Free Income Trust |
Board approval of management and subadvisory agreements (unaudited) (cont’d)
The Board considered other benefits received by the Manager and its affiliates, as a result of the Manager’s relationship with the Fund, including the opportunity to offer additional products and services to Fund shareholders. The Board also considered the information provided by the Manager regarding intermediary arrangements.
In light of the structure of the fees, the costs of providing investment management and other services to the Fund, the Manager’s ongoing commitment to the Fund and the ancillary benefits received, the Board concluded that the Management Fees were reasonable.
After evaluation of all material factors, the Board concluded that the continuation of each Agreement is in the best interest of the Fund.
| | |
| Legg Mason Investment Counsel Maryland Tax-Free Income Trust | | 31 |
Additional information (unaudited)
Information about Trustees and Officers
The table below provides information about each of the Trust’s trustees and officers, including biographical information about their business experience and information about their relationships with Legg Mason, Inc. and its affiliates. The mailing address of each trustee and officer is 100 International Drive, Attn: Fund Secretary, Baltimore, Maryland 21202.
| | |
| Independent Trustees1 |
|
| Hearn, Ruby P. |
| |
| Year of birth | | 1940 |
| Position with Trust | | Trustee |
| Term of office and length of time servedA | | Since 2004 |
| Principal occupation(s) during past five years | | Senior Vice President Emerita of The Robert Wood Johnson Foundation (non-profit) since 2001; Trustee of the New York Academy of Medicine since 2004; Director of the Institute for Healthcare Improvement since 2002; Member of the Institute of Medicine since 1982; formerly: Senior Vice President of The Robert Wood Johnson Foundation (1996 to 2001); Fellow of The Yale Corporation (1992 to 1998). |
| Number of funds in fund complex overseen by Trustee | | 14 |
| Other directorships held by Trustee | | None |
|
| Lehman, Arnold L. |
| |
| Year of birth | | 1944 |
| Position with Trust | | Lead Independent Trustee |
| Term of office and length of time served2 | | Since 1990 |
| Principal occupation(s) during past five years | | Director of the Brooklyn Museum since 1997; Trustee of American Federation of Arts since 1998. Formerly: Director of The Baltimore Museum of Art (1979-1997). |
| Number of funds in fund complex overseen by Trustee | | 14 |
| Other directorships held by Trustee | | None |
|
| Masters, Robin J.W. |
| |
| Year of birth | | 1955 |
| Position with Trust | | Trustee |
| Term of office and length of time served2 | | Since 2002 |
| Principal occupation(s) during past five years | | Retired; formerly: Chief Investment Officer of ACE Limited (insurance) (1986 to 2000). |
| Number of funds in fund complex overseen by Trustee | | 14 |
| Other directorships held by Trustee | | Director of Cheyne Capital International Limited (investment advisory firm). Director/Trustee of Legg Mason Institutional Funds plc, WA Fixed Income Funds plc and Western Asset Debt Securities Fund plc. |
|
McGovern, Jill E.
|
| |
| Year of birth | | 1944 |
| Position with Trust | | Trustee |
| Term of office and length of time served2 | | Since 1990 |
| Principal occupation(s) during past five years | | Senior Consultant, American Institute for Contemporary German Studies (AICGS) since 2007; formerly: Chief Executive Officer of The Marrow Foundation (non-profit) (1993 to 2007); Executive Director of the Baltimore International Festival (1991 to 1993); Senior Assistant to the President of The Johns Hopkins University (1986 to 1990). |
| Number of funds in fund complex overseen by Trustee | | 14 |
| Other directorships held by Trust | | Director of International Biomedical Research Alliance; Director of Lois Roth Endowment |
| | |
| 32 | | Legg Mason Investment Counsel Maryland Tax-Free Income Trust 2010 Annual Report |
Additional information (unaudited) (cont’d)
Information about Trustees and Officers
| | |
| Independent Trustees1 cont’d |
|
| Mehlman, Arthur S. |
| |
| Year of birth | | 1942 |
| Position with Trust | | Trustee |
| Term of office and length of time served2 | | Since 2002 |
| Principal occupation(s) during past five years | | Retired. Director, The University of Maryland Foundation since 1992; Director, The League for People with Disabilities since 2003; formerly: Partner, KPMG LLP (international accounting firm) (1972 to 2002). |
| Number of funds in fund complex overseen by Trustee | | Director/Trustee of all Legg Mason Funds consisting of 14 portfolios; Director/Trustee of the Royce Family of Funds consisting of 30 portfolios. |
| Other directorships held by Trustee | | Director of Municipal Mortgage & Equity, LLC. |
|
| O’Brien, G. Peter |
| |
| Year of birth | | 1945 |
| Position with Trust | | Trustee |
| Term of office and length of time served2 | | Since 1999 |
| Principal occupation(s) during past five years | | Retired. Trustee Emeritus of Colgate University; Board Member, Hill House, Inc. (residential home care); Board Member, Bridges School (pre- school); formerly: Managing Director, Equity Capital Markets Group of Merrill Lynch & Co. (1971-1999). |
| Number of funds in fund complex overseen by Trustee | | Director/Trustee of all Legg Mason funds consisting of 14 portfolios; Director/Trustee of the Royce Family of Funds consisting of 30 portfolios. |
| Other directorships held by Trustee | | Director of Technology Investment Capital Corp. |
|
| Rowan, S. Ford |
| |
| Year of birth | | 1943 |
| Position with Trust | | Trustee |
| Term of office and length of time served2 | | Since 2002 |
| Principal occupation(s) during past five years | | Chairman, National Center for Critical Incident Analysis, National Defense University Foundation, since 2004; Trustee, St. John’s College, since 2006; formerly: Consultant, Rowan & Blewitt Inc. (management consulting) (1984 to 2007); Lecturer in Journalism, Northwestern University (1980 to 1993); Lecturer in Organizational Sciences, George Washington University (2000 to 2008); Director, Sante Fe Institute (1999 to 2008). |
| Number of funds in fund complex overseen by Trustee | | 14 |
| Other directorships held by Trustee | | None |
|
| Tarola, Robert M. |
| |
| Year of birth | | 1950 |
| Position with Trust | | Trustee |
| Term of office and length of time served2 | | Since 2004 |
| Principal occupation(s) during past five years | | President of Right Advisory LLC (corporate finance and governance consulting) since 2008; Member, Investor Advisory Group of the Public Company Accounting Oversight Board since 2009; Executive Vice President and Chief Financial Officer of The Howard University since 2010 (higher education and health care); formerly: Senior Vice President and Chief Financial Officer of W.R. Grace & Co. (specialty chemicals) (1999 to 2008) and MedStar Health, Inc. (healthcare) (1996 to 1999); Partner, Price Waterhouse, LLP (accounting and auditing) (1984 to 1996). |
| Number of funds in fund complex overseen by Trustee | | 14 |
| Other directorships held by Trustee | | Director of TeleTech Holdings, Inc. (business process outsourcing); Director of American Kidney Fund (renal disease assistance) |
| | |
| Legg Mason Investment Counsel Maryland Tax-Free Income Trust | | 33 |
| | |
| Interested Trustees3 |
|
| Fetting, Mark R. |
| |
| Year of birth | | 1954 |
| Position with Trust | | Chairman and Trustee |
| Term of office and length of time served2 | | Trustee since 2002 and Chairman since 2008 |
| Principal occupation(s) during past five years | | President, CEO, Chairman and Director of Legg Mason, Inc. and Chairman of Legg Mason Funds since 2008; formerly: President of all Legg Mason Funds (2001-2008). Senior Executive Vice President of Legg Mason, Inc., Director and/or officer of various Legg Mason, Inc. affiliates (2000-2008). Division President and Senior Officer of Prudential Financial Group, Inc. and related companies, including fund boards and consulting services to subsidiary companies (1991-2000) |
| Number of funds in fund complex overseen by Trustee | | Chairman and Director/Trustee of all Legg Mason Funds consisting of 14 portfolios; Director/Trustee of the Royce Family of Funds consisting of 30 portfolios. |
| Other directorships held by Trustee | | None |
|
| Odenath, David R. |
| |
| Year of birth | | 1957 |
| Position with Trust | | President and Trustee |
| Term of office and length of time served2 | | Since 2008 |
| Principal occupation(s) during past five years | | Senior Executive Vice President of Legg Mason, Inc. and President of Legg Mason Funds since 2008; formerly: President of Prudential Annuities (2002 to 2008); Executive Vice President (2003 to 2008) of American Skandia Investment Services, Inc; Chief Executive Officer and Director (2003 to 2008) of American Skandia Life Assurance Corporation, American Skandia Information Services and Technology Corporation and Skandia U.S. Inc.; President, Chief Executive Officer and Director (2003 to 2008) of American Skandia Marketing, Inc.; President, Chief Executive Officer, Chief Operating Officer and Officer-In-Charge (1999 to 2003) of Prudential Investments; Senior Vice President (1999 to 2008) of Prudential Financial, Inc.; Senior Vice President (1993 to 1999) of PaineWebber Group, Inc. (investment banking). |
| Number of funds in fund complex overseen by Trustees | | 14 |
| Other directorships held by Trustee | | None |
| | |
| 34 | | Legg Mason Investment Counsel Maryland Tax-Free Income Trust 2010 Annual Report |
Additional information (unaudited) (cont’d)
Information about Trustees and Officers
| | |
| Executive Officers |
| |
| R. Jay Gerken, CFA3 | | |
| |
| Year of birth | | 1951 |
| Position(s) with Trust | | Vice President |
| Term of office1 and length of time served2 | | Since 2009 |
| Principal occupation(s) during past five years | | Managing Director of Legg Mason & Co., LLC, Chairman, President and Chief Executive Officer of certain mutual funds associated with LMPFA or its affiliates; Chairman, President and Chief Executive Officer of LMPFA (since 2006); President and CEO of Smith Barney Fund Management LLC and Chairman, President and CEO of Citi Fund Management Inc. (since 2002); formerly: Chairman, President and Chief Executive Officer of Travelers Investment Adviser, Inc. (2002 to 2005). |
| |
Kaprel Ozsolak Legg Mason 55 Water Street, New York, NY 10041 | | |
| |
| Year of birth | | 1965 |
| Position(s) with Trust | | Treasurer and Chief Financial Officer |
| Term of office1 and length of time served2 | | Since 2009 |
| Principal occupation(s) during past five years | | Director of Legg Mason & Co. (since 2005); Chief Financial Officer and Treasurer of certain mutual funds associated with Legg Mason & Co. (since 2005); formerly: Vice President at CAM (1996 to 2005); Chief Financial Officer and Treasurer of certain mutual funds associated with CAM (2004 to 2005); Controller of certain mutual funds associated with CAM (2002 to 2004). |
| |
Robert I. Frenkel
Legg Mason
100 First Stamford Place, Stamford, CT 06902 | | |
| |
| Year of birth | | 1954 |
| Position(s) with Trust | | Secretary and Chief Legal Officer |
| Term of office1 and length of time served2 | | Since 2009 |
| Principal occupation(s) during past five years | | Managing Director and General Counsel of Global Mutual Funds for Legg Mason & Co. (since 2005); Secretary and Chief Legal Officer of certain mutual funds associated with Legg Mason & Co. (since 2003); formerly: Managing Director and General Counsel of Global Mutual Funds for CAM (2000 to 2005); Secretary of CFM (2001 to 2004). |
| |
Ted P. Becker
Legg Mason
620 Eighth Avenue, New York, NY 10018 | | |
| |
| Year of birth | | 1951 |
| Position(s) with Trust | | Vice President and Chief Compliance Officer |
| Term of office1 and length of time served2 | | Since 2007 |
| Principal occupation(s) during past five years | | Director of Global Compliance at Legg Mason, Inc. (since 2006); Managing Director of Compliance at Legg Mason & Co. (since 2005); Chief Compliance Officer with certain mutual funds associated with Legg Mason Partners Fund Advisor, LLC (“LMPFA”) (since 2006); Chief Compliance Officer of LMPFA and certain affiliates; Managing Director of Compliance at Citigroup Asset Management (“CAM”) (2002 to 2005). Prior to 2002, Managing Director-Internal Audit & Risk Review at Citigroup Inc. |
| | |
| Legg Mason Investment Counsel Maryland Tax-Free Income Trust | | 35 |
ADDITIONAL INFORMATION ABOUT THE TRUST’S TRUSTEES AND OFFICERS IS CONTAINED IN THE STATEMENT OF ADDITIONAL INFORMATION, AVAILABLE WITHOUT CHARGE UPON REQUEST BY CALLING FUNDS INVESTOR SERVICES AT 1-800-822-5544 OR INSTITUTIONAL SHAREHOLDER SERVICES AT 1-888-425-6432 OR ON THE SECURITIES AND EXCHANGE COMMISSION WEBSITE (http://www.sec.gov).
| 1 | Each of the Independent Trustees serves on the standing committees of the Board of Trustees, which include the Audit Committee (chair: Arthur Mehlman), the Nominating Committee (co-chairs: Peter O’Brien and Jill McGovern), and the Independent Trustees Committee (chair: Arnold Lehman). |
| 2 | Officers of the Trust are elected to serve until their successors are elected and qualified. Trustees of the Trust serve a term of indefinite length until their retirement, in accordance with the Board’s retirement policy, resignation or removal, and stand for re-election by shareholders only as and when required by the 1940 Act. |
| 3 | Mr. Fetting and Mr. Odenath are considered to be interested persons, as defined in the 1940 Act, of the Trust on the basis of their current employment with the Fund’s investment adviser or its affiliated entities (including the Trust’s principal underwriter) and Legg Mason, Inc., the parent holding company of these entities as well as their ownership of Legg Mason, Inc. stock. |
| | |
| 36 | | Legg Mason Investment Counsel Maryland Tax-Free Income Trust |
Important tax information (unaudited)
98.82% and 98.83% of the net investment income distributions paid monthly by the Fund from April 2009 through December 2009 and from January 2010 through March 2010, respectively, qualify as a tax-exempt interest dividends for Federal income tax purposes.
The following information is applicable to non-U.S. resident shareholders.
All of the ordinary income distributions paid monthly by the Fund represent Qualified Net Interest Income and Qualified Short-Term Gain eligible for exemption from U.S. withholding tax for nonresident aliens and foreign corporations.
Please retain this information for your records.
Legg Mason Investment Counsel
Maryland Tax-Free Income Trust
Board of trustees
Mark R. Fetting Chairman
David R. Odenath President
Dr. Ruby P. Hearn
Arnold L. Lehman
Robin J.W. Masters
Dr. Jill E. McGovern
Arthur S. Mehlman
G. Peter O’Brien
S. Ford Rowan
Robert M. Tarola
Investment manager
Legg Mason Partners Fund Advisor, LLC
New York, NY
Investment sub-adviser
Legg Mason Investment Counsel, LLC
Baltimore, MD
Custodian
State Street Bank & Trust Company
Transfer and shareholder servicing agent
Boston Financial Data Services, Inc.
2000 Crown Colony Drive Quincy, Massachusetts 02169
Counsel
K&L Gates LLP
Washington, DC
Independent registered public accounting firm
PricewaterhouseCoopers LLP
Baltimore, MD
Legg Mason Investment Counsel Maryland Tax-Free Income Trust
Legg Mason Investment Counsel Maryland Tax-Free Income Trust
Legg Mason Funds
55 Water Street
New York, New York 10041
The Fund files its complete schedule of portfolio holdings with the Securities and Exchange Commission (“SEC”) for the first and third quarters of each fiscal year on Form N-Q. The Fund’s Forms N-Q are available on the SEC’s website at www.sec.gov. The Fund’s Forms N-Q may be reviewed and copied at the SEC’s Public Reference Room in Washington, D.C., and information on the operation of the Public Reference Room may be obtained by calling 1-800-SEC-0330. To obtain information on Form N-Q from the Fund, shareholders can call Funds Investor Services at 1-800-822-5544 or Institutional Shareholder Services at 1-888-425-6432.
Information on how the Fund voted proxies relating to portfolio securities during the prior 12-month period ended June 30th of each year and a description of the policies and procedures that the Fund uses to determine how to vote proxies related to portfolio transactions are available (1) without charge, upon request, by calling Funds Investor Services at 1-800-822-5544 or Institutional Shareholder Services at 1-888-425-6432, (2) on the Fund’s website at www.leggmason.com/individualinvestors and (3) on the SEC’s website at www.sec.gov.
This report is submitted for the general information of the shareholders of Legg Mason Investment Counsel Maryland Tax-Free Income Trust. This report is not authorized for distribution to prospective investors in the Fund unless preceded or accompanied by a current prospectus.
Investors should consider the Fund’s investment objectives, risks, charges and expenses carefully before investing. The prospectus contains this and other important information about the Fund. Please read the prospectus carefully before investing.
www.leggmason.com/individualinvestors
© 2010 Legg Mason Investor Services, LLC
Member FINRA, SIPC
Privacy policy
We are committed to keeping nonpublic personal information about you secure and confidential. This notice is intended to help you understand how we fulfill this commitment. From time to time, we may collect a variety of personal information about you, including:
| | Ÿ | | Information we receive from you on applications and forms, via the telephone, and through our websites; |
| | Ÿ | | Information about your transactions with us, our affiliates, or others (such as your purchases, sales, or account balances); and |
| | Ÿ | | Information we receive from consumer reporting agencies. |
We do not disclose nonpublic personal information about our customers or former customers, except to our affiliates (such as broker-dealers or investment advisers within the Legg Mason family of companies) or as is otherwise permitted by applicable law or regulation. For example, we may share this information with others in order to process your transactions or service an account. We may also provide this information to companies that perform marketing services on our behalf, such as printing and mailing, or to other financial institutions with whom we have joint marketing agreements. When we enter into such agreements, we will require these companies to protect the confidentiality of this information and to use it only to perform the services for which we hired them.
With respect to our internal security procedures, we maintain physical, electronic, and procedural safeguards to protect your nonpublic personal information, and we restrict access to this information.
If you decide at some point either to close your account(s) or become an inactive customer, we will continue to adhere to our privacy policies and practices with respect to your nonpublic personal information.
NOT PART OF THE ANNUAL REPORT
At Legg Mason, we’ve assembled a collection of experienced investment management firms and empowered each of them with the tools, the resources and, most importantly, the independence to pursue the strategies they know best.
| Ÿ | | Each was purposefully chosen for their commitment to investment excellence. |
| Ÿ | | Each is focused on specific investment styles and asset classes. |
| Ÿ | | Each exhibits thought leadership in their chosen area of focus. |
Together, we’ve built a powerful portfolio of solutions for financial advisors and their clients. And it has made us a world leader in money management.*
| * | Ranked eleventh-largest money manager in the world, according to Pensions & Investments, May 18, 2009, based on 12/31/08 worldwide assets under management. |
www.leggmason.com/individualinvestors
©2010 Legg Mason Investor Services, LLC Member FINRA, SIPC
LMF-030/A (5/10) SR10-1092
NOT PART OF THE ANNUAL REPORT
The Registrant has adopted a code of ethics that applies to the Registrant’s principal executive officer, principal financial officer, principal accounting officer or controller.
| ITEM 3. | AUDIT COMMITTEE FINANCIAL EXPERT. |
The Board of Trustees of the Registrant has determined that Arthur S. Mehlman and Robert M. Tarola possess the technical attributes identified in Instruction 2(b) of Item 3 to Form N-CSR to qualify as an “audit committee financial expert,” and has designated Mr. Mehlman and Mr. Tarola as the Audit Committee’s financial experts. Mr. Mehlman and Mr. Tarola are “independent” Trustees pursuant to paragraph (a)(2) of Item 3 to Form N-CSR.
| ITEM 4. | PRINCIPAL ACCOUNTANT FEES AND SERVICES. |
a) Audit Fees. The aggregate fees billed in the last two fiscal years ending March 31, 2009 and March 31, 2010 (the “Reporting Periods”) for professional services rendered by the Registrant’s principal accountant (the “Auditor”) for the audit of the Registrant’s annual financial statements, or services that are normally provided by the Auditor in connection with the statutory and regulatory filings or engagements for the Reporting Periods, were $33,770 in 2009 and $13,930 in 2010.
b) Audit-Related Fees. The aggregate fees billed in the Reporting Periods for assurance and related services by the Auditor that are reasonably related to the performance of the audit of the Registrant’s financial statements were $0 in 2009 and $4,000 in 2010. These services consisted of procedures performed in connection with the re-domiciliation of the various reviews of Prospectus supplements, and consent issuances related to the N-1A filings and calculations pursuant to Funds revolving credit for the Legg Mason Tax Free Income Fund.
In addition, there were no Audit-Related Fees billed in the Reporting Period for assurance and related services by the Auditor to the Registrant’s investment adviser (not including any sub-adviser whose role is primarily portfolio management and is subcontracted with or overseen by another investment adviser), and any entity controlling, controlled by or under common control with the investment adviser that provides ongoing services to the Registrant (“service affiliates”), that were reasonably related to the performance of the annual audit of the service affiliates. Accordingly, there were no such fees that required pre-approval by the Audit Committee for the Reporting Periods.
(c) Tax Fees. The aggregate fees billed in the Reporting Periods for professional services rendered by the Auditor for tax compliance, tax advice and tax planning (“Tax Services”) were $2,400 in 2009 and $386 in 2010. These services consisted of (i) review or preparation of U.S. federal, state, local and excise tax returns; (ii) U.S. federal, state and local tax planning, advice and assistance regarding statutory, regulatory or administrative developments, and (iii) tax advice regarding tax qualification matters and/or treatment of various financial instruments held or proposed to be acquired or held.
There were no fees billed for tax services by the Auditors to service affiliates during the Reporting Periods that required pre-approval by the Audit Committee.
d) All Other Fees. There were no other fees billed in the Reporting Periods for products and services provided by the Auditor, other than the services reported in paragraphs (a) and (c) of this Item 4 for the Registrant.
There were no other non-audit services rendered by the Auditor to Legg Mason Partners Fund Advisors, LLC (“LMPFA”), and any entity controlling, controlled by or under common control with LMPFA that provided ongoing services to the Registrant requiring pre-approval by the Audit Committee in the Reporting Period.
(e) Audit Committee’s pre–approval policies and procedures described in paragraph (c)(7) of Rule 2-01 of Regulation S-X.
(1) The Charter for the Audit Committee (the “Committee”) of the Board of each Legg Mason Fund (each a “Fund”) states that the Committee has the duty and power (a) to pre-approve the engagement of each Fund’s independent auditors to perform any permissible non-audit services for that Fund and, as the Committee deems appropriate, to establish and oversee policies and procedures for the pre-approval of such services to a Fund and (b) to pre-approve the engagement of each Fund’s independent auditors to perform any permissible non-audit services for the Fund’s investment adviser(s) and any entity controlling, controlled by or under common control with the investment adviser(s) if the engagement relates directly to the operations and financial reporting of the Fund, and, as the Committee deems appropriate, to establish and oversee policies and procedures for the pre-approval of such services.
The Audit Committee’s policy is to delegate to its chairperson the authority to pre-approve items prior to the next meeting of the Committee. Such pre-approvals are reported at the next quarterly meeting of the Audit Committee.
(2) For the Registrant, the percentage of fees that were pre-approved by the Audit Committee, with respect to: Audit-Related Fees were 100% and 100% for 2009 and 2010; Tax Fees were 100% and 100% for 2009 and 2010; and Other Fees were 100% and 100% for 2009 and 2010.
There were no services provided to the Registrant that were approved by the Audit Committee pursuant to paragraph (c)(7)(i)(C) of Rule 2-01 of Regulation S-X. There were no fees billed to the Registrant for services where pre-approval of the Audit Committee was necessary pursuant to paragraph (c)(7)(i)(C) of Rule 2-01 of Regulation S-X.
(f) Not Applicable.
(g) Non-audit fees billed by the Auditor for services rendered to the Registrant, LMPFA and any entity controlling, controlled by, or under common control with LMPFA that provides ongoing services to the Registrant during the reporting period were $0 in 2010.
(h) Yes. The Registrant’s Audit Committee has considered whether the provision of non-audit services that were rendered to Service Affiliates, which were not pre-approved (not requiring pre-approval), is compatible with maintaining the Auditor’s independence. All services provided by the Auditor to the Registrant or to Service Affiliates, which were required to be pre-approved, were pre-approved as required.
| ITEM 5. | AUDIT COMMITTEE OF LISTED REGISTRANTS. |
The Registrant is not a listed issuer as defined in Rule 10A-3 under the Securities Exchange Act of 1934.
| ITEM 6. | SCHEDULE OF INVESTMENTS. |
Included herein under Item 1.
| ITEM 7. | DISCLOSURE OF PROXY VOTING POLICIES AND PROCEDURES FOR CLOSED-END MANAGEMENT INVESTMENT COMPANIES. |
Not applicable.
| ITEM 8. | PORTFOLIO MANAGERS OF CLOSED-END MANAGEMENT INVESTMENT COMPANIES. |
Not applicable.
| ITEM 9. | PURCHASES OF EQUITY SECURITIES BY CLOSED-END MANAGEMENT INVESTMENT COMPANY AND AFFILIATED PURCHASERS. |
Not applicable.
| ITEM 10. | SUBMISSION OF MATTERS TO A VOTE OF SECURITY HOLDERS. |
The Nominating Committee will accept recommendations for nominations from shareholders. Shareholders may forward recommendations to the Fund Assistant Secretary at 100 International Drive, 7th Floor, Baltimore, Maryland 21202, Attn.: Fund Assistant Secretary.
| ITEM 11. | CONTROLS AND PROCEDURES. |
| | (a) | The Registrant’s principal executive officer and principal financial officer have concluded that the Registrant’s disclosure controls and procedures (as defined in Rule 30a- 3(c) under the Investment Company Act of 1940, as amended (the “1940 Act”)) are effective as of a date within 90 days of the filing date of this report that includes the disclosure required by this paragraph, based on their evaluation of the disclosure controls and procedures required by Rule 30a-3(b) under the 1940 Act and 15d-15(b) under the Securities Exchange Act of 1934. |
| | (b) | There were no changes in the Registrant’s internal control over financial reporting (as defined in Rule 30a-3(d) under the 1940 Act) that occurred during the Registrant’s last fiscal half-year (the Registrant’s second fiscal half-year in the case of an annual report) that have materially affected, or are likely to materially affect the Registrant’s internal control over financial reporting. |
(a) (1) Code of Ethics attached hereto.
Exhibit 99.CODE ETH
(a) (2) Certifications pursuant to section 302 of the Sarbanes-Oxley Act of 2002 attached hereto.
Exhibit 99.CERT
(b) Certifications pursuant to Section 906 of the Sarbanes-Oxley Act of 2002 attached hereto.
Exhibit 99.906CERT
SIGNATURES
Pursuant to the requirements of the Securities Exchange Act of 1934 and the Investment Company Act of 1940, the Registrant has duly caused this Report to be signed on its behalf by the undersigned, there unto duly authorized.
| | |
| Legg Mason Tax-Free Income Fund |
| |
| By: | | /S/ DAVID R. ODENATH |
| | (David R. Odenath) |
| | President and Trustee of Legg Mason Tax-Free Income Fund |
|
| Date: June 2, 2010 |
Pursuant to the requirements of the Securities Exchange Act of 1934 and the Investment Company Act of 1940, this report has been signed below by the following persons on behalf of the Registrant and in the capacities and on the dates indicated.
| | |
| By: | | /S/ DAVID R. ODENATH |
| | (David R. Odenath) |
| | President and Trustee of Legg Mason Tax-Free Income Fund |
|
| Date: June 2, 2010 |
| |
| By: | | /S/ KAPREL OZSOLAK |
| | (Kaprel Ozsolak) |
| | Chief Financial Officer of Legg Mason Tax-Free Income Fund |
|
| Date: June 2, 2010 |