UNITED STATES
SECURITIES AND EXCHANGE COMMISSION
Washington, D.C. 20549
FORM N-CSR
CERTIFIED SHAREHOLDER REPORT OF REGISTERED
MANAGEMENT INVESTMENT COMPANIES
Investment Company Act file number 811-06223
Legg Mason Tax Free Income Fund
(Exact name of Registrant as specified in charter)
55 Water Street, New York, NY 10041
(Address of principal executive offices) (Zip code)
Robert I. Frenkel, Esq.
Legg Mason & Co., LLC
100 First Stamford Place
Stamford, CT 06902
(Name and address of agent for service)
Registrant’s telephone number, including area code: 1-877-721-1926
Date of fiscal year end: March 31
Date of reporting period: March 31, 2012
| ITEM 1. | REPORT TO STOCKHOLDERS. |
The Annual Report to Stockholders is filed herewith.
March 31, 2012

Annual
Repor t
Legg Mason
Investment Counsel
Maryland Tax-Free
Income Trust
INVESTMENT PRODUCTS: NOT FDIC INSURED • NO BANK GUARANTEE • MAY LOSE VALUE
| | |
| II | | Legg Mason Investment Counsel Maryland Tax-Free Income Trust |
Fund objective
The Fund seeks a high level of current income exempt from federal and Maryland state and local income taxes*, consistent with prudent investment risk and preservation of capital.
| * | Certain investors may be subject to the federal alternative minimum tax (“AMT”), and state and local taxes may apply. Capital gains, if any, are fully taxable. Please consult your personal tax or legal adviser. |
Letter to our shareholders
Dear Shareholder,
We are pleased to provide the annual report of Legg Mason Investment Counsel Maryland Tax-Free Income Trust for the twelve-month reporting period ended March 31, 2012. Please read on for a detailed look at prevailing economic and market conditions during the Fund’s reporting period and to learn how those conditions have affected Fund performance.
As always, we remain committed to providing you with excellent service and a full spectrum of investment choices. We also remain committed to supplementing the support you receive from your financial advisor. One way we accomplish this is through our website, www.leggmason.com/individualinvestors. Here you can gain immediate access to market and investment information, including:
| Ÿ | | Fund prices and performance, |
| Ÿ | | Market insights and commentaries from our portfolio managers, and |
| Ÿ | | A host of educational resources. |
We look forward to helping you meet your financial goals.
Sincerely,
| | |
 | |  |
| Mark R. Fetting | | R. Jay Gerken, CFA |
| Chairman | | President |
April 27, 2012
| | | | |
| Legg Mason Investment Counsel Maryland Tax-Free Income Trust | | | III | |
Investment commentary
Economic review
The U.S. economy continued to grow over the twelve months ended March 31, 2012, albeit at an uneven pace. U.S. gross domestic product (“GDP”)i growth, as reported by the U.S. Department of Commerce, was 1.3% and 1.8% in the second and third quarters of 2011, respectively. The economy then gathered further momentum late in 2011, as the Commerce Department reported that fourth quarter GDP growth was 3.0% — the fastest pace since the second quarter of 2010. However, economic growth in the U.S. then moderated somewhat, as the Commerce Department’s initial estimate for first quarter 2012 GDP growth was 2.2%.
Two factors constraining economic growth were the weak job market and continued troubles in the housing market. While there was some improvement during the second half of the reporting period, unemployment remained elevated. When the reporting period began, unemployment, as reported by the U.S. Department of Labor, was 8.9%. Unemployment then rose to 9.0% in April and stayed at or above 9.0% over the next five months before declining to 8.9% in October. Unemployment then declined during four out of the next five months and was 8.2% in March 2012, the lowest rate since February 2009. The housing market showed some positive signs, although it still appears to be searching for a bottom. According to the National Association of Realtors (“NAR”), existing-home sales fluctuated throughout the period. However, the inventory of unsold homes moved lower versus the previous month in March 2012 and home prices increased. The NAR reported that the median existing-home price for all housing types was $163,800 in March 2012, up 2.5% from March 2011.
The manufacturing sector overcame a soft patch in the summer of 2011 and expanded at a stronger pace during much of the remainder of the reporting period. Looking back, based on the Institute for Supply Management’s PMI (“PMI”)ii, in February 2011, the manufacturing sector expanded at its fastest pace since May 2004, with a reading of 61.4 (a reading below 50 indicates a contraction, whereas a reading above 50 indicates an expansion). The PMI then generally moderated over the next several months and was 50.6 in August 2011, its lowest reading in two years. The manufacturing sector gathered momentum and ended January 2012 at 54.1, its highest reading since June 2011. After dipping to 52.4 in February, the PMI rose to 53.4 in March. In addition, fifteen of the eighteen industries tracked by the Institute for Supply Management expanded in March. In contrast, only nine and eleven industries expanded in January and February 2012, respectively.
The Federal Reserve Board (“Fed”)iii took a number of actions as it sought to meet its dual mandate of fostering maximum employment and price stability. As has been the case since December 2008, the Fed kept the federal funds rateiv at a historically low range between zero and 0.25%. In August 2011, the Fed declared its intention to keep the federal funds rate steady until mid-2013. Then, in September 2011, the Fed announced its intention to purchase $400 billion of longer-term Treasury securities and to sell an equal amount of shorter-term Treasury securities by June 2012 (often referred to as “Operation Twist”). In January 2012, the Fed extended the period it expects to keep rates on hold, saying “economic conditions — including low rates of resource utilization and a subdued outlook for inflation over the medium run — are likely to warrant exceptionally low levels for the federal funds rate at least through late 2014.” The Fed repeated this point at its meeting in April (after the reporting period ended), saying “To support a stronger economic recovery and to help ensure that inflation, over time, is at the rate most consistent with its dual
| | |
| IV | | Legg Mason Investment Counsel Maryland Tax-Free Income Trust |
Investment commentary (cont’d)
mandate, the Committee expects to maintain a highly accommodative stance for monetary policy.”
As always, thank you for your confidence in our stewardship of your assets.
Sincerely,

R. Jay Gerken, CFA
President
April 27, 2012
All investments are subject to risk including the possible loss of principal. Past performance is no guarantee of future results.
| i | Gross domestic product (“GDP”) is the market value of all final goods and services produced within a country in a given period of time. |
| ii | The Institute for Supply Management’s PMI is based on a survey of purchasing executives who buy the raw materials for manufacturing at more than 350 companies. It offers an early reading on the health of the manufacturing sector. |
| iii | The Federal Reserve Board (“Fed”) is responsible for the formulation of policies designed to promote economic growth, full employment, stable prices and a sustainable pattern of international trade and payments. |
| iv | The federal funds rate is the rate charged by one depository institution on an overnight sale of immediately available funds (balances at the Federal Reserve) to another depository institution; the rate may vary from depository institution to depository institution and from day to day. |
| | | | |
| Legg Mason Investment Counsel Maryland Tax-Free Income Trust 2012 Annual Report | | | 1 | |
Fund overview
Q. What is the Fund’s investment strategy?
A. The Fund seeks a high level of current income exempt from federal and Maryland state and local income taxes, consistent with prudent investment risk and preservation of capital. The Fund invests primarily in debt instruments issued by or on behalf of the state of Maryland, its political subdivisions, municipalities, agencies, instrumentalities or public authorities, the interest on which, in the opinion of counsel to the issuers of those instruments, is exempt from federal and Maryland state and local income taxes. Securities considered for investment must be investment grade. The Fund may invest 25% or more of its total assets in a particular segment of the municipal securities market, such as hospital revenue bonds, housing agency bonds, private activity bonds or airport bonds, or in securities the interest on which is paid from revenues of a similar type of project. Under normal circumstances, the Fund invests at least 80% of its net assets in municipal obligations, the interest on which is exempt from Maryland state and local taxes, and is not considered a tax preference item for the purpose of the alternative minimum tax (“AMT”).
The Fund may invest in securities of any maturity. We anticipate that the dollar-weighted average maturity for the Fund will be in the long-intermediate to long-term range (generally from seven to twenty years) although, at times, depending on our market outlook, the average maturity may be somewhat longer or shorter than this. We establish a durationi target for the Fund based on our investment outlook. This outlook is determined by our analysis of the economy, fiscal and monetary policy and international events. Factors directly impacting the municipal market, such as supply, demand and legislative developments, are also incorporated into our outlook. We analyze each industry and issuer to determine its credit fundamentals and outlook. Issuers are scrutinized not only for their ability to make timely interest and principal payments, but for the stability of their financial position and ratings. The tax consequences of trading activity are always considered.
What were the overall market conditions during the Fund’s reporting period?
A. Despite another year of extreme volatility, tax-free bonds provided excellent returns over the past twelve months. New issue volume dropped considerably in 2011 versus the strong 2010 pace, falling 31.9% to $294 billion, the lightest year of issuance since 2000. Demand firmed throughout the period as concerns of deteriorating credit quality were diminished by additional cost cutting within the local government sector and an improving economy. Tax revenues continued to improve, stabilizing the municipal market after a difficult start to the year related to numerous predictions of a meltdown within the finances of local governments. By calendar year-end, yields resided near forty-five-year lows, with five-year AAA-rated tax-free bonds yielding 0.85%, and ten-year AAA-rated tax-free bonds yielding just 1.83%.
As 2012 began, the bullish trend of 2011 continued, and through mid-February tax-free yields continued to hover at the lowest levels in decades. However, investors pushed back during a period of relatively heavy volume late in the month. Yields surged upwards, with newly issued bonds trading 75 basis pointsii higher by mid-March in some cases. The brief bearish trend reversed yet again in the last two weeks of the quarter ended March 31, 2012. Municipal issuance dried up and treasury yields dropped heading into quarter-end as economic data became more mixed and Spain’s problems rekindled worries regarding Europe’s fiscal health. Despite the drop in yields late in the reporting period, five- and ten-year AAA-rated tax-free bond yields managed to move higher by
| | |
| 2 | | Legg Mason Investment Counsel Maryland Tax-Free Income Trust 2012 Annual Report |
Fund overview (cont’d)
the end of March versus the levels available at calendar year-end. However, compared to the beginning of the twelve-month reporting period, yields were significantly lower, and finished the Fund’s fiscal year at 0.98% and 2.11%, for five- and ten-year AAA-rated municipal bonds, respectively.
As a result of the significant drop in municipal bond yields, the annual performance of the Barclays Capital Municipal Bond Index iii, a proxy for the overall market, was an impressive 12.07% through the Fund’s fiscal year ended March 31, 2012. Over the reporting period, the broad market index benefitted from a large weighting to the longest maturity bonds, as nearly 60% of outstanding municipal bonds have maturities 15-years or longer. These bonds, which were in short supply for much of the year, drove the index as mutual fund outflows slowed and eventually reversed by year-end as investors sought yields higher than what was available on individual securities. Returns on shorter-maturity securities such as three- and five-year municipal bonds fared much worse, returning 3.44% and 6.90%, respectively, over the past twelve months.
Also, bonds rated in the lowest tier of investment grade (i.e. BBB-rated) performed exceptionally well, returning 17.61% for the twelve months ended March 31, 2012, buoying returns across the entire yield curve iv. Lower-rated securities benefitted from the improving economy. Tax revenues remained in an improving trend, albeit at a slower pace than the unsustainable double-digit levels of increase through mid-2011. The most recent data from the Rockefeller Institute showed a 2.7% increase in state and local government revenues from the year prior, covering the period through year-end. Stripping out Illinois (whose revenues surged 24% following an income tax increase) and California (whose revenues were down 8.9% due to a tax law change) leaves an aggregate increase among the remaining states of a solid 4.4%. Challenges related to a slowdown in federal spending, notwithstanding, growth in Maryland’s tax revenues outperformed the nation, rising 6.4% over the period. In addition to better revenues, states continued to make progress on their expenses as evidenced by the continued cuts in government payrolls and success in managing budget deficits which have exceeded $500 billion in aggregate since fiscal year 2009.
Challenges remain for local governments despite the strong momentum heading into 2012. After successfully closing over $100 billion in budget gaps in fiscal year 2012, states still face an estimated $40 billion shortfall for fiscal year 2013 according to the National Governors Association. Aggregate tax revenues remain approximately $20 billion below the high water mark prior to the credit crisis-induced recession, with most of the easy budget cuts already made. Specific to Maryland, as of this writing the Maryland General Assembly ended their legislative session without a passed budget for the first time since 1992. Disagreements regarding a package of tax increases aimed at reducing a $1 billion budget deficit in fiscal year 2013 will now require a special session to resolve, or mandatory spending cuts to schools and state programs will be required next year. Also, the United States Supreme Court’s ruling on the Patient Protection and Affordable Care Act holds tremendous ramifications for the states. As currently configured, Medicaid rolls are set to explode when the plan comes on-line. While the Federal Government will pick up the bulk of the tab for newly-eligible enrollees, the individual mandate will cause many who are currently eligible but not enrolled to sign up, boosting the states’ fastest growing expense.
Regardless of the United States Supreme Court’s decision, municipalities continued to make difficult and increasingly unpopular decisions regarding revenue
| | | | |
| Legg Mason Investment Counsel Maryland Tax-Free Income Trust 2012 Annual Report | | | 3 | |
enhancements (i.e. tax increases) and expense reductions (i.e. fewer services). While high profile credit disasters like Harrisburg, Pennsylvania, still garner attention, these instances are isolated and the widespread defaults predicted by certain members of the media did not occur over the past twelve months. In fact, as the economic recovery continued to move revenues and expenses closer to equilibrium, Fitch Ratings removed the state sector from negative credit watch in December, acknowledging the improvement in revenues and the success in closing persistent deficits since year-end 2007.
How did you respond to these changing market conditions?
A. Early in the reporting period we extended the average maturity of the Fund. Coming out of 2010 and early 2011 we had a large cash position to provide liquidity should redemptions arise from the negative publicity that pervaded the municipal market. As the predictions for credit turmoil failed to materialize, investment flows stabilized and eventually turned quite positive. We reduced the cash position accordingly and started putting money to work in what turned out to be an attractive interest rate environment.
Our purchases were focused on the single-A part of the credit curve, which remained attractive following the widening of spreads in the aftermath of the credit crisis. As municipal yields collapsed to near record lows late in the calendar year and early 2012, we took the opportunity of a strong bid side to reduce the duration of the Fund. In doing so we likewise reduced the Fund’s already modest AMT exposure further, to 4.43% by the end of the Fund’s reporting period ended March 31, 2012.
Performance review
For the twelve months ended March 31, 2012, Class A shares of Legg Mason Investment Counsel Maryland Tax-Free Income Trust, excluding sales charges, returned 11.63%. The Fund’s unmanaged benchmark, the Barclays Capital Municipal Bond Index, returned 12.07% for the same period. The Lipper Maryland Municipal Debt Funds Category Average1 returned 12.13% over the same time frame.
Certain investors may be subject to the AMT, and state and local taxes may apply. Capital gains, if any, are fully taxable. Please consult your personal tax or legal adviser.
| | | | | | | | |
Performance Snapshot as of March 31, 2012
(unaudited) | |
| (excluding sales charges) | | 6 months | | | 12 months | |
| Legg Mason Investment Counsel Maryland Tax-Free Income Trust: | |
Class A | | | 3.71 | % | | | 11.63 | % |
Class C | | | 3.40 | % | | | 10.96 | % |
Class I | | | 3.80 | % | | | 11.90 | % |
| Barclays Capital Municipal Bond Index | | | 3.91 | % | | | 12.07 | % |
| Lipper Maryland Municipal Debt Funds Category Average1 | | | 4.03 | % | | | 12.13 | % |
The performance shown represents past performance. Past performance is no guarantee of future results and current performance may be higher or lower than the performance shown above. Principal value, investment returns and yields will fluctuate and investors’ shares, when redeemed, may be worth more or less than their original cost. To obtain performance data current to the most recent month-end, please visit our website at www.leggmason.com/individualinvestors.
All share class returns assume the reinvestment of all distributions if any, at net asset value and the deduction of all Fund expenses. Returns have not been adjusted to include sales charges that may apply or the deduction of taxes that a shareholder
| 1 | Lipper, Inc., a wholly-owned subsidiary of Reuters, provides independent insight on global collective investments. Returns are based on the period ended March 31, 2012, including the reinvestment of all distributions, including returns of capital, if any, calculated among the 35 funds for the six-month period and among the 34 funds for the twelve-month period in the Fund’s Lipper category, and excluding sales charges. |
| | |
| 4 | | Legg Mason Investment Counsel Maryland Tax-Free Income Trust 2012 Annual Report |
Fund overview (cont’d)
would pay on Fund distributions. If sales charges were reflected, the performance quoted would be lower. Performance figures for periods shorter than one year represent cumulative figures and are not annualized.
Fund performance figures reflect fee waivers and/or expense reimbursements, without which the performance would have been lower.
The 30-Day SEC Yields for the period ended March 31, 2012 for Class A, Class C and Class I shares were 2.83%, 2.37% and 3.14%, respectively. Absent current fee waivers and/or expense reimbursements, the 30-Day SEC Yields for Class A, Class C and Class I shares would have been 2.72%, 2.25% and 3.01%, respectively. The 30-Day SEC Yield is subject to change and is based on the yield to maturity of the Fund’s investments over a 30-day period and not on the dividends paid by the Fund, which may differ.
|
| Total Annual Operating Expenses (unaudited) |
As of the Fund’s current prospectus dated July 31, 2011, the gross total annual operating expense ratios for Class A, Class C and Class I shares were 0.84%, 1.43% and 0.78%, respectively.
Actual expenses may be higher. For example, expenses may be higher than those shown if average net assets decrease. Net assets are more likely to decrease and Fund expense ratios are more likely to increase when markets are volatile.
As a result of expense limitation arrangements, the ratio of expenses, other than brokerage commissions, interest, dividend expense on short sales, taxes, extraordinary expenses and acquired fund fees and expenses, to average net assets is not expected to exceed 0.70% for Class A shares, 1.25% for Class C shares and 0.45% for Class I shares. These expense limitation arrangements cannot be terminated prior to December 31, 2013 without the Board of Trustees’ consent.
The manager is permitted to recapture amounts waived or reimbursed to a class within three years after the year in which the manager earned the fee or incurred the expense if the class’ total annual operating expenses have fallen to a level below the expense limitation (“expense cap”) in effect at the time the fees were earned or the expenses incurred. In no case will the manager recapture any amount that would result, on any particular business day of the Fund, in the class’ total annual operating expenses exceeding the expense cap or any other lower limit then in effect.
What were the leading contributors to performance?
A. Our sector weightings were beneficial to the Fund’s performance over the twelve months ended March 31, 2012. Given the narrowing of credit spreads during the period, the Fund’s large weighting to Hospitals within the Health Care1 sector provided the largest positive contribution to performance, as these issuers tend to have credit ratings that reside in the lowest tiers of the investment grade credit universe (i.e. single-A and BBB). The heavily owned Higher Education sector also performed well. Like the Fund’s Health Care holdings, many of these issuers are rated single-A and BBB, which out-performed securities of higher credit quality. In addition to benefitting from a tightening of credit spreads, both the Hospital and Higher Education holdings are heavily weighted to longer maturities, which was the best performing part of the yield curve as yields collapsed on these securities, driving large increases in prices. Finally, the Fund’s heavy weighting in the Housing sector was accretive to results for the second straight year as prepayment uncertainty tends to result in attractive yields for bondholders.
What were the leading detractors from performance?
A. The largest detractor to performance was overall portfolio duration, which was shorter than the Barclays Capital Municipal Bond Index and much of the Fund’s Lipper peer group for the majority of the reporting
| 1 | Health Care consists of the following industries: Hospitals/Nursing Facilities, Pharmacy Services, Medical Wholesale Drug Distributors, Drug Delivery Systems, Medical Products/Instruments, Medical & Laboratory Testing, Healthcare Cost Containment and Scientific Instruments. |
| | | | |
| Legg Mason Investment Counsel Maryland Tax-Free Income Trust 2012 Annual Report | | | 5 | |
period. Although we extended the weighted average maturity of the Fund in the spring of 2011, the portfolio’s barbell structure, which focuses on a combination of long- and short-securities, resulted in a relatively defensive stance which did not allow the Fund to fully participate in the strong rally among the longest securities. Also, despite meaningful exposure to certain lower-rated, investment grade securities within Hospitals and Higher Education, high-credit quality on the portfolio level detracted from results as lower-rated municipal bonds outperformed in an environment of improving tax revenues and a strengthening economy.
Sincerely,

R. Scott Pierce, CFA
Portfolio Manager
Legg Mason Investment Counsel, LLC
April 17, 2012
RISKS: Bonds are subject to a variety of risks, including interest rate, credit and inflation risks. As interest rates rise, bond prices fall, reducing the value of a fixed-income investment. Municipal securities purchased by the Fund may be adversely affected by changes in the financial condition of municipal issuers and insurers, regulatory and political developments, uncertainties and public perceptions, and other factors. As a “non-diversified” fund, an investment in the Fund will entail greater price risk than an investment in a diversified fund because a higher percentage of investments among fewer issuers may result in greater fluctuation in the total market value of the Fund’s portfolio. Please see the Fund’s prospectus for a more complete discussion of these and other risks, and the Fund’s investment strategies.
The mention of sector breakdowns is for informational purposes only and should not be construed as a recommendation to purchase or sell any securities. The information provided regarding such sectors is not a sufficient basis upon which to make an investment decision. Investors seeking financial advice regarding the appropriateness of investing in any securities or investment strategies discussed should consult their financial professional. Portfolio holdings are subject to change at any time and may not be representative of the portfolio managers’ current or future investments. The Fund’s portfolio composition is subject to change at any time.
All investments are subject to risk including the possible loss of principal. Past performance is no guarantee of future results. All index performance reflects no deduction for fees, expenses or taxes. Please note that an investor cannot invest directly in an index.
The information provided is not intended to be a forecast of future events, a guarantee of future results or investment advice. Views expressed may differ from those of the firm as a whole.
| i | Duration is the measure of the price sensitivity of a fixed-income security to an interest rate change of 100 basis points. Calculation is based on the weighted average of the present values for all cash flows. |
| ii | A basis point is one one-hundredth (1/100 or 0.01) of one percent. |
| iii | The Barclays Capital Municipal Bond Index is a market value weighted index of investment grade municipal bonds with maturities of one year or more. |
| iv | The yield curve is the graphical depiction of the relationship between the yield on bonds of the same credit quality but different maturities. |
| | |
| 6 | | Legg Mason Investment Counsel Maryland Tax-Free Income Trust 2012 Annual Report |
Fund at a glance† (unaudited)
Investment breakdown (%) as a percent of total investments
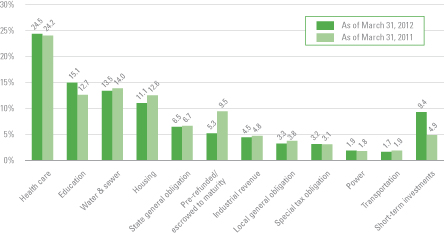
| † | The bar graph above represents the composition of the Fund’s investments as of March 31, 2012 and March 31, 2011. The Fund is actively managed. As a result, the composition of the Fund’s investments is subject to change at any time. |
| | | | |
| Legg Mason Investment Counsel Maryland Tax-Free Income Trust 2012 Annual Report | | | 7 | |
Fund expenses (unaudited)
Example
As a shareholder of the Fund, you may incur two types of costs: (1) transaction costs, including front-end and back-end sales charges (loads) on purchase payments; and (2) ongoing costs, including management fees; service and/or distribution (12b-1) fees; and other Fund expenses. This example is intended to help you understand your ongoing costs (in dollars) of investing in the Fund and to compare these costs with the ongoing costs of investing in other mutual funds.
This example is based on an investment of $1,000 invested on October 1, 2011 and held for the six months ended March 31, 2012.
Actual expenses
The table below titled “Based on Actual Total Return” provides information about actual account values and actual expenses. You may use the information provided in this table, together with the amount you invested, to estimate the expenses that you paid over the period. To estimate the expenses you paid on your account, divide your ending account value by $1,000 (for example, an $8,600 ending account value divided by $1,000 = 8.6), then multiply the result by the number under the heading entitled “Expenses Paid During the Period”.
Hypothetical example for comparison purposes
The table below titled “Based on Hypothetical Total Return” provides information about hypothetical account values and hypothetical expenses based on the actual expense ratio and an assumed rate of return of 5.00% per year before expenses, which is not the Fund’s actual return. The hypothetical account values and expenses may not be used to estimate the actual ending account balance or expenses you paid for the period. You may use the information provided in this table to compare the ongoing costs of investing in the Fund and other funds. To do so, compare the 5.00% hypothetical example relating to the Fund with the 5.00% hypothetical examples that appear in the shareholder reports of the other funds.
Please note that the expenses shown in the table below are meant to highlight your ongoing costs only and do not reflect any transactional costs, such as front-end or back-end sales charges (loads). Therefore, the table is useful in comparing ongoing costs only, and will not help you determine the relative total costs of owning different funds. In addition, if these transaction costs were included, your costs would have been higher.
| | | | | | | | | | | | | | | | | | | | | | | | | | | | | | | | | | | | | | | | | | | | |
| Based on actual total return1 | | | | | Based on hypothetical total return1 | |
| | | Actual
Total Return
Without
Sales
Charge2 | | | Beginning
Account
Value | | | Ending
Account
Value | | | Annualized
Expense
Ratio | | | Expenses
Paid
During
the
Period3 | | | | | | | Hypothetical
Annualized
Total Return | | | Beginning
Account
Value | | | Ending
Account
Value | | | Annualized
Expense
Ratio | | | Expenses
Paid
During
the
Period3 | |
| Class A | | | 3.71 | % | | $ | 1,000.00 | | | $ | 1,037.10 | | | | 0.63 | % | | $ | 3.21 | | | | | Class A | | | 5.00 | % | | $ | 1,000.00 | | | $ | 1,021.85 | | | | 0.63 | % | | $ | 3.18 | |
| Class C | | | 3.40 | | | | 1,000.00 | | | | 1,034.00 | | | | 1.24 | | | | 6.31 | | | | | Class C | | | 5.00 | | | | 1,000.00 | | | | 1,018.80 | | | | 1.24 | | | | 6.26 | |
| Class I | | | 3.80 | | | | 1,000.00 | | | | 1,038.00 | | | | 0.45 | | | | 2.29 | | | | | Class I | | | 5.00 | | | | 1,000.00 | | | | 1,022.75 | | | | 0.45 | | | | 2.28 | |
| 1 | For the six months ended March 31, 2012. |
| 2 | Assumes the reinvestment of all distributions, including the returns of capital, if any, at net asset value and does not reflect the deduction of the applicable sales charge with respect to Class A shares or the applicable contingent deferred sales charges (“CDSC”) with respect to Class C shares. Total return is not annualized, as it may not be representative of the total return for the year. Performance figures may reflect compensating balance arrangements, fee waivers and/or expense reimbursements. In the absence of compensating balance arrangements, fee waivers and/or expense reimbursements, the total return would have been lower. Past performance is no guarantee of future results. |
| 3 | Expenses (net of compensating balance arrangements, fee waivers and/or expense reimbursements) are equal to each class’ respective annualized expense ratio multiplied by the average account value over the period, multiplied by the number of days in the most recent fiscal half-year (183), then divided by 366. |
| | |
| 8 | | Legg Mason Investment Counsel Maryland Tax-Free Income Trust 2012 Annual Report |
Fund Performance (unaudited)
| | | | | | | | | | | | |
| Average annual total returns | | | | | | | | | |
| Without sales charges1 | | Class A | | | Class C | | | Class I | |
| Twelve Months Ended 3/31/12 | | | 11.63 | % | | | 10.96 | % | | | 11.90 | % |
| Five Years Ended 3/31/12 | | | 5.01 | | | | N/A | | | | N/A | |
| Ten Years Ended 3/31/12 | | | 4.93 | | | | N/A | | | | N/A | |
| Inception* through 3/31/12 | | | 5.61 | | | | 6.23 | | | | 6.31 | |
| | | |
| With sales charges2 | | Class A | | | Class C | | | Class I | |
| Twelve Months Ended 3/31/12 | | | 6.90 | % | | | 9.96 | % | | | 11.90 | % |
| Five Years Ended 3/31/12 | | | 4.11 | | | | N/A | | | | N/A | |
| Ten Years Ended 3/31/12 | | | 4.47 | | | | N/A | | | | N/A | |
| Inception* through 3/31/12 | | | 5.39 | | | | 6.23 | | | | 6.31 | |
| | | | |
| Cumulative total returns | | | |
| Without sales charges1 | | | |
| Class A (3/31/02 through 3/31/12) | | | 61.83 | % |
| Class C (Inception date of 2/05/09 through 3/31/12) | | | 20.99 | |
| Class I (Inception date of 7/30/08 through 3/31/12) | | | 25.20 | |
All figures represent past performance and are not a guarantee of future results. Investment return and principal value of an investment will fluctuate so that an investor’s shares, when redeemed, may be worth more or less than their original cost. The returns shown do not reflect the deduction of taxes that a shareholder would pay on Fund distributions or the redemption of Fund shares. Performance figures may reflect compensating balance arrangements, fee waivers and/or expense reimbursements. In the absence of compensating balance arrangements, fee waivers and/or expense reimbursements, the total return would have been lower.
| 1 | Assumes the reinvestment of all distributions, including returns of capital, if any, at net asset value and does not reflect the deduction of the applicable sales charge with respect to Class A shares or the applicable CDSC with respect to Class C shares. |
| 2 | Assumes the reinvestment of all distributions, including returns of capital, if any, at net asset value. In addition, Class A shares reflect the deduction of the maximum initial sales charge of 4.25% and Class C shares reflect the deduction of a 1.00% CDSC, which applies if shares are redeemed within one year from purchase payment. |
| * | The inception dates for Class A, C and I shares are May 1, 1991, February 5, 2009 and July 30, 2008, respectively. |
| | | | |
| Legg Mason Investment Counsel Maryland Tax-Free Income Trust 2012 Annual Report | | | 9 | |
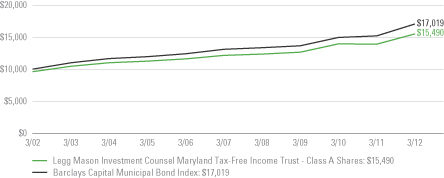
Historical performance
Value of $10,000 invested in
Class A Shares of Legg Mason Investment Counsel Maryland Tax-Free Income Trust vs. Barclays Capital Municipal Bond Index† — March 2002 - March 2012
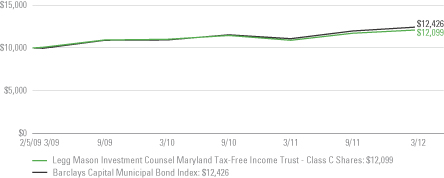
Value of $10,000 invested in
Class C Shares of Legg Mason Investment Counsel Maryland Tax-Free Income Trust vs. Barclays Capital Municipal Bond Index† — February 5, 2009 - March 2012
| | |
| 10 | | Legg Mason Investment Counsel Maryland Tax-Free Income Trust 2012 Annual Report |
Fund performance (unaudited) (cont’d)
Value of $1,000,000 invested in
Class I Shares of Legg Mason Investment Counsel Maryland Tax-Free Income Trust vs. Barclays Capital Municipal Bond Index† —
July 30, 2008 - March 2012
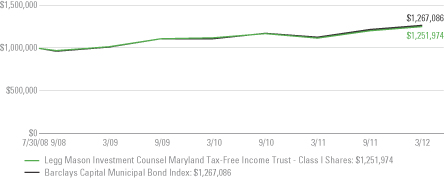
All figures represent past performance and are not a guarantee of future results. Investment return and principal value of an investment will fluctuate so that an investor’s shares, when redeemed, may be worth more or less than their original cost. The returns shown do not reflect the deduction of taxes that a shareholder would pay on Fund distributions or the redemption of Fund shares. Performance figures may reflect compensating balance arrangements, fee waivers and/or expense reimbursements. In the absence of compensating balance arrangements, fee waivers and/or expense reimbursements, the total return would have been lower.
| † | Hypothetical illustration of $10,000 invested in Class A and C shares and $1,000,000 in Class I shares of Legg Mason Investment Counsel Maryland Tax-Free Income Trust on March 31, 2002, February 5, 2009 (inception date) and July 30, 2008 (inception date), respectively, assuming the deduction of the maximum initial sales charge of 4.25% at the time of investment for Class A shares and the reinvestment of all distributions, including returns of capital, if any, at net asset value through March 31, 2012. The hypothetical illustration also assumes a $10,000 or $1,000,000 investment, as applicable, in the Barclays Capital Municipal Bond Index. The Barclays Capital Municipal Bond Index is a market value weighted index of investment grade municipal bonds with maturities of one year or more. The Index is unmanaged and is not subject to the same management and trading expenses as a mutual fund. Please note that an investor cannot invest directly in an index. |
| | | | |
| Legg Mason Investment Counsel Maryland Tax-Free Income Trust 2012 Annual Report | | | 11 | |
Schedule of investments
March 31, 2012
Legg Mason Investment Counsel Maryland Tax-Free Income Trust
| | | | | | | | | | | | | | |
| Security | | Rate | | | Maturity
Date | | Face
Amount | | | Value | |
| Municipal Bonds — 89.5% | | | | | | | | | | | | | | |
Education — 14.9% | | | | | | | | | | | | | | |
City of Annapolis, Maryland, EDR and Refunding Revenue Bonds: | | | | | | | | | | | | | | |
St. John’s College Facility | | | 5.500 | % | | 10/1/18 | | $ | 200,000 | | | $ | 200,768 | |
St. John’s College Facility | | | 5.500 | % | | 10/1/23 | | | 490,000 | | | | 491,602 | |
St. John’s College Facility | | | 5.000 | % | | 10/1/27 | | | 1,135,000 | | | | 1,165,111 | |
St. John’s College Facility | | | 5.000 | % | | 10/1/36 | | | 2,465,000 | | | | 2,509,962 | |
Maryland Health & Higher EFA Revenue Bonds: | | | | | | | | | | | | | | |
College of Notre Dame of Maryland Issue, NATL | | | 5.300 | % | | 10/1/18 | | | 925,000 | | | | 1,056,174 | |
Loyola College Issue | | | 5.000 | % | | 10/1/40 | | | 2,000,000 | | | | 2,058,000 | |
Maryland Institute College of Art | | | 5.000 | % | | 6/1/36 | | | 5,000,000 | | | | 5,086,000 | |
Maryland Institute College of Art | | | 5.000 | % | | 6/1/42 | | | 800,000 | | | | 811,200 | |
The Johns Hopkins University Issue | | | 5.000 | % | | 7/1/33 | | | 3,000,000 | | | | 3,216,090 | |
Maryland State EDC, Student Housing Revenue Bonds: | | | | | | | | | | | | | | |
University of Maryland, College Park Projects | | | 5.750 | % | | 6/1/33 | | | 500,000 | | | | 524,485 | |
University of Maryland, College Park Projects | | | 5.800 | % | | 6/1/38 | | | 1,500,000 | | | | 1,563,630 | |
Maryland State EDC, Utility Infrastructure Revenue: | | | | | | | | | | | | | | |
University of Maryland, College Park Project | | | 5.000 | % | | 7/1/16 | | | 3,700,000 | | | | 4,134,750 | |
University of Maryland, College Park Project | | | 5.000 | % | | 7/1/17 | | | 1,000,000 | | | | 1,135,220 | |
University System of Maryland Auxiliary Facility and Tuition Revenue Bonds | | | 5.000 | % | | 10/1/21 | | | 2,500,000 | | | | 2,875,175 | |
Westminster, Maryland, Education Facilities Refunding Revenue Bonds, McDaniel College Inc. | | | 5.000 | % | | 11/1/31 | | | 3,500,000 | | | | 3,524,045 | |
Total Education | | | | | | | | | | | | | 30,352,212 | |
Health Care — 24.3% | | | | | | | | | | | | | | |
Baltimore County, Maryland, Revenue Bonds, Catholic Health Initiatives | | | 5.000 | % | | 9/1/20 | | | 1,050,000 | | | | 1,188,904 | |
Maryland State Health & Higher EFA Revenue: | | | | | | | | | | | | | | |
Carroll County General Hospital Issue | | | 6.000 | % | | 7/1/37 | | | 1,000,000 | | | | 1,003,830 | |
Suburban Hospital | | | 5.500 | % | | 7/1/16 | | | 500,000 | | | | 548,925 | |
Maryland State Health & Higher EFA Revenue Bonds: | | | | | | | | | | | | | | |
Anne Arundel Health System | | | 6.750 | % | | 7/1/29 | | | 2,000,000 | | | | 2,396,920 | |
Board of Child Care Issue | | | 5.500 | % | | 7/1/18 | | | 1,110,000 | | | | 1,118,092 | |
Calvert Health Systems Issue | | | 5.500 | % | | 7/1/39 | | | 2,000,000 | | | | 2,072,280 | |
Carroll County General Hospital Issue | | | 5.750 | % | | 7/1/22 | | | 1,000,000 | | | | 1,005,290 | |
Carroll County General Hospital Issue | | | 6.000 | % | | 7/1/26 | | | 2,000,000 | | | | 2,010,940 | |
Carroll County General Hospital Issue | | | 5.750 | % | | 7/1/27 | | | 1,050,000 | | | | 1,054,095 | |
Carroll County General Hospital Issue | | | 5.800 | % | | 7/1/32 | | | 2,000,000 | | | | 2,006,860 | |
College of Notre Dame of Maryland | | | 4.000 | % | | 10/1/25 | | | 1,645,000 | | | | 1,693,988 | |
See Notes to Financial Statements.
| | |
| 12 | | Legg Mason Investment Counsel Maryland Tax-Free Income Trust 2012 Annual Report |
Schedule of investments (cont’d)
March 31, 2012
Legg Mason Investment Counsel Maryland Tax-Free Income Trust
| | | | | | | | | | | | | | |
| Security | | Rate | | | Maturity
Date | | Face
Amount | | | Value | |
Health Care — continued | | | | | | | | | | | | | | |
Helix Health Issue, AMBAC | | | 5.250 | % | | 8/15/38 | | $ | 3,000,000 | | | $ | 3,370,140 | |
Johns Hopkins Medical Institutions | | | 5.000 | % | | 5/15/35 | | | 1,300,000 | | | | 1,426,646 | |
Johns Hopkins Medicine, Howard County General Hospital Acquisition Issue, NATL | | | 5.000 | % | | 7/1/29 | | | 2,000,000 | | | | 2,002,400 | |
Mercy Medical Center Inc. | | | 5.500 | % | | 7/1/42 | | | 3,445,000 | | | | 3,532,847 | |
Peninsula Regional Medical Center Issue | | | 5.000 | % | | 7/1/19 | | | 1,000,000 | | | | 1,094,080 | |
Peninsula Regional Medical Center Issue | | | 5.000 | % | | 7/1/26 | | | 2,435,000 | | | | 2,566,880 | |
Refunding, Kennedy Krieger Issue | | | 5.125 | % | | 7/1/22 | | | 3,000,000 | | | | 3,000,750 | |
Refunding, MedStar Health Issue | | | 5.500 | % | | 8/15/25 | | | 785,000 | | | | 856,302 | |
Refunding, Mercy Ridge | | | 4.750 | % | | 7/1/34 | | | 3,200,000 | | | | 3,210,080 | |
The Johns Hopkins Hospital Issue | | | 0.000 | % | | 7/1/19 | | | 4,000,000 | | | | 3,162,640 | |
Union Hospital of Cecil County Issue | | | 5.500 | % | | 7/1/22 | | | 250,000 | | | | 252,765 | |
University of Maryland Medical System | | | 5.000 | % | | 7/1/34 | | | 1,000,000 | | | | 1,064,860 | |
University of Maryland Medical System | | | 5.000 | % | | 7/1/41 | | | 1,500,000 | | | | 1,552,575 | |
Washington County Hospital Association | | | 5.000 | % | | 1/1/17 | | | 500,000 | | | | 540,195 | |
Washington County Hospital Issue | | | 4.000 | % | | 1/1/15 | | | 1,000,000 | | | | 1,041,640 | |
Washington County Hospital Issue | | | 4.750 | % | | 1/1/16 | | | 1,000,000 | | | | 1,068,770 | |
Washington County Hospital Issue | | | 5.250 | % | | 1/1/23 | | | 500,000 | | | | 530,960 | |
Washington County Hospital Issue | | | 5.750 | % | | 1/1/38 | | | 2,000,000 | | | | 2,070,860 | |
Washington County Hospital Issue | | | 6.000 | % | | 1/1/43 | | | 1,000,000 | | | | 1,045,740 | |
Total Health Care | | | | | | | | | | | | | 49,491,254 | |
Housing — 11.0% | | | | | | | | | | | | | | |
Community Development Administration, Maryland Department of Housing and Community Development Residential Revenue Bonds | | | 5.200 | % | | 9/1/22 | | | 1,790,000 | | | | 1,790,949 | (a) |
Community Development Administration, Maryland Department of Housing and Community Development Residential Revenue Bonds | | | 5.375 | % | | 9/1/22 | | | 120,000 | | | | 120,073 | (a) |
Community Development Administration, Maryland Department of Housing and Community Development Residential Revenue Bonds | | | 5.375 | % | | 9/1/24 | | | 2,000,000 | | | | 2,001,220 | (a) |
Community Development Administration, Maryland Department of Housing and Community Development Residential Revenue Bonds | | | 4.500 | % | | 9/1/29 | | | 2,490,000 | | | | 2,548,366 | |
Community Development Administration, Maryland Department of Housing and Community Development Residential Revenue Bonds | | | 4.750 | % | | 9/1/29 | | | 1,000,000 | | | | 1,036,270 | |
Community Development Administration, Maryland Department of Housing and Community Development Residential Revenue Bonds | | | 5.050 | % | | 9/1/39 | | | 1,980,000 | | | | 2,034,410 | |
Maryland State Community Development Administration, Department of Housing & Community Development | | | 5.375 | % | | 9/1/39 | | | 1,500,000 | | | | 1,557,915 | |
See Notes to Financial Statements.
| | | | |
| Legg Mason Investment Counsel Maryland Tax-Free Income Trust 2012 Annual Report | | | 13 | |
Legg Mason Investment Counsel Maryland Tax-Free Income Trust
| | | | | | | | | | | | | | |
| Security | | Rate | | | Maturity
Date | | Face
Amount | | | Value | |
Housing — continued | | | | | | | | | | | | | | |
Maryland State Community Development Administration, Department of Housing and Community Development, Local Government Infrastructure | | | 4.000 | % | | 6/1/30 | | $ | 5,485,000 | | | $ | 5,693,759 | |
Montgomery County, Maryland, Revenue Bonds: | | | | | | | | | | | | | | |
Housing Opportunities Commission, Single Family Mortgage | | | 4.875 | % | | 7/1/25 | | | 1,000,000 | | | | 1,057,560 | |
Housing Opportunities Commission, Single Family Mortgage | | | 5.000 | % | | 7/1/27 | | | 1,395,000 | | | | 1,423,793 | (a) |
Montgomery County, MD, Housing Opportunities Commission, Multi-Family Revenue, Housing Development | | | 4.625 | % | | 7/1/41 | | | 2,000,000 | | | | 2,058,220 | |
Montgomery County, MD, Lease Revenue, Metrorail Garage Project | | | 5.000 | % | | 6/1/24 | | | 1,000,000 | | | | 1,161,690 | |
Total Housing | | | | | | | | | | | | | 22,484,225 | |
Industrial Revenue — 4.4% | | | | | | | | | | | | | | |
IDA of Prince George’s County, Maryland, Subordinated Lease Revenue Bonds: | | | | | | | | | | | | | | |
Upper Marlboro Justice Center Expansion Project, NATL | | | 5.125 | % | | 6/30/15 | | | 3,340,000 | | | | 3,524,535 | |
Upper Marlboro Justice Center Expansion Project, NATL | | | 5.000 | % | | 6/30/19 | | | 1,000,000 | | | | 1,047,330 | |
Maryland EDC, EDR, Lutheran World Relief Inc. and Immigration and Refugee Service | | | 5.250 | % | | 4/1/29 | | | 565,000 | | | | 571,418 | |
Maryland IDA, EDR Bonds, National Aquarium in Baltimore Facility | | | 5.000 | % | | 11/1/19 | | | 500,000 | | | | 501,415 | |
Maryland IDA, Refunding Revenue Bonds, American Center for Physics Headquarters Facility | | | 5.250 | % | | 12/15/15 | | | 320,000 | | | | 321,021 | |
Puerto Rico Commonwealth Government Development Bank, NATL | | | 4.750 | % | | 12/1/15 | | | 3,000,000 | | | | 3,083,220 | |
Total Industrial Revenue | | | | | | | | | | | | | 9,048,939 | |
Local General Obligation — 3.2% | | | | | | | | | | | | | | |
Anne Arundel County, Maryland, GO Bonds, Consolidated General Improvement Bonds | | | 4.500 | % | | 3/1/23 | | | 1,000,000 | | | | 1,109,880 | |
Baltimore County, Maryland, GO Bonds | | | 4.000 | % | | 8/1/23 | | | 1,270,000 | | | | 1,432,700 | |
Baltimore County, Maryland, GO Bonds, Metropolitan District Bonds, 70th Issue | | | 4.250 | % | | 9/1/26 | | | 1,000,000 | | | | 1,060,150 | |
Frederick County, Maryland, GO Bonds, Public Facilities Refunding Bonds | | | 5.000 | % | | 7/1/15 | | | 1,000,000 | | | | 1,143,820 | |
Howard County, Maryland, GO Bonds, Consolidated Public Improvement Project and Refunding Bonds | | | 5.000 | % | | 8/15/19 | | | 1,000,000 | | | | 1,241,560 | |
Queen Anne’s County, Maryland, Public Facilities Refunding Bonds, NATL | | | 5.000 | % | | 11/15/16 | | | 500,000 | | | | 572,725 | |
Total Local General Obligation | | | | | | | | | | | | | 6,560,835 | |
See Notes to Financial Statements.
| | |
| 14 | | Legg Mason Investment Counsel Maryland Tax-Free Income Trust 2012 Annual Report |
Schedule of investments (cont’d)
March 31, 2012
Legg Mason Investment Counsel Maryland Tax-Free Income Trust
| | | | | | | | | | | | | | |
| Security | | Rate | | | Maturity
Date | | Face
Amount | | | Value | |
Power — 1.9% | | | | | | | | | | | | | | |
Puerto Rico Electric Power Authority, Power Revenue | | | 5.000 | % | | 7/1/28 | | $ | 3,740,000 | | | $ | 3,917,164 | |
Pre-Refunded/Escrowed to Maturity — 5.2% | | | | | | | | | | | | | | |
City of Baltimore, Maryland, Mayor and City Council of Baltimore, Project and Refunding Revenue Bonds, Water Projects | | | 5.000 | % | | 7/1/24 | | | 3,800,000 | | | | 4,810,686 | (b) |
Maryland State Health & Higher EFA Revenue: | | | | | | | | | | | | | | |
Howard County General Hospital Issue | | | 5.500 | % | | 7/1/21 | | | 2,825,000 | | | | 3,002,241 | (b) |
LifeBridge Health Issue | | | 5.250 | % | | 7/1/18 | | | 1,640,000 | | | | 1,813,807 | (c) |
Puerto Rico Sales Tax Financing Corp., Sales Tax Revenue | | | 5.500 | % | | 8/1/28 | | | 15,000 | | | | 19,219 | (c) |
University of Maryland Medical Systems | | | 6.000 | % | | 7/1/32 | | | 1,000,000 | | | | 1,014,080 | (c) |
Total Pre-Refunded/Escrowed to Maturity | | | | | | | | | | | | | 10,660,033 | |
Special Tax Obligation — 3.2% | | | | | | | | | | | | | | |
Frederick County, MD, Special Obligation, Urbana Community Development Authority | | | 5.000 | % | | 7/1/30 | | | 3,000,000 | | | | 3,184,860 | |
Puerto Rico Sales Tax Financing Corp., Sales Tax Revenue | | | 5.500 | % | | 8/1/28 | | | 1,985,000 | | | | 2,184,234 | |
Puerto Rico Sales Tax Financing Corp., Sales Tax Revenue | | | 6.000 | % | | 8/1/39 | | | 1,000,000 | | | | 1,127,540 | |
Total Special Tax Obligation | | | | | | | | | | | | | 6,496,634 | |
State General Obligation — 6.4% | | | | | | | | | | | | | | |
Commonwealth of Puerto Rico, GO Bonds: | | | | | | | | | | | | | | |
Public Improvement Bonds | | | 5.000 | % | | 7/1/25 | | | 2,000,000 | | | | 2,057,060 | |
Public Improvement Bonds | | | 6.000 | % | | 7/1/39 | | | 5,000,000 | | | | 5,312,700 | |
State of Maryland, GO Bonds, State and Local Facilities Loan | | | 5.500 | % | | 3/1/15 | | | 5,000,000 | | | | 5,713,100 | |
Total State General Obligation | | | | | | | | | | | | | 13,082,860 | |
Transportation — 1.7% | | | | | | | | | | | | | | |
Department of Transportation of Maryland, Consolidated Transportation Bonds | | | 5.500 | % | | 2/1/15 | | | 3,000,000 | | | | 3,412,050 | |
Water & Sewer — 13.3% | | | | | | | | | | | | | | |
City of Baltimore, Maryland, Mayor and City Council of Baltimore, Project and Refunding Revenue Bonds: | | | | | | | | | | | | | | |
Wastewater Projects, FGIC | | | 5.000 | % | | 7/1/22 | | | 1,910,000 | | | | 2,229,658 | |
Water Projects, FGIC | | | 5.000 | % | | 7/1/24 | | | 1,890,000 | | | | 2,210,506 | |
Water Projects, FGIC | | | 5.125 | % | | 7/1/42 | | | 1,000,000 | | | | 1,007,060 | |
City of Baltimore, Maryland, Mayor and City Council of Baltimore, Project and Revenue Bonds, Wastewater Projects, AGM | | | 5.000 | % | | 7/1/33 | | | 4,000,000 | | | | 4,368,760 | |
City of Baltimore, Maryland, Project Revenue Bonds, Water Projects, AMBAC | | | 5.000 | % | | 7/1/23 | | | 1,000,000 | | | | 1,135,220 | |
See Notes to Financial Statements.
| | | | |
| Legg Mason Investment Counsel Maryland Tax-Free Income Trust 2012 Annual Report | | | 15 | |
Legg Mason Investment Counsel Maryland Tax-Free Income Trust
| | | | | | | | | | | | | | | | |
| Security | | Rate | | | Maturity
Date | | | Face
Amount | | | Value | |
Water & Sewer — continued | | | | | | | | | | | | | | | | |
Northeast Maryland Waste Disposal Authority, Solid Waste Revenue, AMBAC | | | 5.500 | % | | | 4/1/16 | | | $ | 3,425,000 | | | $ | 3,574,261 | (a) |
Washington Suburban Sanitary District, Maryland, Montgomery and Prince George’s Counties, Water Supply Refunding Bonds | | | 5.250 | % | | | 6/1/16 | | | | 1,650,000 | | | | 1,948,205 | |
Washington Suburban Sanitary District, Maryland, Montgomery and Prince George’s Counties, Water Supply Refunding Bonds | | | 5.750 | % | | | 6/1/17 | | | | 2,000,000 | | | | 2,477,560 | |
Washington Suburban Sanitary District, Maryland, Montgomery and Prince George’s Counties, Water Supply Refunding Bonds | | | 6.000 | % | | | 6/1/18 | | | | 2,705,000 | | | | 3,458,721 | |
Washington Suburban Sanitary District, Maryland, Montgomery and Prince George’s Counties, Water Supply Refunding Bonds | | | 6.000 | % | | | 6/1/19 | | | | 3,665,000 | | | | 4,774,579 | |
Total Water & Sewer | | | | | | | | | | | | | | | 27,184,530 | |
Total Investments before Short-Term Investments (Cost — $166,241,503) | | | | 182,690,736 | |
| Short-Term Investments — 9.3% | | | | | | | | | | | | | | | | |
General Obligation — 0.9% | | | | | | | | | | | | | | | | |
Washington Suburban Sanitation District, MD, GO, BAN, SPA-Helaba | | | 0.270 | % | | | 6/1/23 | | | | 1,800,000 | | | | 1,800,000 | (d)(e) |
Health Care — 6.1% | | | | | | | | | | | | | | | | |
Maryland Health & Higher EFA Revenue, University of Maryland Medical System, LOC-Wells Fargo Bank N.A. | | | 0.170 | % | | | 7/1/34 | | | | 3,000,000 | | | | 3,000,000 | (d)(e) |
Maryland Health & Higher EFA Revenue Bonds, Anne Arundel Health System | | | 0.260 | % | | | 7/1/43 | | | | 6,800,000 | | | | 6,800,000 | (d)(e) |
Maryland State Health & Higher EFA Revenue: | | | | | | | | | | | | | | | | |
Johns Hopkins University | | | 0.180 | % | | | 7/1/36 | | | | 1,600,000 | | | | 1,600,000 | (d)(e) |
LOC-JPMorgan Chase | | | 0.190 | % | | | 4/1/35 | | | | 1,000,000 | | | | 1,000,000 | (d)(e) |
Total Health Care | | | | | | | | | | | | | | | 12,400,000 | |
Industrial Revenue — 2.3% | | | | | | | | | | | | | | | | |
Maryland State EDC Revenue: | | | | | | | | | | | | | | | | |
American Urological Association | | | 0.370 | % | | | 9/1/32 | | | | 750,000 | | | | 750,000 | (d)(e) |
Howard Hughes Medical Institute | | | 0.160 | % | | | 2/15/43 | | | | 4,000,000 | | | | 4,000,000 | (d)(e) |
Total Industrial Revenue | | | | | | | | | | | | | | | 4,750,000 | |
Total Short-Term Investments (Cost — $18,950,000) | | | | | | | | | | | | | | | 18,950,000 | |
Total Investments — 98.8% (Cost — $185,191,503#) | | | | | | | | | | | | | | | 201,640,736 | |
Other Assets in Excess of Liabilities — 1.2% | | | | | | | | | | | | | | | 2,526,448 | |
Total Net Assets — 100.0% | | | | | | | | | | | | | | $ | 204,167,184 | |
| (a) | Income from this issue is considered a preference item for purposes of calculating the alternative minimum tax (“AMT”). |
| (b) | Bonds are escrowed to maturity by government securities and/or U.S. government agency securities and are considered by the manager to be triple-A rated even if issuer has not applied for new ratings. |
See Notes to Financial Statements.
| | |
| 16 | | Legg Mason Investment Counsel Maryland Tax-Free Income Trust 2012 Annual Report |
Schedule of investments (cont’d)
March 31, 2012
Legg Mason Investment Counsel Maryland Tax-Free Income Trust
| (c) | Pre-Refunded bonds are escrowed with U.S. government obligations and/or U.S. government agency securities and are considered by the manager to be triple-A rated even if issuer has not applied for new ratings. |
| (d) | Variable rate demand obligations have a demand feature under which the Fund can tender them back to the issuer or liquidity provider on no more than 7 days notice. |
| (e) | Maturity date shown is the final maturity date. The security may be sold back to the issuer before final maturity. |
| # | Aggregate cost for federal income tax purposes is substantially the same. |
| | |
Abbreviations used in this schedule: |
| AGM | | — Assured Guaranty Municipal Corporation — Insured Bonds |
| AMBAC | | — American Municipal Bond Assurance Corporation — Insured Bonds |
| BAN | | — Bond Anticipation Notes |
| EDC | | — Economic Development Corporation |
| EDR | | — Economic Development Revenue |
| EFA | | — Educational Facilities Authority |
| FGIC | | — Financial Guaranty Insurance Company — Insured Bonds |
| GO | | — General Obligation |
| IDA | | — Industrial Development Authority |
| LOC | | — Letter of Credit |
| NATL | | — National Public Finance Guarantee Corporation — Insured Bonds |
| SPA | | — Standby Bond Purchase Agreement — Insured Bonds |
| | | | |
| Ratings Table* (unaudited) | | | |
| Standard & Poor’s/Moody’s/Fitch** | | | | |
| AAA/Aaa | | | 16.3 | % |
| AA/Aa | | | 29.6 | |
| A | | | 20.6 | |
| BBB/Baa | | | 23.2 | |
| A-1/VMIG 1 | | | 9.4 | |
| NR | | | 0.9 | |
| | | | 100.0 | % |
| * | As a percentage of total investments. |
| ** | The ratings shown are based on each portfolio security’s rating as determined by Standard & Poor’s, Moody’s or Fitch, each a Nationally Recognized Statistical Rating Organization (“NRSRO”). These ratings are the opinions of the NRSRO and are not measures of quality or guarantees of performance. Securities may be rated by other NRSROs, and these ratings may be higher or lower. In the event that a security is rated by multiple NRSROs and receives different ratings, the Fund will treat the security as being rated in the highest rating category received from a NRSRO. |
See pages 17 through 21 for definitions of ratings.
See Notes to Financial Statements.
| | | | |
| Legg Mason Investment Counsel Maryland Tax-Free Income Trust 2012 Annual Report | | | 17 | |
Bond ratings
The definitions of the applicable rating symbols are set forth below:
Long-term security ratings (unaudited)
Standard & Poor’s Ratings Service (“Standard & Poor’s”) Long-term Issue Credit Ratings — Ratings from “AA” to “CCC” may be modified by the addition of a plus (+) or minus (–) sign to show relative standings within the major rating categories.
AAA | — | An obligation rated “AAA” has the highest rating assigned by Standard & Poor’s. The obligor’s capacity to meet its financial commitment on the obligation is extremely strong. |
AA | — | An obligation rated “AA” differs from the highest-rated obligations only to a small degree. The obligor’s capacity to meet its financial commitment on the obligation is very strong. |
A | — | An obligation rated “A” is somewhat more susceptible to the adverse effects of changes in circumstances and economic conditions than obligations in higher-rated categories. However, the obligor’s capacity to meet its financial commitment on the obligation is still strong. |
BBB | — | An obligation rated “BBB” exhibits adequate protection parameters. However, adverse economic conditions or changing circumstances are more likely to lead to a weakened capacity of the obligor to meet its financial commitment on the obligation. |
BB | — | An obligation rated “BB” is less vulnerable to nonpayment than other speculative issues. However, it faces major ongoing uncertainties or exposure to adverse business, financial, or economic conditions, which could lead to the obligor’s inadequate capacity to meet its financial commitment on the obligation. |
B | — | An obligation rated “B” is more vulnerable to nonpayment than obligations rated “BB”, but the obligor currently has the capacity to meet its financial commitment on the obligation. Adverse business, financial, or economic conditions will likely impair the obligor’s capacity or willingness to meet its financial commitment on the obligation. |
CCC | — | An obligation rated “CCC” is currently vulnerable to nonpayment, and is dependent upon favorable business, financial, and economic conditions for the obligor to meet its financial commitment on the obligation. In the event of adverse business, financial, or economic conditions, the obligor is not likely to have the capacity to meet its financial commitment on the obligation. |
CC | — | An obligation rated “CC” is currently highly vulnerable to nonpayment. |
C | — | The “C” rating may be used to cover a situation where a bankruptcy petition has been filed or similar action has been taken, but payments on this obligation are being continued. |
| | |
| 18 | | Legg Mason Investment Counsel Maryland Tax-Free Income Trust 2012 Annual Report |
Long-term security ratings (unaudited) (cont’d)
D | — | An obligation rated “D” is in payment default. The “D” rating category is used when payments on an obligation are not made on the date due, even if the applicable grace period has not expired, unless Standard & Poor’s believes that such payments will be made during such grace period. The “D” rating also will be used upon the filing of a bankruptcy petition or the taking of a similar action if payments of an obligation are jeopardized. |
Moody’s Investors Service (“Moody’s”) Long-term Obligation Ratings — Numerical modifiers 1, 2 and 3 may be applied to each generic rating from “Aa” to “Caa,” where 1 is the highest and 3 the lowest ranking within its generic category.
Aaa | — | Obligations rated “Aaa” are judged to be of the highest quality, with minimal credit risk. |
Aa | — | Obligations rated “Aa” are judged to be of high quality and are subject to very low credit risk. |
A | — | Obligations rated “A” are considered upper-medium grade and are subject to low credit risk. |
Baa | — | Obligations rated “Baa” are subject to moderate credit risk. They are considered medium grade and as such may possess certain speculative characteristics. |
Ba | — | Obligations rated “Ba” are judged to have speculative elements and are subject to substantial credit risk. |
B | — | Obligations rated “B” are considered speculative and are subject to high credit risk. |
Caa | — | Obligations rated “Caa” are judged to be of poor standing and are subject to very high credit risk. |
Ca | — | Obligations rated “Ca” are highly speculative and are likely in, or very near, default, with some prospect of recovery for principal and interest. |
C | — | Obligations rated “C” are the lowest rated class and are typically in default, with little prospect of recovery for principal and interest. |
Fitch Ratings Service (“Fitch”) Structured, Project & Public Finance Obligations — Ratings from “AA” to “CCC” may be modified by the addition of a plus (+) or minus (–) sign to show relative standings within the major rating categories.
AAA | — | Obligations rated “AAA” by Fitch denote the lowest expectation of default risk. They are assigned only in cases of exceptionally strong capacity for payment of financial commitments. This capacity is highly unlikely to be adversely affected by foreseeable events. |
AA | — | Obligations rated “AA” denote expectations of very low default risk. They indicate very strong capacity for payment of financial commitments. This capacity is not significantly vulnerable to foreseeable events. |
A | — | Obligations rated “A” denote expectations of low default risk. The capacity for payment of financial commitments is considered strong. This capacity may, nevertheless, be more vulnerable to adverse business or economic conditions than is the case for higher ratings. |
| | | | |
| Legg Mason Investment Counsel Maryland Tax-Free Income Trust 2012 Annual Report | | | 19 | |
BBB | — | Obligations rated “BBB” indicate that expectations of default risk are currently low. The capacity for payment of financial commitments is considered adequate but adverse business or economic conditions are more likely to impair this capacity. |
BB | — | Obligations rated “BB” indicate an elevated vulnerability to default risk, particularly in the event of adverse changes in business or economic conditions over time; however, business or financial flexibility exists which supports the servicing of financial commitments. |
B | — | Obligations rated “B” indicate that material default risk is present, but a limited margin of safety remains. Financial commitments are currently being met; however, capacity for continued payment is vulnerable to deterioration in the business and economic environment. |
CCC | — | Default is a real possibility. |
CC | — | Default of some kind appears probable. |
C | — | Default is imminent or inevitable, or the issuer is in standstill. |
NR | — | Indicates that the obligation is not rated by Standard & Poor’s, Moody’s or Fitch. |
Short-term security ratings (unaudited)
Standard & Poor’s Municipal Short-Term Notes Ratings
SP-1 | — | A short-term obligation rated “SP-1” is rated in the highest category by Standard & Poor’s. Strong capacity to pay principal and interest. An issue determined to possess a very strong capacity to pay debt service is given a plus (+) designation. |
SP-2 | — | A short-term obligation rated “SP-2” is a Standard & Poor’s rating indicating satisfactory capacity to pay principal and interest, with some vulnerability to adverse financial and economic changes over the term of the notes. |
SP-3 | — | A short-term obligation rated “SP-3” is a Standard & Poor’s rating indicating speculative capacity to pay principal and interest. |
Standard & Poor’s Short-Term Issues Credit Ratings
A-1 | — | A short-term obligation rated “A-1” is rated in the highest category by Standard & Poor’s. The obligor’s capacity to meet its financial commitment on the obligation is strong. Within this category, certain obligations are designated with a plus sign (+). This indicates that the obligor’s capacity to meet its financial commitment on these obligations is extremely strong. |
A-2 | — | A short-term obligation rated “A-2” by Standard & Poor’s is somewhat more susceptible to the adverse effects of changes in circumstances and economic conditions than obligations in higher rating categories. However, the obligor’s capacity to meet its financial commitment on the obligation is satisfactory. |
| | |
| 20 | | Legg Mason Investment Counsel Maryland Tax-Free Income Trust 2012 Annual Report |
Short-term security ratings (unaudited) (cont’d)
A-3 | — | A short-term obligation rated “A-3” by Standard & Poor’s exhibits adequate protection parameters. However, adverse economic conditions or changing circumstances are more likely to lead to a weakened capacity of the obligor to meet its financial commitment on the obligation. |
B | — | A short-term obligation rated “B” by Standard & Poor’s is regarded as having significant speculative characteristics. Ratings of “B-1”, “B-2” and “B-3” may be assigned to indicate finer distinctions within the “B” category. The obligor currently has the capacity to meet its financial commitment on the obligation; however, it faces major ongoing uncertainties which could lead to the obligor’s inadequate capacity to meet its financial commitment on the obligation. |
Moody’s Variable Rate Demand Obligations (VRDO) Ratings
VMIG 1 | — | Moody’s highest rating for issues having a variable rate demand feature — VRDO. This designation denotes superior credit quality. Excellent protection is afforded by the superior short-term credit strength of the liquidity provider and structural and legal protections that ensure the timely payment of purchase price on demand. |
VMIG 2 | — | This designation denotes strong credit quality. Good protection is afforded by the strong short-term credit strength of the liquidity provider and structural and legal protections that ensure the timely payment of purchase price on demand. |
VMIG 3 | — | This designation denotes acceptable credit quality. Adequate protection is afforded by the strong short-term credit strength of the liquidity provider and structural and legal protections that ensure the timely payment of purchase price on demand. |
SG | — | This designation denotes speculative-grade credit quality. Demand features rated in this category may be supported by a liquidity provider that does not have an investment grade short term rating or may lack the structural and/or legal protections necessary to ensure the timely payment of purchase price upon demand. |
Moody’s Short-Term Municipal Obligations Ratings
MIG 1 | — | Moody’s highest rating for short-term municipal obligations. This designation denotes superior credit quality. Excellent protection is afforded by established cash flows, highly reliable liquidity support, or demonstrated broad-based access to the market for refinancing. |
MIG 2 | — | This designation denotes strong credit quality. Margins of protection are ample, although not as large as the preceding group. |
MIG 3 | — | This designation denotes acceptable credit quality. Liquidity and cash flow protection may be narrow, and market access for refinancing is likely to be less well-established. |
SG | — | This designation denotes speculative-grade credit quality. Debt instruments in this category may lack sufficient margins of protection. |
| | | | |
| Legg Mason Investment Counsel Maryland Tax-Free Income Trust 2012 Annual Report | | | 21 | |
Moody’s Short-Term Obligations Ratings
P-1 | — | Moody’s highest rating for commercial paper and for VRDO prior to the advent of the VMIG 1 rating. Have a superior ability to repay short-term debt obligations. |
P-2 | — | Have a strong ability to repay short-term debt obligations. |
P-3 | — | Have an acceptable ability to repay short-term debt obligations. |
NP | — | Issuers do not fall within any of the Prime rating categories. |
Fitch’s Short-Term Issuer or Obligations Ratings
F1 | — | Fitch’s highest rating indicating the strongest intrinsic capacity for timely payment of financial commitments; may have an added “+” to denote any exceptionally strong credit feature. |
F2 | — | Fitch rating indicating good intrinsic capacity for timely payment of financial commitments. |
F3 | — | Fitch rating indicating intrinsic capacity for timely payment of financial commitments is adequate. |
B | — | Fitch rating indicating minimal capacity for timely payment of financial commitments, plus heightened vulnerability to near term changes in financial and economic conditions. |
C | — | Fitch rating indicating default is a real possibility. |
NR | — | Indicates that the obligation is not rated by Standard & Poor’s, Moody’s or Fitch. |
| | |
| 22 | | Legg Mason Investment Counsel Maryland Tax-Free Income Trust 2012 Annual Report |
Statement of assets and liabilities
March 31, 2012
| | | | |
| |
| Assets: | | | | |
Investments, at value (Cost — $185,191,503) | | $ | 201,640,736 | |
Cash | | | 231,561 | |
Interest receivable | | | 2,295,966 | |
Receivable for Fund shares sold | | | 468,142 | |
Prepaid expenses | | | 26,237 | |
Other assets | | | 1,404 | |
Total Assets | | | 204,664,046 | |
| |
| Liabilities: | | | | |
Payable for Fund shares repurchased | | | 267,209 | |
Investment management fee payable | | | 73,503 | |
Distributions payable | | | 50,766 | |
Service and/or distribution fees payable | | | 38,440 | |
Accrued expenses | | | 66,944 | |
Total Liabilities | | | 496,862 | |
| Total Net Assets | | $ | 204,167,184 | |
| |
| Net Assets: | | | | |
Par value (Note 8) | | $ | 12,014 | |
Paid-in capital in excess of par value | | | 188,316,260 | |
Undistributed net investment income | | | 22,162 | |
Accumulated net realized loss on investments | | | (632,485) | |
Net unrealized appreciation on investments | | | 16,449,233 | |
| Total Net Assets | | $ | 204,167,184 | |
| |
| Shares Outstanding: | | | | |
Class A | | | 8,854,059 | |
Class C | | | 1,946,007 | |
Class I | | | 1,213,771 | |
| |
| Net Asset Value: | | | | |
Class A (and redemption price) | | | $16.99 | |
Class C* | | | $16.99 | |
Class I (and redemption price) | | | $17.00 | |
| Maximum Public Offering Price Per Share: | | | | |
Class A (based on maximum initial sales charge of 4.25%) | | | $17.74 | |
| * | Redemption price per share is NAV of Class C shares reduced by a 1.00% CDSC if shares are redeemed within one year from purchase payment (See Note 2). |
See Notes to Financial Statements.
| | | | |
| Legg Mason Investment Counsel Maryland Tax-Free Income Trust 2012 Annual Report | | | 23 | |
Statement of operations
For the Year Ended March 31, 2012
| | | | |
| |
| Investment Income: | | | | |
Interest | | $ | 8,741,733 | |
| |
| Expenses: | | | | |
Investment management fee (Note 2) | | | 1,065,420 | |
Service and/or distribution fees (Notes 2 and 5) | | | 428,469 | |
Transfer agent fees (Note 5) | | | 88,833 | |
Legal fees | | | 47,977 | |
Registration fees | | | 40,537 | |
Trustees’ fees | | | 34,073 | |
Audit and tax | | | 27,197 | |
Custody fees | | | 21,500 | |
Shareholder reports | | | 20,369 | |
Fund accounting fees | | | 9,052 | |
Insurance | | | 2,856 | |
Miscellaneous expenses | | | 11,445 | |
Total Expenses | | | 1,797,728 | |
Less: Fee waivers and/or expense reimbursements (Notes 2 and 5) | | | (416,951) | |
Net Expenses | | | 1,380,777 | |
| Net Investment Income | | | 7,360,956 | |
| |
| Realized and Unrealized Gain on Investments (Notes 1 and 3): | | | | |
Net Realized Gain From Investment Transactions | | | 141,745 | |
Change in Net Unrealized Appreciation (Depreciation) on Investments | | | 13,540,476 | |
| Net Gain on Investments | | | 13,682,221 | |
| Increase in Net Assets from Operations | | $ | 21,043,177 | |
See Notes to Financial Statements.
| | |
| 24 | | Legg Mason Investment Counsel Maryland Tax-Free Income Trust 2012 Annual Report |
Statements of changes in net assets
| | | | | | | | |
| For the Years Ended March 31, | | 2012 | | | 2011 | |
| | |
| Operations: | | | | | | | | |
Net investment income | | $ | 7,360,956 | | | $ | 7,749,813 | |
Net realized gain (loss) | | | 141,745 | | | | (262,061) | |
Change in net unrealized appreciation (depreciation) | | | 13,540,476 | | | | (8,444,657) | |
Increase (Decrease) in Net Assets From Operations | | | 21,043,177 | | | | (956,905) | |
| | |
| Distributions to Shareholders From (Notes 1 and 7): | | | | | | | | |
Net investment income | | | (7,360,956) | | | | (7,749,813) | |
Decrease in Net Assets From Distributions to Shareholders | | | (7,360,956) | | | | (7,749,813) | |
| | |
| Fund Share Transactions (Note 8): | | | | | | | | |
Net proceeds from sale of shares | | | 28,942,248 | | | | 36,499,368 | |
Reinvestment of distributions | | | 6,737,252 | | | | 6,994,545 | |
Cost of shares repurchased | | | (32,154,674) | | | | (45,637,540) | |
Increase (Decrease) in Net Assets From Fund Share Transactions | | | 3,524,826 | | | | (2,143,627) | |
Increase (Decrease) in Net Assets | | | 17,207,047 | | | | (10,850,345) | |
| | |
| Net Assets: | | | | | | | | |
Beginning of year | | | 186,960,137 | | | | 197,810,482 | |
End of year* | | $ | 204,167,184 | | | $ | 186,960,137 | |
* Includes undistributed net investment income of: | | | $22,162 | | | | $22,162 | |
See Notes to Financial Statements.
| | | | |
| Legg Mason Investment Counsel Maryland Tax-Free Income Trust 2012 Annual Report | | | 25 | |
Financial highlights
| | | | | | | | | | | | | | | | | | | | |
| For a share of each class of beneficial interest outstanding throughout each year ended March 31, | |
| Class A Shares1 | | 2012 | | | 2011 | | | 2010 | | | 2009 | | | 2008 | |
| | | | | |
| Net asset value, beginning of year | | | $ 15.82 | | | | $ 16.50 | | | | $ 15.58 | | | | $ 15.89 | | | | $ 16.28 | |
| | | | | |
| Income (loss) from operations: | | | | | | | | | | | | | | | | | | | | |
Net investment income | | | 0.64 | | | | 0.64 | | | | 0.63 | | | | 0.68 | | | | 0.67 | |
Net realized and unrealized gain (loss) | | | 1.17 | | | | (0.68) | | | | 0.92 | | | | (0.31) | | | | (0.39) | |
Total income (loss) from operations | | | 1.81 | | | | (0.04) | | | | 1.55 | | | | 0.37 | | | | 0.28 | |
| | | | | |
| Less distributions from: | | | | | | | | | | | | | | | | | | | | |
Net investment income | | | (0.64) | | | | (0.64) | | | | (0.63) | | | | (0.68) | | | | (0.67) | |
Net realized gains | | | — | | | | — | | | | — | | | | — | | | | (0.00) | 2 |
Total distributions | | | (0.64) | | | | (0.64) | | | | (0.63) | | | | (0.68) | | | | (0.67) | |
| | | | | |
| Net asset value, end of year | | | $16.99 | | | | $15.82 | | | | $16.50 | | | | $15.58 | | | | $15.89 | |
Total return3 | | | 11.63 | % | | | (0.32) | % | | | 10.08 | % | | | 2.46 | % | | | 1.76 | % |
| | | | | |
| Net assets, end of year (000s) | | | $150,467 | | | | $145,959 | | | | $168,589 | | | | $145,672 | | | | $149,392 | |
| | | | | |
| Ratios to average net assets: | | | | | | | | | | | | | | | | | | | | |
Gross expenses | | | 0.85 | % | | | 0.84 | % | | | 0.89 | % | | | 1.03 | % | | | 0.96 | % |
Net expenses4,5,6 | | | 0.64 | | | | 0.63 | | | | 0.65 | | | | 0.70 | | | | 0.70 | |
Net investment income | | | 3.88 | | | | 3.88 | | | | 3.88 | | | | 4.40 | | | | 4.15 | |
| | | | | |
| Portfolio turnover rate | | | 4 | % | | | 15 | % | | | 6 | % | | | 8 | % | | | 6 | % |
| 1 | Per share amounts have been calculated using the average shares method. |
| 2 | Amount represents less than $0.005 per share. |
| 3 | Performance figures, exclusive of sales charges, may reflect compensating balance arrangements, fee waivers and/or expense reimbursements. In the absence of compensating balance arrangements, fee waivers and/or expense reimbursements, the total return would have been lower. Past performance is no guarantee of future results. |
| 4 | As a result of an expense limitation arrangement, the ratio of expenses, other than brokerage commissions, interest, dividend expense on short sales, taxes, extraordinary expenses and acquired fund fees and expenses, to average net assets of Class A shares did not exceed 0.70%. This expense limitation arrangement cannot be terminated prior to December 31, 2013 without the Board of Trustees’ consent. |
| 5 | Reflects fee waivers and/or expense reimbursements. |
| 6 | The impact of compensating balance arrangements, if any, was less than 0.01%. |
See Notes to Financial Statements.
| | |
| 26 | | Legg Mason Investment Counsel Maryland Tax-Free Income Trust 2012 Annual Report |
Financial highlights (cont’d)
| | | | | | | | | | | | | | | | |
For a share of each class of beneficial interest outstanding throughout each year ended March 31, unless
otherwise noted: | |
| Class C Shares1 | | 2012 | | | 2011 | | | 2010 | | | 20092 | |
| | | | |
| Net asset value, beginning of year | | | $15.82 | | | | $16.50 | | | | $15.58 | | | | $15.59 | |
| | | | |
| Income (loss) from operations: | | | | | | | | | | | | | | | | |
Net investment income | | | 0.54 | | | | 0.54 | | | | 0.52 | | | | 0.07 | |
Net realized and unrealized gain (loss) | | | 1.17 | | | | (0.68) | | | | 0.94 | | | | 0.01 | |
Total income (loss) from operations | | | 1.71 | | | | (0.14) | | | | 1.46 | | | | 0.08 | |
| | | | |
| Less distributions from: | | | | | | | | | | | | | | | | |
Net investment income | | | (0.54) | | | | (0.54) | | | | (0.54) | | | | (0.09) | |
Total distributions | | | (0.54) | | | | (0.54) | | | | (0.54) | | | | (0.09) | |
| | | | |
| Net asset value, end of year | | | $16.99 | | | | $15.82 | | | | $16.50 | | | | $15.58 | |
Total return3 | | | 10.96 | % | | | (0.90) | % | | | 9.44 | % | | | 0.53 | % |
| | | | |
| Net assets, end of year (000s) | | | $33,068 | | | | $28,186 | | | | $21,000 | | | | $1,965 | |
| | | | |
| Ratios to average net assets: | | | | | | | | | | | | | | | | |
Gross expenses | | | 1.45 | % | | | 1.43 | % | | | 1.52 | % | | | 1.99 | %4 |
Net expenses5,6,7 | | | 1.24 | | | | 1.21 | | | | 1.20 | | | | 1.17 | 4 |
Net investment income | | | 3.27 | | | | 3.31 | | | | 3.22 | | | | 3.51 | 4 |
| | | | |
| Portfolio turnover rate | | | 4 | % | | | 15 | % | | | 6 | % | | | 8 | % |
| 1 | Per share amounts have been calculated using the average shares method. |
| 2 | For the period February 5, 2009 (inception date) to March 31, 2009. |
| 3 | Performance figures, exclusive of CDSC, may reflect compensating balance arrangements, fee waivers and/or expense reimbursements. In the absence of compensating balance arrangements, fee waivers and/or expense reimbursements, the total return would have been lower. Past performance is no guarantee of future results. Total returns for periods of less than one year are not annualized. |
| 5 | As a result of an expense limitation arrangement, the ratio of expenses, other than brokerage commissions, interest, dividend expense on short sales, taxes, extraordinary expenses and acquired fund fees and expenses, to average net assets of Class C shares did not exceed 1.25%. This expense limitation arrangement cannot be terminated prior to December 31, 2013 without the Board of Trustees’ consent. |
| 6 | Reflects fee waivers and/or expense reimbursements. |
| 7 | The impact of compensating balance arrangements, if any, was less than 0.01%. |
See Notes to Financial Statements.
| | | | |
| Legg Mason Investment Counsel Maryland Tax-Free Income Trust 2012 Annual Report | | | 27 | |
| | | | | | | | | | | | | | | | |
For a share of each class of beneficial interest outstanding throughout each year ended March 31, unless
otherwise noted: | |
| Class I Shares1,2 | | 2012 | | | 2011 | | | 2010 | | | 20093 | |
| | | | |
| Net asset value, beginning of year | | | $15.82 | | | | $16.51 | | | | $15.58 | | | | $15.83 | |
| | | | |
| Income (loss) from operations: | | | | | | | | | | | | | | | | |
Net investment income | | | 0.67 | | | | 0.67 | | | | 0.66 | | | | 0.47 | |
Net realized and unrealized gain (loss) | | | 1.18 | | | | (0.69) | | | | 0.94 | | | | (0.24) | |
Total income (loss) from operations | | | 1.85 | | | | (0.02) | | | | 1.60 | | | | 0.23 | |
| | | | |
| Less distributions from: | | | | | | | | | | | | | | | | |
Net investment income | | | (0.67) | | | | (0.67) | | | | (0.67) | | | | (0.48) | |
Total distributions | | | (0.67) | | | | (0.67) | | | | (0.67) | | | | (0.48) | |
| | | | |
| Net asset value, end of year | | | $17.00 | | | | $15.82 | | | | $16.51 | | | | $15.58 | |
Total return4 | | | 11.90 | % | | | (0.21) | % | | | 10.38 | % | | | 1.58 | % |
| | | | |
| Net assets, end of year (000s) | | | $20,632 | | | | $12,815 | | | | $8,221 | | | | $3,296 | |
| | | | |
| Ratios to average net assets: | | | | | | | | | | | | | | | | |
Gross expenses | | | 0.71 | % | | | 0.78 | % | | | 0.90 | % | | | 1.22 | %5 |
Net expenses6,7,8 | | | 0.45 | | | | 0.45 | | | | 0.45 | | | | 0.45 | 5 |
Net investment income | | | 4.04 | | | | 4.08 | | | | 4.04 | | | | 4.72 | 5 |
| | | | |
| Portfolio turnover rate | | | 4 | % | | | 15 | % | | | 6 | % | | | 8 | % |
| 1 | Effective October 5, 2009, Institutional Class shares were renamed as Class I shares. |
| 2 | Per share amounts have been calculated using the average shares method. |
| 3 | For the period July 30, 2008 (inception date) to March 31, 2009. |
| 4 | Performance figures may reflect compensating balance arrangements, fee waivers and/or expense reimbursements. In the absence of compensating balance arrangements, fee waivers and/or expense reimbursements, the total return would have been lower. Past performance is no guarantee of future results. Total returns for periods of less than one year are not annualized. |
| 6 | As a result of an expense limitation arrangement, the ratio of expenses, other than brokerage commissions, interest, dividend expense on short sales, taxes, extraordinary expenses and acquired fund fees and expenses, to average net assets of Class I shares did not exceed 0.45%. This expense limitation arrangement cannot be terminated prior to December 31, 2013 without the Board of Trustees’ consent. |
| 7 | Reflects fee waivers and/or expense reimbursements. |
| 8 | The impact of compensating balance arrangements, if any, was less than 0.01%. |
See Notes to Financial Statements.
| | |
| 28 | | Legg Mason Investment Counsel Maryland Tax-Free Income Trust 2012 Annual Report |
Notes to financial statements
1. Organization and significant accounting policies
Legg Mason Investment Counsel Maryland Tax-Free Income Trust (the “Fund”) is a separate non-diversified investment series of Legg Mason Tax-Free Income Fund (the “Trust”). The Trust, a Massachusetts business trust, is registered under the Investment Company Act of 1940, as amended (the “1940 Act”), as an open-end management investment company.
The following are significant accounting policies consistently followed by the Fund and are in conformity with U.S. generally accepted accounting principles (“GAAP”). Estimates and assumptions are required to be made regarding assets, liabilities and changes in net assets resulting from operations when financial statements are prepared. Changes in the economic environment, financial markets and any other parameters used in determining these estimates could cause actual results to differ. Subsequent events have been evaluated through the date the financial statements were issued.
(a) Investment valuation. The valuations for fixed income securities (which may include, but are not limited to, corporate, government, municipal, mortgage-backed, collateralized mortgage obligations and asset-backed securities) and certain derivative instruments are typically the prices supplied by independent third party pricing services, which may use market prices or broker/dealer quotations or a variety of valuation techniques and methodologies. The independent third party pricing services’ internal models use inputs that are observable such as issuer details, interest rates, yield curves, prepayment speeds, credit risks/ spreads, default rates and quoted prices for similar securities. Short-term fixed income securities that will mature in 60 days or less are valued at amortized cost, unless it is determined that using this method would not reflect an investment’s fair value. If independent third party pricing services are unable to supply prices for a portfolio investment, or if the prices supplied are deemed by the manager to be unreliable, the market price may be determined by the manager using quotations from one or more broker/dealers or at the transaction price if the security has recently been purchased and no value has yet been obtained from a pricing service or pricing broker. When reliable prices are not readily available, such as when the value of a security has been significantly affected by events after the close of the exchange or market on which the security is principally traded, but before the Fund calculates its net asset value, the Fund values these securities as determined in accordance with procedures approved by the Fund’s Board of Trustees.
The Board of Trustees is responsible for the valuation process and has delegated the supervision of the daily valuation process to the Legg Mason North American Fund Valuation Committee (the “Valuation Committee”). The Valuation Committee, pursuant to the policies adopted by the Board of Trustees, is responsible for making fair value determinations, evaluating the effectiveness of the Fund’s pricing policies, and reporting to the Board of Trustees. When determining the reliability of third party pricing information for investments owned by the Fund, the Valuation Committee, among other things, conducts due diligence reviews of pricing vendors, monitors the daily change in prices and reviews transactions among market participants.
| | | | |
| Legg Mason Investment Counsel Maryland Tax-Free Income Trust 2012 Annual Report | | | 29 | |
The Valuation Committee will consider pricing methodologies it deems relevant and appropriate when making fair value determinations. Examples of possible methodologies include, but are not limited to, multiple of earnings; discount from market of a similar freely traded security; discounted cash-flow analysis; book value or a multiple thereof; risk premium/yield analysis; yield to maturity; and/or fundamental investment analysis. The Valuation Committee will also consider factors it deems relevant and appropriate in light of the facts and circumstances. Examples of possible factors include, but are not limited to, the type of security; the issuer’s financial statements; the purchase price of the security; the discount from market value of unrestricted securities of the same class at the time of purchase; analysts’ research and observations from financial institutions; information regarding any transactions or offers with respect to the security; the existence of merger proposals or tender offers affecting the security; the price and extent of public trading in similar securities of the issuer or comparable companies; and the existence of a shelf registration for restricted securities.
For each portfolio security that has been fair valued pursuant to the policies adopted by the Board of Trustees, the fair value price is compared against the last available and next available market quotations. The Valuation Committee reviews the results of such back testing monthly and fair valuation occurrences are reported to the Board of Trustees quarterly.
The Fund uses valuation techniques to measure fair value that are consistent with the market approach and/or income approach, depending on the type of security and the particular circumstance. The market approach uses prices and other relevant information generated by market transactions involving identical or comparable securities. The income approach uses valuation techniques to discount estimated future cash flows to present value.
GAAP establishes a disclosure hierarchy that categorizes the inputs to valuation techniques used to value assets and liabilities at measurement date. These inputs are summarized in the three broad levels listed below:
| Ÿ | | Level 1 — quoted prices in active markets for identical investments |
| Ÿ | | Level 2 — other significant observable inputs (including quoted prices for similar investments, interest rates, prepayment speeds, credit risk, etc.) |
| Ÿ | | Level 3 — significant unobservable inputs (including the Fund’s own assumptions in determining the fair value of investments) |
The inputs or methodology used for valuing securities are not necessarily an indication of the risk associated with investing in those securities.
| | |
| 30 | | Legg Mason Investment Counsel Maryland Tax-Free Income Trust 2012 Annual Report |
Notes to financial statements (cont’d)
The following is a summary of the inputs used in valuing the Fund’s assets carried at fair value:
| | | | | | | | | | | | | | | | |
| ASSETS | |
| Description | | Quoted Prices
(Level 1) | | | Other Significant
Observable Inputs
(Level 2) | | | Significant
Unobservable
Inputs
(Level 3) | | | Total | |
| Municipal bonds† | | | — | | | $ | 182,690,736 | | | | — | | | $ | 182,690,736 | |
| Short-term investments† | | | — | | | | 18,950,000 | | | | — | | | | 18,950,000 | |
| Total investments | | | — | | | $ | 201,640,736 | | | | — | | | $ | 201,640,736 | |
| † | See Schedule of Investments for additional detailed categorizations. |
(b) Concentration risk. The Fund invests substantially all of its assets in securities issued by or on behalf of the State of Maryland, its political subdivisions, municipalities, agencies, instrumentalities, and public authorities. Changes in economic conditions in, or governmental policies of, the State of Maryland could have a significant impact on the performance of the Fund.
The Fund may focus a significant amount of its investments in a single sector of the municipal securities market. In doing so, the Fund is more susceptible to factors adversely affecting that sector than a fund not following that practice.
The Fund may invest a significant portion of assets in securities issued by local governments or public authorities that are rated according to their particular creditworthiness, which may vary significantly from the state’s general obligations. The value of the Fund’s shares will be more susceptible to being materially impacted by a single economic, political or regulatory event affecting those issuers or their securities than shares of a diversified fund.
(c) Security transactions and investment income. Security transactions are accounted for on a trade date basis. Interest income, adjusted for amortization of premium and accretion of discount, is recorded on the accrual basis. The cost of investments sold is determined by use of the specific identification method. To the extent any issuer defaults or a credit event occurs that impacts the issuer, the Fund may halt any additional interest income accruals and consider the realizability of interest accrued up to the date of default or credit event.
(d) Distributions to shareholders. Distributions from net investment income of the Fund are declared each business day to shareholders of record, and are paid monthly. The Fund intends to satisfy conditions that will enable interest from municipal securities, which is exempt from federal and certain state income taxes, to retain such tax-exempt status when distributed to the shareholders of the Fund. Distributions of net realized gains, if any, are taxable and are declared at least annually. Distributions to shareholders of the Fund are recorded on the ex-dividend date and are determined in accordance with income tax regulations, which may differ from GAAP.
(e) Share class accounting. Investment income, common expenses and realized/unrealized gains (losses) on investments are allocated to the various classes of the Fund on the basis of daily net assets of each class. Fees relating to a specific class are charged directly to that share class.
| | | | |
| Legg Mason Investment Counsel Maryland Tax-Free Income Trust 2012 Annual Report | | | 31 | |
(f) Compensating balance arrangements. The Fund has an arrangement with its custodian bank whereby a portion of the custodian’s fees is paid indirectly by credits earned on the Fund’s cash on deposit with the bank.
(g) Federal and other taxes. It is the Fund’s policy to comply with the federal income and excise tax requirements of the Internal Revenue Code of 1986 (the “Code”), as amended, applicable to regulated investment companies. Accordingly, the Fund intends to distribute its taxable income and net realized gains, if any, to shareholders in accordance with timing requirements imposed by the Code. Therefore, no federal or state income tax provision is required in the Fund’s financial statements.
Management has analyzed the Fund’s tax positions taken on income tax returns for all open tax years and has concluded that as of March 31, 2012, no provision for income tax is required in the Fund’s financial statements. The Fund’s federal and state income and federal excise tax returns for tax years for which the applicable statutes of limitations have not expired are subject to examination by Internal Revenue Service and state departments of revenue.
(h) Reclassification. GAAP requires that certain components of net assets be reclassified to reflect permanent differences between financial and tax reporting. These reclassifications have no effect on net assets or net asset value per share. During the current year, the Fund had no reclassifications.
2. Investment management agreement and other transactions with affiliates
Legg Mason Partners Fund Advisor, LLC (“LMPFA”) is the Fund’s investment manager and Legg Mason Investment Counsel, LLC (“LMIC”) is the Fund’s subadviser. LMPFA and LMIC are wholly-owned subsidiaries of Legg Mason, Inc. (“Legg Mason”).
Under the investment management agreement, the Fund pays an investment management fee, calculated daily and paid monthly, at an annual rate of 0.55% of the Fund’s average daily net assets.
LMIC serves as investment adviser to the Fund pursuant to a sub-advisory agreement with LMPFA. LMPFA (not the Fund) pays LMIC a fee, computed daily and payable monthly, at an annual rate of 0.50% of the Fund’s average daily net assets, net of any fee waivers and/or expense reimbursements.
As a result of expense limitation arrangements between the Fund and LMPFA, the ratio of expenses other than brokerage commissions, interest, dividend expense on short sales, taxes, extraordinary expenses and acquired fund fees and expenses, to average net assets of Class A, Class C and Class I shares did not exceed 0.70%, 1.25% and 0.45%, respectively. These expense limitation arrangements cannot be terminated prior to December 31, 2013 without the Board of Trustees’ consent.
During the year ended March 31, 2012, fees waived and/or expenses reimbursed amounted to $416,951.
| | |
| 32 | | Legg Mason Investment Counsel Maryland Tax-Free Income Trust 2012 Annual Report |
Notes to financial statements (cont’d)
The investment manager is permitted to recapture amounts waived or reimbursed to a class within three years after the year in which the investment manager earned the fee or incurred the expense if the class’ total annual operating expenses have fallen to a level below the expense limitation (“expense cap”) in effect at the time the fees were earned or the expenses incurred. In no case will the investment manager recapture any amount that would result, on any particular business day of the Fund, in the class’ total annual operating expenses exceeding the expense cap or any other lower limit then in effect.
Pursuant to these arrangements, at March 31, 2012, the Fund had remaining fee waivers and/or expense reimbursements subject to recapture by LMPFA and respective dates of expiration as follows:
| | | | | | | | | | | | |
| | | Class A | | | Class C | | | Class I | |
| Expires March 31, 2013 | | $ | 375,161 | | | $ | 37,313 | | | $ | 28,403 | |
| Expires March 31, 2014 | | | 355,243 | | | | 59,025 | | | | 37,384 | |
| Expires March 31, 2015 | | | 309,086 | | | | 62,819 | | | | 45,046 | |
| Fee waivers/expense reimbursements subject to recapture | | $ | 1,039,490 | | | $ | 159,157 | | | $ | 110,833 | |
During the year ended March 31, 2012, LMPFA did not recapture any fees.
Legg Mason Investor Services, LLC (“LMIS”), a wholly-owned broker-dealer subsidiary of Legg Mason, serves as the Fund’s sole and exclusive distributor.
There is a maximum initial sales charge of 4.25% for Class A shares. There is a contingent deferred sales charge (“CDSC”) of 1.00% on Class C shares, which applies if redemption occurs within one year from purchase payment. In certain cases, Class A shares have a 1.00% CDSC, which applies if redemption occurs within one year from purchase payment. This CDSC only applies to those purchases of Class A shares, which, when combined with current holdings of other shares of funds sold by LMIS, equal or exceed $1,000,000 in the aggregate. These purchases do not incur an initial sales charge.
For the year ended March 31, 2012, LMIS and its affiliates received sales charges of approximately $18,000 on sales of the Fund’s Class A shares. In addition, for the year ended March 31, 2012, CDSCs paid to LMIS and its affiliates were approximately:
| | | | | | | | |
| | | Class A | | | Class C | |
| CDSCs | | $ | 0 | * | | $ | 3,000 | |
| * | Amount represents less than $1,000. |
Under a Deferred Compensation Plan (the “Plan”), Trustees may elect to defer receipt of all or a specified portion of their compensation. A participating Trustee may select one or more funds managed by affiliates of Legg Mason in which his or her deferred trustee’s fees will be deemed to be invested. Deferred amounts remain in the Fund until distributed in accordance with the Plan.
All officers and two Trustees of the Trust are employees of Legg Mason or its affiliates and do not receive compensation from the Trust.
| | | | |
| Legg Mason Investment Counsel Maryland Tax-Free Income Trust 2012 Annual Report | | | 33 | |
3. Investments
During the year ended March 31, 2012, the aggregate cost of purchases and proceeds from sales of investments (excluding short-term investments) were as follows:
| | | | |
| Purchases | | $ | 7,394,773 | |
| Sales | | | 14,724,897 | |
At March 31, 2012, the aggregate gross unrealized appreciation and depreciation of investments for federal income tax purposes were as follows:
| | | | |
| Gross unrealized appreciation | | $ | 16,449,233 | |
| Gross unrealized depreciation | | | — | |
| Net unrealized appreciation | | $ | 16,449,233 | |
4. Derivative instruments and hedging activities
Financial Accounting Standards Board Codification Topic 815 requires enhanced disclosure about an entity’s derivative and hedging activities.
During the year ended March 31, 2012, the Fund did not invest in any derivative instruments.
5. Class specific expenses, waivers and/or expense reimbursements
The Fund has adopted Rule 12b-1 distribution plans and under those plans the Fund pays a service fee with respect to its Class A and Class C shares calculated at the annual rate of 0.15% and 0.25% of the average daily net assets of each respective class. The Fund also pays a distribution fee with respect to its Class C shares calculated at the annual rate of 0.45% of the average daily net assets of its Class C shares. Service and distribution fees are accrued daily and paid monthly.
For the year ended March 31, 2012, class specific expenses were as follows:
| | | | | | | | |
| | | Service and/or
Distribution Fees | | | Transfer Agent
Fees | |
| Class A | | $ | 219,506 | | | $ | 54,520 | |
| Class C | | | 208,963 | | | | 26,132 | |
| Class I | | | — | | | | 8,181 | |
| Total | | $ | 428,469 | | | $ | 88,833 | |
For the year ended March 31, 2012, waivers and/or expense reimbursements by class were as follows:
| | | | |
| | | Waivers/Expense
Reimbursements | |
| Class A | | $ | 309,086 | |
| Class C | | | 62,819 | |
| Class I | | | 45,046 | |
| Total | | $ | 416,951 | |
| | |
| 34 | | Legg Mason Investment Counsel Maryland Tax-Free Income Trust 2012 Annual Report |
Notes to financial statements (cont’d)
6. Line of credit
The Fund, along with certain other Legg Mason Funds, participates in a $200 million line of credit (“Credit Agreement”) to be used for temporary or emergency purposes. This 364-day revolving Credit Agreement matures on February 28, 2013. Pursuant to the Credit Agreement, each participating fund is liable only for principal and interest payments related to borrowings made by that fund. Borrowings under the Credit Agreement bear interest at a rate equal to the prevailing LIBOR rate plus the LIBOR rate margin. The Fund did not utilize the line of credit during the year ended March 31, 2012.
7. Distributions to shareholders by class
| | | | | | | | |
| | | Year Ended
March 31, 2012 | | | Year Ended
March 31, 2011 | |
| Net Investment Income: | |
| Class A | | $ | 5,675,776 | | | $ | 6,388,169 | |
| Class C | | | 976,452 | | | | 898,715 | |
| Class I | | | 708,728 | | | | 462,929 | |
| Total | | $ | 7,360,956 | | | $ | 7,749,813 | |
8. Shares of beneficial interest
At March 31, 2012, the Trust had an unlimited number of shares of beneficial interest authorized with a par value of $0.001 per share. The Fund has the ability to issue multiple classes of shares. Each class of shares represents an identical interest and has the same rights, except that each class bears certain direct expenses, including those specifically related to the distribution of its shares.
Transactions in shares of each class were as follows:
| | | | | | | | | | | | | | | | |
| | | Year Ended
March 31, 2012 | | | Year Ended
March 31, 2011 | |
| | | Shares | | | Amount | | | Shares | | | Amount | |
| Class A | | | | | | | | | | | | | | | | |
| Shares sold | | | 670,711 | | | $ | 11,188,046 | | | | 953,704 | | | $ | 15,798,472 | |
| Shares issued on reinvestment | | | 322,617 | | | | 5,358,368 | | | | 361,143 | | | | 5,942,046 | |
| Shares repurchased | | | (1,365,954) | | | | (22,484,969) | | | | (2,304,579) | | | | (37,638,646) | |
| Net decrease | | | (372,626) | | | $ | (5,938,555) | | | | (989,732) | | | $ | (15,898,128) | |
| | | | |
| Class C | | | | | | | | | | | | | | | | |
| Shares sold | | | 455,927 | | | $ | 7,609,261 | | | | 742,077 | | | $ | 12,308,552 | |
| Shares issued on reinvestment | | | 50,997 | | | | 847,302 | | | | 47,224 | | | | 775,286 | |
| Shares repurchased | | | (342,778) | | | | (5,666,949) | | | | (280,102) | | | | (4,532,070) | |
| Net increase | | | 164,146 | | | $ | 2,789,614 | | | | 509,199 | | | $ | 8,551,768 | |
| | | | |
| Class I | | | | | | | | | | | | | | | | |
| Shares sold | | | 613,124 | | | $ | 10,144,941 | | | | 507,235 | | | $ | 8,392,344 | |
| Shares issued on reinvestment | | | 31,901 | | | | 531,582 | | | | 16,906 | | | | 277,213 | |
| Shares repurchased | | | (241,105) | | | | (4,002,756) | | | | (212,340) | | | | (3,466,824) | |
| Net increase | | | 403,920 | | | $ | 6,673,767 | | | | 311,801 | | | $ | 5,202,733 | |
| | | | |
| Legg Mason Investment Counsel Maryland Tax-Free Income Trust 2012 Annual Report | | | 35 | |
9. Income tax information and distributions to shareholders
Subsequent to the fiscal year end, the Fund has made the following distributions per share:
| | | | | | | | | | | | |
Record Date
Payable Date | | Class A | | | Class C | | | Class I | |
Daily 4/30/2012 | | $ | 0.047122 | | | $ | 0.039339 | | | $ | 0.049695 | |
The tax character of distributions paid during the fiscal years ended March 31, was as follows:
| | | | | | | | |
| | | 2012 | | | 2011 | |
| Distributions Paid From: | | | | | | | | |
| Tax-exempt income | | $ | 7,290,167 | | | $ | 7,663,631 | |
| Ordinary income | | | 70,789 | | | | 86,182 | |
| Total distributions paid | | $ | 7,360,956 | | | $ | 7,749,813 | |
As of March 31, 2012, the components of accumulated earnings on a tax basis were as follows:
| | | | |
| Undistributed tax-exempt income — net | | $ | 82,334 | |
| Capital loss carryforward* | | | (632,485) | |
| Other book/tax temporary differences(a) | | | (60,172) | |
| Unrealized appreciation (depreciation) | | | 16,449,233 | |
| Total accumulated earnings (losses) — net | | $ | 15,838,910 | |
| * | The Fund had the following net capital loss carryforwards remaining: |
| | | | |
| Year of Expiration | | Amount | |
| No expiration | | $ | (153,265 | )** |
| 3/31/2017 | | | (479,220 | ) |
| | | $ | (632,485 | ) |
These amounts will be available to offset future taxable capital gains.
| ** | Under the Regulated Investment Company Modernization Act of 2010, the Fund is permitted to carry forward these capital losses for an unlimited period. However, these losses will be required to be utilized prior to the Fund’s other capital losses with the expiration date listed above. Additionally, these capital losses retain their character as either short-term or long-term capital losses rather than being considered all short-term as under previous law. |
| (a) | Other book/tax temporary differences are attributable primarily to book/tax differences in the timing of the deductibility of various expenses. |
10. Recent accounting pronouncement
In May 2011, the Financial Accounting Standards Board issued Accounting Standard Update No. 2011-04, Fair Value Measurement (Topic 820) — Amendments to Achieve Common Fair Value Measurement and Disclosure Requirements in U.S. GAAP and IFRSs (“ASU No. 2011-04”). ASU No. 2011-04 establishes common requirements for measuring fair value and for disclosing information about fair value measurements. ASU No. 2011-04 is effective during interim and annual periods beginning after December 15, 2011. Management has evaluated ASU No. 2011-04 and concluded that it does not materially impact the financial statement amounts; however, as required, additional disclosure has been included about fair value measurement.
| | |
| 36 | | Legg Mason Investment Counsel Maryland Tax-Free Income Trust 2012 Annual Report |
Report of independent registered public accounting firm
To the Board of Trustees of Legg Mason Tax-Free Income Fund and to the Shareholders of Legg Mason Investment Counsel Maryland Tax-Free Income Trust:
In our opinion, the accompanying statement of assets and liabilities, including the schedule of investments, and the related statements of operations and of changes in net assets and the financial highlights present fairly, in all material respects, the financial position of Legg Mason Investment Counsel Maryland Tax-Free Income Trust (comprising Legg Mason Tax-Free Income Fund, the “Fund”) at March 31, 2012, the results of its operations, the changes in its net assets, and the financial highlights for each of the periods presented, in conformity with accounting principles generally accepted in the United States of America. These financial statements and financial highlights (hereafter referred to as “financial statements”) are the responsibility of the Fund’s management; our responsibility is to express an opinion on these financial statements based on our audits. We conducted our audits of these financial statements in accordance with the standards of the Public Company Accounting Oversight Board (United States). Those standards require that we plan and perform the audit to obtain reasonable assurance about whether the financial statements are free of material misstatement. An audit includes examining, on a test basis, evidence supporting the amounts and disclosures in the financial statements, assessing the accounting principles used and significant estimates made by management, and evaluating the overall financial statement presentation. We believe that our audits, which included confirmation of securities at March 31, 2012 by correspondence with the custodian and brokers, provide a reasonable basis for our opinion.
PricewaterhouseCoopers LLP
Baltimore, Maryland
May 21, 2012
| | | | |
| Legg Mason Investment Counsel Maryland Tax-Free Income Trust | | | 37 | |
Board approval of investment advisory and management agreement and sub-advisory agreement (unaudited)
At its November 2011 meeting, the Fund’s Board of Trustees (the “Board”) approved the continuation of the investment advisory and management agreement (the “Management Agreement”) with Legg Mason Partners Fund Advisor, LLC (the “Manager”) and the sub-advisory agreement (the “Sub-Advisory Agreement”) with Legg Mason Investment Counsel, LLC (the “Adviser”). The Trustees who are not “interested persons” of the Fund (as defined in the Investment Company Act of 1940, as amended (the “1940 Act”)) (the “Independent Trustees”), met on October 12, 2011, with the assistance of their independent legal counsel and their contract review consultant, to review and evaluate the materials provided by the Manager and the Adviser to assist the Board, and in particular the Independent Trustees, in considering renewal of the Management and Sub-Advisory Agreements, respectively. At such October meeting the Independent Trustees reviewed the information provided, as well as a memorandum from their independent legal counsel and materials from the contract review consultant. The Independent Trustees further discussed renewal of the Management and Sub-Advisory Agreements in executive session held on November 16, 2011.
In voting to approve continuance of the Agreements, the Board, including the Independent Trustees, considered whether continuance of the Agreements would be in the best interests of the Fund and its shareholders. No single factor or item of information reviewed by the Board was identified as the principal factor in determining whether to approve the Management Agreement and the Sub-Advisory Agreement. Based upon its evaluation of all material factors, including those described below, the Board concluded that the terms of each Agreement are reasonable and fair and that it was in the best interest of the Fund and its shareholders to approve continuance of the Agreements.
The Board received and considered information regarding the nature, extent and quality of services provided to the Fund by the Manager and the Adviser, under the Management and Sub-Advisory Agreements, respectively. The Board also considered the Manager’s supervisory activities over the Adviser. In addition, the Board received and considered other information regarding the administrative and other services rendered to the Fund and its shareholders by the Manager and its affiliates. The Board noted information received at regular meetings throughout the year related to the services rendered by the Manager in its management of the Fund’s affairs and the Manager’s role in coordinating the activities of the Adviser and the Fund’s other service providers. The Board’s evaluation of the services provided by the Manager and the Adviser took into account the Board’s knowledge and familiarity gained as Board members of funds in the Legg Mason fund complex, including the scope and quality of the investment management and other capabilities of the Manager and the Adviser and the quality of the Manager’s administrative and other services. The Board observed that the scope of services provided by the Manager had expanded over time as a result of regulatory and other developments, including maintaining and monitoring its own and the Fund’s expanded compliance programs.
| | |
| 38 | | Legg Mason Investment Counsel Maryland Tax-Free Income Trust |
Board approval of investment advisory and management agreement and sub-advisory agreement (unaudited) (cont’d)
The Board reviewed the qualifications, backgrounds and responsibilities of the senior personnel serving the Fund and the portfolio management team primarily responsible for the day-to-day portfolio management of the Fund. The Board also considered, based on its knowledge of the Manager and the Manager’s affiliates, the financial resources available through the Manager’s parent organization, Legg Mason, Inc.
The Board considered the division of responsibilities between the Manager and the Adviser and the oversight provided by the Manager. The Board also considered the Adviser’s brokerage policies and practices.
The Board received and reviewed performance information for the Fund and for a group of funds (the “Performance Universe”) selected by Lipper, Inc. (“Lipper”), an independent provider of investment company data. The Board was provided with a description of the methodology Lipper used to determine the similarity of the Fund to the funds included in the Performance Universe. The Lipper data also included a comparison of the Fund’s performance to a benchmark index selected by Lipper. The Board also received from the contract review consultant analysis of the risk adjusted performance of the Fund compared with its corresponding Lipper benchmark index. The Board also reviewed performance information for the Fund showing rolling returns based upon trailing performance. In addition, the Trustees noted that they also had received and discussed at periodic intervals information comparing the Fund’s performance to that of its benchmark index.
The Board noted the Fund’s underperformance for the one-year period ended June 30, 2011, which placed it in the fifth quintile, and noted the outstanding longer term performance history of the Fund, which as of June 30, 2011 placed the Fund in the first quintile for each of the 3, 5 and 10 year periods. The Board noted that its evaluation of the factors of the nature, extent and quality of services and investment performance led it to conclude that it was in the best interest of the Fund to approve renewal of the Agreement.
The Board reviewed and considered, the contractual management fee (the “Contractual Management Fee”) payable by the Fund to the Manager in light of the nature, extent and quality of the management and advisory services provided by the Manager and the Adviser, respectively. The Board noted that the Manager, and not the Fund, pays the fee to the Adviser. In addition, the Board reviewed and considered the actual management fee rate (after taking into account fees waived and expense reimbursements by the Manager which partially reduced the management fee paid to the Manager) (“Actual Management Fee”).
The Board also reviewed information regarding the fees the Manager and the Adviser charged any of their U.S. clients investing primarily in an asset class similar to that of the Fund including, where applicable, separate accounts. The Manager reviewed with the Board the significant differences in the scope of services provided to the Fund and to such other clients, and the Board considered that the Manager coordinates and oversees the provision of services to the Fund by other fund service providers, including the Adviser. The Board considered the fee comparisons in light of the scope of services required to manage these different types of accounts.
| | | | |
| Legg Mason Investment Counsel Maryland Tax-Free Income Trust | | | 39 | |
The Board received an analysis of complex-wide management fees provided by the Manager, which, among other things, set out the range of fees based on asset classes. In addition, the Manager provided and discussed with the Board a comparison with the fees of other registered investment companies managed by affiliated advisers in the same investment style. Management also discussed with the Board the Fund’s distribution arrangements, including how amounts received by the Fund’s distributors are expended.
Additionally, the Board received and considered information comparing the Fund’s Contractual Management Fee and Actual Management Fee and the Fund’s overall expense ratio with those of a group of funds selected by Lipper as comparable to the Fund and a broader universe of funds also selected by Lipper. With respect to the Fund, the Board noted that Contractual and Actual Management Fees were competitive (third quintile and first quintile, respectively) and that actual expenses were lower than the Lipper expense group and expense universe averages.
The Board was provided an overview of the process followed in conducting the profitability study and received a report on the profitability of Legg Mason in providing services to the Fund, based on financial information and business data for the 12 months ended March 31, 2011, which corresponds to Legg Mason’s most recently completed fiscal year. The Trustees considered the profitability study along with the other materials previously provided to the Board and determined that the profitability was not excessive in light of the nature, extent and quality of the services provided to the Fund.
The Board received and considered information regarding whether there have been economies of scale with respect to the management of the Fund as the Fund’s assets grow, whether the Fund has appropriately benefited from any economies of scale, and whether there is potential for realization of any further economies of scale. The Board noted that as a result of market conditions and net redemptions, the Fund complex had suffered a substantial decline in assets over its historic highs. Given the asset size of the Fund and the complex, the Board concluded that although there are currently no breakpoints, any economies of scale currently being realized were appropriately being reflected in the Management Fee paid by the Fund.
The Board considered other benefits received by the Manager and its affiliates, as a result of the Manager’s relationship with the Fund, including the opportunity to offer additional products and services to Fund shareholders. The Board also considered the information provided by the Manager regarding intermediary arrangements.
In light of the structure of the fees, the costs of providing investment management and other services to the Fund, the Manager’s ongoing commitment to the Fund and the ancillary benefits received, the Board concluded that the Management Fees were reasonable.
After evaluation of all material factors, the Board concluded that the continuation of each Agreement is in the best interest of the Fund.
| | |
| 40 | | Legg Mason Investment Counsel Maryland Tax-Free Income Trust |
Additional information (unaudited)
Information about Trustees and Officers
The business and affairs of Legg Mason Investment Counsel Maryland Tax-Free Income Trust (the “Fund”) are conducted by management under the supervision and subject to the direction of its Board of Trustees. The business address of each Trustee is 100 International Drive, Attn: Fund Secretary, Baltimore, Maryland 21202. Information pertaining to the Trustees and officers of the Fund is set forth below.
The Statement of Additional Information includes additional information about Trustees and is available, without charge, upon request by calling the Fund at 1-877-721-1926.
| | |
| Independent Trustees1 |
| Ruby P. Hearn |
| Year of birth | | 1940 |
| Position with Trust | | Trustee |
| Term of office and length of time servedA | | Since 2004 |
| Principal occupation(s) during past five years | | Senior Vice President Emerita of The Robert Wood Johnson Foundation (non-profit) since 2001; Trustee of the New York Academy of Medicine since 2004; Director of the Institute for Healthcare Improvement since 2002; Member of the Institute of Medicine since 1982; formerly: Senior Vice President of The Robert Wood Johnson Foundation (1996 to 2001); Fellow of The Yale Corporation (1992 to 1998). |
| Number of funds in fund complex overseen by Trustee | | 14 |
| Other directorships held by Trustee | | None |
| Arnold L. Lehman |
| Year of birth | | 1944 |
| Position with Trust | | Lead Independent Trustee |
| Term of office and length of time served2 | | Since 1990 |
| Principal occupation(s) during past five years | | Director of the Brooklyn Museum since 1997; Trustee of American Federation of Arts since 1998. Formerly: Director of The Baltimore Museum of Art (1979-1997). |
| Number of funds in fund complex overseen by Trustee | | 14 |
| Other directorships held by Trustee | | None |
| Robin J.W. Masters |
| Year of birth | | 1955 |
| Position with Trust | | Trustee |
| Term of office and length of time served2 | | Since 2002 |
| Principal occupation(s) during past five years | | Retired; formerly: Chief Investment Officer of ACE Limited (insurance) (1986 to 2000). |
| Number of funds in fund complex overseen by Trustee | | 14 |
| Other directorships held by Trustee | | Director of Cheyne Capital International Limited (investment advisory firm). Director/Trustee of Legg Mason Institutional Funds plc, WA Fixed Income Funds plc and Western Asset Debt Securities Fund plc. |
| | | | |
| Legg Mason Investment Counsel Maryland Tax-Free Income Trust | | | 41 | |
| | |
| Independent Trustees1 cont’d |
| Jill E. McGovern |
| Year of birth | | 1944 |
| Position with Trust | | Trustee |
| Term of office and length of time served2 | | Since 1990 |
| Principal occupation(s) during past five years | | Senior Consultant, American Institute for Contemporary German Studies (AICGS) since 2007; formerly: Chief Executive Officer of The Marrow Foundation (non-profit) (1993 to 2007); Executive Director of the Baltimore International Festival (1991 to 1993); Senior Assistant to the President of The Johns Hopkins University (1986 to 1990). |
| Number of funds in fund complex overseen by Trustee | | 14 |
| Other directorships held by Trust | | Director of International Biomedical Research Alliance; Director of Lois Roth Endowment |
| Arthur S. Mehlman |
| Year of birth | | 1942 |
| Position with Trust | | Trustee |
| Term of office and length of time served2 | | Since 2002 |
| Principal occupation(s) during past five years | | Retired. Director, The University of Maryland Foundation since 1992; Director, The League for People with Disabilities since 2003; formerly: Partner, KPMG LLP (international accounting firm) (1972 to 2002). |
| Number of funds in fund complex overseen by Trustee | | Director/Trustee of all Legg Mason Funds consisting of 14 portfolios; Director/Trustee of the Royce Family of Funds consisting of 35 portfolios. |
| Other directorships held by Trustee | | Director of Municipal Mortgage & Equity, LLC. |
| G. Peter O’Brien |
| Year of birth | | 1945 |
| Position with Trust | | Trustee |
| Term of office and length of time served2 | | Since 1999 |
| Principal occupation(s) during past five years | | Retired. Trustee Emeritus of Colgate University; Board Member, Hill House, Inc. (residential home care); Board Member, Bridges School (pre- school); formerly: Managing Director, Equity Capital Markets Group of Merrill Lynch & Co. (1971-1999). |
| Number of funds in fund complex overseen by Trustee | | Director/Trustee of all Legg Mason funds consisting of 14 portfolios; Director/Trustee of the Royce Family of Funds consisting of 35 portfolios. |
| Other directorships held by Trustee | | Director of Technology Investment Capital Corp. |
| | |
| 42 | | Legg Mason Investment Counsel Maryland Tax-Free Income Trust |
Additional information (unaudited) (cont’d)
Information about Trustees and Officers
| | |
| Independent Trustees1 cont’d |
| S. Ford Rowan |
| Year of birth | | 1943 |
| Position with Trust | | Trustee |
| Term of office and length of time served2 | | Since 2002 |
| Principal occupation(s) during past five years | | Chairman, National Center for Critical Incident Analysis, National Defense University Foundation, since 2004; Trustee, St. John’s College, since 2006; formerly: Consultant, Rowan & Blewitt Inc. (management consulting) (1984 to 2007); Lecturer in Journalism, Northwestern University (1980 to 1993); Lecturer in Organizational Sciences, George Washington University (2000 to 2008); Director, Sante Fe Institute (1999 to 2008). |
| Number of funds in fund complex overseen by Trustee | | 14 |
| Other directorships held by Trustee | | None |
| Robert M. Tarola |
| Year of birth | | 1950 |
| Position with Trust | | Trustee |
| Term of office and length of time served2 | | Since 2004 |
| Principal occupation(s) during past five years | | President of Right Advisory LLC (corporate finance and governance consulting) since 2008; Member, Investor Advisory Group of the Public Company Accounting Oversight Board since 2009; Senior Vice President and Chief Financial Officer of The Howard University since 2010 (higher education and health care); formerly: Senior Vice President and Chief Financial Officer of W.R. Grace & Co. (specialty chemicals) (1999 to 2008) and MedStar Health, Inc. (healthcare) (1996 to 1999); Partner, Price Waterhouse, LLP (accounting and auditing) (1984 to 1996). |
| Number of funds in fund complex overseen by Trustee | | 14 |
| Other directorships held by Trustee | | Director of TeleTech Holdings, Inc. (business process outsourcing); Director of American Kidney Fund (renal disease assistance) |
| | | | |
| Legg Mason Investment Counsel Maryland Tax-Free Income Trust | | | 43 | |
| | |
| Interested Trustees3 |
| Mark R. Fetting |
| Year of birth | | 1954 |
| Position with Trust | | Chairman and Trustee |
| Term of office and length of time served2 | | Trustee since 2002 and Chairman since 2008 |
| Principal occupation(s) during past five years | | President, CEO, Chairman and Director of Legg Mason, Inc. and Chairman of Legg Mason Funds since 2008; formerly: President of all Legg Mason Funds (2001-2008). Senior Executive Vice President of Legg Mason, Inc., Director and/or officer of various Legg Mason, Inc. affiliates (2000-2008). Division President and Senior Officer of Prudential Financial Group, Inc. and related companies, including fund boards and consulting services to subsidiary companies (1991-2000) |
| Number of funds in fund complex overseen by Trustee | | Chairman and Director/Trustee of all Legg Mason Funds consisting of 14 portfolios; Director/Trustee of the Royce Family of Funds consisting of 35 portfolios. |
| Other directorships held by Trustee | | None |
| R. Jay Gerken | | |
| Year of birth | | 1951 |
| Position(s) with Trust | | President and Trustee |
| Term of office1 and length of time served2 | | Since 2011 |
| Principal occupation(s) during past five years | | Managing Director of Legg Mason & Co., LLC (“Legg Mason & Co.”) (since 2005); Officer and Trustee/Director of 161 funds associated with Legg Mason Partners Fund Advisor, LLC (“LMPFA”) or its affiliates (since 2006) and Legg Mason & Co. predecessors (prior to 2006); President and Chief Executive Officer (“CEO”) of LMPFA (since 2006); President and CEO of Smith Barney Fund Management LLC (“SBFM”) (formerly a registered investment adviser) (since 2002) |
| Number of funds in fund complex overseen by Trustee | | 161 |
| Other board memberships held by Trustee during past five years | | None |
| | |
| 44 | | Legg Mason Investment Counsel Maryland Tax-Free Income Trust |
Additional information (unaudited) (cont’d)
Information about Trustees and Officers
| | |
| Executive Officers |
Richard F. Sennett Legg Mason 100 International Drive, Baltimore, MD 21202 | | |
| Year of birth | | 1970 |
| Position(s) with Trust | | Principal Financial Officer |
| Term of office1 and length of time served2 | | Since 2011 |
| Principal occupation(s) during past five years | | Principal Financial Officer of certain mutual funds associated with Legg Mason & Co. or its affiliates (since 2011); Managing Director of Legg Mason & Co. and Senior Manager of the Treasury Policy group for Legg Mason & Co.’s Global Fiduciary Platform (since 2011); formerly, Chief Accountant within the SEC’s Division of Investment Management (2007 to 2011); formerly, Assistant Chief Accountant within the SEC’s Division of Investment Management (2002 to 2007) |
Robert I. Frenkel
Legg Mason
100 First Stamford Place, Stamford, CT 06902 | | |
| Year of birth | | 1954 |
| Position(s) with Trust | | Secretary and Chief Legal Officer |
| Term of office and length of time served2 | | Since 2009 |
| Principal occupation(s) during past five years | | Vice President and Deputy General Counsel of Legg Mason, Inc. (since 2006); Managing Director and General Counsel of Global Mutual Funds for Legg Mason & Co. (since 2006) and Legg Mason & Co. predecessors (since 1994); Secretary and Chief Legal Officer of certain mutual funds associated with Legg Mason & Co. or its affiliates (since 2006) and Legg Mason & Co. predecessors (prior to 2006). |
Ted P. Becker Legg Mason 620 Eighth Avenue, New York, NY 10018 | | |
| Year of birth | | 1951 |
| Position(s) with Trust | | Vice President and Chief Compliance Officer |
| Term of office1 and length of time served2 | | Since 2007 |
| Principal occupation(s) during past five years | | Director of Global Compliance at Legg Mason (since 2006); Chief Compliance Officer of LMPFA (since 2006); Managing Director of Compliance of Legg Mason & Co. (since 2005); Chief Compliance Officer of certain mutual funds associated with Legg Mason & Co. or its affiliates (since 2006) and Legg Mason & Co. predecessors (prior to 2006) |
| | | | |
| Legg Mason Investment Counsel Maryland Tax-Free Income Trust | | | 45 | |
| | |
| Executive Officers cont’d |
Christopher Berarducci
Legg Mason
55 Water Street, New York, NY 10041 | | |
| Year of birth | | 1974 |
| Position(s) with Fund | | Treasurer |
| Term of office and length of time served2 | | Since 2010 |
| Principal occupation(s) during past five years | | Vice President of Legg Mason & Co. (since 2011); Treasurer of certain mutual funds associated with LMPFA (since 2010); formerly: Assistant Controller of certain mutual funds associated with LMPFA (2007 to 2010); Manager of Fund Administration at UBS Global Asset Management (prior to 2007); Assistant Vice President and Manager of Fund Administration at JPMorgan Chase & Co. (prior to 2005). |
| 1 | Each of the Independent Trustees serves on the standing committees of the Board of Trustees, which include the Audit Committee (chair: Arthur Mehlman), the Nominating Committee (co-chairs: Peter O’Brien and Jill McGovern), and the Independent Trustees Committee (chair: Arnold Lehman). |
| 2 | Officers of the Trust are elected to serve until their successors are elected and qualified. Trustees of the Trust serve a term of indefinite length until their retirement, in accordance with the Board’s retirement policy, resignation or removal, and stand for re-election by shareholders only as and when required by the 1940 Act. |
| 3 | Mr. Fetting and Mr. Gerken are considered to be interested persons, as defined in the 1940 Act, of the Trust on the basis of their current employment with the Fund’s investment adviser or its affiliated entities (including the Trust’s principal underwriter) and Legg Mason, Inc., the parent holding company of these entities as well as their ownership of Legg Mason, Inc. stock. |
| | |
| 46 | | Legg Mason Investment Counsel Maryland Tax-Free Income Trust |
Important tax information (unaudited)
99.09% and 98.86% of the net investment income distributions paid monthly by the Fund from April 2011 through December 2011 and from January 2012 through March 2012, respectively, qualify as tax-exempt interest dividends for Federal income tax purposes.
The following information is applicable to non-U.S. resident shareholders:
All of the ordinary income distributions paid monthly by the Fund represent Qualified Net Interest Income and Qualified Short-Term Gain eligible for exemption from U.S. withholding tax for nonresident aliens and foreign corporations.
Please retain this information for your records.
Legg Mason Investment Counsel
Maryland Tax-Free Income Trust
Trustees
Mark R. Fetting Chairman
R. Jay Gerken President
Ruby P. Hearn
Arnold L. Lehman
Robin J.W. Masters
Jill E. McGovern
Arthur S. Mehlman
G. Peter O’Brien
S. Ford Rowan
Robert M. Tarola
Investment manager
Legg Mason Partners Fund Advisor, LLC
Investment sub-adviser
Legg Mason Investment Counsel, LLC
Custodian
State Street Bank & Trust Company
Transfer agent
Boston Financial Data Services, Inc.
2000 Crown Colony Drive Quincy, MA 02169
Independent registered public accounting firm
PricewaterhouseCoopers LLP
Baltimore, MD
Legg Mason Investment Counsel Maryland Tax-Free Income Trust
The Fund is a separate investment series of Legg Mason Tax-Free Income Fund, a Massachusetts business trust.
Legg Mason Investment Counsel Maryland Tax-Free Income Trust
Legg Mason Funds
55 Water Street
New York, NY 10041
The Fund files its complete schedule of portfolio holdings with the Securities and Exchange Commission (“SEC”) for the first and third quarters of each fiscal year on Form N-Q. The Fund’s Forms N-Q are available on the SEC’s website at www.sec.gov. The Fund’s Forms N-Q may be reviewed and copied at the SEC’s Public Reference Room in Washington, D.C., and information on the operation of the Public Reference Room may be obtained by calling 1-800-SEC-0330. To obtain information on Form N-Q, shareholders can call the Fund at 1-877-721-1926.
Information on how the Fund voted proxies relating to portfolio securities during the prior 12-month period ended June 30th of each year and a description of the policies and procedures that the Fund uses to determine how to vote proxies related to portfolio transactions are available (1) without charge, upon request, by calling the Fund at 1-877-721-1926, (2) on the Fund’s website at www.leggmason.com/individualinvestors and (3) on the SEC’s website at www.sec.gov.
This report is submitted for the general information of the shareholders of Legg Mason Investment Counsel Maryland Tax-Free Income Trust. This report is not authorized for distribution to prospective investors in the Fund unless preceded or accompanied by a current prospectus.
Investors should consider the Fund’s investment objectives, risks, charges and expenses carefully before investing. The prospectus contains this and other important information about the Fund. Please read the prospectus carefully before investing.
www.leggmason.com/individualinvestors
©2012 Legg Mason Investor Services, LLC
Member FINRA, SIPC
Legg Mason Funds Privacy and Security Notice
Your Privacy and the Security of Your Personal Information is Very Important to the Legg Mason Funds
This Privacy and Security Notice (the “Privacy Notice”) addresses the Legg Mason Funds’ privacy and data protection practices with respect to nonpublic personal information the Funds receive. The Legg Mason Funds include any funds sold by the Funds’ distributor, Legg Mason Investor Services, LLC, as well as Legg Mason-sponsored closed-end funds and certain other closed-end funds managed or sub-advised by Legg Mason or its affiliates. The provisions of this Privacy Notice apply to your information both while you are a shareholder and after you are no longer invested with the Funds.
The Type of Nonpublic Personal Information the Funds Collect About You
The Funds collect and maintain nonpublic personal information about you in connection with your shareholder account. Such information may include, but is not limited to:
| Ÿ | | Personal information included on applications or other forms; |
| Ÿ | | Account balances, transactions, and mutual fund holdings and positions; |
| Ÿ | | Online account access user IDs, passwords, security challenge question responses; and |
| Ÿ | | Information received from consumer reporting agencies regarding credit history and creditworthiness (such as the amount of an individual’s total debt, payment history, etc.). |
How the Funds Use Nonpublic Personal Information About You
The Funds do not sell or share your nonpublic personal information with third parties or with affiliates for their marketing purposes, or with other financial institutions or affiliates for joint marketing purposes, unless you have authorized the Funds to do so. The Funds do not disclose any nonpublic personal information about you except as may be required to perform transactions or services you have authorized or as permitted or required by law. The Funds may disclose information about you to:
| Ÿ | | Employees, agents, and affiliates on a “need to know” basis to enable the Funds to conduct ordinary business or comply with obligations to government regulators; |
| Ÿ | | Service providers, including the Funds’ affiliates, who assist the Funds as part of the ordinary course of business (such as printing, mailing services, or processing or servicing your account with us) or otherwise perform services on the Funds’ behalf, including companies that may perform marketing services solely for the Funds; |
| Ÿ | | The Funds’ representatives such as legal counsel, accountants and auditors; and |
| Ÿ | | Fiduciaries or representatives acting on your behalf, such as an IRA custodian or trustee of a grantor trust. |
|
| NOT PART OF THE ANNUAL REPORT |
Legg Mason Funds Privacy and Security Notice (cont’d)
Except as otherwise permitted by applicable law, companies acting on the Funds’ behalf are contractually obligated to keep nonpublic personal information the Funds provide to them confidential and to use the information the Funds share only to provide the services the Funds ask them to perform.
The Funds may disclose nonpublic personal information about you when necessary to enforce their rights or protect against fraud, or as permitted or required by applicable law, such as in connection with a law enforcement or regulatory request, subpoena, or similar legal process. In the event of a corporate action or in the event a Fund service provider changes, the Funds may be required to disclose your nonpublic personal information to third parties. While it is the Funds’ practice to obtain protections for disclosed information in these types of transactions, the Funds cannot guarantee their privacy policy will remain unchanged.
Keeping You Informed of the Funds’ Privacy and Security Practices
The Funds will notify you annually of their privacy policy as required by federal law. While the Funds reserve the right to modify this policy at any time they will notify you promptly if this privacy policy changes.
The Funds’ Security Practices
The Funds maintain appropriate physical, electronic and procedural safeguards designed to guard your nonpublic personal information. The Funds’ internal data security policies restrict access to your nonpublic personal information to authorized employees, who may use your nonpublic personal information for Fund business purposes only.
Although the Funds strive to protect your nonpublic personal information, they cannot ensure or warrant the security of any information you provide or transmit to them, and you do so at your own risk. In the event of a breach of the confidentiality or security of your nonpublic personal information, the Funds will attempt to notify you as necessary so you can take appropriate protective steps. If you have consented to the Funds using electronic communications or electronic delivery of statements, they may notify you under such circumstances using the most current email address you have on record with them.
In order for the Funds to provide effective service to you, keeping your account information accurate is very important. If you believe that your account information is incomplete, not accurate or not current, or if you have questions about the Funds’ privacy practices, write the Funds using the contact information on your account statements, email the Funds by clicking on the Contact Us section of the Funds’ website at www.leggmason.com, or contact the Fund at 1-877-721-1926.
Revised April 2011
|
| NOT PART OF THE ANNUAL REPORT |
www.leggmason.com/individualinvestors
©2012 Legg Mason Investor Services, LLC Member FINRA, SIPC
LMF-030/A 5/12 SR12-1650
The Registrant has adopted a code of ethics that applies to the Registrant’s principal executive officer, principal financial officer, principal accounting officer or controller.
| ITEM 3. | AUDIT COMMITTEE FINANCIAL EXPERT. |
The Board of Trustees of the Registrant has determined that Arthur S. Mehlman and Robert M. Tarola possess the technical attributes identified in Instruction 2(b) of Item 3 to Form N-CSR to qualify as an “audit committee financial expert,” and has designated Mr. Mehlman and Mr. Tarola as the Audit Committee’s financial experts. Mr. Mehlman and Mr. Tarola are “independent” Trustees pursuant to paragraph (a)(2) of Item 3 to Form N-CSR.
| ITEM 4. | PRINCIPAL ACCOUNTANT FEES AND SERVICES. |
a) Audit Fees. The aggregate fees billed in the last two fiscal years ending March 31, 2011 and March 31, 2012 (the “Reporting Periods”) for professional services rendered by the Registrant’s principal accountant (the “Auditor”) for the audit of the Registrant’s annual financial statements, or services that are normally provided by the Auditor in connection with the statutory and regulatory filings or engagements for the Reporting Periods, were $13,930 in 2011 and $36,797 in 2012.
b) Audit-Related Fees. The aggregate fees billed in the Reporting Periods for assurance and related services by the Auditor that are reasonably related to the performance of the audit of the Registrant’s financial statements were $0 in 2011 and $0 in 2012. These services consisted of procedures performed in connection with the re-domiciliation of the various reviews of Prospectus supplements, and consent issuances related to the N-1A filings and calculations pursuant to Funds revolving credit for the Legg Mason Tax Free Income Fund.
In addition, there were no Audit-Related Fees billed in the Reporting Period for assurance and related services by the Auditor to the Registrant’s investment adviser (not including any sub-adviser whose role is primarily portfolio management and is subcontracted with or overseen by another investment adviser), and any entity controlling, controlled by or under common control with the investment adviser that provides ongoing services to the Registrant (“service affiliates”), that were reasonably related to the performance of the annual audit of the service affiliates. Accordingly, there were no such fees that required pre-approval by the Audit Committee for the Reporting Periods.
(c) Tax Fees. The aggregate fees billed in the Reporting Periods for professional services rendered by the Auditor for tax compliance, tax advice and tax planning (“Tax Services”) were $3,500 in 2011 and $4,100 in 2012. These services consisted of (i) review or preparation of U.S. federal, state, local and excise tax returns; (ii) U.S. federal, state and local tax planning, advice and assistance regarding statutory, regulatory or administrative developments, and (iii) tax advice regarding tax qualification matters and/or treatment of various financial instruments held or proposed to be acquired or held.
There were no fees billed for tax services by the Auditors to service affiliates during the Reporting Periods that required pre-approval by the Audit Committee.
d) All Other Fees. There were no other fees billed in the Reporting Periods for products and services provided by the Auditor, other than the services reported in paragraphs (a) and (c) of this Item 4 for the Registrant.
All Other Fees. There were no other non-audit services rendered by the Auditor to Legg Mason Partners Fund Advisors, LLC (“LMPFA”), and any entity controlling, controlled by or under common control with LMPFA that provided ongoing services to the Registrant requiring pre-approval by the Audit Committee in the Reporting Period.
(e) Audit Committee’s pre–approval policies and procedures described in paragraph (c)(7) of Rule 2-01 of Regulation S-X.
(1) The Charter for the Audit Committee (the “Committee”) of the Board of each Legg Mason Fund (each a “Fund”) states that the Committee has the duty and power (a) to pre-approve the engagement of each Fund’s independent auditors to perform any permissible non-audit services for that Fund and, as the Committee deems appropriate, to establish and oversee policies and procedures for the pre-approval of such services to a Fund and (b) to pre-approve the engagement of each Fund’s independent auditors to perform any permissible non-audit services for the Fund’s investment adviser(s) and any entity controlling, controlled by or under common control with the investment adviser(s) if the engagement relates directly to the operations and financial reporting of the Fund, and, as the Committee deems appropriate, to establish and oversee policies and procedures for the pre-approval of such services.
The Audit Committee’s policy is to delegate to its chairperson the authority to pre-approve items prior to the next meeting of the Committee. Such pre-approvals are reported at the next quarterly meeting of the Audit Committee.
(2) For Legg Mason Tax Free Income Fund, the percentage of fees that were pre-approved by the Audit Committee, with respect to: Audit-Related Fees were 100% and 100% for 2011 and 2012; Tax Fees were 100% and 100% for 2011 and 2012; and Other Fees were 100% and 100% for 2011 and 2012.
There were no services provided to the Registrant that were approved by the Audit Committee pursuant to paragraph (c)(7)(i)(C) of Rule 2-01 of Regulation S-X. There were no fees billed to the Registrant for services where pre-approval of the Audit Committee was necessary pursuant to paragraph (c)(7)(i)(C) of Rule 2-01 of Regulation S-X.
(f) Not Applicable.
(g) Non-audit fees billed by the Auditor for services rendered to Legg Mason Tax Free Income Fund, LMPFA and any entity controlling, controlled by, or under common control with LMPFA that provides ongoing services to the Registrant during the reporting period were $0 in 2012.
(h) Yes. Legg Mason Tax Free Income Fund’s Audit Committee has considered whether the provision of non-audit services that were rendered to Service Affiliates, which were not pre-approved (not requiring pre-approval), is compatible with maintaining the Auditor’s independence. All services provided by the Auditor to Legg Mason Tax Free Income Fund or to Service Affiliates, which were required to be pre-approved, were pre-approved as required.
| ITEM 5. | AUDIT COMMITTEE OF LISTED REGISTRANTS. |
The Registrant is not a listed issuer as defined in Rule 10A-3 under the Securities Exchange Act of 1934.
| ITEM 6. | SCHEDULE OF INVESTMENTS. |
Included herein under Item 1.
| ITEM 7. | DISCLOSURE OF PROXY VOTING POLICIES AND PROCEDURES FOR CLOSED-END MANAGEMENT INVESTMENT COMPANIES. |
Not applicable.
| ITEM 8. | PORTFOLIO MANAGERS OF CLOSED-END MANAGEMENT INVESTMENT COMPANIES. |
Not applicable.
| ITEM 9. | PURCHASES OF EQUITY SECURITIES BY CLOSED-END MANAGEMENT INVESTMENT COMPANY AND AFFILIATED PURCHASERS. |
Not applicable.
| ITEM 10. | SUBMISSION OF MATTERS TO A VOTE OF SECURITY HOLDERS. |
The Nominating Committee will accept recommendations for nominations from shareholders. Shareholders may forward recommendations to the Fund Assistant Secretary at 100 International Drive, 7th Floor, Baltimore, Maryland 21202, Attn.: Fund Assistant Secretary.
| ITEM 11. | CONTROLS AND PROCEDURES. |
| | (a) | The Registrant’s principal executive officer and principal financial officer have concluded that the Registrant’s disclosure controls and procedures (as defined in Rule 30a- 3(c) under the Investment Company Act of 1940, as amended (the “1940 Act”)) are effective as of a date within 90 days of the filing date of this report that includes the disclosure required by this paragraph, based on their evaluation of the disclosure controls and procedures required by Rule 30a-3(b) under the 1940 Act and 15d-15(b) under the Securities Exchange Act of 1934. |
| | (b) | There were no changes in the registrant’s internal control over financial reporting (as defined in Rule 30a-3(d) under the 1940 Act) that occurred during the second fiscal quarter of the period covered by this report that have materially affected, or are likely to materially affect the registrant’s internal control over financial reporting. |
(a) (1) Code of Ethics attached hereto.
Exhibit 99.CODE ETH
(a) (2) Certifications pursuant to section 302 of the Sarbanes-Oxley Act of 2002 attached hereto.
Exhibit 99.CERT
(b) Certifications pursuant to Section 906 of the Sarbanes-Oxley Act of 2002 attached hereto.
Exhibit 99.906CERT
SIGNATURES
Pursuant to the requirements of the Securities Exchange Act of 1934 and the Investment Company Act of 1940, the Registrant has duly caused this Report to be signed on its behalf by the undersigned, there unto duly authorized.
Legg Mason Tax Free Income Fund
| | |
| By: | | /S/ R. JAY GERKEN |
| | (R. Jay Gerken) |
| | President |
| | Legg Mason Tax Free Income Fund |
Date: May 23, 2012
Pursuant to the requirements of the Securities Exchange Act of 1934 and the Investment Company Act of 1940, this report has been signed below by the following persons on behalf of the Registrant and in the capacities and on the dates indicated.
| | |
| By: | | /S/ R. JAY GERKEN |
| | (R. Jay Gerken) |
| | President |
| | Legg Mason Tax Free Income Fund |
Date: May 23, 2012
| | |
| By: | | /S/ RICHARD F. SENNETT |
| | (Richard F. Sennett) |
| | Principal Financial Officer of |
| | Legg Mason Tax Free Income Fund |
Date: May 23, 2012