UNITED STATES
SECURITIES AND EXCHANGE COMMISSION
Washington, D.C. 20549
FORM N-CSR
CERTIFIED SHAREHOLDER REPORT OF REGISTERED
MANAGEMENT INVESTMENT COMPANIES
Investment Company Act file number
811-06221
Brandywine Blue Fund, Inc.
(Exact name of registrant as specified in charter)
P.O. Box 4166
Greenville, DE 19807
(Address of principal executive offices) (Zip code)
William F. D’Alonzo
P.O. Box 4166
Greenville, Delaware 19807
(Name and address of agent for service)
(302) 656-3017
Registrant's telephone number, including area code:
Date of fiscal year end: September 30
Date of reporting period: September 30, 2008
Item 1. Reports to Stockholders.
| Managed by Friess Associates, LLC | Annual Report | September 30, 2008 |
Dear Fellow Shareholders:
The September-quarter environment was bad, and our performance in it was worse. We did not serve you well during these three months.
Brandywine Fund declined 21.51 percent in the quarter as the Russell 3000 and Russell 3000 Growth Indexes declined 8.73 and 11.93 percent. Brandywine Blue Fund declined 28.61 percent versus declines in the S&P 500, Russell 1000 and Russell 1000 Growth Indexes of 8.37, 9.35 and 12.33 percent.
Please don’t confuse the text that follows outlining the reasons why we underperformed the market as an effort on our part to make excuses. We are keenly aware that you expect and deserve better from us. No one in this firm will be satisfied until our results reward the confidence you showed in us during this tumultuous time.
After leading the Brandywine Funds to solid gains against mixed index results in the June quarter, energy-related holdings became a costly liability in the September quarter. The group began falling early in the quarter along with oil prices. We didn’t hold energy-related companies because oil prices were previously moving up, so we didn’t see reason to flee the energy sector because oil was now retreating from record highs.
We performed an exhaustive re-evaluation of every energy company in the portfolios to ensure their ongoing earnings potential, and in most instances our original expectations were confirmed. Holdings from the energy sector continued to fall, ultimately detracting most from results in both Funds. Industrial holdings, particularly companies with any sort of link to energy, joined suit and became the next most significant performance detractors.
While we feverishly focused on earnings, our challenge came in assessing just how risk-averse investors became as threats from the credit crisis grew. The valuation standards set by the market in recent years were abruptly abandoned. We made allowances for contraction in price-to-earnings ratios as the market became increasingly shaken, but the swift and severe re-pricing in the energy and industrial sectors went well beyond our expectations.
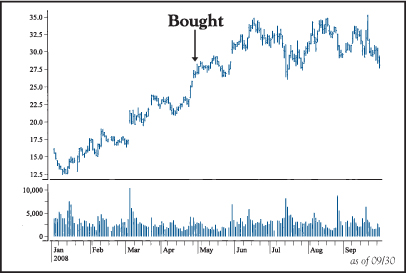
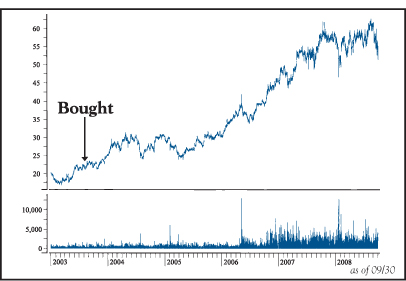
McDermott International, which suffered the worst percentage decline in the Brandywine Funds, finished the June quarter selling at roughly 20 times expected earnings for the next 12 months. That price-to-earnings ratio was about average for our experience since we first purchased shares more than three years ago. McDermott fell steadily in the September quarter despite lacking a company-specific catalyst for the sell-off, eventually settling at about eight times forward earnings.
The severity of the market’s turn on McDermott is surprising when you consider the company’s improved financial position relative to past periods when shares fetched a much higher multiple.
| | Brandywine | Brandywine Blue |
| Cumulative Total Return | % Change | % Change |
| Quarter | -21.51 | -28.61 |
| One Year | -25.16 | -30.73 |
| Five Years | 45.02 | 33.13 |
| Ten Years | 104.02 | 96.06 |
| Inception | 1,196.60* | 554.35** |
| Five Years | 7.72 | 5.89 |
| Ten Years | 7.39 | 6.96 |
| Inception | 11.92* | 11.18** |
| Brandywine | 1.08% |
| Brandywine Blue | 1.12% |
***As stated in the Prospectus dated January 31, 2008
Performance data quoted represent past performance; past performance does not guarantee future results. The investment return and principal value of an investment will fluctuate so that an investor’s shares, when redeemed, may be worth more or less than their original cost. Current performance of the Funds may be lower or higher than the performance quoted. Performance data current to the most recent month end may be obtained by visiting www.brandywinefunds.com.
When we first bought McDermott, its debt-to-equity ratio, which is a measure of leverage on the company’s balance sheet, was above 40 percent. McDermott currently carries no long-term debt. It also generates $300 million to $400 million a year in free cash flow, boasts $9.8 billion in backlogged business and holds $1.4 billion in cash on its balance sheet.
Given the steady flow of nerve-wracking events related to the credit crisis, it’s not surprising that many stocks moved for reasons unrelated to their fundamentals. Still, the degree to which the kind of reasonably priced, rapidly growing companies that we seek underperformed companies fitting any other description left us scratching our heads.
Companies in the Russell 3000 Growth Index with forward price-to-earnings ratios below 25 and year-over-year earnings growth rates of 25 percent or more fell 18 percent on average. Companies from the index that didn’t fall in that range, including companies with declining earnings and companies with big losses, declined less than 4 percent.
Pulte Homes, which in the period reported its seventh consecutive quarter of losses, surged 45 percent despite news that in August new homes sales fell to their lowest level in 17 years. We didn’t hold homebuilders or beleaguered financial companies that showed renewed life amid signs of government intervention into the mortgage mess, representing another area where the benchmarks gained a performance edge on us.
Technology holdings also contributed to the performance gap. Our research identified market-share gains for Dell (both Funds) and robust sales momentum for Research in Motion (Brandywine Blue), but our earnings forecasts for their most recently reported quarters overshot reality by $0.03 and $0.01 per share, respectively. In both cases, we didn’t pick up on the degree to which costs would climb to drive new sales growth. Technology’s negative influence was more pronounced in Brandywine Blue.
For more information on holdings that influenced September-quarter performance, please see Roses & Thorns on page 4 for Brandywine and page 6 for Brandywine Blue.
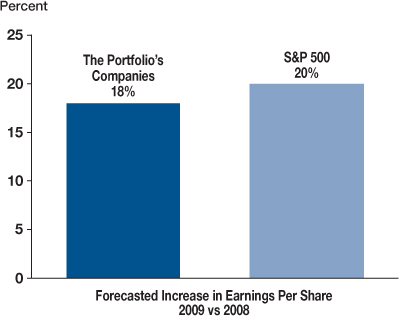
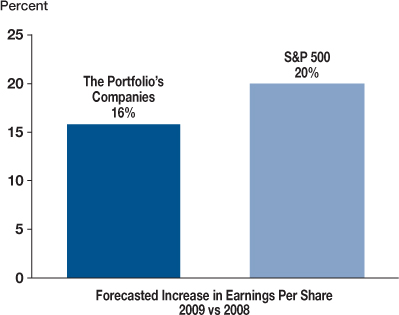
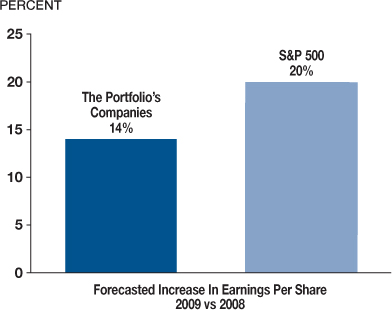
On pages 3 and 5, you’ll notice that 2009 earnings forecasts for the average company held in each of the Brandywine Funds is lower than current estimates for the typical S&P 500 Index company. We believe that situation will reverse as we progress toward and into 2009. We’re working hard to make sure we hold companies that meet or exceed realistic expectations. As for the broader group of companies the index represents, we think current forecasts leave ample room for downward earnings estimate revisions.
We just completed a very tough quarter marked by significant macro uncertainty. It’s not the first time, and it won’t be the last. Ten years ago, the market was emerging from the Asian economic crisis, Russia’s debt default and the hedge fund Long Term Capital Management’s collapse. Since then, we’ve seen the dot-com bust, the September 11 attacks, the worst bear market of this generation, a recession and a war.
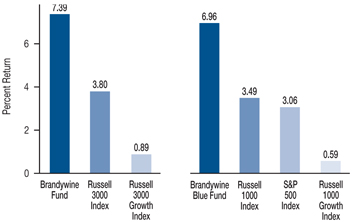
Recent results have reduced long-term returns from levels we’re accustomed to during brighter times, but stocks still show gains over the past 10 years even now that we’ve added global financial crisis to the list. Although it wasn’t the case in the September quarter, results for the Brandywine Funds reaffirm our belief that companies with superior earnings growth potential outperform the broader market over the long haul.
Ten Year Performance
* Total Annualized Returns, 10/1/98 - 9/30/08.
We’ve been overwhelmed by the encouragement we’ve received from shareholders, clients, advisors and consultants. The entire Friess team joins me in sending our sincere thanks for your long-term focus and support. We come to work each day with a single-minded focus to produce results that merit your continued confidence.
We recognize the assets you entrust to us represent retirement funds, college tuition, charitable and endowment resources, and other important savings. We’re invested alongside you with many of the same goals in mind, and we’re determined to grow your assets in a prudent manner in the months and years ahead.
 | |
| Bill D’Alonzo | |
| Brandywine Funds President | October 10, 2008 |
Brandywine Fund
% Change in Top Ten Holdings From Book Cost as of September 30, 2008
| 1. | | Thermo Fisher Scientific, Inc. | +43.0% | 6. | | Wal-Mart Stores, Inc. | -0.2% |
| 2. | | Urban Outfitters, Inc. | -3.6% | 7. | | Cephalon, Inc. | +12.5% |
| 3. | | Check Point Software Technologies Ltd. | +0.1% | 8. | | Invitrogen Corp. | -7.0% |
| 4. | | Covance Inc. | +5.5% | 9. | | Perrigo Co. | +0.2% |
| 5. | | Harris Corp. | +17.1% | 10. | | Crown Holdings, Inc. | -10.1% |
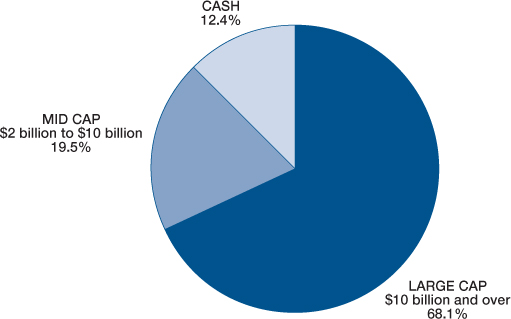
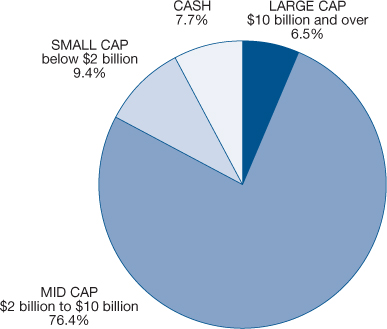
| Earnings Growth | The Portfolio’s Market Capitalization |
| |
All figures are dollar weighted and based on data from Baseline. September 30, 2008.
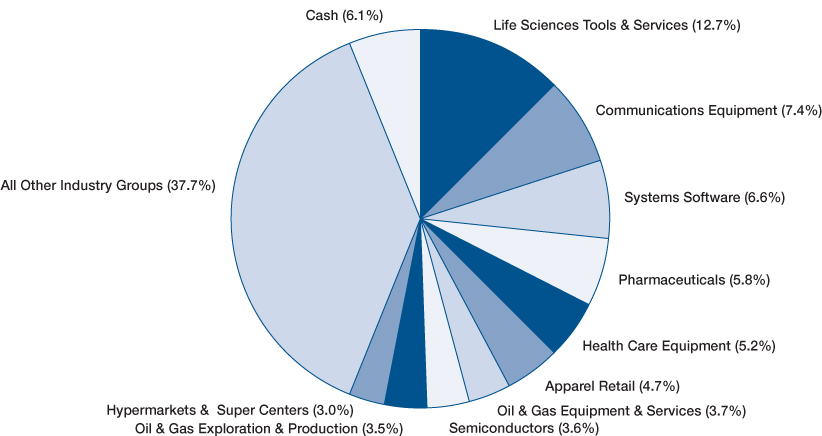
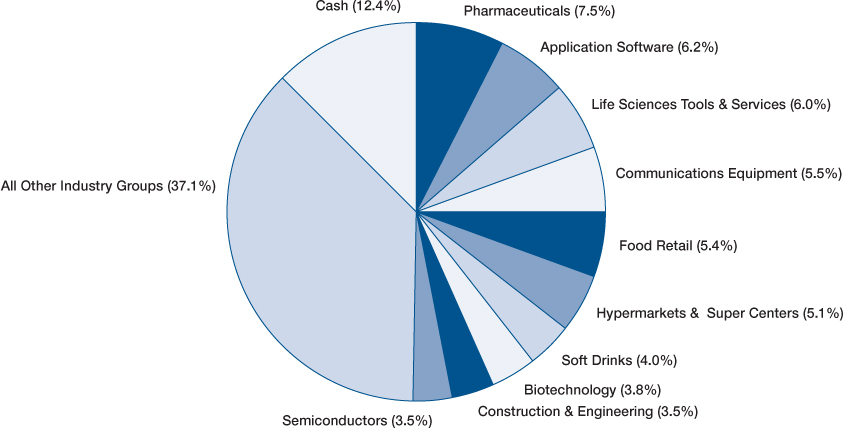
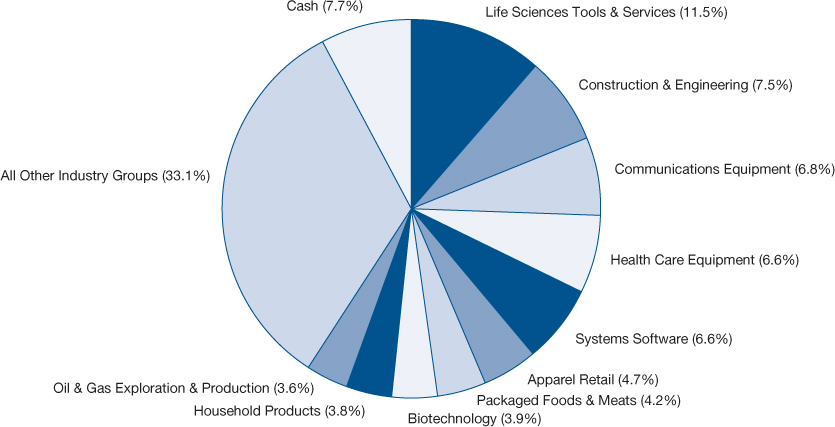
Top Ten Industry Groups
Brandywine Fund
September Quarter “Roses and Thorns”
| Biggest $ Winners | $ Gain (in millions) | % Gain | Reason for Move |
| Cephalon, Inc. | $13.6 | 15.4 | The maker of drugs used in the treatment of neurological disorders and cancer grew June-quarter earnings 22 percent, beating estimates. Revenues jumped 10 percent on strong initial sales of Treanda, used for leukemia, and Amrix, a muscle relaxant. The company also plans to release Nuvigil, an improved version of its blockbuster Provigil drug for excessive sleepiness, next year. |
| Perrigo Co. | $11.1 | 13.6 | The manufacturer of store brand over-the-counter pharmaceuticals and consumer products grew June-quarter earnings 63 percent. Revenues jumped 34 percent. The company’s products offer both a cost trade-down for consumers shifting to less expensive store brands over pricier national brands and a profit source for drug store chains looking to grow their brand business. Recent acquisitions strengthen the company’s pipeline of new products and create market share opportunities. |
| Avon Products, Inc. | $7.6 | 19.9 | The largest door-to-door cosmetic retailer grew June-quarter earnings 27 percent, beating estimates by 21 percent. Overseas expansion continued, with sales in Russia and Brazil rising more than 30 percent. Operating margins expanded to nearly 14 percent compared to 8 percent a year ago due to a favorable product mix of high-margin cosmetics and continued cost control efforts. We sold Avon when shares hit our target price during the quarter. |
Church & Dwight Co., Inc. | $7.2 | 10.8 | The maker of a broad range of consumer and specialty products under the Arm & Hammer brand name beat estimates with 12 percent June-quarter earnings growth. Strong organic growth was driven by improved product pricing, the introduction of new products, increased marketing and expanding distribution. Gross profit margins expanded during the quarter as cost savings and acquisition synergies more than offset higher commodity costs. |
| Gen-Probe Inc. | $5.7 | 10.2 | The maker of rapid, accurate and cost-effective nucleic acid tests that are used primarily to diagnose human diseases and screen donated blood grew June-quarter earnings 26 percent, beating estimates by 19 percent. Shares gained ground on continued strength in blood screening sales and the approval of the company’s Ultrio Procleix assay for Hepatitis B, expanding its current uses in detecting HIV and Hepatitis C. |
| Biggest $ Losers | $ Loss (in millions) | % Loss | Reason for Move |
McDermott International, Inc. | $96.0 | 56.5 | June-quarter earnings grew 18 percent as backlog for the company’s engineering and construction services continued to grow. Following strong price performance through June, shares declined on perceptions regarding how much of the company’s operational performance hinges on customers in the energy group. Investors indiscriminately sold anything energy-related during the quarter on concerns stemming from deteriorating macro-economic conditions, ignoring McDermott’s solid balance sheet and operational health. |
| Walter Industries, Inc. | $68.0 | 49.3 | The producer of metallurgical coal for the steel industry grew June-quarter earnings 169 percent, beating estimates by 65 percent. Despite the strong results, shares traded lower as steel prices fell from record levels amid deteriorating macro-economic conditions, creating concerns that pricing for metallurgical coal would follow suit. We sold Walter Industries as the quarter ended and completely exited the position in early October. |
| Apple, Inc. | $51.8 | 34.6 | The maker of iPods, iPhones and Macintosh computers grew June-quarter earnings 29 percent, beating estimates by 10 percent. Despite strong trends for new products, shares traded lower with growing fears that consumers would rein in spending this holiday season, given overall economic conditions. We sold Apple as the quarter ended and completely exited the position in early October. |
Petrohawk Energy Corp. | $49.1 | 53.3 | The oil and natural gas producer grew June-quarter earnings 35 percent. Deteriorating macro-economic conditions and lower commodity prices resulted in a wave of selling across the energy sector. Investors overlooked the company’s success in the Haynesville Shale area, where it is currently drilling three horizontal wells and expects to have six operating rigs drilling wells in the months ahead. |
Weatherford International Ltd. | $45.9 | 44.9 | The oil-field service provider grew June-quarter earnings 26 percent, missing consensus estimates by $0.02. Despite having one of the strongest patent portfolios of many leading-edge technologies in the oil-services business, shares traded with those of other energy stocks as falling oil prices threatened demand. |
All gains/losses are calculated on an average cost basis
Brandywine Blue Fund
% Change in Top Ten Holdings From Book Cost as of September 30, 2008
| 1. | | Thermo Fisher Scientific, Inc. | +21.3% | 6. | | Gilead Sciences, Inc. | +17.3% |
| 2. | | Wal-Mart Stores, Inc. | -1.8% | 7. | | Altera Corp. | -4.9% |
| 3. | | Abbott Laboratories | -2.2% | 8. | | Teva Pharmaceutical Industries Ltd. | +2.5% |
| 4. | | Juniper Networks, Inc. | -17.7% | 9. | | Intuit Inc. | +2.6% |
| 5. | | The Coca-Cola Co. | -1.3% | 10. | | Southwest Airlines Co. | +2.2% |
| Earnings Growth | The Portfolio’s Market Capitalization |
| |
All figures are dollar weighted and based on data from Baseline. September 30, 2008.
Top Ten Industry Groups
Brandywine Blue Fund
September Quarter “Roses and Thorns”
| Biggest $ Winners | | % Gain | Reason for Move |
| Avon Products, Inc. | $12.3 | 19.9 | The largest door-to-door cosmetic retailer grew June-quarter earnings 27 percent, beating estimates by 21 percent. Overseas expansion continued, with sales in Russia and Brazil rising more than 30 percent. Operating margins expanded to nearly 14 percent compared to 8 percent a year ago due to a favorable product mix of high-margin cosmetics and continued cost control efforts. We sold Avon when shares hit our target price during the quarter. |
| Southwest Airlines Co. | $8.7 | 8.9 | June-quarter earnings beat estimates by 33 percent as revenues grew 11 percent. The low-cost airline carrier benefited from significant reductions in capacity by competitors in overlapping markets and lower jet-fuel prices. Southwest continues to maintain cost and workforce productivity advantages over competing carriers. |
| Intuit Inc. | $2.8 | 2.6 | The software company best known for its QuickBooks, TurboTax and Quicken applications is expected to grow earnings 17 percent in the fiscal year ending next July. Helping households and small businesses automate financial tasks such as tax reporting, the company benefits from a high level of recurring revenues and higher profitability associated with its aggressive transition efforts toward on-demand, online product offerings. |
| St. Jude Medical, Inc. | $0.4 | 1.6 | The medical device manufacturer targeting the cardiovascular and neuromodulation markets grew June-quarter earnings 33 percent, beating estimates by 9 percent. St. Jude is leveraging its strong distribution network, leading position in the pacemaker segment, and new defibrillator and cardiac resynchronization therapy products to gain market share across cardiac segments. |
| Express Scripts, Inc. | $0.1 | 0.2 | The manager of prescription benefits for employers and insurance companies grew June-quarter earnings 36 percent, beating estimates by 6 percent. Express Scripts benefits from an industry leading generic fill rate, a sharp increase in mail-order volume and a growing specialty pharmacy franchise. The company is also experiencing strong renewal rates and growing acceptance of its “consumerology” initiative, which is focused on increasing mail and generic utilization by tailoring messages to individual members. |
| Biggest $ Losers | | % Loss | Reason for Move |
| Nabors Industries Ltd. | $76.3 | 45.5 | The world’s largest onshore oil and natural gas contract driller topped June-quarter consensus earnings estimates. The sharp contraction in global economic growth and commodity prices overshadowed near-term results and sparked concerns of possible demand destruction, rig count decreases and delays in capital spending. We sold Nabors during the quarter. |
Weatherford International Ltd. | $73.2 | 45.0 | The oil-field service provider grew June-quarter earnings 26 percent, missing consensus estimates by $0.02. Despite having one of the strongest patent portfolios of many leading-edge technologies in the oil-services business, shares traded with those of other energy stocks as falling oil prices threatened demand. |
| Fluor Corp. | $70.5 | 41.3 | The construction and engineering company grew June-quarter earnings 66 percent, topping estimates. Despite strong results, a solid balance sheet and rising forward earnings guidance, shares traded lower on concerns that the broadening credit crisis would eventually crimp industrial capital outlays by Fluor’s worldwide oil, gas and chemical customers. |
Chesapeake Energy Corp. | $65.1 | 39.1 | The natural-gas driller grew June-quarter earnings 25 percent, beating estimates. Chesapeake’s favorable position as a domestic natural-gas supplier was overlooked as valuations for companies in the energy sector experienced drastic compression amid deteriorating macro-economic conditions. We sold Chesapeake during the quarter. |
| Apple, Inc. | $62.1 | 33.9 | The maker of iPods, iPhones and Macintosh computers grew June-quarter earnings 29 percent, beating estimates by 10 percent. Despite strong trends for new products, shares traded lower with growing fears that consumers would rein in spending this holiday season, given overall economic conditions. We sold Apple as the quarter ended and completely exited the position in early October. |
All gains/losses are calculated on an average cost basis
Management’s Discussion of Results, Brandywine Fund
Fallout from the subprime mortgage mess grew in scope and severity during the fiscal year, culminating in a crisis of confidence that was ultimately met with aggressive government intervention. Deteriorating conditions in the markets that facilitate commerce dampened economic expectations.
Brandywine Fund’s investment strategy emphasizes the relationship between earnings performance and stock prices. The Fund’s approach fared relatively well through the first nine months of the period. Then Brandywine lost more ground than benchmarks in the fiscal year’s final quarter as market sentiment overtook individual-company fundamentals as the primary influence on stocks amid growing concerns about the credit crisis.
Brandywine declined 25.16 percent in the 12 months through September 30, 2008. The Russell 3000 and Russell 3000 Growth Indexes declined 21.52 and 20.60 percent.
Brandywine started the fiscal year in solid fashion by posting a gain in the December quarter of 2007, a period in which its benchmarks declined. Holdings from the industrial sector attracted positive attention with strong earnings results in an environment marked by growing consumer spending concerns due to rising oil prices.
The credit crisis took center stage in the March quarter of 2008. The government backed a deal in which Wall Street’s fifth-largest investment bank, Bear Stearns, was acquired to avert its collapse. Most stocks suffered. Holdings from the technology and industrial sectors weighed on performance as economic concerns grew, leading Brandywine to decline more than its benchmarks.
Energy-related holdings were a notable bright spot in the March quarter, and their solid performance continued into the June quarter. Brandywine grew amid mixed index results, reclaiming fiscal-year-to-date relative performance advantages over its benchmarks.
The credit crisis re-emerged as the dominant influence on stock prices in the September quarter. The period included the largest bankruptcy in history, the largest bank failure and other jarring events that fueled a challenging environment. Holdings from the energy sector that only months before led Brandywine’s performance became the most notable performance detractors in the September quarter.
Concerns that the credit crisis would reverberate throughout the global economy prompted investors to avoid companies with strong earnings expectations. Brandywine declined more than its benchmarks in a negative, macro-driven environment.
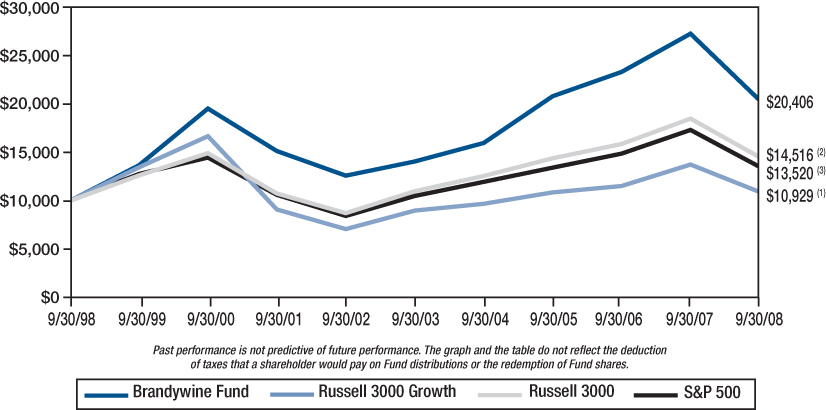
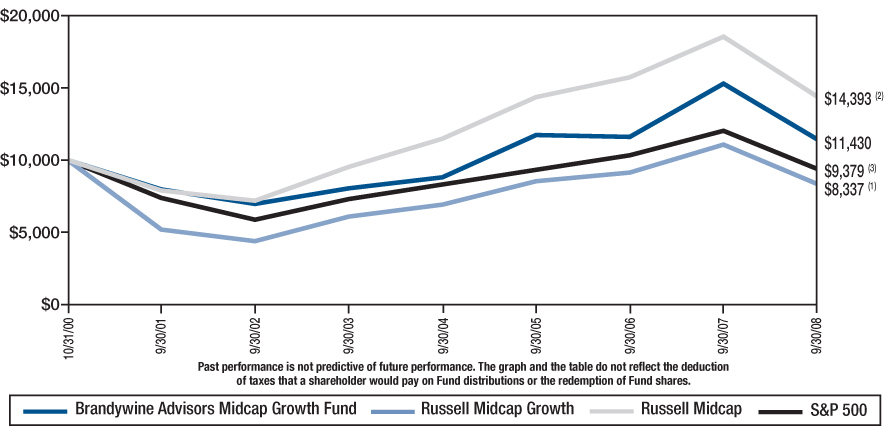
Comparison of Change in Value of $10,000 Investment in Brandywine Fund, Russell 3000 Growth(1), Russell 3000 Index(2) and S&P 500 Index(3) |
| | (1) | | The Russell 3000 Growth Index measures the performance of those Russell 3000 Index companies with higher price-to-book ratios and higher forecasted growth values. The stocks in this index are also members of either the Russell 1000 Growth or the Russell 2000 Growth Indexes and includes dividends. | |
| | (2) | | The Russell 3000 Index, a trademark of the Frank Russell Company, is 3,000 of the largest publicly traded companies in the United States equity market and includes dividends. | |
| | (3) | | The S&P 500 Index consists of 500 stocks, mostly on the New York Stock Exchange, selected by the Standard & Poor’s Ratings Group. Each stock’s weighting is based on its relative total market value and includes dividends. | |
| | | | | |
| Average Annual Total Return |
| 1-Year | 5-Year | 10-Year | |
| -25.16% | 7.72% | 7.39% | 11.92% |
Brandywine Fund, Inc.
Statement of Assets and Liabilities
September 30, 2008
| Assets: | | | |
| Investments in securities, at value (cost $3,576,940,483) | | $ | 3,429,951,499 | |
| Receivable from investments sold | | | 166,030,241 | |
| Receivable from shareholders for purchases | | | 1,200,982 | |
| Dividends and interest receivable | | | 299,138 | |
| Total assets | | $ | 3,597,481,860 | |
| Liabilities: | | | | |
| Payable to brokers for securities purchased | | $ | 167,759,582 | |
| Payable to adviser for management fees | | | 3,057,904 | |
| Payable to shareholders for redemptions | | | 4,459,423 | |
| Other liabilities | | | 417,525 | |
| Total liabilities | | | 175,694,434 | |
| Net Assets: | | | | |
| Capital Stock, $0.01 par value; 500,000,000 shares authorized; 127,384,194 shares outstanding | | | 3,775,338,691 | |
| Net unrealized depreciation on investments | | | (146,988,984 | ) |
| Accumulated net realized loss on investments | | | (206,562,281 | ) |
| Net assets | | | 3,421,787,426 | |
| Total liabilities and net assets | | $ | 3,597,481,860 | |
| Calculation of net asset value per share: | | | | |
Net asset value, offering and redemption price per share ($3,421,787,426 ÷ 127,384,194 shares outstanding) | | $ | 26.86 | |
The accompanying notes to financial statements are an integral part of this statement.
Schedule of Investments
September 30, 2008
| Shares | | | | Cost | | | Value | |
Common Stocks - 93.9% (a) | | | | | | |
CONSUMER DISCRETIONARY | | | | | | |
| | | Apparel Retail - 4.7% | | | | | | |
| | 237,600 | | The Buckle, Inc. | | $ | 12,660,522 | | | $ | 13,196,304 | |
| | 4,643,700 | | Urban Outfitters, Inc.* | | | 153,514,620 | | | | 147,994,719 | |
| | | | Apparel, Accessories, & Luxury Goods - 0.2% | | | | | | | | |
| | 313,500 | | Carter’s, Inc.* | | | 5,676,261 | | | | 6,185,355 | |
| | | | Education Services - 0.8% | | | | | | | | |
| | 529,500 | | DeVry, Inc. | | | 28,254,680 | | | | 26,231,430 | |
| | | | General Merchandise Stores - 1.0% | | | | | | | | |
| | 1,245,200 | | Big Lots, Inc.* | | | 34,796,232 | | | | 34,653,916 | |
| | | | Leisure Facilities - 0.4% | | | | | | | | |
| | 391,700 | | Life Time Fitness, Inc.* | | | 11,996,549 | | | | 12,248,459 | |
| | | | Total Consumer Discretionary | | | 246,898,864 | | | | 240,510,183 | |
| | | | This sector is 2.6% below your Fund’s cost. | | | | | | | | |
CONSUMER STAPLES | | | | | | | | |
| | | | Food Retail - 0.1% | | | | | | | | |
| | 93,500 | | Casey’s General Stores, Inc. | | | 2,751,898 | | | | 2,820,895 | |
| | | | Household Products - 2.2% | | | | | | | | |
| | 1,182,900 | | Church & Dwight Co., Inc. | | | 64,426,094 | | | | 73,446,261 | |
| | | | Hypermarkets & Super Centers - 3.0% | | | | | | | | |
| | 1,703,300 | | Wal-Mart Stores, Inc. | | | 102,199,245 | | | | 102,010,637 | |
| | | | Packaged Foods & Meats - 2.8% | | | | | | | | |
| | 3,211,700 | | Dean Foods Co.* | | | 76,890,963 | | | | 75,025,312 | |
| | 296,400 | | Ralcorp Holdings, Inc.* | | | 18,122,207 | | | | 19,980,324 | |
| | | | Soft Drinks - 1.0% | | | | | | | | |
| | 662,700 | | The Coca-Cola Co. | | | 34,119,026 | | | | 35,043,576 | |
| | | | Total Consumer Staples | | | 298,509,433 | | | | 308,327,005 | |
| | | | This sector is 3.3% above your Fund’s cost. | | | | | | | | |
ENERGY | | | | | | | | |
| | | | Coal & Consumable Fuels - 0.4% | | | | | | | | |
| | 294,600 | | Walter Industries, Inc. | | | 8,950,396 | | | | 13,978,770 | |
| | | | Oil & Gas Equipment & Services - 3.7% | | | | | | | | |
| | 268,800 | | Core Laboratories N.V. | | | 29,439,926 | | | | 27,234,816 | |
| | 65,300 | | Lufkin Industries, Inc. | | | 5,744,690 | | | | 5,181,555 | |
| | 862,300 | | Superior Energy Services, Inc.* | | | 42,589,191 | | | | 26,852,022 | |
| | 120,569 | | Tesco Corp.* | | | 3,689,796 | | | | 2,524,715 | |
| | 2,240,800 | | Weatherford International Ltd.* | | | 89,596,486 | | | | 56,333,712 | |
| | 368,300 | | Willbros Group, Inc.* | | | 12,714,334 | | | | 9,759,950 | |
Brandywine Fund, Inc.
Schedule of Investments (Continued)
September 30, 2008
| Shares | | | | Cost | | | Value | |
Common Stocks - 93.9% (a) (Continued) | | | | | | |
| | Oil & Gas Exploration & Production - 3.5% | | | | | | |
| | 1,261,900 | | Comstock Resources, Inc.* | | $ | 81,122,918 | | | $ | 63,158,095 | |
| | 374,600 | | EXCO Resources, Inc.* | | | 6,040,226 | | | | 6,113,472 | |
| | 181,800 | | Goodrich Petroleum Corp.* | | | 8,276,282 | | | | 7,924,662 | |
| | 1,988,000 | | Petrohawk Energy Corp.* | | | 56,706,338 | | | | 43,000,440 | |
| | | | Total Energy | | | 344,870,583 | | | | 262,062,209 | |
| | | | This sector is 24.0% below your Fund’s cost. | | | | | | | | |
FINANCIALS | | | | | | | | |
| | | Property & Casualty Insurance - 0.0% | | | | | | | | |
| | 20,900 | | ProAssurance Corp.* | | | 1,024,450 | | | | 1,170,400 | |
| | | | Regional Banks - 0.0% | | | | | | | | |
| | 27,300 | | Hancock Holding Co. | | | 1,414,126 | | | | 1,392,300 | |
| | | | Total Financials | | | 2,438,576 | | | | 2,562,700 | |
| | | | This sector is 5.1% above your Fund’s cost. | | | | | | | | |
HEALTH CARE | | | | | | | | |
| | | Biotechnology - 3.0% | | | | | | | | |
| | 1,313,600 | | Cephalon, Inc.* | | | 90,485,951 | | | | 101,790,864 | |
| | | | Health Care Distributors - 0.3% | | | | | | | | |
| | 456,900 | | PSS World Medical, Inc.* | | | 8,924,649 | | | | 8,909,550 | |
| | | | Health Care Equipment - 5.2% | | | | | | | | |
| | 956,900 | | Beckman Coulter, Inc. | | | 65,980,405 | | | | 67,930,331 | |
| | 896,300 | | Gen-Probe Inc.* | | | 51,279,521 | | | | 47,548,715 | |
| | 1,359,400 | | ResMed Inc.* | | | 61,862,383 | | | | 58,454,200 | |
| | 150,000 | | Wright Medical Group, Inc.* | | | 4,346,013 | | | | 4,566,000 | |
| | | | Health Care Facilities - 0.3% | | | | | | | | |
| | 282,400 | | Psychiatric Solutions, Inc.* | | | 8,583,435 | | | | 10,717,080 | |
| | | | Health Care Services - 0.3% | | | | | | | | |
| | 238,500 | | Amedisys, Inc.* | | | 13,393,278 | | | | 11,607,795 | |
| | | | Health Care Supplies - 0.5% | | | | | | | | |
| | 488,100 | | The Cooper Companies, Inc. | | | 18,312,944 | | | | 16,966,356 | |
| | | | Health Care Technology - 0.4% | | | | | | | | |
| | 659,600 | | Eclipsys Corp.* | | | 13,482,054 | | | | 13,818,620 | |
| | | | Life Sciences Tools & Services - 12.7% | | | | | | | | |
| | 231,200 | | Charles River Laboratories International, Inc.* | | | 14,171,228 | | | | 12,838,536 | |
| | 1,422,200 | | Covance Inc.* | | | 119,142,019 | | | | 125,736,702 | |
| | 2,515,800 | | Invitrogen Corp.* | | | 102,253,813 | | | | 95,097,240 | |
| | 3,254,600 | | Thermo Fisher Scientific, Inc.* | | | 125,176,978 | | | | 179,003,000 | |
| | 382,300 | | Waters Corp.* | | | 24,660,140 | | | | 22,242,214 | |
| | | | Pharmaceuticals - 5.8% | | | | | | | | |
| | 941,400 | | Abbott Laboratories | | | 54,445,009 | | | | 54,205,812 | |
| | 2,414,700 | | Perrigo Co. | | | 92,702,839 | | | | 92,869,362 | |
| | 1,120,300 | | Teva Pharmaceutical Industries Ltd. SP-ADR | | | 48,237,446 | | | | 51,298,537 | |
| | | | Total Health Care | | | 917,440,105 | | | | 975,600,914 | |
| | | | This sector is 6.3% above your Fund’s cost. | | | | | | | | |
INDUSTRIALS | | | | | | | | |
| | | Air Freight & Logistics - 0.1% | | | | | | | | |
| | 90,500 | | Atlas Air Worldwide Holdings, Inc.* | | | 4,522,923 | | | | 3,648,055 | |
| | | | Airlines - 0.2% | | | | | | | | |
| | 544,300 | | Southwest Airlines Co. | | | 8,662,535 | | | | 7,897,793 | |
| | | | Construction & Engineering - 2.7% | | | | | | | | |
| | 668,600 | | EMCOR Group, Inc.* | | | 20,151,468 | | | | 17,597,552 | |
| | 138,800 | | Fluor Corp. | | | 9,055,840 | | | | 7,731,160 | |
| | 2,523,600 | | Quanta Services, Inc.* | | | 78,087,149 | | | | 68,162,436 | |
| | | | Construction & Farm Machinery & Heavy Trucks - 1.0% | | | | | | | | |
| | 113,750 | | Titan International, Inc. | | | 3,411,647 | | | | 2,425,150 | |
| | 643,900 | | Wabtec Corp. d/b/a Westinghouse Air Brake Technologies Corp. | | | 25,652,271 | | | | 32,986,997 | |
| | | | Electrical Components & Equipment - 1.4% | | | | | | | | |
| | 2,676,600 | | GrafTech International Ltd.* | | | 64,354,925 | | | | 40,443,426 | |
| | 365,500 | | Polypore International, Inc.* | | | 8,752,064 | | | | 7,861,905 | |
| | | | Environmental & Facilities Services - 0.6% | | | | | | | | |
| | 545,250 | | Waste Connections, Inc.* | | | 12,526,446 | | | | 18,702,075 | |
| | | | Industrial Conglomerates - 1.2% | | | | | | | | |
| | 1,602,400 | | McDermott International, Inc.* | | | 11,554,791 | | | | 40,941,320 | |
| | | | Industrial Machinery - 1.1% | | | | | | | | |
| | 107,600 | | Chart Industries, Inc.* | | | 4,922,390 | | | | 3,073,056 | |
| | 32,900 | | ESCO Technologies, Inc.* | | | 1,568,297 | | | | 1,584,793 | |
| | 440,500 | | SPX Corp. | | | 54,191,306 | | | | 33,918,500 | |
| | | | Marine - 0.3% | | | | | | | | |
| | 173,000 | | Eagle Bulk Shipping Inc. | | | 2,398,450 | | | | 2,411,620 | |
| | 146,600 | | Genco Shipping & Trading Ltd. | | | 8,082,168 | | | | 4,872,984 | |
| | 368,800 | | Safe Bulkers, Inc. | | | 7,007,200 | | | | 4,019,920 | |
| | | | Marine Ports & Services - 0.4% | | | | | | | | |
| | 613,800 | | Aegean Marine Petroleum Network Inc. | | | 20,332,965 | | | | 13,718,430 | |
| | | | Railroads - 0.4% | | | | | | | | |
| | 367,000 | | Genesee & Wyoming Inc.* | | | 14,279,376 | | | | 13,769,840 | |
| | | | Research & Consulting Servies - 2.0% | | | | | | | | |
| | 959,100 | | FTI Consulting Inc.* | | | 65,452,321 | | | | 69,285,384 | |
| | | | Security & Alarm Services - 1.6% | | | | | | | | |
| | 2,140,600 | | Corrections Corporation of America* | | | 57,277,557 | | | | 53,193,910 | |
| | | | Total Industrials | | | 482,244,089 | | | | 448,246,306 | |
| | | | This sector is 7.0% below your Fund’s cost. | | | | | | | | |
INFORMATION TECHNOLOGY | | | | | | | | |
| | | Application Software - 0.3% | | | | | | | | |
| | 143,500 | | Informatica Corp.* | | | 2,443,802 | | | | 1,864,065 | |
| | 817,100 | | Nuance Communications, Inc.* | | | 12,689,135 | | | | 9,960,449 | |
Brandywine Fund, Inc.
Schedule of Investments (Continued)
September 30, 2008
| Shares or | | | | | | | | |
| Principal | | | | | | | | |
| Amount | | | | Cost | | | Value | |
Common Stocks - 93.9% (a) (Continued) | | | | | | |
| | Communications Equipment - 7.4% | | | | | | |
| | 1,816,900 | | CommScope, Inc.* | | $ | 81,156,421 | | | $ | 62,937,416 | |
| | 2,624,800 | | Harris Corp. | | | 103,574,334 | | | | 121,265,760 | |
| | 3,284,400 | | Juniper Networks, Inc.* | | | 84,235,223 | | | | 69,202,308 | |
| | | | Computer Hardware - 1.5% | | | | | | | | |
| | 447,400 | | Apple, Inc.* | | | 73,180,245 | | | | 50,851,484 | |
| | | | Data Processing & Outsourced Services - 2.8% | | | | | | | | |
| | 1,651,400 | | Affiliated Computer Services, Inc.* | | | 83,460,266 | | | | 83,610,382 | |
| | 672,800 | | CyberSource Corp.* | | | 10,670,687 | | | | 10,838,808 | |
| | | | Home Entertainment Software - 1.0% | | | | | | | | |
| | 2,226,600 | | Activision Blizzard, Inc.* | | | 37,423,600 | | | | 34,356,438 | |
| | | | Internet Software & Services - 0.4% | | | | | | | | |
| | 387,600 | | Open Text Corp.* | | | 13,451,649 | | | | 13,403,208 | |
| | | | IT Consulting & Other Services - 0.8% | | | | | | | | |
| | 1,283,300 | | SAIC, Inc.* | | | 24,430,997 | | | | 25,961,159 | |
| | | | Semiconductors - 3.6% | | | | | | | | |
| | 3,443,400 | | Altera Corp. | | | 74,278,333 | | | | 71,209,512 | |
| | 446,000 | | Atheros Communications* | | | 12,965,571 | | | | 10,516,680 | |
| | 370,900 | | Monolithic Power Systems, Inc.* | | | 8,967,320 | | | | 6,442,533 | |
| | 3,162,400 | | PMC-Sierra, Inc.* | | | 27,419,517 | | | | 23,465,008 | |
| | 396,300 | | Silicon Laboratories Inc.* | | | 12,520,808 | | | | 12,166,410 | |
| | | | Systems Software - 6.6% | | | | | | | | |
| | 6,176,800 | | Check Point Software Technologies Ltd.* | | | 140,333,959 | | | | 140,460,432 | |
| | 1,645,800 | | McAfee Inc.* | | | 60,539,027 | | | | 55,891,368 | |
| | 1,128,600 | | MICROS Systems, Inc.* | | | 37,196,703 | | | | 30,088,476 | |
| | | | Total Information Technology | | | 900,937,597 | | | | 834,491,896 | |
| | | | This sector is 7.4% below your Fund’s cost. | | | | | | | | |
MATERIALS | | | | | | | | |
| | | Diversified Chemicals - 1.7% | | | | | | | | |
| | 1,117,300 | | FMC Corp. | | | 73,337,198 | | | | 57,418,047 | |
| | | | Metal & Glass Containers - 2.5% | | | | | | | | |
| | 3,828,600 | | Crown Holdings, Inc.* | | | 94,565,005 | | | | 85,033,206 | |
| | | | Total Materials | | | 167,902,203 | | | | 142,451,253 | |
| | | | This sector is 15.2% below your Fund’s cost. | | | | | | | | |
| | | | Total common stocks | | | 3,361,241,450 | | | | 3,214,252,466 | |
Short-Term Investments - 6.3% (a) | | | | | | | | |
| | | Commercial Paper - 6.2% | | | | | | | | |
| $ | 100,000,000 | | Citigroup Funding Inc., due 10/01/08, discount of 4.00% | | | 100,000,000 | | | | 100,000,000 | |
| | 113,500,000 | | General Electric Capital Corp., due 10/01/08, discount of 2.00% | | | 113,500,000 | | | | 113,500,000 | |
| | | | Total commercial paper | | | 213,500,000 | | | | 213,500,000 | |
| | | | Variable Rate Demand Note - 0.1% | | | | | | | | |
| | 2,199,033 | | U.S. Bank, N.A., 3.68% | | | 2,199,033 | | | | 2,199,033 | |
| | | | Total short-term investments | | | 215,699,033 | | | | 215,699,033 | |
| | | | Total investments - 100.2% | | $ | 3,576,940,483 | | | | 3,429,951,499 | |
| | | | Liabilities, less cash and receivables - (0.2%) (a) | | | | | | | (8,164,073 | ) |
| | | | TOTAL NET ASSETS - 100.0% | | | | | | $ | 3,421,787,426 | |
| * | Non-dividend paying security. |
| (a) | Percentages for the various classifications relate to net assets. |
ADR - American Depositary Receipts.
N.V. - Netherlands Antilles Limited Liability Corp.
The accompanying notes to financial statements are an integral part of this schedule.
Brandywine Fund, Inc.
Statement of Operations
For the Year Ended September 30, 2008
| Income: | | | |
| Dividends | | $ | 19,765,384 | |
| Interest | | | 4,054,770 | |
| Total income | | | 23,820,154 | |
| | | | | |
| Expenses: | | | | |
| Management fees | | | 43,846,248 | |
| Transfer agent fees | | | 2,137,571 | |
| Administrative and accounting services | | | 461,067 | |
| Custodian fees | | | 318,379 | |
| Printing and postage expense | | | 315,626 | |
| Board of Directors fees and expenses | | | 138,170 | |
| Registration fees | | | 63,702 | |
| Professional fees | | | 63,249 | |
| Insurance expense | | | 54,384 | |
| Other expenses | | | 17,571 | |
| Total expenses | | | 47,415,967 | |
| Net Investment Loss | | | (23,595,813 | ) |
| Net Realized Loss on Investments | | | (74,950,120 | ) |
| Net Decrease in Unrealized Appreciation on Investments | | | (1,082,904,525 | ) |
| Net Loss on Investments | | | (1,157,854,645 | ) |
| Net Decrease in Net Assets Resulting From Operations | | $ | (1,181,450,458 | ) |
Statements of Changes in Net Assets
For the Years Ended September 30, 2008 and 2007
| | | 2008 | | | 2007 | |
| Operations: | | | | | | |
| Net investment loss | | $ | (23,595,813 | ) | | $ | (23,464,966 | ) |
| Net realized (loss) gain on investments | | | (74,950,120 | ) | | | 571,371,370 | |
| Net (decrease) increase in unrealized appreciation on investments | | | (1,082,904,525 | ) | | | 531,009,089 | |
| Net (decrease) increase in net assets resulting from operations | | | (1,181,450,458 | ) | | | 1,078,915,493 | |
| | | | | | | | | |
| Distributions to Shareholders: | | | | | | | | |
| Distributions from net realized gains ($5.22252 and $0.24662 per share, respectively) | | | (628,623,195 | ) | | | (30,419,122 | ) |
| Fund Share Activities: | | | | | | | | |
| Proceeds from shares issued (12,943,440 and 9,363,718 shares, respectively) | | | 446,449,782 | | | | 347,355,401 | |
| Net asset value of shares issued in distributions reinvested (15,978,665 and 840,556 shares, respectively) | | | 599,258,536 | | | | 28,878,771 | |
| Cost of shares redeemed (19,927,339 and 17,804,121 shares, respectively) | | | (665,114,852 | ) | | | (639,755,297 | ) |
| Net increase (decrease) in net assets derived from Fund share activities | | | 380,593,466 | | | | (263,521,125 | ) |
| Total (Decrease) Increase | | | (1,429,480,187 | ) | | | 784,975,246 | |
| | | | | | | | | |
| Net Assets at the Beginning of the Year | | | 4,851,267,613 | | | | 4,066,292,367 | |
| Net Assets at the End of the Year | | $ | 3,421,787,426 | | | $ | 4,851,267,613 | |
| (Includes accumulated net investment loss of $0 and $0, respectively) | | | | | | | | |
The accompanying notes to financial statements are an integral part of these statements.
Brandywine Fund, Inc.
Financial Highlights
(Selected data for each share of the Fund outstanding throughout each year)
| | | Years Ended September 30, | |
| | | 2008 | | | 2007 | | | 2006 | | | 2005 | | | 2004 | |
| PER SHARE OPERATING PERFORMANCE: | | | | | | | | | | | | | | | |
| Net asset value, beginning of year | | $ | 40.98 | | | $ | 32.27 | | | $ | 31.50 | | | $ | 24.19 | | | $ | 21.30 | |
| Income from investment operations: | | | | | | | | | | | | | | | | | | | | |
Net investment loss(1) | | | (0.18 | ) | | | (0.19 | ) | | | (0.10 | ) | | | (0.08 | ) | | | (0.13 | ) |
| Net realized and unrealized (losses) gains on investments | | | (8.72 | ) | | | 9.15 | | | | 0.87 | | | | 7.39 | | | | 3.02 | |
| Total from investment operations | | | (8.90 | ) | | | 8.96 | | | | 0.77 | | | | 7.31 | | | | 2.89 | |
| Less distributions: | | | | | | | | | | | | | | | | | | | | |
| Distributions from net investment income | | | — | | | | — | | | | — | | | | — | | | | — | |
| Distributions from net realized gains | | | (5.22 | ) | | | (0.25 | ) | | | — | | | | — | | | | — | |
| Total from distributions | | | (5.22 | ) | | | (0.25 | ) | | | — | | | | — | | | | — | |
| Net asset value, end of year | | $ | 26.86 | | | $ | 40.98 | | | $ | 32.27 | | | $ | 31.50 | | | $ | 24.19 | |
| TOTAL RETURN | | | (25.16 | %) | | | 27.90 | % | | | 2.44 | % | | | 30.22 | % | | | 13.57 | % |
| RATIOS/SUPPLEMENTAL DATA: | | | | | | | | | | | | | | | | | | | | |
| Net assets, end of year (in 000’s $) | | | 3,421,787 | | | | 4,851,268 | | | | 4,066,292 | | | | 3,995,582 | | | | 3,586,793 | |
| Ratio of expenses to average net assets | | | 1.08 | % | | | 1.08 | % | | | 1.08 | % | | | 1.08 | % | | | 1.08 | % |
| Ratio of net investment loss to average net assets | | | (0.54 | %) | | | (0.54 | %) | | | (0.31 | %) | | | (0.25 | %) | | | (0.55 | %) |
| Portfolio turnover rate | | | 210 | % | | | 162 | % | | | 200 | % | | | 183 | % | | | 247 | % |
| (1) | Net investment loss per share was calculated using average shares outstanding. |
The accompanying notes to financial statements are an integral part of this statement.
Definitions and Disclosures (This section is not part of the audited financial statements.) Performance data quoted represent past performance; past performance does not guarantee future results. The investment return and principal value of an investment will fluctuate so that an investor’s shares, when redeemed, may be worth more or less than their original cost. Current performance of the Funds may be lower or higher than the performance quoted. Performance data current to the most recent month end may be obtained by visiting www.brandywinefunds.com. The Funds’ investment objectives, risks, charges and expenses must be considered carefully before investing. The prospectus contains this and other important information about the investment companies, and it may be obtained by calling 1-800-656-3017, or visiting www.brandywinefunds.com. Read it carefully before investing. Fund holdings and sector weightings are subject to change at any time and are not recommendations to buy or sell any securities. Securities discussed were not held by the Funds as of 9/30/08, unless listed in the accompanying financial statements. References to the earnings growth rates of the Funds refer solely to the estimated earnings growth rates of the average investment holding of the Funds based on consensus estimates from Baseline and not to the actual performance of the Funds themselves. Baseline Financial Services, Inc. (Baseline) provides analytical information and services to the investment community. The Russell 1000, Russell 1000 Growth, Russell 3000, Russell 3000 Growth and S&P 500 Indexes are unmanaged indexes commonly used to measure the performance of U.S. stocks. You cannot invest directly in an index. As of September 30, 2008, the Russell 1000 Index’s average annual total returns for 1, 5 and 10 years were -22.10, 5.50 and 3.49 percent; the Russell 1000 Growth Index’s were -20.88, 3.74 and 0.59 percent; the Russell 3000 Index’s were -21.52, 5.70 and 3.80 percent; the Russell 3000 Growth Index’s were -20.60, 3.96 and 0.89 percent; and the S&P 500 Index’s were -21.98, 5.16 and 3.06 percent. |
Management’s Discussion of Results, Brandywine Blue Fund
Dramatic events related to the ongoing credit crisis brought a disappointing end to the fiscal year ended September 30, 2008. After weighing on the market’s mindset for the better part of the fiscal year, concerns about the global economic impact of the growing mortgage mess became the dominant influence on stock prices as the period came to a close.
Brandywine Blue Fund employs an investment strategy that capitalizes on the long-term relationship between earnings performance and stock prices. Final results for the fiscal year reflected a market driven more by deteriorating sentiment than by individual-company fundamentals.
Brandywine Blue declined 30.70 percent in the 12 months through September. The S&P 500, Russell 1000 and Russell 1000 Growth Indexes declined 21.98, 22.10 and 20.88 percent.
Brandywine Blue started the fiscal year by gaining ground in the December quarter of 2007 as its benchmarks retraced. Industrial holdings benefiting from global trends in energy and agricultural drove performance as they demonstrated earnings strength at a time when rising oil prices cast doubt on consumer spending power. Limited exposure to consumer-related companies aided relative results as well.
The credit crisis, which to this point mainly showed itself to stock investors in the form of big charges against earnings among financial institutions, became a more pressing concern in the March quarter of 2008. The government assisted JP Morgan Chase in acquiring Bear Stearns, a major investment bank beset by losses related to mortgage-backed securities. Amid widespread declines in stocks, holdings from the technology and industrial sectors contributed to a decline in Brandywine Blue that was larger than declines in its benchmarks.
The Fund’s performance rebounded solidly in the June quarter as a continued rise in oil prices drew attention to earnings strength among the portfolio’s energy-related holdings. Brandywine Blue’s gain outpaced mixed results in benchmarks, giving the Fund a relative performance edge through the first nine months of the fiscal year.
Brandywine Blue underperformed benchmarks in the September quarter as the energy-related holdings that drove June-quarter performance became a significant drag in a market increasingly concerned about the credit crisis. Oil prices retreated on growing global economic uncertainty, which skittish investors took as a cue to abandon the energy sector.
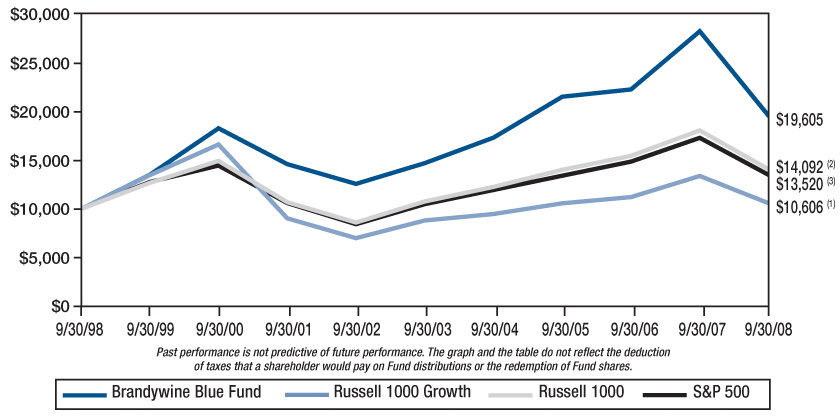
Comparison of Change in Value of $10,000 Investment in Brandywine Blue Fund, Russell 1000 Growth(1), Russell 1000 Index(2) and S&P 500 Index(3) |
| | (1) | | The Russell 1000 Growth Index measures the performance of those Russell 1000 Index companies with higher price-to-book ratios and higher forecasted growth values and includes dividends. | |
| | (2) | | The Russell 1000 Index, a trademark of the Frank Russell Company, is the largest 1,000 companies of the 3,000 largest publicly traded companies in the United States equity market and includes dividends. | |
| | (3) | | The S&P 500 Index consists of 500 stocks, mostly on the New York Stock Exchange, selected by the Standard & Poor’s Ratings Group. Each stock’s weighting is based on its relative total market value and includes dividends. | |
| | | | | |
| Average Annual Total Return |
| 1-Year | 5-Year | 10-Year | |
| -30.70% | 5.90% | 6.97% | 11.18% |
Brandywine Blue Fund
Statement of Assets and Liabilities
September 30, 2008
| Assets: | | | |
| Investments in securities, at value (cost $3,503,208,535) | | $ | 3,202,746,938 | |
| Receivable from investments sold | | | 211,626,276 | |
| Receivable from shareholders for purchases | | | 85,249,739 | |
| Dividends and interest receivable | | | 1,754,514 | |
| Other assets | | | 531 | |
| Total assets | | $ | 3,501,377,998 | |
| Liabilities: | | | | |
| Payable to brokers for investments purchased | | $ | 160,573,687 | |
| Payable to adviser for management fees | | | 2,928,999 | |
| Payable to shareholders for redemptions | | | 13,387,931 | |
| Other liabilities | | | 819,347 | |
| Total liabilities | | | 177,709,964 | |
| Net Assets: | | | | |
| Capital Stock, $0.01 par value; 500,000,000 shares authorized; 139,293,706 shares outstanding | | | 4,315,215,019 | |
| Net unrealized depreciation on investments | | | (300,461,597 | ) |
| Accumulated net realized loss on investments | | | (691,085,388 | ) |
| Net assets | | | 3,323,668,034 | |
| Total liabilities and net assets | | $ | 3,501,377,998 | |
| Calculation of net asset value per share: | | | | |
Net asset value, offering and redemption price per share ($3,323,668,034 ÷ 139,293,706 shares outstanding) | | $ | 23.86 | |
The accompanying notes to financial statements are an integral part of this statement.
Schedule of Investments
September 30, 2008
| Shares | | | | Cost | | | Value | |
Common Stocks - 87.6% (a) | | | | | | |
CONSUMER DISCRETIONARY | | | | | | |
| | General Merchandise Stores - 2.4% | | | | | | |
| | 1,594,300 | | Target Corp. | | $ | 90,118,521 | | | $ | 78,200,415 | |
| | | | Total Consumer Discretionary | | | 90,118,521 | | | | 78,200,415 | |
| | | | This sector is 13.2% below your Fund’s cost. | | | | | | | | |
CONSUMER STAPLES | | | | | | | | |
| | | Food Retail - 5.4% | | | | | | | | |
| | 2,784,100 | | Kroger Co. | | | 72,084,937 | | | | 76,507,068 | |
| | 4,384,600 | | Safeway Inc. | | | 116,057,002 | | | | 104,002,712 | |
| | | | Hypermarkets & Super Centers - 5.1% | | | | | | | | |
| | 2,829,100 | | Wal-Mart Stores, Inc. | | | 172,458,058 | | | | 169,434,799 | |
| | | | Soft Drinks - 4.0% | | | | | | | | |
| | 2,542,400 | | The Coca-Cola Co. | | | 136,205,861 | | | | 134,442,112 | |
| | | | Total Consumer Staples | | | 496,805,858 | | | | 484,386,691 | |
| | | | This sector is 2.5% below your Fund’s cost. | | | | | | | | |
ENERGY | | | | | | | | |
| | | Oil & Gas Drilling - 2.2% | | | | | | | | |
| | 654,372 | | Transocean, Inc. | | | 85,077,513 | | | | 71,876,220 | |
| | | | Oil & Gas Equipment & Services - 2.7% | | | | | | | | |
| | 3,565,000 | | Weatherford International Ltd.* | | | 123,448,506 | | | | 89,624,100 | |
| | | | Oil & Gas Exploration & Production - 1.3% | | | | | | | | |
| | 2,014,400 | | Petrohawk Energy Corp.* | | | 66,504,231 | | | | 43,571,472 | |
| | | | Total Energy | | | 275,030,250 | | | | 205,071,792 | |
| | | | This sector is 25.4% below your Fund’s cost. | | | | | | | | |
HEALTH CARE | | | | | | | | |
| | | Biotechnology - 3.8% | | | | | | | | |
| | 2,735,400 | | Gilead Sciences, Inc.* | | | 106,308,710 | | | | 124,679,532 | |
| | | | Health Care Equipment - 0.8% | | | | | | | | |
| | 607,800 | | St. Jude Medical, Inc.* | | | 26,015,405 | | | | 26,433,222 | |
| | | | Health Care Services - 1.9% | | | | | | | | |
| | 850,400 | | Express Scripts, Inc.* | | | 62,629,529 | | | | 62,776,528 | |
Brandywine Blue Fund
Schedule of Investments (Continued)
September 30, 2008
| Shares or | | | | | | | | |
| Principal | | | | | | | | |
| Amount | | | | Cost | | | Value | |
Common Stocks - 87.6% (a) (Continued) | | | | | | |
| | Life Sciences Tools & Services - 6.0% | | | | | | |
| | 3,093,100 | | Thermo Fisher Scientific, Inc.* | | $ | 140,207,719 | | | $ | 170,120,500 | |
| | 513,700 | | Waters Corp.* | | | 33,187,266 | | | | 29,887,066 | |
| | | | Pharmaceuticals - 7.5% | | | | | | | | |
| | 2,458,600 | | Abbott Laboratories | | | 144,789,087 | | | | 141,566,188 | |
| | 2,384,900 | | Teva Pharmaceutical Industries Ltd. SP-ADR | | | 106,535,975 | | | | 109,204,571 | |
| | | | Total Health Care | | | 619,673,691 | | | | 664,667,607 | |
| | | | This sector is 7.3% above your Fund’s cost. | | | | | | | | |
INDUSTRIALS | | | | | | | | |
| | | Airlines - 3.2% | | | | | | | | |
| | 7,344,100 | | Southwest Airlines Co. | | | 104,256,189 | | | | 106,562,891 | |
| | | | Construction & Engineering - 3.5% | | | | | | | | |
| | 1,797,800 | | Fluor Corp. | | | 94,375,565 | | | | 100,137,460 | |
| | 402,700 | | Foster Wheeler Ltd.* | | | 28,200,843 | | | | 14,541,497 | |
| | | | Construction & Farm Machinery & Heavy Trucks - 2.5% | | | | | | | | |
| | 1,644,900 | | Deere & Co. | | | 110,716,081 | | | | 81,422,550 | |
| | | | Industrial Conglomerates - 0.4% | | | | | | | | |
| | 557,400 | | McDermott International, Inc.* | | | 25,247,725 | | | | 14,241,570 | |
| | | | Industrial Machinery - 1.9% | | | | | | | | |
| | 805,300 | | SPX Corp. | | | 101,477,967 | | | | 62,008,100 | |
| | | | Total Industrials | | | 464,274,370 | | | | 378,914,068 | |
| | | | This sector is 18.4% below your Fund’s cost. | | | | | | | | |
INFORMATION TECHNOLOGY | | | | | | | | |
| | | Application Software - 6.2% | | | | | | | | |
| | 2,462,200 | | Adobe Systems Inc.* | | | 110,874,904 | | | | 97,183,034 | |
| | 3,441,800 | | Intuit Inc.* | | | 106,002,391 | | | | 108,795,298 | |
| | | | Communications Equipment - 5.5% | | | | | | | | |
| | 932,200 | | Harris Corp. | | | 46,296,272 | | | | 43,067,640 | |
| | 6,604,300 | | Juniper Networks, Inc.* | | | 169,083,218 | | | | 139,152,601 | |
| | | | Computer Hardware - 1.9% | | | | | | | | |
| | 553,700 | | Apple, Inc.* | | | 89,214,444 | | | | 62,933,542 | |
| | | | Home Entertainment Software - 2.5% | | | | | | | | |
| | 5,491,200 | | Activision Blizzard, Inc.* | | | 91,556,344 | | | | 84,729,216 | |
| | | | IT Consulting & Other Services - 2.3% | | | | | | | | |
| | 3,826,800 | | SAIC, Inc.* | | | 75,023,711 | | | | 77,416,164 | |
| | | | Semiconductors - 3.5% | | | | | | | | |
| | 5,610,600 | | Altera Corp. | | | 121,956,164 | | | | 116,027,208 | |
| | | | Systems Software - 0.7% | | | | | | | | |
| | 721,800 | | McAfee Inc.* | | | 27,344,999 | | | | 24,512,328 | |
| | | | Total Information Technology | | | 837,352,447 | | | | 753,817,031 | |
| | | | This sector is 10.0% below your Fund’s cost. | | | | | | | | |
MATERIALS | | | | | | | | |
| | | Commodity Chemicals - 1.8% | | | | | | | | |
| | 2,138,000 | | Celanese Corp. | | | 94,287,027 | | | | 59,671,580 | |
| | | | Fertilizers & Agricultural Chemicals - 3.2% | | | | | | | | |
| | 1,060,400 | | Monsanto Co. | | | 120,643,655 | | | | 104,958,392 | |
| | | | Total Materials | | | 214,930,682 | | | | 164,629,972 | |
| | | | This sector is 23.4% below your Fund’s cost. | | | | | | | | |
TELECOMMUNICATION SERVICES | | | | | | | | |
| | | Integrated Telecommunication Services - 2.9% | | | | | | | | |
| | 3,026,800 | | Verizon Communications Inc. | | | 104,537,833 | | | | 97,130,012 | |
| | | | Wireless Telecommunication Services - 2.5% | | | | | | | | |
| | 2,186,400 | | NII Holdings Inc.* | | | 107,463,821 | | | | 82,908,288 | |
| | | | Total Telecommunication Services | | | 212,001,654 | | | | 180,038,300 | |
| | | | This sector is 15.1% below your Fund’s cost. | | | | | | | | |
| | | | Total common stocks | | | 3,210,187,473 | | | | 2,909,725,876 | |
Short-Term Investments - 8.8% (a) | | | | | | | | |
| | | Commercial Paper - 8.7% | | | | | | | | |
| $ | 125,000,000 | | Citigroup Funding Inc., due 10/01/08, discount of 4.00% | | | 125,000,000 | | | | 125,000,000 | |
| | 165,500,000 | | General Electric Capital Corp., due 10/01/08, discount of 2.00% | | | 165,500,000 | | | | 165,500,000 | |
| | | | Total commercial paper | | | 290,500,000 | | | | 290,500,000 | |
| | | | Variable Rate Demand Note - 0.1% | | | | | | | | |
| | 2,521,062 | | U.S. Bank, N.A., 3.68% | | | 2,521,062 | | | | 2,521,062 | |
| | | | Total short-term investments | | | 293,021,062 | | | | 293,021,062 | |
| | | | Total investments - 96.4% | | $ | 3,503,208,535 | | | | 3,202,746,938 | |
| | | | Cash and receivables, less | | | | | | | | |
| | | | liabilities - 3.6% (a) | | | | | | | 120,921,096 | |
| | | | TOTAL NET ASSETS - 100.0% | | | | | | $ | 3,323,668,034 | |
| * | Non-dividend paying security. |
| (a) | Percentages for the various classifications relate to net assets. |
ADR - American Depositary Receipts.
The accompanying notes to financial statements are an integral part of this schedule.
Brandywine Blue Fund
Statement of Operations
For the Year Ended September 30, 2008
| Income: | | | |
| Dividends | | $ | 27,270,120 | |
| Interest | | | 6,568,709 | |
| Total income | | | 33,838,829 | |
| Expenses: | | | | |
| Management fees | | | 37,838,711 | |
| Transfer agent fees | | | 2,661,347 | |
| Printing and postage expense | | | 873,244 | |
| Administrative and accounting services | | | 384,191 | |
| Registration fees | | | 317,482 | |
| Custodian fees | | | 246,114 | |
| Board of Directors fees and expenses | | | 100,289 | |
| Professional fees | | | 64,266 | |
| Insurance expense | | | 50,102 | |
| Other expenses | | | 43,766 | |
| Total expenses | | | 42,579,512 | |
| Net Investment Loss | | | (8,740,683 | ) |
| Net Realized Loss on Investments | | | (638,841,633 | ) |
| Net Decrease in Unrealized Appreciation on Investments | | | (730,032,110 | ) |
| Net Loss on Investments | | | (1,368,873,743 | ) |
| Net Decrease in Net Assets Resulting From Operations | | $ | (1,377,614,426 | ) |
Statements of Changes in Net Assets
For the Years Ended September 30, 2008 and 2007
| | | 2008 | | | 2007 | |
| Operations: | | | | | | |
| Net investment loss | | $ | (8,740,683 | ) | | $ | (1,501,448 | ) |
| Net realized (loss) gain on investments | | | (638,841,633 | ) | | | 310,831,452 | |
| Net (decrease) increase in unrealized appreciation on investments | | | (730,032,110 | ) | | | 291,276,771 | |
| Net (decrease) increase in net assets resulting from operations | | | (1,377,614,426 | ) | | | 600,606,775 | |
| | | | | | | | | |
| Distributions to Shareholders: | | | | | | | | |
| Distributions from net realized gains ($3.86974 and $1.09995 per share, respectively) | | | (356,221,835 | ) | | | (67,271,293 | ) |
| Fund Share Activities: | | | | | | | | |
| Proceeds from shares issued (70,794,329 and 37,213,824 shares, respectively) | | | 2,277,198,544 | | | | 1,262,161,344 | |
| Net asset value of shares issued in distributions reinvested (8,447,066 and 1,820,755 shares, respectively) | | | 303,519,359 | | | | 57,780,654 | |
| Cost of shares redeemed (26,495,404 and 12,076,689 shares, respectively) | | | (827,494,470 | ) | | | (405,492,302 | ) |
| Net increase in net assets derived from Fund share activities | | | 1,753,223,433 | | | | 914,449,696 | |
| Total Increase | | | 19,387,172 | | | | 1,447,785,178 | |
| | | | | | | | | |
| Net Assets at the Beginning of the Year | | | 3,304,280,862 | | | | 1,856,495,684 | |
| Net Assets at the End of the Year | | $ | 3,323,668,034 | | | $ | 3,304,280,862 | |
| (Includes accumulated net investment loss of $0 and $0, respectively) | | | | | | | | |
The accompanying notes to financial statements are an integral part of these statements.
Brandywine Blue Fund
Financial Highlights
(Selected data for each share of the Fund outstanding throughout each year)
| | | Years Ended September 30, | |
| | | 2008 | | | 2007 | | | 2006 | | | 2005 | | | 2004 | |
| PER SHARE OPERATING PERFORMANCE: | | | | | | | | | | | | | | | |
| Net asset value, beginning of year | | $ | 38.18 | | | $ | 31.15 | | | $ | 31.33 | | | $ | 25.21 | | | $ | 21.40 | |
| Income from investment operations: | | | | | | | | | | | | | | | | | | | | |
Net investment loss(1) | | | (0.07 | ) | | | (0.02 | ) | | | (0.00 | )* | | | (0.04 | ) | | | (0.08 | ) |
| Net realized and unrealized (losses) gains on investments | | | (10.38 | ) | | | 8.15 | | | | 0.96 | | | | 6.16 | | | | 3.89 | |
| Total from investment operations | | | (10.45 | ) | | | 8.13 | | | | 0.96 | | | | 6.12 | | | | 3.81 | |
| Less distributions: | | | | | | | | | | | | | | | | | | | | |
| Distributions from net investment income | | | — | | | | — | | | | — | | | | — | | | | — | |
| Distributions from net realized gains | | | (3.87 | ) | | | (1.10 | ) | | | (1.14 | ) | | | — | | | | — | |
| Total from distributions | | | (3.87 | ) | | | (1.10 | ) | | | (1.14 | ) | | | — | | | | — | |
| Net asset value, end of year | | $ | 23.86 | | | $ | 38.18 | | | $ | 31.15 | | | $ | 31.33 | | | $ | 25.21 | |
| TOTAL RETURN | | | (30.70 | )% | | | 26.82 | % | | | 3.47 | % | | | 24.28 | % | | | 17.80 | % |
| RATIOS/SUPPLEMENTAL DATA: | | | | | | | | | | | | | | | | | | | | |
| Net assets, end of year (in 000’s $) | | | 3,323,668 | | | | 3,304,281 | | | | 1,856,496 | | | | 1,230,936 | | | | 531,516 | |
| Ratio of expenses to average net assets | | | 1.13 | % | | | 1.12 | % | | | 1.10 | % | | | 1.12 | % | | | 1.13 | % |
| Ratio of net investment loss to average net assets | | | (0.23 | %) | | | (0.06 | %) | | | (0.02 | %) | | | (0.13 | %) | | | (0.32 | %) |
| Portfolio turnover rate | | | 267 | % | | | 184 | % | | | 207 | % | | | 181 | % | | | 247 | % |
| (1) | Net investment loss per share was calculated using average shares outstanding. |
| * | Amount less than $0.005 per share. |
The accompanying notes to financial statements are an integral part of this statement.
The Brandywine Funds
Notes to Financial Statements
September 30, 2008
| (1) | Summary of Significant Accounting Policies |
| | The following is a summary of significant accounting policies of Brandywine Fund, Inc. (the “Brandywine Fund”) and Brandywine Blue Fund (the “Blue Fund,” one of two Funds in a series of the Brandywine Blue Fund, Inc.) (collectively the “Brandywine Funds” or the “Funds”). Each Fund is registered as a diversified open-end management company under the Investment Company Act of 1940, as amended. The Brandywine Blue Fund filed articles supplementary on October 6, 2008 increasing its authorized shares to 500,000,000. The assets and liabilities of each Fund are segregated and a shareholder’s interest is limited to the Fund in which the shareholder owns shares. The Brandywine Fund was incorporated under the laws of Maryland on October 9, 1985. The Blue Fund was incorporated under the laws of Maryland on November 13, 1990. The investment objective of each Fund is to produce long-term capital appreciation principally through investing in common stocks. |
| (a) | Each security, excluding short-term investments, is valued at the last sale price reported by the principal security exchange on which the issue is traded. Securities that are traded on the Nasdaq Markets are valued at the Nasdaq Official Closing Price, or if no sale is reported, the latest bid price. Securities which are traded over-the-counter are valued at the latest bid price. Securities for which quotations are not readily available are valued at fair value as determined by the investment adviser under the supervision of the Board of Directors. The fair value of a security may differ from the last quoted price and the Fund may not be able to sell a security at the fair value. Market quotations may not be available, for example, if trading in particular securities has halted during the day and not resumed prior to the close of trading on the New York Stock Exchange. Short-term investments with maturities of 60 days or less are valued at amortized cost which approximates value. For financial reporting purposes, investment transactions are recorded on the trade date; however, for purposes of executing shareholder transactions, the Funds record changes in holdings of portfolio securities no later than the first business day after the trade date in accordance with Rule 2a-4 of the Investment Company Act. Accordingly, certain differences between net asset value for financial reporting and for executing shareholder transactions may arise. |
The Brandywine Funds
Notes to Financial Statements (Continued)
September 30, 2008
| (1) | Summary of Significant Accounting Policies (Continued) |
| | In September 2006, the Financial Accounting Standards Board (“FASB”) issued Statement of Financial Accounting Standards (“SFAS”) No. 157, “Fair Value Measurements.” This standard establishes a single authoritative definition of fair value, sets out a framework for measuring fair value and requires additional disclosures about fair value measurements. SFAS No. 157 applies to fair value measurements already required or permitted by existing standards. SFAS No. 157 is effective for financial statements issued for fiscal years beginning after November 15, 2007 and interim periods within those fiscal years. The changes to current generally accepted accounting principles from the application of this standard relate to the definition of fair value, the methods used to measure fair value, and the expanded disclosures about fair value measurements. The adoption of SFAS No. 157 will not impact the financial statement amounts; however, additional disclosures will be required regarding the inputs used to develop the measurements and the effect of certain of the measurements included within the Statement of Operations. |
| (b) | Net realized gains and losses on sales of securities are computed on the identified cost basis. |
| (c) | Dividend income is recorded on the ex-dividend date. Interest income is recorded on the accrual basis. |
| (d) | The Funds have investments in short-term variable rate demand notes, which are unsecured instruments. The Funds may be susceptible to credit risk with respect to these notes to the extent the issuer defaults on its payment obligation. The Funds’ policy is to monitor the creditworthiness of the issuer and nonperformance by these counterparties is not anticipated. |
| (e) | Accounting principles generally accepted in the United States of America (“GAAP”) require that permanent differences between income for financial reporting and tax purposes be reclassified in the capital accounts. |
| (f) | The preparation of financial statements in conformity with GAAP requires management to make estimates and assumptions that affect the reported amounts of assets and liabilities and disclosure of contingent assets and liabilities at the date of the financial statements and the reported amounts of revenues and expenses during the reporting period. Actual results could differ from these estimates. |
| (g) | No provision has been made for Federal income taxes since the Funds have elected to be taxed as “regulated investment companies” and intend to distribute substantially all net investment company taxable income and net capital gains to shareholders and otherwise comply with the provisions of the Internal Revenue Code applicable to regulated investment companies. |
| (h) | Effective March 31, 2008, the Funds adopted FASB interpretation No. 48 (FIN 48), “Accounting for Uncertainty in Income Taxes”. FIN 48 requires the evaluation of tax positions taken on previously filed tax returns or expected to be taken on future returns. These positions must meet a “more-likely-than-not” standard that, based on the technical merits, have a more than fifty percent likelihood of being sustained upon examination. In evaluating whether a tax position has met the recognition threshold, the Funds must presume that the position will be examined by the appropriate taxing authority that has full knowledge of all relevant information. Tax positions not deemed to meet the “more-likely-than-not” threshold are recorded as a tax expense in the current year. |
| | FIN 48 requires the Funds to analyze all open tax years, as defined by the Statue of Limitations, for all major jurisdictions. Open tax years are those that are open for exam by taxing authorities. Major jurisdictions for the Funds include Federal and the state of Maryland. As of September 30, 2008, open Federal and Maryland tax years include the tax years ended September 30, 2005 through 2008. The Funds have no examination in progress. |
| | The Funds have reviewed all open tax years and major jurisdictions and concluded that the adoption of FIN 48 resulted in no effect to the Funds’ financial position or results of operations. There is no tax liability resulting from unrecognized tax benefits relating to uncertain income tax positions taken or expected to be taken on the tax return for the fiscal year-end September 30, 2008. The Funds are also not aware of any tax positions for which it is reasonably possible that the total amounts of unrecognized tax benefits will significantly change in the next twelve months. |
| (2) | Investment Adviser and Management Agreements and Transactions With Related Parties |
| | Each Fund has a management agreement with Friess Associates, LLC (the “Adviser”), with whom certain Officers and Directors of the Funds are affiliated, to serve as investment adviser and manager. Under the terms of the agreements, each Fund will pay the Adviser a monthly management fee at the annual rate of one percent (1%) on the daily net assets of such Fund. |
| The Adviser entered into sub-advisory agreements with its affiliate, Friess Associates of Delaware, LLC (the “Sub-Adviser”), to assist it in the day-to-day management of each of the Funds. The Adviser and, if so delegated, the Sub-Adviser supervise the investment portfolios of the Funds, directing the purchase and sale of investment securities in the day-to-day management of the Funds. The Adviser pays the Sub-Adviser a fee equal to 110% of the monthly expenses the Sub-Adviser incurs in performing its services as Sub-Adviser. This relationship does not increase the annual management fee the Funds pay to the Adviser. |
The Brandywine Funds
Notes to Financial Statements (Continued)
September 30, 2008
| (2) | Investment Adviser and Management Agreements and Transactions With Related Parties (Continued) |
| | The Brandywine Fund and Blue Fund paid each of the five independent directors annual fees of $23,875 and $17,125 each, respectively. The lead independent director and chairman of the audit committee are paid an additional $5,000 annually, divided proportionately among all the Brandwine Funds. All of the corresponding fees the directors receive are paid quarterly to the directors and then invested on the payment date in shares of the Funds at the net asset value of the Funds on the payment date. The Funds also reimburse directors for travel costs incurred in order to attend meetings of the Board of Directors. For the year ended September 30, 2008, the Funds expensed the following directors fees and costs: |
| | | Brandywine Fund | | | Blue Fund | |
| Directors Fees and Travel Costs Paid during the Year | | $ | 138,170 | | | $ | 100,289 | |
| | Under the Funds’ organizational documents, each Director, officer, employee or other agent of the Fund (including the Funds’ investment manager) is indemnified, to the extent permitted by the Act, against certain liabilities that may arise out of performance of their duties to the Funds. Additionally, in the normal course of business, the Funds enter into contracts that contain a variety of indemnification clauses. The Funds’ maximum exposure under these arrangement is unknown as this would involve future claims that may be made against the Funds that have not yet occurred. However, the Funds have not had prior claims or losses pursuant to these contracts and believes the risk of loss to be remote. |
| | U.S. Bank, N.A. has made available to each Fund a credit facility pursuant to Credit Agreements effective July 22, 2004, for the purpose of having cash available to cover incoming redemptions. The Brandywine Fund has a $50,000,000 credit facility and the Blue Fund has a $37,500,000 credit facility. Principal and interest of such loan under the Credit Agreements are due not more than 31 days after the date of the loan. Amounts under the credit facilities bear interest at a rate per annum equal to the current prime rate minus one on the amount borrowed. Advances will be collateralized by securities owned by the respective Fund. During the year ended September 30, 2008, neither Fund borrowed against their Agreement. The Credit Agreements expire on December 18, 2008. |
| (4) | Distributions to Shareholders |
| | Net investment income and net realized gains, if any, are distributed to shareholders at least annually. The Board of Directors has approved a distribution of net realized gains on October 30, 2008 for the Brandywine Fund to shareholders of record on October 29, 2008. This distribution, which is subject to change, is expected to be $14,327,152 from net short-term capital gains. |
| (5) | Investment Transactions and Related Costs |
| | For the year ended September 30, 2008, purchases and proceeds of sales of investment securities (excluding short-term investments) for the Funds were as follows: |
| | | Purchases | | | | | | | | | Ratio of Costs to Average Net Assets | |
| Brandywine Fund | | $ | 9,026,270,806 | | | $ | 9,253,296,717 | | | $ | 18,579,575 | | | | 0.42% | |
| Blue Fund | | | 10,747,711,894 | | | | 9,474,347,366 | | | | 17,629,137 | | | | 0.47 | |
| | Transaction costs represent the total commissions paid by each Fund on its respective purchases and sales of investment securities. These costs are added to the cost basis of the securities purchased and are deducted from the proceeds of securities sold, thereby reducing the realized gains or increasing the realized losses upon the sale of the securities. |
| (6) | Income Tax Information |
| | The following information for the Funds is presented on an income tax basis as of September 30, 2008: |
| | | | | | Gross | | | Gross | | | Net Unrealized | | | Distributable | | | Distributable | |
| | | Cost of | | | Unrealized | | | Unrealized | | | Depreciation | | | Ordinary | | | Long-Term | |
| | | Investments | | | Appreciation | | | Depreciation | | | on Investments | | | Income | | | Capital Gains | |
| Brandywine Fund | | $ | 3,582,284,307 | | | $ | 171,697,505 | | | $ | 324,030,313 | | | $ | 152,332,808 | | | $ | 14,327,152 | | | $ | — | |
| Blue Fund | | | 3,507,069,732 | | | | 87,183,457 | | | | 391,506,251 | | | | 304,322,794 | | | | — | | | | — | |
| The difference, if any, between the cost amounts for financial statement and federal income tax purposes is due primarily to timing differences in recognizing certain gains and losses in security transactions. |
The Brandywine Funds
Notes to Financial Statements (Continued)
September 30, 2008
| (6) | Income Tax Information (Continued) |
| | The tax components of dividends paid during the years ended September 30, 2008 and 2007, capital loss carryovers, which may be used to offset future capital gains, subject to Internal Revenue Code limitations as of September 30, 2008, and tax basis post-October losses as of September 30, 2008, which are not recognized for tax purposes until the first day of the following fiscal year are: |
| | | September 30, 2008 | | | September 30, 2007 | |
| | | Ordinary | | | Long-Term | | | Net Capital | | | | | | Ordinary | | | Long-Term | |
| | | Income | | | Capital Gains | | | Loss | | | Post-October | | | Income | | | Capital Gains | |
| | | Distributions | | | Distributions | | | Carryovers | | | Losses | | | Distributions | | | Distributions | |
| Brandywine Fund | | $ | 220,366,098 | | | $ | 408,257,097 | | | $ | — | | | $ | 215,545,609 | | | $ | — | | | $ | 30,419,122 | |
| Blue Fund | | | 228,628,373 | | | | 127,593,462 | | | | — | | | | 687,224,192 | | | | 19,042,368 | | | | 48,228,925 | |
| For corporate shareholders in the Brandywine and Blue Funds, the percentage of dividend income distributed for the year ended September 30, 2008, which is designated as qualifying for the dividends received deduction is 14% and 15%, respectively (unaudited). |
| For the shareholders in the Brandywine and Blue Funds, the percentage of dividend income distributed for the year ended September 30, 2008, which is designated as qualified dividend income under the Jobs and Growth Tax Relief Act of 2003 is 14% and 15%, respectively (unaudited). |
REPORT OF INDEPENDENT REGISTERED PUBLIC ACCOUNTING FIRM
To the Board of Directors and Shareholders of
Brandywine Fund, Inc. and Brandywine Blue Fund
In our opinion, the accompanying statements of assets and liabilities, including the schedules of investments, and the related statements of operations and of changes in net assets and the financial highlights present fairly, in all material respects, the financial position of Brandywine Fund, Inc. and Brandywine Blue Fund (a series of the Brandywine Blue Fund, Inc.) (the “Funds”) at September 30, 2008, the results of each of their operations for the year then ended, the changes in each of their net assets for each of the two years in the period then ended and the financial highlights for each of the five years in the period then ended, in conformity with accounting principles generally accepted in the United States of America. These financial statements and financial highlights (hereafter referred to as “financial statements”) are the responsibility of the Funds’ management; our responsibility is to express an opinion on these financial statements based on our audits. We conducted our audits of these financial statements in accordance with the standards of the Public Company Accounting Oversight Board (United States). Those standards require that we plan and perform the audit to obtain reasonable assurance about whether the financial statements are free of material misstatement. An audit includes examining, on a test basis, evidence supporting the amounts and disclosures in the financial statements, assessing the accounting principles used and significant estimates made by management, and evaluating the overall financial statement presentation. We believe that our audits, which included confirmation of securities at September 30, 2008 by correspondence with the custodian and brokers, provide a reasonable basis for our opinion.

Milwaukee, Wisconsin
October 10, 2008
Cost Discussion
Mutual fund shareholders incur two types of costs: (1) transaction costs, including sales charges (loads) on purchase payments, reinvested dividends, or other distributions; redemption fees; and exchange fees; and (2) ongoing costs, including management fees; distribution [and/or service] (12b-1) fees; and other fund expenses. Brandywine and Brandywine Blue do not have 12b-1 distribution fees. This example is intended to help you understand your ongoing costs (in dollars) of investing in the Brandywine Funds and to compare these costs with the ongoing costs of investing in other mutual funds.
In addition to the costs highlighted and described below, the only Fund transaction costs you might currently incur would be wire fees ($15 per wire), if you choose to have proceeds from a redemption wired to your bank account instead of receiving a check. Additionally, U.S. Bank charges an annual processing fee ($15) if you maintain an IRA account with the Funds. To determine your total costs of investing in the Funds, you would need to add any applicable wire or IRA processing fees you’ve incurred during the period to the costs provided in the example below.
The example is based on an investment of $1,000 invested at the beginning of the period and held for the entire period from April 1, 2008 through September 30, 2008.
Actual Expenses
The first line of the table below provides information about actual account values and actual expenses. You may use the information in this line, together with the amount you invested, to estimate the expenses that you paid over the period. Simply divide your account value by $1,000 (for example, an $8,600 account value divided by $1,000 = 8.6), then multiply the result by the number in the first line under the heading entitled “Expenses Paid During Period” to estimate the expenses you paid on your account during this period.
Hypothetical Example for Comparison Purposes
The second line of the table below provides information about hypothetical account values and hypothetical expenses based on the Fund’s actual expense ratio and an assumed rate of return of 5% per year before expenses, which is not the Fund’s actual return. The hypothetical account values and expenses may not be used to estimate the actual ending account balance or expenses you paid for the period. You may use this information to compare the ongoing costs of investing in the Funds and other funds. To do so, compare this 5% hypothetical example with the 5% hypothetical examples that appear in the shareholder reports of the other funds.
Please note that the expenses shown in the table are meant to highlight your ongoing costs only and do not reflect any transactional costs. While the Brandywine Funds currently do not assess sales charges, redemption or exchange fees, other funds do, and those costs will not be reflected in their expense example tables. Therefore, the second line of the table is useful in comparing ongoing costs only, and will not help you determine the relative total costs of owning different funds.
| | Beginning | Ending | |
| | Account | Account | Expenses Paid |
| | Value | Value | During Period* |
| | 4/01/08 | 9/30/08 | 4/01/08-9/30/08 |
| Brandywine Actual | $1,000.00 | $ 855.70 | $5.01 |
| Hypothetical (5% return before expenses) | $1,000.00 | $1,019.60 | $5.45 |
| Brandywine Blue Actual | $1,000.00 | $ 770.20 | $4.95 |
| Hypothetical (5% return before expenses) | $1,000.00 | $1,019.40 | $5.65 |
| * | Expenses are equal to the Funds’ annualized expense ratios of 1.08% and 1.12%, multiplied by the average account value over the period, multiplied by 183/366 (to reflect the one-half year period between April 1, 2008 and September 30, 2008). |
Additional Director Information, Proxy Voting Policy and Quarterly Portfolio Schedules
For additional information about the Directors and Officers or for a description of the policies and procedures that the Funds use to determine how to vote proxies relating to portfolio securities, please call (800) 656-3017 and request a Statement of Additional Information. One will be mailed to you free of charge. The Statement of Additional Information is also available on the website of the Securities and Exchange Commission (the “Commission”) at http://www.sec.gov or the Funds’ website at http://www.brandywinefunds.com. Information on how the Funds voted proxies relating to portfolio securities during the twelve month period ending June 30, 2008 is available on the Funds’ website or the website of the Commission. The Funds file their complete schedule of portfolio holdings with the Commission for the first and third quarters of each fiscal year on Form N-Q. The Funds’ Forms N-Q are available on the Commission’s website. The Funds’ Forms N-Q may be reviewed and copied at the Commission’s Public Reference Room in Washington, DC, and that information on the operation of the Public Reference Room may be obtained by calling 1-800-SEC-0330.
Brandywine Fund and Brandywine Blue Fund Directors and Officers
| | Name, Age, Address | | Position, Term of Office and Length of Time Served and Number of Portfolios in Fund Complex Overseen by Director | | Principal Occupation During Past Five Years | | Other Directorships Held by Director |
 | C. Quentin S. Jackson, 64 c/o Friess Associates P.O. Box 4166 Greenville, DE 19807 | | Lead Independent Director Indefinite Term since October, 2001 3 Portfolios | | Mr. Jackson is retired. He was the President and Chief Executive Officer of Nuclear Electric Insurance Ltd., a multibillion-dollar company mutually owned by energy companies. | | None |
| | | | | | | | |
| | | | | | | | |
 | Stuart A. McFarland, 61 c/o Friess Associates P.O. Box 4166 Greenville, DE 19807 | | Director Indefinite Term since October, 2001 Audit Committee Chairman, since June 2004 3 Portfolios | | Mr. McFarland is Managing Partner of Federal City Capital Advisors, LLC, a financial advisory firm. He was the Chairman of the Federal City Bancorp, a thrift holding company from April 2004 until June 2007. | | Hyperion Funds (5 portfolios), Newcastle Investment Corporation and RMK Funds |
| | | | | | | | |
| | | | | | | | |
 | W. Richard Scarlett III, 69 c/o Friess Associates P.O. Box 4166 Greenville, DE 19807 | | Director Indefinite Term since October, 2001 3 Portfolios | | Mr. Scarlett is Regional Chairman of State of Wyoming Wells Fargo Bank effective July 2008. He was the Chairman and Chief Executive Officer of United Bancorporation of Wyoming, Inc., from 1981 to July 2008. | | State of Wyoming Wells Fargo Bank |
| | | | | | | | |
| | | | | | | | |
 | Thomas D. Wren, 56 c/o Friess Associates P.O. Box 4166 Greenville, DE 19807 | | Director Indefinite Term since June, 2006 3 Portfolios | | Mr. Wren is a senior advisor for Promontory Financial Group, LLC. He was the Treasurer of MBNA Corporation and its MBNA America Bank, N.A. subsidiary from 1995 to 2006. | | ACM Financial Trust, Inc. and Hatteras Financial Corp. |
| | | | | | | | |
| | | | | | | | |
 | James W. Zug, 68 c/o Friess Associates P.O. Box 4166 Greenville, DE 19807 | | Director Indefinite Term since October, 2001 3 Portfolios | | Mr. Zug is a retired Partner of PricewaterhouseCoopers LLP. He was employed with PricewaterhouseCoopers and its predecessors from 1964 until 2000. | | Allianz Funds (34 portfolios), Amkor Technology, Inc. and Teleflex Inc. |
Brandywine Fund and Brandywine Blue Fund Directors and Officers
“Interested Persons” of the Funds* | Name, Age, Address | | Position, Term of Office and Length of Time Served and Number of Portfolios in Fund Complex Overseen by Director or Officer | | Principal Occupation During Past Five Years | | Other Directorships Held by Director or Officer |
| | | | | | | | |
 | William F. D’Alonzo*, 53 c/o Friess Associates P.O. Box 4166 Greenville, DE 19807 | | Director Indefinite Term since October, 2001 President since 2003 Chairman since 2004 3 Portfolios | | Mr. D’Alonzo joined Friess Associates in 1981 as part of the research team, became Chief Investment Officer in 1997 and Chief Executive Officer in 2002. | | None |
| | | | | | | | |
| | | | | | | | |
 | Foster S. Friess*, 68 c/o Friess Associates P.O. Box 576 Jackson, WY 83001 | | Director Indefinite Term since October, 1985 Founder 3 Portfolios | | Mr. Friess founded Friess Associates in 1974 with his wife, Lynnette E. Friess. He serves as Chairman of the Friess Companies. | | None |
| | | | | | | | |
| | | | | | | | |
 | Lynda J. Campbell*, 62 c/o Friess Associates P.O. Box 4166 Greenville, DE 19807 | | Vice President since 1998 Secretary since 1990 Treasurer since 2007 3 Portfolios | | Ms. Campbell joined Friess Associates in 1985, the year of Brandywine Fund’s inception. Ms. Campbell is currently Chief Administrative Officer of the Friess Companies. | | None |
| | | | | | | | |
| | | | | | | | |
 | Joseph J. Fields*, 52 c/o Friess Associates P.O. Box 4166 Greenville, DE 19807 | | Vice President since 2007 3 Portfolios | | Mr. Fields joined Friess Associates in 1999. He is currently a Client Relationship Manager of the Friess Companies. | | None |
| | | | | | | | |
| | | | | | | | |
 | Gordon Kaiser*, 49 c/o Friess Associates P.O. Box 4166 Greenville, DE 19807 | | Vice President since 2007 3 Portfolios | | Mr. Kaiser joined Friess Associates in 1999. He is currently a Client Relationship Manager of the Friess Companies. | | None |
| | | | | | | | |
| | | | | | | | |
 | David D. Marky*, 43 c/o Friess Associates P.O. Box 4166 Greenville, DE 19807 | | Vice President since 2002 Chief Compliance Officer since 2004 3 Portfolios | | Mr. Marky joined Friess Associates in 2000. He currently serves as Chief Compliance Officer for the Friess Companies. | | None |
| | | | | | | | |
For additional information about the Directors and Officers, please call (800) 656-3017 and request a Statement of Additional Information. One will be mailed to you free of charge.
| * | Messrs. D’Alonzo, Friess, Fields, Kaiser and Marky and Ms. Campbell are “interested persons” of the Funds as that term is defined in the Investment Company Act of 1940 by reason of their being officers of the Funds and employees of Friess Associates, LLC. |
Distribution Update . . . Internal Revenue Service regulations for mutual funds relating to annual excise distribution requirements maintain that funds measure capital gains and losses based on an October 31 year-end. The Brandywine Funds operate on a fiscal year that ends on September 30. Because of the different end dates, the Funds are required to track what the IRS rules refer to as “post October losses” for net capital losses that occur after the IRS’s October 31 end date through our fiscal year ending 11 months later on September 30. Net capital losses that are incurred after October 31 each year are then deferred and not recognized until the following fiscal year. Therefore, while capital gains incurred prior to the excise period measuring date of October 31 may not reflect a Fund’s overall performance during a fiscal year, the pre-October 31 gains cannot be netted with post-October losses and are required to be distributed for tax purposes. That is the case for Brandywine Fund for this fiscal year. Gains realized in October 2007 (the first month of the Brandywine’s fiscal year and the final month of the IRS year) are unable to be offset by the losses the Fund incurred over the remainder of its fiscal year. As such, Brandywine must distribute approximately $0.11 per share in short-term capital gains to shareholders of record on October 29. The distribution will be paid on October 31. If the Fund does not make this distribution, those gains would be taxed at the Fund level at the corporate income tax rate of 35 percent. We regret having to pay a small capital gain distribution in a year of overall capital losses, but the IRS rules require such a distribution for mutual funds in our circumstances. The mutual-fund industry continues to petition the IRS to revise its current rules and eliminate the timing discrepancy they cause between fund performance and the recognition of gains and losses. Brandywine Blue Fund is not required to make any distributions at this time. |
IRA Investors . . . The annual $15 maintenance fee for shareholders invested through IRA accounts is due on November 7, 2008. For your convenience, US Bancorp will automatically deduct this amount from your IRA on the due date. If you prefer not to have the fee swept from your account, please send a check to US Bancorp by the due date. |
P.O. Box 4166, Greenville, DE 19807
| (800) 656-3017 | www.brandywinefunds.com | bfunds@friess.com |
Investment Adviser: Friess Associates, LLC | Transfer Agent: U.S. Bancorp Fund Services, LLC |
Investment Sub-Adviser: Friess Associates of Delaware, LLC | Independent Registered Public Accounting Firm: PricewaterhouseCoopers LLP |
Custodian: U.S. Bank, N.A. | Legal Counsel: Foley & Lardner LLP |
Officers: Foster Friess, Founder; William D’Alonzo, Chairman and President;
Lynda Campbell, Vice President, Secretary and Treasurer; Joseph Fields, Vice President;
Gordon Kaiser, Vice President; David Marky, Chief Compliance Officer, Vice President and Assistant Secretary
| Report Editor: Chris Aregood | Report Staff: Rebecca Buswell, David Marky, Adam Rieger |
| Managed by Friess Associates, LLC | Annual Report | September 30, 2008 |
Dear Fellow Shareholders:
The September-quarter environment was bad, and our performance in it was worse. We did not serve you well during these three months.
Brandywine Advisors Midcap Growth Fund declined 21.58 percent in the quarter in an environment that was particularly tough on growth stocks due to mounting concerns about the economic impact of the credit crisis. The S&P 500, Russell Midcap and Russell Midcap Growth Indexes declined 8.37, 12.91 and 17.75 percent during the quarter.
Please don’t confuse the text that follows outlining the reasons why we underperformed the market as an effort on our part to make excuses. We are keenly aware that you expect and deserve better from us. No one in this firm will be satisfied until our results reward the confidence you showed in us during this tumultuous time.
After leading the Brandywine Advisors to a solid gain against mixed index results in the June quarter, energy-related holdings became a costly liability in the September quarter. The group began falling early in the quarter along with oil prices. We didn’t hold energy-related companies because oil prices were previously moving up, so we didn’t see reason to flee the energy sector because oil was now retreating from record highs.
We performed an exhaustive re-evaluation of every energy company in the portfolio to ensure their ongoing earnings potential, and in most instances our original expectations were confirmed. Holdings from the energy sector continued to fall, ultimately detracting more from results than any other sector by a substantial margin. Industrial holdings, particularly companies with any sort of link to energy, were the next most significant performance detractors.
While we feverishly focused on earnings, our challenge came in assessing just how risk-averse investors became as threats from the credit crisis grew. The valuation standards set by the market in recent years were abruptly abandoned. We made allowances for contraction in price-to-earnings ratios as the market became increasingly shaken, but the swift and severe re-pricing in the energy and industrial sectors went well beyond our expectations.
McDermott International, which suffered the worst percentage decline in the portfolio, finished the June quarter selling at roughly 20 times expected earnings for the next 12 months. That price-to-earnings ratio was about average for our experience since we first purchased shares more than three years ago. McDermott fell steadily in the September quarter despite lacking a company-specific catalyst for the sell-off, eventually settling at about eight times forward earnings.
The severity of the market’s turn on McDermott is surprising when you consider the company’s improved financial position relative to past periods when shares fetched a much higher multiple. When we first bought McDermott, its debt-to-equity ratio, which is a measure of leverage on the company’s balance sheet, was above 40 percent. McDermott currently carries no long-term debt. It also generates $300 million to $400 million a year in free cash flow, boasts $9.8 billion in backlogged business and holds $1.4 billion in cash on its balance sheet.
| Cumulative Total Return | Brandywine Advisors % Change |
| Quarter | -21.58 |
| One Year | -25.22 |
| Five Years | 42.27 |
| Inception – 10/31/00 | 14.31 |
| Five Years | 7.31 |
| Inception – 10/31/00 | 1.70 |
* Expense Ratio – 1.17% as stated in the Prospectus dated January 31, 2008
Performance data quoted represent past performance; past performance does not guarantee future results. The investment return and principal value of an investment will fluctuate so that an investor’s shares, when redeemed, may be worth more or less than their original cost. Current performance of the Fund may be lower or higher than the performance quoted. Performance data current to the most recent month end may be obtained by visiting www.brandywinefunds.com.
Given the steady flow of nerve-wracking events related to the credit crisis, it’s not surprising that many stocks moved for reasons unrelated to their fundamentals. Still, the degree to which the kind of reasonably priced, rapidly growing companies that we seek underperformed companies fitting any other description left us scratching our heads.
The Russell 3000 Growth Index provides one of the broadest representative samples of growth stocks. Companies in the index with forward price-to-earnings ratios below 25 and year-over-year earnings growth rates of 25 percent or more fell 18 percent on average in the September quarter. Companies from the index that didn’t fall in that range, including companies with declining earnings and companies with big losses, declined less than 4 percent.
Pulte Homes, which during the September quarter reported its seventh consecutive quarter of losses, surged 45 percent despite news that in August new homes sales fell to their lowest level in 17 years. We didn’t hold homebuilders or beleaguered financial companies that showed renewed life amid signs of government intervention into the mortgage mess, representing another area where the benchmarks gained a performance edge on us.
For more information on holdings that influenced September-quarter performance, please see Roses & Thorns on page 6.
On page 5, you’ll notice that 2009 earnings forecasts for the average company held in Brandywine Advisors is lower than current estimates for the typical S&P 500 Index company. We believe that situation will reverse as we progress toward and into 2009. We’re working hard to make sure we hold companies that meet or exceed realistic expectations. As for the broader group of companies the index represents, we think current forecasts leave ample room for downward earnings estimate revisions.
Brandywine Advisors fared relatively well through the first nine months of its fiscal year, limiting its decline versus the broader market. In the end, however, performance in the fiscal year’s final three months eliminated the Fund’s relative advantage over benchmarks. Brandywine Advisors declined 25.22 percent in the 12 months through September 30 versus declines in the S&P 500, Russell Midcap and Russell Midcap Growth Indexes of 21.98, 22.36 and 24.65 percent.
The economic outlook is changed and, as growth stock investors, we must adjust to current realities. Starved of credit, the economy looks to be shrinking. Earnings growth is unlikely to compare with recent periods past. With uncertainty regarding earnings and fear surrounding the credit crisis, the price investors are willing to pay for earnings potential is reduced.
Sounds grim, but these conditions don’t present an unusual challenge for our investment strategy. To be sure, we need to be realistic regarding the level of earnings growth we can reasonably expect a company to experience in the current climate. That just requires us to be open to some ideas that might not meet the 20-plus percent, year-over-year earnings growth target we maintain in more robust economic times.
Likewise, periods of heightened earnings uncertainty are a regular part of the peaks and valleys that occur in the business cycle. Earnings visibility will be a primary concern for us. Companies with the surest paths to earnings growth will win priority placement in the portfolio.
Market history is rife with examples of tumultuous events that subsequently proved opportune times to buy stocks. In many instances, the market’s turn for the better began well before the day’s uncertainty was fully resolved.
This downturn might eventually show itself to be another one of those instances, but we won’t make unnecessarily bold bets. Chances are many companies, particularly in the financial sector, will rebound before demonstrating the fundamental strength to warrant share-price gains. Our strategy doesn’t lead us to speculative leaps of faith. We’re committed to making up lost ground with an equal focus on limiting downside risk.
Visible, above-average earnings growth, modest price-to-earnings ratios and solid balance sheets will be the factors we value above all else as we navigate the environment ahead.
We’ve been overwhelmed by the encouragement we’ve received from shareholders, clients, advisors and consultants. The entire Friess team joins me in sending our sincere thanks for your long-term focus and support. We come to work each day with a single-minded focus to produce results that merit your continued confidence.
We recognize the assets you entrust to us represent retirement funds, college tuition, charitable and endowment resources, and other important investments. We’re invested alongside you with many of the same goals in mind, and we’re determined to grow your assets in a prudent manner in the months and years ahead.
| |
| Bill D’Alonzo | |
| Brandywine Funds President | October 15, 2008 |
Big Lots, Inc., BIG
A softening economy has consumers tightening their purse strings and retailers adjusting by scaling back inventories. Big Lots benefits from both sides of the equation by buying up excess brand-name merchandise and selling it to cost-conscious shoppers.
NYSE-listed Big Lots, Inc. is the largest closeout retailer in the U.S. with $4.6 billion in annual sales and over 1,300 stores nationwide. The company buys closeout merchandise from manufacturers and retailers looking to reduce inventory following packaging changes, canceled orders, product discontinuations and other events. Its consumables, home, seasonal and other items sell at prices 20 to 40 percent less than discount stores and up to 70 percent below conventional retailers.
July-quarter earnings grew 52 percent, marking seven consecutive quarters of beating estimates. Quarterly sales rose to $1.1 billion as customers were attracted to Big Lots’ ever-changing mix of quality brand merchandise. Operating profit margins expanded thanks to the company’s continued focus on cost control.
The company’s overall strategy, which emphasizes operating efficiency and product mix to increase profitability per customer visit, creates earnings leverage even amid modest same-store-sales growth. Efficiencies realized in buying, payroll, distribution, inventory levels and real estate have sent operating profit margins from less than 1 percent to nearly 5 percent in two years. Weak overall retail trends and rising bankruptcies are creating larger and more profitable closeout opportunities.
Your team spoke with Chief Financial Officer Joe Cooper regarding the company’s future plans. On pace to hit operating profit goals a year earlier than planned, Big Lots is exploring smaller store concepts and online initiatives to spur future profitability.
Your team bought Big Lots at 14 times earnings estimates for the fiscal year ending January 2009. Wall Street predicts the company will grow earnings 28 percent during that fiscal period.
Thermo Fisher Scientific, Inc., TMO
From lead-based paint and tainted milk to air and water pollution, rapid growth in Asian economies is adding to global health and safety concerns. Thermo Fisher Scientific is uniquely positioned to meet growing demand for quality control testing, food safety and diagnostic devices.
NYSE-listed Thermo Fisher Scientific, Inc. resulted from the merger of Thermo Electron and Fisher Scientific in late 2006. The deal paired Thermo’s scientific instruments with Fisher’s single-use laboratory consumables, creating a laboratory supply powerhouse with annual sales of $10 billion. The company serves more than 350,000 customers worldwide, operating in a diverse range of industries.
June-quarter earnings grew 22 percent, marking 13 straight quarters of beating estimates. Revenues jumped 14 percent to $2.4 billion, driven by demand for scientific instruments, specialty diagnostics and biopharmaceutical services. Large biotech and pharmaceutical customers looking for ways to cut costs and simplify procurement functions are increasingly attracted to Thermo Fisher’s unmatched portfolio of products.
Thermo Fisher is also increasingly able to cross-sell its testing products to environmental and consumer goods customers. Whether the goal is to monitor air quality or test prepared foods for harmful bacteria, sales of high-end diagnostic instruments are being followed with steady revenue streams from consumable products such as lab disposables and reagent kits.
Your team spoke to Chief Executive Marijn Dekkers about growth plans in India and China. The company recently launched its first Chinese-language catalog and acquired two divisions of Chemito Technologies, India’s largest local supplier of instruments for life science and environmental monitoring applications.
Your team purchased Fisher Scientific back in 2003, holding shares through the merger. Wall Street predicts the company will grow earnings 27 percent this year. It currently sells at 17 times consensus estimates.
Cost Discussion
Mutual fund shareholders incur two types of costs: (1) transaction costs, including sales charges (loads) on purchase payments, reinvested dividends, or other distributions; redemption fees; and exchange fees; and (2) ongoing costs, including management fees; distribution [and/or service] (12b-1) fees; and other fund expenses. This example is intended to help you understand your ongoing costs (in dollars) of investing in Brandywine Advisors Midcap Growth Fund and to compare these costs with the ongoing costs of investing in other mutual funds.
In addition to the costs highlighted and described below, the only Fund transaction costs you might currently incur would be wire fees ($15 per wire), if you choose to have proceeds from a redemption wired to your bank account instead of receiving a check. Additionally, U.S. Bank charges an annual processing fee ($15) if you maintain an IRA account with the Fund. To determine your total costs of investing in the Fund, you would need to add any applicable wire or IRA processing fees you’ve incurred during the period to the costs provided in the example at the end of this article.
The example is based on $1,000 invested at the beginning of the period and held for the entire period from April 1, 2008 through September 30, 2008.
Actual Expenses
The first line of the table below provides information about actual account values and actual expenses. You may use the information in this line, together with the amount you invested, to estimate the expenses that you paid over the period. Simply divide your account value by $1,000 (for example, an $8,600 account value divided by $1,000 = 8.6), then multiply the result by the number in the first line under the heading entitled “Expenses Paid During Period” to estimate the expenses you paid on your account during this period.
Hypothetical Example for Comparison Purposes
The second line of the table below provides information about hypothetical account values and hypothetical expenses based on the Fund’s actual expense ratio and an assumed rate of return of 5% per year before expenses, which is not the Fund’s actual return. The hypothetical account values and expenses may not be used to estimate the actual ending account balance or expenses you paid for the period. You may use this information to compare the ongoing costs of investing in the Fund and other funds. To do so, compare this 5% hypothetical example with the 5% hypothetical examples that appear in the shareholder reports of the other funds.
Please note that the expenses shown in the table are meant to highlight your ongoing costs only and do not reflect any transactional costs. While Brandywine Advisors Midcap Growth Fund currently does not assess sales charges, redemption or exchange fees, other funds do, and those costs will not be reflected in their expense example tables. Therefore, the second line of the table is useful in comparing ongoing costs only, and will not help you determine the relative total costs of owning different funds.
| | Beginning | Ending | |
| | Account | Account | Expenses Paid |
| | Value | Value | During Period* |
| | 4/01/08 | 9/30/08 | 4/01/08-9/30/08 |
| Brandywine Advisors Midcap Growth Fund Actual | $1,000.00 | $ 859.80 | $5.48 |
| Hypothetical (5% return before expenses) | $1,000.00 | $1,019.10 | $5.95 |
| * | Expenses are equal to the Fund’s annualized expense ratio of 1.18%, multiplied by the average account value over the period, multiplied by 183/366 (to reflect the one-half year period between April 1, 2008 and September 30, 2008). |
Additional Director Information, Proxy Voting Policy and Quarterly Portfolio Schedules
For additional information about the Directors and Officers or for a description of the policies and procedures that the Fund uses to determine how to vote proxies relating to portfolio securities, please call (877) 636-6460 and request a Statement of Additional Information. One will be mailed to you free of charge. The Statement of Additional Information is also available on the website of the Securities and Exchange Commission (the “Commission”) at http://www.sec.gov or the Fund’s website at http://www.brandywinefunds.com. Information on how the Fund voted proxies relating to portfolio securities during the twelve month period ending June 30, 2008 is available on the Fund’s website or the website of the Commission. The Fund files its complete schedule of portfolio holdings with the Commission for the first and third quarters of each fiscal year on Form N-Q. The Fund’s Form N-Q is available on the Commission’s website. The Fund’s Form N-Q may be reviewed and copied at the Commission’s Public Reference Room in Washington, DC, and that information on the operation of the Public Reference Room may be obtained by calling 1-800-SEC-0330.
Brandywine Advisors Midcap Growth Fund
% Change in Top Ten Holdings From Book Cost as of September 30, 2008
| 1. | | Urban Outfitters, Inc. | -2.9% | 6. | | Church & Dwight Co., Inc. | +13.1% |
| 2. | | Harris Corp. | +20.9% | 7. | | Thermo Fisher Scientific, Inc. | +81.6% |
| 3. | | Covance Inc. | +4.5% | 8. | | Crown Holdings, Inc. | -10.8% |
| 4. | | Check Point Software Technologies Ltd. | -1.4% | 9. | | Perrigo Co. | -0.2% |
| 5. | | Cephalon, Inc. | +11.5% | 10. | | Southwest Airlines Co. | +2.3% |
| Earnings Growth | The Portfolio’s Market Capitalization |
| |
All figures are dollar weighted and based on data from Baseline. September 30, 2008
Top Ten Industry Groups
Brandywine Advisors Midcap Growth Fund
September Quarter “Roses and Thorns”
| Biggest $ Winners | | % Gain | Reason for Move |
| Cephalon, Inc. | $1,079.4 | 15.5 | The maker of drugs used in the treatment of neurological disorders and cancer grew June-quarter earnings 22 percent, beating estimates. Revenues jumped 10 percent on strong initial sales of Treanda, used for leukemia, and Amrix, a muscle relaxant. The company also plans to release Nuvigil, an improved version of its blockbuster Provigil drug for excessive sleepiness, next year. |
| Perrigo Co. | $844.5 | 15.9 | The manufacturer of store brand over-the-counter pharmaceuticals and consumer products grew June-quarter earnings 63 percent. Revenues jumped 34 percent. The company’s products offer both a cost trade-down for consumers shifting to less expensive store brands over pricier national brands and a profit source for drug store chains looking to grow their brand business. Recent acquisitions strengthen the company’s pipeline of new products and create market share opportunities. |
| Church & Dwight Co., Inc. | $767.8 | 10.8 | The maker of a broad range of consumer and specialty products under the Arm & Hammer brand name beat estimates with 12 percent June-quarter earnings growth. Strong organic growth was driven by improved product pricing, the introduction of new products, increased marketing and expanding distribution. Gross profit margins expanded during the quarter as cost savings and acquisition synergies more than offset higher commodity costs. |
| Gen-Probe Inc. | $658.8 | 11.5 | The maker of rapid, accurate and cost-effective nucleic acid tests that are used primarily to diagnose human diseases and screen donated blood grew June-quarter earnings 26 percent, beating estimates by 19 percent. Shares gained ground on continued strength in blood screening sales and the approval of the company’s Ultrio Procleix assay for Hepatitis B, expanding its current uses in detecting HIV and Hepatitis C. |
| Republic Services, Inc. | $568.9 | 13.7 | Shares traded higher after Waste Management, North America’s largest trash hauler, made an unsolicited offer to buy Republic for about $6.2 billion in a bid to stop the company from combining with a competitor. We sold shares following the announcement as they quickly hit our target price. Subsequent to our sale, tightening credit conditions made the acquisition less likely to take place. |
| Biggest $ Losers | | % Loss | Reason for Move |
| Walter Industries, Inc. | $4,715.9 | 49.0 | The producer of metallurgical coal for the steel industry grew June-quarter earnings 169 percent, beating estimates by 65 percent. Despite the strong results, shares traded lower as steel prices fell from record levels amid deteriorating macro-economic conditions, creating concerns that pricing for metallurgical coal would follow suit. We sold Walter Industries as the quarter ended and completely exited the position in early October. |
McDermott International, Inc. | $4,703.0 | 56.5 | June-quarter earnings grew 18 percent as backlog for the company’s engineering and construction services continued to grow. Following strong price performance through June, shares declined on perceptions regarding how much of the company’s operational performance hinges on customers in the energy group. Investors indiscriminately sold anything energy-related during the quarter on concerns stemming from deteriorating macro-economic conditions, ignoring McDermott’s solid balance sheet and operational health. |
| Nabors Industries Ltd. | $4,338.3 | 45.1 | The world’s largest onshore oil and natural gas contract driller topped June-quarter consensus earnings estimates. The sharp contraction in global economic growth and commodity prices overshadowed near-term results and sparked concerns of possible demand destruction, rig count decreases and delays in capital spending. We sold Nabors during the quarter. |
Comstock Resources, Inc. | $3,438.8 | 41.2 | The independent exploration and production company grew June-quarter earnings 212 percent, topping consensus estimates. Strong production growth and a favorable reserve position were overshadowed as a weakening economic outlook sent commodity prices lower and clouded earnings visibility. |
| Fluor Corp. | $3,168.4 | 41.8 | The construction and engineering company grew June-quarter earnings 66 percent, topping estimates. Despite strong results, a solid balance sheet and rising forward earnings guidance, shares traded lower on concerns that the broadening credit crisis would eventually crimp industrial capital outlays by Fluor’s worldwide oil, gas and chemical customers. |
All gains/losses are calculated on an average cost basis
Management’s Discussion of Results,
Brandywine Advisors Midcap Growth Fund
Fallout from the subprime mortgage mess grew in scope and severity during the fiscal year, culminating in a crisis of confidence that was ultimately met with aggressive government intervention. Deteriorating conditions in the markets that facilitate commerce dampened economic expectations.
Brandywine Advisors Midcap Growth Fund’s investment strategy emphasizes the relationship between earnings performance and stock prices. The Fund’s approach fared relatively well through the first nine months of the period. Then the Fund lost more ground than benchmarks in the fiscal year’s final quarter as market sentiment overtook individual-company fundamentals as the primary influence on stocks amid growing concerns about the credit crisis.
Brandywine Advisors declined 25.22 percent in the 12 months through September 30, 2008. The S&P 500, Russell Midcap and Russell Midcap Growth Indexes declined 21.98, 22.36 and 24.65 percent.
The Fund started the fiscal year in solid fashion by posting a gain in the December quarter of 2007, a period in which its benchmarks declined. Holdings from the industrial sector attracted positive attention with strong earnings results in an environment marked by growing consumer spending concerns due to rising oil prices.
The credit crisis took center stage in the March quarter of 2008. The government backed a deal in which Wall Street’s fifth-largest investment bank, Bear Stearns, was acquired to avert its collapse. Most stocks suffered. Holdings from the technology and industrial sectors weighed on performance as economic concerns grew, leading Brandywine Advisors to decline more than its benchmarks.
Energy-related holdings were a notable bright spot in the March quarter, and their solid performance continued into the June quarter. The Fund grew amid mixed index results, reclaiming fiscal-year-to-date relative performance advantages over its benchmarks.
The credit crisis re-emerged as the dominant influence on stock prices in the September quarter. The period included the largest bankruptcy in history, the largest bank failure and other jarring events that fueled a challenging environment. Holdings from the energy sector that only months before drove performance became the most notable performance detractors in the September quarter.
Concerns that the credit crisis would reverberate throughout the global economy prompted investors to avoid companies with strong earnings expectations. Brandywine Advisors declined more than its benchmarks in a negative, macro-driven environment.
Hypothetical Comparison of Change in Value of $10,000 Investment in Brandywine Advisors Midcap Growth Fund, Russell Midcap Growth Index(1), Russell Midcap Index(2) and S&P 500 Index(3) |
| |
| | (1) | The Russell Midcap Growth Index measures the performance of those Russell Midcap companies with higher price-to-book ratios and higher forecasted growth values and includes dividends. The stocks are also members of the Russell 1000 Growth Index. | |
| | (2) | The Russell Midcap Index, a trademark of the Frank Russell Company, measures the performance of the smallest 800 companies in the Russell 1000 Index and includes dividends. | |
| | (3) | The S&P 500 Index consists of 500 stocks, mostly on the New York Stock Exchange, selected by the Standard & Poor’s Ratings Group. Each stock’s weighting is based on its relative total market value and includes dividends. | |
| Average Annual Total Return |
| 1-Year | 5-Year | Since Effective Date 10/31/00 |
| -25.22% | 7.31% | 1.70% |
Brandywine Advisors Midcap Growth Fund
Statement of Assets and Liabilities
September 30, 2008
| Assets: | | | |
| Investments in securities, at value (cost $208,228,410) | | $ | 200,181,299 | |
| Receivable from investments sold | | | 6,371,723 | |
| Receivable from shareholders for purchases | | | 297,534 | |
| Dividends and interest receivable | | | 37,005 | |
| Other assets | | | 216 | |
| Total assets | | $ | 206,887,777 | |
| Liabilities: | | | | |
| Payable to brokers for securities purchased | | $ | 1,966,653 | |
| Payable to adviser for management fees | | | 179,903 | |
| Payable to shareholders for redemptions | | | 125,382 | |
| Other liabilities | | | 45,057 | |
| Total liabilities | | | 2,316,995 | |
| Net Assets: | | | | |
| Capital Stock, $0.01 par value; 500,000,000 shares authorized; 23,662,021 shares outstanding | | | 226,112,267 | |
| Net unrealized depreciation on investments | | | (8,047,111 | ) |
| Accumulated net realized loss on investments | | | (13,494,374 | ) |
| Net assets | | | 204,570,782 | |
| Total liabilities and net assets | | $ | 206,887,777 | |
| Calculation of net asset value per share: | | | | |
Net asset value, offering and redemption price per share ($204,570,782 ÷ 23,662,021 shares outstanding) | | $ | 8.65 | |
The accompanying notes to financial statements are an integral part of this statement.
Schedule of Investments
September 30, 2008
| Shares | | | | Cost | | | Value | |
Common Stocks - 92.3% (a) | | | | | | |
CONSUMER DISCRETIONARY | | | | | | |
| | Apparel Retail - 4.7% | | | | | | |
| | 300,800 | | Urban Outfitters, Inc.* | | $ | 9,871,569 | | | $ | 9,586,496 | |
| | | | Education Services - 0.8% | | | | | | | | |
| | 31,300 | | DeVry, Inc. | | | 1,669,322 | | | | 1,550,602 | |
| | | | General Merchandise Store - 1.2% | | | | | | | | |
| | 84,900 | | Big Lots, Inc.* | | | 2,373,214 | | | | 2,362,767 | |
| | | | Total Consumer Discretionary | | | 13,914,105 | | | | 13,499,865 | |
| | | | This sector is 3.0% below your Fund’s cost. | | | | | | | | |
CONSUMER STAPLES | | | | | | | | |
| | | Household Products - 3.8% | | | | | | | | |
| | 126,700 | | Church & Dwight Co., Inc. | | | 6,953,531 | | | | 7,866,803 | |
| | | | Packaged Foods & Meats - 4.2% | | | | | | | | |
| | 250,500 | | Dean Foods Co.* | | | 5,970,715 | | | | 5,851,680 | |
| | 40,400 | | Ralcorp Holdings, Inc.* | | | 2,440,753 | | | | 2,723,364 | |
| | | | Total Consumer Staples | | | 15,364,999 | | | | 16,441,847 | |
| | | | This sector is 7.0% above your Fund’s cost. | | | | | | | | |
ENERGY | | | | | | | | |
| | | Coal & Consumable Fuels - 0.4% | | | | | | | | |
| | 17,100 | | Walter Industries, Inc. | | | 920,327 | | | | 811,395 | |
| | | | Oil & Gas Equipment & Services - 1.2% | | | | | | | | |
| | 7,900 | | Core Laboratories N.V. | | | 853,472 | | | | 800,428 | |
| | 49,900 | | Superior Energy Services, Inc.* | | | 2,464,247 | | | | 1,553,886 | |
| | | | Oil & Gas Exploration & Production - 3.6% | | | | | | | | |
| | 98,000 | | Comstock Resources, Inc.* | | | 6,367,569 | | | | 4,904,900 | |
| | 117,600 | | Petrohawk Energy Corp.* | | | 3,380,942 | | | | 2,543,688 | |
| | | | Total Energy | | | 13,986,557 | | | | 10,614,297 | |
| | | | This sector is 24.1% below your Fund’s cost. | | | | | | | | |
HEALTH CARE | | | | | | | | |
| | | Biotechnology - 3.9% | | | | | | | | |
| | 103,700 | | Cephalon, Inc.* | | | 7,208,113 | | | | 8,035,713 | |
| | | | Health Care Equipment - 6.6% | | | | | | | | |
| | 67,700 | | Beckman Coulter, Inc. | | | 4,725,921 | | | | 4,806,023 | |
| | 99,900 | | Gen-Probe Inc.* | | | 5,816,999 | | | | 5,299,695 | |
| | 80,300 | | ResMed Inc.* | | | 3,648,240 | | | | 3,452,900 | |
Brandywine Advisors Midcap Growth Fund
Schedule of Investments (Continued)
September 30, 2008
| Shares or | | | | | | | | |
| Principal | | | | | | | | |
| Amount | | | | Cost | | | Value | |
Common Stocks - 92.3% (a) (Continued) | | | | | | |
| | Life Sciences Tools & Services - 11.5% | | | | | | |
| | 26,200 | | Charles River Laboratories International, Inc.* | | $ | 1,642,529 | | | $ | 1,454,886 | |
| | 95,300 | | Covance Inc.* | | | 8,059,932 | | | | 8,425,473 | |
| | 143,700 | | Invitrogen Corp.* | | | 5,858,890 | | | | 5,431,860 | |
| | 128,600 | | Thermo Fisher Scientific, Inc.* | | | 3,895,530 | | | | 7,073,000 | |
| | 20,400 | | Waters Corp.* | | | 1,320,350 | | | | 1,186,872 | |
| | | | Pharmaceuticals - 3.0% | | | | | | | | |
| | 159,800 | | Perrigo Co. | | | 6,158,627 | | | | 6,145,908 | |
| | | | Total Health Care | | | 48,335,131 | | | | 51,312,330 | |
| | | | This sector is 6.2% above your Fund’s cost. | | | | | | | | |
INDUSTRIALS | | | | | | | | |
| | | Airlines - 3.0% | | | | | | | | |
| | 421,000 | | Southwest Airlines Co. | | | 5,971,769 | | | | 6,108,710 | |
| | | | Construction & Engineering - 7.5% | | | | | | | | |
| | 53,800 | | EMCOR Group, Inc.* | | | 1,710,523 | | | | 1,416,016 | |
| | 79,200 | | Fluor Corp. | | | 3,705,209 | | | | 4,411,440 | |
| | 213,400 | | Quanta Services, Inc.* | | | 6,566,996 | | | | 5,763,934 | |
| | 104,000 | | URS Corp.* | | | 4,373,750 | | | | 3,813,680 | |
| | | | Electrical Components & Equipment - 1.8% | | | | | | | | |
| | 243,700 | | GrafTech International Ltd.* | | | 6,041,707 | | | | 3,682,307 | |
| | | | Industrial Conglomerates - 1.0% | | | | | | | | |
| | 78,900 | | McDermott International, Inc.* | | | 876,934 | | | | 2,015,895 | |
| | | | Industrial Machinery - 1.6% | | | | | | | | |
| | 41,700 | | SPX Corp. | | | 5,254,131 | | | | 3,210,900 | |
| | | | Research & Consulting Services - 2.6% | | | | | | | | |
| | 74,500 | | FTI Consulting Inc.* | | | 5,081,831 | | | | 5,381,880 | |
| | | | Security & Alarm Services - 2.3% | | | | | | | | |
| | 191,400 | | Corrections Corporation of America* | | | 5,214,165 | | | | 4,756,290 | |
| | | | Total Industrials | | | 44,797,015 | | | | 40,561,052 | |
| | | | This sector is 9.5% below your Fund’s cost. | | | | | | | | |
INFORMATION TECHNOLOGY | | | | | | | | |
| | | Application Software - 0.4% | | | | | | | | |
| | 61,900 | | Nuance Communications, Inc.* | | | 945,833 | | | | 754,561 | |
| | | | Communications Equipment - 6.8% | | | | | | | | |
| | 130,800 | | CommScope, Inc.* | | | 5,869,209 | | | | 4,530,912 | |
| | 205,200 | | Harris Corp. | | | 7,844,417 | | | | 9,480,240 | |
| | | | Data Processing & Outsourced Services - 3.0% | | | | | | | | |
| | 119,400 | | Affiliated Computer Services, Inc.* | | | 5,999,590 | | | | 6,045,222 | |
| | | | IT Consulting & Other Services - 0.9% | | | | | | | | |
| | 90,400 | | SAIC, Inc.* | | | 1,725,834 | | | | 1,828,792 | |
| | | | Semiconductors - 2.7% | | | | | | | | |
| | 271,900 | | Altera Corp. | | | 5,951,014 | | | | 5,622,892 | |
| | | | Systems Software - 6.6% | | | | | | | | |
| | 361,800 | | Check Point Software Technologies Ltd.* | | | 8,343,788 | | | | 8,227,332 | |
| | 94,700 | | McAfee Inc.* | | | 3,483,510 | | | | 3,216,012 | |
| | 80,200 | | MICROS Systems, Inc.* | | | 2,674,995 | | | | 2,138,132 | |
| | | | Total Information Technology | | | 42,838,190 | | | | 41,844,095 | |
| | | | This sector is 2.3% below your Fund’s cost. | | | | | | | | |
MATERIALS | | | | | | | | |
| | | Diversified Chemicals - 1.6% | | | | | | | | |
| | 61,800 | | FMC Corp. | | | 4,086,827 | | | | 3,175,902 | |
| | | | Metal & Glass Containers - 3.4% | | | | | | | | |
| | 314,200 | | Crown Holdings, Inc.* | | | 7,826,160 | | | | 6,978,382 | |
| | | | Total Materials | | | 11,912,987 | | | | 10,154,284 | |
| | | | This sector is 14.8% below your Fund’s cost. | | | | | | | | |
TELECOMMUNICATION SERVICES | | | | | | | | |
| | | Wireless Telecommunication Services - 2.2 % | | | | | | | | |
| | 117,300 | | NII Holdings Inc.* | | | 5,773,913 | | | | 4,448,016 | |
| | | | Total Telecommunication Services | | | 5,773,913 | | | | 4,448,016 | |
| | | | This sector is 23.0% below your Fund’s cost. | | | | | | | | |
| | | | Total common stocks | | | 196,922,897 | | | | 188,875,786 | |
Short-Term Investments - 5.5% (a) | | | | | | | | |
| | | Commercial Paper - 4.4% | | | | | | | | |
| $ | 4,500,000 | | Citigroup Funding Inc., due 10/01/08, discount of 4.00% | | | 4,500,000 | | | | 4,500,000 | |
| | 4,500,000 | | General Electric Capital Corp., due 10/01/08, discount of 2.00% | | | 4,500,000 | | | | 4,500,000 | |
| | | | Total commercial paper | | | 9,000,000 | | | | 9,000,000 | |
| | | Variable Rate Demand Note - 1.1% | | | | | | | | |
| | 2,305,513 | | Wisconsin Corporate Central Credit Union, 3.60% | | | 2,305,513 | | | | 2,305,513 | |
| | | | Total short-term investments | | | 11,305,513 | | | | 11,305,513 | |
| | | | Total investments - 97.8% | | $ | 208,228,410 | | | | 200,181,299 | |
| | | | Cash and receivables, less liabilities - 2.2% (a) | | | | | | | 4,389,483 | |
| | | | | | | | | | | | |
| | | | TOTAL NET ASSETS - 100.0% | | | | | | $ | 204,570,782 | |
| * | Non-dividend paying security. |
| (a) | Percentages for the various classifications relate to net assets. |
N.V. - Netherlands Antilles Limited Liability Corp.
The accompanying notes to financial statements are an integral part of this schedule.
Brandywine Advisors Midcap Growth Fund
Statement of Operations
For the Year Ended September 30, 2008
| Income: | | | |
| Dividends | | $ | 839,672 | |
| Interest | | | 334,569 | |
| Total income | | | 1,174,241 | |
| Expenses: | | | | |
| Management fees | | | 2,460,890 | |
| Service and Distribution expenses | | | 139,016 | |
| Transfer agent fees | | | 86,770 | |
| Professional fees | | | 51,096 | |
| Administrative and accounting services | | | 46,000 | |
| Registration fees | | | 40,794 | |
| Custodian fees | | | 39,405 | |
| Printing and postage expense | | | 32,743 | |
| Board of Directors fees and expenses | | | 19,612 | |
| Insurance expense | | | 9,885 | |
| Other expenses | | | 6,925 | |
| Net expenses | | | 2,933,136 | |
| Net Investment Loss | | | (1,758,895 | ) |
| Net Realized Loss on Investments | | | (7,467,332 | ) |
| Net Decrease in Unrealized Appreciation on Investments | | | (58,891,395 | ) |
| Net Loss on Investments | | | (66,358,727 | |
| Net Decrease in Net Assets Resulting From Operations | | $ | (68,117,622 | ) |
Statements of Changes in Net Assets
For the Years Ended September 30, 2008 and 2007
| | | 2008 | | | 2007 | |
| Operations: | | | | | | |
| Net investment loss | | $ | (1,758,895 | ) | | $ | (1,287,369 | ) |
| Net realized (loss) gain on investments | | | (7,467,332 | ) | | | 28,508,687 | |
| Net (decrease) increase in unrealized appreciation on investments | | | (58,891,395 | ) | | | 33,332,269 | |
| Net (decrease) increase in net assets resulting from operations | | | (68,117,622 | ) | | | 60,553,587 | |
| | | | | | | | | |
| Distributions to Shareholders: | | | | | | | | |
| Distributions from realized gains ($1.49109 and $0.78313 per share, respectively) | | | (30,642,150 | ) | | | (14,106,987 | ) |
| | | | | | | | | |
| Fund Share Activities: | | | | | | | | |
| Proceeds from shares issued (4,469,129 and 3,181,689 shares, respectively) | | | 49,945,420 | | | | 36,420,866 | |
| Net asset value of shares issued in distributions reinvested (815,104 and 341,881 shares, respectively) | | | 9,787,846 | | | | 3,598,126 | |
| Cost of shares redeemed (1,690,144 and 1,086,674 shares, respectively) | | | (17,902,222 | ) | | | (12,347,315 | ) |
| Net increase in net assets derived from Fund share activities | | | 41,831,044 | | | | 27,671,677 | |
| Total (Decrease) Increase | | | (56,928,728 | ) | | | 74,118,277 | |
| | | | | | | | | |
| Net Assets at the Beginning of the Year | | | 261,499,510 | | | | 187,381,233 | |
| Net Assets at the End of the Year | | $ | 204,570,782 | | | $ | 261,499,510 | |
| (Includes accumulated net investment loss of $0 and $0, respectively) | | | | | | | | |
The accompanying notes to financial statements are an integral part of these statements.
Brandywine Advisors Midcap Growth Fund
Financial Highlights
(Selected data for each share of the Fund outstanding throughout each year)
| | | For the Years Ended September 30, | |
| | | 2008 | | | 2007 | | | 2006 | | | 2005 | | | 2004 | |
| PER SHARE OPERATING PERFORMANCE: | | | | | | | | | | | | | | | |
Net asset value, beginning of year | | $ | 13.03 | | | $ | 10.63 | | | $ | 12.29 | | | $ | 9.22 | | | $ | 8.42 | |
Income from investment operations: | | | | | | | | | | | | | | | | | | | | |
Net investment loss(1) | | | (0.08 | ) | | | (0.07 | ) | | | (0.06 | ) | | | (0.05 | ) | | | (0.07 | ) |
Net realized and unrealized (losses) gains on investments | | | (2.81 | ) | | | 3.25 | | | | (0.20 | ) | | | 3.12 | | | | 0.87 | |
Total from investment operations | | | (2.89 | ) | | | 3.18 | | | | (0.26 | ) | | | 3.07 | | | | 0.80 | |
| Less distributions: | | | | | | | | | | | | | | | | | | | | |
Distributions from net investment income | | | — | | | | — | | | | — | | | | — | | | | — | |
Distributions from net realized gains | | | (1.49 | ) | | | (0.78 | ) | | | (1.40 | ) | | | — | | | | — | |
| Total from distributions | | | (1.49 | ) | | | (0.78 | ) | | | (1.40 | ) | | | — | | | | — | |
Net asset value, end of year | | $ | 8.65 | | | $ | 13.03 | | | $ | 10.63 | | | $ | 12.29 | | | $ | 9.22 | |
| TOTAL RETURN | | | (25.22 | %) | | | 31.80 | % | | | (1.10 | %) | | | 33.30 | % | | | 9.50 | % |
| RATIOS/SUPPLEMENTAL DATA: | | | | | | | | | | | | | | | | | | | | |
Net assets, end of year (in 000’s $) | | | 204,571 | | | | 261,500 | | | | 187,381 | | | | 200,593 | | | | 140,646 | |
Ratio of expenses to average net assets | | | 1.19 | % | | | 1.17 | % | | | 1.18 | % | | | 1.19 | % | | | 1.20 | % |
Ratio of net investment loss to average net assets | | | (0.71 | %) | | | (0.59 | %) | | | (0.53 | %) | | | (0.51 | %) | | | (0.75 | %) |
| Portfolio turnover rate | | | 198 | % | | | 178 | % | | | 208 | % | | | 207 | % | | | 269 | % |
| (1) | Net investment loss per share was calculated using average shares outstanding. |
The accompanying notes to financial statements are an integral part of this statement.
Brandywine Advisors Midcap Growth Fund
Notes to Financial Statements
September 30, 2008
| (1) | Summary of Significant Accounting Policies |
| | The following is a summary of significant accounting policies of Brandywine Advisors Midcap Growth Fund (the “Fund”). The Fund is registered as a diversified open-end management company under the Investment Company Act of 1940, as amended, and is a series of the Brandywine Blue Fund, Inc. (the “Blue Fund”). The Blue Fund was incorporated under the laws of Maryland on November 13, 1990. The Fund was privately offered from October 1, 2000 (commencement of operations) to October 31, 2000 (effective date), the date shares were first offered to the public. The Brandywine Blue Fund, Inc. filed articles supplementary on October 6, 2008 increasing the Brandywine Advisors Midcap Growth Fund’s authorized shares to 500,000,000. The assets and liabilities of each series in the Blue Fund are segregated and a shareholder’s interest is limited to the Fund in which the shareholder owns shares. The investment objective of the Fund is to produce capital appreciation principally through investing in common stocks. |
| (a) | Each security, excluding short-term investments, is valued at the last sale price reported by the principal security exchange on which the issue is traded. Securities that are traded on the Nasdaq Markets are valued at the Nasdaq Official Closing Price, or if no sale is reported, the latest bid price. Securities which are traded over-the-counter are valued at the latest bid price. Securities for which quotations are not readily available are valued at fair value as determined by the investment adviser under the supervision of the Board of Directors. The fair value of a security may differ from the last quoted price and the Fund may not be able to sell a security at the fair value. Market quotations may not be available, for example, if trading in particular securities has halted during the day and not resumed prior to the close of trading on the New York Stock Exchange. Short-term investments with maturities of 60 days or less are valued at amortized cost, which approximates value. For financial reporting purposes, investment transactions are recorded on the trade date; however, for purposes of executing shareholder transactions, the Fund records changes in holdings of portfolio securities no later than the first business day after the trade date in accordance with Rule 2a-4 of the Investment Company Act. Accordingly certain differences between net asset value for financial reporting and for executing shareholder transactions may arise. |
| | In September 2006, the Financial Accounting Standards Board (“FASB”) issued Statement of Financial Accounting Standards (“SFAS”) No. 157, “Fair Value Measurements.” This standard establishes a single authoritative definition of fair value, sets out a framework for measuring fair value and requires additional disclosures about fair value measurements. SFAS No. 157 applies to fair value measurements already required or permitted by existing standards. SFAS No. 157 is effective for financial statements issued for fiscal years beginning after November 15, 2007 and interim periods within those fiscal years. The changes to current generally accepted accounting principles from the application of this standard relate to the definition of fair value, the methods used to measure fair value, and the expanded disclosures about fair value measurements. The adoption of SFAS No. 157 will not impact the financial statement amounts; however, additional disclosures will be required regarding the inputs used to develop the measurements and the effect of certain of the measurements included within the Statement of Operations. |
Brandywine Advisors Midcap Growth Fund
Notes to Financial Statements (Continued)
September 30, 2008
| (1) | Summary of Significant Accounting Policies (Continued) |
| (b) | Net realized gains and losses on sales of securities are computed on the identified cost basis. |
| (c) | Dividend income is recorded on the ex-dividend date. Interest income is recorded on an accrual basis. |
| (d) | The Fund has investments in short-term variable rate demand notes, which are unsecured instruments. The Fund may be susceptible to credit risk with respect to these notes to the extent the issuer defaults on its payment obligation. The Fund’s policy is to monitor the creditworthiness of the issuer and nonperformance by these counterparties is not anticipated. |
| (e) | Accounting principles generally accepted in the United States of America (“GAAP”) require that permanent differences between income for financial reporting and tax purposes be reclassified in the capital accounts. |
| (f) | The preparation of financial statements in conformity with GAAP requires management to make estimates and assumptions that affect the reported amounts of assets and liabilities and disclosure of contingent assets and liabilities at the date of the financial statements and the reported amounts of revenues and expenses during the reporting period. Actual results could differ from these estimates. |
| (g) | No provision has been made for Federal income taxes since the Fund has elected to be taxed as a “regulated investment company” and intends to distribute substantially all net investment company taxable income and net capital gains to shareholders and otherwise comply with the provisions of the Internal Revenue Code applicable to regulated investment companies. |
| (h) | Effective March 31, 2008, the Fund adopted FASB interpretation No. 48 (FIN 48), “Accounting for Uncertainty in Income Taxes”. FIN 48 requires the evaluation of tax positions taken on previously filed tax returns or expected to be taken on future returns. These positions must meet a “more-likely-than-not” standard that, based on the technical merits, have a more than fifty percent likelihood of being sustained upon examination. In evaluating whether a tax position has met the recognition threshold, the Fund must presume that the position will be examined by the appropriate taxing authority that has full knowledge of all relevant information. Tax positions not deemed to meet the “more-likely-than-not” threshold are recorded as a tax expense in the current year. |
| | FIN 48 requires the Fund to analyze all open tax years, as defined by the Statue of Limitations, for all major jurisdictions. Open tax years are those that are open for exam by taxing authorities. Major jurisdictions for the Fund include Federal and the state of Maryland. As of September 30, 2008, open Federal and Maryland tax years include the tax years ended September 30, 2005 through 2008. The Fund has no examination in progress. |
| | The Fund has reviewed all open tax years and major jurisdictions and concluded that the adoption of FIN 48 resulted in no effect to the Fund’s financial position or results of operations. There is no tax liability resulting from unrecognized tax benefits relating to uncertain income tax positions taken or expected to be taken on the tax return for the fiscal year-end September 30, 2008. The Fund is also not aware of any tax positions for which it is reasonably possible that the total amounts of unrecognized tax benefits will significantly change in the next twelve months. |
| (2) | Investment Adviser and Management Agreement and Transactions With Related Parties |
| | The Fund has a management agreement with Friess Associates, LLC (the “Adviser”), with whom certain Officers and Directors of the Fund are affiliated, to serve as investment adviser and manager. Under the terms of the agreement, the Fund will pay the Adviser a monthly management fee at the annual rate of one percent (1%) on the daily net assets of the Fund. |
| | The Adviser entered into a sub-advisory agreement with its affiliate, Friess Associates of Delaware, LLC (the “Sub-Adviser”), to assist it in the day-to-day management of the Fund. The Adviser and, if so delegated, the Sub-Adviser supervise the investment portfolio of the Fund, directing the purchase and sale of investment securities in the day-to-day management of the Fund. The Adviser pays the Sub-Adviser a fee equal to 110% of the monthly expenses the Sub-Adviser incurs in performing its services as Sub-Adviser. This relationship does not increase the annual management fee the Fund pays to the Adviser. |
| | The Fund pays each of the five independent directors annual fees of $3,000. The lead independent director and chairman of the audit committee are paid an additional $5,000 annually, divided proportionately among all the Brandywine Funds. All of the corresponding fees the directors receive are paid quarterly to the directors and then invested on the payment date in shares of the Fund at the net asset value of the Fund on the payment date. The Fund also reimburses directors for travel costs incurred in order to attend meetings of the Board of Directors. For the year ended September 30, 2008, the Fund expensed the following directors fees and costs: |
| Directors Fees and Travel Costs Paid during the Year | $19,612 |
| | The Fund has adopted a Service and Distribution Plan (the “Plan”) pursuant to Rule 12b-1 under the Investment Company Act of 1940. The Plan provides that the Fund may incur certain costs which may not exceed a maximum amount equal to 0.25% per annum of the Fund’s average net assets. Payments made pursuant to the Plan may only be used to pay distribution expenses incurred in the current year. |
| | Under the Fund’s organizational documents, each Director, officer, employee or other agent of the Fund (including the Fund’s investment manager) is indemnified, to the extent permitted by the Act, against certain liabilities that may arise out of performance of their duties to the Fund. Additionally, in the normal course of business, the Fund enters into contracts that contain a variety of indemnification clauses. The Fund’s maximum exposure under these arrangements is unknown as this would involve future claims that may be made against the Fund that have not yet occurred. However, the Fund has not had prior claims or losses pursuant to these contracts and believes the risk of loss to be remote. |
| | At September 30, 2008, approximately 68% of the outstanding shares of the Fund are owned by one of the Fund’s Directors. |
| | U.S. Bank, N.A. has made available to the Fund a $4,000,000 uncommitted credit facility pursuant to a Credit Agreement, effective December 6, 2004, for the purpose of having cash available to cover incoming redemptions. Principal and interest of such loan under |
Brandywine Advisors Midcap Growth Fund
Notes to Financial Statements (Continued)
September 30, 2008
| (3) | Credit Agreement (Continued) |
| the Credit Agreement is due not more than 31 days after the date of the loan. Amounts under the credit facility bear interest at a rate per annum equal to the current prime rate minus one on the amount borrowed. During the year ended September 30, 2008, the Fund did not borrow against its Agreement. The Credit Agreement expires on December 18, 2008. |
| (4) | Distributions to Shareholders |
| | Net investment income and net realized gains, if any, are distributed to shareholders at least annually. |
| (5) | Investment Transactions and Related Costs |
| | For the year ended September 30, 2008, purchases and proceeds of sales of investment securities (excluding short-term investments) for the Fund were as follows: |
| | | Sale | | Transaction | | Ratio of Costs to |
| Purchases | | Proceeds | | Costs | | Average Net Assets |
| $481,632,603 | | $470,309,327 | | $968,720 | | 0.39% |
| | Transaction costs represent the total commissions paid by the Fund on its purchases and sales of investment securities. These costs are added to the cost basis of the securities purchased and are deducted from the proceeds of securities sold, thereby reducing the realized gains or increasing the realized losses upon the sale of the securities. |
| (6) | Income Tax Information |
| | The following information for the Fund is presented on an income tax basis as of September 30, 2008: |
| | | Gross | | Gross | | Net Unrealized | | Distributable | | Distributable |
| Cost of | | Unrealized | | Unrealized | | Depreciation | | Ordinary | | Long-Term |
| Investments | | Appreciation | | Depreciation | | on Investments | | Income | | Capital Gains |
| $208,357,224 | | $10,082,496 | | $18,258,421 | | $8,175,925 | | $ — | | $ — |
| | The difference, if any, between the cost amount for financial statement and federal income tax purposes is due primarily to timing differences in recognizing certain gains and losses in security transactions. |
| | The tax components of dividends paid during the years ended September 30, 2008 and 2007, capital loss carryovers, which may be used to offset future capital gains, subject to Internal Revenue Code limitations, as of September 30, 2008, and tax basis post-October losses as of September 30, 2008, which are not recognized for tax purposes until the first day of the following fiscal year are: |
| September 30, 2008 | | September 30, 2007 |
| Ordinary | | Long-Term | | Net Capital | | | | Ordinary | | Long-Term |
| Income | | Capital Gains | | Loss | | Post-October | | Income | | Capital Gains |
| Distributions | | Distributions | | Carryovers | | Losses | | Distribution | | Distributions |
| $8,982,450 | | $21,659,700 | | $ — | | $13,365,561 | | $2,734,618 | | $11,372,369 |
| | For corporate shareholders in the Fund, the percentage of dividend income distributed for the year ended September 30, 2008, which is designated as qualifying for the dividends received deduction is 19% (unaudited). |
| | For the shareholders in the Fund, the percentage of dividend income distributed for the year ended September 30, 2008, which is designated as qualified dividend income under the Jobs and Growth Tax Relief Act of 2003, is 20% (unaudited). |
REPORT OF INDEPENDENT REGISTERED PUBLIC ACCOUNTING FIRM
To the Board of Directors and Shareholders of
Brandywine Advisors Midcap Growth Fund
In our opinion, the accompanying statement of assets and liabilities, including the schedule of investments, and the related statements of operations and of changes in net assets and the financial highlights present fairly, in all material respects, the financial position of Brandywine Advisors Midcap Growth Fund (the “Fund”, a series of the Brandywine Blue Fund, Inc.) at September 30, 2008, the results of its operations for the year then ended, the changes in its net assets for each of the two years in the period then ended and the financial highlights for each of the five years in the period then ended, in conformity with accounting principles generally accepted in the United States of America. These financial statements and financial highlights (hereafter referred to as “financial statements”) are the responsibility of the Fund’s management; our responsibility is to express an opinion on these financial statements based on our audits. We conducted our audits of these financial statements in accordance with the standards of the Public Company Accounting Oversight Board (United States). Those standards require that we plan and perform the audit to obtain reasonable assurance about whether the financial statements are free of material misstatement. An audit includes examining, on a test basis, evidence supporting the amounts and disclosures in the financial statements, assessing the accounting principles used and significant estimates made by management, and evaluating the overall financial statement presentation. We believe that our audits, which included confirmation of securities at September 30, 2008 by correspondence with the custodian and brokers, provide a reasonable basis for our opinion.
Milwaukee, Wisconsin
October 10, 2008
Brandywine Advisors Midcap Growth Fund Directors and Officers
| | Name, Age, Address | | Position, Term of Office and Length of Time Served and Number of Portfolios in Fund Complex Overseen by Director | | Principal Occupation During Past Five Years | | Other Directorships Held by Director |
| C. Quentin S. Jackson, 64 c/o Friess Associates P.O. Box 4166 Greenville, DE 19807 | | Lead Independent Director Indefinite Term since October, 2001 3 Portfolios | | Mr. Jackson is retired. He was the President and Chief Executive Officer of Nuclear Electric Insurance Ltd., a multibillion-dollar company mutually owned by energy companies. | | None |
| | | | | | | | |
| | | | | | | | |
| Stuart A. McFarland, 61 c/o Friess Associates P.O. Box 4166 Greenville, DE 19807 | | Director Indefinite Term since October, 2001 Audit Committee Chairman, since June 2004 3 Portfolios | | Mr. McFarland is Managing Partner of Federal City Capital Advisors, LLC, a financial advisory firm. He was the Chairman of the Federal City Bancorp, a thrift holding company from April 2004 until June 2007. | | Hyperion Funds (5 portfolios), Newcastle Investment Corporation and RMK Funds |
| | | | | | | | |
| | | | | | | | |
| W. Richard Scarlett III, 69 c/o Friess Associates P.O. Box 4166 Greenville, DE 19807 | | Director Indefinite Term since October, 2001 3 Portfolios | | Mr. Scarlett is Regional Chairman of State of Wyoming Wells Fargo Bank effective July 2008. He was the Chairman and Chief Executive Officer of United Bancorporation of Wyoming, Inc., from 1981 to July 2008. | | State of Wyoming Wells Fargo Bank |
| | | | | | | | |
| | | | | | | | |
| Thomas D. Wren, 56 c/o Friess Associates P.O. Box 4166 Greenville, DE 19807 | | Director Indefinite Term since June, 2006 3 Portfolios | | Mr. Wren is a senior advisor for Promontory Financial Group, LLC. He was the Treasurer of MBNA Corporation and its MBNA America Bank, N.A. subsidiary from 1995 to 2006. | | ACM Financial Trust, Inc. and Hatteras Financial Corp. |
| | | | | | | | |
| | | | | | | | |
| James W. Zug, 68 c/o Friess Associates P.O. Box 4166 Greenville, DE 19807 | | Director Indefinite Term since October, 2001 3 Portfolios | | Mr. Zug is a retired Partner of PricewaterhouseCoopers LLP. He was employed with PricewaterhouseCoopers and its predecessors from 1964 until 2000. | | Allianz Funds (34 portfolios), Amkor Technology, Inc. and Teleflex Inc. |
Brandywine Advisors Midcap Growth Fund Directors and Officers
“Interested Persons” of the Funds* | Name, Age, Address | | Position, Term of Office and Length of Time Served and Number of Portfolios in Fund Complex Overseen by Director or Officer | | Principal Occupation During Past Five Years | | Other Directorships Held by Director or Officer |
| | | | | | | | |
| William F. D’Alonzo*, 53 c/o Friess Associates P.O. Box 4166 Greenville, DE 19807 | | Director Indefinite Term since October, 2001 President since 2003 Chairman since 2004 3 Portfolios | | Mr. D’Alonzo joined Friess Associates in 1981 as part of the research team, became Chief Investment Officer in 1997 and Chief Executive Officer in 2002. | | None |
| | | | | | | | |
| | | | | | | | |
| Foster S. Friess*, 68 c/o Friess Associates P.O. Box 576 Jackson, WY 83001 | | Director Indefinite Term since October, 1985 Founder 3 Portfolios | | Mr. Friess founded Friess Associates in 1974 with his wife, Lynnette E. Friess. He serves as Chairman of the Friess Companies. | | None |
| | | | | | | | |
| | | | | | | | |
| Lynda J. Campbell*, 62 c/o Friess Associates P.O. Box 4166 Greenville, DE 19807 | | Vice President since 1998 Secretary since 1990 Treasurer since 2007 3 Portfolios | | Ms. Campbell joined Friess Associates in 1985, the year of Brandywine Fund’s inception. Ms. Campbell is currently Chief Administrative Officer of the Friess Companies. | | None |
| | | | | | | | |
| | | | | | | | |
| Joseph J. Fields*, 52 c/o Friess Associates P.O. Box 4166 Greenville, DE 19807 | | Vice President since 2007 3 Portfolios | | Mr. Fields joined Friess Associates in 1999. He is currently a Client Relationship Manager of the Friess Companies. | | None |
| | | | | | | | |
| | | | | | | | |
| Gordon Kaiser*, 49 c/o Friess Associates P.O. Box 4166 Greenville, DE 19807 | | Vice President since 2007 3 Portfolios | | Mr. Kaiser joined Friess Associates in 1999. He is currently a Client Relationship Manager of the Friess Companies. | | None |
| | | | | | | | |
| | | | | | | | |
| David D. Marky*, 43 c/o Friess Associates P.O. Box 4166 Greenville, DE 19807 | | Vice President since 2002 Chief Compliance Officer since 2004 3 Portfolios | | Mr. Marky joined Friess Associates in 2000. He currently serves as Chief Compliance Officer for the Friess Companies. | | None |
| | | | | | | | |
For additional information about the Directors and Officers, please call (800) 656-3017 and request a Statement of Additional Information. One will be mailed to you free of charge.
| * | Messrs. D’Alonzo, Friess, Fields, Kaiser and Marky and Ms. Campbell are “interested persons” of the Fund as that term is defined in the Investment Company Act of 1940 by reason of their being officers of the Fund and employees of Friess Associates, LLC. |
Capital Gains Update . . . Brandywine Advisors Midcap Growth Fund will not make a capital gains distribution for the fiscal year ended September 30, 2008. The Fund finished the fiscal year in a net realized loss position of approximately $0.56 per share. The realized loss can be carried forward to offset future realized gains. |
IRA Investors . . . The annual $15 maintenance fee for shareholders invested through IRA accounts is due on November 7, 2008. For your convenience, US Bancorp will automatically deduct this amount from your IRA on the due date. If you prefer not to have the fee swept from your account, please send a check to US Bancorp by the due date. |
| | P.O. Box 4166, Greenville, DE 19807 | |
| (877) 636-6460 | www.brandywinefunds.com | bfunds@friess.com |
Investment Adviser: Friess Associates, LLC | Independent Registered Public Accounting Firm: PricewaterhouseCoopers LLP |
Investment Sub-Adviser: Friess Associates of Delaware, LLC | Legal Counsel: Foley & Lardner LLP |
Custodian: U.S. Bank, N.A. | Distributor: Quasar Distributors, LLC |
Transfer Agent: U.S. Bancorp Fund Services, LLC | |
Officers: Foster Friess, Founder; William D’Alonzo, Chairman and President;
Lynda Campbell, Vice President, Secretary and Treasurer; Joseph Fields, Vice President;
Gordon Kaiser, Vice President; David Marky, Chief Compliance Officer, Vice President and Assistant Secretary
| Report Editor: Chris Aregood | Report Staff: David Marky, Adam Rieger |
Must be preceded or accompanied by prospectus. Please refer to the prospectus for important information about the investment company including investment objectives, risks, charges and expenses.
Mutual fund investing involves risk. Principal loss is possible. The Fund invests in mid-cap companies, which involve additional risks such as limited liquidity and greater volatility. Investments in foreign securities, even though publicly traded in the United States, may involve risks which are in addition to those inherent in domestic investments. Fund holdings and sector weightings are subject to change at any time and are not recommendations to buy or sell any securities. Securities discussed were not held by the Fund as of 9/30/08, unless listed in the accompanying schedule of investments. Cash flow measures the cash-generating capability of a company by adding non-cash charges (e.g. depreciation) and interest expense to pretax income. The Price to Earnings (P/E) Ratio is calculated by dividing current price of the stock by the company’s estimated earnings per share for the current calendar year. References to the earnings growth rates of the Fund refer solely to the estimated earnings growth rates of the average investment holding of the Fund based on consensus estimates from Baseline and not to the actual performance of the Fund itself. Baseline Financial Services, Inc. (Baseline) provides analytical information and services to the investment community. The S&P 500, Russell Midcap, Russell Midcap Growth and Russell 3000 Growth Indexes are unmanaged indices commonly used to measure the performance of U.S. stocks.You cannot invest directly in an index.
As of September 30, 2008, the S&P 500 Index’s average annual total returns for 1, 5 and 10 years were -21.98, 5.16 and 3.06 percent; the Russell Midcap Index’s were -22.36, 8.62 and 8.34 percent; and the Russell Midcap Growth Index’s were - -24.65, 6.53 and 5.51 percent.
10/08
Item 2. Code of Ethics.
Registrant has adopted a code of ethics. See attached Exhibit 12 (a).
Item 3. Audit Committee Financial Expert.
Registrant’s Board of Directors has determined that Mr. Stuart A. McFarland, a member of the audit committee, is an audit committee financial expert. Mr. McFarland is “independent” as such term is defined in Form N-CSR.
Item 4. Principal Accountant Fees and Services.
(a) Audit Fees
$53,502 (FY 2008) and $48,517 (FY 2007) are the aggregate fees billed for each of the last two fiscal years for professional services rendered by the principal accountant to the registrant for the audit of the registrant’s annual financial statements or services that are normally provided by the accountant in connection with statutory and regulatory filings or engagements for those fiscal years.
(b) Audit-Related Fees
There were no fees billed in each of the last two fiscal years for Audit-Related Fees.
$0 (FY 2008) and $12,300 (FY 2007) are the aggregate fees billed in each of the last two fiscal years for professional services rendered by the principal accountant to the registrant for tax compliance, tax advice, tax planning and tax return preparation.
(d) All Other Fees
There were no fees billed in each of the last two fiscal years for products and services provided by the principal accountant to the registrant, other than the services reported in paragraphs (a) – (c) of this Item 4.
(e) (1) None
(e) (2) None
(f) Not applicable.
(g) $71,020 (FY 2008) and $39,925 (FY 2007) in non-audit fees were billed to the registrant’s investment adviser for tax return preparation and AIMR performance verification services.
(h) The Audit Committee of the registrant determined that the non-audit fees billed to the registrant’s investment adviser by the principal accountant disclosed in paragraph (g) of this Item 4, was compatible with maintaining the principal accountant’s independence.
Item 5. Audit Committee of Listed Registrants.
Not applicable.
Item 6. Schedule of Investments.
The schedule of investments in securities of unaffiliated issuers is included as part of the report to shareholders filed under Item 1.
Item 7. Disclosure of Proxy Voting Policies and Procedures for Closed-End Management Investment Companies
Not applicable.
Item 8. Portfolio Managers of Closed-End Management Investment Companies.
Not applicable.
Item 9. Purchases of Equity Securities By Closed-End Management Investment Company and Affiliated Purchasers.
Not applicable.
Item 10. Submission of Matters to a Vote of Security Holders.
None.
Item 11. Controls and Procedures.
| (a) | The disclosure controls and procedures of the Brandywine Blue Fund, Inc. are periodically evaluated. As of October 22, 2008, the date of the last evaluation, we concluded that our disclosure controls and procedures are adequate. |
| (b) | The internal controls of the Brandywine Blue Fund, Inc. are periodically evaluated. There were no changes to Brandywine Blue Fund’s internal control over financial reporting that occurred during the second fiscal quarter of the period covered by this report that have materially affected, or are reasonably likely to materially affect, such controls. |
Item 12. Exhibits.
| (a) | Any code of ethics or amendment thereto. Filed herewith. |
| (b) | Certifications pursuant to Section 302 of the Sarbanes-Oxley Act of 2002. Filed herewith. |
| (c) | Certification pursuant to Section 906 of the Sarbanes-Oxley Act of 2002. Filed herewith. |
SIGNATURES
Pursuant to the requirements of the Securities Exchange Act of 1934 and the Investment Company Act of 1940, the registrant has duly caused this report to be signed on its behalf by the undersigned, thereunto duly authorized.
Brandywine Blue Fund, Inc.
Registrant
By /s/William F. D’Alonzo
William F. D’Alonzo Principal Executive Officer
Date October 24, 2008
Pursuant to the requirements of the Securities Exchange Act of 1934 and the Investment Company Act of 1940, this report has been signed below by the following persons on behalf of the registrant and in the capacities and on the dates indicated.
Brandywine Blue Fund, Inc.
Registrant
By /s/Lynda J. Campbell
Lynda J. Campbell, Principal Financial Officer
Date October 24, 2008