UNITED STATES
SECURITIES AND EXCHANGE COMMISSION
Washington, D.C. 20549
FORM N-CSR
CERTIFIED SHAREHOLDER REPORT OF REGISTERED
MANAGEMENT INVESTMENT COMPANIES
Investment Company Act file number
811-06221
Brandywine Blue Fund, Inc.
(Exact name of registrant as specified in charter)
P.O. Box 4166
Greenville, DE 19807
(Address of principal executive offices) (Zip code)
William F. D’Alonzo
P.O. Box 4166
Greenville, Delaware 19807
(Name and address of agent for service)
(302) 656-3017
Registrant's telephone number, including area code:
Date of fiscal year end: September 30
Date of reporting period: September 30, 2009
Item 1. Reports to Stockholders.
| Managed by Friess Associates, LLC | Annual Report | September 30, 2009 |
Dear Fellow Shareholders:
Investors during the September quarter continued to envision a brighter economic future, extending the stock market rally. Extended, too, was the market’s renewed appetite for risk. Big banks, homebuilders and other earnings-challenged mainstays of the rally’s early months added to their tenure at the forefront of the rebound.
The Brandywine Funds remained focused on the individual-company earnings trends that our research tells us are likely to develop over the next six to nine months. Many other investors appeared willing to set their sights further into the future under optimistic assumptions for the economy. As a result, a good quarter on an absolute basis was something else when compared against benchmarks.
Brandywine Fund grew 8.81 percent in the September quarter versus gains in the Russell 3000 and Russell 3000 Growth Indexes of 16.31 and 14.12 percent. Brandywine Blue Fund grew 8.50 percent as the S&P 500, Russell 1000 and Russell 1000 Growth Indexes gained 15.61, 16.07 and 13.97 percent.
Every economic sector represented in the Brandywine portfolio gained ground in the September quarter, but in some notable instances those gains didn’t keep pace with benchmark returns. Lower returns in the consumer discretionary sector, which represented the largest percentage of Brandywine’s assets, and the health care sector, which was the third largest percentage of assets, accounted for roughly two-thirds of the Fund’s relative performance deficit versus the Russell 3000 Growth Index.
Two of the most significant contributors to Brandywine’s return, Dollar Tree and Comcast Corp., hail from the consumer discretionary sector. With expectation-beating earnings growth in their most recently reported quarter of 50 and 57 percent, respectively, Dollar Tree and Comcast enjoyed returns that showed appreciation for their progress. Likewise, Family Dollar Stores and Vistaprint moved higher in the wake of earnings growth that exceeded consensus views.
One meaningful difference in terms of relative performance is what Brandywine didn’t hold. Homebuilders were among the biggest contributors to consumer discretionary gains posted by benchmarks. On average, homebuilders within the broad Russell 3000 Index saw their market values increase by 47 percent in the quarter. Meanwhile, Wall Street predicts that 15 of the 16 homebuilders from the index will lose money this year and next, which makes them the kind of companies we make a conscious effort to avoid.
Holdings from the health care sector contributed to performance for Brandywine and Brandywine Blue, but they represented the second biggest detractors from relative results in both Funds. Investors showed muted enthusiasm for health care stocks amid continued political debate regarding health insurance. Many of the health care holdings in the Brandywine Funds contribute to health care cost reduction in some way, which we believe works in their favor longer-term.
| | Brandywine | Brandywine Blue |
| Cumulative Total Return | % Change | % Change |
| Quarter | 8.81 | 8.50 |
| One Year | -20.98 | -13.37 |
| Five Years | 0.91 | -2.05 |
| Ten Years | 17.82 | 25.66 |
| Inception | 924.61* | 467.11** |
| Five Years | 0.18 | -0.41 |
| Ten Years | 1.65 | 2.31 |
| Inception | 10.29* | 9.71** |
| Brandywine | 1.08% |
| Brandywine Blue | 1.13% |
***As stated in the Prospectus dated January 30, 2009
Performance data quoted represent past performance; past performance does not guarantee future results. The investment return and principal value of an investment will fluctuate so that an investor’s shares, when redeemed, may be worth more or less than their original cost. Current performance of the Funds may be lower or higher than the performance quoted. Performance data current to the most recent month end may be obtained by visiting www.brandywinefunds.com.
Technology holdings represented the largest percentage of assets in Brandywine Blue. Gains in Apple, Cisco Systems and Hewlett-Packard, among others, generated a technology sector return that trailed the sector’s return within benchmarks.
Holdings from the financial sector were a bright spot for the Brandywine Funds, outperforming benchmarks in both instances. Reinsurance underwriter Everest Re Group Ltd. was a standout performer in Brandywine. The company grew June-quarter earnings 43 percent, surpassing expectations by 40 percent. Goldman Sachs contributed the most to Brandywine Blue’s financial sector results. The per-share result of the investment bank’s 8 percent earnings growth was 39 percent higher than analysts predicted it would be.
For more information on companies that influenced September-quarter performance, please see Roses & Thorns on page 4 for Brandywine and page 7 for Brandywine Blue.
The September quarter was for the most part a continuation of a trend that helped put the Brandywine Funds in a tough spot relative to the overall market in the fiscal year and in the calendar-year-to-date period through September. (For discussions of the fiscal year, please see page 5 for Brandywine and page 8 for Brandywine Blue.) Brandywine and Brandywine Blue are up 4.56 and 4.29 percent this year through September versus benchmark returns ranging from 19.26 percent for the S&P 500 Index to 27.27 percent for the Russell 3000 Growth Index.
The key date – the true turning point as it relates to our relative results in this period – is March 9. We’ve wondered whether someone changed some of the basics of stock investing as we understand them sometime after we went to bed on March 8. From that point on, a lot of companies that looked bad to us were celebrated by the broader investment community while companies that looked good to us seemed unable to attract much positive attention. But when bad is good and good is bad it’s important to remember that being out of sync doesn’t mean being out of touch.
This is far from the first time share prices have risen at a time when earnings compress, an event that raises the market’s price-to-earnings multiple, or P/E, as the “P” in the ratio grows and the “E” falls. One of the more extreme examples occurred in 2001 as the tech bubble collapsed and the U.S. struggled to emerge from recession. The March 9 rally, however, is even more extreme.
“In fact, looking at the past five cycles, we see that the current cycle with a multiple expansion of 191 percent over a period of less than seven months is a 30-year record both in terms of its magnitude and speed,” analysts for Sanford C. Bernstein & Co., LLC wrote in a September 29 report.
Investors are making quick and dramatic judgments based on macro evidence that might be mildly encouraging but still falls well short of anything truly telling. The message investors collectively have been sending since March 9 is that the financial crisis that gripped and, for a time, strangled the market early in the year is over – why else would troubled banks and companies with high debt burdens perform so well?
The financial sector led the market in the September quarter, a period in which the Federal Deposit Insurance Corp. (FDIC) reported that its list of “problem” financial institutions reached a level not seen since the tail end of the savings and loan crisis. About one month later on September 29, the FDIC proposed that FDIC-insured banks – some of which received government assistance less than a year ago – effectively bail out the FDIC by prepaying fees into the insurance fund years in advance to keep it solvent.
As for the machinery at the heart of the credit crisis, certain important debt-securitization markets, where loans are packaged into securities and sold to generate more money for banks to lend, still rely on the government as an important crutch. It remains to be seen how smoothly things function once the government begins extricating itself from those markets, a process scheduled to start next year.
We’re not saying the economy’s funk will continue indefinitely or the worst of the credit crisis will come back to revisit us sometime soon. We just believe the market is ahead of reality in some obvious places and that persistent investor focus on these areas leaves the most promising opportunities elsewhere.
We enjoy the team depth, experience and resources needed to perform the kind of research that we believe will be increasingly important as the environment becomes more discerning based on fundamentals. Our interests are aligned with shareholders as fellow investors and employee-owners, motivating us to generate the kind of results you expect from us. Thanks for the opportunity to serve you.
 |  |
| Bill D’Alonzo | |
| Brandywine Funds President | October 13, 2009 |
Brandywine Fund
% Change in Top Ten Holdings From Book Cost as of September 30, 2009
| 1. | | Comcast Corp. | +4.3% | | 6. | | O’Reilly Automotive, Inc. | +20.5% |
| 2. | | McDermott International, Inc. | +64.9% | | 7. | | Crown Holdings, Inc. | +16.0% |
| 3. | | Dollar Tree, Inc. | +24.3% | | 8. | | GameStop Corp. | +14.1% |
| 4. | | Teva Pharmaceutical Industries Ltd. | +18.8% | | 9. | | LSI Corp. | +12.5% |
| 5. | | Ralcorp Holdings, Inc. | -8.3% | | 10. | | Freeport-McMoRan Copper & Gold Inc. | +8.7% |
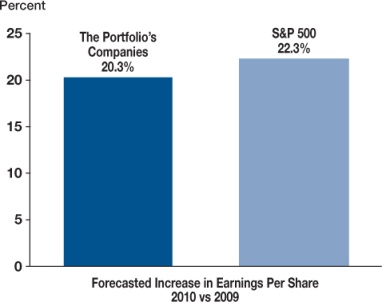
Earnings Growth | The Portfolio’s Market Capitalization |
| 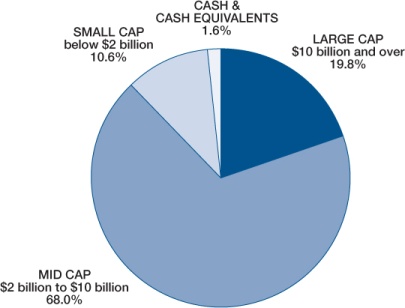 |
Earnings growth rates are based on consensus earnings estimates 68.0% compiled by Baseline, as of September 30, 2009. Friess Associates expects the companies it isolates to exceed consensus expectations, so the growth rate of the portfolio’s companies would be higher using the firm’s internal estimates. Growth rates reflect year-over-year comparisons of aggregate earnings per share. | |
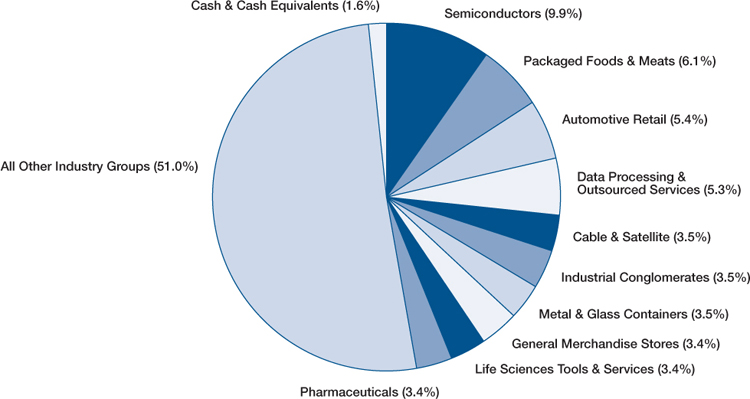
Top Ten Industry Groups
Brandywine Fund
September Quarter “Roses and Thorns”
| | $ Gain | | |
| Biggest $ Winners | (in millions) | % Gain | Reason for Move |
| McDermott International, Inc. | $16.7 | 24.4 | June-quarter earnings topped estimates by 8 percent. Demand for the company’s offshore oil and gas construction segment is expected to continue to build this year and into 2010 as exploration and development work increases. At the same time, McDermott is near completion on some pipeline projects that have weighed on profitability. The company also benefits as a leader in equipment needed for coal and nuclear power generation. |
| Everest Re Group, Ltd. | $13.6 | 15.6 | The provider of reinsurance to property and casualty insurers grew June-quarter earnings 43 percent, beating consensus estimates by 40 percent. Everest gained market share from distressed competitors, while at the same time capitalizing on favorable premium pricing. We sold our position as shares reached our target price. |
| Dollar Tree, Inc. | $12.9 | 15.3 | The largest single-price-point retailer in the country grew July-quarter earnings 50 percent, beating Wall Street estimates by 17 percent. Sales rose 12 percent as the company’s expanding footprint coincided with more shoppers looking for value-priced basics such as frozen foods and cleaning products. Gross margins expanded during the quarter, driven by improved merchandise sourcing and lower freight costs. |
| Comcast Corp. | $12.2 | 16.4 | The largest cable-TV operator in the U.S. grew June-quarter earnings 57 percent, beating estimates by 27 percent. Even as new customer additions slowed, the company experienced net RGU (revenue generating unit) additions due to its ability to offer multiple services over its existing network. Over the past two quarters, Comcast has added 75 percent more Internet access customers than AT&T and Verizon combined, despite serving nearly 40 percent fewer homes. |
| Affiliated Computer Services, Inc. | $11.5 | 11.0 | The provider of information technology outsourcing solutions to commercial and government customers beat June-quarter consensus earnings estimates. Shares rose late in the quarter after Xerox Corp. agreed to buy the company in a deal valued at approximately $5.8 billion, representing a premium of 34 percent. |
| | $ Loss | | |
| Biggest $ Losers | (in millions) | % Loss | Reason for Move |
| FTI Consulting, Inc. | $9.9 | 15.6 | FTI, which advises businesses on litigation, bankruptcies and restructuring, grew June-quarter earnings 5 percent, beating estimates. Sales were bolstered by growth in the corporate financing and restructuring, technology and economic consulting divisions. Accounting and other issues announced by competitor Huron Consulting resulted in an SEC investigation, creating fears that the issues could be prevalent across the industry and putting pressure on FTI shares. |
| O’Reilly Automotive, Inc. | $4.3 | 4.7 | The aftermarket auto parts retailer grew June-quarter earnings 31 percent to $0.63 per share, beating estimates by 15 percent. While increasing traffic and favorable sales trends drove results, O’Reilly traded lower on concerns that new store conversions following its CSK Auto acquisition would slow and that the trend toward do-it-yourself repairs was waning. |
| Huron Consulting Group Inc. | $4.3 | 70.2 | Huron, which advises companies facing lawsuits and government investigations, fell sharply on news that the company would need to restate financial results and that senior management had stepped down. The unforeseen problems stem from how the company accounted for earn-out payments tied to four acquisitions the company made between 2005 and 2007. We sold Huron following the announcement. |
| Symantec Corp. | $3.3 | 11.1 | The maker of security software declined following lower-than-expected June-quarter earnings and lackluster forward guidance due to slower closing rates and narrowing profit margins as the company spent more to boost market share. A challenging overall economic environment is overshadowing new management, a new product cycle and favorable industry consolidation. We sold Symantec during the quarter to fund an idea with more near-term earnings potential. |
| Ralcorp Holdings, Inc. | $3.1 | 3.8 | The manufacturer of branded and private-label cereals and other foods experienced a 51 percent increase in June-quarter sales. Shares traded lower as the company’s Post Foods brand, acquired last year, lost market share due to some issues with integration. We expect Post will contribute to profitability in the future and, more important, that consumers will continue to trade down to Ralcorp’s private-label products amid challenging economic conditions. |
All gains/losses are calculated on an average cost basis
Management’s Discussion of Results, Brandywine Fund
The fiscal year was marked by extremes, with panic related to the credit crisis sending indexes to decade-plus lows before resurgent economic optimism abruptly reversed the market’s direction. Many of the companies hit hardest in the downturn, including banks and companies with significant debt loads, fared especially well in the rally.
Brandywine Fund’s investment strategy emphasizes the relationship between earnings performance and stock prices. In the rally, stock prices recovered in anticipation of an economic recovery before signs surfaced showing that economic conditions and, more important to Brandywine, individual-company earnings were improving.
The fiscal year began in the wake of some of the most dramatic events of the credit crisis, including the government placing Fannie Mae and Freddie Mac in conservatorship and the bankruptcy of Lehman Brothers. The $700 billion Troubled Asset Relief Program (TARP) was established just three days into the fiscal year. Bank failures, asset write-downs, mergers of necessity and other fallout from the credit crisis kept constant pressure on stock prices through the end of 2008.
Investors became increasingly risk-averse, sending stocks to a new low on March 9. With the government following TARP with an aggressive spending plan, confidence began rebuilding and risk tolerance skyrocketed. Stock prices rose even as Wall Street continued revising forward earnings estimates downward, creating a challenging situation for Brandywine.
Companies with losses, deteriorating outlooks and other characteristics that don’t conform with Brandywine’s investment disciplines dominated in the rally, which continued through most of the second half of the fiscal year. Companies with solid earnings growth potential likely to be realized in the next six to nine months – the kind of companies Brandywine typically isolates – attracted relatively little investor attention.
From the beginning of the period through the market low in March, Brandywine’s approach enabled it to contain its decline better than benchmarks. Due to its muted participation in the subsequent rally, Brandywine’s relative performance advantage changed into a significant relative performance deficit by the period’s end.
The Fund declined 20.98 percent in the year ended September 30, 2009. The Russell 3000 and Russell 3000 Growth Indexes declined 6.42 and 2.19 percent.
| | Comparison of Change in Value of $10,000 Investment in Brandywine Fund, Russell 3000 Growth(1), Russell 3000 Index(2) and S&P 500 Index(3) | |
| | | |
| (1) | | The Russell 3000 Growth Index measures the performance of those Russell 3000 Index companies with higher price-to-book ratios and higher forecasted growth values. The stocks in this index are also members of either the Russell 1000 Growth or the Russell 2000 Growth Indexes and includes dividends. | |
| (2) | | The Russell 3000 Index, a trademark of the Frank Russell Company, is 3,000 of the largest publicly traded companies in the United States equity market and includes dividends. | |
| (3) | | The S&P 500 Index consists of 500 stocks, mostly on the New York Stock Exchange, selected by the Standard & Poor’s Ratings Group. Each stock’s weighting is based on its relative total market value and includes dividends. | |
Brandywine Blue Fund
% Change in Top Ten Holdings From Book Cost as of September 30, 2009
| 1. | | Teva Pharmaceutical Industries Ltd. | +17.2% | | 6. | | Celgene Corp. | +31.9% |
| 2. | | Comcast Corp. | +1.4% | | 7. | | The Goldman Sachs Group, Inc. | +28.7% |
| 3. | | Broadcom Corp. | +35.6% | | 8. | | Cisco Systems, Inc. | +6.4% |
| 4. | | Express Scripts, Inc. | +36.2% | | 9. | | ITT Corp. | +15.5% |
| 5. | | Freeport-McMoRan Copper & Gold Inc. | +8.2% | | 10. | | The Williams Companies, Inc. | +18.2% |
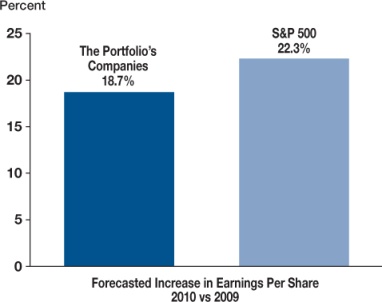
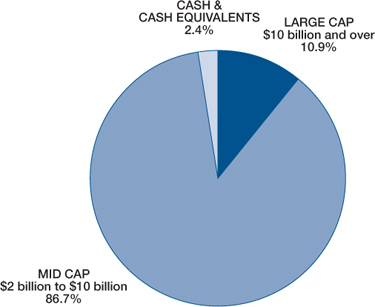
Earnings Growth | The Portfolio’s Market Capitalization |
| 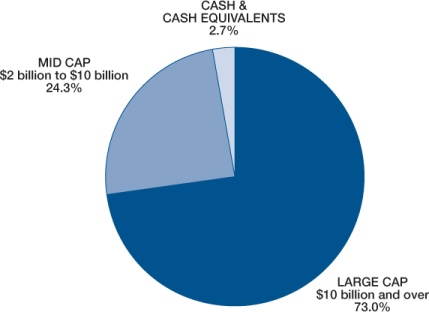 |
| Earnings growth rates are based on consensus earnings estimates compiled by Baseline, as of September 30, 2009. Friess Associates expects the companies it isolates to exceed consensus expectations, so the growth rate of the portfolio’s companies would be higher using the firm’s internal estimates. Growth rates reflect year-over-year comparisons of aggregate earnings per share. | |
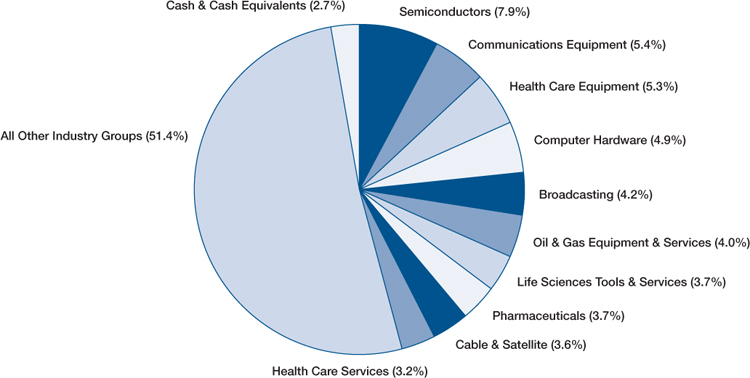
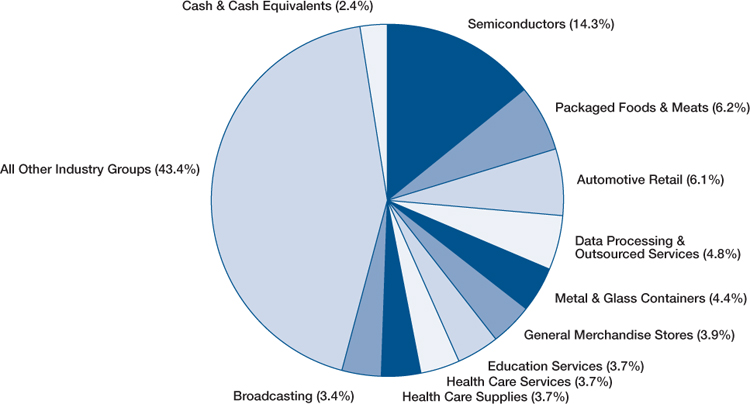
Top Ten Industry Groups
Brandywine Blue Fund
September Quarter “Roses and Thorns”
| | $ Gain | | |
| Biggest $ Winners | (in millions) | % Gain | Reason for Move |
| Broadcom Corp. | $15.5 | 22.0 | New management at the semiconductor manufacturer is focused on restoring profitability. At the same time, increasing demand stems from design wins with top-tier phone manufacturers and a strong upgrade cycle for wireless networks and digital set-top boxes. Broadcom’s broad product portfolio and its ability to skillfully integrate multiple components onto system-on-a-chip solutions continue to provide a competitive advantage. |
| The Goldman Sachs Group, Inc. | $15.1 | 24.4 | The investment bank’s favorable balance sheet has set it up for considerable opportunities in underwriting new debt and equity as smaller competitors struggle to return to health. June-quarter earnings grew 8 percent, beating Wall Street’s estimates by 39 percent. Goldman continues to benefit from wider spreads on fixed income, currency and commodity trades (FICC), which are substantially larger than they were last year. |
| Hewlett-Packard Co. | $14.8 | 19.1 | The world’s largest personal computer maker beat June-quarter estimates with 6 percent earnings growth. Strong growth in the company’s enterprise server and storage segment combined with rebuilding high-margin printer inventories set the stage for revenue growth and operating leverage going forward. |
| Comcast Corp. | $14.6 | 13.3 | The largest cable-TV operator in the U.S. grew June-quarter earnings 57 percent, beating estimates by 27 percent. Even as new customer additions slowed, the company experienced net RGU (revenue generating unit) additions due to its ability to offer multiple services over its existing network. Over the past two quarters, Comcast has added 75 percent more Internet access customers than AT&T and Verizon combined, despite serving nearly 40 percent fewer homes. |
| Invesco Ltd. | $13.4 | 25.3 | We sold the provider of a comprehensive array of investment management services for individuals and institutions when shares reached our target price during the quarter. Invesco benefits from strong growth in AIM and Perpetual, the company’s U.S. and British operations, as well as from its ownership of WL Ross & Company, which specializes in distressed debt and restructuring and is participating in the U.S. Treasury’s Public Private Investment Program. |
| | $ Loss | | |
| Biggest $ Losers | (in millions) | % Loss | Reason for Move |
| Yahoo! Inc. | $6.8 | 7.6 | The world’s largest Internet portal beat June-quarter earnings estimates by 25 percent. A search and advertising deal between the company and Microsoft did not include expected upfront revenue guarantees, implying worsening search trends and disappointing investors. We sold Yahoo! to fund an idea with greater near-term earnings potential. |
| Activision Blizzard, Inc. | $5.4 | 7.8 | The developer of interactive game software beat June-quarter earnings estimates. Shares fell following news that the company would be pushing several new releases into next year to allow for additional development time for multiplayer features. Your team sold Activision during the quarter on concerns that pushed out sales would impact profitability in the near term. |
| Kroger Co. | $5.3 | 6.1 | The operator of the largest supermarket chain in the U.S. lowered quarterly profit and full-year forecasts below previous expectations. Intensifying price wars and sharp retail price declines for staples like produce and dairy gnawed at profitability during the quarter, overshadowing the company’s industry leading private-label program. We sold Kroger to fund an idea with greater near-term earnings visibility. |
| NVIDIA Corp. | $3.6 | 6.5 | The manufacturer of high-level graphics chips for personal computers and gaming consoles more than quadrupled consensus earnings estimates for the June quarter. Despite an improving outlook, shares traded lower as investors expressed concern that the latest generation of Intel platforms could hurt sales due to their ability to integrate more graphics. Our research shows continued strong use of NVIDIA’s newest products in the notebook and handheld markets. |
| Ultra Petroleum Corp. | $3.4 | 6.8 | The natural gas exploration and production company topped June-quarter earnings estimates. While Ultra has an exceptional portfolio of natural gas assets and developing opportunities, shares fell during our holding period as natural gas prices dropped going into the fall season. We sold Ultra Petroleum to fund an idea with greater near term earnings upside. |
All gains/losses are calculated on an average cost basis
Management’s Discussion of Results, Brandywine Blue Fund
The fiscal year began with sharp declines as fallout from the credit crisis revealed itself to be dire and widespread. In response, the government committed unprecedented amounts of capital to restore order and stimulate the economy, contributing to revived investor confidence that helped lift stock prices from multiyear lows. Relative performance suffered in the rally as many of the companies that fared best faced fundamental hurdles that made them the kind of potential investments Brandywine Blue Fund avoids.
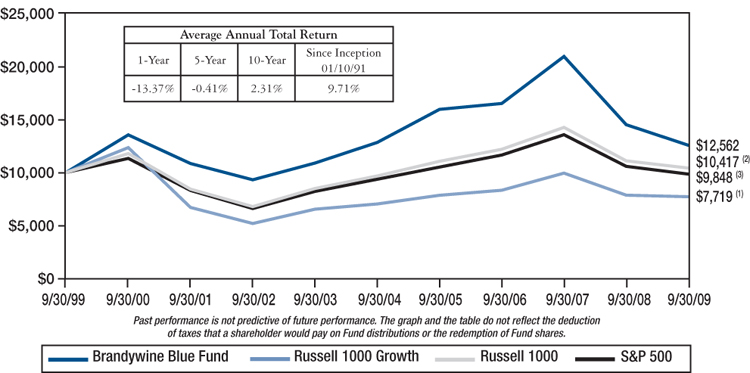
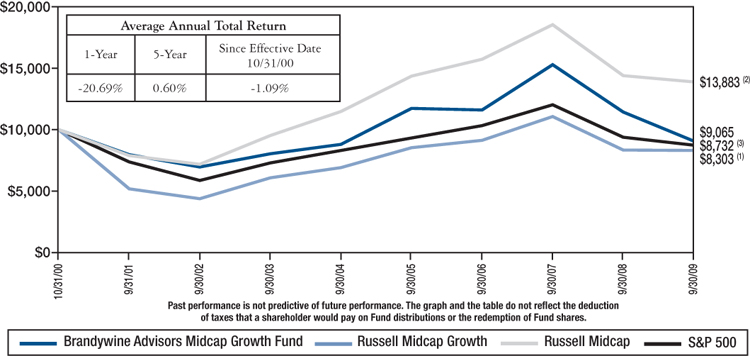
Brandywine Blue declined 13.37 percent in the 12 months ended September 30, 2009. The S&P 500, Russell 1000 and Russell 1000 Growth Indexes declined 6.91, 6.14 and 1.85 percent.
Brandywine Blue’s investment strategy is based on the premise that earnings drive stock prices. In the rally, stock prices recovered in anticipation of an economic recovery before signs surfaced showing that economic conditions and, more important to Brandywine Blue, individual-company earnings were improving.
Brandywine Blue weathered the downturn that marked the beginning of the period and ran into March 2009 better than benchmarks. During that stretch, investors digested a series of significant negative events with potentially far-reaching implications for the economy. Bank failures, asset write-downs, mergers of necessity and other unsettling developments related to the credit crisis kept constant pressure on stock prices.
About two weeks after Lehman Brothers filed for bankruptcy, the government established the Troubled Asset Relief Program (TARP), which in the ensuing months was followed by a series of visible government efforts to stabilize the financial system and stimulate the economy. After setting decade-plus lows on March 9, stock prices began to recover along with investor confidence. Risk tolerance increased substantially. Stocks climbed even as Wall Street continued revising forward earnings estimates downward, creating a challenging situation for Brandywine Blue.
Companies with losses, deteriorating outlooks and other characteristics that Brandywine Blue avoids by design dominated in the rally, which continued through most of the second half of the fiscal year. Companies with solid earnings growth potential likely to be realized in the next six to nine months – the kind of companies Brandywine Blue typically isolates – attracted relatively little investor attention.
| | Comparison of Change in Value of $10,000 Investment in Brandywine Blue Fund, Russell 1000 Growth(1), Russell 1000 Index(2) and S&P 500 Index(3) | |
| (1) | | The Russell 1000 Growth Index measures the performance of those Russell 1000 Index companies with higher price-to-book ratios and higher forecasted growth values and includes dividends. | |
| (2) | | The Russell 1000 Index, a trademark of the Frank Russell Company, is the largest 1,000 companies of the 3,000 largest publicly traded companies in the United States equity market and includes dividends. | |
| (3) | | The S&P 500 Index consists of 500 stocks, mostly on the New York Stock Exchange, selected by the Standard & Poor’s Ratings Group. Each stock’s weighting is based on its relative total market value and includes dividends. | |
REPORT OF INDEPENDENT REGISTERED PUBLIC ACCOUNTING FIRM
To the Board of Directors and Shareholders of Brandywine Fund, Inc. and Brandywine Blue Fund
In our opinion, the accompanying statements of assets and liabilities, including the schedules of investments, and the related statements of operations and of changes in net assets and the financial highlights present fairly, in all material respects, the financial position of Brandywine Fund, Inc. and Brandywine Blue Fund (a series of the Brandywine Blue Fund, Inc.) (the “Funds”) at September 30, 2009, the results of each of their operations for the year then ended, the changes in each of their net assets for each of the two years in the period then ended and the financial highlights for each of the five years in the period then ended, in conformity with accounting principles generally accepted in the United States of America. These financial statements and financial highlights (hereafter referred to as “financial statements”) are the responsibility of the Funds’ management; our responsibility is to express an opinion on these financial statements based on our audits. We conducted our audits of these financial statements in accordance with the standards of the Public Company Accounting Oversight Board (United States). Those standards require that we plan and perform the audit to obtain reasonable assurance about whether the financial statements are free of material misstatement. An audit includes examining, on a test basis, evidence supporting the amounts and disclosures in the financial statements, assessing the accounting principles used and significant estimates made by management, and evaluating the overall financial statement presentation. We believe that our audits, which included confirmation of securities at September 30, 2009 by correspondence with the custodian and brokers, provide a reasonable basis for our opinion.

Milwaukee, Wisconsin
October 13, 2009
Brandywine Fund, Inc.
Statement of Assets and Liabilities
September 30, 2009
| Assets: | | | |
| Investments in securities, at value (cost $2,023,542,256) | | $ | 2,276,119,145 | |
| Receivable from investments sold | | | 77,363,364 | |
| Dividends and interest receivable | | | 473,722 | |
| Receivable from shareholders for purchases | | | 308,584 | |
| Total assets | | $ | 2,354,264,815 | |
| Liabilities: | | | | |
| Payable to brokers for investments purchased | | $ | 67,605,882 | |
| Payable to shareholders for redemptions | | | 2,779,756 | |
| Payable to adviser for management fees | | | 1,865,384 | |
| Other liabilities | | | 333,249 | |
| Total liabilities | | | 72,584,271 | |
| Net Assets: | | | | |
| Capital Stock, $0.01 par value; 500,000,000 shares authorized; 108,109,056 shares outstanding | | | 3,391,410,165 | |
| Net unrealized appreciation on investments | | | 252,576,889 | |
| Accumulated net realized loss on investments | | | (1,362,306,510 | ) |
| Net assets | | | 2,281,680,544 | |
| Total liabilities and net assets | | $ | 2,354,264,815 | |
Calculation of net asset value per share: Net asset value, offering and redemption price per share ($2,281,680,544 ÷ 108,109,056 shares outstanding) | | $ | 21.11 | |
The accompanying notes to financial statements are an integral part of this statement.
Brandywine Fund, Inc.
Schedule of Investments
September 30, 2009
| Shares | | | | Cost | | | Value | |
Common Stocks - 98.4% (a) | | | | | | |
CONSUMER DISCRETIONARY | | | | | | |
| | | Apparel Retail - 0.7% | | | | | | |
| | 470,400 | | American Eagle Outfitters, Inc. | | $ | 7,982,766 | | | $ | 7,930,944 | |
| | 616,100 | | Foot Locker, Inc. | | | 6,945,706 | | | | 7,362,395 | |
| | | | Apparel, Accessories & Luxury Goods - 1.3% | | | | | | | | |
| | 375,900 | | Carter’s, Inc.* | | | 10,075,133 | | | | 10,036,530 | |
| | 471,000 | | The Warnaco Group, Inc.* | | | 17,958,400 | | | | 20,658,060 | |
| | | | Automobile Manufacturers - 0.8% | | | | | | | | |
| | 573,000 | | Thor Industries, Inc. | | | 15,213,366 | | | | 17,734,350 | |
| | | | Automotive Retail - 5.4% | | | | | | | | |
| | 345,000 | | AutoZone, Inc.* | | | 53,977,414 | | | | 50,445,900 | |
| | 2,012,400 | | O’Reilly Automotive, Inc.* | | | 60,339,498 | | | | 72,728,136 | |
| | | | Broadcasting - 1.3% | | | | | | | | |
| | 1,007,100 | | Discovery Communications, Inc.* | | | 22,611,544 | | | | 29,095,119 | |
| | | | Cable & Satellite - 3.5% | | | | | | | | |
| | 4,746,300 | | Comcast Corp. | | | 76,848,143 | | | | 80,165,007 | |
| | | | Computer & Electronics Retail - 2.8% | | | | | | | | |
| | 2,443,700 | | GameStop Corp.* | | | 56,677,820 | | | | 64,684,739 | |
| | | | Department Stores - 0.3% | | | | | | | | |
| | 100,900 | | Kohl’s Corp*. | | | 5,768,009 | | | | 5,756,345 | |
| | | | Distributors - 0.4% | | | | | | | | |
| | 441,000 | | LKQ Corp.* | | | 7,519,634 | | | | 8,176,140 | |
| | | | Education Services - 2.7% | | | | | | | | |
| | 397,900 | | Apollo Group, Inc.* | | | 27,363,009 | | | | 29,313,293 | |
| | 593,700 | | DeVry, Inc. | | | 29,970,642 | | | | 32,843,484 | |
| | | | General Merchandise Stores - 3.4% | | | | | | | | |
| | 1,612,200 | | Dollar Tree, Inc.* | | | 63,155,592 | | | | 78,481,896 | |
| | | | Internet Retail - 0.9% | | | | | | | | |
| | 222,300 | | Amazon.com, Inc.* | | | 20,156,819 | | | | 20,753,928 | |
| | | | Leisure Products - 2.0% | | | | | | | | |
| | 2,441,100 | | Mattel, Inc. | | | 44,457,462 | | | | 45,062,706 | |
| | | | Movies & Entertainment - 0.3% | | | | | | | | |
| | 113,800 | | Cinemark Holdings, Inc. | | | 1,158,103 | | | | 1,178,968 | |
| | 386,200 | | Regal Entertainment Group | | | 4,899,807 | | | | 4,757,984 | |
| | | | Restaurants - 0.3% | | | | | | | | |
| | 297,300 | | Papa John’s International, Inc.* | | | 8,148,751 | �� | | | 7,304,661 | |
| | | | Specialized Consumer Services - 0.3% | | | | | | | | |
| | 223,700 | | Coinstar, Inc.* | | | 7,104,444 | | | | 7,377,626 | |
| | | | Total Consumer Discretionary | | | 548,332,062 | | | | 601,848,211 | |
| | | | This sector is 9.8% above your Fund’s cost. | | | | | | | | |
CONSUMER STAPLES | | | | | | | |
| | | | Food Retail - 0.1% | | | | | | | | |
| | 93,500 | | Casey’s General Stores, Inc. | | | 2,333,990 | | | | 2,934,030 | |
| | | | Household Products - 2.2% | | | | | | | | |
| | 875,800 | | Church & Dwight Co., Inc. | | | 46,202,700 | | | | 49,692,892 | |
| | | | Hypermarkets & Super Centers - 1.0% | | | | | | | | |
| | 607,200 | | BJ’s Wholesale Club, Inc.* | | | 21,271,341 | | | | 21,992,784 | |
| | | | Packaged Foods & Meats - 6.1% | | | | | | | | |
| | 668,300 | | Flowers Foods, Inc. | | | 14,951,912 | | | | 17,569,607 | |
| | 546,400 | | Green Mountain Coffee Roasters, Inc.* | | | 34,335,247 | | | | 40,346,176 | |
| | 1,299,500 | | Ralcorp Holdings, Inc.* | | | 82,859,664 | | | | 75,981,765 | |
| | 137,400 | | TreeHouse Foods, Inc.* | | | 4,399,909 | | | | 4,901,058 | |
| | | | Personal Products - 1.9% | | | | | | | | |
| | 438,500 | | Avon Products, Inc. | | | 14,524,061 | | | | 14,891,460 | |
| | 725,800 | | NBTY, Inc.* | | | 18,880,180 | | | | 28,727,164 | |
| | | | Total Consumer Staples | | | 239,759,004 | | | | 257,036,936 | |
| | | | This sector is 7.2% above your Fund’s cost. | | | | | | | | |
ENERGY | | | | | | | | |
| | | | Coal & Consumable Fuels - 1.4% | | | | | | | | |
| | 1,179,100 | | Massey Energy Co. | | | 34,321,196 | | | | 32,885,099 | |
| | | | Oil & Gas Drilling - 1.7% | | | | | | | | |
| | 1,889,300 | | Nabors Industries Ltd.* | | | 35,325,276 | | | | 39,486,370 | |
| | | | Oil & Gas Equipment & Services - 1.5% | | | | | | | | |
| | 1,641,100 | | Weatherford International Ltd.* | | | 33,382,887 | | | | 34,020,003 | |
| | | | Oil & Gas Exploration & Production - 0.5% | | | | | | | | |
| | 576,500 | | EXCO Resources, Inc.* | | | 6,853,983 | | | | 10,774,785 | |
| | | | Total Energy | | | 109,883,342 | | | | 117,166,257 | |
| | | | This sector is 6.6% above your Fund’s cost. | | | | | | | | |
FINANCIALS | | | | | | | | |
| | | | Asset Management & Custody Banks - 1.1% | | | | | | | | |
| | 1,318,300 | | SEI Investments Co. | | | 23,327,100 | | | | 25,944,144 | |
| | | | Investment Banking & Brokerage - 0.7% | | | | | | | | |
| | 179,900 | | Greenhill & Co., Inc. | | | 15,419,988 | | | | 16,115,442 | |
| | | | Real Estate Services - 0.1% | | | | | | | | |
| | 156,311 | | Altisource Portfolio Solutions SA* | | | 1,992,310 | | | | 2,257,131 | |
| | | | Reinsurance - 0.7% | | | | | | | | |
| | 46,200 | | Montpelier Re Holdings Ltd. | | | 715,218 | | | | 753,984 | |
| | 631,100 | | Validus Holdings, Ltd. | | | 13,867,199 | | | | 16,282,380 | |
| | | | Thrifts & Mortgage Finance - 0.2% | | | | | | | | |
| | 418,700 | | Ocwen Financial Corp.* | | | 3,921,244 | | | | 4,739,684 | |
| | | | Total Financials | | | 59,243,059 | | | | 66,092,765 | |
| | | | This sector is 11.6% above your Fund’s cost. | | | | | | | | |
HEALTH CARE | | | | | | | | |
| | | | Health Care Distributors - 0.3% | | | | | | | | |
| | 283,900 | | PSS World Medical, Inc.* | | | 5,724,607 | | | | 6,197,537 | |
Brandywine Fund, Inc.
Schedule of Investments (Continued)
September 30, 2009
| Shares | | | | Cost | | | Value | |
Common Stocks - 98.4% (a) (Continued) | | | | | | |
| | | | | | | | | |
| | | Health Care Equipment - 1.3% | | | | | | |
| | 471,100 | | Baxter International Inc. | | $ | 24,268,621 | | | $ | 26,857,411 | |
| | 75,400 | | Masimo Corp.* | | | 1,909,096 | | | | 1,975,480 | |
| | | | Health Care Services - 2.7% | | | | | | | | |
| | 19,700 | | Emergency Medical Services Corp.* | | | 788,000 | | | | 916,050 | |
| | 438,476 | | Express Scripts, Inc.* | | | 19,874,179 | | | | 34,016,968 | |
| | 502,280 | | MEDNAX, Inc.* | | | 26,270,541 | | | | 27,585,218 | |
| | | | Health Care Supplies - 2.4% | | | | | | | | |
| | 1,395,500 | | Inverness Medical Innovations, Inc.* | | | 53,111,770 | | | | 54,047,715 | |
| | | | Health Care Technology - 0.5% | | | | | | | | |
| | 581,600 | | Eclipsys Corp.* | | | 10,129,344 | | | | 11,224,880 | |
| | 63,900 | | Phase Forward Inc.* | | | 906,729 | | | | 897,156 | |
| | | | Life Sciences Tools & Services - 3.4% | | | | | | | | |
| | 657,200 | | Covance Inc.* | | | 24,233,313 | | | | 35,587,380 | |
| | 512,088 | | ICON PLC - SP-ADR* | | | 9,145,265 | | | | 12,541,035 | |
| | 585,000 | | Life Technologies Corp.* | | | 24,648,274 | | | | 27,231,750 | |
| | 50,900 | | Techne Corp. | | | 3,064,948 | | | | 3,183,795 | |
| | | | Pharmaceuticals - 3.4% | | | | | | | | |
| | 1,523,100 | | Teva Pharmaceutical Industries Ltd. SP-ADR | | | 64,832,337 | | | | 77,007,936 | |
| | | | Total Health Care | | | 268,907,024 | | | | 319,270,311 | |
| | | | This sector is 18.7% above your Fund’s cost. | | | | | | | | |
INDUSTRIALS | | | | | | | | |
| | | | Air Freight & Logistics - 0.5% | | | | | | | | |
| | 156,500 | | FedEx Corp. | | | 11,784,859 | | | | 11,771,930 | |
| | | | Construction & Engineering - 0.8% | | | | | | | | |
| | 666,000 | | Chicago Bridge & Iron Co. N.V. NYS | | | 9,444,754 | | | | 12,440,880 | |
| | 572,100 | | MasTec, Inc.* | | | 6,944,949 | | | | 6,951,015 | |
| | | | Electrical Components & Equipment - 0.6% | | | | | | | | |
| | 977,100 | | GrafTech International Ltd.* | | | 13,787,956 | | | | 14,363,370 | |
| | | | Industrial Conglomerates - 3.5% | | | | | | | | |
| | 3,169,900 | | McDermott International, Inc.* | | | 48,568,554 | | | | 80,103,373 | |
| | | | Research & Consulting Services - 2.1% | | | | | | | | |
| | 1,100,800 | | FTI Consulting, Inc.* | | | 56,244,507 | | | | 46,905,088 | |
| | 25,000 | | Navigant Consulting, Inc.* | | | 335,290 | | | | 337,500 | |
| | | | Security & Alarm Services - 0.1% | | | | | | | | |
| | 81,000 | | The Geo Group Inc.* | | | 1,617,045 | | | | 1,633,770 | |
| | | | Trucking - 2.2% | | | | | | | | |
| | 1,542,400 | | Hunt (J.B.) Transport Services, Inc. | | | 41,244,405 | | | | 49,557,312 | |
| | | | Total Industrials | | | 189,972,319 | | | | 224,064,238 | |
| | | | This sector is 17.9% above your Fund’s cost. | | | | | | | | |
INFORMATION TECHNOLOGY | | | | | | | | |
| | | | Application Software - 1.9% | | | | | | | | |
| | 2,902,300 | | Nuance Communications, Inc.* | | | 24,155,633 | | | | 43,418,408 | |
| | | | Communications Equipment - 2.2% | | | | | | | | |
| | 2,143,300 | | Cisco Systems, Inc.* | | | 47,789,571 | | | | 50,453,282 | |
| | 29,478 | | NETGEAR, Inc.* | | | 496,367 | | | | 540,921 | |
| | | | Computer Storage & Peripherals - 1.9% | | | | | | | | |
| | 1,806,100 | | QLogic Corp.* | | | 30,569,077 | | | | 31,064,920 | |
| | 482,100 | | Synaptics Inc.* | | | 13,091,310 | | | | 12,148,920 | |
| | | | Data Processing & Outsourced Services - 5.3% | | | | | | | | |
| | 786,300 | | Affiliated Computer Services, Inc.* | | | 35,279,671 | | | | 42,593,871 | |
| | 583,400 | | Alliance Data Systems Corp.* | | | 32,712,561 | | | | 35,634,072 | |
| | 762,700 | | Lender Processing Services, Inc. | | | 29,064,268 | | | | 29,112,259 | |
| | 181,500 | | Visa Inc. | | | 12,592,333 | | | | 12,543,465 | |
| | | | IT Consulting & Other Services - 0.4% | | | | | | | | |
| | 177,900 | | CACI International Inc.* | | | 6,311,258 | | | | 8,409,333 | |
| | | | Internet Software & Services - 1.0% | | | | | | | | |
| | 430,000 | | VistaPrint N.V.* | | | 17,419,329 | | | | 21,822,500 | |
| | | | Semiconductors - 9.9% | | | | | | | | |
| | 932,300 | | Altera Corp. | | | 18,298,820 | | | | 19,121,473 | |
| | 403,600 | | Atheros Communications* | | | 6,972,048 | | | | 10,707,508 | |
| | 506,200 | | Avago Technologies Ltd.* | | | 7,852,548 | | | | 8,640,834 | |
| | 310,600 | | Cavium Networks, Inc.* | | | 6,631,227 | | | | 6,668,582 | |
| | 2,218,200 | | Cypress Semiconductor Corp.* | | | 22,420,973 | | | | 22,914,006 | |
| | 1,024,300 | | Integrated Device Technology, Inc.* | | | 6,800,422 | | | | 6,924,268 | |
| | 11,087,900 | | LSI Corp.* | | | 54,091,990 | | | | 60,872,571 | |
| | 2,957,800 | | Maxim Integrated Products, Inc. | | | 41,895,456 | | | | 53,654,492 | |
| | 1,182,600 | | National Semiconductor Corp. | | | 17,178,202 | | | | 16,875,702 | |
| | 119,800 | | Power Integrations, Inc. | | | 2,866,540 | | | | 3,992,934 | |
| | 334,100 | | Silicon Laboratories Inc.* | | | 12,228,248 | | | | 15,488,876 | |
| | | | Systems Software - 0.2% | | | | | | | | |
| | 222,000 | | CommVault Systems, Inc.* | | | 3,707,621 | | | | 4,606,500 | |
| | | | Total Information Technology | | | 450,425,473 | | | | 518,209,697 | |
| | | | This sector is 15.0% above your Fund’s cost. | | | | | | | | |
MATERIALS | | | | | | | | |
| | | | Diversified Metals & Mining - 2.4% | | | | | | | | |
| | 806,500 | | Freeport-McMoRan Copper & Gold Inc. | | | 50,903,258 | | | | 55,333,965 | |
| | | | Metal & Glass Containers - 3.5% | | | | | | | | |
| | 2,408,000 | | Crown Holdings, Inc.* | | | 56,476,919 | | | | 65,497,600 | |
| | 122,600 | | Greif Inc. | | | 6,649,732 | | | | 6,749,130 | |
| | 130,800 | | Silgan Holdings Inc. | | | 5,696,023 | | | | 6,897,084 | |
| | | | Total Materials | | | 119,725,932 | | | | 134,477,779 | |
| | | | This sector is 12.3% above your Fund’s cost. | | | | | | | | |
Brandywine Fund, Inc.
Schedule of Investments (Continued)
September 30, 2009
Shares or Principal Amount | | | | Cost | | | Value | |
Common Stocks - 98.4% (a) (Continued) | | | | | | |
TELECOMMUNICATION SERVICES | | | | | | |
| | | Wireless Telecommunication Services - 0.3% | | | | | | |
| | 568,200 | | Iridium Communications, Inc.* | | $ | 5,744,704 | | | $ | 6,403,614 | |
| | | | Total Telecommunication Services | | | 5,744,704 | | | | 6,403,614 | |
| | | | This sector is 11.5% above your Fund’s cost. | | | | | | | | |
| | | | Total common stocks | | | 1,991,992,919 | | | | 2,244,569,808 | |
Short-Term Investments - 1.4% (a) | | | | | | | | |
| | | | Commercial Paper - 1.3% | | | | | | | | |
| $ | 28,900,000 | | ING America Insurance Holdings, due 10/01/09, discount of 0.20% | | | 28,900,000 | | | | 28,900,000 | |
| | | | Variable Rate Demand Note - 0.1% | | | | | | | | |
| | 2,649,337 | | American Family Financial Services, 0.10% | | | 2,649,337 | | | | 2,649,337 | |
| | | | Total short-term investments | | | 31,549,337 | | | | 31,549,337 | |
| | | | Total investments - 99.8% | | $ | 2,023,542,256 | | | | 2,276,119,145 | |
| | | | Other assets less | | | | | | | | |
| | | | liabilities - 0.2% (a) | | | | | | | 5,561,399 | |
| | | | TOTAL NET ASSETS - 100.0% | | | | | | $ | 2,281,680,544 | |
* Non-dividend paying security.
(a) Percentages for the various classifications relate to net assets.
N.V. - Netherlands Antilles Limited Liability Corp.
NYS - New York Registered Shares
SP-ADR - Sponsored American Depositary Receipts
The accompanying notes to financial statements are an integral part of this schedule.
Statement of Operations
For the Year Ended September 30, 2009
| Income: | | | |
| Dividends | | $ | 19,114,314 | |
| Interest | | | 442,991 | |
| Total income | | | 19,557,305 | |
| Expenses: | | | | |
| Management fees | | | 23,048,359 | |
| Transfer agent fees | | | 1,345,600 | |
| Printing and postage expense | | | 300,677 | |
| Administrative and accounting services | | | 274,424 | |
| Custodian fees | | | 144,585 | |
| Board of Directors fees and expenses | | | 110,102 | |
| Professional fees | | | 69,047 | |
| Insurance expense | | | 51,676 | |
| Registration fees | | | 51,157 | |
| Other expenses | | | 13,417 | |
| Total expenses | | | 25,409,044 | |
| Net Investment Loss | | | (5,851,739 | ) |
| Net Realized Loss on Investments | | | (1,141,417,077 | ) |
| Net Increase in Unrealized Appreciation on Investments | | | 399,565,873 | |
| Net Loss on Investments | | | (741,851,204 | ) |
| Net Decrease in Net Assets Resulting From Operations | | $ | (747,702,943 | ) |
The accompanying notes to financial statements are an integral part of this statement.
Brandywine Fund, Inc.
Statements of Changes in Net Assets
For the Years Ended September 30, 2009 and 2008
| | | 2009 | | | 2008 | |
| Operations: | | | | | | |
| Net investment loss | | $ | (5,851,739 | ) | | $ | (23,595,813 | ) |
| Net realized loss on investments | | | (1,141,417,077 | ) | | | (74,950,120 | ) |
| Net increase (decrease) in unrealized appreciation on investments | | | 399,565,873 | | | | (1,082,904,525 | ) |
| Net decrease in net assets resulting from operations | | | (747,702,943 | ) | | | (1,181,450,458 | ) |
| | | | | | | | | |
| Distributions to Shareholders: | | | | | | | | |
| Distributions from net realized gains ($0.1145 and $5.22252 per share, respectively) | | | (14,327,226 | ) | | | (628,623,195 | ) |
| Fund Share Activities: | | | | | | | | |
| Proceeds from shares issued (8,247,123 and 12,943,440 shares, respectively) | | | 163,040,216 | | | | 446,449,782 | |
| Net asset value of shares issued in distributions reinvested (655,907 and 15,978,665 shares, respectively) | | | 13,715,026 | | | | 599,258,536 | |
| Cost of shares redeemed (28,178,168 and 19,927,339 shares, respectively) | | | (554,831,955 | ) | | | (665,114,852 | ) |
| Net (decrease) increase in net assets derived from Fund share activities | | | (378,076,713 | ) | | | 380,593,466 | |
| Total Decrease | | | (1,140,106,882 | ) | | | (1,429,480,187 | ) |
| | | | | | | | | |
| Net Assets at the Beginning of the Year | | | 3,421,787,426 | | | | 4,851,267,613 | |
| Net Assets at the End of the Year | | $ | 2,281,680,544 | | | $ | 3,421,787,426 | |
| (Includes undistributed net investment income of $0 and $0, respectively) | | | | | | | | |
Financial Highlights
(Selected data for each share of the Fund outstanding throughout each year)
| | | Years Ended September 30, | |
| | | 2009 | | | 2008 | | | 2007 | | | 2006 | | | 2005 | |
| PER SHARE OPERATING PERFORMANCE: | | | | | | | | | | | | | | | |
| Net asset value, beginning of year | | $ | 26.86 | | | $ | 40.98 | | | $ | 32.27 | | | $ | 31.50 | | | $ | 24.19 | |
Income from investment operations: | | | | | | | | | | | | | | | | | | | | |
Net investment loss(1) | | | (0.05 | ) | | | (0.18 | ) | | | (0.19 | ) | | | (0.10 | ) | | | (0.08 | ) |
| Net realized and unrealized (losses) gains on investments | | | (5.59 | ) | | | (8.72 | ) | | | 9.15 | | | | 0.87 | | | | 7.39 | |
| Total from investment operations | | | (5.64 | ) | | | (8.90 | ) | | | 8.96 | | | | 0.77 | | | | 7.31 | |
Less distributions: | | | | | | | | | | | | | | | | | | | | |
| Distributions from net investment income | | | — | | | | — | | | | — | | | | — | | | | — | |
| Distributions from net realized gains | | | (0.11 | ) | | | (5.22 | ) | | | (0.25 | ) | | | — | | | | — | |
| Total from distributions | | | (0.11 | ) | | | (5.22 | ) | | | (0.25 | ) | | | — | | | | — | |
| Net asset value, end of year | | $ | 21.11 | | | $ | 26.86 | | | $ | 40.98 | | | $ | 32.27 | | | $ | 31.50 | |
| TOTAL RETURN | | | (20.98 | %) | | | (25.16 | %) | | | 27.90 | % | | | 2.44 | % | | | 30.22 | % |
RATIOS/SUPPLEMENTAL DATA: | | | | | | | | | | | | | | | | | | | | |
| Net assets, end of year (in 000’s $) | | | 2,281,681 | | | | 3,421,787 | | | | 4,851,268 | | | | 4,066,292 | | | | 3,995,582 | |
Ratio of expenses to average net assets | | | 1.10 | % | | | 1.08 | % | | | 1.08 | % | | | 1.08 | % | | | 1.08 | % |
Ratio of net investment loss to average net assets | | | (0.25 | %) | | | (0.54 | %) | | | (0.54 | %) | | | (0.31 | %) | | | (0.25 | %) |
| Portfolio turnover rate | | | 239 | % | | | 210 | % | | | 162 | % | | | 200 | % | | | 183 | % |
| Net investment loss per share was calculated using average shares outstanding. |
The accompanying notes to financial statements are an integral part of these statements.
Brandywine Blue Fund
Statement of Assets and Liabilities
September 30, 2009
| Assets: | | | |
| Investments in securities, at value (cost $2,236,527,459) | | $ | 2,450,317,138 | |
| Receivable from investments sold | | | 41,986,549 | |
| Receivable from shareholders for purchases | | | 34,201,467 | |
| Dividends and interest receivable | | | 1,923,983 | |
| Total assets | | $ | 2,528,429,137 | |
Liabilities: | | | | |
| Payable to brokers for investments purchased | | $ | 57,597,063 | |
| Payable to shareholders for redemptions | | | 6,333,682 | |
| Payable to adviser for management fees | | | 2,003,111 | |
| Other liabilities | | | 588,705 | |
| Total liabilities | | | 66,522,561 | |
Net Assets: | | | | |
| Capital Stock, $0.01 par value; 500,000,000 shares authorized; 119,104,247 shares outstanding | | | 3,935,545,019 | |
| Net unrealized appreciation on investments | | | 213,789,679 | |
| Accumulated net realized loss on investments | | | (1,692,783,673 | ) |
| Undistributed net investment income | | | 5,355,551 | |
| Net assets | | | 2,461,906,576 | |
| Total liabilities and net assets | | $ | 2,528,429,137 | |
Calculation of net asset value per share: | | | | |
Net asset value, offering and redemption price per share ($2,461,906,576 ÷ 119,104,247 shares outstanding) | | $ | 20.67 | |
The accompanying notes to financial statements are an integral part of this statement.
Schedule of Investments
September 30, 2009
| Shares | | | | Cost | | | Value | |
Common Stocks - 97.3% (a) | | | | | | |
CONSUMER DISCRETIONARY | | | | | | |
| | | Automotive Retail - 2.4% | | | | | | |
| | 406,600 | | AutoZone, Inc.* | | $ | 63,203,496 | | | $ | 59,453,052 | |
| | | | Broadcasting - 4.2% | | | | | | | | |
| | 3,922,700 | | CBS Corp. Cl B Non-Voting | | | 47,617,611 | | | | 47,268,535 | |
| | 1,902,800 | | Discovery Communications, Inc.* | | | 42,368,927 | | | | 54,971,892 | |
| | | | Cable & Satellite - 3.6% | | | | | | | | |
| | 5,223,600 | | Comcast Corp. | | | 86,967,250 | | | | 88,226,604 | |
| | | | Department Stores - 0.3% | | | | | | | | |
| | 107,000 | | Kohl’s Corp.* | | | 6,116,719 | | | | 6,104,350 | |
| | | | Education Services - 2.6% | | | | | | | | |
| | 880,000 | | Apollo Group, Inc.* | | | 59,379,653 | | | | 64,829,600 | |
| | | | Footwear - 2.0% | | | | | | | | |
| | 760,500 | | NIKE, Inc. Cl B | | | 42,906,429 | | | | 49,204,350 | |
| | | | Internet Retail - 1.4% | | | | | | | | |
| | 361,400 | | Amazon.com, Inc.* | | | 33,007,331 | | | | 33,740,304 | |
| | | | Leisure Products - 2.4% | | | | | | | | |
| | 3,229,000 | | Mattel, Inc. | | | 58,751,286 | | | | 59,607,340 | |
| | | | Total Consumer Discretionary | | | 440,318,702 | | | | 463,406,027 | |
| | | | This sector is 5.2% above your Fund’s cost. | | | | | | | | |
CONSUMER STAPLES | | | | | | | | |
| | | | Drug Retail - 2.4% | | | | | | | | |
| | 1,684,300 | | CVS Caremark Corp. | | | 62,025,752 | | | | 60,196,882 | |
| | | | Personal Products - 0.7% | | | | | | | | |
| | 522,700 | | Avon Products, Inc. | | | 17,319,854 | | | | 17,750,892 | |
| | | | Soft Drinks - 2.4% | | | | | | | | |
| | 998,800 | | PepsiCo, Inc. | | | 56,540,234 | | | | 58,589,608 | |
| | | | Total Consumer Staples | | | 135,885,840 | | | | 136,537,382 | |
| | | | This sector is 0.5% above your Fund’s cost. | | | | | | | | |
ENERGY | | | | | | | | |
| | | | Oil & Gas Equipment & Services - 4.0% | | | | | | | | |
| | 1,639,200 | | Cameron International Corp.* | | | 56,451,559 | | | | 61,994,544 | |
| | 1,760,200 | | Weatherford International Ltd.* | | | 35,752,957 | | | | 36,488,946 | |
| | | | Oil & Gas Storage & Transportation - 2.9% | | | | | | | | |
| | 3,938,100 | | The Williams Companies, Inc. | | | 59,560,760 | | | | 70,373,847 | |
| | | | Total Energy | | | 151,765,276 | | | | 168,857,337 | |
| | | | This sector is 11.3% above your Fund’s cost. | | | | | | | | |
Brandywine Blue Fund
Schedule of Investments (Continued)
September 30, 2009
| Shares or | | | | | | | | |
| Principal | | | | | | | | |
| Amount | | | | Cost | | | Value | |
Common Stocks - 97.3% (a) (Continued) | | | | | | |
FINANCIALS | | | | | | |
| | | Consumer Finance - 2.1% | | | | | | |
| | 1,485,900 | | American Express Co. | | $ | 43,050,828 | | | $ | 50,372,010 | |
| | | | Investment Banking & Brokerage - 3.0% | | | | | | | | |
| | 400,700 | | The Goldman Sachs Group, Inc. | | | 57,390,543 | | | | 73,869,045 | |
| | | | Thrifts & Mortgage Finance - 2.4% | | | | | | | | |
| | 4,453,100 | | Hudson City Bancorp, Inc. | | | 57,434,776 | | | | 58,558,265 | |
| | | | Total Financials | | | 157,876,147 | | | | 182,799,320 | |
| | | | This sector is 15.8% above your Fund’s cost. | | | | | | | | |
HEALTH CARE | | | | | | | | |
| | | | Biotechnology - 3.0% | | | | | | | | |
| | 1,336,500 | | Celgene Corp.* | | | 56,638,386 | | | | 74,710,350 | |
| | | | Health Care Distributors - 1.6% | | | | | | | | |
| | 1,779,900 | | AmerisourceBergen Corp. | | | 36,139,613 | | | | 39,834,162 | |
| | | | Health Care Equipment - 5.3% | | | | | | | | |
| | 1,087,000 | | Baxter International Inc. | | | 58,839,668 | | | | 61,969,870 | |
| | 1,780,900 | | St. Jude Medical, Inc.* | | | 66,658,625 | | | | 69,472,909 | |
| | | | Health Care Services - 3.2% | | | | | | | | |
| | 999,800 | | Express Scripts, Inc.* | | | 56,933,115 | | | | 77,564,484 | |
| | | | Life Sciences Tools & Services - 3.7% | | | | | | | | |
| | 619,800 | | Life Technologies Corp.* | | | 26,775,521 | | | | 28,851,690 | |
| | 1,450,400 | | Thermo Fisher Scientific, Inc.* | | | 59,960,716 | | | | 63,338,968 | |
| | | | Pharmaceuticals - 3.7% | | | | | | | | |
| | 1,813,100 | | Teva Pharmaceutical Industries Ltd. SP-ADR | | | 78,248,934 | | | | 91,670,336 | |
| | | | Total Health Care | | | 440,194,578 | | | | 507,412,769 | |
| | | | This sector is 15.3% above your Fund’s cost. | | | | | | | | |
INDUSTRIALS | | | | | | | | |
| | | | Aerospace & Defense - 2.9% | | | | | | | | |
| | 1,389,400 | | ITT Corp. | | | 62,725,395 | | | | 72,457,210 | |
| | | | Air Freight & Logistics - 1.4% | | | | | | | | |
| | 472,800 | | FedEx Corp. | | | 31,318,254 | | | | 35,564,016 | |
| | | | Industrial Machinery - 2.6% | | | | | | | | |
| | 1,480,925 | | Illinois Tool Works Inc. | | | 64,499,966 | | | | 63,250,306 | |
| | | | Total Industrials | | | 158,543,615 | | | | 171,271,532 | |
| | | | This sector is 8.0% above your Fund’s cost. | | | | | | | | |
INFORMATION TECHNOLOGY | | | | | | | | |
| | | | Communications Equipment - 5.4% | | | | | | | | |
| | 3,117,700 | | Cisco Systems, Inc.* | | | 69,003,917 | | | | 73,390,658 | |
| | 1,319,900 | | QUALCOMM Inc. | | | 59,857,230 | | | | 59,369,102 | |
| | | | Computer Hardware - 4.9% | | | | | | | | |
| | 339,200 | | Apple Inc.* | | | 56,199,045 | | | | 62,877,504 | |
| | 1,236,100 | | Hewlett-Packard Co. | | | 42,216,293 | | | | 58,356,281 | |
| | | | Computer Storage & Peripherals - 2.6% | | | | | | | | |
| | 3,773,100 | | EMC Corp.* | | | 61,107,321 | | | | 64,293,624 | |
| | | | Data Processing & Outsourced Services - 2.4% | | | | | | | | |
| | 858,500 | | Visa Inc. | | | 47,173,370 | | | | 59,330,935 | |
| | | | Electronic Components - 2.7% | | | | | | | | |
| | 4,402,500 | | Corning Inc. | | | 65,281,915 | | | | 67,402,275 | |
| | | | Semiconductors - 7.9% | | | | | | | | |
| | 2,165,200 | | Analog Devices, Inc. | | | 59,534,282 | | | | 59,716,216 | |
| | 2,685,300 | | Broadcom Corp.* | | | 60,776,505 | | | | 82,411,857 | |
| | 3,471,900 | | NVIDIA Corp.* | | | 55,791,056 | | | | 52,182,657 | |
| | | | Total Information Technology | | | 576,940,934 | | | | 639,331,109 | |
| | | | This sector is 10.8% above your Fund’s cost. | | | | | | | | |
MATERIALS | | | | | | | | |
| | | | Diversified Metals & Mining - 3.1% | | | | | | | | |
| | 1,094,500 | | Freeport-McMoRan Copper & Gold Inc. | | | 69,428,451 | | | | 75,093,645 | |
| | | | Gold - 2.1% | | | | | | | | |
| | 767,500 | | Agnico-Eagle Mines Ltd. | | | 52,040,774 | | | | 52,074,875 | |
| | | | Total Materials | | | 121,469,225 | | | | 127,168,520 | |
| | | | This sector is 4.7% above your Fund’s cost. | | | | | | | | |
| | | | Total common stocks | | | 2,182,994,317 | | | | 2,396,783,996 | |
Short-Term Investments - 2.2% (a) | | | | | | | | |
| | | | Commercial Paper - 2.0% | | | | | | | | |
| $ | 12,318,000 | | ING America Insurance Holdings, due 10/01/09, discount of 0.20% | | | 12,318,000 | | | | 12,318,000 | |
| | 37,700,000 | | General Electric Capital Corp., due 10/26/09, discount of 0.15% | | | 37,696,073 | | | | 37,696,073 | |
| | | | Total commercial paper | | | 50,014,073 | | | | 50,014,073 | |
| | | | Variable Rate Demand Note - 0.2% | | | | | | | | |
| | 3,519,069 | | American Family Financial Services, 0.10% | | | 3,519,069 | | | | 3,519,069 | |
| | | | Total short-term investments | | | 53,533,142 | | | | 53,533,142 | |
| | | | Total investments - 99.5% | | $ | 2,236,527,459 | | | | 2,450,317,138 | |
| | | | Other assets less | | | | | | | | |
| | | | liabilities - 0.5% (a) | | | | | | | 11,589,438 | |
| | | | TOTAL NET ASSETS - 100.0% | | | | | | $ | 2,461,906,576 | |
* Non-dividend paying security.
(a) Percentages for the various classifications relate to net assets.
SP-ADR - Sponsored American Depositary Receipts
The accompanying notes to financial statements are an integral part of this schedule.
Brandywine Blue Fund
Statement of Operations
For the Year Ended September 30, 2009
| Income: | | | |
| Dividends | | $ | 34,396,063 | |
| Interest | | | 1,177,242 | |
| Total income | | | 35,573,305 | |
Expenses: | | | | |
| Management fees | | | 25,957,953 | |
| Transfer agent fees | | | 2,380,180 | |
| Printing and postage expense | | | 1,108,264 | |
| Administrative and accounting services | | | 285,507 | |
| Custodian fees | | | 150,339 | |
| Board of Directors fees and expenses | | | 110,726 | |
| Registration fees | | | 84,851 | |
| Professional fees | | | 71,684 | |
| Insurance expense | | | 55,911 | |
| Other expenses | | | 12,339 | |
| Total expenses | | | 30,217,754 | |
| Net Investment Income | | | 5,355,551 | |
| Net Realized Loss on Investments | | | (1,001,698,285 | ) |
| Net Increase in Unrealized Appreciation on Investments | | | 514,251,276 | |
| Net Loss on Investments | | | (487,447,009 | ) |
| Net Decrease in Net Assets Resulting From Operations | | $ | (482,091,458 | ) |
Statements of Changes in Net Assets
For the Years Ended September 30, 2009 and 2008
| | | 2009 | | | 2008 | |
| Operations: | | | | | | |
| Net investment income (loss) | | $ | 5,355,551 | | | $ | (8,740,683 | ) |
| Net realized loss on investments | | | (1,001,698,285 | ) | | | (638,841,633 | ) |
| Net increase (decrease) in unrealized appreciation on investments | | | 514,251,276 | | | | (730,032,110 | ) |
| Net decrease in net assets resulting from operations | | | (482,091,458 | ) | | | (1,377,614,426 | ) |
| | | | | | | | | |
| Distributions to Shareholders: | | | | | | | | |
| Distributions from net realized gains ($3.86974 per share) | | | — | | | | (356,221,835 | ) |
Fund Share Activities: | | | | | | | | |
| Proceeds from shares issued (62,850,433 and 70,794,329 shares, respectively) | | | 1,204,228,339 | | | | 2,277,198,544 | |
| Net asset value of shares issued in distributions reinvested (8,447,066 shares) | | | — | | | | 303,519,359 | |
| Cost of shares redeemed (83,039,892 and 26,495,404 shares, respectively) | | | (1,583,898,339 | ) | | | (827,494,470 | ) |
| Net (decrease) increase in net assets derived from Fund share activities | | | (379,670,000 | ) | | | 1,753,223,433 | |
| Total (Decrease) Increase | | | (861,761,458 | ) | | | 19,387,172 | |
| | | | | | | | | |
| Net Assets at the Beginning of the Year | | | 3,323,668,034 | | | | 3,304,280,862 | |
| Net Assets at the End of the Year | | $ | 2,461,906,576 | | | $ | 3,323,668,034 | |
| (Includes undistributed net investment income of $5,355,551 and $0, respectively) | | | | | | | | |
The accompanying notes to financial statements are an integral part of these statements.
Brandywine Blue Fund
Financial Highlights
(Selected data for each share of the Fund outstanding throughout each year)
| | | Years Ended September 30, | |
| | | 2009 | | | 2008 | | | 2007 | | | 2006 | | | 2005 | |
| PER SHARE OPERATING PERFORMANCE: | | | | | | | | | | | | | | | |
| Net asset value, beginning of year | | $ | 23.86 | | | $ | 38.18 | | | $ | 31.15 | | | $ | 31.33 | | | $ | 25.21 | |
| Income from investment operations: | | | | | | | | | | | | | | | | | | | | |
Net investment income (loss)(1) | | | 0.04 | | | | (0.07 | ) | | | (0.02 | ) | | | (0.00 | )* | | | (0.04 | ) |
| Net realized and unrealized (losses) gains on investments | | | (3.23 | ) | | | (10.38 | ) | | | 8.15 | | | | 0.96 | | | | 6.16 | |
| Total from investment operations | | | (3.19 | ) | | | (10.45 | ) | | | 8.13 | | | | 0.96 | | | | 6.12 | |
Less distributions: | | | | | | | | | | | | | | | | | | | | |
| Distributions from net investment income | | | — | | | | — | | | | — | | | | — | | | | — | |
| Distributions from net realized gains | | | — | | | | (3.87 | ) | | | (1.10 | ) | | | (1.14 | ) | | | — | |
| Total from distributions | | | — | | | | (3.87 | ) | | | (1.10 | ) | | | (1.14 | ) | | | — | |
| Net asset value, end of year | | $ | 20.67 | | | $ | 23.86 | | | $ | 38.18 | | | $ | 31.15 | | | $ | 31.33 | |
| TOTAL RETURN | | | (13.37 | %) | | | (30.70 | %) | | | 26.82 | % | | | 3.47 | % | | | 24.28 | % |
RATIOS/SUPPLEMENTAL DATA: | | | | | | | | | | | | | | | | | | | | |
| Net assets, end of year (in 000’s $) | | | 2,461,907 | | | | 3,323,668 | | | | 3,304,281 | | | | 1,856,496 | | | | 1,230,936 | |
| Ratio of expenses to average net assets | | | 1.16 | % | | | 1.13 | % | | | 1.12 | % | | | 1.10 | % | | | 1.12 | % |
Ratio of net investment income (loss) to average net assets | | | 0.21 | % | | | (0.23 | %) | | | (0.06 | %) | | | (0.02 | %) | | | (0.13 | %) |
| Portfolio turnover rate | | | 261 | % | | | 267 | % | | | 184 | % | | | 207 | % | | | 181 | % |
| (1) | Net investment income (loss) per share was calculated using average shares outstanding. |
| * | Amount less than $0.005 per share. |
The accompanying notes to financial statements are an integral part of this statement.
The Brandywine Funds
Notes to Financial Statements
September 30, 2009
| (1) | Summary of Significant Accounting Policies |
| | | The following is a summary of significant accounting policies of Brandywine Fund, Inc. (the “Brandywine Fund”) and Brandywine Blue Fund (the “Blue Fund,” one of two Funds in a series of the Brandywine Blue Fund, Inc.) (collectively the “Brandywine Funds” or the “Funds”). Each Fund is registered as a diversified open-end management company under the Investment Company Act of 1940 (the “Act”), as amended. The assets and liabilities of each Fund are segregated and a shareholder’s interest is limited to the Fund in which the shareholder owns shares. The Brandywine Fund was incorporated under the laws of Maryland on October 9, 1985. The Blue Fund was incorporated under the laws of Maryland on November 13, 1990. The investment objective of each Fund is to produce long-term capital appreciation principally through investing in common stocks. |
| | (a) | Each security, excluding short-term investments, is valued at the last sale price reported by the principal security exchange on which the issue is traded. Securities that are traded on the Nasdaq Markets are valued at the Nasdaq Official Closing Price, or if no sale is reported, the latest bid price. Securities which are traded over-the-counter are valued at the latest bid price. Securities for which quotations are not readily available are valued at fair value as determined by the investment adviser under the supervision of the Board of Directors. The fair value of a security may differ from the last quoted price and the Fund may not be able to sell a security at the estimated fair value. Market quotations may not be available, for example, if trading in particular securities has halted during the day and not resumed prior to the close of trading on the New York Stock Exchange. As of September 30, 2009, there were no securities that were internally fair valued. Short-term investments with maturities of 60 days or less are valued at amortized cost which approximates value. For financial reporting purposes, investment transactions are recorded on the trade date; however, for purposes of executing shareholder transactions, the Funds record changes in holdings of portfolio securities no later than the first business day after the trade date in accordance with Rule 2a-4 of the Act. Accordingly, certain differences between net asset value for financial reporting and for executing shareholder transactions may arise. |
The Brandywine Funds
Notes to Financial Statements (Continued)
September 30, 2009
| (1) | Summary of Significant Accounting Policies (Continued) |
| | The Funds adopted the provisions of the Financial Accounting Standards Board (“FASB”) Accounting Standards Codification “Fair Value Measurements and Disclosures” Topic 820 (“ASC 820”), effective October 1, 2008. Under ASC 820, fair value is defined as the price that would be received to sell an asset or paid to transfer a liability (i.e., the “exit price”) in an orderly transaction between market participants at the measurement date. |
| | | In determining fair value, the Funds use various valuation approaches. ASC 820 establishes a fair value hierarchy for inputs used in measuring fair value that maximizes the use of observable inputs and minimizes the use of unobservable inputs by generally requiring that the most observable inputs be used when available. Observable inputs are those that market participants would use in pricing the asset or liability based on market data obtained from sources independent of the Funds. Unobservable inputs reflect the Funds’ assumptions about the inputs market participants would use in pricing the asset or liability developed based on the best information available in the circumstances. The inputs or methodologies used for valuing securities are not necessarily an indication of the risks associated with investing in those securities. |
| | | The fair value hierarchy is categorized into three levels based on the inputs as follows: |
| | | Level 1 – Valuations based on unadjusted quoted prices in active markets for identical assets. |
| | | Level 2 – Valuations based on quoted prices for similar securities or in markets that are not active or for which all significant inputs are observable, either directly or indirectly. |
| | | Level 3 – Valuations based on inputs that are unobservable and significant to the overall fair value measurement. |
| | | The following table summarizes the Funds’ investments as of September 30, 2009, based on the inputs used to value them: |
| | | Brandywine Fund | | | Blue Fund | |
| Valuation Inputs | | Investments in Securities | | | Investments in Securities | |
| Level 1 – Common Stocks | | $ | 2,244,569,808 | | | $ | 2,396,783,996 | |
| Level 2 – Short Term Commercial Paper | | | 28,900,000 | | | | 50,014,073 | |
| Variable Rate Demand Notes | | | 2,649,337 | | | | 3,519,069 | |
| Total Level 2 | | | 31,549,337 | | | | 53,533,142 | |
| Level 3 – | | | — | | | | — | |
| Total | | $ | 2,276,119,145 | | | $ | 2,450,317,138 | |
| | (b) | Net realized gains and losses on sales of securities are computed on the identified cost basis. |
| | (c) | Dividend income is recorded on the ex-dividend date. Interest income is recorded on the accrual basis. |
| | (d) | The Funds have investments in short-term variable rate demand notes, which are unsecured instruments. The Funds may be susceptible to credit risk with respect to these notes to the extent the issuer defaults on its payment obligation. The Funds’ policy is to monitor the creditworthiness of the issuer and nonperformance by these counterparties is not anticipated. |
| | (e) | Accounting principles generally accepted in the United States of America (“GAAP”) require that permanent differences between income for financial reporting and tax purposes be reclassified in the capital accounts. |
| | (f) | The preparation of financial statements in conformity with GAAP requires management to make estimates and assumptions that affect the reported amounts of assets and liabilities and disclosure of contingent assets and liabilities at the date of the financial statements and the reported amounts of revenues and expenses during the reporting period. Actual results could differ from these estimates. |
| | (g) | No provision has been made for Federal income taxes since the Funds have elected to be taxed as “regulated investment companies” and intend to distribute substantially all net investment company taxable income and net capital gains to shareholders and otherwise comply with the provisions of the Internal Revenue Code applicable to regulated investment companies. |
The Brandywine Funds
Notes to Financial Statements (Continued)
September 30, 2009
| (1) | Summary of Significant Accounting Policies (Continued) |
| | (h) | The Funds have reviewed all open tax years and major jurisdictions, which include Federal and the state of Maryland, and concluded that there are no significant uncertain tax positions that would require recognition in the financial statements. Open tax years are those that are open for exam by taxing authorities and, as of September 30, 2009, open Federal tax years include the tax years ended September 30, 2006 through 2009. The Funds have no examinations in progress and are also not aware of any tax positions for which it is reasonably possible that the total amounts of unrecognized tax benefits will significantly change in the next twelve months. |
| (2) | Investment Adviser and Management Agreements and Transactions With Related Parties |
| | | Each Fund has a management agreement with Friess Associates, LLC (the “Adviser”), with whom certain Officers and a Director of the Funds are affiliated, to serve as investment adviser and manager. Under the terms of the agreements, each Fund will pay the Adviser a monthly management fee at the annual rate of one percent (1%) on the daily net assets of such Fund. |
| | | The Adviser entered into sub-advisory agreements with its affiliate, Friess Associates of Delaware, LLC (the “Sub-Adviser”), to assist it in the day-to-day management of each of the Funds. The Adviser and, if so delegated, the Sub-Adviser supervise the investment portfolios of the Funds, directing the purchase and sale of investment securities in the day-to-day management of the Funds. The Adviser pays the Sub-Adviser a fee equal to 110% of the monthly expenses the Sub-Adviser incurs in performing its services as Sub-Adviser. This relationship does not increase the annual management fee the Funds pay to the Adviser. |
| | | Each of the Funds pay the five independent directors annual fees of $20,500 each. The lead independent director and chairman of the audit committee are paid an additional $5,000 annually, divided proportionately among all the Brandwine Funds. All of the corresponding fees the directors receive are paid quarterly to the directors and then invested on the payment date in shares of the Funds at the net asset value of the Funds on the payment date. The Funds also reimburse directors for travel costs incurred in order to attend meetings of the Board of Directors. For the year ended September 30, 2009, the Funds expensed the following directors fees and costs: |
| | Brandywine | Blue |
| | Fund | Fund |
| Directors Fees and Travel Costs Paid during the Year | $110,102 | $110,726 |
| | | Under the Funds’ organizational documents, each Director, officer, employee or other agent of the Fund (including the Funds’ investment manager) is indemnified, to the extent permitted by the Act, against certain liabilities that may arise out of performance of their duties to the Funds. Additionally, in the normal course of business, the Funds enter into contracts that contain a variety of indemnification clauses. The Funds’ maximum exposure under these arrangements is unknown as this would involve future claims that may be made against the Funds that have not yet occurred. However, the Funds have not had prior claims or losses pursuant to these contracts and believes the risk of loss to be remote. |
| | | U.S. Bank, N.A. has made available to each Fund a credit facility pursuant to Credit Agreements effective July 22, 2004, for the purpose of having cash available to cover incoming redemptions. Each of the Funds has a $50,000,000 credit facility. Principal and interest of such loan under the Credit Agreements are due not more than 31 days after the date of the loan. Amounts under the credit facilities bear interest at a rate per annum equal to the current prime rate minus one percent on the amount borrowed. Advances will be collateralized by securities owned by the respective Fund. During the year ended September 30, 2009, neither Fund borrowed against their Agreement. The Credit Agreements expire on December 18, 2009. |
| (4) | Distributions to Shareholders |
| | Net investment income and net realized gains, if any, are distributed to shareholders at least annually. The Board of Directors has approved a distribution of net investment income on October 29, 2009 for the Blue Fund to shareholders of record on October 28, 2009. This distribution, which is subject to change, is expected to be $5,355,551. |
The Brandywine Funds
Notes to Financial Statements (Continued)
September 30, 2009
| (5) | Investment Transactions and Related Costs |
| | | For the year ended September 30, 2009, purchases and proceeds of sales of investment securities (excluding short-term investments) for the Funds were as follows: |
| | | | | | Sale | | | Transaction | | | Ratio of Costs to | |
| | | Purchases | | | Proceeds | | | Costs | | | Average Net Assets | |
| Brandywine Fund | | $ | 5,532,636,742 | | | $ | 5,758,672,912 | | | $ | 14,990,929 | | | | 0.65 | % |
| Blue Fund | | | 6,418,956,351 | | | | 6,444,372,922 | | | | 14,563,411 | | | | 0.56 | |
| | | Transaction costs represent the total commissions paid by each Fund on its respective purchases and sales of investment securities. These costs are added to the cost basis of the securities purchased and are deducted from the proceeds of securities sold, thereby reducing the realized gains or increasing the realized losses upon the sale of the securities. |
| (6) | Income Tax Information |
| | The following information for the Funds is presented on an income tax basis as of September 30, 2009: |
| | | | | | Gross | | | Gross | | | Net Unrealized | | | Distributable | | | Distributable | |
| | | Cost of | | | Unrealized | | | Unrealized | | | Appreciation | | | Ordinary | | | Long-Term | |
| | | Investments | | | Appreciation | | | Depreciation | | | on Investments | | | Income | | | Capital Gains | |
| Brandywine Fund | | $ | 2,034,454,063 | | | $ | 268,388,805 | | | $ | 26,723,723 | | | $ | 241,665,082 | | | $ | — | | | $ | — | |
| Blue Fund | | | 2,244,272,043 | | | | 220,775,131 | | | | 14,730,036 | | | | 206,045,095 | | | | 5,355,551 | | | | — | |
| | The difference, if any, between the cost amounts for financial statement and federal income tax purposes is due primarily to timing differences in recognizing certain gains and losses in security transactions. |
| The tax components of dividends paid during the years ended September 30, 2009 and 2008, capital loss carryovers, which may be used to offset future capital gains, subject to Internal Revenue Code limitations (expiring in 2017), as of September 30, 2009, and tax basis post-October losses as of September 30, 2009, which are not recognized for tax purposes until the first day of the following fiscal year are: |
| | | September 30, 2009 | | | September 30, 2008 | |
| | | Ordinary | | | Long-Term | | | Net Capital | | | | | | Ordinary | | | Long-Term | |
| | | Income | | | Capital Gains | | | Loss | | | Post-October | | | Income | | | Capital Gains | |
| | | Distributions | | | Distributions | | | Carryovers | | | Losses | | | Distributions | | | Distributions | |
| Brandywine Fund | | $ | 14,327,152 | | | $ | — | | | $ | 687,183,259 | | | $ | 664,211,443 | | | $ | 220,366,098 | | | $ | 408,257,097 | |
| Blue Fund | | | — | | | | — | | | | 1,309,430,618 | | | | 375,608,473 | | | | 228,628,373 | | | | 127,593,462 | |
| | For corporate shareholders in the Brandywine Fund, the percentage of dividend income distributed for the year ended September 30, 2009, which is designated as qualifying for the dividends received deduction is 49.4% (unaudited). |
| For the shareholders in the Brandywine Fund, the percentage of dividend income distributed for the year ended September 30, 2009, which is designated as qualified dividend income under the Jobs and Growth Tax Relief Act of 2003 is 39.7% (unaudited). |
| Since there were no ordinary distributions paid for the Blue Fund for the year ended September 30, 2009, there were no distributions designated as qualifying for the dividends received deduction for corporate shareholders nor as qualified dividend income under the Jobs and Growth Tax Relief Act of 2003 (unaudited). |
| | Effective October 1, 2009, U.S. Bancorp Fund Services, LLC, began serving as the administrator and accounting services agent for the Funds. Subsequent events have been evaluated through October 13, 2009, which is the date the financial statements were issued. Subsequent events have not been evaluated after this date. |
Cost Discussion
Mutual fund shareholders incur two types of costs: (1) transaction costs, including sales charges (loads) on purchase payments, reinvested dividends, or other distributions; redemption fees; and exchange fees; and (2) ongoing costs, including management fees; distribution [and/or service] (12b-1) fees; and other fund expenses. Brandywine and Brandywine Blue do not have 12b-1 distribution fees. This example is intended to help you understand your ongoing costs (in dollars) of investing in the Brandywine Funds and to compare these costs with the ongoing costs of investing in other mutual funds.
In addition to the costs highlighted and described below, the only Fund transaction costs you might currently incur would be wire fees ($15 per wire), if you choose to have proceeds from a redemption wired to your bank account instead of receiving a check. Additionally, U.S. Bank charges an annual processing fee ($15) if you maintain an IRA account with the Funds. To determine your total costs of investing in the Funds, you would need to add any applicable wire or IRA processing fees you’ve incurred during the period to the costs provided in the example below.
The example is based on an investment of $1,000 invested at the beginning of the period and held for the entire period from April 1, 2009 through September 30, 2009.
Actual Expenses
The first line of the table below provides information about actual account values and actual expenses. You may use the information in this line, together with the amount you invested, to estimate the expenses that you paid over the period. Simply divide your account value by $1,000 (for example, an $8,600 account value divided by $1,000 = 8.6), then multiply the result by the number in the first line under the heading entitled “Expenses Paid During Period” to estimate the expenses you paid on your account during this period.
Hypothetical Example for Comparison Purposes
The second line of the table below provides information about hypothetical account values and hypothetical expenses based on the Fund’s actual expense ratio and an assumed rate of return of 5% per year before expenses, which is not the Fund’s actual return. The hypothetical account values and expenses may not be used to estimate the actual ending account balance or expenses you paid for the period. You may use this information to compare the ongoing costs of investing in the Funds and other funds. To do so, compare this 5% hypothetical example with the 5% hypothetical examples that appear in the shareholder reports of the other funds.
Please note that the expenses shown in the table are meant to highlight your ongoing costs only and do not reflect any transactional costs. While the Brandywine Funds currently do not assess sales charges, redemption or exchange fees, other funds do, and those costs will not be reflected in their expense example tables. Therefore, the second line of the table is useful in comparing ongoing costs only, and will not help you determine the relative total costs of owning different funds.
| | Beginning | Ending | |
| | Account | Account | Expenses Paid |
| | Value | Value | During Period* |
| | 4/01/09 | 9/30/09 | 4/01/09-9/30/09 |
| Brandywine Actual | $1,000.00 | $1,127.10 | $5.92 |
| Hypothetical (5% return before expenses) | $1,000.00 | $1,019.50 | $5.62 |
| Brandywine Blue Actual | $1,000.00 | $1,152.80 | $6.31 |
| Hypothetical (5% return before expenses) | $1,000.00 | $1,019.20 | $5.92 |
| * | Expenses are equal to the Funds’ annualized expense ratios of 1.11% and 1.17%, multiplied by the average account value over the period, multiplied by 183/365 (to reflect the one-half year period between April 1, 2009 and September 30, 2009). |
Additional Director Information, Proxy Voting Policy and Quarterly Portfolio Schedules
For additional information about the Directors and Officers or for a description of the policies and procedures that the Funds use to determine how to vote proxies relating to portfolio securities, please call (800) 656-3017 and request a Statement of Additional Information. One will be mailed to you free of charge. The Statement of Additional Information is also available on the website of the Securities and Exchange Commission (the “Commission”) at http://www.sec.gov or the Funds’ website at http://www.brandywinefunds.com. Information on how the Funds voted proxies relating to portfolio securities is available on the Funds’ website or the website of the Commission no later than August 31 for the prior twelve months ending June 30. The Funds file their complete schedule of portfolio holdings with the Commission for the first and third quarters of each fiscal year on Form N-Q. The Funds’ Forms N-Q are available on the Commission’s website. The Funds’ Forms N-Q may be reviewed and copied at the Commission’s Public Reference Room in Washington, D.C., and that information on the operation of the Public Reference Room may be obtained by calling 1-800-SEC-0330.
Brandywine Fund and Brandywine Blue Fund Directors and Officers
| | | Name, Age, Address | | Position, Term of Office and Length of Time Served and Number of Portfolios in Fund Complex Overseen by Director | | Principal Occupation During Past Five Years | | Other Directorships Held by Director |
| | | | | | | | | |
 | | C. Quentin S. Jackson, 65c/o Friess AssociatesP.O. Box 4166Greenville, DE 19807 | | Lead IndependentDirectorIndefinite Term sinceOctober, 20013 Portfolios | | Mr. Jackson is retired. He wasthe President and Chief ExecutiveOfficer of Nuclear ElectricInsurance Ltd., a multibillion-dollarcompany mutually owned by energycompanies. | | None |
| | | | | | | | | |
 | | Stuart A. McFarland, 62c/o Friess AssociatesP.O. Box 4166Greenville, DE 19807 | | | | Mr. McFarland is Managing Partnerof Federal City Capital Advisors, LLC,a financial advisory firm. He was theChairman of Federal CityBancorp, a thrift holding companyfrom April 2004 until June 2007. | | Helios Funds (8 portfolios)and Newcastle InvestmentCorporation |
| | | | | | | | | |
 | | W. Richard Scarlett III, 70c/o Friess AssociatesP.O. Box 4166Greenville, DE 19807 | | DirectorIndefinite Term sinceOctober, 20013 Portfolios | | Mr. Scarlett is retired. He was thePresident and CEO of Jackson StateBank & Trust. He was the Chairmanand Chief Executive Officer of UnitedBancorporation of Wyoming, Inc.,from 1981 to July 2008. | | None |
| | | | | | | | | |
 | | Thomas D. Wren, 57c/o Friess AssociatesP.O. Box 4166Greenville, DE 19807 | | | | Mr. Wren is a senior advisor forPromontory Financial Group, LLC.He was the Treasurer of MBNACorporation and its MBNAAmerica Bank, N.A. subsidiaryfrom 1995 to 2006. | | ACM Financial Trust, Inc.and Hatteras FinancialCorp. |
| | | | | | | | | |
 | | James W. Zug, 69c/o Friess AssociatesP.O. Box 4166Greenville, DE 19807 | | DirectorIndefinite Term sinceOctober, 20013 Portfolios | | Mr. Zug is a retired Partner ofPricewaterhouseCoopers LLP. Hewas employed with Pricewater-houseCoopers and its predecessorsfrom 1964 until 2000. | | Allianz Funds(30 portfolios),Amkor Technology, Inc.and Teleflex Inc. |
Brandywine Fund and Brandywine Blue Fund Directors and Officers
| "Interested Persons" of the Funds* | | Name, Age, Address | | Position, Term of Office and Length of Time Served and Number of Portfolios in Fund Complex Overseen by Director or Officer | | Principal Occupation During Past Five Years | | Other Directorships Held by Director or Officer |
| | | | | | | | | |
 | | William F. D’Alonzo*, 54c/o Friess AssociatesP.O. Box 4166Greenville, DE 19807 | | DirectorIndefinite Term sinceOctober, 2001President since 2003 Chairman since 2004 3 Portfolios | | Mr. D’Alonzo joined FriessAssociates in 1981 as part of theresearch team, became Chief Investment Officer in 1997 andChief Executive Officer in 2002. | | None |
| | | | | | | | | |
 | | Lynda J. Campbell*, 63c/o Friess AssociatesP.O. Box 4166Greenville, DE 19807 | | Vice President since 1998Secretary since 1990Treasurer since 20073 Portfolios | | Ms. Campbell joined Friess Associ- ates in 1985, the year of Brandy- wine Fund's inception. Ms. Campbell is currently Chief Administrative Officer of the Friess Companies. | | None |
| | | | | | | | | |
 | | Joseph J. Fields*, 53c/o Friess AssociatesP.O. Box 4166Greenville, DE 19807 | | Vice President since 2007 3 Portfolios | | Mr. Fields joined Friess Associatesin 1999. He is currently aClient Relationship Managerof the Friess Companies. | | None |
| | | | | | | | | |
 | | Gordon Kaiser*, 50 c/o Friess Associates P.O. Box 4166Greenville, DE 19807 | | Vice President since 2007 3 Portfolios | | Mr. Kaiser joined Friess Associatesin 1999. He is currently aClient Relationship Managerof the Friess Companies. | | None |
| | | | | | | | | |
 | | David D. Marky*, 44 c/o Friess AssociatesP.O. Box 4166Greenville, DE 19807 | | Vice President since 2002Chief Compliance Officer since 2004 | | Mr. Marky joined Friess Associatesin 2000. He currently serves asChief Compliance Officer for theFriess Companies. | | None |
| | | |
|  | The Brandywine Funds P.O. Box 4166 Greenville, DE 19807 (800) 656-3017www.brandywinefunds.combfunds@friess.com |
| | | |
For additional information about the Directors and Officers, please call (800) 656-3017 and request a Statement of Additional Information. One will be mailed to you free of charge.
| * | Messrs. D’Alonzo, Fields, Kaiser and Marky and Ms. Campbell are “interested persons” of the Funds as that term is defined in the Investment Company Act of 1940 by reason of their being officers of the Funds and employees of Friess Associates, LLC. |
Distribution and Capital Gains Update . . . Brandywine Blue Fund will pay a distribution of approximately $0.05 per share from net investment income to shareholders of record on October 28. The distribution will be paid on October 30, however, there will be no capital gains distributions in October in Brandywine Fund or Brandywine Blue Fund. As of September 30, Brandywine Fund can realize gains of approximately $12.59 per share and Brandywine Blue Fund can realize approximately $14.22 per share before triggering a distribution. These estimates may change, so please look to the December-quarter report for final year-end figures. |
IRA Investors . . . The annual $15 maintenance fee for shareholders invested through IRA accounts is due on November 13, 2009. For your convenience, US Bancorp will automatically deduct this amount from your IRA on the due date, or if you prefer not to have the fee swept from your account, please send a check to US Bancorp by the due date. |
Definitions and Disclosures Performance data quoted represent past performance; past performance does not guarantee future results. The investment return and principal value of an investment will fluctuate so that an investor’s shares, when redeemed, may be worth more or less than their original cost. Current performance of the Funds may be lower or higher than the performance quoted. Performance data current to the most recent month end may be obtained by visiting www.brandywinefunds.com. The Funds’ investment objectives, risks, charges and expenses must be considered carefully before investing. The prospectus contains this and other important information about the investment companies, and it may be obtained by calling 1-800-656-3017, or visiting www.brandywinefunds.com. Read it carefully before investing. Fund holdings and sector weightings are subject to change at any time and are not recommendations to buy or sell any securities. Securities discussed were not held by the Funds as of 9/30/09, unless listed in the accompanying statements of net assets. Earnings growth rates quoted for the Funds refer solely to the estimated earnings growth rates of the average investment holding of the Funds based on consensus estimates from Baseline Financial Services, Inc. (Baseline) and not to the actual performance of the Funds themselves. Baseline provides analytical information and services to the investment community. The Russell 1000, Russell 1000 Growth, Russell 3000, Russell 3000 Growth and S&P 500 Indexes are unmanaged indexes commonly used to measure the performance of U.S. stocks. You cannot invest directly in an index. As of September 30, 2009, the Russell 1000 Index’s average annual total returns for 1, 5 and 10 years were -6.14, 1.49 and 0.41 percent; the Russell 1000 Growth Index’s were -1.85, 1.86 and -2.56 percent; the Russell 3000 Index’s were -6.42, 1.56 and 0.73 percent; the Russell 3000 Growth Index’s were -2.19, 1.96 and -2.28 percent; and the S&P 500 Index’s were -6.91, 1.02 and -0.15 percent. |
Investment Adviser: Friess Associates, LLC | Transfer Agent: U.S. Bancorp Fund Services, LLC |
Investment Sub-Adviser: Friess Associates of Delaware, LLC | Independent Registered Public Accounting Firm: PricewaterhouseCoopers LLP |
Custodian: U.S. Bank, N.A. | Legal Counsel: Foley & Lardner LLP |
Officers: William D’Alonzo, Chairman and President;
Lynda Campbell, Vice President, Secretary and Treasurer; Joseph Fields, Vice President;
Gordon Kaiser, Vice President; David Marky, Chief Compliance Officer, Vice President and Assistant Secretary
Report Editor: Chris Aregood Report Staff: David Marky, Adam Rieger
| Managed by Friess Associates, LLC | Annual Report | September 30, 2009 |
Dear Fellow Shareholders:
Investors during the September quarter continued to envision a brighter economic future, extending the stock market rally. Extended, too, was the market’s renewed appetite for risk. Big banks, homebuilders and other earnings-challenged mainstays of the rally’s early months added to their tenure at the forefront of the rebound.
Brandywine Advisors Midcap Growth Fund remained focused on the individual-company earnings trends that our research tells us are likely to develop over the next six to nine months. Many other investors appeared willing to set their sights further into the future under optimistic assumptions for the economy. As a result, a good quarter on an absolute basis was something else when compared against benchmarks.
Brandywine Advisors grew 8.89 percent in the September quarter versus gains in the S&P 500, Russell Midcap and Russell Midcap Growth Indexes of 15.61, 20.62 and 17.58 percent.
Every economic sector represented in the Brandywine Advisors portfolio gained ground in the September quarter, but in some notable instances those gains didn’t keep pace with benchmark returns. Lower returns in the consumer discretionary sector, which represented the largest percentage of assets, and the consumer staples sector, which was the fourth largest, accounted for well over half of the Fund’s relative performance deficit versus the Russell Midcap Growth Index.
Two of the most significant contributors to Brandywine Advisors’ return, Dollar Tree and TJX Cos., hail from the consumer discretionary sector. With expectation-beating earnings growth in their most recently reported quarter of 50 and 30 percent, respectively, Dollar Tree and TJX enjoyed returns that showed appreciation for their progress.
One notable difference in terms of relative performance is what Brandywine Advisors didn’t hold. Homebuilders were among the biggest contributors to consumer discretionary gains posted by benchmarks. On average, homebuilders within the Russell Midcap Index saw their market values increase by 27 percent in the quarter. Meanwhile, Wall Street predicts that seven of the eight homebuilders from the index will lose money this year and next, which makes them the kind of companies we make a conscious effort to avoid.
Brandywine Advisors held only three companies from the consumer staples sector during the quarter and two of them, Church & Dwight and Green Mountain Coffee Roasters, contributed to performance amid solid earnings gains. Church & Dwight and Green Mountain Coffee Roasters grew June-quarter earnings 30 and 116 percent, respectively, exceeding estimates in both instances. The reason the consumer staples sector detracted from relative results was the third holding, Ralcorp Holdings, which accounted for the most assets of the three.
Ralcorp met June-quarter expectations with 8 percent earnings growth. Shares declined on news that products in the Post Foods line that the company acquired last year lost market share, which raised near-term concerns among investors regarding potential
| | Brandywine Advisors |
| Cumulative Total Return | % Change |
| Quarter | 8.89 |
| One Year | -20.69 |
| Five Years | 3.04 |
| Inception – 10/31/00 | -9.35 |
| Five Years | 0.60 |
| Inception – 10/31/00 | -1.09 |
*Expense Ratio – 1.19% as stated in the Prospectus dated January 30, 2009
Performance data quoted represent past performance; past performance does not guarantee future results. The investment return and principal value of an investment will fluctuate so that an investor’s shares, when redeemed, may be worth more or less than their original cost. Current performance of the Fund may be lower or higher than the performance quoted. Performance data current to the most recent month end may be obtained by visiting www.brandywinefunds.com.
integration issues with the acquisition. We continue to see promise in Ralcorp due to rising demand for its private-label goods, which offer affordable prices to consumers at a higher profit for Ralcorp.
Holdings from the industrial sector also detracted from relative performance, due in most part to the performance of FTI Consulting. FTI shares fell after a competitor in the forensic accounting business, Huron Consulting, revealed that Huron’s past payment practices related to acquisitions might have violated regulatory guidelines.
For more information on companies that influenced September-quarter performance, please see Roses & Thorns on page 6.
The September quarter was for the most part a continuation of a trend that helped put Brandywine Advisors in a tough spot relative to the overall market in the fiscal year and in the calendar-year-to-date period through September. (For a discussion of the fiscal year, please see page 7.) Brandywine Advisors is up 7.19 percent this year through September versus benchmark returns ranging from 19.26 percent for the S&P 500 Index to 37.12 percent for the Russell Midcap Growth Index.
The key date – the true turning point as it relates to our relative results in this period – is March 9. We’ve wondered whether someone changed some of the basics of stock investing as we understand them sometime after we went to bed on March 8. From that point on, a lot of companies that looked bad to us were celebrated by the broader investment community while companies that looked good to us seemed unable to attract much positive attention. But when bad is good and good is bad it’s important to remember that being out of sync doesn’t mean being out of touch.
This is far from the first time share prices have risen at a time when earnings compress, an event that raises the market’s price-to-earnings multiple, or P/E, as the “P” in the ratio grows and the “E” falls. One of the more extreme examples occurred in 2001 as the tech bubble collapsed and the U.S. struggled to emerge from recession. The March 9 rally, however, is even more extreme.
“In fact, looking at the past five cycles, we see that the current cycle with a multiple expansion of 191 percent over a period of less than seven months is a 30-year record both in terms of its magnitude and speed,” analysts for Sanford C. Bernstein & Co., LLC wrote in a September 29 report.
Investors are making quick and dramatic judgments based on macro evidence that might be mildly encouraging but still falls well short of anything truly telling. The message investors collectively have been sending since March 9 is that the financial crisis that gripped and, for a time, strangled the market early in the year is over – why else would troubled banks and companies with high debt burdens perform so well?
The financial sector led the market in the September quarter, a period in which the Federal Deposit Insurance Corp. (FDIC) reported that its list of “problem” financial institutions reached a level not seen since the tail end of the savings and loan crisis. About one month later on September 29, the FDIC proposed that FDIC-insured banks – some of which received government assistance less than a year ago – effectively bail out the FDIC by prepaying fees into the insurance fund years in advance to keep it solvent.
As for the machinery at the heart of the credit crisis, certain important debt-securitization markets, where loans are packaged into securities and sold to generate more money for banks to lend, still rely on the government as an important crutch. It remains to be seen how smoothly things function once the government begins extricating itself from those markets, a process scheduled to start next year.
We’re not saying the economy’s funk will continue indefinitely or the worst of the credit crisis will come back to revisit us sometime soon. We just believe the market is ahead of reality in some obvious places and that persistent investor focus on these areas leaves the most promising opportunities elsewhere.
We enjoy the team depth, experience and resources needed to perform the kind of research that we believe will be increasingly important as the environment becomes more discerning based on fundamentals. Our interests are aligned with shareholders as fellow investors and employee-owners, motivating us to generate the kind of results you expect from us. Thanks for the opportunity to serve you.
| |
| Bill D’Alonzo | |
| Brandywine Funds President | October 13, 2009 |
Dollar Tree, Inc., DLTR
Reining in expansion plans and closing underperforming stores has been the norm for retailers for some time. Dollar Tree is on pace to expand square footage by 7 percent this year, a pace greater than any competitor, even Wal-Mart.
Nasdaq-listed Dollar Tree, Inc. operates 3,700 stores in 48 states, making it the nation’s third-largest value retailer and the largest in the U.S. using a single price point. The company’s flagship Dollar Tree stores offer a variety of general merchandise, consumables and closeouts at a price of $1 or less. Sales are forecast to grow 11 percent to $5.2 billion in the year ending January 2010.
July-quarter earnings grew 50 percent, topping estimates by 17 percent and marking eight consecutive quarters of beating estimates. Sales jumped 12 percent, driven by incremental revenue from new stores and a 6.8 percent rise in same-store sales. A slowing economy and a weak job market continue to encourage more shoppers to adopt value mindsets. Gross margins expanded during the quarter, driven by improved merchandise sourcing and lower freight costs.
Customers have been attracted by new initiatives and expanded offerings in refrigerated and frozen foods and household goods. Adverse economic conditions have also resulted in greater use of Electronic Benefit Transfer cards and food stamps. Over 65 percent of stores now accept food stamps, compared with just 42 percent a year ago.
Chief Executive Bob Sasser provided details related to the expansion of the Deal$ concept acquired in 2006 during a recent global retailing conference. By carrying value-priced goods above the $1 price limit in its other stores, new Deal$ stores in the Northeast and Southeast should enhance overall profitability.
Your team bought Dollar Tree at 11 times earnings estimates for the fiscal year ending January 2010. Wall Street predicts the company will grow earnings 27 percent during that period.
Mattel, Inc., MAT
The toy business, like most others, has been something short of fun and games in these economic hard times. Mattel has been serious about cost control throughout 2009, helping position the company to see earnings rebound soundly this holiday season and beyond.
NYSE-listed Mattel, Inc. is the world’s largest toy manufacturer. Barbie, Fisher-Price, Hot Wheels and American Girl are among the company’s best known franchises. Mattel also enters licensing deals for character-themed toys and games in conjunction with makers of children’s television programs and movies such as Disney, Sesame Street and Nickelodeon. The company’s largest customers are Wal-Mart, Target and Toys ‘R Us. Revenue in the 12 months through June was nearly $5.6 billion.
Mattel doubled June-quarter earnings to $0.06 per share, beating estimates. The consensus on Wall Street was that the company would break even for the quarter. Analysts underestimated the company’s success in executing the “Global Cost Leadership” program it launched at the start of the year. Operating expenses fell by $91 million versus the year-ago period in the June quarter.
Your team spoke with Mattel Treasurer Dianne Douglas about how controlling costs now should benefit the company in both the upcoming holiday season and 2010. With retailers reluctant to hold excess product amid the economic downturn, their inventories are lean. Given the level of retailer caution, stores are likely to restock with leading brands from financially sound manufacturers. Mattel’s tighter cost structure should enable the company to leverage new sales into strong earnings gains.
Events likely to drive demand include the 50th anniversary of Barbie, which generates more than $1 billion annually and is Mattel’s most profitable product. The company is also partnering with Disney on products for the 2010 release of Toy Story 3, in which Barbie will be a key character.
Cost Discussion
Mutual fund shareholders incur two types of costs: (1) transaction costs, including sales charges (loads) on purchase payments, reinvested dividends, or other distributions; redemption fees; and exchange fees; and (2) ongoing costs, including management fees; distribution [and/or service] (12b-1) fees; and other fund expenses. This example is intended to help you understand your ongoing costs (in dollars) of investing in Brandywine Advisors Midcap Growth Fund and to compare these costs with the ongoing costs of investing in other mutual funds.
In addition to the costs highlighted and described below, the only Fund transaction costs you might currently incur would be wire fees ($15 per wire), if you choose to have proceeds from a redemption wired to your bank account instead of receiving a check. Additionally, U.S. Bank charges an annual processing fee ($15) if you maintain an IRA account with the Fund. To determine your total costs of investing in the Fund, you would need to add any applicable wire or IRA processing fees you’ve incurred during the period to the costs provided in the example at the end of this article.
The example is based on $1,000 invested at the beginning of the period and held for the entire period from April 1, 2009 through September 30, 2009.
Actual Expenses
The first line of the table below provides information about actual account values and actual expenses. You may use the information in this line, together with the amount you invested, to estimate the expenses that you paid over the period. Simply divide your account value by $1,000 (for example, an $8,600 account value divided by $1,000 = 8.6), then multiply the result by the number in the first line under the heading entitled “Expenses Paid During Period” to estimate the expenses you paid on your account during this period.
Hypothetical Example for Comparison Purposes
The second line of the table below provides information about hypothetical account values and hypothetical expenses based on the Fund’s actual expense ratio and an assumed rate of return of 5% per year before expenses, which is not the Fund’s actual return. The hypothetical account values and expenses may not be used to estimate the actual ending account balance or expenses you paid for the period. You may use this information to compare the ongoing costs of investing in the Fund and other funds. To do so, compare this 5% hypothetical example with the 5% hypothetical examples that appear in the shareholder reports of the other funds.
Please note that the expenses shown in the table are meant to highlight your ongoing costs only and do not reflect any transactional costs. While Brandywine Advisors Midcap Growth Fund currently does not assess sales charges, redemption or exchange fees, other funds do, and those costs will not be reflected in their expense example tables. Therefore, the second line of the table is useful in comparing ongoing costs only, and will not help you determine the relative total costs of owning different funds.
| | Beginning | Ending | |
| | Account | Account | Expenses Paid |
| | Value | Value | During Period* |
| | 4/01/09 | 9/30/09 | 4/01/09-9/30/09 |
| Brandywine Advisors Midcap Growth Fund Actual | $1,000.00 | $1,132.00 | $6.79 |
| Hypothetical (5% return before expenses) | $1,000.00 | $1,018.70 | $6.43 |
| * | Expenses are equal to the Fund’s annualized expense ratio of 1.27%, multiplied by the average account value over the period, multiplied by 183/365 (to reflect the one-half year period between April 1, 2009 and September 30, 2009). |
Additional Director Information, Proxy Voting Policy and Quarterly Portfolio Schedules
For additional information about the Directors and Officers or for a description of the policies and procedures that the Fund uses to determine how to vote proxies relating to portfolio securities, please call (877) 636-6460 and request a Statement of Additional Information. One will be mailed to you free of charge. The Statement of Additional Information is also available on the website of the Securities and Exchange Commission (the “Commission”) at http://www.sec.gov or the Fund’s website at http://www.brandywinefunds.com. Information on how the Fund voted proxies relating to portfolio securities is available on the Fund’s website or the website of the Commission no later than August 31 for the prior twelve months ending June 30. The Fund files its complete schedule of portfolio holdings with the Commission for the first and third quarters of each fiscal year on Form N-Q. The Fund’s Form N-Q is available on the Commission’s website. The Fund’s Form N-Q may be reviewed and copied at the Commission’s Public Reference Room in Washington, D.C., and that information on the operation of the Public Reference Room may be obtained by calling 1-800-SEC-0330.
Brandywine Advisors Midcap Growth Fund
% Change in Top Ten Holdings From Book Cost as of September 30, 2009
| 1. | | Ralcorp Holdings, Inc. | -8.1% | | 6. | | McDermott International, Inc. | +61.6% |
| 2. | | Crown Holdings, Inc. | +14.9% | | 7. | | Hunt (J.B.) Transport Services, Inc. | +20.4% |
| 3. | | Dollar Tree, Inc. | +22.6% | | 8. | | Nuance Communications, Inc. | +42.1% |
| 4. | | O’Reilly Automotive, Inc. | +27.3% | | 9. | | NVIDIA Corp. | -7.0% |
| 5. | | Inverness Medical Innovations, Inc. | +2.4% | | 10. | | LSI Corp. | +11.3% |
Earnings Growth | The Portfolio’s Market Capitalization |
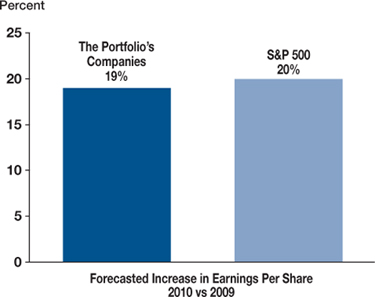 | |
| Earnings growth rates are based on consensus earnings estimates compiled by Baseline, as of September 30, 2009. Friess Associates expects the companies it isolates to exceed consensus expectations, so the growth rate of the portfolio’s companies would be higher using the firm’s internal estimates. Growth rates reflect year-over-year comparisons of aggregate earnings per share. | |
Top Ten Industry Groups
Brandywine Advisors Midcap Growth Fund
September Quarter “Roses and Thorns”
| | $ Gain | | |
| Biggest $ Winners | (in thousands) | % Gain | Reason for Move |
McDermott International, Inc. | $1,054.1 | 25.1 | June-quarter earnings topped estimates by 8 percent. Demand for the company’s offshore oil and gas construction segment is expected to continue to build this year and into 2010 as exploration and development work increases. At the same time, McDermott is near completion on some pipeline projects that have weighed on profitability. The company also benefits as a leader in equipment needed for coal and nuclear power generation. |
| Everest Re Group, Ltd. | $953.8 | 15.5 | The provider of reinsurance to property and casualty insurers grew June-quarter earnings 43 percent, beating consensus estimates by 40 percent. Everest gained market share from distressed competitors, while at the same time capitalizing on favorable premium pricing. We sold our position as shares reached our target price. |
Nuance Communications, Inc. | $835.1 | 23.6 | The provider of voice-recognition solutions grew June-quarter earnings 18 percent, topping Wall Street expectations and marking 19 consecutive quarters of meeting or beating consensus estimates. Increasing sales of the company’s health care dictation products drove results amid pressure in the sector to improve quality of care and lower costs. Nuance also benefits from increasing design wins with mobile device and automobile manufacturers. |
| Dollar Tree, Inc. | $823.9 | 15.5 | The largest single-price-point retailer in the country grew July-quarter earnings 50 percent, beating Wall Street estimates by 17 percent. Sales rose 12 percent as the company’s expanding footprint coincided with more shoppers looking for value-priced basics such as frozen foods and cleaning products. Gross margins expanded during the quarter, driven by improved merchandise sourcing and lower freight costs. |
| Crown Holdings, Inc. | $683.9 | 12.7 | The manufacturer of metal food and beverage cans grew June-quarter earnings 8 percent, beating estimates. Pricing and volumes remain favorable in developed markets as consumers are choosing to eat at home more to save money during difficult economic times. At the same time, Crown benefits from its strong presence in international markets, where it derives about three-quarters of its sales. |
| | $ Loss | | |
| Biggest $ Losers | (in thousands) | % Loss | Reason for Move |
| FTI Consulting, Inc. | $721.8 | 16.0 | FTI, which advises businesses on litigation, bankruptcies and restructuring, grew June-quarter earnings 5 percent, beating estimates. Sales were bolstered by growth in the corporate financing and restructuring, technology and economic consulting divisions. Accounting and other issues announced by competitor Huron Consulting resulted in a regulatory investigation, creating fears that the issues could be prevalent across the industry and putting pressure on FTI shares. |
| $333.4 | 5.1 | The aftermarket auto parts retailer grew June-quarter earnings 31 percent to $0.63 per share, beating estimates by 15 percent. While increasing traffic and favorable sales trends drove results, O’Reilly traded lower on concerns that new store conversions following its CSK Auto acquisition would slow and that the trend toward do-it-yourself repairs was waning. |
| NVIDIA Corp. | $315.8 | 7.0 | The manufacturer of high-level graphics chips for personal computers and gaming consoles more than quadrupled consensus earnings estimates for the June quarter. Despite an improving outlook, shares traded lower as investors expressed concern that the latest generation of Intel platforms could hurt sales due to their ability to integrate more graphics. Our research shows continued strong use of NVIDIA's newest products in the notebook and handheld markets. |
| Ralcorp Holdings, Inc. | $278.8 | 4.0 | The manufacturer of branded and private-label cereals and other foods experienced a 51 percent increase in June-quarter sales. Shares traded lower as the company’s Post Foods brand, acquired last year, lost market share due to some issues with integration. We expect Post will contribute to profitability in the future and, more important, that consumers will continue to trade down to Ralcorp’s private-label products amid challenging economic conditions. |
| Massey Energy Co. | $225.1 | 6.4 | The Central Appalachia coal producer topped June-quarter consensus earnings estimates by 50 percent. Shares traded lower as steel prices fell in China and metallurgical coal shipments to the country stalled following a strong period. Our research continues to uncover upside to estimates given Massey’s low-cost structure and favorable reserve position in U.S. metallurgical coal amid declining production and rising customer demand. |
All gains/losses are calculated on an average cost basis
Management’s Discussion of Results,
Brandywine Advisors Midcap Growth Fund
The fiscal year was marked by extremes, with panic related to the credit crisis sending indexes to decade-plus lows before resurgent economic optimism abruptly reversed the market’s direction. Many of the companies hit hardest in the downturn, including banks and companies with significant debt loads, fared especially well in the rally.
Brandywine Advisors Midcap Growth Fund’s investment strategy emphasizes the relationship between earnings performance and stock prices. In the rally, stock prices recovered in anticipation of an economic recovery before signs surfaced showing that economic conditions and, more important to Brandywine Advisors, individual-company earnings were improving.
The fiscal year began in the wake of some of the most dramatic events of the credit crisis, including the government placing Fannie Mae and Freddie Mac in conservatorship and the bankruptcy of Lehman Brothers. The $700 billion Troubled Asset Relief Program (TARP) was established just three days into the fiscal year. Bank failures, asset write-downs, mergers of necessity and other fallout from the credit crisis kept constant pressure on stock prices through the end of 2008.
Investors became increasingly risk-averse, sending stocks to a new low on March 9. With the government following TARP with an aggressive spending plan, confidence began rebuilding and risk tolerance skyrocketed. Stock prices rose even as Wall Street continued revising forward earnings estimates downward, creating a challenging situation for Brandywine Advisors.
Companies with losses, deteriorating outlooks and other characteristics that don’t conform with Brandywine Advisors’ investment disciplines dominated in the rally, which continued through most of the second half of the fiscal year. Companies with solid earnings growth potential likely to be realized in the next six to nine months – the kind of companies Brandywine Advisors typically isolates – attracted relatively little investor attention.
From the beginning of the period through the market low in March, Brandywine Advisors’ approach enabled it to contain its decline better than benchmarks. Due to its muted participation in the subsequent rally, Brandywine Advisors’ relative performance advantage changed into a significant relative performance deficit by the period’s end.
Brandywine Advisors declined 20.69 percent in the 12 months ended September 30, 2009. The S&P 500, Russell Midcap and Russell Midcap Growth Indexes declined 6.91, 3.55 and 0.40 percent.
| | Hypothetical Comparison of Change in Value of $10,000 Investment in Brandywine Advisors Midcap Growth Fund, Russell Midcap Growth Index(1), Russell Midcap Index(2) and S&P 500 Index(3) | |
| (1) | | The Russell Midcap Growth Index measures the performance of those Russell Midcap companies with higher price-to-book ratios and higher forecasted growth values and includes dividends. The stocks are also members of the Russell 1000 Growth Index. | |
| (2) | | The Russell Midcap Index, a trademark of the Frank Russell Company, measures the performance of the smallest 800 companies in the Russell 1000 Index and includes dividends. | |
| (3) | | The S&P 500 Index consists of 500 stocks, mostly on the New York Stock Exchange, selected by the Standard & Poor’s Ratings Group. Each stock’s weighting is based on its relative total market value and includes dividends. | |
Brandywine Advisors Midcap Growth Fund
Statement of Assets and Liabilities
September 30, 2009
| Assets: | | | |
| Investments in securities, at value (cost $140,899,351) | | $ | 155,336,838 | |
| Receivable from investments sold | | | 3,885,861 | |
| Receivable from shareholders for purchases | | | 315,175 | |
| Dividends and interest receivable | | | 41,092 | |
| Total assets | | $ | 159,578,966 | |
| Liabilities: | | | | |
| Payable to brokers for investments purchased | | $ | 10,879,105 | |
| Payable to adviser for management fees | | | 121,056 | |
| Payable to shareholders for redemptions | | | 22,161 | |
| Other liabilities | | | 38,872 | |
| Total liabilities | | | 11,061,194 | |
| Net Assets: | | | | |
| Capital Stock, $0.01 par value; 500,000,000 shares authorized; 21,643,264 shares outstanding | | | 212,665,999 | |
| Net unrealized appreciation on investments | | | 14,437,487 | |
| Accumulated net realized loss on investments | | | (78,585,714 | ) |
| Net assets | | | 148,517,772 | |
| Total liabilities and net assets | | $ | 159,578,966 | |
| Calculation of net asset value per share: | | | | |
Net asset value, offering and redemption price per share ($148,517,772 ÷ 21,643,264 shares outstanding) | | $ | 6.86 | |
The accompanying notes to financial statements are an integral part of this statement.
Schedule of Investments
September 30, 2009
| Shares | | | | Cost | | | Value | |
Common Stocks - 97.6% (a) | | | | | | |
CONSUMER DISCRETIONARY | | | | | | |
| | | Apparel Retail - 0.4% | | | | | | |
| | 30,400 | | American Eagle Outfitters, Inc. | | $ | 515,865 | | | $ | 512,544 | |
| | | | Automotive Retail - 6.1% | | | | | | | | |
| | 23,500 | | AutoZone, Inc.* | | | 3,661,945 | | | | 3,436,170 | |
| | 157,000 | | O’Reilly Automotive, Inc.* | | | 4,457,536 | | | | 5,673,980 | |
| | | | Broadcasting - 3.4% | | | | | | | | |
| | 237,700 | | CBS Corp. Cl B Non-Voting | | | 2,884,829 | | | | 2,864,285 | |
| | 77,200 | | Discovery Communications, Inc.* | | | 1,724,842 | | | | 2,230,308 | |
| | | | Computer & Electronics Retail - 2.5% | | | | | | | | |
| | 139,200 | | GameStop Corp.* | | | 3,341,420 | | | | 3,684,624 | |
| | | | Distributors - 0.6% | | | | | | | | |
| | 46,500 | | LKQ Corp.* | | | 880,616 | | | | 862,110 | |
| | | | Education Services - 3.7% | | | | | | | | |
| | 39,600 | | Apollo Group, Inc.* | | | 2,649,277 | | | | 2,917,332 | |
| | 46,300 | | DeVry, Inc. | | | 2,353,713 | | | | 2,561,316 | |
| | | | General Merchandise Stores - 3.9% | | | | | | | | |
| | 118,600 | | Dollar Tree, Inc.* | | | 4,708,747 | | | | 5,773,448 | |
| | | | Leisure Products - 2.4% | | | | | | | | |
| | 194,900 | | Mattel, Inc. | | | 3,536,945 | | | | 3,597,854 | |
| | | | Total Consumer Discretionary | | | 30,715,735 | | | | 34,113,971 | |
| | | | This sector is 11.1% above your Fund’s cost. | | | | | | | | |
CONSUMER STAPLES | | | | | | | | |
| | | | Household Products - 2.6% | | | | | | | | |
| | 68,300 | | Church & Dwight Co., Inc. | | | 3,698,467 | | | | 3,875,342 | |
| | | | Packaged Foods & Meats - 6.2% | | | | | | | | |
| | 33,600 | | Green Mountain Coffee Roasters, Inc.* | | | 2,312,211 | | | | 2,481,024 | |
| | 113,800 | | Ralcorp Holdings, Inc.* | | | 7,238,729 | | | | 6,653,886 | |
| | | | Total Consumer Staples | | | 13,249,407 | | | | 13,010,252 | |
| | | | This sector is 1.8% below your Fund’s cost. | | | | | | | | |
ENERGY | | | | | | | | |
| | | | Coal & Consumable Fuels - 2.2% | | | | | | | | |
| | 117,600 | | Massey Energy Co. | | | 3,504,947 | | | | 3,279,864 | |
| | | | Oil & Gas Drilling - 2.4% | | | | | | | | |
| | 170,100 | | Nabors Industries Ltd.* | | | 3,154,961 | | | | 3,555,090 | |
Brandywine Advisors Midcap Growth Fund
Schedule of Investments (Continued)
September 30, 2009
| Shares or | | | | | | | | |
| Principal | | | | | | | | |
| Amount | | | | Cost | | | Value | |
Common Stocks - 97.6% (a) (Continued) | | | | | | |
| | | Oil & Gas Equipment & Services - 1.7% | | | | | | |
| | 65,500 | | Cameron International Corp.* | | $ | 2,261,663 | | | $ | 2,477,210 | |
| | | | Oil & Gas Exploration & Production - 0.4% | | | | | | | | |
| | 34,400 | | EXCO Resources, Inc.* | | | 412,661 | | | | 642,936 | |
| | | | Oil & Gas Storage & Transportation - 2.7% | | | | | | | | |
| | 225,000 | | The Williams Companies, Inc. | | | 3,442,744 | | | | 4,020,750 | |
| | | | Total Energy | | | 12,776,976 | | | | 13,975,850 | |
| | | | This sector is 9.4% above your Fund’s cost. | | | | | | | | |
FINANCIALS | | | | | | | | |
| | | | Asset Management & Custody Banks - 1.8% | | | | | | | | |
| | 138,400 | | SEI Investments Co. | | | 2,399,720 | | | | 2,723,712 | |
| | | | Investment Banking & Brokerage - 1.3% | | | | | | | | |
| | 22,000 | | Greenhill & Co., Inc. | | | 2,018,261 | | | | 1,970,760 | |
| | | | Thrifts & Mortgage Finance - 2.2% | | | | | | | | |
| | 242,900 | | Hudson City Bancorp, Inc. | | | 3,138,384 | | | | 3,194,135 | |
| | | | Total Financials | | | 7,556,365 | | | | 7,888,607 | |
| | | | This sector is 4.4% above your Fund’s cost. | | | | | | | | |
HEALTH CARE | | | | | | | | |
| | | | Health Care Distributors - 1.4% | | | | | | | | |
| | 90,800 | | AmerisourceBergen Corp. | | | 1,843,528 | | | | 2,032,104 | |
| | | | Health Care Services - 3.7% | | | | | | | | |
| | 46,100 | | Express Scripts, Inc.* | | | 2,120,227 | | | | 3,576,438 | |
| | 35,900 | | MEDNAX, Inc.* | | | 1,971,441 | | | | 1,971,628 | |
| | | | Health Care Supplies - 3.7% | | | | | | | | |
| | 141,935 | | Inverness Medical Innovations, Inc.* | | | 5,366,233 | | | | 5,497,143 | |
| | | | Life Sciences Tools & Services - 3.1% | | | | | | | | |
| | 54,400 | | Covance Inc.* | | | 2,150,891 | | | | 2,945,760 | |
| | 37,000 | | Life Technologies Corp.* | | | 1,551,891 | | | | 1,722,350 | |
| | | | Total Health Care | | | 15,004,211 | | | | 17,745,423 | |
| | | | This sector is 18.3% above your Fund’s cost. | | | | | | | | |
INDUSTRIALS | | | | | | | | |
| | | | Aerospace & Defense - 2.1% | | | | | | | | |
| | 58,600 | | ITT Corp. | | | 2,658,983 | | | | 3,055,990 | |
| | | | Industrial Conglomerates - 3.4% | | | | | | | | |
| | 200,400 | | McDermott International, Inc.* | | | 3,133,796 | | | | 5,064,108 | |
| | | | Research & Consulting Services - 2.6% | | | | | | | | |
| | 89,000 | | FTI Consulting, Inc.* | | | 4,534,763 | | | | 3,792,290 | |
| | | | Trucking - 3.1% | | | | | | | | |
| | 144,700 | | Hunt (J.B.) Transport Services, Inc. | | | 3,861,991 | | | | 4,649,211 | |
| | | | Total Industrials | | | 14,189,533 | | | | 16,561,599 | |
| | | | This sector is 16.7% above your Fund’s cost. | | | | | | | | |
INFORMATION TECHNOLOGY | | | | | | | | |
| | | | Application Software - 2.9% | | | | | | | | |
| | 292,000 | | Nuance Communications, Inc.* | | | 3,074,521 | | | | 4,368,320 | |
| | | | Data Processing & Outsourced Services - 4.8% | | | | | | | | |
| | 43,500 | | Affiliated Computer Services, Inc.* | | | 1,984,160 | | | | 2,356,395 | |
| | 37,100 | | Alliance Data Systems Corp.* | | | 2,088,262 | | | | 2,266,068 | |
| | 67,200 | | Lender Processing Services, Inc. | | | 2,562,151 | | | | 2,565,024 | |
| | | | Semiconductors - 14.3% | | | | | | | | |
| | 60,400 | | Altera Corp. | | | 1,185,547 | | | | 1,238,804 | |
| | 79,500 | | Analog Devices, Inc. | | | 2,177,306 | | | | 2,192,610 | |
| | 104,000 | | Avago Technologies Ltd.* | | | 1,740,975 | | | | 1,775,280 | |
| | 102,400 | | Broadcom Corp.* | | | 2,285,122 | | | | 3,142,656 | |
| | 756,200 | | LSI Corp.* | | | 3,730,803 | | | | 4,151,538 | |
| | 221,300 | | Maxim Integrated Products, Inc. | | | 3,137,673 | | | | 4,014,382 | |
| | 33,200 | | National Semiconductor Corp. | | | 479,044 | | | | 473,764 | |
| | 277,600 | | NVIDIA Corp.* | | | 4,488,138 | | | | 4,172,328 | |
| | | | Total Information Technology | | | 28,933,702 | | | | 32,717,169 | |
| | | | This sector is 13.1% above your Fund’s cost. | | | | | | | | |
MATERIALS | | | | | | | | |
| | | | Gold - 1.6% | | | | | | | | |
| | 35,400 | | Agnico-Eagle Mines Ltd. | | | 2,337,798 | | | | 2,401,890 | |
| | | | Metal & Glass Containers - 4.4% | | | | | | | | |
| | 223,500 | | Crown Holdings, Inc.* | | | 5,291,261 | | | | 6,079,200 | |
| | 7,900 | | Greif Inc. | | | 436,381 | | | | 434,895 | |
| | | | Total Materials | | | 8,065,440 | | | | 8,915,985 | |
| | | | This sector is 10.5% above your Fund’s cost. | | | | | | | | |
| | | | Total common stocks | | | 130,491,369 | | | | 144,928,856 | |
Short-Term Investments - 7.0% (a) | | | | | | | | |
| | | | Commercial Paper - 5.0% | | | | | | | | |
| $ | 7,500,000 | | ING America Insurance Holdings, due 10/01/09, discount of 0.20% | | | 7,500,000 | | | | 7,500,000 | |
| | | | Variable Rate Demand Note - 2.0% | | | | | | | | |
| | 2,907,982 | | American Family Financial Services, 0.10% | | | 2,907,982 | | | | 2,907,982 | |
| | | | Total short-term investments | | | 10,407,982 | | | | 10,407,982 | |
| | | | Total investments - 104.6% | | $ | 140,899,351 | | | | 155,336,838 | |
| | | | Liabilities, less other assets - (4.6%) (a) | | | | | | | (6,819,066 | ) |
| | | | TOTAL NET ASSETS - 100.0% | | | | | | $ | 148,517,772 | |
| * | Non-dividend paying security. |
| (a) | Percentages for the various classifications relate to net assets. |
The accompanying notes to financial statements are an integral part of this schedule.
Brandywine Advisors Midcap Growth Fund
Statement of Operations
For the Year Ended September 30, 2009
| Income: | | | |
| Dividends | | $ | 880,860 | |
| Interest | | | 49,049 | |
| Total income | | | 929,909 | |
| Expenses: | | | | |
| Management fees | | | 1,373,325 | |
| Service and Distribution expenses | | | 94,108 | |
| Transfer agent fees | | | 76,338 | |
| Professional fees | | | 59,053 | |
| Administrative and accounting services | | | 46,000 | |
| Printing and postage expense | | | 38,306 | |
| Registration fees | | | 32,138 | |
| Custodian fees | | | 25,070 | |
| Board of Directors fees and expenses | | | 18,320 | |
| Insurance expense | | | 10,747 | |
| Other expenses | | | 5,865 | |
| Net expenses | | | 1,779,270 | |
| Net Investment Loss | | | (849,361 | ) |
| Net Realized Loss on Investments | | | (65,091,340 | ) |
| Net Increase in Unrealized Appreciation on Investments | | | 22,484,598 | |
| Net Loss on Investments | | | (42,606,742 | ) |
| Net Decrease in Net Assets Resulting From Operations | | $ | (43,456,103 | ) |
Statements of Changes in Net Assets
For the Years Ended September 30, 2009 and 2008
| | | 2009 | | | 2008 | |
| Operations: | | | | | | |
| Net investment loss | | $ | (849,361 | ) | | $ | (1,758,895 | ) |
| Net realized loss on investments | | | (65,091,340 | ) | | | (7,467,332 | ) |
| Net increase (decrease) in unrealized appreciation on investments | | | 22,484,598 | | | | (58,891,395 | ) |
| Net decrease in net assets resulting from operations | | | (43,456,103 | ) | | | (68,117,622 | ) |
| | | | | | | | | |
| Distributions to Shareholders: | | | | | | | | |
| Distributions from realized gains ($1.49109 per share) | | | — | | | | (30,642,150 | ) |
| | | | | | | | | |
| Fund Share Activities: | | | | | | | | |
| Proceeds from shares issued (3,262,108 and 4,469,129 shares, respectively) | | | 20,802,261 | | | | 49,945,420 | |
| Net asset value of shares issued in distributions reinvested (815,104 shares) | | | — | | | | 9,787,846 | |
| Cost of shares redeemed (5,280,865 and 1,690,144 shares, respectively) | | | (33,399,168 | ) | | | (17,902,222 | ) |
| Net (decrease) increase in net assets derived from Fund share activities | | | (12,596,907 | ) | | | 41,831,044 | |
| Total Decrease | | | (56,053,010 | ) | | | (56,928,728 | ) |
| | | | | | | | | |
| Net Assets at the Beginning of the Year | | | 204,570,782 | | | | 261,499,510 | |
| Net Assets at the End of the Year | | $ | 148,517,772 | | | $ | 204,570,782 | |
| (Includes undistributed net investment income of $0 and $0, respectively) | | | | | | | | |
The accompanying notes to financial statements are an integral part of these statements.
Brandywine Advisors Midcap Growth Fund
Financial Highlights
(Selected data for each share of the Fund outstanding throughout each year)
| | | Years Ended September 30, | |
| | | 2009 | | | 2008 | | | 2007 | | | 2006 | | | 2005 | |
| PER SHARE OPERATING PERFORMANCE: | | | | | | | | | | | | | | | |
| Net asset value, beginning of year | | $ | 8.65 | | | $ | 13.03 | | | $ | 10.63 | | | $ | 12.29 | | | $ | 9.22 | |
Income from investment operations: | | | | | | | | | | | | | | | | | | | | |
Net investment loss(1) | | | (0.04 | ) | | | (0.08 | ) | | | (0.07 | ) | | | (0.06 | ) | | | (0.05 | ) |
| Net realized and unrealized (losses) gains on investments | | | (1.75 | ) | | | (2.81 | ) | | | 3.25 | | | | (0.20 | ) | | | 3.12 | |
| Total from investment operations | | | (1.79 | ) | | | (2.89 | ) | | | 3.18 | | | | (0.26 | ) | | | 3.07 | |
Less distributions: | | | | | | | | | | | | | | | | | | | | |
| Distributions from net investment income | | | — | | | | — | | | | — | | | | — | | | | — | |
| Distributions from net realized gains | | | — | | | | (1.49 | ) | | | (0.78 | ) | | | (1.40 | ) | | | — | |
| Total from distributions | | | — | | | | (1.49 | ) | | | (0.78 | ) | | | (1.40 | ) | | | — | |
| Net asset value, end of year | | $ | 6.86 | | | $ | 8.65 | | | $ | 13.03 | | | $ | 10.63 | | | $ | 12.29 | |
| TOTAL RETURN | | | (20.69 | %) | | | (25.22 | %) | | | 31.80 | % | | | (1.10 | %) | | | 33.30 | % |
RATIOS/SUPPLEMENTAL DATA: | | | | | | | | | | | | | | | | | | | | |
| Net assets, end of year (in 000’s $) | | | 148,518 | | | | 204,571 | | | | 261,500 | | | | 187,381 | | | | 200,593 | |
| Ratio of expenses to average net assets | | | 1.30 | % | | | 1.19 | % | | | 1.17 | % | | | 1.18 | % | | | 1.19 | % |
Ratio of net investment loss to average net assets | | | (0.62 | %) | | | (0.71 | %) | | | (0.59 | %) | | | (0.53 | %) | | | (0.51 | %) |
| Portfolio turnover rate | | | 240 | % | | | 198 | % | | | 178 | % | | | 208 | % | | | 207 | % |
| (1) | Net investment loss per share was calculated using average shares outstanding. |
The accompanying notes to financial statements are an integral part of this statement.
Brandywine Advisors Midcap Growth Fund
Notes to Financial Statements
September 30, 2009
| (1) | Summary of Significant Accounting Policies |
| | The following is a summary of significant accounting policies of Brandywine Advisors Midcap Growth Fund (the “Fund”). The Fund is registered as a diversified open-end management company under the Investment Company Act of 1940 (the “Act”), as amended, and is a series of the Brandywine Blue Fund, Inc. (the “Blue Fund”). The Blue Fund was incorporated under the laws of Maryland on November 13, 1990. The Fund was privately offered from October 1, 2000 (commencement of operations) to October 31, 2000 (effective date), the date shares were first offered to the public. The assets and liabilities of each series in the Blue Fund are segregated and a shareholder’s interest is limited to the Fund in which the shareholder owns shares. The investment objective of the Fund is to produce capital appreciation principally through investing in common stocks. |
| | (a) | Each security, excluding short-term investments, is valued at the last sale price reported by the principal security exchange on which the issue is traded. Securities that are traded on the Nasdaq Markets are valued at the Nasdaq Official Closing Price, or if no sale is reported, the latest bid price. Securities which are traded over-the-counter are valued at the latest bid price. Securities for which quotations are not readily available are valued at fair value as determined by the investment adviser under the supervision of the Board of Directors. The fair value of a security may differ from the last quoted price and the Fund may not be able to sell a security at the estimated fair value. Market quotations may not be available, for example, if trading in particular securities has halted during the day and not resumed prior to the close of trading on the New York Stock Exchange. As of September 30, 2009, there were no securities that were internally fair valued. Short-term investments with maturities of 60 days or less are valued at amortized cost, which approximates value. For financial reporting purposes, investment transactions are recorded on the trade date; however, for purposes of executing shareholder transactions, the Fund records changes in holdings of portfolio securities no later than the first business day after the trade date in accordance with Rule 2a-4 of the Act. Accordingly certain differences between net asset value for financial reporting and for executing shareholder transactions may arise. |
| | | The Fund adopted the provisions of the Financial Accounting Standards Board (“FASB”) Accounting Standards Codification “Fair Value Measurements and Disclosures” Topic 820 (“ACS 820”), effective October 1, 2008. Under ACS 820, fair value is defined as the price that would be received to sell an asset or paid to transfer a liability (i.e., the “exit price”) in an orderly transaction between market participants at the measurement date. |
| | | In determining fair value, the Fund uses various valuation approaches. ACS 820 establishes a fair value hierarchy for inputs used in measuring fair value that maximizes the use of observable inputs and minimizes the use of unobservable inputs by generally requiring that the most observable inputs be used when available. Observable inputs are those that market participants would use in pricing the asset or liability based on market data obtained from sources independent of the Fund. Unobservable inputs reflect the Fund’s assumptions about the inputs market participants would use in pricing the asset or liability developed based on the best information available in the circumstances. The inputs or methodologies used for valuing securities are not necessarily an indication of the risks associated with investing in those securities. |
| | | The fair value hierarchy is categorized into three levels based on the inputs as follows: |
| | | Level 1 – Valuations based on unadjusted quoted prices in active markets for identical assets. |
| | | Level 2 – Valuations based on quoted prices for similar securities or in markets that are not active or for which all significant inputs are observable, either directly or indirectly. |
Brandywine Advisors Midcap Growth Fund
Notes to Financial Statements (Continued)
September 30, 2009
| (1) | Summary of Significant Accounting Policies (Continued) |
| | Level 3 – Valuations based on inputs that are unobservable and significant to the overall fair value measurement. |
| | | The following table summarizes the Fund’s investments as of September 30, 2009, based on the inputs used to value them: |
| Valuation Inputs | | Investments in Securities | |
| Level 1 – Common Stocks | | $ | 144,928,856 | |
| Level 2 – Short Term Commercial Paper | | | 7,500,000 | |
| Variable Rate Demand Note | | | 2,907,982 | |
| Total Level 2 | | | 10,407,982 | |
| Level 3 – | | | — | |
| Total | | $ | 155,336,838 | |
| | (b) | Net realized gains and losses on sales of securities are computed on the identified cost basis. |
| | (c) | Dividend income is recorded on the ex-dividend date. Interest income is recorded on an accrual basis. |
| | (d) | The Fund has investments in short-term variable rate demand notes, which are unsecured instruments. The Fund may be susceptible to credit risk with respect to these notes to the extent the issuer defaults on its payment obligation. The Fund’s policy is to monitor the creditworthiness of the issuer and nonperformance by these counterparties is not anticipated. |
| | (e) | Accounting principles generally accepted in the United States of America (“GAAP”) require that permanent differences between income for financial reporting and tax purposes be reclassified in the capital accounts. |
| | (f) | The preparation of financial statements in conformity with GAAP requires management to make estimates and assumptions that affect the reported amounts of assets and liabilities and disclosure of contingent assets and liabilities at the date of the financial statements and the reported amounts of revenues and expenses during the reporting period. Actual results could differ from these estimates. |
| | (g) | No provision has been made for Federal income taxes since the Fund has elected to be taxed as a “regulated investment company” and intends to distribute substantially all net investment company taxable income and net capital gains to shareholders and otherwise comply with the provisions of the Internal Revenue Code applicable to regulated investment companies. |
| | (h) | The Fund has reviewed all open tax years and major jurisdictions, which include Federal and the state of Maryland, and concluded that there are no significant uncertain tax positions that would require recognition in the financial statements. Open tax years are those that are open for exam by taxing authorities and, as of September 30, 2009, open Federal tax years include the tax years ended September 30, 2006 through 2009. The Fund has no examinations in progress and is also not aware of any tax positions for which it is reasonably possible that the total amounts of unrecognized tax benefits will significantly change in the next twelve months. |
| (2) | Investment Adviser and Management Agreement and Transactions With Related Parties |
| | The Fund has a management agreement with Friess Associates, LLC (the “Adviser”), with whom certain Officers and a Director of the Fund are affiliated, to serve as investment adviser and manager. Under the terms of the agreement, the Fund will pay the Adviser a monthly management fee at the annual rate of one percent (1%) on the daily net assets of the Fund. |
| The Adviser entered into a sub-advisory agreement with its affiliate, Friess Associates of Delaware, LLC (the “Sub-Adviser”), to assist it in the day-to-day management of the Fund. The Adviser and, if so delegated, the Sub-Adviser supervise the investment portfolio of the Fund, directing the purchase and sale of investment securities in the day-to-day management of the Fund. The Adviser pays the Sub-Adviser a fee equal to 110% of the monthly expenses the Sub-Adviser incurs in performing its services as Sub-Adviser. This relationship does not increase the annual management fee the Fund pays to the Adviser. |
| The Fund pays each of the five independent directors annual fees of $3,000. The lead independent director and chairman of the audit committee are paid an additional $5,000 annually, divided proportionately among all the Brandywine Funds. All of the corresponding fees the directors receive are paid quarterly to the directors and then invested on the payment date in shares of the Fund at the net asset value of the Fund on the payment date. The Fund also reimburses directors for travel costs incurred in order to attend meetings of the Board of Directors. For the year ended September 30, 2009, the Fund expensed the following directors fees and costs: |
| Directors Fees and Travel Costs Paid during the Year | $18,320 |
| | | The Fund has adopted a Service and Distribution Plan (the “Plan”) pursuant to Rule 12b-1 under the Act. The Plan provides that the Fund may incur certain costs which may not exceed a maximum amount equal to 0.25% per annum of the Fund’s average net assets. Payments made pursuant to the Plan may only be used to pay distribution expenses incurred in the current year. |
| | | Under the Fund’s organizational documents, each director, officer, employee or other agent of the Fund (including the Fund’s investment manager) is indemnified, to the extent permitted by the Act, against certain liabilities that may arise out of performance of their duties to the Fund. Additionally, in the normal course of business, the Fund enters into contracts that contain a variety of indemnification clauses. The Fund’s maximum exposure under these arrangements is unknown as this would involve future claims that may be made against the Fund that have not yet occurred. However, the Fund has not had prior claims or losses pursuant to these contracts and believes the risk of loss to be remote. |
| | | At September 30, 2009, approximately 70% of the outstanding shares of the Fund are owned by an affiliate of the Adviser. |
| | U.S. Bank, N.A. has made available to the Fund a $4,000,000 uncommitted credit facility pursuant to a Credit Agreement, effective December 6, 2004, for the purpose of having cash available to cover incoming redemptions. Principal and interest of such loan under the Credit Agreement is due not more than 31 days after the date of the loan. Amounts under the credit facility bear interest at a rate per annum equal to the current prime rate minus one percent on the amount borrowed. During the year ended September 30, 2009, the Fund did not borrow against its Agreement. The Credit Agreement expires on December 18, 2009. |
Brandywine Advisors Midcap Growth Fund
Notes to Financial Statements (Continued)
September 30, 2009
| (4) | Distributions to Shareholders |
| | Net investment income and net realized gains, if any, are distributed to shareholders at least annually. |
| (5) | Investment Transactions and Related Costs |
| | | For the year ended September 30, 2009, purchases and proceeds of sales of investment securities (excluding short-term investments) for the Fund were as follows: |
| | | | Sale | | Transaction | | Ratio of Costs to | |
| | Purchases | | Proceeds | | Costs | | Average Net Assets | |
| | $322,757,482 | | $324,097,671 | | $846,552 | | 0.62% | |
| | | Transaction costs represent the total commissions paid by the Fund on its purchases and sales of investment securities. These costs are added to the cost basis of the securities purchased and are deducted from the proceeds of securities sold, thereby reducing the realized gains or increasing the realized losses upon the sale of the securities. |
| (6) | Income Tax Information |
| | The following information for the Fund is presented on an income tax basis as of September 30, 2009: |
| | | | Gross | | Gross | | Net Unrealized | | Distributable | | Distributable | |
| | Cost of | | Unrealized | | Unrealized | | Appreciation | | Ordinary | | Long-Term | |
| | Investments | | Appreciation | | Depreciation | | on Investments | | Income | | Capital Gains | |
| | $141,170,560 | | $16,500,326 | | $2,334,048 | | $14,166,278 | | $— | | $— | |
| | The difference, if any, between the cost amount for financial statement and federal income tax purposes is due primarily to timing differences in recognizing certain gains and losses in security transactions. |
| | The tax components of dividends paid during the years ended September 30, 2009 and 2008, capital loss carryovers, which may be used to offset future capital gains, subject to Internal Revenue Code limitations (expiring in 2017), as of September 30, 2009, and tax basis post-October losses as of September 30, 2009, which are not recognized for tax purposes until the first day of the following fiscal year are: |
| | September 30, 2009 | | September 30, 2008 | |
| | Ordinary | | Long-Term | | Net Capital | | | | Ordinary | | Long-Term | |
| | Income | | Capital Gains | | Loss | | Post-October | | Income | | Capital Gains | |
| | Distributions | | Distributions | | Carryovers | | Losses | | Distribution | | Distributions | |
| | $— | | $— | | $41,003,419 | | $37,311,086 | | $8,982,450 | | $21,659,700 | |
| | Since there were no ordinary distributions paid for the year ended September 30, 2009, there were no distributions designated as qualifying for the dividends received deduction for corporate shareholders nor as qualified dividend income under the Jobs and Growth Tax Relief Act of 2003. |
| | Effective October 1, 2009, U.S. Bancorp Fund Services, LLC, began serving as the administrator and accounting services agent for the Fund. Subsequent events have been evaluated through October 13, 2009, which is the date the financial statements were issued. Subsequent events have not been evaluated after this date. |
REPORT OF INDEPENDENT REGISTERED PUBLIC ACCOUNTING FIRM
To the Board of Directors and Shareholders of
Brandywine Advisors Midcap Growth Fund
In our opinion, the accompanying statement of assets and liabilities, including the schedule of investments, and the related statements of operations and of changes in net assets and the financial highlights present fairly, in all material respects, the financial position of Brandywine Advisors Midcap Growth Fund (the “Fund”, a series of the Brandywine Blue Fund, Inc.) at September 30, 2009, the results of its operations for the year then ended, the changes in its net assets for each of the two years in the period then ended and the financial highlights for each of the five years in the period then ended, in conformity with accounting principles generally accepted in the United States of America. These financial statements and financial highlights (hereafter referred to as “financial statements”) are the responsibility of the Fund’s management; our responsibility is to express an opinion on these financial statements based on our audits. We conducted our audits of these financial statements in accordance with the standards of the Public Company Accounting Oversight Board (United States). Those standards require that we plan and perform the audit to obtain reasonable assurance about whether the financial statements are free of material misstatement. An audit includes examining, on a test basis, evidence supporting the amounts and disclosures in the financial statements, assessing the accounting principles used and significant estimates made by management, and evaluating the overall financial statement presentation. We believe that our audits, which included confirmation of securities at September 30, 2009 by correspondence with the custodian and brokers, provide a reasonable basis for our opinion.
Milwaukee, Wisconsin
October 13, 2009
Brandywine Advisors Midcap Growth Fund Directors and Officers
| | | Name, Age, Address | | Position, Term of Office and Length of Time Served and Number of Portfolios in Fund Complex Overseen by Director | | Principal Occupation During Past Five Years | | Other Directorships Held by Director |
| | | | | | | | | |
| | C. Quentin S. Jackson, 65c/o Friess AssociatesP.O. Box 4166Greenville, DE 19807 | | Lead IndependentDirectorIndefinite Term sinceOctober, 20013 Portfolios | | Mr. Jackson is retired. He wasthe President and Chief ExecutiveOfficer of Nuclear ElectricInsurance Ltd., a multibillion-dollarcompany mutually owned by energycompanies. | | None |
| | | | | | | | | |
| | Stuart A. McFarland, 62c/o Friess AssociatesP.O. Box 4166Greenville, DE 19807 | | | | Mr. McFarland is Managing Partnerof Federal City Capital Advisors, LLC,a financial advisory firm. He was theChairman of Federal CityBancorp, a thrift holding companyfrom April 2004 until June 2007. | | Helios Funds (8 portfolios)and Newcastle InvestmentCorporation |
| | | | | | | | | |
| | W. Richard Scarlett III, 70c/o Friess AssociatesP.O. Box 4166Greenville, DE 19807 | | DirectorIndefinite Term sinceOctober, 20013 Portfolios | | Mr. Scarlett is retired. He was thePresident and CEO of Jackson StateBank & Trust. He was the Chairmanand Chief Executive Officer of UnitedBancorporation of Wyoming, Inc.,from 1981 to July 2008. | | None |
| | | | | | | | | |
| | Thomas D. Wren, 57c/o Friess AssociatesP.O. Box 4166Greenville, DE 19807 | | | | Mr. Wren is a senior advisor forPromontory Financial Group, LLC.He was the Treasurer of MBNACorporation and its MBNAAmerica Bank, N.A. subsidiaryfrom 1995 to 2006. | | ACM Financial Trust, Inc.and Hatteras FinancialCorp. |
| | | | | | | | | |
| | James W. Zug, 69c/o Friess AssociatesP.O. Box 4166Greenville, DE 19807 | | DirectorIndefinite Term sinceOctober, 20013 Portfolios | | Mr. Zug is a retired Partner ofPricewaterhouseCoopers LLP. Hewas employed with Pricewater-houseCoopers and its predecessorsfrom 1964 until 2000. | | Allianz Funds(30 portfolios),Amkor Technology, Inc.and Teleflex Inc. |
Brandywine Advisors Midcap Growth Fund Directors and Officers
| "Interested Persons" of the Fund* | | Name, Age, Address | | Position, Term of Office and Length of Time Served and Number of Portfolios in Fund Complex Overseen by Director or Officer | | Principal Occupation During Past Five Years | | Other Directorships Held by Director or Officer |
| | | | | | | | | |
| | William F. D’Alonzo*, 54c/o Friess AssociatesP.O. Box 4166Greenville, DE 19807 | | DirectorIndefinite Term sinceOctober, 2001President since 2003 Chairman since 2004 3 Portfolios | | Mr. D’Alonzo joined FriessAssociates in 1981 as part of theresearch team, became Chief Investment Officer in 1997 andChief Executive Officer in 2002. | | None |
| | | | | | | | | |
| | Lynda J. Campbell*, 63c/o Friess AssociatesP.O. Box 4166Greenville, DE 19807 | | Vice President since 1998Secretary since 1990Treasurer since 20073 Portfolios | | Ms. Campbell joined Friess Associates in 1985. Ms. Campbell is currently Chief Administrative Officer of the Friess Companies. | | None |
| | | | | | | | | |
| | Joseph J. Fields*, 53c/o Friess AssociatesP.O. Box 4166Greenville, DE 19807 | | Vice President since 2007 3 Portfolios | | Mr. Fields joined Friess Associatesin 1999. He is currently aClient Relationship Managerof the Friess Companies. | | None |
| | | | | | | | | |
| | Gordon Kaiser*, 50 c/o Friess Associates P.O. Box 4166Greenville, DE 19807 | | Vice President since 2007 3 Portfolios | | Mr. Kaiser joined Friess Associatesin 1999. He is currently aClient Relationship Managerof the Friess Companies. | | None |
| | | | | | | | | |
| | David D. Marky*, 44 c/o Friess AssociatesP.O. Box 4166Greenville, DE 19807 | | Vice President since 2002Chief Compliance Officer since 2004 | | Mr. Marky joined Friess Associatesin 2000. He currently serves asChief Compliance Officer for theFriess Companies. | | None |
| | | |
| | | |
| | The Brandywine Funds P.O. Box 4166 Greenville, DE 19807 (877) 636-6460www.brandywinefunds.combfunds@friess.com |
| | | |
For additional information about the Directors and Officers, please call (877) 636-6460 and request a Statement of Additional Information. One will be mailed to you free of charge.
| * | Messrs. D’Alonzo, Fields, Kaiser and Marky and Ms. Campbell are “interested persons” of the Fund as that term is defined in the Investment Company Act of 1940 by reason of their being officers of the Fund and employees of Friess Associates, LLC. |
Capital Gains Update . . . Brandywine Advisors Midcap Growth Fund will not make a capital gains distribution for the fiscal year ended September 30, 2009. The Fund finished the fiscal year in a net realized loss position of approximately $3.65 per share. The realized loss can be carried forward to offset future realized gains. |
IRA Investors . . . The annual $15 maintenance fee for shareholders invested through IRA accounts is due on November 13, 2009. For your convenience, US Bancorp will automatically deduct this amount from your IRA on the due date. If you prefer not to have the fee swept from your account, please send a check to US Bancorp by the due date. |
| | P.O. Box 4166, Greenville, DE 19807 | |
| (877) 636-6460 | www.brandywinefunds.com | bfunds@friess.com |
Investment Adviser: Friess Associates, LLC | Independent Registered Public Accounting Firm : PricewaterhouseCoopers LLP |
Investment Sub-Adviser: Friess Associates of Delaware, LLC | Legal Counsel: Foley & Lardner LLP |
Custodian: U.S. Bank, N.A. | Distributor: Quasar Distributors, LLC |
Transfer Agent: U.S. Bancorp Fund Services, LLC | |
Officers: William D’Alonzo, Chairman and President;
Lynda Campbell, Vice President, Secretary and Treasurer; Joseph Fields, Vice President;
Gordon Kaiser, Vice President; David Marky, Chief Compliance Officer, Vice President and Assistant Secretary
Report Editor: Chris AregoodReport Staff: David Marky, Adam Rieger
Must be preceded or accompanied by prospectus. Please refer to the prospectus for important information about the investment company including investment objectives, risks, charges and expenses.
Mutual fund investing involves risk. Principal loss is possible. The Fund invests in mid-cap companies, which involve additional risks such as limited liquidity and greater volatility. Investments in foreign securities, even though publicly traded in the United States, may involve risks which are in addition to those inherent in domestic investments. Fund holdings and sector weightings are subject to change at any time and are not recommendations to buy or sell any securities. Securities discussed were not held by the Fund as of 9/30/09, unless listed in the accompanying schedule of investments. Cash flow measures the cash-generating capability of a company by adding non-cash charges (e.g. depreciation) and interest expense to pretax income. The Price to Earnings (P/E) Ratio is calculated by dividing current price of the stock by the company’s estimated earnings per share for the current calendar year. References to the earnings growth rates of the Fund refer solely to the estimated earnings growth rates of the average investment holding of the Fund based on consensus estimates from Baseline Financial Services, Inc. (Baseline) and not to the actual performance of the Fund itself. Baseline provides analytical information and services to the investment community. The S&P 500, Russell Midcap and Russell Midcap Growth Indexes are unmanaged indices commonly used to measure the performance of U.S. stocks.You cannot invest directly in an index.
As of September 30, 2009, the S&P 500 Index’s average annual total returns for 1, 5 and 10 years were -6.91, 1.02 and -0.15 percent; the Russell Midcap Index’s were -3.55, 3.89 and 6.05 percent; and the Russell Midcap Growth Index’s were -0.40, 3.75 and 2.18 percent.
10/09
Item 2. Code of Ethics.
Registrant has adopted a code of ethics. See attached Exhibit 12 (a).
Item 3. Audit Committee Financial Expert.
Registrant’s Board of Directors has determined that Mr. Stuart A. McFarland, a member of the audit committee, is an audit committee financial expert. Mr. McFarland is “independent” as such term is defined in Form N-CSR.
Item 4. Principal Accountant Fees and Services.
(a) Audit Fees
$55,219.33 + (FY 2009) and $53,555 (FY 2008) are the aggregate fees billed for each of the last two fiscal years for professional services rendered by the principal accountant to the registrant for the audit of the registrant’s annual financial statements or services that are normally provided by the accountant in connection with statutory and regulatory filings or engagements for those fiscal years.
(b) Audit-Related Fees
There were no fees billed in each of the last two fiscal years for Audit-Related Fees.
There were no fees billed in the last two fiscal years for professional services rendered by the principal accountant to the registrant for tax compliance, tax advice, tax planning and tax return preparation.
(d) All Other Fees
There were no fees billed in the last two fiscal years for products and services provided by the principal accountant to the registrant, other than the services reported in paragraphs (a) – (c) of this Item 4.
(e) (1) None
(e) (2) None
(f) Not applicable.
(g) $81,472 (FY 2009) and $71,020 (FY 2008) in non-audit fees were billed to the registrant’s investment adviser for tax return preparation and AIMR performance verification services.
(h) The Audit Committee of the registrant determined that the provision of non-audit services rendered to the registrant’s investment adviser by the principal accountant disclosed in paragraph (g) of this Item 4, was compatible with maintaining the principal accountant’s independence.
Item 5. Audit Committee of Listed Registrants.
Not applicable.
Item 6. Schedule of Investments.
The schedule of investments in securities of unaffiliated issuers is included as part of the report to shareholders filed under Item 1.
Item 7. Disclosure of Proxy Voting Policies and Procedures for Closed-End Management Investment Companies
Not applicable.
Item 8. Portfolio Managers of Closed-End Management Investment Companies.
Not applicable.
Item 9. Purchases of Equity Securities By Closed-End Management Investment Company and Affiliated Purchasers.
Not applicable.
Item 10. Submission of Matters to a Vote of Security Holders.
None.
Item 11. Controls and Procedures.
| (a) | The disclosure controls and procedures of the Brandywine Blue Fund, Inc. are periodically evaluated. As of October 23, 2009, the date of the last evaluation, we concluded that our disclosure controls and procedures are adequate. |
| (b) | The internal controls of the Brandywine Blue Fund, Inc. are periodically evaluated. There were no changes to Brandywine Blue Fund’s internal control over financial reporting that occurred during the second fiscal quarter of the period covered by this report that have materially affected, or are reasonably likely to materially affect, such controls. |
Item 12. Exhibits.
| (a) | (1) | Any code of ethics or amendment thereto. Filed herewith. |
| | (2) | Certifications pursuant to Section 302 of the Sarbanes-Oxley Act of 2002. Filed herewith. |
| | (3) | Any written solicitation to purchase securities under Rule 23c-1 under the Act sent or given during the period covered by the report or on behalf of the Registrant to 10 or more persons. Not applicable. |
| (b) | Certification pursuant to Section 906 of the Sarbanes-Oxley Act of 2002. Filed herewith. |
SIGNATURES
Pursuant to the requirements of the Securities Exchange Act of 1934 and the Investment Company Act of 1940, the registrant has duly caused this report to be signed on its behalf by the undersigned, thereunto duly authorized.
Brandywine Blue Fund, Inc.
Registrant
By /s/William F. D’Alonzo
William F. D’Alonzo Principal Executive Officer
Date October 26, 2009
Pursuant to the requirements of the Securities Exchange Act of 1934 and the Investment Company Act of 1940, this report has been signed below by the following persons on behalf of the registrant and in the capacities and on the dates indicated.
Brandywine Blue Fund, Inc.
Registrant
By /s/Lynda J. Campbell
Lynda J. Campbell, Principal Financial Officer
Date October 26, 2009