UNITED STATES
SECURITIES AND EXCHANGE COMMISSION
WASHINGTON, D.C. 20549
FORM N-CSR
CERTIFIED SHAREHOLDER REPORT OF REGISTERED
MANAGEMENT INVESTMENT COMPANIES
Investment Company Act file number: 811-06260
THE QUAKER INVESTMENT TRUST
(Exact name of registrant as specified in charter)
309 Technology Drive
Malvern, PA 19355
(Address of principal executive offices) (Zip code)
(Name and address of agent for service)
Registrant’s telephone number, including area code: 800-220-8888
Date of fiscal year end: June 30, 2007
Date of reporting period: June 30, 2007
Form N-CSR is to be used by management investment companies to file reports with the Commission not later than 10 days after the transmission to stockholders of any report that is required to be transmitted to stockholders under Rule30e-1 under the Investment Company Act of 1940 (17 CFR 270.30e-1). The Commission may use the information provided on Form N-CSR in its regulatory, disclosure review, inspection, and policymaking rules.
A registrant is required to disclose the information specified by Form N-CSR, and the Commission will make this information public. A registrant is not required to respond to the collection of information contained in Form N-CSR unless the Form displays a currently valid Office of Management and Budget (“OMB”) control number. Please direct all comments concerning the accuracy of the information collection burden estimate and any suggestions for reducing the burden to Secretary, Securities and Exchange Commission, 450 Fifth Street, NW, Washington, DC 20549-0609. The OMB has reviewed this collection of information under clearance requirements of 44 U.S.C. ss. 3507.
ITEM 1. REPORTS TO STOCKHOLDERS.
ANNUAL REPORT | 2007
GROWTH FUNDS
Quaker Strategic Growth Fund
Quaker Core Equity Fund
Quaker Small-Cap Growth Fund
Quaker Capital Opportunities Fund
Quaker Biotech Pharma-Healthcare Fund
VALUE FUNDS
Quaker Mid-Cap Value Fund
Quaker Small-Cap Value Fund
Quaker Core Value Fund
Mutual fund investing involves risk. Principal loss is possible.
Investing in the Quaker Funds may involve special risks including, but not limited to, investments in smaller companies, non-diversification, short sales, foreign securities, special situation companies, debt securities and value and growth investing. Please refer to the prospectus for more complete information.
This report must be preceded or accompanied by a current prospectus.
The opinions expressed are those of the sub-advisers through the end of the period for this report, are subject to change, are not a guarantee and should not be considered investment advice.
Fund holdings are subject to change and should not be considered a recommendation to buy or sell any security.
Chairman’s Letter to the Shareholders
June 30, 2007
Dear Fellow Shareholder:
We are pleased to present the Annual Report to Shareholders of the Quaker Funds for the year ended June 30, 2007. Fiscal year 2007 (July 1, 2006 — June 30, 2007) presented numerous challenges for the Quaker Funds. An economy affected by the war in Iraq, an inverted Treasury yield curve, an unstable domestic housing market and general uncertainty about interest rates created a difficult environment for investors and investment managers alike.
In mid 2006, our organization entered into new service provider agreements for custody, fund accounting, fund administration, transfer agency and distribution. After a thorough screening and pricing process, the Trustees chose Brown Brothers Harriman & Co. for custody, fund accounting and fund administration and U.S.Bancorp Fund Services, LLC for transfer agency and distribution. The transition of all of these services to our new providers was completed in December. We believe these changes will result in more efficient and lower cost services. Additionally, our Audit Committee chose to hire a new auditing firm. After a diligent selection process, PricewaterhouseCoopers LLP was selected. We feel very strongly that all of the above changes will increase our ability to serve you, our shareholders, as we grow in the future.
I would also like to take this opportunity to thank the shareholders and fellow board members for the opportunity to serve as independent chairman for the Quaker Investment Trust. It has been a pleasure to work with the Quaker Funds’ Board and Fund management for the past several years. Now that the funds are serviced by well respected providers and are on a clear course for the future, I have decided to resign from the Quaker Board effective August 1, 2007. Upon my resignation, the Board has asked me to take the title of Chairman Emeritus, and I am pleased to accept. The Quaker Funds are well positioned to advance to the next level with the guidance of the remaining Board members and Fund management. I wish the Quaker Funds team and shareholders all of the best for the future.
The Quaker Funds continue to strive to provide the shareholders with exceptional, institutional quality, entrepreneurial asset managers. On behalf of the Board of Trustees, we thank you for placing your trust in us.
Sincerely,
David K. Downes
Independent Chairman
Table of Contents
| | | | | |
| | | Page | |
| Chairman’s Letter to the Shareholders | | | 1 | |
| Performance Update: | | | | |
| Quaker Strategic Growth Fund | | | 2 | |
| Quaker Core Equity Fund | | | 4 | |
| Quaker Small-Cap Growth Fund | | | 6 | |
| Quaker Capital Opportunities Fund | | | 8 | |
| Quaker Biotech Pharma-Healthcare Fund | | | 10 | |
| Quaker Mid-Cap Value Fund | | | 12 | |
| Quaker Small-Cap Value Fund | | | 14 | |
| Quaker Core Value Fund | | | 16 | |
| Expense Information | | | 18 | |
| Schedule of Investments | | | 21 | |
| Statements of Assets and Liabilities | | | 40 | |
| Statements of Operations | | | 42 | |
| Statements of Changes in Net Assets | | | 44 | |
| Financial Highlights | | | 46 | |
| Notes to the Financial Statements | | | 75 | |
| Report of Independent Registered Public Accounting Firm | | | 87 | |
| Trustees and Officers | | | 88 | |
| Approval of Advisory Agreement | | | 90 | |
| General Information | | | 92 | |
Performance Update
Quaker Strategic Growth Fund (QUAGX, QAGBX, QAGCX, QAGIX)
Objectives and Principal Strategies
The Fund seeks to provide long-term capital growth. Current income is not a significant investment consideration and any such income realized will be considered incidental to the Fund’s investment objective. The Fund invests primarily in equity securities of domestic U.S. companies which the Fund’s sub-adviser believes show a high probability for superior growth.
Performance Review and Market Outlook
For the fiscal year ended June 30, 2007, the S&P® 500 Total Return Index (“S&P 500”), a broad based market proxy, generated a 20.59% return. The Quaker Strategic Growth Fund finished the year with a total return of 18.68%*. Despite good calendar 2007 performance, the Fund could not keep pace with the index over the last year mainly due to defensive positioning last summer and overweights in the energy, materials and industrial sectors (which lagged the market) in the third quarter of 2006. For the first half of calendar year 2007, the S&P 500 gained 6.96% while the Quaker Strategic Growth Fund’s performance was up 15.67%.
The recent strength of the equity markets has been driven by three major factors. First is the merger and acquisition activity by financial (a.k.a. private equity funds) and strategic corporate buyers. This has placed a “floor” under the market because investors are constantly valuing companies at a premium over current prices based on recent buy-out prices. Second is the continued acceleration of economic growth in Asian, Middle Eastern and South American countries. This growth has been a tailwind to export oriented companies around the globe as well as to industrial and commodity related companies. Third is the current valuation of the market, which at 16 times forward earnings almost looks fair when compared to recent historical stock market overvaluations.
We continue to believe that U.S. domestic demand will remain weak and perhaps get even weaker as 2007 progresses. At the same time, we also believe that global demand will be strong due to the economic development that is occurring in Asia and the rising export revenues that are accruing to commodity based countries like Brazil, Russia and Saudi Arabia. If one extrapolates the conclusion of a recent study by the Federal Reserve Bank of New York, it appears that import growth on the part of export-oriented countries could continue for at least two more years. This of course is good news for export-oriented companies in the U.S. and Europe. Going forward, we will continue to be overweight companies that we believe will benefit from export markets or long-cycle spending and underweight companies that are exposed to discretionary consumer spending and finance related areas.
Manu P. Daftary, Portfolio Manager
DG Capital Management, Inc.
| | |
| * | | Performance shown is that of Class A and is not reflective of sales charges. See the Total Return Table on the next page for performance with sales charges. |
SUB-ADVISER:
DG Capital Management, Inc.
TOTAL NET ASSETS:
AS OF JUNE 30, 2007:
$767,305,938
| | | | | |
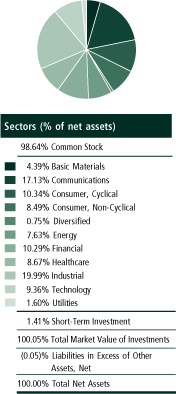
| Top Ten Holdings** (% of net assets) | | |
| Freeport-McMoRan Copper & Gold, Inc. | | | 4.35 | % |
| Canadian Natural Resources Ltd. | | | 4.14 | % |
| Williams Cos., Inc. | | | 3.96 | % |
| ConocoPhillips | | | 3.50 | % |
| Bayer AG ADR | | | 3.47 | % |
| Siemens AG ADR | | | 3.45 | % |
| Bunge Ltd. | | | 3.09 | % |
| XTO Energy, Inc. | | | 3.03 | % |
| Transocean, Inc. | | | 2.97 | % |
| Southwestern Energy Co. | | | 2.84 | % |
| |
| % Fund Total | | | 34.80 | % |
| |
| | |
| ** | | Excludes Short-Term Investments |
| |
| | |  |
| |
2 | 2007 ANNUAL REPORT
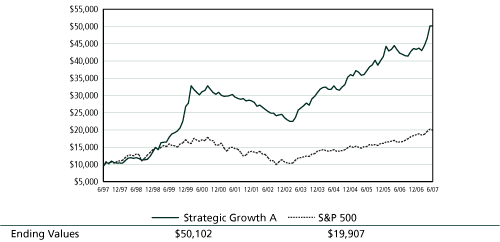
Quaker Strategic Growth Fund
Growth of a Hypothetical $10,000 Investment
June 30, 2007
Average Annualized Total Return
| | | | | | | | | | | | | | | | | | | | | | | | | | | | | | | | | | | | | | | | | |
| | | | | | | | | | | | | | | | | | | | | | | | | | | | | | | | | | | Commencement |
| | | Expense | | Inception | | | | | | | | | | | | | | | | | | | | | | | | | | of operations |
| | | Ratio | | Date | | One Year | | Five Year | | Ten Year | | through 06/30/07 |
| | | | | | | | | | | with | | without | | with | | without | | with | | without | | with | | without |
| | | | | | | | | | | sales | | sales | | sales | | sales | | sales | | sales | | sales | | sales |
| | | | | | | | | | | charge | | charge | | charge | | charge | | charge | | charge | | charge | | charge |
| |
| Class A | | | 1.90 | % | | | 11/25/1996 | | | | 12.15 | % | | | 18.68 | % | | | 13.29 | % | | | 14.58 | % | | | 17.48 | % | | | 18.14 | % | | | 17.74 | % | | | 18.37 | % |
| Class B | | | 2.65 | % | | | 08/01/2000 | | | | 12.77 | % | | | 17.77 | % | | | 13.50 | % | | | 13.74 | % | | | n/a | | | | n/a | | | | 6.26 | % | | | 6.26 | % |
| Class C | | | 2.65 | % | | | 07/11/2000 | | | | 16.80 | % | | | 17.80 | % | | | 13.73 | % | | | 13.73 | % | | | n/a | | | | n/a | | | | 6.18 | % | | | 6.18 | % |
| Class I | | | 1.65 | % | | | 07/20/2000 | | | | 18.95 | % | | | 18.95 | % | | | 14.86 | % | | | 14.86 | % | | | n/a | | | | n/a | | | | 7.04 | % | | | 7.04 | % |
| S&P 500 Total Return Index* | | | | | | | | | | | 20.59 | % | | | 20.59 | % | | | 10.70 | % | | | 10.70 | % | | | 7.12 | % | | | 7.12 | % | | | 8.41 | % | | | 8.41 | % |
| | |
| * | | The benchmark since inception returns are calculated since commencement of November 25, 1996 through June 30, 2007. |
Performance data quoted represents past performance and is no guarantee of future results. Investment return and principal value will fluctuate so that shares, when redeemed, may be worth more or less than their original cost. Current performance may be lower or higher than performance data quoted. Performance data current to the most recent month end is available at www.quakerfunds.com or by calling us toll free at 1-800-220-8888. Total return includes reinvestment of dividends and capital gains.
Class A shares of the Funds have a maximum sales charge of 5.50%. Class B and Class C shares have maximum deferred sales charges of 5.00% and 1.00%, respectively.
The line graph and performance table do not reflect the deduction of taxes that a shareholder might pay on fund distributions or the redemption of fund shares. Total return calculations reflect expense reimbursements and fee waivers in the applicable periods. See financial highlights for periods where fees were waived or reimbursed.
The Fund’s portfolio holdings may differ significantly from the securities held in the index and, unlike a mutual fund, an unmanaged index assumes no transaction costs, taxes, management fees or other expenses. You cannot invest directly in an index.
The S&P 500® Total Return Index is a capitalization weighted index of 500 stocks designed to measure performance of the broad domestic economy through changes in the aggregate market value of 500 stocks representing all major industries.
2007 ANNUAL REPORT | 3
Performance Update
Quaker Core Equity Fund (QUEX, QCEBX, QCECX, QCEIX)
Objectives and Principal Strategies
The Fund seeks to provide long-term capital growth. Current income is not a significant investment consideration and any such income realized will be considered incidental to the Fund’s investment objective. The Fund invests primarily in common stocks of U.S. companies with market capitalizations within the range of companies included in the Russell 1000® Growth Index.
Performance Review and Market Outlook
For the six-month period ended June 30, 2007, the Fund’s return of 9.51%* versus 8.13% for the Russell 1000® Growth Index was not enough to overcome a dismal second half of 2006. This left the Fund’s return for the fiscal year ended June 30, 2007 at 12.55%* versus 19.04% for the index. Our approach to valuation, growth-at-a-reasonable-price, was not rewarded, whereas, low price-to-book and low price-to-earnings were rewarded, irrespective of their future prospects. Our approach led us to have good earnings surprises and visibility at a reasonable price, but these companies were not rewarded for surprising the marketplace.
The last twelve months have actually been a study of two different markets: the last half of 2006 was driven by stocks with no good earnings news and the returns in the first half of 2007 were determined by earnings surprises. Accordingly, although the Fund underperformed for the last half of last year, it has recently seen some improvement.
As of June 30, 2007, we are continuing our emphasis on growth-at-a-reasonable-price stocks, as well as lower volatility stocks. This has been the stance of our portfolio during the last three years, and we expect it to continue for the next few quarters, at least. Given that current interest rates do not seem to be heading any lower, valuation is becoming even more important for investors’ returns. Likewise, as the market is getting a little more risky, volatility is not being rewarded. Accordingly, we will continue to emphasize lower volatility stocks. Given our bias for growth-at-a-reasonable-price and lower volatility, we will continue to take slight sector bets relative to the index.
The most striking underweight will continue to be the consumer discretionary sector. As long as the earnings and sales growth for this sector remain lower than their price/earnings warrant, we will be underweighted in this group. We intend to overemphasize slightly the energy sector, and even more so the financial sector. The energy sector is showing tremendous growth in revenues and earnings, which does not seem to want to slow down at all. We believe that the financial sector (insurance and investment banking) offers the best value in the stock market. Until the earnings season reveals itself, we will maintain a market weighting on the economically sensitive sectors of technology, material, and capital equipment, with our selections geared towards the export market. In fact, we expect international sales/earnings to be a larger component of your portfolio in the future, as the global economy grows at a faster rate than our domestic economy.
As we continuously rebalance the Fund’s portfolio, our turnover will be higher than it has been in the past, as relative valuation is very important to total returns and the volatility of the marketplace allows for more advantageous intraday trading. Although disappointed in our second half performance in calendar year 2006, we are nevertheless encouraged by our recent snapback and plan to stay the course with our current biases.
John Geewax and Bruce Terker
Geewax, Terker & Co.
SUB-ADVISER:
Geewax, Terker & Co.
| | |
| * | | Performance shown is that of Class A and is not reflective of sales charges. See the Total Return Table on the next page for performance with sales charges. |
TOTAL NET ASSETS:
AS OF JUNE 30, 2007:
$13,137,811
| | | | | |
| Top Ten Holdings** (% of net assets) |
| |
| General Electric Co. | | | 4.64 | % |
| PepsiCo, Inc. | | | 4.37 | % |
| Procter & Gamble Co. | | | 3.91 | % |
| Google, Inc. | | | 3.19 | % |
| Apple, Inc. | | | 3.07 | % |
| Baker Hughes, Inc. | | | 2.50 | % |
| American International Group, Inc. | | | 2.35 | % |
| Oshkosh Truck Corp. | | | 2.11 | % |
| Schlumberger Ltd. | | | 1.94 | % |
| American Express Co. | | | 1.91 | % |
| |
| | | | 29.99 | % |
| |
| | |
| ** | | Excludes Short-Term Investments |
| |
| | |  |
4 | 2007 ANNUAL REPORT
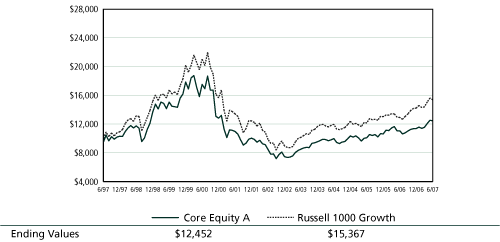
Quaker Core Equity Fund
Growth of a Hypothetical $10,000 Investment
June 30, 2007
Average Annualized Total Return
| | | | | | | | | | | | | | | | | | | | | | | | | | | | | | | | | | | | | | | | | |
| | | | | | | | | | | | | | | | | | | | | | | | | | | | | | | | | | | Commencement |
| | | Expense | | Inception | | | | | | | | | | | | | | | | | | | | | | | | | | of operations |
| | | Ratio | | Date | | One Year | | Five Year | | Ten Year | | through 06/30/07 |
| | | | | | | | | | | with | | without | | with | | without | | with | | without | | with | | without |
| | | | | | | | | | | sales | | sales | | sales | | sales | | sales | | sales | | sales | | sales |
| | | | | | | | | | | charge | | charge | | charge | | charge | | charge | | charge | | charge | | charge |
| |
| Class A | | | 1.77 | % | | | 11/25/1996 | | | | 6.36 | % | | | 12.55 | % | | | 6.79 | % | | | 8.00 | % | | | 2.22 | % | | | 2.80 | % | | | 3.57 | % | | | 4.13 | % |
| Class B | | | 2.52 | % | | | 11/14/2000 | | | | 6.68 | % | | | 11.68 | % | | | 6.90 | % | | | 7.20 | % | | | n/a | | | | n/a | | | | (3.13 | )% | | | (3.13 | )% |
| Class C | | | 2.52 | % | | | 06/30/2000 | | | | 10.67 | % | | | 11.67 | % | | | 7.21 | % | | | 7.21 | % | | | n/a | | | | n/a | | | | (5.51 | )% | | | (5.51 | )% |
| Class I | | | 1.52 | % | | | 07/14/2000 | | | | 12.82 | % | | | 12.82 | % | | | 8.28 | % | | | 8.28 | % | | | n/a | | | | n/a | | | | (5.31 | )% | | | (5.31 | )% |
| Russell 1000 Growth Index* | | | | | | | | | | | 19.04 | % | | | 19.04 | % | | | 9.28 | % | | | 9.28 | % | | | 4.39 | % | | | 4.39 | % | | | 5.73 | % | | | 5.73 | % |
| | |
| * | | The benchmark since inception returns are calculated since commencement of November 25, 1996 through June 30, 2007. |
Performance data quoted represents past performance and is no guarantee of future results. Investment return and principal value will fluctuate so that shares, when redeemed, may be worth more or less than their original cost. Current performance may be lower or higher than performance data quoted. Performance data current to the most recent month end is available at www.quakerfunds.com or by calling us toll free at 1-800-220-8888. Total return includes reinvestment of dividends and capital gains.
Class A shares of the Funds have a maximum sales charge of 5.50%. Class B and Class C shares have maximum deferred sales charges of 5.00% and 1.00%, respectively.
The line graph and performance table do not reflect the deduction of taxes that a shareholder might pay on fund distributions or the redemption of fund shares. Total return calculations reflect expense reimbursements and fee waivers in the applicable periods. See financial highlights for periods where fees were waived or reimbursed.
The Fund’s portfolio holdings may differ significantly from the securities held in the index and, unlike a mutual fund, an unmanaged index assumes no transaction costs, taxes, management fees or other expenses. You cannot invest directly in an index.
The Russell 1000® Growth Index measures the performance of those Russell 1000 companies with higher price-to-book ratios and higher forecasted growth values.
2007 ANNUAL REPORT | 5
Performance Update
Quaker Small-Cap Growth Fund (QSGAX, QSGBX, QSGCX, QSGIX)
Objectives and Principal Strategies
The Fund seeks to provide long-term capital growth. Current income is not a significant investment consideration and any such income realized will be considered incidental to the Fund’s investment objective. The Fund invests primarily in U.S. common stocks with market capitalizations within the range of companies included in the Russell 2000® Growth Index.
Performance Review and Market Outlook
For the twelve-months ended June 30, 2007, the Fund returned 12.44%* versus 16.83% for the Russell 2000® Growth Index. The entire underperformance occurred during the third quarter of 2006, when companies that we viewed as too risky, or as having too much negative sentiment/news, significantly outperformed those stocks that we invested in and which we believe offered a better risk/return tradeoff, or better earnings or valuations. Our overweight in the energy sector for the fiscal year was not rewarded as this sector was the worst performing sector. Likewise, our underweight in the consumer discretionary sector proved costly as this sector was one of the better performing ones. We have stayed with our risk-avoidance approach, and have slowly made up the underperformance of the third quarter 2006.
As we continue to focus on lower risk small growth companies, we have continued to underweight the consumer discretionary and the healthcare sectors; the former for its slower revenue and earnings growth, and the latter for its earnings disappointments and uncertainty. We are slightly overweighted in the economically sensitive sectors (technology/capital equipment/materials) as well as financials and energy. These sector tilts will continue into the near future, as we believe the consumer growth to be much less than other sectors in the marketplace.
Given the uncertainty in the marketplace, as well as increased riskiness in earnings forecasts, we continue to focus on growth-at-a-reasonable-price companies. With this emphasis, we should avoid most negative surprises in the upcoming earnings season, which we feel is very important given the level of interest rates, relative level of valuation multiples and the uncertainty surrounding earnings/revenue announcements. Given this uncertainty, the best investments are normally the best companies within each sector, or, as we believe, the most undervalued within each sector. Accordingly, the Fund is mainly invested this way, except for the two sectors mentioned above (consumer discretionary and healthcare), which have declining relative growth (as in the case of consumer discretionary), and very uncertain earnings (as in the case of the healthcare sector).
Overall, we intend to stay the course with our fundamental bets until there is more clarity as to the overall earnings and revenues in the domestic economy.
John Geewax and Bruce Terker
Geewax, Terker & Co.
| | |
| * | | Performance shown is that of Class A and is not reflective of sales charges. See the Total Return table on the next page for performance with sales charges. |
SUB-ADVISER:
Geewax, Terker & Co.
TOTAL NET ASSETS:
AS OF JUNE 30, 2007:
$4,003,802
Top Ten Holdings** (% of net assets)
| | | | | |
| Lufkin Industries, Inc. | | | 2.58 | % |
| Baldor Electric Co. | | | 2.46 | % |
| Aspreva Pharmaceuticals Corp. | | | 2.16 | % |
| KKR Financial Corp. | | | 1.94 | % |
| Corning, Inc. | | | 1.91 | % |
| Lindsay Corp. | | | 1.79 | % |
| Synaptics, Inc. | | | 1.79 | % |
| Procter & Gamble Co. | | | 1.77 | % |
| Trinity Industries, Inc. | | | 1.74 | % |
| Gardner Denver, Inc. | | | 1.70 | % |
| |
| % Fund Total | | | 19.84 | % |
| |
| | |
| ** | | Excludes Short-Term Investments |
6 | 2007 ANNUAL REPORT
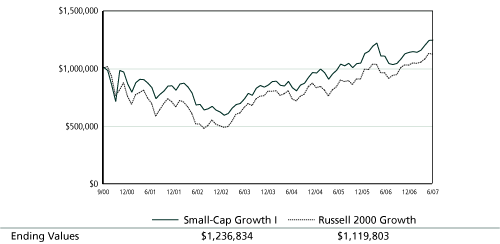
Quaker Small-Cap Growth Fund
Growth of a Hypothetical $1,000,000 Investment
June 30, 2007
Average Annualized Total Return
| | | | | | | | | | | | | | | | | | | | | | | | | | | | | | | | | |
| | | | | | | | | | | | | | | | | | | | | | | | | | | Commencement |
| | | Expense | | Inception | | | | | | | | | | | | | | | | | | of operations |
| | | Ratio | | Date | | One Year | | Five Year | | through 06/30/07 |
| | | | | | | | | | | with | | without | | with | | without | | with | | without |
| | | | | | | | | | | sales | | sales | | sales | | sales | | sales | | sales |
| | | | | | | | | | | charge | | charge | | charge | | charge | | charge | | charge |
| |
| Class A | | | 1.83 | % | | | 06/14/2001 | | | | 6.26 | % | | | 12.44 | % | | | 8.01 | % | | | 9.24 | % | | | 4.46 | % | | | 5.44 | % |
| Class B | | | 2.58 | % | | | 03/16/2001 | | | | 6.69 | % | | | 11.69 | % | | | 8.00 | % | | | 8.29 | % | | | 5.91 | % | | | 5.91 | % |
| Class C | | | 2.58 | % | | | 10/17/2001 | | | | 10.61 | % | | | 11.61 | % | | | 8.42 | % | | | 8.42 | % | | | 7.77 | % | | | 7.77 | % |
| Class I | | | 1.58 | % | | | 09/18/2000 | | | | 12.75 | % | | | 12.75 | % | | | 9.74 | % | | | 9.74 | % | | | 3.18 | % | | | 3.18 | % |
| Russell 2000 Growth Index* | | | | | | | | | | | 16.83 | % | | | 16.83 | % | | | 13.07 | % | | | 13.07 | % | | | 1.68 | % | | | 1.68 | % |
| | |
| * | | The benchmark since inception returns are calculated since commencement of September 18, 2000 through June 30, 2007. |
Performance data quoted represents past performance and is no guarantee of future results. Investment return and principal value will fluctuate so that shares, when redeemed, may be worth more or less than their original cost. Current performance may be lower or higher than performance data quoted. Performance data current to the most recent month end is available at www.quakerfunds.com or by calling us toll free at 1-800-220-8888. Total return includes reinvestment of dividends and capital gains.
Class A shares of the Funds have a maximum sales charge of 5.50%. Class B and Class C shares have maximum deferred sales charges of 5.00% and 1.00%, respectively.
The line graph and performance table do not reflect the deduction of taxes that a shareholder might pay on fund distributions or the redemption of fund shares. Total return calculations reflect expense reimbursements and fee waivers in the applicable periods. See financial highlights for periods where fees were waived or reimbursed. You cannot invest directly in an index.
The Fund’s portfolio holdings may differ significantly from the securities held in the index and, unlike a mutual fund, an unmanaged index assumes no transaction costs, taxes, management fees or other expenses.
The Russell 2000® Growth Index measures the performance of those Russell 2000 companies with higher price-to-book ratios and higher forecasted growth values.
2007 ANNUAL REPORT | 7
Performance Update
Quaker Capital Opportunities Fund (QUKTX, QCOBX, QCOCX)
Objectives and Principal Strategies
The Fund seeks to provide long-term capital growth. Current income is not a significant investment consideration and any such income realized will be considered incidental to the Fund’s investment objective. The Fund invests primarily in a limited number of securities which the Fund’s sub-adviser believes show a high probability for superior growth.
Performance Review and Market Outlook
For the twelve months ended June 30, 2007, the Fund underperformed the S&P 500, gaining 9.67%* vs. 20.59% for the S&P 500. As we predicted at the beginning of 2006, the economy experienced a significant slowdown during the past twelve months, as GDP growth moderated to just above a 2% pace in the second half of 2006 and barely registered any growth in the first quarter of 2007 (+0.7%). We believe that the correction in the housing market that is taking place will lead to a further retrenchment on the part of the consumer and this underpins our defensive positioning of the Fund during the period.
This defensive positioning, however, was not rewarded during the prior twelve months. Our overweightings in consumer staples and healthcare hampered our relative performance, and we had low exposure to some of the best-performing sectors, such as telecom and energy. We substantially reduced our energy holdings in mid-2006, feeling that the combination of record inventory levels of commodities, coupled with slowing demand, was not setting the stage for outperformance of the stocks in this sector. Our underexposure to the financial sector, however, was beneficial. Our concerns regarding credit-quality deterioration, the inverted yield curve, and the sub-prime mortgage fallout were confirmed as these factors weighed on many of the subgroups within the financial sector. Our overweighting of the materials sector was also advantageous. Additionally, our holdings in the industrial gases segment have exhibited excellent fundamentals and commensurate stock-price moves.
As the economy slows and the rate of corporate earnings growth weakens throughout 2007, we believe that the Fund’s emphasis on predictable, stable-growth companies will be justly rewarded. Additionally, the sharp increase in market volatility that we are now seeing has historically been favorable for high-quality stocks and those in “defensive” sectors —another potential tailwind for the Fund. While downside protection — the hallmark of the Knott Capital approach — has not been at a premium in the current market cycle, we believe it warrants even greater consideration in the months to come.
Charles A. Knott, J. Michael Barron, Peter M. Schofield,
CFA Knott Capital Management
| | |
| * | | Performance shown is that of Class A and is not reflective of sales charges. See the Total Return Table on the next page for performance with sales charges. |
SUB-ADVISER:
Knott Capital Management
TOTAL NET ASSETS:
AS OF JUNE 30, 2007:
$17,061,636
| | | | | |
| Top Ten Holdings** (% of net assets) |
| |
| Omnicom Group, Inc. | | | 4.28 | % |
| CVS Corp. | | | 4.27 | % |
| Textron, Inc. | | | 4.26 | % |
| Diageo PLC ADR | | | 4.10 | % |
| PepsiCo, Inc. | | | 4.07 | % |
| Colgate-Palmolive Co. | | | 3.88 | % |
| Praxair, Inc. | | | 3.84 | % |
| Teva Pharmaceutical Industries Ltd. ADR | | | 3.77 | % |
| Air Products & Chemicals, Inc. | | | 3.72 | % |
| UnitedHealth Group, Inc. | | | 3.72 | % |
| |
| % Fund Total | | | 39.91 | % |
| |
| | |
| ** | | Excludes Short-Term Investments |
8 | 2007 ANNUAL REPORT
Quaker Capital Opportunities Fund
Growth of a Hypothetical $10,000 Investment
June 30, 2007
Average Annualized Total Return
| | | | | | | | | | | | | | | | | | | | | | | | | | | | | | | | | |
| | | | | | | | | | | | | | | | | | | | | | | | | | | Commencement |
| | | Expense | | Inception | | | | | | | | | | | | | | | | | | of operations |
| | | Ratio | | Date | | One Year | | Five Year | | through 06/30/07 |
| | | | | | | | | | | with | | without | | with | | without | | with | | without |
| | | | | | | | | | | sales | | sales | | sales | | sales | | sales | | sales |
| | | | | | | | | | | charge | | charge | | charge | | charge | | charge | | charge |
| |
| Class A | | | 1.60 | % | | | 01/31/2002 | | | | 3.64 | % | | | 9.67 | % | | | 8.33 | % | | | 9.57 | % | | | 6.52 | % | | | 7.64 | % |
| Class B | | | 2.35 | % | | | 05/02/2002 | | | | 3.76 | % | | | 8.76 | % | | | 8.48 | % | | | 8.77 | % | | | 7.24 | % | | | 7.39 | % |
| Class C | | | 2.35 | % | | | 05/02/2002 | | | | 7.76 | % | | | 8.76 | % | | | 8.77 | % | | | 8.77 | % | | | 7.39 | % | | | 7.39 | % |
| S&P 500 Total Return Index* | | | | | | | | | | | 20.59 | % | | | 20.59 | % | | | 10.70 | % | | | 10.70 | % | | | 7.32 | % | | | 7.32 | % |
| | |
| * | | The benchmark since inception returns are calculated since commencement of January 31, 2002 through June 30, 2007. |
Performance data quoted represents past performance and is no guarantee of future results. Investment return and principal value will fluctuate so that shares, when redeemed, may be worth more or less than their original cost. Current performance may be lower or higher than performance data quoted. Performance data current to the most recent month end is available at www.quakerfunds.com or by calling us toll free at 1-800-220-8888. Total return includes reinvestment of dividends and capital gains.
Class A shares of the Funds have a maximum sales charge of 5.50%. Class B and Class C shares have maximum deferred sales charges of 5.00% and 1.00%, respectively.
The line graph and performance table do not reflect the deduction of taxes that a shareholder might pay on fund distributions or the redemption of fund shares. Total return calculations reflect expense reimbursements and fee waivers in the applicable periods. See financial highlights for periods where fees were waived or reimbursed.
The Fund’s portfolio holdings may differ significantly from the securities held in the index and, unlike a mutual fund, an unmanaged index assumes no transaction costs, taxes, management fees or other expenses. You cannot invest directly in an index.
The S&P 500® Total Return Index is a capitalization weighted index of 500 stocks designed to measure performance of the broad domestic economy through changes in the aggregate market value of 500 stocks representing all major industries.
2007 ANNUAL REPORT | 9
Performance Update
Quaker Biotech Pharma-Healthcare Fund (QBPAX, QBPBX, CBPCX)
Objectives and Principal Strategies
The Fund seeks to provide long-term capital appreciation. Current income is not a significant investment consideration and any such income realized will be considered incidental to the Fund’s investment objective. The Fund invests in stocks of companies that have attractive growth prospects resulting from leading edge product research and development that are engaged in the development, production or distribution of biotechnology, healthcare and pharmaceutical products and services.
Performance Review and Market Outlook
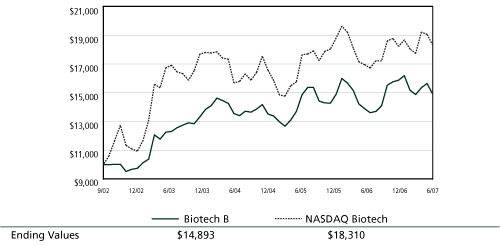
Biotech stocks, up 8.05% over the twelve months ended June 30, 2007 as measured by the NASDAQ Biotechnology Index (“NBI”), have not faired as well as the broader markets because of investor, political and regulatory concerns and focus on other market sectors. Despite these short- to mid-term issues, we believe the long-term prospects for the industry remain solid.
For the twelve months ended June 30, 2007, the Quaker Biotech Pharma-Healthcare Fund’s performance was 9.51%*. This performance was achieved with a volatility about 25% lower than that of the NBI.
Beginning with the Democratic congressional victory in November, investor concerns focused largely on political and regulatory developments. It is our belief that significantly adverse changes to the biotech industry will not be achievable unilaterally by the current Congress. The re-authorization of the Prescription Drug User Fee Act is on track for its September 2007 deadline — a positive for the sector. And finally, noise on biogenerics — a variety of competing biogeneric bills working their way through Congress — has intensified. Our expectation is that the effects of generics on biologic drugs will be significantly more muted as compared to their chemical generic counterparts.
We believe that the solid long-term prospects for the biotech industry are reinforced by a number of issues. First, valuations, at ten-year historic lows for both large-cap and mid-cap biotech companies, are very attractive. This was reinforced by a particularly heated merger & acquisition environment over the last twelve months with deals such as Merck buying RNAi technology company Sirna for a 100% premium and AstraZeneca buying biotech large cap MedImmune for a 50% premium. In addition, the industry has continued to demonstrate significant productivity in getting new treatments approved for significant unmet medical needs. A few examples include Alexion’s Soliris (for a rare blood disorder, Paroxysmal nocturnal hemoglobinuria), Gilead’s Letairis (for pulmonary arterial hypertension) and Atripla (for HIV), and Speedel’s Tekturna (for hypertension). All represent significant advances over current standard of care.
We expect these positive trends to continue. We believe sales and earnings growth should continue to grow at double digits for the next few years. We believe that the potential for long-term outperformance of the biotech industry is also supported by demographics — the aging population and their increased drug utilization — as well as therapeutic innovation to ease the fiscal pressure of disease management.
Michael Sjöström, CFA, Chief Investment Officer
Stephan Patten, CFA, Portfolio Manager
Sectoral Asset Management, Inc.
| | |
| * | | Performance shown is that of Class A and is not reflective of sales charges. See the Total Return Table on the next page for performance with sales charges. |
SUB-ADVISER:
Sectoral Asset Management, Inc.
TOTAL NET ASSETS:
AS OF JUNE 30, 2007:
$9,927,296
| | | | | |
| Top Ten Holdings** (% of net assets) |
| |
| Genzyme Corp. | | | 6.15 | % |
| Cardiome Pharma Corp. | | | 5.16 | % |
| Progenics Pharmaceuticals, Inc. | | | 5.14 | % |
| CV Therapeutics, Inc. | | | 5.04 | % |
| Celgene Corp. | | | 5.02 | % |
| Biogen Idec, Inc. | | | 4.32 | % |
| Gilead Sciences, Inc. | | | 4.10 | % |
| Illumina, Inc. | | | 3.93 | % |
| Allergan, Inc. | | | 3.80 | % |
| Momenta Pharmaceuticals, Inc. | | | 3.43 | % |
| |
| % Fund Total | | | 46.09 | % |
| |
| | |
| ** | | Excludes Short-Term Investments |
10 | 2007 ANNUAL REPORT
Quaker Biotech Pharma-Healthcare Fund
Growth of a Hypothetical $10,000 Investment
June 30, 2007
Average Annualized Total Return
| | | | | | | | | | | | | | | | | | | | | | | | | |
| | | | | | | | | | | | | | | | | | | Commencement |
| | | Expense | | Inception | | | | | | | | | | of operations |
| | | Ratio | | Date | | One Year | | through 06/30/07 |
| | | | | | | | | | | with | | without | | with | | without |
| | | | | | | | | | | sales | | sales | | sales | | sales |
| | | | | | | | | | | charge | | charge | | charge | | charge |
| |
| Class A | | | 2.04 | % | | | 10/14/2002 | | | | 3.49 | % | | | 9.51 | % | | | 8.61 | % | | | 9.93 | % |
| Class B | | | 2.79 | % | | | 09/23/2002 | | | | 3.75 | % | | | 8.67 | % | | | 8.71 | % | | | 9.01 | % |
| Class C | | | 2.79 | % | | | 11/20/2002 | | | | 7.69 | % | | | 8.67 | % | | | 9.31 | % | | | 9.31 | % |
NASDAQ Biotechnology Index®* | | | | | | | | | | | 8.05 | % | | | 8.05 | % | | | 13.52 | % | | | 13.52 | % |
| * | | The benchmark since inception returns are calculated since commencement of September 23, 2002 through June 30, 2007. |
Performance data quoted represents past performance and is no guarantee of future results. Investment return and principal value will fluctuate so that shares, when redeemed, may be worth more or less than their original cost. Current performance may be lower or higher than performance data quoted. Performance data current to the most recent month end is available at www.quakerfunds.com or by calling us toll free at 1-800-220-8888. Total return includes reinvestment of dividends and capital gains.
Class A shares of the Funds have a maximum sales charge of 5.50%. Class B and Class C shares have maximum deferred sales charges of 5.00% and 1.00%, respectively.
The line graph and performance table do not reflect the deduction of taxes that a shareholder might pay on fund distributions or the redemption of fund shares. Total return calculations reflect expense reimbursements and fee waivers in the applicable periods. See financial highlights for periods where fees were waived or reimbursed.
The Fund’s portfolio holdings may differ significantly from the securities held in the index and, unlike a mutual fund, an unmanaged index assumes no transaction costs, taxes, management fees or other expenses. You cannot invest directly in an index.
The NASDAQ Biotechnology® Index is a widely recognized, unmanaged index. It contains companies primarily engaged in using biomedical research for the discovery or development of novel treatments or cures for human disease which also meet other eligibility criteria. The NASDAQ Biotechnology® Index is calculated under a modified capitalization-weighted methodology.
2007 ANNUAL REPORT | 11
Performance Update
Quaker Mid-Cap Value Fund (QMCVX, QMCBX, QMCCX, QMVIX)
Objectives and Principal Strategies
The Fund seeks to provide long-term capital growth. Current income is not a significant investment consideration and any such income realized will be considered incidental to the Fund’s investment objective. The Fund invests primarily in common stocks with market capitalizations comparable to those of the companies included in the Russell MidCap® Value Index.
Performance Review and Market Outlook
The Quaker Mid-Cap Value Fund ended its fiscal year on June 30, 2007 with a return of 14.51%* versus 22.09% for the benchmark Russell MidCap® Value Index. The Fund suffered a difficult second half of 2006 like so many other funds, as the end of 17 continuous interest rate hikes by the Federal Reserve Bank signaled the economy was slowing and a recession was looming, based on historical experience, in nine to twelve months. Twelve months have passed, however, and there is no indication of a recession as far as we can see.
With the perception of a softening economy on the horizon, many top-down equity managers played defense and moved to overweight positions in utility and consumer staples companies during the third and fourth quarters of 2006. However, we believed that most utility stocks were not worthy of high-quality ratings because they had high debt-to-equity ratios and very low profit margins. Moreover we believed that valuations were a problem in the consumer staples universe. Consequently, we underweighted the Fund’s exposure to the sectors and focused on high-quality stocks that were undervalued, but with what we believed were improving business prospects. Unfortunately, utility and consumer staples companies outperformed during the second half of 2006 and were a principal reason for the Fund’s underperformance during that period.
During the reporting period, we continued to maintain a portfolio that was focused on the global economy and held overweight sector positions in industrials, materials, and technology, market weightings in healthcare, energy, and financials while underweighting consumer and utility stocks. The underweight in utility and consumer staples stocks that detracted from the Fund’s performance the latter half of 2006 helped in 2007 as the majority of the Fund’s 14.51% return is attributable to its performance during the first and second quarter of 2007.
Currently, we believe that a tremendous opportunity exists as the relative price to value ratio for high quality companies compared to all companies is 0.45. This is the lowest relative valuation in 33 years. If ever there was a bubble, we believe it is in the mis-pricing of low-quality companies. Looking ahead, the global economy is still dependent on tight supplies in oil, materials, and industrial products. Domestically, we believe we are entering into a growth phase for technology. There will most likely continue to be “headline” risk with respect to oil, defense stocks, and healthcare, but in the end, we believe that the Fed may have orchestrated a near perfect performance with domestic secular growth being aided by demand for raw materials and by emerging markets demand for U.S. goods and services. We expect that earnings will continue to be helped by the weak dollar.
Anthony Soslow, CFA, Philip Mendelsohn, CFA, and John Hammerschmidt Global Capital Management, Inc.
| | |
| * | | Performance shown is that of Class A and is not reflective of sales charges. See the Total Return Table on the next page for performance with sales charges. |
SUB-ADVISER:
Global Capital Management, Inc.
TOTAL NET ASSETS:
AS OF JUNE 30, 2007:
$154,829,808
Top Ten Holdings** (% of net assets)
| | | | | |
| L-3 Communication Holdings, Inc. | | | 3.77 | % |
| Johnson Controls, Inc. | | | 3.74 | % |
| Trinity Industries, Inc. | | | 3.52 | % |
| Altera Corp. | | | 3.47 | % |
| AMBAC Financial Group, Inc. | | | 3.38 | % |
| Barr Pharmaceuticals, Inc. | | | 3.24 | % |
| Philadelphia Consolidated Holding Corp. | | | 3.24 | % |
| HCC Insurance Holdings, Inc. | | | 3.24 | % |
| Maxim Integrated Products, Inc. | | | 3.24 | % |
| Parker Hannifin Corp. | | | 3.16 | % |
| |
| % Fund Total | | | 34.00 | % |
| |
| | |
| ** | | Excludes Short-Term Investments |
12 | 2007 ANNUAL REPORT
Quaker Mid-Cap Value Fund
Growth of a Hypothetical $10,000 Investment
June 30, 2007
Average Annualized Total Return
| | | | | | | | | | | | | | | | | | | | | | | | | | | | | | | | | |
| | | | | | | | | | | | | | | | | | | | | | | | | | | Commencement | |
| | | Expense | | | Inception | | | | | | | | | | | | | | | | | | | of operations | |
| | | Ratio | | | Date | | | One Year | | | Five Year | | | through 06/30/07 | |
| | | | | | | | | | | with | | | without | | | with | | | without | | | with | | | without | |
| | | | | | | | | | | sales | | | sales | | | sales | | | sales | | | sales | | | sales | |
| | | | | | | | | | | charge | | | charge | | | charge | | | charge | | | charge | | | charge | |
| |
| Class A | | | 1.69 | % | | | 12/31/1997 | | | | 8.22 | % | | | 14.51 | % | | | 13.97 | % | | | 15.27 | % | | | 9.66 | % | | | 10.31 | % |
| Class B | | | 2.44 | % | | | 01/05/2001 | | | | 8.72 | % | | | 13.72 | % | | | 14.22 | % | | | 14.45 | % | | | 13.51 | % | | | 13.51 | % |
| Class C | | | 2.44 | % | | | 07/31/2000 | | | | 12.67 | % | | | 13.67 | % | | | 14.41 | % | | | 14.41 | % | | | 13.02 | % | | | 13.02 | % |
| Class I | | | 1.44 | % | | | 11/21/2000 | | | | 14.85 | % | | | 14.85 | % | | | 15.58 | % | | | 15.58 | % | | | 14.90 | % | | | 14.90 | % |
| Russell Midcap Value Index* | | | | | | | | | | | 22.09 | % | | | 22.09 | % | | | 17.16 | % | | | 17.16 | % | | | 11.89 | % | | | 11.89 | % |
| | |
| * | | The benchmark since inception returns are calculated since commencement of December 31, 1997 through June 30, 2007. |
Performance data quoted represents past performance and is no guarantee of future results. Investment return and principal value will fluctuate so that shares, when redeemed, may be worth more or less than their original cost. Current performance may be lower or higher than performance data quoted. Performance data current to the most recent month end is available at www.quakerfunds.com or by calling us toll free at 1-800-220-8888. Total return includes reinvestment of dividends and capital gains.
Class A shares of the Funds have a maximum sales charge of 5.50%. Class B and Class C shares have maximum deferred sales charges of 5.00% and 1.00%, respectively.
The line graph and performance table do not reflect the deduction of taxes that a shareholder might pay on fund distributions or the redemption of fund shares. Total return calculations reflect expense reimbursements and fee waivers in the applicable periods. See financial highlights for periods where fees were waived or reimbursed.
The Fund’s portfolio holdings may differ significantly from the securities held in the index and, unlike a mutual fund, an unmanaged index assumes no transaction costs, taxes, management fees or other expenses. You cannot invest directly in an index.
The Russell Midcap Value® Index measures the performance of those Russell Midcap companies with lower price-to-book ratios and lower forecasted growth values. The stocks are also members of the Russell 1000 Value® Index.
2007 ANNUAL REPORT | 13
Performance Update
Quaker Small-Cap Value Fund (QUSVX, QSVBX, QSVCX, QSVIX)
Objectives and Principal Strategies
The Fund seeks to provide long-term capital growth. Current income is not a significant investment consideration and any such income realized will be considered incidental to the Fund’s investment objective. The Fund invests primarily in equity securities of domestic U.S. Companies with market capitalizations similar to the market capitalizations of companies included in the Russell 2000® Index and Russell 2500® Index. The Fund invests in companies considered by the Fund’s sub-adviser to have consistent earnings and above-average core assets, selling at relatively low market valuations, with attractive growth and momentum characteristics.
Performance Review and Market Outlook
The Fund had a good year in both absolute and relative terms. For the year ended June 30, 2007, the Fund’s performance was 18.22%*, while the Fund’s benchmark, the Russell 2000 Index (a broad-based cross-section of the entire U.S. small-cap market), returned 16.43%. Working from the bottom up, we evaluate companies relative to their industry peers using three broad categories of attractiveness: value, management, and momentum. Value to us means fairly traditional ratios of price to fundamental value, management measures seek evidence that company management has and will continue to produce earning power, and momentum helps us determine when stocks might be expected to begin the ascent toward full valuation.
Our assessment of value (specifically, companies that are cheap compared to their operating or future earnings) and our take on management (leaning towards companies that repurchase shares and have generated a positive long-run return on assets) contributed the most to our outperformance. Examining the year’s results from a different viewpoint, consumers’ appetite for buffalo wings (Buffalo Wild Wings Corp.) and UGG and TEVA brand shoes (Deckers Outdoor Corp) combined with the performance of our picks in the energy sector helped us overcome some disappointments in the technology and capital goods sectors. Finally, our long-standing bet against the real estate industry has recently been vindicated.
AJO is disciplined and value-oriented, maintaining a fully-invested, well-diversified portfolio of small-cap stocks. The economic outlook — ours or anyone else’s — plays no role in the Fund’s structure; instead, our work seeks well-managed companies with quality cash profits, relatively low market valuations, and positive price and earnings momentum. As we search for opportunities, we keep a keen eye on minimizing transaction costs.
Theodore Aronson, Kevin J. Johnson and Martha E. Ortiz
Aronson+Johnson+Ortiz, LP
| | |
| * | | Performance shown is that of Class A and is not reflective of sales charges. See the Total Return Table on the next page for performance with sales charges. |
SUB-ADVISER:
Aronson+Johnson+Ortiz, LP
TOTAL NET ASSETS:
AS OF JUNE 30, 2007:
$91,384,050
| | | | | |
| Top Ten Holdings** (% of net assets) |
| |
| Dade Behring, Inc. | | | 1.00 | % |
| ITT Educational Services, Inc. | | | 0.99 | % |
| Holly Corp. | | | 0.96 | % |
| Deckers Outdoor Corp. | | | 0.95 | % |
| United Stationers, Inc. | | | 0.94 | % |
| Hillenbrand Industries, Inc. | | | 0.94 | % |
| Jones Lang LaSalle, Inc. | | | 0.93 | % |
| Novatel Wireless, Inc. | | | 0.92 | % |
| A.G. Edwards, Inc. | | | 0.92 | % |
| Alliant Techsystems, Inc. | | | 0.89 | % |
| |
| % Fund Total | | | 9.44 | % |
| |
| | |
| ** | | Excludes Short-Term Investments |
14 | 2007 ANNUAL REPORT
Quaker Small-Cap Value Fund
Growth of a Hypothetical $10,000 Investment
June 30, 2007
Average Annualized Total Return
| | | | | | | | | | | | | | | | | | | | | | | | | | | | | | | | | | | | | | | | | |
| | | | | | | | | | | | | | | | | | | | | | | | | | | | | | | | | | | Commencement |
| | | Expense | | Inception | | | | | | | | | | | | | | | | | | | | | | | | | | of operations |
| | | Ratio | | Date | | One Year | | Five Year | | Ten Year | | through 06/30/07 |
| | | | | | | | | | | with | | without | | with | | without | | with | | without | | with | | without |
| | | | | | | | | | | sales | | sales | | sales | | sales | | sales | | sales | | sales | | sales |
| | | | | | | | | | | charge | | charge | | charge | | charge | | charge | | charge | | charge | | charge |
| |
| Class A | | | 1.83 | % | | | 11/25/1996 | | | | 11.72 | % | | | 18.22 | % | | | 14.92 | % | | | 16.23 | % | | | 12.56 | % | | | 13.20 | % | | | 13.79 | % | | | 14.39 | % |
| Class B | | | 2.58 | % | | | 11/14/2000 | | | | 12.31 | % | | | 17.31 | % | | | 15.12 | % | | | 15.34 | % | | | n/a | | | | n/a | | | | 14.00 | % | | | 14.00 | % |
| Class C | | | 2.58 | % | | | 07/28/2000 | | | | 16.38 | % | | | 17.38 | % | | | 15.40 | % | | | 15.40 | % | | | n/a | | | | n/a | | | | 14.86 | % | | | 14.86 | % |
| Class I | | | 1.58 | % | | | 09/12/2000 | | | | 18.44 | % | | | 18.44 | % | | | 16.50 | % | | | 16.50 | % | | | n/a | | | | n/a | | | | 14.39 | % | | | 14.39 | % |
| Russell 2000 Index* | | | | | | | | | | | 16.43 | % | | | 16.43 | % | | | 13.87 | % | | | 13.87 | % | | | 9.05 | % | | | 9.05 | % | | | 9.85 | % | | | 9.85 | % |
| | |
| * | | The benchmark since inception returns are calculated since commencement of November 25, 1996 through June 30, 2007. |
Performance data quoted represents past performance and is no guarantee of future results. Investment return and principal value will fluctuate so that shares, when redeemed, may be worth more or less than their original cost. Current performance may be lower or higher than performance data quoted. Performance data current to the most recent month end is available at www.quakerfunds.com or by calling us toll free at 1-800-220-8888. Total return includes reinvestment of dividends and capital gains.
Class A shares of the Funds have a maximum sales charge of 5.50%. Class B and Class C shares have maximum deferred sales charges of 5.00% and 1.00%, respectively.
The line graph and performance table do not reflect the deduction of taxes that a shareholder might pay on fund distributions or the redemption of fund shares. Total return calculations reflect expense reimbursements and fee waivers in the applicable periods. See financial highlights for periods where fees were waived or reimbursed.
The Fund’s portfolio holdings may differ significantly from the securities held in the index and, unlike a mutual fund, an unmanaged index assumes no transaction costs, taxes, management fees or other expenses. You cannot invest directly in an index.
The Russell 2000® Index is a widely recognized unmanaged index comprised of the smallest 2000 companies represented in the Russell 3000® Index. The Index currently represents approximately 8% of the market capitalization of the Russell 3000® Index.
2007 ANNUAL REPORT | 15
Performance Update
Quaker Core Value Fund (QUGTX)
Objectives and Principal Strategies
The Fund seeks to provide long-term capital appreciation through the prudent investment in securities issued by companies considered by the sub-adviser to be “value” oriented companies. Current income is not a significant investment consideration and any such income realized will be considered incidental to the Fund’s investment objective.
Performance Review and Market Outlook
This past fiscal year was difficult for the Fund. Our portfolio returned 16.21%* versus 21.87% for the Russell 1000® Value Index for the twelve-months ended June 30, 2007. Our approach to valuation, growth-at-a-reasonable-price, was not rewarded, whereas, low price-to-book and low price-to-earnings were rewarded, irrespective of their future prospects. Our approach led us to have good earnings surprises and visibility at a reasonable price, but these companies were not rewarded for surprising the marketplace. It was a year that was divided into two separate markets. The first covered the second half of 2006, where undervalued stocks with decent earnings did not perform as well as stocks with just average to negative earnings. This began to reverse itself during the first half of 2007, with valuation being rewarded and negative earnings being punished. By staying the course, we avoided being whipsawed by chasing the most recent best performers.
Currently, the Fund’s portfolio of investments is structured towards the capital equipment/investment sector of the economy, and away from the consumer sector of the economy. We believe the consumer sector seems to be decelerating, while the capital equipment and economically sensitive sectors have global demand helping to support revenue growth of these sectors. The global demand for U.S. style investment banking/capital market products also allows us to have an overweight in the financial sector. Likewise, a declining outlook for the healthcare sector has led us to underweight this group. Our emphasis remains to be on a growth-at-a-reasonable-price strategy, a strategy we have not deviated from over the past five years. Given valuations and the current rate of interest, we will continue to seek earnings growth for the Fund’s portfolio, without paying too much for it.
We plan on staying with the current orientation until revenue/earnings estimates start changing by theme or sector. With the high uncertainty in the marketplace currently, we believe the prudent policy is to not overpay for expectations.
John Geewax and Bruce Terker
Geewax, Terker & Co.
| | |
| * | | Performance shown is that of Class A and is not reflective of sales charges. See the Total Return Table on the next page for performance with sales charges. |
SUB-ADVISER:
Geewax, Terker & Co.
TOTAL NET ASSETS:
AS OF JUNE 30, 2007:
$3,375,227
| | | | | |
| Top Ten Holdings** (% of net assets) |
| General Electric Co. | | | 5.10 | % |
| Procter & Gamble Co. | | | 4.46 | % |
| Google, Inc. | | | 3.57 | % |
| Dun & Bradstreet Corp. | | | 3.05 | % |
| Oshkosh Truck Corp. | | | 2.87 | % |
| AT&T, Inc. | | | 2.58 | % |
| Merrill Lynch & Co., Inc. | | | 2.35 | % |
| Apple, Inc. | | | 2.32 | % |
| Credit Suisse Group ADR | | | 2.31 | % |
| Praxair, Inc. | | | 2.13 | % |
| |
| %Fund Total | | | 30.74 | % |
| |
| | |
| ** | | Excludes Short-Term Investments |
16 | 2007 ANNUAL REPORT
Quaker Core Value Fund
Growth of a Hypothetical $10,000 Investment
June 30, 2007
Average Annualized Total Return
| | | | | | | | | | | | | | | | | | | | | | | | | | | | | | | | | |
| | | | | | | | | | | | | | | | | | | | | | | | | | | Commencement |
| | | Expense | | Inception | | | | | | | | | | | | | | | | | | of operations |
| | | Ratio | | Date | | One Year | | Five Year | | through 06/30/07 |
| | | | | | | with | | without | | with | | without | | with | | without |
| | | | | | | sales | | sales | | sales | | sales | | sales | | sales |
| | | | | | | charge | | charge | | charge | | charge | | charge | | charge |
| |
| Class A | | | 1.89 | % | | | 03/26/2002 | | | | 9.82 | % | | | 16.21 | % | | | 13.07 | % | | | 14.35 | % | | | 10.81 | % | | | 12.01 | % |
| Russell 1000 Value Index* | | | | | | | | | | | 21.87 | % | | | 21.87 | % | | | 13.31 | % | | | 13.31 | % | | | 10.89 | % | | | 10.89 | % |
| | |
| * | | The benchmark since inception returns are calculated since commencement of March 26, 2002 through June 30, 2007. |
Performance data quoted represents past performance and is no guarantee of future results. Investment return and principal value will fluctuate so that shares, when redeemed, may be worth more or less than their original cost. Current performance may be lower or higher than performance data quoted. Performance data current to the most recent month end is available at www.quakerfunds.com or by calling us toll free at 1-800-220-8888. Total return includes reinvestment of dividends and capital gains.
Class A shares of the Funds have a maximum sales charge of 5.50%.
The line graph and performance table do not reflect the deduction of taxes that a shareholder might pay on fund distributions or the redemption of fund shares. Total return calculations reflect expense reimbursements and fee waivers in the applicable periods. See financial highlights for periods where fees were waived or reimbursed.
The Fund’s portfolio holdings may differ significantly from the securities held in the index and, unlike a mutual fund, an unmanaged index assumes no transaction costs, taxes, management fees or other expenses. You cannot invest directly in an index.
The Russell 1000® Value Index is a widely recognized, unmanaged market capitalization index comprised of the largest 1000 companies represented in the Russell 3000® Index. The Index currently represents approximately 92% of the market capitalization of the Russell 3000® Index. The Russell 1000® Value Index measures the performance of those companies with lower price-to-book ratios and lower forecasted growth values.
2007 ANNUAL REPORT | 17
Expense Information
As a shareholder of the Fund, you incur two types of costs: (1) transaction costs, including applicable sales charges and redemption fees; and (2) ongoing costs, including management fees, distribution (12b-1) fees and other Fund expenses. This example is intended to help you understand your ongoing costs (in dollars) of investing in the Fund and to compare these costs with the ongoing costs of investing in other funds. The example is based on an investment of $1,000 invested at the beginning of the (six-month) period and held for the entire period January 1, 2007 through June 30, 2007.
Actual Expenses
The first section of each table below provides information about actual account values and actual expenses for each of the Funds. You may use this information, together with the amount you invested, to estimate the expenses that you paid over the period. Simply divide your account value by $1,000 (for example, an $8,600 account value divided by $1,000 = 8.6), then multiply the result by the number in the applicable line under the heading entitled “Expenses Paid During the Period’’ to estimate the expenses you paid on your account during this period.
Hypothetical Example For Comparison Purposes
The second section of each table below provides information about hypothetical account values and hypothetical expenses based on the Fund’s actual expense ratio and an assumed rate of return of 5% per year before expenses, which is not the Fund’s actual return. The hypothetical account values and expenses may not be used to estimate the actual ending account balance or expenses you paid for the period. You may use this information to compare the ongoing costs of investing in the Fund to other funds. To do so, compare this 5% hypothetical example with the 5% hypothetical examples that appear in the shareholder reports of the other funds. Please note that the expenses shown in the table are meant to highlight your ongoing costs only and do not reflect any transactional costs, such as sales charges (loads), redemption fees or exchange fees. Therefore, the second section of the table is useful in comparing ongoing costs only, and will not help you determine the relative total costs of owning different funds. In addition, if these transactional costs were included, your costs would have been higher.
| | | | | | | | | | | | | | | | | | | | | |
| | | | | | | Beginning Account | | Annualized Expense | | Ending Account | | Expenses Paid |
| | | | | | | Value 01/01/07 | | Ratio For the Period | | Value 06/30/07 | | During the Period* |
| |
| Quaker Strategic Growth Fund | | | | | | | | | | | | | | | | |
| | | | | | | | | | | | | | | | | | | | | |
| Actual return based on actual return of: | | | | | | | | | | | | |
| Class A | | | 15.67 | % | | $ | 1,000.00 | | | | 1.91 | % | | $ | 1,156.70 | | | $ | 10.21 | |
| Class B | | | 15.27 | % | | | 1,000.00 | | | | 2.66 | % | | | 1,152.70 | | | | 14.20 | |
| Class C | | | 15.29 | % | | | 1,000.00 | | | | 2.66 | % | | | 1,152.90 | | | | 14.20 | |
| Class I | | | 15.80 | % | | | 1,000.00 | | | | 1.66 | % | | | 1,158.00 | | | | 8.88 | |
| |
| | | | | | | | | | | | | | | | | | | | | |
| Hypothetical return based on assumed 5% return | | | | | | | | | | | | |
| Class A | | | | | | | 1,000.00 | | | | 1.91 | % | | | 1,015.32 | | | | 9.54 | |
| Class B | | | | | | | 1,000.00 | | | | 2.66 | % | | | 1,011.60 | | | | 13.27 | |
| Class C | | | | | | | 1,000.00 | | | | 2.66 | % | | | 1,011.60 | | | | 13.27 | |
| Class I | | | | | | | 1,000.00 | | | | 1.66 | % | | | 1,016.56 | | | | 8.30 | |
| |
| | | | | | | | | | | | | | | | | | | | | |
| Quaker Core Equity Fund | | | | | | | | | | | | | | | | |
| | | | | | | | | | | | | | | | | | | | | |
| Actual return based on actual return of: | | | | | | | | | | | | |
| Class A | | | 9.51 | % | | | 1,000.00 | | | | 1.83 | % | | | 1,095.10 | | | | 9.51 | |
| Class B | | | 9.06 | % | | | 1,000.00 | | | | 2.58 | % | | | 1,090.60 | | | | 13.37 | |
| Class C | | | 9.12 | % | | | 1,000.00 | | | | 2.58 | % | | | 1,091.20 | | | | 13.38 | |
| Class I | | | 9.56 | % | | | 1,000.00 | | | | 1.58 | % | | | 1,095.60 | | | | 8.21 | |
| |
| | | | | | | | | | | | | | | | | | | | | |
| Hypothetical return based on assumed 5% return | | | | | | | | | | | | |
| Class A | | | | | | | 1,000.00 | | | | 1.83 | % | | | 1,015.72 | | | | 9.15 | |
| Class B | | | | | | | 1,000.00 | | | | 2.58 | % | | | 1,012.00 | | | | 12.87 | |
| Class C | | | | | | | 1,000.00 | | | | 2.58 | % | | | 1,012.00 | | | | 12.87 | |
| Class I | | | | | | | 1,000.00 | | | | 1.58 | % | | | 1,016.96 | | | | 7.90 | |
| |
18 | 2007 ANNUAL REPORT
| | | | | | | | | | | | | | | | | | | | | |
| | | | | | | Beginning Account | | Annualized Expense | | Ending Account | | Expenses Paid |
| | | | | | | Value 01/01/07 | | Ratio For the Period | | Value 06/30/07 | | During the Period* |
| |
| Quaker Small-Cap Growth Fund | | | | | | | | | | | | | | | | |
| | | | | | | | | | | | | | | | | | | | | |
| Actual return based on actual return of: | | | | | | | | | | | | |
| Class A | | | 9.42 | % | | $ | 1,000.00 | | | | 2.31 | % | | $ | 1,094.20 | | | $ | 11.99 | |
| Class B | | | 8.97 | % | | | 1,000.00 | | | | 3.06 | % | | | 1,089.70 | | | | 15.85 | |
| Class C | | | 9.02 | % | | | 1,000.00 | | | | 3.06 | % | | | 1,090.20 | | | | 15.86 | |
| Class I | | | 9.50 | % | | | 1,000.00 | | | | 2.06 | % | | | 1,095.00 | | | | 10.70 | |
| |
| | | | | | | | | | | | | | | | | | | | | |
| Hypothetical return based on assumed 5% return | | | | | | | | | | | | |
| Class A | | | | | | | 1,000.00 | | | | 2.31 | % | | | 1,013.34 | | | | 11.53 | |
| Class B | | | | | | | 1,000.00 | | | | 3.06 | % | | | 1,009.62 | | | | 15.25 | |
| Class C | | | | | | | 1,000.00 | | | | 3.06 | % | | | 1,009.62 | | | | 15.25 | |
| Class I | | | | | | | 1,000.00 | | | | 2.06 | % | | | 1,014.58 | | | | 10.29 | |
| |
| | | | | | | | | | | | | | | | | | | | | |
| Quaker Capital Opportunities Fund | | | | | | | | | | | | | | | | |
| | | | | | | | | | | | | | | | | | | | | |
| Actual return based on actual return of: | | | | | | | | | | | | |
| Class A | | | 5.71 | % | | | 1,000.00 | | | | 1.81 | % | | | 1,057.10 | | | | 9.23 | |
| Class B | | | 5.20 | % | | | 1,000.00 | | | | 2.56 | % | | | 1,052.00 | | | | 13.02 | |
| Class C | | | 5.30 | % | | | 1,000.00 | | | | 2.56 | % | | | 1,053.00 | | | | 13.03 | |
| |
| | | | | | | | | | | | | | | | | | | | | |
| Hypothetical return based on assumed 5% return | | | | | | | | | | | | |
| Class A | | | | | | | 1,000.00 | | | | 1.81 | % | | | 1,015.82 | | | | 9.05 | |
| Class B | | | | | | | 1,000.00 | | | | 2.56 | % | | | 1,012.10 | | | | 12.77 | |
| Class C | | | | | | | 1,000.00 | | | | 2.56 | % | | | 1,012.10 | | | | 12.77 | |
| |
| | | | | | | | | | | | | | | | | | | | | |
| Quaker Biotech Pharma-Healthcare Fund | | | | | | | | | | | | |
| | | | | | | | | | | | | | | | | | | | | |
| Actual return based on actual return of: | | | | | | | | | | | | |
| Class A | | | (4.52 | )% | | $ | 1,000.00 | | | | 2.38 | % | | | 954.80 | | | | 11.54 | |
| Class B | | | (4.85 | )% | | | 1,000.00 | | | | 3.13 | % | | | 951.50 | | | | 15.14 | |
| Class C | | | (4.85 | )% | | | 1,000.00 | | | | 3.13 | % | | | 951.50 | | | | 15.14 | |
| |
| | | | | | | | | | | | | | | | | | | | | |
| Hypothetical return based on assumed 5% return | | | | | | | | | | | | |
| Class A | | | | | | | 1,000.00 | | | | 2.38 | % | | | 1,012.99 | | | | 11.88 | |
| Class B | | | | | | | 1,000.00 | | | | 3.13 | % | | | 1,009.27 | | | | 15.59 | |
| Class C | | | | | | | 1,000.00 | | | | 3.13 | % | | | 1,009.27 | | | | 15.59 | |
| |
| | | | | | | | | | | | | | | | | | | | | |
| Quaker Mid-Cap Value Fund | | | | | | | | | | | | | | | | |
| | | | | | | | | | | | | | | | | | | | | |
| Actual return based on actual return of: | | | | | | | | | | | | |
| Class A | | | 9.65 | % | | | 1,000.00 | | | | 1.63 | % | | | 1,096.50 | | | | 8.47 | |
| Class B | | | 9.30 | % | | | 1,000.00 | | | | 2.38 | % | | | 1,093.00 | | | | 12.35 | |
| Class C | | | 9.18 | % | | | 1,000.00 | | | | 2.38 | % | | | 1,091.80 | | | | 12.34 | |
| Class I | | | 9.83 | % | | | 1,000.00 | | | | 1.38 | % | | | 1,098.30 | | | | 7.18 | |
| |
| | | | | | | | | | | | | | | | | | | | | |
| Hypothetical return based on assumed 5% return | | | | | | | | | | | | |
| Class A | | | | | | | 1,000.00 | | | | 1.63 | % | | | 1,016.71 | | | | 8.15 | |
| Class B | | | | | | | 1,000.00 | | | | 2.38 | % | | | 1,012.99 | | | | 11.88 | |
| Class C | | | | | | | 1,000.00 | | | | 2.38 | % | | | 1,012.99 | | | | 11.88 | |
| Class I | | | | | | | 1,000.00 | | | | 1.38 | % | | | 1,017.95 | | | | 6.90 | |
| |
2007 ANNUAL REPORT | 19
Expense Information
| | | | | | | | | | | | | | | | | | | | | |
| | | | | | | Beginning Account | | Annualized Expense | | Ending Account | | Expenses Paid |
| | | | | | | Value 01/01/07 | | Ratio For the Period | | Value 06/30/07 | | During the Period* |
| |
Quaker Small-Cap Value Fund | | | | | | | | | | | | | | | | | | | | |
| | | | | | | | | | | | | | | | | | | | | |
Actual return based on actual return of: | | | | | | | | | | | | | | | | | | | | |
| Class A | | | 9.23 | % | | $ | 1,000.00 | | | | 1.73 | % | | $ | 1,092.30 | | | $ | 8.97 | |
| Class B | | | 8.82 | % | | | 1,000.00 | | | | 2.48 | % | | | 1,088.20 | | | | 12.84 | |
| Class C | | | 8.87 | % | | | 1,000.00 | | | | 2.48 | % | | | 1,088.70 | | | | 12.84 | |
| Class I | | | 9.34 | % | | | 1,000.00 | | | | 1.48 | % | | | 1,093.40 | | | | 7.68 | |
| |
Hypothetical return based on assumed 5% return | | | | | | | | | | | | | | | | | | | | |
| Class A | | | | | | | 1,000.00 | | | | 1.73 | % | | | 1,016.22 | | | | 8.65 | |
| Class B | | | | | | | 1,000.00 | | | | 2.48 | % | | | 1,012.50 | | | | 12.37 | |
| Class C | | | | | | | 1,000.00 | | | | 2.48 | % | | | 1,012.50 | | | | 12.37 | |
| Class I | | | | | | | 1,000.00 | | | | 1.48 | % | | | 1,017.46 | | | | 7.40 | |
| |
| | | | | | | | | | | | | | | | | | | | | |
Quaker Core Value Fund | | | | | | | | | | | | | | | | | | | | |
| | | | | | | | | | | | | | | | | | | | | |
Actual return based on actual return of: | | | | | | | | | | | | | | | | | | | | |
| Class A | | | 10.61 | % | | | 1,000.00 | | | | 1.05 | % | | | 1,106.10 | | | | 5.48 | |
| |
Hypothetical return based on assumed 5% return | | | | | | | | | | | | | | | | | | | | |
| Class A | | | | | | | 1,000.00 | | | | 1.05 | % | | | 1,019.59 | | | | 5.26 | |
| |
| | |
| * | | Expenses are equal to the Funds’ annualized six-month expense ratios (excluding reimbursements) multiplied by the average account value over the period, multiplied by the number of days in the most recent fiscal half year (181) divided by 365 to reflect the one-half year period. |
20 | 2007 ANNUAL REPORT
Schedule of Investments
Quaker Strategic Growth Fund
June 30, 2007
| | | | | | | | | |
| | | Number | | | Fair | |
| | | of Shares | | | Value | |
| |
Common Stocks — 86.00% | | | | | | | | |
Basic Materials — 15.03% | | | | | | | | |
Chemicals — 5.46% | | | | | | | | |
| Bayer AG ADR | | | 353,617 | | | $ | 26,627,360 | |
| Potash Corp. of Saskatchewan | | | 195,800 | | | | 15,266,526 | |
| | | | | | | | |
| | | | | | | | 41,893,886 | |
| |
Iron & Steel Production — 0.98% | | | | | | | | |
| United States Steel Corp. | | | 69,200 | | | | 7,525,500 | |
| |
Mining — 8.59% | | | | | | | | |
| Alcoa, Inc. | | | 289,800 | | | | 11,745,594 | |
| Compahnia Vale do Rio Doce ADR | | | 465,800 | | | | 20,751,390 | |
| Freeport-McMoRan Copper & Gold, Inc. | | | 403,300 | | | | 33,401,306 | |
| | | | | | | | |
| | | | | | | | 65,898,290 | |
| |
| Total Basic Materials (Cost: $92,672,214) | | | | | | | 115,317,676 | |
| |
Communications — 7.74% | | | | | | | | |
Internet Software & Services — 1.10% | | | | | | | | |
| Google, Inc.(a) | | | 16,100 | | | | 8,426,418 | |
| |
Telecommunications — 6.64% | | | | | | | | |
| America Movil SA de CV ADR | | | 248,300 | | | | 15,377,219 | |
| LM Ericsson ADR | | | 328,900 | | | | 13,119,821 | |
| NII Holdings, Inc.(a) | | | 96,355 | | | | 7,779,703 | |
| Qualcomm, Inc. | | | 260,700 | | | | 11,311,773 | |
| Tim Participacoes SA ADR | | | 97,200 | | | | 3,350,484 | |
| | | | | | | | |
| | | | | | | | 50,939,000 | |
| |
| Total Communications (Cost: $52,008,175) | | | | | | | 59,365,418 | |
| |
Consumer, Cyclical — 3.66% | | | | | | | | |
Auto Manufacturers — 1.07% | | | | | | | | |
| Ford Motor Co. | | | 875,600 | | | | 8,248,152 | |
| |
Retail — 2.59% | | | | | | | | |
| CVS Caremark Corp. | | | 544,500 | | | | 19,847,025 | |
| |
| Total Consumer, Cyclical (Cost: $26,073,713) | | | | | | | 28,095,177 | |
| |
Consumer, Non-cyclical — 3.20% | | | | | | | | |
Agricultural Products — 3.09% | | | | | | | | |
| Bunge Ltd. | | | 280,400 | | | | 23,693,800 | |
| |
Commerical Services — 0.11% | | | | | | | | |
| Wright Express Corp.(a) | | | 24,200 | | | | 829,334 | |
| |
Household Products — 0.00% | | | | | | | | |
| Ronco Corp.(a)(b) | | | 932,914 | | | | 0 | |
| |
Total Consumer, Non-Cyclical
(Cost: $23,694,593) | | | | | | | 24,523,134 | |
| |
Diversified — 0.82% | | | | | | | | |
Holding Companies-Divers — 0.82% | | | | | | | | |
| Star Maritime Acquisition Corp.(a) | | | 515,100 | | | | 6,315,126 | |
| |
| Total Diversified (Cost: $5,863,293) | | | | | | | 6,315,126 | |
| |
| | | | | | | | | |
| | | Number | | | Fair | |
| | | of Shares | | | Value | |
| |
Common Stocks (Continued) | | | | | | | | |
Energy — 23.15% | | | | | | | | |
Gas — 3.96% | | | | | | | | |
| Williams Cos., Inc. | | | 961,900 | | | $ | 30,415,278 | |
| |
Oil — 2.84% | | | | | | | | |
| Southwestern Energy Co.(a) | | | 489,300 | | | | 21,773,850 | |
| |
Oil & Gas — 16.35% | | | | | | | | |
| Canadian Natural Resources Ltd. | | | 478,500 | | | | 31,748,475 | |
| ConocoPhillips | | | 342,100 | | | | 26,854,850 | |
| Rowan Cos., Inc. | | | 507,400 | | | | 20,793,252 | |
| Transocean, Inc.(a) | | | 214,800 | | | | 22,764,504 | |
| XTO Energy, Inc. | | | 387,000 | | | | 23,258,700 | |
| | | | | | | | |
| | | | | | | | 125,419,781 | |
| |
| Total Energy (Cost: $148,642,446) | | | | | | | 177,608,909 | |
| |
Financial — 3.95% | | | | | | | | |
Banks — 1.36% | | | | | | | | |
| State Street Corp. | | | 152,400 | | | | 10,424,160 | |
| |
Diversified Financial Services — 1.38% | | | | | | | | |
| Ameriprise Financial, Inc. | | | 166,900 | | | | 10,609,833 | |
| |
Insurance — 1.21% | | | | | | | | |
| Marsh & McLennan Cos., Inc. | | | 301,700 | | | | 9,316,496 | |
| |
| Total Financial (Cost: $29,573,388) | | | | | | | 30,350,489 | |
| |
Healthcare — 2.74% | | | | | | | | |
Healthcare-Services — 2.74% | | | | | | | | |
| Aetna, Inc. | | | 426,100 | | | | 21,049,340 | |
| |
| Total Healthcare (Cost: $19,264,446) | | | | | | | 21,049,340 | |
| |
Industrial — 18.02% | | | | | | | | |
Aerospace & Defense — 0.16% | | | | | | | | |
| Raytheon Co. | | | 22,400 | | | | 1,207,136 | |
| |
Electrical Components & Equipment — 0.71% | | | | | | | | |
| Coleman Cable, Inc.(a) | | | 211,700 | | | | 5,474,562 | |
| |
Engineering — 2.58% | | | | | | | | |
| McDermott International, Inc.(a) | | | 238,200 | | | | 19,799,184 | |
| |
Engineering & Construction — 1.92% | | | | | | | | |
| KBR, Inc.(a) | | | 560,200 | | | | 14,694,046 | |
| |
Environmental Control — 1.12% | | | | | | | | |
| American Ecology Corp. | | | 402,391 | | | | 8,619,215 | |
| |
Machinery-Construction & Mining — 1.81% | | | | | | | | |
| Joy Global, Inc. | | | 237,600 | | | | 13,859,208 | |
| |
Metal Fabricate & Hardware — 1.80% | | | | | | | | |
| Haynes International, Inc.(a) | | | 163,857 | | | | 13,834,446 | |
| |
The accompanying notes are an integral part of the financial statements.
2007 | ANNUAL REPORT 21
Schedule of Investments
Quaker Strategic Growth Fund
June 30, 2007
| | | | | | | | | |
| | | Number | | | Fair | |
| | | of Shares | | | Value | |
| |
Common Stocks (Continued) | | | | | | | | |
Miscellaneous Manufacturing — 7.33% | | | | | | | | |
| ITT Industries, Inc. | | | 152,400 | | | $ | 10,405,872 | |
| Siemens AG ADR | | | 185,300 | | | | 26,509,018 | |
| Trinity Industries, Inc. | | | 134,600 | | | | 5,860,484 | |
| Tyco International Ltd.(a) | | | 398,600 | | | | 13,468,694 | |
| | | | | | | | |
| | | | | | | | 56,244,068 | |
| |
Transportation — 0.59% | | | | | | | | |
| Burlington Northern Santa Fe Corp. | | | 52,876 | | | | 4,501,863 | |
| |
| Total Industrial (Cost: $114,711,142) | | | | | | | 138,233,728 | |
| |
Technology — 5.64% | | | | | | | | |
Computers — 1.71% | | | | | | | | |
| International Business Machines Corp. | | | 124,300 | | | | 13,082,575 | |
| |
Software — 3.93% | | | | | | | | |
| Broadridge Financial Solutions, Inc.(a) | | | 391,300 | | | | 7,481,656 | |
| Business Objects SA ADR(a) | | | 284,000 | | | | 11,030,560 | |
| Intuit, Inc.(a) | | | 388,300 | | | | 11,680,064 | |
| | | | | | | | |
| | | | | | | | 30,192,280 | |
| |
| Total Technology (Cost: $43,126,817) | | | | | | | 43,274,855 | |
| |
Utilities — 2.05% | | | | | | | | |
Electric — 2.05% | | | | | | | | |
| Allegheny Energy, Inc.(a) | | | 303,400 | | | | 15,697,916 | |
| |
| Total Utilities (Cost: $11,687,497) | | | | | | | 15,697,916 | |
| |
Total Common Stocks (Cost $567,317,724) | | | | | | | 659,831,768 | |
| |
Warrant — 0.00% | | | | | | | | |
| Waste Management Services, Inc. Warrants Expiration: | | | | | | | | |
| April 2009, Exercise Price: $12.00(a)(b) | | | 50,000 | | | | 0 | |
| |
Total Warrants
(Cost $0) | | | | | | | 0 | |
| |
| | | | | | | | | |
| | | Par | | | Fair | |
| | | Value | | | Value | |
| |
Short-Term Investment — 12.12% | | | | | | | | |
Time Deposit — 12.12% | | | | | | | | |
Wells Fargo (Grand Cayman) 4.64%,
07/02/2007 | | $ | 92,984,412 | | | $ | 92,984,412 | |
| |
Total Short-Term Investment
(Cost $92,984,412) | | | | | | | 92,984,412 | |
| |
Total Investments (Cost $660,302,136) — 98.12% | | | | | | | 752,816,180 | |
| |
Other Assets in Excess of Liabilities, Net 1.88% | | | | | | | 14,489,758 | |
| |
Total Net Assets — 100.00% | | | | | | $ | 767,305,938 | |
| |
| | |
| ADR | | American Depositary Receipt |
| |
| (a) | | Non-income producing security. |
| |
| (b) | | Restricted security |
| |
| | | Ronco Corp. was acquired on June 24, 2005 at a cost of $2,865,200. Waste Management Services, Inc. warrants were acquired on November 17, 2006 at a cost of $0. Since market quotations are not readily available for these securities, they were valued at fair value as determined by the Adviser using procedures approved by the Board of Trustees. The total fair value of such securities at June 30, 2007 is $0, which represents 0.00% of total net assets. |
22 | 2007 ANNUAL REPORT
Schedule of Investments
Quaker Core Equity Fund
June 30, 2007
| | | | | | | | | |
| | | Number | | | Fair | |
| | | of Shares | | | Value | |
Common Stocks — 99.79% | | | | | | | | |
Basic Materials — 5.24% | | | | | | | | |
Chemicals — 3.88% | | | | | | | | |
| Airgas, Inc. | | | 4,800 | | | $ | 229,920 | |
| Lubrizol Corp. | | | 2,100 | | | | 135,555 | |
| Praxair, Inc. | | | 2,000 | | | | 143,980 | |
| | | | | | | | |
| | | | | | | | 509,455 | |
| |
Mining — 1.36% | | | | | | | | |
| BHP Billiton Ltd. ADR | | | 3,000 | | | | 179,250 | |
| |
| Total Basic Materials (Cost: $608,599) | | | | | | | 688,705 | |
| |
Communications — 15.40% | | | | | | | | |
Internet — 2.37% | | | | | | | | |
| Akamai Technologies, Inc.(a) | | | 4,100 | | | | 199,424 | |
| HLTH Corp.(a) | | | 8,000 | | | | 112,080 | |
| | | | | | | | |
| | | | | | | | 311,504 | |
| |
Internet Software & Services — 3.19% | | | | | | | | |
| Google, Inc.(a) | | | 800 | | | | 418,704 | |
| |
Media — 0.23% | | | | | | | | |
| Citadel Broadcasting Corp. | | | 368 | | | | 2,374 | |
| Pearson PLC ADR | | | 1,600 | | | | 26,944 | |
| | | | | | | | |
| | | | | | | | 29,318 | |
| |
Multimedia — 2.70% | | | | | | | | |
| McGraw-Hill Cos., Inc. | | | 1,500 | | | | 102,120 | |
| News Corp. Inc. Class A | | | 4,200 | | | | 89,082 | |
| The Walt Disney Co. | | | 4,800 | | | | 163,872 | |
| | | | | | | | |
| | | | | | | | 355,074 | |
| |
Telecommunications — 6.91% | | | | | | | | |
| America Movil SA de CV ADR | | | 1,500 | | | | 92,895 | |
| AT&T, Inc. | | | 4,900 | | | | 203,350 | |
| Corning, Inc.(a) | | | 8,400 | | | | 214,620 | |
| Harris Corp. | | | 1,400 | | | | 76,370 | |
| Oplink Communications, Inc.(a) | | | 6,000 | | | | 90,000 | |
| SBA Communications Corp.(a) | | | 1,000 | | | | 33,590 | |
| Telecom Argentina SA ADR(a) | | | 1,000 | | | | 24,920 | |
| Telekomunikasi Indonesia Tbk PT ADR | | | 4,000 | | | | 172,400 | |
| | | | | | | | |
| | | | | | | | 908,145 | |
| |
| Total Communications (Cost: $1,922,351) | | | | | | | 2,022,745 | |
| |
Consumer, Cyclical — 4.47% | | | | | | | | |
Auto Manufacturers — 2.11% | | | | | | | | |
| Oshkosh Truck Corp. | | | 4,400 | | | | 276,848 | |
| |
Entertainment — 0.22% | | | | | | | | |
| DreamWorks Animation SKG, Inc.(a) | | | 1,000 | | | | 28,840 | |
| |
Lodging — 0.11% | | | | | | | | |
| Wyndham Worldwide Corp.(a) | | | 400 | | | | 14,504 | |
| |
| | | | | | | | | |
| | | Number | | | Fair | |
| | | of Shares | | | Value | |
Common Stocks (Continued) | | | | | | | | |
Retail — 2.03% | | | | | | | | |
| CVS Caremark Corp. | | | 4,200 | | | $ | 153,090 | |
| Kohl’s Corp.(a) | | | 1,600 | | | | 113,648 | |
| | | | | | | | |
| | | | | | | | 266,738 | |
| |
| Total Consumer, Cyclical (Cost: $532,778) | | | | | | | 586,930 | |
| |
Consumer, Non-cyclical — 11.49% | | | | | | | | |
Commerical Services — 1.35% | | | | | | | | |
| Avis Budget Group, Inc.(a) | | | 3,300 | | | | 93,819 | |
| Robert Half International, Inc. | | | 2,300 | | | | 83,950 | |
| | | | | | | | |
| | | | | | | | 177,769 | |
| |
Cosmetics & Toiletries — 3.91% | | | | | | | | |
| Procter & Gamble Co. | | | 8,400 | | | | 513,996 | |
| |
Food — 0.19% | | | | | | | | |
| Koninklijke Ahold NV ADR(a) | | | 2,000 | | | | 25,040 | |
| |
Food & Beverages — 4.37% | | | | | | | | |
| PepsiCo, Inc. | | | 8,860 | | | | 574,571 | |
| |
Household Products — 1.67% | | | | | | | | |
| Avery Dennison Corp. | | | 2,000 | | | | 132,960 | |
| Jarden Corp.(a) | | | 2,000 | | | | 86,020 | |
| | | | | | | | |
| | | | | | | | 218,980 | |
| |
| Total Consumer, Non-Cyclical (Cost: $1,446,127) | | | | | | | 1,510,356 | |
| |
Energy — 11.85% | | | | | | | | |
Gas — 0.84% | | | | | | | | |
| Williams Cos., Inc. | | | 3,500 | | | | 110,670 | |
| |
Oil & Gas — 6.09% | | | | | | | | |
| Apache Corp. | | | 1,800 | | | | 146,862 | |
| Baker Hughes, Inc. | | | 3,900 | | | | 328,107 | |
| Chesapeake Energy Corp. | | | 4,000 | | | | 138,400 | |
| ENSCO International, Inc. | | | 1,000 | | | | 61,010 | |
| Unit Corp.(a) | | | 2,000 | | | | 125,820 | |
| | | | | | | | |
| | | | | | | | 800,199 | |
| |
Oil & Gas Services — 4.92% | | | | | | | | |
| Cameron International Corp.(a) | | | 2,500 | | | | 178,675 | |
| Schlumberger Ltd. | | | 3,000 | | | | 254,820 | |
| Superior Energy Services(a) | | | 2,000 | | | | 79,840 | |
| Weatherford International Ltd.(a) | | | 2,400 | | | | 132,576 | |
| | | | | | | | |
| | | | | | | | 645,911 | |
| |
| Total Energy (Cost: $1,295,041) | | | | | | | 1,556,780 | |
| |
Financial — 17.59% | | | | | | | | |
Banks — 3.13% | | | | | | | | |
| Allied Irish Banks PLC ADR | | | 3,800 | | | | 208,848 | |
| Deutsche Bank AG | | | 1,400 | | | | 202,636 | |
| | | | | | | | |
| | | | | | | | 411,484 | |
| |
The accompanying notes are an integral part of the financial statements.
2007 ANNUAL REPORT | 23
Schedule of Investments
Quaker Core Equity Fund
June 30, 2007
| | | | | | | | | |
| | | Number | | | Fair | |
| | | of Shares | | | Value | |
Common Stocks (Continued) | | | | | | | | |
Diversified Financial Services — 6.70% | | | | | | | | |
| American Express Co. | | | 4,100 | | | $ | 250,838 | |
| Credit Suisse Group ADR | | | 2,900 | | | | 205,784 | |
| Lehman Brothers Holdings, Inc. | | | 1,300 | | | | 96,876 | |
| Merrill Lynch & Co., Inc. | | | 1,500 | | | | 125,370 | |
| Morgan Stanley | | | 2,400 | | | | 201,312 | |
| | | | | | | | |
| | | | | | | | 880,180 | |
| |
Insurance — 7.76% | | | | | | | | |
| American International Group, Inc. | | | 4,400 | | | | 308,132 | |
| Chubb Corp. | | | 3,700 | | | | 200,318 | |
| CNA Financial Corp. | | | 3,800 | | | | 181,222 | |
| Endurance Specialty Holdings Ltd. | | | 3,200 | | | | 128,128 | |
| HCC Insurance Holdings, Inc. | | | 3,900 | | | | 130,299 | |
| Transatlantic Holdings, Inc. | | | 1,000 | | | | 71,130 | |
| | | | | | | | |
| | | | | | | | 1,019,229 | |
| |
| Total Financial (Cost: $2,341,702) | | | | | | | 2,310,893 | |
| |
Healthcare — 8.83% | | | | | | | | |
Biotechnology — 1.52% | | | | | | | | |
| Genzyme Corp.(a) | | | 1,900 | | | | 122,360 | |
| Gilead Sciences, Inc.(a) | | | 2,000 | | | | 77,540 | |
| | | | | | | | |
| | | | | | | | 199,900 | |
| |
Healthcare-Products — 1.73% | | | | | | | | |
| Johnson & Johnson | | | 3,700 | | | | 227,994 | |
| |
Healthcare-Services — 3.22% | | | | | | | | |
| Quest Diagnostics, Inc. | | | 2,500 | | | | 129,125 | |
| UnitedHealth Group, Inc. | | | 3,400 | | | | 173,876 | |
| WellPoint, Inc.(a) | | | 1,500 | | | | 119,745 | |
| | | | | | | | |
| | | | | | | | 422,746 | |
| |
Medical Products — 1.06% | | | | | | | | |
| Intuitive Surgical, Inc.(a) | | | 1,000 | | | | 138,770 | |
| |
Pharmaceuticals — 1.30% | | | | | | | | |
| Cardinal Health, Inc. | | | 1,600 | | | | 113,024 | |
| Wyeth | | | 1,000 | | | | 57,340 | |
| | | | | | | | |
| | | | | | | | 170,364 | |
| |
| Total Healthcare (Cost: $1,108,330) | | | | | | | 1,159,774 | |
| |
Industrial — 18.04% | | | | | | | | |
Aerospace & Defense — 1.03% | | | | | | | | |
| Raytheon Co. | | | 2,500 | | | | 134,725 | |
| |
Electrical Components & Equipment — 1.18% | | | | | | | | |
| Ametek, Inc. | | | 3,900 | | | | 154,752 | |
| |
Electronics — 2.07% | | | | | | | | |
| Agilent Technologies, Inc.(a) | | | 4,000 | | | | 153,760 | |
| Waters Corp.(a) | | | 2,000 | | | | 118,720 | |
| | | | | | | | |
| | | | | | | | 272,480 | |
| |
| | | | | | | | | |
| | | Number | | | Fair | |
| | | of Shares | | | Value | |
Common Stocks (Continued) | | | | | | | | |
Engineering & Construction — 0.52% | | | | | | | | |
| ABB Ltd. ADR | | | 3,000 | | | $ | 67,800 | |
| |
Machinery-Diversified — 1.67% | | | | | | | | |
| Gardner Denver, Inc.(a) | | | 2,000 | | | | 85,100 | |
| IDEX Corp. | | | 3,500 | | | | 134,890 | |
| | | | | | | | |
| | | | | | | | 219,990 | |
| |
Metal Fabricate & Hardware — 0.92% | | | | | | | | |
| Precision Castparts Corp. | | | 1,000 | | | | 121,360 | |
| |
Miscellaneous Manufacturing — 9.57% | | | | | | | | |
| Dover Corp. | | | 3,800 | | | | 194,370 | |
| General Electric Co. | | | 15,940 | | | | 610,183 | |
| Harsco Corp. | | | 2,000 | | | | 104,000 | |
| Parker Hannifin Corp. | | | 2,000 | | | | 195,820 | |
| Trinity Industries, Inc. | | | 3,500 | | | | 152,390 | |
| | | | | | | | |
| | | | | | | | 1,256,763 | |
| |
Packaging & Containers — 0.89% | | | | | | | | |
| Crown Holdings, Inc.(a) | | | 4,700 | | | | 117,359 | |
| |
Trucking & Leasing — 0.19% | | | | | | | | |
| GATX Corp. | | | 500 | | | | 24,625 | |
| |
| Total Industrial (Cost: $2,120,024) | | | | | | | 2,369,854 | |
| |
Technology — 6.22% | | | | | | | | |
Computers — 4.63% | | | | | | | | |
| Apple, Inc.(a) | | | 3,300 | | | | 402,732 | |
| Hewlett-Packard Co. | | | 2,900 | | | | 129,398 | |
| Western Digital Corp.(a) | | | 3,900 | | | | 75,465 | |
| | | | | | | | |
| | | | | | | | 607,595 | |
| |
Semiconductors — 1.35% | | | | | | | | |
| Kla-Tencor Corp. | | | 1,000 | | | | 54,950 | |
| MEMC Electronic Materials, Inc.(a) | | | 2,000 | | | | 122,240 | |
| | | | | | | | |
| | | | | | | | 177,190 | |
| |
Software — 0.24% | | | | | | | | |
| IMS Health, Inc. | | | 1,000 | | | | 32,130 | |
| |
| Total Technology (Cost: $679,846) | | | | | | | 816,915 | |
| |
Utilities — 0.66% | | | | | | | | |
Electric — 0.66% | | | | | | | | |
| Constellation Energy Group, Inc. | | | 1,000 | | | | 87,170 | |
| |
| Total Utilities (Cost: $93,140) | | | | | | | 87,170 | |
| |
Total Common Stocks
(Cost $12,147,938) | | | | | | | 13,110,122 | |
| |
24 | 2007 ANNUAL REPORT
| | | | | | | | | |
| | | Par | | Fair |
| | | Value | | Value |
Short-Term Investment — 0.51% | | | | | | | | |
Time Deposit — 0.51% | | | | | | | | |
| BBH Grand Cayman 4.64%, 07/02/2007 | | $ | 66,876 | | | $ | 66,876 | |
| |
Total Short-Term Investment
(Cost $66,876) | | | | | | | 66,876 | |
| |
Total Investments
(Cost $12,214,814) — 100.30% | | | | | | | 13,176,998 | |
| |
Liabilities in Excess of Other Assets, Net (0.30)% | | | | | | | (39,187 | ) |
| |
Total Net Assets — 100.00% | | | | | | $ | 13,137,811 | |
| |
| | |
| ADR | | American Depositary Receipt |
| |
| (a) | | Non-income producing security |
The accompanying notes are an integral part of the financial statements.
2007 ANNUAL REPORT | 25
Schedule of Investments
Quaker Small-Cap Growth Fund
June 30, 2007
| | | | | | | | | |
| | | Number | | | Fair | |
| | | of Shares | | | Value | |
| |
Common Stocks — 98.64% | | | | | | | | |
Basic Materials — 4.39% | | | | | | | | |
Chemicals — 3.52% | | | | | | | | |
| Airgas, Inc. | | | 1,000 | | | $ | 47,900 | |
| Arch Chemical, Inc. | | | 1,000 | | | | 35,140 | |
| Hercules, Inc.(a) | | | 500 | | | | 9,825 | |
| SGL Carbon AG ADR(a) | | | 800 | | | | 10,880 | |
| Spartech Corp | | | 1,400 | | | | 37,170 | |
| | | | | | | | |
| | | | | | | | 140,915 | |
| |
Mining — 0.87% | | | | | | | | |
| RTI International Metals, Inc.(a) | | | 460 | | | | 34,670 | |
| |
| Total Basic Materials (Cost: $171,777) | | | | | | | 175,585 | |
| |
Communications — 17.13% | | | | | | | | |
Advertising — 0.57% | | | | | | | | |
| Valuevision Media, Inc.(a) | | | 2,000 | | | | 22,640 | |
| |
Internet — 1.53% | | | | | | | | |
| Akamai Technologies, Inc.(a) | | | 1,260 | | | | 61,286 | |
| |
Media — 2.60% | | | | | | | | |
| Grupo Televisa SA ADR | | | 1,700 | | | | 46,937 | |
| Pearson PLC ADR | | | 3,400 | | | | 57,256 | |
| | | | | | | | |
| | | | | | | | 104,193 | |
| |
Telecommunications — 12.43% | | | | | | | | |
| Anixter International, Inc.(a) | | | 410 | | | | 30,836 | |
| Centennial Communications Corp.(a) | | | 2,010 | | | | 19,075 | |
| Comtech Telecommunications Corp.(a) | | | 1,370 | | | | 63,595 | |
| Corning, Inc.(a) | | | 3,000 | | | | 76,651 | |
| CPI International, Inc.(a) | | | 2,400 | | | | 47,592 | |
| Dobson Communications Corp.(a) | | | 1,960 | | | | 21,776 | |
| Golden Telecom, Inc. | | | 150 | | | | 8,251 | |
| Leap Wireless International, Inc.(a) | | | 360 | | | | 30,420 | |
| Novatel Wireless, Inc.(a) | | | 1,020 | | | | 26,540 | |
| Oplink Communications, Inc.(a) | | | 3,200 | | | | 48,000 | |
| Orbcomm, Inc.(a) | | | 3,010 | | | | 49,394 | |
| PAETEC Holding Corp.(a) | | | 1,660 | | | | 18,741 | |
| SBA Communications Corp.(a) | | | 500 | | | | 16,795 | |
| Telecom Argentina SA ADR(a) | | | 1,600 | | | | 39,872 | |
| | | | | | | | |
| | | | | | | | 497,538 | |
| |
| Total Communications (Cost: $640,188) | | | | | | | 685,657 | |
| |
Consumer, Cyclical — 10.34% | | | | | | | | |
Apparel — 0.65% | | | | | | | | |
| Kellwood Co. | | | 930 | | | | 26,152 | |
| |
Auto Parts & Equipment — 1.82% | | | | | | | | |
| American Axle & Manufacturing Holdings, Inc. | | | 1,770 | | | | 52,427 | |
| Noble International Ltd. | | | 1,000 | | | | 20,440 | |
| | | | | | | | |
| | | | | | | | 72,867 | |
| |
Distribution & Wholesale — 0.44% | | | | | | | | |
| Owens & Minor, Inc. | | | 500 | | | | 17,470 | |
| |
Housewares — 1.36% | | | | | | | | |
| Lifetime Brands, Inc. | | | 2,660 | | | | 54,397 | |
| |
| | | | | | | | | |
| | | Number | | | Fair | |
| | | of Shares | | | Value | |
| |
Common Stocks (Continued) | | | | | | | | |
Office Furnishings — 1.40% | | | | | | | | |
| Knoll, Inc. | | | 2,500 | | | $ | 56,000 | |
| |
Retail — 4.67% | | | | | | | | |
| Bon Ton Stores, Inc. | | | 1,240 | | | | 49,675 | |
| Carrols Restaurant Group, Inc.(a) | | | 1,030 | | | | 15,708 | |
| Conn’s, Inc.(a) | | | 1,610 | | | | 45,982 | |
| First Cash Financial Services, Inc.(a) | | | 1,100 | | | | 25,784 | |
| Jos. A. Bank Clothiers, Inc.(a) | | | 1,200 | | | | 49,764 | |
| | | | | | | | |
| | | | | | | | 186,913 | |
| |
| Total Consumer, Cyclical (Cost: $422,227) | | | | | | | 413,799 | |
| |
Consumer, Non-cyclical — 8.49% | | | | | | | | |
Agriculture — 1.59% | | | | | | | | |
| Alliance One International, Inc.(a) | | | 1,810 | | | | 18,190 | |
| Andersons, Inc. | | | 1,000 | | | | 45,330 | |
| | | | | | | | |
| | | | | | | | 63,520 | |
| |
Commerical Services — 2.05% | | | | | | | | |
| Cenveo, Inc.(a) | | | 700 | | | | 16,233 | |
| MPS Group, Inc.(a) | | | 1,870 | | | | 25,002 | |
| Pharmaceutical Products Developments, Inc. | | | 300 | | | | 11,481 | |
| The Providence Service Corp.(a) | | | 1,100 | | | | 29,392 | |
| | | | | | | | |
| | | | | | | | 82,108 | |
| |
Cosmetics & Toiletries — 1.77% | | | | | | | | |
| Procter & Gamble Co. | | | 1,160 | | | | 70,980 | |
| |
Food & Beverages — 1.62% | | | | | | | | |
| PepsiCo, Inc. | | | 1,000 | | | | 64,850 | |
| |
Household Products — 1.46% | | | | | | | | |
| Jarden Corp.(a) | | | 1,360 | | | | 58,494 | |
| |
| Total Consumer, Non-Cyclical (Cost: $332,961) | | | | | | | 339,952 | |
| |
Diversified — 0.75% | | | | | | | | |
Holding Companies-Divers — 0.75% | | | | | | | | |
| Leucadia National Corp. | | | 850 | | | | 29,963 | |
| |
| Total Diversified (Cost:$30,372) | | | | | | | 29,963 | |
| |
Energy — 7.63% | | | | | | | | |
Gas — 0.40% | | | | | | | | |
| Williams Cos., Inc. | | | 500 | | | | 15,810 | |
| |
Oil & Gas — 6.04% | | | | | | | | |
| Apache Corp. | | | 540 | | | | 44,059 | |
| Chesapeake Energy Corp. | | | 1,500 | | | | 51,900 | |
| ENSCO International, Inc. | | | 700 | | | | 42,707 | |
| Lufkin Industries, Inc. | | | 1,600 | | | | 103,280 | |
| | | | | | | | |
| | | | | | | | 241,946 | |
| |
Oil & Gas Services — 1.19% | | | | | | | | |
| Complete Production Services, Inc.(a) | | | 300 | | | | 7,755 | |
| Superior Energy Services(a) | | | 1,000 | | | | 39,920 | |
| | | | | | | | |
| | | | | | | | 47,675 | |
| |
| Total Energy (Cost: $264,682) | | | | | | | 305,431 | |
| |
26 | 2007 ANNUAL REPORT
| | | | | | | | | |
| | | Number | | | Fair | |
| | | of Shares | | | Value | |
| |
Common Stocks (Continued) | | | | | | | | |
Financial — 10.29% | | | | | | | | |
Banks — 0.36% | | | | | | | | |
| Sterling Financial Corp. | | | 500 | | | $ | 14,470 | |
| |
Diversified Financial Services — 0.70% | | | | | | | | |
| Marlin Business Services Corp.(a) | | | 1,310 | | | | 27,916 | |
| |
Insurance — 5.05% | | | | | | | | |
| ACA Capital Holdings, Inc.(a) | | | 3,000 | | | | 35,700 | |
| Argonaut Group, Inc. | | | 280 | | | | 8,739 | |
| Meadowbrook Insurance Group, Inc.(a) | | | 2,190 | | | | 24,002 | |
| Platinum Underwriters Holdings Ltd. | | | 1,460 | | | | 50,735 | |
| SeaBright Insurance Holdings, Inc.(a) | | | 1,500 | | | | 26,220 | |
| Transatlantic Holdings, Inc. | | | 800 | | | | 56,903 | |
| | | | | | | | |
| | | | | | | | 202,299 | |
| |
Investment Companies — 2.49% | | | | | | | | |
| Harris & Harris Group, Inc.(a) | | | 2,000 | | | | 22,400 | |
| KKR Financial Holdings LLC | | | 3,110 | | | | 77,470 | |
| | | | | | | | |
| | | | | | | | 99,870 | |
| |
REITS — 1.69% | | | | | | | | |
| First Industrial Realty Trust, Inc. | | | 830 | | | | 32,171 | |
| Lexington Realty Trust | | | 1,700 | | | | 35,360 | |
| | | | | | | | |
| | | | | | | | 67,531 | |
| |
| Total Financial (Cost: $431,634) | | | | | | | 412,086 | |
| |
Healthcare — 8.67% | | | | | | | | |
Biotechnology — 0.67% | | | | | | | | |
| American Oriental Bioengineering, Inc.(a) | | | 3,000 | | | | 26,700 | |
| |
Healthcare-Products — 0.26% | | | | | | | | |
| Trinity Biotech PLC ADR(a) | | | 900 | | | | 10,449 | |
| |
Healthcare-Services — 1.83% | | | | | | | | |
| Air Methods Corp.(a) | | | 1,000 | | | | 36,670 | |
| Option Care, Inc. | | | 1,000 | | | | 15,400 | |
| Radiation Therapy Services, Inc.(a) | | | 800 | | | | 21,072 | |
| | | | | | | | |
| | | | | | | | 73,142 | |
| |
Medical Services — 0.37% | | | | | | | | |
| Alliance Imaging, Inc.(a) | | | 1,600 | | | | 15,024 | |
| |
Pharmaceuticals — 5.54% | | | | | | | | |
| Aspreva Pharmaceuticals Corp.(a) | | | 5,000 | | | | 86,500 | |
| Bradley Pharmaceuticals, Inc.(a) | | | 2,600 | | | | 56,446 | |
| Indevus Pharmaceuticals, Inc.(a) | | | 3,000 | | | | 20,190 | |
| Mannatech, Inc. | | | 1,180 | | | | 18,750 | |
| Sciele Pharma, Inc.(a) | | | 1,700 | | | | 40,052 | |
| | | | | | | | |
| | | | | | | | 221,938 | |
| |
| Total Healthcare (Cost: $350,012) | | | | | | | 347,253 | |
| |
| | | | | | | | | |
| | | Number | | | Fair | |
| | | of Shares | | | Value | |
| |
Common Stocks (Continued) | | | | | | | | |
Industrial — 19.99% | | | | | | | | |
Aerospace & Defense — 1.18% | | | | | | | | |
| Kaman Corp. | | | 680 | | | $ | 21,209 | |
| Moog, Inc.(a) | | | 590 | | | | 26,025 | |
| | | | | | | | |
| | | | | | | | 47,234 | |
| |
Building Materials — 1.93% | | | | | | | | |
| Apogee Enterprises, Inc. | | | 330 | | | | 9,181 | |
| Goodman Global, Inc.(a) | | | 2,680 | | | | 59,550 | |
| Interline Brands, Inc.(a) | | | 330 | | | | 8,606 | |
| | | | | | | | |
| | | | | | | | 77,337 | |
| |
Electrical Components & Equipment — 0.99% | | | | | | | | |
| Ametek, Inc. | | | 1,000 | | | | 39,680 | |
| |
Electronics — 0.57% | | | | | | | | |
| Benchmark Electronics, Inc.(a) | | | 1,000 | | | | 22,620 | |
| |
Hand & Machine Tools — 2.66% | | | | | | | | |
| Baldor Electric Co. | | | 2,000 | | | | 98,560 | |
| Regal-Beloit Corp. | | | 170 | | | | 7,912 | |
| | | | | | | | |
| | | | | | | | 106,472 | |
| |
Industrial Equipment — 0.69% | | | | | | | | |
| Belden CDT, Inc. | | | 500 | | | | 27,675 | |
| |
Machinery-Diversified — 6.32% | | | | | | | | |
| Altra Holdings, Inc.(a) | | | 480 | | | | 8,294 | |
| Applied Industrial Technologies, Inc. | | | 1,860 | | | | 54,870 | |
| Gardner Denver, Inc.(a) | | | 1,600 | | | | 68,080 | |
| IDEX Corp. | | | 1,000 | | | | 38,540 | |
| Kadant, Inc.(a) | | | 370 | | | | 11,544 | |
| Lindsay Corp. | | | 1,620 | | | | 71,750 | |
| | | | | | | | |
| | | | | | | | 253,078 | |
| |
Metal Fabricate & Hardware — 1.36% | | | | | | | | |
| NN, Inc. | | | 500 | | | | 5,900 | |
| Quanex Corp. | | | 1,000 | | �� | | 48,700 | |
| | | | | | | | |
| | | | | | | | 54,600 | |
| |
Miscellaneous Manufacturing — 4.29% | | | | | | | | |
| American Railcar Industries, Inc. | | | 1,000 | | | | 39,000 | |
| Ameron International Corp. | | | 700 | | | | 63,133 | |
| Trinity Industries, Inc. | | | 1,600 | | | | 69,664 | |
| | | | | | | | |
| | | | | | | | 171,797 | |
| |
| Total Industrial (Cost: $686,543) | | | | | | | 800,493 | |
| |
Technology — 9.36% | | | | | | | | |
Computers — 3.74% | | | | | | | | |
| Ness Technologies, Inc.(a) | | | 2,120 | | | | 27,581 | |
| Smart Modular Technologies WWH, Inc.(a) | | | 3,680 | | | | 50,637 | |
| Synaptics, Inc.(a) | | | 2,000 | | | | 71,580 | |
| | | | | | | | |
| | | | | | | | 149,798 | |
| |
The accompanying notes are an integral part of the financial statements.
2007 ANNUAL REPORT | 27
Schedule of Investments
Quaker Small-Cap Growth Fund
June 30, 2007
| | | | | | | | | |
| | | Number | | | Fair | |
| | | of Shares | | | Value | |
| |
Common Stocks (Continued) | | | | | | | | |
Semiconductors — 2.17% | | | | | | | | |
| Diodes, Inc.(a) | | | 400 | | | $ | 16,708 | |
| International Rectifier Corp.(a) | | | 500 | | | | 18,630 | |
| Kla-Tencor Corp. | | | 500 | | | | 27,475 | |
| Zoran Corp.(a) | | | 1,200 | | | | 24,048 | |
| | | | | | | | |
| | | | | | | | 86,861 | |
| |
Software — 3.45% | | | | | | | | |
| Actuate Corp.(a) | | | 1,300 | | | | 8,827 | |
| Ansys, Inc.(a) | | | 2,000 | | | | 53,000 | |
| Epicor Software Corp.(a) | | | 3,000 | | | | 44,610 | |
| IMS Health, Inc. | | | 500 | | | | 16,065 | |
| QAD, Inc. | | | 1,870 | | | | 15,521 | |
| | | | | | | | |
| | | | | | | | 138,023 | |
| |
| Total Technology (Cost: $342,134) | | | | | | | 374,682 | |
| |
Utilities — 1.60% | | | | | | | | |
Electric — 0.37% | | | | | | | | |
| PNM Resources, Inc. | | | 540 | | | | 15,007 | |
| |
Gas — 0.34% | | | | | | | | |
| UGI Corp. | | | 500 | | | | 13,640 | |
| |
Water — 0.89% | | | | | | | | |
| American States Water Co. | | | 1,000 | | | | 35,570 | |
| |
| Total Utilities (Cost: $70,339) | | | | | | | 64,217 | |
| |
Total Common Stocks | | | | | | | | |
(Cost $3,742,869) | | | | | | | 3,949,118 | |
| |
| | | | | | | | | |
| | | Par | | | Fair | |
| | | Value | | | Value | |
| |
Short-Term Investment — 1.41% | | | | | | | | |
Time Deposit — 1.41% | | | | | | | | |
| BBH Grand Cayman 4.64%, 07/02/2007 | | $ | 56,604 | | | $ | 56,604 | |
| |
Total Short-Term Investment | | | | | | | | |
(Cost $56,604) | | | | | | | 56,604 | |
| |
Total Investments | | | | | | | | |
(Cost $3,799,473) — 100.05% | | | | | | | 4,005,722 | |
| |
Liabilities in Excess of Other Assets, Net (0.05)% | | | | | | | (1,920 | ) |
| |
Total Net Assets — 100.00% | | | | | | $ | 4,003,802 | |
| |
| | |
| ADR American Depository Receipt |
| |
| (a) | | Non-income producing security |
28 | 2007 ANNUAL REPORT
Schedule of Investments
Quaker Capital Opportunities Fund
June 30, 2007
| | | | | | | | | |
| | | Number | | | Fair | |
| | | of Shares | | | Value | |
| |
Common Stocks — 93.37% | | | | | | | | |
Basic Materials — 7.56% | | | | | | | | |
Chemicals — 7.56% | | | | | | | | |
| Air Products & Chemicals, Inc. | | | 7,900 | | | $ | 634,923 | |
| Praxair, Inc. | | | 9,100 | | | | 655,109 | |
| | | | | | | | |
| | | | | | | | 1,290,032 | |
| |
| Total Basic Materials (Cost: $1,034,044) | | | | | | | 1,290,032 | |
| |
Communications — 7.78% | | | | | | | | |
Advertising — 4.28% | | | | | | | | |
| Omnicom Group, Inc. | | | 13,800 | | | | 730,296 | |
Communication Services — 3.50% | | | | | | | | |
| Western Union Co.(a) | | | 28,700 | | | | 597,821 | |
| |
| Total Communications (Cost: $1,383,912) | | | | | | | 1,328,117 | |
| |
Consumer, Cyclical — 4.27% | | | | | | | | |
Retail — 4.27% | | | | | | | | |
| CVS Caremark Corp. | | | 20,000 | | | | 729,000 | |
| |
| Total Consumer, Cyclical (Cost: $615,990) | | | | | | | 729,000 | |
| |
Consumer, Non-cyclical — 15.51% | | | | | | | | |
Cosmetics & Toiletries — 3.88% | | | | | | | | |
| Colgate-Palmolive Co. | | | 10,200 | | | | 661,470 | |
| |
Food & Beverages — 11.63% | | | | | | | | |
| Diageo PLC ADR | | | 8,400 | | | | 699,804 | |
| Kellogg Co. | | | 11,400 | | | | 590,406 | |
| PepsiCo, Inc. | | | 10,700 | | | | 693,895 | |
| | | | | | | | |
| | | | | | | | 1,984,105 | |
| |
| Total Consumer, Non-Cyclical (Cost: $2,321,897) | | | | | | | 2,645,575 | |
| |
Energy — 2.12% | | | | | | | | |
Oil & Gas — 2.12% | | | | | | | | |
| ConocoPhillips | | | 4,600 | | | | 361,100 | |
| |
| Total Energy (Cost: $351,759) | | | | | | | 361,100 | |
| |
Financial — 12.43% | | | | | | | | |
Banks — 3.32% | | | | | | | | |
| Bank of America Corp. | | | 11,600 | | | | 567,124 | |
| |
Financial Services — 5.76% | | | | | | | | |
| JPMorgan Chase & Co. | | | 10,900 | | | | 528,105 | |
| Principal Financial Group, Inc. | | | 7,800 | | | | 454,662 | |
| | | | | | | | |
| | | | | | | | 982,767 | |
| |
Insurance — 3.35% | | | | | | | | |
| The Hartford Financial Services Group, Inc. | | | 5,800 | | | | 571,358 | |
| |
| Total Financial (Cost: $1,987,573) | | | | | | | 2,121,249 | |
| |
Healthcare — 20.36% | | | | | | | | |
Biotechnology — 3.59% | | | | | | | | |
| Genentech, Inc.(a) | | | 8,100 | | | | 612,846 | |
| |
Healthcare-Services — 3.72% | | | | | | | | |
| UnitedHealth Group, Inc. | | | 12,400 | | | | 634,136 | |
| |
| | | | | | | | | |
| | | Number | | | Fair | |
| | | of Shares | | | Value | |
| |
Common Stocks (Continued) | | | | | | | | |
Pharmaceuticals — 13.05% | | | | | | | | |
| Express Scripts, Inc.(a) | | | 7,200 | | | $ | 360,072 | |
| Medco Health Solutions, Inc.(a) | | | 7,765 | | | | 605,592 | |
| Novartis AG ADR | | | 11,000 | | | | 616,770 | |
| Teva Pharmaceutical Industries Ltd. ADR | | | 15,600 | | | | 643,500 | |
| | | | | | | | |
| | | | | | | | 2,225,934 | |
| |
| Total Healthcare (Cost: $3,280,326) | | | | | | | 3,472,916 | |
| |
Industrial — 9.48% | | | | | | | | |
Aerospace & Defense — 5.22% | | | | | | | | |
| General Dynamics Corp. | | | 4,300 | | | | 336,346 | |
| L-3 Communication Holdings, Inc. | | | 5,700 | | | | 555,123 | |
| | | | | | | | |
| | | | | | | | 891,469 | |
| |
Miscellaneous Manufacturing — 4.26% | | | | | | | | |
| Textron, Inc. | | | 6,600 | | | | 726,726 | |
| |
| Total Industrial (Cost: $1,354,933) | | | | | | | 1,618,195 | |
| |
Technology — 13.86% | | | | | | | | |
Computer Services — 6.56% | | | | | | | | |
| Automatic Data Processing, Inc. | | | 12,600 | | | | 610,722 | |
| Oracle Corp.(a) | | | 25,800 | | | | 508,518 | |
| | | | | | | | |
| | | | | | | | 1,119,240 | |
| |
Computer Software & Services — 3.64% | | | | | | | | |
| Microsoft Corp. | | | 21,095 | | | | 621,670 | |
| |
Computers — 3.66% | | | | | | | | |
| International Business Machines Corp. | | | 5,930 | | | | 624,133 | |
| |
| Total Technology (Cost: $2,158,289) | | | | | | | 2,365,043 | |
| |
Total Common Stocks (Cost $14,488,723) | | | | | | | 15,931,227 | |
| |
| | | | | | | | | |
| | | Par | | | | | |
| | | Value | | | | | |
| |
Short-Term Investment — 6.68% | | | | | | | | |
Time Deposit — 6.68% | | | | | | | | |
| Wells Fargo (Grand Cayman) 4.64%, 07/02/2007 | | $ | 1,139,784 | | | | 1,139,784 | |
| |
Total Short-Term Investment
(Cost $1,139,784) | | | | | | | 1,139,784 | |
| |
Total Investments
(Cost $15,628,507) — 100.05% | | | | | | | 17,071,011 | |
| |
Liabilities in Excess of Other Assets, Net (0.05)% | | | | | | | (9,375 | ) |
Total Net Assets — 100.00% | | | | | | $ | 17,061,636 | |
| |
ADR American Depositary Receipt
| (a) | | Non-income producing security |
The accompanying notes are an integral part of the financial statements.
2007 ANNUAL REPORT | 29
Schedule of Investments and Securities Sold Short
Quaker Biotech Pharma-Healthcare Fund
June 30, 2007
| | | | | | | | | |
| | | Number | | | Fair | |
| | | of Shares | | | Value | |
| |
Domestic Common Stocks — 64.07% | | | | | | | | |
Healthcare — 64.07% | | | | | | | | |
Biotechnology — 62.25% | | | | | | | | |
| Alexion Pharmaceuticals, Inc.(a) | | | 4,463 | | | $ | 201,103 | |
| Allergan, Inc. | | | 6,540 | | | | 376,966 | |
| Alnylam Pharmaceuticals, Inc.(a) | | | 13,081 | | | | 198,700 | |
| Amylin Pharmaceuticals, Inc.(a) | | | 4,827 | | | | 198,679 | |
| Biogen Idec, Inc.(a) | | | 8,026 | | | | 429,391 | |
| Celgene Corp.(a) | | | 8,700 | | | | 498,771 | |
| CV Therapeutics, Inc.(a) | | | 37,872 | | | | 500,289 | |
| Genzyme Corp.(a) | | | 9,478 | | | | 610,383 | |
| Gilead Sciences, Inc.(a) | | | 10,504 | | | | 407,240 | |
| Human Genome Sciences, Inc.(a) | | | 31,206 | | | | 278,358 | |
| Illumina, Inc.(a) | | | 9,604 | | | | 389,826 | |
| ImClone Systems, Inc.(a) | | | 5,600 | | | | 198,016 | |
| InterMune, Inc.(a) | | | 8,273 | | | | 214,602 | |
| Momenta Pharmaceuticals, Inc.(a) | | | 33,750 | | | | 340,200 | |
| Myriad Genetics, Inc.(a) | | | 8,659 | | | | 322,028 | |
| Nektar Therapeutics(a) | | | 19,216 | | | | 182,360 | |
| Progenics Pharmaceuticals, Inc.(a) | | | 23,681 | | | | 510,799 | |
| Savient Pharmaceuticals, Inc.(a) | | | 25,891 | | | | 321,566 | |
| | | | | | | | |
| | | | | | | | 6,179,277 | |
| |
Pharmaceuticals — 1.82% | | | | | | | | |
| Dynavax Technologies Corp.(a) | | | 43,700 | | | | 180,918 | |
| |
| Total Healthcare (Cost: $6,204,829) | | | | | | | 6,360,195 | |
| |
Total Domestic Common Stocks
(Cost $6,204,829) | | | | | | | 6,360,195 | |
| |
Foreign Common Stocks — 11.04% | | | | | | | | |
Canada — 6.05% | | | | | | | | |
Biotechnology — 0.90% | | | | | | | | |
| ConjuChem Biotechnologies, Inc.(a) | | | 260,390 | | | | 89,204 | |
| |
Pharmaceuticals — 5.15% | | | | | | | | |
| Cardiome Pharma Corp.(a) | | | 55,583 | | | | 511,919 | |
| |
| Total Canada (Cost: $776,230) | | | | | | | 601,123 | |
| |
Switzerland — 4.99% | | | | | | | | |
Biotechnology — 2.12% | | | | | | | | |
| Cytos Biotechnology Ltd.(a) | | | 1,597 | | | | 210,371 | |
| |
Therapeutics — 2.87% | | | | | | | | |
| Speedel Holding AG(a) | | | 1,910 | | | | 284,596 | |
| |
| Total Switzerland (Cost: $350,419) | | | | | | | 494,967 | |
Total Foreign Common Stocks
(Cost $1,126,649) | | | | | | | 1,096,090 | |
| |
| | | | | | | | | |
| | | Par | | | Fair | |
| | | Value | | | Value | |
| |
Short-Term Investments — 14.58% | | | | | | | | |
Foreign Currencies — 0.00% | | | | | | | | |
Swiss Franc
(Cost $375) | | | 459 | | | $ | 376 | |
| |
Time Deposit — 14.58% | | | | | | | | |
| Bank of America (London) 4.64%, 07/02/2007 | | $ | 1,447,002 | | | | 1,447,002 | |
| |
Total Short-Term Investments
(Cost $1,447,377) | | | | | | | 1,447,378 | |
| |
Total Investments
(Cost $8,778,855) — 89.69% | | | | | | | 8,903,663 | |
| |
Other Assets in Excess of Liabilities, Net 10.31% | | | | | | | 1,023,633 | |
| |
Total Net Assets — 100.00% | | | | | | $ | 9,927,296 | |
| |
| | | | | | | | | |
| | | Number | | | | | |
| Schedule of Securities Sold Short | | of Shares | | | | | |
| |
Common Stocks — 17.86% | | | | | | | | |
| Actelion Ltd.(a) | | | 7,500 | | | $ | 335,564 | |
| Genentech, Inc.(a) | | | 3,811 | | | | 288,340 | |
| GlaxoSmithKline PLC ADR | | | 6,100 | | | | 319,457 | |
| Millennium Pharmaceuticals, Inc.(a) | | | 10,133 | | | | 107,106 | |
| OSI Pharmaceuticals, Inc.(a) | | | 5,600 | | | | 202,776 | |
| Tanox, Inc.(a) | | | 11,284 | | | | 219,023 | |
| United Therapeutics Corp.(a) | | | 3,100 | | | | 197,656 | |
| Volcano Corp.(a) | | | 5,100 | | | | 103,071 | |
| |
Total Common Stocks (Proceeds: $1,848,068) | | | | | | $ | 1,772,993 | |
| |
Total Securities Sold Short (Proceeds: $1,848,068) | | | | | | $ | 1,772,993 | |
| |
ADR American Depository Receipt
| (a) | | Non-income producing security |
30 | 2007 ANNUAL REPORT
Schedule of Investments
Quaker Mid-Cap Value Fund
June 30, 2007
| | | | | | | | | |
| | | Number | | | Fair | |
| | | of Shares | | | Value | |
| |
Common Stocks — 99.56% | | | | | | | | |
Basic Materials — 5.92% | | | | | | | | |
Chemicals — 2.15% | | | | | | | | |
| Sherwin-Williams Co. | | | 50,000 | | | $ | 3,323,500 | |
| |
Iron & Steel Production — 1.76% | | | | | | | | |
| Steel Dynamics, Inc. | | | 65,000 | | | | 2,724,150 | |
| |
Mining — 2.01% | | | | | | | | |
| Southern Copper Corp. | | | 33,000 | | | | 3,110,580 | |
| |
| Total Basic Materials (Cost: $6,424,372) | | | | | | | 9,158,230 | |
| |
Communications — 2.08% | | | | | | | | |
Telecommunications — 2.08% | | | | | | | | |
| Tellabs, Inc.(a) | | | 300,000 | | | | 3,228,000 | |
| |
| Total Communications (Cost: $3,206,474) | | | | | | | 3,228,000 | |
| |
Consumer, Cyclical — 16.31% | | | | | | | | |
Airlines — 1.85% | | | | | | | | |
| Skywest, Inc. | | | 120,000 | | | | 2,859,600 | |
| |
Auto Manufacturers — 2.44% | | | | | | | | |
| Oshkosh Truck Corp. | | | 60,000 | | | | 3,775,200 | |
| |
Auto Parts & Equipment — 3.74% | | | | | | | | |
| Johnson Controls, Inc. | | | 50,000 | | | | 5,788,500 | |
| |
Home Builders — 1.17% | | | | | | | | |
| Thor Industries, Inc. | | | 40,000 | | | | 1,805,600 | |
| |
Leisure Time — 1.92% | | | | | | | | |
| Harley-Davidson, Inc. | | | 50,000 | | | | 2,980,500 | |
| |
Retail — 5.19% | | | | | | | | |
| American Eagle Outfitters, Inc. | | | 160,000 | | | | 4,105,600 | |
| J.C. Penney Co., Inc. | | | 54,400 | | | | 3,937,472 | |
| | | | | | | | |
| | | | | | | | 8,043,072 | |
| |
| Total Consumer, Cyclical (Cost: $21,735,855) | | | | | | | 25,252,472 | |
| |
Energy — 8.71% | | | | | | | | |
Oil & Gas — 4.65% | | | | | | | | |
| Helix Energy Solutions Group, Inc.(a) | | | 80,000 | | | | 3,192,800 | |
| Nabors Industries Ltd.(a) | | | 120,000 | | | | 4,005,600 | |
| | | | | | | | |
| | | | | | | | 7,198,400 | |
| |
Oil & Gas Services — 4.06% | | | | | | | | |
| BJ Services Co. | | | 115,000 | | | | 3,270,600 | |
| Grant Prideco, Inc.(a) | | | 56,000 | | | | 3,014,480 | |
| | | | | | | | |
| | | | | | | | 6,285,080 | |
| |
| Total Energy (Cost: $12,566,565) | | | | | | | 13,483,480 | |
| |
| | | | | | | | | |
| | | Number | | | Fair | |
| | | of Shares | | | Value | |
| |
Common Stocks (Continued) | | | | | | | | |
Financial — 22.60% | | | | | | | | |
Insurance — 22.60% | | | | | | | | |
| AMBAC Financial Group, Inc. | | | 60,000 | | | $ | 5,231,400 | |
| Cigna Corp. | | | 60,000 | | | | 3,133,200 | |
| First American Corp. | | | 50,000 | | | | 2,475,000 | |
| Genworth Financial, Inc. | | | 70,000 | | | | 2,408,000 | |
| HCC Insurance Holdings, Inc. | | | 150,000 | | | | 5,011,500 | |
| Lincoln National Corp. | | | 45,000 | | | | 3,192,750 | |
| Philadelphia Consolidated Holding Corp.(a) | | | 120,000 | | | | 5,016,000 | |
| Reinsurance Group of America, Inc. | | | 65,849 | | | | 3,966,744 | |
| W.R. Berkley Corp. | | | 140,000 | | | | 4,555,600 | |
| |
| Total Financial (Cost: $32,982,998) | | | | | | | 34,990,194 | |
| |
Healthcare — 8.52% | | | | | | | | |
Healthcare-Services — 2.79% | | | | | | | | |
| Coventry Health Care, Inc.(a) | | | 75,000 | | | | 4,323,750 | |
| |
Pharmaceuticals — 5.73% | | | | | | | | |
| Barr Pharmaceuticals, Inc.(a) | | | 100,000 | | | | 5,023,000 | |
| Forest Laboratories, Inc.(a) | | | 84,100 | | | | 3,839,165 | |
| | | | | | | | |
| | | | | | | | 8,862,165 | |
| |
| Total Healthcare (Cost: $13,432,463) | | | | | | | 13,185,915 | |
| |
Industrial — 21.38% | | | | | | | | |
Aerospace & Defense — 3.77% | | | | | | | | |
| L-3 Communication Holdings, Inc. | | | 60,000 | | | | 5,843,400 | |
| |
Electrical Components & Equipment — 5.31% | | | | | | | | |
| Ametek, Inc. | | | 117,500 | | | | 4,662,400 | |
| Amphenol Corp. | | | 100,000 | | | | 3,565,000 | |
| | | | | | | | |
| | | | | | | | 8,227,400 | |
| |
Hand & Machine Tools — 2.97% | | | | | | | | |
| Lincoln Electric Holdings, Inc. | | | 62,000 | | | | 4,602,880 | |
| |
Miscellaneous Manufacturing — 6.68% | | | | | | | | |
| Parker Hannifin Corp. | | | 50,000 | | | | 4,895,500 | |
| Trinity Industries, Inc. | | | 125,000 | | | | 5,442,500 | |
| | | | | | | | |
| | | | | | | | 10,338,000 | |
| |
Transportation — 2.65% | | | | | | | | |
| CSX Corp. | | | 50,000 | | | | 2,254,000 | |
| YRC Worldwide, Inc.(a) | | | 50,000 | | | | 1,840,000 | |
| | | | | | | | |
| | | | | | | | 4,094,000 | |
| |
| Total Industrial (Cost: $28,249,115) | | | | | | | 33,105,680 | |
| |
Technology — 12.13% | | | | | | | | |
Electrical Components & Equipment — 3.47% | | | | | | | | |
| Altera Corp. | | | 242,800 | | | | 5,373,164 | |
| |
Semiconductors — 8.66% | | | | | | | | |
| International Rectifier Corp.(a) | | | 100,000 | | | | 3,726,000 | |
| Kla-Tencor Corp. | | | 85,000 | | | | 4,670,750 | |
| Maxim Integrated Products, Inc. | | | 150,000 | | | | 5,011,500 | |
| | | | | | | | |
| | | | | | | | 13,408,250 | |
| |
| Total Technology (Cost: $16,950,347) | | | | | | | 18,781,414 | |
| |
The accompanying notes are an integral part of the financial statements.
2007 ANNUAL REPORT | 31
Schedule of Investments
Quaker Mid-Cap Value Fund
June 30, 2007
| | | | | | | | | |
| | | Number | | | Fair | |
| | | of Shares | | | Value | |
| |
Common Stocks (Continued) | | | | | | | | |
Utilities — 1.91% | | | | | | | | |
Gas — 1.91% | | | | | | | | |
| Sempra Energy | | | 50,000 | | | $ | 2,961,500 | |
| |
| Total Utilities (Cost: $2,211,648) | | | | | | | 2,961,500 | |
| |
Total Common Stocks
(Cost $137,759,836) | | | | | | | 154,146,885 | |
| |
| | | | | | | | | |
| | | Par | | | | | |
| | | Value | | | | | |
| |
Short-Term Investment — 3.94% | | | | | | | | |
Time Deposit — 3.94% | | | | | | | | |
| Wachovia Bank (Grand Cayman) | | | | | | | | |
| 4.64%, 07/02/2007 | | $ | 6,107,517 | | | | 6,107,517 | |
| |
Total Short-Term Investment
(Cost $6,107,517) | | | | | | | 6,107,517 | |
| |
Total Investment
(Cost $143,867,353) — 103.50% | | | | | | | 160,254,402 | |
| |
Liabilities in Excess of Other Assets, Net (3.50)% | | | | | | | (5,424,594 | ) |
| |
Total Net Assets — 100.00% | | | | | | $ | 154,829,808 | |
| |
| (a) | | Non-income producing security |
32 | 2007 ANNUAL REPORT
Schedule of Investments
Quaker Small-Cap Value Fund
June 30, 2007
| | | | | | | | | |
| | | Number | | | Fair | |
| | | of Shares | | | Value | |
Common Stocks — 97.88% | | | | | | | | |
Basic Materials — 4.71% | | | | | | | | |
Chemicals — 1.75% | | | | | | | | |
| Methanex Corp. | | | 15,200 | | | $ | 382,128 | |
| Nova Chemicals Corp. | | | 20,400 | | | | 725,628 | |
| Terra Industries, Inc.(a) | | | 19,400 | | | | 493,148 | |
| | | | | | | | |
| | | | | | | | 1,600,904 | |
| |
Iron & Steel Production — 2.96% | | | | | | | | |
| Cleveland-Cliffs, Inc. | | | 7,000 | | | | 543,690 | |
| Gerdau Ameristeel Corp. | | | 29,800 | | | | 435,974 | |
| Schnitzer Steel Industries, Inc. | | | 14,100 | | | | 675,954 | |
| Steel Dynamics, Inc. | | | 18,700 | | | | 783,717 | |
| Universal Stainless & Alloy(a) | | | 7,600 | | | | 267,748 | |
| | | | | | | | |
| | | | | | | | 2,707,083 | |
| |
| Total Basic Materials (Cost: $3,769,442) | | | | | | | 4,307,987 | |
| |
Communications — 11.05% | | | | | | | | |
Internet — 4.08% | | | | | | | | |
| Blue Nile, Inc.(a) | | | 6,800 | | | | 410,720 | |
| Check Point Software Technologies(a) | | | 32,300 | | | | 736,763 | |
| Imergent, Inc. | | | 26,700 | | | | 653,082 | |
| j2 Global Communications, Inc.(a) | | | 11,800 | | | | 411,820 | |
| RADVision Ltd.(a) | | | 14,700 | | | | 309,141 | |
| Valueclick, Inc.(a) | | | 21,500 | | | | 633,390 | |
| Vasco Data Security International, Inc.(a) | | | 25,100 | | | | 571,276 | |
| | | | | | | | |
| | | | | | | | 3,726,192 | |
| |
Internet Software & Services — 0.78% | | | | | | | | |
| United Online, Inc. | | | 43,300 | | | | 714,017 | |
| |
Media — 0.69% | | | | | | | | |
| Westwood One, Inc. | | | 87,600 | | | | 629,844 | |
| |
Multimedia — 0.45% | | | | | | | | |
| Shaw Communications, Inc. | | | 9,700 | | | | 407,788 | |
| |
Telecommunications — 5.05% | | | | | | | | |
| Adtran, Inc. | | | 13,700 | | | | 355,789 | |
| Avici Systems, Inc. | | | 36,200 | | | | 271,500 | |
| CenturyTel, Inc. | | | 3,300 | | | | 161,865 | |
| Dobson Communications Corp.(a) | | | 54,500 | | | | 605,495 | |
| InterDigital, Inc.(a) | | | 21,500 | | | | 691,655 | |
| Netgear, Inc.(a) | | | 12,000 | | | | 435,000 | |
| Novatel Wireless, Inc.(a) | | | 32,200 | | | | 837,844 | |
| Premiere Global Services, Inc.(a) | | | 51,700 | | | | 673,134 | |
| Telephone & Data Systems, Inc. | | | 3,300 | | | | 206,481 | |
| USA Mobility, Inc.(a) | | | 14,300 | | | | 382,668 | |
| | | | | | | | |
| | | | | | | | 4,621,431 | |
| |
| Total Communications (Cost: $8,900,679) | | | | | | | 10,099,272 | |
| |
| | | | | | | | | |
| | | Number | | | Fair | |
| | | of Shares | | | Value | |
Common Stocks (Continued) | | | | | | | | |
Consumer, Cyclical — 17.28% | | | | | | | | |
Apparel — 2.14% | | | | | | | | |
| Deckers Outdoor Corp.(a) | | | 8,600 | | | $ | 867,740 | |
| Gymboree Corp.(a) | | | 11,700 | | | | 461,097 | |
| Maidenform Brands, Inc.(a) | | | 31,800 | | | | 631,548 | |
| | | | | | | | |
| | | | | | | | 1,960,385 | |
| |
Auto Parts & Equipment — 1.27% | | | | | | | | |
| Autoliv, Inc. | | | 1,000 | | | | 56,870 | |
| Cooper Tire & Rubber Co. | | | 14,500 | | | | 400,490 | |
| TRW Automotive Holdings Corp.(a) | | | 19,000 | | | | 699,770 | |
| | | | | | | | |
| | | | | | | | 1,157,130 | |
| |
Distribution & Wholesale — 2.43% | | | | | | | | |
| Ingram Micro, Inc.(a) | | | 33,800 | | | | 733,798 | |
| Tech Data Corp.(a) | | | 16,200 | | | | 623,052 | |
| United Stationers, Inc.(a) | | | 12,900 | | | | 859,656 | |
| | | | | | | | |
| | | | | | | | 2,216,506 | |
| |
Home Builders — 0.67% | | | | | | | | |
| NVR, Inc.(a) | | | 900 | | | | 611,775 | |
| |
Home Furnishings — 0.48% | | | | | | | | |
| Tempur-Pedic International, Inc. | | | 17,000 | | | | 440,300 | |
| |
Household Products — 0.71% | | | | | | | | |
| Toro Co. | | | 11,100 | | | | 653,679 | |
| |
Leisure Time — 0.84% | | | | | | | | |
| Polaris Industries, Inc. | | | 14,100 | | | | 763,656 | |
| |
Office Furnishings — 0.54% | | | | | | | | |
| Knoll, Inc. | | | 22,000 | | | | 492,800 | |
| |
Retail — 7.36% | | | | | | | | |
| Aeropostale, Inc.(a) | | | 16,900 | | | | 704,392 | |
| AnnTaylor Stores Corp.(a) | | | 8,500 | | | | 301,070 | |
| Asbury Automotive Group, Inc. | | | 14,100 | | | | 351,795 | |
| Big Lots, Inc.(a) | | | 26,000 | | | | 764,920 | |
| Buffalo Wild Wings, Inc.(a) | | | 16,400 | | | | 682,076 | |
| Dollar Tree Stores, Inc.(a) | | | 14,000 | | | | 609,700 | |
| Ezcorp, Inc.(a) | | | 42,000 | | | | 556,080 | |
| First Cash Financial Services, Inc.(a) | | | 26,500 | | | | 621,160 | |
| Jack in the Box, Inc.(a) | | | 10,600 | | | | 751,964 | |
| Jo-Ann Stores, Inc.(a) | | | 13,000 | | | | 369,590 | |
| RadioShack Corp. | | | 10,400 | | | | 344,656 | |
| The Buckle, Inc. | | | 17,000 | | | | 669,800 | |
| | | | | | | | |
| | | | | | | | 6,727,203 | |
| |
Toys & Hobbies — 0.84% | | | | | | | | |
| Hasbro, Inc. | | | 24,500 | | | | 769,545 | |
| |
| Total Consumer, Cyclical (Cost: $13,319,667) | | | | | | | 15,792,979 | |
| |
The accompanying notes are an integral part of the financial statements.
2007 ANNUAL REPORT | 33
Schedule of Investments
Quaker Small-Cap Value Fund
June 30, 2007
| | | | | | | | | |
| | | Number | | | Fair | |
| | | of Shares | | | Value | |
Common Stocks (Continued) | | | | | | | | |
Consumer, Non-cyclical — 10.39% | | | | | | | | |
Commerical Services — 6.62% | | | | | | | | |
| Advance America Cash Advance Centers, Inc. | | | 26,300 | | | $ | 466,562 | |
| Arbitron, Inc. | | | 8,000 | | | | 412,240 | |
| Bowne & Co., Inc. | | | 36,100 | | | | 704,311 | |
| Chemed Corp. | | | 11,200 | | | | 742,448 | |
| Convergys Corp.(a) | | | 26,000 | | | | 630,240 | |
| Deluxe Corp. | | | 9,200 | | | | 373,612 | |
| Hudson Highland Group, Inc.(a) | | | 16,800 | | | | 359,352 | |
| ITT Educational Services, Inc.(a) | | | 7,700 | | | | 903,826 | |
| Labor Ready, Inc.(a) | | | 30,500 | | | | 704,855 | |
| United Rentals, Inc.(a) | | | 12,100 | | | | 393,734 | |
| Universal Technical Institute, Inc.(a) | | | 14,000 | | | | 355,460 | |
| | | | | | | | |
| | | | | | | | 6,046,640 | |
| |
Cosmetics / Personal Care — 0.41% | | | | | | | | |
| Elizabeth Arden, Inc.(a) | | | 15,600 | | | | 378,456 | |
| |
Food — 1.99% | | | | | | | | |
| J.M. Smucker Co. | | | 4,700 | | | | 299,202 | |
| Nash Finch Co. | | | 11,600 | | | | 574,200 | |
| Sanderson Farms, Inc. | | | 15,800 | | | | 711,316 | |
| Spartan Stores, Inc. | | | 7,100 | | | | 233,661 | |
| | | | | | | | |
| | | | | | | | 1,818,379 | |
| |
Food & Beverages — 0.25% | | | | | | | | |
| Boston Beer, Inc.(a) | | | 5,700 | | | | 224,295 | |
| |
Household Products — 1.12% | | | | | | | | |
| American Greetings Corp. | | | 16,700 | | | | 473,111 | |
| Blyth, Inc. | | | 20,700 | | | | 550,206 | |
| | | | | | | | |
| | | | | | | | 1,023,317 | |
| |
| Total Consumer, Non-Cyclical (Cost: $10,503,723) | | | | | | | 9,491,087 | |
| |
Energy — 5.24% | | | | | | | | |
Coal — 0.39% | | | | | | | | |
| Massey Energy Co. | | | 13,500 | | | | 359,775 | |
| |
Energy-Alternate Sources — 0.63% | | | | | | | | |
| Headwaters, Inc.(a) | | | 33,300 | | | | 575,091 | |
| |
Oil & Gas — 4.09% | | | | | | | | |
| Frontier Oil Corp. | | | 10,200 | | | | 446,454 | |
| Global Industries Ltd.(a) | | | 20,300 | | | | 544,446 | |
| Holly Corp. | | | 11,900 | | | | 882,861 | |
| Parker Drilling Co.(a) | | | 60,400 | | | | 636,616 | |
| Petroquest Energy, Inc.(a) | | | 33,800 | | | | 491,452 | |
| Rosetta Resources, Inc.(a) | | | 15,000 | | | | 323,100 | |
| Tidewater, Inc. | | | 5,800 | | | | 411,104 | |
| | | | | | | | |
| | | | | | | | 3,736,033 | |
| |
Pipelines — 0.13% | | | | | | | | |
| Oneok, Inc. | | | 2,300 | | | | 115,943 | |
| |
| Total Energy (Cost: $4,043,592) | | | | | | | 4,786,842 | |
| |
| | | | | | | | | |
| | | Number | | | Fair | |
| | | of Shares | | | Value | |
Common Stocks (Continued) | | | | | | | | |
Financial — 17.76% | | | | | | | | |
Banks — 2.34% | | | | | | | | |
| The Colonial BancGroup, Inc. | | | 16,000 | | | $ | 399,520 | |
| Corus Bankshares, Inc. | | | 37,000 | | | | 638,620 | |
| Credicorp Ltd. | | | 12,100 | | | | 740,157 | |
| SVB Financial Group(a) | | | 6,700 | | | | 355,837 | |
| | | | | | | | |
| | | | | | | | 2,134,134 | |
| |
Diversified Financial Services — 1.52% | | | | | | | | |
| Eaton Vance Corp. | | | 14,500 | | | | 640,610 | |
| Federated Investors, Inc. | | | 19,600 | | | | 751,268 | |
| | | | | | | | |
| | | | | | | | 1,391,878 | |
| |
Financial Services — 2.03% | | | | | | | | |
| A.G. Edwards, Inc. | | | 9,900 | | | | 837,045 | |
| Advanta Corp. | | | 21,000 | | | | 653,940 | |
| Banco Latinoamericano De Exportaciones SA | | | 19,400 | | | | 364,720 | |
| | | | | | | | |
| | | | | | | | 1,855,705 | |
| |
Insurance — 8.52% | | | | | | | | |
| American Physicians Capital, Inc.(a) | | | 14,250 | | | | 577,125 | |
| Axis Capital Holdings Ltd. | | | 17,900 | | | | 727,635 | |
| Commerce Group, Inc. | | | 19,800 | | | | 687,456 | |
| Everest Re Group Ltd. | | | 4,900 | | | | 532,336 | |
| Hanover Insurance Group, Inc. | | | 14,100 | | | | 687,939 | |
| Infinity Property & Casualty Corp. | | | 7,600 | | | | 385,548 | |
| IPC Holdings Ltd. | | | 21,700 | | | | 700,693 | |
| PartnerRe Ltd. | | | 800 | | | | 62,000 | |
| Platinum Underwriters Holdings Ltd. | | | 19,200 | | | | 667,200 | |
| PMI Group, Inc. | | | 16,800 | | | | 750,456 | |
| RLI Corp. | | | 11,900 | | | | 665,805 | |
| Safety Insurance Group, Inc. | | | 10,000 | | | | 414,000 | |
| Triad Guaranty, Inc.(a) | | | 14,900 | | | | 594,957 | |
| Zenith National Insurance Corp. | | | 7,000 | | | | 329,630 | |
| | | | | | | | |
| | | | | | | | 7,782,780 | |
| |
Real Estate — 0.93% | | | | | | | | |
| Jones Lang LaSalle, Inc. | | | 7,500 | | | | 851,250 | |
| |
REITS — 0.69% | | | | | | | | |
| Cohen & Steers, Inc. | | | 14,600 | | | | 634,370 | |
| |
Savings & Loans — 1.73% | | | | | | | | |
| BankUnited Financial Corp. | | | 31,000 | | | | 622,170 | |
| FirstFed Financial Corp.(a) | | | 9,000 | | | | 510,570 | |
| Franklin Bank Corp.(a) | | | 29,900 | | | | 445,510 | |
| | | | | | | | |
| | | | | | | | 1,578,250 | |
| |
| Total Financial (Cost: $14,692,975) | | | | | | | 16,228,367 | |
| |
Healthcare — 10.15% | | | | | | | | |
Biotechnology — 1.15% | | | | | | | | |
| American Oriental Bioengineering, Inc.(a) | | | 31,400 | | | | 279,460 | |
| Invitrogen Corp.(a) | | | 10,400 | | | | 767,000 | |
| | | | | | | | |
| | | | | | | | 1,046,460 | |
| |
34 | 2007 ANNUAL REPORT
| | | | | | | | | |
| | | Number | | | Fair | |
| | | of Shares | | | Value | |
Common Stocks (Continued) | | | | | | | | |
Healthcare-Products — 4.78% | | | | | | | | |
| Conmed Corp.(a) | | | 19,800 | | | $ | 579,744 | |
| Dade Behring, Inc. | | | 17,300 | | | | 918,976 | |
| Hillenbrand Industries, Inc. | | | 13,200 | | | | 858,000 | |
| Invacare Corp. | | | 31,900 | | | | 584,727 | |
| Quidel Corp.(a) | | | 36,400 | | | | 639,184 | |
| STERIS Corp. | | | 25,800 | | | | 789,480 | |
| | | | | | | | |
| | | | | | | | 4,370,111 | |
| |
Healthcare-Services — 0.40% | | | | | | | | |
| Health Net, Inc.(a) | | | 6,900 | | | | 364,320 | |
| |
Medical Services — 0.62% | | | | | | | | |
| Apria Healthcare Group, Inc.(a) | | | 19,800 | | | | 569,646 | |
| |
Pharmaceuticals — 3.20% | | | | | | | | |
| Aspreva Pharmaceuticals Corp.(a) | | | 28,000 | | | | 484,400 | |
| Axcan Pharma, Inc.(a) | | | 30,700 | | | | 593,431 | |
| Biovail Corp. | | | 28,700 | | | | 729,554 | |
| Cephalon, Inc.(a) | | | 4,400 | | | | 353,716 | |
| King Pharmaceuticals, Inc.(a) | | | 17,400 | | | | 356,004 | |
| Pharmion Corp.(a) | | | 14,200 | | | | 411,090 | |
| | | | | | | | |
| | | | | | | | 2,928,195 | |
| |
| Total Healthcare (Cost: $6,649,879) | | | | | | | 9,278,732 | |
| |
Industrial — 13.05% | | | | | | | | |
Aerospace & Defense — 0.89% | | | | | | | | |
| Alliant Techsystems, Inc.(a) | | | 8,200 | | | | 813,030 | |
| |
Building Materials — 1.19% | | | | | | | | |
| Apogee Enterprises, Inc. | | | 13,000 | | | | 361,660 | |
| Eagle Materials, Inc. | | | 7,500 | | | | 367,875 | |
| Lennox International, Inc. | | | 10,500 | | | | 359,415 | |
| | | | | | | | |
| | | | | | | | 1,088,950 | |
| |
Electrical Components & Equipment — 1.10% | | | | | | | | |
| Avnet, Inc.(a) | | | 10,400 | | | | 412,256 | |
| GrafTech International Ltd.(a) | | | 35,400 | | | | 596,136 | |
| | | | | | | | |
| | | | | | | | 1,008,392 | |
| |
Electronics — 1.20% | | | | | | | | |
| CTS Corp. | | | 11,500 | | | | 145,590 | |
| Dionex Corp.(a) | | | 5,700 | | | | 404,643 | |
| Vishay Intertechnology, Inc.(a) | | | 34,400 | | | | 544,208 | |
| | | | | | | | |
| | | | | | | | 1,094,441 | |
| |
Engineering & Construction — 0.60% | | | | | | | | |
| Dycom Industries, Inc.(a) | | | 18,200 | | | | 545,636 | |
| |
Machinery-Diversified — 0.77% | | | | | | | | |
| Gardner Denver, Inc.(a) | | | 8,400 | | | | 357,420 | |
| Zebra Technologies Corp. | | | 9,000 | | | | 348,660 | |
| | | | | | | | |
| | | | | | | | 706,080 | |
| |
| | | | | | | | | |
| | | Number | | | Fair | |
| | | of Shares | | | Value | |
Common Stocks (Continued) | | | | | | | | |
Manufacturing — 0.59% | | | | | | | | |
| Acuity Brands, Inc. | | | 8,900 | | | $ | 536,492 | |
| |
Metal Fabricate & Hardware — 0.14% | | | | | | | | |
| Timken Co. | | | 3,500 | | | | 126,385 | |
| |
Miscellaneous Manufacturing — 2.72% | | | | | | | | |
| Ceradyne, Inc.(a) | | | 9,900 | | | | 732,204 | |
| EnPro Industries, Inc.(a) | | | 16,000 | | | | 684,640 | |
| Harsco Corp. | | | 6,800 | | | | 353,600 | |
| Teleflex, Inc. | | | 4,400 | | | | 359,832 | |
| Tredegar Corp. | | | 16,500 | | | | 351,450 | |
| | | | | | | | |
| | | | | | | | 2,481,726 | |
| |
Packaging & Containers — 0.29% | | | | | | | | |
| Ball Corp. | | | 5,100 | | | | 271,167 | |
| |
Transportation — 3.56% | | | | | | | | |
| Con-way, Inc. | | | 13,300 | | | | 668,192 | |
| Excel Maritime Carriers Ltd. | | | 26,400 | | | | 664,752 | |
| Frontline Ltd. | | | 14,400 | | | | 660,240 | |
| Saia, Inc.(a) | | | 17,400 | | | | 474,324 | |
| Tsakos Energy Navigation Ltd. | | | 11,300 | | | | 789,983 | |
| | | | | | | | |
| | | | | | | | 3,257,491 | |
| |
| Total Industrial (Cost: $10,770,777) | | | | | | | 11,929,790 | |
| |
Technology — 5.14% | | | | | | | | |
Computer Software & Services — 0.63% | | | | | | | | |
| MicroStrategy, Inc.(a) | | | 6,100 | | | | 576,389 | |
| |
Computers — 0.47% | | | | | | | | |
| Cadence Design Systems, Inc.(a) | | | 19,600 | | | | 430,416 | |
| |
Data Processing — 1.14% | | | | | | | | |
| Dun & Bradstreet Corp. | | | 7,000 | | | | 720,860 | |
| Fair Isaac Corp. | | | 8,100 | | | | 324,972 | |
| | | | | | | | |
| | | | | | | | 1,045,832 | |
| |
Semiconductors — 1.72% | | | | | | | | |
| ChipMOS TECHNOLOGIES Bermuda Ltd.(a) | | | 2,200 | | | | 15,818 | |
| Credence Systems Corp.(a) | | | 85,600 | | | | 308,160 | |
| Emulex Corp.(a) | | | 16,100 | | | | 351,624 | |
|
| Tessera Technologies, Inc.(a) | | | 10,000 | | | | 405,500 | |
| Varian Semiconductor Equipment Associates, Inc.(a) | | | 12,200 | | | | 488,732 | |
| | | | | | | | |
| | | | | | | | 1,569,834 | |
| |
Software — 1.18% | | | | | | | | |
| Compuware Corp.(a) | | | 62,400 | | | | 740,064 | |
| SYNNEX Corp.(a) | | | 16,200 | | | | 333,882 | |
| | | | | | | | |
| | | | | | | | 1,073,946 | |
| |
| Total Technology (Cost: $4,386,266) | | | | | | | 4,696,417 | |
| |
The accompanying notes are an integral part of the financial statements.
2007 ANNUAL REPORT | 35
Schedule of Investments
Quaker Small-Cap Value Fund
June 30, 2007
| | | | | | | | | |
| | | Number | | | Fair | |
| | | of Shares | | | Value | |
Common Stocks (Continued) | | | | | | | | |
Utilities — 3.11% | | | | | | | | |
Electric — 2.27% | | | | | | | | |
| Alliant Energy Corp. | | | 6,200 | | | $ | 240,870 | |
| El Paso Electric Co.(a) | | | 26,100 | | | | 641,016 | |
| Energy East Corp. | | | 30,100 | | | | 785,309 | |
| Wisconsin Energy Corp. | | | 9,200 | | | | 406,916 | |
| | | | | | | | |
| | | | | | | | 2,074,111 | |
| |
Gas — 0.84% | | | | | | | | |
| Energen Corp. | | | 13,900 | | | | 763,666 | |
| |
| Total Utilities (Cost: $2,324,582) | | | | | | | 2,837,777 | |
| |
Total Common Stocks (Cost $79,361,582) | | | | | | | 89,449,250 | |
| |
Warrant — 0.00% | | | | | | | | |
| Imperial Credit Industries, Inc. Warrants Expiration: | | | | | | | | |
| January 2008, Exercise Price: $2.15(a)(b) | | | 806 | | | | 0 | |
| |
Total Warrants (Cost $0) | | | | | | | 0 | |
| |
| | | | | | | | | |
| | | Par | | | Fair | |
| | | Value | | | Value | |
Short-Term Investment — 1.92% | | | | | | | | |
Time Deposit — 1.92% | | | | | | | | |
| Citibank (Nassau) 4.64%, 07/02/2007 | | $ | 1,753,970 | | | $ | 1,753,970 | |
| |
Total Short-Term Investment (Cost $1,753,970) | | | | | | | 1,753,970 | |
| |
Total Investments (Cost $81,115,552) — 99.80% | | | | | | | 91,203,220 | |
| |
Other Assets in Excess of Liabilities, Net 0.20% | | | | | | | 180,830 | |
| |
Total Net Assets — 100.00% | | | | | | $ | 91,384,050 | |
| |
| | |
| (a) | | Non-income producing security |
| |
| (b) | | Restricted security Imperial Credit Industry warrants were acquired on October 19, 2004 at a cost of $0. Since market quotations are not readily available for this security, it was valued at fair value as determined by the Adviser using procedures approved by the Board of Trustees. The total fair value of such securities at June 30, 2007 is $0, which represents 0.00% of total net assets. |
36 | 2007 ANNUAL REPORT
Schedule of Investments
Quaker Core Value Fund
June 30, 2007
| | | | | | | | | |
| | | Number | | | Fair | |
| | | of Shares | | | Value | |
| |
Common Stocks — 99.48% | | | | | | | | |
Basic Materials — 7.45% | | | | | | | | |
Chemicals — 5.68% | | | | | | | | |
| Airgas, Inc. | | | 1,000 | | | $ | 47,900 | |
| HB Fuller Co. | | | 1,320 | | | | 39,455 | |
| Lubrizol Corp. | | | 500 | | | | 32,275 | |
| Praxair, Inc. | | | 1,000 | | | | 71,990 | |
| | | | | | | | |
| | | | | | | | 191,620 | |
| |
Mining — 1.77% | | | | | | | | |
| BHP Billiton Ltd. ADR | | | 1,000 | | | | 59,750 | |
| |
| Total Basic Materials (Cost: $219,154) | | | | | | | 251,370 | |
| |
Communications — 13.47% | | | | | | | | |
Internet Software & Services — 3.57% | | | | | | | | |
| Google, Inc.(a) | | | 230 | | | | 120,377 | |
| |
Media — 0.00% | | | | | | | | |
| Citadel Broadcasting Corp. | | | 26 | | | | 168 | |
| |
Multimedia — 1.57% | | | | | | | | |
| News Corp. Inc. Class A | | | 1,950 | | | | 41,359 | |
| The Walt Disney Co. | | | 340 | | | | 11,608 | |
| | | | | | | | |
| | | | | | | | 52,967 | |
| |
Telecommunications — 8.33% | | | | | | | | |
| America Movil SA de CV ADR | | | 1,000 | | | | 61,930 | |
| AT&T, Inc. | | | 2,100 | | | | 87,149 | |
| Corning, Inc.(a) | | | 2,000 | | | | 51,100 | |
| Leap Wireless International, Inc.(a) | | | 300 | | | | 25,350 | |
| Telecom Argentina SA ADR(a) | | | 500 | | | | 12,460 | |
| Telekomunikasi Indonesia Tbk PT ADR | | | 1,000 | | | | 43,100 | |
| | | | | | | | |
| | | | | | | | 281,089 | |
| |
| Total Communications (Cost: $408,082) | | | | | | | 454,601 | |
| |
Consumer, Cyclical — 4.46% | | | | | | | | |
Auto Manufacturers — 2.87% | | | | | | | | |
| Oshkosh Truck Corp. | | | 1,540 | | | | 96,897 | |
| |
Lodging — 0.54% | | | | | | | | |
| Wyndham Worldwide Corp.(a) | | | 500 | | | | 18,130 | |
| |
Retail — 1.05% | | | | | | | | |
| CVS Caremark Corp. | | | 970 | | | | 35,357 | |
| |
| Total Consumer, Cyclical (Cost: $129,195) | | | | | | | 150,384 | |
| |
Consumer, Non-cyclical — 8.81% | | | | | | | | |
Commerical Services — 1.50% | | | | | | | | |
| Avis Budget Group, Inc.(a) | | | 1,140 | | | | 32,410 | |
| Robert Half International, Inc. | | | 500 | | | | 18,250 | |
| | | | | | | | |
| | | | | | | | 50,660 | |
| |
| | | | | | | | | |
| | | Number | | | Fair | |
| | | of Shares | | | Value | |
| |
Common Stocks (Continued) | | | | | | | | |
Cosmetics & Toiletries — 4.46% | | | | | | | | |
| Procter & Gamble Co. | | | 2,460 | | | $ | 150,528 | |
| |
Food — 0.37% | | | | | | | | |
| Koninklijke Ahold NV ADR(a) | | | 1,000 | | | | 12,520 | |
| |
Food & Beverages — 1.54% | | | | | | | | |
| PepsiCo, Inc. | | | 800 | | | | 51,880 | |
| |
Household Products — 0.94% | | | | | | | | |
| Avery Dennison Corp. | | | 480 | | | | 31,910 | |
| |
| Total Consumer, Non-Cyclical (Cost: $294,914) | | | | | | | 297,498 | |
| |
Energy — 7.84% | | | | | | | | |
Gas — 0.83% | | | | | | | | |
| Williams Cos., Inc. | | | 890 | | | | 28,142 | |
| |
Oil & Gas — 2.52% | | | | | | | | |
| Apache Corp. | | | 600 | | | | 48,954 | |
| Chesapeake Energy Corp. | | | 1,040 | | | | 35,984 | |
| | | | | | | | |
| | | | | | | | 84,938 | |
| |
Oil & Gas Services — 3.92% | | | | | | | | |
| Cameron International Corp.(a) | | | 700 | | | | 50,029 | |
| Schlumberger Ltd. | | | 500 | | | | 42,470 | |
| Superior Energy Services(a) | | | 1,000 | | | | 39,920 | |
| | | | | | | | |
| | | | | | | | 132,419 | |
| |
Pipelines — 0.57% | | | | | | | | |
| Questar Corp. | | | 360 | | | | 19,026 | |
| |
| Total Energy (Cost: $221,805) | | | | | | | 264,525 | |
| |
Financial — 31.38% | | | | | | | | |
Banks — 5.27% | | | | | | | | |
| Allied Irish Banks PLC ADR | | | 1,200 | | | | 65,952 | |
| Bank of America Corp. | | | 600 | | | | 29,334 | |
| Deutsche Bank AG | | | 450 | | | | 65,133 | |
| Wells Fargo & Co. | | | 500 | | | | 17,585 | |
| | | | | | | | |
| | | | | | | | 178,004 | |
| |
Diversified Financial Services — 9.90% | | | | | | | | |
| American Express Co. | | | 1,100 | | | | 67,298 | |
| Credit Suisse Group ADR | | | 1,100 | | | | 78,056 | |
| Goldman Sachs Group, Inc. | | | 100 | | | | 21,675 | |
| Lehman Brothers Holdings, Inc. | | | 500 | | | | 37,260 | |
| Merrill Lynch & Co., Inc. | | | 950 | | | | 79,401 | |
| Morgan Stanley | | | 600 | | | | 50,328 | |
| | | | | | | | |
| | | | | | | | 334,018 | |
| |
The accompanying notes are an integral part of the financial statements.
2007 ANNUAL REPORT | 37
Schedule of Investments
Quaker Core Value Fund
June 30, 2007
| | | | | | | | | |
| | | Number | | | Fair | |
| | | of Shares | | | Value | |
| |
Common Stocks (Continued) | | | | | | | | |
Insurance — 15.57% | | | | | | | | |
| American International Group, Inc. | | | 980 | | | $ | 68,628 | |
| Chubb Corp. | | | 1,020 | | | | 55,223 | |
| CNA Financial Corp. | | | 1,000 | | | | 47,690 | |
| Endurance Specialty Holdings Ltd. | | | 790 | | | | 31,632 | |
| HCC Insurance Holdings, Inc. | | | 1,700 | | | | 56,797 | |
| Markel Corp.(a) | | | 100 | | | | 48,456 | |
| PMI Group, Inc. | | | 1,440 | | | | 64,325 | |
| Reinsurance Group of America, Inc. | | | 1,000 | | | | 60,240 | |
| Transatlantic Holdings, Inc. | | | 900 | | | | 64,017 | |
| W.R. Berkley Corp. | | | 880 | | | | 28,635 | |
| | | | | | | | |
| | | | | | | | 525,643 | |
| |
Investment Companies — 0.64% | | | | | | | | |
| KKR Financial Holdings LLC | | | 860 | | | | 21,423 | |
| |
| Total Financial (Cost: $1,060,086) | | | | | | | 1,059,088 | |
| |
Healthcare — 3.31% | | | | | | | | |
Healthcare-Products — 1.73% | | | | | | | | |
| Johnson & Johnson | | | 950 | | | | 58,539 | |
| |
Healthcare-Services — 0.93% | | | | | | | | |
| Quest Diagnostics, Inc. | | | 610 | | | | 31,506 | |
| |
Medical Services — 0.14% | | | | | | | | |
| Alliance Imaging, Inc.(a) | | | 500 | | | | 4,695 | |
| |
Pharmaceuticals — 0.51% | | | | | | | | |
| Wyeth | | | 300 | | | | 17,202 | |
| |
| Total Healthcare (Cost: $113,472) | | | | | | | 111,942 | |
| |
Industrial — 14.98% | | | | | | | | |
Aerospace & Defense — 0.94% | | | | | | | | |
| Raytheon Co. | | | 590 | | | | 31,795 | |
| |
Electronics — 0.68% | | | | | | | | |
| Agilent Technologies, Inc.(a) | | | 600 | | | | 23,064 | |
| |
Engineering & Construction — 2.33% | | | | | | | | |
| ABB Ltd. ADR | | | 2,000 | | | | 45,200 | |
| Fluor Corp. | | | 300 | | | | 33,411 | |
| | | | | | | | |
| | | | | | | | 78,611 | |
| |
Machinery—Diversified — 0.97% | | | | | | | | |
| IDEX Corp. | | | 850 | | | | 32,759 | |
| |
Miscellaneous Manufacturing — 7.54% | | | | | | | | |
| Dover Corp. | | | 1,200 | | | | 61,380 | |
| General Electric Co. | | | 4,500 | | | | 172,260 | |
| Harsco Corp. | | | 400 | | | | 20,800 | |
| | | | | | | | |
| | | | | | | | 254,440 | |
| |
| | | | | | | | | |
| | | Number | | | Fair | |
| | | of Shares | | | Value | |
| |
Common Stocks (Continued) | | | | | | | | |
Transportation — 1.26% | | | | | | | | |
| Norfolk Southern Corp. | | | 810 | | | $ | 42,582 | |
| |
Trucking & Leasing — 1.26% | | | | | | | | |
| GATX Corp. | | | 860 | | | | 42,355 | |
| |
| Total Industrial (Cost: $459,215) | | | | | | | 505,606 | |
| |
Technology — 5.94% | | | | | | | | |
Computers — 2.89% | | | | | | | | |
| Apple, Inc.(a) | | | 640 | | | | 78,106 | |
| Western Digital Corp.(a) | | | 1,000 | | | | 19,350 | |
| | | | | | | | |
| | | | | | | | 97,456 | |
| |
Data Processing — 3.05% | | | | | | | | |
| Dun & Bradstreet Corp. | | | 1,000 | | | | 102,980 | |
| |
| Total Technology (Cost: $167,722) | | | | | | | 200,436 | |
| |
Utilities — 1.84% | | | | | | | | |
Electric — 1.03% | | | | | | | | |
| Constellation Energy Group, Inc. | | | 400 | | | | 34,868 | |
| |
Gas — 0.81% | | | | | | | | |
| UGI Corp. | | | 1,000 | | | | 27,280 | |
| |
| Total Utilities (Cost: $64,533) | | | | | | | 62,148 | |
| |
Total Common Stocks
(Cost $3,138,178) | | | | | | | 3,357,598 | |
| |
| | | | | | | | | |
| | | Par | | | | | |
| | | Value | | | | | |
| |
Short-Term Investment — 1.28% | | | | | | | | |
Time Deposit — 1.28% | | | | | | | | |
| BBH Grand Cayman 4.64%, 07/02/2007 | | $ | 43,303 | | | | 43,303 | |
| |
Total Short-Term Investment
(Cost $43,303) | | | | | | | 43,303 | |
| |
Total Investments
(Cost $3,181,481) — 100.76% | | | | | | | 3,400,901 | |
| |
Liabilities in Excess of Other Assets, Net (0.76)% | | | | | | | (25,674 | ) |
| |
Total Net Assets — 100.00% | | | | | | $ | 3,375,227 | |
| |
| | |
| ADR | | American Depositary Receipt |
| |
| (a) | | Non-income producing security |
38 | 2007 ANNUAL REPORT
[This page intentionally left blank]
Statements of Assets and Liabilities
June 30, 2007
| | | | | | | | | | | | | |
| | | Growth Funds |
| | | Quaker | | Quaker | | Quaker |
| | | Strategic | | Core | | Small-Cap |
| | | Growth | | Equity | | Growth |
| | | Fund | | Fund | | Fund |
| |
ASSETS: | | | | | | | | | | | | |
| Investments in unaffiliated issuers, at value | | $ | 752,816,180 | | | $ | 13,176,998 | | | $ | 4,005,722 | |
| |
Total investments | | | 752,816,180 | | | | 13,176,998 | | | | 4,005,722 | |
| |
| Cash | | | 287,458 | | | | — | | | | — | |
| Deposits with brokers for securities sold short | | | 21,848,779 | | | | — | | | | — | |
| Receivables: | | | | | | | | | | | | |
| Dividends and interest | | | 315,900 | | | | 9,044 | | | | 3,124 | |
| Capital shares sold | | | 1,653,968 | | | | — | | | | — | |
| Investment securities sold | | | 5,957,595 | | | | 1,018,739 | | | | — | |
| Commission Recapture | | | 30,906 | | | | — | | | | — | |
| Prepaid expenses and other assets | | | 246,354 | | | | 4,830 | | | | 1,906 | |
| |
Total assets | | | 783,157,140 | | | | 14,209,611 | | | | 4,010,752 | |
| |
| | | | | | | | | | | | | |
LIABILITIES: | | | | | | | | | | | | |
| Payables: | | | | | | | | | | | | |
| Due to custodian | | | — | | | | 8 | | | | 7 | |
| Due to advisor (note 3) | | | 805,480 | | | | 11,412 | | | | 3,473 | |
| Capital shares redeemed | | | 1,311,983 | | | | 65 | | | | 33 | |
| Investment securities purchased | | | 13,002,801 | | | | 1,052,050 | | | | — | |
| Securities sold short, at value | | | — | | | | — | | | | — | |
| Distributions fees | | | 227,489 | | | | 2,179 | | | | 380 | |
| Trustee expenses | | | 59,449 | | | | — | | | | 37 | |
| Accrued expenses | | | 444,000 | | | | 6,086 | | | | 3,020 | |
| |
Total liabilities | | | 15,851,202 | | | | 1,071,800 | | | | 6,950 | |
| |
NET ASSETS | | $ | 767,305,938 | | | $ | 13,137,811 | | | $ | 4,003,802 | |
| |
| | | | | | | | | | | | | |
NET ASSETS CONSIST OF: | | | | | | | | | | | | |
| Paid-in capital | | $ | 600,558,169 | | | $ | 15,692,059 | | | $ | 3,372,346 | |
| Accumulated net realized gain (loss) on investments | | | 74,233,725 | | | | (3,516,432 | ) | | | 425,207 | |
| Accumulated net investment income (loss) | | | — | | | | — | | | | — | |
| Net unrealized appreciation on investments | | | 92,514,044 | | | | 962,184 | | | | 206,249 | |
| |
Total Net Assets | | $ | 767,305,938 | | | $ | 13,137,811 | | | $ | 4,003,802 | |
| |
Investments in unaffiliated issuers, at Cost | | $ | 660,302,136 | | | $ | 12,214,814 | | | $ | 3,799,473 | |
| |
Total Investments, at Cost | | | 660,302,136 | | | | 12,214,814 | | | | 3,799,473 | |
| |
Proceeds from Securities Sold Short | | | — | | | | — | | | | — | |
| | | | | | | | | | | | | |
Class A shares: | | | | | | | | | | | | |
| Net Assets | | $ | 629,530,737 | | | $ | 9,744,143 | | | $ | 665,116 | |
| |
Shares of Beneficial interest outstanding(1) | | | 24,506,338 | | | | 687,840 | | | | 57,858 | |
| |
Net Assets Value and redemption(2) price per share | | $ | 25.69 | | | $ | 14.17 | | | $ | 11.50 | |
| |
| Offering price per share (100 ÷ 94.50 x net asset value per share) | | $ | 27.19 | | | $ | 14.99 | | | $ | 12.17 | |
| |
Class B shares: | | | | | | | | | | | | |
| Net Assets | | $ | 14,428,945 | | | $ | 133,445 | | | $ | 149,623 | |
| |
Shares of Beneficial interest outstanding(1) | | | 589,880 | | | | 9,900 | | | | 13,694 | |
| |
Net Assets Value, offering and redemption(2) price per share | | $ | 24.46 | | | $ | 13.48 | | | $ | 10.93 | |
| |
Class C shares: | | | | | | | | | | | | |
| Net Assets | | $ | 108,241,160 | | | $ | 67,181 | | | $ | 144,005 | |
| |
Shares of Beneficial interest outstanding(1) | | | 4,443,765 | | | | 5,015 | | | | 13,096 | |
| |
Net Assets Value, offering and redemption(2) price per share | | $ | 24.36 | | | $ | 13.40 | | | $ | 11.00 | |
| |
Class I shares: | | | | | | | | | | | | |
| Net Assets | | $ | 15,105,096 | | | $ | 3,193,042 | | | $ | 3,045,058 | |
| |
Shares of Beneficial interest outstanding(1) | | | 578,946 | | | | 234,122 | | | | 256,619 | |
| |
| Net Assets Value, offering and redemption price per share | | $ | 26.09 | | | $ | 13.64 | | | $ | 11.87 | |
| |
| | |
| 1 | | Unlimited number of shares of beneficial interest with a $0.01 par value, authorized. |
| |
| 2 | | Redemption price per share may be reduced for any applicable contingent deferred sales charge. |
40 | 2007 ANNUAL REPORT
| | | | | | | | | | | | | | | | | | | | | |
| | | Growth Funds | | Value Funds |
| | | Quaker | | Quaker | | Quaker | | Quaker | | Quaker |
| | | Capital | | Biotech Pharma- | | Mid-Cap | | Small-Cap | | Core |
| | | Opportunities | | Healthcare | | Value | | Value | | Value |
| | | Fund | | Fund | | Fund | | Fund | | Fund |
| |
| | | | | | | | | | | | | | | | | | | | | |
| | | $ | 17,071,011 | | | $ | 8,903,663 | | | $ | 160,254,402 | | | $ | 91,203,220 | | | $ | 3,400,901 | |
| |
| | | | 17,071,011 | | | | 8,903,663 | | | | 160,254,402 | | | | 91,203,220 | | | | 3,400,901 | |
| |
| | | | — | | | | — | | | | 1,514 | | | | — | | | | — | |
| | | | — | | | | 2,746,506 | | | | — | | | | — | | | | — | |
| | | | | | | | | | | | | | | | | | | | | |
| | | | 21,121 | | | | 3,760 | | | | 99,890 | | | | 57,101 | | | | 2,926 | |
| | | | — | | | | — | | | | 569,206 | | | | 236,150 | | | | — | |
| | | | — | | | | 75,067 | | | | — | | | | 733,868 | | | | 197,005 | |
| | | | — | | | | — | | | | — | | | | — | | | | — | |
| | | | 8,615 | | | | 8,226 | | | | 31,915 | | | | 26,006 | | | | 1,687 | |
| |
| | | | 17,100,747 | | | | 11,737,222 | | | | 160,956,927 | | | | 92,256,345 | | | | 3,602,519 | |
| |
| | | | | | | | | | | | | | | | | | | | | |
| | | | | | | | | | | | | | | | | | | | | |
| | | | | | | | | | | | | | | | | | | | | |
| | | | 191 | | | | 136 | | | | — | | | | 11,693 | | | | 951 | |
| | | | 15,058 | | | | 12,210 | | | | 133,828 | | | | 83,172 | | | | — | |
| | | | 1,007 | | | | 13,149 | | | | 1,133,936 | | | | 177,462 | | | | — | |
| | | | — | | | | — | | | | 4,775,800 | | | | 542,477 | | | | 223,042 | |
| | | | — | | | | 1,772,993 | | | | — | | | | — | | | | — | |
| | | | 9,289 | | | | 5,140 | | | | 42,287 | | | | 21,611 | | | | 699 | |
| | | | 794 | | | | 77 | | | | — | | | | 858 | | | | 67 | |
| | | | 12,772 | | | | 6,221 | | | | 41,268 | | | | 35,022 | | | | 2,533 | |
| |
| | | | 39,111 | | | | 1,809,926 | | | | 6,127,119 | | | | 872,295 | | | | 227,292 | |
| |
| | | $ | 17,061,636 | | | $ | 9,927,296 | | | $ | 154,829,808 | | | $ | 91,384,050 | | | $ | 3,375,227 | |
| |
| | | | | | | | | | | | | | | | | | | | | |
| | | | | | | | | | | | | | | | | | | | | |
| | | $ | 13,952,432 | | | $ | 10,121,780 | | | $ | 132,714,929 | | | $ | 71,189,573 | | | $ | 2,780,523 | |
| | | | 1,666,700 | | | | (394,368 | ) | | | 5,727,830 | | | | 10,106,474 | | | | 370,219 | |
| | | | — | | | | — | | | | — | | | | — | | | | 5,065 | |
| | | | 1,442,504 | | | | 199,884 | | | | 16,387,049 | | | | 10,088,003 | | | | 219,420 | |
| |
| | | $ | 17,061,636 | | | $ | 9,927,296 | | | $ | 154,829,808 | | | $ | 91,384,050 | | | $ | 3,375,227 | |
| |
| | | $ | 15,628,507 | | | $ | 8,778,855 | | | $ | 143,867,353 | | | $ | 81,115,552 | | | $ | 3,181,481 | |
| |
| | | | 15,628,507 | | | | 8,778,855 | | | | 143,867,353 | | | | 81,115,552 | | | | 3,181,481 | |
| |
| | | | — | | | | 1,848,068 | | | | — | | | | — | | | | — | |
| | | | | | | | | | | | | | | | | | | | | |
| | | | | | | | | | | | | | | | | | | | | |
| | | $ | 8,015,872 | | | $ | 5,148,835 | | | $ | 135,679,581 | | | $ | 46,384,512 | | | $ | 3,375,227 | |
| |
| | | | 709,650 | | | | 413,659 | | | | 7,604,344 | | | | 2,239,278 | | | | 249,087 | |
| |
| | | $ | 11.30 | | | $ | 12.45 | | | $ | 17.84 | | | $ | 20.71 | | | $ | 13.55 | |
| |
| | | $ | 11.96 | | | $ | 13.17 | | | $ | 18.88 | | | $ | 21.92 | | | $ | 14.34 | |
| |
| | | | | | | | | | | | | | | | | | | | | |
| | | $ | 596,540 | | | $ | 836,749 | | | $ | 2,273,317 | | | $ | 1,022,979 | | | | | |
| |
| | | | 54,617 | | | | 69,906 | | | | 134,307 | | | | 52,791 | | | | | |
| |
| | | $ | 10.92 | | | $ | 11.97 | | | $ | 16.93 | | | $ | 19.38 | | | | | |
| |
| | | | | | | | | | | | | | | | | | | | | |
| | | $ | 8,449,224 | | | $ | 3,941,712 | | | $ | 14,974,901 | | | $ | 13,436,297 | | | | | |
| |
| | | | 773,910 | | | | 329,127 | | | | 899,189 | | | | 715,947 | | | | | |
| |
| | | $ | 10.92 | | | $ | 11.98 | | | $ | 16.65 | | | $ | 18.77 | | | | | |
| |
| | | | | | | | | | | | | | | | | | | | | |
| | | | | | | | | | | $ | 1,902,009 | | | $ | 30,540,262 | | | | | |
| |
| | | | | | | | | | | | 103,774 | | | | 1,441,446 | | | | | |
| |
| | | | | | | | | | | $ | 18.33 | | | $ | 21.19 | | | | | |
| |
The accompanying notes are an integral part of the financial statements.
2007 ANNUAL REPORT | 41
Statement of Operations
For the Fiscal Year Ended June 30, 2007
| | | | | | | | | | | | | |
| | | Growth Funds |
| | | Quaker | | Quaker | | Quaker |
| | | Strategic | | Core | | Small-Cap |
| | | Growth Fund | | Equity Fund | | Growth Fund |
| |
INVESTMENT INCOME | | | | | | | | | | | | |
| | | | | | | | | | | | | |
Income: | | | | | | | | | | | | |
| Dividends (net of foreign withholding taxes) | | $ | 8,545,733 | | | $ | 143,544 | | | $ | 40,391 | |
| Dividends from affiliate company | | | 501,428 | | | | — | | | | — | |
| Interest | | | 9,859,739 | | | | 11,792 | | | | 3,260 | |
| |
Total Income | | | 18,906,900 | | | | 155,336 | | | | 43,651 | |
| |
| | | | | | | | | | | | | |
Expenses: | | | | | | | | | | | | |
| Investment advisory fees (note 3) | | | 11,511,920 | | | | 130,307 | | | | 39,949 | |
| Fund administration, accounting, and transfer agent fees (note 3) | | | 1,271,712 | | | | 18,046 | | | | 5,649 | |
| Custody fees | | | 214,439 | | | | 12,522 | | | | 13,570 | |
| Trustee fees and meeting expenses | | | 442,374 | | | | 5,193 | | | | 1,674 | |
| Legal fees | | | 193,507 | | | | 2,223 | | | | 569 | |
| Audit Fees | | | 157,556 | | | | 1,981 | | | | 608 | |
| Distribution fee — Class A | | | 1,840,643 | | | | 22,700 | | | | 1,772 | |
| Distribution fee — Class B | | | 146,721 | | | | 1,358 | | | | 1,374 | |
| Distribution fee — Class C | | | 1,011,203 | | | | 802 | | | | 1,743 | |
| Officers’ Compensation fees | | | 149,290 | | | | 2,072 | | | | 639 | |
| Registration and filing expenses | | | 111,137 | | | | 11,464 | | | | 4,966 | |
| Printing expenses | | | 292,791 | | | | 3,797 | | | | 1,110 | |
| Dividends on securities sold short | | | 33,152 | | | | — | | | | — | |
| Other operating expenses | | | 254,541 | | | | 5,238 | | | | 3,458 | |
| |
Total expenses | | | 17,630,986 | | | | 217,703 | | | | 77,081 | |
| |
| Less: | | | | | | | | | | | | |
| Investment advisory fees waived & reimbursed (note 3) | | | — | | | | — | | | | — | |
Net expenses | | | 17,630,986 | | | | 217,703 | | | | 77,081 | |
| |
Net investment income (loss) | | | 1,275,914 | | | | (62,367 | ) | | | (33,430 | ) |
| |
| | | | | | | | | | | | | |
| REALIZED AND UNREALIZED GAIN (LOSS) ON INVESTMENTS AND FOREIGN CURRENCY TRANSACTIONS: |
| | | | | | | | | | | | | |
Net realized gain (loss) from investments, unaffiliated issuers (excluding short securities) | | | 78,313,812 | | | | 1,619,090 | | | | 460,403 | |
Net realized gain from affiliated company | | | 3,902,390 | | | | — | | | | — | |
Net realized loss from short securities | | | (2,858,246 | ) | | | — | | | | — | |
Net realized loss from written options | | | (419,680 | ) | | | — | | | | — | |
Net realized loss from foreign currency transactions | | | — | | | | — | | | | — | |
Net unrealized appreciation (depreciation) on investments, unaffiliated issuers (excluding short securities) | | | 58,801,332 | | | | (74,497 | ) | | | 25,383 | |
Net unrealized depreciation on investments, affiliated company | | | (10,500,615 | ) | | | — | | | | — | |
Net unrealized appreciation on short securities | | | 1,087,079 | | | | — | | | | — | |
| |
Net realized and unrealized gain on investments and foreign currency transactions | | | 128,326,072 | | | | 1,544,593 | | | | 485,786 | |
| |
Net increase in net assets resulting from operations | | $ | 129,601,986 | | | $ | 1,482,226 | | | $ | 452,356 | |
| |
Foreign withholding taxes on dividends | | $ | 133,284 | | | $ | 1,128 | | | $ | — | |
| |
42 | 2007 ANNUAL REPORT
| | | | | | | | | | | | | | | | | | | | | |
| | | Growth Funds | | Value Funds |
| | | Quaker | | Quaker | | Quaker | | Quaker | | Quaker |
| | | Capital | | Biotech Pharma- | | Mid-Cap | | Small-Cap | | Core |
| | | Opportunities Fund | | Healthcare Fund | | Value Fund | | Value Fund | | Value Fund |
| |
| | | | | | | | | | | | | | | | | | | | | |
| | | | | | | | | | | | | | | | | | | | | |
| | | | | | | | | | | | | | | | | | | | | |
| | | $ | 278,195 | | | $ | 648 | | | $ | 1,255,347 | | | $ | 1,128,172 | | | $ | 41,699 | |
| | | | — | | | | — | | | | — | | | | — | | | | — | |
| | | | 121,577 | | | | 173,482 | | | | 94,469 | | | | 78,485 | | | | 2,233 | |
| |
| | | | 399,772 | | | | 174,130 | | | | 1,349,816 | | | | 1,206,657 | | | | 43,932 | |
| |
| | | | | | | | | | | | | | | | | | | | | |
| | | | | | | | | | | | | | | | | | | | | |
| | | | 212,222 | | | | 173,464 | | | | 1,302,046 | | | | 990,479 | | | | 32,495 | |
| | | | 29,210 | | | | 17,338 | | | | 178,709 | | | | 118,887 | | | | 4,501 | |
| | | | 17,112 | | | | 22,381 | | | | 32,816 | | | | 31,598 | | | | 7,409 | |
| | | | 9,229 | | | | 4,848 | | | | 54,924 | | | | 37,280 | | | | 1,468 | |
| | | | 3,695 | | | | 1,404 | | | | 24,620 | | | | 15,382 | | | | 557 | |
| | | | 3,435 | | | | 1,969 | | | | 18,862 | | | | 13,104 | | | | 486 | |
| | | | 23,866 | | | | 17,076 | | | | 260,856 | | | | 103,634 | | | | 7,737 | |
| | | | 7,148 | | | | 9,985 | | | | 21,891 | | | | 10,094 | | | | — | |
| | | | 99,517 | | | | 41,342 | | | | 158,559 | | | | 113,291 | | | | — | |
| | | | 3,393 | | | | 2,073 | | | | 20,357 | | | | 13,775 | | | | 514 | |
| | | | 13,402 | | | | 18,834 | | | | 31,708 | | | | 24,686 | | | | 3,421 | |
| | | | 8,116 | | | | 2,640 | | | | 40,267 | | | | 25,764 | | | | 941 | |
| | | | — | | | | — | | | | — | | | | — | | | | — | |
| | | | 5,376 | | | | 4,366 | | | | 24,616 | | | | 23,439 | | | | 2,861 | |
| |
| | | | 435,721 | | | | 317,720 | | | | 2,170,231 | | | | 1,521,413 | | | | 62,390 | |
| |
| | | | | | | | | | | | | | | | | | | | | |
| | | | — | | | | — | | | | — | | | | 70,055 | | | | 32,495 | |
| | | | 435,721 | | | | 317,720 | | | | 2,170,231 | | | | 1,451,358 | | | | 29,895 | |
| |
| | | | (35,949 | ) | | | (143,590 | ) | | | (820,415 | ) | | | (244,701 | ) | | | 14,037 | |
| |
| | | | | | | | | | | | | | | | | | | | | |
| | | | | | | | | | | | | | | | | | | | | |
| | | | | | | | | | | | | | | | | | | | | |
| | | | | | | | | | | | | | | | | | | | | |
| | | | 2,125,175 | | | | (87,114 | ) | | | 6,641,912 | | | | 11,914,134 | | | | 386,947 | |
| | | | — | | | | — | | | | — | | | | — | | | | — | |
| | | | — | | | | (79,938 | ) | | | — | | | | — | | | | — | |
| | | | — | | | | — | | | | — | | | | — | | | | — | |
| | | | — | | | | (15,012 | ) | | | — | | | | — | | | | — | |
| | | | | | | | | | | | | | | | | | | | | |
| | | | (365,054 | ) | | | 1,080,468 | | | | 11,593,452 | | | | 2,315,841 | | | | 79,245 | |
| | | | — | | | | — | | | | — | | | | — | | | | — | |
| | | | — | | | | 6,694 | | | | — | | | | — | | | | — | |
| |
| | | | | | | | | | | | | | | | | | | | | |
| | | | 1,760,121 | | | | 905,098 | | | | 18,235,364 | | | | 14,229,975 | | | | 466,192 | |
| |
| | | $ | 1,724,172 | | | $ | 761,508 | | | $ | 17,414,949 | | | $ | 13,985,274 | | | $ | 480,229 | |
| |
| | | $ | 3,650 | | | $ | — | | | $ | — | | | $ | 6,164 | | | $ | 363 | |
| |
The accompanying notes are an integral part of the financial statements.
2007 ANNUAL REPORT | 43
Statements of Changes in Net Assets
For the Fiscal Year Ended June 30, 2007
| | | | | | | | | | | | | |
| | | Growth Funds |
| | | Quaker | | Quaker | | Quaker |
| | | Strategic | | Core | | Small-Cap |
| | | Growth Fund | | Equity Fund | | Growth Fund |
| |
INCREASE (DECREASE) IN NET ASSETS | | | | | | | | | | | | |
Operations | | | | | | | | | | | | |
| Net investment income (loss) | | $ | 1,275,914 | | | $ | (62,367 | ) | | $ | (33,430 | ) |
| Net realized gain (loss) from investment transactions and foreign currency transactions | | | 78,938,276 | | | | 1,619,090 | | | | 460,403 | |
| Change in net unrealized appreciation (depreciation) on investments | | | 49,387,796 | | | | (74,497 | ) | | | 25,383 | |
| |
Net increase in net assets resulting from operations | | | 129,601,986 | | | | 1,482,226 | | | | 452,356 | |
| |
Distributions to shareholders from | | | | | | | | | | | | |
| Net investment income — Class A | | | (2,900,910 | ) | | | — | | | | — | |
| Net investment income — Class B | | | — | | | | — | | | | — | |
| Net investment income — Class C | | | — | | | | — | | | | — | |
| Net investment income — Class I | | | (248,934 | ) | | | — | | | | — | |
| Net realized capital gain — Class A | | | (76,183,989 | ) | | | — | | | | (32,807 | ) |
| Net realized capital gain — Class B | | | (1,533,711 | ) | | | — | | | | (5,912 | ) |
| Net realized capital gain — Class C | | | (10,701,494 | ) | | | — | | | | (7,603 | ) |
| Net realized capital gain — Class I | | | (3,765,560 | ) | | | — | | | | (112,989 | ) |
| |
Total Distributions | | | (95,334,598 | ) | | | — | | | | (159,311 | ) |
| |
Capital share transactions | | | | | | | | | | | | |
| Increase (decrease) in net assets from fund share transactions (note 10) | | | (323,962,274 | ) | | | (544,516 | ) | | | (173,616 | ) |
| |
Total increase (decrease) in net assets | | | (289,694,886 | ) | | | 937,710 | | | | 119,429 | |
| |
| | | | | | | | | | | | | |
NET ASSETS | | | | | | | | | | | | |
| Beginning of period | | | 1,057,000,824 | | | | 12,200,101 | | | | 3,884,373 | |
| |
| End of period | | $ | 767,305,938 | | | $ | 13,137,811 | | | $ | 4,003,802 | |
| |
| Undistributed accumulated net investment income, at end of period | | $ | — | | | $ | — | | | $ | — | |
| |
For the Fiscal Year Ended June 30, 2006
| | | | | | | | | | | | | |
INCREASE (DECREASE) IN NET ASSETS | | | | | | | | | | | | |
Operations | | | | | | | | | | | | |
| Net investment income (loss) | | $ | 1,126,195 | | | $ | (63,388 | ) | | $ | (32,398 | ) |
| Net realized gain from investment transactions and foreign currency transactions | | | 110,199,094 | | | | 486,595 | | | | 680,677 | |
| Change in net unrealized appreciation (depreciation) on investments | | | (19,235,874 | ) | | | 666,779 | | | | (243,874 | ) |
| |
Net increase in net assets resulting from operations | | | 92,089,415 | | | | 1,089,986 | | | | 404,405 | |
| |
Distributions to shareholders from | | | | | | | | | | | | |
| Net investment income — Class A | | | — | | | | — | | | | — | |
| Net investment income — Class B | | | — | | | | — | | | | — | |
| Net investment income — Class C | | | — | | | | — | | | | — | |
| Net investment income — Class I | | | — | | | | — | | | | — | |
| Net realized capital gain — Class A | | | (37,378,459 | ) | | | — | | | | — | |
| Net realized capital gain — Class B | | | (944,789 | ) | | | — | | | | — | |
| Net realized capital gain — Class C | | | (5,012,351 | ) | | | — | | | | — | |
| Net realized capital gain — Class I | | | (1,867,570 | ) | | | — | | | | — | |
| |
Total Distributions | | | (45,203,169 | ) | | | — | | | | — | |
| |
Capital share transactions | | | | | | | | | | | | |
| Increase (decrease) in net assets from fund share transactions (note 10) | | | 364,272,675 | | | | (346,651 | ) | | | 214,508 | |
| |
Total increase (decrease) in net assets | | | 411,158,921 | | | | 743,335 | | | | 618,913 | |
| |
| | | | | | | | | | | | | |
NET ASSETS | | | | | | | | | | | | |
| Beginning of period | | | 645,841,903 | | | | 11,456,766 | | | | 3,265,460 | |
| |
| End of period | | $ | 1,057,000,824 | | | $ | 12,200,101 | | | $ | 3,884,373 | |
| |
| Undistributed accumulated net investment income (loss), at end of period | | $ | 1,126,195 | | | $ | — | | | $ | — | |
| |
44 | 2007 ANNUAL REPORT
| | | | | | | | | | | | | | | | | | | | | | | | | |
| Growth Funds | | Value Funds |
| | | Quaker | | Quaker | | Quaker | | Quaker | | Quaker | | | | |
| | | Capital | | Biotech Pharma- | | Mid-Cap | | Small-Cap | | Core | | | | |
| | | Opportunities Fund | | Healthcare Fund | | Value Fund | | Value Fund | | Value Fund | | | | |
| |
| | | | | | | | | | | | | | | | | | | | | | | | | |
| | | | | | | | | | | | | | | | | | | | | | | | | |
| | | $ | (35,949 | ) | | $ | (143,590 | ) | | $ | (820,415 | ) | | $ | (244,701 | ) | | $ | 14,037 | | | | | |
| | | | 2,125,175 | | | | (182,064 | ) | | | 6,641,912 | | | | 11,914,134 | | | | 386,947 | | | | | |
| | | | (365,054 | ) | | | 1,087,162 | | | | 11,593,452 | | | | 2,315,841 | | | | 79,245 | | | | | |
| |
| | | | 1,724,172 | | | | 761,508 | | | | 17,414,949 | | | | 13,985,274 | | | | 480,229 | | | | | |
| |
| | | | | | | | | | | | | | | | | | | | | | | | | |
| | | | — | | | | — | | | | — | | | | — | | | | (20,000 | ) | | | | |
| | | | — | | | | — | | | | — | | | | — | | | | — | | | | | |
| | | | — | | | | — | | | | — | | | | — | | | | — | | | | | |
| | | | — | | | | — | | | | — | | | | — | | | | — | | | | | |
| | | | (618,838 | ) | | | (629,422 | ) | | | (2,044,739 | ) | | | (4,201,235 | ) | | | (317,566 | ) | | | | |
| | | | (51,589 | ) | | | (101,639 | ) | | | (43,407 | ) | | | (106,504 | ) | | | — | | | | | |
| | | | (737,051 | ) | | | (414,003 | ) | | | (349,010 | ) | | | (1,266,817 | ) | | | — | | | | | |
| | | | — | | | | — | | | | (30,160 | ) | | | (3,094,993 | ) | | | — | | | | | |
| |
| | | | (1,407,478 | ) | | | (1,145,064 | ) | | | (2,467,316 | ) | | | (8,669,549 | ) | | | (337,566 | ) | | | | |
| |
| | | | | | | | | | | | | | | | | | | | | | | | | |
| | | | (8,045,843 | ) | | | (8,946,825 | ) | | | 48,867,507 | | | | 9,670,153 | | | | 513,689 | | | | | |
| |
| | | | (7,729,149 | ) | | | (9,330,381 | ) | | | 63,815,140 | | | | 14,985,878 | | | | 656,352 | | | | | |
| |
| | | | | | | | | | | | | | | | | | | | | | | | | |
| | | | | | | | | | | | | | | | | | | | | | | | | |
| | | | 24,790,785 | | | | 19,257,677 | | | | 91,014,668 | | | | 76,398,172 | | | | 2,718,875 | | | | | |
| |
| | | $ | 17,061,636 | | | $ | 9,927,296 | | | $ | 154,829,808 | | | $ | 91,384,050 | | | $ | 3,375,227 | | | | | |
| |
| | | $ | — | | | $ | — | | | $ | — | | | $ | — | | | $ | 5,065 | | | | | |
| |
| | | | | | | | | | | | | | | | | | | | | | | | | |
| | | | | | | | | | | | | | | | | | | | | | | | | |
| | | | | | | | | | | | | | | | | | | | | | | | | |
| | | $ | (214,774 | ) | | $ | (206,208 | ) | | $ | (504,399 | ) | | $ | (567,674 | ) | | $ | 17,379 | | | | | |
| | | | 2,145,314 | | | | 2,240,840 | | | | 4,155,784 | | | | 9,265,963 | | | | 390,841 | | | | | |
| | | | (155,691 | ) | | | (1,657,155 | ) | | | 373,108 | | | | 1,414,463 | | | | (17,187 | ) | | | | |
| |
| | | | 1,774,849 | | | | 377,477 | | | | 4,024,493 | | | | 10,112,752 | | | | 391,033 | | | | | |
| |
| | | | | | | | | | | | | | | | | | | | | | | | | |
| | | | — | | | | — | | | | — | | | | — | | | | (14,303 | ) | | | | |
| | | | — | | | | — | | | | — | | | | — | | | | — | | | | | |
| | | | — | | | | — | | | | — | | | | — | | | | — | | | | | |
| | | | — | | | | — | | | | — | | | | — | | | | — | | | | | |
| | | | (1,220,487 | ) | | | (72,946 | ) | | | (3,822,299 | ) | | | (3,953,844 | ) | | | (182,777 | ) | | | | |
| | | | (105,392 | ) | | | (6,784 | ) | | | (327,109 | ) | | | (147,360 | ) | | | — | | | | | |
| | | | (1,109,017 | ) | | | (22,125 | ) | | | (2,157,827 | ) | | | (1,213,262 | ) | | | — | | | | | |
| | | | — | | | | — | | | | (202,933 | ) | | | (4,203,414 | ) | | | — | | | | | |
| |
| | | | (2,434,896 | ) | | | (101,855 | ) | | | (6,510,168 | ) | | | (9,517,880 | ) | | | (197,080 | ) | | | | |
| |
| | | | | | | | | | | | | | | | | | | | | | | | | |
| | | | 372,570 | | | | (1,588,822 | ) | | | 35,718,584 | | | | 19,420,347 | | | | 582,060 | | | | | |
| |
| | | | (287,477 | ) | | | (1,313,200 | ) | | | 33,232,909 | | | | 20,015,219 | | | | 776,013 | | | | | |
| |
| | | | | | | | | | | | | | | | | | | | | | | | | |
| | | | | | | | | | | | | | | | | | | | | | | | | |
| | | | 25,078,262 | | | | 20,570,877 | | | | 57,781,759 | | | | 56,382,953 | | | | 1,942,862 | | | | | |
| |
| | | $ | 24,790,785 | | | $ | 19,257,677 | | | $ | 91,014,668 | | | $ | 76,398,172 | | | $ | 2,718,875 | | | | | |
| |
| | | $ | — | | | $ | (7,487 | ) | | $ | — | | | $ | — | | | $ | 11,027 | | | | | |
| |
The accompanying notes are an integral part of the financial statements.
2007 ANNUAL REPORT | 45
Financial Highlights
Quaker Strategic Growth Fund
(For a Share Outstanding Throughout the Period)
| | | | | | | | | | | | | | | | | | | | | |
| | | Class A |
| | | Year | | Year | | Year | | Year | | Year |
| | | Ended | | Ended | | Ended | | Ended | | Ended |
| | | June 30, | | June 30, | | June 30, | | June 30, | | June 30, |
| | | 2007 | | 2006 | | 2005 | | 2004 | | 2003 |
| |
Net asset value, beginning of period | | $ | 24.12 | | | $ | 22.44 | | | $ | 20.71 | | | $ | 16.67 | | | $ | 16.03 | |
| |
Income from investment operations | | | | | | | | | | | | | | | | | | | | |
Net investment income (loss)(1) | | | 0.06 | | | | 0.05 | | | | (0.16 | ) | | | (0.27 | ) | | | (0.19 | ) |
| Net realized and unrealized gain on investments | | | 4.07 | | | | 2.98 | | | | 2.88 | | | | 4.31 | | | | 0.83 | |
| |
Total from investment operations | | | 4.13 | | | | 3.03 | | | | 2.72 | | | | 4.04 | | | | 0.64 | |
| |
Distributions to shareholders from: | | | | | | | | | | | | | | | | | | | | |
| Net investment income | | | (0.09 | ) | | | — | | | | — | | | | — | | | | — | |
| Net realized capital gain | | | (2.47 | ) | | | (1.35 | ) | | | (0.99 | ) | | | — | | | | — | |
| |
Total distributions | | | (2.56 | ) | | | (1.35 | ) | | | (0.99 | ) | | | — | | | | — | |
| |
Net asset value, end of period | | $ | 25.69 | | | $ | 24.12 | | | $ | 22.44 | | | $ | 20.71 | | | $ | 16.67 | |
| |
Total Return(2) | | | 18.68 | % | | | 13.66 | % | | | 13.36 | % | | | 24.24 | % | | | 3.99 | % |
| | | | | | | | | | | | | | | | | | | | | |
Ratios/supplemental data | | | | | | | | | | | | | | | | | | | | |
Net assets, end of period (000’s omitted) | | $ | 629,531 | | | $ | 901,498 | | | $ | 530,271 | | | $ | 307,744 | | | $ | 149,677 | |
Ratio of expenses to average net assets: | | | | | | | | | | | | | | | | | | | | |
| Before fees paid indirectly through commission recapture | | | 1.90 | % | | | 1.90 | % | | | 2.04 | % | | | 2.16 | % | | | 2.16 | % |
| After fees paid indirectly through commission recapture | | | 1.90 | % | | | 1.86 | % | | | 1.99 | % | | | 2.16 | % | | | 2.16 | % |
Ratio of net investment income (loss) to average net assets: | | | | | | | | | | | | | | | | | | | | |
| Before fees paid indirectly through commission recapture | | | 0.23 | % | | | 0.16 | % | | | (0.78 | )% | | | (1.41 | )% | | | (1.24 | )% |
| After fees paid indirectly through commission recapture | | | 0.23 | % | | | 0.20 | % | | | (0.73 | )% | | | (1.41 | )% | | | (1.24 | )% |
Portfolio turnover rate | | | 319.28 | % | | | 185.71 | % | | | 204.59 | % | | | 332.70 | % | | | 401.43 | % |
| |
| | |
| (1) | | The average shares outstanding method has been applied for per share information. |
| |
| (2) | | Total investment return is based on the change in net asset value of a share during the period and assumes reinvestments of dividends and distributions at net asset value and does not reflect the impact of sales charge. |
46 | 2007 ANNUAL REPORT
| | | | | | | | | | | | | | | | | | | | | |
| | | Class B |
| | | Year | | Year | | Year | | Year | | Year |
| | | Ended | | Ended | | Ended | | Ended | | Ended |
| | | June 30, | | June 30, | | June 30, | | June 30, | | June 30, |
| | | 2007 | | 2006 | | 2005 | | 2004 | | 2003 |
| |
Net asset value, beginning of period | | $ | 23.16 | | | $ | 21.76 | | | $ | 20.25 | | | $ | 16.41 | | | $ | 15.90 | |
| |
Income from investment operations | | | | | | | | | | | | | | | | | | | | |
Net investment loss(1) | | | (0.12 | ) | | | (0.13 | ) | | | (0.31 | ) | | | (0.40 | ) | | | (0.31 | ) |
| Net realized and unrealized gain on investments | | | 3.89 | | | | 2.88 | | | | 2.81 | | | | 4.24 | | | | 0.82 | |
| |
Total from investment operations | | | 3.77 | | | | 2.75 | | | | 2.50 | | | | 3.84 | | | | 0.51 | |
| |
Distributions to shareholders from: | | | | | | | | | | | | | | | | | | | | |
| Net investment income | | | — | | | | — | | | | — | | | | — | | | | — | |
| Net realized capital gain | | | (2.47 | ) | | | (1.35 | ) | | | (0.99 | ) | | | — | | | | — | |
| |
Total distributions | | | (2.47 | ) | | | (1.35 | ) | | | (0.99 | ) | | | — | | | | — | |
| |
Net asset value, end of period | | $ | 24.46 | | | $ | 23.16 | | | $ | 21.76 | | | $ | 20.25 | | | $ | 16.41 | |
| |
Total Return(2) | | | 17.77 | % | | | 12.77 | % | | | 12.56 | % | | | 23.40 | % | | | 3.21 | % |
| | | | | | | | | | | | | | | | | | | | | |
Ratios/supplemental data | | | | | | | | | | | | | | | | | | | | |
Net assets, end of period (000’s omitted) | | $ | 14,429 | | | $ | 15,999 | | | $ | 16,106 | | | $ | 16,186 | | | $ | 14,054 | |
Ratio of expenses to average net assets: | | | | | | | | | | | | | | | | | | | | |
| Before fees paid indirectly through commission recapture | | | 2.65 | % | | | 2.65 | % | | | 2.79 | % | | | 2.91 | % | | | 2.91 | % |
| After fees paid indirectly through commission recapture | | | 2.65 | % | | | 2.61 | % | | | 2.74 | % | | | 2.91 | % | | | 2.91 | % |
Ratio of net investment loss to average net assets: | | | | | | | | | | | | | | | | | | | | |
| Before fees paid indirectly through commission recapture | | | (0.52 | )% | | | (0.59 | )% | | | (1.53 | )% | | | (2.16 | )% | | | (1.99 | )% |
| After fees paid indirectly through commission recapture | | | (0.52 | )% | | | (0.55 | )% | | | (1.48 | )% | | | (2.16 | )% | | | (1.99 | )% |
Portfolio turnover rate | | | 319.28 | % | | | 185.71 | % | | | 204.59 | % | | | 332.70 | % | | | 401.43 | % |
| |
| | |
| (1) | | The average shares outstanding method has been applied for per share information. |
| |
| (2) | | Total investment return is based on the change in net asset value of a share during the period and assumes reinvestments of dividends and distributions at net asset value and does not reflect the impact of sales charge. |
The accompanying notes are an integral part of the financial statements.
2007 ANNUAL REPORT | 47
Financial Highlights
Quaker Strategic Growth Fund
(For a Share Outstanding Throughout the Period)
| | | | | | | | | | | | | | | | | | | | | |
| | | Class C |
| | | Year | | Year | | Year | | Year | | Year |
| | | Ended | | Ended | | Ended | | Ended | | Ended |
| | | June 30, | | June 30, | | June 30, | | June 30, | | June 30, |
| | | 2007 | | 2006 | | 2005 | | 2004 | | 2003 |
| |
Net asset value, beginning of period | | $ | 23.07 | | | $ | 21.68 | | | $ | 20.18 | | | $ | 16.36 | | | $ | 15.85 | |
| |
Income from investment operations | | | | | | | | | | | | | | | | | | | | |
Net investment loss(1) | | | (0.12 | ) | | | (0.12 | ) | | | (0.31 | ) | | | (0.41 | ) | | | (0.31 | ) |
| Net realized and unrealized gain on investments | | | 3.88 | | | | 2.86 | | | | 2.80 | | | | 4.23 | | | | 0.82 | |
| |
Total from investment operations | | | 3.76 | | | | 2.74 | | | | 2.49 | | | | 3.82 | | | | 0.51 | |
| |
Distributions to shareholders from: | | | | | | | | | | | | | | | | | | | | |
| Net investment income | | | — | | | | — | | | | — | | | | — | | | | — | |
| Net realized capital gain | | | (2.47 | ) | | | (1.35 | ) | | | (0.99 | ) | | | — | | | | — | |
| |
Total distributions | | | (2.47 | ) | | | (1.35 | ) | | | (0.99 | ) | | | — | | | | — | |
| |
Net asset value, end of period | | $ | 24.36 | | | $ | 23.07 | | | $ | 21.68 | | | $ | 20.18 | | | $ | 16.36 | |
| |
Total Return(2) | | | 17.80 | % | | | 12.77 | % | | | 12.55 | % | | | 23.35 | % | | | 3.22 | % |
| | | | | | | | | | | | | | | | | | | | | |
Ratios/supplemental data | | | | | | | | | | | | | | | | | | | | |
Net assets, end of period (000’s omitted) | | $ | 108,241 | | | $ | 98,224 | | | $ | 66,958 | | | $ | 37,559 | | | $ | 15,047 | |
Ratio of expenses to average net assets: | | | | | | | | | | | | | | | | | | | | |
| Before fees paid indirectly through commission recapture recapture | | | 2.65 | % | | | 2.65 | % | | | 2.79 | % | | | 2.91 | % | | | 2.91 | % |
| After fees paid indirectly through commission recapture | | | 2.65 | % | | | 2.61 | % | | | 2.74 | % | | | 2.91 | % | | | 2.91 | % |
Ratio of net investment loss to average net assets: | | | | | | | | | | | | | | | | | | | | |
| Before fees paid indirectly through commission recapture | | | (0.52 | )% | | | (0.59 | )% | | | (1.53 | )% | | | (2.16 | )% | | | (1.99 | )% |
| After fees paid indirectly through commission recapture | | | (0.52 | )% | | | (0.55 | )% | | | (1.48 | )% | | | (2.16 | )% | | | (1.99 | )% |
Portfolio turnover rate | | | 319.28 | % | | | 185.71 | % | | | 204.59 | % | | | 332.70 | % | | | 401.43 | % |
| |
| | |
| (1) | | The average shares outstanding method has been applied for per share information. |
| |
| (2) | | Total investment return is based on the change in net asset value of a share during the period and assumes reinvestments of dividends and distributions at net asset value and does not reflect the impact of sales charge. |
48 | 2007 ANNUAL REPORT
| | | | | | | | | | | | | | | | | | | | | |
| | | Institutional Class |
| | | Year | | Year | | Year | | Year | | Year |
| | | Ended | | Ended | | Ended | | Ended | | Ended |
| | | June 30, | | June 30, | | June 30, | | June 30, | | June 30, |
| | | 2007 | | 2006 | | 2005 | | 2004 | | 2003 |
| |
Net asset value, beginning of period | | $ | 24.47 | | | $ | 22.70 | | | $ | 20.88 | | | $ | 16.76 | | | $ | 16.08 | |
| |
Income from investment operations | | | | | | | | | | | | | | | | | | | | |
Net investment income (loss)(1) | | | 0.12 | | | | 0.11 | | | | (0.10 | ) | | | (0.22 | ) | | | (0.15 | ) |
| Net realized and unrealized gain on investments | | | 4.13 | | | | 3.01 | | | | 2.91 | | | | 4.34 | | | | 0.83 | |
| |
Total from investment operations | | | 4.25 | | | | 3.12 | | | | 2.81 | | | | 4.12 | | | | 0.68 | |
| |
Distributions to shareholders from: | | | | | | | | | | | | | | | | | | | | |
| Net investment income | | | (0.16 | ) | | | — | | | | — | | | | — | | | | — | |
| Net realized capital gain | | | (2.47 | ) | | | (1.35 | ) | | | (0.99 | ) | | | — | | | | — | |
| |
Total distributions | | | (2.63 | ) | | | (1.35 | ) | | | (0.99 | ) | | | — | | | | — | |
| |
Net asset value, end of period | | $ | 26.09 | | | $ | 24.47 | | | $ | 22.70 | | | $ | 20.88 | | | $ | 16.76 | |
| |
Total Return(2) | | | 18.95 | % | | | 13.91 | % | | | 13.69 | % | | | 24.58 | % | | | 4.23 | % |
| | | | | | | | | | | | | | | | | | | | | |
Ratios/supplemental data | | | | | | | | | | | | | | | | | | | | |
Net assets, end of period (000’s omitted) | | $ | 15,105 | | | $ | 41,280 | | | $ | 32,506 | | | $ | 14,767 | | | $ | 4,676 | |
Ratio of expenses to average net assets: | | | | | | | | | | | | | | | | | | | | |
| Before fees paid indirectly through commission recapture recapture | | | 1.65 | % | | | 1.65 | % | | | 1.79 | % | | | 1.91 | % | | | 1.91 | % |
| After fees paid indirectly through commission recapture | | | 1.65 | % | | | 1.61 | % | | | 1.74 | % | | | 1.91 | % | | | 1.91 | % |
Ratio of net investment income (loss) to average net assets: | | | | | | | | | | | | | | | | | | | | |
| Before fees paid indirectly through commission recapture | | | 0.48 | % | | | 0.41 | % | | | (0.53 | )% | | | (1.16 | )% | | | (1.32 | )% |
| After fees paid indirectly through commission recapture | | | 0.48 | % | | | 0.45 | % | | | (0.48 | )% | | | (1.16 | )% | | | (1.32 | )% |
Portfolio turnover rate | | | 319.28 | % | | | 185.71 | % | | | 204.59 | % | | | 332.70 | % | | | 401.43 | % |
| |
| | |
| (1) | | The average shares outstanding method has been applied for per share information. |
| |
| (2) | | Total investment return is based on the change in net asset value of a share during the period and assumes reinvestments of dividends and distributions at net asset value and does not reflect the impact of sales charge. |
The accompanying notes are an integral part of the financial statements.
2007 ANNUAL REPORT | 49
Financial Highlights
Quaker Core Equity Fund
(For a Share Outstanding Throughout the Period)
| | | | | | | | | | | | | | | | | | | | | |
| | | Class A |
| | | Year | | Year | | Year | | Year | | Year |
| | | Ended | | Ended | | Ended | | Ended | | Ended |
| | | June 30, | | June 30, | | June 30, | | June 30, | | June 30, |
| | | 2007 | | 2006 | | 2005 | | 2004 | | 2003 |
| |
Net asset value, beginning of period | | $ | 12.59 | | | $ | 11.49 | | | $ | 11.35 | | | $ | 9.69 | | | $ | 9.64 | |
| |
Income From Investment Operations | | | | | | | | | | | | | | | | | | | | |
Net investment loss(1) | | | (0.07 | ) | | | (0.07 | ) | | | (0.04 | ) | | | (0.11 | ) | | | (0.11 | ) |
| Net realized and unrealized gain on investments | | | 1.65 | | | | 1.17 | | | | 0.18 | | | | 1.77 | | | | 0.16 | |
| |
Total from investment operations | | | 1.58 | | | | 1.10 | | | | 0.14 | | | | 1.66 | | | | 0.05 | |
| |
Net asset value, end of period | | $ | 14.17 | | | $ | 12.59 | | | $ | 11.49 | | | $ | 11.35 | | | $ | 9.69 | |
| |
Total Return(2) | | | 12.55 | % | | | 9.57 | % | | | 1.23 | % | | | 17.13 | % | | | 0.52 | % |
| | | | | | | | | | | | | | | | | | | | | |
Ratios/supplemental data | | | | | | | | | | | | | | | | | | | | |
Net assets, end of period (000’s omitted) | | $ | 9,744 | | | $ | 8,854 | | | $ | 8,290 | | | $ | 8,604 | | | $ | 7,687 | |
Ratio of expenses to average net assets: | | | | | | | | | | | | | | | | | | | | |
| Before expense reimbursements and waived fees | | | 1.80 | % | | | 1.77 | % | | | 1.93 | % | | | 2.10 | % | | | 2.02 | % |
| After expense reimbursements and waived fees | | | 1.80 | % | | | 1.77 | % | | | 1.93 | % | | | 2.10 | % | | | 2.02 | % |
Ratio of net investment loss to average net assets: | | | | | | | | | | | | | | | | | | | | |
| Before expense reimbursements and waived fees | | | (0.54 | )% | | | (0.57 | )% | | | (0.33 | )% | | | (1.03 | )% | | | (1.18 | )% |
| After expense reimbursements and waived fees | | | (0.54 | )% | | | (0.57 | )% | | | (0.33 | )% | | | (1.03 | )% | | | (1.18 | )% |
Portfolio turnover rate | | | 245.06 | % | | | 139.04 | % | | | 88.76 | % | | | 239.70 | % | | | 223.82 | % |
| |
| | |
| (1) | | The average shares outstanding method has been applied for per share information. |
| |
| (2) | | Total investment return is based on the change in net asset value of a share during the period and assumes reinvestments of dividends and distributions at net asset value and does not reflect the impact of sales charge. |
50 | 2007 ANNUAL REPORT
| | | | | | | | | | | | | | | | | | | | | |
| | | Class B |
| | | Year | | Year | | Year | | Year | | Year |
| | | Ended | | Ended | | Ended | | Ended | | Ended |
| | | June 30, | | June 30, | | June 30, | | June 30, | | June 30, |
| | | 2007 | | 2006 | | 2005 | | 2004 | | 2003 |
| |
Net asset value, beginning of period | | $ | 12.07 | | | $ | 11.10 | | | $ | 11.04 | | | $ | 9.50 | | | $ | 9.52 | |
| |
Income From Investment Operations | | | | | | | | | | | | | | | | | | | | |
Net investment loss(1) | | | (0.16 | ) | | | (0.16 | ) | | | (0.12 | ) | | | (0.19 | ) | | | (0.17 | ) |
| Net realized and unrealized gain on investments | | | 1.57 | | | | 1.13 | | | | 0.18 | | | | 1.73 | | | | 0.15 | |
| |
Total from investment operations | | | 1.41 | | | | 0.97 | | | | 0.06 | | | | 1.54 | | | | (0.02 | ) |
| |
Net asset value, end of period | | $ | 13.48 | | | $ | 12.07 | | | $ | 11.10 | | | $ | 11.04 | | | $ | 9.50 | |
| |
Total Return(2) | | | 11.68 | % | | | 8.74 | % | | | 0.54 | % | | | 16.21 | % | | | (0.21 | )% |
| | | | | | | | | | | | | | | | | | | | | |
Ratios/supplemental data | | | | | | | | | | | | | | | | | | | | |
Net assets, end of period (000’s omitted) | | $ | 134 | | | $ | 150 | | | $ | 167 | | | $ | 199 | | | $ | 124 | |
Ratio of expenses to average net assets: | | | | | | | | | | | | | | | | | | | | |
| Before expense reimbursements and waived fees | | | 2.55 | % | | | 2.52 | % | | | 2.68 | % | | | 2.85 | % | | | 2.77 | % |
| After expense reimbursements and waived fees | | | 2.55 | % | | | 2.52 | % | | | 2.68 | % | | | 2.85 | % | | | 2.77 | % |
Ratio of net investment loss to average net assets: | | | | | | | | | | | | | | | | | | | | |
| Before expense reimbursements and waived fees | | | (1.29 | )% | | | (1.32 | )% | | | (1.08 | )% | | | (1.78 | )% | | | (1.93 | )% |
| After expense reimbursements and waived fees | | | (1.29 | )% | | | (1.32 | )% | | | (1.08 | )% | | | (1.78 | )% | | | (1.93 | )% |
Portfolio turnover rate | | | 245.06 | % | | | 139.04 | % | | | 88.76 | % | | | 239.70 | % | | | 223.82 | % |
| |
| | |
| (1) | | The average shares outstanding method has been applied for per share information. |
| |
| (2) | | Total investment return is based on the change in net asset value of a share during the period and assumes reinvestments of dividends and distributions at net asset value and does not reflect the impact of sales charge. |
The accompanying notes are an integral part of the financial statements.
2007 ANNUAL REPORT | 51
Financial Highlights
Quaker Core Equity Fund
(For a Share Outstanding Throughout the Period)
| | | | | | | | | | | | | | | | | | | | | |
| | | Class C |
| | | Year | | Year | | Year | | Year | | Year |
| | | Ended | | Ended | | Ended | | Ended | | Ended |
| | | June 30, | | June 30, | | June 30, | | June 30, | | June 30, |
| | | 2007 | | 2006 | | 2005 | | 2004 | | 2003 |
| |
Net asset value, beginning of period | | $ | 12.00 | | | $ | 11.03 | | | $ | 10.97 | | | $ | 9.44 | | | $ | 9.46 | |
| |
Income From Investment Operations | | | | | | | | | | | | | | | | | | | | |
Net investment loss(1) | | | (0.16 | ) | | | (0.16 | ) | | | (0.12 | ) | | | (0.18 | ) | | | (0.18 | ) |
| Net realized and unrealized gain on investments | | | 1.56 | | | | 1.13 | | | | 0.18 | | | | 1.71 | | | | 0.16 | |
| |
Total from investment operations | | | 1.40 | | | | 0.97 | | | | 0.06 | | | | 1.53 | | | | (0.02 | ) |
| |
Net asset value, end of period | | $ | 13.40 | | | $ | 12.00 | | | $ | 11.03 | | | $ | 10.97 | | | $ | 9.44 | |
| |
Total Return(2) | | | 11.67 | % | | | 8.79 | % | | | 0.55 | % | | | 16.21 | % | | | (0.21 | )% |
| | | | | | | | | | | | | | | | | | | | | |
Ratios/supplemental data | | | | | | | | | | | | | | | | | | | | |
Net assets, end of period (000’s omitted) | | $ | 67 | | | $ | 91 | | | $ | 143 | | | $ | 168 | | | $ | 310 | |
Ratio of expenses to average net assets: | | | | | | | | | | | | | | | | | | | | |
| Before expense reimbursements and waived fees | | | 2.55 | % | | | 2.52 | % | | | 2.68 | % | | | 2.85 | % | | | 2.77 | % |
| After expense reimbursements and waived fees | | | 2.55 | % | | | 2.52 | % | | | 2.68 | % | | | 2.85 | % | | | 2.77 | % |
Ratio of net investment loss to average net assets: | | | | | | | | | | | | | | | | | | | | |
| Before expense reimbursements and waived fees | | | (1.29 | )% | | | (1.32 | )% | | | (1.08 | )% | | | (1.78 | )% | | | (1.93 | )% |
| After expense reimbursements and waived fees | | | (1.29 | )% | | | (1.32 | )% | | | (1.08 | )% | | | (1.78 | )% | | | (1.93 | )% |
Portfolio turnover rate | | | 245.06 | % | | | 139.04 | % | | | 88.76 | % | | | 239.70 | % | | | 223.82 | % |
| |
| | |
| (1) | | The average shares outstanding method has been applied for per share information. |
| |
| (2) | | Total investment return is based on the change in net asset value of a share during the period and assumes reinvestments of dividends and distributions at net asset value and does not reflect the impact of sales charge. |
52 | 2007 ANNUAL REPORT
| | | | | | | | | | | | | | | | | | | | | |
| | | Institutional Class |
| | | Year | | Year | | Year | | Year | | Year |
| | | Ended | | Ended | | Ended | | Ended | | Ended |
| | | June 30, | | June 30, | | June 30, | | June 30, | | June 30, |
| | | 2007 | | 2006 | | 2005 | | 2004 | | 2003 |
| |
Net asset value, beginning of period | | $ | 12.09 | | | $ | 11.01 | | | $ | 10.84 | | | $ | 9.23 | | | $ | 9.16 | |
| |
Income From Investment Operations | | | | | | | | | | | | | | | | | | | | |
Net investment loss(1) | | | (0.04 | ) | | | (0.04 | ) | | | (0.01 | ) | | | (0.08 | ) | | | (0.08 | ) |
| Net realized and unrealized gain on investments | | | 1.59 | | | | 1.12 | | | | 0.18 | | | | 1.69 | | | | 0.15 | |
| |
Total from investment operations | | | 1.55 | | | | 1.08 | | | | 0.17 | | | | 1.61 | | | | 0.07 | |
| |
Net asset value, end of period | | $ | 13.64 | | | $ | 12.09 | | | $ | 11.01 | | | $ | 10.84 | | | $ | 9.23 | |
| |
Total Return(2) | | | 12.82 | % | | | 9.81 | % | | | 1.57 | % | | | 17.44 | % | | | 0.76 | % |
| | | | | | | | | | | | | | | | | | | | | |
Ratios/supplemental data | | | | | | | | | | | | | | | | | | | | |
Net assets, end of period (000’s omitted) | | $ | 3,193 | | | $ | 3,106 | | | $ | 2,857 | | | $ | 2,894 | | | $ | 2,511 | |
Ratio of expenses to average net assets: | | | | | | | | | | | | | | | | | | | | |
| Before expense reimbursements and waived fees | | | 1.55 | % | | | 1.52 | % | | | 1.68 | % | | | 1.85 | % | | | 1.77 | % |
| After expense reimbursements and waived fees | | | 1.55 | % | | | 1.52 | % | | | 1.68 | % | | | 1.85 | % | | | 1.77 | % |
Ratio of net investment loss to average net assets: | | | | | | | | | | | | | | | | | | | | |
| Before expense reimbursements and waived fees | | | (0.29 | )% | | | (0.32 | )% | | | (0.08 | )% | | | (0.78 | )% | | | (0.93 | )% |
| After expense reimbursements and waived fees | | | (0.29 | )% | | | (0.32 | )% | | | (0.08 | )% | | | (0.78 | )% | | | (0.93 | )% |
Portfolio turnover rate | | | 245.06 | % | | | 139.04 | % | | | 88.76 | % | | | 239.70 | % | | | 223.82 | % |
| |
| | |
| (1) | | The average shares outstanding method has been applied for per share information. |
| |
| (2) | | Total investment return is based on the change in net asset value of a share during the period and assumes reinvestments of dividends and distributions at net asset value and does not reflect the impact of sales charge. |
The accompanying notes are an integral part of the financial statements.
2007 ANNUAL REPORT | 53
Financial Highlights
Quaker Small-Cap Growth Fund
(For a Share Outstanding Throughout the Period)
| | | | | | | | | | | | | | | | | | | | | |
| | | Class A |
| | | Year | | Year | | Year | | Year | | Year |
| | | Ended | | Ended | | Ended | | Ended | | Ended |
| | | June 30, | | June 30, | | June 30, | | June 30, | | June 30, |
| | | 2007 | | 2006 | | 2005 | | 2004 | | 2003 |
| |
Net asset value, beginning of period | | $ | 10.67 | | | $ | 9.50 | | | $ | 8.57 | | | $ | 6.71 | | | $ | 7.71 | |
| |
Income From Investment Operations | | | | | | | | | | | | | | | | | | | | |
Net investment loss(1) | | | (0.11 | ) | | | (0.10 | ) | | | (0.10 | ) | | | (0.13 | ) | | | (0.15 | ) |
| Net realized and unrealized gain (loss) on investments | | | 1.39 | | | | 1.27 | | | | 1.03 | | | | 1.99 | | | | (0.85 | ) |
| |
Total from investment operations | | | 1.28 | | | | 1.17 | | | | 0.93 | | | | 1.86 | | | | (1.00 | ) |
| |
Distributions to shareholders from: | | | | | | | | | | | | | | | | | | | | |
| Net realized capital gain | | | (0.45 | ) | | | — | | | | — | | | | — | | | | — | |
| |
Total distributions | | | (0.45 | ) | | | — | | | | — | | | | — | | | | — | |
| |
Net asset value, end of period | | $ | 11.50 | | | $ | 10.67 | | | $ | 9.50 | | | $ | 8.57 | | | $ | 6.71 | |
| |
Total Return(2) | | | 12.44 | % | | | 12.32 | % | | | 10.85 | % | | | 27.72 | % | | | (12.97 | )% |
| | | | | | | | | | | | | | | | | | | | | |
Ratios/supplemental data | | | | | | | | | | | | | | | | | | | | |
Net assets, end of period (000’s omitted) | | $ | 665 | | | $ | 748 | | | $ | 484 | | | $ | 291 | | | $ | 117 | |
Ratio of expenses to average net assets: | | | | | | | | | | | | | | | | | | | | |
| Before expense reimbursements and waived fees | | | 2.15 | % | | | 1.83 | % | | | 2.05 | % | | | 2.09 | % | | | 2.63 | % |
| After expense reimbursements and waived fees | | | 2.15 | % | | | 1.83 | % | | | 2.05 | % | | | 2.09 | % | | | 2.63 | % |
Ratio of net investment loss to average net assets: | | | | | | | | | | | | | | | | | | | | |
| Before expense reimbursements and waived fees | | | (0.96 | )% | | | (0.99 | )% | | | (1.15 | )% | | | (1.62 | )% | | | (2.20 | )% |
| After expense reimbursements and waived fees | | | (0.96 | )% | | | (0.99 | )% | | | (1.15 | )% | | | (1.62 | )% | | | (2.20 | )% |
Portfolio turnover rate | | | 380.25 | % | | | 215.97 | % | | | 115.81 | % | | | 191.91 | % | | | 250.36 | % |
| |
| | |
| (1) | | The average shares outstanding method has been applied for per share information. |
| |
| (2) | | Total investment return is based on the change in net asset value of a share during the period and assumes reinvestments of dividends and distributions at net asset value and does not reflect the impact of sales charge. |
54 | 2007 ANNUAL REPORT
| | | | | | | | | | | | | | | | | | | | | |
| | | Class B |
| | | Year | | Year | | Year | | Year | | Year |
| | | Ended | | Ended | | Ended | | Ended | | Ended |
| | | June 30, | | June 30, | | June 30, | | June 30, | | June 30, |
| | | 2007 | | 2006 | | 2005 | | 2004 | | 2003 |
| |
Net asset value, beginning of period | | $ | 10.23 | | | $ | 9.19 | | | $ | 8.35 | | | $ | 6.61 | | | $ | 7.67 | |
| |
Income From Investment Operations | | | | | | | | | | | | | | | | | | | | |
Net investment loss(1) | | | (0.18 | ) | | | (0.17 | ) | | | (0.16 | ) | | | (0.19 | ) | | | (0.19 | ) |
| Net realized and unrealized gain (loss) on investments | | | 1.33 | | | | 1.21 | | | | 1.00 | | | | 1.93 | | | | (0.87 | ) |
| |
Total from investment operations | | | 1.15 | | | | 1.04 | | | | 0.84 | | | | 1.74 | | | | (1.06 | ) |
| |
Distributions to shareholders from: | | | | | | | | | | | | | | | | | | | | |
| Net realized capital gain | | | (0.45 | ) | | | — | | | | — | | | | — | | | | — | |
| |
Total distributions | | | (0.45 | ) | | | — | | | | — | | | | — | | | | — | |
| |
Net asset value, end of period | | $ | 10.93 | | | $ | 10.23 | | | $ | 9.19 | | | $ | 8.35 | | | $ | 6.61 | |
| |
Total Return(2) | | | 11.69 | % | | | 11.32 | % | | | 10.06 | % | | | 26.32 | % | | | (13.82 | )% |
| | | | | | | | | | | | | | | | | | | | | |
Ratios/supplemental data | | | | | | | | | | | | | | | | | | | | |
Net assets, end of period (000’s omitted) | | $ | 150 | | | $ | 142 | | | $ | 128 | | | $ | 126 | | | $ | 65 | |
Ratio of expenses to average net assets: | | | | | | | | | | | | | | | | | | | | |
| Before expense reimbursements and waived fees | | | 2.90 | % | | | 2.58 | % | | | 2.80 | % | | | 2.84 | % | | | 3.38 | % |
| After expense reimbursements and waived fees | | | 2.90 | % | | | 2.58 | % | | | 2.80 | % | | | 2.84 | % | | | 3.38 | % |
Ratio of net investment loss to average net assets: | | | | | | | | | | | | | | | | | | | | |
| Before expense reimbursements and waived fees | | | (1.71 | )% | | | (1.74 | )% | | | (1.90 | )% | | | (2.37 | )% | | | (2.95 | )% |
| After expense reimbursements and waived fees | | | (1.71 | )% | | | (1.74 | )% | | | (1.90 | )% | | | (2.37 | )% | | | (2.95 | )% |
Portfolio turnover rate | | | 380.25 | % | | | 215.97 | % | | | 115.81 | % | | | 191.91 | % | | | 250.36 | % |
| |
| | |
| (1) | | The average shares outstanding method has been applied for per share information. |
| |
| (2) | | Total investment return is based on the change in net asset value of a share during the period and assumes reinvestments of dividends and distributions at net asset value and does not reflect the impact of sales charge. |
The accompanying notes are an integral part of the financial statements.
2007 ANNUAL REPORT | 55
Financial Highlights
Quaker Small-Cap Growth Fund
(For a Share Outstanding Throughout the Period)
| | | | | | | | | | | | | | | | | | | | | |
| | | Class C |
| | | Year | | Year | | Year | | Year | | Year |
| | | Ended | | Ended | | Ended | | Ended | | Ended |
| | | June 30, | | June 30, | | June 30, | | June 30, | | June 30, |
| | | 2007 | | 2006 | | 2005 | | 2004 | | 2003 |
| |
Net asset value, beginning of period | | $ | 10.30 | | | $ | 9.24 | | | $ | 8.40 | | | $ | 6.64 | | | $ | 7.67 | |
| |
Income From Investment Operations | | | | | | | | | | | | | | | | | | | | |
Net investment loss(1) | | | (0.18 | ) | | | (0.18 | ) | | | (0.16 | ) | | | (0.19 | ) | | | (0.19 | ) |
| Net realized and unrealized gain (loss) on investments | | | 1.33 | | | | 1.24 | | | | 1.00 | | | | 1.95 | | | | (0.84 | ) |
| |
Total from investment operations | | | 1.15 | | | | 1.06 | | | | 0.84 | | | | 1.76 | | | | (1.03 | ) |
| |
Distributions to shareholders from: | | | | | | | | | | | | | | | | | | | | |
| Net realized capital gain | | | (0.45 | ) | | | — | | | | — | | | | — | | | | — | |
| |
Total distributions | | | (0.45 | ) | | | — | | | | — | | | | — | | | | — | |
| |
Net asset value, end of period | | $ | 11.00 | | | $ | 10.30 | | | $ | 9.24 | | | $ | 8.40 | | | $ | 6.64 | |
| |
Total Return(2) | | | 11.61 | % | | | 11.47 | % | | | 10.00 | % | | | 26.51 | % | | | (13.43 | )% |
| | | | | | | | | | | | | | | | | | | | | |
Ratios/supplemental data | | | | | | | | | | | | | | | | | | | | |
Net assets, end of period (000’s omitted) | | $ | 144 | | | $ | 238 | | | $ | 229 | | | $ | 272 | | | $ | 174 | |
Ratio of expenses to average net assets: | | | | | | | | | | | | | | | | | | | | |
| Before expense reimbursements and waived fees | | | 2.90 | % | | | 2.58 | % | | | 2.80 | % | | | 2.84 | % | | | 3.38 | % |
| After expense reimbursements and waived fees | | | 2.90 | % | | | 2.58 | % | | | 2.80 | % | | | 2.84 | % | | | 3.38 | % |
Ratio of net investment loss to average net assets: | | | | | | | | | | | | | | | | | | | | |
| Before expense reimbursements and waived fees | | | (1.71 | )% | | | (1.74 | )% | | | (1.90 | )% | | | (2.37 | )% | | | (2.95 | )% |
| After expense reimbursements and waived fees | | | (1.71 | )% | | | (1.74 | )% | | | (1.90 | )% | | | (2.37 | )% | | | (2.95 | )% |
Portfolio turnover rate | | | 380.25 | % | | | 215.97 | % | | | 115.81 | % | | | 191.91 | % | | | 250.36 | % |
| |
| | |
| (1) | | The average shares outstanding method has been applied for per share information. |
| |
| (2) | | Total investment return is based on the change in net asset value of a share during the period and assumes reinvestments of dividends and distributions at net asset value and does not reflect the impact of sales charge. |
56 | 2007 ANNUAL REPORT
| | | | | | | | | | | | | | | | | | | | | |
| | | Institutional Class |
| | | Year | | Year | | Year | | Year | | Year |
| | | Ended | | Ended | | Ended | | Ended | | Ended |
| | | June 30, | | June 30, | | June 30, | | June 30, | | June 30, |
| | | 2007 | | 2006 | | 2005 | | 2004 | | 2003 |
| |
Net asset value, beginning of period | | $ | 10.97 | | | $ | 9.75 | | | $ | 8.78 | | | $ | 6.86 | | | $ | 7.77 | |
| |
Income From Investment Operations | | | | | | | | | | | | | | | | | | | | |
Net investment loss(1) | | | (0.08 | ) | | | (0.08 | ) | | | (0.08 | ) | | | (0.11 | ) | | | (0.12 | ) |
| Net realized and unrealized gain (loss) on investments | | | 1.43 | | | | 1.30 | | | | 1.05 | | | | 2.03 | | | | (0.79 | ) |
| |
Total from investment operations | | | 1.35 | | | | 1.22 | | | | 0.97 | | | | 1.92 | | | | (0.91 | ) |
| |
Distributions to shareholders from: | | | | | | | | | | | | | | | | | | | | |
| Net realized capital gain | | | (0.45 | ) | | | — | | | | — | | | | — | | | | — | |
| |
Total distributions | | | (0.45 | ) | | | — | | | | — | | | | — | | | | — | |
| |
Net asset value, end of period | | $ | 11.87 | | | $ | 10.97 | | | $ | 9.75 | | | $ | 8.78 | | | $ | 6.86 | |
| |
Total Return(2) | | | 12.75 | % | | | 12.51 | % | | | 11.05 | % | | | 27.99 | % | | | (11.71 | )% |
| | | | | | | | | | | | | | | | | | | | | |
Ratios/supplemental data | | | | | | | | | | | | | | | | | | | | |
Net assets, end of period (000’s omitted) | | $ | 3,045 | | | $ | 2,756 | | | $ | 2,424 | | | $ | 2,162 | | | $ | 1,680 | |
Ratio of expenses to average net assets: | | | | | | | | | | | | | | | | | | | | |
| Before expense reimbursements and waived fees | | | 1.90 | % | | | 1.58 | % | | | 1.80 | % | | | 1.84 | % | | | 2.38 | % |
| After expense reimbursements and waived fees | | | 1.90 | % | | | 1.58 | % | | | 1.80 | % | | | 1.84 | % | | | 2.38 | % |
Ratio of net investment loss to average net assets: | | | | | | | | | | | | | | | | | | | | |
| Before expense reimbursements and waived fees | | | (0.71 | )% | | | (0.74 | )% | | | (0.90 | )% | | | (1.37 | )% | | | (1.95 | )% |
| After expense reimbursements and waived fees | | | (0.71 | )% | | | (0.74 | )% | | | (0.90 | )% | | | (1.37 | )% | | | (1.95 | )% |
Portfolio turnover rate | | | 380.25 | % | | | 215.97 | % | | | 115.81 | % | | | 191.91 | % | | | 250.36 | % |
| |
| | |
| (1) | | The average shares outstanding method has been applied for per share information. |
| |
| (2) | | Total investment return is based on the change in net asset value of a share during the period and assumes reinvestments of dividends and distributions at net asset value and does not reflect the impact of sales charge. |
The accompanying notes are an integral part of the financial statements.
2007 ANNUAL REPORT | 57
Financial Highlights
Quaker Capital Opportunities Fund
(For a Share Outstanding Throughout the Period)
| | | | | | | | | | | | | | | | | | | | | |
| | | Class A |
| | | Year | | Year | | Year | | Year | | Year |
| | | Ended | | Ended | | Ended | | Ended | | Ended |
| | | June 30, | | June 30, | | June 30, | | June 30, | | June 30, |
| | | 2007 | | 2006 | | 2005 | | 2004 | | 2003 |
| |
Net asset value, beginning of period | | $ | 11.07 | | | $ | 11.29 | | | $ | 11.45 | | | $ | 9.05 | | | $ | 9.43 | |
| |
Income from investment operations | | | | | | | | | | | | | | | | | | | | |
Net investment income (loss)(1) | | | 0.02 | | | | (0.05 | ) | | | (0.12 | ) | | | (0.13 | ) | | | (0.03 | ) |
| Net realized and unrealized gain (loss) on investments | | | 1.01 | | | | 0.85 | | | | 1.19 | | | | 2.64 | | | | (0.35 | ) |
| |
Total from investment operations | | | 1.03 | | | | 0.80 | | | | 1.07 | | | | 2.51 | | | | (0.38 | ) |
| |
Distributions to shareholders from: | | | | | | | | | | | | | | | | | | | | |
| Net realized capital gain | | | (0.80 | ) | | | (1.02 | ) | | | (1.23 | ) | | | (0.11 | ) | | | — | |
| |
Total distributions | | | (0.80 | ) | | | (1.02 | ) | | | (1.23 | ) | | | (0.11 | ) | | | — | |
| |
Net asset value, end of period | | $ | 11.30 | | | $ | 11.07 | | | $ | 11.29 | | | $ | 11.45 | | | $ | 9.05 | |
| |
Total Return(2) | | | 9.67 | % | | | 7.05 | % | | | 9.66 | % | | | 27.83 | % | | | (4.03 | )% |
| | | | | | | | | | | | | | | | | | | | | |
Ratios/supplemental data | | | | | | | | | | | | | | | | | | | | |
Net assets, end of period (000’s omitted) | | $ | 8,016 | | | $ | 12,482 | | | $ | 11,970 | | | $ | 7,250 | | | $ | 2,868 | |
Ratio of expenses to average net assets: | | | | | | | | | | | | | | | | | | | | |
| Before expense reimbursements and waived fees | | | 1.76 | % | | | 1.72 | % | | | 1.95 | % | | | 1.98 | % | | | 2.05 | % |
| After expense reimbursements and waived fees | | | 1.76 | % | | | 1.67 | % | | | 1.95 | % | | | 1.98 | % | | | 2.05 | % |
Ratio of net investment income (loss) to average net assets: | | | | | | | | | | | | | | | | | | | | |
| Before expense reimbursements and waived fees | | | 0.22 | % | | | (0.46 | )% | | | (1.08 | )% | | | (1.12 | )% | | | (0.28 | )% |
| After expense reimbursements and waived fees | | | 0.22 | % | | | (0.41 | )% | | | (1.08 | )% | | | (1.12 | )% | | | (0.28 | )% |
Portfolio turnover rate | | | 87.48 | % | | | 129.29 | % | | | 226.62 | % | | | 230.58 | % | | | 692.80 | % |
| |
| | |
| (1) | | The average shares outstanding method has been applied for per share information. |
| |
| (2) | | Total investment return is based on the change in net asset value of a share during the period and assumes reinvestments of dividends and distributions at net asset value and does not reflect the impact of sales charge. |
58 | 2007 ANNUAL REPORT
| | | | | | | | | | | | | | | | | | | | | |
| | | Class B |
| | | Year | | Year | | Year | | Year | | Year |
| | | Ended | | Ended | | Ended | | Ended | | Ended |
| | | June 30, | | June 30, | | June 30, | | June 30, | | June 30, |
| | | 2007 | | 2006 | | 2005 | | 2004 | | 2003 |
| |
Net asset value, beginning of period | | $ | 10.81 | | | $ | 11.12 | | | $ | 11.38 | | | $ | 9.05 | | | $ | 9.50 | |
| |
Income from investment operations | | | | | | | | | | | | | | | | | | | | |
Net investment loss(1) | | | (0.06 | ) | | | (0.13 | ) | | | (0.21 | ) | | | (0.19 | ) | | | (0.08 | ) |
| Net realized and unrealized gain (loss) on investments | | | 0.97 | | | | 0.84 | | | | 1.18 | | | | 2.63 | | | | (0.37 | ) |
| |
Total from investment operations | | | 0.91 | | | | 0.71 | | | | 0.97 | | | | 2.44 | | | | (0.45 | ) |
| |
Distributions to shareholders from: | | | | | | | | | | | | | | | | | | | | |
| Net realized capital gain | | | (0.80 | ) | | | (1.02 | ) | | | (1.23 | ) | | | (0.11 | ) | | | — | |
| |
Total distributions | | | (0.80 | ) | | | (1.02 | ) | | | (1.23 | ) | | | (0.11 | ) | | | — | |
| |
Net asset value, end of period | | $ | 10.92 | | | $ | 10.81 | | | $ | 11.12 | | | $ | 11.38 | | | $ | 9.05 | |
| |
Total Return(2) | | | 8.76 | % | | | 6.31 | % | | | 8.80 | % | | | 27.05 | % | | | (4.74 | )% |
| | | | | | | | | | | | | | | | | | | | | |
Ratios/supplemental data | | | | | | | | | | | | | | | | | | | | |
Net assets, end of period (000’s omitted) | | $ | 597 | | | $ | 886 | | | $ | 1,176 | | | $ | 1,098 | | | $ | 926 | |
Ratio of expenses to average net assets: | | | | | | | | | | | | | | | | | | | | |
| Before expense reimbursements and waived fees | | | 2.51 | % | | | 2.47 | % | | | 2.70 | % | | | 2.73 | % | | | 2.80 | % |
| After expense reimbursements and waived fees | | | 2.51 | % | | | 2.42 | % | | | 2.70 | % | | | 2.73 | % | | | 2.80 | % |
Ratio of net investment loss to average net assets: | | | | | | | | | | | | | | | | | | | | |
| Before expense reimbursements and waived fees | | | (0.53 | )% | | | (1.21 | )% | | | (1.83 | )% | | | (1.87 | )% | | | (1.03 | )% |
| After expense reimbursements and waived fees | | | (0.53 | )% | | | (1.16 | )% | | | (1.83 | )% | | | (1.87 | )% | | | (1.03 | )% |
Portfolio turnover rate | | | 87.48 | % | | | 129.29 | % | | | 226.62 | % | | | 230.58 | % | | | 692.80 | % |
| |
| | |
| (1) | | The average shares outstanding method has been applied for per share information. |
| |
| (2) | | Total investment return is based on the change in net asset value of a share during the period and assumes reinvestments of dividends and distributions at net asset value and does not reflect the impact of sales charge. |
The accompanying notes are an integral part of the financial statements.
2007 ANNUAL REPORT | 59
Financial Highlights
Quaker Capital Opportunities Fund
(For a Share Outstanding Throughout the Period)
| | | | | | | | | | | | | | | | | | | | | |
| | | Class C |
| | | Year | | Year | | Year | | Year | | Year |
| | | Ended | | Ended | | Ended | | Ended | | Ended |
| | | June 30, | | June 30, | | June 30, | | June 30, | | June 30, |
| | | 2007 | | 2006 | | 2005 | | 2004 | | 2003 |
| |
Net asset value, beginning of period | | $ | 10.81 | | | $ | 11.12 | | | $ | 11.38 | | | $ | 9.05 | | | $ | 9.50 | |
| |
Income from investment operations | | | | | | | | | | | | | | | | | | | | |
Net investment loss(1) | | | (0.06 | ) | | | (0.13 | ) | | | (0.21 | ) | | | (0.19 | ) | | | (0.09 | ) |
| Net realized and unrealized gain (loss) on investments | | | 0.97 | | | | 0.84 | | | | 1.18 | | | | 2.63 | | | | (0.36 | ) |
| |
Total from investment operations | | | 0.91 | | | | 0.71 | | | | 0.97 | | | | 2.44 | | | | (0.45 | ) |
| |
Distributions to shareholders from: | | | | | | | | | | | | | | | | | | | | |
| Net realized capital gain | | | (0.80 | ) | | | (1.02 | ) | | | (1.23 | ) | | | (0.11 | ) | | | — | |
| |
Total distributions | | | (0.80 | ) | | | (1.02 | ) | | | (1.23 | ) | | | (0.11 | ) | | | — | |
| |
Net asset value, end of period | | $ | 10.92 | | | $ | 10.81 | | | $ | 11.12 | | | $ | 11.38 | | | $ | 9.05 | |
| |
Total Return(2) | | | 8.76 | % | | | 6.32 | % | | | 8.80 | % | | | 27.05 | % | | | (4.74 | )% |
| | | | | | | | | | | | | | | | | | | | | |
Ratios/supplemental data | | | | | | | | | | | | | | | | | | | | |
Net assets, end of period (000’s omitted) | | $ | 8,449 | | | $ | 11,423 | | | $ | 11,932 | | | $ | 10,757 | | | $ | 8,735 | |
Ratio of expenses to average net assets: | | | | | | | | | | | | | | | | | | | | |
| Before expense reimbursements and waived fees | | | 2.51 | % | | | 2.47 | % | | | 2.70 | % | | | 2.73 | % | | | 2.80 | % |
| After expense reimbursements and waived fees | | | 2.51 | % | | | 2.42 | % | | | 2.70 | % | | | 2.73 | % | | | 2.80 | % |
Ratio of net investment loss to average net assets: | | | | | | | | | | | | | | | | | | | | |
| Before expense reimbursements and waived fees | | | (0.53 | )% | | | (1.21 | )% | | | (1.83 | )% | | | (1.87 | )% | | | (1.03 | )% |
| After expense reimbursements and waived fees | | | (0.53 | )% | | | (1.16 | )% | | | (1.83 | )% | | | (1.87 | )% | | | (1.03 | )% |
Portfolio turnover rate | | | 87.48 | % | | | 129.29 | % | | | 226.62 | % | | | 230.58 | % | | | 692.80 | % |
| |
| | |
| (1) | | The average shares outstanding method has been applied for per share information. |
| |
| (2) | | Total investment return is based on the change in net asset value of a share during the period and assumes reinvestments of dividends and distributions at net asset value and does not reflect the impact of sales charge. |
60 | 2007 ANNUAL REPORT
[This page intentionally left blank]
Financial Highlights
Quaker Biotech-Pharma Healthcare Fund
(For a Share Outstanding Throughout the Period)
| | | | | | | | | | | | | | | | | | | | | |
| | | Class A |
| | | | | | | | | | | | | | | | | | | For the |
| | | | | | | | | | | | | | | | | | | period from |
| | | Year | | Year | | Year | | Year | | October 14, 2002 |
| | | Ended | | Ended | | Ended | | Ended | | (commencement of |
| | | June 30, | | June 30, | | June 30, | | June 30, | | operations) to |
| | | 2007 | | 2006 | | 2005 | | 2004 | | June 30, 2003(1) |
| |
Net asset value, beginning of period | | $ | 12.50 | | | $ | 12.30 | | | $ | 13.64 | | | $ | 11.83 | | | $ | 10.00 | |
| |
Income From Investment Operations | | | | | | | | | | | | | | | | | | | | |
Net investment loss(2) | | | (0.11 | ) | | | (0.11 | ) | | | (0.19 | ) | | | (0.28 | ) | | | (0.08 | ) |
| Net realized and unrealized gain (loss) on investments | | | 1.34 | | | | 0.37 | | | | (0.22 | ) | | | 2.80 | | | | 1.91 | |
| |
Total from investment operations | | | 1.23 | | | | 0.26 | | | | (0.41 | ) | | | 2.52 | | | | 1.83 | |
| |
Distributions to shareholders from: | | | | | | | | | | | | | | | | | | | | |
| Net realized capital gain | | | (1.28 | ) | | | (0.06 | ) | | | (0.93 | ) | | | (0.71 | ) | | | — | |
| |
Total distributions | | | (1.28 | ) | | | (0.06 | ) | | | (0.93 | ) | | | (0.71 | ) | | | — | |
| |
Net asset value, end of period | | $ | 12.45 | | | $ | 12.50 | | | $ | 12.30 | | | $ | 13.64 | | | $ | 11.83 | |
| |
Total Return(3) | | | 9.51 | % | | | 2.14 | % | | | (3.22 | )% | | | 21.97 | % | | | 18.30 | % |
| | | | | | | | | | | | | | | | | | | | | |
Ratios/supplemental data | | | | | | | | | | | | | | | | | | | | |
Net assets, end of period (000’s omitted) | | $ | 5,149 | | | $ | 14,324 | | | $ | 15,295 | | | $ | 9,908 | | | $ | 2,611 | |
Ratio of expenses to average net assets: | | | | | | | | | | | | | | | | | | | | |
| Before expense reimbursements and waived fees | | | 2.34 | % | | | 2.19 | % | | | 2.31 | % | | | 2.41 | % | | | 2.68 | % |
| After expense reimbursements and waived fees | | | 2.34 | % | | | 2.19 | % | | | 2.31 | % | | | 2.41 | % | | | 2.64 | % |
Ratio of net investment loss to average net assets: | | | | | | | | | | | | | | | | | | | | |
| Before expense reimbursements and waived fees | | | (0.88 | )% | | | (0.79 | )% | | | (1.56 | )% | | | (2.15 | )% | | | (2.22 | )% |
| After expense reimbursements and waived fees | | | (0.88 | )% | | | (0.79 | )% | | | (1.56 | )% | | | (2.15 | )% | | | (2.18 | )% |
Portfolio turnover rate | | | 117.35 | % | | | 199.35 | % | | | 272.82 | % | | | 139.37 | % | | | 108.76 | % |
| |
| | |
| (1) | | Ratios have been annualized, total return and portfolio turnover have not been annualized. |
| |
| (2) | | The average shares outstanding method has been applied for per share information. |
| |
| (3) | | Total investment return is based on the change in net asset value of a share during the period and assumes reinvestments of dividends and distributions at net asset value and does not reflect the impact of sales charge. |
62 | 2007 ANNUAL REPORT
| | | | | | | | | | | | | | | | | | | | | |
| | | Class B |
| | | | | | | | | | | | | | | | | | | For the |
| | | | | | | | | | | | | | | | | | | period from |
| | | Year | | Year | | Year | | Year | | September 23, 2002 |
| | | Ended | | Ended | | Ended | | Ended | | (commencement of |
| | | June 30, | | June 30, | | June 30, | | June 30, | | operations) to |
| | | 2007 | | 2006 | | 2005 | | 2004 | | June 30, 2003(1) |
| |
Net asset value, beginning of period | | $ | 12.15 | | | $ | 12.04 | | | $ | 13.47 | | | $ | 11.77 | | | $ | 10.00 | |
| |
Income From Investment Operations | | | | | | | | | | | | | | | | | | | | |
Net investment loss(2) | | | (0.20 | ) | | | (0.20 | ) | | | (0.29 | ) | | | (0.37 | ) | | | (0.08 | ) |
| Net realized and unrealized gain (loss) on investments | | | 1.30 | | | | 0.37 | | | | (0.21 | ) | | | 2.78 | | | | 1.85 | |
| |
Total from investment operations | | | 1.10 | | | | 0.17 | | | | (0.50 | ) | | | 2.41 | | | | 1.77 | |
| |
Distributions to shareholders from: | | | | | | | | | | | | | | | | | | | | |
| Net realized capital gain | | | (1.28 | ) | | | (0.06 | ) | | | (0.93 | ) | | | (0.71 | ) | | | — | |
| |
Total distributions | | | (1.28 | ) | | | (0.06 | ) | | | (0.93 | ) | | | (0.71 | ) | | | — | |
| |
Net asset value, end of period | | $ | 11.97 | | | $ | 12.15 | | | $ | 12.04 | | | $ | 13.47 | | | $ | 11.77 | |
| |
Total Return(3) | | | 8.67 | % | | | 1.43 | % | | | (3.95 | )% | | | 21.12 | % | | | 17.70 | % |
| | | | | | | | | | | | | | | | | | | | | |
Ratios/supplemental data | | | | | | | | | | | | | | | | | | | | |
Net assets, end of period (000’s omitted) | | $ | 837 | | | $ | 1,131 | | | $ | 1,238 | | | $ | 1,761 | | | $ | 1,565 | |
Ratio of expenses to average net assets: | | | | | | | | | | | | | | | | | | | | |
| Before expense reimbursements and waived fees | | | 3.09 | % | | | 2.94 | % | | | 3.06 | % | | | 3.16 | % | | | 3.43 | % |
| After expense reimbursements and waived fees | | | 3.09 | % | | | 2.94 | % | | | 3.06 | % | | | 3.16 | % | | | 3.39 | % |
Ratio of net investment loss to average net assets: | | | | | | | | | | | | | | | | | | | | |
| Before expense reimbursements and waived fees | | | (1.63 | )% | | | (1.54 | )% | | | (2.31 | )% | | | (2.90 | )% | | | (2.97 | )% |
| After expense reimbursements and waived fees | | | (1.63 | )% | | | (1.54 | )% | | | (2.31 | )% | | | (2.90 | )% | | | (2.93 | )% |
Portfolio turnover rate | | | 117.35 | % | | | 199.35 | % | | | 272.82 | % | | | 139.37 | % | | | 108.76 | % |
| |
| | |
| (1) | | Ratios have been annualized, total return and portfolio turnover have not been annualized. |
| |
| (2) | | The average shares outstanding method has been applied for per share information. |
| |
| (3) | | Total investment return is based on the change in net asset value of a share during the period and assumes reinvestments of dividends and distributions at net asset value and does not reflect the impact of sales charge. |
The accompanying notes are an integral part of the financial statements.
2007 ANNUAL REPORT | 63
Financial Highlights
Quaker Biotech-Pharma Healthcare Fund
(For a Share Outstanding Throughout the Period)
| | | | | | | | | | | | | | | | | | | | | |
| | | Class C |
| | | | | | | | | | | | | | | | | | | For the |
| | | | | | | | | | | | | | | | | | | period from |
| | | Year | | Year | | Year | | Year | | November 20, 2002 |
| | | Ended | | Ended | | Ended | | Ended | | (commencement of |
| | | June 30, | | June 30, | | June 30, | | June 30, | | operations) to |
| | | 2007 | | 2006 | | 2005 | | 2004 | | June 30, 2003(1) |
| |
Net asset value, beginning of period | | $ | 12.16 | | | $ | 12.05 | | | $ | 13.48 | | | $ | 11.78 | | | $ | 10.02 | |
| |
Income From Investment Operations | | | | | | | | | | | | | | | | | | | | |
Net investment loss(2) | | | (0.20 | ) | | | (0.20 | ) | | | (0.28 | ) | | | (0.37 | ) | | | (0.09 | ) |
| Net realized and unrealized gain (loss) on investments | | | 1.30 | | | | 0.37 | | | | (0.22 | ) | | | 2.78 | | | | 1.85 | |
| |
Total from investment operations | | | 1.10 | | | | 0.17 | | | | (0.50 | ) | | | 2.41 | | | | 1.76 | |
| |
Distributions to shareholders from: | | | | | | | | | | | | | | | | | | | | |
| Net realized capital gain | | | (1.28 | ) | | | (0.06 | ) | | | (0.93 | ) | | | (0.71 | ) | | | — | |
| |
Total distributions | | | (1.28 | ) | | | (0.06 | ) | | | (0.93 | ) | | | (0.71 | ) | | | — | |
| |
Net asset value, end of period | | $ | 11.98 | | | $ | 12.16 | | | $ | 12.05 | | | $ | 13.48 | | | $ | 11.78 | |
| |
Total Return(3) | | | 8.67 | % | | | 1.43 | % | | | (3.95 | )% | | | 21.11 | % | | | 17.57 | % |
| | | | | | | | | | | | | | | | | | | | | |
Ratios/supplemental data | | | | | | | | | | | | | | | | | | | | |
Net assets, end of period (000’s omitted) | | $ | 3,942 | | | $ | 3,802 | | | $ | 4,038 | | | $ | 4,084 | | | $ | 1,588 | |
Ratio of expenses to average net assets: | | | | | | | | | | | | | | | | | | | | |
| Before expense reimbursements and waived fees | | | 3.09 | % | | | 2.94 | % | | | 3.06 | % | | | 3.16 | % | | | 3.43 | % |
| After expense reimbursements and waived fees | | | 3.09 | % | | | 2.94 | % | | | 3.06 | % | | | 3.16 | % | | | 3.39 | % |
Ratio of net investment loss to average net assets: | | | | | | | | | | | | | | | | | | | | |
| Before expense reimbursements and waived fees | | | (1.63 | )% | | | (1.54 | )% | | | (2.31 | )% | | | (2.90 | )% | | | (2.97 | )% |
| After expense reimbursements and waived fees | | | (1.63 | )% | | | (1.54 | )% | | | (2.31 | )% | | | (2.90 | )% | | | (2.93 | )% |
Portfolio turnover rate | | | 117.35 | % | | | 199.35 | % | | | 272.82 | % | | | 139.37 | % | | | 108.76 | % |
| |
| | |
| (1) | | Ratios have been annualized, total return and portfolio turnover have not been annualized. |
| |
| (2) | | The average shares outstanding method has been applied for per share information. |
| |
| (3) | | Total investment return is based on the change in net asset value of a share during the period and assumes reinvestments of dividends and distributions at net asset value and does not reflect the impact of sales charge. |
64 | 2007 ANNUAL REPORT
[This page intentionally left blank]
Financial Highlights
Quaker Mid-Cap Value Fund
(For a Share Outstanding Throughout the Period)
| | | | | | | | | | | | | | | | | | | | | |
| | | Class A |
| | | Year | | Year | | Year | | Year | | Year |
| | | Ended | | Ended | | Ended | | Ended | | Ended |
| | | June 30, | | June 30, | | June 30, | | June 30, | | June 30, |
| | | 2007 | | 2006 | | 2005 | | 2004 | | 2003 |
| |
Net asset value, beginning of period | | $ | 15.89 | | | $ | 16.67 | | | $ | 16.03 | | | $ | 10.75 | | | $ | 11.80 | |
| |
Income From Investment Operations | | | | | | | | | | | | | | | | | | | | |
Net investment loss(1) | | | (0.09 | ) | | | (0.10 | ) | | | (0.09 | ) | | | (0.13 | ) | | | (0.01 | ) |
| Net realized and unrealized gain (loss) on investments | | | 2.37 | | | | 1.75 | | | | 2.09 | | | | 5.41 | | | | (0.54 | ) |
| |
Total from investment operations | | | 2.28 | | | | 1.65 | | | | 2.00 | | | | 5.28 | | | | (0.55 | ) |
| |
Distributions to shareholders from: | | | | | | | | | | | | | | | | | | | | |
| Net realized capital gain | | | (0.33 | ) | | | (2.43 | ) | | | (1.36 | ) | | | — | | | | (0.50 | ) |
| |
Total distributions | | | (0.33 | ) | | | (2.43 | ) | | | (1.36 | ) | | | — | | | | (0.50 | ) |
| |
Net asset value, end of period | | $ | 17.84 | | | $ | 15.89 | | | $ | 16.67 | | | $ | 16.03 | | | $ | 10.75 | |
| |
Total Return(2) | | | 14.51 | % | | | 10.32 | % | | | 12.57 | % | | | 49.12 | % | | | (3.99 | )% |
| | | | | | | | | | | | | | | | | | | | | |
Ratios/supplemental data | | | | | | | | | | | | | | | | | | | | |
Net assets, end of period (000’s omitted) | | $ | 135,680 | | | $ | 70,866 | | | $ | 40,198 | | | $ | 30,393 | | | $ | 8,143 | |
Ratio of expenses to average net assets: | | | | | | | | | | | | | | | | | | | | |
| Before fees paid indirectly through commission recapture | | | 1.64 | % | | | 1.69 | % | | | 1.84 | % | | | 2.01 | % | | | 2.11 | % |
| After fees paid indirectly through commission recapture | | | 1.64 | % | | | 1.65 | % | | | 1.66 | % | | | 2.01 | % | | | 2.11 | % |
Ratio of net investment income (loss) to average net assets: | | | | | | | | | | | | | | | | | | | | |
| Before fees paid indirectly through commission recapture | | | (0.56 | )% | | | (0.64 | )% | | | (0.73 | )% | | | (0.84 | )% | | | 0.02 | % |
| After fees paid indirectly through commission recapture | | | (0.56 | )% | | | (0.60 | )% | | | (0.55 | )% | | | (0.84 | )% | | | 0.02 | % |
Portfolio turnover rate | | | 74.49 | % | | | 82.01 | % | | | 186.72 | % | | | 134.73 | % | | | 122.76 | % |
| |
| | |
| (1) | | The average shares outstanding method has been applied for per share information. |
| |
| (2) | | Total investment return is based on the change in net asset value of a share during the period and assumes reinvestments of dividends and distributions at net asset value and does not reflect the impact of sales charge. |
66 | 2007 ANNUAL REPORT
| | | | | | | | | | | | | | | | | | | | | |
| | | Class B |
| | | Year | | Year | | Year | | Year | | Year |
| | | Ended | | Ended | | Ended | | Ended | | Ended |
| | | June 30, | | June 30, | | June 30, | | June 30, | | June 30, |
| | | 2007 | | 2006 | | 2005 | | 2004 | | 2003 |
| |
Net asset value, beginning of period | | $ | 15.20 | | | $ | 16.16 | | | $ | 15.69 | | | $ | 10.60 | | | $ | 11.71 | |
| |
Income From Investment Operations | | | | | | | | | | | | | | | | | | | | |
Net investment loss(1) | | | (0.21 | ) | | | (0.22 | ) | | | (0.20 | ) | | | (0.21 | ) | | | (0.07 | ) |
| Net realized and unrealized gain (loss) on investments | | | 2.27 | | | | 1.69 | | | | 2.03 | | | | 5.30 | | | | (0.54 | ) |
| |
Total from investment operations | | | 2.06 | | | | 1.47 | | | | 1.83 | | | | 5.09 | | | | (0.61 | ) |
| |
Distributions to shareholders from: | | | | | | | | | | | | | | | | | | | | |
| Net realized capital gain | | | (0.33 | ) | | | (2.43 | ) | | | (1.36 | ) | | | — | | | | (0.50 | ) |
| |
Total distributions | | | (0.33 | ) | | | (2.43 | ) | | | (1.36 | ) | | | — | | | | (0.50 | ) |
| |
Net asset value, end of period | | $ | 16.93 | | | $ | 15.20 | | | $ | 16.16 | | | $ | 15.69 | | | $ | 10.60 | |
| |
Total Return(2) | | | 13.72 | % | | | 9.47 | % | | | 11.73 | % | | | 48.02 | % | | | (4.56 | )% |
| | | | | | | | | | | | | | | | | | | | | |
Ratios/supplemental data | | | | | | | | | | | | | | | | | | | | |
Net assets, end of period (000’s omitted) | | $ | 2,273 | | | $ | 2,188 | | | $ | 2,452 | | | $ | 3,055 | | | $ | 2,211 | |
Ratio of expenses to average net assets: | | | | | | | | | | | | | | | | | | | | |
| Before fees paid indirectly through commission recapture | | | 2.39 | % | | | 2.44 | % | | | 2.59 | % | | | 2.76 | % | | | 2.86 | % |
| After fees paid indirectly through commission recapture | | | 2.39 | % | | | 2.40 | % | | | 2.41 | % | | | 2.76 | % | | | 2.86 | % |
Ratio of net investment loss to average net assets: | | | | | | | | | | | | | | | | | | | | |
| Before fees paid indirectly through commission recapture | | | (1.31 | )% | | | (1.39 | )% | | | (1.48 | )% | | | (1.59 | )% | | | (0.73 | )% |
| After fees paid indirectly through commission recapture | | | (1.31 | )% | | | (1.35 | )% | | | (1.30 | )% | | | (1.59 | )% | | | (0.73 | )% |
Portfolio turnover rate | | | 74.49 | % | | | 82.01 | % | | | 186.72 | % | | | 134.73 | % | | | 122.76 | % |
| |
| | |
| (1) | | The average shares outstanding method has been applied for per share information. |
| |
| (2) | | Total investment return is based on the change in net asset value of a share during the period and assumes reinvestments of dividends and distributions at net asset value and does not reflect the impact of sales charge. |
The accompanying notes are an integral part of the financial statements.
2007 ANNUAL REPORT | 67
Financial Highlights
Quaker Mid-Cap Value Fund
(For a Share Outstanding Throughout the Period)
| | | | | | | | | | | | | | | | | | | | | |
| | | Class C |
| | | Year | | Year | | Year | | Year | | Year |
| | | Ended | | Ended | | Ended | | Ended | | Ended |
| | | June 30, | | June 30, | | June 30, | | June 30, | | June 30, |
| | | 2007 | | 2006 | | 2005 | | 2004 | | 2003 |
| |
Net asset value, beginning of period | | $ | 14.96 | | | $ | 15.94 | | | $ | 15.49 | | | $ | 10.47 | | | $ | 11.59 | |
| |
Income From Investment Operations | | | | | | | | | | | | | | | | | | | | |
Net investment loss(1) | | | (0.20 | ) | | | (0.21 | ) | | | (0.20 | ) | | | (0.21 | ) | | | (0.07 | ) |
| Net realized and unrealized gain (loss) on investments | | | 2.22 | | | | 1.66 | | | | 2.01 | | | | 5.23 | | | | (0.55 | ) |
| |
Total from investment operations | | | 2.02 | | | | 1.45 | | | | 1.81 | | | | 5.02 | | | | (0.62 | ) |
| |
Distributions to shareholders from: | | | | | | | | | | | | | | | | | | | | |
| Net realized capital gain | | | (0.33 | ) | | | (2.43 | ) | | | (1.36 | ) | | | — | | | | (0.50 | ) |
| |
Total distributions | | | (0.33 | ) | | | (2.43 | ) | | | (1.36 | ) | | | — | | | | (0.50 | ) |
| |
Net asset value, end of period | | $ | 16.65 | | | $ | 14.96 | | | $ | 15.94 | | | $ | 15.49 | | | $ | 10.47 | |
| |
Total Return(2) | | | 13.67 | % | | | 9.47 | % | | | 11.75 | % | | | 47.95 | % | | | (4.69 | )% |
| | | | | | | | | | | | | | | | | | | | | |
Ratios/supplemental data | | | | | | | | | | | | | | | | | | | | |
Net assets, end of period (000’s omitted) | | $ | 14,975 | | | $ | 16,458 | | | $ | 13,379 | | | $ | 9,138 | | | $ | 4,815 | |
Ratio of expenses to average net assets: | | | | | | | | | | | | | | | | | | | | |
| Before fees paid indirectly through commission recapture | | | 2.39 | % | | | 2.44 | % | | | 2.59 | % | | | 2.76 | % | | | 2.86 | % |
| After fees paid indirectly through commission recapture | | | 2.39 | % | | | 2.40 | % | | | 2.41 | % | | | 2.76 | % | | | 2.86 | % |
Ratio of net investment loss to average net assets: | | | | | | | | | | | | | | | | | | | | |
| Before fees paid indirectly through commission recapture | | | (1.31 | )% | | | (1.39 | )% | | | (1.48 | )% | | | (1.59 | )% | | | (0.73 | )% |
| After fees paid indirectly through commission recapture | | | (1.31 | )% | | | (1.35 | )% | | | (1.30 | )% | | | (1.59 | )% | | | (0.73 | )% |
Portfolio turnover rate | | | 74.49 | % | | | 82.01 | % | | | 186.72 | % | | | 134.73 | % | | | 122.76 | % |
| |
| | |
| (1) | | The average shares outstanding method has been applied for per share information. |
| |
| (2) | | Total investment return is based on the change in net asset value of a share during the period and assumes reinvestments of dividends and distributions at net asset value and does not reflect the impact of sales charge. |
68 | 2007 ANNUAL REPORT
| | | | | | | | | | | | | | | | | | | | | |
| | | Institutional Class |
| | | Year | | Year | | Year | | Year | | Year |
| | | Ended | | Ended | | Ended | | Ended | | Ended |
| | | June 30, | | June 30, | | June 30, | | June 30, | | June 30, |
| | | 2007 | | 2006 | | 2005 | | 2004 | | 2003 |
| |
Net asset value, beginning of period | | $ | 16.27 | | | $ | 16.98 | | | $ | 16.27 | | | $ | 10.88 | | | $ | 11.90 | |
| |
Income From Investment Operations | | | | | | | | | | | | | | | | | | | | |
Net investment loss(1) | | | (0.05 | ) | | | (0.06 | ) | | | (0.05 | ) | | | (0.07 | ) | | | 0.04 | |
| Net realized and unrealized gain (loss) on investments | | | 2.44 | | | | 1.78 | | | | 2.12 | | | | 5.46 | | | | (0.56 | ) |
| |
Total from investment operations | | | 2.39 | | | | 1.72 | | | | 2.07 | | | | 5.39 | | | | (0.52 | ) |
| |
Distributions to shareholders from: | | | | | | | | | | | | | | | | | | | | |
| Net realized capital gain | | | (0.33 | ) | | | (2.43 | ) | | | (1.36 | ) | | | — | | | | (0.50 | ) |
| |
Total distributions | | | (0.33 | ) | | | (2.43 | ) | | | (1.36 | ) | | | — | | | | (0.50 | ) |
| |
Net asset value, end of period | | $ | 18.33 | | | $ | 16.27 | | | $ | 16.98 | | | $ | 16.27 | | | $ | 10.88 | |
| |
Total Return(2) | | | 14.85 | % | | | 10.56 | % | | | 12.83 | % | | | 49.54 | % | | | (3.70 | )% |
| | | | | | | | | | | | | | | | | | | | | |
Ratios/supplemental data | | | | | | | | | | | | | | | | | | | | |
Net assets, end of period (000’s omitted) | | $ | 1,902 | | | $ | 1,503 | | | $ | 1,752 | | | $ | 1,672 | | | $ | 1,060 | |
Ratio of expenses to average net assets: | | | | | | | | | | | | | | | | | | | | |
| Before fees paid indirectly through commission recapture | | | 1.39 | % | | | 1.44 | % | | | 1.59 | % | | | 1.76 | % | | | 1.86 | % |
| After fees paid indirectly through commission recapture | | | 1.39 | % | | | 1.40 | % | | | 1.41 | % | | | 1.76 | % | | | 1.86 | % |
Ratio of net investment income (loss) to average net assets: | | | | | | | | | | | | | | | | | | | | |
| Before fees paid indirectly through commission recapture | | | (0.31 | )% | | | (0.39 | )% | | | (0.48 | )% | | | (0.59 | )% | | | 0.27 | % |
| After fees paid indirectly through commission recapture | | | (0.31 | )% | | | (0.35 | )% | | | (0.30 | )% | | | (0.59 | )% | | | 0.27 | % |
Portfolio turnover rate | | | 74.49 | % | | | 82.01 | % | | | 186.72 | % | | | 134.73 | % | | | 122.76 | % |
| |
| | |
| (1) | | The average shares outstanding method has been applied for per share information. |
| |
| (2) | | Total investment return is based on the change in net asset value of a share during the period and assumes reinvestments of dividends and distributions at net asset value and does not reflect the impact of sales charge. |
The accompanying notes are an integral part of the financial statements.
2007 ANNUAL REPORT | 69
Financial Highlights
Quaker Small-Cap Value Fund
(For a Share Outstanding Throughout the Period)
| | | | | | | | | | | | | | | | | | | | | |
| | | Class A |
| | | Year | | Year | | Year | | Year | | Year |
| | | Ended | | Ended | | Ended | | Ended | | Ended |
| | | June 30, | | June 30, | | June 30, | | June 30, | | June 30, |
| | | 2007 | | 2006 | | 2005 | | 2004 | | 2003 |
| |
Net asset value, beginning of period | | $ | 19.51 | | | $ | 19.39 | | | $ | 18.95 | | | $ | 14.17 | | | $ | 14.91 | |
| |
Income from investment operations | | | | | | | | | | | | | | | | | | | | |
Net investment loss(1) | | | (0.05 | ) | | | (0.17 | ) | | | (0.14 | ) | | | (0.09 | ) | | | (0.22 | ) |
| Net realized and unrealized gain on investments | | | 3.39 | | | | 3.23 | | | | 2.39 | | | | 4.90 | | | | 0.38 | |
| |
Total from investment operations | | | 3.34 | | | | 3.06 | | | | 2.25 | | | | 4.81 | | | | 0.16 | |
| |
Distributions to shareholders from: | | | | | | | | | | | | | | | | | | | | |
| Net realized capital gain | | | (2.14 | ) | | | (2.94 | ) | | | (1.81 | ) | | | (0.03 | ) | | | (0.90 | ) |
| |
Total distributions | | | (2.14 | ) | | | (2.94 | ) | | | (1.81 | ) | | | (0.03 | ) | | | (0.90 | ) |
| |
Net asset value, end of period | | $ | 20.71 | | | $ | 19.51 | | | $ | 19.39 | | | $ | 18.95 | | | $ | 14.17 | |
| |
Total Return(2) | | | 18.22 | % | | | 16.76 | % | | | 12.17 | % | | | 33.97 | % | | | 2.28 | % |
| | | | | | | | | | | | | | | | | | | | | |
Ratios/supplemental data | | | | | | | | | | | | | | | | | | | | |
Net assets, end of period (000’s omitted) | | $ | 46,385 | | | $ | 36,735 | | | $ | 21,818 | | | $ | 17,516 | | | $ | 7,393 | |
Ratio of expenses to average net assets: | | | | | | | | | | | | | | | | | | | | |
| Before expense reimbursements and waived fees | | | 1.82 | % | | | 1.83 | % | | | 1.94 | % | | | 1.68 | % | | | 2.63 | % |
| After expense reimbursements and waived fees | | | 1.73 | % | | | 1.75 | % | | | 1.94 | % | | | 1.68 | % | | | 2.58 | % |
Ratio of net investment loss to average net assets: | | | | | | | | | | | | | | | | | | | | |
| Before expense reimbursements and waived fees | | | (0.36 | )% | | | (0.91 | )% | | | (0.75 | )% | | | (0.52 | )% | | | (1.83 | )% |
| After expense reimbursements and waived fees | | | (0.27 | )% | | | (0.83 | )% | | | (0.75 | )% | | | (0.52 | )% | | | (1.78 | )% |
Portfolio turnover rate | | | 144.26 | % | | | 129.64 | % | | | 127.20 | % | | | 101.86 | % | | | 89.57 | % |
| |
| | |
| (1) | | The average shares outstanding method has been applied for per share information. |
| |
| (2) | | Total investment return is based on the change in net asset value of a share during the period and assumes reinvestments of dividends and distributions at net asset value and does not reflect the impact of sales charge. |
70 | 2007 ANNUAL REPORT
| | | | | | | | | | | | | | | | | | | | | |
| | | Class B |
| | | Year | | Year | | Year | | Year | | Year |
| | | Ended | | Ended | | Ended | | Ended | | Ended |
| | | June 30, | | June 30, | | June 30, | | June 30, | | June 30, |
| | | 2007 | | 2006 | | 2005 | | 2004 | | 2003 |
| |
Net asset value, beginning of period | | $ | 18.52 | | | $ | 18.66 | | | $ | 18.43 | | | $ | 13.89 | | | $ | 14.75 | |
| |
Income from investment operations | | | | | | | | | | | | | | | | | | | | |
Net investment loss(1) | | | (0.19 | ) | | | (0.30 | ) | | | (0.27 | ) | | | (0.21 | ) | | | (0.31 | ) |
| Net realized and unrealized gain on investments | | | 3.19 | | | | 3.10 | | | | 2.31 | | | | 4.78 | | | | 0.35 | |
| |
Total from investment operations | | | 3.00 | | | | 2.80 | | | | 2.04 | | | | 4.57 | | | | 0.04 | |
| |
Distributions to shareholders from: | | | | | | | | | | | | | | | | | | | | |
| Net realized capital gain | | | (2.14 | ) | | | (2.94 | ) | | | (1.81 | ) | | | (0.03 | ) | | | (0.90 | ) |
| |
Total distributions | | | (2.14 | ) | | | (2.94 | ) | | | (1.81 | ) | | | (0.03 | ) | | | (0.90 | ) |
| |
Net asset value, end of period | | $ | 19.38 | | | $ | 18.52 | | | $ | 18.66 | | | $ | 18.43 | | | $ | 13.89 | |
| |
Total Return(2) | | | 17.31 | % | | | 15.95 | % | | | 11.33 | % | | | 32.93 | % | | | 1.46 | % |
| | | | | | | | | | | | | | | | | | | | | |
Ratios/supplemental data | | | | | | | | | | | | | | | | | | | | |
Net assets, end of period (000’s omitted) | | $ | 1,023 | | | $ | 1,052 | | | $ | 1,005 | | | $ | 985 | | | $ | 759 | |
Ratio of expenses to average net assets: | | | | | | | | | | | | | | | | | | | | |
| Before expense reimbursements and waived fees | | | 2.57 | % | | | 2.58 | % | | | 2.69 | % | | | 2.43 | % | | | 3.38 | % |
| After expense reimbursements and waived fees | | | 2.48 | % | | | 2.50 | % | | | 2.69 | % | | | 2.43 | % | | | 3.33 | % |
Ratio of net investment loss to average net assets: | | | | | | | | | | | | | | | | | | | | |
| Before expense reimbursements and waived fees | | | (1.11 | )% | | | (1.66 | )% | | | (1.50 | )% | | | (1.27 | )% | | | (2.58 | )% |
| After expense reimbursements and waived fees | | | (1.02 | )% | | | (1.58 | )% | | | (1.50 | )% | | | (1.27 | )% | | | (2.53 | )% |
Portfolio turnover rate | | | 144.26 | % | | | 129.64 | % | | | 127.20 | % | | | 101.86 | % | | | 89.57 | % |
| |
| | |
| (1) | | The average shares outstanding method has been applied for per share information. |
| |
| (2) | | Total investment return is based on the change in net asset value of a share during the period and assumes reinvestments of dividends and distributions at net asset value and does not reflect the impact of sales charge. |
The accompanying notes are an integral part of the financial statements.
2007 ANNUAL REPORT | 71
Financial Highlights
Quaker Small-Cap Value Fund
(For a Share Outstanding Throughout the Period)
| | | | | | | | | | | | | | | | | | | | | |
| | | Class C |
| | | Year | | Year | | Year | | Year | | Year |
| | | Ended | | Ended | | Ended | | Ended | | Ended |
| | | June 30, | | June 30, | | June 30, | | June 30, | | June 30, |
| | | 2007 | | 2006 | | 2005 | | 2004 | | 2003 |
| |
Net asset value, beginning of period | | $ | 17.99 | | | $ | 18.21 | | | $ | 18.02 | | | $ | 13.56 | | | $ | 14.42 | |
| |
Income from investment operations | | | | | | | | | | | | | | | | | | | | |
Net investment loss(1) | | | (0.18 | ) | | | (0.29 | ) | | | (0.27 | ) | | | (0.21 | ) | | | (0.31 | ) |
| Net realized and unrealized gain on investments | | | 3.10 | | | | 3.01 | | | | 2.27 | | | | 4.70 | | | | 0.35 | |
| |
Total from investment operations | | | 2.92 | | | | 2.72 | | | | 2.00 | | | | 4.49 | | | | 0.04 | |
| |
Distributions to shareholders from: | | | | | | | | | | | | | | | | | | | | |
| Net realized capital gain | | | (2.14 | ) | | | (2.94 | ) | | | (1.81 | ) | | | (0.03 | ) | | | (0.90 | ) |
| |
Total distributions | | | (2.14 | ) | | | (2.94 | ) | | | (1.81 | ) | | | (0.03 | ) | | | (0.90 | ) |
| |
Net asset value, end of period | | $ | 18.77 | | | $ | 17.99 | | | $ | 18.21 | | | $ | 18.02 | | | $ | 13.56 | |
| |
Total Return(2) | | | 17.38 | % | | | 15.91 | % | | | 11.37 | % | | | 33.14 | % | | | 1.49 | % |
| | | | | | | | | | | | | | | | | | | | | |
Ratios/supplemental data | | | | | | | | | | | | | | | | | | | | |
Net assets, end of period (000’s omitted) | | $ | 13,436 | | | $ | 9,884 | | | $ | 6,597 | | | $ | 3,914 | | | $ | 1,383 | |
Ratio of expenses to average net assets: | | | | | | | | | | | | | | | | | | | | |
| Before expense reimbursements and waived fees | | | 2.57 | % | | | 2.58 | % | | | 2.69 | % | | | 2.43 | % | | | 3.38 | % |
| After expense reimbursements and waived fees | | | 2.48 | % | | | 2.50 | % | | | 2.69 | % | | | 2.43 | % | | | 3.33 | % |
Ratio of net investment loss to average net assets: | | | | | | | | | | | | | | | | | | | | |
| Before expense reimbursements and waived fees | | | (1.11 | )% | | | (1.66 | )% | | | (1.50 | )% | | | (1.27 | )% | | | (2.58 | )% |
| After expense reimbursements and waived fees | | | (1.02 | )% | | | (1.58 | )% | | | (1.50 | )% | | | (1.27 | )% | | | (2.53 | )% |
Portfolio turnover rate | | | 144.26 | % | | | 129.64 | % | | | 127.20 | % | | | 101.86 | % | | | 89.57 | % |
| |
| | |
| (1) | | The average shares outstanding method has been applied for per share information. |
| |
| (2) | | Total investment return is based on the change in net asset value of a share during the period and assumes reinvestments of dividends and distributions at net asset value and does not reflect the impact of sales charge. |
72 | 2007 ANNUAL REPORT
| | | | | | | | | | | | | | | | | | | | | |
| | | Institutional Class |
| | | Year | | Year | | Year | | Year | | Year |
| | | Ended | | Ended | | Ended | | Ended | | Ended |
| | | June 30, | | June 30, | | June 30, | | June 30, | | June 30, |
| | | 2007 | | 2006 | | 2005 | | 2004 | | 2003 |
| |
Net asset value, beginning of period | | $ | 19.88 | | | $ | 19.65 | | | $ | 19.14 | | | $ | 14.28 | | | $ | 14.98 | |
| |
Income from investment operations | | | | | | | | | | | | | | | | | | | | |
Net investment loss(1) | | | — | | | | (0.12 | ) | | | (0.09 | ) | | | (0.05 | ) | | | (0.19 | ) |
| Net realized and unrealized gain on investments | | | 3.45 | | | | 3.29 | | | | 2.41 | | | | 4.94 | | | | 0.39 | |
| |
Total from investment operations | | | 3.45 | | | | 3.17 | | | | 2.32 | | | | 4.89 | | | | 0.20 | |
| |
Distributions to shareholders from: | | | | | | | | | | | | | | | | | | | | |
| Net realized capital gain | | | (2.14 | ) | | | (2.94 | ) | | | (1.81 | ) | | | (0.03 | ) | | | (0.90 | ) |
| |
Total distributions | | | (2.14 | ) | | | (2.94 | ) | | | (1.81 | ) | | | (0.03 | ) | | | (0.90 | ) |
| |
Net asset value, end of period | | $ | 21.19 | | | $ | 19.88 | | | $ | 19.65 | | | $ | 19.14 | | | $ | 14.28 | |
| |
Total Return(2) | | | 18.44 | % | | | 17.12 | % | | | 12.42 | % | | | 34.27 | % | | | 2.55 | % |
| | | | | | | | | | | | | | | | | | | | | |
Ratios/supplemental data | | | | | | | | | | | | | | | | | | | | |
Net assets, end of period (000’s omitted) | | $ | 30,540 | | | $ | 28,727 | | | $ | 26,963 | | | $ | 25,783 | | | $ | 15,214 | |
Ratio of expenses to average net assets: | | | | | | | | | | | | | | | | | | | | |
| Before expense reimbursements and waived fees | | | 1.57 | % | | | 1.58 | % | | | 1.69 | % | | | 1.43 | % | | | 2.38 | % |
| After expense reimbursements and waived fees | | | 1.48 | % | | | 1.50 | % | | | 1.69 | % | | | 1.43 | % | | | 2.33 | % |
Ratio of net investment loss to average net assets: | | | | | | | | | | | | | | | | | | | | |
| Before expense reimbursements and waived fees | | | (0.11 | )% | | | (0.66 | )% | | | (0.50 | )% | | | (0.27 | )% | | | (1.58 | )% |
| After expense reimbursements and waived fees | | | (0.02 | )% | | | (0.58 | )% | | | (0.50 | )% | | | (0.27 | )% | | | (1.53 | )% |
Portfolio turnover rate | | | 144.26 | % | | | 129.64 | % | | | 127.20 | % | | | 101.86 | % | | | 89.57 | % |
| |
| | |
| (1) | | The average shares outstanding method has been applied for per share information. |
| |
| (2) | | Total investment return is based on the change in net asset value of a share during the period and assumes reinvestments of dividends and distributions at net asset value and does not reflect the impact of sales charge. |
The accompanying notes are an integral part of the financial statements.
2007 ANNUAL REPORT | 73
Financial Highlights
Quaker Core Value Fund
(For a Share Outstanding Throughout the Period)
| | | | | | | | | | | | | | | | | | | | | |
| | | Class A |
| | | Year | | Year | | Year | | Year | | Year |
| | | Ended | | Ended | | Ended | | Ended | | Ended |
| | | June 30, | | June 30, | | June 30, | | June 30, | | June 30, |
| | | 2007 | | 2006 | | 2005 | | 2004 | | 2003 |
| |
Net asset value, beginning of period | | $ | 13.09 | | | $ | 11.86 | | | $ | 11.54 | | | $ | 9.28 | | | $ | 9.29 | |
| |
Income From Investment Operations | | | | | | | | | | | | | | | | | | | | |
Net investment income (loss)(1) | | | 0.06 | | | | 0.10 | | | | 0.06 | | | | (0.06 | ) | | | (0.09 | ) |
| Net realized and unrealized gain on investments | | | 1.91 | | | | 2.34 | | | | 1.26 | | | | 2.32 | | | | 0.08 | |
| |
Total from investment operations | | | 1.97 | | | | 2.44 | | | | 1.32 | | | | 2.26 | | | | (0.01 | ) |
| |
Distributions to shareholders from: | | | | | | | | | | | | | | | | | | | | |
| Net investment income | | | (0.09 | ) | | | — | | | | — | | | | — | | | | — | |
| Net realized capital gain | | | (1.42 | ) | | | (1.12 | ) | | | (1.00 | ) | | | — | | | | — | |
| |
Total distributions | | | (1.51 | ) | | | (1.21 | ) | | | (1.00 | ) | | | — | | | | — | |
| |
Net asset value, end of period | | $ | 13.55 | | | $ | 13.09 | | | $ | 11.86 | | | $ | 11.54 | | | $ | 9.28 | |
| |
Total Return(2) | | | 16.21 | % | | | 21.42 | % | | | 11.60 | % | | | 24.35 | % | | | (0.11 | )% |
| | | | | | | | | | | | | | | | | | | | | |
Ratios/supplemental data | | | | | | | | | | | | | | | | | | | | |
Net assets, end of period (000’s omitted) | | $ | 3,375 | | | $ | 2,719 | | | $ | 1,943 | | | $ | 1,449 | | | $ | 1,045 | |
Ratio of expenses to average net assets: | | | | | | | | | | | | | | | | | | | | |
| Before expense reimbursements and waived fees | | | 2.01 | % | | | 1.89 | % | | | 2.09 | % | | | 2.14 | % | | | 2.12 | % |
| After expense reimbursements and waived fees | | | 0.97 | % | | | 0.84 | % | | | 1.04 | % | | | 1.94 | % | | | 2.12 | % |
Ratio of net investment income (loss) to average net assets: | | | | | | | | | | | | | | | | | | | | |
| Before expense reimbursements and waived fees | | | (0.56 | )% | | | (0.31 | )% | | | (0.56 | )% | | | (0.78 | )% | | | (1.01 | )% |
| After expense reimbursements and waived fees | | | 0.48 | % | | | 0.74 | % | | | 0.49 | % | | | (0.58 | )% | | | (1.01 | )% |
Portfolio turnover rate | | | 265.26 | % | | | 184.01 | % | | | 103.24 | % | | | 156.88 | % | | | 151.69 | % |
| |
| | |
| (1) | | The average shares outstanding method has been applied for per share information. |
| |
| (2) | | Total investment return is based on the change in net asset value of a share during the period and assumes reinvestments of dividends and distributions at net asset value and does not reflect the impact of sales charge. |
74 | 2007 ANNUAL REPORT
Notes to the Financial Statements
Note 1 — Organization
The Quaker Investment Trust (the “Trust”), a diversified, open-end management investment company, was organized as a Massachusetts business trust on October 24, 1990, and is registered under the Investment Company Act of 1940, as amended (the “1940 Act”), as an open-end management investment company. The Trust’s Amended and Restated Agreement and Declaration of Trust permits the Trustees to issue an unlimited number of shares of beneficial interest. The Trust currently has eight series: Quaker Core Equity Fund, Quaker Strategic Growth Fund, Quaker Mid-Cap Value Fund, Quaker Small-Cap Value Fund, Quaker Small-Cap Growth Fund, Quaker Biotech Pharma-Healthcare Fund, Quaker Capital Opportunities Fund, and Quaker Core Value Fund (formerly Geewax Terker Core Value Fund) (each a “Fund” and collectively, the “Funds”). The investment objectives of each Fund are set forth below.
Quaker Core Equity Fund (“Core Equity”), Quaker Strategic Growth Fund (“Strategic Growth”), and Quaker Small-Cap Value Fund (“Small-Cap Value”) all commenced operations on November 25, 1996. Quaker Mid-Cap Value Fund (“Mid-Cap Value”) commenced operations on December 31, 1997. Quaker Small-Cap Growth Fund (“Small-Cap Growth”) commenced operations on September 18, 2000. The investment objective of these Funds is to provide shareholders with long-term capital growth.
Quaker Capital Opportunities Fund (“Capital Opportunities”) commenced operations on January 31, 2002. The investment objective of this Fund is to seek long-term capital growth.
Quaker Core Value Fund (“Core Value”) commenced operations on March 26, 2002. The Fund seeks to achieve long-term capital appreciation through the prudent investment of securities issued by companies considered by the sub-adviser to be “value” oriented companies.
Quaker Biotech Pharma-Healthcare Fund (“Biotech”) commenced operations on September 23, 2002. The investment objective of this Fund is to seek long-term capital appreciation.
Core Equity, Strategic Growth, Small-Cap Value, Mid-Cap Value, and Small-Cap Growth offer four classes of shares (Class A, Class B, Class C and Institutional Class shares). Class A shares are charged a front-end sales charge and a distribution and servicing fee; Class B shares bear a contingent deferred sales charge (“CDSC”) that declines to zero once the economic equivalent of a 5.00% sales charge is recovered by the Fund(s) for each investment account, normally after an average of seven years, coupled with additional distribution and servicing fees; Class C shares bear an additional distribution and servicing fee and a CDSC of 1% for a period of thirteen months; and Institutional Class shares bear no front-end sales charge or CDSC, but have higher minimum investment limitations.
Capital Opportunities and Biotech offer Class A, Class B and Class C shares. Core Value offers Class A shares.
Note 2 — Summary of Significant Accounting Policies and Other Information
The following is a summary of significant accounting policies consistently followed by the Funds in the preparation of their financial statements. The policies are in conformity with accounting principles generally accepted in the United States of America.
A. Security Valuation. The Funds’ investments in securities are carried at market value. Securities listed on an exchange or quoted on a national market system are generally valued at the last quoted sales price at the time of valuation. Other securities traded in the over-the-counter market and listed securities for which no sale was reported on that date are valued at the most recent bid price. Each security reported on the NASDAQ National Market System is valued at the NASDAQ Official Closing Price.
The Funds have adopted fair valuation procedures to value securities at fair market value in certain circumstances and have established a Valuation Committee responsible for determining when fair valuing a security is necessary and appropriate. The Funds will value securities at fair market value when market quotations are not readily available or when securities cannot be accurately valued within established pricing procedures. The Valuation Committee may also fair value foreign securities whose prices may have been affected by events occurring after the close of trading in their respective markets but prior to the time the Fund holding the foreign securities calculates its net asset value. The Funds’ fair valuation procedures are designed to help ensure that prices at which Fund shares are purchased and redeemed are fair and do not result in dilution of shareholder interest or other harm to shareholders.
Short-term investments are valued at amortized cost, which approximates fair market value.
B. Federal Income Taxes. It is the Funds’ policy to comply with the requirements of Subchapter M of the Internal Revenue Code and to distribute substantially all of their
2007 ANNUAL REPORT | 75
Notes to the Financial Statements
Note 2 — Summary of Significant Accounting Policies and Other Information (Continued)
taxable income to shareholders. Therefore, no federal income tax provision is required.
Net investment income or loss and net realized gains or losses may differ for financial statement and income tax purposes primarily due to investments which have a different basis for financial statement and income tax purposes. The character of distributions made during the year from net investment income or net realized gains may differ from their ultimate characterization for federal income tax purposes. Also, due to the timing of dividend distributions, the fiscal year in which amounts are distributed may differ from the year that the income or realized gains were recorded by each Fund. Temporary differences that result in over-distribution for financial statement purposes are classified as distributions in excess of net investment income or accumulated net realized gains. Permanent differences in the recognition of earnings are reclassified to additional paid-in capital. Distributions in excess of tax-basis earnings are recorded as a return of capital.
C. Security Transactions and Investment Income. Security transactions are recorded on the trade date. Realized gains and losses are determined using the specific identification cost method. Interest income on debt securities is recorded daily on the accrual basis. Discounts and premiums on debt securities are amortized over their respective lives. Dividend income is recorded on the ex-dividend date, or as soon as information is available to the Fund.
Strategic Growth and Biotech make short sales of investments, which are transactions in which the Fund sells a security it does not own in anticipation of a decline in the fair value of that security. To complete such a transaction, the Fund must borrow the security to make delivery to the buyer. The Fund is then obligated to replace the security borrowed by purchasing it at the market price at the time of replacement. The broker retains the proceeds of short sales to the extent necessary to meet margin requirements until the short position is closed out.
D. Option Writing. Strategic Growth, Capital Opportunities, and Biotech may write options. When the Fund writes an option, an amount equal to the premium received by the Fund is recorded as a liability and is subsequently adjusted to the current fair value of the option written. Premiums received from writing options that expire unexercised are treated by the Fund on the expiration date as realized gains from investments. The difference between the premium and the amount paid on effecting a closing purchase transaction, including brokerage commissions, is also treated as a realized gain, or, if the premium is less than the amount paid for the closing purchase transaction, as a realized loss. If a call option is exercised, the premium is added to the proceeds from the sale of the underlying security or currency in determining whether the Fund has realized a gain or loss. If a put option is exercised, the premium reduces the cost basis of the securities purchased by the Fund. The Fund as writer of an option bears the market risk of an unfavorable change in the price of the security underlying the written option.
E. Foreign Currency Transactions. Securities and other assets and liabilities denominated in foreign currencies are converted each business day into U.S. dollars based on the prevailing rates of exchange. Purchases and sales of portfolio securities and income and expenses are converted into U.S. dollars on the respective dates of such transactions.
Gains and losses resulting from changes in exchange rates applicable to foreign securities are not reported separately from gains and losses arising from movements in securities prices.
Net realized foreign exchange gains and losses include gains and losses from sales and maturities of foreign currency exchange contracts, gains and losses realized between the trade and settlement dates of foreign securities transactions, and the difference between the amount of dividends, interest and foreign withholding taxes on the Fund’s books and the U.S. dollar equivalent of the amounts actually received. Net unrealized foreign exchange gains and losses include gains and losses from changes in the fair value of assets and liabilities denominated in foreign currencies other than portfolio securities, resulting from changes in exchange rates.
F. Multiple Class Allocations. Each class of shares has equal rights as to earnings and assets except that each class bears different distribution and shareholder servicing expenses. Each class of shares has exclusive voting rights with respect to matters that affect just that class. Income, expenses (other than expenses attributable to a specific class), and realized and unrealized gains or losses on investments are allocated to each class of shares based on its relative net assets.
G. Expense Allocations. Fund expenses that are not series (fund) specific are allocated to each series based upon its relative proportion of net assets to the Funds’ total net assets.
H. Distributions to Shareholders. Each Fund generally declares dividends annually, payable in December, on a
76 | 2007 ANNUAL REPORT
Note 2 — Summary of Significant Accounting Policies and Other Information (Continued)
date selected by the Trust’s Board of Trustees. In addition, distributions may be made annually in December out of net realized gains through October 31 of that calendar year. Distributions to shareholders are recorded on the ex-dividend date. Each Fund may make a supplemental distribution subsequent to the end of its fiscal year ending June 30.
I. Use of Estimates. The preparation of financial statements in conformity with accounting principles generally accepted in the United States of America requires management to make estimates and assumptions that affect the reported amounts of assets and liabilities and the disclosure of contingent assets and liabilities at the date of the financial statements, and the reported amounts of revenue and expenses during the reporting period. Actual results could differ from those estimates.
J. Indemnifications. Under the Funds’ organizational documents, its officers and Trustees are indemnified against certain liabilities arising out of the performance of their duties to the Funds. In addition, in the normal course of business, the Funds enter into contracts with their vendors and others that provide for general indemnifications. The Funds’ maximum exposure under these arrangements is unknown as this would involve future claims that may be made against the Funds. However, based on experience, the Funds expect this risk of loss to be remote.
Note 3 — Investment Advisory Fee and Other Related Party Transactions
Quaker Funds, Inc. (“QFI”) serves as Investment Advisor to each Fund. Pursuant to separate investment subadvisory agreements, QFI has selected the following persons to serve as sub-advisers:
| | | |
| Fund | | Sub-Adviser |
| |
| Strategic Growth | | DG Capital Management, Inc. |
| Core Equity | | Geewax, Terker & Co. |
| Small-Cap Growth | | Geewax, Terker & Co. |
| Capital Opportunities | | Knott Capital Management |
| Biotech | | Sectoral Asset Management, Inc. |
| Mid-Cap Value | | Global Capital Management, Inc. |
| Small-Cap Value | | Aronson+Johnson+Ortiz, LP |
| Core Value | | Geewax, Terker & Co. |
The sub-advisers provide each Fund with a continuous program of supervision of the Fund’s assets, including the composition of its portfolio, and furnish advice and recommendations with respect to investments, investment policies and the purchase and sale of securities.
Each Fund paid QFI aggregate fees shown in the table below for the fiscal year ended June 30, 2007. Amounts are expressed as an annualized percentage of average net assets.
| | | | | | | | | | | | | |
| | | Aggregate | | | | |
| | | advisory | | subadvisory | | Advisory & |
| | | fee | | fee paid by QFI | | subadvisory fee |
| Fund | | paid to QFI | | to the sub-adviser | | waived & reimbursed |
| |
| Strategic Growth | | | 1.30 | % | | | 0.75 | % | | | N/A | |
| Core Equity | | | 1.05 | % | | | 0.75 | % | | | N/A | |
| Small-Cap Growth | | | 1.05 | % | | | 0.75 | % | | | N/A | |
| Capital Opportunities | | | 1.05 | % | | | 0.75 | % | | | N/A | |
| Biotech | | | 1.45 | % | | | 0.95 | % | | | N/A | |
| Mid-Cap Value | | | 1.05 | % | | | 0.75 | % | | | N/A | |
| Small-Cap Value | | | 1.20 | % | | | 0.90 | % | | | 0.08 | % |
| Core Value | | | 1.05 | % | | | 0.75 | % | | | 1.05 | % |
For the fiscal year ended June 30, 2007, QFI and the sub-advisers earned and reimbursed fees as follows:
| | | | | | | | | | | | | |
| | | | | | | Subadvisory | | |
| | | Aggregate | | fee paid by QFI | | Advisory & |
| | | advisory fee | | to the sub- | | subadvisory fees |
| Fund | | paid to QFI | | adviser | | waived & reimbursed |
| |
| Strategic Growth | | $ | 11,511,920 | | | $ | 6,641,495 | | | $ | — | |
| Core Equity | | | 130,307 | | | | 93,077 | | | | — | |
| Small-Cap Growth | | | 39,949 | | | | 28,533 | | | | — | |
| Capital Opportunities | | | 212,222 | | | | 151,597 | | | | — | |
| Biotech | | | 173,464 | | | | 113,650 | | | | — | |
| Mid-Cap Value | | | 1,302,046 | | | | 930,037 | | | | — | |
| Small-Cap Value | | | 990,479 | | | | 672,808 | | | | 70,055 | |
| Core Value | | | 32,495 | | | | — | | | | 32,495 | |
The sub-adviser to Small-Cap Value has voluntarily waived a portion of its subadvisory fee, resulting in a subadvisory fee rate of 0.85% on the first $25 million of assets of the Fund and 0.90% on all amounts in excess of $25 million, in accordance with the sub-adviser’s “most favored nation” policy that provides for a subadvisory fee based upon a rate no greater than the lowest rate offered by the sub-adviser to another client with a similar investment objective. This voluntary waiver results in a corresponding reduction in the fees paid by Fund shareholders. However, in the event that the investment advisory services provided to that client is terminated, the subadvisory fee rates would revert to the contractual fee rate of 0.90% per annum.
2007 ANNUAL REPORT | 77
Notes to the Financial Statements
Note 3 — Investment Advisory Fee and Other Related Party Transactions (Continued)
QFI voluntarily agreed to waive its management fee to the extent that the total operating expenses of Small-Cap Value (exclusive of interest, taxes, brokerage commissions and other costs incurred in connection with the purchase or sale of portfolio securities, and extraordinary items) exceed the annual rate of 2.60% for Class A, 3.35% for Classes B and C, and 2.35% for Class I of the average net assets of each class, respectively. QFI currently has no intention to terminate this arrangement, however, it may do so at any time in its sole discretion.
QFI and the sub-adviser to Core Value have each voluntarily agreed to waive their respective advisory and sub-advisory fees, in their entirety. These waivers result in a reduction in fees paid by Core Value shareholders. Neither QFI nor the sub-adviser to Core Value intend to terminate their respective waivers. However, either may do so at any time at their sole discretion.
Since November 20, 2006, US Bancorp Fund Services, LLC (“USB”), has served as the Funds’ transfer, dividend paying, and shareholder servicing agent (“Transfer Agent”). Prior to that date, Citco Mutual Fund Services, Inc. (“CMFS”) was the Funds’ transfer, dividend paying and shareholder service agent. The Transfer Agent maintains the records of each shareholder’s account, answers shareholder inquiries concerning accounts, processes purchases and redemption of Fund shares, acts as dividend and distribution disbursing agent and performs other shareholder functions. As compensation for its services, the Transfer Agent receives a fee at the annual rate of 0.0525% of the aggregate of the Trust’s average daily net assets.
Since December 11, 2006, Brown Brothers Harriman & Co. has served as fund accountant and administrator (the “Administrator”) for the Trust pursuant to a written agreement with the Trust. The Administrator provides fund accounting services and administrative services to, and is generally responsible for the overall management and day-to-day operations of, each Fund. As compensation for its services, the Administrator receives a fee at the annual rate of 0.025% for accounting and 0.030% for administration of the aggregate of the Trust’s first $2 billion of average daily net assets and 0.0200% for accounting and 0.0250% for administration on average daily net assets in excess of $2 billion.
Prior to December 11, 2006, CMFS was also the Funds’ administrator. For the six-month period ended December 31, 2006, CMFS was paid $910,394 in the aggregate for administration, fund accounting and transfer agency services. For the period November 20, 2006 through June 30, 2007, USB was paid $357,019 as Transfer Agent for the Funds. For the period November 17, 2006 through June 30, 2007, the Administrator was paid $376,639 for fund accounting and administration services.
Since November 17, 2006, Quasar Distributors, LLC (the “Distributor”) has served as principal underwriter for the Trust. Prior to that date, Citco Mutual Fund Distributors, Inc. (“CMFD”) served as principal underwriter for the Trust. The Trust has adopted distribution and shareholder servicing plans pursuant to Rule 12b-1 of the 1940 Act for each class for each Fund with the exception of Class I. The Class A Plan provides that each Fund may pay a servicing or Rule 12b-1 fee at an annual rate of 0.25% of the Class A average net assets on a monthly basis to persons or institutions for performing certain servicing functions for the Class A shareholders. The Plan also allows the Fund to pay or reimburse expenditures in connection with sales and promotional services related to distribution of the Fund’s shares, including personal services provided to prospective and existing shareholders. The Class B and C Plans provide that each Fund may compensate QFI and others for services provided and expenses incurred in the distribution of shares at an annual rate of 1.00% of the average net assets of each class on a monthly basis.
For the period from July 1, 2006 through November 16, 2006, CMFD received $55,791 in underwriter concessions from the sale of Fund shares. For the period November 17, 2006 through June 30, 2007, the Distributor received $44,121 in underwriter concessions from the sale of Fund shares.
QFI has informed the Trust that for the fiscal year ended June 30, 2007 it received contingent deferred sales charges from certain redemptions of the Funds’ Class B shares and Class C shares of $47,921 and $49,871, respectively. The respective shareholders pay such charges, which are not an expense of the Fund.
78 | 2007 ANNUAL REPORT
Note 3 — Investment Advisory Fee and Other Related Party Transactions (Continued)
Except for the Trust’s Chief Compliance Officer (“CCO”), employees and officers of QFI do not receive any compensation from the Trust. The General Counsel/CCO of QFI also serves as CCO for the Trust. According to the terms of a Board resolution on November 16, 2006, the Trust agreed to pay the CCO an annual salary of $150,000 and authorized a 2006 bonus of $15,000. For the year ended June 30, 2007, the Trust compensated the CCO $164,460.
Commissions paid and recaptured were as follows:
| | | | | | | | | |
| | | Commissions | | Commissions |
| Fund | | Paid | | Recaptured |
| |
| Strategic Growth | | $ | 1,143,339 | | | $ | 571,670 | |
| Capital Opportunities | | | — | | | | 283 | |
| Mid-Cap Value | | | 166,965 | | | | 83,482 | |
Under the terms of certain commission recapture agreements with Radnor Research & Trading, the commissions recaptured by the Funds were reflected as realized gain (loss) from investments for the fiscal year ended June 30, 2007.
Note 4 — Purchases and Sales of Investments
For the fiscal year ended June 30, 2007, aggregate purchases and sales of investment securities (excluding short-term investments) for each Fund were as follows:
| | | | | | | | | |
| Fund | | Purchases | | Sales |
| |
| Strategic Growth | | $ | 2,184,380,909 | | | $ | 2,272,900,724 | |
| Core Equity | | | 30,199,431 | | | | 30,625,174 | |
| Small-Cap Growth | | | 14,046,573 | | | | 14,320,622 | |
| Capital Opportunities | | | 15,500,990 | | | | 23,184,968 | |
| Biotech | | | 10,050,219 | | | | 18,611,825 | |
| Mid-Cap Value | | | 140,117,056 | | | | 91,143,036 | |
| Small-Cap Value | | | 118,462,097 | | | | 117,699,733 | |
| Core Value | | | 8,296,734 | | | | 8,087,672 | |
Note 5 — Options Written
A summary of option contracts written by the Trust during the fiscal year ended June 30, 2007 were as follows:
| | | | | | | | | |
| | | Strategic Growth Calls |
| | | Number of | | Option |
| | | Contracts | | Premiums |
| |
| Options outstanding at beginning of period | | | — | | | $ | — | |
| Options written | | | 35,349 | | | | 3,238,171 | |
| Options closed | | | (29,235 | ) | | | (2,660,329 | ) |
| Options exercised | | | (1,354 | ) | | | (239,651 | ) |
| Options expired | | | (4,760 | ) | | | (338,191 | ) |
| |
| Options outstanding at end of period | | | — | | | $ | — | |
| |
One option contract is equivalent to one hundred shares of common stock.
Note 6 — Investments in Affiliate
The Quaker Strategic Growth Fund invests a portion of its assets in American Ecology Corporation (the “Corporation”). The Corporation is considered to be an affiliate of the Fund under the 1940 Act because the Fund owned more than 5% of the
2007 ANNUAL REPORT | 79
Notes to the Financial Statements
Note 6 — Investments in Affiliate (Continued)
Corporation’s outstanding voting stock during the year. A description of the Quaker Strategic Growth Fund’s holding in the Corporation and related transactions during the fiscal year ended June 30, 2007 appear below.
| | | | | | | | | | | | | | | | | | | | | | | | | |
| | | Beginning | | | | | | | | | | Ending | | Dividend | | Market |
| | | Shares | | Purchases | | Sales | | Shares | | Income | | Value |
| |
| American Ecology Corporation | | | 1,000,395 | | | | — | | | | 598,004 | | | | 402,391 | | | $ | 501,428 | | | $ | 8,619,215 | (a) |
| | |
| (a) | | At June 30, 2007, the company is no longer defined as an affiliate, although it was an affiliated company during the period. |
Note 7 — Tax Matters
For U.S. federal income tax purposes, the cost of securities owned (including proceeds for securities sold short), gross appreciation, gross depreciation, and net unrealized appreciation (depreciation) of investments at June 30, 2007 for each Fund were as follows:
| | | | | | | | | | | | | | | | | |
| | | | | | | | | | | | | | | Net |
| | | | | | | Gross | | Gross | | Appreciation |
| Fund | | Cost | | Appreciation | | Depreciation | | (Depreciation) |
| |
| Strategic Growth | | $ | 662,809,972 | | | $ | 94,126,870 | | | $ | (4,120,662 | ) | | $ | 90,006,208 | |
| Core Equity | | | 12,215,892 | | | | 1,169,208 | | | | (208,102 | ) | | | 961,106 | |
| Small-Cap Growth | | | 3,800,004 | | | | 331,486 | | | | (125,768 | ) | | | 205,718 | |
| Capital Opportunities | | | 15,648,093 | | | | 1,576,677 | | | | (153,759 | ) | | | 1,422,918 | |
| Biotech | | | 9,103,229 | | | | 625,182 | | | | (749,672 | ) | | | (124,490 | ) |
| Mid-Cap Value | | | 144,015,089 | | | | 18,124,577 | | | | (1,885,264 | ) | | | 16,239,313 | |
| Small-Cap Value | | | 81,126,209 | | | | 12,137,196 | | | | (2,059,850 | ) | | | 10,077,346 | |
| Core Value | | | 3,181,481 | | | | 269,632 | | | | (50,212 | ) | | | 219,420 | |
The difference between book basis and tax basis unrealized appreciation (depreciation) is attributable primarily to the tax deferral of losses on wash sales and straddles from options.
As of June 30, 2007, the components of distributable earnings on a tax basis were as follows:
| | | | | | | | | | | | | | | | | | | | | | | | | |
| | | Unrealized | | | | | | | | | | | | | | | | | | Total |
| | | Appreciation | | Undistributed | | Undistributed | | Capital Loss | | Post-October | | Distributable |
| Fund | | (Depreciation) | | Ordinary Income | | Capital Gains | | Carryforward | | Capital Loss | | Earnings |
| |
| Strategic Growth | | $ | 90,006,208 | | | $ | 34,992,210 | | | $ | 41,749,350 | | | $ | — | | | $ | — | | | $ | 166,747,768 | |
| Core Equity | | | 961,106 | | | | — | | | | — | | | | (3,515,354 | ) | | | — | | | | (2,554,248 | ) |
| Small-Cap Growth | | | 205,718 | | | | 271,875 | | | | 153,863 | | | | — | | | | — | | | | 631,456 | |
| Capital Opportunities | | | 1,422,918 | | | | 21,032 | | | | 1,665,254 | | | | — | | | | — | | | | 3,109,204 | |
| Biotech | | | (124,490 | ) | | | 149,165 | | | | — | | | | — | | | | (219,159 | ) | | | (194,484 | ) |
| Mid-Cap Value | | | 16,239,313 | | | | 2,157,561 | | | | 3,718,005 | | | | — | | | | — | | | | 22,114,879 | |
| Small-Cap Value | | | 10,077,346 | | | | 6,254,285 | | | | 3,862,847 | | | | — | | | | — | | | | 20,194,478 | |
| Core Value | | | 219,420 | | | | 231,595 | | | | 143,689 | | | | — | | | | — | | | | 594,704 | |
The undistributed ordinary income, capital gains and carryforward losses shown above differ from the corresponding accumulated net investment income and accumulated net realized gain (loss) figures reported in the statements of assets and liabilities due to differing book/tax treatment of short-term capital gains, and certain temporary book/tax differences such as the deferral of realized losses on wash sales, straddles from options and net losses realized after October 31st.
80 | 2007 ANNUAL REPORT
Note 7 — Tax Matters (Continued)
Under current tax law, foreign currency and net capital losses realized after October 31 may be deferred and treated as occurring on the first day of the following fiscal year. The Funds elected to defer net capital and currency losses as indicated in the chart below.
At June 30, 2007, the capital loss carryovers for the Funds were as follows:
| | | | | | | | | | | | | | | | | | | | | |
| | | Capital Loss Carryovers Expiring | | Post-October Losses |
| Fund | | 2010 | | 2011 | | Total | | Deferred | | Utilized |
| |
| Core Equity | | $ | 1,156,854 | | | $ | 2,358,500 | | | $ | 3,515,354 | | | $ | — | | | $ | — | |
| Biotech | | | — | | | | — | | | | — | | | | 219,159 | | | | 7,487 | |
Note 8 — Reclassification of Capital Accounts
In accordance with the accounting pronouncements, each Fund has recorded reclassifications in the capital accounts. These reclassifications have no impact on the net asset value of the Funds and are designed generally to present undistributed income and realized gains on a tax basis which is considered to be more informative to shareholders. As of June 30, 2007, the Funds recorded the following reclassification to increase (decrease) the accounts listed below:
| | | | | | | | | | | | | |
| | | | | | | | | | | Capital Paid |
| | | Accumulated | | Accumulated | | in on Shares |
| | | Net Investment | | Net Realized | | of Beneficial |
| Fund | | Income | | Gain (Loss) | | Interest |
| |
| Strategic Growth | | $ | 747,735 | | | $ | (747,735 | ) | | $ | — | |
| Core Equity | | | 62,367 | | | | — | | | | (62,367 | ) |
| Small-Cap Growth | | | 33,430 | | | | (33,430 | ) | | | — | |
| Capital Opportunities | | | 35,949 | | | | (35,949 | ) | | | — | |
| Biotech | | | 151,077 | | | | (151,077 | ) | | | — | |
| Mid-Cap Value | | | 820,415 | | | | (820,439 | ) | | | 24 | |
| Small-Cap Value | | | 244,701 | | | | (244,719 | ) | | | 18 | |
| Core Value | | | 1 | | | | (1 | ) | | | — | |
Note 9 — Distributions to Shareholders
Income and long-term capital gain distributions are determined in accordance with Federal income tax regulations, which may differ from accounting principles generally accepted in the United States. The information set forth below is for each Fund’s fiscal year as required by federal securities laws.
The tax character of dividends and distributions paid during the fiscal years of 2007 and 2006 were as follows:
| | | | | | | | | | | | | | | | | |
| | | Ordinary Income | | Long-Term Capital Gain |
| Fund | | 2007 | | 2006 | | 2007 | | 2006 |
| |
| Strategic Growth | | $ | 59,149,717 | | | $ | 29,137,312 | | | $ | 36,184,881 | | | $ | 16,065,857 | |
| Small-Cap Growth | | | — | | | | — | | | | 159,311 | | | | — | |
| Capital Opportunities | | | — | | | | 615,911 | | | | 1,407,478 | | | | 1,818,985 | |
| Biotech | | | 764,958 | | | | — | | | | 380,106 | | | | 101,855 | |
| Mid-Cap Value | | | 2,054,394 | | | | 3,028,061 | | | | 412,922 | | | | 3,482,107 | |
| Small-Cap Value | | | 2,553,445 | | | | 2,713,671 | | | | 6,116,104 | | | | 6,804,209 | |
| Core Value | | | 162,989 | | | | 182,650 | | | | 174,577 | | | | 14,430 | |
2007 ANNUAL REPORT | 81
Notes to the Financial Statements
Note 10 — Fund Share Transactions
At June 30, 2007, there were an unlimited number of shares of beneficial interest with a $0.01 par value, authorized. The following table summarizes the activity in shares of each Fund:
Strategic Growth
| | | | | | | | | | | | | | | | | | | | | | | | | | | | | | | | | |
| | | For the Fiscal Year Ended: June 30, 2007 | | For the Fiscal Year Ended: June 30, 2006 |
| | | Sold | | Redeemed | | Reinvested | | Ending Shares | | Sold | | Redeemed | | Reinvested | | Ending Shares |
| |
| Class A | | | | | | | | | | | | | | | | |
| Shares | | | 7,740,884 | | | | (23,925,644 | ) | | | 3,316,454 | | | | 24,506,338 | | | | 17,397,995 | | | | (5,169,681 | ) | | | 1,519,836 | | | | 37,374,644 | |
| Value | | $ | 185,603,133 | | | $ | (559,277,930 | ) | | $ | 74,354,882 | | | | | | | $ | 421,625,118 | | | $ | (125,020,495 | ) | | $ | 35,746,532 | | | | | |
Class B | | | | | | | | | | | | | | | | | | | | | | | | | | | | | | | | |
| Shares | | | 1,663 | | | | (167,376 | ) | | | 64,787 | | | | 589,880 | | | | 11,727 | | | | (99,050 | ) | | | 37,848 | | | | 690,806 | |
| Value | | $ | 37,917 | | | $ | (3,768,235 | ) | | $ | 1,389,038 | | | | | | | $ | 276,041 | | | $ | (2,292,236 | ) | | $ | 858,012 | | | | | |
Class C | | | | | | | | | | | | | | | | | | | | | | | | | | | | | | | | |
| Shares | | | 950,281 | | | | (1,215,687 | ) | | | 451,878 | | | | 4,443,765 | | | | 1,947,132 | | | | (980,064 | ) | | | 201,354 | | | | 4,257,293 | |
| Value | | $ | 21,588,309 | | | $ | (31,017,793 | ) | | $ | 9,651,300 | | | | | | | $ | 45,138,990 | | | $ | (23,012,370 | ) | | $ | 4,548,584 | | | | | |
Class I | | | | | | | | | | | | | | | | | | | | | | | | | | | | | | | | |
| Shares | | | 47,336 | | | | (1,311,602 | ) | | | 156,343 | | | | 578,946 | | | | 378,084 | | | | (188,397 | ) | | | 65,101 | | | | 1,686,869 | |
| Value | | $ | 1,148,237 | | | $ | (27,227,935 | ) | | $ | 3,556,803 | | | | | | | $ | 9,484,661 | | | $ | (4,631,529 | ) | | $ | 1,551,367 | | | | | |
Core Equity
| | | | | | | | | | | | | | | | | | | | | | | | | | | | | | | | | |
| | | For the Fiscal Year Ended: June 30, 2007 | | For the Fiscal Year Ended: June 30, 2006 |
| | | Sold | | Redeemed | | Reinvested | | Ending Shares | | Sold | | Redeemed | | Reinvested | | Ending Shares |
| |
| Class A | | | | | | | | | | | | | | | | |
| Shares | | | 16,377 | | | | (31,504 | ) | | | — | | | | 687,840 | | | | 16,311 | | | | (34,844 | ) | | | — | | | | 702,967 | |
| Value | | $ | 213,512 | | | $ | (411,306 | ) | | | — | | | | | | | $ | 201,765 | | | $ | (429,078 | ) | | | — | | | | | |
Class B | | | | | | | | | | | | | | | | | | | | | | | | | | | | | | | | |
| Shares | | | — | | | | (2,507 | ) | | | — | | | | 9,900 | | | | — | | | | (2,598 | ) | | | — | | | | 12,407 | |
| Value | | $ | — | | | $ | (30,930 | ) | | | — | | | | | | | $ | — | | | $ | (29,276 | ) | | | — | | | | | |
Class C | | | | | | | | | | | | | | | | | | | | | | | | | | | | | | | | |
| Shares | | | 122 | | | | (2,650 | ) | | | — | | | | 5,015 | | | | 1,110 | | | | (6,576 | ) | | | — | | | | 7,543 | |
| Value | | $ | 1,495 | | | $ | (33,514 | ) | | | — | | | | | | | $ | 13,135 | | | $ | (75,320 | ) | | | — | | | | | |
Class I | | | | | | | | | | | | | | | | | | | | | | | | | | | | | | | | |
| Shares | | | 5,010 | | | | (27,702 | ) | | | — | | | | 234,122 | | | | 3,548 | | | | (6,267 | ) | | | — | | | | 256,814 | |
| Value | | $ | 63,182 | | | $ | (346,955 | ) | | | — | | | | | | | $ | 42,798 | | | $ | (70,675 | ) | | | — | | | | | |
82 | 2007 ANNUAL REPORT
Note 10 — Fund Share Transactions (Continued)
Small-Cap Growth
| | | | | | | | | | | | | | | | | | | | | | | | | | | | | | | | | |
| | | For the Fiscal Year Ended: June 30, 2007 | | For the Fiscal Year Ended: June 30, 2006 |
| | | Sold | | Redeemed | | Reinvested | | Ending Shares | | Sold | | Redeemed | | Reinvested | | Ending Shares |
| |
Class A | | | | | | | | | | | | | | | | | | | | | | | | | | | | | | | | |
| Shares | | | 20,231 | | | | (35,445 | ) | | | 2,943 | | | | 57,858 | | | | 33,526 | | | | (14,387 | ) | | | — | | | | 70,129 | |
| Value | | $ | 216,781 | | | $ | (375,219 | ) | | $ | 30,702 | | | | | | | $ | 358,142 | | | $ | (155,800 | ) | | | — | | | | | |
Class B | | | | | | | | | | | | | | | | | | | | | | | | | | | | | | | | |
| Shares | | | — | | | | (779 | ) | | | 594 | | | | 13,694 | | | | — | | | | (1 | ) | | | — | | | | 13,879 | |
| Value | | $ | — | | | $ | (7,930 | ) | | $ | 5,912 | | | | | | | $ | — | | | $ | (12 | ) | | | — | | | | | |
Class C | | | | | | | | | | | | | | | | | | | | | | | | | | | | | | | | |
| Shares | | | 1,861 | | | | (12,637 | ) | | | 759 | | | | 13,096 | | | | 4,411 | | | | (6,122 | ) | | | — | | | | 23,113 | |
| Value | | $ | 18,903 | | | $ | (126,214 | ) | | $ | 7,603 | | | | | | | $ | 47,221 | | | $ | (64,647 | ) | | | — | | | | | |
Class I | | | | | | | | | | | | | | | | | | | | | | | | | | | | | | | | |
| Shares | | | 1,726 | | | | (6,957 | ) | | | 10,511 | | | | 256,619 | | | | 2,639 | | | | — | | | | — | | | | 251,339 | |
| Value | | $ | 18,872 | | | $ | (76,015 | ) | | $ | 112,989 | | | | | | | $ | 29,604 | | | $ | — | | | | — | | | | | |
Capital Opportunities
| | | | | | | | | | | | | | | | | | | | | | | | | | | | | | | | | |
| | | For the Fiscal Year Ended: June 30, 2007 | | For the Fiscal Year Ended: June 30, 2006 |
| | | Sold | | Redeemed | | Reinvested | | Ending Shares | | Sold | | Redeemed | | Reinvested | | Ending Shares |
| |
Class A | | | | | | | | | | | | | | | | | | | | | | | | | | | | | | | | |
| Shares | | | 147,833 | | | | (622,141 | ) | | | 56,762 | | | | 709,650 | | | | 449,097 | | | | (491,118 | ) | | | 108,728 | | | | 1,127,196 | |
| Value | | $ | 1,632,462 | | | $ | (6,934,221 | ) | | $ | 607,353 | | | | | | | $ | 5,202,606 | | | $ | (5,567,352 | ) | | $ | 1,207,975 | | | | | |
Class B | | | | | | | | | | | | | | | | | | | | | | | | | | | | | | | | |
| Shares | | | 1,372 | | | | (33,568 | ) | | | 4,879 | | | | 54,617 | | | | 1,350 | | | | (34,842 | ) | | | 9,678 | | | | 81,934 | |
| Value | | $ | 14,926 | | | $ | (362,214 | ) | | $ | 50,692 | | | | | | | $ | 15,015 | | | $ | (387,329 | ) | | $ | 105,392 | | | | | |
Class C | | | | | | | | | | | | | | | | | | | | | | | | | | | | | | | | |
| Shares | | | 11,326 | | | | (363,987 | ) | | | 69,611 | | | | 773,910 | | | | 120,981 | | | | (237,159 | ) | | | 99,809 | | | | 1,056,960 | |
| Value | | $ | 123,518 | | | $ | (3,900,922 | ) | | $ | 722,563 | | | | | | | $ | 1,369,751 | | | $ | (2,659,406 | ) | | $ | 1,085,918 | | | | | |
Biotech
| | | | | | | | | | | | | | | | | | | | | | | | | | | | | | | | | |
| | | For the Fiscal Year Ended: June 30, 2007 | | For the Fiscal Year Ended: June 30, 2006 |
| | | Sold | | Redeemed | | Reinvested | | Ending Shares | | Sold | | Redeemed | | Reinvested | | Ending Shares |
| |
Class A | | | | | | | | | | | | | | | | | | | | | | | | | | | | | | | | |
| Shares | | | 151,333 | | | | (929,471 | ) | | | 46,180 | | | | 413,659 | | | | 392,779 | | | | (496,508 | ) | | | 5,472 | | | | 1,145,617 | |
| Value | | $ | 1,944,121 | | | $ | (11,434,710 | ) | | $ | 593,879 | | | | | | | $ | 5,263,687 | | | $ | (6,528,186 | ) | | $ | 69,822 | | | | | |
Class B | | | | | | | | | | | | | | | | | | | | | | | | | | | | | | | | |
| Shares | | | 117 | | | | (31,308 | ) | | | 7,987 | | | | 69,906 | | | | 6,915 | | | | (17,176 | ) | | | 543 | | | | 93,110 | |
| Value | | $ | 1,494 | | | $ | (378,698 | ) | | $ | 99,194 | | | | | | | $ | 91,265 | | | $ | (227,897 | ) | | $ | 6,760 | | | | | |
Class C | | | | | | | | | | | | | | | | | | | | | | | | | | | | | | | | |
| Shares | | | 94,408 | | | | (107,265 | ) | | | 29,236 | | | | 329,127 | | | | 75,276 | | | | (99,173 | ) | | | 1,521 | | | | 312,748 | |
| Value | | $ | 1,200,372 | | | $ | (1,335,590 | ) | | $ | 363,113 | | | | | | | $ | 991,661 | | | $ | (1,274,883 | ) | | $ | 18,949 | | | | | |
2007 ANNUAL REPORT | 83
Notes to the Financial Statements
Note 10 — Fund Share Transactions (Continued)
Mid-Cap Value
| | | | | | | | | | | | | | | | | | | | | | | | | | | | | | | | | |
| | | For the Fiscal Year Ended: June 30, 2007 | | For the Fiscal Year Ended: June 30, 2006 |
| | | | | | | | | | | | | | | Ending | | | | | | | | | | | | | | Ending |
| | | Sold | | Redeemed | | Reinvested | | Shares | | Sold | | Redeemed | | Reinvested | | Shares |
| |
Class A | | | | | | | | | | | | | | | | | | | | | | | | | | | | | | | | |
| Shares | | | 4,637,754 | | | | (1,617,163 | ) | | | 123,480 | | | | 7,604,344 | | | | 3,447,903 | | | | (1,638,914 | ) | | | 239,478 | | | | 4,460,273 | |
| Value | | $ | 77,122,371 | | | $ | (27,178,895 | ) | | $ | 2,020,133 | | | | | | | $ | 56,410,060 | | | $ | (28,014,914 | ) | | $ | 3,695,156 | | | | | |
Class B | | | | | | | | | | | | | | | | | | | | | | | | | | | | | | | | |
| Shares | | | 13,379 | | | | (25,782 | ) | | | 2,741 | | | | 134,307 | | | | 9,090 | | | | (38,537 | ) | | | 21,633 | | | | 143,969 | |
| Value | | $ | 215,481 | | | $ | (404,764 | ) | | $ | 42,711 | | | | | | | $ | 140,137 | | | $ | (619,010 | ) | | $ | 320,605 | | | | | |
Class C | | | | | | | | | | | | | | | | | | | | | | | | | | | | | | | | |
| Shares | | | 139,031 | | | | (357,091 | ) | | | 17,316 | | | | 899,189 | | | | 357,474 | | | | (217,842 | ) | | | 120,822 | | | | 1,099,933 | |
| Value | | $ | 2,152,774 | | | $ | (5,574,407 | ) | | $ | 265,454 | | | | | | | $ | 5,656,556 | | | $ | (3,426,983 | ) | | $ | 1,762,797 | | | | | |
Class I | | | | | | | | | | | | | | | | | | | | | | | | | | | | | | | | |
| Shares | | | 11,251 | | | | (1,611 | ) | | | 1,794 | | | | 103,774 | | | | 9,607 | | | | (33,296 | ) | | | 12,831 | | | | 92,340 | |
| Value | | $ | 204,493 | | | $ | (27,942 | ) | | $ | 30,098 | | | | | | | $ | 161,532 | | | $ | (569,822 | ) | | $ | 202,470 | | | | | |
Small-Cap Value
| | | | | | | | | | | | | | | | | | | | | | | | | | | | | | | | | |
| | | For the Fiscal Year Ended: June 30, 2007 | | For the Fiscal Year Ended: June 30, 2006 |
| | | | | | | | | | | | | | | Ending | | | | | | | | | | | | | | Ending |
| | | Sold | | Redeemed | | Reinvested | | Shares | | Sold | | Redeemed | | Reinvested | | Shares |
| |
Class A | | | | | | | | | | | | | | | | | | | | | | | | | | | | | | | | |
| Shares | | | 855,116 | | | | (716,805 | ) | | | 218,459 | | | | 2,239,278 | | | | 974,202 | | | | (428,852 | ) | | | 211,801 | | | | 1,882,508 | |
| Value | | $ | 16,827,579 | | | $ | (14,211,113 | ) | | $ | 4,117,957 | | | | | | | $ | 19,369,949 | | | $ | (8,450,432 | ) | | $ | 3,882,318 | | | | | |
Class B | | | | | | | | | | | | | | | | | | | | | | | | | | | | | | | | |
| Shares | | | 2,849 | | | | (12,528 | ) | | | 5,645 | | | | 52,791 | | | | 643 | | | | (5,714 | ) | | | 8,071 | | | | 56,825 | |
| Value | | $ | 51,265 | | | $ | (233,273 | ) | | $ | 99,972 | | | | | | | $ | 12,000 | | | $ | (108,491 | ) | | $ | 141,002 | | | | | |
Class C | | | | | | | | | | | | | | | | | | | | | | | | | | | | | | | | |
| Shares | | | 158,759 | | | | (61,177 | ) | | | 69,057 | | | | 715,947 | | | | 169,946 | | | | (48,277 | ) | | | 65,299 | | | | 549,308 | |
| Value | | $ | 2,889,310 | | | $ | (1,102,491 | ) | | $ | 1,184,334 | | | | | | | $ | 3,132,479 | | | $ | (889,403 | ) | | $ | 1,108,118 | | | | | |
Class I | | | | | | | | | | | | | | | | | | | | | | | | | | | | | | | | |
| Shares | | | 100,215 | | | | (264,543 | ) | | | 160,612 | | | | 1,441,446 | | | | 80,737 | | | | (232,823 | ) | | | 225,384 | | | | 1,445,162 | |
| Value | | $ | 2,105,877 | | | $ | (5,154,257 | ) | | $ | 3,094,993 | | | | | | | $ | 1,616,755 | | | $ | (4,597,362 | ) | | $ | 4,203,414 | | | | | |
Core Value
| | | | | | | | | | | | | | | | | | | | | | | | | | | | | | | | | |
| | | For the Fiscal Year Ended: June 30, 2007 | | For the Fiscal Year Ended: June 30, 2006 |
| | | | | | | | | | | | | | | Ending | | | | | | | | | | | | | | Ending |
| | | Sold | | Redeemed | | Reinvested | | Shares | | Sold | | Redeemed | | Reinvested | | Shares |
| |
Class A | | | | | | | | | | | | | | | | | | | | | | | | | | | | | | | | |
| Shares | | | 41,046 | | | | (26,815 | ) | | | 27,219 | | | | 249,087 | | | | 59,868 | | | | (32,205 | ) | | | 16,173 | | | | 207,637 | |
| Value | | $ | 530,549 | | | $ | (352,197 | ) | | $ | 335,337 | | | | | | | $ | 803,432 | | | $ | (417,392 | ) | | $ | 196,020 | | | | | |
84 | 2007 ANNUAL REPORT
Note 11 — New Accounting Pronouncements
In July 2006, the Financial Accounting Standards Board issued Interpretation No. 48, Accounting for Uncertainty in Income Taxes (FIN 48). FIN 48 sets forth a recognition threshold and measurement method for the financial statement recognition and measurement of a tax position taken or expected to be taken on a tax return. FIN 48 is effective for fiscal years beginning after December 15, 2006, and will be applied to all open tax years as of the effective date. Management is currently evaluating the impact that the adoption of FIN 48 will have on the Funds’ financial statement disclosures.
In addition, in September 2006, Statement of Financial Accounting Standards No. 157, Fair Value Measurements (SFAS 157), was issued and is effective for fiscal years beginning after November 15, 2007. SFAS 157 defines fair value, establishes a framework for measuring fair value and expands disclosures about fair value measurements. Management is currently evaluating the impact the adoption of SFAS 157 will have on the Funds’ financial statement disclosures.
Note 12 — 10% Shareholders
As of June 30, 2007, certain Funds had single shareholder and/or omnibus shareholder accounts (which are comprised of a group of individual shareholders), which individually amounted to more than 10% of the total shares outstanding as detailed below:
| | | | | | | | | |
| | | % Shares | | Number of |
| Fund | | Outstanding | | Accounts |
| |
| Strategic Growth | | | 24 | % | | | 1 | |
| Core Equity | | | 58 | % | | | 1 | |
| Small-Cap Growth | | | 81 | % | | | 2 | |
| Capital Opportunities | | | — | | | | — | |
| Biotech | | | — | | | | — | |
| Mid-Cap Value | | | 73 | % | | | 1 | |
| Small-Cap Value | | | 34 | % | | | 2 | |
| Core Value | | | 69 | % | | | 2 | |
2007 ANNUAL REPORT | 85
Notes to the Financial Statements
Note 13 — Change in Independent Registered Public Accounting Firm
The Board of Trustees, including a majority of disinterested Trustees, selected PricewaterhouseCoopers LLP (“PWC”), to serve as the Trust’s independent registered public accounting firm for the Trust’s fiscal year ended June 30, 2007. The decision to select PWC was recommended by the Audit Committee and was approved by the Board of Trustees, including a majority of the disinterested Trustees, on August 10, 2006. During the Trusts fiscal years ended June 30, 2005 and June 30, 2006 and through August 10, 2006, neither the Trust, its portfolios nor anyone on their behalf has consulted with PWC on items which (i) concerned the application of accounting principles to a specified transaction, either completed or proposed, or the type of audit opinion that might be rendered on the Trust’s financial statements; or (ii) concerned the subject of a disagreement (as defined in paragraph (a)(1)(iv) of Item 304 of Regulation S-K) or reportable events (as described in paragraph (a)(1)(iv) of said Item 304). The selection of PWC does not reflect any disagreements with or dissatisfaction by the Trust or the Board of Trustees with the performance of the Trust’s prior auditor. The decision to dismiss Briggs, Bunting & Dougherty, LLP (“Briggs”), the Trust’s previous independent registered public accounting firm and to select PWC was recommended by the Trust’s Audit Committee and approved by the Board of Trustees, including a majority of disinterested Trustees. Briggs’ report on the Trust’s financial statements for the fiscal years ended June 30, 2005 and June 30, 2006 contained no adverse opinion or disclaimer of opinion nor were they qualified or modified as to uncertainty, audit scope or accounting principles. During the Trust’s fiscal years ended June 30, 2005 and June 30, 2006 and through August 10, 2006, (i) there were no disagreements with Briggs on any matter of accounting principles or practices, financial statement disclosure or auditing scope or procedure, which disagreements, if not resolved to the satisfaction of Briggs, would have caused it to make reference to the subject matter of the disagreements in connection with its reports on the Trust’s financial statements for such years, and (ii) there were no reportable events of the kind described in Item 304(a)(1)(v) of Regulation S-K. The Trust has requested that Briggs furnish it with a letter addressed to the SEC stating whether or not it agrees with the above statements.
Note 14 — Subsequent Event
At a meeting of the Board of Trustees of the Quaker Investment Trust held on May 24, 2007, the Board approved reductions in sub-advisory fees paid by the Adviser to certain of the Funds’ sub-advisers. These reductions will result in a corresponding decrease in the fees paid by the Fund’s shareholders. Each of these arrangements went into effect as of July 1, 2007 and are as follows:
Knott Capital Management, the Quaker Capital Opportunities Fund’s sub-adviser, has agreed contractually to permanently reduce its sub-advisory fee from 0.75% to 0.625%, as a percentage of the Fund’s average daily net assets;
Sectoral Asset Management, Inc., the Quaker Biotech Pharma-Healthcare Fund’s sub-adviser, has agreed contractually to reduce its sub-advisory fee from 0.95% to 0.80%, as a percentage of the Fund’s average daily net assets from July 1, 2007 through December 31, 2008;
Geewax, Terker & Co., the Quaker Core Value Fund’s sub-adviser, has agreed contractually to add a breakpoint to its sub-advisory fee, such that the sub-advisory fee shall be 0.75% as a percentage on assets up to $20 million and 0.50% of the Fund’s average daily net assets on assets above $20 million; and
Global Capital Management, Inc., the Quaker Mid-Cap Value Fund’s sub-adviser, has agreed voluntarily to reduce its sub-advisory fee from 0.75% to 0.70%, as a percentage of the Fund’s average daily net assets.
86 | 2007 ANNUAL REPORT
Report of Independent Registered Public Accounting Firm
To the Board of Trustees and Shareholders of Quaker Investment Trust:
In our opinion, the accompanying statements of assets and liabilities, including the schedules of investments of Quaker Strategic Growth Fund, Quaker Core Equity Fund, Quaker Small-Cap Growth Fund, Quaker Capital Opportunities Fund, Quaker Mid-Cap Value Fund, Quaker Small-Cap Value Fund and Quaker Core Value Fund (formerly Geewax Terker Core Value Fund) and the schedule of investments and the schedule of securities sold short of Quaker Biotech Pharma-Healthcare Fund (constituting Quaker Investment Trust, hereafter referred to as the “Trust”), and the related statements of operations and of changes in net assets and the financial highlights present fairly, in all material respects, the financial position of the Trust at June 30, 2007 and the results of each of their operations, the changes in each of their net assets and the financial highlights for the year then ended, in conformity with accounting principles generally accepted in the United States of America. These financial statements and financial highlights (hereafter referred to as “financial statements”) are the responsibility of the Trust’s management; our responsibility is to express an opinion on these financial statements based on our audits. We conducted our audits of these financial statements in accordance with the standards of the Public Company Accounting Oversight Board (United States). Those standards require that we plan and perform the audit to obtain reasonable assurance about whether the financial statements are free of material misstatement. An audit includes examining, on a test basis, evidence supporting the amounts and disclosures in the financial statements, assessing the accounting principles used and significant estimates made by management, and evaluating the overall financial statement presentation. We believe that our audits, which included confirmation of securities at June 30, 2007 by correspondence with the custodian and brokers, provide a reasonable basis for our opinion. The statement of changes in net assets for the year ended June 30, 2006 and the financial highlights for each of the four years in the period ended June 30, 2006 were audited by other independent accountants whose report dated July 26, 2006 expressed an unqualified opinion on those statements.
PricewaterhouseCoopers LLP
Philadelphia, Pennsylvania
August 23, 2007
2007 ANNUAL REPORT | 87
Trustees and Officers
June 30, 2007
The Board of Trustees (“Board” or “Trustees”) has over all responsibility for conduct of the Trust’s affairs. The day-to-day operations of the Trust are managed by Quaker Funds Inc., subject to the Bylaws of the Trust and review by the Board. The Trustees of the Trust, including those Trustees who are also officers, are listed below.
| | | | | | | | | | | | | |
| |
| | | | | Serving as | | | | Number of | | Other |
| | | | | an Officer | | | | Portfolios | | Directorships |
| Name, Address and Age | | Position(s) Held | | or Trustee | | | | Overseen by | | Held by |
| | with the Trust | | of the Trust | | Principal Occupation(s) During Past 5 Years | | Trustee | | Nominee(1) |
| |
| |
Interested Trustees and Officers
Jeffry H. King, Sr.(2)
309 Technology Drive
Malvern, PA 19355
Age 64 | | Chairman of the Board of Trustees and Chief Executive Officer | | Since
Nov. 1996 | | Chairman of Board of Directors and Chief Executive Officer, Quaker Funds, Inc. (1996—present); Registered Representative, Radnor Research & Trading Company, LLC (2005—2006); Chairman and CEO, Quaker Securities Inc. (1990—2005). | | | 8 | | | None |
| |
Laurie Keyes(2)
309 Technology Drive
Malvern, PA 19355
Age 57 | | Treasurer and Trustee | | Since
Nov. 1996 | | Chief Financial Officer, Quaker Funds, Inc. (1996—present). | | | 8 | | | None |
| |
Justin Brundage(3)
309 Technology Drive
Malvern, PA 19355
Age 37 | | Secretary | | Since
Nov. 2006 | | Registered Representative, Quaker Securities (1995-2005); Chief Operating Officer, Quaker Funds, Inc. (2005—present). | | None | | None |
| |
Timothy E. Richards
309 Technology Drive
Malvern, PA 19355
Age 42 | | Chief Compliance
Officer | | Since
March
2004 | | General Counsel to Quaker Funds, Inc. and Chief Compliance Officer for the Quaker Investment Trust (2004—present); formerly Chief Compliance Officer for the Penn Street Funds, Inc. (2004 —2007); formerly General Counsel for CRA Advisors, Inc. and the Community Reinvestment Act Qualified Investment Trust (2004—2006). | | None | | None |
| |
Independent Trustees | | | | | | | | | | | | |
David K. Downes
309 Technology Drive
Malvern, PA 19355
Age 67 | | Chairman Emeritus of the Board
Trustee | | Since
Aug. 2007 Jan. 2004 - July 2007 | | President, Chief Executive Officer and Director of CRA Fund Advisors Inc. (2004—present); President, CRA Fund Advisers, Inc., an investment management company (2004—present); formerly, Chief Operating Officer and Chief Financial Officer, Lincoln National Investment Companies and Delaware Investments, the investment management subsidiary of Lincoln Financial Group (1992—2003); Chief Executive Officer, Delaware Investments, an investment management company (1997—2003). | | | 8 | | | Internet Capital Group, Inc. (a technology management company) (2003—present); GlaxoSmith Kline — Independent Chair Domestic Employee Benefit Trusts (2006—present); Oppenheimer Funds (2005—present); Correctnet, Inc. (2006—present). |
| |
Mark S. Singel
309 Technology Drive
Malvern, PA 19355
Age 54 | | Trustee | | Since Feb. 2002 | | Director/Founder, The Winter Group (2005—present); formerly, Managing Director, Public Affairs Management (lobbying firm) (2000—2004); Lieutenant Governor and Acting Governor of Pennsylvania (1987—1995). | | | 8 | | | None |
| |
Ambassador Adrian A. Basora (ret.)
309 Technology Drive
Malvern, PA 19355
Age 69 | | Trustee | | Since Feb. 2002 | | Director of Project on Democratic Transitions, Foreign Policy Research Institute (2004—present); formerly, President of Eisenhower Fellowships (1996-2004). | | | 8 | | | None |
| |
James R. Brinton
309 Technology Drive
Malvern, PA 19355
Age 53 | | Trustee | | Since Feb. 2002 | | President, Robert J. McAllister Agency, Inc. (insurance brokerage firm) (1979—present). | | | 8 | | | None |
88 | 2007 ANNUAL REPORT
| | | | | | | | | | | | | |
| | | | | Serving as | | | | Number of | | Other |
| | | | | an Officer | | | | Portfolios | | Directorships |
| | | Position(s) Held | | or Trustee | | | | Overseen by | | Held by |
| Name, Address and Age | | with the Trust | | of the Trust | | Principal Occupation(s) During Past 5 Years | | Trustee | | Nominee(1) |
| |
G. Michael Mara
309 Technology Drive
Malvern, PA 19355
Age 52 | | Trustee | | Since Feb. 2002 | | President, Valley Forge Capital Advisers (2002—present); formerly, President, Penn Street Funds, Inc. (2001—2005); formerly, Managing Director, Millennium Bank (2000—2004); Principal, Vanguard Fiduciary Trust Company (1997—1999). | | | 8 | | | None |
| |
Warren West
309 Technology Drive
Malvern, PA 19355
Age 51 | | Trustee | | Since Nov. 2003 | | President and owner, Greentree Brokerage Services, Inc. (1998—present). | | | 8 | | | None |
| |
Everett T. Keech
309 Technology Drive
Malvern, PA 19355
Age 67 | | Trustee
Interested Trustee, Vice Chairman of the Board, President, Treasurer
Trustee | | Since Nov. 2005
Feb., 2002—Jan.,
2005
Nov.
1996—Feb., 2002 | | Chairman—Executive Committee, Technology Development Corp., Norristown, PA, a technology development and manufacturing firm (1997—present); President, Quaker Investment Trust (2002—2003); Affiliated Faculty, University of Pennsylvania (1998—present). | | | 8 | | | Director, Technology Development Corp.; Director, Advanced Training Systems International, Inc.; Director, Phoenix Data Systems, Inc. |
| | |
| (1) | | Directorship of companies required to report to the SEC under the Securities Exchange Act of 1934, as amended (the “Exchange Act”) (i.e., “public companies”) and investment companies registered under the 1940 Act. |
| |
| (2) | | Mr. King and Ms. Keyes are considered to be “interested persons” of the Trust for purposes of the 1940 Act because they are officers and controlling shareholders of Quaker Funds, Inc., the investment adviser to the Funds. Mr. King and Ms. Keyes are husband and wife. |
| |
| (3) | | Mr. Brundage is Ms. Keyes’ son. |
The Statement of Additional Information for the Funds includes additional information about the Trustees and Officers and is available, without charge, upon request by calling (800) 220-8888.
2007 ANNUAL REPORT | 89
Board Consideration of the Investment Advisory and Sub-Advisory Agreements
June 30, 2007
The Independent Trustees of the Board of Trustees considered the Investment Advisory agreements between the Trust and QFI and each of the respective Sub-Advisory Agreements between QFI and DG Capital Management, Geewax, Terker & Co., Knott Capital Management, Sectoral Asset Management, Inc., Global Capital Management, Inc. and Aronson+Johnson+Ortiz, LP (collectively, the “Agreements”) with respect to each Fund at a meeting held on March 15, 2007. At the Board meeting the Independent Trustees reported to the full Board of Trustees their considerations with respect to the Agreements, and the Board of Trustees, including a majority of the Independent Trustees, considered and approved renewal of the Agreements.
In arriving at their decision to renew the Agreements, the Board considered, a variety of information concerning QFI and each sub-adviser, including: (1) the nature, extent and quality of services provided to the Funds by QFI and by the sub-adviser; (2) the level of the advisory and sub-advisory fees that are charged to each Fund; (3) the profitability information provided by QFI; (4) QFI’s and the sub-adviser’s compliance programs; (5) and any “fall out” or ancillary benefits enjoyed by QFI and the sub-advisers as a result of their relationship with the Funds. The Board also considered the answers to questions posed by the Board to representatives of QFI.
In considering the continuation of these Agreements, the Board considered the nature and quality of the services provided by QFI and the sub-advisers, the proposed fee structures, the level of fee waivers, each Fund’s past and anticipated expense ratios, possible economies of scale resulting from increases in the size of the Funds and other possible benefits QFI and the sub-advisers derived from their relationships with the Funds. The Board carefully analyzed the information provided to it by QFI, the sub-advisers, and independent third parties, focusing particularly on the level of advisory fees and expenses of each Fund with information for comparable funds, and the performance of each Fund to funds with comparable investment objectives. The Board also considered other information that it had received from QFI and the sub-advisers at other meetings throughout the year.
In examining the nature, extent and quality of the services to be provided by QFI, the Board considered the portfolio management, administrative and supervisory services provided by QFI. The Board acknowledged the value of QFI’s historical performance of services for the Funds. The Board noted QFI’s commitment to servicing the Funds as its only client; QFI’s efforts during the past year to reduce Fund expenses; and the nature of the non-investment advisory services provided to the Funds, such as the supervision of the Funds’ other third-party service providers, by QFI.
With respect to the nature, extent and quality of the services provided to the Funds by the sub-advisers, the Board considered the quality of the portfolio management services that the sub-advisers provided to the Funds; the depth, experience and demonstrated consistency in investment approach of each sub-adviser’s portfolio management team; the continued growth in each sub-adviser’s personnel responsible for managing the Funds; and the quality of each sub-adviser’s reputation. The Board further considered each sub-adviser’s performance record and its experience, as applicable, in managing other fund complexes with similar mutual funds.
Based on the totality of the information considered, the Board concluded that the Funds were likely to benefit from the nature, extent and quality of QFI’s and the sub-advisers’ services, as applicable, and that QFI and the sub-advisers have the ability to continue to provide these services based on their respective experience, operations and resources.
With respect to the Funds’ investment performance, the Board reviewed each Fund’s performance compared to both its peer group and relative benchmark indices over one-year, three-year, five-year, ten year and since inception periods, as applicable. The Board considered factors, including but not limited to each sub-adviser’s management style, that had affected the performance of each Fund relative to its peer group and benchmarks.
The Board considered the fees payable under each of the Agreements. The Board reviewed the information compiled from Morningstar comparing each Fund’s contractual management fee rate. The Board reviewed both the overall expenses on a Fund-by-Fund basis as well as the advisory fee charged to each Fund. The Board also noted that the Funds’ total expense ratios were equal to or above the average of comparable funds. The foregoing comparisons assisted the Board in determining to approve the Agreements by providing them with a basis for evaluating each Fund’s advisory fee and expense ratio on a relative basis.
90 | 2007 ANNUAL REPORT
With respect to the costs of the services to be provided and profits to be realized by QFI from its relationship with the Funds, the Board considered the fact that QFI had agreed to continue to waive its advisory fees to the extent necessary to limit the annualized expenses of each Fund to their assigned expenses ratio caps for an additional year. The Board also considered that QFI may be able to recoup some of the waived fees in the future. The Board noted that QFI continued to operate at a loss on most Funds due to its substantial subsidization of Fund expenses and that economies of scale had not yet been realized due to the relatively small size of the Funds. The Board also took into consideration QFI’s willingness to consider adding breakpoints to its advisory fee in the future if the Funds’ assets increase to the extent that economies of scale are realized. The Board did not consider the relationship between QFI’s advisory fees compared to other accounts that QFI advises because QFI has no other advisory accounts.
The Board considered whether there are any “fall out” or ancillary benefits that may accrue to QFI or the sub-advisers as a result of their relationship with the Funds. Based on the information provided prior to, and at, the March meeting, the Board noted that there did not appear to be any significant benefits in this regard.
After evaluation of the comparative performance, fee and expense information and the profitability, ancillary benefits and other considerations as described above, and in light of the nature, extent and quality of services to be provided by QFI and the sub-advisers, the Board concluded that the level of fees to be paid to QFI and the sub-advisers was reasonable.
In voting unanimously to approve the Agreements based on the various considerations discussed above, the Board determined that the approval of the Agreements was in the best interests of the Funds. As a result, the Board, including a majority of the Independent Trustees, approved the Advisory and Sub-Advisory Agreements.
2007 ANNUAL REPORT | 91
General Information (Unaudited)
Form N-Q Filing and Proxy Voting Policies and Procedures
Each Fund files its complete schedule of portfolio holdings with the Securities and Exchange Commission for the first and third quarters of each fiscal year on Form N-Q. Each Fund’s Forms N-Q, as well as a description of the policies and procedures that the Fund uses to determine how to vote proxies (if any) relating to portfolio securities is available without charge (i) upon request, by calling (800) 220-8888; and (ii) on the SEC’s web-site at http://www.sec.gov. Each Fund’s Forms N-Q may be reviewed and copied at the SEC’s Public Reference Room in Washington, DC; information on the operation of the Public Reference Room may be obtained by calling 1-800-SEC-0330.
Information (if any) regarding how the Funds voted proxies relating to portfolio securities during the most recently disclosed 12-month period ended June 30 is available (i) without charge, upon request, by calling (800) 220-8888; and (ii) on the SEC’s web-site at http://www.sec.gov.
Tax Information
We are required to advise you within 60 days of the Funds’ fiscal year-end regarding the federal tax status of certain distributions received by shareholders during such fiscal year. The information below is provided for the fiscal year ending June 30, 2007.
During the fiscal year ended June 30, 2007, the following Funds paid long-term capital distributions:
| | | | | | | | | |
| | | Long-Term | | |
| Fund | | Capital Gains | | Per Share |
| |
| Strategic Growth | | $ | 36,184,881 | | | $ | 0.96893 | |
| Core Equity | | | — | | | | — | |
| Small-Cap Growth | | | 159,311 | | | | 0.45132 | |
| Capital Opportunities | | | 1,407,478 | | | | 0.79584 | |
| Biotech | | | 380,106 | | | | 0.42489 | |
| Mid-Cap Value | | | 412,922 | | | | 0.05458 | |
| Small-Cap Value | | | 6,116,104 | | | | 1.51204 | |
| Core Value | | | 174,557 | | | | 0.78146 | |
Individual shareholders are eligible for reduced tax rates on the following percentages of qualified dividend income.
For the purposes of computing the dividends eligible for reduced taxes, the following amounts of the dividends paid by the Fund from ordinary income earned during the fiscal year are considered qualified dividend income.
| | | | | | | | | |
| Fund | | Amount | | Percentage |
| |
| Strategic Growth | | $ | 8,696,076 | | | | 14.70 | % |
| Core Equity | | | — | | | | — | |
| Small-Cap Growth | | | — | | | | — | |
| Capital Opportunities | | | — | | | | — | |
| Biotech | | | 648 | | | | 0.08 | % |
| Mid-Cap Value | | | 1,249,791 | | | | 60.84 | % |
| Small-Cap Value | | | 1,132,634 | | | | 44.36 | % |
| Core Value | | | 40,813 | | | | 25.04 | % |
Corporate shareholders may exclude up to the following percentages of qualifying dividends. For the purposes of computing this exclusion, the following amounts of the dividends paid by the Funds from ordinary income earned during the fiscal year represents qualifying dividends.
| | | | | | | | | |
| Fund | | Amount | | Percentage |
| |
| Strategic Growth | | $ | 7,367,107 | | | | 12.46 | % |
| Core Equity | | | — | | | | — | |
| Small-Cap Growth | | | — | | | | — | |
| Capital Opportunities | | | — | | | | — | |
| Biotech | | | 648 | | | | 0.08 | % |
| Mid-Cap Value | | | 1,114,347 | | | | 54.24 | % |
| Small-Cap Value | | | 782,511 | | | | 30.65 | % |
| Core Value | | | 37,492 | | | | 23.00 | % |
Dividends and distributions received by retirement plans such as IRAs, Keogh type plans and 403(b) plans need not be reported as taxable income. However, many retirement plan trusts may need this information for their annual information reporting.
Since the information above is reported for the Funds’ fiscal year and not the calendar year, shareholders should refer to their Form 1099-DIV or other tax information which will be mailed in January 2008 to determine the calendar year amounts to be included on their 2007 tax returns. Shareholders should consult their tax advisers.
92 | 2007 ANNUAL REPORT
The Quaker Funds are distributed by
Quasar Distributors, LLC.
Contact us:
Quaker Funds, Inc.
c/o U.S. Bancorp Fund Services, LLC
P.O. Box 701
Milwaukee, WI 53201-0701
800-220-8888
www.quakerfunds.com
(c)2007 Quaker® Investment Trust
ITEM 2. CODE OF ETHICS.
(a) The registrant, as of the end of the period covered by this report, has adopted a code of ethics that applies to the registrant’s principal executive officer, principal financial officer, principal accounting officer or controller, or persons performing similar functions, regardless of whether these individuals are employed by the registrant or a third party.
(b) Not Applicable
(c) There have been no amendments, during the period covered by this report, to a provision of the code of ethics that applies to the registrant’s principal executive officer, principal financial officer, principal accounting officer or controller, or persons performing similar functions, regardless of whether these individuals are employed by the registrant or a third party, and that relates to any element of the code of ethics description.
(d) The registrant has not granted any waivers, including an implicit waiver, from a provision of the code of ethics that applies to the registrant’s principal executive officer, principal financial officer, principal accounting officer or controller, or persons performing similar functions, regardless of whether these individuals are employed by the registrant or a third party, that relates to one or more of the items set forth in paragraph (b) of this item’s instructions.
(e) Not Applicable
(f) The registrant has included a copy of its code of ethics as an exhibit to this report.
ITEM 3. AUDIT COMMITTEE FINANCIAL EXPERT.
As of the end of the period covered by the report, the registrant’s board of Trustees has determined that Everett T. Keech is qualified to serve as an audit committee financial expert serving on its audit committee and is “independent”, as defined by Item 3 of Form N-CSR.
ITEM 4. PRINCIPAL ACCOUNTANT FEES AND SERVICES.
AUDIT FEES
(a) The aggregate fees billed for each of the last two fiscal years for professional services rendered by the principal accountant for the audit of the registrant’s annual financial statements or services that are normally provided by the accountant in connection with statutory and regulatory filings or engagements for those fiscal years are $159,000 for 2007 and $74,000 for 2006.
AUDIT-RELATED FEES
(b) The aggregate fees billed in each of the last two fiscal years for assurance and related services by the principal accountant that are reasonably related to the performance of the audit of the registrant’s financial statements and are not reported under paragraph (a) of this Item are $10,100 for 2007 and $0 for 2006.
TAX FEES
(c) The aggregate fees billed in each of the last two fiscal years for professional services rendered by the principal accountant for tax compliance, tax advice, and tax planning are $40,000 for 2007 and $22,000 for 2006.
ALL OTHER FEES
(d) The aggregate fees billed in each of the last two fiscal years for products and services provided by the principal accountant, other than the services reported in paragraphs (a) through (c) of this Item are $0 for 2007 and $0 for 2006.
(e) The audit committee has not adopted pre-approval policies and procedures. Instead, pursuant to the registrant’s Audit Committee Charter that has been adopted by the audit committee, the audit committee shall approve, prior to appointment, the engagement of the auditor to provide audit services to the registrant and non-audit services to the registrant, its investment adviser or any entity controlling, controlled by or under common control with the investment adviser that provides on-going services to the registrant if the engagement relates directly to the operations and financial reporting of the registrant.
(f) All of the principal accountant’s hours spent on auditing the registrant’s financial statements were attributed to work performed by full time permanent employees of the principal accountant.
(g) The aggregate non-audit fees billed by the registrant’s accountant for services rendered to the registrant and to the registrant’s investment adviser (not including any sub-adviser whose role is primarily portfolio management and whose activities are overseen by the registrant’s investment adviser) and any entity controlling, controlled by,
or under common control with the investment adviser that provides ongoing services to the registrant, for each of the registrant’s last two fiscal years are $0 for 2007 and $0 for 2006.
(h) The audit committee of the Board of Trustees has considered whether the provision of non-audit services that were rendered to the registrant’s investment adviser is compatible with maintaining the principal accountant’s independence. The audit committee has concluded that the provision of such non-audit services by the accountant has not compromised the accountant’s independence.
ITEM 5. AUDIT COMMITTEE OF LISTED REGISTRANTS.
Not applicable.
ITEM 6. SCHEDULE OF INVESTMENTS.
A Schedule of Investments in securities of unaffiliated issuers as of the close of the reporting period is included as part of the report to shareholders filed under Item 1 of this Form N-CSR.
ITEM 7. DISCLOSURE OF PROXY VOTING POLICIES AND PROCEDURES FOR CLOSED-END MANAGEMENT INVESTMENT COMPANIES.
Not Applicable.
ITEM 8. PORTFOLIO MANAGERS OF CLOSED-END MANAGEMENT INVESTMENT COMPANIES.
Not Applicable.
ITEM 9. PURCHASES OF EQUITY SECURITIES BY CLOSED-END MANAGEMENT INVESTMENT COMPANIES AND AFFILIATED PURCHASERS.
Not Applicable.
ITEM 10. SUBMISSION OF MATTERS TO A VOTE OF SECURITY HOLDERS.
There have been no material changes to the procedures by which the shareholders may recommend nominees to the registrant’s board of directors, where those changes were implemented after the registrant last provided disclosure in response to the requirements of Item 7(d)(2)(ii)(G) of Schedule 14A (17 CFR 240.14a-101), or this Item.
ITEM 11. CONTROLS AND PROCEDURES.
(a) The registrant’s principal executive officer and principal financial officer have concluded that the registrant’s disclosure controls and procedures (as defined in Rule 30a-
3(c) under the Investment Company Act of 1940, as amended) are effective, as of a date within 90 days of the filing date of this report that includes the disclosure required by this paragraph, based on their evaluation of these disclosure controls and procedures as required by Rule 30a-3(b) under the 1940 Act, as amended, 17 CFR 270.30a-3(b)), and Rules 13a-15(b) or 15d-15(b) under the Securities Exchange Act of 1934, as amended (17 CFR 240.13a-15(b) or 240.15d-15(b)).
(b) There were no changes in the registrant’s internal control over financial reporting (as defined in Rule 30a-3(d) under the 1940 Act, as amended (17 CFR 270.30a-3(d)), that occurred during the registrant’s second fiscal quarter of the period covered by this report that has materially affected, or is reasonably likely to materially affect, the registrant’s internal control over financial reporting.
ITEM 12. EXHIBITS.
(a)(1) Code of ethics, or any amendment thereto, that is the subject of disclosure required by Item 2 is attached hereto.
(a)(2) Certifications pursuant to Rule 30a-2(a) under the 1940 Act and Section 302 of the Sarbanes-Oxley Act of 2002 are attached hereto.
(a)(3) Not Applicable.
(b) Certifications pursuant to Rule 30a-2(b) under the 1940 Act and Section 906 of the Sarbanes-Oxley Act of 2002 are attached hereto.
SIGNATURES
Pursuant to the requirements of the Securities Exchange Act of 1934 and the Investment Company Act of 1940, the registrant has duly caused this report to be signed on its behalf by the undersigned, thereunto duly authorized.
| | | | | |
| (registrant) | | QUAKER INVESTMENT TRUST | | |
| | | | | |
| By (Signature and Title)* | | /s/ Jeffry H. King, Sr. | | |
| | | Jeffry H. King, Sr. | | |
| | | Chief Executive Officer | | |
Date: August, 23, 2007
Pursuant to the requirements of the Securities Exchange Act of 1934 and the Investment Company Act of 1940, this report has been signed below by the following persons on behalf of the registrant and in the capacities and on the dates indicated.
| | | | | |
| By (signature and Title)* | | /s/ Jeffry H. King, Sr. | | |
| | | Jeffry H. King, Sr. | | |
| | | Chief Executive Officer | | |
| | | | | |
| Date: August 23, 2007 | | | | |
| | | | | |
| By (signature and Title)* | | /s/ Laurie Keyes | | |
| | | Laurie Keyes | | |
| | | Treasurer | | |
| | | | | |
| Date: August 23, 2007 | | | | |
| | |
| * | | Print the name and title of each signing officer under his or her signature |