UNITED STATES
SECURITIES AND EXCHANGE COMMISSION
Washington, D.C. 20549
FORM N-CSR
CERTIFIED SHAREHOLDER REPORT OF REGISTERED
MANAGEMENT INVESTMENT COMPANIES
Investment Company Act file number: 811-06260
Quaker Investment Trust
(Exact name of registrant as specified in charter)
309 Technology Drive
Malvern, PA 19355
(Address of principle executive offices) (Zip Code)
Jeffry H. King, Sr.
309 Technology Drive
Malvern, PA 19355
(Name and address of agent for service)
Registrant’s telephone number, including area code: (800) 220-8888
Date of fiscal year end: June 30, 2008
Date of reporting period: June 30, 2008
Form N-CSR is to be used by management investment companies to file reports with the Commission not later than 10 days after the transmission to stockholders of any report that is required to be transmitted to stockholders under Rule 30e-1 under the Investment Company Act of 1940 (17 CFR 270.30e-1). The Commission may use the information provided on Form N-CSR in its regulatory, disclosure review, inspection, and policymaking roles.
A registrant is required to disclose the information specified by Form N-CSR, and the Commission will make this information public. A registrant is not required to respond to the collection of information contained in Form N-CSR unless the Form displays a currently valid Office of Management and Budget (“OMB”) control number. Please direct comments concerning the accuracy of the information collection burden estimate and any suggestions for reducing the burden to Secretary, Securities and Exchange Commission, 450 Fifth Street, NW, Washington, DC 20549-0609. The OMB has reviewed this collection of information under the clearance requirements of 44 U.S.C. § 3507.
Item 1. Report to Stockholders.
Chairman’s Letter to the Shareholders
June 30, 2008
Dear Fellow Shareholder:
The past fiscal year has been especially gratifying for me. The once fledgling company, the Quaker Funds is now almost 12 years old and has experienced tremendous growth in what is a very mature industry. The company was founded with the belief that over full market cycles, investment managers that have a consistent, repeatable investment process have a propensity to outperform their peer group and benchmarks.
During this short stretch of time, Quaker Funds has stood by its clients through two bull markets, as well as two bear markets. As these four distinct market cycles have unfolded, one thing has remained consistent, namely, our sub-advisers’ investment methodologies.
In 1996, looking toward the future, I believed that the investment industry would experience a Darwinian process that would ultimately lead to a new breed of money manager, thus changing the way people think about investing. Quaker Funds has two mutual fund portfolios that have been with us since inception: Quaker Strategic Growth and Quaker Small-Cap Value. We asked DG Capital and AJO Partners to manage the funds because we believed they would ultimately be (and we feel we were correct) the new faces of the investment industry.
DG Capital employed a strategy that, at the time, was not very popular within the mutual fund community, which consisted of shorting stocks and raising an unlimited amount of cash. AJO Partners was a pioneer in the somewhat fledgling investment style of quantitative investing. Today, these two methodologies are highly sought investment strategies and we can boast that our managers have been battle tested in many different markets.
For the fiscal year ended June 30, 2008, total firm assets have increased by over 50% during a trying period in the stock market. I look upon this as validation that investors like you understand and appreciate the vision I had years ago.
Quaker Funds continually strives to provide you, our valued investor, with investment managers that are disciplined in their investment methodologies and tested in the ever-changing marketplace. On behalf of the Board of Trustees, we thank you for giving us the opportunity to be trusted stewards of your financial well-being.
Sincerely,
Jeffry King
Chairman & CEO
Quaker Investment Trust
| Table of Contents |
| | Page |
| | |
| Chairman’s Letter to the Shareholders | | 1 |
| Performance Update: |
| Total Return Funds |
| Quaker Biotech Pharma-Healthcare Fund | | 2 |
| Quaker Global Total Return Fund | | 4 |
| Quaker Strategic Growth Fund | | 6 |
| Traditional Funds |
| Quaker Capital Opportunities Fund | | 8 |
| Quaker Mid-Cap Value Fund | | 10 |
| Quaker Small-Cap Value Fund | | 12 |
| Expense Information | | 14 |
| Schedule of Investments | | 16 |
| Statements of Assets and Liabilities | | 28 |
| Statements of Operations | | 30 |
| Statements of Changes in Net Assets | | 32 |
| Financial Highlights | | 34 |
| Notes to the Financial Statements | | 56 |
| Report of Independent Registered Public |
| Accounting Firm | | 66 |
| Trustees and Officers | | 67 |
| Approval Advisory Agreement | | 69 |
| General Information | | 71 |
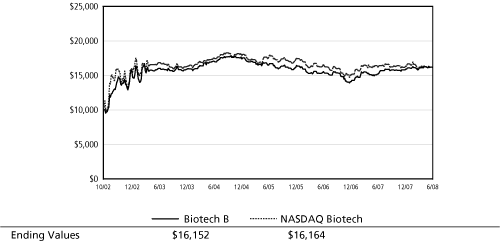
Quaker Biotech Pharma-Healthcare Fund (QBPAX, QBPBX, CBPCX)
Objectives and Principal Strategies
The Fund seeks to provide long-term growth of capital. Current income is not a significant investment consideration. The Fund invests in stocks of companies that have attractive growth prospects resulting from leading edge product research and development that are engaged in the development, production or distribution of biotechnology, healthcare and pharmaceutical products and services.
Performance Review and Market Outlook
Biotech stocks, down 1.15% over the twelve month period ended June 30, 2008 as measured by the NASDAQ Biotech Index (“NBI”), fared better than the broader markets, down over 10% throughout the twelve month period, as measured by the NASDAQ Composite Index and the S&P 500 Index. This out performance is attributable both to the fact that the credit, commodity price and economic growth worries which have dominated investor sentiment have little impact on biotech companies, as well as the fact that the biotech industry’s fundamentals are solid and valuations attractive.
For the twelve month period ended June 30, 2008, the Quaker Biotech Pharma-Healthcare Fund’s performance was 3.40%*. This performance was achieved with an average net long exposure of about 60% and volatility about 25% lower than that of the NBI.
Biotech stocks faired well due to their lack of dependence on credit and economic growth issues as well as fundamental industry developments. The U.S. government re-authorized the Food and Drug Administration’s legislation, the Prescription Drug and User Fee Act, in a form that appears to be backed by industry. The creation of a pathway for the approval of biogenerics in the U.S. was not included in the Prescription Drug and User Fee Act and appears to be a project for later years. Healthcare has attracted significant attention in the U.S. elections with candidate reform proposals focusing on improving coverage and costs.
Additionally, the biotech industry has continued to demonstrate strong fundamentals with large-cap companies generally reporting solid financial performance and mid and small-cap companies continuing to innovate. The Biotech industry continues to get product approvals, some examples of which are Progenics’ Relistor (for opiod induced constipation), Genentech’s Avastin (for metastatic breast cancer), and Onyx’s Nexavar (for liver cancer) among others. Clinical trial results for drugs that are far superior to current standards of care include Vertex’s telaprevir(for hepatitis c infection), Cardiome’s vernakalant(for atrial fibrillation), and Pharmion’s Vidaza (for a type of blood cancer). Merger and acquisition activity was also plentiful with the major deals being Celgene acquiring Pharmion and Takeda buying Millennium.
While we expect biotech relative outperformance to continue, absolute performance will in large part depend on the overall equity market environment. The biotech industry’s fundamentals appear strong while valuation is still quite attractive. Finally, support for the sector should continue if economic growth concerns linger.
Michael Sjöström, CFA, Chief Investment Officer
Stephan Patten, CFA, Portfolio Manager
Sectoral Asset Management, Inc.
* Performance shown is that of Class A and is not reflective of sales charges. See the Total Return Table on the next page for performance with sales charges.
SUB-ADVISER: Sectoral Asset Management, Inc. TOTAL NET ASSETS: AS OF JUNE 30, 2008: $6,636,001 |
Top Ten Holdings** (% of net assets)
| | | | | |
| |
| Celgene Corp. | | | 6.81 | % |
| Genzyme Corp. | | | 6.57 | % |
| Amgen Inc. | | | 6.41 | % |
| Gilead Sciences, Inc. | | | 5.94 | % |
| Novo Nordisk A/S | | | 3.65 | % |
| Basilea Pharmaceutica AG | | | 3.42 | % |
| Onyx Pharmaceuticals, Inc. | | | 3.34 | % |
| Progenics Pharmaceuticals, Inc. | | | 2.87 | % |
| Illumina, Inc. | | | 2.49 | % |
| Varian Medical Systems, Inc. | | | 2.35 | % |
| |
| % Fund Total | | | 43.85 | % |
| |
| ** Excludes Short-Term Investments |
2 ½ 2 0 0 8 A N N U A L R E P O R T
Quaker Biotech Pharma-Healthcare Fund
Growth of a Hypothetical $10,000 Investment
June 30, 2008
Average Annualized Total Return
* The benchmark since inception returns are calculated since commencement of September 23, 2002 through June 30, 2008.
| | | | | | | | | | | | | | | | | | | | | | | | | | | | | | | | | |
| | | | | | | | | | | | | | | | | | | | | | | | | | | Commencement |
| | | Expense | | Inception | | | | | | | | | | | | | | | | | | of operations |
| | | Ratio | | Date | | One Year | | Five Year | | through 06/30/08 |
| | | | | | | | | | | |
| | | | | | | | | | | with | | without | | with | | without | | with | | without |
| | | | | | | | | | | sales | | sales | | sales | | sales | | sales | | sales |
| | | | | | | | | | | charge | | charge | | charge | | charge | | charge | | charge |
| |
| Class A | | | 2.19 | % | | | 10/14/2002 | | | | (2.28 | )% | | | 3.40 | % | | | 5.22 | % | | | 6.42 | % | | | 7.68 | % | | | 8.75 | % |
| |
| Class B | | | 2.94 | % | | | 09/23/2002 | | | | (1.93 | )% | | | 2.67 | % | | | 5.35 | % | | | 5.65 | % | | | 7.76 | % | | | 7.88 | % |
| |
| Class C | | | 2.94 | % | | | 11/20/2002 | | | | 1.75 | % | | | 2.67 | % | | | 5.65 | % | | | 5.65 | % | | | 8.09 | % | | | 8.09 | % |
| |
| NASDAQ Biotechnology® Index* | | | | | | (1.15 | )% | | | (1.15 | )% | | | 3.37 | % | | | 3.37 | % | | | 10.82 | % | | | 10.82 | % |
| |
Performance data quoted represents past performance and is no guarantee of future results. Investment return and principal value will fluctuate so that shares, when redeemed, may be worth more or less than their original cost. Current performance may be lower or higher than performance data quoted. Performance data current to the most recent month end is available at www.quakerfunds.com or by calling us toll free at 800-220-8888. Total return includes reinvestment of dividends and capital gains.
Class A shares of the Fund have a maximum sales charge of 5.50%. Class B and Class C shares have maximum deferred sales charges of 5.00% and 1.00%, respectively.
The line graph and performance table do not reflect the deduction of taxes that a shareholder might pay on fund distributions or the redemption of fund shares. Total return calculations reflect expense reimbursements and fee waivers in the applicable periods. See financial highlights for periods where fees were waived or reimbursed.
The Fund’s portfolio holdings may differ significantly from the securities held in the index and, unlike a mutual fund, an unmanaged index assumes no transaction costs, taxes, management fees or other expenses. You cannot invest directly in an index.
The NASDAQ Biotechnology® Index is a widely recognized, unmanaged index. It contains companies primarily engaged in using biomedical research for the discovery or development of novel treatments or cures for human disease which also meet other eligibility criteria. The NASDAQ Biotechnology® Index is calculated under a modified capitalization-weighted methodology.
2 0 0 8 A N N U A L R E P O R T ½ 3
Performance Update
Quaker Global Total Return Fund (QTRAX, QTRCX, QTRIX)
Objectives and Principal Strategies
The Fund seeks to provide long-term growth of capital. Current income is not a significant investment consideration. This Fund’s investment objective is non-fundamental, which means that it may be changed by the Board of Trustees without shareholder approval.
Performance Review and Market Outlook
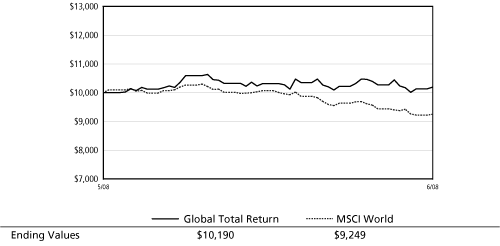
Amid a backdrop of global financial turmoil and market volatility, the Quaker Global Total Return Fund performed admirably in its first partial quarter. Since its inception on 5/1/2008, the Fund appreciated 1.90%*, while its benchmark, the MSCI World Index, had a loss of –7.51% over the same period.
As the U.S. economy de-leverages itself, growth continues to lag other economies with better public revenue and debt to GDP ratios. The increased consumer spending and infrastructure expansion in emerging economies continues to buoy their growth. The Middle Eastern countries of the GCC (Gulf Cooperation Council) (which includes Saudi Arabia, Qatar, Kuwait, Oman and the U.A.E.) are predicting domestic infrastructure spending of over $230 billion a year over the next 12 years ($2.8 trillion in total). India’s average income per person is expected to triple over the next 20 years moving it from the 12th largest consumer economy to the 5th largest. The consumption of energy, commodities and food is expanding rapidly and in some cases eclipsing gains in supply.
To benefit from these global shifts, we have invested opportunistically in domestic companies that have a global footprint and provide exports to these markets (in industries such as integrated oil and gas, drillers, E&P companies, steel and agribusiness). We have also invested the international portion of the Fund in shipping companies, construction and engineering firms, mining and fertilizer manufacturers. Overall we continue to emphasize highly liquid, larger-cap stocks with attractive valuations and good earnings surprise potential.
We have stayed away from any global industries with exposure to the sub-prime crisis (primarily finance) and its resulting drag on consumer spending in retail, consumer technology, autos and housing.
Manu P. Daftary, Portfolio Manager
DG Capital Management, Inc.
* Performance shown is that of Class A and is not reflective of sales charges. See the Total Return Table on the next page for performance with sales charges.
SUB-ADVISER: DG Capital Management, Inc. TOTAL NET ASSETS: AS OF JUNE 30, 2008: $41,111,030 |
| |
| |
| Top Ten Holdings** (% of net assets) | | | | |
| | | | | |
| |
| Potash Corp. of Saskatchewan | | | 4.92 | % |
| Freeport-McMoRan Copper & Gold, Inc. | | | 4.18 | % |
| Schlumberger Ltd. | | | 4.11 | % |
| BHP Billiton Ltd. ADR | | | 3.87 | % |
| ArcelorMittal | | | 3.86 | % |
| United States Steel Corp. | | | 3.78 | % |
| Monsanto Co. | | | 3.69 | % |
| Petroleo Brasileiro SA ADR | | | 3.50 | % |
| XTO Energy, Inc. | | | 3.37 | % |
| Bunge Ltd. | | | 3.28 | % |
| |
| % Fund Total | | | 38.56 | % |
| |
| ** Excludes Short-Term Investments |
4 ½ 2 0 0 8 A N N U A L R E P O R T
Quaker Global Total Return Fund
Growth of a Hypothetical $10,000 Investment
June 30, 2008
Average Total Return
* The benchmark since inception returns are calculated since commencement of May 1, 2008 through June 30, 2008.
| | | | | | | | | | | | | | | | | | | | | | | | | | | | | | | | |
| | | | | | | | | | | | | | | | | | | | | | | | | | | Commencement |
| | | Expense | | Inception | | | | | | | | | | | | | | | | | | of operations |
| | | Ratio | | Date | | One Year | | Five Year | | through 06/30/08 |
| | | | | | | | | | | |
| | | | | | | | | | | with | | without | | with | | without | | with | | without |
| | | | | | | | | | | sales | | sales | | sales | | sales | | sales | | sales |
| | | | | | | | | | | charge | | charge | | charge | | charge | | charge | | charge |
| |
| Class A | | | 1.99 | % | | | 05/01/2008 | | | | – | | | | – | | | | – | | | | – | | | | (3.70 | )% | | | 1.90 | % |
| |
| Class C | | | 2.74 | % | | | 05/01/2008 | | | | – | | | | – | | | | – | | | | – | | | | 0.70 | % | | | 1.70 | % |
| |
| Institutional Class | | | 1.74 | % | | | 05/01/2008 | | | | – | | | | – | | | | – | | | | – | | | | – | | | | – | |
| |
| MSCI World Index* | | | | | | | | | | | – | | | | – | | | | – | | | | – | | | | (7.51 | )% | | | (7.51 | )% |
| |
Performance data quoted represents past performance and is no guarantee of future results. Investment return and principal value will fluctuate so that shares, when redeemed, may be worth more or less than their original cost. Current performance may be lower or higher than performance data quoted. Performance data current to the most recent month end is available at www.quakerfunds.com or by calling us toll free at 800-220-8888. Total return includes reinvestment of dividends and capital gains.
Class A shares of the Fund have a maximum sales charge of 5.50%. Class C shares have maximum deferred sales charges of 1.00%.
The line graph and performance table do not reflect the deduction of taxes that a shareholder might pay on fund distributions or the redemption of fund shares. Total return calculations reflect expense reimbursements and fee waivers in the applicable periods. See financial highlights for periods where fees were waived or reimbursed.
The Fund’s portfolio holdings may differ significantly from the securities held in the index and, unlike a mutual fund, an unmanaged index assumes no transaction costs, taxes, management fees or other expenses. You cannot invest directly in an index.
The Morgan Stanley Capital International World Index measures developed-market equity performance throughout the world.
2 0 0 8 A N N U A L R E P O R T ½ 5
Performance Update
Quaker Strategic Growth Fund (QUAGX, QAGBX, QAGCX, QAGIX)
Objectives and Principal Strategies
The Fund seeks to provide long-term growth of capital. Current income is not a significant investment consideration. The Fund invests primarily in equity securities of domestic U.S. companies which the Fund’s sub-adviser believes show a high probability for superior growth.
Performance Review and Market Outlook
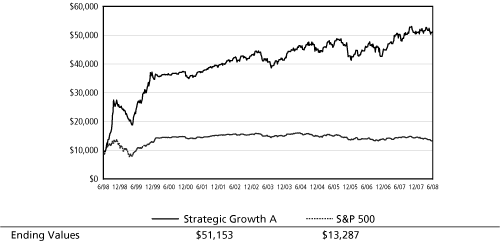
For the fiscal year ending June 30, 2008, the S&P 500 Total Return Index (a broad based market proxy) declined –13.12% while the Class A shares of the Quaker Strategic Growth Fund finished the fiscal year with a total return of 22.22%*. For the first half of calendar year 2008, the S&P 500 has fallen –11.91% while the Quaker Strategic Growth Fund has gained 6.24%.
The economic boom in the BRIC (Brazil, Russia, India and China) and GCC (Gulf Cooperation Council) countries has led to an increased demand for the commodities used in their infrastructure build-out. Additionally, rising incomes in these countries has led to increasing demand for meat which is causing increasing competition for animal feedstock. Combined with the diversion of corn for ethanol production, worldwide prices for grains continue to advance. Finally, it is becoming apparent that countries that are producers of oil have been increasing their consumption of oil derivatives (gasoline, diesel, fuel oil) much faster than the rest of the world, leading to lower export levels to countries that import those derivatives.
Unfortunately, this worldwide trend of increasing demand is occurring against a background of limited supplies. All of the above has caused commentators to bring forward the possibility of a world-wide food and energy crisis as prices of all inputs soar beyond expectations. We too are concerned about the rapid escalation of input prices that is now causing headline inflation to jump rapidly in developing countries.
In an effort to navigate these global trends, we continue to have investments in the industrial (global construction and engineering firms), materials (mining and fertilizer companies), energy and consumer staple (agribusiness) sectors. We continue to emphasize large-cap growth stocks with good free-cash flow characteristics, attractive valuations, positive earnings surprise potential and a global presence.
We have maintained our underweights in the financial, consumer discretionary and technology sectors of the market due to the seemingly perpetual credit meltdown, weakness in consumer spending (due to housing woes and high gas prices) and the overall slowing of the domestic economy.
Manu P. Daftary, Portfolio Manager
DG Capital Management, Inc.
* Performance shown is that of Class A and is not reflective of sales charges. See the Total Return Table on the next page for performance with sales charges.
6 ½ 2 0 0 8 A N N U A L R E P O R T
SUB-ADVISER: DG Capital Management, Inc. TOTAL NET ASSETS: AS OF JUNE 30, 2008: $1,590,773,136 |
| Top Ten Holdings** (% of net assets) |
| | | | | | | | | |
| |
| Potash Corp. of Saskatchewan | | | | | | | 4.95 | % |
| United States Steel Corp. | | | | | | | 4.62 | % |
| Freeport-McMoRan Copper & Gold, Inc. | | | | | | | 4.60 | % |
| Schlumberger Ltd. | | | | | | | 4.25 | % |
| BHP Billiton Ltd. ADR | | | | | | | 4.21 | % |
| Monsanto Co. | | | | | | | 4.01 | % |
| Petroleo Brasileiro SA | | | | | | | 3.77 | % |
| XTO Energy, Inc. | | | | | | | 3.74 | % |
| Bunge Ltd. | | | | | | | 3.45 | % |
| Occidental Petroleum Corp. | | | | | | | 3.18 | % |
| |
| % Fund Total | | | | | | | 40.78 | % |
| |
| ** | | Excludes Short-Term Investments |
Quaker Strategic Growth Fund
Growth of a Hypothetical $10,000 Investment
June 30, 2008
Average Annualized Total Return
* The benchmark since inception returns are calculated since commencement of November 25, 1996 through June 30, 2008.
| | | | | | | | | | | | | | | | | | | | | | | | | | | | | | | | | | | | | | | | |
| | | | | | | | | | | | | | | | | | | | | | | | | | | | | | | | | | | Commencement |
| | | Expense | | Inception | | | | | | | | | | | | | | | | | | | | | | | | | | of operations |
| | | Ratio | | Date | | One Year | | Five Year | | Ten Year | | through 06/30/08 |
| | | | | | | | | | | | | |
| | | | | | | | | | | with | | without | | with | | without | | with | | without | | with | | without |
| | | | | | | | | | | sales | | sales | | sales | | sales | | sales | | sales | | sales | | sales |
| | | | | | | | | | | charge | | charge | | charge | | charge | | charge | | charge | | charge | | charge |
| |
| Class A | | | 1.90 | % | | | 11/25/1996 | | | | 15.50 | % | | | 22.22 | % | | | 17.00 | % | | | 18.33 | % | | | 17.05 | % | | | 17.71 | % | | | 18.11 | % | | | 18.69 | % |
| |
| Class B | | | 2.65 | % | | | 08/01/2000 | | | | 16.32 | % | | | 21.32 | % | | | 17.25 | % | | | 17.46 | % | | | n/a | | | | n/a | | | | 8.05 | % | | | 8.05 | % |
| |
| Class C | | | 2.65 | % | | | 07/11/2000 | | | | 20.29 | % | | | 21.29 | % | | | 17.45 | % | | | 17.45 | % | | | n/a | | | | n/a | | | | 7.96 | % | | | 7.96 | % |
| |
| Class I | | | 1.65 | % | | | 07/20/2000 | | | | 22.58 | % | | | 22.58 | % | | | 18.64 | % | | | 18.64 | % | | | n/a | | | | n/a | | | | 8.87 | % | | | 8.87 | % |
| |
S&P 500 ® Total Return Index* | | | | | | (13.12 | )% | | | (13.12 | )% | | | 7.58 | % | | | 7.58 | % | | | 2.88 | % | | | 2.88 | % | | | 6.36 | % | | | 6.36 | % |
| |
Performance data quoted represents past performance and is no guarantee of future results. Investment return and principal value will fluctuate so that shares, when redeemed, may be worthmore or less than their original cost. Current performance may be lower or higher than performance data quoted. Performance data current to the most recent month end is available at www.quakerfunds.com or by calling us toll free at 800-220-8888. Total return includes reinvestment of dividends and capital gains.
Class A shares of the Fund have a maximum sales charge of 5.50%. Class B and Class C shares have maximum deferred sales charges of 5.00% and 1.00%, respectively.
The line graph and performance table do not reflect the deduction of taxes that a shareholder might pay on fund distributions or the redemption of fund shares. Total return calculations reflect expense reimbursements and fee waivers in the applicable periods. See financial highlights for periods where fees were waived or reimbursed.
The Fund’s portfolio holdings may differ significantly from the securities held in the index and, unlike a mutual fund, an unmanaged index assumes no transaction costs, taxes, management fees or other expenses. You cannot invest directly in an index.
The S&P 500® Total Return Index is a capitalization weighted index of 500 stocks designed to measure performance of the broad domestic economy through changes in the aggregate market value of 500 stocks representing all major industries.
2 0 0 8 A N N U A L R E P O R T ½ 7
Performance Update
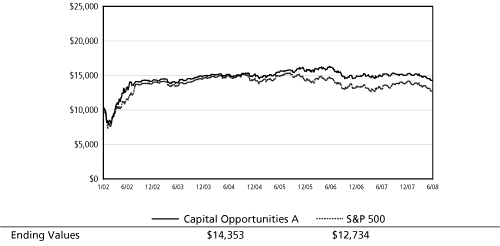
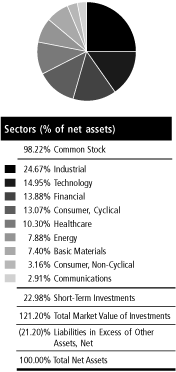
Quaker Capital Opportunities Fund (QUKTX, QCOBX, QCOCX)
Objectives and Principal Strategies
The Fund seeks to provide long-term growth of capital. Current income is not a significant investment consideration and any such income realized will be viewed as incidental to the Fund’s investment objective. The Fund invests primarily in a limited number of securities which the Fund’s sub-adviser believes show a high probability for superior growth.
Performance Review and Market Outlook
For the twelve months ended June 30, 2008, the Fund outperformed the S&P 500, with a loss of –3.63%* vs. a loss of –13.12% for the S&P 500. Our macroeconomic view during the past year emphasized defensiveness, given our belief that the economy would likely slow over the period. Concerns over the housing industry, a looming credit crisis, and steadily declining employment numbers proved to be well founded as 2007 ended and the new year began. While not yet a recession by standard definition, the “feels like” recession that we anticipated several months ago is now upon us.
Our defensive positioning has been rewarded over the past twelve months. Underweights of both the financial and consumer discretionary sectors have contributed to our relative performance versus the S&P 500, allowing us to avoid the increasing pressures on lenders and consumers in the form of falling housing prices, rising mortgage delinquencies, high energy price, and a deteriorating job market. Additionally, our overweight positions in consumer staples, information technology, and aerospace and defense industries all proved advantageous. Conversely, our underweight positions in the energy and utilities sectors hindered performance. Despite an environment of weakening demand, meager supply growth and other factors have led to a surprisingly steep increase in the price of crude oil. More recently, we have added to our holdings in the energy sector, emphasizing large-cap, integrated oil companies.
The market environment has been extremely challenging for many months now, and we continue to see obstacles for both financial intermediaries and consumers. However, with recent declines affecting virtually all market sectors, we are presented with more attractive opportunities to invest. We believe that the Fund’s emphasis on downside protection, a hallmark of the Knott Capital approach, coupled with continued focus on predictable, stable-growth companies, will prove invaluable in the months to come.
Charles A. Knott, Peter M. Schofield, CFA
Knott Capital Management
SUB-ADVISER: Knott Capital Management TOTAL NET ASSETS: AS OF JUNE 30, 2008: $12,649,664 |
| | | | | | |
| Top Ten Holdings** (% of net assets) | | | | | |
| |
| Textron, Inc. | | | | 4.73 | % |
| General Dynamics Corp. | | | | 4.46 | % |
| Genentech, Inc. | | | | 4.44 | % |
| Microsoft Corp. | | | | 4.28 | % |
| SPDR Gold Trust | | | | 4.23 | % |
| Teva Pharmaceutical Industries Ltd. ADR | | | | 4.20 | % |
| PepsiCo, Inc. | | | | 4.17 | % |
| Diageo PLC ADR | | | | 4.15 | % |
| CVS Caremark Corp. | | | | 4.00 | % |
| Oracle Corp. | | | | 3.98 | % |
| |
| % Fund Total | | | | 42.64 | % |
| |
| |
| ** | | Excludes Short-Term Investment |
| * | | Performance shown is that of Class A and is not reflective of sales charges. See the Total Return Table on the next page for performance with sales charges. |
8 ½ 2 0 0 8 A N N U A L R E P O R T
Quaker Capital Opportunities Fund
Growth of a Hypothetical $10,000 Investment
June 30, 2008
Average Annualized Total Return
* The benchmark since inception returns are calculated since commencement of January31, 2002 through June 30, 2008.
| | | | | | | | | | | | | | | | | | | | | | | | | | | | | | | | |
| | | | | | | | | | | | | | | | | | | | | | | | | | | Commencement |
| | | Expense | | Inception | | | | | | | | | | | | | | | | | | of operations |
| | | Ratio | | Date | | One Year | | Five Year | | through 06/30/08 |
| | | | | | | | | | | |
| | | | | | | | | | | with | | without | | with | | without | | with | | without |
| | | | | | | | | | | sales | | sales | | sales | | sales | | sales | | sales |
| | | | | | | | | | | charge | | charge | | charge | | charge | | charge | | charge |
| |
| Class A | | | 1.64 | % | | | 01/31/2002 | | | | (8.93 | )% | | | (3.63 | )% | | | 8.42 | % | | | 9.65 | % | | | 4.86 | % | | | 5.79 | % |
| |
| Class B | | | 2.39 | % | | | 05/02/2002 | | | | (8.32 | )% | | | (4.29 | )% | | | 8.58 | % | | | 8.86 | % | | | 5.40 | % | | | 5.40 | % |
| |
| Class C | | | 2.39 | % | | | 05/02/2002 | | | | (5.19 | )% | | | (4.38 | )% | | | 8.85 | % | | | 8.85 | % | | | 5.38 | % | | | 5.38 | % |
| |
S&P 500® Total Return Index* | | | | (13.12 | )% | | | (13.12 | )% | | | 7.58 | % | | | 7.58 | % | | | 3.84 | % | | | 3.84 | % |
| |
Performance data quoted represents past performance and is no guarantee of future results. Investment return and principal value will fluctuate so that shares, when redeemed, may be worthmore or less than their original cost. Current performance may be lower or higher than performance data quoted. Performance data current to the most recent month end is available at www.quakerfunds.com or by calling us toll free at 800-220-8888. Total return includes reinvestment of dividends and capital gains.
Class A shares of the Fund have a maximum sales charge of 5.50%. Class B and Class C shares have maximum deferred sales charges of 5.00% and 1.00%, respectively.
The line graph and performance table do not reflect the deduction of taxes that a shareholder might pay on fund distributions or the redemption of fund shares. Total return calculations reflect expense reimbursements and fee waivers in the applicable periods. See financial highlights for periods where fees were waived or reimbursed.
The Fund’s portfolio holdings may differ significantly from the securities held in the index and, unlike a mutual fund, an unmanaged index assumes no transaction costs, taxes, management fees or other expenses. You cannot invest directly in an index.
The S&P 500® Total Return Index is a capitalization weighted index of 500 stocks designed to measure performance of the broad domestic economy through changes in the aggregate market value of 500 stocks representing all major industries.
2 0 0 8 A N N U A L R E P O R T ½ 9
Performance Update
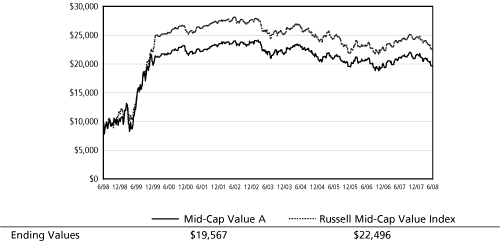
Quaker Mid-Cap Value Fund (QMCVX, QMCBX, QMCCX, QMVIX)
Objectives and Principal Strategies
The Fund seeks to provide long-term growth of capital. Current income is not a significant investment consideration and any such income realized will be considered incidental to the Fund’s investment objective. The Fund invests primarily in common stocks comparable to the companies included in the Russell MidCap® Value.
Performance Review and Market Outlook
The Quaker Mid-Cap Value Fund ended its fiscal year on June 30, 2008, with a return of –15.92%* versus –17.09% for the benchmark Russell MidCap® Value Index, while outperforming in three out of the four quarters. Fiscal 2007 recessionary fears gave way to sub-prime mortgage foreclosures. The market set new highs in the first two weeks of the fiscal year based on strength in global markets, but has led the way down ever since on a weakening dollar and surging oil and commodity prices. Global markets have followed with many nearing 50% corrections with high volatile returns. Large capitalization stocks, as measured by the S&P 500, a sector that was almost unanimously agreed upon as a “safe haven”, generated a negative total return of –13.12% in this period. The Federal Reserve was not idle and from the perspective of many “FED watchers”, the Central Bank was “anticipatory” to the sub-prime mess. The FED began lowering interest rates in September with a 50 basis point surprise cut. The market had not experienced a 15% cleansing correction in over5 years. October saw the equity markets rise to record levels for some indices before a sharp sell off around the middle of the month. Oil prices marched from $80 to $90 dollars and gold traded up through a $700 ceiling. We wrote back in October of our concerns with Citigroup, Merrill Lynch and General Motors and the debt on their balance sheets. As investors warmed up to growth stocks, we became increasingly uncomfortable with any company that carried debt.
Throughout the fiscal year, the portfolio was underweighted to the benchmark in Finance, Utility and Consumer stocks. Our process guided us toward Industrial companies with growing international sales and Commodity/Energy sector companies. We maintained an overweighting in these two sectors for most of the fiscal year. In the fiscal fourth quarter we have been scaling back in the Commodity/Energy stocks.
John Hammerschmidt, Anthony Soslow, CFA, and Philip Mendelsohn, CFA,
Global Capital Management, Inc.
SUB-ADVISER: Global Capital Management, Inc. TOTAL NET ASSETS: AS OF JUNE 30, 2008: $23,898,004 |
| | | | | | | |
| Top Ten Holdings** (% of net assets) |
| | | | | | | |
| Altera Corp. | | | | | 4.33 | % |
| Noble Corp. | | | | | 4.08 | % |
| SEI Investments Co. | | | | | 3.94 | % |
| Parker Hannifin Corp. | | | | | 3.58 | % |
| American Financial Group, Inc. | | | | | 3.36 | % |
| DryShips, Inc. | | | | | 3.36 | % |
| Steel Dynamics, Inc. | | | | | 3.27 | % |
| Precision Castparts Corp. | | | | | 3.23 | % |
| Bunge Ltd. | | | | | 3.16 | % |
| Endo Pharmaceuticals Holdings, Inc. | | | | | 3.04 | % |
| |
| % Fund Total | | | | | 35.35 | % |
| |
| |
| ** | | Excludes Short-Term Investments |
| * | | Performance shown is that of Class A and is not reflective of sales charges. See the Total Return Table on the next page for performance with sales charges. |
10 ½ 2 0 0 8 A N N U A L R E P O R T
Quaker Mid-Cap Value Fund
Growth of a Hypothetical $10,000 Investment
June 30, 2008
Average Annualized Total Return
* The benchmark since inception returns are calculated since commencement of December 31, 1997 through June 30, 2008.
| | | | | | | | | | | | | | | | | | | | | | | | | | | | | | | | | | | | | | | | |
| | | | | | | | | | | | | | | | | | | | | | | | | | | | | | | | | | | Commencement |
| | | Expense | | Inception | | | | | | | | | | | | | | | | | | | | | | | | | | of operations |
| | | Ratio | | Date | | One Year | | Five Year | | Ten Year | | through 06/30/08 |
| | | | | | | | | | | | | |
| | | | | | | | | | | with | | without | | with | | without | | with | | without | | with | | without |
| | | | | | | | | | | sales | | sales | | sales | | sales | | sales | | sales | | sales | | sales |
| | | | | | | | | | | charge | | charge | | charge | | charge | | charge | | charge | | charge | | charge |
| |
| Class A | | | 1.64 | % | | | 12/31/1997 | | | | (20.54 | )% | | | (15.92 | )% | | | 10.99 | % | | | 12.25 | % | | | 6.33 | % | | | 6.94 | % | | | 6.92 | % | | | 7.50 | % |
| |
| Class B | | | 2.39 | % | | | 01/05/2001 | | | | (20.49 | )% | | | (16.49 | )% | | | 11.17 | % | | | 11.43 | % | | | n/a | | | | n/a | | | | 8.95 | % | | | 8.95 | % |
| |
| Class C | | | 2.39 | % | | | 07/31/2000 | | | | (17.33 | )% | | | (16.53 | )% | | | 11.41 | % | | | 11.41 | % | | | n/a | | | | n/a | | | | 8.78 | % | | | 8.78 | % |
| |
| Class I | | | 1.39 | % | | | 11/21/2000 | | | | (15.70 | )% | | | (15.70 | )% | | | 12.54 | % | | | 12.54 | % | | | n/a | | | | n/a | | | | 10.31 | % | | | 10.31 | % |
| |
Russell Mid Cap Value® Index* | | | | (17.09 | )% | | | (17.09 | )% | | | 12.99 | % | | | 12.99 | % | | | 8.44 | % | | | 8.44 | % | | | 8.74 | % | | | 8.74 | % |
| |
Performance data quoted represents past performance and is no guarantee of future results. Investment return and principal value will fluctuate so that shares, when redeemed, may be worth more or less than their original cost. Current performance may be lower or higher than performance data quoted. Performance data current to the most recent month end is available at www.quakerfunds.com or by calling us toll free at 800-220-8888. Total return includes reinvestment of dividends and capital gains.
Class A shares of the Fund have a maximum sales charge of 5.50%. Class B and Class C shares have maximum deferred sales charges of 5.00% and 1.00%, respectively.
The line graph and performance table do not reflect the deduction of taxes that a shareholder might pay on fund distributions or the redemption of fund shares. Total return calculations reflect expense reimbursements and fee waivers in the applicable periods. See financial highlights for periods where fees were waived or reimbursed.
The Fund’s portfolio holdings may differ significantly from the securities held in the index and, unlike a mutual fund, an unmanaged index assumes no transaction costs, taxes, management fees or other expenses. You cannot invest directly in an index.
The Russell Midcap Value® Index measures the performance of those Russell Midcap companies with lower price-to-book ratios and lower forecasted growth values. The stocks are also members of the Russell 1000 Value® Index.
2 0 0 8 A N N U A L R E P O R T ½ 11
Performance Update
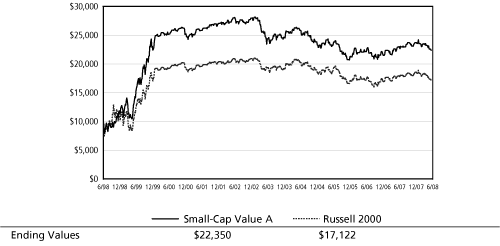
Quaker Small-Cap Value Fund (QUSVX, QSVBX, QSVCX, QSVIX)
Objectives and Principal Strategies
The Fund seeks to provide long-term growth of capital. Current income is not a significant investment consideration, and any such income realized will be considered incidental to the Fund’s investment objective. The Fund invests primarily in common stocks of U.S. companies with market capitalizations similar to the market capitalizations of companies included in the Russell 2000® Index and Russell 2500® Index. The Fund invests in companies considered by the Fund’s sub-adviser to have consistent earnings and above-average core assets, selling at relatively low market valuations, with attractive growth and momentum characteristics.
Performance Review and Market Outlook
The Fund had a disappointing year, particularly in absolute terms. For the year ended June 30, 2008, the Fund’s performance was –17.86%*, while the Fund’s benchmark, the Russell 2000® Index (a broad-based cross-section of the entire U.S. small-cap market) returned –16.19%. Working from the bottom up, we evaluate companies relative to their industry peers using three broad categories of attractiveness: value, management and momentum. Value to us means fairly traditional ratios of price to fundamental value, management measures seek evidence that company management has produced and will continue to produce earning power, and momentum helps us determine when stocks might be expected to begin the ascent toward full valuation.
The portfolio’s deeper-than-benchmark value orientation proved difficult for performance this year. On a positive note, performing well were holdings that exhibited favorable management traits—a solid record of return on assets—and positive momentum in the form of earnings estimate revision and relative strength, but not enough to offset the value drag. Examining the year’s results from a different viewpoint, our picks in health equipment stocks (including Dade Behring and Edwards Lifesciences), combined with the performance of our picks in the transportation sector (especially Excel Maritime Carriers), helped us overcome some disappointments in the energy and services sectors. Finally, our aggregate industry bets, though modest, added to performance, specifically, bets against real estate companies and banks.
AJO is disciplined and value-oriented, maintaining a fully invested, well-diversifiedportfolio of attractive small-cap stocks. The economic outlook—ours or anyone else’s—plays no role in the Fund’s structure; instead, our work seeks well-managed companies with quality cash profits, relatively low market valuations, and positive price and earnings momentum. As we search for opportunities, we keep a keen eye on minimizing transaction costs, enabling us to realize the profits from superior stock selection.
The Portfolio Management Team
Aronson+Johnson+Ortiz, LP
SUB-ADVISER: Aronson+Johnson+Ortiz, LP. TOTAL NET ASSETS: AS OF JUNE 30, 2008: $56,221,515 |
| | | | | | | | | |
| Top Ten Holdings** (% of net assets) |
| |
| Edwards Lifesciences Corp. | | | | | | | 1.07 | % |
| Mariner Energy, Inc. | | | | | | | 1.07 | % |
| Reliance Steel & Aluminum Co. | | | | | | | 1.06 | % |
| Cimarex Energy Co. | | | | | | | 1.05 | % |
| Ryder System, Inc. | | | | | | | 1.04 | % |
| BMC Software, Inc. | | | | | | | 1.03 | % |
| Credicorp Ltd. | | | | | | | 1.01 | % |
| Knight Capital Group, Inc. | | | | | | | 0.99 | % |
| Patterson-UTI Energy, Inc. | | | | | | | 0.97 | % |
| W&T Offshore, Inc. | | | | | | | 0.97 | % |
| |
| % Fund Total | | | | | | | 10.26 | % |
| |
| |
| ** | | Excludes Short-Term Investment |
| | * | | Performance shown is that of Class A and is not reflective of sales charges. See the Total Return Table on the next page for performance with sales charges. |
12 ½ 2 0 0 8 A N N U A L R E P O R T
Quaker Small-Cap Value Fund
Growth of a Hypothetical $10,000 Investment
June 30, 2008
Average Annualized Total Return
* The benchmark since inception returns are calculated since commencement of November 25, 1996 through June 30, 2008.
| | | | | | | | | | | | | | | | | | | | | | | | | | | | | | | | | | | | | | | | |
| | | | | | | | | | | | | | | | | | | | | | | | | | | | | | | | | | | Commencement |
| | | Expense | | Inception | | | | | | | | | | | | | | | | | | | | | | | | | | of operations |
| | | Ratio | | Date | | One Year | | Five Year | | Ten Year | | through 06/30/08 |
| | | | | | | | | | | | | |
| | | | | | | | | | | with | | without | | with | | without | | with | | without | | with | | without |
| | | | | | | | | | | sales | | sales | | sales | | sales | | sales | | sales | | sales | | sales |
| | | | | | | | | | | charge | | charge | | charge | | charge | | charge | | charge | | charge | | charge |
| |
| Class A | | | 1.82 | % | | | 11/25/1996 | | | | (22.38 | )% | | | (17.86 | )% | | | 9.98 | % | | | 11.23 | % | | | 7.76 | % | | | 8.37 | % | | | 10.63 | % | | | 11.17 | % |
| |
| Class B | | | 2.57 | % | | | 11/14/2000 | | | | (21.80 | )% | | | (18.53 | )% | | | 10.14 | % | | | 10.39 | % | | | n/a | | | | n/a | | | | 9.08 | % | | | 9.08 | % |
| |
| Class C | | | 2.57 | % | | | 07/28/2000 | | | | (19.14 | )% | | | (18.49 | )% | | | 10.44 | % | | | 10.44 | % | | | n/a | | | | n/a | | | | 9.99 | % | | | 9.99 | % |
| |
| Class I | | | 1.57 | % | | | 09/12/2000 | | | | (17.62 | )% | | | (17.62 | )% | | | 11.51 | % | | | 11.51 | % | | | n/a | | | | n/a | | | | 9.67 | % | | | 9.67 | % |
| |
Russell 2000 ® Index* | | | | | | | | | | | (16.19 | )% | | | (16.19 | )% | | | 10.28 | % | | | 10.28 | % | | | 5.52 | % | | | 5.52 | % | | | 7.31 | % | | | 7.31 | % |
| |
Performance data quoted represents past performance and is no guarantee of future results. Investment return and principal value will fluctuate so that shares, when redeemed, may be worth more or less than their original cost. Current performance may be lower or higher than performance data quoted. Performance data current to the most recent month end is available at www.quakerfunds.com or by calling us toll free at 800-220-8888. Total return includes reinvestment of dividends and capital gains.
Class A shares of the Fund have a maximum sales charge of 5.50%. Class B and Class C shares have maximum deferred sales charges of 5.00% and 1.00%, respectively.
The line graph and performance table do not reflect the deduction of taxes that a shareholder might pay on fund distributions or the redemption of fund shares. Total return calculations reflect expense reimbursements and fee waivers in the applicable periods. See financial highlights for periods where fees were waived or reimbursed.
The Fund’s portfolio holdings may differ significantly from the securities held in the index and, unlike a mutual fund, an unmanaged index assumes no transaction costs, taxes, management fees or other expenses. You cannot invest directly in an index.
The Russell 2000® Index is a widely recognized unmanaged index comprised of the smallest 2000 companies represented in the Russell 3000® Index. The Index currently represents approximately 8% of the market capitalization of the Russell 3000® Index.
2 0 0 8 A N N U A L R E P O R T ½ 13
Expense Information
Hypothetical Example For
Comparison Purposes
The second section of each table below provides information about hypothetical account values and hypothetical expenses based on the Fund’s actual expense ratio and an assumed rate of return of 5% per year before expenses, which is not the Fund’s actual return. The hypothetical account values and expenses may not be used to estimate the actual ending account balance or expenses you paid for the period. You may use this information to compare the ongoing costs of investing in the Fund to other funds. To do so, compare this 5% hypothetical example with the 5% hypothetical examples that appear in the shareholder reports of the other funds. Please note that the expenses shown in the table are meant to highlight your ongoing costs only and do not reflect any transactional costs, such as sales charges (loads), redemption fees or exchange fees. Therefore, the second section of the table is useful in comparing ongoing costs only, and will not help you determine the relative total costs of owning different funds. In addition, if these transactional costs were included, your costs would have been higher.
As a shareholder of the Fund, you incur two types of costs: (1) transaction costs, including applicable sales charges and redemption fees; and (2) ongoing costs, including management fees, distribution (12b-1) fees and other Fund expenses. This example is intended to help you understand your ongoing costs (in dollars) of investing in the Fund and to compare these costs with the ongoing costs of investing in other funds. The example is based on an investment of $1,000 invested at the beginning of the (six-month) period and held for the entire period January 1, 2008 through June 30, 2008.
Actual Expenses
The first section of each table below provides information about actual account values and actual expenses for each of the Funds. You may use this information, together with the amount you invested, to estimate the expenses that you paid over the period. Simply divide your account value by $1,000 (for example, an $8,600 account value divided by $1,000 = 8.6), then multiply the result by the number in the applicable line under the heading entitled “Expenses Paid During the Period” to estimate the expenses you paid on your account during this period.
| | | | | | | | | | | | | | | | | | | | | |
| | | | | | | Beginning Account | | Annualized Expense | | Ending Account | | Expenses Paid |
| | | | | | | Value 01/01/08 | | Ratio For the Period | | Value 06/30/08 | | During the Period* |
| Quaker Biotech Pharma-Healthcare Fund |
| Actual return based on actual return of: |
| Class A | | | 0.78 | % | | $ | 1,000.00 | | | | 2.77 | % | | $ | 1,007.80 | | | $ | 13.83 | |
| Class B | | | 0.36 | % | | | 1,000.00 | | | | 3.52 | % | | | 1,003.60 | | | | 17.54 | |
| Class C | | | 0.46 | % | | | 1,000.00 | | | | 3.53 | % | | | 1,004.60 | | | | 17.59 | |
| |
| Hypothetical return based on assumed 5% return |
| Class A | | | | | | | 1,000.00 | | | | 2.77 | % | | | 1,011.09 | | | | 13.85 | |
| Class B | | | | | | | 1,000.00 | | | | 3.52 | % | | | 1,007.36 | | | | 17.57 | |
| Class C | | | | | | | 1,000.00 | | | | 3.53 | % | | | 1,007.31 | | | | 17.62 | |
| |
| | | | | | | | | | | | | | | | | | | | | |
| Quaker Global Total Return Fund ** |
| Actual return based on actual return of: |
| Class A | | | 1.90 | % | | | 1,000.00 | | | | 2.01 | % | | | 1,019.00 | | | | 3.38 | |
| Class C | | | 1.70 | % | | | 1,000.00 | | | | 2.76 | % | | | 1,017.00 | | | | 4.64 | |
| |
| Hypothetical return based on assumed 5% return |
| Class A | | | | | | | 1,000.00 | | | | 2.01 | % | | | 1,004.98 | | | | 3.36 | |
| Class C | | | | | | | 1,000.00 | | | | 2.76 | % | | | 1,003.73 | | | | 4.61 | |
| |
14 ½ 2 0 0 8 A N N U A L R E P O R T
| | | | | | | | | | | | | | | | | | | | | |
| | | | | | | Beginning Account | | Annualized Expense | | Ending Account | | Expenses Paid |
| | | | | | | Value 01/01/08 | | Ratio For the Period | | Value 06/30/08 | | During the Period* |
| Quaker Strategic Growth Fund |
| Actual return based on actual return of: |
| Class A | | | 6.24 | % | | | $1,000.00 | | | | 1.78 | % | | | $1,062.40 | | | | $ 9.13 | |
| Class B | | | 5.86 | % | | | 1,000.00 | | | | 2.52 | % | | | 1,058.60 | | | | 12.90 | |
| Class C | | | 5.85 | % | | | 1,000.00 | | | | 2.53 | % | | | 1,058.50 | | | | 12.95 | |
| Class I | | | 6.38 | % | | | 1,000.00 | | | | 1.53 | % | | | 1,063.80 | | | | 7.85 | |
| |
| Hypothetical return based on assumed 5% return |
| Class A | | | | | | | 1,000.00 | | | | 1.78 | % | | | 1,016.01 | | | | 8.92 | |
| Class B | | | | | | | 1,000.00 | | | | 2.52 | % | | | 1,012.33 | | | | 12.61 | |
| Class C | | | | | | | 1,000.00 | | | | 2.53 | % | | | 1,012.28 | | | | 12.66 | |
| Class I | | | | | | | 1,000.00 | | | | 1.53 | % | | | 1,017.26 | | | | 7.67 | |
| |
| | | | | | | | | | | | | | | | | | | | | |
| Quaker Capital Opportunities Fund |
| Actual return based on actual return of: |
| Class A | | | (10.47 | )% | | | 1,000.00 | | | | 1.58 | % | | | 895.30 | | | | 7.45 | |
| Class B | | | (10.74 | )% | | | 1,000.00 | | | | 2.33 | % | | | 892.60 | | | | 10.96 | |
| Class C | | | (10.84 | )% | | | 1,000.00 | | | | 2.33 | % | | | 891.60 | | | | 10.96 | |
| |
| Hypothetical return based on assumed 5% return |
| Class A | | | | | | | 1,000.00 | | | | 1.58 | % | | | 1,017.01 | | | | 7.92 | |
| Class B | | | | | | | 1,000.00 | | | | 2.33 | % | | | 1,013.28 | | | | 11.66 | |
| Class C | | | | | | | 1,000.00 | | | | 2.33 | % | | | 1,013.28 | | | | 11.66 | |
| |
| | | | | | | | | | | | | | | | | | | | | |
| Quaker Mid-Cap Value Fund |
| Actual return based on actual return of: |
| Class A | | | (7.80 | )% | | | 1,000.00 | | | | 2.01 | % | | | 922.00 | | | | 9.61 | |
| Class B | | | (8.07 | )% | | | 1,000.00 | | | | 3.00 | % | | | 919.30 | | | | 14.32 | |
| Class C | | | (8.14 | )% | | | 1,000.00 | | | | 3.01 | % | | | 918.60 | | | | 14.36 | |
| Class I | | | (7.70 | )% | | | 1,000.00 | | | | 1.99 | % | | | 923.00 | | | | 9.51 | |
| |
| Hypothetical return based on assumed 5% return |
| Class A | | | | | | | 1,000.00 | | | | 2.01 | % | | | 1,014.87 | | | | 10.07 | |
| Class B | | | | | | | 1,000.00 | | | | 3.00 | % | | | 1,009.95 | | | | 14.99 | |
| Class C | | | | | | | 1,000.00 | | | | 3.01 | % | | | 1,009.90 | | | | 15.04 | |
| Class I | | | | | | | 1,000.00 | | | | 1.99 | % | | | 1,014.97 | | | | 9.97 | |
| |
| | | | | | | | | | | | | | | | | | | | | |
| Quaker Small-Cap Value Fund |
| Actual return based on actual return of: |
| Class A | | | (4.34 | )% | | | 1,000.00 | | | | 1.75 | % | | | 956.60 | | | | 8.51 | |
| Class B | | | (4.67 | )% | | | 1,000.00 | | | | 2.49 | % | | | 953.30 | | | | 12.09 | |
| Class C | | | (4.62 | )% | | | 1,000.00 | | | | 2.49 | % | | | 953.80 | | | | 12.10 | |
| Class I | | | (4.15 | )% | | | 1,000.00 | | | | 1.50 | % | | | 958.50 | | | | 7.30 | |
| |
| Hypothetical return based on assumed 5% return |
| Class A | | | | | | | 1,000.00 | | | | 1.75 | % | | | 1,016.16 | | | | 8.77 | |
| Class B | | | | | | | 1,000.00 | | | | 2.49 | % | | | 1,012.48 | | | | 12.46 | |
| Class C | | | | | | | 1,000.00 | | | | 2.49 | % | | | 1,012.48 | | | | 12.46 | |
| Class I | | | | | | | 1,000.00 | | | | 1.50 | % | | | 1,017.40 | | | | 7.52 | |
| |
| | | |
| * | | Expenses are equal to the Funds’ annualized six-month expense ratios (excluding reimbursements) multiplied by the average account value over the period multiplied by the number of days in the most recent fiscal half year (182) divided by 366 to reflect the one-half year period. |
| |
| ** | | Expenses for the Global Total Return Fund are equal to the fund’s annualized expense ratios since inception on 5/1/08 (excluding reimbursements) multiplied by the average account value over the period multiplied by the number of days since inception (61) divided by 366 to reflect the period since inception. |
2 0 0 8 A N N U A L R E P O R T ½ 15
Schedule of Investments and Securities Sold Short
Quaker Biotech Pharma-Healthcare Fund
June 30, 2008
| | | | | | | | | |
| | | Number | | Fair |
| | | of Shares | | Value |
| |
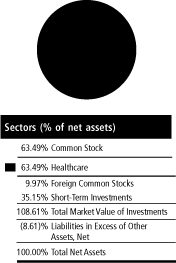
| Domestic Common Stocks — 63.49% |
| |
| Healthcare — 63.49% |
| Biotechnology — 47.95% |
| Alexion Pharmaceuticals, Inc.(a)(b) | | | 2,084 | | | $ | 151,090 | |
| Amgen, Inc.(a)(b) | | | 9,023 | | | | 425,525 | |
| Celgene Corp.(a) | | | 7,070 | | | | 451,561 | |
| Genzyme Corp.(a) | | | 6,052 | | | | 435,865 | |
| Gilead Sciences, Inc.(a) | | | 7,446 | | | | 394,266 | |
| Illumina, Inc.(a) | | | 1,900 | | | | 165,509 | |
| InterMune, Inc.(a)(b) | | | 9,423 | | | | 123,630 | |
| Momenta Pharmaceuticals, Inc.(a)(b) | | | 5,731 | | | | 70,491 | |
| Myriad Genetics, Inc.(a) | | | 3,000 | | | | 136,560 | |
| Onyx Pharmaceuticals, Inc.(a) | | | 6,233 | | | | 221,895 | |
| OSI Pharmaceuticals, Inc.(a) | | | 4,400 | | | | 181,808 | |
| Progenics Pharmaceuticals, Inc.(a) | | | 11,981 | | | | 190,138 | |
| Savient Pharmaceuticals, Inc.(a)(b) | | | 5,695 | | | | 144,084 | |
| Sequenom, Inc.(a) | | | 5,600 | | | | 89,376 | |
| | | | | | | |
| | | | | | | 3,181,798 | |
| |
| Healthcare-Products — 7.02% |
| Align Technology, Inc.(a)(b) | | | 10,441 | | | | 109,526 | |
| DexCom, Inc.(a) | | | 10,472 | | | | 63,251 | |
| Luminex Corp.(a)(b) | | | 6,673 | | | | 137,130 | |
| Varian Medical Systems, Inc.(a) | | | 3,011 | | | | 156,120 | |
| | | | | | | |
| | | | | | | 466,027 | |
| |
| Pharmaceuticals — 8.52% |
| Cardiome Pharma Corp.(a) | | | 10,115 | | | | 89,012 | |
| K-V Pharmaceutical Co.(a) | | | 6,575 | | | | 127,095 | |
| Schering-Plough Corp.(b) | | | 6,758 | | | | 133,065 | |
| The Medicines Co.(a)(b) | | | 3,643 | | | | 72,204 | |
| Wyeth | | | 3,000 | | | | 143,880 | |
| | | | | | | |
| | | | | | | 565,256 | |
| |
| Total Healthcare (Cost: $3,840,079) | | | | | | | 4,213,081 | |
| |
Total Domestic Common Stocks
(Cost $3,840,079) | | | | | | | 4,213,081 | |
| |
| |
| Foreign Common Stocks — 9.97% | | | | | | | | |
| |
| Denmark — 3.65% |
| Pharmaceuticals — 3.65% |
| Novo Nordisk A/S | | | 3,698 | | | | 242,033 | |
| |
| Total Denmark (Cost: $230,878) | | | | | | | 242,033 | |
| |
| Israel — 1.06% |
| Healthcare-Products — 1.06% |
| Given Imaging Ltd.(a)(b) | | | 4,761 | | | | 70,177 | |
| |
| Total Israel (Cost: $80,792) | | | | | | | 70,177 | |
| |
| | | | | | | | | |
| | | Par Value/ | | | | |
| | | Number | | Fair |
| | | of Shares | | Value |
| |
| Foreign Common Stocks (Continued) |
| |
| Switzerland — 5.26% |
| Biotechnology — 5.26% |
| Basilea Pharmaceutica AG(a) | | | 1,394 | | | $ | 227,035 | |
| Speedel Holding AG(a) | | | 1,910 | | | | 122,448 | |
| | | | | | | |
| | | | | | | 349,483 | |
| |
| Total Switzerland (Cost: $464,834) | | | | | | | 349,483 | |
| |
Total Foreign Common Stocks
(Cost $776,504) | | | | | | | 661,693 | |
| |
| |
| Short-Term Investments — 35.15% | | | | | | | | |
| |
| Investment Trust — 19.21% |
| Securities Lending Investment Fund, a series of the Brown Brothers Investment Trust, 2.58%(c)(d) | | | 1,274,714 | | | | 1,274,714 | |
| |
| Time Deposit — 15.94% |
| Wells Fargo-Grand Cayman 1.60%, 07/01/2008 | | $ | 1,058,138 | | | | 1,058,138 | |
| |
Total Short-Term Investments
(Cost $2,332,852) | | | | | | | 2,332,852 | |
| |
Total Investments
(Cost $6,949,435) — 108.61% | | | | | | | 7,207,626 | |
| |
Liabilities in Excess of Other Assets, Net (8.61)% | | | | | | | (571,625 | ) |
| |
Total Net Assets — 100.00% | | | | | | $ | 6,636,001 | |
| |
| |
| | | Number | | | | |
Schedule of Securities Sold Short | | of Shares | | | | |
| |
| Common Stocks — 10.44% |
| |
| Actelion, Ltd.(a) | | | 2,499 | | | $ | 133,792 | |
| Alnylam Pharmaceuticals, Inc.(a) | | | 4,500 | | | | 120,285 | |
| Genmab A/S(a) | | | 1,100 | | | | 42,036 | |
| GlaxoSmithKline PLC ADR | | | 3,000 | | | | 132,660 | |
| ImClone Systems, Inc.(a) | | | 3,200 | | | | 129,472 | |
| Pfizer, Inc. | | | 7,700 | | | | 134,519 | |
| |
Total Common Stocks (Proceeds: $723,713) | | | | | | | 692,764 | |
| |
Total Securities Sold Short (Proceeds: $723,713) | | | | | | $ | 692,764 | |
| |
ADR American Depositary Receipt
(a) Non-income producing security.
(b) All or a portion of the security out on loan.
(c) Represents investment of collateral received from securities lending transactions.
(d) The rate shown is the annualized seven-day yield at period end.
16 ½ 2 0 0 8 A N N U A L R E P O R T
Schedule of Investments
Quaker Global Total Return Fund
June 30, 2008
| | | | | | | | | |
| | | Number | | Fair |
| | | of Shares | | Value |
| |
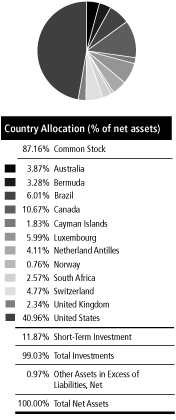
| Common Stocks — 87.16% |
| |
| Australia — 3.87% |
| BHP Billiton Ltd. ADR(a) | | | 18,670 | | | $ | 1,590,497 | |
| |
| Total Australia (Cost $1,596,387) | | | | | | | 1,590,497 | |
| |
| Bermuda — 3.28% |
| Bunge Ltd.(a) | | | 12,530 | | | | 1,349,356 | |
| | | | | | | |
| Total Bermuda (Cost $1,466,009) | | | | | | | 1,349,356 | |
| |
| Brazil — 6.01% |
| Banco Bradesco ADR | | | 18,700 | | | | 382,602 | |
| Compahnia Vale do Rio Doce ADR(a) | | | 5,100 | | | | 182,682 | |
| Petroleo Brasileiro SA ADR | | | 20,300 | | | | 1,437,849 | |
| Sadia SA ADR | | | 21,800 | | | | 465,212 | |
| | | | | | | |
| | | | | | | 2,468,345 | |
| |
| Total Brazil (Cost $2,495,404) | | | | | | | 2,468,345 | |
| |
| Canada — 10.67% |
| Canadian Natural Resources Ltd. | | | 12,150 | | | | 1,218,038 | |
| Potash Corp. of Saskatchewan | | | 8,850 | | | | 2,022,844 | |
| Suncor Energy, Inc. | | | 19,700 | | | | 1,144,964 | |
| | | | | | | |
| | | | | | | 4,385,846 | |
| |
| Total Canada (Cost $4,222,873) | | | | | | | 4,385,846 | |
| |
| Cayman Islands — 1.83% |
| Noble Corp. | | | 11,600 | | | | 753,536 | |
| |
| Total Cayman Islands (Cost $757,348) | | | | | | | 753,536 | |
| |
| Luxembourg — 5.99% |
| ArcelorMittal(a) | | | 16,000 | | | | 1,585,120 | |
| Tenaris SA ADR | | | 11,800 | | | | 879,100 | |
| | | | | | | |
| | | | | | | 2,464,220 | |
| | | | | | | |
| |
| Total Luxembourg (Cost $2,308,011) | | | | | | | 2,464,220 | |
| |
| Netherland Antilles — 4.11% |
| Schlumberger Ltd. | | | 15,730 | | | | 1,689,874 | |
| |
| Total Netherland Antilles (Cost $1,617,627) | | | | | | | 1,689,874 | |
| |
| Norway — 0.76% |
| Norsk Hydro ASA ADR(a) | | | 21,500 | | | | 314,051 | |
| |
| Total Norway (Cost $333,689) | | | | | | | 314,051 | |
| |
| South Africa — 2.57% |
| Sasol Ltd. ADR | | | 17,900 | | | | 1,055,026 | |
| |
| Total South Africa (Cost $1,104,245) | | | | | | | 1,055,026 | |
| |
| Switzerland — 4.77% |
| ABB Ltd. ADR(b) | | | 40,000 | | | | 1,132,800 | |
| Syngenta AG ADR | | | 12,800 | | | | 828,160 | |
| | | | | | | |
| | | | | | | 1,960,960 | |
| |
| Total Switzerland (Cost $2,090,888) | | | | | | | 1,960,960 | |
| |
| | | | | | | | | |
| | | Number | | Fair |
| | | of Shares | | Value |
| |
| Common Stocks (Continued) |
| |
| United Kingdom — 2.34% |
| Rio Tinto PLC ADR | | | 1,940 | | | $ | 960,300 | |
| |
| Total United Kingdom (Cost $957,389) | | | | | | | 960,300 | |
| |
| United States — 40.96% |
| Alcoa, Inc. | | | 32,400 | | | | 1,154,088 | |
| Amazon.com, Inc.(b) | | | 3,900 | | | | 285,987 | |
| American Ecology Corp. | | | 7,500 | | | | 221,475 | |
| Apache Corp. | | | 5,660 | | | | 786,740 | |
| Chesapeake Energy Corp. | | | 17,800 | | | | 1,174,088 | |
| Freeport-McMoRan Copper & Gold, Inc. | | | 14,670 | | | | 1,719,177 | |
| KBR, Inc. | | | 32,100 | | | | 1,120,611 | |
| McDermott International, Inc.(b) | | | 18,200 | | | | 1,126,398 | |
| Monsanto Co. | | | 12,000 | | | | 1,517,280 | |
| Nucor Corp. | | | 13,300 | | | | 993,111 | |
| Plains Exploration & Production Co.(b) | | | 10,300 | | | | 751,591 | |
| Pride International, Inc.(b) | | | 16,000 | | | | 756,640 | |
| Star Bulk Carriers Corp. | | | 36,100 | | | | 425,619 | |
| Ultra Petroleum Corp.(b) | | | 6,100 | | | | 599,020 | |
| United States Steel Corp. | | | 8,400 | | | | 1,552,152 | |
| Visa, Inc.(b) | | | 3,700 | | | | 300,847 | |
| Williams Cos., Inc. | | | 24,100 | | | | 971,471 | |
| XTO Energy, Inc. | | | 20,200 | | | | 1,383,902 | |
| | | | | | | |
| | | | | | | 16,840,197 | |
| |
| Total United States (Cost $16,557,071) | | | | | | | 16,840,197 | |
| |
Total Common Stocks (Cost $35,506,941) | | | | | | | 35,832,208 | |
| |
| | | | | | | | | |
| Short-Term Investment — 11.87% |
| |
| Investment Trust — 11.87% |
| Securities Lending Investment Fund, a series of the Brown Brothers Investment Trust, 2.58%(c)(d) | | | 4,879,789 | | | | 4,879,789 | |
| |
Total Short-Term Investment
(Cost $4,879,789) | | | | | | | 4,879,789 | |
| |
Total Investments
(Cost $40,386,730) — 99.03% | | | | | | | 40,711,997 | |
| |
Other Assets in Excess of Liabilities, Net — 0.97 % | | | | | | | 399,033 | |
| |
Total Net Assets — 100.00% | | | | | | $ | 41,111,030 | |
| |
| | | |
| ADR | | American Depositary Receipt |
| |
| (a) | | All or portion of the security out on loan. |
| |
| (b) | | Non-income producing security. |
| |
| (c) | | Represents investment collateral received from securities lending transactions. |
| |
| (d) | | The rate shown is the annualized seven-day yield at period end. |
The accompanying notes are an integral part of the financial statements.
2 0 0 8 A N N U A L R E P O R T ½ 17
Schedule of Investments
Quaker Strategic Growth Fund
June 30, 2008
| | | | | | | | | |
| | | Number | | Fair |
| | | of Shares | | Value |
| |
| Common Stocks — 78.20% |
| |
| Basic Materials — 34.04% |
| Chemicals — 11.71% |
| Monsanto Co. | | | 504,990 | | | $ | 63,850,936 | |
| Potash Corp. of Saskatchewan | | | 344,700 | | | | 78,788,079 | |
| The Mosaic Co.(a) | | | 301,573 | | | | 43,637,613 | |
| | | | | | | |
| | | | | | | 186,276,628 | |
| |
| Iron & Steel Production — 7.75% |
| Nucor Corp. | | | 666,800 | | | | 49,789,956 | |
| United States Steel Corp.(b) | | | 397,480 | | | | 73,446,354 | |
| | | | | | | |
| | | | | | | 123,236,310 | |
| |
| Mining — 14.58% |
| Alcoa, Inc. | | | 1,290,700 | | | | 45,974,734 | |
| BHP Billiton Ltd. ADR(b) | | | 786,320 | | | | 66,986,601 | |
| Compahnia Vale do Rio Doce ADR(b) | | | 207,200 | | | | 7,421,904 | |
| Freeport-McMoRan Copper & Gold, Inc. | | | 625,020 | | | | 73,246,094 | |
| Rio Tinto PLC ADR | | | 77,410 | | | | 38,317,950 | |
| | |
| | | | | | | 231,947,283 | |
| |
| Total Basic Materials (Cost: $449,048,105) | | | | | | | 541,460,221 | |
| |
| Communications — 0.71% |
| Internet — 0.71% |
| Amazon.com, Inc.(a)(b) | | | 155,400 | | | | 11,395,482 | |
| |
| Total Communications (Cost: $12,588,419) | | | | | | | 11,395,482 | |
| |
| Consumer, Non-Cyclical — 4.20% |
| Agricultural Products — 3.45% |
| Bunge Ltd.(b) | | | 509,700 | | | | 54,889,593 | |
| |
| Commerical Services — 0.75% |
| Visa, Inc.(a) | | | 146,100 | | | | 11,879,391 | |
| |
| Total Consumer, Non-Cyclical (Cost: $65,063,922) | | | | | | | 66,768,984 | |
| |
| Diversified — 0.57% |
| Holding Companies-Divers — 0.57% |
| Star Bulk Carriers Corp.(b) | | | 774,400 | | | | 9,130,176 | |
| |
| Total Diversified (Cost: $9,361,861) | | | | | | | 9,130,176 | |
| |
| Energy — 29.29% |
| Gas — 2.60% |
| Williams Cos., Inc. | | | 1,025,800 | | | | 41,349,998 | |
| |
| Oil & Gas — 22.44% |
| Apache Corp. | | | 225,320 | | | | 31,319,480 | |
| Canadian Natural Resources Ltd. | | | 501,730 | | | | 50,298,432 | |
| Chesapeake Energy Corp.(b) | | | 732,700 | | | | 48,328,892 | |
| Noble Corp. | | | 495,800 | | | | 32,207,168 | |
| Occidental Petroleum Corp. | | | 563,500 | | | | 50,636,110 | |
| Petroleo Brasileiro SA ADR(b) | | | 845,720 | | | | 59,902,348 | |
| Ultra Petroleum Corp.(a) | | | 252,530 | | | | 24,798,446 | |
| XTO Energy, Inc. | | | 867,990 | | | | 59,465,995 | |
| | |
| | | | | | | 356,956,871 | |
| |
| Oil & Gas Services — 4.25% |
| Schlumberger Ltd. | | | 629,150 | | | $ | 67,589,584 | |
| |
| Total Energy (Cost: $386,363,740) | | | | | | | 465,896,453 | |
| |
| | | | | | | | | |
| | | Par Value/ | | | | |
| | | Number | | Fair |
| | | of Shares | | Value |
| |
| Common Stocks (Continued) |
| |
| Industrial — 9.39% |
| Engineering — 2.58% |
| McDermott International, Inc.(a) | | | 664,300 | | | $ | 41,113,527 | |
| |
| Engineering & Construction — 5.56% |
| ABB Ltd. ADR(a) | | | 1,375,442 | | | | 38,952,517 | |
| KBR, Inc. | | | 1,416,974 | | | | 49,466,562 | |
| | |
| | | | | | | 88,419,079 | |
| |
| Environmental Control — 0.43% |
| American Ecology Corp. | | | 229,169 | | | | 6,767,361 | |
| |
| Metal Fabricate & Hardware — 0.82% |
| Norsk Hydro ASA ADR(b) | | | 896,400 | | | | 13,093,715 | |
| |
| Total Industrial (Cost: $123,801,822) | | | | | | | 149,393,682 | |
| |
Total Common Stocks
(Cost $1,046,227,869) | | | | | | | 1,244,044,998 | |
| |
| |
| Warrant — 0.00% | | | | | | | | |
Waste Management Services, Inc.
Warrants Expiration: April, 2009 (a)(c) | | | 50,000 | | | | 0 | |
| |
Total Warrants (Cost $0) | | | | | | | 0 | |
| |
| |
| Short-Term Investments — 31.34% | | | | | | | | |
| |
| Investment Trust — 14.66% |
Securities Lending Investment Fund,
a series of the Brown Brothers Investment Trust, 2.58%(d)(e) | | | 233,181,130 | | | | 233,181,130 | |
| |
| Time Deposit — 16.68% |
| Wells Fargo-Grand Cayman 1.60%, 07/01/2008 | | $ | 265,294,905 | | | | 265,294,905 | |
| |
Total Short-Term Investments
(Cost $498,476,035) | | | | | | | 498,476,035 | |
| |
Total Investments
(Cost $1,544,703,904) — 109 ..54% | | | | | | | 1,742,521,033 | |
| |
Liabilities in Excess of Other Assets, Net (9.54%) | | | | | | | (151,747,897 | ) |
| |
Total Net Assets — 100.00% | | | | | | $ | 1,590,773,136 | |
| |
| | | |
| ADR | | American Depositary Receipt |
| |
| (a) | | Non-income producing security. |
| |
| (b) | | All or a portion of the security out on loan. |
| |
| (c) | | Restricted security. |
| |
| | | Waste Management Services, Inc. warrants were acquired on November 17, 2006 at a cost of $0. Since market quotations are not readily available for these securities, they were valued at fair value as determined by the Adviser using procedures approved by the Board of Trustees. The total fair value of such securities at June 30, 2008 is $0, which represents 0.00% of total net assets. |
| |
| (d) | | Represents investment collateral received from securities being lending transactions. |
| |
| (e) | | The rate shown is the annualized seven-day yield at period end. |
18 ½ 2 0 0 8 A N N U A L R E P O R T
Schedule of Investments
Quaker Capital Opportunities Fund
June 30, 2008
| | | | | | | | | |
| | | Number | | Fair |
| | | of Shares | | Value |
| |
| Common Stocks — 81.18% |
| |
| Basic Materials — 1.72% |
| Chemicals — 1.72% |
| Air Products & Chemicals, Inc. | | | 2,200 | | | $ | 217,492 | |
| |
| Total Basic Materials (Cost: $170,597) | | | | | | | 217,492 | |
| |
| Communications — 5.95% |
| Advertising — 2.20% |
| Omnicom Group, Inc. | | | 6,200 | | | | 278,256 | |
| |
| Telecommunications — 3.75% |
| AT&T, Inc. | | | 14,100 | | | | 475,029 | |
| |
| Total Communications (Cost: $836,452) | | | | | | | 753,285 | |
| |
| Consumer, Cyclical — 7.35% |
| Retail — 7.35% |
| CVS Caremark Corp. | | | 12,800 | | | | 506,496 | |
| Walgreen Co. | | | 13,000 | | | | 422,630 | |
| | | | | | | |
| | | | | | | 929,126 | |
| |
| Total Consumer, Cyclical (Cost: $919,157) | | | | | | | 929,126 | |
| |
| Consumer, Non-cyclical — 12.09% |
| Cosmetics & Toiletries — 3.77% |
| Colgate-Palmolive Co. | | | 6,900 | | | | 476,790 | |
| |
| Food & Beverages — 8.32% |
| Diageo PLC ADR | | | 7,100 | | | | 524,477 | |
| PepsiCo, Inc. | | | 8,300 | | | | 527,797 | |
| | | | | | | |
| | | | | | | 1,052,274 | |
| |
| Total Consumer, Non-Cyclical (Cost: $1,346,540) | | | | | | | 1,529,064 | |
| |
| Energy — 11.80% |
| Oil & Gas — 9.37% |
| ConocoPhillips(a) | | | 5,300 | | | | 500,267 | |
| Exxon Mobil Corp. | | | 3,900 | | | | 343,707 | |
| Total SA ADR | | | 4,000 | | | | 341,080 | |
| | | | | | | |
| | | | | | | 1,185,054 | |
| |
| Oil & Gas Services — 2.43% |
| Weatherford International Ltd.(b) | | | 6,200 | | | | 307,458 | |
| |
| Total Energy (Cost: $1,310,468) | | | | | | | 1,492,512 | |
| |
| Healthcare — 8.64% |
| Biotechnology — 4.44% |
| Genentech, Inc.(b) | | | 7,400 | | | | 561,660 | |
| |
| Pharmaceuticals — 4.20% |
| Teva Pharmaceutical Industries Ltd. ADR(a) | | | 11,600 | | | | 531,280 | |
| |
| Total Healthcare (Cost: $992,672) | | | | | | | 1,092,940 | |
| |
| | | | | | | | | |
| | | Number | | Fair |
| | | of Shares | | Value |
| |
| Common Stocks (Continued) |
| |
| Industrial — 12.21% |
| Aerospace & Defense — 7.48% |
| General Dynamics Corp. | | | 6,700 | | | $ | 564,140 | |
| L-3 Communication Holdings, Inc. | | | 4,200 | | | | 381,654 | |
| | | | | | | |
| | | | | | | 945,794 | |
| |
| Miscellaneous Manufacturing — 4.73% |
| Textron, Inc. | | | 12,500 | | | | 599,125 | |
| |
| Total Industrial (Cost: $1,493,390) | | | | | | | 1,544,919 | |
| |
| Technology — 21.42% |
| Computer Services — 7.53% |
| Automatic Data Processing, Inc. | | | 10,700 | | | | 448,330 | |
| Oracle Corp.(b) | | | 24,000 | | | | 504,000 | |
| | | | | | | |
| | | | | | | 952,330 | |
| |
| Computer Software & Services — 4.28% |
| Microsoft Corp. | | | 19,700 | | | | 541,947 | |
| |
| Computers — 7.07% |
| Hewlett-Packard Co. | | | 10,500 | | | | 464,205 | |
| International Business Machines Corp. | | | 3,630 | | | | 430,264 | |
| | | | | | | |
| | | | | | | 894,469 | |
| |
| Software — 2.54% |
| Autodesk, Inc.(b) | | | 9,500 | | | | 321,195 | |
| |
| Total Technology (Cost: $2,745,084) | | | | | | | 2,709,941 | |
| |
Total Common Stocks (Cost $9,814,360) | | | | | | | 10,269,279 | |
| |
| | | | | | | | | |
| Exchange-Traded Fund — 4.23% |
| |
| SPDR Gold Trust(a)(b) | | | 5,845 | | | | 534,233 | |
| |
Total Exchange — Traded Fund (Cost $534,237) | | | | | | | 534,233 | |
| |
The accompanying notes are an integral part of the financial statements.
2 0 0 8 A N N U A L R E P O R T ½ 19
Schedule of Investments
Quaker Capital Opportunities Fund
June 30, 2008
| | | | | | | | | |
| | | Par Value/ | | | | |
| | | Number | | Fair |
| | | of Shares | | Value |
| |
| Short-Term Investments — 20.44% |
| |
| Investment Trust — 9.67% |
Securities Lending Investment Fund, a series of
the Brown Brothers Investment Trust, 2.58%(c)(d) | | | 1,223,814 | | | $ | 1,223,814 | |
| |
| Time Deposit — 10.77% |
| Bank of America (London) 1.6%, 07/01/2008 | | $ | 1,361,957 | | | | 1,361,957 | |
| |
Total Short-Term Investments (Cost $2,585,771) | | | | | | | 2,585,771 | |
| |
Total Investments (Cost $12,934,368) — 105.85% | | | | | | | 13,389,283 | |
| |
Liabilities in Excess of Other Assets, Net (5.85%) | | | | | | | (739,619 | ) |
| |
Total Net Assets — 100.00% | | | | | | $ | 12,649,664 | |
| |
| | |
| ADR | | American Depositary Receipt |
| |
| (a) | | All or a portion of the security out on loan. |
| |
| (b) | | Non-income producing security. |
| |
| (c) | | Represents investment of collateral received from securities lending transactions. |
| |
| (d) | | The rate shown is the annualized seven-day yield at period end. |
20 ½ 2 0 0 8 A N N U A L R E P O R T
Schedule of Investments
Quaker Mid-Cap Value Fund
June 30, 2008
| | | | | | | | | |
| | | Number | | Fair |
| | | of Shares | | Value |
| |
| Common Stocks — 98.22% |
| |
| Basic Materials — 7.40% |
| Chemicals — 1.44% |
| OM Group, Inc.(a)(b) | | | 10,500 | | | $ | 344,295 | |
| |
| Iron & Steel Production — 3.27% |
| Steel Dynamics, Inc. | | | 20,000 | | | | 781,400 | |
| |
| Mining — 2.69% |
| Cameco Corp.(b) | | | 15,000 | | | | 643,050 | |
| |
| Total Basic Materials (Cost: $1,614,830) | | | | | | | 1,768,745 | |
| |
| Communications — 2.91% |
| Internet — 2.91% |
| Akamai Technologies, Inc.(a) | | | 20,000 | | | | 695,800 | |
| |
| Total Communications (Cost: $552,230) | | | | | | | 695,800 | |
| |
| Consumer, Cyclical — 13.07% |
| Apparel — 6.00% |
| Gymboree Corp.(a) | | | 18,000 | | | | 721,260 | |
| VF Corp. | | | 10,000 | | | | 711,800 | |
| | | | | | | |
| | | | | | | 1,433,060 | |
| |
| Auto Parts & Equipment — 2.64% |
| Johnson Controls, Inc. | | | 22,000 | | | | 630,960 | |
| |
| Leisure Time — 2.53% |
| Polaris Industries, Inc.(b) | | | 15,000 | | | | 605,700 | |
| |
| Retail — 1.90% |
| Nordstrom, Inc. | | | 15,000 | | | | 454,500 | |
| |
| Total Consumer, Cyclical (Cost: $3,364,874) | | | | | | | 3,124,220 | |
| |
| Consumer, Non-cyclical — 3.16% |
| Agricultural Products — 3.16% |
| Bunge Ltd.(b) | | | 7,000 | | | | 753,830 | |
| |
| Total Consumer, Non-Cyclical (Cost: $655,451) | | | | | | | 753,830 | |
| |
| Energy — 7.88% |
| Oil & Gas — 7.88% |
| Holly Corp. | | | 15,000 | | | | 553,800 | |
| National Oilwell Varco, Inc.(a) | | | 4,000 | | | | 354,880 | |
| Noble Corp. | | | 15,000 | | | | 974,400 | |
| | | | | | | |
| | | | | | | | 1,883,080 | |
| |
| Total Energy (Cost: $1,699,113) | | | | | | | 1,883,080 | |
| |
| | | | | | | | | |
| | | Number | | Fair |
| | | of Shares | | Value |
| |
| Common Stocks (Continued) |
| |
| Financial — 13.88% |
| Insurance — 13.88% |
| American Financial Group, Inc. | | | 30,000 | | | $ | 802,500 | |
| Assurant, Inc. | | | 5,000 | | | | 329,800 | |
| Cigna Corp. | | | 14,000 | | | | 495,460 | |
| Philadelphia Consolidated Holding Corp.(a) | | | 15,000 | | | | 509,550 | |
| Reinsurance Group of America, Inc. | | | 16,000 | | | | 696,320 | |
| W.R. Berkley Corp. | | | 20,000 | | | | 483,200 | |
| | | | | | | |
| | | | | | | 3,316,830 | |
| |
| Total Financial (Cost: $4,112,801) | | | | | | | 3,316,830 | |
| |
| Healthcare — 10.30% |
| Healthcare-Products — 2.09% |
| Kinetic Concepts, Inc.(a)(b) | | | 12,500 | | | | 498,875 | |
| |
| Pharmaceuticals — 8.21% |
| Endo Pharmaceuticals Holdings, Inc.(a) | | | 30,000 | | | | 725,700 | |
| Forest Laboratories, Inc.(a) | | | 20,000 | | | | 694,800 | |
| Herbalife Ltd. | | | 14,000 | | | | 542,500 | |
| | | | | | | |
| | | | | | | 1,963,000 | |
| |
| Total Healthcare (Cost: $2,584,735) | | | | | | | 2,461,875 | |
| |
| Industrial — 24.67% |
| Electrical Components & Equipment — 5.10% |
| Ametek, Inc. | | | 12,500 | | | | 590,250 | |
| Amphenol Corp. | | | 14,000 | | | | 628,320 | |
| | | | | | | |
| | | | | | | 1,218,570 | |
| |
| Hand & Machine Tools — 2.63% |
| Lincoln Electric Holdings, Inc. | | | 8,000 | | | | 629,600 | |
| |
| Machinery-Diversified — 2.74% |
| Cummins, Inc. | | | 10,000 | | | | 655,200 | |
| |
| Metal Fabricate & Hardware — 3.23% |
| Precision Castparts Corp. | | | 8,000 | | | | 770,960 | |
| |
| Miscellaneous Manufacturing — 5.51% |
| Parker Hannifin Corp. | | | 12,000 | | | | 855,840 | |
| SPX Corp. | | | 3,500 | | | | 461,055 | |
| | | | | | | |
| | | | | | | 1,316,895 | |
| |
| Transportation — 5.46% |
| CSX Corp. | | | 8,000 | | | | 502,480 | |
| DryShips, Inc.(b) | | | 10,000 | | | | 801,800 | |
| | | | | | | | |
| | | | | | | 1,304,280 | |
| |
| Total Industrial (Cost: $4,943,198) | | | | | | | 5,895,505 | |
| |
The accompanying notes are an integral part of the financial statements.
2 0 0 8 A N N U A L R E P O R T ½ 21
Schedule of Investments
Quaker Mid-Cap Value Fund
June 30, 2008
| | | | | | | | | |
| | | Number | | Fair |
| | | of Shares | | Value |
| |
| Common Stocks (Continued) |
| |
| Technology — 14.95% |
| Computers — 4.96% |
| Computer Sciences Corp.(a) | | | 10,000 | | | $ | 468,400 | |
| Seagate Technology | | | 37,500 | | | | 717,375 | |
| | | | | | | |
| | | | | | | 1,185,775 | |
| |
| Electrical Components & Equipment — 4.33% |
| Altera Corp.(b) | | | 50,000 | | | | 1,035,000 | |
| |
| Semiconductors — 1.72% |
| National Semiconductor Corp. | | | 20,000 | | | | 410,800 | |
| |
| Software — 3.94% |
| SEI Investments Co. | | | 40,000 | | | | 940,800 | |
| |
| Total Technology (Cost: $3,937,253) | | | | | | | 3,572,375 | |
| |
Total Common Stocks (Cost $23,464,485) | | | | | | | 23,472,260 | |
| |
| | | | | | | | | |
| | | Par Value/ | | | | |
| | | Number | | Fair |
| | | of Shares | | Value |
| |
| Short-Term Investments — 22.98% |
| |
| Investment Trust — 18.79% |
Securities Lending Investment Fund, a series of
the Brown Brothers Investment Trust, 2.58%(c)(d) | | | 4,489,876 | | | $ | 4,489,876 | |
| |
| Time Deposit — 4.19% |
| Bank of America (London) 1.60%, 07/01/2008 | | $ | 1,002,769 | | | | 1,002,769 | |
| |
Total Short Term Investments (Cost $5,492,645) | | | | | | | 5,492,645 | |
| |
Total Investments (Cost $28,957,130) — 121.20% | | | | | | | 28,964,905 | |
| |
Liabilities in Excess of Other Assets, Net (21.20%) | | | | | | | (5,066,901 | ) |
| |
Total Net Assets — 100.00% | | | | | | $ | 23,898,004 | |
| |
(a) Non-income producing security.
(b) All or a portion of security out on loan.
(c) Represents investment of collateral received from securities lending transactions.
(d) The rate shown is the annualized seven-day yield at period end.
22 ½ 2 0 0 8 A N N U A L R E P O R T
Schedule of Investments
Quaker Small-Cap Value Fund
June 30, 2008
| | | | | | | | | |
| | | Number | | Fair |
| | | of Shares | | Value |
| |
| Common Stocks — 98.62% |
| |
| Basic Materials — 4.95% |
| Chemicals — 3.12% |
| Chemtura Corp. | | | 27,100 | | | $ | 158,264 | |
| Ferro Corp. | | | 21,400 | | | | 401,464 | |
| Innospec, Inc. | | | 17,200 | | | | 323,704 | |
| Minerals Technologies, Inc. | | | 6,600 | | | | 419,694 | |
| Schulman A, Inc. | | | 19,600 | | | | 451,388 | |
| | | | | | | |
| | | | | | | 1,754,514 | |
| |
| Iron & Steel Production — 1.83% |
| Reliance Steel & Aluminum Co. | | | 7,700 | | | | 593,593 | |
| Schnitzer Steel Industries, Inc. | | | 3,800 | | | | 435,480 | |
| | | | | | | |
| | | | | | | 1,029,073 | |
| |
| Total Basic Materials (Cost: $2,582,080) | | | | | | | 2,783,587 | |
| |
| Communications — 5.51% |
| Internet — 3.01% |
| Check Point Software Technologies(a) | | | 19,900 | | | | 471,033 | |
| j2 Global Communications, Inc.(a)(b) | | | 11,800 | | | | 271,400 | |
| NetFlix, Inc.(a)(b) | | | 14,300 | | | | 372,801 | |
| S1 Corp.(a) | | | 38,100 | | | | 288,417 | |
| Stamps.com, Inc.(a) | | | 23,100 | | | | 288,288 | |
| | | | | | | |
| | | | | | | 1,691,939 | |
| |
| Internet Software & Services — 0.81% |
| Earthlink, Inc.(a) | | | 52,800 | | | | 456,720 | |
| |
| Media — 0.18% |
| Westwood One, Inc.(a) | | | 79,100 | | | | 98,084 | |
| |
| Telecommunications — 1.51% |
| Premiere Global Services, Inc.(a) | | | 30,400 | | | | 443,232 | |
| USA Mobility, Inc. | | | 23,700 | | | | 178,935 | |
| Utstarcom, Inc.(a) | | | 41,500 | | | | 227,005 | |
| | | | | | | |
| | | | | | | 849,172 | |
| |
| Total Communications (Cost: $3,991,918) | | | | | | | 3,095,915 | |
| |
| Consumer, Cyclical — 14.17% |
| Airlines — 0.20% |
| Pinnacle Airlines Corp.(a) | | | 36,300 | | | | 114,708 | |
| |
| Apparel — 0.87% |
| Gymboree Corp.(a) | | | 6,200 | | | | 248,434 | |
| Warnaco Group, Inc.(a) | | | 5,400 | | | | 237,978 | |
| | | | | | | |
| | | | | | | 486,412 | |
| |
| Auto Parts & Equipment — 0.92% |
| Autoliv, Inc. | | | 8,000 | | | | 372,960 | |
| Lear Corp.(a)(b) | | | 10,300 | | | | 146,054 | |
| | | | | | | |
| | | | | | | 519,014 | |
| |
| | | | | | | | | |
| | | Number | | Fair |
| | | of Shares | | Value |
| |
| Common Stocks (Continued) |
| |
| Distribution & Wholesale — 2.43% |
| Houston Wire & Cable Co.(b) | | | 19,500 | | | $ | 388,050 | |
| Owens & Minor, Inc.(b) | | | 11,800 | | | | 539,142 | |
| WESCO International, Inc.(a) | | | 10,900 | | | | 436,436 | |
| | | | | | | |
| | | | | | | 1,363,628 | |
| |
| Entertainment — 0.48% |
| Lions Gate Entertainment Corp.(a) | | | 26,200 | | | | 271,432 | |
| |
| Home Builders — 0.53% | | | | | | | | |
| NVR, Inc.(a) | | | 600 | | | | 300,048 | |
| |
| Leisure Time — 0.76% |
| Polaris Industries, Inc.(b) | | | 10,500 | | | | 423,990 | |
| |
| Retail — 6.63% |
| Aeropostale, Inc.(a) | | | 16,500 | | | | 516,945 | |
| AnnTaylor Stores Corp.(a) | | | 14,900 | | | | 357,004 | |
| Big Lots, Inc.(a) | | | 6,900 | | | | 215,556 | |
| BJ’s Wholesale Club, Inc.(a)(b) | | | 6,100 | | | | 236,070 | |
| Bob Evans Farms, Inc. | | | 7,700 | | | | 220,220 | |
| Build-A-Bear Workshop, Inc.(a)(b) | | | 27,000 | | | | 196,290 | |
| Cash America International, Inc. | | | 10,200 | | | | 316,200 | |
| CEC Entertainment, Inc.(a) | | | 11,600 | | | | 324,916 | |
| CKE Restaurants, Inc. | | | 20,000 | | | | 249,400 | |
| Ezcorp, Inc.(a) | | | 32,100 | | | | 409,275 | |
| Hot Topic, Inc.(a) | | | 45,900 | | | | 248,319 | |
| Panera Bread Co.(a)(b) | | | 9,400 | | | | 434,844 | |
| | | | | | | |
| | | | | | | 3,725,039 | |
| |
| Toys & Hobbies — 1.35% |
| Hasbro, Inc. | | | 15,100 | | | | 539,372 | |
| Marvel Entertainment, Inc.(a) | | | 6,900 | | | | 221,766 | |
| | | | | | | |
| | | | | | | 761,138 | |
| |
| Total Consumer, Cyclical (Cost: $8,747,794) | | | | | | | 7,965,409 | |
| |
| Consumer, Non-cyclical — 9.99% |
| Commerical Services — 8.01% |
| AMN Healthcare Services, Inc.(a) | | | 24,700 | | | | 417,924 | |
| Bowne & Co, Inc. | | | 26,100 | | | | 332,775 | |
| Consolidated Graphics, Inc.(a) | | | 4,800 | | | | 236,496 | |
| Corporate Executive Board Co. | | | 10,100 | | | | 424,705 | |
| Cross Country Healthcare, Inc.(a) | | | 30,100 | | | | 433,741 | |
| Hewitt Associates, Inc.(a) | | | 13,800 | | | | 528,954 | |
| MAXIMUS, Inc. | | | 13,600 | | | | 473,552 | |
| Mcgrath Rentcorp | | | 11,100 | | | | 272,949 | |
| Navigant Consulting, Inc.(a) | | | 13,000 | | | | 254,280 | |
| Rent-A-Center, Inc.(a) | | | 11,000 | | | | 226,270 | |
| Robert Half International, Inc. | | | 16,700 | | | | 400,299 | |
| TNS, Inc.(a) | | | 21,000 | | | | 503,160 | |
| | | | | | | |
| | | | | | | 4,505,105 | |
| |
The accompanying notes are an integral part of the financial statements.
2 0 0 8 A N N U A L R E P O R T ½ 23
Schedule of Investments
Quaker Small-Cap Value Fund
June 30, 2008
| | | | | | | | | |
| | | Number | | Fair |
| | | of Shares | | Value |
| |
| Common Stocks (Continued) |
| |
| Food — 1.38% |
| Diamond Foods, Inc. | | | 16,800 | | | $ | 387,072 | |
| Nash Finch Co. | | | 11,400 | | | | 390,678 | |
| | | | | | | |
| | | | | | | 777,750 | |
| |
| Household Products — 0.60% |
| Ennis, Inc. | | | 21,500 | | | | 336,475 | |
| |
Total Consumer, Non-Cyclical
(Cost: $5,850,481) | | | | | | | 5,619,330 | |
| |
| Energy — 10.20% |
| Oil & Gas — 7.81% |
| Bois d’Arc Energy, Inc.(a) | | | 17,300 | | | | 420,563 | |
| Cimarex Energy Co. | | | 8,500 | | | | 592,195 | |
| Energy Partners Ltd. | | | 27,400 | | | | 408,808 | |
| Frontier Oil Corp. | | | 12,100 | | | | 289,311 | |
| Mariner Energy, Inc.(a) | | | 16,200 | | | | 598,914 | |
| Patterson-UTI Energy, Inc. | | | 15,200 | | | | 547,808 | |
| Rosetta Resources, Inc.(a) | | | 16,800 | | | | 478,800 | |
| SEACOR Holdings, Inc.(a) | | | 5,700 | | | | 510,207 | |
| W&T Offshore, Inc. | | | 9,300 | | | | 544,143 | |
| | | | | | | |
| | | | | | | 4,390,749 | |
| |
| Oil & Gas Services — 1.58% | | | | | | | | |
| Gulf Island Fabrication, Inc. | | | 5,500 | | | | 269,115 | |
| Oil States International, Inc.(a) | | | 4,500 | | | | 285,480 | |
| Superior Energy Services(a)(b) | | | 6,100 | | | | 336,354 | |
| | | | | | | |
| | | | | | | 890,949 | |
| |
| Pipelines — 0.81% | | | | | | | | |
| Oneok, Inc. | | | 9,300 | | | | 454,119 | |
| |
| Total Energy (Cost: $4,893,583) | | | | | | | 5,735,817 | |
| |
| Financial — 16.08% |
| Banks — 2.61% |
| Cathay General Bancorp(b) | | | 16,200 | | | | 176,094 | |
| Credicorp Ltd. | | | 6,900 | | | | 566,628 | |
| Oriental Financial Group | | | 20,400 | | | | 290,904 | |
| SVB Financial Group(a)(b) | | | 4,500 | | | | 216,495 | |
| Webster Financial Corp. | | | 11,500 | | | | 213,900 | |
| | | | | | | |
| | | | | | | 1,464,021 | |
| |
| Diversified Financial Services — 4.69% |
| Federated Investors, Inc. | | | 11,700 | | | | 402,714 | |
| Interactive Brokers Group, Inc.(a) | | | 14,100 | | | | 453,033 | |
| Investment Technology Group, Inc.(a) | | | 7,100 | | | | 237,566 | |
| Knight Capital Group, Inc.(a) | | | 30,900 | | | | 555,582 | |
| optionsXpress Holdings, Inc. | | | 16,900 | | | | 377,546 | |
| SWS Group, Inc. | | | 12,600 | | | | 209,286 | |
| TradeStation Group, Inc.(a) | | | 39,400 | | | | 399,910 | |
| | | | | | | |
| | | | | | | 2,635,637 | |
| |
| | | | | | | | | |
| | | Number | | Fair |
| | | of Shares | | Value |
| |
| Common Stocks (Continued) |
| |
| Financial Services — 0.93% |
| Banco Latinoamericano De Exportaciones SA | | | 19,400 | | | $ | 314,086 | |
| Greenhill & Co., Inc.(b) | | | 3,900 | | | | 210,054 | |
| | | | | | | |
| | | | | | | 524,140 | |
| |
| Insurance — 7.85% |
| American Physicians Capital, Inc.(b) | | | 8,500 | | | | 411,740 | |
| Axis Capital Holdings Ltd. | | | 14,800 | | | | 441,188 | |
| Endurance Specialty Holdings Ltd. | | | 11,900 | | | | 366,401 | |
| Fairfax Financial Holdings Ltd. | | | 900 | | | | 228,510 | |
| FPIC Insurance Group, Inc.(a) | | | 8,700 | | | | 394,284 | |
| Infinity Property & Casualty Corp. | | | 10,100 | | | | 419,352 | |
| Platinum Underwriters Holdings Ltd. | | | 13,800 | | | | 450,018 | |
| RLI Corp. | | | 9,500 | | | | 469,965 | |
| Safeco Corp. | | | 7,300 | | | | 490,268 | |
| StanCorp. Financial Group, Inc. | | | 4,900 | | | | 230,104 | |
| W.R. Berkley Corp. | | | 12,500 | | | | 302,000 | |
| Willis Group Holdings Ltd. | | | 6,700 | | | | 210,179 | |
| | | | | | | |
| | | | | | | 4,414,009 | |
| |
| Total Financial (Cost: $9,512,761) | | | | | | | 9,037,807 | |
| |
| Healthcare — 10.82% |
| Biotechnology — 1.36% |
| Alexion Pharmaceuticals, Inc.(a)(b) | | | 3,400 | | | | 246,500 | |
| Martek Biosciences Corp.(a)(b) | | | 8,400 | | | | 283,164 | |
| Momenta Pharmaceuticals, Inc.(a)(b) | | | 19,300 | | | | 237,390 | |
| | | | | | | |
| | | | | | | 767,054 | |
| |
| Healthcare-Products — 4.46% |
| Conmed Corp.(a) | | | 15,500 | | | | 411,525 | |
| Edwards Lifesciences Corp.(a) | | | 9,700 | | | | 601,788 | |
| Invacare Corp. | | | 11,800 | | | | 241,192 | |
| Mentor Corp.(b) | | | 15,200 | | | | 422,864 | |
| Steris Corp. | | | 16,900 | | | | 486,044 | |
| Zoll Medical Corp.(a) | | | 10,300 | | | | 346,801 | |
| | | | | | | |
| | | | | | | 2,510,214 | |
| |
| Healthcare-Services — 2.01% |
| LifePoint Hospitals, Inc.(a)(b) | | | 7,400 | | | | 209,420 | |
| Lincare Holdings, Inc.(a) | | | 15,000 | | | | 426,000 | |
| Universal Health Services, Inc. | | | 7,800 | | | | 493,116 | |
| | | | | | | |
| | | | | | | 1,128,536 | |
| |
| Pharmaceuticals — 2.99% |
| Endo Pharmaceuticals Holdings, Inc.(a) | | | 18,900 | | | | 457,191 | |
| Herbalife Ltd. | | | 11,300 | | | | 437,875 | |
| King Pharmaceuticals, Inc.(a) | | | 32,400 | | | | 339,228 | |
| The Medicines Co.(a)(b) | | | 22,400 | | | | 443,968 | |
| | | | | | | |
| | | | | | | 1,678,262 | |
| |
| Total Healthcare (Cost: $6,287,658) | | | | | | | 6,084,066 | |
| |
24 ½ 2 0 0 8 A N N U A L R E P O R T
| | | | | | | | | |
| | | Number | | Fair |
| | | of Shares | | Value |
| |
| Common Stocks (Continued) |
| |
| Industrial — 15.23% |
| Aerospace & Defense — 0.43% |
| Argon ST, Inc.(a) | | | 9,700 | | | $ | 240,560 | |
| |
| Building Materials — 1.65% |
| Gibraltar Industries, Inc. | | | 19,300 | | | | 308,221 | |
| Lennox International, Inc. | | | 10,500 | | | | 304,080 | |
| NCI Building Systems, Inc.(a) | | | 8,600 | | | | 315,878 | |
| | | | | | | |
| | | | | | | 928,179 | |
| |
| Electrical Components & Equipment — 2.32% |
| Encore Wire Corp.(b) | | | 21,000 | | | | 444,990 | |
| Insteel Industries, Inc. | | | 17,700 | | | | 324,087 | |
| Superior Essex, Inc.(a) | | | 12,000 | | | | 535,560 | |
| | | | | | | |
| | | | | | | 1,304,637 | |
| |
| Electronics — 2.92% |
| Celestica, Inc.(a) | | | 45,600 | | | | 384,408 | |
| CTS Corp. | | | 11,500 | | | | 115,575 | |
| Cymer, Inc.(a) | | | 15,500 | | | | 416,640 | |
| Methode Electronics, Inc. | | | 39,400 | | | | 411,730 | |
| Multi-Fineline Electronix, Inc.(a) | | | 11,300 | | | | 312,671 | |
| | | | | | | |
| | | | | | | 1,641,024 | |
| |
| Machinery-Diversified — 1.61% |
| Gardner Denver, Inc.(a) | | | 9,400 | | | | 533,920 | |
| Nordson Corp. | | | 5,100 | | | | 371,739 | |
| | | | | | | |
| | | | | | | 905,659 | |
| |
| Manufacturing — 0.85% |
| Acuity Brands, Inc. | | | 9,900 | | | | 475,992 | |
| |
| Metal Fabricate & Hardware — 0.77% |
| Mueller Industries, Inc. | | | 13,400 | | | | 431,480 | |
| |
| Miscellaneous Manufacturing — 1.00% |
| Ceradyne, Inc.(a) | | | 5,700 | | | | 195,510 | |
| EnPro Industries, Inc.(a) | | | 9,800 | | | | 365,932 | |
| | | | | | | |
| | | | | | | 561,442 | |
| |
| Packaging & Containers — 0.41% |
| Greif, Inc. | | | 3,600 | | | | 230,508 | |
| |
| Transportation — 2.33% |
| DryShips, Inc.(b) | | | 3,500 | | | | 280,630 | |
| Overseas Shipholding Group, Inc. | | | 5,600 | | | | 445,312 | |
| Ryder System, Inc. | | | 8,500 | | | | 585,480 | |
| | | | | | | |
| | | | | | | 1,311,422 | |
| |
| Trucking & Leasing — 0.94% |
| GATX Corp. | | | 12,000 | | | | 531,960 | |
| |
| Total Industrial (Cost: $7,909,781) | | | | | | | 8,562,863 | |
| |
| | | | | | | | | |
| | | Number | | Fair |
| | | of Shares | | Value |
| |
| Common Stocks (Continued) |
| |
| Technology — 8.62% |
| Computer Software & Services — 0.76% |
| CSG Systems International, Inc.(a) | | | 21,900 | | | $ | 241,338 | |
| MicroStrategy, Inc.(a) | | | 2,900 | | | | 187,775 | |
| |
| | | | | | | 429,113 | |
| | | | | | | |
| Computers — 2.05% |
| CACI International, Inc.(a) | | | 4,600 | | | | 210,542 | |
| Manhattan Associates, Inc.(a) | | | 11,300 | | | | 268,149 | |
| Rackable Systems, Inc.(a) | | | 29,300 | | | | 392,620 | |
| STEC, Inc.(a)(b) | | | 27,200 | | | | 279,344 | |
| | | | | | | |
| | | | | | | 1,150,655 | |
| |
| Data Processing — 0.65% |
| Fair Isaac Corp. | | | 17,700 | | | | 367,629 | |
| |
| Semiconductors — 2.47% |
| Credence Systems Corp.(a) | | | 85,600 | | | | 111,280 | |
| Entegris, Inc.(a) | | | 28,800 | | | | 188,640 | |
| Micrel, Inc. | | | 23,900 | | | | 218,685 | |
| QLogic Corp.(a) | | | 31,400 | | | | 458,126 | |
| Silicon Image, Inc.(a) | | | 56,900 | | | | 412,525 | |
| | | | | | | |
| | | | | | | 1,389,256 | |
| |
| Software — 2.69% |
| American Reprographics Co.(a) | | | 12,900 | | | | 214,785 | |
| BMC Software, Inc.(a) | | | 16,100 | | | | 579,600 | |
| Compuware Corp.(a) | | | 48,400 | | | | 461,736 | |
| Sybase, Inc.(a) | | | 8,600 | | | | 253,012 | |
| | | | | | | |
| | | | | | | 1,509,133 | |
| |
| Total Technology (Cost: $5,793,143) | | | | | | | 4,845,786 | |
| |
| Utilities — 3.05% |
| Electric — 2.17% |
| Alliant Energy Corp. | | | 8,600 | | | | 294,636 | |
| El Paso Electric Co.(a) | | | 19,600 | | | | 388,080 | |
| NorthWestern Corp. | | | 8,800 | | | | 223,696 | |
| Sierra Pacific Resources | | | 24,400 | | | | 310,124 | |
| | | | | | | |
| | | | | | | 1,216,536 | |
| |
| Gas — 0.88% |
| UGI Corp. | | | 17,300 | | | | 496,683 | |
| |
| Total Utilities (Cost: $1,917,250) | | | | | | | 1,713,219 | |
| |
Total Common Stocks (Cost $57,486,449) | | | | | | | 55,443,799 | |
| |
The accompanying notes are an integral part of the financial statements.
2 0 0 8 A N N U A L R E P O R T ½ 25
Schedule of Investments
Quaker Small-Cap Value Fund
June 30, 2008
| | | | | | | | | |
| | | Par Value/ | | | | |
| | | Number | | Fair |
| | | of Shares | | Value |
| |
| Short-Term Investments — 13.59% |
| |
| Investment Trust — 11.58% |
| Securities Lending Investment Fund, a series of the Brown Brothers Investment Trust, 2.58%(c)(d) | | | 6,511,818 | | | $ | 6,511,818 | |
| |
| Time Deposits — 2.01% |
| Citibank (Nassau) 1.6%, 07/01/2008 | | $ | 1,127,594 | | | | 1,127,594 | |
| |
Total Short-Term Investments (Cost $7,639,412) | | | | | | | 7,639,412 | |
| |
Total Investments (Cost $65,125,861) — 112.21% | | | | | | | 63,083,211 | |
| |
Liabilities in Excess of Other Assets, Net (12.21%) | | | | | | | (6,861,696 | ) |
| |
Total Net Assets — 100.00% | | | | | | $ | 56,221,515 | |
| |
| | |
| (a) | | Non-income producing security. |
| |
| (b) | | All or a portion of the security out on loan. |
| |
| (c) | | Represents investment of collateral received from securities lending transactions. |
| |
| (d) | | The rate shown is the annualized seven-day yield at period end. |
26 ½ 2 0 0 8 A N N U A L R E P O R T
[This page intentionally left blank]
Statements of Assets and Liabilities
June 30, 2008
| | | | | | | | | | | | | |
| | | Total Return Funds |
| | | Quaker | | Quaker | | Quaker |
| | | Biotech Pharma- | | Global Total | | Strategic |
| | | Healthcare Fund | | Return Fund | | Growth Fund |
| |
ASSETS: | | | | | | | | | | | | |
| Investments, at value | | $ | 7,207,626 | | | $ | 40,711,997 | | | $ | 1,742,521,033 | |
| Cash | | | 238,557 | | | | 3,462,368 | | | | — | |
| Foreign currency deposits with brokers for securities sold short | | | 192,152 | | | | — | | | | — | |
| Deposits with brokers for securities sold short | | | 1,125,103 | | | | — | | | | 24,434,250 | |
| Receivables: | | | | | | | | | | | | |
| Dividends and interest | | | 458 | | | | 20,929 | | | | 847,135 | |
| Capital shares sold | | | 48,257 | | | | 1,044,675 | | | | 22,244,569 | |
| Investment securities sold | | | 123,138 | | | | 1,214,902 | | | | 59,931,537 | |
| Commission recapture | | | — | | | | 853 | | | | 38,941 | |
| Security lending income | �� | | 742 | | | | 663 | | | | 73,793 | |
| Prepaid expenses and other assets | | | 2,783 | | | | 56,324 | | | | 172,122 | |
| |
Total assets | | | 8,938,816 | | | | 46,512,711 | | | | 1,850,263,380 | |
| |
| | | | | | | | | | | | | |
LIABILITIES: | | | | | | | | | | | | |
| Securities sold short, at value | | | 692,764 | | | | — | | | | — | |
| Payables: | | | | | | | | | | | | |
| Cash overdraft | | | — | | | | — | | | | 5,914 | |
| Due to advisor (note 3) | | | 7,898 | | | | 38,417 | | | | 1,618,154 | |
| Capital shares redeemed | | | 14,946 | | | | 45,807 | | | | 1,131,962 | |
| Upon return of securities loaned | | | 1,274,714 | | | | 4,879,789 | | | | 233,181,130 | |
| Investment securities purchased | | | 297,389 | | | | 405,826 | | | | 22,668,481 | |
| Dividends on securities sold short | | | 2,593 | | | | — | | | | — | |
| Distributions fees | | | 3,405 | | | | 15,392 | | | | 415,033 | |
| Trustee expenses | | | 712 | | | | 1,066 | | | | 55,158 | |
| Accrued expenses | | | 8,394 | | | | 15,384 | | | | 414,412 | |
| |
Total liabilities | | | 2,302,815 | | | | 5,401,681 | | | | 259,490,244 | |
| |
NET ASSETS | | $ | 6,636,001 | | | $ | 41,111,030 | | | $ | 1,590,773,136 | |
| |
| | | | | | | | | | | | | |
NET ASSETS CONSIST OF: | | | | | | | | | | | | |
| Paid-in capital | | $ | 7,406,897 | | | $ | 41,049,992 | | | $ | 1,303,232,084 | |
| Accumulated net realized gain (loss) on investments | | | (1,060,333 | ) | | | (264,229 | ) | | | 89,723,923 | |
| Accumulated net investment loss | | | — | | | | — | | | | — | |
| Net unrealized appreciation (depreciation) on investments | | | 289,437 | | | | 325,267 | | | | 197,817,129 | |
| |
Total Net Assets | | $ | 6,636,001 | | | $ | 41,111,030 | | | $ | 1,590,773,136 | |
| |
Total Investments, at Cost | | $ | 6,949,435 | | | $ | 40,386,730 | | | $ | 1,544,703,904 | |
| |
Foreign Currency, at Cost | | $ | 191,862 | | | $ | — | | | $ | — | |
| |
Proceeds from Securities Sold Short | | | 723,713 | | | | — | | | | — | |
| |
Class A shares: | | | | | | | | | | | | |
| Net Assets | | $ | 3,423,000 | | | $ | 27,108,657 | | | $ | 1,244,922,368 | |
| |
Shares of Beneficial interest outstanding(1) | | | 295,549 | | | | 2,661,590 | �� | | | 43,756,605 | |
| |
Net Asset Value per share and redemption(2) price per share | | $ | 11.58 | | | $ | 10.19 | | | $ | 28.45 | |
| |
| Offering price per share (100 ÷ 94.50 X net asset value per share) | | $ | 12.26 | | | $ | 10.78 | | | $ | 30.11 | |
| |
Class B shares: | | | | | | | | | | | | |
| Net Assets | | $ | 461,456 | | | $ | — | | | $ | 6,020,315 | |
| |
Shares of Beneficial interest outstanding(1) | | | 41,952 | | | | — | | | | 225,176 | |
| |
Net Asset Value, offering and redemption(2) price per share | | $ | 11.00 | | | $ | — | | | $ | 26.74 | |
| |
Class C shares: | | | | | | | | | | | | |
| Net Assets | | $ | 2,751,545 | | | $ | 14,002,373 | | | $ | 213,193,613 | |
| |
Shares of Beneficial interest outstanding(1) | | | 249,983 | | | | 1,376,552 | | | | 8,010,540 | |
| |
Net Asset Value, offering and redemption(2) price per share | | $ | 11.01 | | | $ | 10.17 | | | $ | 26.61 | |
| |
Institutional Class shares: | | | | | | | | | | | | |
| Net Assets | | $ | — | | | $ | — | | | $ | 126,636,840 | |
| |
Shares of Beneficial interest outstanding(1) | | | — | | | | — | | | | 4,361,806 | |
| |
| Net Asset Value, offering and redemption price per share | | $ | — | | | $ | — | | | $ | 29.03 | |
| |
| | | |
| (1) | | Unlimited number of shares of beneficial interest with a $0.01 par value, authorized. |
28 ½ 2 0 0 8 A N N U A L R E P O R T
| | | | | | | | | | | | | |
| Traditional Funds |
| Quaker | | | | Quaker | | Quaker |
| Capital | | | | Mid-Cap | | Small-Cap |
| Opportunities Fund | | | | Value Fund | | Value Fund |
| |
| | | | | | | | | | | | |
| $ | 13,389,283 | | | | | $ | 28,964,905 | | | $ | 63,083,211 | |
| | — | | | | | | — | | | | — | |
| | — | | | | | | — | | | | — | |
| | — | | | | | | — | | | | — | |
| | 8,731 | | | | | | 12,189 | | | | 20,289 | |
| | 63,253 | | | | | | 28,526 | | | | 75,541 | |
| | 435,685 | | | | | | — | | | | 660,661 | |
| | — | | | | | | — | | | | 10,158 | |
| | 581 | | | | | | 4,116 | | | | — | |
| | 6,553 | | | | | | 25,951 | | | | 29,738 | |
| |
| | 13,904,086 | | | | | | 29,035,687 | | | | 63,879,598 | |
| |
| | | | | | | | | | | | | |
| | | | | | | | | | | | |
| — | | | | | | — | | | | — | |
| |
| | 165 | | | | | | 72 | | | | 89 | |
| | 10,116 | | | | | | 22,660 | | | | 57,683 | |
| | 2,015 | | | | | | 116,708 | | | | 86,414 | |
| | 1,223,814 | | | | | | 4,489,876 | | | | 6,511,818 | |
| | — | | | | | | 477,933 | | | | 958,081 | |
| | — | | | | | | — | | | | — | |
| | 6,395 | | | | | | 9,404 | | | | 10,227 | |
| | 1,262 | | | | | | 1,570 | | | | 6,033 | |
| | 10,655 | | | | | | 19,460 | | | | 27,738 | |
| |
| | 1,254,422 | | | | | | 5,137,683 | | | | 7,658,083 | |
| |
| $ | 12,649,664 | | | | | $ | 23,898,004 | | | $ | 56,221,515 | |
| |
| | | | | | | | | | | | | |
| | | | | | | | | | | | |
| $ | 12,369,446 | | | | | $ | 29,427,944 | | | $ | 64,640,328 | |
| | (174,697 | ) | | | | | (5,537,715 | ) | | | (6,376,163 | ) |
| | — | | | | | | — | | | | — | |
| | 454,915 | | | | | | 7,775 | | | | (2,042,650 | ) |
| |
| $ | 12,649,664 | | | | | $ | 23,898,004 | | | $ | 56,221,515 | |
| |
| $ | 12,934,368 | | | | | $ | 28,957,130 | | | $ | 65,125,861 | |
| |
| $ | — | | | | | $ | — | | | $ | — | |
| |
| | — | | | | | | — | | | | — | |
| |
| $ | 7,007,259 | | | | | $ | 17,118,299 | | | $ | 27,722,158 | |
| |
| | 758,492 | | | | | | 1,186,980 | | | | 1,996,709 | |
| |
| $ | 9.24 | | | | | $ | 14.42 | | | $ | 13.88 | |
| |
| $ | 9.78 | | | | | $ | 15.26 | | | $ | 14.69 | |
| |
| | | | | | | | | | | | | |
| $ | 320,700 | | | | | $ | 468,356 | | | $ | 261,079 | |
| |
| | 36,416 | | | | | | 34,551 | | | | 20,599 | |
| |
| $ | 8.81 | | | | | $ | 13.56 | | | $ | 12.67 | |
| |
| | | | | | | | | | | | | |
| $ | 5,321,705 | | | | | $ | 5,800,587 | | | $ | 4,710,160 | |
| |
| | 604,578 | | | | | | 435,330 | | | | 386,705 | |
| |
| $ | 8.80 | | | | | $ | 13.32 | | | $ | 12.18 | |
| |
| | | | | | | | | | | | | |
| $ | — | | | | | $ | 510,762 | | | $ | 23,528,118 | |
| |
| | — | | | | | | 34,359 | | | | 1,643,263 | |
| |
| $ | — | | | | | $ | 14.87 | | | $ | 14.32 | |
| |
The accompanying notes are an integral part of the financial statements.
2 0 0 8 A N N U A L R E P O R T ½ 29
Statements of Operations
For the Fiscal Year Ended June 30, 2008
| | | | | | | | | | | | | |
| | | Total Return Funds |
| | | Quaker | | Quaker | | Quaker |
| | | Biotech Pharma- | | Global Total | | Strategic |
| | | Healthcare Fund | | Return Fund* | | Growth Fund |
INVESTMENT INCOME | | | | | | | | | | | | |
Income: | | | | | | | | | | | | |
| Dividends (net of foreign withholding taxes) | | $ | 5,661 | | | $ | 39,268 | | | $ | 9,049,319 | |
| Interest | | | 96,064 | | | | — | | | | 4,797,372 | |
| Security lending income | | | 9,654 | | | | 663 | | | | 610,662 | |
| |
Total Income | | | 111,379 | | | | 39,931 | | | | 14,457,353 | |
| |
| | | | | | | | | | | | | |
Expenses: | | | | | | | | | | | | |
| Investment advisory fees (note 3) | | | 120,924 | | | | 61,976 | | | | 12,868,888 | |
| Fund administration, accounting, and transfer agent fees (note 3) | | | 21,146 | | | | 7,546 | | | | 1,245,384 | |
| Custody fees | | | 23,379 | | | | 3,725 | | | | 125,839 | |
| Trustee fees and meeting expenses | | | 3,379 | | | | 1,066 | | | | 265,187 | |
| Legal fees | | | 510 | | | | 197 | | | | — | |
| Audit fees | | | 1,060 | | | | 3,802 | | | | 151,171 | |
| Distribution fee — Class A | | | 10,713 | | | | 8,317 | | | | 1,968,724 | |
| Distribution fee — Class B | | | 6,894 | | | | — | | | | 113,066 | |
| Distribution fee — Class C | | | 33,650 | | | | 16,313 | | | | 1,399,472 | |
| Officers’ compensation fees | | | 1,602 | | | | 611 | | | | 162,474 | |
| Registration and filing expenses | | | 7,659 | | | | — | | | | 106,971 | |
| Printing expenses | | | 4,957 | | | | 2,896 | | | | 289,554 | |
| Dividends on securities sold short | | | 7,357 | | | | — | | | | 88,173 | |
| Other operating expenses | | | 7,660 | | | | 5,472 | | | | 79,797 | |
| |
Total expenses | | | 250,890 | | | | 111,921 | | | | 18,864,700 | |
| |
| Less: | | | | | | | | | | | | |
| Investment advisory fees waived & reimbursed (note 3) | | | 12,509 | | | | — | | | | — | |
Net expenses | | | 238,381 | | | | 111,921 | | | | 18,864,700 | |
| |
Net investment loss | | | (127,002 | ) | | | (71,990 | ) | | | (4,407,347 | ) |
| |
| | | | | | | | | | | | | |
REALIZED AND UNREALIZED GAIN (LOSS) ON INVESTMENTS AND FOREIGN CURRENCY TRANSACTIONS | | | | | | |
Net realized gain (loss) from investments, (excluding short securities) | | | 180,182 | | | | (264,229 | ) | | | 102,890,657 | |
Net realized gain from short securities | | | 96,656 | | | | — | | | | 642,096 | |
Net realized gain from written options | | | 7,430 | | | | — | | | | 664,550 | |
Net realized gain from foreign currency transactions | | | 41,036 | | | | — | | | | — | |
Net unrealized appreciation (depreciation) on investments (excluding short securities) | | | 58,604 | | | | 325,267 | | | | 105,303,085 | |
Net unrealized appreciation on short securities | | | 30,949 | | | | — | | | | — | |
Net increase from payments by affiliates and net loss realized on the disposal of investments in violation of restrictions | | | — | | | | — | | | | — | |
| |
Net realized and unrealized gain (loss) on investments and
foreign currency transactions | | | 414,857 | | | | 61,038 | | | | 209,500,388 | |
| |
Net increase (decrease) in net assets resulting from operations | | $ | 287,855 | | | $ | (10,952 | ) | | $ | 205,093,041 | |
| |
Foreign withholding taxes on dividends | | $ | 521 | | | $ | 2,268 | | | $ | 429,221 | |
| |
| * | | For the period May 1, 2008 through June 30, 2008. |
30 ½ 2 0 0 8 A N N U A L R E P O R T
| | | | | | | | | | | | | |
| Traditional Funds |
| Quaker | | | | Quaker | | Quaker |
| Capital | | | | Mid-Cap | | Small-Cap |
| Opportunities Fund | | | | Value Fund | | Value Fund |
| |
| | | | | | | | | | | | |
| | | | | | | | | | | | | |
| $ | 178,284 | | | | | $ | 1,036,748 | | | $ | 671,342 | |
| | 57,417 | | | | | | 111,137 | | | | 24,095 | |
| | 3,841 | | | | | | 59,912 | | | | 183,460 | |
| |
| | 239,542 | | | | | | 1,207,797 | | | | 878,897 | |
| |
| | | | | | | | | | | | | |
| | | | | | | | | | | | | |
| | 143,940 | | | | | | 1,034,826 | | | | 836,633 | |
| | 26,187 | | | | | | 131,849 | | | | 97,590 | |
| | 14,590 | | | | | | 26,765 | | | | 30,746 | |
| | 5,388 | | | | | | 37,711 | | | | 27,432 | |
| | 254 | | | | | | 1,674 | | | | 2,339 | |
| | 2,230 | | | | | | 22,517 | | | | 12,682 | |
| | 19,999 | | | | | | 213,570 | | | | 85,763 | |
| | 4,880 | | | | | | 10,329 | | | | 5,193 | |
| | 70,734 | | | | | | 104,337 | | | | 87,067 | |
| | 2,967 | | | | | | 18,073 | | | | 13,322 | |
| | 3,859 | | | | | | 18,549 | | | | 13,398 | |
| | 5,628 | | | | | | 81,150 | | | | 27,170 | |
| | — | | | | | | — | | | | — | |
| | 4,160 | | | | | | 17,428 | | | | 7,582 | |
| |
| | 304,816 | | | | | | 1,718,778 | | | | 1,246,917 | |
| |
| | | | | | | | | | | | | |
| | — | | | | | | 49,277 | | | | 57,220 | |
| | 304,816 | | | | | | 1,669,501 | | | | 1,189,697 | |
| |
| | (65,274 | ) | | | | | (461,704 | ) | | | (310,800 | ) |
| |
| | | | | | | | | | | | | |
| | | | | | | | | | | | |
| | 612,920 | | | | | | (5,389,979 | ) | | | (3,347,651 | ) |
| | — | | | | | | — | | | | — | |
| | — | | | | | | — | | | | — | |
| | — | | | | | | — | | | | — | |
| | (987,589 | ) | | | | | (16,379,274 | ) | | | (12,130,653 | ) |
| | — | | | | | | — | | | | — | |
| |
| | — | | | | | | — | | | | — | |
| |
| | (374,669 | ) | | | | | (21,769,253 | ) | | | (15,478,304 | ) |
| |
| $ | (439,943 | ) | | | | $ | (22,230,957 | ) | | $ | (15,789,104 | ) |
| |
| $ | 4,162 | | | | | $ | 2,295 | | | $ | 5,115 | |
| |
The accompanying notes are an integral part of the financial statements.
2 0 0 8 A N N U A L R E P O R T ½ 31
Statements of Changes in Net Assets
For the Fiscal Year Ended June 30, 2008
| | | | | | | | | | | | | |
| | | Total Return Funds |
| | | Quaker | | Quaker | | Quaker |
| | | Biotech Pharma- | | Global Total | | Strategic |
| | | Healthcare Fund | | Return Fund* | | Growth Fund |
| |
INCREASE (DECREASE) IN NET ASSETS | | | | | | | | | | | | |
Operations | | | | | | | | | | | | |
| |
| Net investment loss | | $ | (127,002 | ) | | $ | (71,990 | ) | | $ | (4,407,347 | ) |
| Net realized gain (loss) from investment and foreign currency transactions | | | 325,304 | | | | (264,229 | ) | | | 104,197,303 | |
| Change in net unrealized appreciation (depreciation) on investments | | | 89,553 | | | | 325,267 | | | | 105,303,085 | |
| |
Net increase (decrease) in net assets resulting from operations | | | 287,855 | | | | (10,952 | ) | | | 205,093,041 | |
| |
Distributions to shareholders from | | | | | | | | | | | | |
| |
| Net realized capital gain — Class A | | | (429,282 | ) | | | — | | | | (67,714,263 | ) |
| Net realized capital gain — Class B | | | (79,799 | ) | | | — | | | | (1,428,000 | ) |
| Net realized capital gain — Class C | | | (359,911 | ) | | | — | | | | (12,971,793 | ) |
| Net realized capital gain — Class I | | | — | | | | — | | | | (2,185,702 | ) |
| Return of capital — Class A | | | — | | | | — | | | | — | |
| Return of capital — Class B | | | — | | | | — | | | | — | |
| Return of capital — Class C | | | — | | | | — | | | | — | |
| |
Total Distributions | | | (868,992 | ) | | | — | | | | (84,299,758 | ) |
| |
Capital share transactions | | | | | | | | | | | | |
| Increase (decrease) in net assets from fund share transactions (note 9) | | | (2,710,158 | ) | | | 41,121,982 | | | | 702,673,915 | |
| |
Total increase (decrease) in net assets | | | (3,291,295 | ) | | | 41,111,030 | | | | 823,467,198 | |
| |
NET ASSETS | | | | | | | | | | | | |
| Beginning of period | | | 9,927,296 | | | | — | | | | 767,305,938 | |
| |
| End of period | | $ | 6,636,001 | | | $ | 41,111,030 | | | $ | 1,590,773,136 | |
| |
| Accumulated net investment loss, at end of period | | $ | — | | | $ | — | | | $ | — | |
| |
| | | | | | | | | | | | | |
| For the Fiscal Year Ended June 30, 2007 | | | | | | | | | | | | |
INCREASE (DECREASE) IN NET ASSETS | | | | | | | | | | | | |
| Net investment income (loss) | | $ | (143,590 | ) | | $ | — | | | $ | 1,275,914 | |
| Net realized gain (loss) from investment transactions and foreign currency transactions | | | (182,064 | ) | | | — | | | | 78,938,276 | |
| Change in net unrealized appreciation (depreciation) on investments | | | 1,087,162 | | | | — | | | | 49,387,796 | |
| |
Net increase in net assets resulting from operations | | | 761,508 | | | | — | | | | 129,601,986 | |
| |
Distributions to shareholders from | | | | | | | | | | | | |
| Net investment income — Class A | | | — | | | | — | | | | (2,900,910 | ) |
| Net investment income — Class B | | | — | | | | — | | | | — | |
| Net investment income — Class C | | | — | | | | — | | | | — | |
| Net investment income — Class I | | | — | | | | — | | | | (248,934 | ) |
| Net realized capital gains — Class A | | | (629,422 | ) | | | — | | | | (76,183,989 | ) |
| Net realized capital gains — Class B | | | (101,639 | ) | | | — | | | | (1,533,711 | ) |
| Net realized capital gains — Class C | | | (414,003 | ) | | | — | | | | (10,701,494 | ) |
| Net realized capital gains — Class I | | | — | | | | — | | | | (3,765,560 | ) |
| |
Total Distributions | | | (1,145,064 | ) | | | — | | | | (95,334,598 | ) |
| |
Capital share transactions | | | | | | | | | | | | |
| Increase (decrease) in net assets from fund share transactions (note 9) | | | (8,946,825 | ) | | | — | | | | (323,962,274 | ) |
| |
Total increase (decrease) in net assets | | | (9,330,381 | ) | | | — | | | | (289,694,886 | ) |
| |
NET ASSETS | | | | | | | | | | | | |
| Beginning of period | | | 19,257,677 | | | | — | | | | 1,057,000,824 | |
| |
| End of period | | $ | 9,927,296 | | | $ | — | | | $ | 767,305,938 | |
| |
| Undistributed accumulated net investment income, at end of period | | $ | — | | | $ | — | | | $ | — | |
| |
| | | |
| * | | For the period May 1, 2008 through June 30, 2008. |
32 ½ 2 0 0 8 A N N U A L R E P O R T
| | | | | | | | | | | | | |
| Traditional Funds |
| Quaker | | | | Quaker | | Quaker |
| Capital | | | | Mid-Cap | | Small-Cap |
| Opportunities Fund | | | | Value Fund | | Value Fund |
| | | | | | | | | | | | |
| | | | | | | | | | | | | |
| $ | (65,274 | ) | | | | $ | (461,704 | ) | | $ | (310,800 | ) |
| | 612,920 | | | | | | (5,389,979 | ) | | | (3,347,651 | ) |
| | (987,589 | ) | | | | | (16,379,274 | ) | | | (12,130,653 | ) |
| |
| | (439,943 | ) | | | | | (22,230,957 | ) | | | (15,789,104 | ) |
| |
| | | | | | | | | | | | | |
| | (1,226,105 | ) | | | | | (5,313,611 | ) | | | (6,162,955 | ) |
| | (68,366 | ) | | | | | (42,910 | ) | | | (103,203 | ) |
| | (1,094,572 | ) | | | | | (454,807 | ) | | | (1,833,492 | ) |
| | — | | | | | | (64,360 | ) | | | (4,724,536 | ) |
| | (48,738 | ) | | | | | — | | | | — | |
| | (2,717 | ) | | | | | — | | | | — | |
| | (43,510 | ) | | | | | — | | | | — | |
| |
| | (2,484,008 | ) | | | | | (5,875,688 | ) | | | (12,824,186 | ) |
| |
| | | | | | | | | | | | | |
| | (1,488,021 | ) | | | | | (102,825,159 | ) | | | (6,549,245 | ) |
| |
| | (4,411,972 | ) | | | | | (130,931,804 | ) | | | (35,162,535 | ) |
| |
| | | | | | | | | | | | |
| | | | | | | | | | | | | |
| | 17,061,636 | | | | | | 154,829,808 | | | | 91,384,050 | |
| |
| $ | 12,649,664 | | | | | $ | 23,898,004 | | | $ | 56,221,515 | |
| |
| $ | — | | | | | $ | — | | | $ | — | |
| |
| | | | | | | | | | | | | |
| |
| | | | | | | | | | | | |
| | | | | | | | | | | | | |
| $ | (35,949 | ) | | | | $ | (820,415 | ) | | $ | (244,701 | ) |
| | 2,125,175 | | | | | | 6,641,912 | | | | 11,914,134 | |
| | (365,054 | ) | | | | | 11,593,452 | | | | 2,315,841 | |
| |
| | 1,724,172 | | | | | | 17,414,949 | | | | 13,985,274 | |
| |
| | | | | | | | | | | | | |
| | — | | | | | | — | | | | — | |
| | — | | | | | | — | | | | — | |
| | — | | | | | | — | | | | — | |
| | — | | | | | | — | | | | — | |
| | (618,838 | ) | | | | | (2,044,739 | ) | | | (4,201,235 | ) |
| | (51,589 | ) | | | | | (43,407 | ) | | | (106,504 | ) |
| | (737,051 | ) | | | | | (349,010 | ) | | | (1,266,817 | ) |
| | — | | | | | | (30,160 | ) | | | (3,094,993 | ) |
| |
| | (1,407,478 | ) | | | | | (2,467,316 | ) | | | (8,669,549 | ) |
| |
| | | | | | | | | | | | | |
| | (8,045,843 | ) | | | | | 48,867,507 | | | | 9,670,153 | |
| |
| | (7,729,149 | ) | | | | | 63,815,140 | | | | 14,985,878 | |
| |
| | | | | | | | | | | | |
| | | | | | | | | | | | | |
| | 24,790,785 | | | | | | 91,014,668 | | | | 76,398,172 | |
| |
| $ | 17,061,636 | | | | | $ | 154,829,808 | | | $ | 91,384,050 | |
| |
| $ | — | | | | | $ | — | | | $ | — | |
| |
The accompanying notes are an integral part of the financial statements.
2 0 0 8 A N N U A L R E P O R T ½ 33
Financial Highlights
Quaker Biotech Pharma-Healthcare Fund
(For a Share Outstanding Throughout the Period)
| | | | | | | | | | | | | | | | | | | | | | | | | |
| | | | | | | | Class A | |
| | | | | | | |
| | | | | | | Year | | Year | | Year | | Year | | Year |
| | | | | | | Ended | | Ended | | Ended | | Ended | | Ended |
| | | | | | | June 30, | | June 30, | | June 30, | | June 30, | | June 30, |
| | | | | | | 2008 | | 2007 | | 2006 | | 2005 | | 2004 |
| |
| Net asset value, beginning of period | | | | | | $ | 12.45 | | | $ | 12.50 | | | $ | 12.30 | | | $ | 13.64 | | | $ | 11.83 | |
| |
| Income From Investment Operations |
Net investment loss(1) | | | | | | | (0.14 | ) | | | (0.11 | ) | | | (0.11 | ) | | | (0.19 | ) | | | (0.28 | ) |
| Net realized and unrealized gain (loss) on investments | | | | | | | 0.55 | | | | 1.34 | | | | 0.37 | | | | (0.22 | ) | | | 2.80 | |
| |
Total from investment operations | | | | | | | 0.41 | | | | 1.23 | | | | 0.26 | | | | (0.41 | ) | | | 2.52 | |
| |
| Distributions to shareholders from: |
| Net realized capital gain | | | | | | | (1.28 | ) | | | (1.28 | ) | | | (0.06 | ) | | | (0.93 | ) | | | (0.71 | ) |
| |
Total distributions | | | | | | | (1.28 | ) | | | (1.28 | ) | | | (0.06 | ) | | | (0.93 | ) | | | (0.71 | ) |
| |
| Net asset value, end of period | | | | | | $ | 11.58 | | | $ | 12.45 | | | $ | 12.50 | | | $ | 12.30 | | | $ | 13.64 | |
| |
Total Return(2) | | | | | | | 3.40 | % | | | 9.51 | % | | | 2.14 | % | | | (3.22 | )% | | | 21.97 | % |
| |
| Ratios/supplemental data |
Net assets, end of period (000’s omitted) | | | | | | $ | 3,423 | | | $ | 5,149 | | | $ | 14,324 | | | $ | 15,295 | | | $ | 9,908 | |
Ratio of expenses to average net assets: |
| Before expense reimbursements and waived fees | | | | | | | 2.64 | % | | | 2.34 | % | | | 2.19 | % | | | 2.31 | % | | | 2.41 | % |
| After expense reimbursements and waived fees | | | | | | | 2.49 | % | | | 2.34 | % | | | 2.19 | % | | | 2.31 | % | | | 2.41 | % |
Ratio of net investment loss to average net assets | | | | | | | (1.11 | )% | | | (0.88 | )% | | | (0.79 | )% | | | (1.56 | )% | | | (2.15 | )% |
Portfolio turnover rate | | | | | | | 280.63 | % | | | 117.35 | % | | | 199.35 | % | | | 272.82 | % | | | 139.37 | % |
| |
| | | |
| (1) | | The average shares outstanding method has been applied for per share information. |
| |
| (2) | | Total investment return is based on the change in net asset value of a share during the period and assumes reinvestments of dividends and distributions at net asset value and does not reflect the impact of sales charge. |
34 ½ 2 0 0 8 A N N U A L R E P O R T
| | | | | | | | | | | | | | | | | | | | | | | | | |
| | | | | | | | Class B | |
| | | | | | | |
| | | | | | | Year | | Year | | Year | | Year | | Year |
| | | | | | | Ended | | Ended | | Ended | | Ended | | Ended |
| | | | | | | June 30, | | June 30, | | June 30, | | June 30, | | June 30, |
| | | | | | | 2008 | | 2007 | | 2006 | | 2005 | | 2004 |
| |
| Net asset value, beginning of period | | | | | | $ | 11.97 | | | $ | 12.15 | | | $ | 12.04 | | | $ | 13.47 | | | $ | 11.77 | |
| |
| Income From Investment Operations |
Net investment loss(1) | | | | | | | (0.24 | ) | | | (0.20 | ) | | | (0.20 | ) | | | (0.29 | ) | | | (0.37 | ) |
| Net realized and unrealized gain (loss) on investments | | | | | | | 0.55 | | | | 1.30 | | | | 0.37 | | | | (0.21 | ) | | | 2.78 | |
| |
Total from investment operations | | | | | | | 0.31 | | | | 1.10 | | | | 0.17 | | | | (0.50 | ) | | | 2.41 | |
| |
| Distributions to shareholders from: |
| Net realized capital gain | | | | | | | (1.28 | ) | | | (1.28 | ) | | | (0.06 | ) | | | (0.93 | ) | | | (0.71 | ) |
| |
Total distributions | | | | | | | (1.28 | ) | | | (1.28 | ) | | | (0.06 | ) | | | (0.93 | ) | | | (0.71 | ) |
| |
Net asset value, end of period | | | | | | $ | 11.00 | | | $ | 11.97 | | | $ | 12.15 | | | $ | 12.04 | | | $ | 13.47 | |
| |
Total Return(2) | | | | | | | 2.67 | % | | | 8.67 | % | | | 1.43 | % | | | (3.95 | )% | | | 21.12 | % |
| |
| Ratios/supplemental data |
Net assets, end of period (000’s omitted) | | | | | | $ | 461 | | | $ | 837 | | | $ | 1,131 | | | $ | 1,238 | | | $ | 1,761 | |
Ratio of expenses to average net assets: |
| Before expense reimbursements and waived fees | | | | | | | 3.39 | % | | | 3.09 | % | | | 2.94 | % | | | 3.06 | % | | | 3.16 | % |
| After expense reimbursements and waived fees | | | | | | | 3.24 | % | | | 3.09 | % | | | 2.94 | % | | | 3.06 | % | | | 3.16 | % |
Ratio of net investment loss to average net assets | | | | | | | (2.07 | )% | | | (1.63 | )% | | | (1.54 | )% | | | (2.31 | )% | | | (2.90 | )% |
Portfolio turnover rate | | | | | | | 280.63 | % | | | 117.35 | % | | | 199.35 | % | | | 272.82 | % | | | 139.37 | % |
| |
| | | |
| (1) | | The average shares outstanding method has been applied for per share information. |
| |
| (2) | | Total investment return is based on the change in net asset value of a share during the period and assumes reinvestments of dividends and distributions at net asset value and does not reflect the impact of sales charge. |
The accompanying notes are an integral part of the financial statements.
2 0 0 8 A N N U A L R E P O R T ½ 35
Financial Highlights
Quaker Biotech Pharma-Healthcare Fund
(For a Share Outstanding Throughout the Period)
| | | | | | | | | | | | | | | | | | | | | | | | | |
| | | | | | | | Class C | |
| | | | | | | |
| | | | | | | Year | | Year | | Year | | Year | | Year |
| | | | | | | Ended | | Ended | | Ended | | Ended | | Ended |
| | | | | | | June 30, | | June 30, | | June 30, | | June 30, | | June 30, |
| | | | | | | 2008 | | 2007 | | 2006 | | 2005 | | 2004 |
| |
| Net asset value, beginning of period | | | | | | $ | 11.98 | | | $ | 12.16 | | | $ | 12.05 | | | $ | 13.48 | | | $ | 11.78 | |
| |
| Income From Investment Operations |
Net investment loss(1) | | | | | | | (0.22 | ) | | | (0.20 | ) | | | (0.20 | ) | | | (0.28 | ) | | | (0.37 | ) |
| Net realized and unrealized gain (loss) on investments | | | | | | | 0.53 | | | | 1.30 | | | | 0.37 | | | | (0.22 | ) | | | 2.78 | |
| |
Total from investment operations | | | | | | | 0.31 | | | | 1.10 | | | | 0.17 | | | | (0.50 | ) | | | 2.41 | |
| |
| Distributions to shareholders from: |
| Net realized capital gain | | | | | | | (1.28 | ) | | | (1.28 | ) | | | (0.06 | ) | | | (0.93 | ) | | | (0.71 | ) |
| |
Total distributions | | | | | | | (1.28 | ) | | | (1.28 | ) | | | (0.06 | ) | | | (0.93 | ) | | | (0.71 | ) |
| |
Net asset value, end of period | | | | | | $ | 11.01 | | | $ | 11.98 | | | $ | 12.16 | | | $ | 12.05 | | | $ | 13.48 | |
| |
Total Return(2) | | | | | | | 2.67 | % | | | 8.67 | % | | | 1.43 | % | | | (3.95 | )% | | | 21.11 | % |
| |
| Ratios/supplemental data |
Net assets, end of period (000’s omitted) | | | | | | $ | 2,752 | | | $ | 3,942 | | | $ | 3,802 | | | $ | 4,038 | | | $ | 4.084 | |
Ratio of expenses to average net assets: |
| Before expense reimbursements and waived fees | | | | | | | 3.40 | % | | | 3.09 | % | | | 2.94 | % | | | 3.06 | % | | | 3.16 | % |
| After expense reimbursements and waived fees | | | | | | | 3.25 | % | | | 3.09 | % | | | 2.94 | % | | | 3.06 | % | | | 3.16 | % |
Ratio of net investment loss to average net assets | | | | | | | (1.93 | )% | | | (1.63 | )% | | | (1.54 | )% | | | (2.31 | )% | | | (2.90 | )% |
| Portfolio turnover rate | | | | | | | 280.63 | % | | | 117.35 | % | | | 199.35 | % | | | 272.82 | % | | | 139.37 | % |
| |
| | |
| (1) | | The average shares outstanding method has been applied for per share information. |
| |
| (2) | | Total investment return is based on the change in net asset value of a share during the period and assumes reinvestments of dividends and distributions at net asset value and does not reflect the impact of sales charge. |
36 ½ 2 0 0 8 A N N U A L R E P O R T
[This page is intentionally left blank]
Financial Highlights
Quaker Global Total Return Fund
(For a Share Outstanding Throughout the Period)
| | | | | | | | | | | | | | | | | | | | | | | | | | | | | |
| | | | | | | | | | | | | | | | | | | | | | | | | | Class A |
| | | | | | | | | | | | | | | | | | | | | | | | | | |
| | | | | | | | | | | | | | | | | | | | | | | | | | For the period |
| | | | | | | | | | | | | | | | | | | | | | | | | | May 1, 2008 |
| | | | | | | | | | | | | | | | | | | | | | | | | | (commencement of |
| | | | | | | | | | | | | | | | | | | | | | | | | | operations) to |
| | | | | | | | | | | | | | | | | | | | | | | | | | June 30, 2008 |
| |
Net asset value, beginning of period | | | | | | | | | | | | | | | | | | | | $ | 10.00 | |
| |
| Income From Investment Operations |
Net investment loss(1) | | | | | | | | | | | | | | | | | | | | | (0.02 | ) |
| Net realized and unrealized gain on investments | | | | | | | | | | | | | | | | | | | | | 0.21 | |
| |
Total from investment operations | | | | | | | | | | | | | | | | | | | | | 0.19 | |
| |
Net asset value, end of period | | | | | | | | | | | | | | | | | | | | $ | 10.19 | |
| |
Total Return(2) | | | | | | | | | | | | | | | | | | | | | 1.90 | %* |
| |
| Ratios/supplemental data |
Net assets, end of period (000’s omitted) | | | | | | | | | | | | | | | | | | | | $ | 27,109 | |
Ratio of expenses to average net assets: |
| Before expense reimbursements and waived fees | | | | | | | | | | | | | | | | | | | | | 2.01 | %** |
| After expense reimbursements and waived fees | | | | | | | | | | | | | | | | | | | | | 2.01 | %** |
Ratio of net investment loss to average net assets | | | | | | | | | | | | | | | | | | | | | (1.20 | )%** |
Portfolio turnover rate | | | | | | | | | | | | | | | | | | | | | 29.39 | %* |
| |
| | | |
| (1) | | The average shares outstanding method has been applied for per share information. |
| |
| (2) | | Total investment return is based on the change in net asset value of a share during the period and assumes reinvestments of dividends and distributions at net asset value and does not reflect the impact of sales charge. |
| |
| | | * Not annualized. |
| |
| | | ** Annualized. |
38 ½ 2 0 0 8 A N N U A L R E P O R T
| | | | | | | | | | | | | | | | | | | | | |
| | | | | | | | | | | | | | | | | | | Class C |
| | | | | | | | | | | | | | | | | | | |
| | | | | | | | | | | | | | | | | | | For the period |
| | | | | | | | | | | | | | | | | | | May 1, 2008 |
| | | | | | | | | | | | | | | | | | | (commencement of |
| | | | | | | | | | | | | | | | | | | operations) to |
| | | | | | | | | | | | | | | | | | | June 30, 2008 |
| |
Net asset value, beginning of period | | | | | | | | | | | | | | | | | | $ | 10.00 | |
| |
Income From Investment Operations | | | | | | | | | | | | | | | | | | | | |
Net investment loss(1) | | | | | | | | | | | | | | | | | | | (0.03 | ) |
| Net realized and unrealized gain on investments | | | | | | | | | | | | | | | | | | | 0.20 | |
| |
Total from investment operations | | | | | | | | | | | | | | | | | | | 0.17 | |
| |
Net asset value, end of period | | | | | | | | | | | | | | | | | | $ | 10.17 | |
| |
Total Return(2) | | | | | | | | | | | | | | | | | | | 1.70 | %* |
| |
Ratios/supplemental data | | | | | | | | | | | | | | | | | | | | |
Net assets, end of period (000’s omitted) | | | | | | | | | | | | | | | | | | $ | 14,002 | |
Ratio of expenses to average net assets: | | | | | | | | | | | | | | | | | | | | |
| Before expense reimbursements and waived fees | | | | | | | | | | | | | | | | | | | 2.76 | %** |
| After expense reimbursements and waived fees | | | | | | | | | | | | | | | | | | | 2.76 | %** |
Ratio of net investment loss to average net assets | | | | | | | | | | | | | | | | | | | (1.95 | )%** |
Portfolio turnover rate | | | | | | | | | | | | | | | | | | | 29.39 | %* |
| |
| (1) | | The average shares outstanding method has been applied for per share information. |
| | | |
| (2) | | Total investment return is based on the change in net asset value of a share during the period and assumes reinvestments of dividends and distributions
at net asset value and does not reflect the impact of sales charge. |
| | | |
| | | * Not annualized. |
| | | |
| | | ** Annualized. |
The accompanying notes are an integral part of the financial statements.
2 0 0 8 A N N U A L R E P O R T ½ 39
Financial Highlights
Quaker Strategic Growth Fund
(For a Share Outstanding Throughout the Period)
| | | | | | | | | | | | | | | | | | | | | |
| | | | Class A | |
| | | |
| | | Year | | Year | | Year | | Year | | Year |
| | | Ended | | Ended | | Ended | | Ended | | Ended |
| | | June 30, | | June 30, | | June 30, | | June 30, | | June 30, |
| | | 2008 | | 2007 | | 2006 | | 2005 | | 2004 |
| |
Net asset value, beginning of period | | $ | 25.69 | | | $ | 24.12 | | | $ | 22.44 | | | $ | 20.71 | | | $ | 16.67 | |
| |
Income from investment operations | | | | | | | | | | | | | | | | | | | | |
Net investment income (loss)(1) | | | (0.09 | ) | | | 0.06 | | | | 0.05 | | | | (0.16 | ) | | | (0.27 | ) |
| |
| Net realized and unrealized gain on investments | | | 5.50 | | | | 4.07 | | | | 2.98 | | | | 2.88 | | | | 4.31 | |
| |
Total from investment operations | | | 5.41 | | | | 4.13 | | | | 3.03 | | | | 2.72 | | | | 4.04 | |
| |
Distributions to shareholders from: | | | | | | | | | | | | | | | | | | | | |
| Net investment income | | | — | | | | (0.09 | ) | | | — | | | | — | | | | — | |
| Net realized capital gain | | | (2.65 | ) | | | (2.47 | ) | | | (1.35 | ) | | | (0.99 | ) | | | — | |
| |
Total distributions | | | (2.65 | ) | | | (2.56 | ) | | | (1.35 | ) | | | (0.99 | ) | | | — | |
| |
Net asset value, end of period | | $ | 28.45 | | | $ | 25.69 | | | $ | 24.12 | | | $ | 22.44 | | | $ | 20.71 | |
| |
Total Return(2) | | | 22.22 | % | | | 18.68 | % | | | 13.66 | % | | | 13.36 | % | | | 24.24 | % |
| |
Ratios/supplemental data | | | | | | | | | | | | | | | | | | | | |
Net assets, end of period (000’s omitted) | | $ | 1,244,922 | | | $ | 629,531 | | | $ | 901,498 | | | $ | 530,271 | | | $ | 307,744 | |
Ratio of expenses to average net assets: | | | | | | | | | | | | | | | | | | | | |
| Before fees paid indirectly through commission recapture | | | 1.80 | % | | | 1.90 | % | | | 1.90 | % | | | 2.04 | % | | | 2.16 | % |
| After fees paid indirectly through commission recapture | | | 1.80 | % | | | 1.90 | % | | | 1.86 | % | | | 1.99 | % | | | 2.16 | % |
Ratio of net investment income (loss) to average net assets | | | (0.34 | )% | | | 0.23 | % | | | 0.20 | % | | | (0.73 | )% | | | (1.41 | )% |
Portfolio turnover rate | | | 168.61 | % | | | 319.28 | % | | | 185.71 | % | | | 204.59 | % | | | 332.70 | % |
| |
| (1) | | The average shares outstanding method has been applied for per share information. |
| | | |
| (2) | | Total investment return is based on the change in net asset value of a share during the period and assumes reinvestments of dividends and distributions at net asset value and does not reflect the impact of sales charge. |
40 ½ 2 0 0 8 A N N U A L R E P O R T
| | | | | | | | | | | | | | | | | | | | | |
| | | | Class B | |
| | | |
| | | Year | | Year | | Year | | Year | | Year |
| | | Ended | | Ended | | Ended | | Ended | | Ended |
| | | June 30, | | June 30, | | June 30, | | June 30, | | June 30, |
| | | 2008 | | 2007 | | 2006 | | 2005 | | 2004 |
| |
Net asset value, beginning of period | | $ | 24.46 | | | $ | 23.16 | | | $ | 21.76 | | | $ | 20.25 | | | $ | 16.41 | |
| |
| Income from investment operations |
Net investment loss(1) | | | (0.29 | ) | | | (0.12 | ) | | | (0.13 | ) | | | (0.31 | ) | | | (0.40 | ) |
| |
| Net realized and unrealized gain on investments | | | 5.22 | | | | 3.89 | | | | 2.88 | | | | 2.81 | | | | 4.24 | |
| |
Total from investment operations | | | 4.93 | | | | 3.77 | | | | 2.75 | | | | 2.50 | | | | 3.84 | |
| |
| Distributions to shareholders from: |
| Net investment income | | | — | | | | — | | | | — | | | | — | | | | — | |
| Net realized capital gain | | | (2.65 | ) | | | (2.47 | ) | | | (1.35 | ) | | | (0.99 | ) | | | — | |
| |
Total distributions | | | (2.65 | ) | | | (2.47 | ) | | | (1.35 | ) | | | (0.99 | ) | | | — | |
| |
Net asset value, end of period | | $ | 26.74 | | | $ | 24.46 | | | $ | 23.16 | | | $ | 21.76 | | | $ | 20.25 | |
| |
Total Return(2) | | | 21.32 | % | | | 17.77 | % | | | 12.77 | % | | | 12.56 | % | | | 23.40 | % |
| |
| Ratios/supplemental data |
Net assets, end of period (000’s omitted) | | $ | 6,020 | | | $ | 14,429 | | | $ | 15,999 | | | $ | 16,106 | | | $ | 16,186 | |
Ratio of expenses to average net assets: |
| Before fees paid indirectly through commission recapture | | | 2.57 | % | | | 2.65 | % | | | 2.65 | % | | | 2.79 | % | | | 2.91 | % |
| After fees paid indirectly through commission recapture | | | 2.57 | % | | | 2.65 | % | | | 2.61 | % | | | 2.74 | % | | | 2.91 | % |
Ratio of net investment loss to average net assets | | | (1.17 | )% | | | (0.52 | )% | | | (0.55 | )% | | | (1.48 | )% | | | (2.16 | )% |
Portfolio turnover rate | | | 168.61 | % | | | 319.28 | % | | | 185.71 | % | | | 204.59 | % | | | 332.70 | % |
| |
| (1) | | The average shares outstanding method has been applied for per share information. |
| | | |
| (2) | | Total investment return is based on the change in net asset value of a share during the period and assumes reinvestments of dividends and distributions
at net asset value and does not reflect the impact of sales charge. |
The accompanying notes are an integral part of the financial statements.
2 0 0 8 A N N U A L R E P O R T ½ 41
Financial Highlights
Quaker Strategic Growth Fund
(For a Share Outstanding Throughout the Period)
| | | | | | | | | | | | | | | | | | | | | |
| | | | Class C | |
| | | |
| | | Year | | Year | | Year | | Year | | Year |
| | | Ended | | Ended | | Ended | | Ended | | Ended |
| | | June 30, | | June 30, | | June 30, | | June 30, | | June 30, |
| | | 2008 | | 2007 | | 2006 | | 2005 | | 2004 |
| |
Net asset value, beginning of period | | $ | 24.36 | | | $ | 23.07 | | | $ | 21.68 | | | $ | 20.18 | | | $ | 16.36 | |
| |
| Income from investment operations |
Net investment income (loss)(1) | | | (0.27 | ) | | | (0.12 | ) | | | (0.12 | ) | | | (0.31 | ) | | | (0.41 | ) |
| Net realized and unrealized gain on investments | | | 5.17 | | | | 3.88 | | | | 2.86 | | | | 2.80 | | | | 4.23 | |
| |
Total from investment operations | | | 4.90 | | | | 3.76 | | | | 2.74 | | | | 2.49 | | | | 3.82 | |
| |
| Distributions to shareholders from: |
| Net investment income | | | — | | | | — | | | | — | | | | — | | | | — | |
| Net realized capital gain | | | (2.65 | ) | | | (2.47 | ) | | | (1.35 | ) | | | (0.99 | ) | | | — | |
| |
Total distributions | | | (2.65 | ) | | | (2.47 | ) | | | (1.35 | ) | | | (0.99 | ) | | | — | |
| |
Net asset value, end of period | | $ | 26.61 | | | $ | 24.36 | | | $ | 23.07 | | | $ | 21.68 | | | $ | 20.18 | |
| |
Total Return(2) | | | 21.29 | % | | | 17.80 | % | | | 12.77 | % | | | 12.55 | % | | | 23.35 | % |
| |
| Ratios/supplemental data |
Net assets, end of period (000’s omitted) | | $ | 213,194 | | | $ | 108,241 | | | $ | 98,224 | | | $ | 66,958 | | | $ | 37,559 | |
Ratio of expenses to average net assets: |
| Before fees paid indirectly through commission recapture | | | 2.55 | % | | | 2.65 | % | | | 2.65 | % | | | 2.79 | % | | | 2.91 | % |
| After fees paid indirectly through commission recapture | | | 2.55 | % | | | 2.65 | % | | | 2.61 | % | | | 2.74 | % | | | 2.91 | % |
Ratio of net investment loss to average net assets | | | (1.09 | )% | | | (0.52 | )% | | | (0.55 | )% | | | (1.48 | )% | | | (2.16 | )% |
Portfolio turnover rate | | | 168.61 | % | | | 319.28 | % | | | 185.71 | % | | | 204.59 | % | | | 332.70 | % |
| |
(1) The average shares outstanding method has been applied for per share information.
| (2) | | Total investment return is based on the change in net asset value of a share during the period and assumes reinvestments of dividends and distributions
at net asset value and does not reflect the impact of sales charge. |
42 ½ 2 0 0 8 A N N U A L R E P O R T
| | | | | | | | | | | | | | | | | | | | | |
| | | | Institutional Class | |
| | | |
| | | Year | | Year | | Year | | Year | | Year |
| | | Ended | | Ended | | Ended | | Ended | | Ended |
| | | June 30, | | June 30, | | June 30, | | June 30, | | June 30, |
| | | 2008 | | 2007 | | 2006 | | 2005 | | 2004 |
| |
Net asset value, beginning of period | | $ | 26.09 | | | $ | 24.47 | | | $ | 22.70 | | | $ | 20.88 | | | $ | 16.76 | |
| |
| Income from investment operations |
Net investment income (loss)(1) | | | (0.03 | ) | | | 0.12 | | | | 0.11 | | | | (0.10 | ) | | | (0.22 | ) |
| Net realized and unrealized gain on investments | | | 5.62 | | | | 4.13 | | | | 3.01 | | | | 2.91 | | | | 4.34 | |
| |
Total from investment operations | | | 5.59 | | | | 4.25 | | | | 3.12 | | | | 2.81 | | | | 4.12 | |
| |
| Distributions to shareholders from: |
| Net investment income | | | — | | | | (0.16 | ) | | | — | | | | — | | | | — | |
| Net realized capital gain | | | (2.65 | ) | | | (2.47 | ) | | | (1.35 | ) | | | (0.99 | ) | | | — | |
| |
Total distributions | | | (2.65 | ) | | | (2.63 | ) | | | (1.35 | ) | | | (0.99 | ) | | | — | |
| |
Net asset value, end of period | | $ | 29.03 | | | $ | 26.09 | | | $ | 24.47 | | | $ | 22.70 | | | $ | 20.88 | |
| |
Total Return(2) | | | 22.58 | % | | | 18.95 | % | | | 13.91 | % | | | 13.69 | % | | | 24.58 | % |
| |
| Ratios/supplemental data |
Net assets, end of period (000’s omitted) | | $ | 126,637 | | | $ | 15,105 | | | $ | 41,280 | | | $ | 32,506 | | | $ | 14,767 | |
Ratio of expenses to average net assets: |
| Before fees paid indirectly through commission recapture | | | 1.54 | % | | | 1.65 | % | | | 1.65 | % | | | 1.79 | % | | | 1.91 | % |
| After fees paid indirectly through commission recapture | | | 1.54 | % | | | 1.65 | % | | | 1.61 | % | | | 1.74 | % | | | 1.91 | % |
Ratio of net investment income (loss) to average net assets | | | (0.09 | )% | | | 0.48 | % | | | 0.45 | % | | | (0.48 | )% | | | (1.16 | )% |
Portfolio turnover rate | | | 168.61 | % | | | 319.28 | % | | | 185.71 | % | | | 204.59 | % | | | 332.70 | % |
| |
| (1) | | The average shares outstanding method has been applied for per share information. |
| | | |
| (2) | | Total investment return is based on the change in net asset value of a share during the period and assumes reinvestments of dividends and distributions
at net asset value and does not reflect the impact of sales charge. |
The accompanying notes are an integral part of the financial statements.
2 0 0 8 A N N U A L R E P O R T ½ 43
Financial Highlights
Quaker Capital Opportunities Fund
(For a Share Outstanding Throughout the Period)
| | | | | | | | | | | | | | | | | | | | | |
| | | | Class A | |
| | | |
| | | Year | | Year | | Year | | Year | | Year |
| | | Ended | | Ended | | Ended | | Ended | | Ended |
| | | June 30, | | June 30, | | June 30, | | June 30, | | June 30, |
| | | 2008 | | 2007 | | 2006 | | 2005 | | 2004 |
| |
Net asset value, beginning of period | | $ | 11.30 | | | $ | 11.07 | | | $ | 11.29 | | | $ | 11.45 | | | $ | 9.05 | |
| |
| Income from investment operations |
Net investment income (loss)(1) | | | 0.02 | | | | 0.02 | | | | (0.05 | ) | | | (0.12 | ) | | | (0.13 | ) |
| Net realized and unrealized gain (loss) on investments | | | (0.26 | ) | | | 1.01 | | | | 0.85 | | | | 1.19 | | | | 2.64 | |
| |
Total from investment operations | | | (0.24 | ) | | | 1.03 | | | | 0.80 | | | | 1.07 | | | | 2.51 | |
| |
| Distributions to shareholders from: |
| Net realized capital gain | | | (1.75 | ) | | | (0.80 | ) | | | (1.02 | ) | | | (1.23 | ) | | | (0.11 | ) |
| Return of capital | | | (0.07 | ) | | | — | | | | — | | | | — | | | | — | |
| |
Total distributions | | | (1.82 | ) | | | (0.80 | ) | | | (1.02 | ) | | | (1.23 | ) | | | (0.11 | ) |
| |
Net asset value, end of period | | $ | 9.24 | | | $ | 11.30 | | | $ | 11.07 | | | $ | 11.29 | | | $ | 11.45 | |
| |
Total Return(2) | | | (3.63 | )% | | | 9.67 | % | | | 7.05 | % | | | 9.66 | % | | | 27.83 | % |
| |
| Ratios/supplemental data |
Net assets, end of period (000’s omitted) | | $ | 7,007 | | | $ | 8,016 | | | $ | 12,482 | | | $ | 11,970 | | | $ | 7,250 | |
Ratio of expenses to average net assets: |
| Before expense reimbursements and waived fees | | | 1.59 | % | | | 1.76 | % | | | 1.72 | % | | | 1.95 | % | | | 1.98 | % |
| After expense reimbursements and waived fees | | | 1.59 | % | | | 1.76 | % | | | 1.67 | % | | | 1.95 | % | | | 1.98 | % |
Ratio of net investment income (loss) to average net assets | | | 0.15 | % | | | 0.22 | % | | | (0.41 | )% | | | (1.08 | )% | | | (1.12 | )% |
Portfolio turnover rate | | | 75.18 | % | | | 87.48 | % | | | 129.29 | % | | | 226.62 | % | | | 230.58 | % |
| |
| (1) | | The average shares outstanding method has been applied for per share information. |
| | | |
| (2) | | Total investment return is based on the change in net asset value of a share during the period and assumes reinvestments of dividends and distributions
at net asset value and does not reflect the impact of sales charge. |
44 ½ 2 0 0 8 A N N U A L R E P O R T
| | | | | | | | | | | | | | | | | | | | | |
| | | | Class B | |
| | | |
| | | Year | | Year | | Year | | Year | | Year |
| | | Ended | | Ended | | Ended | | Ended | | Ended |
| | | June 30, | | June 30, | | June 30, | | June 30, | | June 30, |
| | | 2008 | | 2007 | | 2006 | | 2005 | | 2004 |
| |
Net asset value, beginning of period | | $ | 10.92 | | | $ | 10.81 | | | $ | 11.12 | | | $ | 11.38 | | | $ | 9.05 | |
| |
| Income from investment operations |
Net investment loss(1) | | | (0.12 | ) | | | (0.06 | ) | | | (0.13 | ) | | | (0.21 | ) | | | (0.19 | ) |
| Net realized and unrealized gain (loss) on investments | | | (0.17 | ) | | | 0.97 | | | | 0.84 | | | | 1.18 | | | | 2.63 | |
| |
Total from investment operations | | | (0.29 | ) | | | 0.91 | | | | 0.71 | | | | 0.97 | | | | 2.44 | |
| |
| Distributions to shareholders from: |
| Net realized capital gain | | | (1.75 | ) | | | (0.80 | ) | | | (1.02 | ) | | | (1.23 | ) | | | (0.11 | ) |
| Return of capital | | | (0.07 | ) | | | — | | | | — | | | | — | | | | — | |
| |
Total distributions | | | (1.82 | ) | | | (0.80 | ) | | | (1.02 | ) | | | (1.23 | ) | | | (0.11 | ) |
| |
Net asset value, end of period | | $ | 8.81 | | | $ | 10.92 | | | $ | 10.81 | | | $ | 11.12 | | | $ | 11.38 | |
| |
Total Return(2) | | | (4.29 | )% | | | 8.76 | % | | | 6.31 | % | | | 8.80 | % | | | 27.05 | % |
| |
| Ratios/supplemental data |
Net assets, end of period (000’s omitted) | | $ | 321 | | | $ | 597 | | | $ | 886 | | | $ | 1,176 | | | $ | 1,098 | |
Ratio of expenses to average net assets: |
| Before expense reimbursements and waived fees | | | 2.35 | % | | | 2.51 | % | | | 2.47 | % | | | 2.70 | % | | | 2.73 | % |
| After expense reimbursements and waived fees | | | 2.35 | % | | | 2.51 | % | | | 2.42 | % | | | 2.70 | % | | | 2.73 | % |
Ratio of net investment loss to average net assets | | | (1.15 | )% | | | (0.53 | )% | | | (1.16 | )% | | | (1.83 | )% | | | (1.87 | )% |
Portfolio turnover rate | | | 75.18 | % | | | 87.48 | % | | | 129.29 | % | | | 226.62 | % | | | 230.58 | % |
| |
| (1) | | The average shares outstanding method has been applied for per share information. |
| | | |
| (2) | | Total investment return is based on the change in net asset value of a share during the period and assumes reinvestments of dividends and distributions at net asset value and does not reflect the impact of sales charge. |
The accompanying notes are an integral part of the financial statements.
2 0 0 8 A N N U A L R E P O R T ½ 45
Financial Highlights
Quaker Capital Opportunities Fund
(For a Share Outstanding Throughout the Period)
| | | | | | | | | | | | | | | | | | | | | |
| | | | Class C | |
| | | |
| | | Year | | Year | | Year | | Year | | Year |
| | | Ended | | Ended | | Ended | | Ended | | Ended |
| | | June 30, | | June 30, | | June 30, | | June 30, | | June 30, |
| | | 2008 | | 2007 | | 2006 | | 2005 | | 2004 |
| |
Net asset value, beginning of period | | $ | 10.92 | | | $ | 10.81 | | | $ | 11.12 | | | $ | 11.38 | | | $ | 9.05 | |
| |
| Income from investment operations |
Net investment loss(1) | | | (0.10 | ) | | | (0.06 | ) | | | (0.13 | ) | | | (0.21 | ) | | | (0.19 | ) |
| Net realized and unrealized gain (loss) on investments | | | (0.20 | ) | | | 0.97 | | | | 0.84 | | | | 1.18 | | | | 2.63 | |
| |
Total from investment operations | | | (0.30 | ) | | | 0.91 | | | | 0.71 | | | | 0.97 | | | | 2.44 | |
| |
| Distributions to shareholders from: |
| Net realized capital gain | | | (1.75 | ) | | | (0.80 | ) | | | (1.02 | ) | | | (1.23 | ) | | | (0.11 | ) |
| |
| Return of capital | | | (0.07 | ) | | | — | | | | — | | | | — | | | | — | |
| |
Total distributions | | | (1.82 | ) | | | (0.80 | ) | | | (1.02 | ) | | | (1.23 | ) | | | (0.11 | ) |
| |
Net asset value, end of period | | $ | 8.80 | | | $ | 10.92 | | | $ | 10.81 | | | $ | 11.12 | | | $ | 11.38 | |
| |
Total Return(2) | | | (4.38 | )% | | | 8.76 | % | | | 6.32 | % | | | 8.80 | % | | | 27.05 | % |
| |
| Ratios/supplemental data |
Net assets, end of period (000’s omitted) | | $ | 5,322 | | | $ | 8,449 | | | $ | 11,423 | | | $ | 11,932 | | | $ | 10,757 | |
Ratio of expenses to average net assets: |
| Before expense reimbursements and waived fees | | | 2.34 | % | | | 2.51 | % | | | 2.47 | % | | | 2.70 | % | | | 2.73 | % |
| After expense reimbursements and waived fees | | | 2.34 | % | | | 2.51 | % | | | 2.42 | % | | | 2.70 | % | | | 2.73 | % |
Ratio of net investment loss to average net assets | | | (1.01 | )% | | | (0.53 | )% | | | (1.16 | )% | | | (1.83 | )% | | | (1.87 | )% |
Portfolio turnover rate | | | 75.18 | % | | | 87.48 | % | | | 129.29 | % | | | 226.62 | % | | | 230.58 | % |
| |
| (1) | | The average shares outstanding method has been applied for per share information. |
| | | |
| (2) | | Total investment return is based on the change in net asset value of a share during the period and assumes reinvestments of dividends and distributions
at net asset value and does not reflect the impact of sales charge. |
46 ½ 2 0 0 8 A N N U A L R E P O R T
[This page is intentionally left blank]
Financial Highlights
Quaker Mid-Cap Value Fund
(For a Share Outstanding Throughout the Period)
| | | | | | | | | | | | | | | | | | | | | |
| | | | Class A | |
| | | |
| | | Year | | Year | | Year | | Year | | Year |
| | | Ended | | Ended | | Ended | | Ended | | Ended |
| | | June 30, | | June 30, | | June 30, | | June 30, | | June 30, |
| | | 2008 | | 2007 | | 2006 | | 2005 | | 2004 |
| |
Net asset value, beginning of period | | $ | 17.84 | | | $ | 15.89 | | | $ | 16.67 | | | $ | 16.03 | | | $ | 10.75 | |
| |
Income From Investment Operations | | | | | | | | | | | | | | | | | | | | |
Net investment loss(1) | | | (0.06 | ) | | | (0.09 | ) | | | (0.10 | ) | | | (0.09 | ) | | | (0.13 | ) |
| Net realized and unrealized gain (loss) on investments | | | (2.74 | ) | | | 2.37 | | | | 1.75 | | | | 2.09 | | | | 5.41 | |
| |
Total from investment operations | | | (2.80 | ) | | | 2.28 | | | | 1.65 | | | | 2.00 | | | | 5.28 | |
| |
Distributions to shareholders from: | | | | | | | | | | | | | | | | | | | | |
| Net realized capital gain | | | (0.62 | ) | | | (0.33 | ) | | | (2.43 | ) | | | (1.36 | ) | | | — | |
| |
Total distributions | | | (0.62 | ) | | | (0.33 | ) | | | (2.43 | ) | | | (1.36 | ) | | | — | |
| |
Net asset value, end of period | | $ | 14.42 | | | $ | 17.84 | | | $ | 15.89 | | | $ | 16.67 | | | $ | 16.03 | |
| |
Total Return(2) | | | (15.92 | )% | | | 14.51 | % | | | 10.32 | % | | | 12.57 | % | | | 49.12 | % |
| |
Ratios/supplemental data | | | | | | | | | | | | | | | | | | | | |
Net assets, end of period (000’s omitted) | | $ | 17,118 | | | $ | 135,680 | | | $ | 70,866 | | | $ | 40,198 | | | $ | 30,393 | |
Ratio of expenses to average net assets: | | | | | | | | | | | | | | | | | | | | |
| Before expense reimbursements and waived fees | | | 1.64 | % | | | 1.64 | %* | | | 1.69 | %* | | | 1.84 | %* | | | 2.01 | %* |
| After expense reimbursements and waived fees | | | 1.59 | % | | | 1.64 | %* | | | 1.65 | %* | | | 1.66 | %* | | | 2.01 | %* |
Ratio of net investment loss to average net assets | | | (0.36 | )% | | | (0.56 | )% | | | (0.60 | )% | | | (0.55 | )% | | | (0.84 | )% |
Portfolio turnover rate | | | 221.17 | % | | | 74.49 | % | | | 82.01 | % | | | 186.72 | % | | | 134.73 | % |
| |
| (1) | | The average shares outstanding method has been applied for per share information. |
| | | |
| (2) | | Total investment return is based on the change in net asset value of a share during the period and assumes reinvestments of dividends and distributions
at net asset value and does not reflect the impact of sales charge. |
| | | |
| * | | The difference between before and after ratios is attributed to fees paid indirectly through commission recapture. |
48 ½ 2 0 0 8 A N N U A L R E P O R T
| | | | | | | | | | | | | | | | | | | | | |
| | | | Class B | |
| | | |
| | | Year | | Year | | Year | | Year | | Year |
| | | Ended | | Ended | | Ended | | Ended | | Ended |
| | | June 30, | | June 30, | | June 30, | | June 30, | | June 30, |
| | | 2008 | | 2007 | | 2006 | | 2005 | | 2004 |
| |
Net asset value, beginning of period | | $ | 16.93 | | | $ | 15.20 | | | $ | 16.16 | | | $ | 15.69 | | | $ | 10.60 | |
| |
Income From Investment Operations | | | | | | | | | | | | | | | | | | | | |
Net investment loss(1) | | | (0.19 | ) | | | (0.21 | ) | | | (0.22 | ) | | | (0.20 | ) | | | (0.21 | ) |
| Net realized and unrealized gain (loss) on investments | | | (2.56 | ) | | | 2.27 | | | | 1.69 | | | | 2.03 | | | | 5.30 | |
| |
Total from investment operations | | | (2.75 | ) | | | 2.06 | | | | 1.47 | | | | 1.83 | | | | 5.09 | |
| |
Distributions to shareholders from: | | | | | | | | | | | | | | | | | | | | |
| Net realized capital gain | | | (0.62 | ) | | | (0.33 | ) | | | (2.43 | ) | | | (1.36 | ) | | | — | |
| |
Total distributions | | | (0.62 | ) | | | (0.33 | ) | | | (2.43 | ) | | | (1.36 | ) | | | — | |
| |
Net asset value, end of period | | $ | 13.56 | | | $ | 16.93 | | | $ | 15.20 | | | $ | 16.16 | | | $ | 15.69 | |
| |
Total Return(2) | | | (16.49 | )% | | | 13.72 | % | | | 9.47 | % | | | 11.73 | % | | | 48.02 | % |
| |
Ratios/supplemental data | | | | | | | | | | | | | | | | | | | | |
Net assets, end of period (000’s omitted) | | $ | 468 | | | $ | 2,273 | | | $ | 2,188 | | | $ | 2,452 | | | $ | 3,055 | |
Ratio of expenses to average net assets: | | | | | | | | | | | | | | | | | | | | |
| Before expense reimbursements and waived fees | | | 2.53 | % | | | 2.39 | %* | | | 2.44 | %* | | | 2.59 | %* | | | 2.76 | %* |
| After expense reimbursements and waived fees | | | 2.48 | % | | | 2.39 | %* | | | 2.40 | %* | | | 2.41 | %* | | | 2.76 | %* |
Ratio of net investment loss to average net assets | | | (1.24 | )% | | | (1.31 | )% | | | (1.35 | )% | | | (1.30 | )% | | | (1.59 | )% |
Portfolio turnover rate | | | 221.17 | % | | | 74.49 | % | | | 82.01 | % | | | 186.72 | % | | | 134.73 | % |
| |
| (1) | | The average shares outstanding method has been applied for per share information. |
| | | |
| (2) | | Total investment return is based on the change in net asset value of a share during the period and assumes reinvestments of dividends and distributions
at net asset value and does not reflect the impact of sales charge. |
| | | |
| * | | The difference between before and after ratios is attributed to fees paid indirectly through commission recapture. |
The accompanying notes are an integral part of the financial statements.
2 0 0 8 A N N U A L R E P O R T ½ 49
Financial Highlights
Quaker Mid-Cap Value Fund
(For a Share Outstanding Throughout the Period)
| | | | | | | | | | | | | | | | | | | | | |
| | | | Class C | |
| | | |
| | | Year | | Year | | Year | | Year | | Year |
| | | Ended | | Ended | | Ended | | Ended | | Ended |
| | | June 30, | | June 30, | | June 30, | | June 30, | | June 30, |
| | | 2008 | | 2007 | | 2006 | | 2005 | | 2004 |
| |
Net asset value, beginning of period | | $ | 16.65 | | | $ | 14.96 | | | $ | 15.94 | | | $ | 15.49 | | | $ | 10.47 | |
| |
Income From Investment Operations | | | | | | | | | | | | | | | | | | | | |
Net investment loss(1) | | | (0.19 | ) | | | (0.20 | ) | | | (0.21 | ) | | | (0.20 | ) | | | (0.21 | ) |
| Net realized and unrealized gain (loss) on investments | | | (2.52 | ) | | | 2.22 | | | | 1.66 | | | | 2.01 | | | | 5.23 | |
| |
Total from investment operations | | | (2.71 | ) | | | 2.02 | | | | 1.45 | | | | 1.81 | | | | 5.02 | |
| |
Distributions to shareholders from: | | | | | | | | | | | | | | | | | | | | |
| Net realized capital gain | | | (0.62 | ) | | | (0.33 | ) | | | (2.43 | ) | | | (1.36 | ) | | | — | |
| |
Total distributions | | | (0.62 | ) | | | (0.33 | ) | | | (2.43 | ) | | | (1.36 | ) | | | — | |
| |
Net asset value, end of period | | $ | 13.32 | | | $ | 16.65 | | | $ | 14.96 | | | $ | 15.94 | | | $ | 15.49 | |
| |
Total Return(2) | | | (16.53 | )% | | | 13.67 | % | | | 9.47 | % | | | 11.75 | % | | | 47.95 | % |
| |
Ratios/supplemental data | | | | | | | | | | | | | | | | | | | | |
Net assets, end of period (000’s omitted) | | $ | 5,801 | | | $ | 14,975 | | | $ | 16,458 | | | $ | 13,379 | | | $ | 9,138 | |
Ratio of expenses to average net assets: | | | | | | | | | | | | | | | | | | | | |
| Before expense reimbursements and waived fees | | | 2.57 | % | | | 2.39 | %* | | | 2.44 | %* | | | 2.59 | %* | | | 2.76 | %* |
| After expense reimbursements and waived fees | | | 2.52 | % | | | 2.39 | %* | | | 2.40 | %* | | | 2.41 | %* | | | 2.76 | %* |
Ratio of net investment loss to average net assets | | | (1.27 | )% | | | (1.31 | )% | | | (1.35 | )% | | | (1.30 | )% | | | (1.59 | )% |
Portfolio turnover rate | | | 221.17 | % | | | 74.49 | % | | | 82.01 | % | | | 186.72 | % | | | 134.73 | % |
| |
| (1) | | The average shares outstanding method has been applied for per share information. |
| | | |
| (2) | | Total investment return is based on the change in net asset value of a share during the period and assumes reinvestments of dividends and distributions
at net asset value and does not reflect the impact of sales charge. |
| | | |
| * | | The difference between before and after ratios is attributed to fees paid indirectly through commission recapture. |
50 ½ 2 0 0 8 A N N U A L R E P O R T
| | | | | | | | | | | | | | | | | | | | | |
| | | | Institutional Class | |
| | | |
| | | Year | | Year | | Year | | Year | | Year |
| | | Ended | | Ended | | Ended | | Ended | | Ended |
| | | June 30, | | June 30, | | June 30, | | June 30, | | June 30, |
| | | 2008 | | 2007 | | 2006 | | 2005 | | 2004 |
| |
Net asset value, beginning of period | | $ | 18.33 | | | $ | 16.27 | | | $ | 16.98 | | | $ | 16.27 | | | $ | 10.88 | |
| |
Income From Investment Operations | | | | | | | | | | | | | | | | | | | | |
Net investment loss(1) | | | (0.05 | ) | | | (0.05 | ) | | | (0.06 | ) | | | (0.05 | ) | | | (0.07 | ) |
| Net realized and unrealized gain (loss) on investments | | | (2.79 | ) | | | 2.44 | | | | 1.78 | | | | 2.12 | | | | 5.46 | |
| |
Total from investment operations | | | (2.84 | ) | | | 2.39 | | | | 1.72 | | | | 2.07 | | | | 5.39 | |
| |
Distributions to shareholders from: | | | | | | | | | | | | | | | | | | | | |
| Net realized capital gain | | | (0.62 | ) | | | (0.33 | ) | | | (2.43 | ) | | | (1.36 | ) | | | — | |
| |
Total distributions | | | (0.62 | ) | | | (0.33 | ) | | | (2.43 | ) | | | (1.36 | ) | | | — | |
| |
Net asset value, end of period | | $ | 14.87 | | | $ | 18.33 | | | $ | 16.27 | | | $ | 16.98 | | | $ | 16.27 | |
| |
Total Return(2) | | | (15.70 | )% | | | 14.85 | % | | | 10.56 | % | | | 12.83 | % | | | 49.54 | % |
| |
Ratios/supplemental data | | | | | | | | | | | | | | | | | | | | |
Net assets, end of period (000’s omitted) | | $ | 511 | | | $ | 1,902 | | | $ | 1,503 | | | $ | 1,752 | | | $ | 1,672 | |
Ratio of expenses to average net assets: | | | | | | | | | | | | | | | | | | | | |
| Before expense reimbursements and waived fees | | | 1.63 | % | | | 1.39 | %* | | | 1.44 | %* | | | 1.59 | %* | | | 1.76 | %* |
| After expense reimbursements and waived fees | | | 1.58 | % | | | 1.39 | %* | | | 1.40 | %* | | | 1.41 | %* | | | 1.76 | %* |
Ratio of net investment loss to average net assets | | | (0.30 | )% | | | (0.31 | )% | | | (0.35 | )% | | | (0.30 | )% | | | (0.59 | )% |
Portfolio turnover rate | | | 221.17 | % | | | 74.49 | % | | | 82.01 | % | | | 186.72 | % | | | 134.73 | % |
| |
| (1) | | The average shares outstanding method has been applied for per share information. |
| | | |
| (2) | | Total investment return is based on the change in net asset value of a share during the period and assumes reinvestments of dividends and distributions
at net asset value and does not reflect the impact of sales charge. |
| | | |
| * | | The difference between before and after ratios is attributed to fees paid indirectly through commission recapture. |
The accompanying notes are an integral part of the financial statements.
2 0 0 8 A N N U A L R E P O R T ½ 51
Financial Highlights
Quaker Small-Cap Value Fund
(For a Share Outstanding Throughout the Period)
| | | | | | | | | | | | | | | | | | | | | |
| | | | Class A | |
| | | |
| | | Year | | Year | | Year | | Year | | Year |
| | | Ended | | Ended | | Ended | | Ended | | Ended |
| | | June 30, | | June 30, | | June 30, | | June 30, | | June 30, |
| | | 2008 | | 2007 | | 2006 | | 2005 | | 2004 |
| |
Net asset value, beginning of period | | $ | 20.71 | | | $ | 19.51 | | | $ | 19.39 | | | $ | 18.95 | | | $ | 14.17 | |
| |
Income from investment operations | | | | | | | | | | | | | | | | | | | | |
Net investment loss(1) | | | (0.07 | ) | | | (0.05 | ) | | | (0.17 | ) | | | (0.14 | ) | | | (0.09 | ) |
| Net realized and unrealized gain (loss) on investments | | | (3.51 | ) | | | 3.39 | | | | 3.23 | | | | 2.39 | | | | 4.90 | |
| |
Total from investment operations | | | (3.58 | ) | | | 3.34 | | | | 3.06 | | | | 2.25 | | | | 4.81 | |
| |
Distributions to shareholders from: | | | | | | | | | | | | | | | | | | | | |
| Net realized capital gain | | | (3.25 | ) | | | (2.14 | ) | | | (2.94 | ) | | | (1.81 | ) | | | (0.03 | ) |
| |
Total distributions | | | (3.25 | ) | | | (2.14 | ) | | | (2.94 | ) | | | (1.81 | ) | | | (0.03 | ) |
| |
Net asset value, end of period | | $ | 13.88 | | | $ | 20.71 | | | $ | 19.51 | | | $ | 19.39 | | | $ | 18.95 | |
| |
Total Return(2) | | | (17.86 | )% | | | 18.22 | % | | | 16.76 | % | | | 12.17 | % | | | 33.97 | % |
| |
Ratios/supplemental data | | | | | | | | | | | | | | | | | | | | |
Net assets, end of period (000’s omitted) | | $ | 27,722 | | | $ | 46,385 | | | $ | 36,735 | | �� | $ | 21,818 | | | $ | 17,516 | |
Ratio of expenses to average net assets: | | | | | | | | | | | | | | | | | | | | |
| Before expense reimbursements and waived fees | | | 1.78 | % | | | 1.82 | % | | | 1.83 | % | | | 1.94 | % | | | 1.68 | % |
| After expense reimbursements and waived fees | | | 1.70 | % | | | 1.73 | % | | | 1.75 | % | | | 1.94 | % | | | 1.68 | % |
Ratio of net investment loss to average net assets | | | (0.44 | )% | | | (0.27 | )% | | | (0.83 | )% | | | (0.75 | )% | | | (0.52 | )% |
Portfolio turnover rate | | | 129.58 | % | | | 144.26 | % | | | 129.64 | % | | | 127.20 | % | | | 101.86 | % |
| |
| (1) | | The average shares outstanding method has been applied for per share information. |
| | | |
| (2) | | Total investment return is based on the change in net asset value of a share during the period and assumes reinvestments of dividends and distributions at net asset value and does not reflect the impact of sales charge. |
52 ½ 2 0 0 8 A N N U A L R E P O R T
| | | | | | | | | | | | | | | | | | | | | |
| | | | Class B | |
| | | |
| | | Year | | Year | | Year | | Year | | Year |
| | | Ended | | Ended | | Ended | | Ended | | Ended |
| | | June 30, | | June 30, | | June 30, | | June 30, | | June 30, |
| | | 2008 | | 2007 | | 2006 | | 2005 | | 2004 |
| |
Net asset value, beginning of period | | $ | 19.38 | | | $ | 18.52 | | | $ | 18.66 | | | $ | 18.43 | | | $ | 13.89 | |
| |
Income from investment operations | | | | | | | | | | | | | | | | | | | | |
Net investment loss(1) | | | (0.19 | ) | | | (0.19 | ) | | | (0.30 | ) | | | (0.27 | ) | | | (0.21 | ) |
| Net realized and unrealized gain (loss) on investments | | | (3.27 | ) | | | 3.19 | | | | 3.10 | | | | 2.31 | | | | 4.78 | |
| |
Total from investment operations | | | (3.46 | ) | | | 3.00 | | | | 2.80 | | | | 2.04 | | | | 4.57 | |
| |
Distributions to shareholders from: | | | | | | | | | | | | | | | | | | | | |
| Net realized capital gain | | | (3.25 | ) | | | (2.14 | ) | | | (2.94 | ) | | | (1.81 | ) | | | (0.03 | ) |
| |
Total distributions | | | (3.25 | ) | | | (2.14 | ) | | | (2.94 | ) | | | (1.81 | ) | | | (0.03 | ) |
| |
Net asset value, end of period | | $ | 12.67 | | | $ | 19.38 | | | $ | 18.52 | | | $ | 18.66 | | | $ | 18.43 | |
| |
Total Return(2) | | | (18.53 | )% | | | 17.31 | % | | | 15.95 | % | | | 11.33 | % | | | 32.93 | % |
| |
Ratios/supplemental data | | | | | | | | | | | | | | | | | | | | |
Net assets, end of period (000’s omitted) | | $ | 261 | | | $ | 1,023 | | | $ | 1,052 | | | $ | 1,005 | | | $ | 985 | |
Ratio of expenses to average net assets: | | | | | | | | | | | | | | | | | | | | |
| Before expense reimbursements and waived fees | | | 2.52 | % | | | 2.57 | % | | | 2.58 | % | | | 2.69 | % | | | 2.43 | % |
| After expense reimbursements and waived fees | | | 2.44 | % | | | 2.48 | % | | | 2.50 | % | | | 2.69 | % | | | 2.43 | % |
Ratio of net investment loss to average net assets | | | (1.23 | )% | | | (1.02 | )% | | | (1.58 | )% | | | (1.50 | )% | | | (1.27 | )% |
Portfolio turnover rate | | | 129.58 | % | | | 144.26 | % | | | 129.64 | % | | | 127.20 | % | | | 101.86 | % |
| |
| (1) | | The average shares outstanding method has been applied for per share information. |
| | | |
| (2) | | Total investment return is based on the change in net asset value of a share during the period and assumes reinvestments of dividends and distributions
at net asset value and does not reflect the impact of sales charge. |
The accompanying notes are an integral part of the financial statements.
2 0 0 8 A N N U A L R E P O R T ½ 53
Financial Highlights
Quaker Small-Cap Value Fund
(For a Share Outstanding Throughout the Period)
| | | | | | | | | | | | | | | | | | | | | |
| | | | Class C | |
| | | |
| | | Year | | Year | | Year | | Year | | Year |
| | | Ended | | Ended | | Ended | | Ended | | Ended |
| | | June 30, | | June 30, | | June 30, | | June 30, | | June 30, |
| | | 2008 | | 2007 | | 2006 | | 2005 | | 2004 |
| |
Net asset value, beginning of period | | $ | 18.77 | | | $ | 17.99 | | | $ | 18.21 | | | $ | 18.02 | | | $ | 13.56 | |
| |
Income from investment operations | | | | | | | | | | | | | | | | | | | | |
Net investment loss(1) | | | (0.18 | ) | | | (0.18 | ) | | | (0.29 | ) | | | (0.27 | ) | | | (0.21 | ) |
| Net realized and unrealized gain (loss) on investments | | | (3.16 | ) | | | 3.10 | | | | 3.01 | | | | 2.27 | | | | 4.70 | |
| |
Total from investment operations | | | (3.34 | ) | | | 2.92 | | | | 2.72 | | | | 2.00 | | | | 4.49 | |
| |
Distributions to shareholders from: | | | | | | | | | | | | | | | | | | | | |
| Net realized capital gain | | | (3.25 | ) | | | (2.14 | ) | | | (2.94 | ) | | | (1.81 | ) | | | (0.03 | ) |
| |
Total distributions | | | (3.25 | ) | | | (2.14 | ) | | | (2.94 | ) | | | (1.81 | ) | | | (0.03 | ) |
| |
Net asset value, end of period | | $ | 12.18 | | | $ | 18.77 | | | $ | 17.99 | | | $ | 18.21 | | | $ | 18.02 | |
| |
Total Return(2) | | | (18.49 | )% | | | 17.38 | % | | | 15.91 | % | | | 11.37 | % | | | 33.14 | % |
| |
Ratios/supplemental data | | | | | | | | | | | | | | | | | | | | |
Net assets, end of period (000’s omitted) | | $ | 4,711 | | | $ | 13,436 | | | $ | 9,884 | | | $ | 6,597 | | | $ | 3,914 | |
Ratio of expenses to average net assets: | | | | | | | | | | | | | | | | | | | | |
| Before expense reimbursements and waived fees | | | 2.52 | % | | | 2.57 | % | | | 2.58 | % | | | 2.69 | % | | | 2.43 | % |
| After expense reimbursements and waived fees | | | 2.44 | % | | | 2.48 | % | | | 2.50 | % | | | 2.69 | % | | | 2.43 | % |
Ratio of net investment loss to average net assets | | | (1.17 | )% | | | (1.02 | )% | | | (1.58 | )% | | | (1.50 | )% | | | (1.27 | )% |
Portfolio turnover rate | | | 129.58 | % | | | 144.26 | % | | | 129.64 | % | | | 127.20 | % | | | 101.86 | % |
| |
| (1) | | The average shares outstanding method has been applied for per share information. |
| | | |
| (2) | | Total investment return is based on the change in net asset value of a share during the period and assumes reinvestments of dividends and distributions
at net asset value and does not reflect the impact of sales charge. |
54 ½ 2 0 0 8 A N N U A L R E P O R T
| | | | | | | | | | | | | | | | | | | | | |
| | | | Institutional Class | |
| | | |
| | | Year | | Year | | Year | | Year | | Year |
| | | Ended | | Ended | | Ended | | Ended | | Ended |
| | | June 30, | | June 30, | | June 30, | | June 30, | | June 30, |
| | | 2008 | | 2007 | | 2006 | | 2005 | | 2004 |
| |
Net asset value, beginning of period | | $ | 21.19 | | | $ | 19.88 | | | $ | 19.65 | | | $ | 19.14 | | | $ | 14.28 | |
| |
Income from investment operations | | | | | | | | | | | | | | | | | | | | |
Net investment loss(1) | | | (0.03 | ) | | | — | | | | (0.12 | ) | | | (0.09 | ) | | | (0.05 | ) |
| Net realized and unrealized gain (loss) on investments | | | (3.59 | ) | | | 3.45 | | | | 3.29 | | | | 2.41 | | | | 4.94 | |
| |
Total from investment operations | | | (3.62 | ) | | | 3.45 | | | | 3.17 | | | | 2.32 | | | | 4.89 | |
| |
Distributions to shareholders from: | | | | | | | | | | | | | | | | | | | | |
| Net realized capital gain | | | (3.25 | ) | | | (2.14 | ) | | | (2.94 | ) | | | (1.81 | ) | | | (0.03 | ) |
| |
Total distributions | | | (3.25 | ) | | | (2.14 | ) | | | (2.94 | ) | | | (1.81 | ) | | | (0.03 | ) |
| |
Net asset value, end of period | | $ | 14.32 | | | $ | 21.19 | | | $ | 19.88 | | | $ | 19.65 | | | $ | 19.14 | |
| |
Total Return(2) | | | (17.62 | )% | | | 18.44 | % | | | 17.12 | % | | | 12.42 | % | | | 34.27 | % |
| |
Ratios/supplemental data | | | | | | | | | | | | | | | | | | | | |
Net assets, end of period (000’s omitted) | | $ | 23,528 | | | $ | 30,540 | | | $ | 28,727 | | | $ | 26,963 | | | $ | 25,783 | |
Ratio of expenses to average net assets: | | | | | | | | | | | | | | | | | | | | |
| Before expense reimbursements and waived fees | | | 1.54 | % | | | 1.57 | % | | | 1.58 | % | | | 1.69 | % | | | 1.43 | % |
| After expense reimbursements and waived fees | | | 1.46 | % | | | 1.48 | % | | | 1.50 | % | | | 1.69 | % | | | 1.43 | % |
Ratio of net investment loss to average net assets | | | (0.20 | )% | | | (0.02 | )% | | | (0.58 | )% | | | (0.50 | )% | | | (0.27 | )% |
Portfolio turnover rate | | | 129.58 | % | | | 144.26 | % | | | 129.64 | % | | | 127.20 | % | | | 101.86 | % |
| |
| (1) | | The average shares outstanding method has been applied for per share information. |
| | | |
| (2) | | Total investment return is based on the change in net asset value of a share during the period and assumes reinvestments of dividends and distributions
at net asset value and does not reflect the impact of sales charge. |
The accompanying notes are an integral part of the financial statements.
2 0 0 8 A N N U A L R E P O R T ½ 55
Notes to the Financial Statements
Note 1 — Organization
The Quaker Investment Trust (the “Trust”), a diversified, open-end management investment company, was organized as a Massachusetts business trust on October 24, 1990, and is registered under the Investment Company Act of 1940, as amended (the “1940 Act”), as an open-end management investment company. The Trust’s Amended and Restated Agreement and Declaration of Trust permits the Trustees to issue an unlimited number of shares of beneficial interest. The Trust currently has six series: Quaker Biotech Pharma-Healthcare Fund (“Biotech”), Quaker Global Total Return Fund (“Global Total Return”), Quaker Strategic Growth Fund (“Strategic Growth”) ,Quaker Capital Opportunities Fund (“Capital Opportunities”), Quaker Mid-Cap Value Fund (“Mid-Cap Value”), and Quaker Small-Cap Value Fund (“Small-Cap Value”) (each a “Fund” and collectively, the “Funds”). The investment objectives of each Fund are set forth below.
Strategic Growth and Small-Cap Value commenced operations on November 25, 1996. Mid-Cap Value commenced operations on December 31, 1997. The investment objective of these Funds is to provide shareholders with long-term growth of capital. Capital Opportunities commenced operations on January 31, 2002. The investment objective of this Fund is to seek long-term growth of capital. Biotech commenced operations on September 23, 2002. The investment objective of this Fund is to seek long-term growth of capital.
Global Total Return commenced operations on May 1, 2008. The investment objective of this Fund is to seek long-term growth of capital. Unlike other Funds in the Trust, this investment objective is non-fundamental in that this objective may be changed by the Board of Trustees without shareholder approval.
Strategic Growth, Capital Opportunities, Small-Cap Value, and Mid-Cap Value offer four classes of shares (Class A, Class B, Class C and Institutional Class shares). Class A shares are charged a front-end sales charge and a distribution and servicing fee; Class B shares bear a contingent deferred sales charge (“CDSC”) of 5.00% that declines to zero in the seventh year after purchase; Class B shares automatically convert to Class A shares once the economic equivalent of a 5.00% sales charge is recovered by the Fund(s) for each investment account, normally after an average of seven years, coupled with additional distribution and servicing fees. Class C shares bear an additional distribution and servicing fee; and Institutional Class shares bear no front-end sales charge or CDSC, but have higher minimum investment limitations. The Adviser has the ability to waive the minimum investment for Institutional Class shares at its discretion.
Biotech offers Class A, Class B and Class C shares. Global Total Return offers Class A, Class C and Institutional Class shares.
Note 2 — Summary of Significant Accounting Policies and Other Information
The following is a summary of significant accounting policies consistently followed by the Funds in the preparation of their financial statements. The policies are in conformity with accounting principles generally accepted in the United States of America.
A. Security Valuation. The Funds’ investments in securities are carried at market value. Securities listed on an exchange or quoted on a national market system are generally valued at the last quoted sales price at the time of valuation. Other securities traded in the over-the-counter market and listed securities for which no sale was reported on that date are valued at the most recent bid price. Each security reported on the NASDAQ National Market System is valued at the NASDAQ Official Closing Price.
The Funds have adopted fair valuation procedures to value securities at fair market value in certain circumstances and have established a Valuation Committee responsible for determining when fair valuing a security is necessary and appropriate. The Funds will value securities at fair market value when market quotations are not readily available or when securities cannot be accurately valued within established pricing procedures. The Valuation Committee may also fair value foreign securities whose prices may have been affected by events occurring after the close of trading in their respective markets but prior to the time the Fund holding the foreign securities calculates its net asset value. The Funds’ fair valuation procedures are designed to help ensure that prices at which Fund shares are purchased and redeemed are fair and do not result in dilution of shareholder interest or other harm to shareholders.
Short-term investments are valued at amortized cost, which approximates fair market value.
B. Federal Income Taxes. It is the Funds’ policy to comply with the requirements of Subchapter M of the Internal Revenue Code and to distribute substantially all of their taxable income to shareholders. Therefore, no federal income tax provision is required.
In June 2006, the Financial Accounting Standards Board issued Interpretation No. 48, Accounting for Uncertainty in Income Taxes (“FIN 48”). FIN 48 sets forth a recognition threshold and measurement method for the financial statement recognition and measurement of a tax position taken or expected to be taken on a tax return. FIN 48 was effective for fiscal years beginning after December 15, 2006, and was applied to all open tax years as of the effective date. Management has reviewed the tax positions for each of the four open tax years as of June 30, 2008 and has determined that the implementation of FIN 48 does not have a material impact
56 ½ 2 0 0 8 A N N U A L R E P O R T
BOW/W62664_F13/Quaker Funds_AR08/Current/Pages 58 of 73/Friday August 22 2008
Note 2 — Summary of Significant Accounting Policies and Other Information (Continued)
on the Funds’ financial statements. Each Fund’s federal tax returns for the prior three fiscal years remains subject to examination by the Internal Revenue Service.
Net investment income or loss and net realized gains or losses may differ for financial statement and income tax purposes primarily due to investments that have a different basis for financial statement and income tax purposes. The character of distributions made during the year from net investment income or net realized gains may differ from their ultimate characterization for federal income tax purposes. Also, due to the timing of dividend distributions, the fiscal year in which amounts are distributed may differ from the year that the income or realized gains were recorded by each Fund. Temporary differences that result in over-distribution for financial statement purposes are classified as distributions in excess of net investment income or accumulated net realized gains. Permanent differences in the recognition of earnings are reclassified to additional paid-in capital. Distributions in excess of tax-basis earnings are recorded as a return of capital.
C. Security Transactions and Investment Income. Security transactions are recorded on the trade date. Realized gains and losses are determined using the specific identification cost method. Interest income on debt securities is recorded daily on the accrual basis. Discounts and premiums on debt securities are amortized over their respective lives. Dividend income is recorded on the ex-dividend date, or as soon as information is available to the Fund.
Strategic Growth and Biotech make short sales of investments, which are transactions in which a Fund sells a security it does not own in anticipation of a decline in the fair value of that security. To complete such a transaction, the Fund must borrow the security to make delivery to the buyer. The Fund is then obligated to replace the security borrowed by purchasing it at the market price at the time of replacement. The broker retains the proceeds of short sales to the extent necessary to meet margin requirements until the short position is closed out.
If a security pays a dividend while the fund holds it short; the fund will need to pay the dividend to the original owner of the security. Since the fund borrowed the shares and sold them to a third party, the third party will receive the dividend from the security and the fund will pay the original owner the dividend directly. The fund is not entitled to the dividend because it does not own the shares. A gain, limited to the price at which the Fund sold the security short, or a loss, unlimited in size, will be recognized upon the termination of a short sale.
D. Option Writing. Strategic Growth, Capital Opportunities, Global Total Return and Biotech may write options. When the Fund writes an option, an amount equal to the premium received by the Fund is recorded as a liability and is subsequently adjusted to the current fair value of the option written. Premiums received from writing options that expire unexercised are treated by the Fund on the expiration date as realized gains from investments. The difference between the premium and the amount paid on effecting a closing purchase transaction, including brokerage commissions, is also treated as a realized gain, or, if the premium is less than the amount paid for the closing purchase transaction, as a realized loss. If a call option is exercised, the premium is added to the proceeds from the sale of the underlying security or currency in determining whether the Fund has realized a gain or loss. If a put option is exercised, the premium reduces the cost basis of the securities purchased by the Fund. The Fund as writer of an option bears the market risk of an unfavorable change in the price of the security underlying the written option.
E. Foreign Currency Transactions. Securities and other assets and liabilities denominated in foreign currencies are converted each business day into U.S. dollars based on the prevailing rates of exchange. Purchases and sales of portfolio securities and income and expenses are converted into U.S. dollars on the respective dates of such transactions.
Gains and losses resulting from changes in exchange rates applicable to foreign securities are not reported separately from gains and losses arising from movements in securities prices.
Net realized foreign exchange gains and losses include gains and losses from sales and maturities of foreign currency exchange contracts, gains and losses realized between the trade and settlement dates of foreign securities transactions, and the difference between the amount of dividends, interest and foreign withholding taxes on the Fund’s books and the U.S. dollar equivalent of the amounts actually received. Net unrealized foreign exchange gains and losses include gains and losses from changes in the fair value of assets and liabilities denominated in foreign currencies other than portfolio securities, resulting from changes in exchange rates.
F. Multiple Class Allocations. Each class of shares has equal rights as to earnings and assets except that each class bears different distribution and shareholder servicing expenses. Each class of shares has exclusive voting rights with respect to matters that affect just that class. Income, expenses (other than expenses attributable to a specific class) and realized and unrealized gains or losses on investments are allocated to each class of shares based on its relative net assets.
2 0 0 8 A N N U A L R E P O R T ½ 57
Notes to the Financial Statements
Note 2 — Summary of Significant Accounting Policies and Other Information (Continued)
G. Expense Allocations. Fund expenses that are not series (fund) specific are allocated to each series based upon its relative proportion of net assets to the Funds’ total net assets.
H. Distributions to Shareholders. Each Fund generally declares dividends annually, payable in December, on a date selected by the Trust’s Board of Trustees (“Board” or “Trustees”). In addition, distributions may be made annually in December out of net realized gains through October 31 of that calendar year. Distributions to shareholders are recorded on the ex-dividenddate. Each Fund may make a supplemental distribution subsequent to the end of its fiscal year ending June 30.
I. Use of Estimates. The preparation of financial statements in conformity with accounting principles generally accepted in the United States of America requires management to make estimates and assumptions that affect the reported amounts of assets and liabilities and the disclosure of contingent assets and liabilities at the date of the financial statements, and the reported amounts of revenue and expenses during the reporting period. Actual results could differ from those estimates.
J. Security Loans. The Funds receive compensation in the form of fees, or retain a portion of interest on the investment of any cash received as collateral. The funds also continue to receive interest or dividends on the securities loaned. The loans are secured by collateral at least equal, at all times, to the fair value of the securities loaned plus accrued interest. Gain or loss in the fair value of the securities loaned that may occur during the term of the loan will be for the account of the Funds. The Funds have the right under the lending agreement to recover the securities from the borrower in demand.
Note 3 — Investment Advisory Fee and Other Related Party Transactions
Quaker Funds, Inc. (“QFI”) serves as Investment Advisor to each Fund. Pursuant to separate investment subadvisory agreements, QFI has selected the following persons to serve as sub-advisers:
| | | | | |
| Fund | | | Sub-adviser |
| |
| Biotech | | | Sectoral Asset Management, Inc. | |
| |
| Global Total Return | | | DG Capital Management, Inc. | |
| |
| Strategic Growth | | | DG Capital Management, Inc. | |
| |
| Capital Opportunities | | | Knott Capital Management | |
| |
| Mid-Cap Value | | | Global Capital Management, Inc. | |
| |
The sub-advisers provide each Fund with a continuous program of supervision of the Fund’s assets, including the composition of its portfolio, and furnish advice and recommendations with respect to investments, investment policies and the purchase and sale of securities.
Each Fund paid QFI aggregate fees shown in the table below for the fiscal year ended June 30, 2008. Amounts are expressed as an annualized percentage of average net assets.
| | | | | | | | | | | | | |
| | | | | | | | | | | Advisory & |
| | | Aggregate | | Subadvisory | | subadvisory |
| | | advisory fee | | fee paid by QFI | | fees waived & |
| Fund | | paid to QFI | | to the sub-adviser | | reimbursed |
| |
| Biotech | | | 1.45 | % | | | 0.95 | % | | | 0.15 | % |
| |
| Global Total Return | | | 1.25 | % | | | 0.75 | % | | | N/A | |
| |
| Strategic Growth | | | 1.30 | % | | | 0.75 | % | | | N/A | |
| |
| Capital Opportunities | | | 0.925 | % | | | 0.625 | % | | | N/A | |
| |
| Mid-Cap Value | | | 1.05 | % | | | 0.75 | % | | | 0.05 | % |
| |
| Small-Cap Value | | | 1.20 | % | | | 0.90 | % | | | 0.08 | % |
| |
For the fiscal year ended June 30, 2008, QFI and the sub-advisers earned and reimbursed fees as follows:
| | | | | | | | | | | | | |
| | | | | | | | | | | Advisory & |
| | | Aggregate | | Subadvisory | | subadvisory |
| | | advisory fee | | fee paid by QFI | | fees waived & |
| Fund | | paid to QFI | | to the sub-adviser | | reimbursed |
| |
| Biotech | | $ | 120,924 | | | $ | 79,226 | | | $ | 12,509 | |
| |
| Global Total Return | | | 61,976 | | | | 37,186 | | | | — | |
| |
| Strategic Growth | | | 12,868,888 | | | | 7,424,358 | | | | — | |
| |
| Capital Opportunities | | | 143,940 | | | | 97,257 | | | | — | |
| |
| Mid-Cap Value | | | 1,034,826 | | | | 739,161 | | | | 49,277 | |
| |
| Small-Cap Value | | | 836,633 | | | | 627,475 | | | | 57,220 | |
| |
The sub-adviser to Small-Cap Value has voluntarily waived a portion of its subadvisory fee, resulting in a subadvisory fee rate of 0.85% on the first $25 million of assets of the Fund and 0.80% on all amounts in excess of $25 million, in accordance with the sub-adviser’s “most favored nation” policy that provides for a subadvisory fee based upon a rate no greater than the lowest rate offered by the sub-adviser to another client with a similar investment objective. However, in the event that the investment advisory services provided to that client is terminated, the subadvisory fee rates offered to Small-Cap Value would revert to the contractual fee rate of 0.90% per annum.
QFI voluntarily agreed to waive its management fee to the extent that the total operating expenses of Small-Cap Value (exclusive of interest, taxes, brokerage commissions and other costs incurred in connection with the purchase or sale of portfolio
58 ½ 2 0 0 8 A N N U A L R E P O R T
Note 3 — Investment Advisory Fee and Other Related Party Transactions (Continued)
securities, and extraordinary items) exceed the annual rate of 2.60% for Class A, 3.35% for Classes B and C, and 2.35% for Institutional Class of the average net assets of each class, respectively. QFI currently has no intention to terminate this arrangement; however, it may do so at any time in its sole discretion.
US Bancorp Fund Services, LLC (“USB”), serves as the Funds’ transfer, dividend paying, and shareholder servicing agent (“Transfer Agent”). The Transfer Agent maintains the records of each shareholder’s account, answers shareholder inquiries concerning accounts, processes purchases and redemptions of Fund shares, acts as dividend and distribution disbursing agent and performs other shareholder functions. As compensation for its services, the Transfer Agent receives a fee at the annual rate of 0.0525% of the aggregate of the Trust’s average daily net assets.
Brown Brothers Harriman & Co. serves as fund accountant and administrator (the “Administrator”) for the Trust pursuant to a written agreement with the Trust. The Administrator provides fund accounting services and administrative services to each Fund. As compensation for its services, the Administrator receives a fee at the annual rate of 0.025% for accounting and 0.030% for administration of the aggregate of the Trust’s first $2 billion of average daily net assets and 0.0200% for accounting and 0.0250% for administration for over $2 billion of average daily net assets.
Quasar Distributors, LLC (the “Distributor”) serves as principal underwriter for the Trust. The Trust has adopted distribution and shareholder servicing plans pursuant to Rule 12b-1 of the 1940 Act for each class for each Fund with the exception of Institutional Class. The Class A Plan provides that each Fund may pay a servicing or Rule 12b-1 fee at an annual rate of 0.25% of the Class A average net assets on a monthly basis to persons or institutions for performing certain servicing functions for the Class A shareholders. The Plan also allows the Fund to pay or reimburse expenditures in connection with sales and promotional services related to distribution of the Fund’s shares, including personal services provided to prospective and existing shareholders. The Class B and C Plans provide that each Fund may compensate QFI and others for services provided and expenses incurred in the distribution of shares at an annual rate of 1.00% of the average net assets of each class on a monthly basis.
For the fiscal year ended June 30, 2008, the Distributor received $482,526 in underwriter concessions from the sale of fund shares.
QFI has informed the Trust that for the fiscal year ended June 30, 2008 it received contingent deferred sales charges from certain redemptions of the Funds’ Class B shares and Class C shares of $3,548 and $17,889, respectively. The respective shareholders pay such charges, which are not an expense of the Fund.
Except for the Trust Chief Compliance Officer (“CCO”), employees and Officers of QFI do not receive any compensation from the trust. The General Counsel/CCO of QFI also serves as CCO for the Trust. For the year ended June 30, 2008, the Trust compensated the CCO $199,049.
Brokerage commissions paid and recaptured for the year ended June 30, 2008 were as follows:
| | | | | | | | | |
| | | Commissions | | Commissions |
| Fund | | Paid | | Recaptured |
| |
| Global Total Return | | $ | 3,483 | | | $ | 1,741 | |
| |
| Strategic Growth | | | 539,453 | | | | 269,726 | |
| |
Under the terms of certain commission recapture agreements with Radnor Research & Trading, the commissions recaptured by the Funds were reflected as realized gain (loss) from investments for the fiscal year ended June 30, 2008.
Note 4 — Purchases and Sales of Investments
For the fiscal year ended June 30, 2008, aggregate purchases and sales of investment securities (excluding short-term investments) for each Fund were as follows:
| | | | | | | | | |
| Fund | | Purchases | | Sales |
| |
| Biotech | | $ | 17,477,673 | | | $ | 20,361,205 | |
| |
| Global Total Return | | | 45,254,851 | | | | 9,481,941 | |
| |
| Strategic Growth | | | 1,799,622,644 | | | | 1,411,583,537 | |
| |
| Capital Opportunities | | | 10,363,367 | | | | 15,116,209 | |
| |
| Mid-Cap Value | | | 214,487,750 | | | | 323,158,892 | |
| |
| Small-Cap Value | | | 89,823,672 | | | | 107,415,298 | |
| |
2 0 0 8 A N N U A L R E P O R T ½ 59
Notes to the Financial Statements
Note 5 — Options Written
A summary of option contracts written by the Trust during the fiscal year ended June 30, 2008 is as follows:
| | | | | | | | | | | | | | | | | |
| | | Strategic Growth | | Biotech |
| | | | | |
| | | Number of | | Option | | Number of | | Option |
| | | Contracts | | Premiums | | Contracts | | Premiums |
| |
| Options outstanding at beginning of period | | | — | | | $ | — | | | | — | | | $ | — | |
| Options written | | | 2,080 | | | | 664,550 | | | | 2,110 | | | | 672,160 | |
| Options closed | | | — | | | | — | | | | (30 | ) | | | (7,610 | ) |
| Options exercised | | | — | | | | — | | | | — | | | | — | |
| Options expired | | | (2,080 | ) | | | (664,550 | ) | | | (2,080 | ) | | | (664,550 | ) |
| |
| Options outstanding at end of period | | | — | | | $ | — | | | | — | | | $ | — | |
| |
Note 6 — Tax Matters
For U.S. federal income tax purposes, the cost of securities owned (including proceeds for securities sold short), gross appreciation, gross depreciation, and net unrealized appreciation (depreciation) of investments at June 30, 2008 for each Fund were as follows:
| | | | | | | | | | | | | | | | | |
| | | | | | | | | | | | | | | Net |
| | | | | | | Gross | | Gross | | Appreciation |
| Fund | | Cost | | Appreciation | | Depreciation | | (Depreciation) |
| |
| Biotech | | $ | 7,319,335 | | | $ | 304,649 | | | $ | (385,112 | ) | | $ | (80,463 | ) |
| |
| Global Total Return | | | 40,466,193 | | | | 1,137,865 | | | | (892,061 | ) | | | 245,804 | |
| |
| Strategic Growth | | | 1,548,741,153 | | | | 201,526,959 | | | | (7,747,079 | ) | | | 193,779,880 | |
| |
| Capital Opportunities | | | 12,954,582 | | | | 810,532 | | | | (375,831 | ) | | | 434,701 | |
| |
| Mid-Cap Value | | | 29,206,003 | | | | 2,047,747 | | | | (2,288,845 | ) | | | (241,098 | ) |
| |
| Small-Cap Value | | | 65,126,078 | | | | 4,355,282 | | | | (6,398,149 | ) | | | (2,042,867 | ) |
| |
The difference between book basis and tax basis unrealized appreciation (depreciation) is attributable primarily to the tax deferral of losses on wash sales and straddles from options.
As of June 30, 2008, the components of distributable earnings on a tax basis were as follows:
| | | | | | | | | | | | | | | | | | | | | | | | | |
| | | Unrealized | | | | | | | | | | | | | | | | | | Total |
| | | Appreciation | | Undistributed | | Undistributed | | Capital Loss | | Post-October | | Distributable |
| Fund | | (Depreciation) | | Ordinary Income | | Capital Gains | | Carryforward | | Capital Loss | | Earnings |
| |
| Biotech | | $ | (80,463 | ) | | $ | — | | | $ | — | | | $ | — | | | $ | (690,433 | ) | | $ | (770,896 | ) |
| |
| Global Total Return | | | 245,804 | | | | — | | | | — | | | | (184,766 | ) | | | — | | | | 61,038 | |
| |
| Strategic Growth | | | 193,779,880 | | | | 50,714,739 | | | | 43,046,432 | | | | — | | | | — | | | | 287,541,051 | |
| |
| Capital Opportunities | | | 434,701 | | | | — | | | | — | | | | — | | | | (154,483 | ) | | | 280,218 | |
| |
| Mid-Cap Value | | | (241,098 | ) | | | — | | | | — | | | | (1,558,303 | ) | | | (3,730,539 | ) | | | (5,529,940 | ) |
| |
| Small-Cap Value | | | (2,042,867 | ) | | | 65,909 | | | | — | | | | — | | | | (6,441,854 | ) | | | (8,418,812 | ) |
| |
The undistributed ordinary income, capital gains and carryforward losses shown above differ from the corresponding accumulated net investment income and accumulated net realized gain (loss) figures reported in the statements of assets and liabilities due to differing book/tax treatment of short-term capital gains, and certain temporary book/tax differences such as the deferral of realized losses on wash sales, straddles from options and net losses realized after October 31st.
60 ½ 2 0 0 8 A N N U A L R E P O R T
Under current tax law, foreign currency and net capital losses realized after October 31 may be deferred and treated as occurring on the first day of the following fiscal year. The Funds elected to defer net capital and currency losses as indicated in the chart below.
At June 30, 2008, the capital loss carryovers for the Funds were as follows:
| | | | | | | | | | | | | | | | | |
| | | | Capital Loss
Carryovers Expiring | | Post-October Capital Loss |
| Fund | | | | 2016 | | Deferred | | Utilized | |
| |
| Biotech | | | | $ | — | | | $ | 690,433 | | $ | 219,159 | |
| |
| Global Total Return | | | | 184,766 | | | — | | — | |
| |
| Capital Opportunities | | | | — | | | 154,483 | | — | |
| |
| Mid-Cap Value | | | | 1,558,303 | | | 3,730,539 | | — | |
| |
| Small-Cap Value | | | | — | | | 6,441,854 | | — | |
| |
Note 7 — Reclassification of Capital Accounts
In accordance with the accounting pronouncements, each Fund has recorded reclassifications in the capital accounts. These reclassification have no impact on the net asset value of the Funds and are designed generally to present undistributed income and realized gains on a tax basis which is considered to be more informative to shareholders. As of June 30, 2008, the Funds recorded the following reclassification to increase (decrease) the accounts listed below:
| | | | | | | | | | | | | |
| | | Accumulated | | | Accumulated | | | Capital paid in on | |
| | | Net Investment | | | Net Realized | | | Shares of Beneficial | |
| Fund | | Income | | | Gain (Loss) | | | Interest | |
| Biotech | | $ | 127,002 | | | $ | (122,277 | ) | | $ | (4,725 | ) |
| |
| Global Total Return | | 71,990 | | | — | | | (71,990 | ) |
| |
| Strategic Growth | | 4,407,347 | | | (4,407,347 | ) | | — | |
| |
| Capital Opportunities | | 65,274 | | | 29,691 | | | (94,965 | ) |
| |
| Mid-Cap Value | 461,704 | | 122 | | (461,826 | ) |
| |
| Small-Cap Value | 310,800 | | (310,800 | ) | — | |
| |
Note 8 — Distributions to Shareholders
Income and long-term capital gain distributions are determined in accordance with Federal income tax regulations, which may differ from accounting principles generally accepted in the United States of America. The information set forth below is for each Fund’s fiscal year as required by federal securities laws.
The tax character of dividends and distributions paid during the fiscal years of 2008 and 2007 were as follows:
| | | | | | | | | | | | | | | | | | | | | | | | | |
| | | Ordinary Income | | | Long-Term Capital Gain | | | Return of Capital | |
| Fund | | 2008 | | | 2007 | | | 2008 | | | 2007 | | | 2008 | | | 2007 | |
| |
| Biotech | | $ | 680,852 | | | $ | 764,958 | | | $ | 188,140 | | | $ | 380,106 | | | $ | — | | | $ | — | |
| |
| Global Total Return | | | — | | | | — | | | | — | | | | — | | | | — | | | | — | |
| |
| Strategic Growth | | | 36,337,528 | | | | 59,149,717 | | | | 47,962,230 | | | | 36,184,881 | | | | — | | | | — | |
| |
| Capital Opportunities | | | 159,374 | | | | — | | | | 2,229,669 | | | | 1,407,478 | | | | 94,965 | | | | — | |
| |
| Mid-Cap Value | | | 2,157,637 | | | | 2,054,394 | | | | 3,718,051 | | | | 412,922 | | | | — | | | | — | |
| |
| Small-Cap Value | | | 6,624,646 | | | | 2,553,445 | | | | 6,199,540 | | | | 6,116,104 | | | | — | | | | — | |
| |
2 0 0 8 A N N U A L R E P O R T ½ 61
Notes to the Financial Statements
Note 9 — Fund Share Transactions
At June 30, 2008, there were an unlimited number of shares of beneficial interest with a $0.01 par value authorized. The following table summarizes the activity in shares of each Fund:
Biotech
| | | | | | | | | | | | | | | | | | | | | | | | | | | | | | | | | |
| | | For the Fiscal Year Ended: June 30, 2008 | | For the Fiscal Year Ended: June 30, 2007 |
| | | | | |
| | | Sold | | Redeemed | | Reinvested | | | Ending Shares | | Sold | | Redeemed | | Reinvested | | | Ending Shares | |
| |
| Class A | | | | | | | | | | | | | | | | | | | | | | | | | | | | | | | | |
| Shares | | | 61,233 | | | | (214,157 | ) | | | 34,814 | | | | 295,549 | | | | 151,333 | | | | (929,471 | ) | | | 46,180 | | | | 413,659 | |
| Value | | $ | 729,453 | | | $ | (2,606,957 | ) | | $ | 400,359 | | | | | | | $ | 1,944,121 | | | $ | (11,434,710 | ) | | $ | 593,879 | | | | | |
| |
| Class B |
| Shares | | | | | | | (35,011 | ) | | | 7,057 | | | | 41,952 | | | | 117 | | | | (31,308 | ) | | | 7,987 | | | | 69,906 | |
| Value | | $ | — | | | $ | (389,953 | ) | | $ | 77,345 | | | | | | | $ | 1,494 | | | $ | (378,698 | ) | | $ | 99,194 | | | | | |
| |
| Class C |
| Shares | | | 5,843 | | | | (113,655 | ) | | | 28,668 | | | | 249,983 | | | | 94,408 | | | | (107,265 | ) | | | 29,236 | | | | 329,127 | |
| Value | | $ | 71,799 | | | $ | (1,306,692 | ) | | $ | 314,488 | | | | | | | $ | 1,200,372 | | | $ | (1,335,590 | ) | | $ | 363,113 | | | | | |
| |
Global Total Return
| | | | | | | | | | | | | | | | | |
| | | | Since Inception (Inception Date May 1, 2008) through June 30, 2008 | |
| | | |
| | | Sold | | Redeemed | | | Reinvested | | Ending Shares |
| |
| Class A |
| Shares | | | 2,688,812 | | | | (27,222 | ) | | | | — | | | 2,661,590 | |
| Value | | $ | 27,387,600 | | | $ | (276,660 | ) | | | | — | | | | |
| |
| Class C |
| Shares | | | 1,398,133 | | | | (21,581 | ) | | | | — | | | 1,376,552 | |
| Value | | $ | 14,235,903 | | | $ | (224,861 | ) | | | | — | | | | |
| |
| Institutional Class |
| Shares | | | — | | | | — | | | | | — | | | — | |
| Value | | | — | | | | — | | | | | — | | | — | |
| |
62 ½ 2 0 0 8 A N N U A L R E P O R T
BOW/W62664_F13/Quaker Funds_AR08/Current/Pages 64 of 73/Friday August 22 2008
Note 9 — Fund Share Transactions (Continued)
Strategic Growth
| | | | | | | | | | | | | | | | | | | | | | | | | | | | | | | | | |
| | | | For the Fiscal Year Ended: June 30, 2008 | | | | For the Fiscal Year Ended: June 30, 2007 | |
| | | | | |
| | | Sold | | Redeemed | | Reinvested | | Ending Shares | | Sold | | Redeemed | | Reinvested | | Ending Shares |
| |
Class A | | | | | | | | | | | | | | | | | | | | | | | | | | | | | | | | |
| Shares | | | 23,560,946 | | | | (7,142,524 | ) | | | 2,435,550 | | | | 43,756,605 | | | | 7,740,884 | | | | (23,925,644 | ) | | | 3,316,454 | | | | 24,506,338 | |
Shares converted from
Class B | | | 396,295 | | | | — | | | | — | | | | | | | | — | | | | — | | | | — | | | | | |
| Value | | $ | 638,544,030 | | | $ | (188,412,702 | ) | | $ | 62,332,930 | | | | | | | $ | 185,603,133 | | | $ | (559,277,930 | ) | | $ | 74,354,882 | | | | | |
Value converted from
Class B | | $ | 9,711,386 | | | | — | | | | — | | | | | | | | — | | | | — | | | | — | | | | | |
| |
| Class B |
| Shares | | | 8,427 | | | | (30,183 | ) | | | 53,347 | | | | 225,176 | | | | 1,663 | | | | (167,376 | ) | | | 64,787 | | | | 589,880 | |
Shares converted to
Class A | | | — | | | | (396,295 | ) | | | — | | | | | | | | — | | | | — | | | | — | | | | | |
| Value | | $ | 209,719 | | | $ | (670,570 | ) | | $ | 1,288,328 | | | | | | | $ | 37,917 | | | $ | (3,768,235 | ) | | $ | 1,389,038 | | | | | |
Value converted to
Class A | | | — | | | $ | (9,711,386 | ) | | | — | | | | | | | | — | | | | — | | | | — | | | | | |
| |
| Class C |
| Shares | | | 3,794,917 | | | | (720,382 | ) | | | 492,240 | | | | 8,010,540 | | | | 950,281 | | | | (1,215,687 | ) | | | 451,878 | | | | 4,443,765 | |
| Value | | $ | 96,255,144 | | | $ | (17,878,006 | ) | | $ | 11,828,538 | | | | | | | $ | 21,588,309 | | | $ | (31,017,793 | ) | | $ | 9,651,300 | | | | | |
| |
| Institutional Class |
| Shares | | | 3,899,091 | | | | (188,911 | ) | | | 72,680 | | | �� | 4,361,806 | | | | 47,336 | | | | (1,311,602 | ) | | | 156,343 | | | | 578,946 | |
| Value | | $ | 102,475,254 | | | $ | (5,194,238 | ) | | $ | 1,895,488 | | | | | | | $ | 1,148,237 | | | $ | (27,227,935 | ) | | $ | 3,556,803 | | | | | |
| |
Capital Opportunities
| | | | | | | | | | | | | | | | | | | | | | | | | | | | | | | | | |
| | | For the Fiscal Year Ended: June 30, 2008 | | For the Fiscal Year Ended: June 30, 2007 |
| | | | | |
| | | Sold | | Redeemed | | Reinvested | | Ending Shares | | Sold | | Redeemed | | Reinvested | | | Ending Shares |
| |
| Class A |
| Shares | | | 116,802 | | | | (191,874 | ) | | | 123,888 | | | | 758,492 | | | | 147,833 | | | | (622,141 | ) | | | 56,762 | | | | 709,650 | |
Shares converted from
Class B | | | 26 | | | | — | | | | — | | | | | | | | — | | | | — | | | | — | | | | | |
| Value | | $ | 1,202,936 | | | $ | (1,943,199 | ) | | $ | 1,263,654 | | | | | | | $ | 1,632,462 | | | $ | (6,934,221 | ) | | $ | 607,353 | | | | | |
Value converted from
Class B | | $ | 255 | | | | — | | | | — | | | | | | | | — | | | | — | | | | — | | | | | |
| |
| Class B |
| Shares | | | 4,381 | | | | (29,622 | ) | | | 7,066 | | | | 36,416 | | | | 1,372 | | | | (33,568 | ) | | | 4,879 | | | | 54,617 | |
Shares converted to
Class A | | | — | | | | (26 | ) | | | — | | | | | | | | — | | | | — | | | | — | | | | | |
| Value | | $ | 40,000 | | | $ | (306,651 | ) | | $ | 69,031 | | | | | | | $ | 14,926 | | | $ | (362,214 | ) | | $ | 50,692 | | | | | |
Value converted to
Class A | | | — | | | $ | (255 | ) | | | — | | | | | | | | — | | | | — | | | | — | | | | | |
| |
| Class C |
| Shares | | | 26,836 | | | | (309,345 | ) | | | 113,177 | | | | 604,578 | | | | 11,326 | | | | (363,987 | ) | | | 69,611 | | | | 773,910 | |
| Value | | $ | 274,334 | | | $ | (3,192,737 | ) | | $ | 1,104,611 | | | | | | | $ | 123,518 | | | $ | (3,900,922 | ) | | $ | 722,563 | | | | | |
| |
2 0 0 8 A N N U A L R E P O R T ½ 63
Note 9 — Fund Share Transactions (Continued)
Mid-Cap Value
| | | | | | | | | | | | | | | | | | | | | | | | | | | | | | | | | |
| | | For the Fiscal Year Ended: June 30, 2008 | | For the Fiscal Year Ended: June 30, 2007 |
| | | | | |
| | | Sold | | Redeemed | | Reinvested | | Ending Shares | | Sold | | Redeemed | | Reinvested | | Ending Shares |
| |
| Class A |
| Shares | | | 2,174,765 | | | | (9,014,098 | ) | | | 343,238 | | | | 1,186,980 | | | | 4,637,754 | | | | (1,617,163 | ) | | | 123,480 | | | | 7,604,344 | |
Shares converted from
Class B | | | 78,731 | | | | — | | | | — | | | | | | | | — | | | | — | | | | — | | | | | |
| Value | | $ | 36,766,082 | | | $ | (136,683,052 | ) | | $ | 5,285,860 | | | | | | | $ | 77,122,371 | | | $ | (27,178,895 | ) | | $ | 2,020,133 | | | | | |
Value converted from
Class B | | $ | 1,299,698 | | | | — | | | | — | | | | | | | | — | | | | — | | | | — | | | | | |
| |
| Class B |
| Shares | | | 1,168 | | | | (25,146 | ) | | | 2,953 | | | | 34,551 | | | | 13,379 | | | | (25,782 | ) | | | 2,741 | | | | 134,307 | |
Shares converted to
Class A | | | — | | | | (78,731 | ) | | | — | | | | | | | | — | | | | — | | | | — | | | | | |
| Value | | $ | 17,481 | | | $ | (361,855 | ) | | $ | 42,910 | | | | | | | $ | 215,481 | | | $ | (404,764 | ) | | $ | 42,711 | | | | | |
Value converted to
Class A | | | — | | | $ | (1,299,698 | ) | | | — | | | | | | | | — | | | | — | | | | — | | | | | |
| |
| Class C |
| Shares | | | 19,079 | | | | (506,449 | ) | | | 23,511 | | | | 435,330 | | | | 139,031 | | | | (357,091 | ) | | | 17,316 | | | | 899,189 | |
| Value | | $ | 288,708 | | | $ | (7,407,232 | ) | | $ | 335,738 | | | | | | | $ | 2,152,774 | | | $ | (5,574,407 | ) | | $ | 265,454 | | | | | |
| |
| Institutional Class |
| Shares | | | — | | | | (73,466 | ) | | | 4,051 | | | | 34,359 | | | | 11,251 | | | | (1,611 | ) | | | 1,794 | | | | 103,774 | |
| Value | | $ | — | | | $ | (1,174,041 | ) | | $ | 64,242 | | | | | | | $ | 204,493 | | | $ | (27,942 | ) | | $ | 30,098 | | | | | |
| |
Small-Cap Value
| | | | | | | | | | | | | | | | | | | | | | | | | | | | | | | | | |
| | | For the Fiscal Year Ended: June 30, 2008 | | For the Fiscal Year Ended: June 30, 2007 |
| | | | | |
| | | Sold | | Redeemed | | Reinvested | | Ending Shares | | Sold | | Redeemed | | Reinvested | | Ending Shares |
| |
| Class A |
| Shares | | | 668,438 | | | | (1,342,085 | ) | | | 414,525 | | | | 1,996,709 | | | | 855,116 | | | | (716,805 | ) | | | 218,459 | | | | 2,239,278 | |
Shares converted from
Class B | | | 16,553 | | | | — | | | | — | | | | | | | | — | | | | — | | | | — | | | | | |
| Value | | $ | 11,072,206 | | | $ | (21,931,655 | ) | | $ | 5,981,589 | | | | | | | $ | 16,827,579 | | | $ | (14,211,113 | ) | | $ | 4,117,957 | | | | | |
Value converted from
Class B | | $ | 303,140 | | | | — | | | | — | | | | | | | | — | | | | — | | | | — | | | | | |
| |
| Class B |
| Shares | | | 36 | | | | (23,218 | ) | | | 7,543 | | | | 20,599 | | | | 2,849 | | | | (12,528 | ) | | | 5,645 | | | | 52,791 | |
Shares converted to
Class A | | | — | | | | (16,553 | ) | | | — | | | | | | | | — | | | | — | | | | — | | | | | |
| Value | | $ | 476 | | | $ | (327,937 | ) | | $ | 99,712 | | | | | | | $ | 51,265 | | | $ | (233,273 | ) | | $ | 99,972 | | | | | |
Value converted to
Class A | | | — | | | $ | (303,140 | ) | | | — | | | | | | | | — | | | | — | | | | — | | | | | |
| |
| Class C |
| Shares | | | 50,536 | | | | (516,099 | ) | | | 136,321 | | | | 386,705 | | | | 158,759 | | | | (61,177 | ) | | | 69,057 | | | | 715,947 | |
| Value | | $ | 800,354 | | | $ | (7,132,540 | ) | | $ | 1,732,645 | | | | | | | $ | 2,889,310 | | | $ | (1,102,491 | ) | | $ | 1,184,334 | | | | | |
| |
| Institutional Class |
| Shares | | | 17,139 | | | | (133,258 | ) | | | 317,936 | | | | 1,643,263 | | | | 100,215 | | | | (264,543 | ) | | | 160,612 | | | | 1,441,446 | |
| Value | | $ | 300,874 | | | $ | (1,869,505 | ) | | $ | 4,724,536 | | | | | | | $ | 2,105,877 | | | $ | (5,154,257 | ) | | $ | 3,094,993 | | | | | |
| |
64 ½ 2 0 0 8 A N N U A L R E P O R T
Notes to the Financial Statements
Note 10 — Recent Accounting Pronouncements
In September 2006, Statement of Financial Accounting Standards No. 157, Fair Value Measurements (“SFAS 157”), was issued and is effective for fiscal years beginning after November 15, 2007. SFAS 157 defines fair value, establishes a framework for measuring fair value and expands disclosures about fair value measurement. Management is currently evaluating the impact the adoption of SFAS 157 will have on the Fund’s financial statement disclosures.
In March 2008, Statement of Financial Accounting Standards No. 161, Disclosures about Derivative Instruments and Hedging Activities (SFAS 161), was issued and is effective for fiscal years beginning after November 15, 2008. SFAS 161 requires enhanced disclosures to provide information about the reasons the Fund invests in derivative instruments, the accounting treatment and the effect derivatives have on financial performance. Management is currently evaluating the impact the adoption of SFAS 161 will have on the Fund’s financial statement disclosures.
Note 11 — 5% Shareholders
As of June 30, 2008, certain Funds had single shareholder and/or omnibus shareholder accounts (which are comprised of a group of individual shareholders), which individually amounted to more than 5% of the total shares outstanding as detailed below:
| | | | | | | | | |
| | | % Shares | | Number of |
| Fund | | Outstanding | | Accounts |
| |
| Biotech | | | — | | | | — | |
| |
| Global Total Return Fund | | | — | | | | — | |
| |
| Strategic Growth | | | 25.89 | % | | | 1 | |
| |
| Capital Opportunities | | | 20.26 | % | | | 3 | |
| |
| Mid-Cap Value | | | 32.40 | % | | | 2 | |
| |
| Small-Cap Value | | | 54.72 | % | | | 5 | |
| |
Note 12 — Indemnifications
Under the Fund’s organizational documents, its officers and Trustees are indemnified against certain liabilities arising out of the performance of their duties to the Funds. In addition, in the normal course of business, the Funds enter into contracts with their vendors and others that provide for general indemnifications. The Fund’s maximum exposure under these arrangements is unknown as this would involve future claims that may be made against the Funds. However, based on experience, the Funds expect this risk of loss to be remote.
Note 13 — Securities Lending
At June 30, 2008, these securities or a portion of these securities are out on loan. The aggregate market value of these loaned securities and the value of the cash collateral the Funds received is as follows:
| | | | | | | | | | | | | |
| | | Loaned Securities | | Value of | | % of |
| Fund | | Market Value | | Cash Collateral | | Net Assets |
| |
| Biotech | | $ | 1,240,215 | | | $ | 1,274,714 | | | | 19.21% | |
| |
| Global Total Return | | | 4,747,350 | | | | 4,879,789 | | | | 11.87% | |
| |
| Strategic Growth | | | 227,951,572 | | | | 233,181,130 | | | | 14.66% | |
| |
| Capital Opportunities | | | 1,189,850 | | | | 1,223,814 | | | | 9.67% | |
| |
| Mid-Cap Value | | | 4,391,765 | | | | 4,489,876 | | | | 18.79% | |
| |
| Small-Cap Value | | | 6,337,187 | | | | 6,511,818 | | | | 11.58% | |
| |
Note 14 — Fund Liquidations
On March 14, 2008, the Board of Trustees of the Trust, including all of the Trustees who are not “interested persons” (as that term is defined in the Investment Company Act of 1940) unanimously approved the liquidation and dissolution of the Quaker Core Equity Fund, Quaker Small-Cap Growth Fund, and Quaker Core Value Fund (each a “Fund” and collectively, the “Funds”). Each liquidation and dissolution was approved by the Board of the Trust and majority shareholders of each Fund in accordance with the requirements of the Investment Company Act of 1940, as amended, the Securities Exchange Act of 1934 and the Trust’s Amended and Restated Declaration of Trust. The liquidation and dissolution of each Fund was approved, by written consent, by more than 50% of the outstanding voting securities of each Fund entitled to vote. The results of the votes are shown below:
| | | | | | | | | | | | | |
| |
| Quaker Core Equity Fund | | | | | | | | | | | 59.28 | % |
| |
| Quaker Core Value Fund | | | | | | | | | | | 75.02 | % |
| |
| Quaker Small-Cap Growth Fund | | | | | | | | | | | 84.22 | % |
| |
2 0 0 8 A N N U A L R E P O R T ½ 65
Report of Independent Registered Public Accounting Firm
To the Board of Trustees and Shareholders of Quaker Investment Trust:
In our opinion, the accompanying statements of assets and liabilities, including the schedules of investments of Quaker Global Total Return Fund, Quaker Strategic Growth Fund, Quaker Capital Opportunities Fund, Quaker Mid-Cap Value Fund and Quaker Small-Cap Value Fund and the schedule of investments and the schedule of securities sold short of Quaker Biotech Pharma-Healthcare Fund (constituting Quaker Investment Trust, hereafter referred to as the “Trust”), and the related statements of operations and of changes in net assets and the financial highlights present fairly, in all material respects, the financial position of the Trust at June 30, 2008 and the results of each of their operations, the changes in each of their net assets and the financial highlights for each of the periods indicated, in conformity with accounting principles generally accepted in the United States of America. These financial statements and financial highlights (hereafter referred to as “financial statements”) are the responsibility of the Trust’s management; our responsibility is to express an opinion on these financial statements based on our audits. We conducted our audits of these financial statements in accordance with the standards of the Public Company Accounting Oversight Board (United States). Those standards require that we plan and perform the audit to obtain reasonable assurance about whether the financial statements are free of material misstatement. An audit includes examining, on a test basis, evidence supporting the amounts and disclosures in the financial statements, assessing the accounting principles used and significant estimates made by management, and evaluating the overall financial statement presentation. We believe that our audits, which included confirmation of securities at June 30, 2008 by correspondence with the custodian and brokers, provide a reasonable basis for our opinion. The financial highlights for each of the three years in the period ended June 30, 2006 were audited by other independent accountants whose report dated July 26, 2006 expressed an unqualified opinion on those statements.
PricewaterhouseCoopers LLP
Philadelphia, Pennsylvania
August 22, 2008
66 ½ 2 0 0 8 A N N U A L R E P O R T
Trustees and Officers
June 30, 2008
The Board of Trustees (“Board” or “Trustees”) has overall responsibility for conduct of the Trust’s affairs. The day-to-day operations of the Trust are managed by Quaker Funds Inc., subject
to the Bylaws of the Trust and review by the Board. The Trustees of the Trust, including those Trustees who are also officers, are listed below:
| | | | | | | | | | | | | | | |
| |
| | | | | Serving as | | | | Number of | | Other |
| | | | | an Officer | | | | Portfolios | | Directorships |
| | | Position(s) Held | | or Trustee | | | | Overseen by | | Held by |
| Name, Address and Age | | with the Trust | | of the Trust | | Principal Occupation(s) During Past 5 Years | | Trustee | | Trustee(1) |
| |
Interested Trustees and Officers | | | | | | | | | | | |
| | | | | | | | | | | | | | | |
Jeffry H. King, Sr.(2)(3) | | Chairman of the Board | | Since | | Chairman of Board of Directors and Chief Executive Officer, | | | 6 | | | None |
| 309 Technology Drive | | and Chief Executive | | Nov. 1996 | | Quaker Funds, Inc. (1996–present); Registered | | | | | | |
| Malvern, PA 19355 | | Officer | | | | | | Representative Citco Mutual Fund Distributors, Inc. | | | | | | |
| Age 65 | | | | | | | | (2006–2007); Registered Representative, Radnor | | | | | | |
| | | | | | | | | Research & Trading Company, LLC (2005–2006); | | | | | | |
| | | | | | | | | Chairman and CEO,Quaker Securities Inc. (1990–2005). | | | | | | |
| |
Laurie Keyes (3), (4) | | Treasurer and | | Since | | Chief Financial Officer, Quaker Funds, Inc. | | | 6 | | | None |
| 309 Technology Drive | | Trustee | | Nov. 1996 | | (1996–present). | | | | | | |
| Malvern, PA 19355 | | | | | | | | | | | | | | |
| Age 58 | | | | | | | | | | | | | | |
| |
Justin Brundage (5) | | Secretary | | Since | | President, Quaker Funds, Inc. (2007–present); | | None | | None |
| 309 Technology Drive | | | | Nov. 2006 | | Chief Operating Officer, Quaker Funds, Inc. | | | | | | |
| Malvern, PA 19355 | | | | | | | | (2005–present); Director of IT, Citco Mutual Fund | | | | | | |
| Age 38 | | | | | | | | Services, Inc. (2003–2005); formerly Registered | | | | | | |
| | | | | | | | | Representative, Quaker Securities (1995–2005). | | | | | | |
| |
Timothy E. Richards | | Chief Compliance | | Since | | General Counsel to Quaker Funds, Inc. (2003–present); | | None | | None |
| 309 Technology Drive | | Officer | | March | | Chief Compliance Officer for the Quaker | | | | | | |
| Malvern, PA 19355 | | | | | 2004 | | | Investment Trust (2004–present); formerly Chief | | | | | | |
| Age 43 | | | | | | | | Compliance Officer for the Penn Street Funds, Inc. | | | | | | |
| | | | | | | | | (2004–2007); formerly General Counsel for CRA | | | | | | |
| | | | | | | | | Advisors, Inc. and the Community Reinvestment Act | | | | | | |
| | | | | | | | | Qualified Investment Trust (2004–2006). | | | | | | |
| |
| | | | | | | | | | | | | | | |
Independent Trustees | | | | | | | | | | | |
Mark S. Singel | | Trustee | | Since | | Director/Founder, The Winter Group | | | 6 | | | None |
| 309 Technology Drive | | | | Feb. 2002 | | (2005–present); Managing Director, | | | | | | |
| Malvern, PA 19355 | | | | | | | | Public Affairs Management (lobbying firm) | | | | | | |
| Age 55 | | | | | | | | (2000–present); Lieutenant Governor and | | | | | | |
| | | | | | | | | Acting Governor of Pennsylvania (1987–1995). | | | | | | |
| |
Ambassador Adrian A. Basora (ret.) | | Trustee | | Since | | Director of Project on Democratic | | | 6 | | | None |
| 309 Technology Drive | | | | Feb. 2002 | | Transitions, Foreign Policy Research | | | | | | |
| Malvern, PA 19355 | | | | | | | | Institute (2004–present); formerly, | | | | | | |
| Age 70 | | | | | | | | President of Eisenhower Fellowships (1996–2004). | | | | | | |
| |
James R. Brinton | | Trustee | | Since | | President, Robert J. McAllister Agency, | | | 6 | | | Director, |
| 309 Technology Drive | | | | Feb. 2002 | | Inc. (commercial insurance brokerage firm) | | | | | | ACP Funds Trust |
| Malvern, PA 19355 | | Lead Independent | | Since | | (1979–present). | | | | | | |
| Age 54 | | Trustee | | Aug. 2007 | | | | | | | | |
| |
Gary Edward Shugrue | | Trustee | | Since | | President and Chief Investment Officer, | | | 6 | | | Director, |
| 309 Technology Drive | | | | July 2008 | | Ascendant Capital Partners. | | | | | | BHR Institutional |
| Malvern, PA 19335 | | | | | | | | | | | | | | Funds; Director, |
| Age 54 | | | | | | | | | | | | | | ACP Funds Trust |
| |
Warren West | | Trustee | | Since | | President and owner, Greentree Brokerage | | | 6 | | | None |
| 309 Technology Drive | | | | Nov. 2003 | | Services, Inc. (1998–present). | | | | | | |
| Malvern, PA 19355 | | | | | | | | | | | | | | |
| Age 52 | | | | | | | | | | | | | | |
| |
2 0 0 8 A N N U A L R E P O R T ½ 67
| | | | | | | | | | | | | | | |
| |
| | | | | Serving as | | | | Number of | | Other |
| | | | | an Officer | | | | Portfolios | | Directorships |
| | | Position(s) Held | | or Trustee | | | | Overseen by | | Held by |
| Name, Address and Age | | with the Trust | | of the Trust | | Principal Occupation(s) During Past 5 Years | | Trustee | | Trustee(1) |
| |
Everett T. Keech | | Trustee | | Since | | Chairman-Executive Committee, Technology | | | 6 | | | Director, |
| 309 Technology Drive | | | | Nov. 2005 | | Development Corp., Norristown, PA, a | | | | | | Technology |
| Malvern, PA 19355 | | Interested Trustee, | | Nov., | | technology development and manufacturing | | | | | | Development |
| Age 68 | | Vice Chairman of | | 1996 – Jan., | | firm (1997–present); President, Quaker | | | | | | Corp.; Director, |
| | | the Board, | | | 2005 | | | Investment Trust (2002–2003); Affiliated | | | | | | Advanced |
| | | President, | | | | | | Faculty, University of Pennsylvania (1998–present). | | | | | | Training |
| | | Treasurer | | | | | | | | | | | | Systems |
| | | | | | | | | | | | | | | International, |
| | | | | | | | | | | | | | | Inc.; Director, |
| | | Trustee | | Nov., | | | | | | | | Phoenix Data |
| | | | | 1996 – Feb., | | | | | | | | Systems, Inc. |
| | | | | | 2002 | | | | | | | | | |
| |
| | |
| (1) | | Directorship of companies required to report to the SEC under the Securities and Exchange Act of 1934, as amended (the “Exchange Act”)(i.e., “public companies”) and investment companies registered under the 1940 Act. |
| |
| (2) | | Mr. King is considered to be “interested person” of the Trust for purposes of the 1940 Act because he is the Chief Executive Officer and a controlling shareholder of Quaker Funds, Inc., the investment adviser to the Funds. |
| |
| (3) | | Mr. King and Ms. Keyes are husband and wife. |
| |
| (4) | | Ms. Keyes is considered to be an “interested person” of the Trust for purposes of the 1940 Act because she is the Trust’s Treasurer and a controlling shareholder of Quaker Funds, Inc. |
| |
| (5) | | Mr. Brundage is Ms. Keyes’ son. |
The Statement of Additional Information for the Funds includes additional information about the Trustees and Officers and is available, without charge, upon request by calling (800) 220-8888.
68 ½ 2 0 0 8 A N N U A L R E P O R T
Board Consideration of the Investment Advisory and Sub-Advisory Agreements
The Independent Trustees of the Board of Trustees of the Quaker Investment Trust (the “Trust”) considered the Investment Advisory Agreement between the Trust and Quaker Funds, Inc. (“QFI”) and each of the respective Sub-Advisory Agreements between QFI and DG Capital Management, Knott Capital Management, Sectoral Asset Management, Inc., Global Capital Management, Inc., and Aronson+Johnson+Ortiz, LP (collectively the “Agreements”) with regard to each Fund at a meeting held on May 1, 2008. At the Board meeting, the Independent Trustees reported to the full Board of Trustees their considerations with respect to the Agreements, and the Board of Trustees, including a majority of the Independent Trustees, considered and approved the renewal of the Agreements.
In arriving at their decision to renew the Agreements, the Board, including the Independent Trustees, considered a variety of information concerning QFI and each sub-adviser. In considering the continuation of the Agreements, the Board, including the Independent Trustees, considered the nature and quality of the services provided by QFI and each of the sub-advisers, the proposed fee structures, the level of fee waivers, each Fund's past and anticipated expense ratios, possible economies of scale resulting from increases in the size of the Funds and other possible benefits QFI and each of the sub-advisers derived from their relationships with the Funds. The Board, including the Independent Trustees, carefully analyzed the information provided to them by QFI, each of the sub-advisers, and independent third parties, focusing particularly on the level of advisory fees and expenses of each Fund compared with information for similar funds, and the performance of each Fund compared to funds with similar investment objectives. The Board, including the Independent Trustees, also considered other information that it had received from QFI and each of the sub-advisers at other meetings throughout the year.
In examining the nature, extent and quality of the services to be provided by QFI, the Board, including the Independent Trustees, considered the portfolio management, administrative and supervisory services provided by QFI. The Board, including the Independent Trustees, acknowledged the value of QFI’s historical performance of services for the Funds. The Board, including the Independent Trustees, noted QFI’s commitment to servicing the Funds as its only client, QFI’s efforts during the past year to reduce Fund expenses, and the nature of the non-investment advisory services provided to the Funds, such as the supervision of the Funds’ other third-party service providers by QFI.
With respect to the nature, extent and quality of the services provided to the Funds by each sub-adviser, the Board including the Independent Trustees, considered the quality of the portfolio management services that each sub-adviser provided to the Funds, the depth, experience and demonstrated consistency in investment approach of each of the sub-advisers’ portfolio management teams, the continued growth in each of the sub-advisers’ personnel responsible for managing the Funds; and the quality of each of the sub-advisers’ reputations. The Board, including the Independent Trustees, further considered each of the sub-advisers’ performance records and their experience in managing another fund complex with similar mutual funds.
Based on the totality of the information considered, the Board, including the Independent Trustees, concluded that the Funds were likely to benefit from the nature, extent and quality of QFI’s and each of the sub-advisers’ services, as applicable, and that QFI and each of the sub-advisers have the ability to continue to provide these services based on their respective experience, operations and resources.
With respect to the Funds’ investment performance, the Board, including the Independent Trustees, reviewed each Fund's performance compared to both its peer group and relative benchmark indices over one-year, three-year, five-year and since inception periods, as applicable. The Board, including the Independent Trustees, considered factors, including but not limited to the sub-advisers’ management style, that have affected the performance of each Fund relative to its peer group and benchmarks.
With respect to the costs of the services to be provided and profits to be realized by QFI from its relationship with the Funds, the Board, including the Independent Trustees, considered the fact that QFI had agreed to continue to waive its advisory fees to the extent necessary to limit the annualized expenses of each Fund to their assigned expense ratio caps for an additional year. The Board, including the Independent Trustees, also considered that QFI might be able to recoup some of the waived fees in the future. The Board, including Independent Trustees, did not consider the relationship between QFI’s advisory fees compared to other accounts that QFI advises, because QFI has no other advisory accounts.
2 0 0 8 A N N U A L R E P O R T ½ 69
The Board, including the Independent Trustees, considered whether there are any ancillary benefits that may accrue to QFI or a sub-adviser resulting from their relationship with the Funds. Based on the information provided, the Board, including the Independent Trustees, noted that there did not appear to be any significant benefits in this regard.
After evaluation of the comparative performance, fee and expense information and the profitability, ancillary benefits and other considerations as described above, and in light of the nature, extent and quality of services to be provided by QFI and each of the sub-advisers, the Board, including the Independent Trustees, concluded that the level of fees to be paid to QFI and each of the sub-advisers was reasonable.
In voting unanimously to approve the Agreements based on the various considerations discussed above, the Board, including the Independent Trustees, determined that the approval of the Agreements was in the best interests of the Funds. As a result, the Board, including a majority of the Independent Trustees, approved the Agreements.
70 ½ 2 0 0 8 A N N U A L R E P O R T
General Information(Unaudited)
Form N-Q Filing and Proxy Voting Policies and Procedures
Each Fund files its complete schedule of portfolio holdings with the Securities and Exchange Commission for the first and third quarters of each fiscal year on Form N-Q. Each Fund’s Forms N-Q, as well as a description of the policies and procedures that each Fund uses to determine how to vote proxies (if any) relating to portfolio securities is available without charge (i) upon request, by calling (800) 220-8888; and (ii) on the SEC’s web-site at http://www.sec.gov. Each Fund’s Forms N-Q may be reviewed and copied at the SEC’s Public Reference Room in Washington, DC; information on the operation of the Public Reference Room may be obtained by calling 1-800-SEC-0330.
Information (if any) regarding how the Funds voted proxies relating to portfolio securities during the most recently disclosed 12-month period ended June 30 is available (i) without charge, upon request, by calling (800) 220-8888; and (ii) on the SEC’s web-site at http://www.sec.gov.
Tax Information
We are required to advise you within 60 days of the Funds’ fiscal year-end regarding the federal tax status of certain distributions received by shareholders during such fiscal year. The information below is provided for the fiscal year endingJune 30, 2008.
During the fiscal year ended June 30, 2008, the following Funds paid long-term capital distributions:
| | | | | | | | | |
| | | Long-Term | | | | |
| Fund | | Capital Gains | | Per Share |
| |
| Biotech | | $ | 188,140 | | | $ | 0.27816 | |
| |
| Global Total Return | | | — | | | | — | |
| |
| Strategic Growth | | | 47,962,230 | | | | 1.50859 | |
| |
| Capital Opportunities | | | 2,229,669 | | | | 1.63435 | |
| |
| Mid-Cap Value | | | 3,718,051 | | | | 0.39246 | |
| |
| Small-Cap Value | | | 6,199,540 | | | | 1.57335 | |
| |
Individual shareholders are eligible for reduced tax rates on the following percentages of qualified dividend income. For the purposes of computing the dividends eligible for reduced taxes, the following amounts of the dividends paid by the Fund from ordinary income earned during the fiscal year are considered qualified dividend income.
| | | | | | | | | |
| Fund | | Amount | | Percentage |
| |
| Biotech | | $ | 1,298 | | | | 0.19 | % |
| |
| Global Total Return | | | — | | | | — | |
| |
| Strategic Growth | | | 5,817,482 | | | | 16.01 | % |
| |
| Capital Opportunities | | | 221,517 | | | | 100.00 | % |
| |
| Mid-Cap Value | | | 1,249,791 | | | | 57.92 | % |
| |
| Small-Cap Value | | | 1,058,213 | | | | 15.97 | % |
| |
Corporate shareholders may exclude up to the following percentages of qualifying dividends. For the purposes of computing this exclusion, the following amounts of the dividends paid by the Funds from ordinary income earned during the fiscal year represents qualifying dividends.
| | | | | | | | | |
| Fund | | Amount | | Percentage |
| |
| Biotech | | $ | 1,298 | | | | 0.19 | % |
| |
| Global Total Return | | | — | | | | — | |
| |
| Strategic Growth | | | 3,913,818 | | | | 10.77 | % |
| |
| Capital Opportunities | | | 172,844 | | | | 100.00 | % |
| |
| Mid-Cap Value | | | 1,114,347 | | | | 51.65 | % |
| |
| Small-Cap Value | | | 666,400 | | | | 10.06 | % |
| |
Dividends and distributions received by retirement plans such as IRAs, Keogh type plans and 403(b) plans need not be reported as taxable income. However, many retirement plan trusts may need this information for their annual information reporting.
Since the information above is reported for the Funds’ fiscal year and not the calendar year, shareholders should refer to their Form 1099-DIV or other tax information which will be mailed in January 2009 to determine the calendar year amounts to be included on their 2008 tax returns. Shareholders should consult their tax advisers.
2 0 0 8 A N N U A L R E P O R T ½ 71
Exhibit 12(b)
Item 2. Code of Ethics.
As of August 9, 2007 the Registrant has adopted a code of ethics that applies to the Registrant’s President/Chief Executive Officer and Treasurer/Chief Financial Officer. For the year ended June 30, 2008, the code of ethics was amended to note a change in covered officers. There were no waivers granted from a provision of the code of ethics. A copy of its code of ethics is filed with this Form N-CSR under Item 12(a)(1).
Item 3. Audit Committee Financial Expert.
The Registrant’s Board of Directors has determined that the Registrant has one audit committee financial expert serving on its audit committee. The audit committee financial expert serving on the Registrant’s audit committee is Everett T. Keech, who is independent.
Item 4. Principal Accountant Fees and Services.
| | (a) | | Audit Fees: The aggregate fees billed for each of the last two fiscal years for professional services rendered by the principal accountant for the audit of the registrant’s annual financial statements or services that are normally provided by the accountant in connection with statutory and regulatory filings or engagements for those fiscal years are $124,500 for 2008 and $159,000 for 2007. |
| |
| | (b) | | Audit-Related Fees: The aggregate fees billed in each of the last two fiscal years for assurance and related services by the principal accountant that are reasonably related to the performance of the audit of the registrant’s financial statements and are not reported under paragraph (a) of this Item are $2,000 for 2008 and $10,100 for 2007. |
| |
| | (c) | | Tax Fees: The aggregate fees billed in each of the last two fiscal years for professional services rendered by the principal accountant for tax compliance, tax advice, and tax planning are $29,780 for 2008 and $40,000 for 2007. |
| |
| | (d) | | The aggregate fees billed in each of the last two fiscal years for products and services provided by the principal accountant, other than the services reported in paragraphs (a) through (c) of this Item are $0 for 2008 and $0 for 2007. |
| |
| | (e) (1) | | The audit committee has not adopted pre-approval policies and procedures. Instead, pursuant to the registrant’s Audit Committee Charter that has been adopted by the audit committee, the audit committee shall approve, prior to appointment, the engagement of the auditor to provide audit services to the registrant and non-audit services to the registrant, its investment adviser or any entity controlling, controlled by or under common control with the investment adviser that provides on-going services to the registrant if the engagement relates directly to the operations and financial reporting of the registrant. |
| |
| | (f) | | All of the principal accountant’s hours spent on auditing the registrant’s financial statements were attributed to work performed by full time permanent employees of the principal accountant. |
| |
| | (g) | | The aggregate non-audit fees billed by the registrant’s accountant for services rendered to the registrant and to the registrant’s investment adviser (not including any sub-adviser whose role is primarily portfolio management and whose activities are overseen by the registrant’s investment adviser) and any entity controlling, controlled by, or under common control with the investment adviser that provides ongoing services to the |
| | | | registrant, for each of the registrant’s last two fiscal years are $0 for 2008 and $0 for 2007. |
| |
| | (h) | | The audit committee of the Board of Trustees has considered whether the provision of non-audit services that were rendered to the registrant’s investment adviser is compatible with maintaining the principal accountant’s independence. The audit committee has concluded that the provision of such non-audit services by the accountant has not compromised the accountant’s independence. |
Item 5. Audit Committee of Listed Registrants.
Not Applicable.
Item 6. Investments.
| | (a) | | Schedule of Investments in securities of unaffiliated issuers as of the close of the reporting period is included as part of the report to shareholders filed under Item 1 of this form. |
| |
| | (b) | | Not applicable to this filing. |
Item 7. Disclosure of Proxy Voting Policies and Procedures for Closed-End Management Investment Companies.
Not Applicable.
Item 8. Portfolio Managers of Closed-End Management Investment Companies.
Not Applicable.
Item 9. Purchases of Equity Securities by Closed-End Management Company and Affiliated Purchasers.
Not Applicable.
Item 10. Submission of Matters to a Vote of Security Holders.
There have been no material changes to the procedures by which the shareholders may recommend nominees to the registrant’s board of directors, where those changes were implemented after the registrant last provided disclosure in response to the requirements of Item 7(d)(2)(ii)(G) of Schedule 14A (17 CFR 240.14a-101), or this Item.
Item 11. Controls and Procedures.
| | (a) | | The Registrant’s principal executive officer and principal financial officer concluded that the Registrant’s disclosure controls and procedures (as defined in Rule 30a-3(c) under the Investment Company Act of 1940, as amended (the “1940 Act”)) are effective as of a date within 90 days prior to the filing date of this report, based on their evaluation of the effectiveness of the registrant’s disclosure controls and procedures as required by Rule 30a-3(b) under the 1940 Act, (17 CFR 270.30a-3(b)) and Rules 13a-15(b) or 15d-15(b) under the Securities Exchange Act of 1934, as amended (17 CFR 240.13a-15(b) or 240.15d-15(b)). |
| | (b) | | There were no changes in the registrant’s internal control over financial reporting (as defined in Rule 30a-3(d) under the 1940 Act, as amended (17 CFR 270.30a-3(d)) that occurred during the registrant’s second fiscal quarter of the period covered by this report that has materially affected, or is reasonably likely to materially affect, the registrant’s internal control over financial reporting. |
Item 12. Exhibits.
| | (a)(1) | | Registrant’s Code of Ethics for Senior Officers pursuant to the Sarbanes-Oxley Act of 2002. |
| |
| | (a) (2) | | Certifications pursuant to Rule 30a-2(a) under the 1940 Act and Section 302 of the Sarbanes-Oxley Act of 2002 are attached hereto. |
| |
| | (a) (3) | | Not applicable to this filing. |
| |
| | (b) | | Certifications pursuant to Rule 30a-2(b) under the 1940 Act and Section 906 of the Sarbanes-Oxley Act of 2002 are attached hereto. |
SIGNATURES
Pursuant to the requirements of the Securities Exchange Act of 1934 and the Investment Company Act of 1940, the registrant has duly caused this report to be signed on its behalf by the undersigned, thereunto duly authorized.
| | | | | |
| (Registrant) | Quaker Investment Trust
| |
| By (signature and title)* | /s/ Jeffry H. King, Sr. | |
| | Jeffry H. King, Sr., Chief Executive Officer | |
| | (principle executive officer) | |
| |
| Date | September 8, 2008 | |
Pursuant to the requirements of the Securities Exchange Act of 1934 and the Investment Company Act of 1940, this report has been signed below by the following persons on behalf of the registrant and in the capacities and on the dates indicated.
| | | | | |
| | | |
| By (signature and title)* | /s/ Jeffry H. King, Sr. | |
| | Jeffry H. King, Sr., Chief Executive Officer | |
| | (principle executive officer) | |
| |
| Date | September 8, 2008 | |
| | | |
| By (signature and title)* | /s/ Laurie Keyes | |
| | Laurie Keyes, Treasurer | |
| | (principle executive officer) | |
| |
| Date | September 8, 2008 | |