UNITED STATES
SECURITIES AND EXCHANGE COMMISSION
Washington, D.C. 20549
FORM 10-K
(Mark One)
[ X ] ANNUAL REPORT PURSUANT TO SECTION 13 OR 15(d) OF THE SECURITIES EXCHANGE ACT OF 1934
For the Fiscal Year ended December 31, 2006
or
| [ ] | TRANSITION REPORT PURSUANT TO SECTION 13 OR 15(d) OF THE SECURITIES EXCHANGE ACT OF 1934 |
For the transition period from ___________ to ___________
| Commission File No. 0-22920 |
NUMEREX CORP. | |
(Exact Name of Registrant as Specified in its Charter) | |
Pennsylvania | | 11-2948749 |
| (State or Other Jurisdiction of Incorporation or Organization) | | (IRS Employer Identification No.) |
1600 Parkwood Circle Suite 500 Atlanta, Georgia | | 30339-2119 |
| (Address of principal executive offices) | | (Zip Code) |
Registrant's Telephone Number, Including Area Code: (770) 693-5950 |
| |
| Securities Registered Pursuant to Section 12(b) of the Act: None |
| |
| Securities Registered Pursuant to Section 12(g) of the Act: |
| | | |
| Class A Common Stock, no par value | | |
| (Title of Class) | | |
Indicate by check mark if the registrant is a well-known seasoned issuer, as defined in Rule 405 of the Securities Act. Yes o No þ
Indicate by check mark if the registrant is not required to file reports pursuant to Section 13 or 15 (d) of the Act. Yes o No þ
Indicate by check mark whether the registrant (1) has filed all reports required to be filed by Section 13 or 15(d) of the Securities Exchange Act of 1934 during the preceding 12 months (or for such shorter period that the registrant was required to file such reports), and (2) has been subject to such filing requirements for the past 90 days. Yes þ No o
Indicate by check mark if disclosure of delinquent filers pursuant to Item 405 of Regulation S-K (§229.405 of this chapter) is not contained herein, and will not be contained, to the best of registrant’s knowledge, in definitive proxy or information statements incorporated by reference in Part III of this Form 10-K or any amendment to this Form 10-K. o
Indicate by check mark whether the registrant is a large accelerated filer, an accelerated filer, or a non-accelerated filer. See definition of “accelerated filer and large accelerated filer” in Rule 12b-2 of the Exchange Act. (Check one):
Large accelerated filer o Accelerated filer o Non-accelerated filer þ
Indicate by check mark whether the registrant is a shell company (as defined in Rule 12b-2 of the Act). Yes o No þ
The aggregate market value of voting and non-voting common stock held by nonaffiliates of the registrant (8,899,999 shares) based on the closing price of the registrant’s common stock as reported on the NASDAQ National Market on June 30, 2006, was $63,634,993. For purposes of this computation, all officers, directors, and 10% beneficial owners of the registrant are deemed to be affiliates. Such determination should not be deemed to be an admission that such officers, directors, or 10% beneficial owners are, in fact, affiliates of the registrant.
The number of shares outstanding of the registrant’s Class A Common Stock as of March 16, 2007, was 13,050,399 shares.
DOCUMENTS INCORPORATED BY REFERENCE
Certain portions of the Company’s Proxy Statement to be filed in connection with its 2006 Annual Meeting of Shareholders are incorporated by reference in Part III of this Report.
NUMEREX CORP.
ANNUAL REPORT ON FORM 10-K
FOR THE FISCAL YEAR ENDED DECEMBER 31, 2006
TABLE OF CONTENTS
| | | Page |
| | PART I | |
Item 1. | Business | 4 |
Item 1A. | Risk Factors | 13 |
Item 1B. | Unresolved Staff Comments | 18 |
Item 2. | Properties | 18 |
Item 3. | Legal Proceedings | 18 |
Item 4. | Submission of Matters to a Vote of Security Holders | 18 |
| | | |
| | PART II | |
Item 5. | Market for Registrant’s Common Equity, Related Stockholder Matters and Issuer Purchases of Equity | |
| | Securities | 19 |
Item 6. | Selected Consolidated Financial Data | 21 |
Item 7. | Management’s Discussion and Analysis of Financial Condition and Results of Operations | 22 |
Item 7A. | Quantitative and Qualitative Disclosures about Market Risk | 34 |
Item 8. | Financial Statements and Supplementary Data | 35 |
Item 9. | Changes in and Disagreements with Accountants on Accounting and Financial Disclosure | 60 |
Item 9A. | Controls and Procedures | 60 |
Item 9B. | Other Information | 60 |
| | | |
| | PART III | |
Item 10. | Directors and Executive Officers of the Registrant | 60 |
Item 11. | Executive Compensation | 60 |
Item 12. | Security Ownership of Certain Beneficial Owners and Management and Related Stockholder Matters | 60 |
Item 13. | Certain Relationships and Related Transactions | 60 |
Item 14. | Principal Accounting Fees and Services | 60 |
| | | |
| | PART IV | |
Item 15. | Exhibits, Financial Statement Schedules | 61 |
Forward-Looking Statements
This document contains certain forward-looking statements within the meaning of Section 27A of the Securities Act of 1933 and Section 21E of the Securities Exchange Act of 1934. These statements include, among other things, statements regarding trends, strategies, plans, beliefs, intentions, expectations, goals and opportunities. Forward looking statements are typically identified by words or phrases such as “believe,” “expect,” “anticipate,” “intend,” “estimate,” “assume,” “strategy,” “plan,” “outlook,” “outcome,” “continue,” “remain,” “trend,” and variations of such words and similar expressions, or future or conditional verbs such as “will,” “would,” “should,” “could,” “may,” or similar expressions. All statements and information herein and incorporated by reference herein, other than statements of historical fact, are forward-looking statements that are based upon a number of assumptions concerning future conditions that ultimately may prove to be inaccurate. Many phases of the Company’s operations are subject to influences outside its control. The Company cautions that these forward-looking statements are subject to numerous assumptions, risks and uncertainties, which change over time. These forward-looking statements speak only as of the date of this Annual Report, and the Company assumes no duty to update forward-looking statements. Actual results could differ materially from those anticipated in these forward-looking statements and future results could differ materially from historical performance.
Any one or any combination of factors could have a material adverse effect on the Company’s results of operations or could cause actual results to differ materially from forward-looking statements or historical performance. These factors include: the pace of technological change; variations in quarterly operating results; delays in the development, introduction and marketing of new wireless products and services; customer acceptance of products and services; economic conditions; the inability to attain revenue and earnings growth; changes in interest rates; inflation; the introduction, withdrawal, success and timing of business initiatives and strategies; competitive conditions; the extent and timing of technological changes; changes in customer spending; the loss of intellectual property protection; general economic conditions and conditions affecting the capital markets. Actual events, developments and results could differ materially from those anticipated or projected in the forward-looking statements as a result of certain uncertainties set forth below and elsewhere in this document. Subsequent written or oral statements attributable to the Company or persons acting on its behalf are expressly qualified in their entirety by the cautionary statements in this report and those in the Company’s reports previously and subsequently filed with the Securities and Exchange Commission.
PART I
Item 1. Business
Numerex Corp. is a wireless machine-to-machine (M2M) communications, technology and solutions business. The Company combines its network services, technology, products, and application development capabilities to create innovative packaged and custom-designed M2M offerings for customers across multiple market segments. Numerex makes possible real-time wireless data communications for monitoring, tracking, and service management tailored to the needs of diverse industries and applications, including wireless security solutions, vehicle location and tracking, fleet management, telemedicine, meter reading, utilities, vending, remote device monitoring, and more.
M2M is defined as electronic (wireless) data communication between people, devices and systems that turns data into information and addresses the needs of such industries as security, vending, the automotive aftermarket, healthcare, gas and oil, utilities and others. While the industry emerged in force just a few years ago, the underlying network and technology infrastructure has been a part of Numerex’s business for several years. Today, many mission-critical M2M solutions are deployed by Fortune 100 companies worldwide.
Numerex has established and maintained a leadership position in M2M through delivering end-to-end, single-source solutions as well as “white label” products that are available for distribution through Value Added Resellers (VARs) and Original Equipment Manufacturers (OEMs) who choose to integrate our products and services into their own offerings. We market and sell these products and services through our Airdesk Wireless™ and Uplink™ Divisions.
Numerex has developed industry-specific expertise in wireless network services, back-office support services, wireless device technology and distribution, wireless security products and services, mobile tracking and asset recovery, as well as remote asset management. As a result, leading businesses with M2M requirements partner with Numerex for our proven solutions. We help companies by removing the complexities associated with the design, development, deployment and support of M2M solutions so that our customers can focus on their primary business objectives and speed the time to market.
Numerex provides much more than network connectivity to our partners. We are always looking to expand our expertise by entering new vertical sectors conducive to our long-term recurring revenue model. We may choose to enter through industry partnerships, hiring expertise, or via acquisition. Our strategic vision is to be recognized as the “Perfect Partner” and leading provider of M2M networks, technology and end-to-end wireless solutions for customers in our target markets by:
| · | Providing best-in-class technology, networks and end-to-end solutions to the M2M market, expanding our success in network services, mobile and fixed applications, wireless security and remote monitoring into new market segments across all industries; |
| · | Creating a culture of excellence in customer service; |
| · | Delivering quality products and services that meet and anticipate the evolving needs of our customers; |
| · | Striving to be “The Perfect Partner” - a single stop shop for M2M technology, solutions and support; and |
| · | Enhancing shareholder value through long term recurring revenue growth. |
Background
Numerex Corp., a corporation organized under the laws of the Commonwealth of Pennsylvania, began in July 1992 with the acquisition of technology referred to as “Derived Channel”, which enables data transmission over an existing telephone line without interfering with voice communications over that same telephone line. We expanded our business primarily through the acquisition of complementary businesses, product lines, and proprietary technologies. In November 1999, we sold the Derived Channel technology and business to British Telecommunications PLC (“BT”).
In May 1998, Numerex Corp., BellSouth Corporation and BellSouth Wireless, which became Cingular in 2001 and AT&T in 2006, completed a transaction whereby Cellemetry LLC, a joint venture between Numerex and Cingular, was formed. Cellemetry LLC provided a cost-effective, two-way wireless data communications network throughout the United States, Canada, Mexico, Colombia, Argentina, Paraguay, the Dutch Antilles, and Puerto Rico. On March 28, 2003, we acquired Cingular’s interest in Cellemetry LLC.
Cellemetry has evolved into Numerex, with two distinct business divisions:
| · | Uplink, the Wireless Security Division of Numerex provides products and services that report security alarm messages reliably and securely to central monitoring stations. Uplink offers wireless security solutions through a nationwide network of independent dealers and distributors for over 200,000 subscribers in North America. Uplink is delivered to the market under the Uplink brand as well as our customers own brand for sale to other distributors of security products, including Fortune 500 companies. |
| · | Airdesk, the M2M Wireless Division of Numerex provides flexible, scalable machine-to-machine (M2M) technology, network, services and integration capabilities to partners and customers across a wide range of industries. With individual applications and comprehensive end-to-end solutions, Airdesk serves the utilities, security, automotive, healthcare, manufacturing, and retail markets. Airdesk combines its extensive wireless industry expertise with Numerex’s network services, technology, and support services, to deliver packaged and custom-designed M2M products and services for asset tracking, inventory control, point-of-sale systems and a host of emerging M2M applications. Airdesk is also the leading North American distributor for a variety of wireless radios including Wavecom and Sony-Ericsson. |
Numerex completed the acquisition of Airdesk in January 2006. We believe the acquisition of Airdesk, with its years of experience in the M2M market and extensive distribution reach, has helped position Numerex as a premier provider of wireless M2M products and services.
Numerex’s activities are focused on two segments:
| · | Core Business Segment: Wireless Data Communications; and |
| · | Non-Core Business Segment: Digital Multimedia, Networking and Data Communications. |
CORE BUSINESS SEGMENT: WIRELESS DATA COMMUNICATIONS
Machine-to-Machine Communications (M2M)
Airdesk now serves as Numerex’s wireless M2M products and services division, offering all components of the M2M value chain, including networks, technology, and fixed and mobile solutions. Wireless data solutions historically delivered under the Cellemetry or CellemetryXG brand are now delivered under the Airdesk Wireless brand. Also, Numerex Networks™ is offered through Airdesk to customers and industry partners with network-only requirements. Numerex will continue to market and sell its wireless security solutions through its Uplink division under the Uplink brand name.
Wireless data communications at Numerex encompass:
| · | Fixed end-to-end solutions; |
| · | Mobile end-to-end solutions; |
| · | Networks and network services; and |
| · | Technology Development and Distribution. |
Fixed End-to-End Solutions
Uplink’: Wireless Security Communications
Uplink is a dedicated wireless communications solution for security monitoring that reports all alarms, status, and messages generated by security systems. Uplink delivers this solution by providing a secure, dedicated cellular data link and network access module that transmits alarms to virtually any alarm-receiving center or monitoring service.
A stand-alone sensor, alarm panel output, or alarm panel serial connection provides the trigger to one of Uplink’s family of network access modules, which in turn transmits the alarm event over the Numerex network. The Numerex gateway accepts the incoming signal and logs it for immediate viewing through the password-secured Web interface. Depending on the selected reporting options and alarm monitoring station receiver, the decoded signal can be forwarded via encrypted IP or the Public Switched Telephone Network (PSTN) to the alarm monitoring station. As an option, a customizable text message can be sent to any email-enabled device or to an alphanumeric pager. The Uplink Network Operations Center (NOC) in Atlanta activates and manages the service for its dealers.
Numerex launched Digital Uplink in 2006, with new technology including the DigiCell AnyNET device and the Digital 1650 device. The network services used for Digital Uplink are provided by SMSXpress™ from Numerex Networks. In 2006, we also began a concerted effort to provide both business and technology solutions to move legacy analog Uplink customers to Digital Uplink. We also are developing new mobile and security solutions to better serve our existing customers and enter new markets.
Uplink Sales and Marketing
Uplink is distributed through master distributors to a network of over 4,500 certified Uplink alarm and security dealers in North America for both commercial and residential alarm security markets. Uplink private labeled and custom services are marketed through direct business development and partnering initiatives. Product initiatives planned for Uplink in 2007 include added certifications that will allow us to enter new security markets as well as added hardware and service features.
Mobile End-to-End Solutions
MobileGuardian
In 2006, the MobileGuardian brand was discontinued. The brand was used primarily by a certain mobile tracking customer targeting the new car dealer market. The customer recently replaced the brand with their own private label. Their private label offering is based upon Numerex’s new mobile solution, Airdesk Mobile.
Airdesk Mobile
Airdesk Mobile (formerly known as MobileGuardian) provides advanced features and functions. Airdesk Mobile includes new device technology well suited for multiple automotive and security markets and applications. It delivers vehicle location and recovery solutions that combine the accuracy of GPS (Global Positioning System), Numerex Networks™ and wireless communications technology to improve the prospect of vehicle recovery and the timeframe in which the recovery occurs. Alert notifications, including excess speed and geo-fence boundary violations are delivered via Numerex Networks to Web-based interfaces that allow for immediate action on the part of the user.
If the vehicle’s alarm system is triggered, a message is sent to the Airdesk Mobile device located in the vehicle, which then wirelessly transmits a ‘theft’ alert notification over Numerex Networks to the vehicle’s owner via the owner’s wireless phone, email, or pager. The owner may then log on to the secure, private-labeled Web site to pinpoint the vehicle location and track its recent travel. At that point, the owner may choose to remotely disable the vehicle with a mouse click and prevent it from being restarted while he or she calls the authorities to report the theft.
The Airdesk Mobile solution is also applicable for non-theft recovery applications and markets. The technology and associated services can be used for fleet management, asset tracking and recovery, teen driver monitoring, rental tracking, and more.
For new car markets Airdesk Mobile includes bundled hardware and services at a single price point. With each device, integrated vehicle monitoring and recovery services are provided for a period of time. This includes access to the Customer Theft Recovery Call Center. Additional premium network services, including locates and service transactions, are available online directly from Numerex at the time of activation and later.
Airdesk Mobile is typically installed at the auto dealership location by the dealer/distributor. Application and network support is provided to dealers by the Numerex Network Operations Center in Atlanta. Comprehensive service coverage and distribution spans the US and Canada, with potential expansion into Mexico using the existing Numerex Networks.
Airdesk Mobile Sales & Marketing
The distribution strategy for Airdesk Mobile is designed as an indirect model that involves multiple distributors and expeditors serving auto dealerships and financial services providers. The product is only available as a private-labeled offering through these channels and is not marketed to the end user. Currently, we have a certain distributor that is the primary product sales channel for Airdesk Mobile in the new car market. We have several distributors/expeditors that serve the financial services markets. Our strategy involves expanding our distribution reach within our existing markets, as well as to certain international markets.
Numerex is also focused on delivering Airdesk Mobile to the sub-prime finance, or ‘Buy-Here-Pay-Here’, auto market through a network of distributors and dealers that service this market. The primary sub-prime finance application is the tracking and recovery of vehicles whose owners have defaulted on loans. Currently, Numerex has several distributors servicing this market.
Numerex’s industry partners market and sell our mobile products on a private-labeled basis using a number of channels. For example, a key customer, focused on the new car dealer channel, launched a program to market and sell a mobile tracking and recovery solution based upon the Airdesk Mobile platform. Others are addressing the sub-prime markets or regional fleet markets and have launched their own branded products which are based on Airdesk Mobile, each one containing a unique set of features.
We believe that Airdesk Mobile is competitively priced and offers value-added features, such as extensive network coverage, vehicle tracking, and immediate notification of a breach and/or activation of the vehicle’s alarm system. We believe Airdesk Mobile is well positioned in the established vehicle location and recovery markets as a private-labeled, digital mobile tracking and recovery solution.
In 2007, we seek to complete the development of a next-generation, lower-cost device that is expected to increase distribution of our mobile products and establish alternate distribution channels.
Networks and Network Services
Airdesk M2M Solutions and Numerex Networks
Numerex’s M2M wireless division, Airdesk, brings to market M2M solutions, and an array of products that support the M2M value chain. Core to these offerings and services is the Company’s wireless data network service, Numerex Networks™, which is a Mobile Virtual Network Operator (MVNO). MVNOs are operating companies that sell cellular services without owning the physical networks over which data are transmitted. While we own the network gateway, other message transmission infrastructure that allows us to move information or data across the cellular infrastructure, we have not invested in wireless spectrum or cellular towers. Instead, we have entered into several agreements with a variety of wireless carriers that allows us to move information with our own identification numbers over their existing cellular infrastructure. As a result, we can provide a multitude of wireless data network services. Numerex Networks is dedicated to the M2M market and currently only offers data network services. These services include specific, vertically focused M2M applications combined with our Numerex Networks and services. Numerex services offered through Airdesk are comprised of application engineering and development, customized billing, GPS mapping for mobile applications, network and application implementation management, back-end message delivery management, application and network support, and interactive voice and Web services.
We see it as our charter to go beyond providing specific products and services. Our customers and industry partners look to us not only to help integrate our wireless platform and services with their devices and applications, but also to assist them through the certification, launch, and operation of their products in their respective markets.
With the establishment of the Airdesk Division, Numerex evolved and re-branded its legacy CellemetryXG network solutions as Numerex Networks™, making our core network offerings an integral part of the Airdesk wireless M2M platform.
Numerex Networks™
Serving Airdesk and Uplink, Numerex Networks is capable of supporting a variety of remote applications that are either fixed or mobile. From Global System for Mobile Communications (GSM) and Code Division Multiple Access (CDMA) digital and Cellemetry network offerings, to premium 24/7/365 network support services, Numerex Networks supports continued expansive coverage, legacy network interoperability, and extended gateway capabilities for higher bandwidth M2M applications. Through a myriad of carrier agreements, Numerex Networks provides extensive digital and analog wireless network connectivity and services in the Continental U.S., Canada, the Caribbean, and Mexico.
Numerex launched multiple, state-of-the art, digital networks in 2006. Numerex Networks supports multiple technologies, providing unique, value added services to fulfill varied customer data and application requirements.
Real-Time Delivery with SMSXpress™
Numerex offers a unique network architecture enabling Short Message Service (SMS) delivery with low latency. Numerex Networks delivers messages from our dedicated SMSC (Short Message Service Center) to customer back-end applications. Acknowledgement of message delivery is provided within microseconds. Low latency, a dedicated SMS platform, and message acknowledgement - features that differentiate Numerex Networks and the SMSXpress service from its competitors in the market.
Flexible, Reliable GPRS Service
Numerex Networks GPRS (General Packet Radio Service) provides a secure, two-way network feature as an option, enabling private connectivity of packet routing to applications, as well as hosted applications services. The network offering allows management of dynamic device IPs, which facilitates true two-way communication between field devices and application servers. Numerex Networks GPRS provides dedicated frame relay connections to route packet data off the Internet across North America.
U.S. Coverage with 1xRTT
Numerex Networks provides coverage throughout the domestic U.S. with 1xRTT (CDMA-based single carrier (1x) Radio Transmission Technology) services. In addition, Numerex Networks delivers unique, location-based services (LBS) that provide an accurate, cost-effective way to track customers’ valuable assets. These two services have been combined for unique and specific private labeled customer applications.
‘Beyond the Network’: Value-Added Services and Customer Support
Beyond the network technology, customer support is delivered through the following offerings:
| · | 24x7 Customer Support: Numerex staffs a “’round-the-clock” support center, or help desk, to provide assistance to customers; |
| · | Flexible billing: Numerex provides accurate, timely invoices in flexible formats that detail usage per device. This flexibility is a key differentiator for customers’ end-user billing requirements; |
| · | Integration services: Numerex provides development support, in coordination with the Airdesk Technology support group, to ensure timely and efficient production; |
| · | Automated provisioning: Numerex enables automated, Web-based online provisioning of devices for immediate activation and account management; and |
| · | Network Operations Center: Customers and industry partners receive 24x7x365 network support from our Network Operations Center in Atlanta, Georgia. |
Numerex Networks’ service is provided through our focus on, and investment in: infrastructure; network management; redundancy and reliability; and support services:
| · | Infrastructure: Our Numerex Operation Center (NOC) architecture is built on the latest generation of best of class processing power, using high-grade servers in a totally redundant and hot swappable configuration. The hardware and software network topology features high grade, robust platforms for increased reliability. One of the most important components of this offering is the support delivered by the help desk. With a continuous 24x7x365 level of availability, support technicians are also knowledgeable, experienced and have the requisite skills to diagnose and resolve most issues; |
| · | Network Management: Based on best practices, the system allows for the automation of help desk management—from submission to monitoring to lifecycle management of customer issues. It also facilitates the management of tasks and asset inventory records and indicates which business services are impacted by a given incident or problem. This helps our Technical Support Center develop priorities that resolve customer issues based on business requirements and translates into higher customer satisfaction and quality of service; |
| · | Redundancy and Reliability: The operations sites are geographically diverse and are interconnected over Synchronous Optical Network (SONET) bidirectional, fault-tolerant facilities. This architecture provides Numerex Networks with service level standards that meet and exceed requirements for mission-critical applications. The technology is Underwriters Laboratories (UL) compliant and all components are UL certified; and |
| · | Network Support Services: Building on a solid technological foundation, Numerex Networks brings capable systems and processes for GSM / SMS service activation, service provisioning, inventory planning and management, and supply chain logistical support. |
Technology Development and Distribution
Numerex Network Access Technology
Numerex designs, develops, manufactures and markets a suite of network access modules (wireless data modems) that provide the physical and electrical interface between the customer’s application and Numerex Networks. Examples of the various Numerex-manufactured modules include the DigiCell 11650, Uplink DigiCell AnyNET, and AnyNET (VAR version) for security applications, and ADM3500 family for mobile applications. The Network Modules are configurable as generic product offerings for VAR application development, as fully configured modules for OEM integration, or as a component of the Company’s end-to-end solutions.
Numerex also sources Network Access Technology from industry partners in order to deliver a wider portfolio of products and services.
With the acquisition of Airdesk, Numerex became the number one distributor of Wavecom radio modules in North America. Wavecom is a leading manufacturer of compact, rugged and reliable radio modules. Airdesk technology distribution serves VARs, system integrators and enterprise customers across several M2M market segments. Numerex also intends to enhance the Airdesk distribution model for Wavecom and other radio modules by offering added services, network and end-to-end solutions to this growing customer base.
The DigiCell AnyNET module supports a variety of communication services -- including SMS, and GPRS. The module features real-time message delivery; maximum network coverage; easy customization and integration into OEM applications; support for analog, digital, and hybrid networks; and automated provisioning.
The ADM3500 is an in-vehicle tracking module that incorporates digital cellular and GPS location tracking technologies. With all-in-one GSM/SMS and GPRS capability, it offers cost-effective wireless communication, while advanced motion filtering algorithms provide sensitivity in motion detection and interpretation. The ADM3500 also supports geo-fencing, on-demand position reporting via the Internet or interactive voice systems, ‘speed-threshold crossed’ notifications and more.
Sales and Marketing
Airdesk Wireless M2M solutions and Numerex Networks employ an indirect sales model through private label/OEM agreements, channel partners, system integrators, and VARs (collectively referred to, on occasion, as ‘industry partners’). We also indirectly market and sell certain Numerex branded products and services through distribution and dealer channels, specifically Uplink security.
Our network products are integrated and bundled with Numerex technology and services to provide private-labeled solutions for both fixed and mobile applications. Our network products are also sold and marketed to VARs, integrators, and application service providers who bundle and resell Numerex Networks with their end-to-end solutions. Network products are also sold as a data-only network offering for enterprise customers running M2M applications.
Our custom M2M solutions are typically marketed to Fortune 1000 companies, allowing them to deliver additional products and services outside of their primary business objectives.
Our private-label solutions are designed and marketed for specific vertical markets. Typically these customers are sales and marketing organizations without technical resources that are seeking rapid entry into a market. We are currently concentrating on mobile solutions for the automotive market and sub-prime finance markets. Another area of focus is private labeling the Uplink service and technology for VARs and integrators that are servicing a variety of M2M customers.
NON-CORE BUSINESS SEGMENT: DIGITAL MULTIMEDIA, NETWORKING AND WIRELINE DATA COMMUNICATIONS
Numerex’s primary focus is wireless M2M networks and solutions as described above. We operate three non-core, legacy businesses that make up the balance of our business and comprise about 13% of our revenue base. These are: Digital Multimedia, Networking Integration and Wireless Data Communications through DCX.
Digital Multimedia
We design, develop, and market complete video conferencing and digital multimedia system products and services for high-quality communications networks. We manufacture both the products upon which the systems are based and incorporate third-party products where appropriate. The offerings include PowerPlay™, a digital multimedia solution for high-bandwidth private network applications. PowerPlay provides capability for interactive videoconferencing and is an integrated hardware-software system that supports user-friendly control over network devices. PowerPlay is supplemented by our desktop videoconferencing software version, IPContact™, which offers high-quality and high-performance video. These services are provided primarily through our subsidiary, BNI Solutions LLC.
Networking Integration
We provide products under the Digilog brand that assist both wireline and wireless carriers in the engineering, installation, and servicing of new telecommunications control networks. These telecommunications network operational support systems and services can be categorized as: Services, including system integration (rack and stack) and installation: Products, Test Access and Interconnecting Devices. These products and services are provided through our subsidiary, Digilog Inc.
Wireline Data Communications through DCX
Our licensed technology creates a Derived Channel on an existing telephone line by using an inaudible frequency below the voice communications spectrum for data transmission. This creates a two-way communication system that continuously monitors the integrity of a user’s telephone line and security system. We provide this service through our subsidiaries, DCX Systems and DCX Australia.
Non-Core Products and Services: Sales and Marketing
Our digital multimedia products and services are marketed through a combination of system integrators and VARs. Our networking products are sold and marketed under the Digilog brand. Distribution is focused on wireless and wireline telecommunications companies through system integration agreements with Agilent and other suppliers of telecommunications and monitoring equipment and services. Our Wireline Data Communications service is marketed under the DCX brand directly to carriers primarily in the United States and Australia.
GENERAL
Suppliers
We rely on third-party subcontractors, both in the United States and overseas, to manufacture most of the equipment used to provide our wireless M2M solutions, networking equipment and products. In addition, some of our technology products are obtained from sole-source suppliers. The loss of a subcontractor or supplier could cause a disruption in our business due to the short lead times demanded by certain customers.
Competition
Various entities, such as M2M application service providers, MVNOs, and system integrators, offer a variety of the components and services required to deliver complete M2M solution. Numerex believes that it provides all of the key components of the M2M value chain, including enabling hardware, multiple wireless technologies and custom applications, and wireless network services. Numerex uniquely sells complete network-enabled solutions, or individual components, based upon the specific needs of the customer.
The Numerex wireless data network offering, Numerex Networks, competes with KORE Telematics and Aeris as M2M network providers, and to some extent the major wireless carriers. We believe that the purchase of Airdesk, combined with the continuing development of Numerex Network offerings and services, positions us to compete with emerging providers of M2M solutions using GSM and CDMA technology. Other potentially competitive offerings include “wireless fidelity” (Wi-Fi), World Interoperability for Microwave Access (WiMAX) and other emerging technologies and networks. Principal competitive factors when selecting a network provider are network reliability and the ability of the carrier to support unique M2M requirements.
We believe that Numerex Networks, extended through various agreements with wireless operators/carriers, together with our pricing, end-to-end solution offerings, and system performance, can enable us to effectively maintain and increase our current market share. Specifically, the Airdesk acquisition brings us a new customer base that will provide additional opportunities for added network and service sales. It will also interject Numerex earlier in the customers’ decision-making processes. However, many of the competitors have greater financial and human resources than we do, which may provide them a competitive advantage in marketing and selling, as well as technological advantages obtained through greater outlays of resources for research and development.
Our Uplink security products and services have two primary competitors in the existing channels of distribution — Ademco’s AlarmNet and Telular’s Teleguard, both of which introduced new digital competing products in 2006. The principal competitive factors when making a product selection in the business and consumer security industry are price, reliability, and industry certification status. GE Interlogix and DSC Skyroute also offer competitive hardware product solutions with their network service provided by Numerex wireless communication solution. With the launch of Digital Uplink in 2006, we believe that Uplink’s products and services are competitively positioned and priced.
There are several competitors offering vehicle location and recovery services, but our principal direct competitor in the new car after-market vehicle location and recovery business is LoJack Corporation, the industry’s market leader. There are also numerous other small companies that currently offer or are developing other wireless products and services in this area. OnStar Corp., a subsidiary of General Motors Corp., which offers a full suite of concierge services, markets and sells their services primarily through automobile manufacturers. The principal competitive factors are channel distribution, hardware price, network service price, features, and the ability to locate a vehicle at any time on demand. Our competitive challenge is the pressure to maintain our hardware margins with an on-going process of cost reduction associated with the in-vehicle hardware and the expansion of our distribution network. We believe our mobile solution for this market is competitive.
The market for our technology and platforms has been characterized by rapid technological change. The principal competitive factors in this market include product performance, ease of use, reliability, price, breadth of product lines, sales and distribution capability, technical support and service, customer relations, and general industry and economic conditions. The ability to provide wireless network service, wireless radios, device technology and end-to-end solutions -- including integration, network and service management -- has set Numerex apart. Our master distribution agreement with Wavecom gives us an advantage for technology sales and an opportunity for increased network and solutions sales. Our primary competition for radio modules comes from Siemens and an assortment of smaller manufacturers.
Research and Development
Technology is subject to rapid change. Therefore, the introduction of new products, technologies, and applications in our markets could adversely affect our business. Our success will depend, in part, on our ability to enhance existing products and introduce new products and applications on a timely basis. We plan to continue to devote a portion of our resources to research and development.
We continue to invest in new services and improvements to various Numerex technologies, especially networks and digital fixed and mobile solutions. We are focused primarily on the development of expanded service capabilities; further communications costs reductions, and additional enhancement to application-specific capabilities.
We have focused on providing customers with industry-benchmark solutions that go beyond the network requirement. With digital network migration progressing and our current product offerings running on digital networks, we believe it is important to continue to communicate to the market and customers a clear migration path from legacy analog networks and services to the new digital networks and platforms. Prudent integration of new digital and Web technology into our wireless businesses is an active and ongoing process. We are committed to taking full advantage of such new technology whenever and wherever it makes sense for our customers.
Product Warranty and Service
Our wireless communications business provides a one-year parts and labor warranty on all products. Our Wireline Data communications (Derived Channel) business provides customers with limited one-year warranties on scanners and message switch software, while Subscriber Terminal Units (STUs) are typically sold with a one-year labor and materials warranty. Our digital multimedia business provides either a one-year warranty on parts and labor, depending on the scale and type of product provided. Our networking business provides a one- or two-year warranty on all telecommunications networking products. In addition, a help desk and training support is offered to users of telecommunications networking products. To date, the cost of our warranty programs have not been material.
Intellectual Property
We hold patents through Cellemetry LLC, Numerex Corp., and Numerex Investment Corp. covering the technologies we have developed in support of our product and service offerings in the United States and various other countries. These patents are by law subject to expiration. Through Cellemetry, we license certain technologies related to Cellemetry under licenses with BellSouth Corporation (now AT&T). It is our practice to apply for patents as we develop new technologies, products, or processes suitable for patent protection. No assurance can be given about the scope of the patent protection.
We also hold other intellectual property rights including, without limitation, copyrights, trademarks, and trade secret protections relating to our technology, products, and processes. Patents have a limited legal lifespan. The patents we presently hold will, by law, begin expiring over the approximate period 2010 through 2022 depending upon the effective date of the subject patent. We believe that the rapid technological developments in the telecommunications industry may limit the protection afforded by patents. Accordingly, we believe that our success will also depend on our manufacturing, engineering, and marketing know-how and the quality and economic value of our products, services, and solutions.
Cellemetry is a registered trademark of Numerex Corp. We believe that no individual trademark or trade name is material to our competitive position in the industry.
Regulation
Federal, state, and local telecommunications laws and regulations have not posed any significant impediments to either the delivery of wireless data signals using our network or the provision of alarm services by telephone companies using Derived Channel technology. We may be subject to certain governmentally imposed telecommunications taxes, surcharges, and fees, including the federal universal service charge.
By February 2008, the FCC plans to eliminate its requirement that cellular carriers offer analog service pursuant to the Advanced Mobile Phone Service (AMPS) standard. At that time, cellular carriers may stop offering analog AMPS cellular service and use the spectrum for other purposes. Services that we provide utilizing the control channel of AMPS cellular service would have replaced with digital services capable of utilizing the control channels or Short Messaging Services of digital CDMA wireless service, or digital GSM wireless service Customers that use services dependent upon the control channel of AMPS cellular services would have to replace or modify incompatible radios to utilize the new newer services. While we expect that the AMPS standard will remain available for a period of time after 2008, we have been successful in developing digital solutions that do not rely on the control channel of AMPS cellular services and are deploying those solutions now. As a consequence, we will be able to provide all of the functionality of our Cellemetry-based services, whether utilizing analog or digital protocols, into the foreseeable future. By moving to the digital standard, we will also be able to add additional functionality.
In addition, some of our products, including derived-channel STUs, Uplink radios, and certain digital multimedia products, require FCC certification for compliance with standards designed to prevent damage to the telephone network and to restrict radio frequency interference. Any of our products currently used in the United States and subject to these requirements have received all required certifications. However, anticipated design changes will require additional compliance testing and certification.
We intend to obtain certification from Underwriters Laboratories for our products sold in the United States in order to serve monitoring applications with higher levels of insurance risk, such as bank security alarm systems and fire alarm monitoring systems. Certain of our digital multimedia products also require certification from Underwriters Laboratories. We intend to obtain any required Underwriters Laboratories certifications.
Regulations similar to the above may exist in other countries. In the event that we did not comply with any such regulations, or if our current or future products do not meet various regulatory standards or receive and maintain all required certifications, our business could be adversely affected.
Employees
As of March 16, 2007, we had 110 employees in the U.S., consisting 37 in sales, marketing and customer service, 51 in engineering and operations and 22 in management and administration. We have experienced no work stoppages and none of our employees are represented by collective bargaining arrangements. We believe our relationship with our employees is good.
Available Information
We make available free of charge through our website at www.nmrx.com our annual reports on Form 10-K, quarterly reports on Form 10-Q and current reports on Form 8-K, and all amendments thereto filed or furnished pursuant to 13(a) or 15(d) of the Securities and Exchange act of 1934, as soon as reasonably practicable after such reports are filed with or furnished to the Securities and Exchange Commission. Our filings are also available through the Securities and Exchange Commission via their website, http://www.sec.gov. You may also read and copy any materials we file with the SEC at the SEC's Public Reference Room at 100 F Street, N.E., Washington, D.C. 20549. You may obtain information on the operation of the Public Reference Room by calling the SEC at 1-800-SEC-0330. The information contained on our website is not incorporated by reference in this annual report on form 10-K and should not be considered a part of this report.
Executive Officers of the Registrant
Our executive officers, and all persons chosen to become executive officers, and their ages and positions as of March 15, 2007, are as follows:
Name | Age | Position |
| Stratton J. Nicolaides* | 53 | Chairman of the Board of Directors, Chief Executive Officer |
| Michael A. Marett | 52 | Executive Vice President, Chief Operating Officer |
| Alan B. Catherall | 53 | Executive Vice President, Chief Financial Officer |
*Member of the Board of Directors
Mr. Nicolaides has served as Chief Executive Officer of the Company since April 2000, having served as Chief Operating Officer from April 1999 until March 2000 and as Chairman of the Board since December 1999. From July 1994 until April 1999, Mr. Nicolaides managed a closely held investment partnership.
Mr. Marett has been an Executive Vice President of the Company since February 2001. In February 2005 he was named Chief Operating Officer. From 1999 to 2001, Mr. Marett was Vice President, Sales and Marketing, of TManage, Inc., which provided planning, installation, and support services to companies with large remote workforces. From 1997 to 1999 Mr. Marett was Vice President, Business Development, of Mitel Business Communications Systems, a division of Mitel Corporation. Prior to this position Mr. Marett held a number of executive positions at Bell Atlantic.
Mr. Catherall has been the Executive Vice President and Chief Financial Officer of the Company since June 2003. From 1998 to 2002, Mr. Catherall served as Chief Financial Officer of AirGate PCS, a NASDAQ-listed wireless company. From 1996 to 1998, Mr. Catherall was a partner in Tatum CFO LLP, a financial services consulting company. Prior to this, he held a number of executive and management positions at MCI Communications.
Item 1A. Risk Factors
An investment in our common stock involves a high degree of risk. You should carefully consider the following information about these risks before buying shares of our common stock. The following risks and uncertainties are not the only ones facing us. Additional risks and uncertainties of which we are unaware or we currently believe are not material could also adversely affect us. In any case, the value of our common stock could decline, and you could lose all or part of your investment. You should also refer to the other information contained in this Form 10-K or incorporated herein by reference, including our consolidated financial statements and the notes to those statements. See also, “Special Note Regarding Forward-Looking Statements.”
Risks Related to Our Financial Condition and Ownership Structure
We have a history of losses and are uncertain as to our future profitability.
Although we earned a profit for the years ended December 31, 2006 and December 31, 2005 we have otherwise had a net loss each year since 1998. We may not sustain operating income, net earnings, or positive cash flow from operations in the future.
In addition, we expect to continue to incur significant operating costs and, as a result, will need to generate significant additional revenues to maintain profitability, which may not occur. If our revenues do not grow as needed to offset these costs, our business may not succeed.
We are a holding company. Our only material assets are our ownership interests in our subsidiaries. Consequently, we depend on distributions or other intercompany transfers from our subsidiaries to make payments on our debt. In addition, distributions and intercompany transfers to us from our subsidiaries will depend on:
| · | the earnings of our subsidiaries; |
| · | covenants contained in agreements to which we or our subsidiaries are, or may become, subject; |
| · | business and tax considerations; and |
| · | applicable law, including laws regarding the payment of dividends and distributions. |
We cannot assure you that the operating results of our subsidiaries or the distributions they make to us at any given time will be sufficient to make distributions or other payments to us or that any distribution and/or payments will be adequate to pay our debt, including interest payments, when due.
The structure of our company may limit the voting power of our stockholders and certain factors may inhibit changes in control of our company.
The concentration of ownership of our common stock may have the effect of delaying, deferring or preventing a change in control, merger, consolidation or tender offer that could involve a premium over the price of our common stock. Currently, our executive officers, directors and greater-than-five percent stockholders and their affiliates, in the aggregate, beneficially own approximately 45% of our outstanding common stock. These stockholders, if they vote together, are able to exercise significant influence over all matters requiring stockholder approval, including the election of directors and approval of significant corporate transactions and matters. The interests of these stockholders may be different than those of our unaffiliated stockholders and our unaffiliated stockholders may be dissatisfied with the outcome of votes that may be controlled by our affiliated stockholders.
Our articles of incorporation generally limit holdings by persons of our common stock to no more than 10% without prior approval by our Board. Except as otherwise permitted by the Board, no stockholder has the right to cast more than 10% of the total votes regardless of the number of shares of common stock owned. In addition, if a person acquires holdings in excess of this ownership limit, our Board may terminate all voting rights of the person during the time that the ownership limit is violated, bring a lawsuit against the person seeking divestiture of amounts in excess of the limit, or take other actions as the Board deems appropriate. Our articles of incorporation also have a procedure that gives us the right to purchase shares of common stock held in excess of the ownership limit.
In addition, our articles of incorporation permit our Board to authorize the issuance of preferred stock without stockholder approval. Any future series of preferred stock may have voting provisions that could delay or prevent a change in control or other transaction that might involve a premium price or otherwise be in the best interests of our common stockholders.
Risks Related to Our Business
The markets in which we operate are highly competitive, and we may not be able to compete effectively.
We face competition from many companies with significantly greater financial resources, well-established brand names, and larger customer bases. Numerous companies also may try to enter our market and expose us to greater price competition for our services. We expect competition to intensify in the future. If our competitors successfully focus on the markets we serve, our business could be adversely affected.
We operate in new and rapidly evolving markets where rapid technological change can quickly make products, including those that we offer, obsolete.
We operate in industries that are subject to evolving industry standards, rapid technological changes, and rapid changes in customer demands. These changes, individually or collectively, can adversely affect our business. If the demand for our products declines due to changes in technology, and we are unable to develop new products and services that successfully address market demand, our business will be adversely affected. In the event we keep pace with technological change, any delays in the development, introduction, and marketing of new wireless or digital multimedia products and services by us, or our suppliers, could have an adverse effect on our business.
Failure of our products and services to gain market acceptance would adversely affect our financial condition.
Over the past three years we have introduced a system enabling alarm signals to be transmitted over the cellular network to central monitoring stations; a cellular and GPS-based vehicle tracking solution, solutions tailored to the security needs of the construction industry, a multimedia videoconferencing solution, direct-to-consumer services, and enhanced “back end” services among other initiatives.. If these products and services, or any of our other existing products and services, do not perform as expected, or if our sales are less than expected, our business may be adversely affected.
Our current business plan contemplates significant expansion, which we may be unable to manage.
To the extent that we are successful in implementing our business strategy, we may experience periods of rapid expansion in the future. In order to effectively manage growth, whether organic or through acquisitions, we will need to maintain and improve our operating systems and expand, train and manage our employees. Our expansion through acquisitions is contingent on successful management of those acquisitions, which will require proper integration of new employees, processes and procedures and information systems, which can be both difficult and taxing from a human resources perspective. In addition, we must carefully manage product inventory levels to meet demand. Inaccuracies in expected demand could result in insufficient or excessive inventories and unexpected additional expenses. We must also expand the capacity of our sales, distribution and installation networks in order to achieve continued growth in our existing and future markets. The failure to manage growth effectively in any of these areas could have a material adverse effect on our business, financial condition, and results of operations.
We may require additional capital to fund further development, and our competitive position could decline if we are unable to obtain additional capital.
To address our long-term capital needs, we intend to continue to pursue strategic relationships that would provide resources for the further development of our product candidates. There can be no assurance, however, that these discussions will result in relationships or additional funding. In addition, we may continue, as we were successful in doing in 2006, to seek capital through the public or private sale of securities, if market conditions are favorable for doing so. If we are successful in raising additional funds through the issuance of equity securities, stockholders will likely experience dilution, or the equity securities may have rights, preferences, or privileges senior to those of the holders of our common stock. If we raise funds through the issuance of debt securities, those securities would have rights, preferences, and privileges senior to those of our common stock. There can be no assurance that we will be successful in seeking additional capital.
If we experience product defects or failures, our costs could increase and delay product shipments.
Our products and services are complex. While we test our products, they may still have errors, defects, or bugs that we find only after commercial production has begun. In the past, we have experienced errors, defects, and bugs in connection with new products. Our customers may not purchase our products if the products have reliability, quality, or compatibility problems. Furthermore, product errors, defects, or bugs could result in additional development costs, diversion of resources from our other development efforts, claims by our customers or others against us, or the loss of credibility with our current and prospective customers. Historically, the time required for us to correct defects has caused delays in product shipments and resulted in lower than expected revenues. Significant capital and resources may be required to address and fix problems in new products. If our products do not function properly, we may have lower than expected revenues, and net income would likely be adversely impacted.
We depend on contract manufacturers to manufacture substantially all of our products, and any delay or interruption in manufacturing would result in delayed or reduced shipments to our customers.
We outsource the manufacturing of our products to independent companies and do not have internal manufacturing capabilities to meet the demands of our customers. Any delay, interruption, or termination of the manufacture of our products could harm our ability to provide our products to our customers and, consequently, could have a material adverse effect on our business and operations.
A large portion of our revenues is derived from sales to distributors, and changes in the productivity of our distribution channels or any disruption of our distribution channel could adversely affect the sale of our products and services.
We primarily sell our products through distributors. Our sales could be affected by disruptions in the relationships between our distributors and us or between our distributors and end users of our products or services. Also, distributors may choose not to emphasize our products and services to their customers. Any of these actions or results could lead to decreased sales.
If we do not adapt to changing regulations that affect us, our business would suffer.
We operate in a technological environment characterized by rapid change in products, capabilities, and both consumer and societal expectations. As a result, the regulatory environment in which we operate is continually changing as it adjusts to address new issues in a rapidly changing industry. Future regulations could make our products illegal or obsolete, or may require us to make substantial changes to our products in order to continue to market them. For example, by February 18, 2008, cellular carriers in the United States will no longer be required by the FCC to provide analog service pursuant to the Advanced Mobile Phone Service (AMPS) standard. (No date has been set for ending analog service in Canadian provinces. However,
cellular carriers in Canada have made the determination to follow the U.S. and have begun their transition from analog to digital networks as well.) Cellular carriers may stop offering analog AMPS cellular service. Cellemetry, which currently operates using AMPS cellular service, would have to begin operating on other wireless service channels, and customers who use services that involve Cellemetry would have to replace incompatible equipment. Other products and services that we make and that depend on Cellemetry, such as Airdesk Mobile, would be similarly affected. While we have developed a digital standard, we might not be successful in transitioning our existing customer base to such standard. And, as we expand beyond the “business-to-business” market and begin providing some services directly to end user consumers, some of our sales could become subject to federal and state level consumer protection laws and regulations that could prompt adverse action by regulators in the event of an alleged violation of those laws.
Many of the ultimate consumers of our PowerPlay products and services are elementary and secondary schools that pay for their purchases with funding that they receive through the Schools and Libraries Program (commonly known as the “E-Rate Program”) administered by the Universal Service Fund, which is administered by the Universal Service Administrative Company (USAC) under the direction of the Federal Communications Commission (FCC). Changes in this program could affect demand for our PowerPlay products and services.
We may not be able to achieve our organic growth goals if we do not operate our network efficiently and generate additional traffic.
Our long-term success depends on our ability to operate, manage, and maintain a reliable and cost effective network, as well as our ability to keep pace with changes in technology. Furthermore, our network operations are dependent on third parties. If we experience technical or logistical impediments to our ability to transfer traffic onto our network, fail to generate additional traffic on our network, or if we experience difficulties with our third party providers, we may not achieve our revenue goals or otherwise be successful in growing our business.
We may lose customers if we experience system failures that significantly disrupt the availability and quality of the service our network provides.
The operation of our network depends on our ability to avoid or limit any interruptions in service to our customers. Interruptions in service or performance problems, for whatever reason, could undermine confidence in our services and cause us to lose customers or make it more difficult to attract new customers. In addition, because most of our customers are businesses, any significant interruption in service could result in lost profits or other losses to our customers. Although we attempt to disclaim or limit liability in our agreements with these customers, a court may not enforce a limitation on liability, which could expose us to losses.
The failure of any equipment on our network, or that of a customer, could result in the interruption of that customer’s service until necessary repairs are made or replacement equipment is installed. Network failures, delays, and errors may result from natural disasters, power losses, security breaches, viruses or terrorist acts. These failures or faults cause delays, service interruptions, expose us to customer liability, or require expensive modifications that could have a material adverse effect on our business and operating results.
We may have difficulty identifying the source of a problem in our network.
If a problem occurs on our network, it may be difficult to identify the source of the problem due to the overlay of our network with the cellular telephone network and our network’s reliance on the cellular network. The occurrence of hardware or software errors, regardless of whether such errors are caused by our products or our network, may result in the delay or loss of market acceptance of our products and services, and any necessary revisions may result in significant and additional expenses. The occurrence of some of these types of problems may seriously harm our business, financial condition, or operations.
We operate internationally, which subjects us to international regulation and business uncertainties that create additional risk for us.
We are doing business in Australia, Canada, China, Mexico, Puerto Rico, and Japan. Accordingly, we are subject to international regulation and business uncertainties. International sales and operations may be subject to additional risks than those risks in the United States, such as the following:
| · | imposition of government controls, |
| · | export license requirements, |
| · | restrictions on the export of critical technology, |
| · | currency exchange rate fluctuations, |
| · | generally longer receivable collection periods and difficulty in collecting accounts receivable, |
| · | trade restrictions and changes in tariffs, |
| · | difficulties in staffing and managing international operations, and |
| · | potential insolvency of international dealers and distributors. |
In addition, the laws of certain countries do not protect our products as much as the laws of the United States, which may lead to the potential loss of our proprietary technology through theft, piracy or a failure to protect our rights. These factors may have a material adverse effect on our future international sales and, consequently, on our business and results of operations.
The loss of intellectual property protection both U.S. and international, could have a material adverse effect on our operations.
Our future success and competitive position depend upon our ability to obtain and maintain intellectual property protection, especially with regard to patents on the technology used in our core business. Loss of such protection could compromise any advantage obtained and, therefore, impact our sales, market share, and results. Furthermore, our future or pending patent applications may not be issued with the scope of the claims sought by us, if at all. In addition, others may develop technologies that are similar or superior to our technology, duplicate our technology or design around the patents owned or licensed by us. Effective patent, trademark, copyright, and trade secret protection may be unavailable or limited in foreign countries where we may need protection. We cannot be sure that steps taken by us to protect our technology will prevent misappropriation of the technology.
Our services are highly dependent upon our technology and the scope and limitations of our proprietary rights therein. In order to protect our technology, we rely on a combination of patents, copyrights, and trade secret laws, as well as certain customer licensing agreements, employee and third-party confidentiality and non-disclosure agreements, and other similar arrangements. If our assertion of proprietary rights is held to be invalid, or if another party’s use of our technology were to occur to any substantial degree, our business, financial condition and results of operations could be materially adversely affected.
Our competitors may obtain patents that could restrict our ability to offer our products and services, or subject us to additional costs, which could impede our ability to offer our products and services and otherwise adversely affect us.
Several of our competitors have obtained and can be expected to obtain patents that cover products or services directly or indirectly related to those offered by us. There can be no assurance that we are aware of all patents containing claims that may pose a risk of infringement by its products or services. In addition, patent applications in the United States are confidential until a patent is issued and, accordingly, we cannot evaluate the extent to which our products or services may infringe on future patent rights held by others.
Furthermore, even with technology that we develop independently, a third party may claim that we are using inventions claimed by their patents and may go to court to stop us from engaging in our normal operations and activities, such as research and development and the sale of any of our products or services. These lawsuits are expensive and would consume time and other resources. The court could decide that we are infringing the third party’s patents and order us to stop the activities claimed by the patent and/or order us to pay the other party damages for having infringed its patents. There is no guarantee that the prevailing patent owner would offer us a license so that we could continue to engage in activities claimed by the patent, or that such a license, if made available to us, could be acquired on commercially acceptable terms.
Some licenses we obtain may be nonexclusive and, therefore, our competitors may have access to the same technology licensed to us. If we fail to obtain a required license or are unable to design around a patent, we may be unable to sell some of our products, and there can be no assurance that we would be able to design and incorporate alternative technologies, without a material adverse effect on our business, financial condition, and results of operations.
Our products and information are subject to secrecy and confidentiality obligations, violations of which may not be able to be remedied.
Although we have taken, and will continue to take, steps to protect the confidential nature of our proprietary and trade secret information, we cannot control whether secrecy obligations will be honored or whether disputes will arise related to this
information. There is a risk that the steps we have taken will not prevent misappropriation of our technology or that others might independently develop substantially equivalent products and processes or otherwise gain access to our technology. In addition, we cannot rule out that we will not be subjected to claims from others that we are infringing on their patents or are misappropriating their trade secrets or confidential proprietary information.
We seek to protect our trade secrets and proprietary know-how, in part, through confidentiality agreements with our employees and licensees. We cannot guarantee you that the other parties will not violate these agreements, that we will have adequate remedies for any breach, or that our trade secrets will not otherwise become known or be independently developed by competitors. We cannot be certain that we will, in connection with every relationship, be able to maintain the confidentiality of our technology, which if released could materially affect our business. To the extent that our licensees develop inventions or processes independently that may be applicable to our products, disputes may arise as to the ownership of the proprietary rights to this information. These inventions or processes will not necessarily become our property, but may remain the property of these persons or their full-time employers. We could be required to make payments to the owners of these inventions or processes, in the form of either cash or equity, or a combination of both.
Item 1B. Unresolved Staff Comments.
None.
Item 2. Properties.
All of our facilities are leased. Set forth below is certain information with respect to our leased facilities:
Location | Principal Business | Square Footage | Lease Term |
| Atlanta, Georgia | Wireless Data Communications and Principal Executive Office | 24,135 | 2011 |
| Warminster, Pennsylvania | Wireless Data Communication | 18,000 | 2011 |
| Willow Grove, Pennsylvania | Networking and Wireline Data Communications | 10,000 | 2008 |
| State College, Pennsylvania | Digital Multimedia | 10,788 | Month to Month |
We conduct engineering, sales and marketing, and administrative activities at many of these locations. We believe that our existing facilities are adequate for our current needs. As we grow and expand into new markets and develop additional products, we may require additional space, which we believe will be available at reasonable rates.
We engage in limited manufacturing, equipment and product assembly and testing for certain products. We also use contract manufacturers for production, sub-assembly and final assembly of certain products. We believe there are other manufacturers that could perform this work on comparable terms.
Item 3. Legal Proceedings.
None other than in the ordinary course of business.
Item 4. Submission of Matters to a Vote of Security Holders.
Not applicable.
PART II
Item 5. Market for the Registrant's Common Stock and Related Shareholder Matters.
The Company’s Common Stock trades publicly on the NASDAQ National Market System under the symbol NMRX. We currently do not pay any cash dividends. In deciding whether or not to declare or pay dividends in the future, the Board of Directors will consider all relevant factors, including our earnings, financial condition and working capital, capital expenditure requirements, any restrictions contained in loan agreements and market factors and conditions.
The following table sets forth, for the fiscal quarters indicated, the high and low sales prices per share for the Common Stock on the NASDAQ National Market for the applicable periods.
Fiscal 2006 | | High | | Low | |
| | | | | | |
| First Quarter (January 1, 2006 to March 31, 2006) | | $ | 8.71 | | $ | 4.59 | |
| Second Quarter (April 1, 2006 to June 30, 2006) | | | 8.99 | | | 6.39 | |
| Third Quarter (July 1, 2006 to September 30, 2006) | | | 10.25 | | | 7.45 | |
| Fourth Quarter (October 1, 2006 to December 31, 2006) | | | 10.35 | | | 7.76 | |
| | | | | | | | |
| | | | | | | | |
Fiscal 2005 | | | High | | | Low | |
| | | | | | | | |
| First Quarter (January 1, 2005 to March 31, 2005) | | $ | 5.30 | | $ | 4.36 | |
| Second Quarter (April 1, 2005 to June 30, 2005) | | | 5.15 | | | 4.00 | |
| Third Quarter (July 1, 2005 to September 30, 2005) | | | 6.19 | | | 4.56 | |
| Fourth Quarter (October 1, 2005 to December 31, 2005) | | | 5.50 | | | 4.22 | |
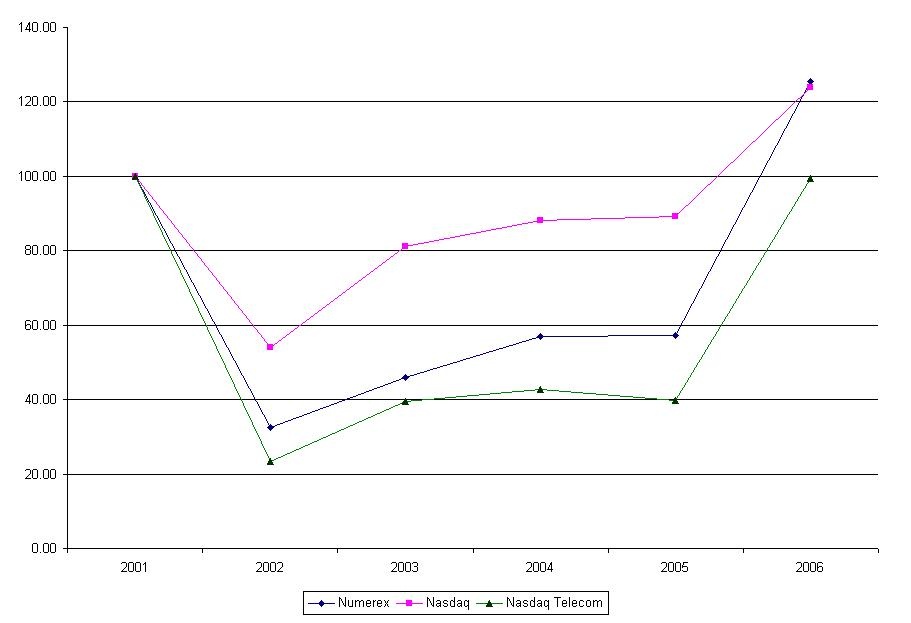
Performance Graph
The information included under the heading "Performance Graph" in this Item 5 of this Annual Report on Form 10-K is "furnished" and not "filed" and shall not be deemed to be "soliciting material" or subject to Regulation 14A or 14C, nor shall it be deemed "filed" for purposes of Section 18 of the Securities Exchange Act of 1934, as amended (the "Exchange Act"), or otherwise subject to the liabilities of that section, nor shall it be deemed incorporated by reference in any filing under the Securities Act of 1933, as amended, or the Exchange Act, except to the extent that we specifically incorporate it by reference into any such filing.
The following graph shows a comparison of the cumulative total return for Common Stock, the NASDAQ Composite Index and the NASDAQ Telecomm Index, assuming (i) an investment of $100 in each, on December 31, 2001, the last trading day before the beginning of the Company’s five preceding years, and, (ii) in the case of the Indices, the reinvestment of all dividends.
SHAREHOLDER VALUE AT YEAR END |
| | 12/31/01 | 12/31/02 | 12/31/03 | 12/31/04 | 12/31/05 | 12/31/06 |
| NMRX | $100.00 | $ 32.61 | $ 46.06 | $ 56.97 | $ 57.33 | $125.60 |
| NASDAQ US Index | $100.00 | $ 54.06 | $ 81.09 | $ 88.06 | $ 89.27 | $123.84 |
| NASDAQ Telecomm Index | $100.00 | $ 23.47 | $ 39.61 | $ 42.78 | $ 39.69 | $ 99.32 |
| | | | | | | |
As of March 15, 2007, there were 62 holders of record of our Common Stock, approximately 7 beneficial shareholders and 13,050,399 shares of Common Stock outstanding. Because many of the shares of our common stock are held by brokers and other institutions on behalf of stockholders, we are unable to estimate the total number of stockholders represented by these record holders.
We have no plans now or in the foreseeable future to declare or pay cash dividends on our common stock
Item 6. Selected Financial Data.
The following selected financial data should be read in conjunction with the consolidated financial statements and the notes contained in “Item 8. Financial Statements and Supplementary Data” and the information contained in “Item 7. Management’s Discussion and Analysis of Financial Condition and Results of Operations.” Historical results are not necessarily indicative of future results.
The following financial information was derived using the consolidated financial statements of Numerex Corp. The table lists historical financial data of the Company for the fiscal years ended December 31, 2006, 2005, 2004, 2003 and 2002.
| | | December 31, 2006 | | December 31, 2005 | | December 31, 2004 | | December 31, 2003 | | December 31, 2002 | |
| (in thousands) | | | | | | | | | | | |
Statement of Operations Data | | | | | | | | | | | | | | | | |
| Revenues | | $ | 52,788 | | $ | 29,946 | | $ | 22,993 | | $ | 20,157 | | $ | 24,501 | |
| Gross profit | | | 18,922 | | | 12,717 | | | 10,039 | | | 9,029 | | | 10,221 | |
| Operating income (loss) | | | 1,674 | | | 961 | | | (1,631 | ) | | (2,726 | ) | | (7,468 | ) |
| Net income (loss) | | | 4,103 | | | 593 | | | (2,079 | ) | | (1,404 | ) | | (7,450 | ) |
| Earnings (loss) per common share (diluted) | | | 0.32 | | | 0.05 | | | (0.19 | ) | | (0.13 | ) | | (0.71 | ) |
Balance Sheet Data | | | | | | | | | | | | | | | | |
| Cash, cash equivalents and short-term investments | | $ | 20,384 | | $ | 4,359 | | $ | 1,684 | | $ | 734 | | $ | 2,137 | |
| Total Assets | | | 66,394 | | | 36,348 | | | 32,612 | | | 33,970 | | | 37,111 | |
| Total Debt and capital lease obligations (short and long term) | | | 14,337 | | | 1,326 | | | 3,848 | | | 3,782 | | | 1,573 | |
| Shareholders' equity | | | 41,420 | | | 27,729 | | | 23,652 | | | 25,366 | | | 27,615 | |
Cash Flow Data | | | | | | | | | | | | | | | | |
| Net cash provided by (used in) operations | | $ | 2,663 | | $ | 3,277 | | $ | 1,520 | | $ | 706 | | $ | (2,890 | ) |
Item 7. Management's Discussion and Analysis of Financial Condition and Results of Operations.
Overview
Numerex Corp is a wireless machine-to-machine communications, technology and solutions business. The Company combines its network services, products and applications development capabilities to create innovative packaged and custom designed machine-to-machine solutions for customers across multiple market segments.
Fiscal year 2006 represented an improvement over prior periods. Full year revenues of almost $53 million increased $22.8 million or 76% from 2005. All of this increase came from our wireless division where 2006 revenues grew 107% compared to 2005.
Gross margins for 2006 were 35.9% compared with 42.5% in 2005. This was due to strong acceleration in wireless data product sales which typically earn a lower margin than that generated by service revenue. These product sales, however, should result in enhanced recurring service revenue in subsequent periods.
For fiscal year 2006 overheads, which include selling, general and administrative (SG&A) costs as well as research and development expenses and bad debt costs, collectively were $13.4 million or $3.3 million higher than for 2005. This increase in SG&A expenses is primarily related to our acquisition of the assets of AIRDESK, Inc. SG&A expenses, which represented almost 34% of revenues in 2005, were less than 26% in 2006.
As a result of strengthening revenues, a decrease in gross margins and continued control over costs, we recorded a $3.5 million improvement in net earnings in 2006, from approximately a $600,000 profit for the year ended December 31, 2005 to a profit of $4.1 million for the comparative period for 2006. For the year ended December 31, 2006 we released approximately $2.9 million of our valuation allowance, but this release of the valuation allowance was partially offset by a goodwill impairment charge of $2.1 million.
Our balance sheet also shows similar improvement in 2006. For example, our working capital was $25.9 million on December 31, 2006 compared to $4.8 million at December 31, 2005. In late December 2006, the Company entered into a $10 million Convertible Term Note with the Laurus Master Fund, Ltd. to provide additional funds primarily for strategic initiatives.
The following is a discussion of our consolidated financial condition and results of operations for the fiscal years ended December 31, 2006 and 2005 and 2004. This discussion should be read in conjunction with our consolidated financial statements, the related notes thereto, and other financial information included elsewhere in this report.
Critical Accounting Policies
Note A of the Notes to the Consolidated Financial Statements includes a summary of the significant accounting policies and methods used in the preparation of Numerex’s Consolidated Financial Statements. The following is a brief discussion of the more significant accounting policies and methods used.
General
The preparation of financial statements in conformity with accounting principles generally accepted in the United States of America requires management to make estimates and assumptions that affect the reported amounts of assets and liabilities and the disclosure of contingent assets and liabilities at the dates of the financial statements and the reported amounts of revenues and expenses during the reporting periods. The most significant estimates and assumptions relate to revenue recognition, accounts receivable and allowance for doubtful accounts, inventories and the adequacy of reserves for excess and obsolete inventories, accounting for income taxes and valuation of goodwill and other intangible assets. Actual amounts could differ significantly from these estimates.
Revenue Recognition
We primarily sell products, recurring services (most billed on a monthly basis) and on-demand services. Product revenues are recognized at the time title passes to the customer, which in most cases is at the time of shipment.
We bill most of our recurring service revenues on a monthly basis, which are generated by providing customers access to our wireless machine-to-machine communications network (the “Network”). We sell these services to retailers and wholesalers of the service. For services sold to retailers, monthly service fees are generally a fixed monthly amount billed one month in advance. We defer the advance billing for the service and recognize the revenue when the services are provided. For services sold to wholesalers, the customers are billed a fixed base fee in
advance and usage fees in arrears at the end of each month. Again, we defer the advance billing of the base fee and recognize the revenues when the services are performed.
We also provide services on a demand basis. These types of services are generally completed in a short period of time (usually less than one month) and are billed and the revenue recognized when the services are completed.
Accounts Receivable and Allowance for Doubtful Accounts
Our estimate for our allowance for doubtful accounts related to trade receivables is calculated based on two methods which are combined to determine the total amount reserved. First, we evaluate specific accounts where information exists that the customer may have an inability to meet its financial obligations. In these cases, we use our judgment, based on the best available facts and circumstances, and record a specific reserve for that customer to reduce the receivable to the amount that is expected to be collected. These specific reserves are reevaluated and adjusted as additional information is received that impacts the amount reserved. Second, we establish a general reserve for all customers based on a range of percentages applied to aging categories. These percentages are based on historical collection and write-off experience. If circumstances change, (i.e. higher than expected defaults or an unexpected material adverse change in a major customer’s ability to meet its financial obligation to us), our estimates of the recoverability of amounts due to us could be changed by a significant amount.
Inventories and Reserves for Excess, Slow-Moving and Obsolete Inventory
We value our inventory at the lower of cost or market. We continually evaluate the composition of our inventory and identify, with estimates, potential future excess, obsolete and slow-moving inventories. We specifically identify obsolete products for reserve purposes and analyze historical usage, forecasted production based on demand forecasts, current economic trends, and historical write-offs when evaluating the adequacy of the reserve for excess and slow-moving inventory. If we are not able to achieve our expectations of the net realizable value of the inventory at its current carrying value, we would adjust our reserves accordingly.
Valuation of Goodwill and Other Intangible Assets
In accordance with Financial Accounting Standards Board Statement No. 144, Accounting for the Impairment or Disposal of Long-Lived Assets, (“SFAS No. 144”) and Statement of Financial Accounting Standards No. 142, Goodwill and Other Intangible Assets (“SFAS No. 142”), we do not amortize goodwill and other intangible assets with indefinite lives. Our long-lived and intangible assets and goodwill are subject to annual impairment tests, which require us to estimate the fair value of our business compared to the carrying value. The impairment reviews require an analysis of future projections and assumptions about our operating performance. Should such review indicate the assets are impaired, we would record an expense for the impaired assets.
Annual tests or other future events could cause us to conclude that impairment indicators exist and that our goodwill is impaired. For example, if we had reason to believe that our recorded goodwill and intangible assets had become impaired due to decreases in the fair market value of the underlying business, we would have to take a charge to income for that portion of goodwill or intangible assets that we believed was impaired. Any resulting impairment loss could have a material adverse impact on our financial position and results of operations.
We conducted our goodwill analysis and assessment for all of our reporting units in February 2007, and as a result recorded a $2.1 million pre-tax, non cash charge for impairment of goodwill in our Broadband Networks, Inc (“BNI”) unit within the non-core Digital Multimedia, Networking and Wireline segment. BNI’s sales have declined in each of the past two years, and this trend is expected to continue. Based on a discounted cash flow valuation of BNI and a fair market value of its tangible and intangible assets, the $2.1 million charge to goodwill was taken. The non-cash charge has no impact on our liquidity or our future operations. After the charge, our net goodwill balance is $16.0 million.
Deferred Tax Valuation Allowance
In assessing the realizability of deferred tax assets, management considers whether it is more likely than not that some portion or all of the deferred tax assets will not be realized. The ultimate realization of deferred tax assets is dependent upon the generation of future taxable income during the periods in which those temporary differences become deductible. Management considers projections of future taxable income, tax planning strategies and the reversal of temporary differences in making this assessment. During the year ended December 31, 2006, management determined that it was more likely than not that the benefit of a portion of the net operating loss carryforwards would be realized by the Company.
A portion of the valuation allowance was reversed, which reflects the amount of net operating loss carryforwards projected to be utilized during the years ending December 31, 2006, 2007, and 2008. The total tax affected amount of valuation allowance reversed was $4,572,000, which includes projected utilization of net operating loss carryforwards in 2006, 2007, and 2008 and a deferred tax liability related to intangibles of $338,000.
The entire amount of the valuation allowance reversal was taken in the current year as an income tax benefit with the exception of $120,000. This amount reflects net operating loss carryforwards that were acquired and accordingly the reversal of the valuation allowance on this amount resulted in a reduction to goodwill.
Result of Operations
The following table sets forth, for the periods indicated, certain revenue and expense items and the percentage increases and decreases for those items in the Company’s Consolidated Statements of Operations.
(in thousands, except per share amounts) | | For the years ended December 31, | | 2006 vs. 2005 | | 2005 vs. 2004 | |
| | | 2006 | | 2005 | | 2004 | | % Change | | % Change | |
| Net sales: | | | | | | | | | | | | | | | | |
| Wireless Data Communications | | | | | | | | | | | | | | | | |
| Product | | $ | 32,383 | | $ | 11,919 | | $ | 5,913 | | | 171.7 | % | | 101.6 | % |
| Service | | | 13,938 | | | 10,409 | | | 8,687 | | | 33.9 | % | | 19.8 | % |
| Sub-total | | | 46,321 | | | 22,328 | | | 14,600 | | | 107.5 | % | | 52.9 | % |
| Digital Multimedia, Networking and Wireline Services | | | | | | | | | | | | | | | | |
| Product | | | 2,141 | | | 2,654 | | | 3,784 | | | -19.3 | % | | -29.9 | % |
| Service | | | 4,326 | | | 4,964 | | | 4,609 | | | -12.9 | % | | 7.7 | % |
| Sub-total | | | 6,467 | | | 7,618 | | | 8,393 | | | -15.1 | % | | -9.2 | % |
| Total net sales | | | | | | | | | | | | | | | | |
| Product | | | 34,524 | | | 14,573 | | | 9,697 | | | 136.9 | % | | 50.3 | % |
| Service | | | 18,264 | | | 15,373 | | | 13,296 | | | 18.8 | % | | 15.6 | % |
| Total net sales | | | 52,788 | | | 29,946 | | | 22,993 | | | 76.3 | % | | 30.2 | % |
| Cost of product sales (excluding depreciation) | | | 27,967 | | | 11,303 | | | 7,626 | | | 147.4 | % | | 48.2 | % |
| Cost of services (excluding depreciation and amortization) | | | 5,750 | | | 5,748 | | | 4,943 | | | 0.0 | % | | 16.3 | % |
| Depreciation and amortization | | | 149 | | | 178 | | | 385 | | | -16.3 | % | | -53.8 | % |
Gross Profit | | | 18,922 | | | 12,717 | | | 10,039 | | | 48.8 | % | | 26.7 | % |
Gross Profit % | | | 35.8 | % | | 42.5 | % | | 43.7 | % | | | | | | |
| | | | | | | | | | | | | | | | | |
| Selling, general, and administrative expenses | | | 12,088 | | | 8,663 | | | 8,625 | | | 39.5 | % | | 0.4 | % |
| Research and development expenses | | | 1,067 | | | 1,106 | | | 906 | | | -3.5 | % | | 22.1 | % |
| Bad debt expense | | | 198 | | | 325 | | | 475 | | | -39.1 | % | | -31.6 | % |
| Depreciation and amortization | | | 1,755 | | | 1,662 | | | 1,664 | | | 5.6 | % | | -0.1 | % |
| Goodwill impairment | | | 2,140 | | | - | | | - | | | NA | | | NA | |
Operating earnings (loss) | | | 1,674 | | | 961 | | | (1,631 | ) | | 74.2 | % | | -158.9 | % |
| | | | | | | | | | | | | | | | | |
| Interest expense, net | | | (552 | ) | | (311 | ) | | (637 | ) | | 77.5 | % | | -51.2 | % |
| Other income and (expense), net | | | 31 | | | (5 | ) | | (52 | ) | | -720.0 | % | | -90.4 | % |
| Gain on sale of business | | | | | | | | | 250 | | | | | | | |
| Provision for income taxes | | | 2,950 | | | (52 | ) | | (9 | ) | | -5773.1 | % | | 477.8 | % |
Net earnings (loss) | | | 4,103 | | | 593 | | | (2,079 | ) | | 591.9 | % | | -128.5 | % |
Net earnings (loss) applicable to common shareholders | | $ | 4,103 | | $ | 593 | | $ | (2,079 | ) | | 591.9 | % | | -128.5 | % |
| Basic earnings (loss) per common share | | $ | 0.33 | | $ | 0.05 | | $ | (0.19 | ) | | | | | | |
| Diluted earnings (loss) per common share | | $ | 0.32 | | $ | 0.05 | | $ | (0.19 | ) | | | | | | |
| Basic | | | 12,502 | | | 11,231 | | | 10,798 | | | | | | | |
| Diluted | | | 12,985 | | | 11,482 | | | 10,798 | | | | | | | |
See notes to consolidated financial statements
Fiscal Years Ended December 31, 2006 and December 31, 2005
Net revenues increased 76.3% to $52.8 million for the year ended December 31, 2006 as compared to $29.9 million for the year ended December 31, 2005. The increase in total net revenues for the year ended December 31, 2006 is attributable to a 136.9% increase in total product sales and an 18.9% increase in service revenue. The product sales and service revenue increase for the year ended December 31, 2006, compared to the same period in 2005, was in Wireless Data Communications in the amount of $24.0 million. These increases were partially offset by a decrease in Digital Multimedia, Networking & Wireline Security product sales and service revenue of $1.2 million.
Cost of product sales increased 147% to $28.0 million for the year ended December 31, 2006 as compared to $11.3 million for the year ended December 31, 2005. The increase in cost of sales was primarily the result of higher product sales volume in Wireless Data Communications.
Cost of services was flat at $5.8 million for the years ended December 31, 2006 and 2005.
Cost of sales depreciation and amortization expense decreased 16% to $149,000 for the year ended December 31, 2006 as compared to $178,000 for the year ended December 31, 2005.
Gross profit, as a percentage of net revenue, was 35.8% for the year ended December 31, 2006 as compared to 42.5% for the year ended December 31, 2005. The total gross profit as a percentage of revenue decreased for the twelve month period ended December 31, 2006 compared to the same period in 2005 because product sales were 65.2% of total revenue for the year ended December 31, 2006 versus 48.7% for the year ended December 31, 2005. Since, gross profit as a percentage of revenue is generally less on product sales than for service revenue, the increase in product sales versus service revenue decreased the total gross profit as a percentage of revenue.
Selling, general, administrative and other expenses increased 40.0% to $12.1 million for the year ended December 31, 2006 as compared to $8.7 million for the year ended December 31, 2005. As a percentage of revenue, selling, general, administrative and other expenses decreased to 23.0% for the year ended December 31, 2006 as compared to 28.9% for the year ended December 31, 2005. Selling, general, administrative and other expenses decreased as a percentage of revenue for the year primarily due to control over these types of expenses.
Research and development expenses were relatively flat for the year ended December 31, 2006 at $1.1 million. We expense most of our research and development costs and expect such costs to continue at approximately these current levels.
Bad debt expense decreased 39.1% to $198,000 for the year ended December 31, 2006 as compared to $325,000 for the year ended December 31, 2005. Bad debt decreased during the period as a result of our continued stringent credit policies and collections processes.
Depreciation and amortization expense increased 5.4% to $1,755,000 for the year ended December 31, 2006 as compared to $1,662,000 for the year ended December 31, 2005. This increase was due to depreciation expense on purchases of new equipment during 2006.
We recorded a pre-tax, non-cash charge of $2.1 million for the impairment of goodwill within the Digital Multimedia, Networking and Wireline segment for the year ended December 31, 2006. Key factors driving the amount of the impairment charge include the Company’s assessment of the long term outlook for its Broadband Networks, Inc. unit within the Digital Multimedia, Networking and Wireline segment and a determination that a reduction in the goodwill balance in the amount of $2.1 million would be required to more properly reflect the current value of the business. We did not record any goodwill impairment for the year ended December 31, 2005.
Interest expense net of interest income increased to $552,000 in 2006 compared to $311,000 for the prior year. This increase was primarily the result of the transactions with the Laurus Master Fund (Laurus) that occurred on January 25, 2005 and May 30, 2006. Interest expense related to these transactions was $638,000 for the twelve months ended December 31, 2006. The increase in interest expense related to the Laurus transactions was partially offset by interest income of $86,000. Please see Note A (13) to our Consolidated Financial Statements for additional information about our transactions with Laurus.
A Foreign currency gain of $10,000 was recorded for the year ended December 31, 2006 up from a $5,000 loss for the year ended December 31, 2005. This increase was the result of decreased foreign currency losses on sales to Canadian customers. Other income of $21,000 was recorded for the year ended December 31, 2006 as a result of a refund at our Australian location.
We recorded a provision (benefit) for income taxes of ($2,950,000) and $52,000 for the years ended December 31, 2006 and 2005, respectively. The amount of income tax benefit recorded for reversal of valuation allowance was $4,572,000 and $241,000 for the years ended December 31, 2006 and 2005, respectively. The effective tax rate differs from the statutory U.S. federal income tax rate of 34% primarily due to permanent differences, foreign and state income tax differences, and the benefit of reversal of valuation allowance for the years ended December 31, 2006 and 2005.
We had provided a valuation allowance of $11,439,000 as of December 31, 2005, on 100% of our deferred tax assets as it had been determined that it was more likely than not that the deferred tax assets would not be realized. We reversed a portion of the valuation allowance related to certain net operating loss carryforward deferred tax assets expected to be utilized. For the remaining deferred tax assets, we intend to maintain a valuation allowance until sufficient positive evidence exists to support their reversal. As of December 31, 2006, the remaining valuation allowance is $6,867,000.
Basic and diluted earnings per common share increased to $.33 and $.32 respectively for year ended December 31, 2006 as compared to $.05 for the year ended December 31, 2005.
The weighted average basic shares outstanding increased to 12,502,000 for the year ended December 31, 2006 as compared to 11,231,000 for the year ended December 31, 2005. The increase in weighted average basic shares outstanding for the twelve-month period ended was due to the issuance of 885,000 common shares to Laurus in connection with the conversion of our debt, as discussed above as well as the issuance of 348,000 common shares related to the acquisition of the assets of AIRDESK, Inc.
Fiscal Years Ended December 31, 2005 and December 31, 2004
Net sales increased 30.2% to $29.9 million for the year ended December 31, 2005 from $23.0 million for the year ended December 31, 2004. The increase in net sales in 2005 is attributable to a 50.3% increase in total product sales and a 15.6% increase in service sales. Substantially all of this increase is attributable to a $7.7 million increase in product and service sales in Wireless Data Communications in 2005, partially offset by an $800,000 decrease in Digital Multimedia, Networking and Wireline product sales.
Cost of product sales increased 48.2% to $11.3 million for the year ended December 31, 2005 from $7.6 million for the year ended December 31, 2004. This increase was primarily the result of higher product sales volume in the Wireless Data Communications, partially offset by lower Digital Multimedia, Networking and Wireline product sales.
Cost of services increased 16.3% to $5.7 million for the year ended December 31, 2005 from $4.9 million for the year ended December 31, 2004. This increase was primarily the result of higher service sales volume in Wireless Data Communications, Digital Multimedia, Networking and Wireline and Wireline.
Cost of sales depreciation and amortization expense decreased 53.8% to $178,000 for the year ended December 31, 2005 from $385,000 for the year ended December 31, 2004. This decrease was primarily the result of assets in our Digital Multimedia, Networking and Wireline division becoming fully depreciated during 2005.
Gross profit as a percentage of net sales was 42.5% for the year ended December 31, 2005 as compared to 43.7% for the year ended December 31, 2004. The gross profit percentage decreased slightly in 2005 because product sales as a percentage of total sales increased to 37.7% for the year ended December 31, 2005 compared to 33.2% for the year ended December 31, 2004. Since product sales entail higher costs of sale, gross profit as a percentage of sales is generally less on product sales than service sales, and so the increase in product sales in 2005 resulted in a slight decrease in the total gross profit percentage. The decrease in gross profit as a percentage of sales for the period ended December 31, 2005 versus the comparable period in 2004 was partially offset by a reduction in depreciation expense due to some assets in Digital Multimedia, Networking and Wireline becoming fully depreciated during 2005.
Selling, general, and administrative expenses increased 0.4% to $8.7 million for the year ended December 31, 2005 from $8.6 million for the year ended December 31, 2004. As a percentage of sales, selling, general, and administrative expenses decreased to 28.9% for the year ended December 31, 2005 from 37.5% for the year ended December 31, 2004. Selling, general, and administrative expenses decreased as a percentage of revenue for the year primarily because our revenues increased while these costs essentially remained flat.
Research and development expenses increased 22.1% to $1.1 million for the year ended December 31, 2005 from $906,000 for the year ended December 31, 2004. Research and development expenses increased primarily due to the reclassification of certain personnel to research and development from selling, general and administrative positions. We expect research and development costs to continue at current levels.
Bad debt expense decreased 31.6% to $325,000 for the year ended December 31, 2005 from $475,000 for the comparable 2004 period. Bad debt expense continued to decrease during 2005 as a result of our implementation of more stringent credit policies and collections processes in 2004.
Operating expense depreciation and amortization expense remained constant at $1.7 million for the year ended December 31, 2005 as compared to the year ended December 31, 2004.
Interest expense (net) decreased to $311,000 in 2005 from $637,000 in 2004. This decrease was primarily the result of reduced interest expense on a note held by the Laurus Master Fund (“Laurus”) initially issued on January 15, 2004 in the amount of $4.5 million. On July 6, 2005 we voluntarily converted $2.3 million of the outstanding debt associated with the note into 500,000 shares of our common stock. On August 1, 2005 we converted the remaining outstanding portion of the debt associated with the note into 209,000 shares of our common stock. As a result, we have reduced our total interest expense. The majority of ongoing interest expense is related to a second $1,500,000 note that we issued to Laurus on January 28, 2005. Please see Note A (13) to our Consolidated Financial Statements for additional information about our transactions with Laurus.
Foreign currency loss decreased to $5,000 for the year ended December 31, 2005 from $52,000 for the year ended December 31, 2004. This decrease was the result of decreased foreign currency loses on sales to Canadian customers.
Basic and diluted earnings per common share was $0.05 per share for year ended December 31, 2005 as compared to a basic and diluted loss per common share of $0.19 per share for the year ended December 31, 2004.
Weighted average basic shares outstanding increased to 11,231,000 at December 31, 2005 from 10,798,000 at December 31, 2004. This increase is primarily due to our issuance of 709,000 million shares to Laurus in connection with the conversion of our $4.5 million note, as discussed above.
Segment Information
| | | | | | | | | | | |
Net Sale by Segment: | | For the years ended December 31, | | 2006 vs. 2005 | | 2005 vs. 2004 | |
| (In thousands) | | 2006 | | 2005 | | 2004 | | % Change | | % Change | |
| Net sales: | | | | | | | | | | | | | | | | |
| Wireless Data Communications | | | | | | | | | | | | | | | | |
| Product | | $ | 32,383 | | $ | 11,919 | | $ | 5,913 | | | 171.7 | % | | 101.6 | % |
| Service | | | 13,938 | | | 10,409 | | | 8,687 | | | 33.9 | % | | 19.8 | % |
| Sub-total | | | 46,321 | | | 22,328 | | | 14,600 | | | 107.5 | % | | 52.9 | % |
| Digital Multimedia, Networking and Wireline | | | | | | | | | | | | |
| Product | | | 2,141 | | | 2,654 | | | 3,784 | | | -19.3 | % | | -29.9 | % |
| Service | | | 4,326 | | | 4,964 | | | 4,609 | | | -12.9 | % | | 7.7 | % |
| Sub-total | | | 6,467 | | | 7,618 | | | 8,393 | | | -15.1 | % | | -9.2 | % |
| Total net sales | | | | | | | | | | | | | | | | |
| Product | | | 34,524 | | | 14,573 | | | 9,697 | | | 136.9 | % | | 50.3 | % |
| Service | | | 18,264 | | | 15,373 | | | 13,296 | | | 18.8 | % | | 15.6 | % |
| Total net sales | | | 52,788 | | | 29,946 | | | 22,993 | | | 76.3 | % | | 30.2 | % |
| | | | | | | | | | | | | | | | | |
Percent of Total Sales | | | | | | | | |
| | | | 2006 | | | 2005 | | | 2004 | | | | | | | |
| Net sales: | | | | | | | | | | | | | | | | |
| Wireless Data Communications | | | | | | | | | | | | | | | | |
| Product | | | 61.3 | % | | 39.8 | % | | 25.7 | % | | | | | | |
| Service | | | 26.4 | % | | 34.8 | % | | 37.8 | % | | | | | | |
| Sub-total | | | 87.7 | % | | 74.6 | % | | 63.5 | % | | | | | | |
| Digital Multimedia and Networking | | | | | | | | | | | | | | | | |
| Product | | | 4.1 | % | | 8.9 | % | | 16.5 | % | | | | | | |
| Service | | | 8.2 | % | | 16.6 | % | | 20.0 | % | | | | | | |
| Sub-total | | | 12.3 | % | | 25.4 | % | | 36.5 | % | | | | | | |
| Total net sales | | | | | | | | | | | | | | | | |
| Product | | | 65.4 | % | | 48.7 | % | | 42.2 | % | | | | | | |
| Service | | | 34.6 | % | | 51.3 | % | | 57.8 | % | | | | | | |
| Total net sales | | | 100.0 | % | | 100.0 | % | | 100.0 | % | | | | | | |
Fiscal Years Ended December 31, 2006 and December 31, 2005
Net revenues from Wireless Data Communications increased 107.5% to $46.3 million for the year ended December 31, 2006 including our Airdesk unit as compared to $22.3 million for the year ended December 31, 2005. This increase was the result of a 171.7% increase in product sales and a 34.0% increase in service revenues compared to the same period last year. The increase in Wireless Data Communications product sales of $20.5 million for the year ended December 31, 2006 versus the same period in 2005 was primarily the result of increased sales of Airdesk modules, our vehicle security products and tracking services, Airdesk Mobile®, and increased sales of our Uplink Security devices used for wireless communications between alarm installations and central monitoring stations. The increase in the Wireless Data Communication services revenue was primarily due to an increase in the number of connections to our wireless network. Connection increases were generated by sales of our security products as well as those generated by value added resellers who utilize our network to provide customer solutions. We continue to focus on increasing connections to our network due to the recurring nature of service revenues.
Net revenue from Digital Multimedia, Networking and Wireline Security decreased 15.1% to $6.5 million for the year ended December 31, 2006 as compared to $7.6 million for the year ended December 31, 2005. This decrease was primarily due to a 19.3% decrease in product sales to $2.1 million, primarily due to decreased sales of our interactive videoconferencing products (PowerPlay™) to distance-learning customers. Capital spending by targeted distance learning customers is largely funded by government entities and, as a result, is difficult to predict and can fluctuate significantly from period to period. Digital Multimedia, Networking and Wireline Security service revenues, mainly installation and integration services, also decreased to $4.3 million for the year ended December 31, 2006 compared to $5.0 million during the same period in 2005. This decrease was due to lower product sales for the year ended December 31, 2006.
Fiscal Years Ended December 31, 2005 and December 31, 2004
Net revenues from Wireless Data Communications increased 52.9% to $22.3 million for the year ended December 31, 2005 as compared to $14.6 million for the year ended December 31, 2004. This increase was the result of a 101.6% increase in product sales and a 19.8% increase in service revenues compared to the same period last year. The increase in Wireless Data Communications product sales of $6.0 million for the year ended December 31, 2005 versus the same period in 2004 was primarily the result of increased sales of our vehicle security products and tracking services, Airdesk Mobile® and increased sales of our Uplink Security devices used for wireless communications between alarm installations and central monitoring stations. The increase in the Wireless Data Communication services revenue was primarily due to an increase in the number of connections to our wireless network. Connection increases were generated by sales of our security products as well as those generated by value added resellers who utilize our network to provide customer solutions. We continue to focus on increasing connections to our network due to the recurring nature of service revenues.
Net revenue from Digital Multimedia, Networking and Wireline Security decreased 9.2% to $7.6 million for the year ended December 31, 2005 as compared to $8.4 million for the year ended December 31, 2004. This decrease was primarily due to a 29.9% decrease in product sales to $2.1 million, primarily due to decreased sales of our interactive videoconferencing products (PowerPlay™) to distance-learning customers. The decrease in product sales was partially offset by an increase of 7.7% to $5.0 million in service revenue as compared to $4.6 million for the year ended December 31, 2004. Capital spending by targeted distance learning customers is largely funded by government entities and, as a result, is difficult to predict and can fluctuate significantly from period to period.
Selected Quarterly Financial Data
The following tables detail certain unaudited financial data of Numerex for each quarter of the last two fiscal years ended December 31, 2006, and 2005, respectively.
Our financial results may fluctuate from quarter to quarter as a result of certain factors related to our business, including the timing of product shipments, new product introductions and equipment, and product and system sales that historically have been of a non-recurring nature.
This information has been prepared from our books and records in accordance with generally accepted accounting principles for interim financial information. In the opinion of management, all (including only normal, recurring) adjustments considered necessary for fair presentation have been included. Interim results for any quarter are not necessarily indicative of the results that may be expected for any future period.
| | | For the Three Months Ended | |
| (in thousands) | | March 31, | | June 30, | | September 30, | | December 31, | |
| | | 2006 | | 2006 | | 2006 | | 2006 | |
| Net sales: | | | | | | | | | |
| Wireless Data Communications | | | | | | | | | |
| Product | | $ | 7,286 | | $ | 7,810 | | $ | 7,747 | | $ | 9,540 | |
| Service | | | 3,112 | | | 3,403 | | | 3,527 | | | 3,896 | |
| Sub-total | | | 10,398 | | | 11,213 | | | 11,274 | | | 13,436 | |
| Digital Multimedia and Networking | | | | | | | | | | | | | |
| Product | | | 309 | | | 463 | | | 1,008 | | | 362 | |
| Service | | | 1,136 | | | 1,218 | | | 1,009 | | | 962 | |
| Sub-total | | | 1,445 | | | 1,681 | | | 2,017 | | | 1,324 | |
| Total net sales | | | | | | | | | | | | | |
| Product | | | 7,595 | | | 8,273 | | | 8,755 | | | 9,902 | |
| Service | | | 4,248 | | | 4,621 | | | 4,536 | | | 4,858 | |
| Sub-total | | | 11,843 | | | 12,894 | | | 13,291 | | | 14,760 | |
| Cost of product sales (excluding depreciation) | | | 6,154 | | | 6,716 | | | 6,761 | | | 8,336 | |
| Cost of services (excluding depreciation and amortization) | | | 1,443 | | | 1,471 | | | 1,541 | | | 1,295 | |
| Depreciation and amortization | | | 44 | | | 40 | | | 38 | | | 27 | |
Gross profit | | | 4,202 | | | 4,667 | | | 4,951 | | | 5,102 | |
| Selling, general, and administrative expenses | | | 2,827 | | | 2,938 | | | 3,051 | | | 3,272 | |
| Research and development expenses | | | 288 | | | 280 | | | 258 | | | 241 | |
| Bad debt expense | | | - | | | 83 | | | 84 | | | 37 | |
| Depreciation and amortization | | | 448 | | | 398 | | | 423 | | | 479 | |
| Goodwill impairment | | | - | | | - | | | - | | | 2,140 | |
Operating earnings (loss) | | | 639 | | | 968 | | | 1,135 | | | (1,067 | ) |
| Interest income (expense) | | | (137 | ) | | (73 | ) | | (193 | ) | | (119 | ) |
Net earnings (loss) | | | 502 | | | 895 | | | 942 | | | (1,186 | ) |
| Provision for Income taxes | | | 29 | | | 15 | | | 1 | | | (2,995 | ) |
Net earnings | | $ | 473 | | $ | 880 | | $ | 941 | | $ | 1,809 | |
| Foreign currency translation adjustment | | | (6 | ) | | (1 | ) | | (1 | ) | | (2 | ) |
Comprehensive earnings | | $ | 467 | | $ | 879 | | $ | 940 | | $ | 1,807 | |
| Basic earnings per common share | | $ | 0.04 | | $ | 0.07 | | $ | 0.08 | | $ | 0.14 | |
| Diluted earnings per common share | | $ | 0.04 | | $ | 0.07 | | $ | 0.07 | | $ | 0.13 | |
| Basic | | | 12,243 | | | 12,307 | | | 12,492 | | | 12,958 | |
| Diluted | | | 12,868 | | | 13,021 | | | 13,363 | | | 13,695 | |
Selected Quarterly Financial Data (Unaudited)
| | | For the Three Months Ended | |
| (in thousands) | | March 31, | | June 30, | | September 30, | | December 31, | |
| | | | 2005 | | | 2005 | | | 2005 | | | 2005 | |
| Net sales: | | | | | | | | | | | | | |
| Wireless Data Communications | | | | | | | | | | | | | |
| Product | | $ | 2,310 | | $ | 2,474 | | $ | 3,059 | | $ | 4,077 | |
| Service | | | 2,546 | | | 2,531 | | | 2,558 | | | 2,772 | |
| Sub-total | | | 4,856 | | | 5,005 | | | 5,617 | | | 6,849 | |
| Digital Multimedia and Networking | | | | | | | | | | | | | |
| Product | | | 312 | | | 1,052 | | | 962 | | | 328 | |
| Service | | | 1,009 | | | 1,306 | | | 1,430 | | | 1,220 | |
| Sub-total | | | 1,321 | | | 2,358 | | | 2,392 | | | 1,548 | |
| Total net sales | | | | | | | | | | | | | |
| Product | | | 2,622 | | | 3,526 | | | 4,021 | | | 4,405 | |
| Service | | | 3,555 | | | 3,837 | | | 3,988 | | | 3,992 | |
| Sub-total | | | 6,177 | | | 7,363 | | | 8,009 | | | 8,397 | |
| Cost of product sales (excluding depreciation) | | | 2,186 | | | 2,505 | | | 2,991 | | | 3,622 | |
| Cost of services (excluding depreciation and amortization) | | | 1,255 | | | 1,548 | | | 1,533 | | | 1,413 | |
| Depreciation and amortization | | | 51 | | | 53 | | | 41 | | | 46 | |
Gross Profit | | | 2,685 | | | 3,257 | | | 3,444 | | | 3,316 | |
| Selling, general, and administrative expenses | | | 2,152 | | | 2,094 | | | 2,215 | | | 2,194 | |
| Research and development expenses | | | 270 | | | 286 | | | 278 | | | 273 | |
| Bad debt expense | | | 58 | | | 101 | | | 83 | | | 83 | |
| Depreciation and amortization | | | 454 | | | 438 | | | 386 | | | 371 | |
Operating earnings (loss) | | | (249 | ) | | 338 | | | 482 | | | 395 | |
| Interest income (expense) | | | (192 | ) | | (94 | ) | | (62 | ) | | 27 | |
Net earnings (loss) | | | (441 | ) | | 244 | | | 420 | | | 422 | |
| Provision for Income taxes | | | 39 | | | 4 | | | 9 | | | - | |
Net earnings (loss) | | $ | (480 | ) | $ | 240 | | $ | 411 | | $ | 422 | |
| Foreign currency translation adjustment | | | (6 | ) | | (1 | ) | | (1 | ) | | 20 | |
Comprehensive earnings (loss) | | $ | (486 | ) | $ | 239 | | $ | 410 | | $ | 442 | |
| Basic earnings (loss) per common share | | $ | (0.04 | ) | $ | 0.02 | | $ | 0.04 | | $ | 0.04 | |
| Diluted earnings (loss) per common share | | $ | (0.04 | ) | $ | 0.02 | | $ | 0.03 | | $ | 0.04 | |
| Basic | | | 10,837 | | | 10,903 | | | 11,528 | | | 11,642 | |
| Diluted | | | 10,837 | | | 11,957 | | | 12,023 | | | 11,873 | |
Liquidity and Capital Resources
We had working capital of $25.9 million as of December 31, 2006 compared to working capital of $4.8 million at December 31, 2005. We had cash balances of $20.3 million and $2.8 million, respectively, as of December 31, 2006 and December 31, 2005.
The majority of the increase in working capital reflects the increase in our cash balances as well as an increase in accounts receivable related to increased sales.
Net cash provided by operating activities was $2.7 million for the year ended December 31, 2006 as compared to $3.3 million for the year ended December 31, 2005. The decrease was primarily due to an increase in deferred income taxes of $3.0 million, an increase in accounts receivable of $3.0 million and an increase in accounts payable of $1.0 million. This was partially offset by an increase in net earnings of $3.5 million, and a decrease in goodwill of $2.1 million.
Net cash used in investing activities was $4.1 million for the year ended December 31, 2006 as compared to $2.8 million for the year ended December 31, 2005. The increase in cash used in investing activities was primarily due to the acquisition of AIRDESK, Inc.
Net cash provided by financing activities was $19.0 million for the twelve months ended December 31, 2006 as compared to $692,000 for the twelve months ended December 31, 2005. The increase was primarily due to proceeds from the notes payable we issued to Laurus in May 2006 and December 2006.
Our business has traditionally not been capital intensive and, accordingly, capital expenditures have not been material. To date, we have funded all capital expenditures from working capital, capital leases and other long-term obligations, and the proceeds from notes payable we have issued.
We paid principal and interest of approximately $1.8 million on our notes payable during the twelve months ended December 31, 2006.
We believe that our existing cash and cash equivalents together with cash generated from operations will be sufficient to meet our operating requirements through at least December 31, 2007. This belief could be affected by future operating losses in excess of expectations, a material adverse change in our operating business or a default under the Company Notes.
Contractual Obligations
The table below sets forth our contractual obligations at December 31, 2006.
| | | Payments due by period | |
| (in thousands) | | Total | | Less than 1 Year | | 1 - 3 Years | | 3 - 5 Years | | More than 5 Years | |
| Long-term Debt* | | $ | 15,000 | | $ | 1,429 | | $ | 13,571 | | | | | | | |
| Capital lease obligations | | | 224 | | | 111 | | | 107 | | | 6 | | | | |
| Operating lease obligations | | | 3,066 | | | 589 | | | 1,860 | | | 617 | | | - | |
| Total | | $ | 18,290 | | $ | 2,129 | | $ | 15,538 | | $ | 623 | | $ | - | |
* $10,000,000 of this debt is convertible into the Company’s common stock at both the Company’s and Lender’s option depending on the Company’s stock price.
Off-Balance Sheet Arrangements
As of December 31, 2006, we did not have any off-balance sheet arrangements, as defined in Item 303(a)(4)(ii) of SEC regulation S-K.
Item 7A. Quantitative and Qualitative Disclosures about Market Risk.
Effect of Inflation
Inflation has not been a material factor affecting our business. In recent years the cost of electronic components has remained relatively stable, due to competitive pressures within the industry, which has enabled us to contain our manufacturing and operations costs. Our general operating expenses, such as salaries, employee benefits, and facilities costs are subject to normal inflationary pressures, but to date inflation has not had a material effect on our operating results.
Foreign Currency
Our functional and reporting currency is the U.S. Dollar. Fluctuations in foreign currency exchange rates have not, and are not expected to have a material impact on our results of operations or liquidity.
ITEM 8. FINANCIAL STATEMENTS AND SUPPLEMENTARY DATA
INDEX TO CONSOLIDATED FINANCIAL STATEMENTS
| | Page |
Consolidated Balance Sheets as of December 31, 2006 and 2005 | 36 |
Consolidated Statements of Operations of the Years ended December 31, 2006, 2005 and 2004 | 37 |
Consolidated Statements of Shareholders’ Equity for the Years ended December 31, 2006, 2005 and 2004 | 38 |
Consolidated Statements of Cash Flows for the Years ended December 31, 2006, 2005 and 2004 | 40 |
Notes to Consolidated Financial Statements | 42 |
Report of Independent Registered Public Accounting Firm | 59 |
NUMEREX CORP. | |
CONDENSED CONSOLIDATED BALANCE SHEET | |
| (In thousands, except share information) | |
| | | December 31, | | December 31, | |
| | | | 2006 | | | 2005 | |
ASSETS | | | | | | | |
| CURRENT ASSETS | | | | | | | |
| Cash and cash equivalents | | $ | 20,384 | | $ | 2,821 | |
| Short-term investments | | | - | | | 1,538 | |
| Accounts receivable, less allowance for doubtful accounts of $933 at December 31, 2006 and $704 at December 31, 2005: | | | 11,844 | | | 6,046 | |
| Inventory | | | 2,755 | | | 1,694 | |
| Prepaid expenses and other current assets | | | 1,677 | | | 517 | |
| Deferred tax asset - current | | | 1,113 | | | - | |
| TOTAL CURRENT ASSETS | | | 37,773 | | | 12,616 | |
| | | | | | | | |
| Property and Equipment, Net | | | 1,287 | | | 986 | |
| Goodwill, Net | | | 15,967 | | | 15,014 | |
| Other Intangibles, Net | | | 6,734 | | | 6,268 | |
| Software, Net | | | 1,815 | | | 1,020 | |
| Deferred tax asset - LT | | | 2,070 | | | - | |
| Other assets | | | 747 | | | 444 | |
TOTAL ASSETS | | $ | 66,393 | | $ | 36,348 | |
| | | | | | | | |
LIABILITIES AND SHAREHOLDERS’ EQUITY | | | | | | | |
| CURRENT LIABILITIES | | | | | | | |
| Accounts payable | | $ | 7,651 | | $ | 3,911 | |
| Other current liabilities | | | 2,270 | | | 2,326 | |
| Note payable, current | | | 1,139 | | | 490 | |
| Deferred revenues | | | 715 | | | 1,056 | |
| Obligations under capital leases, current portion | | | 96 | | | 58 | |
| TOTAL CURRENT LIABILITIES | | | 11,871 | | | 7,841 | |
| | | | | | | | |
| LONG TERM LIABILITIES | | | | | | | |
| Obligations under capital leases and other long term liabilities | | | 339 | | | 60 | |
| Note Payable | | | 12,763 | | | 718 | |
| TOTAL LONG TERM LIABILITIES | | | 13,102 | | | 778 | |
| | | | | | | | |
| SHAREHOLDERS’ EQUITY | | | | | | | |
| Preferred stock - no par value; authorized 3,000,000; none issued | | | - | | | - | |
| Class A common stock - no par value; authorized 30,000,000; issued 14,445,234 shares at December 31, 2006 and 14,033,877 shares at December 31, 2005 | | | 43,133 | | | 40,050 | |
| Additional paid-in-capital | | | 2,486 | | | 1,136 | |
| Treasury stock, at cost, 1,184,900 shares on December 31, 2006 and 2,391,400 on December 31, 2005 | | | (5,053 | ) | | (10,197 | ) |
| Class B common stock - no par value; authorized 5,000,000; none issued | | | - | | | - | |
| Accumulated other comprehensive income (loss) | | | 2 | | | (8 | ) |
| Accumulated earnings (deficit) | | | 852 | | | (3,252 | ) |
| TOTAL SHAREHOLDERS' EQUITY | | | 41,420 | | | 27,729 | |
TOTAL LIABILITIES AND SHAREHOLDERS’ EQUITY | | $ | 66,393 | | $ | 36,348 | |
See accompanying notes to consolidated financial statements.
NUMEREX CORP. AND SUBSIDIARIES | |
CONSOLIDATED STATEMENTS OF OPERATIONS AND COMPREHENSIVE INCOME | |
| (In thousands, except per share data) | |
| | | FOR THE YEARS | |
| | | ENDED DECEMBER 31, | |
| | | | 2006 | | | 2005 | | | 2004 | |
Net sales: | | | | | | | | | | |
| Product | | $ | 34,524 | | $ | 14,573 | | $ | 9,697 | |
| Service | | | 18,264 | | | 15,373 | | | 13,296 | |
Total net sales | | | 52,788 | | | 29,946 | | | 22,993 | |
| Cost of product sales (excluding depreciation) | | | 27,967 | | | 11,303 | | | 7,626 | |
| Cost of services (excluding depreciation and amortization) | | | 5,750 | | | 5,748 | | | 4,943 | |
| Depreciation and amortization | | | 149 | | | 178 | | | 385 | |
Gross Profit | | | 18,922 | | | 12,717 | | | 10,039 | |
| Selling, general, and administrative expenses | | | 12,088 | | | 8,663 | | | 8,624 | |
| Research and development expenses | | | 1,067 | | | 1,106 | | | 906 | |
| Bad debt expense | | | 198 | | | 325 | | | 476 | |
| Depreciation and amortization | | | 1,755 | | | 1,662 | | | 1,664 | |
| Goodwill impairment | | | 2,140 | | | - | | | - | |
Operating earnings (loss) | | | 1,674 | | | 961 | | | (1,631 | ) |
| Net interest expense | | | (552 | ) | | (311 | ) | | (637 | ) |
| Gain on sale of assets | | | - | | | - | | | 250 | |
| Net other income and (expense) | | | 31 | | | (5 | ) | | (52 | ) |
Earnings (loss) before income taxes | | | 1,153 | | | 645 | | | (2,070 | ) |
| Provision for income taxes | | | (2,950 | ) | | 52 | | | 9 | |
Net earnings (loss) | | | 4,103 | | | 593 | | | (2,079 | ) |
Other comprehensive income (loss), net of income taxes: | | | | | | | | | | |
Foreign currency translation adjustment | | | (10 | ) | | 21 | | | (84 | ) |
Comprehensive earnings (loss) | | $ | 4,093 | | $ | 614 | | $ | (2,163 | ) |
| | | | | | | | | | | |
Basic earnings (loss) per share | | $ | 0.33 | | $ | 0.05 | | $ | (0.19 | ) |
Diluted earnings (loss) per share | | $ | 0.32 | | $ | 0.05 | | $ | (0.19 | ) |
| Weighted average common shares used in per share calculation | | | | | | | | | | |
| Basic | | | 12,502 | | | 11,231 | | | 10,798 | |
| Diluted | | | 12,985 | | | 11,482 | | | 10,798 | |
See accompanying note to consolidated financial statements
| |
CONSOLIDATED STATEMENT OF SHAREHOLDERS'EQUITY | |
| | | Common | | | | | | Treasury | | Accumulated Other | | Retained | | | |
| DESCRIPTION: | | Shares | | $ Amount | | APIC | | Stock | | Comprehensive | | Earnings | | TOTAL | |
| Balance @ 12/31/03 | | 13,182 | | $ 36,793 | | $ 439 | | $ (10,197) | | $ 97 | | $ (1,766) | | $ 25,366 | |
| | | | | | | | | | | | | | | | |
| Issuance of shares under Directors Stock Plan | | | 7 | | | 28 | | | | | | | | | | | | | | | 28 | |
| Issuance of shares in connection with employee stock purchase plan | | | 5 | | | 5 | | | | | | | | | | | | | | | 5 | |
| Issuance of shares in connection with warrants | | | | | | | | | 370 | | | | | | | | | | | | 370 | |
| Issuance of shares in lieu of debt payment | | | 10 | | | 46 | | | | | | | | | | | | | | | 46 | |
| Translation adjustment | | | 0 | | | 0 | | | | | | | | | (84 | ) | | | | | (84 | ) |
| Net loss | | | 0 | | | 0 | | | | | | | | | | | | (2,079 | ) | | (2,079 | ) |
| Balance @ 12/31/04 | | | 13,204 | | $ | 36,872 | | $ | 809 | | $ | (10,197 | ) | $ | 13 | | $ | (3,845 | ) | $ | 23,652 | |
| | | | | | | | | | | | | | | | | | | | | | | |
| Issuance of shares under Directors Stock Plan | | | 7 | | | 27 | | | | | | | | | | | | | | | 27 | |
| Issuance of shares in connection with employee stock purchase plan | | | 1 | | | 0 | | | | | | | | | | | | | | | 0 | |
| Issuance of shares in lieu of debt payment | | | 822 | | | 3,151 | | | | | | | | | | | | | | | 3,151 | |
| Translation adjustment | | | 0 | | | 0 | | | | | | | | | (21 | ) | | | | | (21 | ) |
| Warrants | | | | | | | | | 172 | | | | | | | | | | | | 172 | |
| Beneficial Conversion Feature | | | | | | | | | 154 | | | | | | | | | | | | 154 | |
| Net earnings | | | 0 | | | 0 | | | | | | | | | | | | 593 | | | 593 | |
| Balance @ 12/31/05 | | | 14,034 | | $ | 40,050 | | $ | 1,135 | | $ | (10,197 | ) | $ | (8 | ) | $ | (3,252 | ) | $ | 27,729 | |
| | | | | | | | | | | | | | | | | | | | | | | |
| Issuance of shares under Directors Stock Plan | | | 9 | | | 61 | | | - | | | - | | | - | | | - | | | 61 | |
| Issuance of shares in connection with employee stock purchase plan | | | 75 | | | 303 | | | - | | | - | | | - | | | - | | | 303 | |
| Issuance of shares in connection with purchase of Airdesk, Inc. | | | 348 | | | 1,503 | | | - | | | - | | | - | | | - | | | 1,503 | |
| Issuance of shares in lieu of debt payment | | | 885 | | | 6,359 | | | (794 | ) | | - | | | - | | | - | | | 5,565 | |
| Retirement of Treasury Shares | | | (1,206 | ) | | (5,143 | ) | | - | | | 5,143 | | | - | | | - | | | - | |
| Translation adjustment | | | - | | | - | | | - | | | - | | | 10 | | | - | | | 10 | |
| FAS 123 Compensation | | | - | | | - | | | 462 | | | - | | | - | | | - | | | 462 | |
| Warrants | | | - | | | - | | | 1,646 | | | - | | | - | | | - | | | 1,646 | |
| Beneficial Conversion Feature | | | - | | | - | | | 38 | | | - | | | - | | | - | | | 38 | |
| Net earnings | | | - | | | - | | | - | | | - | | | - | | | 4,103 | | | 4,103 | |
| Balance @ 12/31/06 | | | 14,145 | | $ | 43,133 | | $ | 2,487 | | $ | (5,053 | ) | $ | 2 | | $ | 852 | | $ | 41,420 | |
See accompanying notes to consolidated financial statement
| |
CONSOLIDATED STATEMENTS OF CASH FLOWS | |
|
| | | For the years ended December 31, | |
| | | 2006 | | 2005 | | 2004 | |
| Cash flows from operating activities: | | | | | | | | | | |
| Net earnings (loss) | | $ | 4,103 | | $ | 593 | | $ | (2,079 | ) |
| Adjustments to reconcile net earnings (loss) to net cash provided by | | | | | | | | | | |
| operating activities: | | | | | | | | | | |
| Depreciation | | | 668 | | | 562 | | | 671 | |
| Amortization | | | 1,236 | | | 1,279 | | | 1,380 | |
| Allowance for Doubtful Accounts | | | 229 | | | 34 | | | 476 | |
| Inventory Reserves | | | 13 | | | (642 | ) | | 284 | |
| Non cash interest expense | | | 439 | | | 104 | | | 255 | |
| Stock option compensation expense | | | 462 | | | - | | | - | |
| Stock issued in lieu of directors fees | | | 61 | | | 65 | | | 71 | |
| Warrants issued in addition to investor relation fees | | | 64 | | | - | | | - | |
| Gain on Sale of business unit | | | - | | | - | | | (250 | ) |
| Impairment of goodwill | | | 2,140 | | | - | | | - | |
| Deferred income taxes | | | (3,062 | ) | | | | | | |
| Changes in assets and liabilities which provided | | | | | | | | | | |
| (used) cash: | | | | | | | | | | |
| Accounts and notes receivable | | | (2,976 | ) | | (2,056 | ) | | (1,310 | ) |
| Inventory | | | 134 | | | 509 | | | 1,615 | |
| Prepaid expenses & interest receivable | | | (504 | ) | | 129 | | | 79 | |
| Other assets | | | (855 | ) | | 497 | | | - | |
| Accounts payable | | | 957 | | | 1,311 | | | 101 | |
| Other current liabilities | | | (244 | ) | | 742 | | | 96 | |
| Deferred Revenue | | | (240 | ) | | 150 | | | 131 | |
| Income taxes | | | 38 | | | - | | | - | |
| Net cash provided by operating activities: | | | 2,663 | | | 3,277 | | | 1,520 | |
| Cash flows from investing activities: | | | | | | | | | | |
| Purchase of property and equipment | | | (703 | ) | | (517 | ) | | (215 | ) |
| Purchase and capitalization of intangible and other assets | | | (1,262 | ) | | (756 | ) | | (386 | ) |
| Purchase of short-term investment | | | - | | | (1,538 | ) | | | |
| Sale of short-term investment, net | | | 1,538 | | | - | | | - | |
| Proceeds the from sale of a business | | | - | | | - | | | 200 | |
| Increase (decrease) in deposits and long term receivables | | | - | | | - | | | (169 | ) |
| Purchase of Airdesk, Inc. | | | (3,683 | ) | | - | | | - | |
| Net cash used in investing activities | | | (4,110 | ) | | (2,811 | ) | | (570 | ) |
| Cash flows from financing activities: | | | | | | | | | | |
| Proceeds from exercise of common stock options | | | 304 | | | 3 | | | 33 | |
| Proceeds from note payable and debt | | | 20,000 | | | 1,500 | | | 4,283 | |
| Principal payments on capital lease obligations | | | (81 | ) | | (99 | ) | | (309 | ) |
| Principal payments on notes payable and debt | | | (1,223 | ) | | (712 | ) | | (3,922 | ) |
| Net cash provided by financing activities: | | | 19,000 | | | 692 | | | 84 | |
| Effect of exchange differences on cash | | | 10 | | | (21 | ) | | (84 | ) |
| Net increase in cash and cash equivalents | | | 17,563 | | | 1,137 | | | 950 | |
| Cash and cash equivalents at beginning of year | | | 2,821 | | | 1,684 | | | 734 | |
| Cash and cash equivalents at end of year | | $ | 20,384 | | $ | 2,821 | | $ | 1,684 | |
| Supplemental Disclosures of Cash Flow Information | | | |
| | Cash (receipts) payments for: | | | |
| | | Interest | 583 | 231 | 360 |
| | | Income taxes | 189 | 52 | 26 |
| | Disclosure of non-cash activities: | | | |
| | | Goodwill impairment | 2,140 | - | - |
| | | Provision for income taxes | (2,950) | - | - |
| | | Capital leases | 182 | 182 | 32 |
| | | Non cash interest expense | 334 | 104 | 255 |
| | | Non cash conversion of debt to equity | 3,634 | 3,329 | |
| | | Non cash leasehold improvement | 88 | 158 | |
See accompanying notes to consolidated financial statements.
NUMEREX CORP. AND SUBSIDIARIES
NOTES TO CONSOLIDATED FINANCIAL STATEMENTS
Years ended December 31, 2006, 2005 and 2004
NOTE A - SUMMARY OF SIGNIFICANT ACCOUNTING POLICIES
A summary of the significant accounting policies consistently applied in the preparation of the accompanying financial statements follows:
1. Nature of Business
Numerex Corp. provides wireless fixed and mobile machine-to-machine (M2M) solutions, as well as a broad range of network services and technology. A single-source provider for M2M requirements, Numerex enables real-time wireless data communications, monitoring, tracking, and service management tailored to the needs of each application, customer and industry, from vehicle location and tracking, to vending, to security and utilities. Wireless M2M network services and solutions are delivered through the Airdesk Wireless division. Wireless security solutions are delivered through the Uplink Security division. In addition to its core M2M business, Numerex markets proprietary digital multimedia and collaboration products to the educational and distance learning markets. It also provides networking and integration services to major telecommunications companies. Numerex primarily serves customers throughout the United States, Canada and Latin America. The company is headquartered in Atlanta, Georgia.
2. Principles of Consolidation
The consolidated financial statements include the results of operations and financial position of Numerex and its wholly owned subsidiaries. Intercompany accounts and transactions have been eliminated in consolidation.
3. Cash and Cash Equivalents
Cash equivalents of $20.4 million and $2.8 million at December 31, 2006 and 2005, respectively, consist of overnight repurchase agreements, money market deposit accounts, amounts on deposit in a foreign bank and restricted cash held as a letter of credit. Cash of $48,000 and $35,000 at December 31, 2006 and 2005, respectively was held in our foreign bank account. Restricted cash of $63,000 was held as a letter of credit on December 31, 2006.
4. Short-Term Investments
Short-term investments that have an original maturity between three months and one year and a remaining maturity of less than one year are classified as either held-to-maturity or available-for-sale. Held-to-maturity securities are stated at amortized cost as it is our intent to hold these securities until maturity. Available-for-sale securities are recorded at fair value and are classified as current assets due to our intent and practice to hold these readily marketable investments for less than one year. Any unrealized holding gains and losses related to available-for-sale securities are recorded, net of tax, as a separate component of shareholders equity.
There were no investment securities held by the Company at December 31, 2006. The fair value of the investment securities at December 31, 2005 was $1,538,000. This security matured on February 13, 2006 and was transferred to our money market account.
5. Intangible Assets
Intangible assets consist of developed software, patents and acquired intellectual property, customer relationships and goodwill. These assets, except for goodwill, are amortized over their expected useful lives. Developed software is amortized using the straight-line method over 3 to 5 years. Patents and acquired intellectual property are amortized using the straight-line method over 7 to 16 years. Customer relationships are amortized using the straight-line method over 4 years. The $3,205,000 increase in goodwill in Wireless Data Communications was due to the acquisition of the assets of AIRDESK, Inc. on January 5, 2006 (see Note C - Acquisitions).
Intangible assets with determinable useful lives are amortized on a straight-line basis over their estimated useful lives. The increase in other intangible assets was primarily due to the acquisition of AIRDESK, Inc. which is comprised of $668,000 assigned to trademarks, $189,000 assigned to customer relationships and $77,000 assigned to a
non-compete agreement. The estimated useful life of the customer relationships is 4 years and the estimated useful life of the non-compete agreement is 2 years. The trademarks are not subject to amortization.
We adopted SFAS 142 on January 1, 2002. In connection with the adoption, we reviewed the classification of our goodwill and other intangible assets, reassessed the useful lives previously assigned to other intangible assets, and discontinued amortization of goodwill. SFAS 142 also requires that an impairment test be performed on goodwill at least annually. This test requires that the fair value of each reporting unit as a whole be compared to its carrying value including goodwill. If the reporting unit’s fair value exceeds its carrying value, goodwill is not impaired. If, however, the carrying value of the reporting unit exceeds its fair value, a second step of the impairment test is required. This second test requires that an estimate of the implied fair value of goodwill be compared to its carrying amount. If the carrying amount of goodwill exceeds the implied value, the goodwill is impaired and is written down to the implied fair value. The implied fair value of goodwill is the excess of the fair value of the reporting unit as a whole, over the fair values that would be assigned to its assets and liabilities in a purchase business combination. In prior years all the entities that comprise our wireless segment were evaluated at the individual entity level. For our current year evaluation we consolidated our wireless entities and evaluated them as one reporting unit due to the fact that all of our business plans consolidate the individual entities and consider them as one reporting unit.We tested goodwill for impairment as of December 31, 2006, using our 3-year business plan and calculating a discounted cash flow based on that plan to determine the fair value of the reporting units, and as a result recorded a $2.1 million pre-tax, non cash charge for impairment of goodwill in our Broadband Networks, Inc (“BNI”) unit within the non-core Digital Multimedia, Networking and Wireline segment. BNI’s sales have declined in each of the past two years, and this trend is expected to continue. Based on a discounted cash flow valuation of BNI and a fair market value of its tangible and intangible assets, the $2.1 million impairment was recorded. After the impairment charge our consolidated net goodwill balance was $16 million.
We capitalize software development costs when project technological feasibility is established and conclude capitalization when the product is ready for release. Software development costs incurred prior to the establishment of technological feasibility are expensed as incurred. The following table provides a summary of the components of our intangible assets:
| | | December 31, | | December 31, | |
| (In thousands) | | 2006 | | 2005 | |
| Wireless Data Communications | | | | | | | |
| Goodwill | | $ | 15,377 | | $ | 12,284 | |
| Accumulated Amortization | | | (1,405 | ) | | (1,405 | ) |
| Digital Multimedia, Networking and Wireline Security | | | | | | | |
| Goodwill | | | 5,409 | | | 5,409 | |
| Accumulated Amortization | | | (3,414 | ) | | (1,274 | ) |
| Goodwill, net | | $ | 15,967 | | $ | 15,014 | |
| | | | | | | | |
| Purchased and developed software | | | 4,458 | | | 3,268 | |
| Patents, trade and service marks | | | 12,358 | | | 11,452 | |
| Intangible and other assets | | | 988 | | | 503 | |
| Total intangible assets | | | 17,804 | | | 15,223 | |
| Accumulated amortization | | | (9,254 | ) | | (7,935 | ) |
| Intangible assets, net | | $ | 8,550 | | $ | 7,288 | |
The Company expects amortization expense for the next five years and thereafter to be as follows based on intangible assets as of December 31, 2006 (in thousands):
| 2007 | | $ | 1.1 million | |
| 2008 | | | 976,000 | |
| 2009 | | | 913,000 | |
| 2010 | | | 826,000 | |
| 2011 | | | 746,000 | |
| Thereafter | | | 746,000 | |
6. Property and Equipment
Depreciation is provided in amounts sufficient to relate the cost of depreciable assets to operations over their estimated service lives. Leased property under capital leases is amortized over the lives of the respective leases or over the service lives of the assets for those leases, whichever is shorter. Depreciation for property and equipment is calculated using the straight-line method over the following estimated lives:
| · | Short-term leasehold improvements over the term of the lease3-10 years |
| · | Plant and machinery 4-10 years |
| · | Equipment, fixtures and fittings 3-10 years |
7. Impairment of Long-lived Assets
We adopted SFAS No. 144 on January 1, 2002. In accordance with SFAS No. 144, long-lived assets, such as property and equipment, and purchased intangibles subject to amortization, are reviewed for impairment whenever events or changes in circumstances indicate that the carrying amount of an asset may not be recoverable. Recoverability of assets to be held and used is measured by a comparison of the carrying amount of an asset to estimated undiscounted future cash flows expected to be generated by the asset. If the carrying amount of an asset exceeds its estimated future cash flows, an impairment charge is recognized by the amount by which the carrying amount of the asset exceeds the fair value of the asset. Assets to be disposed of by sale would be separately presented in the consolidated balance sheet and reported at the lower of the carrying amount or fair value less costs to sell, and are no longer depreciated. The assets and liabilities of a disposed group classified as held for sale would be presented separately in the appropriate asset and liability sections of the consolidated balance sheet.
8. Income Taxes
We account for income taxes using the asset and liability method in accordance with SFAS 109, Accounting for Income Taxes. Under the asset and liability method, deferred income taxes are recognized for the tax consequences of ²temporary differences² by applying enacted statutory tax rates applicable to future years to differences between the financial statement carrying amounts and the tax bases of existing assets and liabilities. A valuation allowance is provided for deferred tax assets when it is more likely than not that the assets will not be realized.
9. Inventory
Inventory and work-in progress are stated at the lower of cost (first-in, first-out method) or market.
10. Notes Receivable
As of December 31, 2006 we had a note receivable in the amount of $361,000. We did not have any notes receivable at December 31, 2005.
11. Allowance for Doubtful Accounts
We maintain an allowance for estimated losses resulting from the inability of our customers to make required payments. The allowance for doubtful accounts is based principally upon specifically identified amounts where collection is deemed doubtful. Additional non-specific allowances are recorded based on historical experience and management’s assessment of a variety of factors related to the general financial condition and business prospects of our customer base. Management reviews the collectibility of individual accounts and assesses the adequacy of the allowance for doubtful accounts monthly. Account balances are charged off against the allowance after all means of collection have been exhausted and the potential for recovery is considered remote.
12. Other Assets
In May 2003, we shipped $583,000 of wire-line security detection equipment to a customer in Australia. This equipment has been installed at several sites based on an equipment supply agreement (the “Agreement”) with this customer. The Agreement allows the customer to generate additional revenues by providing additional services to its customers. We will share in these revenues as payment for the equipment. While this customer retains title to this equipment from acceptance (which occurred May 2003), it must meet certain obligations under the Agreement or pay amounts specified in the Agreement. Since the actual revenue that will be generated by the sale of the equipment is uncertain at this time, we are recognizing revenue on the sale of the equipment equal to the payments received from this customer from this revenue share. We also recognized cost of sales equal to the payments received from the
customer and reduced the value of this asset. We received our first payments from this customer in September 2004. Currently we expect to receive at least the full value of the equipment from this revenue share, however, as more information becomes available, we will reassess the accounting treatment for the project. At June 30, 2003, the value of the wire-line equipment was transferred from inventory to other assets. The carrying value of the equipment was $140,000 at December 31, 2006, $304,000 at December 31, 2005 and $477,000 at December 31, 2004.
13. Notes Payable
As part of the acquisition of AIRDESK, Inc. (see Note C - Acquisitions), we assumed a note payable to Motorola for $1,700,000 of which $500,000 was paid at closing on the acquisition on January 5, 2006, the remaining balance of $1,200,000 was paid in full on August 17, 2006.
On December 29, 2006, we completed a private placement to Laurus Master Fund, Ltd. (“Laurus”) of (i) a convertible term note in the principal amount of $10,000,000 (“Note C”), and (ii) a warrant to purchase up to 158,562 shares of our common stock. Interest accrues on this note at a rate of 9.50% annually. This note has a four year term and is secured by substantially all of our assets. Note C principal reductions will begin in July 2007 and will continue for the next 42 months with final payment due in December 2010. Interest and principal under convertible Note C may be paid in either cash or, subject to certain conditions, in shares of our common stock. We may only use common stock to make payments on convertible Note C if the price per share of the common stock for the required number of trading days immediately prior to conversion is greater than $11.41. The holder of the convertible note may convert the entire principal amount of the convertible note, and any accrued interest thereon, into our common stock at a fixed conversion price equal to $10.37 per share.
On May 30, 2006, we completed a private placement to Laurus Master Fund, Ltd. (“Laurus”) of (i) a convertible term note in the principal amount of $5,000,000 (“Note A”) (ii) a non-convertible term note in the principal amount of $5,000,000 (“Note B”), and (iii) a warrant to purchase up to 241,379 shares of our common stock. Interest accrues on each of the notes at a rate of 9.75% annually. Both notes have four year terms and are secured by substantially all of our assets.
We may only use common stock to make payments on convertible Note A if the price per share of the common stock for the required number of trading days immediately prior to conversion is greater than $8.70. The holder of the convertible note may convert the entire principal amount of the convertible note, and any accrued interest thereon, into our common stock at a fixed conversion price equal to $7.91 per share.
On August 31, 2006, Laurus converted $158,200 of Note A, which included $41,979 of accrued interest into 20,000 shares of common stock. On September 14, 2006 we voluntarily converted $1,249,994 of Note A into 158,027 shares of common stock. On October 9, 2006 we voluntarily converted $1,249,994 of Note A into 158,027 shares of common stock. On November 14, 2006 we voluntarily converted $1,249,994 of Note A into 158,027 shares of common stock. On December 19, 2006 we voluntarily converted the remaining outstanding balance of $1,133,796 of Note A into 143,337 shares of common stock.
Interest under Note B must be paid in cash. The principal balance on Note B is due and payable in cash on May 30, 2010.
As of March 15, 2007 we had $5,000,000 outstanding under Note B and $10,000,000 outstanding under Note C.
The warrant with Note C is exercisable by the holder until December 29, 2013. Subject to adjustments described in the warrant, the holder will be entitled to receive, upon exercise of the warrant in whole or in part, shares of common stock at an exercise price of $10.13. We are required to register the common stock underlying the Warrant for resale by Laurus.
The warrant with Note A and Note B is exercisable by the holder until May 30, 2013. Subject to adjustments described in the warrant, the holder will be entitled to receive, upon exercise of the warrant in whole or in part, shares of common stock at an exercise price of $7.73. We have registered the common stock underlying the Warrant for resale by Laurus. Note A also contains a beneficial conversion feature with a contingent conversion option. The value of the Beneficial Conversion Feature, $38,000, was measured as of the commitment date.
We also completed two prior private placements with Laurus. On January 13, 2004, we completed our first private placement to Laurus of (i) a Convertible Term Note in the aggregate principal amount of $4,500,000 (the “First Company Note”), and (ii) a warrant to purchase up to 300,000 shares of the Company’s common stock (the “First Warrant”). The First Warrant is exercisable by Laurus until January 13, 2011, and has three separate tranches.
The first tranche is exercisable for up to 150,000 shares of common stock at a price of $4.75 per share. The second tranche is exercisable for up to 100,000 shares of common stock at a price of $5.17 per share. The third tranche is exercisable for up to 50,000 shares of common stock at a price of $5.99 per share. We also agreed to register the common stock underlying the First Warrant for resale by Laurus, and have such registration declared effective, by August 13, 2004. Such registration statement was declared effective on November 22, 2004. As a result, under the terms of the First Warrant, we issued warrants covering additional 66,000 shares pursuant to the registration rights agreement. On July 6, 2005 we voluntarily converted $2,280,000 of the outstanding debt associated with the First Company Note into 500,000 shares of common stock. On August 1, 2005 we converted the $953,040 remaining outstanding portion of the debt associated with the First Company Note into 209,000 shares of common stock.
On January 28, 2005, the Company completed a second private placement to Laurus of (i) a Convertible Term Note in the original principal amount of $1,500,000 (the “Second Company Note”), and (ii) a warrant to purchase up to 100,000 shares of our common stock (the “Second Warrant”). The Second Company Note provided that Laurus may convert all or any portion of the outstanding principal amount of the Second Company Note into shares of common stock, subject to certain limitations. The Second Warrant is exercisable by Laurus until January 28, 2012, and has two separate pricing tranches. The first pricing tranche is exercisable for up to 50,000 shares of common stock at a price of $5.51 per share. The second pricing tranche is exercisable for up to 50,000 shares of common stock at a price of $5.72 per share. We have registered the common stock underlying the Second Company Warrant for resale by Laurus. The Second Company Note also contained a beneficial conversion feature with a contingent conversion option. The value of the beneficial conversion feature was measured as of the commitment date. The value at the commitment date was $154,000. On February 6, 2006, Laurus converted $1,263,780 of our outstanding debt, including $8,944 of accrued interest into 238,000 shares of common stock. The result of this transaction was to eliminate our Second Company Note with Laurus, excluding the warrants issued with the Second Company Note. These warrants along with the warrants issued with the First Company Note, which total 400,000, remain outstanding.
Laurus is an "accredited investor" as defined in Rule 501(d) of Regulation D under the Securities Act of 1933, as amended (the "Securities Act"). The Company issued the securities to Laurus in reliance on the exemption from registration provided by Section 4(2) under the Securities Act.
14. Shareholders’ Equity
Shareholders’ equity increased by $13.7 million for the twelve months ended December 31, 2006. The increase in Shareholders’ equity was due, in part, to a $6.4 million issuance of common shares which was related to the conversion of the Second Company Note and Note A. The increase was also related to the $1.5 million in issuance of common shares which was related to the acquisition of Airdesk, Inc. These increases were partially offset by the $5.1 million decrease related to the retirement of treasury shares. Shareholders’ equity also increased due to net earnings of $4.1 million and a $1.4 million increase in additional paid in capital. The increase in addition paid in capital was due to $1.6 million increase related to the warrants issued with Notes A, B and C. The increase in additional paid in capital was also related to $462,000 for stock option expense as required by FAS 123(R). This increase in additional paid in capital was partially offset by a decrease of $794,000 related to the conversions of the Second Company Note and Note A.
15. Fair Value of Financial Instruments
Our financial instruments include cash, accounts receivable, notes receivable and accounts payable. The carrying value of the financial instruments approximates fair value due to the relatively short period to maturity. The carrying value of the notes payable approximates fair value and bears cash interest at 9.75% and 9.50%, which approximates market rates of similar instruments.
16. Use of Estimates
In preparing our financial statements, management is required to make estimates and assumptions that affect the reported amounts of assets and liabilities, the disclosure of contingent assets and liabilities at the date of the financial statements, and the reported amounts of revenues and expenses during the reporting period. Actual results could differ from those estimates.
17. Concentration of Credit Risk
Financial instruments that potentially subject us to a concentration of credit risk are primarily cash investments and accounts receivable. We maintain our cash and short term investment balances in financial
institutions, which at times may exceed federally insured limits. We had cash balances in excess of these limits of $20,306,000 and $4,259,000 for the years ended December 31, 2006 and 2005, respectively. We have not experienced any losses in such accounts and believe we are not exposed to any significant credit risk on cash and cash equivalents. Concentration of credit risk with respect to accounts receivable from customers is limited. We perform credit evaluations of prospective customers and we evaluate our trade receivables periodically. Our accounts receivable is at risk to the extent that we may not be able to collect from some of our customers.
Our revenue is generated from three sources:
· the supply of product, under non recurring agreements,
· the provision of services, under non recurring agreements, and,
· the provision of data transportation services, under recurring or multi-year contractually based agreements.
Revenue is recognized when persuasive evidence of an agreement exists, the product or service has been delivered, fees and prices are fixed and determinable, collectibility is probable and when all other significant obligations have been fulfilled.
We recognize revenue from product sales at the time of shipment and passage of title. We offer customers the right to return products that do not function properly within a limited time after delivery. We continuously monitor and track such product returns and record a provision for the estimated amount of such future returns, based on historical experience and any notification received of pending returns. While such returns have historically been within expectations and the provisions established, we cannot guarantee that we will continue to experience the same return rates that we have experienced in the past. Any significant increase in product failure rates and the resulting credit returns could have a material adverse impact on operating results for the period or periods in which such returns materialize.
We recognize revenue from the provision of services at the time of the completion, delivery or performance of the service. In the case of revenue derived from maintenance services we recognize revenue ratably over the contract term. In certain instances we may under an appropriate agreement advance charge for the service to be provided. In these instances we recognize the advance charge as deferred revenue (classified as a liability) and release the revenue ratably over future periods in accordance with the contract term as the service is completed, delivered or performed.
Our arrangements do not generally include acceptance clauses. However, arrangements involving multiple element service agreements include certain milestones and levels of certification, acceptance occurs upon our certification of our completion of each of the various elements.
We recognize revenue from the provision of our data transportation services when we perform the services or process transactions in accordance with contractual performance standards. Revenue is earned monthly on the basis of the contracted monthly fee and an excess message fee charge, should it apply, that is volume based. In certain instances we may under an appropriate agreement advance charge for the data transport service to be provided. In these instances we recognize the advance charge (even if nonrefundable) as deferred revenue (classified as a liability) and release the revenue over future periods in accordance with the contract term as the data transport service is delivered or performed.
19. Foreign Currency Transactions
While the majority of our transactions and the transactions of our subsidiaries occur in the United States in U.S. dollars, a limited number are made in Canadian dollars, Australian dollars, and British pounds sterling. Such transactions include recurring service revenues billed to customers in Canada that are denominated in Canadian dollars, some transactions between Numerex Corp. and its small subsidiary in Australia are denominated in Australian dollars. Gains and losses from these transactions are included in income as they occur. For the year ended December 31, 2006 the Company had a foreign currency loss of $10,000, a loss of $5,000 for the year ended December 31, 2005, and a loss of $52,000 for the year ended December 31, 2004.
20. Research and Development
Research and development expenses are charged to operations in the period in which they are incurred. For the Years ended December 31, 2006, 2005 and 2004 research and development costs amounted to $ 1.1 million, $1.1 million, and $906,000, respectively.
21. Provision for Warranty Claims
Estimated warranty expense is charged over the warranty period of the warranted products. Warranty expenses have not been significant.
22. Stock-Based Compensation
On January 1, 2006, the Company adopted Statement of Financial Accounting Standards No. 123 (revised 2004), “Share-Based Payment,” (“SFAS 123(R)”) which requires the measurement and recognition of compensation expense for all share-based payment awards made to employees and directors including equity awards related to the Long-Term Incentive Plan (the “1999 Plan”) based on estimated fair values. SFAS 123(R) supersedes the Company’s previous accounting under Accounting Principles Board Opinion No. 25, “Accounting for Stock Issued to Employees” (“APB 25”) for periods beginning in fiscal 2006. In March 2005, the Securities and Exchange Commission issued Staff Accounting Bulletin No. 107 (“SAB 107”) relating to SFAS 123(R). The Company has applied the provisions of SAB 107 in its adoption of SFAS 123(R).
The Company adopted SFAS 123(R) using the modified prospective transition method, which requires the application of the accounting standard as of January 1, 2006. The Company’s Condensed Consolidated Financial Statements as of and for the twelve months ended December 31, 2006 reflect the impact of SFAS 123(R). In accordance with the modified prospective transition method, the Company’s Condensed Consolidated Financial Statements for prior periods have not been restated to reflect, and do not include, the impact of SFAS 123(R). Stock-based compensation expense recognized under SFAS 123(R) for the twelve months ended December 31, 2006 was $462,000, which consisted of stock-based compensation expense related to employee equity awards. Total unrecognized compensation related to unvested stock-based awards granted to employees and members of our board of directors at December 31, 2006, net of estimated forfeitures, is $1.9 million and is expected to be recognized over a weighted-average period of 4.2 years. There was no stock-based compensation expense related to employee equity awards recognized during the twelve months ended December 31, 2005 and December 31, 2004.
SFAS 123(R) requires companies to estimate the fair value of share-based payment awards on the date of grant using an option-pricing model. The value of the portion of the award that is ultimately expected to vest is recognized as expense over the requisite service period in the Company’s Condensed Consolidated Statement of Operations. Prior to the adoption of SFAS 123(R), the Company accounted for employee equity awards using the intrinsic value method in accordance with APB 25 as allowed under Statement of Financial Accounting Standards No. 123, “Accounting for Stock-Based Compensation” (“SFAS 123”). Under the intrinsic value method, no stock-based compensation expense had been recognized in the Company’s Condensed Consolidated Statement of Operations, because the exercise price of the Company’s stock options granted to employees and directors equaled the fair market value of the underlying stock at the date of grant.
Stock-based compensation expense recognized during the period is based on the value of the portion of share-based payment awards that is ultimately expected to vest during the period. Stock-based compensation expense recognized in the Company’s Condensed Consolidated Statement of Operations for the twelve months ended December 31, 2006 included compensation expense for share-based payment awards granted prior to, but not yet vested as of December 31, 2005 based on the grant date fair value estimated in accordance with the pro forma provisions of SFAS 123 and compensation expense for the share-based payment awards granted subsequent to December 31, 2005 based on the grant date fair value estimated in accordance with the provisions of SFAS 123(R). With the adoption of SFAS 123(R), the Company will continue to use the method of attributing the value of stock-based compensation costs to expense on the straight-line method. As stock-based compensation expense recognized in the Condensed Consolidated Statement of Operations for the fiscal year 2006 is based on awards ultimately expected to vest, it has been reduced for estimated forfeitures. SFAS 123(R) requires forfeitures to be estimated at the time of grant and revised, if necessary, in subsequent periods if actual forfeitures differ from those estimates. In the Company’s pro forma information required under SFAS 123 for the periods prior to fiscal 2006, the Company accounted for forfeitures as they occurred.
The fair value of share-based payment awards is estimated at the grant date using the Black-Scholes option valuation model. The Company’s determination of fair value of share-based payment awards on the date of grant using an option-pricing model is affected by the Company’s stock price as well as assumptions regarding a number of highly complex and subjective variables. These variables include, but are not limited to; the Company’s expected stock price volatility over the term of the awards, and actual and projected employee stock option exercise behaviors.
The impact of adopting SFAS 123(R) on January 1, 2006, was to lower the Company’s earnings before taxes and net earnings for the year ended December 31, 2006 by $462,000. Basic and diluted net earnings per share for the year ended December 31, 2006 were lower by $0.04 as a result of adopting SFAS 123(R).
We have outstanding stock options granted pursuant to four stock option plans. The 1994 Long-Term Incentive Plan (the “1994 Plan”), which was adopted in 1994, the Non-Employee Director Stock Option Plan (the “Director Plan”) which was adopted in 1996, the Long-Term Incentive Plan (the “1999 Plan”), which was adopted in 1999 and the 2006 Long Term Incentive Plan (the “2006 Plan”) which was adopted in 2006. The 1994 Plan and the Director Plan were terminated and replaced by the 1999 Plan which was effective for options granted from October 25, 1999. The 1999 Plan was terminated and replaced by the 2006 Plan. Options outstanding under the 1994 Plan, the Director Plan and the 1999 Plan remain in effect, but no new options may be granted under those plans. Options issued under the 2006 Plan and the 1999 Plan typically vest ratably over a four-year period. All options issued under the 1994 Plan are fully vested.
The aggregate number of shares which may be issued under the 2006 plan is 750,000 shares of Class A Common Stock (“Shares”) plus (i) any available Shares under the 1999 Plan as of its termination date and (ii) Shares subject to options granted under the 1999 Plan that expire or terminate without having been fully exercised. A summary of the company's stock option activity and related information for the twelve months ended December 31, 2006 follows:
| | | | | |
| | | Weighted | Weighted | Aggregate |
| | | Average | Average Remaining | Intrinsic |
| | Shares | Ex. Price | Contractual Life (Yrs) | Value |
| Outstanding, at 12/31/05 | 1,453,515 | 4.76 | | |
| Options granted | 426,250 | 7.89 | | |
| Options exercised | (74,150) | 3.98 | | |
| Options cancelled | (18,250) | (3.82) | | |
| Options expired | (2,500) | 5.13 | | |
| Outstanding, at 12/31/06 | 1,784,865 | 5.55 | 6.43 | $ 6,973,855 |
| Exercisable, at 12/31/06 | 1,024,928 | 5.07 | 4.88 | $ 4,506,120 |
The following table summarizes information related to fixed stock options outstanding at December 31, 2006:
| | Options outstanding | | Options exercisable |
Range of exercise prices | Number outstanding at December 31, 2006 | Weighted average remaining contractual life (years) | Weighted average exercise price | | Number exercisable at December 31, 2006 | Weighted average exercise price |
| $1.00 - 4.00 | 537,165 | 5.99 | $3.05 | | 389,040 | $2.97 |
| 4.01 - 8.00 | 816,950 | 6.25 | $5.24 | | 467,388 | $5.41 |
| 8.01 - 12.94 | 430,750 | 7.34 | $9.25 | | 168,500 | $9.00 |
| | 1,784,865 | 6.43 | $5.55 | | 1,024,928 | $5.07 |
The fair value of options at date of grant was estimated using the Black-Scholes option pricing model. The fair value is then amortized on a straight-line basis over the requisite service periods of the awards, which is generally the vesting period. Use of a valuation model requires management to make certain assumptions with respect to selected model inputs. Expected stock price volatility was calculated based on the historical volatility of our common stock over the expected life of the option. The average expected life was based on the contractual term of the option and expected employee exercise behavior. The risk-free interest rate is based on U.S. Treasury zero-coupon issues with a remaining term equal to the expected life assumed at the date of grant. Forfeitures are estimated based on voluntary termination behavior, as well as an analysis of actual option forfeitures.
A summary of the status of the Company’s stock option plans as of December 31, 2006, 2005, and 2004 and changes during the years ended on those dates is presented below:
| | For the years ended December 31, |
| | FYE 12-31-06 | FYE 12-31-05 | FYE 12-31-04 |
| | | Weighted | | Weighted | | Weighted |
| | | Average | | Average | | Average |
| | Shares | Ex. Price | Shares | Ex. Price | Shares | Ex. Price |
| Outstanding, beginning of year | 1,453,515 | 4.76 | 1,494,015 | 4.85 | 1,255,515 | 5.21 |
| Options granted | 426,250 | 7.89 | 173,500 | 4.53 | 458,250 | 4.47 |
| Options exercised | (74,150) | 3.98 | - | - | - | - |
| Options cancelled | (18,250) | 3.82 | (185,250) | 5.73 | - | - |
| Options expired | (2,500) | 5.13 | (28,750) | 4.69 | (219,750) | 5.86 |
| Outstanding, end of year | 1,784,865 | 5.55 | 1,453,515 | 4.76 | 1,494,015 | 4.85 |
| Exercisable, end of year | 1,024,928 | 5.07 | 838,078 | 5.28 | 854,828 | 5.83 |
In January 2006, the Company awarded 30,000 warrants to our investor relations firm in exchange for services. These warrants vest over a one year period. The Company used the fair value based method of accounting for these warrants and is ratably amortizing the $64,000 to expense over the vesting period. A total of $64,000 was included in selling, general and other expense for the twelve months ended December 31, 2006 in relation to these warrants.
The key assumptions used in the valuation model during the twelve months ended December 31, 2006, 2005 and 2004 are provided below:
| | Twelve Months Ended |
| | December 31, |
| | 2006 | 2005 | 2004 |
| Valuation Assumptions: | | | |
| Volatility | 53.7% | 69.80% | 69.84% |
| Expected term in years | 6.3 | 8 | 8 |
| Risk free interest rate | 4.62% | 4.35% | 3.98% |
| Dividend yield | 0.00% | 0.00% | 0.00% |
The Company recognized $462,000 of stock based compensation expense for the twelve months ended December 31, 2006. Prior to the adoption of SFAS 123(R), the Company accounted for stock based compensation plans using the intrinsic value method prescribed in Accounting Principles Board Opinion 25, Accounting for Stock-Based Compensation, (APBO 25). Under APBO 25, no compensation expense related to stock options was recognized in operations. For the purpose of pro forma disclosure, the estimated fair value of options accounted for under APBO 25 were calculated using the Black-Scholes method utilizing the valuation assumptions above for twelve months ended December 31, 2005 and December 31, 2004.
The Company’s pro forma information is as follows:
| | | December 31, | |
| (In thousands, except per share data) | | 2005 | | 2004 | |
| | | | | | | | |
| Net earnings (loss) - as reported | | $ | 593 | | $ | (2,079 | ) |
| Less total stock-based compensation expense determined | | | | | | | |
| under fair value based method for all awards | | | 455 | | | 637 | |
| | | | | | | | |
| Pro forma net earnings (loss) | | $ | 138 | | $ | (2,716 | ) |
| | | | | | | | |
| Basic earnings (loss) per share: | | | | | | | |
| As reported | | $ | 0.05 | | $ | (0.19 | ) |
| Pro forma | | $ | 0.01 | | $ | (0.25 | ) |
| | | | | | | | |
| Diluted earnings (loss) per share: | | | | | | | |
| As reported | | $ | 0.05 | | $ | (0.19 | ) |
| Pro forma | | $ | 0.01 | | $ | (0.25 | ) |
23. Earnings (Loss) Per Share
Basic net earnings per common share available to common shareholders is based on the weighted-average number of common shares outstanding excluding the dilutive impact of common stock equivalents. For periods in which we have net earnings, we base diluted net earnings per share on the weighted-average number of common shares outstanding and dilutive potential common shares, such as dilutive employee stock options.
The numerator in calculating both basic and diluted net earnings per share for each period is net earnings. The denominator is based on the following number of common shares:
| | | For the years ended December 31, | |
| (In thousands, except per share data) | | 2006 | | 2005 | | 2004 | |
| Common Shares: | | | | | | | |
| Weighted average common shares outstanding | | | 12,502 | | | 11,231 | | | 10,798 | |
| Dilutive effect of common stock equivalents | | | 483 | | | 251 | | | - | |
| Total | | | 12,985 | | | 11,482 | | | 10,798 | |
| | | | | | | | | | | |
| Net earnings (loss): | | $ | 4,103 | | $ | 593 | | $ | (2,079 | ) |
| Net earnings (loss) per common share: | | | | | | | | | | |
| Basic | | | 0.33 | | | 0.05 | | | (0.19 | ) |
| Diluted | | | 0.32 | | | 0.05 | | | (0.19 | ) |
For the twelve months ended December 31, 2006 and 2005, we excluded antidilutive options of 245,120 and 1,044,015 respectively, shares of common stock and common stock equivalents from the computation of diluted earnings per share. We excluded these share amounts because the exercise prices of those shares were greater than the average market price of the common stock during the applicable period.
Because of the antidulitive effect of the net loss, potential common shares resulting from options, convertible debt and warrants were excluded from the calculation of diluted earnings per share for the twelve months ended December 31, 2004. For the twelve months ended December 31, 2004, options to purchase 200,710 shares of common stock and common stock equivalents would have been taken into account in calculating diluted earnings per share were it not for the antidilutive effect of the net loss.
As of December 31, 2006 we had a total of 1,784,865 outstanding options, as of December 31, 2005, we had a total of 1,453,515 options outstanding, and as of December 31, 2004, we had a total of 1,494,015 options outstanding.
24. Advertising Expenses
Advertising expenses are charged to operations in the period in which they are incurred. For the Years ended December 31, 2006, 2005 and 2004, advertising costs amounted to $420,000, $391,000, and $314,000, respectively.
25. Recent Accounting Pronouncements
In February 2006, the FASB issued SFAS No. 155, “Accounting for Certain Hybrid Financial Instruments” (“FAS 155”), which amends SFAS No. 133, “Accounting for Derivative Instruments and Hedging Activities” (“FAS 133”) and SFAS No. 140, “Accounting for Transfers and Servicing of Financial Assets and Extinguishments of Liabilities” (“FAS 140”). FAS 155 provides guidance to simplify the accounting for certain hybrid instruments by permitting fair value remeasurement for any hybrid financial instrument that contains an embedded derivative, as well as, clarifies that beneficial interests in securitized financial assets are subject to FAS 133. In addition, FAS 155 eliminates a restriction on the passive derivative instruments that a qualifying special-purpose entity may hold under FAS 140. FAS 155 is effective for all financial instruments acquired, issued or subject to a new basis occurring after the beginning of an entity’s first fiscal year that begins after September 15, 2006. We believe that the adoption of this statement will not have a material effect on our financial condition or results of operations.
In June 2006, the FASB issued FASB Interpretation No. (FIN) 48, “Accounting for Uncertainty in Income Taxes,” which clarifies the accounting for uncertainty in income taxes recognized in financial statements in accordance with SFAS No. 109, “Accounting for Income Taxes.” FIN 48 prescribes a recognition threshold and measurement attribute for the financial statement recognition and measurement of a tax position taken or expected to be taken in a tax return. FIN 48 requires that we recognize in our consolidated financial statements, the impact of a tax position, if that position is more likely than not of being sustained on audit, based on the technical merits of the position. The provisions of FIN 48 also provide guidance on derecognition, classification, interest and penalties, accounting in interim periods, and disclosure. The provisions of FIN 48 are effective beginning January 1, 2007, with the cumulative effect of the change in accounting principle recorded as an adjustment to the opening balance of retained earnings. We estimate the adoption of this standard will increase/reduce the opening balance of retained earnings for 2007 by approximately $200,000 to $300,000.
In September 2006, the SEC issued Staff Accounting Bulletin No. 108, “Considering the Effects of Prior Year Misstatements when Quantifying Misstatements in Current Year Financial Statements”, (“SAB No. 108”). SAB No. 108 requires quantification of errors using both a balance sheet approach and an income statement approach in the determination of materiality in relation to a misstatement. SAB No. 108 is effective the first fiscal year ending after November 15, 2006. Management has determined that SAB No. 108 will not have a material impact on the Company.
The above discussion is not intended to be a comprehensive list of all of our accounting policies. In many cases, the accounting treatment of a particular transaction is specifically dictated by accounting principles generally accepted in the United States of America, with no need for management’s judgment in their application. There are also areas in which management’s judgment in selecting any available alternative would not produce a materially different result. See our audited consolidated financial statements and notes which begin on page 33 of this Annual Report on Form 10-K which contains accounting policies and other disclosures required by accounting principles generally accepted in the United States of America.
26. Reclassification
Certain prior year amounts have been reclassified to conform to the current period presentation.
NOTE B - LIQUIDITY
As disclosed in the financial statements, our operations generated cash in 2006. We completed two financing transactions during 2006 which generated gross proceeds of $20 million.
We believe that our existing cash and cash equivalents, together with cash generated from operations, will be sufficient to meet our operating requirements through at least December 31, 2007.
NOTE C - ACQUISTIONS
Acquisition of AIRDESK, Inc.
On January 5, 2006 we completed the acquisition of the assets of AIRDESK, Inc. through its wholly owned subsidiary, Airdesk LLC (“Airdesk”). The results of Airdesk’s operations have been included in the consolidated financial statements from January 1, 2006. The assets relate to Airdesk’s machine-to-machine (M2M) solutions and services business in the United States and Canada. The acquisition aligns Airdesk’s digital M2M products and portfolio of industry leading radio modules with our M2M network and services platform.
The assets acquired consist of furniture, fixtures, equipment (consisting of hardware and software), inventory, distribution rights agreements, accounts receivable, trademarks and other intellectual property, including Airdesk’s billing system and “Airsource” database library.
Total consideration for the asset purchase was approximately $4,222,000 payable in the form of shares of our common stock and the assumption of certain existing indebtedness of AIRDESK, Inc. In addition, if certain revenue and other performance targets are achieved, we could release an additional 300,000 shares of our common stock over a three-year period.
We assumed approximately $2,453,000 of debt, of which $1,199,000 was paid in cash at closing of the transaction as a reduction of part of the debt, and the balance of $1,254,000 was paid on August 17, 2006. We also issued shares of common stock valued at approximately $196,000 to AIRDESK at closing and deposited the remaining shares of common stock, valued at closing at approximately $1,307,000, with an Escrow Agent. AIRDESK retains voting and dividend rights to these shares while held in escrow. The Escrow Agent will release the shares of common stock to AIRDESK over a two-year period in accordance with the terms of the Escrow Agreement. In addition, we incurred approximately $266,000 of direct acquisition expenses that are in addition to the purchase price.
The following table summarizes the estimated fair values of the assets acquired and liabilities assumed at the date of acquisition.
| (in thousands) | | At January 5, 2006 | |
| Current assets | | $ | 2,410 | |
| Property, plant and equipment | | | 444 | |
| Other non-current assets | | | 12 | |
| Intangible assets | | | 934 | |
| Goodwill | | | 3,214 | |
| Total assets acquired | | | 7,014 | |
| | | | | |
| Current liabilities | | | (3,346 | ) |
| Long-term debt | | | (700 | ) |
| Total liabilities assumed | | | (4,046 | ) |
| Net assets acquired | | $ | 2,968 | |
The $934,000 of acquired intangible assets was comprised of $668,000 assigned to trademarks, $189,000 assigned to customer relationships and $77,000 assigned to a non-compete agreement. The estimated useful life of the customer relationships is 4 years and the estimated useful life of the non-compete agreement is 2 years. The trademarks are not subject to amortization.
The $3,214,000 of goodwill was assigned to the wireless data communications segment. The goodwill and intangible assets will not be deductible for income tax purposes, thus resulting in a $635,000 lowering of the consolidated valuation allowance on deferred tax assets.
NOTE D - INVENTORY
Inventory consisted of the following:
| | | December 31, | |
| (In thousands) | | 2006 | | 2005 | |
| Raw materials | | $ | 871 | | $ | 349 | |
| Work-in-progress | | | 30 | | | 8 | |
| Finished goods | | | 2,207 | | | 1,654 | |
| Less reserve for obsolescence | | | (353 | ) | | (317 | ) |
| Inventory | | $ | 2,755 | | $ | 1,694 | |
NOTE E - PROPERTY AND EQUIPMENT
Property and equipment consisted of the following:
| | | December 31, | |
| (In thousands) | | 2006 | | 2005 | |
| Leasehold improvements | | $ | 853 | | $ | 645 | |
| Plant and machinery | | | 8,506 | | | 7,925 | |
| Equipment, fixtures, fittings | | | 696 | | | 572 | |
| Total property and equipment | | | 10,055 | | | 9,142 | |
| Accumulated depreciation | | | (8,768 | ) | | (8,156 | ) |
| Property and equipment, net | | | 1,287 | | | 986 | |
NOTE F - INCOME TAXES
For the periods noted below, the provision for income taxes consists of the following:
| | | December 31, | |
| (in thousands) | | 2006 | | 2005 | | 2004 | |
| Current: | | | | | | | | | | |
| Federal | | $ | 57 | | $ | - | | $ | - | |
| State | | | 55 | | | 52 | | | 9 | |
| Foreign | | | - | | | - | | | - | |
| Deferred: | | | | | | | | | | |
| Federal | | | (2,941 | ) | | - | | | - | |
| State | | | (121 | ) | | - | | | - | |
| | | $ | (2,950 | ) | $ | 52 | | $ | 9 | |
Income taxes recorded by the Company differ from the amounts computed by applying the statutory U.S. federal income tax rate to income before income taxes. The following schedule reconciles income tax expense (benefit) at the statutory rate and the actual income tax expense as reflected in the consolidated statements of operations for the respective periods:
| | | December 31, | |
| (in thousands) | | 2006 | | 2005 | | 2004 | |
| Income tax (benefit) computed at | | | | | | | | | | |
| U.S. corporate tax rate of 34% | | $ | 392 | | $ | 219 | | | ($704 | ) |
| Adjustments attributable to | | | | | | | | | | |
| Valuation allowance | | | (4,452 | ) | | (241 | ) | | 677 | |
| State Tax | | | 56 | | | 34 | | | 9 | |
| Foreign Tax | | | (3 | ) | | 6 | | | 6 | |
| Non-deductible expenses | | | 958 | | | 16 | | | 21 | |
| Expiration of net operating loss | | | 108 | | | | | | | |
| Other | | | (9 | ) | | 18 | | | - | |
| | | $ | (2,950 | ) | $ | 52 | | $ | 9 | |
The components of the Company’s net deferred tax assets and liabilities are as follows:
| (in thousands) | | December 31, | |
| | | 2006 | | 2005 | |
| Current deferred tax asset | | | | | | | |
| Inventories | | $ | 120 | | $ | 115 | |
| Accruals | | | 358 | | | 642 | |
| Net operating loss carry forward | | | 2,381 | | | | |
| Other | | | 379 | | | 292 | |
| Valuation | | | (2,125 | ) | | (1,049 | ) |
| | | | 1,113 | | | - | |
| Non-Current deferred tax asset | | | | | | | |
| Intangibles | | | (338 | ) | | (270 | ) |
| Foreign NOL carry forward | | | 65 | | | 88 | |
| Net operating loss carry forward | | | 5,853 | | | 9,084 | |
| Tax credit carry forward | | | 1,258 | | | 1,202 | |
| Differences between book and | | | | | | | |
| tax basis of property & equipment | | | (43 | ) | | 286 | |
| Other | | | 17 | | | | |
| Valuation | | | (4,742 | ) | | (10,390 | ) |
| | | | 2,070 | | | - | |
| | | | | | | | |
| Total | | $ | 3,183 | | $ | - | |
The change in the valuation allowance is attributable to reversal of a portion of the valuation allowance, current year book/tax differences, and state net operating losses presented on a gross rather than net basis.
Net operating loss carry forwards available at December 31, 2006, expire as follows:
| (in thousands) | | | | Year of | |
| | | Amount | | Expiration | |
| Federal operating losses | | $ | 15,005 | | | 2007 - 2024 | |
| State operating losses | | $ | 52,328 | | | 2007 - 2024 | |
| Foreign | | $ | 216 | | | N/A | |
We are entitled to the benefits of certain net operating loss carry forwards for income tax purposes. Subject to applicable regulations, net operating loss carry forwards may be offset against income in future years to reduce our future tax liability. In March 2004, we filed a ruling request with the Internal Revenue Service (IRS) for an extension of time to file an election to carry forward some net operating losses that were in question. In July 2004, we received permission to carry the net operating losses forward and we are therefore entitled to the benefits of the net operating loss carry forwards.
NOTE G - SIGNIFICANT CUSTOMER, CONCENTRATION OF CREDIT RISK AND RELATED PARTIES
We had two suppliers from which our purchases were approximately 76% of our product cost of sales for the year ended December 31, 2006. Our accounts payable to these suppliers was approximately $2.2 million at December 31, 2006. We had one supplier from which our purchases were approximately 69% of cost of product sales for the year ended December 31, 2005 and 37% of cost of product sales for the year ended December 31, 2004. Our accounts payable to this supplier was approximately $2.2 million at December 31, 2005. The components included in the products purchased from this supplier can be sourced from other suppliers.
We conducted business with one related party during the year ended December 31, 2006. Mr. Ryan, a director on the Company’s Board of Directors is also partner in the law firm of Salisbury & Ryan LLP. Salisbury & Ryan LLP provided legal services to the Company in fiscal 2006 and will continue to provide such services during fiscal 2007. During fiscal 2006 and 2005, Salisbury & Ryan LLP charged legal fees of approximately $172,000 and $263,000. Our accounts payable to Salisbury & Ryan LLP was $34,000 and $49,000 at December 31, 2006 and 2005, respectively. During fiscal 2004, Salisbury & Ryan LLP charged us approximately $175,000.
In conjunction with the acquisition of AIRDESK, Inc. on January 1, 2006, we assumed a $250,000 promissory note with an 8% annual interest rate due to Michael Lang, AIRDESK, Inc. President.
NOTE H - COMMITMENTS AND CONTINGENCIES
Capital Leases
We conduct a portion of our operations with leased equipment. For financial reporting purposes, minimum lease rentals relating to the equipment have been capitalized.
The related assets and obligations have been recorded using our incremental borrowing rate at the inception of the lease. The leases expire at various dates through 2011. The net carrying value of assets financed by capital lease obligations is approximated $169,000 as of December 31, 2006. The following is a schedule by years of future minimum lease payments under capital leases together with the present value of the net minimum lease payments as of December 31, 2006 (in thousands).
| 2007 | | $ | 111 | |
| 2008 | | | 50 | |
| 2009 | | | 31 | |
| 2010 | | | 26 | |
| 2011 | | | 6 | |
| Total minimum lease payments | | | 224 | |
| Less amount representing interest | | | (33 | ) |
| Present value of net minimum lease payments | | $ | 191 | |
Operating Leases
We lease certain property and equipment under non-cancelable operating leases with initial terms in excess of one year. Future minimum lease payments under such non-cancelable operating leases subsequent to December 31, 2006, (in thousands) are as follows:
| 2007 | | $ | 589 | |
| 2008 | | | 604 | |
| 2009 | | | 620 | |
| 2010 | | | 636 | |
| 2011 | | | 617 | |
| Total minimum lease payments | | $ | 3,066 | |
Rent expense, including short-term leases, amounted to approximately $795,000, $781,000, and $777,000 for the years ended December 31, 2006, 2005, and 2004 respectively.
NOTE I - BENEFIT PLANS
Savings and Investment Plan
We sponsor a 401(k) savings and investment plan, a plan that covers all eligible employees of Numerex Corp and its subsidiaries. Employees are eligible for participation on the enrollment date following six months of service. We contribute an amount equal to 50% of the portion of the employee’s elective deferral contribution that do not exceed 6% of the employee’s total compensation for each payroll period in which an elective deferral is made. Our contribution is made in cash on a monthly basis. Our matching contributions are vested over a three year period at a rate of 33% per year. Approximately $142,000, $101,000, and $82,000 were expensed for the years ended December 31, 2006, 2005 and 2004.
Employee Stock Purchase Plan
All employees of Numerex and its subsidiaries were entitled to participate in a discounted Employee Stock Purchase Plan. This plan was discontinued on March 1, 2006. This plan allowed employees to elect to have an amount withheld from their pay that is held in an account for the purchase of our common stock. The plan had two measurement dates per year - July 1 and January 1, which is used to determine the stock price at a 15% discount and number of shares issued to the employee. There were a total of 500,000 shares authorized of which 1,504 were issued upon the cancellation of the plan and 450 were issued at December 31, 2005.
NOTE J - GEOGRAPHIC INFORMATION
Segment Information
Beginning in fiscal year 2006, the Company adopted a new business strategy, which focuses on three distinct segments: Wireless Data Communications; Digital Multimedia, Networking and Wireline Security; and Unallocated Corporate. The Wireless Data Communications segment is made up of all our wireless machine-to-machine communications products and services. The Digital Multimedia, Networking and Wireline Security includes our networking products and services, video conferencing products, and our wire-line security detection products. There are expenses, such as depreciation and amortization at the corporate level that are not allocated to the other reportable segments. In prior years Digital Multimedia, Networking and Wireline Security was two separate segments. With the acquisition of Airdesk, the Wireless Data Communications segment has become the primary focus of the Company. As two separate segments, Digital Multimedia and Network Services and Wireline Security did not make up individually 10% of the Company’s operations. As a consolidated segment, Digital Multimedia, Networking and Wireline Security makes up approximately 12% of revenues, and 6% of identifiable assets. Prior year segment data has been reclassified to conform to the current period presentation.
Wireless Data Communications Segment
The Wireless Data segment provides wireless machine-to machine (M2M) communications, delivering comprehensive wireless solutions over the company’s proprietary wireless data network. Our wireless data network is dedicated to the delivery of M2M communications throughout the United States, Canada, Mexico, the Caribbean and much of Latin America. M2M is defined as electronic data communications between people, devices, and systems that turn data into information that companies can act upon.
The Wireless Data segment develops, operates, markets, and sells products and services CellemetryXG™, Cellemetry®, Uplink™, Airdesk Mobile™, and VendView™ brands, as well as distribution through Value Added Resellers (VARs) who have integrated the Numerex Network and components into their own offerings.
Digital Multimedia, Networking and Wireline Security Segment
The Digital Multimedia, Networking and Wireline segment systems permit network operators to provide a wide range of video and data services, including Internet access, high-speed data transfer, and interactive video conferencing and voice service. The use of fiber optics in the broadband transmission network provides improved signal quality for long-distance transmission, increased bandwidth, immunity to interfering signals, and significant cost savings and reliability over coaxial cable-based network technologies. We market our digital multimedia products and services through a combination of system integrators and VARs.
In addition, Digital Multimedia, Networking and Wireline segment provides products under the Digilog™ brand that assist both wireline and wireless carriers in the engineering, installation, and servicing of this new telecommunications control network. These telecommunications network operational support systems and services include system integration (rack and stack) and installation, Test Access, and Interconnecting Devices.
The Wireline segment’s licensed technology creates a derived channel on an existing telephone line by using an inaudible frequency below the voice communications spectrum for data transmission. This creates a two-way communication system that continuously monitors the integrity of a user’s telephone line and security system. Derived Channel operates over a regular voice telephone line with no interference, whether or not the telephone is in use. The Company provides this service through its DCX Systems and DCX Australia subsidiaries.
Summarized below are the Company’s revenues and net income (loss) by reportable segment as of and for the years ended December 31, 2006, 2005 and 2004.
Certain Corporate expenses are allocated to the segments based on segment revenues.
| | | For the years ended December 31, | |
| (In thousands, except per share data) | | 2006 | | 2005 | | 2004 | |
| Revenues: | | | | | | | |
| Wireless Data Communications | | $ | 46,321 | | $ | 22,328 | | $ | 14,600 | |
| Digital Multimedia, Networking and Wireline Security | | | 6,467 | | | 7,618 | | | 8,393 | |
| | | $ | 52,788 | | $ | 29,946 | | $ | 22,993 | |
| Operating earnings (loss) before taxes | | | | | | | | | | |
| Wireless Data Communications | | $ | 3,659 | | $ | 1,027 | | $ | (1,420 | ) |
| Digital Multimedia, Networking and Wireline Security | | | (1,619 | ) | | 118 | | | 417 | |
| Unallocated Corporate | | | (368 | ) | | (184 | ) | | (628 | ) |
| | | $ | 1,674 | | $ | 961 | | $ | (1,631 | ) |
| Depreciation and Amortization | | | | | | | | | | |
| Wireless Data Communications | | $ | 1,268 | | $ | 1,201 | | $ | 1,314 | |
| Digital Multimedia, Networking and Wireline Security | | | 369 | | | 453 | | | 602 | |
| Unallocated Corporate | | | 267 | | | 185 | | | 132 | |
| | | $ | 1,904 | | $ | 1,839 | | $ | 2,048 | |
| | | | | | | | | | | |
| | | | Dec. 31 | | | Dec. 31 | | | | |
| Identifiable Assets | | | 2006 | | | 2005 | | | | |
| Wireless Data Communications | | $ | 37,380 | | $ | 23,244 | | | | |
| Digital Multimedia, Networking and Wireline Security | | | 3,941 | | | 7,360 | | | | |
| Unallocated Corporate | | | 25,072 | | | 5,744 | | | | |
| | | $ | 66,363 | | $ | 36,348 | | | | |
REPORT OF INDEPENDENT REGISTERED PUBLIC ACCOUNTING FIRM
To the Shareholders and Board of
Directors of Numerex Corp. and Subsidiaries
We have audited the accompanying consolidated balance sheets of Numerex Corp. (a Pennsylvania company) and subsidiaries (the “Company”) as of December 31, 2006 and 2005, and the related consolidated statements of operations and comprehensive income, shareholders’ equity, and cash flows for each of the three years in the period ended December 31, 2006. These financial statements are the responsibility of the Company's management. Our responsibility is to express an opinion on these financial statements based on our audits.
We conducted our audits in accordance with the standards of the Public Company Accounting Oversight Board (United States). Those standards require that we plan and perform the audit to obtain reasonable assurance about whether the financial statements are free of material misstatement. The Company is not required to have, nor were we engaged to perform an audit of its internal control over financial reporting. Our audit included consideration of internal control over financial reporting as a basis for designing audit procedures that are appropriate in the circumstances, but not for the purpose of expressing an opinion on the effectiveness of the Company’s internal control over financial reporting. Accordingly, we express no such opinion. An audit also includes examining, on a test basis, evidence supporting the amounts and disclosures in the financial statements, assessing the accounting principles used and significant estimates made by management, as well as evaluating the overall financial statement presentation. We believe that our audits provide a reasonable basis for our opinion.
In our opinion, the consolidated financial statements referred to above present fairly, in all material respects, the financial position of Numerex Corp. and subsidiaries as of December 31, 2006 and 2005, and the results of its operations and its cash flows for each of the three years in the period ended December 31, 2006 in conformity with accounting principles generally accepted in the United States of America.
As described in Note A-22 to the consolidated financial statements, the Company adopted the provisions of Statement of Financial Accounting Standards No. 123 (revised 2004), “Share-Based Payments” on January 1, 2006.
Our audit was conducted for the purpose of forming an opinion on the basic financial statements taken as a whole. The Schedule II for the years ended December 31, 2006, 2005 and 2004, listed in the Index at Item 15(a) is presented for purposes of additional analysis and is not a required part of the basic financial statements. This schedule has been subjected to the auditing procedures applied in the audit of the basic financial statements and, in our opinion, is fairly stated in all material respects in relation to the basic financial statements taken as a whole.
/s/ GRANT THORNTON LLP
Atlanta, Georgia
March 22, 2007
Item 9. Changes in and Disagreements with Accountants on Accounting and Financial Disclosure.
Not applicable.
Item 9A. Controls and Procedures.
Under the supervision and with the participation of our Chief Executive Officer and Chief Financial Officer, management has evaluated the effectiveness of the design and operation of our disclosure controls and procedures. Based upon that evaluation, the Chief Executive Officer and Chief Financial Officer concluded that these disclosure controls and procedures are effective as of December 31, 2005. No changes were made in the Company’s internal control over financial reporting during the year ended December 31, 2005 that have materially affected, or are reasonably likely to materially affect, the internal control over financial reporting.
PART III
Item 10. Directors and Executive Officers of the Registrant.
Except as set forth above under “Business - Executive Officers of the Registrant,” the information required by Item 10 of Form 10-K is incorporated by reference from the Company's Proxy Statement relating to the 2005 Annual Meeting of Shareholders to be filed pursuant to General Instruction G (3) to Form 10-K. Also incorporated by reference is the information under the caption “Section 16(a) Beneficial Ownership Reporting Compliance.”
Item 11. Executive Compensation.
Incorporated by reference from the our Proxy Statement relating to the 2006 Annual Meeting of
Shareholders to be filed pursuant to General Instruction G (3) to Form 10-K.
Item 12. Security Ownership of Certain Beneficial Owners and Management and Related Stockholder Matters.
Except as set forth below, the information required by Item 12 of Form 10-K is incorporated by reference from our Company's Proxy Statement relating to the 2006 Annual Meeting of Shareholders to be filed pursuant to General Instruction G (3) to Form 10-K.
Equity Compensation Plan Information
| | (a) | (b) | (c) |
| Plan category | Number of securities to be issued upon exercise of outstanding options, warrants and rights | Weighted-average exercise price of outstanding options, warrants and rights | Number of securities remaining available for future issuance under equity compensation plans (excluding securities reflected in column (a)) |
| Equity compensation plans approved by security holders | 2,650,000 | $5.98 | 551,763 |
| Equity compensation plans not approved by security holders | - | - | - |
| Total | 2,650,000 | $5.98 | 551,763 |
Item 13. Certain Relationships and Related Transactions.
Incorporated by reference from our Proxy Statement relating to the 2006 Annual Meeting of Shareholders to be filed pursuant to General Instruction G (3) to Form 10-K.
Item 14. Principal Accounting Fees and Services
Incorporated by reference from our Proxy Statement relating to the 2006 Annual Meeting of Shareholders to be filed pursuant to General Instruction G (3) to Form 10-K.
PART IV
Item 15. Exhibits, Financial Statement Schedules.
(a) Documents filed as part of this report:
| 1. | Consolidated Financial Statements; All financial statements of the Company as described in Item I of this report on Form 10-K. |
| 2. | Financial statement schedule included in Part IV of this Form: |
; Page
Report of Independent Registered Public Accounting Firm 60
Schedule II - Valutation and qualifying accounts 64
3. Exhibits
2.11 Numerex Corp. and British Telecommunications plc, Agreement Relating to the sale and purchase of the whole of the issued shares capital of Bronzebase Limited, dated November 12, 1999
2.22 Asset Transfer Agreement by and between Airdesk, LLC and Airdesk, Inc., effective January 1, 2006
3.13 Amended and Restated Articles of Incorporation of the Company
3.23 Bylaws of the Company
4.14 Securities Purchase Agreement, dated May 30, 2006 by and between the Company and Laurus Master Fund, Ltd.
4.24 Secured Non-Convertible Term Note, dated May 30, 2006 by and between the Company and Laurus Master Fund, Ltd.
4.34 Common Stock Purchase Warrant, dated May 30, 2006 by and between the Company and Laurus Master Fund, Ltd.
4.44 Master Security Agreement, dated May 30, 2006 by and among the Company, its U.S. subsidiaries, and Laurus Master Fund, Ltd.
4.54 Subsidiary Guaranty, dated May 30, 2006 entered into by each of the Company’s U.S. Subsidiaries, in connection with the note payable issued to Laurus Master Fund, Ltd.
4.65 Securities Purchase Agreement, dated December 29, 2006 by and between the Company and Laurus Master Fund, Ltd.
4.75 Secured Convertible Term Note, dated December 29, 2006 by and between the Company and Laurus Master Fund, Ltd.
4.85 Common Stock Purchase Warrant, dated December 29, 2006 by and between the Company and Laurus Master Fund, Ltd.
4.95 Master Security Agreement, dated December 29, 2006 by and among the Company, its U.S. subsidiaries, and Laurus Master Fund, Ltd.
4.105 Subsidiary Guaranty, dated December 29, 2006 entered into by each of the Company’s U.S. Subsidiaries, in connection with the note payable issued to Laurus Master Fund, Ltd.
4.111 Registration Rights Agreement, dated December 29, 2006 by and between the Company and Laurus Master Fund, Ltd.
4.125 Amended and Restated Grant of Security Interest in Patent and Trademarks, dated December 29, 2006 by and between the Company and Laurus Master Fund, Ltd.
4.136 Common Stock Purchase Warrant, dated January 13, 2004 by and between the Company and Laurus Master Fund, Ltd.
4.147 Common Stock Purchase Warrant, dated January 28, 2005 by and between the Company and Laurus Master Fund, Ltd.
10.18 Amended and Restated 1994 Employee Stock Option Plan (Management Compensation Plan)
10. 29 Amended and Restated 1994 Stock Option Plan for Non-Employee Directors (Management Compensation Plan)
10. 310 Registration Agreement between the Company and Dominion dated July 13, 1992
10. 49 Letter Agreement between the Company and Dominion (now Gwynedd) dated October 25, 1994 re: designation of director
10. 511 1999 Long-Term Incentive Plan (Management Compensation Plan)
10. 612 2006 Long-Term Incentive Plan (2006 Plan)
10.713 Severence Agreement, by and between Stratton Nicolaides and the Company dated November 1, 2006. (Management Compensation Plan)
10.713 Severence Agreement, by and between Alan Catherall and the Company dated November 1, 2006. (Management Compensation Plan)
10.713 Severence Agreement, by and between Michael Marett and the Company dated November 1, 2006. (Management Compensation Plan)
11 Computation of Earnings Per Share
21 Subsidiaries of Numerex Corp.
23 Consent of Grant Thornton LLP.
31.1 Rule 13a-14(a) Certification of Chief Executive Officer
31.2 Rule 13a-14(a) Certification of Chief Financial Officer
32.1 Rule 13a-14(b) Certification of Chief Executive Officer
32.2 Rule 13a-14(b) Certification of Chief Financial Officer
1 Incorporated by reference to the Exhibits filed with the Current Report on Form 8-K filed with the Securities and Exchange Commission on November 26, 1999 (File No. 0-22920)
2 Incorporated by reference to the Exhibits filed with the Current Report on Form 8-K filed with the Securities and Exchange Commission on January 11, 2006 (File No. 0-22920)
3 Incorporated by reference to the Exhibits filed with the Company's Annual Report on Form 10-K filed with the Securities and Exchange Commission on October 31, 1995 (File No. 0-22920)
4 Incorporated by reference to the Exhibits filed with the Company's Current Report on Form 8-K Filed with the Securities and Exchange Commission on June 5, 2006 (File No. 0-22920)
5 Incorporated by reference to the Exhibits filed with the Company's Current Report on Form 8-K Filed with the Securities and Exchange Commission on January 5, 2007 (File No. 0-22920)
6 Incorporated by reference to the Exhibit filed with the Company's Current Report on Form 8-K filed with the Securities and Exchange Commission on January 15, 2004 (File No. 0-22920)
7 Incorporated by reference to the Exhibits filed with the Company's Current Report on Form 8-K Filed with the Securities and Exchange Commission on February 3, 2005, 2005 (File No. 0-22920)
8 Incorporated by reference to the Exhibits filed with the Company's Annual Report on Form 10-K filed with the Securities and Exchange Commission on January 27, 1997 for the year ended October 31, 1996 (File No. 0-22920)
9 Incorporated by reference to the Exhibits filed with the Company's Registration Statement on Form S-1 filed with the Securities and Exchange Commission (File No. 33-89794)
10 Incorporated by reference to the Exhibit filed with the Company's Current Report on Form 8-K filed with the Securities and Exchange Commission on July 20, 1994 (File No. 0-22920)
11 Incorporated by reference to the Exhibits filed with the Company's Quarterly Report on Form 10-Q filed with the Securities and Exchange Commission on August 14, 2000 (File No. 0-22920)
12 Incorporated by reference to the Exhibits filed with the Company's Proxy Statement on Schedule 14A filed with the Securities and Exchange Commission on April 10, 2006 (File No. 0-22920)
13 Incorporated by reference to the Exhibits filed with the Company's Quarterly Report on Form 10-Q filed with the Securities and Exchange Commission on November 14, 2006 (File No. 0-22920)
SCHEDULE II
NUMEREX CORP.
VALUATION AND QUALIFYING ACCOUNTS
Years ended December 31, 2006, 2005, 2004
(in thousands)
| | | Balance at beginning of Period | | Additions charged to expense | | Deductions | | | | Balance at end of Period | |
| | | | |
| Description | | | |
| | | | | | | | | | | | | | | | | |
| Year ended December 31, 2006: | | | | | | | | | | | | | | | | |
| Accounts receivable | | | | | | | | | | | | | | | | |
| Allowance for uncollectible accounts | | | 704 | | | 198 | | | (24 | ) | | a | | | 878 | |
| Allowance for uncollectible accounts | | | | | | | | | 57 | | | c | | | 57 | |
| Accounts receivable | | | | | | | | | | | | | | | 935 | |
| Inventory | | | | | | | | | | | | | | | | |
| Allowance for obsolescence | | | 317 | | | 36 | | | | | | | | | 353 | |
| | | | | | | | | | | | | | | | | |
| Year ended December 31, 2005: | | | | | | | | | | | | | | | | |
| Accounts receivable | | | | | | | | | | | | | | | | |
| Allowance for uncollectible accounts | | | 702 | | | 325 | | | (323 | ) | | a | | | 704 | |
| Inventory | | | | | | | | | | | | | | | | |
| Allowance for obsolescence | | | 967 | | | 66 | | | (716 | ) | | b | | | 317 | |
| | | | | | | | | | | | | | | | | |
| Year ended December 31, 2004: | | | | | | | | | | | | | | | | |
| Accounts receivable | | | | | | | | | | | | | | | | |
| Allowance for uncollectible accounts | | | 227 | | | 475 | | | | | | | | | 702 | |
| Inventory | | | | | | | | | | | | | | | | |
| Allowance for obsolescence | | | 681 | | | 286 | | | | | | | | | 967 | |
| | | | | | | | | | | | | | | | | |
| (a) Amounts written off as uncollectible, net of recoveries. | | | | | | | | | | | | | | | | |
| (b) Inventory physically disposed. | | | | | | | | | | | | | | | | |
| (c) Additions due to acquisition of Airdesk, Inc. | | | | | | | | | | | | | | | | |
SIGNATURES
Pursuant to the requirements of Section 13 or 15(d) of the Securities Exchange Act of 1934, the registrant has duly caused this report to be signed on its behalf by the undersigned, thereunto duly authorized.
NUMEREX CORP.
By: /s/Stratton J. Nicolaides
Stratton J. Nicolaides, Chairman and
Chief Executive Officer
Date: March 15, 2007
Pursuant to the requirements of the Securities Exchange Act of 1934, this report has been signed below by the following persons on behalf of the registrant and in the capacities and on the dates indicated.
| Signature | Capacity | Date |
| | | |
/s/ Stratton J. Nicolaides | Chairman and Chief Executive Office | March 23, 2007 |
| Stratton J. Nicolaides | | |
| | | |
| | | |
/s/ Brian C. Beazer | Director | March 23, 2007 |
| Brian C. Beazer | | |
| | | |
| | | |
/s/ George Benson | Director | March 23, 2007 |
| George Benson | | |
| | | |
| | | |
/s/ Matthew J. Flanigan | Director | March 23, 2007 |
| Matthew J. Flanigan | | |
| | | |
| | | |
/s/ Allan H. Liu | Director | March 23, 2007 |
| Allan H. Liu | | |
| | | |
| | | |
/s/ John G. Raos | Director | March 23, 2007 |
| John G. Raos | | |
| | | |
| | | |
/s/ Andrew J. Ryan | Director | March 23, 2007 |
| Andrew J. Ryan | | |
| | | |
| | | |
/s/ Nicholas Davidge | Director | March 23, 2007 |
| Nicholas Davidge | | |
| | | |
| | | |
/s/ Alan B. Catherall | Executive Vice President, | March 23, 2007 |
| Alan B. Catherall | Chief Financial Officer, Principal | |
| | Financial and Accounting Officer | |