Item 1: Report to Shareholders
 |
| Balanced Fund | June 30, 2007 |
The views and opinions in this report were current as of June 30, 2007. They are not guarantees of performance or investment results and should not be taken as investment advice. Investment decisions reflect a variety of factors, and the managers reserve the right to change their views about individual stocks, sectors, and the markets at any time. As a result, the views expressed should not be relied upon as a forecast of the fund’s future investment intent. The report is certified under the Sarbanes-Oxley Act, which requires mutual funds and other public companies to affirm that, to the best of their knowledge, the information in their financial reports is fairly and accurately stated in all material respects.
REPORTS ON THE WEB
Sign up for our E-mail Program, and you can begin to receive updated fund reports and prospectuses online rather than through the mail. Log in to your account at troweprice.com for more information.
Manager’s Letter
Fellow Shareholders
U.S. stocks produced strong returns in the first half of 2007. Shares were boosted by better-than-expected first-quarter earnings, especially among multinational firms, and substantial merger and acquisition activity, including a marked increase in leveraged buyout offers from private-equity firms. Bonds generally produced modest returns, as early gains were eroded by falling bond prices in response to a second-quarter spike in interest rates. Non-U.S. stocks produced excellent returns and outperformed U.S. equities. The Balanced Fund harnessed these gains through its broad diversification and provided investors with a competitive total return in the last six months.
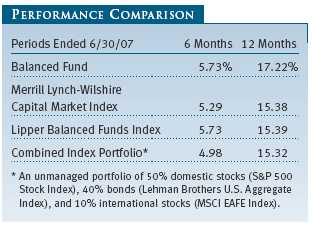
Your fund, which returned 5.73% in the first half of 2007, matched the performance of the Lipper Balanced Funds Index and did better than its other two benchmarks. The fund outperformed all three of its benchmarks in the one-year period, as shown in the Performance Comparison table. In the last six months, the fund outperformed because we overweighted stocks and underweighted bonds. In addition, international stocks continued to produce vigorous gains, and the fund benefited from its emphasis on large-cap shares in the domestic equity portfolio.
HIGHLIGHTS
• Stocks produced strong gains in the first half of 2007, led by international equity markets. Bonds generally produced modest returns.
• The Balanced Fund harnessed these gains through its broad diversification and matched or surpassed its benchmarks in the last six months.
• Overweighting stocks helped the fund’s relative performance. We believe economic growth and corporate profits will remain supportive of equities, particularly in non-U.S. markets.
• The fund’s performance attests to the strength of our investment approach, which incorporates a disciplined strategy, broad diversification, and a long-term focus. We believe that shareholders will be well served by the fund’s fundamental commitment to diversification.
MARKET ENVIRONMENT
The economy showed signs of improvement in the last few months following a year-long slowdown that culminated in an anemic 0.7% annualized rate of GDP growth in the first quarter of 2007. While the housing sector remained weak and investors were concerned about problems in the subprime mortgage market, manufacturing and capital spending have showed signs of accelerating. In addition, the national unemployment rate hovered around 4.5%, not far from six-year lows.
Although gasoline prices and other energy costs continued to press higher and inflation remained above the Federal Reserve’s comfort zone, the central bank kept the federal funds target rate at 5.25% during our reporting period—in fact, for the last year—in anticipation that moderate growth would allow inflation pressures to ease over time. Following the Fed’s late-June monetary policy meeting, however, central bank officials acknowledged that “a sustained moderation in inflation pressures has yet to be convincingly demonstrated.”
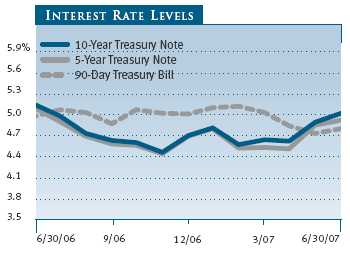
U.S. bonds generally produced modest returns in the first half of 2007, as early gains were eroded by falling bond prices in recent months. Long-term and, to a lesser extent, intermediate-term interest rates rose in the second quarter amid continued concerns about inflation and as the economy showed signs of strengthening. In the investment-grade universe, asset- and mortgage-backed securities and intermediate-term Treasuries did fairly well. Corporate bonds trailed somewhat, and long-term Treasuries declined. High-yield issues produced good returns and decisively outperformed higher-quality issues. The Lehman Brothers U.S. Aggregate Index, which measures the performance of domestic investment-grade taxable bonds, returned 0.98%.
In the U.S. stock market, large-cap shares narrowly surpassed small-caps, but mid-cap shares decisively outperformed both segments. The S&P MidCap 400 Index returned 11.98% versus 6.96% for the large-cap S&P 500 Index and 6.45% for the small-cap Russell 2000 Index. As measured by various Russell indexes, growth stocks outperformed value across all market capitalizations, especially among small-caps.
Non-U.S. stocks produced strong gains and outperformed U.S. equities in the first half of the year. Emerging market equities fared better than stocks in developed markets, with Latin America far outpacing other regions. Among developed markets, European bourses rose strongly, but Japanese stocks lagged with milder gains. The MSCI EAFE Index, which measures the performance of mostly large-cap stocks in Europe, Australasia, and the Far East, returned 11.09%.
ASSET ALLOCATION STRATEGY
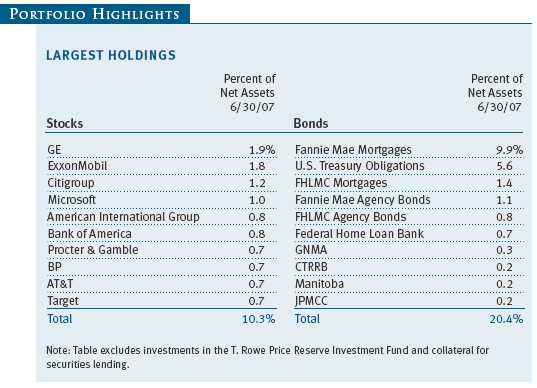
Our allocations to the major asset classes changed slightly in the first half of the year. As of June 30, the fund’s overall exposure to equities was 64% of assets—48% U.S. and 16% international—which represented an overweighting relative to the combined index portfolio. We believe economic growth and corporate profits will remain supportive of equities, particularly in non-U.S. markets. The remainder was invested in fixed-income securities. At the end of our reporting period, corporate bonds represented 17% of assets, while mortgage-backed securities stood at 10% and Treasury and government agency bonds accounted for 8%.
PORTFOLIO REVIEW
Domestic Stocks
Most sectors in the fund’s domestic equity portfolio produced gains in the last six months. Stocks in the economically sensitive energy, industrials, and materials sectors were some of the largest contributors to fund performance, advancing as the economy strengthened in the last few months. Information technology and telecommunication services stocks also did very well, but shares of financial companies lagged amid concerns about their exposure to the subprime mortgage market and a second-quarter spike in longer-term interest rates.
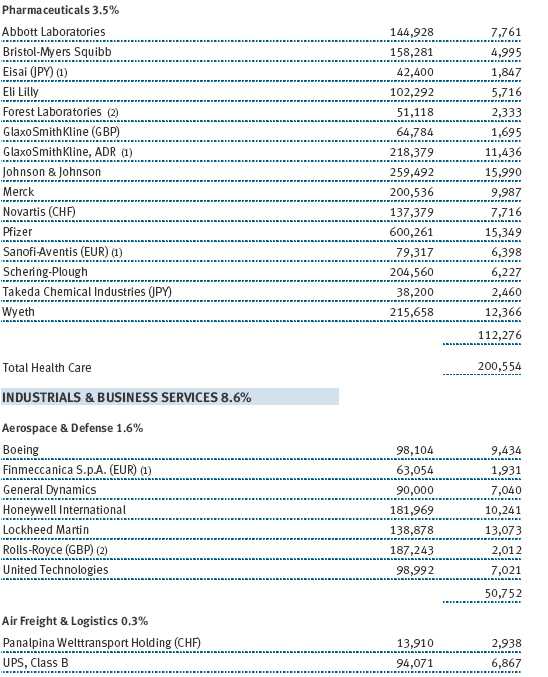
Energy stocks produced excellent gains, lifted by rising gasoline prices and a sharp rebound in oil prices from their mid-January lows. Most of our energy holdings produced positive returns, led by integrated oil majors ExxonMobil and Chevron and oilfield services giant Schlumberger. Industrials and business services companies also rose strongly, especially machinery stocks Deere and Caterpillar, railroad stocks Union Pacific and CSX, and Honeywell International. (Please refer to the portfolio of investments for a complete listing of holdings and the amount each represents in the portfolio.)

Our holdings in the materials sector did well, led by chemical company Potash Corp. of Saskatchewan, which surged more than 60% in the last six months amid high nitrogen and phosphate prices. We reduced our exposure to this top performer toward the end of our reporting period. Shares of aluminum giant Alcoa were also red hot, climbing more than 35% amid favorable industry fundamentals and takeover speculation.
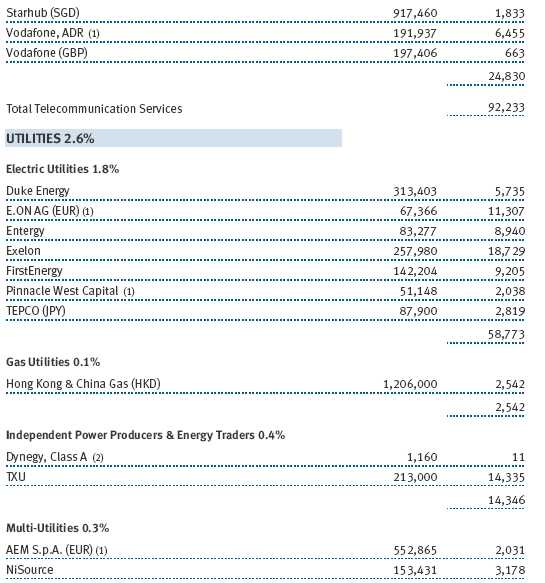
The information technology sector, a traditional growth sector, participated in the market’s advance. Our semiconductor-related companies did best, led by chip giant Intel. Makers of computers and peripheral devices were also strong, but our software holdings lagged due to the lackluster performance of Microsoft. Telecommunication services companies were lifted by favorable industry fundamentals for wireless businesses as well as corporate deal activity. Canadian company Telus rose on merger speculation, while Alltel agreed to a private-equity takeover, and AT&T agreed to be the exclusive carrier for Apple’s iPhone customers.
Weakness in several of our financial sector holdings limited our gains in the last six months. Financial services giants Citigroup and Bank of America and commercial banks Wachovia and U.S. Bancorp sagged amid concerns that increasing mortgage defaults and delinquencies and higher borrowing costs would hurt their revenues and earnings. On the plus side, several of our asset managers, brokerages, and investment banks were buoyed by the strong equity market and by heightened merger activity.
International Stocks
Solid non-inflationary global growth and higher-than-expected corporate earnings generated strong gains in most developed non-U.S. markets in the last six months. A stronger euro versus the dollar boosted returns for U.S.-based investors. The Pacific region outside Japan posted the largest gains among developed markets, but Japan, suffering from weak domestic demand, lagged. Emerging markets, benefiting from strong commodity prices and global growth, outperformed developed markets. Many emerging markets were able to post double-digit gains despite several sharp interim pullbacks.
Our international equity portfolio outpaced broad measures of international stocks, largely due to stock selection within the materials, telecommunication services, and industrials and business services sectors. On the positive side, both stock selection and group weighting in information technology aided results. In terms of regions, our overweight in Pacific ex-Japan boosted our returns, as did our underweight in Japan. Our holdings in emerging markets, especially Latin America, proved beneficial as well.
The materials sector provided several strong contributors to performance, including steel producers SSAB Svenskt Stal (Sweden), Nippon Steel (Japan), and BlueScope Steel (Australia), as well as diversified mining company Rio Tinto (Australia). Robust demand, especially from emerging markets such as China, steel sector consolidation, and a constrained supply of base metals continued to support materials prices, providing a tailwind for producers. We sold BlueScope Steel during the period on valuation grounds. Spanish construction company Acciona and E.On, the large German energy concern, also were strong performers for the period. Key detractors included Japanese banking companies Sumitomo Trust, Mitsubishi UFJ Financial, and Resona Holdings, as expected loan growth did not materialize. One of the largest detractors was Mitsubishi Gas Chemical, which suffered from soft methanol pricing.
Strong global growth has generated fears that the world’s central bankers may continue to raise interest rates to keep inflation in check. Although we expect global growth to continue and earnings to remain strong, we are concerned that the pace of gains in the last few years cannot be sustained. Developed international equities are near fair value but are still attractive relative to the U.S. market. Emerging market equities have largely readjusted so that their valuations range from in line with to more expensive than developed market equities on metrics such as book value and dividend yield. As a result, the universe of inexpensive non-U.S. stocks is shrinking. While most sectors continue to show solid fundamental prospects, financials, energy, and, in some cases, materials stocks are among the most attractively valued, in our view.
Domestic Bonds
Bond returns were mostly flat in the first half of 2007, as early gains were eroded by falling bond prices in response to a second-quarter spike in interest rates. Stocks performed much better than bonds, so underweighting fixed-income securities helped the fund’s relative performance.

For most of the last six months, the investment-grade bond portfolio had a modest emphasis on sectors that offered a yield advantage over government securities, such as mortgage-backed securities and corporate bonds. As interest rates and concerns about the subprime mortgage market increased, the differences (or spreads) between the yields of these securities and Treasuries increased; as a result, our high-grade bond portfolio underperformed the Lehman Brothers U.S. Aggregate Index. To protect against further spread widening, we reduced our emphasis on higher-yielding investment-grade issues.
The high-yield sector of the bond market continued to outperform investment-grade issues, so our position in the T. Rowe Price Institutional High Yield Fund was advantageous. The fundamentals for below investment-grade securities, such as good corporate profits and historically low default rates, remain favorable. However, in light of rich valuations, we trimmed our exposure to high-yield bonds and shifted the assets to higher-quality securities.
OUTLOOK
Equity markets around the world have produced strong gains thus far this year, but bond markets have been pressured by rising global interest rates and concerns about inflation. Although we do not necessarily believe that equities will outperform fixed-income securities for the next three to six months, we believe the environment remains supportive for equities. Corporate earnings growth will likely remain solid, but the rate of growth should decelerate as higher interest rates, commodity prices, and labor costs take their toll. Bonds may remain lackluster if investors continue to seek higher returns from equities, but continued deterioration in the housing and mortgage markets or stock market volatility could prompt investors to seek the relative stability of fixed-income securities.
Our recent and longer-term results point to the strength of our investment approach, which incorporates a disciplined strategy, broad diversification, and a long-term focus. Whatever the near term holds, we believe that shareholders will be well served by the fund’s fundamental commitment to diversification across asset classes.
Respectfully submitted,

Richard T. Whitney
Co-chairman of the fund’s Investment Advisory Committee

Edmund M. Notzon III
Co-chairman of the fund’s Investment Advisory Committee
July 23, 2007
The committee chairmen have day-to-day responsibility for managing the
portfolio and work with committee members in developing and executing the
fund’s investment program.
SUPPLEMENT TO PROSPECTUS DATED MAY 1, 2007
ERRATUM
Effective May 1, 2007, the fund’s operating policy that sets forth the percentage of the fund’s “total bond assets” that may be invested in noninvestment-grade securities is hereby corrected to remove the word “bond” and refer to “total assets” instead.
RISKS OF INVESTING IN STOCKS
As with all stock mutual funds, the fund’s share price can fall because of weakness in the stock market, a particular industry, or specific holdings. Stock markets can decline for many reasons, including adverse political or economic developments, changes in investor psychology, or heavy institutional selling. The prospects for an industry or company may deteriorate because of a variety of factors, including disappointing earnings or changes in the competitive environment. In addition, the investment manager’s assessment of companies held in a fund may prove incorrect, resulting in losses or poor performance even in rising markets.
RISKS OF INTERNATIONAL INVESTING
Funds that invest overseas generally carry more risk than funds that invest strictly in U.S. assets. Risks can result from varying stages of economic and political development, differing regulatory environments, trading days, and accounting standards, currency fluctuations, and higher transaction costs of non-U.S. markets. Investments outside the United States could be subject to governmental actions such as capital or currency controls, nationalization of a company or industry, expropriation of assets, or imposition of high taxes.
RISKS OF INVESTING IN BONDS
Funds that invest in bonds are subject to interest rate risk, the decline in bond prices that usually accompanies a rise in interest rates. Longer-maturity bonds typically decline more than those with shorter maturities. Funds that invest in bonds are also subject to credit risk, the chance that any fund holding could have its credit rating downgraded, or that a bond issuer will default (fail to make timely payments of interest or principal), potentially reducing the fund’s income level and share price.
GLOSSARY
Duration: The average time (expressed in years) needed for an investor to receive the present value of the future cash flows on a fixed-income investment. It is used to measure a bond or bond fund’s sensitivity to interest rate changes. For example, a fund with a five-year duration would fall about 5% in price in response to a one-percentage-point increase in interest rates, and vice versa.
Fed funds target rate: An overnight lending rate set by the Federal Reserve and used by banks to meet reserve requirements. Banks also use the fed funds rate as a benchmark for their prime lending rates.
Lehman Brothers U.S. Aggregate Index: A widely used benchmark for the domestic investment-grade bond market. The index typically includes more than 5,000 fixed-income securities with an overall intermediate- to long-term average maturity.
Lipper indexes: Consist of a small number (10 to 30) of the largest mutual funds in a particular category as tracked by Lipper Inc.
Merrill Lynch-Wilshire Capital Market Index: A market capitalization weighted index including the Wilshire 5000 and Merrill Lynch, High Yield II, and Domestic Master Indexes.
MSCI EAFE Index: Widely accepted as the benchmark for international stock performance (EAFE refers to Europe, Australasia, and Far East). The index represents the major markets of the world excluding the U.S. and Canada, is listed in local currency, and includes reinvestment of dividends.
S&P 500 Stock Index: Tracks the stocks of 500 mostly large U.S. companies.
Performance and Expenses
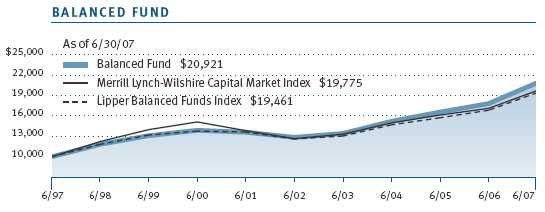
| GROWTH OF $10,000 |
This chart shows the value of a hypothetical $10,000 investment in the fund over the past 10 fiscal year periods or since inception (for funds lacking 10-year records). The result is compared with benchmarks, which may include a broad-based market index and a peer group average or index. Market indexes do not include expenses, which are deducted from fund returns as well as mutual fund averages and indexes.
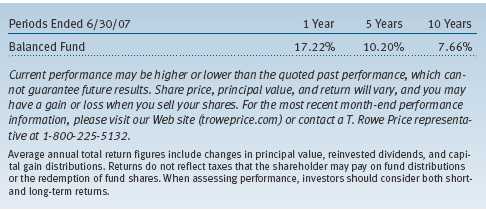
| AVERAGE ANNUAL COMPOUND TOTAL RETURN |
This table shows how the fund would have performed each year if its actual (or cumulative) returns for the periods shown had been earned at a constant rate.
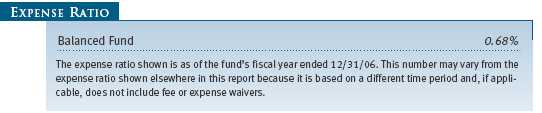
| FUND EXPENSE EXAMPLE |
As a mutual fund shareholder, you may incur two types of costs: (1) transaction costs, such as redemption fees or sales loads, and (2) ongoing costs, including management fees, distribution and service (12b-1) fees, and other fund expenses. The following example is intended to help you understand your ongoing costs (in dollars) of investing in the fund and to compare these costs with the ongoing costs of investing in other mutual funds. The example is based on an investment of $1,000 invested at the beginning of the most recent six-month period and held for the entire period.
Actual Expenses
The first line of the following table (“Actual”) provides information about actual account values and expenses based on the fund’s actual returns. You may use the information in this line, together with your account balance, to estimate the expenses that you paid over the period. Simply divide your account value by $1,000 (for example, an $8,600 account value divided by $1,000 = 8.6), then multiply the result by the number in the first line under the heading “Expenses Paid During Period” to estimate the expenses you paid on your account during this period.
Hypothetical Example for Comparison Purposes
The information on the second line of the table (“Hypothetical”) is based on hypothetical account values and expenses derived from the fund’s actual expense ratio and an assumed 5% per year rate of return before expenses (not the fund’s actual return). You may compare the ongoing costs of investing in the fund with other funds by contrasting this 5% hypothetical example and the 5% hypothetical examples that appear in the shareholder reports of the other funds. The hypothetical account values and expenses may not be used to estimate the actual ending account balance or expenses you paid for the period.
Note: T. Rowe Price charges an annual small-account maintenance fee of $10, generally for accounts with less than $2,000 ($500 for UGMA/UTMA). The fee is waived for any investor whose T. Rowe Price mutual fund accounts total $25,000 or more, accounts employing automatic investing, and IRAs and other retirement plan accounts that utilize a prototype plan sponsored by T. Rowe Price (although a separate custodial or administrative fee may apply to such accounts). This fee is not included in the accompanying table. If you are subject to the fee, keep it in mind when you are estimating the ongoing expenses of investing in the fund and when comparing the expenses of this fund with other funds.
You should also be aware that the expenses shown in the table highlight only your ongoing costs and do not reflect any transaction costs, such as redemption fees or sales loads. Therefore, the second line of the table is useful in comparing ongoing costs only and will not help you determine the relative total costs of owning different funds. To the extent a fund charges transaction costs, however, the total cost of owning that fund is higher.

Unaudited
The accompanying notes are an integral part of these financial statements.


The accompanying notes are an integral part of these financial statements.


The accompanying notes are an integral part of these financial statements.
Unaudited
The accompanying notes are an integral part of these financial statements.
Unaudited
The accompanying notes are an integral part of these financial statements.
Unaudited
The accompanying notes are an integral part of these financial statements.
Unaudited
| NOTES TO FINANCIAL STATEMENTS |
NOTE 1 - SIGNIFICANT ACCOUNTING POLICIES
T. Rowe Price Balanced Fund, Inc. (the fund), is registered under the Investment Company Act of 1940 (the 1940 Act) as a diversified, open-end management investment company. The fund commenced operations on December 31, 1939. The fund seeks to provide capital growth, current income, and preservation of capital through a portfolio of stocks and fixed-income securities.
The accompanying financial statements were prepared in accordance with accounting principles generally accepted in the United States of America, which require the use of estimates made by fund management. Fund management believes that estimates and security valuations are appropriate; however, actual results may differ from those estimates, and the security valuations reflected in the financial statements may differ from the value the fund ultimately realizes upon sale of the securities.
Valuation The fund values its investments and computes its net asset value per share at the close of the New York Stock Exchange (NYSE), normally 4 p.m. ET, each day that the NYSE is open for business. Equity securities listed or regularly traded on a securities exchange or in the over-the-counter (OTC) market are valued at the last quoted sale price or, for certain markets, the official closing price at the time the valuations are made, except for OTC Bulletin Board securities, which are valued at the mean of the latest bid and asked prices. A security that is listed or traded on more than one exchange is valued at the quotation on the exchange determined to be the primary market for such security. Listed securities not traded on a particular day are valued at the mean of the latest bid and asked prices for domestic securities and the last quoted sale price for international securities. Debt securities are generally traded in the over-the-counter market. Securities with original maturities of one year or more are valued at prices furnished by dealers who make markets in such securities or by an independent pricing service, which considers yield or price of bonds of comparable quality, coupon, maturity, and type, as well as prices quoted by dealers who make markets in such securities. Securities with original maturities of less than one year are valued at amortized cost in local currency, which approximates fair value when combined with accrued interest.
Investments in mutual funds are valued at the mutual fund’s closing net asset value per share on the day of valuation. Financial futures contracts are valued at closing settlement prices. Swap agreements are valued at prices furnished by dealers who make markets in such securities.
Other investments, including restricted securities, and those for which the above valuation procedures are inappropriate or are deemed not to reflect fair value are stated at fair value as determined in good faith by the T. Rowe Price Valuation Committee, established by the fund’s Board of Directors.
Most foreign markets close before the close of trading on the NYSE. If the fund determines that developments between the close of a foreign market and the close of the NYSE will, in its judgment, materially affect the value of some or all of its portfolio securities, which in turn will affect the fund’s share price, the fund will adjust the previous closing prices to reflect the fair value of the securities as of the close of the NYSE, as determined in good faith by the T. Rowe Price Valuation Committee, established by the fund’s Board of Directors. A fund may also fair value securities in other situations, such as when a particular foreign market is closed but the fund is open. In deciding whether to make fair value adjustments, the fund reviews a variety of factors, including developments in foreign markets, the performance of U.S. securities markets, and the performance of instruments trading in U.S. markets that represent foreign securities and baskets of foreign securities. The fund uses outside pricing services to provide it with closing market prices and information used for adjusting those prices. The fund cannot predict when and how often it will use closing prices and when it will adjust those prices to reflect fair value. As a means of evaluating its fair value process, the fund routinely compares closing market prices, the next day’s opening prices in the same markets, and adjusted prices.
Currency Translation Assets, including investments, and liabilities denominated in foreign currencies are translated into U.S. dollar values each day at the prevailing exchange rate, using the mean of the bid and asked prices of such currencies against U.S. dollars as quoted by a major bank. Purchases and sales of securities, income, and expenses are translated into U.S. dollars at the prevailing exchange rate on the date of the transaction. The effect of changes in foreign currency exchange rates on realized and unrealized security gains and losses is reflected as a component of security gains and losses.
Credits The fund earns credits on temporarily uninvested cash balances at the custodian that reduce the fund’s custody charges. Custody expense in the accompanying financial statements is presented before reduction for credits, which are reflected as expenses paid indirectly.
Investment Transactions, Investment Income, and Distributions Income and expenses are recorded on the accrual basis. Premiums and discounts on debt securities are amortized for financial reporting purposes. Dividends received from mutual fund investments are reflected as dividend income; capital gain distributions are reflected as realized gain/loss. Dividend income and capital gain distributions are recorded on the ex-dividend date. Any income tax-related interest and penalties would be classified as income tax expense. Investment transactions are accounted for on the trade date. Realized gains and losses are reported on the identified cost basis. Payments (“variation margin”) made or received to settle the daily fluctuations in the value of futures contracts are recorded as unrealized gains or losses until the contracts are closed. Unsettled variation margin on futures contracts is reflected as other assets or liabilities, and unrealized gains and loss es on futures contracts are reflected as the change in net unrealized gain or loss in the accompanying financial statements. Net periodic receipts or payments required by swaps are accrued daily and recorded as realized gain or loss in the accompanying financial statements. Fluctuations in the fair value of swaps are reflected in the change in net unrealized gain or loss and are reclassified to realized gain or loss upon termination prior to maturity. Paydown gains and losses are recorded as an adjustment to interest income. Distributions to shareholders are recorded on the ex-dividend date. Income distributions are declared and paid on a quarterly basis. Capital gain distributions, if any, are declared and paid by the fund, typically on an annual basis.
New Accounting Pronouncements Effective June 29, 2007, the fund adopted Financial Accounting Standards Board (“FASB”) Interpretation No. 48 (“FIN 48”), Accounting for Uncertainty in Income Taxes, a clarification of FASB Statement No. 109, Accounting for Income Taxes. FIN 48 establishes financial accounting and disclosure requirements for recognition and measurement of tax positions taken or expected to be taken on an income tax return. The adoption of FIN 48 had no impact on the fund’s net assets or results of operations.
In September 2006, the FASB released the Statement of Financial Accounting Standard No. 157 (“FAS 157”), Fair Value Measurements. FAS 157 clarifies the definition of fair value and establishes the framework for measuring fair value, as well as proper disclosure of this methodology in the financial statements. It will be effective for the fund’s fiscal year beginning January 1, 2008. Management is evaluating the effects of FAS 157; however, it is not expected to have a material impact on the fund’s net assets or results of operations.
NOTE 2 - INVESTMENT TRANSACTIONS
Consistent with its investment objective, the fund engages in the following practices to manage exposure to certain risks or to enhance performance. The investment objective, policies, program, and risk factors of the fund are described more fully in the fund’s prospectus and Statement of Additional Information.
Restricted Securities The fund may invest in securities that are subject to legal or contractual restrictions on resale. Although certain of these securities may be readily sold, for example, under Rule 144A, others may be illiquid, their sale may involve substantial delays and additional costs, and prompt sale at an acceptable price may be difficult.
Futures Contracts During the six months ended June 30, 2007, the fund was a party to futures contracts, which provide for the future sale by one party and purchase by another of a specified amount of a specific financial instrument at an agreed upon price, date, time, and place. Risks arise from possible illiquidity of the futures market and from movements in security values.
Swaps During the six months ended June 30, 2007, the fund was a party to credit default swaps under which it buys or sells credit protection against a defined-issuer credit event. Upon a defined-issuer credit event, the fund is required to either deliver the notional amount of the contract in cash and take delivery of the relevant credit or deliver cash approximately equal to the notional amount of the contract less market value of the relevant credit at the time of the credit event. Risks arise from the possible inability of counterparties to meet the terms of their agreements and from changes in creditworthiness of the relevant underlying issuer.
TBA Purchase Commitments During the six months ended June 30, 2007, the fund entered into to be announced (TBA) purchase commitments, pursuant to which it agrees to purchase mortgage-backed securities for a fixed unit price, with payment and delivery at a scheduled future date beyond the customary settlement period for that security. With TBA transactions, the particular securities to be delivered are not identified at the trade date; however, delivered securities must meet specified terms, including issuer, rate, and mortgage term, and be within industry-accepted “good delivery” standards. The fund generally enters into TBAs with the intention of taking possession of the underlying mortgage securities. Until settlement, the fund maintains cash reserves and liquid assets sufficient to settle its TBAs.
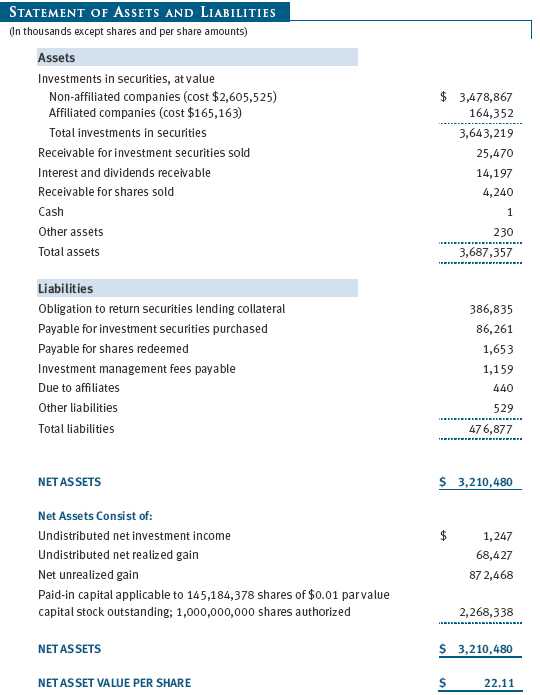
Securities Lending The fund lends its securities to approved brokers to earn additional income. It receives as collateral cash and U.S. government securities valued at 102% to 105% of the value of the securities on loan. Cash collateral is invested in money market pooled accounts managed by the fund’s lending agents in accordance with investment guidelines approved by fund management. Collateral is maintained over the life of the loan in an amount not less than the value of loaned securities, as determined at the close of fund business each day; any additional collateral required due to changes in security values is delivered to the fund the next business day. Although risk is mitigated by the collateral, the fund could experience a delay in recovering its securities and a possible loss of income or value if the borrower fails to return the securities. Securities lending revenue recognized by the fund consists of earnings on invested collateral and borrowing f ees, net of any rebates to the borrower and compensation to the lending agent. At June 30, 2007, the value of loaned securities was $396,696,000; aggregate collateral consisted of $386,835,000 in money market pooled accounts and U.S. government securities valued at $23,707,000.
Other Purchases and sales of portfolio securities, other than short-term and U.S. government securities, aggregated $340,478,000 and $234,376,000, respectively, for the six months ended June 30, 2007. Purchases and sales of U.S. government securities aggregated $629,878,000 and $552,677,000, respectively, for the six months ended June 30, 2007.
NOTE 3 - FEDERAL INCOME TAXES
No provision for federal income taxes is required since the fund intends to continue to qualify as a regulated investment company under Subchapter M of the Internal Revenue Code and distribute to shareholders all of its taxable income and gains. Federal income tax regulations differ from generally accepted accounting principles; therefore, distributions determined in accordance with tax regulations may differ in amount or character from net investment income and realized gains for financial reporting purposes. Financial reporting records are adjusted for permanent book/tax differences to reflect tax character. Financial records are not adjusted for temporary differences. The amount and character of tax-basis distributions and composition of net assets are finalized at fiscal year-end; accordingly, tax-basis balances have not been determined as of June 30, 2007.
At June 30, 2007, the cost of investments for federal income tax purposes was $2,770,688,000. Net unrealized gain aggregated $872,468,000 at period-end, of which $918,695,000 related to appreciated investments and $46,227,000 related to depreciated investments.
NOTE 4 - RELATED PARTY TRANSACTIONS
The fund is managed by T. Rowe Price Associates, Inc. (the manager or Price Associates), a wholly owned subsidiary of T. Rowe Price Group, Inc. The investment management agreement between the fund and the manager provides for an annual investment management fee, which is computed daily and paid monthly. The fee consists of an individual fund fee, equal to 0.15% of the fund’s average daily net assets, and a group fee. The group fee rate is calculated based on the combined net assets of certain mutual funds sponsored by Price Associates (the group) applied to a graduated fee schedule, with rates ranging from 0.48% for the first $1 billion of assets to 0.285% for assets in excess of $220 billion. The fund’s group fee is determined by applying the group fee rate to the fund’s average daily net assets. At June 30, 2007, the effective annual group fee rate was 0.30%.
In addition, the fund has entered into service agreements with Price Associates and two wholly owned subsidiaries of Price Associates (collectively, Price). Price Associates computes the daily share price and provides certain other administrative services to the fund. T. Rowe Price Services, Inc., provides shareholder and administrative services in its capacity as the fund’s transfer and dividend disbursing agent. T. Rowe Price Retirement Plan Services, Inc., provides subaccounting and recordkeeping services for certain retirement accounts invested in the fund. For the six months ended June 30, 2007, expenses incurred pursuant to these service agreements were $77,000 for Price Associates, $442,000 for T. Rowe Price Services, Inc., and $1,840,000 for T. Rowe Price Retirement Plan Services, Inc. The total amount payable at period-end pursuant to these service agreements is reflected as Due to Affiliates in the accompanying financial statements.
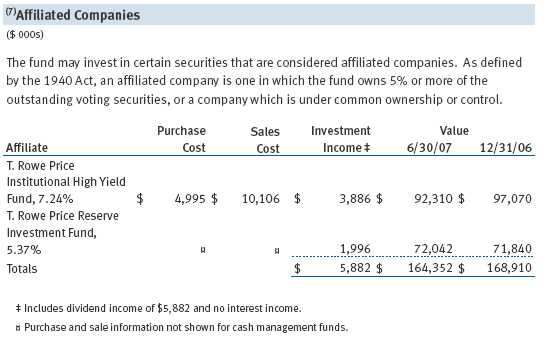
The fund may invest in the T. Rowe Price Reserve Investment Fund and the T. Rowe Price Government Reserve Investment Fund (collectively, the T. Rowe Price Reserve Investment Funds), open-end management investment companies managed by Price Associates and affiliates of the fund. The T. Rowe Price Reserve Investment Funds are offered as cash management options to mutual funds, trusts, and other accounts managed by Price Associates and/or its affiliates, and are not available for direct purchase by members of the public. The T. Rowe Price Reserve Investment Funds pay no investment management fees.
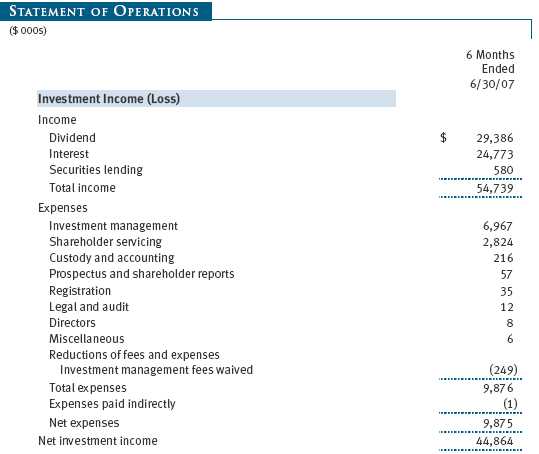
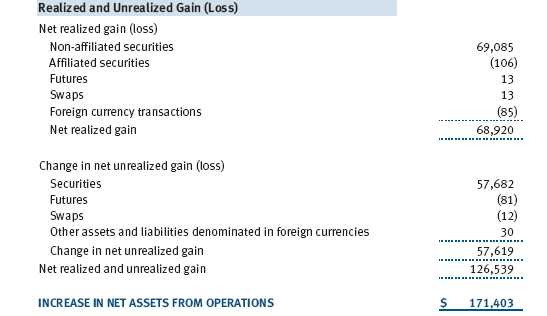
The fund may invest in the T. Rowe Price Institutional High Yield Fund, Inc. (High Yield Fund), as a means of gaining efficient and cost-effective exposure to the high-yield bond markets. The High Yield Fund is an open-end management investment company managed by Price Associates, and is an affiliate of the fund (reflected on the Affiliated Companies table). The High Yield Fund pays an annual all-inclusive management and administrative fee to Price Associates equal to 0.50% of average daily net assets. To ensure that Balanced Fund does not incur duplicate fees for its assets invested in the High Yield Fund, Price Associates has agreed to reduce its management fee charged to the fund. Accordingly, the accompanying Statement of Operations includes $249,000 of management fees permanently waived pursuant to this agreement. For the six months ended June 30, 2007, realized losses on sales of High Yield Fund shares were $106,000 and capital gain distributions from High Yield Fund totaled $0.
| INFORMATION ON PROXY VOTING POLICIES, PROCEDURES, AND RECORDS |
A description of the policies and procedures used by T. Rowe Price funds and portfolios to determine how to vote proxies relating to portfolio securities is available in each fund’s Statement of Additional Information, which you may request by calling 1-800-225-5132 or by accessing the SEC’s Web site, www.sec.gov. The description of our proxy voting policies and procedures is also available on our Web site, www.troweprice.com. To access it, click on the words “Company Info” at the top of our homepage for individual investors. Then, in the window that appears, click on the “Proxy Voting Policy” navigation button in the top left corner.
Each fund’s most recent annual proxy voting record is available on our Web site and through the SEC’s Web site. To access it through our Web site, follow the directions above, then click on the words “Proxy Voting Record” at the bottom of the Proxy Voting Policy page.
| HOW TO OBTAIN QUARTERLY PORTFOLIO HOLDINGS |
The fund files a complete schedule of portfolio holdings with the Securities and Exchange Commission for the first and third quarters of each fiscal year on Form N-Q. The fund’s Form N-Q is available electronically on the SEC’s Web site (www.sec.gov); hard copies may be reviewed and copied at the SEC’s Public Reference Room, 450 Fifth St. N.W., Washington, DC 20549. For more information on the Public Reference Room, call 1-800-SEC-0330.
| APPROVAL OF INVESTMENT MANAGEMENT AGREEMENT |
On March 7, 2007, the fund’s Board of Directors (Board) unanimously approved the investment advisory contract (Contract) between the fund and its investment manager, T. Rowe Price Associates, Inc. (Manager). The Board considered a variety of factors in connection with its review of the Contract, also taking into account information provided by the Manager during the course of the year, as discussed below:
Services Provided by the Manager
The Board considered the nature, quality, and extent of the services provided to the fund by the Manager. These services included, but were not limited to, management of the fund’s portfolio and a variety of related activities, as well as financial and administrative services, reporting, and communications. The Board also reviewed the background and experience of the Manager’s senior management team and investment personnel involved in the management of the fund. The Board concluded that it was satisfied with the nature, quality, and extent of the services provided by the Manager.
Investment Performance of the Fund
The Board reviewed the fund’s average annual total return over the 1-, 3-, 5-, and 10-year periods as well as the fund’s year-by-year returns and compared these returns with previously agreed upon comparable performance measures and market data, including those supplied by Lipper and Morningstar, which are independent providers of mutual fund data. On the basis of this evaluation and the Board’s ongoing review of investment results, the Board concluded that the fund’s performance was satisfactory.
Costs, Benefits, Profits, and Economies of Scale
The Board reviewed detailed information regarding the revenues received by the Manager under the Contract and other benefits that the Manager (and its affiliates) may have realized from its relationship with the fund, including research received under “soft dollar” agreements. The Board noted that soft dollars were not used to pay for third-party, non-broker research. The Board also received information on the estimated costs incurred and profits realized by the Manager and its affiliates from advising T. Rowe Price mutual funds, as well as estimates of the gross profits realized from managing the fund in particular. The Board concluded that the Manager’s profits were reasonable in light of the services provided to the fund. The Board also considered whether the fund or other funds benefit under the fee levels set forth in the Contract from any economies of scale realized by the Manager. Under the Contract, the fund pays a fee to the Manager composed of two components—a group fee rate based on the aggregate assets of certain T. Rowe Price mutual funds (including the fund) that declines at certain asset levels, and an individual fund fee rate that is assessed on the assets of the fund. The Board concluded that the advisory fee structure for the fund continued to provide for a reasonable sharing of benefits from any economies of scale with the fund’s investors.
Fees
The Board reviewed the fund’s management fee rate, operating expenses, and total expense ratio and compared them with fees and expenses of other comparable funds based on information and data supplied by Lipper. The information provided to the Board indicated that the fund’s management fee rate was at or above the median for certain groups of comparable funds but below the median for other groups of comparable funds. The information also indicated that the fund’s expense ratio was generally below the median for comparable funds. The Board also reviewed the fee schedules for comparable privately managed accounts of the Manager and its affiliates. Management informed the Board that the Manager’s responsibilities for privately managed accounts are more limited than its responsibilities for the fund and other T. Rowe Price mutual funds that it or its affiliates advise. On the basis of the information provided, the Board concluded that the fees paid by the fund under the Contract were reasonable.
Approval of the Contract
As noted, the Board approved the continuation of the Contract. No single factor was considered in isolation or to be determinative to the decision. Rather, the Board concluded, in light of a weighting and balancing of all factors considered, that it was in the best interests of the fund to approve the continuation of the Contract, including the fees to be charged for services thereunder.
Item 2. Code of Ethics.
A code of ethics, as defined in Item 2 of Form N-CSR, applicable to its principal executive officer, principal financial officer, principal accounting officer or controller, or persons performing similar functions is filed as an exhibit to the registrant’s annual Form N-CSR. No substantive amendments were approved or waivers were granted to this code of ethics during the registrant’s most recent fiscal half-year.
Item 3. Audit Committee Financial Expert.
Disclosure required in registrant’s annual Form N-CSR.
Item 4. Principal Accountant Fees and Services.
Disclosure required in registrant’s annual Form N-CSR.
Item 5. Audit Committee of Listed Registrants.
Not applicable.
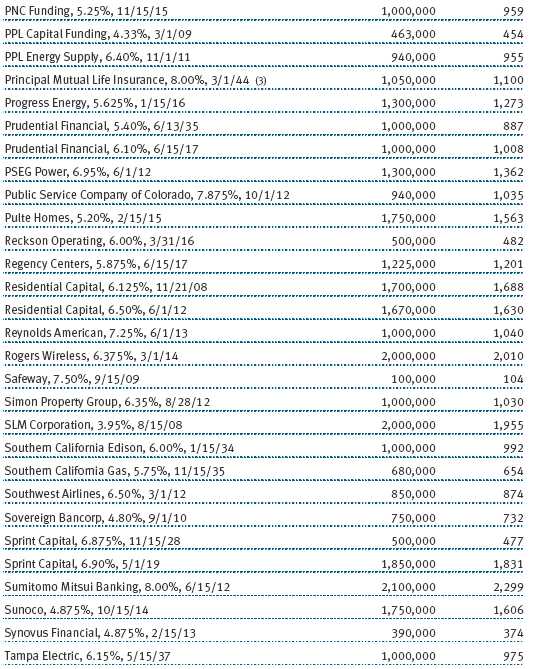
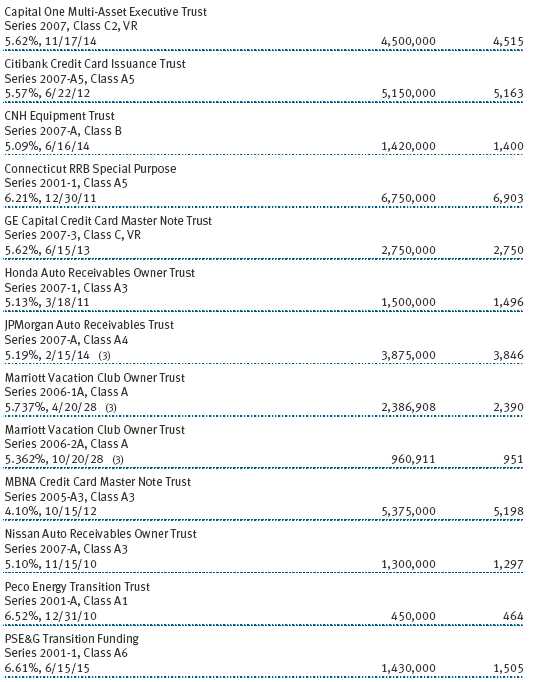
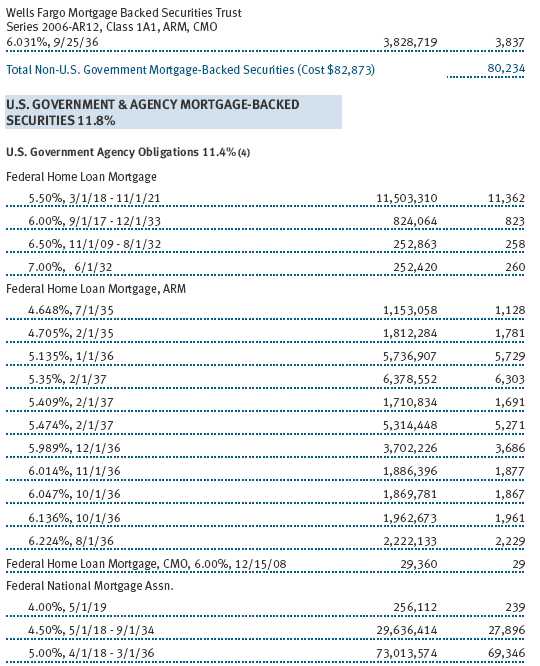
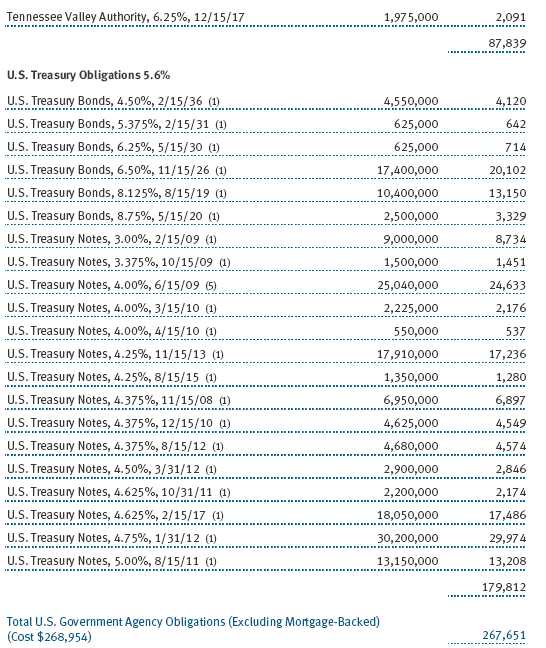
Item 6. Schedule of Investments.
Not applicable. The complete schedule of investments is included in Item 1 of this Form N-CSR.
Item 7. Disclosure of Proxy Voting Policies and Procedures for Closed-End Management Investment Companies.
Not applicable.
Item 8. Portfolio Managers of Closed-End Management Investment Companies.
Not applicable.
Item 9. Purchases of Equity Securities by Closed-End Management Investment Company and Affiliated Purchasers.
Not applicable.
Item 10. Submission of Matters to a Vote of Security Holders.
Not applicable.
Item 11. Controls and Procedures.
(a) The registrant’s principal executive officer and principal financial officer have evaluated the registrant’s disclosure controls and procedures within 90 days of this filing and have concluded that the registrant’s disclosure controls and procedures were effective, as of that date, in ensuring that information required to be disclosed by the registrant in this Form N-CSR was recorded, processed, summarized, and reported timely.
(b) The registrant’s principal executive officer and principal financial officer are aware of no change in the registrant’s internal control over financial reporting that occurred during the registrant’s second fiscal quarter covered by this report that has materially affected, or is reasonably likely to materially affect, the registrant’s internal control over financial reporting.
Item 12. Exhibits.(a)(1) The registrant’s code of ethics pursuant to Item 2 of Form N-CSR is filed with the registrant’s annual Form N-CSR.
(2) Separate certifications by the registrant's principal executive officer and principal financial officer, pursuant to Section 302 of the Sarbanes-Oxley Act of 2002 and required by Rule 30a-2(a) under the Investment Company Act of 1940, are attached.
(3) Written solicitation to repurchase securities issued by closed-end companies: not applicable.
(b) A certification by the registrant's principal executive officer and principal financial officer, pursuant to Section 906 of the Sarbanes-Oxley Act of 2002 and required by Rule 30a-2(b) under the Investment Company Act of 1940, is attached.
SIGNATURES | |
| Pursuant to the requirements of the Securities Exchange Act of 1934 and the Investment | |
| Company Act of 1940, the registrant has duly caused this report to be signed on its behalf by the | |
| undersigned, thereunto duly authorized. | |
| T. Rowe Price Balanced Fund, Inc. | |
| By | /s/ Edward C. Bernard |
| Edward C. Bernard | |
| Principal Executive Officer | |
| Date | August 17, 2007 |
| Pursuant to the requirements of the Securities Exchange Act of 1934 and the Investment | |
| Company Act of 1940, this report has been signed below by the following persons on behalf of | |
| the registrant and in the capacities and on the dates indicated. | |
| By | /s/ Edward C. Bernard |
| Edward C. Bernard | |
| Principal Executive Officer | |
| Date | August 17, 2007 |
| By | /s/ Joseph A. Carrier |
| Joseph A. Carrier | |
| Principal Financial Officer | |
| Date | August 17, 2007 |