| UNITED STATES |
| SECURITIES AND EXCHANGE COMMISSION |
| Washington, D.C. 20549 |
FORM N-CSR |
CERTIFIED SHAREHOLDER REPORT OF REGISTERED |
MANAGEMENT INVESTMENT COMPANIES |
| Investment Company Act File Number: 811-6275 |
| T. Rowe Price Balanced Fund, Inc. |
| (Exact name of registrant as specified in charter) |
| 100 East Pratt Street, Baltimore, MD 21202 |
| (Address of principal executive offices) |
| David Oestreicher |
| 100 East Pratt Street, Baltimore, MD 21202 |
| (Name and address of agent for service) |
| Registrant’s telephone number, including area code: (410) 345-2000 |
| Date of fiscal year end: December 31 |
| Date of reporting period: June 30, 2008 |
Item 1: Report to Shareholders
 |
| Balanced Fund | June 30, 2008 |
The views and opinions in this report were current as of June 30, 2008. They are not guarantees of performance or investment results and should not be taken as investment advice. Investment decisions reflect a variety of factors, and the managers reserve the right to change their views about individual stocks, sectors, and the markets at any time. As a result, the views expressed should not be relied upon as a forecast of the fund’s future investment intent. The report is certified under the Sarbanes-Oxley Act, which requires mutual funds and other public companies to affirm that, to the best of their knowledge, the information in their financial reports is fairly and accurately stated in all material respects.
REPORTS ON THE WEB
Sign up for our E-mail Program, and you can begin to receive updated fund reports and prospectuses online rather than through the mail. Log in to your account at troweprice.com for more information.
Manager’s Letter
Fellow Shareholders
U.S. stocks declined amid sluggish economic growth in the first half of 2008. Surging food and energy costs, tighter lending conditions, and massive mortgage-related losses in the financials sector weighed on investor sentiment and led to weaker consumer spending and corporate profit growth in many sectors. Bonds were mixed, as solid first-quarter gains were eroded by a rebound in Treasury yields from lows reached in mid-March. Non-U.S. stocks declined, although the strength of foreign currencies relative to the U.S. dollar helped their performance in dollar terms. Equities in developed markets narrowly outperformed stocks in developing markets. The Balanced Fund could not escape the downward trends, but its broad diversification limited losses.
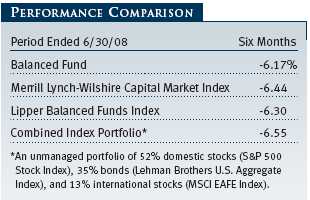
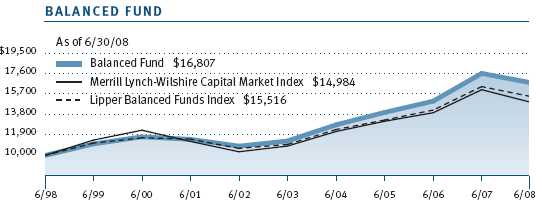
Your fund declined 6.17% in the first half of 2008, although it surpassed the Lipper Balanced Funds Index and the other two benchmarks. Positive stock selection within the portfolio’s U.S. equity holdings was the primary contributor to portfolio outperformance. The fund also benefited from an underweighting in large-cap value stocks.
HIGHLIGHTS
• U.S. and international stocks declined amid sluggish economic growth in the first half of 2008, while bonds generated mixed results.
• The Balanced Fund posted losses, although broad diversification helped it surpass the performance of its benchmarks.
• Overweighting large-cap growth stocks helped the fund’s relative performance. We believe that in this slower economic growth environment, solid large-cap growth companies offer good prospects.
• We believe that shareholders will continue to benefit from the fund’s commitment to a diversified portfolio.
MARKET ENVIRONMENT
Economic growth slowed significantly this year, with gross domestic product expanding at an annualized rate of only 1.0% in the first quarter of 2008 and probably only marginally faster in the second quarter. The housing market continued to deteriorate, and aggregate employment fell during the first half of the year. In addition, output in the manufacturing and services sectors showed little or no growth, and inflation eroded consumers’ purchasing power. As a result, the economy is teetering on the edge of a recession—popularly defined as two consecutive quarters of contraction.
As subprime mortgage losses mounted and financial institutions cut back on lending to preserve capital and avoid additional losses, the Federal Reserve took several extraordinary actions to boost market liquidity—such as helping J.P. Morgan Chase acquire Bear Stearns and creating new credit facilities to allow investment banks and broker-dealers to borrow directly from the Fed. The central bank also aggressively reduced the fed funds target rate—an interbank lending rate that banks also use as a benchmark for their prime consumer lending rates—from 4.25% at the end of 2007 to 2.00% by the end of April. Although the economy remains weak, the Fed refrained from cutting rates at the end of June due to rising inflation.

U.S. stocks declined amid sluggish economic growth in the first half of 2008. Small-cap shares lagged mid-caps in the last six months but outperformed large-cap stocks. As measured by various Russell indexes, growth stocks did better than value across all market capitalizations. In the large-cap universe, the financials sector suffered a severe decline, with some banks expected to fail due to unprecedented mortgage losses that have caused a liquidity crisis. Financial institutions were forced to write down the value of mortgage assets and cut dividends as they went about trying to secure new lines of credit. After our reporting period, questions arose about the solvency of the nation’s two largest mortgage finance companies—Fannie Mae and Freddie Mac—which may need a rescue package that could include a line of credit from the federal government of up to $300 billion. Telecommunication services stocks also fell sharply, while information technology, health care, consumer discretionary, and industrials and business services shares generally performed in line with the broad market. Utilities and consumer staples companies declined but held up better than other segments. Meanwhile, energy stocks produced strong gains as oil surged from about $100 to $140 per barrel. Materials stocks were flat.
U.S. bonds were mixed in the last six months, as a rebound in Treasury yields from lows reached in mid-March largely erased solid first-quarter gains. (Bond yield and prices move in opposite directions.) Short- and intermediate-term U.S. Treasuries and Ginnie Mae mortgage-backed securities appreciated, but municipal bonds produced flat returns, and investment-grade corporate bonds edged lower. High-yield corporate bonds declined, as investors favored securities with the highest credit quality. The Lehman Brothers U.S. Aggregate Index, which measures the taxable domestic investment-grade bond universe, returned 1.13%.
Non-U.S. stock markets declined in the last six months, although the strength of foreign currencies relative to the U.S. dollar helped their performance in dollar terms. Developed market equities narrowly outperformed those in developing markets. Among emerging markets, only the Latin America region was up. Its strong return was a result of high commodity prices and an improved macroeconomic climate. The MSCI EAFE Index, which measures the performance of mostly large-cap stocks in Europe, Australasia, and the Far East, returned -10.58%.
ASSET ALLOCATION STRATEGY
In keeping with the broad diversification of the Balanced Fund, we introduced U.S. large-cap growth-style and U.S. large-cap value-style subportfolios in the last reporting cycle to complement the fund’s current large-cap holdings within U.S. equities. These dedicated growth- and value-style portfolios will provide an opportunity to overweight and underweight growth and value styles within U.S. equities. The neutral weights are equal across all three strategies, although we are currently overweight in large-cap growth and underweight in large-cap value.
The fund’s neutral exposure to equities was increased to 65% beginning May 1, 2008, to reflect a balance between the long-term growth prospects of equities and the income and principal stability of bonds. We believe this exposure is better suited to meet the portfolio’s long-term investment objectives. Our combined index has, therefore, shifted from 60% equities to 65% equities (52% S&P 500 Index, 13% MSCI EAFE, 35% Lehman Brothers U.S. Aggregate). For periods prior to May 1, 2008, the allocation of the combined index portfolio consisted of 50% S&P 500 Index, 10% MSCI EAFE, and 40% Lehman Brothers U.S. Aggregate.
In this period of slower growth, we are overweighting U.S. large-cap growth versus large-cap value because, we believe, the climate favors quality growth companies that can produce consistent earnings increases. We are neutral in non-U.S. equity markets, as valuations appear to be reasonable in EAFE-related markets. However, we are mindful of the fact that export-oriented earnings growth for non-U.S. firms faces headwinds of stronger currencies. We are underweighting high-yield relative to investment-grade bonds, as fundamental and technical factors for the high-yield sector continue to prove challenging and should remain so through the remainder of the year. High-yield spreads have widened year-to-date, reflecting expectations for a significant increase in defaults from historically low levels.
PORTFOLIO REVIEW
Domestic Stocks
Most sectors in the fund’s domestic equity portfolio saw declines, with the sharpest sell-off in financials, which have been hit hard by the mortgage and credit crises. Consumer discretionary also suffered a severe decline, as the economic slowdown and soaring food and energy prices put pressure on the sector. Information technology was also hurt by weak consumer spending. Even the consumer staples and health care sectors saw losses. The only exceptions to the sell-off were the energy and materials sectors. Utilities eked out a tiny gain, but the energy and materials sectors contributed the most, owing to soaring commodity prices.
While financials were a major drag on performance, our overall underweight to the sector as well as stock selection minimized our losses versus the index. Diversified financial services companies and commercial banks were hit particularly hard, as they struggled with the fallout from the subprime mortgage meltdown. Our exposure to Citigroup hurt performance. The giant banking concern was hit with escalating losses stemming from soaring mortgages. Bank of America also felt the impact of rising delinquencies. Among other commercial banks suffering from the subprime fallout was Wachovia. (Please refer to the portfolio of investments for a complete listing of holdings and the amount each represents in the portfolio.)

Consumer discretionary declined sharply as a result of soaring energy and food prices and the drumbeat of negative news in the housing markets. The media industry continued to lose ground as it faces advertising shortfalls and makes the challenging transition to the Internet. Hotels, restaurants, and leisure industries also fell, as consumers reined in nonessential spending. International Game Technology declined on reduced revenues. Similarly, sales of Internet and catalog retail companies such as Amazon.com were down.
Energy was the standout, and most of our energy holdings produced positive returns, led by oil field services giant Schlumberger. The company has a dominant position in the industry, strong demand for its geophysical and well-drilling services, and strong research and development efforts. Energy equipment and services companies FMC Technologies and BJ Services also produced solid returns. Murphy Oil, StatoilHydro, and CONSOL Energy enjoyed strong results as a consequence of the blistering growth rate in emerging markets and worldwide demand for oil, gas, and consumable fuels products.
Our holdings in the materials sector did well, and an overweight in the sector contributed to outperformance versus the benchmark. Chemical company Potash Corp. of Saskatchewan benefited from strong fertilizer demand. Metals and mining companies Nucor and Freeport-McMoRan Copper & Gold also benefited from higher prices. Strong stock selection in the industrials and business service sector limited losses in the sector, which was hurt by the economic slowdown.
International Stocks
Non-U.S. markets declined in the last six months, although the strength of foreign currencies relative to the U.S. dollar helped their performance in dollar terms. Equities in developed markets narrowly outperformed stocks in developing markets. Asian markets have experienced a sell-off over the past six months amid fears of a U.S. recession and abating demand for exports. High energy prices and resurgent inflation have also put pressure on Asian stocks. Latin America, however, continues to enjoy robust growth as worldwide demand for commodity prices and an improved macroeconomic climate have created a sustained platform for growth.
Our holdings in the energy and materials sectors were the standouts, benefiting from the strong global demand for fuel and raw materials. The portfolio’s health care and utilities stocks were other solid contributors. Telecommunication services, normally a defensive sector, performed poorly. Financials continued to be very weak performers. Italian oil services company Saipem and Norwegian energy producer StatoilHydro were top absolute performers, while SSAB Svenskt Stal, the Swedish stainless steel maker, reversed losses from the previous reporting period and was another top absolute performer for the period. Metals and mining company Teck Cominco also performed well. But the story in the consumer discretionary and financials sectors was far different. The international markets declined much as the U.S. has in the last six months. Commercial banks were among the top absolute detractors, led by Royal Bank of Scotland, Allied Irish Banks, and Societe Generale. Real estate management and development company China Overseas Land & Investment lost ground, while insurance companies AXA and QBE Insurance suffered declines. Slowing consumer spending hurt specialty retail, multiline retail, and household durables. Sony, Esprit, and Harvey Norman all declined.
The credit squeeze and U.S. housing downturn are beginning to take their toll. The European economy continues to slow, with business and consumer confidence levels on the decline. Gains in emerging market stocks have moderated from their extraordinary levels of a year ago. While we expect positive returns to continue in overseas markets, they are unlikely to maintain the same brisk pace of the past several years.
Domestic Bonds
The slowing economy and credit market turmoil prompted investors to flee to the relative safety of the Treasury market. As a result, U.S. government securities were the best-performing fixed-income sector. Investment-grade corporate bonds also posted gains over the last six months, while high-yield bonds declined for the same period.
The Treasury yield curve, which is a graphic depiction of the relationship between the yields and maturities of government bonds, steepened during the last six months as short-term yields plummeted while long-term yields fell more moderately. Easier monetary policy and investors’ desire for low-risk assets sent short-term yields dramatically lower. Fundamentals for the high-yield sector have proven more challenging in 2008, and we are underweight in high-yield relative to investment-grade bonds. High-yield spreads have widened year-to-date, reflecting expectations for a significant increase in defaults from historically low levels.
OUTLOOK
Heightened volatility has gripped the equity and fixed-income markets around the world, due to a slowing U.S. economy and the resurgence of inflation in developed and emerging markets. The Federal Reserve is in a bind, as it seeks to find a middle ground between increasing growth and cutting off inflation before it becomes the insidious economic factor that it has been in years past. This period of economic uncertainty emphasizes the benefits of strong fundamental research in security selection to help identify strong companies with seasoned management teams that are best positioned to weather this more difficult environment.
We believe our investment approach, which incorporates a disciplined strategy, broad diversification, and a long-term focus, should serve shareholders’ long-term interests well regardless of short-term economic conditions and market volatility.
Respectfully submitted,

Richard T. Whitney
Co-chairman of the fund’s Investment Advisory Committee

Edmund M. Notzon III
Co-chairman of the fund’s Investment Advisory Committee
July 21, 2008
The committee chairmen have day-to-day responsibility for managing the portfolio and work with committee members in developing and executing the fund’s investment program.
RISKS OF INVESTING IN STOCKS
As with all stock mutual funds, the fund’s share price can fall because of weakness in the stock market, a particular industry, or specific holdings. Stock markets can decline for many reasons, including adverse political or economic developments, changes in investor psychology, or heavy institutional selling. The prospects for an industry or company may deteriorate because of a variety of factors, including disappointing earnings or changes in the competitive environment. In addition, the investment manager’s assessment of companies held in a fund may prove incorrect, resulting in losses or poor performance even in rising markets.
RISKS OF INTERNATIONAL INVESTING
Funds that invest overseas generally carry more risk than funds that invest strictly in U.S. assets. Risks can result from varying stages of economic and political development; differing regulatory environments, trading days, and accounting standards; currency fluctuations; and higher transaction costs of non-U.S. markets. Investments outside the United States could be subject to governmental actions such as capital or currency controls, nationalization of a company or industry, expropriation of assets, or imposition of high taxes.
RISKS OF INVESTING IN BONDS
Funds that invest in bonds are subject to interest rate risk, the decline in bond prices that usually accompanies a rise in interest rates. Longer-maturity bonds typically decline more than those with shorter maturities. Funds that invest in bonds are also subject to credit risk, the chance that any fund holding could have its credit rating downgraded, or that a bond issuer will default (fail to make timely payments of interest or principal), potentially reducing the fund’s income level and share price.
GLOSSARY
Duration: The average time (expressed in years) needed for an investor to receive the present value of the future cash flows on a fixed-income investment. It is used to measure a bond or bond fund’s sensitivity to interest rate changes. For example, a fund with a five-year duration would fall about 5% in price in response to a one-percentage-point increase in interest rates, and vice versa.
Fed funds target rate: An overnight lending rate set by the Federal Reserve and used by banks to meet reserve requirements. Banks also use the fed funds rate as a benchmark for their prime lending rates.
Lehman Brothers U.S. Aggregate Index: A widely used benchmark for the domestic investment-grade bond market. The index typically includes more than 5,000 fixed-income securities with an overall intermediate- to long-term average maturity.
Lipper indexes: Consist of a small number (10 to 30) of the largest mutual funds in a particular category as tracked by Lipper Inc.
Merrill Lynch-Wilshire Capital Market Index: A market capitalization-weighted index including the Wilshire 5000 and the Merrill Lynch High Yield II and Domestic Master indexes.
MSCI EAFE Index: Widely accepted as the benchmark for international stock performance (EAFE refers to Europe, Australasia, and Far East). The index represents the major markets of the world excluding the U.S. and Canada, is listed in local currency, and includes reinvestment of dividends.

Performance and Expenses
| GROWTH OF $10,000 |
This chart shows the value of a hypothetical $10,000 investment in the fund over the past 10 fiscal year periods or since inception (for funds lacking 10-year records). The result is compared with benchmarks, which may include a broad-based market index and a peer group average or index. Market indexes do not include expenses, which are deducted from fund returns as well as mutual fund averages and indexes.
| AVERAGE ANNUAL COMPOUND TOTAL RETURN |
This table shows how the fund would have performed each year if its actual (or cumulative) returns for the periods shown had been earned at a constant rate.

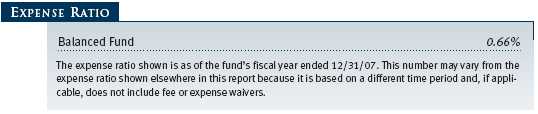
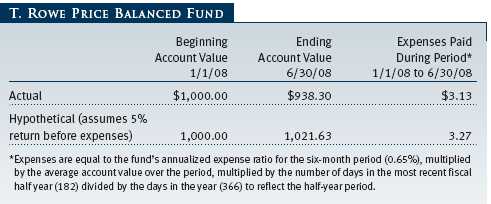
| FUND EXPENSE EXAMPLE |
As a mutual fund shareholder, you may incur two types of costs: (1) transaction costs, such as redemption fees or sales loads, and (2) ongoing costs, including management fees, distribution and service (12b-1) fees, and other fund expenses. The following example is intended to help you understand your ongoing costs (in dollars) of investing in the fund and to compare these costs with the ongoing costs of investing in other mutual funds. The example is based on an investment of $1,000 invested at the beginning of the most recent six-month period and held for the entire period.
Actual Expenses
The first line of the following table (“Actual”) provides information about actual account values and expenses based on the fund’s actual returns. You may use the information in this line, together with your account balance, to estimate the expenses that you paid over the period. Simply divide your account value by $1,000 (for example, an $8,600 account value divided by $1,000 = 8.6), then multiply the result by the number in the first line under the heading “Expenses Paid During Period” to estimate the expenses you paid on your account during this period.
Hypothetical Example for Comparison Purposes
The information on the second line of the table (“Hypothetical”) is based on hypothetical account values and expenses derived from the fund’s actual expense ratio and an assumed 5% per year rate of return before expenses (not the fund’s actual return). You may compare the ongoing costs of investing in the fund with other funds by contrasting this 5% hypothetical example and the 5% hypothetical examples that appear in the shareholder reports of the other funds. The hypothetical account values and expenses may not be used to estimate the actual ending account balance or expenses you paid for the period.
Note: T. Rowe Price charges an annual small-account maintenance fee of $10, generally for accounts with less than $2,000 ($500 for UGMA/UTMA). The fee is waived for any investor whose T. Rowe Price mutual fund accounts total $25,000 or more, accounts employing automatic investing, and IRAs and other retirement plan accounts that utilize a prototype plan sponsored by T. Rowe Price (although a separate custodial or administrative fee may apply to such accounts). This fee is not included in the accompanying table. If you are subject to the fee, keep it in mind when you are estimating the ongoing expenses of investing in the fund and when comparing the expenses of this fund with other funds.
You should also be aware that the expenses shown in the table highlight only your ongoing costs and do not reflect any transaction costs, such as redemption fees or sales loads. Therefore, the second line of the table is useful in comparing ongoing costs only and will not help you determine the relative total costs of owning different funds. To the extent a fund charges transaction costs, however, the total cost of owning that fund is higher.
Unaudited
The accompanying notes are an integral part of these financial statements.
Unaudited


The accompanying notes are an integral part of these financial statements.
Unaudited
The accompanying notes are an integral part of these financial statements.
Unaudited

The accompanying notes are an integral part of these financial statements.
Unaudited
The accompanying notes are an integral part of these financial statements.
Unaudited
| NOTES TO FINANCIAL STATEMENTS |
T. Rowe Price Balanced Fund, Inc. (the fund), is registered under the Investment Company Act of 1940 (the 1940 Act) as a diversified, open-end management investment company. The fund commenced operations on December 31, 1939. The fund seeks to provide capital growth, current income, and preservation of capital through a portfolio of stocks and fixed-income securities.
NOTE 1 - SIGNIFICANT ACCOUNTING POLICIES
Basis of Preparation The accompanying financial statements were prepared in accordance with accounting principles generally accepted in the United States of America, which require the use of estimates made by fund management. Fund management believes that estimates and security valuations are appropriate; however, actual results may differ from those estimates, and the security valuations reflected in the financial statements may differ from the value the fund ultimately realizes upon sale of the securities.
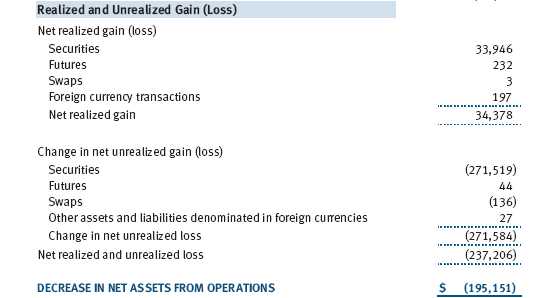
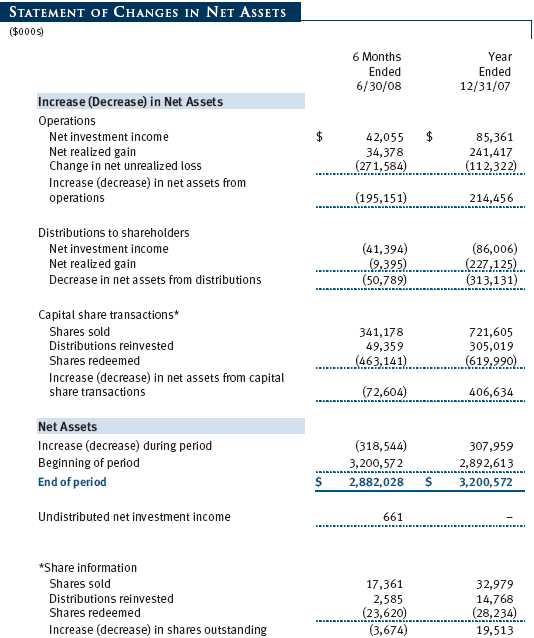
Investment Transactions, Investment Income, and Distributions Income and expenses are recorded on the accrual basis. Premiums and discounts on debt securities are amortized for financial reporting purposes. Dividends received from mutual fund investments are reflected as dividend income; capital gain distributions are reflected as realized gain/loss. Dividend income and capital gain distributions are recorded on the ex-dividend date. Income tax-related interest and penalties, if incurred, would be recorded as income tax expense. Investment transactions are accounted for on the trade date. Realized gains and losses are reported on the identified cost basis. Payments (“variation margin”) made or received to settle the daily fluctuations in the value of futures contracts are recorded as unrealized gains or losses until the contracts are closed. Unsettled variation margin on futures contracts is reflected as other assets or liabilities, and unrealized gains and losses on futures contracts are reflected as the change in net unrealized gain or loss in the accompanying financial statements. Net periodic receipts or payments required by swaps are accrued daily and recorded as realized gain or loss in the accompanying financial statements. Fluctuations in the fair value of swaps are reflected in the change in net unrealized gain or loss and are reclassified to realized gain or loss upon termination prior to maturity. Paydown gains and losses are recorded as an adjustment to interest income. Distributions to shareholders are recorded on the ex-dividend date. Income distributions are declared and paid on a quarterly basis. Capital gain distributions, if any, are declared and paid by the fund, typically on an annual basis.
Currency Translation Assets, including investments, and liabilities denominated in foreign currencies are translated into U.S. dollar values each day at the prevailing exchange rate, using the mean of the bid and asked prices of such currencies against U.S. dollars as quoted by a major bank. Purchases and sales of securities, income, and expenses are translated into U.S. dollars at the prevailing exchange rate on the date of the transaction. The effect of changes in foreign currency exchange rates on realized and unrealized security gains and losses is reflected as a component of security gains and losses.
Credits The fund earns credits on temporarily uninvested cash balances at the custodian that reduce the fund’s custody charges. Custody expense in the accompanying financial statements is presented before reduction for credits.
New Accounting Pronouncements On January 1, 2008, the fund adopted Statement of Financial Accounting Standards No. 157 (FAS 157), Fair Value Measurements. FAS 157 defines fair value, establishes the framework for measuring fair value, and expands the disclosures of fair value measurements in the financial statements. Adoption of FAS 157 did not have a material impact on the fund’s net assets or results of operations.
In March 2008, the Financial Accounting Standards Board issued Statement of Financial Accounting Standards No. 161, Disclosures about Derivative Instruments and Hedging Activities (“FAS 161”), which is effective for fiscal years and interim periods beginning after November 15, 2008. FAS 161 requires enhanced disclosures about derivative and hedging activities, including how such activities are accounted for and their effect on financial position, performance and cash flows. Management is currently evaluating the impact the adoption of FAS 161 will have on the fund’s financial statements and related disclosures.
NOTE 2 - VALUATION
The fund’s investments are reported at fair value as defined under FAS 157. The fund values its investments and computes its net asset value per share at the close of the New York Stock Exchange (NYSE), normally 4 p.m. ET, each day that the NYSE is open for business.
Valuation Methods Equity securities listed or regularly traded on a securities exchange or in the over-the-counter (OTC) market are valued at the last quoted sale price or, for certain markets, the official closing price at the time the valuations are made, except for OTC Bulletin Board securities, which are valued at the mean of the latest bid and asked prices. A security that is listed or traded on more than one exchange is valued at the quotation on the exchange determined to be the primary market for such security. Listed securities not traded on a particular day are valued at the mean of the latest bid and asked prices for domestic securities and the last quoted sale price for international securities.
Debt securities are generally traded in the OTC market. Securities with remaining maturities of one year or more at the time of acquisition are valued at prices furnished by dealers who make markets in such securities or by an independent pricing service, which considers the yield or price of bonds of comparable quality, coupon, maturity, and type, as well as prices quoted by dealers who make markets in such securities. Securities with remaining maturities of less than one year at the time of acquisition generally use amortized cost in local currency to approximate fair value. However, if amortized cost is deemed not to reflect fair value or the fund holds a significant amount of such securities with remaining maturities of more than 60 days, the securities are valued at prices furnished by dealers who make markets in such securities or by an independent pricing service.
Investments in mutual funds are valued at the mutual fund’s closing net asset value per share on the day of valuation. Financial futures contracts are valued at closing settlement prices. Swaps are valued at net present value of the contract as furnished by counterparties or by an independent pricing service.
Other investments, including restricted securities, and those for which the above valuation procedures are inappropriate or are deemed not to reflect fair value are stated at fair value as determined in good faith by the T. Rowe Price Valuation Committee, established by the fund’s Board of Directors.
For valuation purposes, the last quoted prices of non-U.S. equity securities may be adjusted under the circumstances described below. If the fund determines that developments between the close of a foreign market and the close of the NYSE will, in its judgment, materially affect the value of some or all of its portfolio securities, the fund will adjust the previous closing prices to reflect what it believes to be the fair value of the securities as of the close of the NYSE. In deciding whether it is necessary to adjust closing prices to reflect fair value, the fund reviews a variety of factors, including developments in foreign markets, the performance of U.S. securities markets, and the performance of instruments trading in U.S. markets that represent foreign securities and baskets of foreign securities. A fund may also fair value securities in other situations, such as when a particular foreign market is closed but the fund is open. The fund uses outside pricing services to provide it with closing prices and information to evaluate and/or adjust those prices. The fund cannot predict how often it will use closing prices and how often it will determine it necessary to adjust those prices to reflect fair value. As a means of evaluating its security valuation process, the fund routinely compares closing prices, the next day’s opening prices in the same markets, and adjusted prices.
Valuation Inputs Various inputs are used to determine the value of the fund’s investments. These inputs are summarized in the three broad levels listed below:
Level 1 – quoted prices in active markets for identical securities
Level 2 – observable inputs other than Level 1 quoted prices (including, but not limited to, quoted prices for similar securities, interest rates, prepayment speeds, credit risk)
Level 3 – unobservable inputs
Observable inputs are those based on market data obtained from sources independent of the fund, and unobservable inputs reflect the fund’s own assumptions based on the best information available. The input levels are not necessarily an indication of the risk or liquidity associated with investments at that level. For example, non-U.S. equity securities actively traded in foreign markets generally are reflected in Level 2 despite the availability of closing prices, because the fund evaluates and determines whether those closing prices reflect fair value at the close of the NYSE or require adjustment, as described above. The following table summarizes the fund’s investments, based on the inputs used to determine their values on June 30, 2008:

NOTE 3 - INVESTMENT TRANSACTIONS
Consistent with its investment objective, the fund engages in the following practices to manage exposure to certain risks or to enhance performance. The investment objective, policies, program, and risk factors of the fund are described more fully in the fund’s prospectus and Statement of Additional Information.
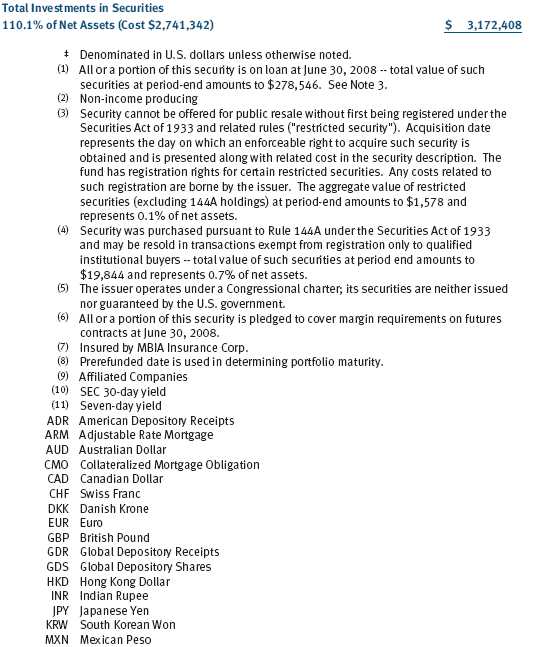
Restricted Securities The fund may invest in securities that are subject to legal or contractual restrictions on resale. Prompt sale of such securities at an acceptable price may be difficult and may involve substantial delays and additional costs.
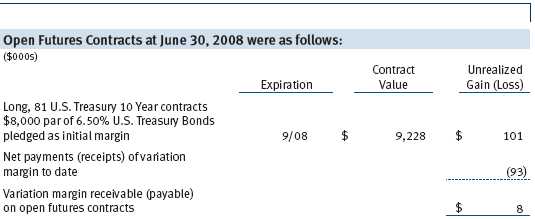
Futures Contracts During the six months ended June 30, 2008, the fund was a party to futures contracts, which provide for the future sale by one party and purchase by another of a specified amount of a specific financial instrument at an agreed upon price, date, time, and place. Risks arise from possible illiquidity of the futures market and from movements in security values and/or interest rates.
Swaps During the six months ended June 30, 2008, the fund was a party to credit default swaps under which it buys or sells credit protection against a defined-issuer credit event. Upon a defined-issuer credit event, the fund is required to either deliver the notional amount of the contract in cash and take delivery of the relevant credit or deliver cash approximately equal to the notional amount of the contract less market value of the relevant credit at the time of the credit event. Risks arise from the possible inability of counterparties to meet the terms of their agreements and from changes in creditworthiness of the relevant underlying issuer. In order to mitigate counterparty risk and subject to specific contractual arrangements, the fund may receive cash and eligible security collateral from such counterparties upon unrealized gain amounts reaching certain thresholds. Eligible security collateral generally includes debt securities issued by the U.S. government or related agencies. At June 30, 2008, no such collateral was received.
Repurchase Agreements All repurchase agreements are fully collateralized by U.S. government securities or AAA-rated asset-backed securities. Collateral is in the possession of the fund’s custodian or, for tri-party agreements, the custodian designated by the agreement. Collateral is evaluated daily to ensure that its market value exceeds the delivery value of the repurchase agreements at maturity. Although risk is mitigated by the collateral, the fund could experience a delay in recovering its value and a possible loss of income or value if the counter-party fails to perform in accordance with the terms of the agreement.
TBA Purchase Commitments During the six months ended June 30, 2008, the fund entered into to be announced (TBA) purchase commitments, pursuant to which it agrees to purchase mortgage-backed securities for a fixed unit price, with payment and delivery at a scheduled future date beyond the customary settlement period for that security. With TBA transactions, the particular securities to be delivered are not identified at the trade date; however, delivered securities must meet specified terms, including issuer, rate, and mortgage term, and be within industry-accepted “good delivery” standards. The fund generally enters into TBAs with the intention of taking possession of the underlying mortgage securities. Until settlement, the fund maintains cash reserves and liquid assets sufficient to settle its TBAs.
Securities Lending The fund lends its securities to approved brokers to earn additional income. It receives as collateral cash and U.S. government securities valued at 102% to 105% of the value of the securities on loan. Cash collateral is invested by the fund’s lending agent(s) in accordance with investment guidelines approved by fund management. Although risk is mitigated by the collateral, the fund could experience a delay in recovering its securities and a possible loss of income or value if the borrower fails to return the securities or if collateral investments decline in value. Securities lending revenue recognized by the fund consists of earnings on invested collateral and borrowing fees, net of any rebates to the borrower and compensation to the lending agent. On June 30, 2008, the value of loaned securities was $278,546,000; aggregate collateral received included U.S. government securities valued at $11,541,000.
Other Purchases and sales of portfolio securities, other than short-term and U.S. government securities, aggregated $547,272,000 and $537,349,000, respectively, for the six months ended June 30, 2008. Purchases and sales of U.S. government securities aggregated $251,214,000 and $327,225,000, respectively, for the six months ended June 30, 2008.
NOTE 4 - FEDERAL INCOME TAXES
No provision for federal income taxes is required since the fund intends to continue to qualify as a regulated investment company under Subchapter M of the Internal Revenue Code and distribute to shareholders all of its taxable income and gains. Distributions are determined in accordance with Federal income tax regulations, which differ from generally accepted accounting principles, and, therefore, may differ in amount or character from net investment income and realized gains for financial reporting purposes. Financial reporting records are adjusted for permanent book/tax differences to reflect tax character but are not adjusted for temporary differences. The amount and character of tax-basis distributions and composition of net assets are finalized at fiscal year-end; accordingly, tax-basis balances have not been determined as of June 30, 2008.
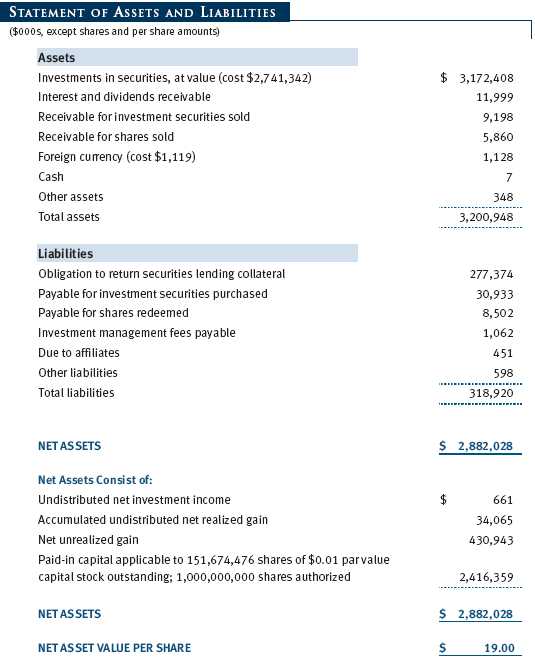
At June 30, 2008, the cost of investments for federal income tax purposes was $2,741,342,000. Net unrealized gain aggregated $430,943,000 at period-end, of which $594,499,000 related to appreciated investments and $163,556,000 related to depreciated investments.
NOTE 5 - RELATED PARTY TRANSACTIONS
The fund is managed by T. Rowe Price Associates, Inc. (the manager or Price Associates), a wholly owned subsidiary of T. Rowe Price Group, Inc. The investment management agreement between the fund and the manager provides for an annual investment management fee, which is computed daily and paid monthly. The fee consists of an individual fund fee, equal to 0.15% of the fund’s average daily net assets, and a group fee. The group fee rate is calculated based on the combined net assets of certain mutual funds sponsored by Price Associates (the group) applied to a graduated fee schedule, with rates ranging from 0.48% for the first $1 billion of assets to 0.285% for assets in excess of $220 billion. The fund’s group fee is determined by applying the group fee rate to the fund’s average daily net assets. At June 30, 2008, the effective annual group fee rate was 0.30%.
In addition, the fund has entered into service agreements with Price Associates and two wholly owned subsidiaries of Price Associates (collectively, Price). Price Associates computes the daily share price and provides certain other administrative services to the fund. T. Rowe Price Services, Inc., provides shareholder and administrative services in its capacity as the fund’s transfer and dividend disbursing agent. T. Rowe Price Retirement Plan Services, Inc., provides subaccounting and recordkeeping services for certain retirement accounts invested in the fund. For the six months ended June 30, 2008, expenses incurred pursuant to these service agreements were $104,000 for Price Associates, $481,000 for T. Rowe Price Services, Inc., and $1,736,000 for T. Rowe Price Retirement Plan Services, Inc. The total amount payable at period-end pursuant to these service agreements is reflected as Due to Affiliates in the accompanying financial statements.
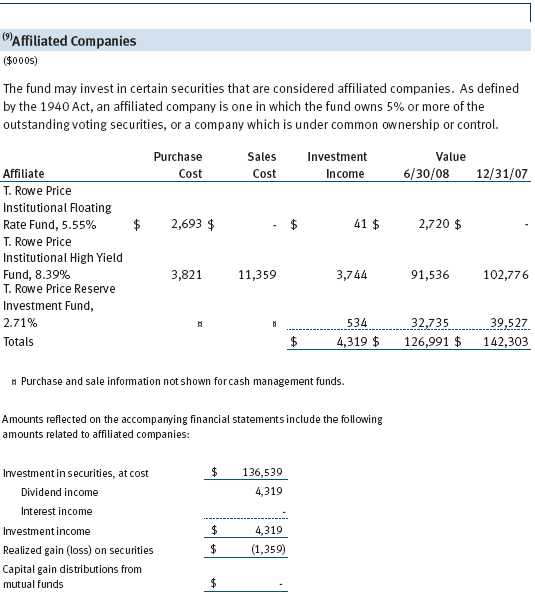
The fund may invest in the T. Rowe Price Reserve Investment Fund and the T. Rowe Price Government Reserve Investment Fund (collectively, the T. Rowe Price Reserve Investment Funds), open-end management investment companies managed by Price Associates and considered affiliates of the fund. The T. Rowe Price Reserve Investment Funds are offered as cash management options to mutual funds, trusts, and other accounts managed by Price Associates and/or its affiliates and are not available for direct purchase by members of the public. The T. Rowe Price Reserve Investment Funds pay no investment management fees.
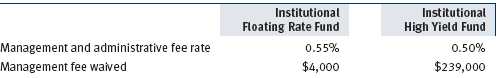
The fund may also invest in certain T. Rowe Price institutional funds (underlying institutional funds) as a means of gaining efficient and cost-effective exposure to certain markets. The underlying institutional funds are open-end management investment companies managed by Price Associates and/or T. Rowe Price International, Inc. (collectively, the Price managers) and are considered affiliates of the fund. Each underlying institutional fund pays an all-inclusive management and administrative fee to its Price manager. To ensure that the fund does not incur duplicate fees, each Price manager has agreed to permanently waive a portion of its management fee charged to the fund in an amount sufficient to fully offset the fees paid by the underlying institutional funds related to fund assets invested therein. Accordingly, the accompanying Statement of Operations includes management fees permanently waived pursuant to this agreement. Annual fee rates and amounts waived within the accompanying Statement of Operations related to shares of the underlying institutional funds for the period ended June 30, 2008 are as follows:
| INFORMATION ON PROXY VOTING POLICIES, PROCEDURES, AND RECORDS |
A description of the policies and procedures used by T. Rowe Price funds and portfolios to determine how to vote proxies relating to portfolio securities is available in each fund’s Statement of Additional Information, which you may request by calling 1-800-225-5132 or by accessing the SEC’s Web site, www.sec.gov. The description of our proxy voting policies and procedures is also available on our Web site, www.troweprice.com. To access it, click on the words “Company Info” at the top of our homepage for individual investors. Then, in the window that appears, click on the “Proxy Voting Policy” navigation button in the top left corner.
Each fund’s most recent annual proxy voting record is available on our Web site and through the SEC’s Web site. To access it through our Web site, follow the directions above, then click on the words “Proxy Voting Record” at the bottom of the Proxy Voting Policy page.
| HOW TO OBTAIN QUARTERLY PORTFOLIO HOLDINGS |
The fund files a complete schedule of portfolio holdings with the Securities and Exchange Commission for the first and third quarters of each fiscal year on Form N-Q. The fund’s Form N-Q is available electronically on the SEC’s Web site (www.sec.gov); hard copies may be reviewed and copied at the SEC’s Public Reference Room, 450 Fifth St. N.W., Washington, DC 20549. For more information on the Public Reference Room, call 1-800-SEC-0330.
| APPROVAL OF INVESTMENT MANAGEMENT AGREEMENT |
On March 4, 2008, the fund’s Board of Directors (Board) unanimously approved the investment advisory contract (Contract) between the fund and its investment manager, T. Rowe Price Associates, Inc. (Manager). The Board considered a variety of factors in connection with its review of the Contract, also taking into account information provided by the Manager during the course of the year, as discussed below:
Services Provided by the Manager
The Board considered the nature, quality, and extent of the services provided to the fund by the Manager. These services included, but were not limited to, management of the fund’s portfolio and a variety of related activities, as well as financial and administrative services, reporting, and communications. The Board also reviewed the background and experience of the Manager’s senior management team and investment personnel involved in the management of the fund. The Board concluded that it was satisfied with the nature, quality, and extent of the services provided by the Manager.
Investment Performance of the Fund
The Board reviewed the fund’s average annual total returns over the 1-, 3-, 5-, and 10-year periods as well as the fund’s year-by-year returns and compared these returns with previously agreed upon comparable performance measures and market data, including those supplied by Lipper and Morningstar, which are independent providers of mutual fund data. On the basis of this evaluation and the Board’s ongoing review of investment results, the Board concluded that the fund’s performance was satisfactory.
Costs, Benefits, Profits, and Economies of Scale
The Board reviewed detailed information regarding the revenues received by the Manager under the Contract and other benefits that the Manager (and its affiliates) may have realized from its relationship with the fund, including research received under “soft dollar” agreements. The Board noted that soft dollars were not used to pay for third-party, non-broker research. The Board also received information on the estimated costs incurred and profits realized by the Manager and its affiliates from advising T. Rowe Price mutual funds, as well as estimates of the gross profits realized from managing the fund in particular. The Board concluded that the Manager’s profits were reasonable in light of the services provided to the fund. The Board also considered whether the fund or other funds benefit under the fee levels set forth in the Contract from any economies of scale realized by the Manager. Under the Contract, the fund pays a fee to the Manager composed of two components—a group fee rate based on the aggregate assets of certain T. Rowe Price mutual funds (including the fund) that declines at certain asset levels and an individual fund fee rate that is assessed on the assets of the fund. The Board concluded that the advisory fee structure for the fund continued to provide for a reasonable sharing of benefits from any economies of scale with the fund’s investors.
Fees
The Board reviewed the fund’s management fee rate, operating expenses, and total expense ratio and compared them with fees and expenses of other comparable funds based on information and data supplied by Lipper. The information provided to the Board indicated that the fund’s management fee rate was above the median for certain groups of comparable funds but at or below the median for other groups of comparable funds. The information also indicated that the fund’s expense ratio was above the median for certain groups of comparable funds but below the median for other groups of comparable funds. The Board also reviewed the fee schedules for comparable privately managed accounts of the Manager and its affiliates. Management informed the Board that the Manager’s responsibilities for privately managed accounts are more limited than its responsibilities for the fund and other T. Rowe Price mutual funds that it or its affiliates advise. On the basis of the information provided, the Board concluded that the fees paid by the fund under the Contract were reasonable.
Approval of the Contract
As noted, the Board approved the continuation of the Contract. No single factor was considered in isolation or to be determinative to the decision. Rather, the Board concluded, in light of a weighting and balancing of all factors considered, that it was in the best interests of the fund to approve the continuation of the Contract, including the fees to be charged for services thereunder.
Item 2. Code of Ethics.
A code of ethics, as defined in Item 2 of Form N-CSR, applicable to its principal executive officer, principal financial officer, principal accounting officer or controller, or persons performing similar functions is filed as an exhibit to the registrant’s annual Form N-CSR. No substantive amendments were approved or waivers were granted to this code of ethics during the registrant’s most recent fiscal half-year.
Item 3. Audit Committee Financial Expert.
Disclosure required in registrant’s annual Form N-CSR.
Item 4. Principal Accountant Fees and Services.
Disclosure required in registrant’s annual Form N-CSR.
Item 5. Audit Committee of Listed Registrants.
Not applicable.
Item 6. Investments.
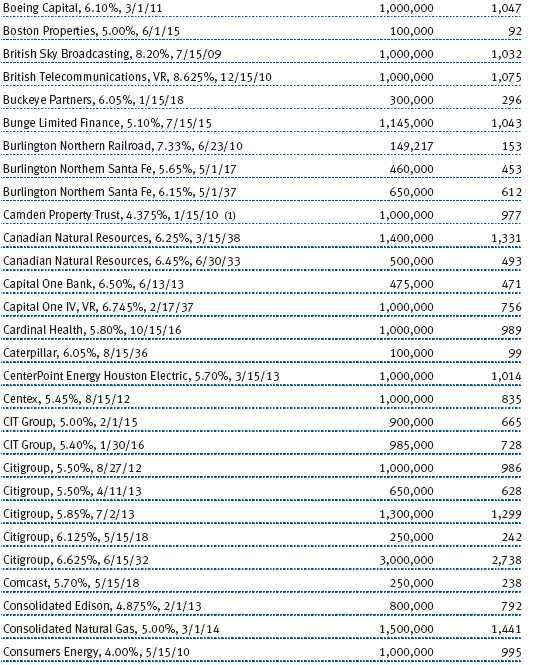
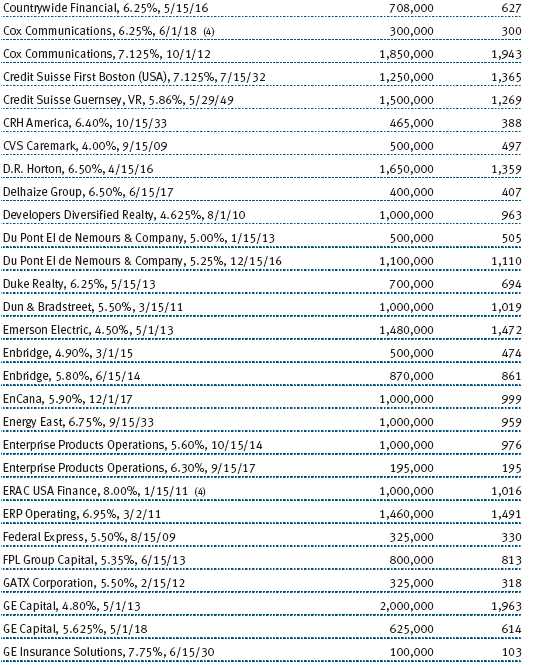
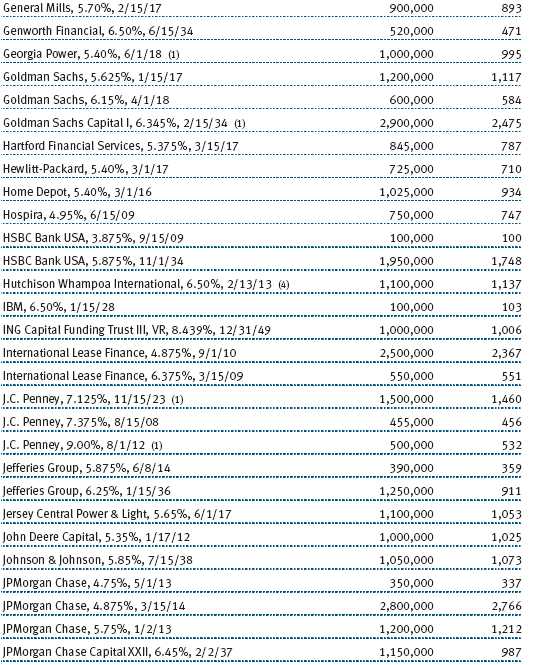
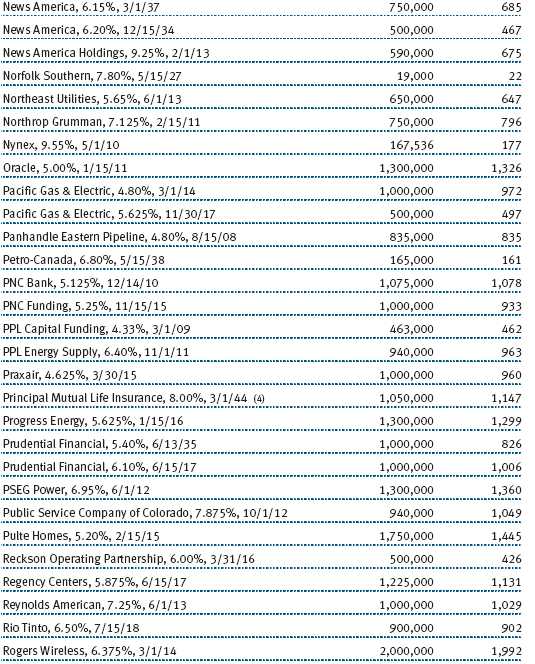
(a) Not applicable. The complete schedule of investments is included in Item 1 of this Form N-CSR.
(b) Not applicable.
Item 7. Disclosure of Proxy Voting Policies and Procedures for Closed-End Management Investment Companies.
Not applicable.
Item 8. Portfolio Managers of Closed-End Management Investment Companies.
Not applicable.
Item 9. Purchases of Equity Securities by Closed-End Management Investment Company and Affiliated Purchasers.
Not applicable.
Item 10. Submission of Matters to a Vote of Security Holders.
Not applicable.
Item 11. Controls and Procedures.
(a) The registrant’s principal executive officer and principal financial officer have evaluated the registrant’s disclosure controls and procedures within 90 days of this filing and have concluded that the registrant’s disclosure controls and procedures were effective, as of that date, in ensuring that information required to be disclosed by the registrant in this Form N-CSR was recorded, processed, summarized, and reported timely.
(b) The registrant’s principal executive officer and principal financial officer are aware of no change in the registrant’s internal control over financial reporting that occurred during the registrant’s second fiscal quarter covered by this report that has materially affected, or is reasonably likely to materially affect, the registrant’s internal control over financial reporting.
Item 12. Exhibits.
(a)(1) The registrant’s code of ethics pursuant to Item 2 of Form N-CSR is filed with the registrant’s annual Form N-CSR.
(2) Separate certifications by the registrant's principal executive officer and principal financial officer, pursuant to Section 302 of the Sarbanes-Oxley Act of 2002 and required by Rule 30a-2(a) under the Investment Company Act of 1940, are attached.
(3) Written solicitation to repurchase securities issued by closed-end companies: not applicable.
(b) A certification by the registrant's principal executive officer and principal financial officer, pursuant to Section 906 of the Sarbanes-Oxley Act of 2002 and required by Rule 30a-2(b) under the Investment Company Act of 1940, is attached.
SIGNATURES | |
| Pursuant to the requirements of the Securities Exchange Act of 1934 and the Investment | |
| Company Act of 1940, the registrant has duly caused this report to be signed on its behalf by the | |
| undersigned, thereunto duly authorized. | |
| T. Rowe Price Balanced Fund, Inc. | |
| By | /s/ Edward C. Bernard |
| Edward C. Bernard | |
| Principal Executive Officer | |
| Date | August 20, 2008 |
| Pursuant to the requirements of the Securities Exchange Act of 1934 and the Investment | |
| Company Act of 1940, this report has been signed below by the following persons on behalf of | |
| the registrant and in the capacities and on the dates indicated. | |
| By | /s/ Edward C. Bernard |
| Edward C. Bernard | |
| Principal Executive Officer | |
| Date | August 20, 2008 |
| By | /s/ Gregory K. Hinkle |
| Gregory K. Hinkle | |
| Principal Financial Officer | |
| Date | August 20, 2008 |