UNITED STATES
SECURITIES AND EXCHANGE COMMISSION
Washington, D.C. 20549
FORM N-CSR
CERTIFIED SHAREHOLDER REPORT OF REGISTERED
MANAGEMENT INVESTMENT COMPANIES
Investment Company Act File Number: 811-06275
| T. Rowe Price Balanced Fund, Inc. |
|
| (Exact name of registrant as specified in charter) |
| |
| 100 East Pratt Street, Baltimore, MD 21202 |
|
| (Address of principal executive offices) |
| |
| David Oestreicher |
| 100 East Pratt Street, Baltimore, MD 21202 |
|
| (Name and address of agent for service) |
Registrant’s telephone number, including area code: (410) 345-2000
Date of fiscal year end: December 31
Date of reporting period: December 31, 2014
Item 1. Report to Shareholders
| Balanced Fund | December 31, 2014 |
The views and opinions in this report were current as of December 31, 2014. They are not guarantees of performance or investment results and should not be taken as investment advice. Investment decisions reflect a variety of factors, and the managers reserve the right to change their views about individual stocks, sectors, and the markets at any time. As a result, the views expressed should not be relied upon as a forecast of the fund’s future investment intent. The report is certified under the Sarbanes-Oxley Act, which requires mutual funds and other public companies to affirm that, to the best of their knowledge, the information in their financial reports is fairly and accurately stated in all material respects.
REPORTS ON THE WEB
Sign up for our E-mail Program, and you can begin to receive updated fund reports and prospectuses online rather than through the mail. Log in to your account at troweprice.com for more information.
Manager’s Letter
Fellow Shareholders
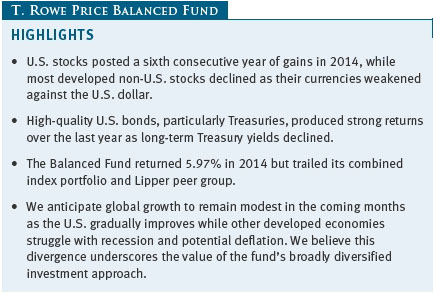
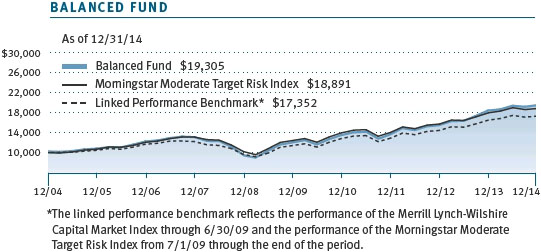
U.S. stocks posted a sixth consecutive year of gains in 2014. Major equities indexes closed near record levels as the economy strengthened, employment improved, and profits continued to expand in the second half of the year. Stocks in developed non-U.S. markets declined, although several developed Asian markets generated solid gains. Stocks in Japan lost ground in dollar terms as the country fell into recession. U.S. investment-grade bonds, particularly Treasuries, produced strong returns. The Balanced Fund advanced for its fiscal year but trailed its combined index portfolio and Lipper peer group.
PERFORMANCE REVIEW
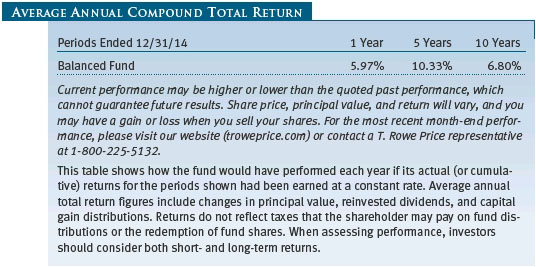
The Balanced Fund returned 0.65% and 5.97% for the 6- and 12-month periods ended December 31, 2014, respectively. As shown in the Performance Comparison table, the fund underperformed the combined index portfolio and peer group, the Lipper Balanced Funds Index, for both periods. The combined index portfolio is a custom benchmark that comprises multiple indexes representing the asset classes in which the fund invests.

Security selection, particularly within the U.S. large-cap growth and non-U.S. equity portfolios, was the largest detractor from relative performance. Security selection within the U.S. investment-grade bond portfolio also detracted as the asset class underperformed its style-specific benchmark. However, security selection within our U.S. large-cap value and real assets portfolios contributed to relative performance. Exposure to diversifying sectors not represented in the benchmark, particularly to real assets and high yield bonds, detracted from relative performance. Tactical allocations also detracted from relative performance, notably an overweight to non-U.S. equities versus U.S. equities. (Please see the Portfolio Review section for more information.)
MARKET ENVIRONMENT
U.S. equities rose as the economy rebounded from a first-quarter weather-related contraction. Falling long-term interest rates since the end of 2013—despite the Federal Reserve’s ending of asset purchases—solid employment growth, favorable corporate earnings, and expanded stimulus measures by major non-U.S. central banks were also supportive. Stagnant global growth, heightened geopolitical tensions surrounding sanctions against Russia for its actions in Ukraine, and unrest in the Middle East periodically weighed on stock prices, as did concerns that the Fed would begin raising short-term interest rates midyear. However, expectations that the European Central Bank (ECB) would start buying sovereign debt, as well as aggressive monetary easing in Japan, boosted investor sentiment. The plunge in oil prices from early-summer highs, while a positive factor for consumers and businesses, as well as major oil-importing nations that can benefit from lower energy costs, weighed on the energy sector. The U.S. remains a net importer of oil and petroleum products, and, in the near term, lower energy costs could help boost U.S. consumer and business spending and provide relief to major oil-importing nations.
Many stocks in developed non-U.S. markets declined. Developed Asian markets held up best. In Japan, stocks fell as the economy entered a recession following an April sales tax increase that caused consumers to significantly curtail spending. In response, the government and central bank expanded their stimulus measures. European markets declined overall as eurozone economies struggled with low inflation, high unemployment, and a loss of consumer and business confidence.
High-quality U.S. bonds generated solid returns over the past year. Among investment-grade bonds, long-term Treasuries performed best, benefiting from declining yields due to global economic weakness and geopolitical uncertainties and despite the Fed’s tapering of its asset purchases. High yield bonds trailed investment-grade issues for the year as steeply falling oil prices weighed on the energy sector, the largest segment of the high yield market. Investment-grade corporate bonds advanced as the asset class benefited from falling Treasury yields, strong demand, and tighter credit spreads. Agency mortgage-backed securities produced good returns, overcoming reduced demand from the Fed having ended purchases in October.

ASSET ALLOCATION STRATEGY
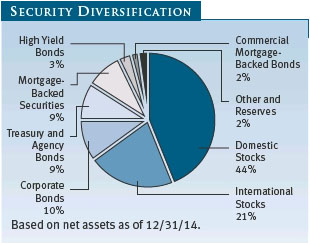
The Balanced Fund seeks to provide capital growth and current income by investing in a combination of U.S. and international stocks and fixed income securities. We currently have 65% of the portfolio allocated to stocks and the remaining 35% to bonds and cash.
Following several years of strong stock market performance, equity valuations have risen to levels that are at or above their historical averages. Within fixed income, the current low-yield environment remains less favorable for bonds, which are vulnerable to rising interest rates, particularly with the first Fed rate hike expected in mid- to late 2015. Other major international economies are in earlier stages of their recovery cycle, and we favor non-U.S. stocks as valuations are more attractive than they are for U.S. equities. The potential for continued central bank easing policies in Europe and Japan, while supportive for growth, could continue to weaken their currencies versus the U.S. dollar and weigh on returns in dollar terms. We also favor growth stocks over value stocks; however, we only have a modestly overweight allocation. While the current low level of economic growth favors growth stocks, which tend to be less reliant than cyclical companies on a strong economy to support rising earnings, a gradually improving economy has prompted us to moderate our commitment to growth stocks relative to value.
We remain underweight to real assets, such as real estate, energy, and natural resources, as well as metals, versus other global equity sectors, as the prospects for muted global economic growth are likely to continue weighing on energy and materials prices, especially with increased global energy production capacity and the impact of drilling technology improving supply. Demand for commodities is expected to remain subdued as China continues to deemphasize industrial production and exports in favor of domestic consumption. Real interest rates remain at low levels; rising real rates have historically been less favorable for real assets-related equities. Although fundamentals for real estate investment trusts (REITs) are favorable, valuations remain rich, and the sector is susceptible to shifts in interest rates.
After reducing our overweight to high yield bonds over the course of the year, we slightly increased our allocation at the end of the period relative to investment-grade bonds as recent underperformance has provided an opportunity to take advantage of higher yields and better prices. High yield bonds remain attractive relative to other sectors in this low-yield environment, particularly given prospects for a slowly improving economy and the low default rate environment. However, we continue to monitor the impact of declining energy prices on the creditworthiness of energy- and commodity-related issuers, which represent a significant portion of the high yield market. We believe the combination of a yield advantage and lower-duration profile can help make high yield bonds less sensitive to rising interest rates than higher-quality bonds with similar or extended maturities.
PORTFOLIO REVIEW
U.S. Stocks
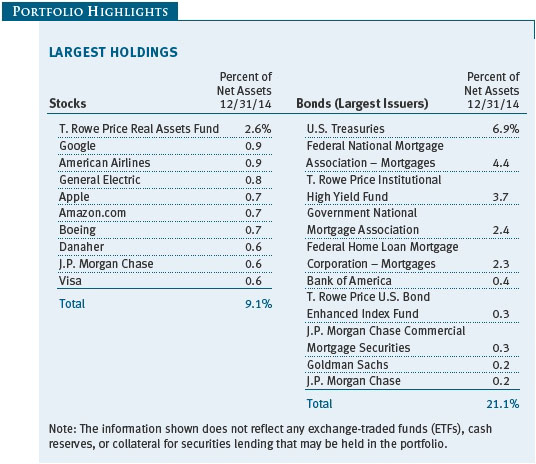
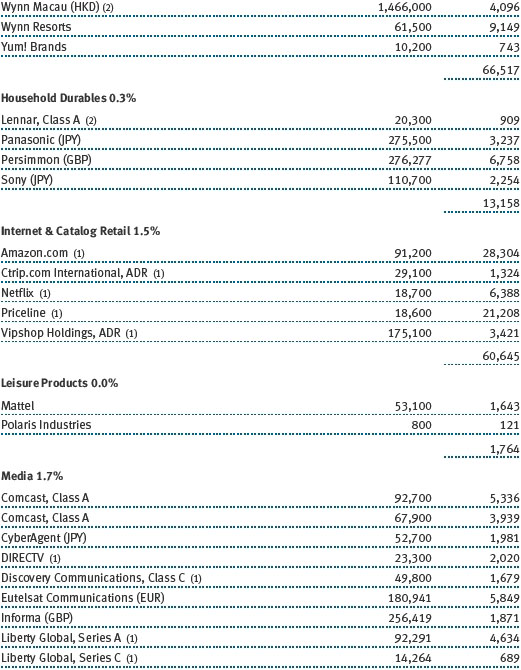
Overall, our domestic stock allocation generated a solid return but underperformed its asset class benchmark. Our large-cap growth portfolio also produced a good return but underperformed its style-specific benchmark. However, our large-cap value portfolio produced a very strong return and outpaced its style-specific benchmark. Online retailer Amazon.com, one of our biggest holdings, detracted from performance as the firm reported losses of more than $400 million in the third quarter of 2014 (versus about a $40 million loss a year earlier) and contended with lackluster sales of its Fire Phone launched in June. However, the firm also recorded accelerated revenue growth driven by a dramatically larger Amazon Prime membership base, as well as a substantial increase in operating cash flow. Wynn Resorts, a high-end luxury owner and operator of casinos in Las Vegas and Macau, was also a performance detractor over the period as sales declined in the third quarter, primarily due to weakness in its Macau operations, which account for a majority of its revenue. Oil and gas producer Apache fell after its chief financial officer resigned. (Please refer to the portfolio of investments for a complete list of holdings and the amount each represents in the portfolio.)
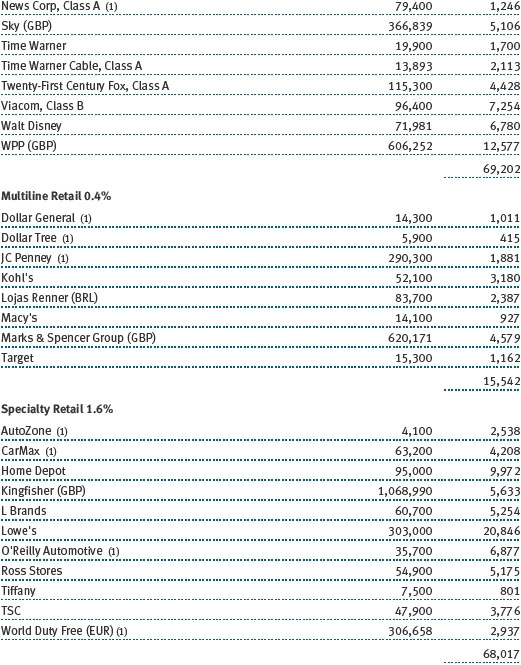
American Airlines, among the world’s largest commercial airlines, was our top contributor as investors anticipated operational benefits from the integration of US Airways following their merger and additional cost savings from falling oil and jet fuel prices. Apple was a particularly robust contributor due to strong demand for its devices, particularly for the latest iPhone. Biotechnology firm Gilead Sciences generated strong returns and contributed to performance as a result of its groundbreaking—and extremely expensive—hepatitis C drug, Sovaldi, which the Food and Drug Administration (FDA) approved in December 2013. In October, the FDA approved its latest hepatitis C drug, Harvoni, which was expected to generate significant immediate sales. U.S. home improvement retailer Lowe’s gained during the second half of the year amid favorable growth, housing, and employment trends and as consumers benefited from lower fuel prices and interest rates heading into the holiday season.
International Stocks
Our non-U.S. stock allocation declined for the year and underperformed the asset class benchmark. Most developed non-U.S. markets fell in 2014, though most developed Asian markets advanced. UK mobile telecommunications company Vodafone detracted from performance due to economic weakness in Europe, regulatory concerns, and price reductions. UK grocer Tesco continued its steady decline that began in February 2014 amid falling sales, steepening competition, revelations of longtime accounting irregularities, and other problems. Standard Chartered, a UK-based multinational bank, fell sharply as its profits declined due in part to increasing costs and nonperforming loans.
Singapore-based chipmaker Avago Technologies was a large performance contributor, and its shares rose in the second half of the year on strong profits and revenue. Chinese Internet powerhouse Baidu recovered from some weakness in early 2014 and gained as a result of strong revenue growth and a promising outlook for wider profit margins. The company has experienced significant increases in revenue from mobile computing, and we expect ongoing margin expansion to gain in 2015. We participated in the initial public offering of Alibaba Group, a leading Chinese online services and e-commerce provider. Its Taobao subsidiary accounts for the majority of consumer-to-consumer sales in China. Alibaba also has very advanced data services operations (similar to the Amazon Web Service platform) that support various entities, including the Chinese government.
Domestic Bonds
Our fixed income portfolio delivered solid absolute returns but underperformed the Barclays U.S. Aggregate Bond Index. The yield on the 10-year Treasury ended the year at 2.17%—down from 3.04% at the end of 2013. Our exposure to high yield bonds, a diversifying sector not represented in the benchmark, detracted from performance because they underperformed the fixed income benchmark. The portfolio’s investment-grade bonds also generated a solid absolute return, but they also lagged the portfolio benchmark.
OUTLOOK
We believe that global growth over the next several quarters will remain modest. In the U.S., diminishing fiscal headwinds, expanding private sector demand, and moderate job growth could support gradual economic improvement. We expect corporate capital expenditures to continue to progress, with gross domestic product growth close to 3.0% for 2015. With U.S. corporate balance sheets and profit margins healthy and revenue growth in the low- to mid-single digits consistent with modest economic growth, we expect earnings growth to trend toward the mid-single digits over the coming quarters, although a stronger dollar presents a headwind to earnings for U.S. multinationals. While lower energy prices support consumer spending, they are likely to weigh on energy sector earnings growth and balance sheets.
In contrast, European growth has softened amid concerns over deflation, and the region remains hindered by high debt loads and high unemployment. We expect ongoing accommodative monetary policies from the ECB and the Bank of Japan to be along the lines of the large increase in securities purchases that the Japanese central bank announced toward the end of the reporting period, which should help spur growth and inflation. These actions are likely to stand in contrast with steps toward policy normalization that the Fed and the Bank of England are likely to implement sometime in 2015. This divergence in monetary policy could also put continued pressure on the euro and the yen relative to the U.S. dollar, which would weigh on eurozone and Japanese stock and bond returns in dollar terms.
Rising interest rates and a stronger dollar are not expected to derail the U.S. recovery; however, Europe and Japan continue to face head-winds. Against a backdrop of a divergent global growth environment, we believe the Balanced Fund’s diversification and investment strategy, combined with prudent security selection, can enhance our ability to produce good long-term returns.
Thank you for investing with T. Rowe Price.
Respectfully submitted,

Charles M. Shriver
Chairman of the fund’s Investment Advisory Committee
January 15, 2015
The committee chairman has day-to-day responsibility for managing the portfolio and works with committee members in developing and executing the fund’s investment program.
RISKS OF INVESTING IN STOCKS
As with all stock mutual funds, the fund’s share price can fall because of weakness in the stock market, a particular industry, or specific holdings. Stock markets can decline for many reasons, including adverse political or economic developments, changes in investor psychology, or heavy institutional selling. The prospects for an industry or company may deteriorate because of a variety of factors, including disappointing earnings or changes in the competitive environment. In addition, the investment manager’s assessment of companies held in a fund may prove incorrect, resulting in losses or poor performance even in rising markets.
RISKS OF INTERNATIONAL INVESTING
Funds that invest overseas generally carry more risk than funds that invest strictly in U.S. assets. Risks can result from varying stages of economic and political development; differing regulatory environments, trading days, and accounting standards; currency fluctuations; and higher transaction costs of non-U.S. markets. Investments outside the United States could be subject to governmental actions such as capital or currency controls, nationalization of a company or industry, expropriation of assets, or imposition of high taxes.
RISKS OF INVESTING IN BONDS
Funds that invest in bonds are subject to interest rate risk, the decline in bond prices that usually accompanies a rise in interest rates. Longer-maturity bonds typically decline more than those with shorter maturities. Funds that invest in bonds are also subject to credit risk, the chance that any fund holding could have its credit rating downgraded or that a bond issuer will default (fail to make timely payments of interest or principal), potentially reducing the fund’s income level and share price.
GLOSSARY
Barclays U.S. Aggregate Bond Index: An unmanaged index that tracks domestic investment-grade bonds, including corporate, government, and mortgage-backed securities.
Combined index portfolio: An unmanaged portfolio of 45.5% domestic stocks (S&P 500 Index), 35% bonds (Barclays U.S. Aggregate Bond Index), and 19.5% international stocks (MSCI EAFE Index).
Credit spreads: The amount of additional yield demanded by bond investors in exchange for buying riskier assets.
Gross domestic product: The total market value of all goods and services produced in a country in a given year.
Lipper indexes: Fund benchmarks that consist of a small number (10 to 30) of the largest mutual funds in a particular category as tracked by Lipper Inc.
Merrill Lynch-Wilshire Capital Market Index: A market capitalization-weighted index including the Wilshire 5000, Merrill Lynch High Yield II, and Domestic Master Indexes. This index was discontinued on June 30, 2009.
MSCI EAFE Index: An index that measures equity market performance of developed countries in the Europe, Australasia, and Far East regions.
Morningstar Moderate Target Risk Index: Represents a portfolio of global equities (fixed at 60%), bonds, and other asset classes.
Real estate investment trusts (REITs): Publicly traded companies that own, develop, and operate apartment complexes, hotels, office buildings, and other commercial properties.
S&P 500 Index: An unmanaged index that tracks the stocks of 500 primarily large-cap U.S. companies.
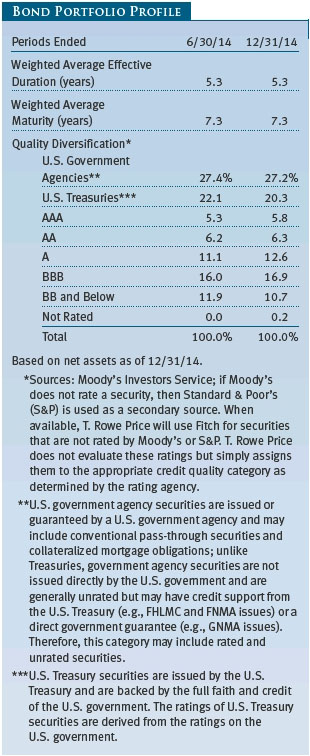
Weighted average effective duration (years): A measure of a security’s price sensitivity to changes in interest rates. Securities with longer durations are more sensitive to changes in interest rates than securities of shorter durations.
Weighted average maturity: A measure of a fund’s interest rate sensitivity. In general, the longer the average maturity, the greater the fund’s sensitivity to interest rate changes. The weighted average maturity may take into account the interest rate readjustment dates for certain securities. Money funds must maintain a weighted average maturity of less than 60 days.
Note: MSCI makes no express or implied warranties or representations and shall have no liability whatsoever with respect to any MSCI data contained herein. The MSCI data may not be further redistributed or used as a basis for other indices or any securities or financial products. This report is not approved, reviewed, or produced by MSCI.
Performance and Expenses
This chart shows the value of a hypothetical $10,000 investment in the fund over the past 10 fiscal year periods or since inception (for funds lacking 10-year records). The result is compared with benchmarks, which may include a broad-based market index and a peer group average or index. Market indexes do not include expenses, which are deducted from fund returns as well as mutual fund averages and indexes.

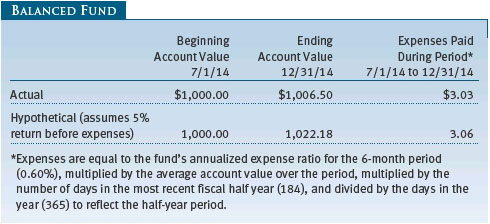
As a mutual fund shareholder, you may incur two types of costs: (1) transaction costs, such as redemption fees or sales loads, and (2) ongoing costs, including management fees, distribution and service (12b-1) fees, and other fund expenses. The following example is intended to help you understand your ongoing costs (in dollars) of investing in the fund and to compare these costs with the ongoing costs of investing in other mutual funds. The example is based on an investment of $1,000 invested at the beginning of the most recent six-month period and held for the entire period.
Actual Expenses
The first line of the following table (Actual) provides information about actual account values and expenses based on the fund’s actual returns. You may use the information on this line, together with your account balance, to estimate the expenses that you paid over the period. Simply divide your account value by $1,000 (for example, an $8,600 account value divided by $1,000 = 8.6), then multiply the result by the number on the first line under the heading “Expenses Paid During Period” to estimate the expenses you paid on your account during this period.
Hypothetical Example for Comparison Purposes
The information on the second line of the table (Hypothetical) is based on hypothetical account values and expenses derived from the fund’s actual expense ratio and an assumed 5% per year rate of return before expenses (not the fund’s actual return). You may compare the ongoing costs of investing in the fund with other funds by contrasting this 5% hypothetical example and the 5% hypothetical examples that appear in the shareholder reports of the other funds. The hypothetical account values and expenses may not be used to estimate the actual ending account balance or expenses you paid for the period.
Note: T. Rowe Price charges an annual account service fee of $20, generally for accounts with less than $10,000. The fee is waived for any investor whose T. Rowe Price mutual fund accounts total $50,000 or more; accounts electing to receive electronic delivery of account statements, transaction confirmations, prospectuses, and shareholder reports; or accounts of an investor who is a T. Rowe Price Preferred Services, Personal Services, or Enhanced Personal Services client (enrollment in these programs generally requires T. Rowe Price assets of at least $100,000). This fee is not included in the accompanying table. If you are subject to the fee, keep it in mind when you are estimating the ongoing expenses of investing in the fund and when comparing the expenses of this fund with other funds.
You should also be aware that the expenses shown in the table highlight only your ongoing costs and do not reflect any transaction costs, such as redemption fees or sales loads. Therefore, the second line of the table is useful in comparing ongoing costs only and will not help you determine the relative total costs of owning different funds. To the extent a fund charges transaction costs, however, the total cost of owning that fund is higher.


The accompanying notes are an integral part of these financial statements.


The accompanying notes are an integral part of these financial statements.

The accompanying notes are an integral part of these financial statements.

The accompanying notes are an integral part of these financial statements.
The accompanying notes are an integral part of these financial statements.
| Notes to Financial Statements |
T. Rowe Price Balanced Fund, Inc. (the fund), is registered under the Investment Company Act of 1940 (the 1940 Act) as a diversified, open-end management investment company. The fund commenced operations on December 31, 1939. The fund seeks to provide capital growth, current income, and preservation of capital through a portfolio of stocks and fixed-income securities.
NOTE 1 - SIGNIFICANT ACCOUNTING POLICIES
Basis of Preparation The fund is an investment company and follows accounting and reporting guidance in the Financial Accounting Standards Board (FASB) Accounting Standards Codification Topic 946 (ASC 946). The accompanying financial statements were prepared in accordance with accounting principles generally accepted in the United States of America (GAAP), including but not limited to ASC 946. GAAP requires the use of estimates made by management. Management believes that estimates and valuations are appropriate; however, actual results may differ from those estimates, and the valuations reflected in the accompanying financial statements may differ from the value ultimately realized upon sale or maturity.
Investment Transactions, Investment Income, and Distributions Income and expenses are recorded on the accrual basis. Premiums and discounts on debt securities are amortized for financial reporting purposes. Paydown gains and losses are recorded as an adjustment to interest income. Inflation adjustments to the principal amount of inflation-indexed bonds are reflected as interest income. Dividends received from mutual fund investments are reflected as dividend income; capital gain distributions are reflected as realized gain/loss. Earnings on investments recognized as partnerships for federal income tax purposes reflect the tax character of such earnings. Dividend income and capital gain distributions are recorded on the ex-dividend date. Income tax-related interest and penalties, if incurred, would be recorded as income tax expense. Investment transactions are accounted for on the trade date. Realized gains and losses are reported on the identified cost basis. Distributions to shareholders are recorded on the ex-dividend date. Distributions from REITs are initially recorded as dividend income and, to the extent such represent a return of capital or capital gain for tax purposes, are reclassified when such information becomes available. Income distributions are declared and paid quarterly. Capital gain distributions, if any, are generally declared and paid by the fund annually.
Currency Translation Assets, including investments, and liabilities denominated in foreign currencies are translated into U.S. dollar values each day at the prevailing exchange rate, using the mean of the bid and asked prices of such currencies against U.S. dollars as quoted by a major bank. Purchases and sales of securities, income, and expenses are translated into U.S. dollars at the prevailing exchange rate on the date of the transaction. The effect of changes in foreign currency exchange rates on realized and unrealized security gains and losses is reflected as a component of security gains and losses.
Rebates Subject to best execution, the fund may direct certain security trades to brokers who have agreed to rebate a portion of the related brokerage commission to the fund in cash. Commission rebates are reflected as realized gain on securities in the accompanying financial statements and totaled $22,000 for the year ended December 31, 2014.
New Accounting Guidance In June 2014, FASB issued Accounting Standards Update (ASU) No. 2014-11, Transfers and Servicing (Topic 860), Repurchase-to-Maturity Transactions, Repurchase Financings, and Disclosures. The ASU changes the accounting for certain repurchase agreements and expands disclosure requirements related to repurchase agreements, securities lending, repurchase-to-maturity and similar transactions. The ASU is effective for interim and annual reporting periods beginning after December 15, 2014. Adoption will have no effect on the fund’s net assets or results of operations.
NOTE 2 - VALUATION
The fund’s financial instruments are valued and its net asset value (NAV) per share is computed at the close of the New York Stock Exchange (NYSE), normally 4 p.m. ET, each day the NYSE is open for business.
Fair Value The fund’s financial instruments are reported at fair value, which GAAP defines as the price that would be received to sell an asset or paid to transfer a liability in an orderly transaction between market participants at the measurement date. The T. Rowe Price Valuation Committee (the Valuation Committee) has been established by the fund’s Board of Directors (the Board) to ensure that financial instruments are appropriately priced at fair value in accordance with GAAP and the 1940 Act. Subject to oversight by the Board, the Valuation Committee develops and oversees pricing-related policies and procedures and approves all fair value determinations. Specifically, the Valuation Committee establishes procedures to value securities; determines pricing techniques, sources, and persons eligible to effect fair value pricing actions; oversees the selection, services, and performance of pricing vendors; oversees valuation-related business continuity practices; and provides guidance on internal controls and valuation-related matters. The Valuation Committee reports to the Board; is chaired by the fund’s treasurer; and has representation from legal, portfolio management and trading, operations, and risk management.
Various valuation techniques and inputs are used to determine the fair value of financial instruments. GAAP establishes the following fair value hierarchy that categorizes the inputs used to measure fair value:
Level 1 – quoted prices (unadjusted) in active markets for identical financial instruments that the fund can access at the reporting date
Level 2 – inputs other than Level 1 quoted prices that are observable, either directly or indirectly (including, but not limited to, quoted prices for similar financial instruments in active markets, quoted prices for identical or similar financial instruments in inactive markets, interest rates and yield curves, implied volatilities, and credit spreads)
Level 3 – unobservable inputs
Observable inputs are developed using market data, such as publicly available information about actual events or transactions, and reflect the assumptions that market participants would use to price the financial instrument. Unobservable inputs are those for which market data are not available and are developed using the best information available about the assumptions that market participants would use to price the financial instrument. GAAP requires valuation techniques to maximize the use of relevant observable inputs and minimize the use of unobservable inputs. When multiple inputs are used to derive fair value, the financial instrument is assigned to the level within the fair value hierarchy based on the lowest-level input that is significant to the fair value of the financial instrument. Input levels are not necessarily an indication of the risk or liquidity associated with financial instruments at that level but rather the degree of judgment used in determining those values.
Valuation Techniques Equity securities listed or regularly traded on a securities exchange or in the over-the-counter (OTC) market are valued at the last quoted sale price or, for certain markets, the official closing price at the time the valuations are made. OTC Bulletin Board securities are valued at the mean of the closing bid and asked prices. A security that is listed or traded on more than one exchange is valued at the quotation on the exchange determined to be the primary market for such security. Listed securities not traded on a particular day are valued at the mean of the closing bid and asked prices for domestic securities and the last quoted sale or closing price for international securities.
For valuation purposes, the last quoted prices of non-U.S. equity securities may be adjusted to reflect the fair value of such securities at the close of the NYSE. If the fund determines that developments between the close of a foreign market and the close of the NYSE will, in its judgment, materially affect the value of some or all of its portfolio securities, the fund will adjust the previous quoted prices to reflect what it believes to be the fair value of the securities as of the close of the NYSE. In deciding whether it is necessary to adjust quoted prices to reflect fair value, the fund reviews a variety of factors, including developments in foreign markets, the performance of U.S. securities markets, and the performance of instruments trading in U.S. markets that represent foreign securities and baskets of foreign securities. The fund may also fair value securities in other situations, such as when a particular foreign market is closed but the fund is open. The fund uses outside pricing services to provide it with quoted prices and information to evaluate or adjust those prices. The fund cannot predict how often it will use quoted prices and how often it will determine it necessary to adjust those prices to reflect fair value. As a means of evaluating its security valuation process, the fund routinely compares quoted prices, the next day’s opening prices in the same markets, and adjusted prices.
Actively traded domestic equity securities generally are categorized in Level 1 of the fair value hierarchy. Non-U.S. equity securities generally are categorized in Level 2 of the fair value hierarchy despite the availability of quoted prices because, as described above, the fund evaluates and determines whether those quoted prices reflect fair value at the close of the NYSE or require adjustment. OTC Bulletin Board securities, certain preferred securities, and equity securities traded in inactive markets generally are categorized in Level 2 of the fair value hierarchy.
Debt securities generally are traded in the OTC market. Securities with remaining maturities of one year or more at the time of acquisition are valued at prices furnished by dealers who make markets in such securities or by an independent pricing service, which considers the yield or price of bonds of comparable quality, coupon, maturity, and type, as well as prices quoted by dealers who make markets in such securities. Generally, debt securities are categorized in Level 2 of the fair value hierarchy; however, to the extent the valuations include significant unobservable inputs, the securities would be categorized in Level 3.
Investments in mutual funds are valued at the mutual fund’s closing NAV per share on the day of valuation and are categorized in Level 1 of the fair value hierarchy. Financial futures contracts are valued at closing settlement prices and are categorized in Level 1 of the fair value hierarchy. Swaps are valued at prices furnished by independent swap dealers or by an independent pricing service and generally are categorized in Level 2 of the fair value hierarchy; however, if unobservable inputs are significant to the valuation, the swap would be categorized in Level 3. Assets and liabilities other than financial instruments, including short-term receivables and payables, are carried at cost, or estimated realizable value, if less, which approximates fair value.
Thinly traded financial instruments and those for which the above valuation procedures are inappropriate or are deemed not to reflect fair value are stated at fair value as determined in good faith by the Valuation Committee. The objective of any fair value pricing determination is to arrive at a price that could reasonably be expected from a current sale. Financial instruments fair valued by the Valuation Committee are primarily private placements, restricted securities, warrants, rights, and other securities that are not publicly traded.
Subject to oversight by the Board, the Valuation Committee regularly makes good faith judgments to establish and adjust the fair valuations of certain securities as events occur and circumstances warrant. For instance, in determining the fair value of an equity investment with limited market activity, such as a private placement or a thinly traded public company stock, the Valuation Committee considers a variety of factors, which may include, but are not limited to, the issuer’s business prospects, its financial standing and performance, recent investment transactions in the issuer, new rounds of financing, negotiated transactions of significant size between other investors in the company, relevant market valuations of peer companies, strategic events affecting the company, market liquidity for the issuer, and general economic conditions and events. In consultation with the investment and pricing teams, the Valuation Committee will determine an appropriate valuation technique based on available information, which may include both observable and unobservable inputs. The Valuation Committee typically will afford greatest weight to actual prices in arm’s length transactions, to the extent they represent orderly transactions between market participants; transaction information can be reliably obtained; and prices are deemed representative of fair value. However, the Valuation Committee may also consider other valuation methods such as market-based valuation multiples; a discount or premium from market value of a similar, freely traded security of the same issuer; or some combination. Fair value determinations are reviewed on a regular basis and updated as information becomes available, including actual purchase and sale transactions of the issue. Because any fair value determination involves a significant amount of judgment, there is a degree of subjectivity inherent in such pricing decisions, and fair value prices determined by the Valuation Committee could differ from those of other market participants. Depending on the relative significance of unobservable inputs, including the valuation technique(s) used, fair valued securities may be categorized in Level 2 or 3 of the fair value hierarchy.
Valuation Inputs The following table summarizes the fund’s financial instruments, based on the inputs used to determine their fair values on December 31, 2014:
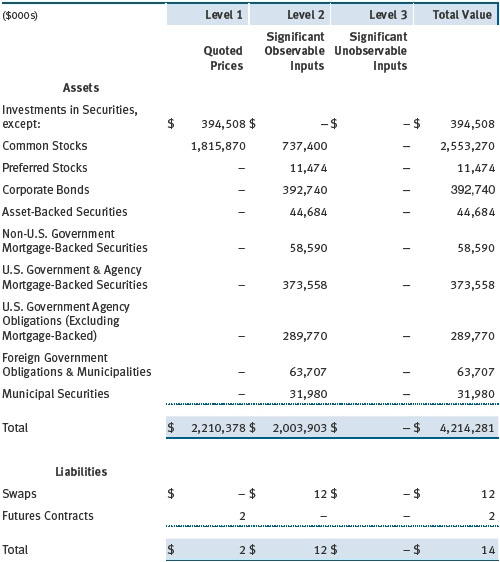
There were no material transfers between Levels 1 and 2 during the year ended December 31, 2014.
NOTE 3 - DERIVATIVE INSTRUMENTS
During the year ended December 31, 2014, the fund invested in derivative instruments. As defined by GAAP, a derivative is a financial instrument whose value is derived from an underlying security price, foreign exchange rate, interest rate, index of prices or rates, or other variable; it requires little or no initial investment and permits or requires net settlement. The fund invests in derivatives only if the expected risks and rewards are consistent with its investment objectives, policies, and overall risk profile, as described in its prospectus and Statement of Additional Information. The fund may use derivatives for a variety of purposes, such as seeking to hedge against declines in principal value, increase yield, invest in an asset with greater efficiency and at a lower cost than is possible through direct investment, or to adjust credit exposure. The risks associated with the use of derivatives are different from, and potentially much greater than, the risks associated with investing directly in the instruments on which the derivatives are based. The fund at all times maintains sufficient cash reserves, liquid assets, or other SEC-permitted asset types to cover its settlement obligations under open derivative contracts.
The fund values its derivatives at fair value, as described in Note 2, and recognizes changes in fair value currently in its results of operations. Accordingly, the fund does not follow hedge accounting, even for derivatives employed as economic hedges. Generally, the fund accounts for its derivatives on a gross basis. It does not offset the fair value of derivative liabilities against the fair value of derivative assets on its financial statements, nor does it offset the fair value of derivative instruments against the right to reclaim or obligation to return collateral.
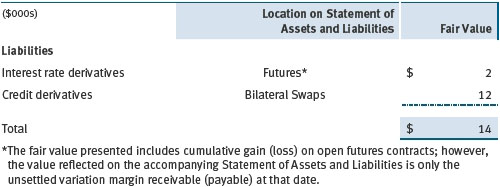
The following table summarizes the fair value of the fund’s derivative instruments held as of December 31, 2014, and the related location on the accompanying Statement of Assets and Liabilities, presented by primary underlying risk exposure:
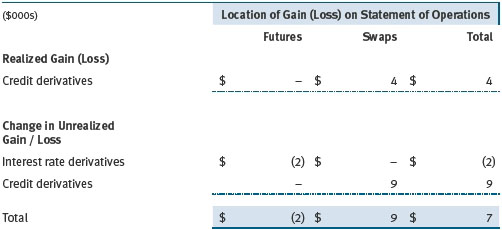
Additionally, the amount of gains and losses on derivative instruments recognized in fund earnings during the year ended December 31, 2014, and the related location on the accompanying Statement of Operations is summarized in the following table by primary underlying risk exposure:
Counterparty Risk and Collateral The fund invests in derivatives in various markets, which expose it to differing levels of counterparty risk. Counterparty risk on exchange-traded and centrally cleared derivative contracts, such as futures, exchange-traded options, and centrally cleared swaps, is minimal because the clearinghouse provides protection against counterparty defaults. For futures and centrally cleared swaps, the fund is required to deposit collateral in an amount equal to a certain percentage of the contract value (margin requirement) and the margin requirement must be maintained over the life of the contract. Each clearing broker, in its sole discretion, may adjust the margin requirements applicable to the fund.
Derivatives, such as bilateral swaps, forward currency exchange contracts, and OTC options, that are transacted and settle directly with a counterparty (bilateral derivatives) expose the fund to greater counterparty risk. To mitigate this risk, the fund has entered into master netting arrangements (MNAs) with certain counterparties that permit net settlement under specified conditions and, for certain counterparties, also provide collateral agreements. MNAs may be in the form of International Swaps and Derivatives Association master agreements (ISDAs) or foreign exchange letter agreements (FX letters).
MNAs govern the ability to offset amounts the fund owes a counterparty against amounts the counterparty owes the fund (net settlement). Both ISDAs and FX letters generally allow net settlement in the event of contract termination and permit termination by either party prior to maturity upon the occurrence of certain stated events, such as failure to pay or bankruptcy. In addition, ISDAs specify other events, the occurrence of which would allow one of the parties to terminate. For example, a downgrade in credit rating of a counterparty would allow the fund to terminate while a decline in the fund’s net assets of more than a certain percentage would allow the counterparty to terminate. Upon termination, all bilateral derivatives with that counterparty would be liquidated and a net amount settled. ISDAs typically include collateral agreements whereas FX letters do not. Collateral requirements are determined based on the net aggregate unrealized gain or loss on all bilateral derivatives with each counterparty, subject to minimum transfer amounts that typically range from $100,000 to $250,000. Any additional collateral required due to changes in security values is transferred the next business day.
Collateral may be in the form of cash or debt securities issued by the U.S. government or related agencies. Cash and currencies posted by the fund are reflected as cash deposits in the accompanying financial statements and generally are restricted from withdrawal by the fund; securities posted by the fund are so noted in the accompanying Portfolio of Investments; both remain in the fund’s assets. Collateral pledged by counterparties is not included in the fund’s assets because the fund does not obtain effective control over those assets. For bilateral derivatives, collateral posted or received by the fund is held in a segregated account by the fund’s custodian. As of December 31, 2014, securities valued at $246,000 had been posted by the fund to counterparties for bilateral derivatives. As of December 31, 2014, no collateral was pledged by counterparties to the fund for bilateral derivatives. As of December 31, 2014, no margin had been posted by the fund for exchange-traded and/or centrally cleared derivatives.
Futures Contracts The fund is subject to interest rate risk and/or equity price risk in the normal course of pursuing its investment objectives and uses futures contracts to help manage such risks. The fund may enter into futures contracts to manage exposure to interest rates, security prices, foreign currencies, and credit quality; as an efficient means of adjusting exposure to all or part of a target market; to enhance income; as a cash management tool; or to adjust credit exposure. A futures contract provides for the future sale by one party and purchase by another of a specified amount of a specific underlying financial instrument at an agreed-upon price, date, time, and place. The fund currently invests only in exchange-traded futures, which generally are standardized as to maturity date, underlying financial instrument, and other contract terms. Payments are made or received by the fund each day to settle daily fluctuations in the value of the contract (variation margin), which reflect changes in the value of the underlying financial instrument. Variation margin is recorded as unrealized gain or loss until the contract is closed. The value of a futures contract included in net assets is the amount of unsettled variation margin; net variation margin receivable is reflected as an asset and net variation margin payable is reflected as a liability on the accompanying Statement of Assets and Liabilities. Risks related to the use of futures contracts include possible illiquidity of the futures markets, contract prices that can be highly volatile and imperfectly correlated to movements in hedged security values and/or interest rates, and potential losses in excess of the fund’s initial investment. During the year ended December 31, 2014, the volume of the fund’s activity in futures, based on underlying notional amounts, was generally less than 1% of net assets.
Swaps The fund is subject to credit risk in the normal course of pursuing its investment objectives and uses swap contracts to help manage such risk. The fund may use swaps in an effort to manage exposure to changes in interest rates, inflation rates, and credit quality; to adjust overall exposure to certain markets; to enhance total return or protect the value of portfolio securities; to serve as a cash management tool; or to adjust credit exposure. Swap agreements can be settled either directly with the counterparty (bilateral swap) or through a central clearinghouse (centrally cleared swap). Fluctuations in the fair value of a contract are reflected in unrealized gain or loss and are reclassified to realized gain or loss upon contract termination or cash settlement. Net periodic receipts or payments required by a contract increase or decrease, respectively, the value of the contract until the contractual payment date, at which time such amounts are reclassified from unrealized to realized gain or loss. For bilateral swaps, cash payments are made or received by the fund on a periodic basis in accordance with contract terms; unrealized gain on contracts and premiums paid are reflected as assets, and unrealized loss on contracts and premiums received are reflected as liabilities on the accompanying Statement of Assets and Liabilities. For centrally cleared swaps, payments are made or received by the fund each day to settle the daily fluctuation in the value of the contract (variation margin). Accordingly, the value of a centrally cleared swap included in net assets is the unsettled variation margin; net variation margin receivable is reflected as an asset and net variation margin payable is reflected as a liability on the accompanying Statement of Assets and Liabilities.
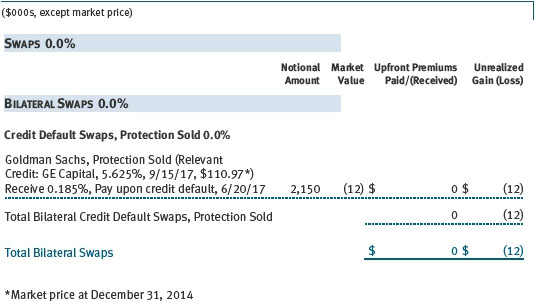
Credit default swaps are agreements where one party (the protection buyer) agrees to make periodic payments to another party (the protection seller) in exchange for protection against specified credit events, such as certain defaults and bankruptcies related to an underlying credit instrument, or issuer or index of such instruments. Upon occurrence of a specified credit event, the protection seller is required to pay the buyer the difference between the notional amount of the swap and the value of the underlying credit, either in the form of a net cash settlement or by paying the gross notional amount and accepting delivery of the relevant underlying credit. For credit default swaps where the underlying credit is an index, a specified credit event may affect all or individual underlying securities included in the index and will be settled based upon the relative weighting of the affected underlying security(s) within the index. Generally, the payment risk for the seller of protection is inversely related to the current market price or credit rating of the underlying credit or the market value of the contract relative to the notional amount, which are indicators of the markets’ valuation of credit quality. As of December 31, 2014, the notional amount of protection sold by the fund totaled $2,150,000 (0.1% of net assets), which reflects the maximum potential amount the fund could be required to pay under such contracts. Risks related to the use of credit default swaps include the possible inability of the fund to accurately assess the current and future creditworthiness of underlying issuers, the possible failure of a counterparty to perform in accordance with the terms of the swap agreements, potential government regulation that could adversely affect the fund’s swap investments, and potential losses in excess of the fund’s initial investment.
During the year ended December 31, 2014, the volume of the fund’s activity in swaps, based on underlying notional amounts, was generally less than 1% of net assets.
NOTE 4 - OTHER INVESTMENT TRANSACTIONS
Consistent with its investment objective, the fund engages in the following practices to manage exposure to certain risks and/or to enhance performance. The investment objective, policies, program, and risk factors of the fund are described more fully in the fund’s prospectus and Statement of Additional Information.
Restricted Securities The fund may invest in securities that are subject to legal or contractual restrictions on resale. Prompt sale of such securities at an acceptable price may be difficult and may involve substantial delays and additional costs.
TBA Purchase and Sale Commitments The fund may enter into to-be-announced (TBA) purchase or sale commitments, pursuant to which it agrees to purchase or sell, respectively, mortgage-backed securities for a fixed unit price, with payment and delivery at a scheduled future date beyond the customary settlement period for such securities. With TBA transactions, the particular securities to be delivered are not identified at the trade date; however, delivered securities must meet specified terms, including issuer, rate, and mortgage term, and be within industry-accepted “good delivery” standards. The fund may enter into TBA purchase transactions with the intention of taking possession of the underlying securities, may elect to extend the settlement by “rolling” the transaction, and/or may use TBAs to gain interim exposure to underlying securities. Until settlement, the fund maintains liquid assets sufficient to settle its TBA commitments.
To mitigate counterparty risk, the fund has entered into agreements with TBA counterparties that provide for collateral and the right to offset amounts due to or from those counterparties under specified conditions. Subject to minimum transfer amounts, collateral requirements are determined and transfers made based on the net aggregate unrealized gain or loss on all TBA commitments with a particular counterparty. At any time, the fund’s risk of loss from a particular counterparty related to its TBA commitments is the aggregate unrealized gain on appreciated TBAs in excess of unrealized loss on depreciated TBAs and collateral received, if any, from such counterparty. As of December 31, 2014, no collateral was pledged by the fund or counterparties for TBAs.
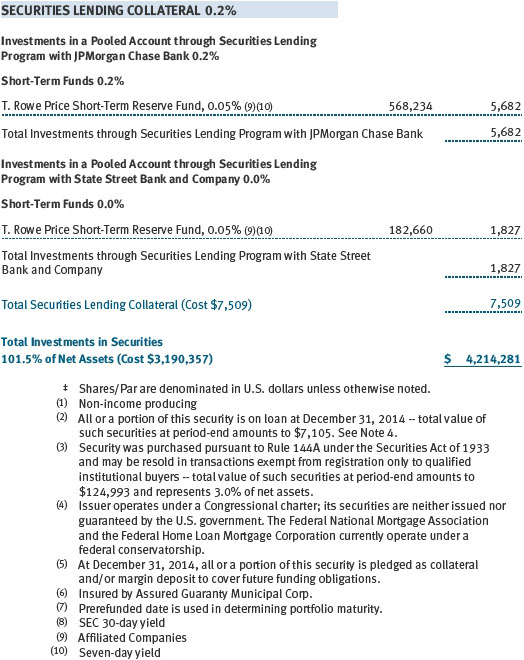
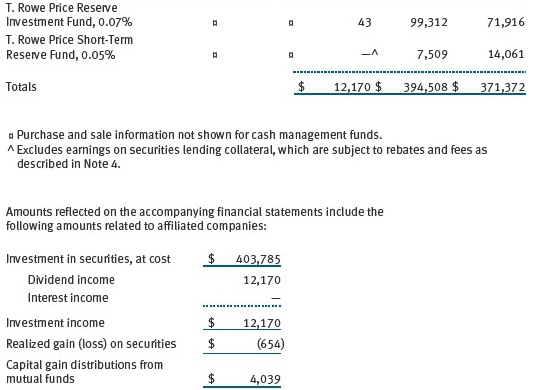
Securities Lending The fund may lend its securities to approved brokers to earn additional income. Its securities lending activities are administered by a lending agent in accordance with a securities lending agreement. Security loans generally do not have stated maturity dates and the fund may recall a security at any time. The fund receives collateral in the form of cash or U.S. government securities, valued at 102% to 105% of the value of the securities on loan. Collateral is maintained over the life of the loan in an amount not less than the value of loaned securities; any additional collateral required due to changes in security values is delivered to the fund the next business day. Cash collateral is invested by the lending agent(s) in accordance with investment guidelines approved by fund management. Additionally, the lending agent indemnifies the fund against losses resulting from borrower default. Although risk is mitigated by the collateral and indemnification, the fund could experience a delay in recovering its securities and a possible loss of income or value if the borrower fails to return the securities, collateral investments decline in value and the lending agent fails to perform. Securities lending revenue consists of earnings on invested collateral and borrowing fees, net of any rebates to the borrower, compensation to the lending agent, and other administrative costs. In accordance with GAAP, investments made with cash collateral are reflected in the accompanying financial statements, but collateral received in the form of securities is not. At December 31, 2014, the value of loaned securities was $7,105,000; the value of cash collateral and related investments was $7,509,000.
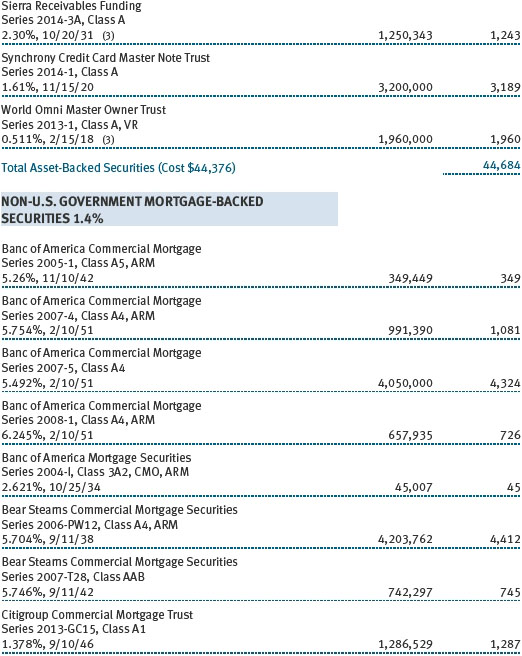
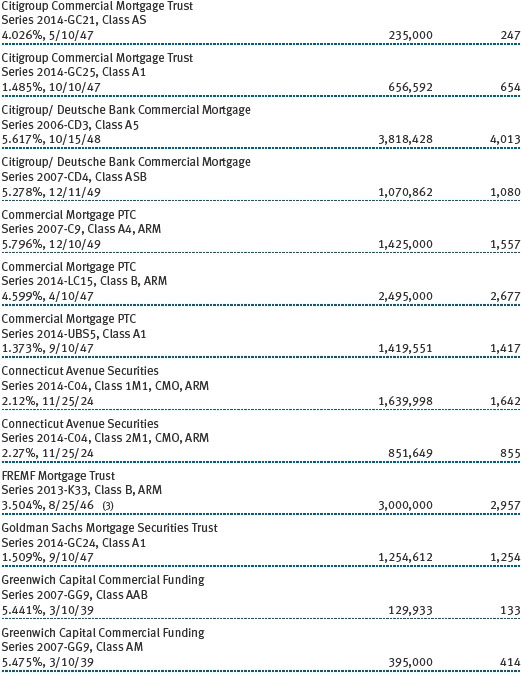
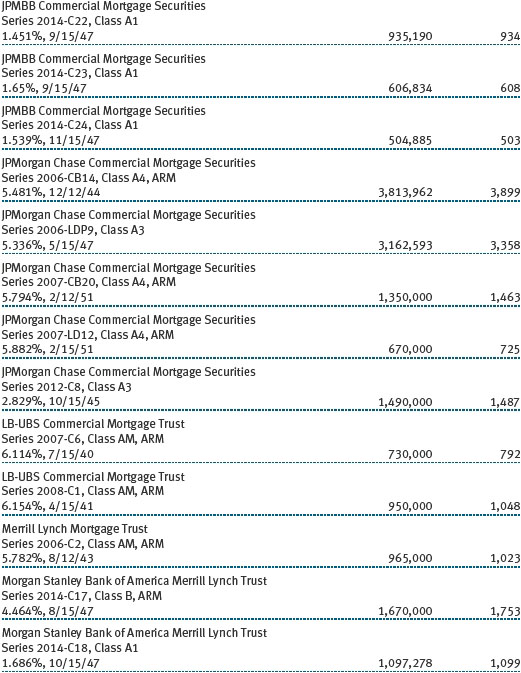
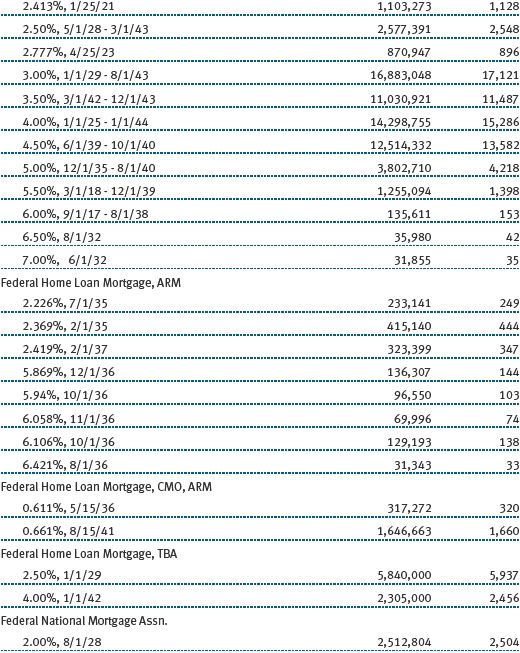
Mortgage-Backed Securities The fund may invest in mortgage-backed securities (MBS or pass-through certificates) that represent an interest in a pool of specific underlying mortgage loans and entitle the fund to the periodic payments of principal and interest from those mortgages. MBS may be issued by government agencies or corporations, or private issuers. Most MBS issued by government agencies are guaranteed; however, the degree of protection differs based on the issuer. MBS are sensitive to changes in economic conditions that affect the rate of prepayments and defaults on the underlying mortgages; accordingly, the value, income, and related cash flows from MBS may be more volatile than other debt instruments.
Other Purchases and sales of portfolio securities other than short-term and U.S. government securities aggregated $1,262,778,000 and $1,225,139,000, respectively, for the year ended December 31, 2014. Purchases and sales of U.S. government securities aggregated $913,318,000 and $923,193,000, respectively, for the year ended December 31, 2014.
NOTE 5 - FEDERAL INCOME TAXES
No provision for federal income taxes is required since the fund intends to continue to qualify as a regulated investment company under Subchapter M of the Internal Revenue Code and distribute to shareholders all of its taxable income and gains. Distributions determined in accordance with federal income tax regulations may differ in amount or character from net investment income and realized gains for financial reporting purposes. Financial reporting records are adjusted for permanent book/tax differences to reflect tax character but are not adjusted for temporary differences.
The fund files U.S. federal, state, and local tax returns as required. The fund’s tax returns are subject to examination by the relevant tax authorities until expiration of the applicable statute of limitations, which is generally three years after the filing of the tax return but which can be extended to six years in certain circumstances. Tax returns for open years have incorporated no uncertain tax positions that require a provision for income taxes.
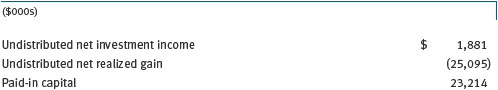
Reclassifications to paid-in capital relate primarily to a tax practice that treats a portion of the proceeds from each redemption of capital shares as a distribution of taxable net investment income or realized capital gain. Reclassifications between income and gain relate primarily to the character of paydown gains and losses on asset-backed securities. For the year ended December 31, 2014, the following reclassifications were recorded to reflect tax character (there was no impact on results of operations or net assets):
Distributions during the years ended December 31, 2014 and December 31, 2013, were characterized for tax purposes as follows:

At December 31, 2014, the tax-basis cost of investments and components of net assets were as follows:

The difference between book-basis and tax-basis net unrealized appreciation (depreciation) is attributable to the deferral of losses from wash sales and/or certain derivative contracts for tax purposes.
NOTE 6 - RELATED PARTY TRANSACTIONS
The fund is managed by T. Rowe Price Associates, Inc. (Price Associates), a wholly owned subsidiary of T. Rowe Price Group, Inc. (Price Group). The investment management agreement between the fund and Price Associates provides for an annual investment management fee, which is computed daily and paid monthly. The fee consists of an individual fund fee, equal to 0.15% of the fund’s average daily net assets, and a group fee. The group fee rate is calculated based on the combined net assets of certain mutual funds sponsored by Price Associates (the group) applied to a graduated fee schedule, with rates ranging from 0.48% for the first $1 billion of assets to 0.275% for assets in excess of $400 billion. The fund’s group fee is determined by applying the group fee rate to the fund’s average daily net assets. At December 31, 2014, the effective annual group fee rate was 0.29%.
In addition, the fund has entered into service agreements with Price Associates and two wholly owned subsidiaries of Price Associates (collectively, Price). Price Associates computes the daily share price and provides certain other administrative services to the fund. T. Rowe Price Services, Inc., provides shareholder and administrative services in its capacity as the fund’s transfer and dividend-disbursing agent. T. Rowe Price Retirement Plan Services, Inc., provides subaccounting and recordkeeping services for certain retirement accounts invested in the fund. For the year ended December 31, 2014, expenses incurred pursuant to these service agreements were $185,000 for Price Associates; $995,000 for T. Rowe Price Services, Inc.; and $3,919,000 for T. Rowe Price Retirement Plan Services, Inc. The total amount payable at period-end pursuant to these service agreements is reflected as Due to Affiliates in the accompanying financial statements.
The fund may invest in the T. Rowe Price Reserve Investment Fund, the T. Rowe Price Government Reserve Investment Fund, or the T. Rowe Price Short-Term Reserve Fund (collectively, the Price Reserve Investment Funds), open-end management investment companies managed by Price Associates and considered affiliates of the fund. The Price Reserve Investment Funds are offered as short-term investment options to mutual funds, trusts, and other accounts managed by Price Associates or its affiliates and are not available for direct purchase by members of the public. The Price Reserve Investment Funds pay no investment management fees.
The fund may also invest in certain other T. Rowe Price funds as a means of gaining efficient and cost-effective exposure to certain markets. The fund does not invest for the purpose of exercising management or control; however, investments by the fund may represent a significant portion of an underlying T. Rowe Price fund’s net assets. Each underlying T. Rowe Price fund is an open-end management investment company managed by Price Associates and is considered an affiliate of the fund. To ensure that the fund does not incur duplicate management fees (paid by the underlying T. Rowe Price fund(s) and the fund), Price Associates has agreed to permanently waive a portion of its management fee charged to the fund in an amount sufficient to fully offset that portion of management fees paid by each underlying T. Rowe Price fund related to the fund’s investment therein. The accompanying Statement of Operations reflects management fees permanently waived pursuant to this agreement. Annual fee rates and management fees waived related to investments in the underlying T. Rowe Price fund(s) for the year ended December 31, 2014, are as follows:

| Report of Independent Registered Public Accounting Firm |
To the Board of Directors and Shareholders of
T. Rowe Price Balanced Fund, Inc.
In our opinion, the accompanying statement of assets and liabilities, including the portfolio of investments, and the related statements of operations and of changes in net assets and the financial highlights present fairly, in all material respects, the financial position of T. Rowe Price Balanced Fund, Inc. (the “Fund”) at December 31, 2014, the results of its operations, the changes in its net assets and the financial highlights for each of the periods indicated therein, in conformity with accounting principles generally accepted in the United States of America. These financial statements and financial highlights (hereafter referred to as “financial statements”) are the responsibility of the Fund’s management. Our responsibility is to express an opinion on these financial statements based on our audits. We conducted our audits of these financial statements in accordance with the standards of the Public Company Accounting Oversight Board (United States). Those standards require that we plan and perform the audit to obtain reasonable assurance about whether the financial statements are free of material misstatement. An audit includes examining, on a test basis, evidence supporting the amounts and disclosures in the financial statements, assessing the accounting principles used and significant estimates made by management, and evaluating the overall financial statement presentation. We believe that our audits, which included confirmation of securities at December 31, 2014 by correspondence with the custodian and brokers, and confirmation of the underlying funds by correspondence with the transfer agent, provide a reasonable basis for our opinion.
PricewaterhouseCoopers LLP
Baltimore, Maryland
February 13, 2015
| Tax Information (Unaudited) for the Tax Year Ended 12/31/14 |
We are providing this information as required by the Internal Revenue Code. The amounts shown may differ from those elsewhere in this report because of differences between tax and financial reporting requirements.
The fund’s distributions to shareholders included:
| ● | $26,958,000 from short-term capital gains, |
| ● | $207,455,000 from long-term capital gains, subject to a long-term capital gains tax rate of not greater than 20%. |
For taxable non-corporate shareholders, $51,342,000 of the fund’s income represents qualified dividend income subject to a long-term capital gains tax rate of not greater than 20%.
For corporate shareholders, $23,797,000 of the fund’s income qualifies for the dividends-received deduction.
| Information on Proxy Voting Policies, Procedures, and Records |
A description of the policies and procedures used by T. Rowe Price funds and portfolios to determine how to vote proxies relating to portfolio securities is available in each fund’s Statement of Additional Information. You may request this document by calling 1-800-225-5132 or by accessing the SEC’s website, sec.gov.
The description of our proxy voting policies and procedures is also available on our website, troweprice.com. To access it, click on the words “Social Responsibility” at the top of our corporate homepage. Next, click on the words “Conducting Business Responsibly” on the left side of the page that appears. Finally, click on the words “Proxy Voting Policies” on the left side of the page that appears.
Each fund’s most recent annual proxy voting record is available on our website and through the SEC’s website. To access it through our website, follow the above directions to reach the “Conducting Business Responsibly” page. Click on the words “Proxy Voting Records” on the left side of that page, and then click on the “View Proxy Voting Records” link at the bottom of the page that appears.
| How to Obtain Quarterly Portfolio Holdings |
The fund files a complete schedule of portfolio holdings with the Securities and Exchange Commission for the first and third quarters of each fiscal year on Form N-Q. The fund’s Form N-Q is available electronically on the SEC’s website (sec.gov); hard copies may be reviewed and copied at the SEC’s Public Reference Room, 100 F St. N.E., Washington, DC 20549. For more information on the Public Reference Room, call 1-800-SEC-0330.
| About the Fund’s Directors and Officers |
Your fund is overseen by a Board of Directors (Board) that meets regularly to review a wide variety of matters affecting or potentially affecting the fund, including performance, investment programs, compliance matters, advisory fees and expenses, service providers, and business and regulatory affairs. The Board elects the fund’s officers, who are listed in the final table. At least 75% of the Board’s members are independent of T. Rowe Price Associates, Inc. (T. Rowe Price), and its affiliates; “inside” or “interested” directors are employees or officers of T. Rowe Price. The business address of each director and officer is 100 East Pratt Street, Baltimore, Maryland 21202. The Statement of Additional Information includes additional information about the fund directors and is available without charge by calling a T. Rowe Price representative at 1-800-638-5660.
| Independent Directors | | |
| |
| Name | | |
| (Year of Birth) | | |
| Year Elected* | | |
| [Number of T. Rowe Price | | Principal Occupation(s) and Directorships of Public Companies and |
| Portfolios Overseen] | | Other Investment Companies During the Past Five Years |
| | | |
| William R. Brody, M.D., Ph.D. | | President and Trustee, Salk Institute for Biological Studies (2009 to |
| (1944) | | present); Director, BioMed Realty Trust (2013 to present); Director, |
| 2009 | | Novartis, Inc. (2009 to present); Director, IBM (2007 to present) |
| [165] | | |
| | | |
| Anthony W. Deering | | Chairman, Exeter Capital, LLC, a private investment firm (2004 to |
| (1945) | | present); Director, Brixmor Real Estate Investment Trust (2012 to |
| 2001 | | present); Director and Member of the Advisory Board, Deutsche |
| [165] | | Bank North America (2004 to present); Director, Under Armour |
| | (2008 to present); Director, Vornado Real Estate Investment Trust |
| | (2004 to 2012) |
| | | |
| Donald W. Dick, Jr. | | Principal, EuroCapital Partners, LLC, an acquisition and management |
| (1943) | | advisory firm (1995 to present) |
| 1991 | | |
| [165] | | |
| | | |
| Bruce W. Duncan | | President, Chief Executive Officer, and Director, First Industrial Realty |
| (1951) | | Trust, owner and operator of industrial properties (2009 to present); |
| 2013 | | Chairman of the Board (2005 to present), Interim Chief Executive |
| [165] | | Officer (2007), and Director, Starwood Hotels & Resorts, a hotel and |
| | leisure company (1999 to present) |
| | | |
| Robert J. Gerrard, Jr. | | Advisory Board Member, Pipeline Crisis/Winning Strategies, a |
| (1952) | | collaborative working to improve opportunities for young African |
| 2012 | | Americans (1997 to present); Chairman of Compensation Committee |
| [165] | | and Director, Syniverse Holdings, Inc., a provider of wireless |
| | voice and data services for telecommunications companies |
| | (2008 to 2011) |
| | | |
| Karen N. Horn | | Limited Partner and Senior Managing Director, Brock Capital |
| (1943) | | Group, an advisory and investment banking firm (2004 to present); |
| 2003 | | Director, Eli Lilly and Company (1987 to present); Director, Simon |
| [163] | | Property Group (2004 to present); Director, Norfolk Southern (2008 |
| | to present) |
| | | |
| Paul F. McBride | | Former Company Officer and Senior Vice President, Human |
| (1956) | | Resources and Corporate Initiatives, Black & Decker Corporation |
| 2013 | | (2004 to 2010) |
| [163] | | |
| | | |
| Cecilia E. Rouse, Ph.D. | | Dean, Woodrow Wilson School (2012 to present); Professor and |
| (1965) | | Researcher, Princeton University (1992 to present); Director, MDRC, |
| 2012 | | a nonprofit education and social policy research organization |
| [165] | | (2011 to present); Member, National Academy of Education (2010 |
| | to present); Research Associate, National Bureau of Economic |
| | Research’s Labor Studies Program (2011 to present); Member, |
| | President’s Council of Economic Advisors (2009 to 2011); Chair |
| | of Committee on the Status of Minority Groups in the Economic |
| | Profession, American Economic Association (2012 to present) |
| | | |
| John G. Schreiber | | Owner/President, Centaur Capital Partners, Inc., a real estate |
| (1946) | | investment company (1991 to present); Cofounder and Partner, |
| 2001 | | Blackstone Real Estate Advisors, L.P. (1992 to present); Director, |
| [165] | | General Growth Properties, Inc. (2010 to 2013); Director, BXMT |
| | (formerly Capital Trust, Inc.), a real estate investment company |
| | (2012 to present); Director and Chairman of the Board, Brixmor |
| | Property Group, Inc. (2013 to present); Director, Hilton Worldwide |
| | (2013 to present) |
| | | |
| Mark R. Tercek | | President and Chief Executive Officer, The Nature Conservancy (2008 |
| (1957) | | to present); Managing Director, The Goldman Sachs Group, Inc. |
| 2009 | | (1984 to 2008) |
| [165] | | |
| |
| *Each independent director serves until retirement, resignation, or election of a successor. |
| | | |
| Inside Directors | | |
| |
| Name | | |
| (Year of Birth) | | |
| Year Elected* | | |
| [Number of T. Rowe Price | | Principal Occupation(s) and Directorships of Public Companies and |
| Portfolios Overseen] | | Other Investment Companies During the Past Five Years |
| | | |
| Edward C. Bernard | | Director and Vice President, T. Rowe Price; Vice Chairman of the |
| (1956) | | Board, Director, and Vice President, T. Rowe Price Group, Inc.; |
| 2006 | | Chairman of the Board, Director, and President, T. Rowe Price |
| [165] | | Investment Services, Inc.; Chairman of the Board and Director, |
| | T. Rowe Price Retirement Plan Services, Inc., and T. Rowe Price |
| | Services, Inc.; Chairman of the Board, Chief Executive Officer, |
| | and Director, T. Rowe Price International; Chairman of the Board, |
| | Chief Executive Officer, Director, and President, T. Rowe Price Trust |
| | Company; Chairman of the Board, all funds |
| | | |
| Brian C. Rogers, CFA, CIC | | Chief Investment Officer, Director, and Vice President, T. Rowe Price; |
| (1955) | | Chairman of the Board, Chief Investment Officer, Director, and Vice |
| 2006 | | President, T. Rowe Price Group, Inc.; Vice President, T. Rowe Price |
| [111] | | Trust Company |
| |
| *Each inside director serves until retirement, resignation, or election of a successor. |
| Officers | | |
| |
| Name (Year of Birth) | | |
| Position Held With Balanced Fund | | Principal Occupation(s) |
| | | |
| E. Frederick Bair, CFA, CPA (1969) | | Vice President, T. Rowe Price, T. Rowe Price |
| Vice President | | Group, Inc., and T. Rowe Price Trust Company |
| | | |
| Darrell N. Braman (1963) | | Vice President, Price Hong Kong, Price |
| Vice President | | Singapore, T. Rowe Price, T. Rowe Price Group, |
| | Inc., T. Rowe Price International, T. Rowe Price |
| | Investment Services, Inc., and T. Rowe Price |
| | Services, Inc. |
| | | |
| Kimberly E. DeDominicis (1976) | | Vice President, T. Rowe Price, T. Rowe Price |
| Vice President | | Group, Inc., and T. Rowe Price International |
| | | |
| Anna M. Dopkin, CFA (1967) | | Vice President, T. Rowe Price, T. Rowe Price |
| Vice President | | Group, Inc., T. Rowe Price International, and |
| | T. Rowe Price Trust Company |
| | | |
| Roger L. Fiery III, CPA (1959) | | Vice President, Price Hong Kong, Price |
| Vice President | | Singapore, T. Rowe Price, T. Rowe Price Group, |
| | Inc., T. Rowe Price International, and T. Rowe |
| | Price Trust Company |
| | | |
| Mark S. Finn CFA, CPA (1963) | | Vice President, T. Rowe Price, T. Rowe Price |
| Vice President | | Group, Inc., and T. Rowe Price Trust Company |
| | | |
| John R. Gilner (1961) | | Chief Compliance Officer and Vice President, |
| Chief Compliance Officer | | T. Rowe Price; Vice President, T. Rowe Price |
| | Group, Inc., and T. Rowe Price Investment |
| | Services, Inc. |
| | | |
| Gregory S. Golczewski (1966) | | Vice President, T. Rowe Price and T. Rowe Price |
| Vice President | | Trust Company |
| | | |
| Gregory K. Hinkle, CPA (1958) | | Vice President, T. Rowe Price, T. Rowe Price |
| Treasurer | | Group, Inc., and T. Rowe Price Trust Company |
| | | |
| Paul A. Karpers, CFA (1967) | | Vice President, T. Rowe Price and T. Rowe Price |
| Vice President | | Group, Inc. |
| | | |
| Robert M. Larkins, CFA (1973) | | Vice President, T. Rowe Price, T. Rowe Price |
| Vice President | | Group, Inc., and T. Rowe Price Trust Company |
| | | |
| Wyatt A. Lee, CFA (1971) | | Vice President, T. Rowe Price, T. Rowe Price |
| Vice President | | Group, Inc., and T. Rowe Price Trust Company |
| | | |
| Patricia B. Lippert (1953) | | Assistant Vice President, T. Rowe Price and |
| Secretary | | T. Rowe Price Investment Services, Inc. |
| | | |
| Raymond A. Mills, Ph.D., CFA (1960) | | Vice President, T. Rowe Price, T. Rowe Price |
| Vice President | | Group, Inc., T. Rowe Price International, and |
| | T. Rowe Price Trust Company |
| | | |
| David Oestreicher (1967) | | Director, Vice President, and Secretary, T. Rowe |
| Vice President | | Price Investment Services, Inc., T. Rowe |
| | Price Retirement Plan Services, Inc., T. Rowe |
| | Price Services, Inc., and T. Rowe Price Trust |
| | Company; Chief Legal Officer, Vice President, |
| | and Secretary, T. Rowe Price Group, Inc.; Vice |
| | President and Secretary, T. Rowe Price and |
| | T. Rowe Price International; Vice President, |
| | Price Hong Kong and Price Singapore |
| | | |
| Larry J. Puglia, CFA, CPA (1960) | | Vice President, T. Rowe Price, T. Rowe Price |
| Vice President | | Group, Inc., and T. Rowe Price Trust Company |
| | | |
| Deborah D. Seidel (1962) | | Vice President, T. Rowe Price, T. Rowe Price |
| Vice President | | Group, Inc., T. Rowe Price Investment Services, |
| | Inc., and T. Rowe Price Services, Inc. |
| | | |
| Charles M. Shriver, CFA (1967) | | Vice President, T. Rowe Price, T. Rowe Price |
| President | | Group, Inc., and T. Rowe Price Trust Company |
| | | |
| Guido F. Stubenrauch (1970) | | Vice President, T. Rowe Price |
| Vice President | | |
| | | |
| Toby M. Thompson, CFA, CAIA (1971) | | Vice President, T. Rowe Price and T. Rowe Price |
| Vice President | | Group, Inc.; formerly, Director of Investments, |
| | I.A.M. National Pension Fund (to 2012) |
| | | |
| Julie L. Waples (1970) | | Vice President, T. Rowe Price |
| Vice President | | |
| | | |
| Richard T. Whitney, CFA (1958) | | Vice President, T. Rowe Price, T. Rowe Price |
| Vice President | | Group, Inc., T. Rowe Price International, and |
| | T. Rowe Price Trust Company |
| | | |
| Unless otherwise noted, officers have been employees of T. Rowe Price or T. Rowe Price International for at least 5 years. |
Item 2. Code of Ethics.
The registrant has adopted a code of ethics, as defined in Item 2 of Form N-CSR, applicable to its principal executive officer, principal financial officer, principal accounting officer or controller, or persons performing similar functions. A copy of this code of ethics is filed as an exhibit to this Form N-CSR. No substantive amendments were approved or waivers were granted to this code of ethics during the period covered by this report.
Item 3. Audit Committee Financial Expert.
The registrant’s Board of Directors/Trustees has determined that Mr. Anthony W. Deering qualifies as an audit committee financial expert, as defined in Item 3 of Form N-CSR. Mr. Deering is considered independent for purposes of Item 3 of Form N-CSR.
Item 4. Principal Accountant Fees and Services.
(a) – (d) Aggregate fees billed for the last two fiscal years for professional services rendered to, or on behalf of, the registrant by the registrant’s principal accountant were as follows:
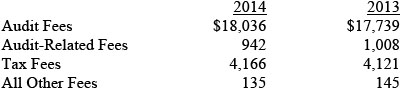
Audit fees include amounts related to the audit of the registrant’s annual financial statements and services normally provided by the accountant in connection with statutory and regulatory filings. Audit-related fees include amounts reasonably related to the performance of the audit of the registrant’s financial statements and specifically include the issuance of a report on internal controls and, if applicable, agreed-upon procedures related to fund acquisitions. Tax fees include amounts related to services for tax compliance, tax planning, and tax advice. The nature of these services specifically includes the review of distribution calculations and the preparation of Federal, state, and excise tax returns. All other fees include the registrant’s pro-rata share of amounts for agreed-upon procedures in conjunction with service contract approvals by the registrant’s Board of Directors/Trustees.
(e)(1) The registrant’s audit committee has adopted a policy whereby audit and non-audit services performed by the registrant’s principal accountant for the registrant, its investment adviser, and any entity controlling, controlled by, or under common control with the investment adviser that provides ongoing services to the registrant require pre-approval in advance at regularly scheduled audit committee meetings. If such a service is required between regularly scheduled audit committee meetings, pre-approval may be authorized by one audit committee member with ratification at the next scheduled audit committee meeting. Waiver of pre-approval for audit or non-audit services requiring fees of a de minimis amount is not permitted.
(2) No services included in (b) – (d) above were approved pursuant to paragraph (c)(7)(i)(C) of Rule 2-01 of Regulation S-X.
(f) Less than 50 percent of the hours expended on the principal accountant’s engagement to audit the registrant’s financial statements for the most recent fiscal year were attributed to work performed by persons other than the principal accountant’s full-time, permanent employees.
(g) The aggregate fees billed for the most recent fiscal year and the preceding fiscal year by the registrant’s principal accountant for non-audit services rendered to the registrant, its investment adviser, and any entity controlling, controlled by, or under common control with the investment adviser that provides ongoing services to the registrant were $2,283,000 and $1,691,000, respectively.
(h) All non-audit services rendered in (g) above were pre-approved by the registrant’s audit committee. Accordingly, these services were considered by the registrant’s audit committee in maintaining the principal accountant’s independence.
Item 5. Audit Committee of Listed Registrants.
Not applicable.
Item 6. Investments.
(a) Not applicable. The complete schedule of investments is included in Item 1 of this Form N-CSR.
(b) Not applicable.
Item 7. Disclosure of Proxy Voting Policies and Procedures for Closed-End Management Investment Companies.
Not applicable.
Item 8. Portfolio Managers of Closed-End Management Investment Companies.
Not applicable.
Item 9. Purchases of Equity Securities by Closed-End Management Investment Company and Affiliated Purchasers.
Not applicable.
Item 10. Submission of Matters to a Vote of Security Holders.
Not applicable.
Item 11. Controls and Procedures.
(a) The registrant’s principal executive officer and principal financial officer have evaluated the registrant’s disclosure controls and procedures within 90 days of this filing and have concluded that the registrant’s disclosure controls and procedures were effective, as of that date, in ensuring that information required to be disclosed by the registrant in this Form N-CSR was recorded, processed, summarized, and reported timely.
(b) The registrant’s principal executive officer and principal financial officer are aware of no change in the registrant’s internal control over financial reporting that occurred during the registrant’s second fiscal quarter covered by this report that has materially affected, or is reasonably likely to materially affect, the registrant’s internal control over financial reporting.
Item 12. Exhibits.
(a)(1) The registrant’s code of ethics pursuant to Item 2 of Form N-CSR is attached.
(2) Separate certifications by the registrant's principal executive officer and principal financial officer, pursuant to Section 302 of the Sarbanes-Oxley Act of 2002 and required by Rule 30a-2(a) under the Investment Company Act of 1940, are attached.
(3) Written solicitation to repurchase securities issued by closed-end companies: not applicable.
(b) A certification by the registrant's principal executive officer and principal financial officer, pursuant to Section 906 of the Sarbanes-Oxley Act of 2002 and required by Rule 30a-2(b) under the Investment Company Act of 1940, is attached.
SIGNATURES
Pursuant to the requirements of the Securities Exchange Act of 1934 and the Investment Company Act of 1940, the registrant has duly caused this report to be signed on its behalf by the undersigned, thereunto duly authorized.
T. Rowe Price Balanced Fund, Inc.
| | By | /s/ Edward C. Bernard |
| | Edward C. Bernard |
| | Principal Executive Officer |
| |
| Date February 13, 2015 | | |
Pursuant to the requirements of the Securities Exchange Act of 1934 and the Investment Company Act of 1940, this report has been signed below by the following persons on behalf of the registrant and in the capacities and on the dates indicated.
| | By | /s/ Edward C. Bernard |
| | Edward C. Bernard |
| | Principal Executive Officer |
| |
| Date February 13, 2015 | | |
| |
| |
| By | /s/ Gregory K. Hinkle |
| | Gregory K. Hinkle |
| | Principal Financial Officer |
| |
| Date February 13, 2015 | | |