UNITED STATES
SECURITIES AND EXCHANGE COMMISSION
WASHINGTON, D.C. 20549
FORM N-CSR
CERTIFIED SHAREHOLDER REPORT OF REGISTERED MANAGEMENT
INVESTMENT COMPANIES
Investment Company Act file number 811-6239
Tax-Free Fund for Utah
(Exact name of Registrant as specified in charter)
380 Madison Avenue
New York, New York 10017
(Address of principal executive offices) (Zip code)
Joseph P. DiMaggio
380 Madison Avenue
New York, New York 10017
(Name and address of agent for service)
Registrant's telephone number, including area code:(212) 697-6666
Date of fiscal year end: 3/31/13
Date of reporting period: 3/31/13
FORM N-CSR
ITEM 1. REPORTS TO STOCKHOLDERS.
Annual Report |
March 31, 2013 |
A tax-free income investment  |
 | Serving Utah Investors For Two Decades Tax-Free Fund For Utah “Economies of Scale” |  |
May, 2013
Dear Fellow Shareholder:
No, you’re not mistaken … you did just receive a semi-annual report a mere three months ago.
So, you might ask, “Why are you sending me an annual report now?” Management of your Fund is continuously looking for ways to streamline the services we provide to you and other shareholders. In turn, we oftentimes can not only improve the quality of the services we provide to you, but also reduce the costs to your Fund.
With this in mind, we determined it would be beneficial for all of the Aquila Group of Funds tax-free bond funds to have a March 31st fiscal year end. A common fiscal year end will allow us to reduce the overall amount of financial, audit and legal review time and spreads the cost of such reviews over the seven tax-free bond funds in the Aquila Group of Funds, resulting in some economies of scale. It also allows the shareholders of all seven funds to be informed of pertinent issues at the same time.
We understand that an additional report at this time may seem redundant. But, it is necessary this one time in order to comply with Securities and Exchange Commission regulations. Going forward, you will receive only the two required financial reports - a March 31st Annual Report and a September 30th Semi-Annual Report.
One thing that hasn’t changed (and will never change) is our continued appreciation of your investment in Tax-Free Fund For Utah. We hope to continue serving you for many more fiscal year ends to come!
Sincerely,
Diana P. Herrmann, President
Consideration should be given to the risks of investing, including potential loss of value, market risk, interest rate risk, credit risk, and geographic concentration. Past performance does not guarantee future results. Investment return and principal value will fluctuate so that an investor’s shares, when redeemed, may be worth more or less than their original cost. For certain investors, some dividends may be subject to Federal and state taxes, including the Alternative Minimum Tax.
NOT A PART OF THE ANNUAL REPORT
Tax-Free Fund For Utah, (the “Fund”) was able to perform slightly better than the Barclays Capital Quality Intermediate Municipal Bond Index (the “Barclays Capital Index”) over the past year because we have a slightly longer duration and effective maturity. Over the past quarter, we have been slightly under the Barclays Index because we have had a larger percentage in cash.
| Tax-Free Fund For Utah | Barclays Capital Index | |
| Modified Duration | 4.56 years | 4.37 years |
| Average Coupon | 4.91% | 4.82% |
| Effective Maturity | 7.20 years | 6.63 years |
| Total Return 3 months* | 0.11% | 0.47% |
| Total Return 6 months* | 1.03% | 0.79% |
| Total Return 12 months* | 5.64% | 3.85% |
* Class A Shares for Tax-Free Fund For Utah
To try and keep share prices stable, we have increased the credit quality of the overall portfolio. As of March 31, 2013, 82.61% of Tax-Free Fund For Utah’s portfolio had a rating of “A” or better, up from 78.8% a year ago. The modified duration of the portfolio has decreased to 4.56 years from 5.15 years in 2012. And, the effective maturity has decreased to 7.20 years from 7.70 years in 2012. Both of these metrics are indicative of a portfolio positioned for rising interest rates.
Municipal Market and Fund Performance
The year 2012 was very interesting for the Municipal Market. First, there was the U.S. Presidential election. President Obama talked about limiting the amount a taxpayer could shelter tax-exempt income. His budget included a 28% limit. Second, the Municipal Market had to endure concern about changes in the capital gains tax. This concern caused an increase in outflows from municipal bond funds because of the impressive gains in municipal bonds over the past few years. As 2013 started, the economy started to look better and there became concerns that the Federal Reserve would cut back on quantitative easing. This concern made fixed income products less attractive than other alternative investments. The Federal Reserve has made it clear they are going to ease as long as unemployment stays above the 6.5% mark, or inflation increases well above the 2% target.
We believe the Municipal Market will likely continue to be vulnerable to headline risks, whether there is talk of defaults, tax changes, Federal Reserve actions, or asset allocations.
1 | Tax-Free Fund For Utah
MANAGEMENT DISCUSSION (continued)
U.S. and Utah Economy
The U.S. economy now has grown for fourteen consecutive quarters. However, growth remains modest with eleven of the fourteen consecutive quarters being below 3% on an annualized basis. Likewise, inflation as measured by the Consumer Price Index (“CPI”) remains subdued in the 2% range. Factors helping the economy are stock market returns, improved home values and new car purchases by consumers. However, as 2013 proceeds, growth could turn negative as the impact of the federal government’s “sequestration” program takes effect and as consumers adjust to higher payroll taxes hitting their take home pay. As such, we do not see any substantial increase in interest rates for the coming year. We expect the Federal Reserve will continue to maintain a low interest rate environment until employment numbers improve. Also, growth on a worldwide basis continues to stall with the problems in Europe being well-documented and China showing signs of slowing.
The Utah economy has outperformed the national average. The unemployment rate has hovered around the 5.5% level until the recent drop to the current 5.2% range. The State of Utah has benefitted from this low unemployment rate and has posted a budget surplus during the last couple of years. The State has received many accolades including this one from the Pew Research Center: “Best Managed State in the Nation”.
“A fiscally conservative legislature has worked hard with the Governor over the years to establish a well-managed and progressive governmental platform that provides stability and predictability in spending, tax policy and a business friendly climate. If there is anything business leaders around the world crave it is a safe, stable and predictable place to conduct business. Utah is that place.” The predictability of the State has also been seen in its cities and counties. And, we have noticed a strength in most municipalities’ balance sheets, even with the slower economy.
Outlook and Strategy
The strategy of Tax-Free Fund For Utah continues to be more defensive in nature, anticipating the time when interest rates trend higher. When opportunities present themselves, we seek to purchase longer, higher-yielding municipal bonds, while at the same time striving to offset the duration risk with purchases of short maturity municipal bonds that can be purchased at a discount. This is commonly known as a barbell approach and leans to be a defensive strategy.
We intend to continue to focus on municipal bond structures that will perform better in a rising interest rate environment, and when appropriate employ a barbell approach to investing. Our goal, as always, is to provide a high level of income exempt from Utah and federal income taxes as is consistent with preservation of capital.
Performance data represents past performance, but does not guarantee future results. Investment return and principal value will fluctuate; shares, when redeemed, may be worth more or less than their original cost; current performance may be lower or higher than the data presented.
NOT FDIC INSURED – NO BANK GUARANTEE – MAY LOSE VALUE
2 | Tax-Free Fund For Utah
PERFORMANCE REPORT
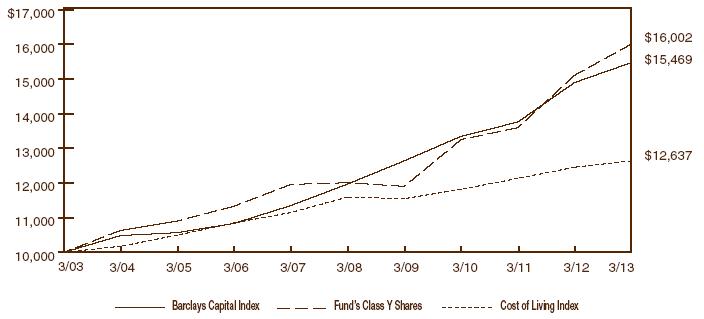
The following graph illustrates the value of $10,000 invested in the Class Y shares of Tax-Free Fund For Utah for the 10-year period ended March 31, 2013 as compared with the Barclays Capital Quality Intermediate Municipal Bond Index (the “Barclays Capital Index”) and the Consumer Price Index (a cost of living index). The performance of each of the other classes is not shown in the graph but is included in the table below. It should be noted that the Barclays Capital Index does not include any operating expenses nor sales charges, and being nationally oriented, does not reflect state-specific bond market performance for the limited number of states in which Tax-Free Fund for Utah may invest.
| Average Annual Total Return | ||||||||||||||||
| for periods ended March 31, 2013 | ||||||||||||||||
| Since | ||||||||||||||||
| Class and Inception Date | 1 Year | 5 Years | 10 Years | Inception | ||||||||||||
| Class A since 7/24/92 | ||||||||||||||||
| With Maximum Sales Charge | 1.44 | % | 4.82 | % | 4.18 | % | 5.12 | % | ||||||||
| Without Sales Charge | 5.64 | 5.69 | 4.60 | 5.33 | ||||||||||||
| Class C since 5/21/96 | ||||||||||||||||
| With CDSC* | 3.88 | 4.84 | 3.77 | 4.22 | ||||||||||||
| Without CDSC | 4.90 | 4.84 | 3.77 | 4.22 | ||||||||||||
| Class Y since 5/21/96 | ||||||||||||||||
| No Sales Charge | 5.94 | 5.91 | 4.81 | 5.35 | ||||||||||||
| Barclays Capital Index | 3.85 | 5.27 | 4.46 | 5.32 | (Class A) | |||||||||||
| 5.14 | (Class C & Y) | |||||||||||||||
Total return figures shown for the Fund reflect any change in price and assume all distributions within the period were invested in additional shares. The rates of return will vary and the principal value of an investment will fluctuate with market conditions. Shares, if redeemed, may be worth more or less than their original cost. A portion of each class’s income may be subject to Federal and state income taxes and/ or the Federal Alternative Minimum Tax (AMT). Past performance is not predictive of future investment results.
* CDSC = 1% contingent deferred sales charge imposed on redemptions made within the first 12 months after purchase.
3 | Tax-Free Fund For Utah
REPORT OF INDEPENDENT REGISTERED PUBLIC ACCOUNTING FIRM
To the Board of Trustees and Shareholders of
Tax-Free Fund For Utah:
We have audited the accompanying statement of assets and liabilities, including the schedule of investments, of Tax-Free Fund For Utah as of March 31, 2013 and the related statements of operations for the period ended March 31, 2013 and the year ended June 30, 2012, the statements of changes in net assets for the period ended March 31, 2013 and for each of the two years in the period ended June 30, 2012, and the financial highlights for the period ended March 31, 2013 and for each of the five years in the period ended June 30, 2012. These financial statements and financial highlights are the responsibility of the Fund’s management. Our responsibility is to express an opinion on these financial statements and financial highlights based on our audits.
We conducted our audits in accordance with the standards of the Public Company Accounting Oversight Board (United States). Those standards require that we plan and perform the audit to obtain reasonable assurance about whether the financial statements and financial highlights are free of material misstatement. The Fund is not required to have, nor were we engaged to perform, an audit of the Fund’s internal control over financial reporting. Our audits included consideration of internal control over financial reporting as a basis for designing audit procedures that are appropriate in the circumstances, but not for the purpose of expressing an opinion on the effectiveness of the Fund’s internal control over financial reporting. Accordingly, we express no such opinion. An audit also includes examining, on a test basis, evidence supporting the amounts and disclosures in the financial statements. Our procedures included confirmation of securities owned as of March 31, 2013, by correspondence with the custodian and brokers, or by other appropriate auditing procedures where replies from brokers were not received. An audit also includes assessing the accounting principles used and significant estimates made by management, as well as evaluating the overall financial statement presentation. We believe that our audits provide a reasonable basis for our opinion.
In our opinion, the financial statements and financial highlights referred to above present fairly, in all material respects, the financial position of Tax-Free Fund For Utah as of March 31, 2013, the results of its operations for the period ended March 31, 2013 and the year ended June 30, 2012, the changes in its net assets for the period ended March 31, 2013 and for each of the two years in the period ended June 30, 2012, and the financial highlights for the period ended March 31, 2013 and for each of the five years in the period ended June 30, 2012, in conformity with accounting principles generally accepted in the United States of America.
TAIT, WELLER & BAKER LLP
Philadelphia, Pennsylvania
May 29, 2013
4 | Tax-Free Fund For Utah
TAX-FREE FUND FOR UTAH
SCHEDULE OF INVESTMENTS
MARCH 31, 2013
| Rating | |||||||||
| Moody’s, S&P | |||||||||
| Principal | and Fitch | ||||||||
| Amount | General Obligation Bonds (22.7%) | (unaudited) | Value | ||||||
| City, County and State (3.5%) | |||||||||
| Anderson, Indiana San District | |||||||||
| $ | 505,000 | 4.600%, 07/15/23 AMBAC Insured | A1/A-/NR | $ | 517,650 | ||||
| Coral Canyon, Utah Special Service | |||||||||
| District | |||||||||
| 100,000 | 4.850%, 07/15/17 | NR/NR/NR* | 101,233 | ||||||
| Houston, Texas Public Improvement | |||||||||
| 1,000,000 | 5.000%, 03/01/29 | Aa2/AA/NR | 1,140,100 | ||||||
| King County, Washington School District | |||||||||
| #401 School Board Guaranty Program | |||||||||
| 1,000,000 | 4.500%, 12/01/25 AGMC Insured | Aa1/AA+/NR | 1,108,360 | ||||||
| Laredo, Texas | |||||||||
| 500,000 | 4.500%, 02/15/24 NPFG Insured | Aa2/AA/AA | 528,455 | ||||||
| McKinney, Texas | |||||||||
| 1,700,000 | 4.500%, 08/15/23 Syncora Guarantee, | ||||||||
| Inc. Insured | Aa1/AAA/NR | 1,825,953 | |||||||
| 1,375,000 | 5.000%, 08/15/24 AMBAC Insured | Aa1/AAA/NR | 1,530,856 | ||||||
| San Patricio County, Texas | |||||||||
| 450,000 | 4.600%, 04/01/25 AMBAC Insured | Aa3/NR/NR | 485,478 | ||||||
| Texas State Transportation Commission | |||||||||
| Mobility Fund | |||||||||
| 2,000,000 | 4.500%, 04/01/33 | Aaa/AA+/AAA | 2,144,860 | ||||||
| Washington State, Series D | |||||||||
| 2,000,000 | 5.000%, 01/01/29 AMBAC Insured | ||||||||
| (pre-refunded) | Aa1/AA+/AA+ | 2,071,520 | |||||||
| Washington State Various Purpose | |||||||||
| 1,405,000 | 5.000%, 07/01/30 Series A | Aa1/AA+/AA+ | 1,586,666 | ||||||
| 2,465,000 | 5.000%, 07/01/31 Series A | Aa1/AA+/AA+ | 2,776,182 | ||||||
| Total City, County and State | 15,817,313 | ||||||||
| Airport (0.5%) | |||||||||
| Clark County, Nevada, Refunding | |||||||||
| Limited Tax Airport System | |||||||||
| 2,000,000 | 5.000%, 07/01/33 Series B | Aa1/AA+/NR | 2,275,900 | ||||||
| Education - Public Schools (2.4%) | |||||||||
| Brownsboro, Texas Independent School | |||||||||
| District | |||||||||
| 490,000 | zero coupon, 08/15/16 PSF | ||||||||
| Guaranteed | NR/AAA/NR | 473,026 | |||||||
5 | Tax-Free Fund For Utah
TAX-FREE FUND FOR UTAH
SCHEDULE OF INVESTMENTS (continued)
MARCH 31, 2013
| Rating | |||||||||
| Moody’s, S&P | |||||||||
| Principal | and Fitch | ||||||||
| Amount | General Obligation Bonds (continued) | (unaudited) | Value | ||||||
| Education - Public Schools (continued) | |||||||||
| Burnet, Texas Consolidated Independent | |||||||||
| School District | |||||||||
| $ | 1,460,000 | 0.050%, 08/01/14 PSF Guaranteed | AAA/NR/NR | $ | 1,455,751 | ||||
| Clark County, Nevada School District | |||||||||
| 1,150,000 | 5.000%, 06/15/18 Series B AGMC | ||||||||
| Insured | Aa3/AA-/A+ | 1,207,833 | |||||||
| Florida State Board of Education Public | |||||||||
| Education Capital Outlay | |||||||||
| 2,000,000 | 4.750%, 06/01/30 2005 Series F | Aa1/AAA/AAA | 2,199,360 | ||||||
| Houston, Texas Community College | |||||||||
| System (Harris and Fort Bend | |||||||||
| Counties) | |||||||||
| 500,000 | 5.000%, 02/15/27 | Aa1/AA+/AA+ | 535,155 | ||||||
| Nebo, Utah School District School | |||||||||
| Board Guaranty Program | |||||||||
| 2,900,000 | 4.500%, 07/01/24 Series A | Aaa/AAA/NR | 3,394,247 | ||||||
| Yakima County, Washington School | |||||||||
| District #201 School Board Guaranty | |||||||||
| Program | |||||||||
| 1,475,000 | 0.050%, 12/01/14 | Aa1/NR/NR | 1,465,250 | ||||||
| Total Education - Public Schools | 10,730,622 | ||||||||
| Hospital (0.2%) | |||||||||
| Skagit County, Washington Public | |||||||||
| Hospital District No. 002, Refunding, | |||||||||
| Island Hospital | |||||||||
| 1,120,000 | 0.250%, 12/01/15 | A1/NR/NR | 1,094,229 | ||||||
| Local Public Property (7.0%) | |||||||||
| Clark County, Nevada, Refunding | |||||||||
| 2,280,000 | 5.000%, 12/01/29 Series A | Aa1/AA+/NR | 2,556,313 | ||||||
| 1,000,000 | 5.000%, 07/01/23 Series B | Aa1/AA+/NR | 1,160,970 | ||||||
| 2,000,000 | 5.000%, 11/01/28 AGMC Insured | Aa1/AA+/AA | 2,222,980 | ||||||
| 2,000,000 | 4.750%, 06/01/30 AGMC Insured | Aa1/AA+/NR | 2,171,460 | ||||||
| 1,000,000 | 4.750%, 11/01/27 NPFG/ FGIC | ||||||||
| Insured | Aa1/AA+/NR | 1,090,130 | |||||||
| Henderson, Nevada Refunding Various | |||||||||
| Purpose | |||||||||
| 1,000,000 | 5.000%, 06/01/33 Series B** | Aa2/AA/NR | 1,142,920 | ||||||
6 | Tax-Free Fund For Utah
TAX-FREE FUND FOR UTAH
SCHEDULE OF INVESTMENTS (continued)
MARCH 31, 2013
| Rating | |||||||||
| Moody’s, S&P | |||||||||
| Principal | and Fitch | ||||||||
| Amount | General Obligation Bonds (continued) | (unaudited) | Value | ||||||
| Local Public Property (continued) | |||||||||
| Hurst, Texas Refunding & Improvement | |||||||||
| $ | 570,000 | 0.050%, 08/15/15 | Aa2/AA/NR | $ | 560,395 | ||||
| Kitsap County, Washington Refunding | |||||||||
| 1,255,000 | 4.850%, 07/01/28 NPFG Insured | Aa3/AA-/NR | 1,319,971 | ||||||
| Miami-Dade County, Florida Building | |||||||||
| Better Communities Program | |||||||||
| 1,170,000 | 5.000%, 07/01/29 NPFG/ FGIC | ||||||||
| Insured | A2/AA-/AA | 1,267,332 | |||||||
| North Las Vegas, Nevada Refunding | |||||||||
| Ltd. Tax | |||||||||
| 1,000,000 | 5.000%, 06/01/36 | Baa2/A/BBB | 1,042,100 | ||||||
| North Slope Borough, Alaska | |||||||||
| 1,000,000 | zero coupon, 06/30/13 Series A NPFG | ||||||||
| Insured | Aa3/AA-/AA | 999,440 | |||||||
| San Angelo, Texas Certificates of | |||||||||
| Obligation | |||||||||
| 2,765,000 | 5.000%, 02/15/30 Series A | Aa2/AA/AA+ | 3,080,348 | ||||||
| San Patricio County, Texas Certificates | |||||||||
| of Obligation | |||||||||
| 2,260,000 | 4.750%, 04/01/31 AMBAC Insured | Aa3/NR/NR | 2,430,201 | ||||||
| South Davis, Utah Recreation District | |||||||||
| 650,000 | 0.050%, 01/01/14 | NR/AA-/NR | 648,356 | ||||||
| State of Utah | |||||||||
| 2,500,000 | 5.000%, 07/01/26 Series A | Aaa/AAA/AAA | 3,010,450 | ||||||
| State of Washington | |||||||||
| 1,500,000 | zero coupon, 01/01/18 Series S-2 | ||||||||
| AGMC Insured | Aa1/AA+/AA+ | 1,423,260 | |||||||
| Washoe County, Nevada Refunding | |||||||||
| Reno Sparks Convention | |||||||||
| 2,000,000 | 5.000%, 07/01/28 | Aa2/AA/NR | 2,263,620 | ||||||
| Williamson County, Texas | |||||||||
| 1,610,000 | 5.000%, 02/15/23 NPFG Insured | ||||||||
| (pre-refunded) | Aa1/AAA/NR | 1,677,024 | |||||||
| 1,445,000 | 5.000%, 02/15/23 NPFG Insured | ||||||||
| (pre-refunded) | Aa1/BBB/NR | 1,504,505 | |||||||
| Total Local Public Property | 31,571,775 | ||||||||
7 | Tax-Free Fund For Utah
TAX-FREE FUND FOR UTAH
SCHEDULE OF INVESTMENTS (continued)
MARCH 31, 2013
| Rating | |||||||||
| Moody’s, S&P | |||||||||
| Principal | and Fitch | ||||||||
| Amount | General Obligation Bonds (continued) | (unaudited) | Value | ||||||
| School District (5.8%) | |||||||||
| Clark County, Nevada School District | |||||||||
| $ | 500,000 | 5.000%, 06/15/28 Series A | Aa3/AA-/A+ | $ | 557,480 | ||||
| Comal, Texas Independent School District | |||||||||
| 2,000,000 | 5.000%, 02/01/33 NPFG Insured | ||||||||
| (pre-refunded) | Aaa/NR/AAA | 2,079,520 | |||||||
| 1,125,000 | 5.000%, 02/01/36 PSF Guaranteed | Aaa/NR/AAA | 1,226,722 | ||||||
| Davis County, Utah School District, | |||||||||
| School Building, Utah School Board | |||||||||
| Guaranty Program | |||||||||
| 2,640,000 | 4.000%, 06/01/27 | Aaa/NR/NR | 2,940,089 | ||||||
| El Paso, Texas Independent School | |||||||||
| District Unlimited Tax Refunding | |||||||||
| 470,000 | 0.050%, 08/15/13 PSF Guaranteed | NR/AAA/AAA | 469,671 | ||||||
| Granite School District, Utah, Salt Lake | |||||||||
| County School Building School Board | |||||||||
| Guaranty Program | |||||||||
| 1,000,000 | 5.000%, 06/01/31 | Aaa/NR/AAA | 1,164,240 | ||||||
| Houston, Texas Independent School | |||||||||
| District | |||||||||
| 3,000,000 | 5.000%, 02/15/28 AGMC Insured | ||||||||
| (pre-refunded) | Aaa/AA+/NR | 3,124,890 | |||||||
| Irving, Texas Independent School | |||||||||
| District Capital Appreciation | |||||||||
| Refunding | |||||||||
| 1,000,000 | zero coupon, 02/15/20 PSF | ||||||||
| Guaranteed | Aaa/AAA/NR | 795,860 | |||||||
| Lake Travis, Texas Independent School | |||||||||
| District Unlimited Tax Refunding | |||||||||
| 515,000 | 0.050%, 08/15/13 PSF Guaranteed | NR/AAA/AAA | 514,737 | ||||||
| Magnolia, Texas Independent School | |||||||||
| District Schoolhouse | |||||||||
| 1,495,000 | 5.000%, 08/15/25 NPFG/ FGIC | ||||||||
| Insured | Aa3/NR/NR | 1,657,193 | |||||||
| Navasota, Texas Independent School | |||||||||
| District | |||||||||
| 475,000 | 5.000%, 08/15/23 NPFG/ FGIC | ||||||||
| Insured | A1/NR/NR | 497,463 | |||||||
8 | Tax-Free Fund For Utah
TAX-FREE FUND FOR UTAH
SCHEDULE OF INVESTMENTS (continued)
MARCH 31, 2013
| Rating | |||||||||
| Moody’s, S&P | |||||||||
| Principal | and Fitch | ||||||||
| Amount | General Obligation Bonds (continued) | (unaudited) | Value | ||||||
| School District (continued) | |||||||||
| North East Independent School District, | |||||||||
| Texas | |||||||||
| $ | 1,000,000 | 5.000%, 08/01/33 NPFG Insured PSF | |||||||
| Guaranteed | Aaa/AAA/NR | $ | 1,048,940 | ||||||
| Port Arthur, Texas Independent School | |||||||||
| District School Building | |||||||||
| 2,000,000 | 5.250%, 02/15/30 NPFG/ FGIC Insured | ||||||||
| (pre-refunded) | Aa3/NR/AA- | 2,086,700 | |||||||
| Schertz-Cibolo Universal City, Texas | |||||||||
| Independent School District | |||||||||
| 2,325,000 | 5.000%, 02/01/36 PSF Guaranteed | Aaa/NR/AAA | 2,541,969 | ||||||
| Uintah County, Utah School District | |||||||||
| School Board Guaranty Program | |||||||||
| 455,000 | 4.250%, 02/01/24 | Aaa/NR/NR | 488,857 | ||||||
| Wasatch County, Utah School District | |||||||||
| School Board Guaranty Program | |||||||||
| 880,000 | 5.000%, 06/01/25 | Aaa/NR/NR | 980,505 | ||||||
| 900,000 | 4.375%, 06/01/26 | Aaa/NR/NR | 973,494 | ||||||
| Washoe County, Nevada School District | |||||||||
| 200,000 | 4.625%, 06/01/23 NPFG/ FGIC Insured | ||||||||
| (pre-refunded) | Aa2/AA/NR | 201,422 | |||||||
| Washoe County, Nevada School District | |||||||||
| Refunding & School Improvement | |||||||||
| 2,000,000 | 5.000%, 06/01/30 Series A | Aa2/AA/NR | 2,265,900 | ||||||
| Wylie, Texas Independent School District | |||||||||
| Capital Appreciation Refunding | |||||||||
| 1,000,000 | zero coupon, 08/15/27 PSF | ||||||||
| Guaranteed** | Aaa/NR/NR | 606,590 | |||||||
| Total School District | 26,222,242 | ||||||||
| Transportation (2.0%) | |||||||||
| Texas State Transportation Commission | |||||||||
| Mobility Fund | |||||||||
| 1,140,000 | 5.000%, 04/01/27 Series A | Aaa/AA+/AAA | 1,300,318 | ||||||
| 5,000,000 | 5.000%, 04/01/35 | Aaa/AA+/AAA | 5,521,400 | ||||||
| 2,000,000 | 4.750%, 04/01/35 Series A NPFG/ IBC | ||||||||
| Insured | Aaa/AA+/AAA | 2,121,960 | |||||||
| Total Transportation | 8,943,678 | ||||||||
9 | Tax-Free Fund For Utah
TAX-FREE FUND FOR UTAH
SCHEDULE OF INVESTMENTS (continued)
MARCH 31, 2013
| Rating | |||||||||
| Moody’s, S&P | |||||||||
| Principal | and Fitch | ||||||||
| Amount | General Obligation Bonds (continued) | (unaudited) | Value | ||||||
| Utilities (1.3%) | |||||||||
| Central Utah Water Conservancy | |||||||||
| District Refunding | |||||||||
| $ | 765,000 | 5.000%, 04/01/28 Series B | NR/AA+/AAA | $ | 892,548 | ||||
| Las Vegas Valley, Nevada Water District | |||||||||
| Refunding | |||||||||
| 1,000,000 | 5.000%, 06/01/30 Series C | Aa2/AA+/NR | 1,144,560 | ||||||
| Las Vegas Valley, Nevada Water District | |||||||||
| Refunding & Water Improvement | |||||||||
| 2,500,000 | 5.000%, 02/01/38 Series A | Aa2/AA+/NR | 2,760,925 | ||||||
| Virgin Valley, Nevada Water District | |||||||||
| 955,000 | 5.000%, 03/01/34 AGC Insured | A1/NR/NR | 1,024,438 | ||||||
| Total Utilities | 5,822,471 | ||||||||
| Total General Obligation Bonds | 102,478,230 | ||||||||
| Revenue Bonds (75.1%) | |||||||||
| Airport (1.3%) | |||||||||
| Alaska State International Airport | |||||||||
| Revenue | |||||||||
| 35,000 | 5.000%, 10/01/24 AMBAC Insured | ||||||||
| AMT | Aa3/NR/A+ | 35,047 | |||||||
| Broward County, Florida Airport System | |||||||||
| Revenue Refunding | |||||||||
| 1,000,000 | 5.375%, 10/01/29 Series O | A1/A+/A | 1,136,040 | ||||||
| Clark County, Nevada Passenger Facilities | |||||||||
| Charge Revenue Las Vegas-McCarran | |||||||||
| International Airport | |||||||||
| 1,500,000 | 5.000%, 07/01/30 | A1/A+/NR | 1,666,395 | ||||||
| Miami-Dade County, Florida Aviation | |||||||||
| Revenue Miami International Airport | |||||||||
| 1,675,000 | 5.000%, 10/01/22 Series A-1 | A2/A/A | 1,982,178 | ||||||
| Reno-Tahoe, Nevada Airport Authority | |||||||||
| Revenue Refunding | |||||||||
| 1,000,000 | 5.000%, 07/01/26 AGMC Insured | A2/NR/A | 1,068,230 | ||||||
| Total Airport | 5,887,890 | ||||||||
| Education (9.4%) | |||||||||
| Florida Higher Education Facilities | |||||||||
| Authority Revenue, Refunding, | |||||||||
| Rollins College Project | |||||||||
| 1,000,000 | 5.000%, 12/01/37 Series A | A1/NR/NR | 1,099,630 | ||||||
10 | Tax-Free Fund For Utah
TAX-FREE FUND FOR UTAH
SCHEDULE OF INVESTMENTS (continued)
MARCH 31, 2013
| Rating | |||||||||
| Moody’s, S&P | |||||||||
| Principal | and Fitch | ||||||||
| Amount | Revenue Bonds (continued) | (unaudited) | Value | ||||||
| Education (continued) | |||||||||
| Florida State Board of Education Public | |||||||||
| Education | |||||||||
| $ | 210,000 | 4.500%, 06/01/25 AGMC Insured | Aa1/AAA/AAA | $ | 219,635 | ||||
| Hammond, Indiana School Building | |||||||||
| Corp. First Mortgage | |||||||||
| 1,030,000 | 5.000%, 07/15/31 NPFG Insured | Baa2/AA+/NR | 1,081,984 | ||||||
| Hillsborough County, Florida School | |||||||||
| Board COP | |||||||||
| 510,000 | 4.250%, 07/01/26 NPFG Insured | Aa2/AA-/AA | 554,288 | ||||||
| 1,500,000 | 5.000%, 07/01/31 NPFG Insured | Aa2/AA-/AA | 1,661,595 | ||||||
| Salt Lake County, Utah Westminster | |||||||||
| College Project | |||||||||
| 825,000 | 4.750%, 10/01/20 | NR/BBB/NR | 886,694 | ||||||
| 870,000 | 4.750%, 10/01/21 | NR/BBB/NR | 930,630 | ||||||
| 2,300,000 | 5.000%, 10/01/22 | NR/BBB/NR | 2,410,331 | ||||||
| 1,250,000 | 5.000%, 10/01/25 | NR/BBB/NR | 1,301,088 | ||||||
| 600,000 | 5.000%, 10/01/27 | NR/BBB/NR | 633,738 | ||||||
| 2,025,000 | 5.125%, 10/01/28 | NR/BBB/NR | 2,099,014 | ||||||
| Southern Utah University Revenue | |||||||||
| Refunding, Auxiliary System Student | |||||||||
| Building Fee | |||||||||
| 875,000 | 4.000%, 05/01/19 | NR/AA/NR | 984,813 | ||||||
| Texas A&M University Revenue | |||||||||
| 1,700,000 | 5.000%, 07/01/34 | Aaa/AAA/AAA | 2,040,391 | ||||||
| Texas State University System Financing | |||||||||
| Revenue | |||||||||
| 2,000,000 | 5.250%, 03/15/25 | Aa2/AA-/AA | 2,323,300 | ||||||
| Tooele County, Utah Municipal Building | |||||||||
| Authority School District Lease Revenue | |||||||||
| 1,000,000 | 4.875%, 06/01/25 | A1/A+/NR | 1,079,060 | ||||||
| 1,000,000 | 5.000%, 06/01/28 | A1/A+/NR | 1,066,810 | ||||||
| University of Utah COP | |||||||||
| 3,170,000 | 4.350%, 12/01/26 AMBAC Insured | Aa2/AA-/NR | 3,401,854 | ||||||
| Utah State Board of Regents | |||||||||
| 2,980,000 | 4.500%, 04/01/29 | Aa2/AA/NR | 3,273,381 | ||||||
| Utah State Board of Regents Auxiliary | |||||||||
| & Campus Facility | |||||||||
| 1,000,000 | 4.125%, 04/01/20 NPFG Insured | Aa2/AA/NR | 1,058,900 | ||||||
11 | Tax-Free Fund For Utah
TAX-FREE FUND FOR UTAH
SCHEDULE OF INVESTMENTS (continued)
MARCH 31, 2013
| Rating | |||||||||
| Moody’s, S&P | |||||||||
| Principal | and Fitch | ||||||||
| Amount | Revenue Bonds (continued) | (unaudited) | Value | ||||||
| Education (continued) | |||||||||
| Utah State Board of Regents Lease | |||||||||
| Revenue | |||||||||
| $ | 410,000 | 4.500%, 05/01/20 AMBAC Insured | NR/AA/NR | $ | 443,251 | ||||
| 425,000 | 4.500%, 05/01/21 AMBAC Insured | NR/AA/NR | 457,083 | ||||||
| 450,000 | 4.625%, 05/01/22 AMBAC Insured | NR/AA/NR | 483,408 | ||||||
| 120,000 | 4.650%, 05/01/23 AMBAC Insured | NR/AA/NR | 128,332 | ||||||
| Utah State Board of Regents Office | |||||||||
| Facility Revenue | |||||||||
| 1,045,000 | 5.000%, 04/01/23 NPFG Insured | Aa2/AA-/NR | 1,124,106 | ||||||
| Utah State Board of Regents, Utah, Valley | |||||||||
| University Student Center Building Fee | |||||||||
| And Unified System Revenue | |||||||||
| 3,005,000 | 5.000%, 11/01/28 Series 2012A | NR/AA/NR | 3,496,588 | ||||||
| 1,000,000 | 4.000%, 11/01/29 Series 2012A | NR/AA/NR | 1,050,350 | ||||||
| Warsaw, Indiana Multi-School Building | |||||||||
| Corp., First Mortgage | |||||||||
| 1,800,000 | 5.450%, 01/15/28 Series B | NR/AA+/NR | 1,995,066 | ||||||
| Washington State Higher Education | |||||||||
| Facilities Authority Revenue, | |||||||||
| Refunding, Gonzaga University | |||||||||
| Project | |||||||||
| 950,000 | 5.000%, 04/01/24 Series B | A3/NR/NR | 1,038,264 | ||||||
| Washington State University Revenue | |||||||||
| 735,000 | 4.600%, 10/01/29 AGMC Insured | Aa2/AA-/NR | 809,587 | ||||||
| Weber State University, Utah Student | |||||||||
| Facilities System | |||||||||
| 1,825,000 | 4.400%, 04/01/27 AGMC Insured | NR/AA/NR | 1,921,907 | ||||||
| 1,275,000 | 5.125%, 04/01/32 NPFG Insured | Baa2/AA/NR | 1,349,422 | ||||||
| Total Education | 42,404,500 | ||||||||
| Education - Charter Schools (8.7%) | |||||||||
| La Vernia, Texas Higher Education | |||||||||
| Finance Corp., Jubilee Academy | |||||||||
| 3,401,500 | 6.500%, 03/15/38 144A† | NR/NR/NR* | 3,403,133 | ||||||
| Utah County, Utah Charter School | |||||||||
| Revenue Lakeview Academy | |||||||||
| 210,000 | 5.350%, 07/15/17 Series A | NR/BBB-/NR | 223,194 | ||||||
| 610,000 | 4.500%, 07/15/22 | NR/BBB-/NR | 612,324 | ||||||
12 | Tax-Free Fund For Utah
TAX-FREE FUND FOR UTAH
SCHEDULE OF INVESTMENTS (continued)
MARCH 31, 2013
| Rating | |||||||||
| Moody’s, S&P | |||||||||
| Principal | and Fitch | ||||||||
| Amount | Revenue Bonds (continued) | (unaudited) | Value | ||||||
| Education - Charter Schools (continued) | |||||||||
| Utah County, Utah Charter School | |||||||||
| Revenue Lincoln Academy | |||||||||
| $ | 635,000 | 5.450%, 06/15/17 Series A 144A | NR/NR/NR* | $ | 639,439 | ||||
| Utah County, Utah Charter School | |||||||||
| Revenue Renaissance Academy | |||||||||
| 225,000 | 5.350%, 07/15/17 Series A 144A | NR/NR/NR* | 229,898 | ||||||
| Utah State Charter School Finance | |||||||||
| Authority Entheos Academy | |||||||||
| 5,598,000 | 6.750%, 08/15/38 144A | NR/NR/NR* | 5,597,720 | ||||||
| Utah State Charter School Finance | |||||||||
| Authority Fast Forward Academy | |||||||||
| 2,940,700 | 6.500%, 11/15/37 144A | NR/NR/NR* | 2,805,369 | ||||||
| Utah State Charter School Finance | |||||||||
| Authority George Washington Academy | |||||||||
| 1,000,000 | 6.750%, 07/15/28 | NR/BB+/NR* | 1,027,950 | ||||||
| Utah State Charter School Finance | |||||||||
| Authority Legacy Preparatory | |||||||||
| Academy | |||||||||
| 5,510,000 | 6.750%, 06/15/38 144A | NR/NR/NR* | 5,489,393 | ||||||
| 7,580,000 | 7.250%, 06/15/39 144A | NR/NR/NR* | 7,538,386 | ||||||
| Utah State Charter School Finance | |||||||||
| Authority Ogden Preparatory | |||||||||
| Academy School Board Guaranty | |||||||||
| Program | |||||||||
| 475,000 | 4.000%, 10/15/22 | NR/AA/NR | 532,104 | ||||||
| 505,000 | 4.000%, 10/15/23 | NR/AA/NR | 559,853 | ||||||
| 525,000 | 4.000%, 10/15/24 | NR/AA/NR | 576,004 | ||||||
| Utah State Charter School Finance | |||||||||
| Authority, Refunding & Improvement, | |||||||||
| Davinci Academy | |||||||||
| 1,000,000 | 7.050%, 09/15/26 Series 2011A | NR/BBB-/NR | 1,087,300 | ||||||
| Utah State Charter School Finance | |||||||||
| Authority Rockwell Charter School | |||||||||
| 900,000 | 6.750%, 08/15/28 144A | NR/NR/NR* | 796,320 | ||||||
| Utah State Charter School Finance | |||||||||
| Authority Ronald Wilson Reagan | |||||||||
| Academy | |||||||||
| 1,200,000 | 5.750%, 02/15/22 Series A 144A | NR/BBB-/NR | 1,271,820 | ||||||
13 | Tax-Free Fund For Utah
TAX-FREE FUND FOR UTAH
SCHEDULE OF INVESTMENTS (continued)
MARCH 31, 2013
| Rating | |||||||||
| Moody’s, S&P | |||||||||
| Principal | and Fitch | ||||||||
| Amount | Revenue Bonds (continued) | (unaudited) | Value | ||||||
| Education - Charter Schools (continued) | |||||||||
| Utah State Charter School Finance | |||||||||
| Authority Venture Academy | |||||||||
| $ | 7,040,000 | 6.750%, 11/15/38 144A | NR/NR/NR* | $ | 7,048,026 | ||||
| Total Education - Charter Schools | 39,438,233 | ||||||||
| Hospital (3.8%) | |||||||||
| Brevard County, Florida Health Facilities | |||||||||
| Authority Health First Inc. Project | |||||||||
| 1,215,000 | 5.000%, 04/01/18 | A3/A-/NR | 1,324,508 | ||||||
| Campbell County, Wyoming Hospital | |||||||||
| District, Hospital Revenue, Memorial | |||||||||
| Hospital Project | |||||||||
| 1,040,000 | 5.000%, 12/01/20 | NR/A-/NR | 1,152,778 | ||||||
| 1,000,000 | 5.500%, 12/01/34 | NR/A-/NR | 1,066,420 | ||||||
| Harris County, Texas Health Facility | |||||||||
| Development Corp. Christus Health | |||||||||
| Series A-6 | |||||||||
| 1,000,000 | 4.750%, 07/01/30 AGMC Insured | A1/AA-/NR | 1,076,010 | ||||||
| Indiana Finance Authority Hospital | |||||||||
| Revenue, Parkview Health System | |||||||||
| 1,350,000 | 5.875%, 05/01/29 (pre-refunded) | A1/NR/NR | 1,431,837 | ||||||
| Indiana Finance Authority Hospital | |||||||||
| Revenue, Parkview Health System, | |||||||||
| Unrefunded balance | |||||||||
| 300,000 | 5.875%, 05/01/29 | A1/A+/NR | 310,629 | ||||||
| King County, Washington Public Hospital | |||||||||
| District No. 002, Refunding, Evergreen | |||||||||
| Healthcare | |||||||||
| 1,000,000 | 5.250%, 12/01/28 | Aa3/A+/NR | 1,129,560 | ||||||
| Laramie County, Wyoming Hospital | |||||||||
| Revenue, Cheyenne Regional | |||||||||
| Medical Center Project | |||||||||
| 1,000,000 | 5.000%, 05/01/32 | NR/A+/NR | 1,101,770 | ||||||
| Reno, Nevada Hospital Revenue, | |||||||||
| Washoe Medical Center | |||||||||
| 725,000 | 5.000%, 06/01/23 AGMC Insured | A2/AA-/NR | 784,088 | ||||||
| 680,000 | 5.000%, 06/01/23 AGMC Insured | A2/AA-/NR | 735,420 | ||||||
14 | Tax-Free Fund For Utah
TAX-FREE FUND FOR UTAH
SCHEDULE OF INVESTMENTS (continued)
MARCH 31, 2013
| Rating | |||||||||
| Moody’s, S&P | |||||||||
| Principal | and Fitch | ||||||||
| Amount | Revenue Bonds (continued) | (unaudited) | Value | ||||||
| Hospital (continued) | |||||||||
| Richmond, Indiana Hospital Revenue | |||||||||
| $ | 250,000 | 5.000%, 01/01/19 | NR/A/A | $ | 273,020 | ||||
| Riverton, Utah Hospital Revenue, | |||||||||
| Intermountain Health Care Health | |||||||||
| Services, Inc. | |||||||||
| 940,000 | 5.000%, 08/15/36 | Aa1/AA+/NR | 1,043,015 | ||||||
| Tarrant County, Texas Cultural Education | |||||||||
| Facilities Finance Corp. Hospital | |||||||||
| Refunding, Scott & White Healthcare | |||||||||
| Project | |||||||||
| 1,000,000 | 5.250%, 08/15/25 | A1/A/AA- | 1,156,990 | ||||||
| Utah County, Utah Hospital Revenue, | |||||||||
| IHC Health Services, Inc. | |||||||||
| 500,000 | 5.000%, 05/15/29 | Aa1/AA+/NR | 570,005 | ||||||
| Utah State Board of Regents Revenue | |||||||||
| Hospital - University of Utah | |||||||||
| 3,000,000 | 5.000%, 08/01/31 Series B | Aa2/AA/NR | 3,298,680 | ||||||
| Washington State Health Care Facilities | |||||||||
| Authority Revenue, Refunding, Fred | |||||||||
| Hutchinson Cancer | |||||||||
| 595,000 | 5.000%, 01/01/18 | A2/A/NR | 670,505 | ||||||
| Total Hospital | 17,125,235 | ||||||||
| Housing (3.5%) | |||||||||
| Florida Housing Finance Corp. | |||||||||
| 375,000 | 5.000%, 07/01/21 AMT | Aa1/AA+/AA+ | 390,375 | ||||||
| 390,000 | 6.000%, 07/01/28 | Aa1/AA+/AA+ | 417,780 | ||||||
| Indianapolis, Indiana Multi-Family | |||||||||
| 350,000 | 4.850%, 01/01/21 AMT FNMA Insured | A1/NR/NR | 355,274 | ||||||
| Miami-Dade County, Florida Housing | |||||||||
| Finance Authority | |||||||||
| 535,000 | 5.000%, 11/01/23 AGMC Insured AMT | A2/AA-/A- | 538,804 | ||||||
| South Dakota Housing Development | |||||||||
| Authority | |||||||||
| 45,000 | 6.000%, 05/01/28 | Aa1/AAA/NR | 45,492 | ||||||
| Utah Housing Corporation Single | |||||||||
| Family Mortgage | |||||||||
| 25,000 | 5.250%, 07/01/23 AMT | Aa2/AA/AA | 25,022 | ||||||
15 | Tax-Free Fund For Utah
TAX-FREE FUND FOR UTAH
SCHEDULE OF INVESTMENTS (continued)
MARCH 31, 2013
| Rating | |||||||||
| Moody’s, S&P | |||||||||
| Principal | and Fitch | ||||||||
| Amount | Revenue Bonds (continued) | (unaudited) | Value | ||||||
| Housing (continued) | |||||||||
| Utah Housing Corporation Single | |||||||||
| Family Mortgage (continued) | |||||||||
| $ | 625,000 | 5.125%, 07/01/24 AMT | Aa3/AA-/AA- | $ | 625,437 | ||||
| 565,000 | 5.000%, 07/01/25 AMT | Aa3/AA-/AA- | 564,915 | ||||||
| 145,000 | 5.100%, 01/01/26 AMT | Aa3/AA-/AA- | 145,307 | ||||||
| 90,000 | 5.650%, 07/01/27 AMT | Aa2/AA/AA | 90,281 | ||||||
| 905,000 | 5.250%, 01/01/28 AMT | Aa3/AA-/AA- | 920,819 | ||||||
| 1,690,000 | 5.800%, 07/01/28 AMT | Aa3/AA-/AA- | 1,771,914 | ||||||
| 635,000 | 5.700%, 07/01/28 AMT | Aa3/AA-/AA- | 663,613 | ||||||
| 465,000 | 5.500%, 07/01/28 AMT | Aa3/AA-/AA- | 482,772 | ||||||
| 730,000 | 6.100%, 01/01/29 AMT | Aa3/AA-/AA- | 772,610 | ||||||
| 1,250,000 | 5.250%, 07/01/28 Series A AMT | Aa3/AA-/AA- | 1,300,763 | ||||||
| 555,000 | 4.950%, 01/01/32 Series A Class II | Aa2/AA/AA | 584,859 | ||||||
| 1,975,000 | 4.500%, 01/01/24 Series A Class III | Aa3/AA-/AA- | 2,089,965 | ||||||
| 1,000,000 | 4.000%, 07/01/28 Series B-1 Class I | Aaa/AAA/AAA | 1,025,910 | ||||||
| 915,000 | 4.625%, 07/01/32 Series B-1 Class II | Aa2/AA/AA | 960,000 | ||||||
| 615,000 | 4.500%, 07/01/23 Series C | Aa3/AA-/AA- | 654,169 | ||||||
| Utah State Housing Finance Agency | |||||||||
| 30,000 | 5.700%, 07/01/15 AMT | Aa3/AA-/AA- | 30,068 | ||||||
| 265,000 | 5.500%, 07/01/18 AMT | Aa3/AA-/AA- | 268,087 | ||||||
| 10,000 | 5.000%, 07/01/18 AMT | Aaa/AA+/NR | 10,008 | ||||||
| 140,000 | 5.600%, 07/01/23 AMT | Aa2/AA/AA | 140,154 | ||||||
| Wyoming Community Development | |||||||||
| Authority Homeownership Mortgage | |||||||||
| Revenue | |||||||||
| 755,000 | 4.625%, 06/01/28 Series A | Aa2/NR/NR | 797,574 | ||||||
| Total Housing | 15,671,972 | ||||||||
| Local Public Property (11.2%) | |||||||||
| CIVIC Ventures Alaska Revenue | |||||||||
| Anchorage Convention Center | |||||||||
| 1,285,000 | 4.625%, 09/01/30 NPFG Insured | A1/A/A+ | 1,351,871 | ||||||
| Clark County, Nevada Improvement | |||||||||
| District Special Local Improvement | |||||||||
| #128 (Summerlin) | |||||||||
| 500,000 | 5.000%, 02/01/21 Series A | NR/NR/NR* | 458,820 | ||||||
| Draper, Utah Sales Tax Revenue | |||||||||
| 1,640,000 | 4.500%, 05/01/27 Series A | NR/AA/NR | 1,850,871 | ||||||
| 1,000,000 | 5.000%, 05/01/32 Series A | NR/AA/NR | 1,158,740 | ||||||
16 | Tax-Free Fund For Utah
TAX-FREE FUND FOR UTAH
SCHEDULE OF INVESTMENTS (continued)
MARCH 31, 2013
| Rating | |||||||||
| Moody’s, S&P | |||||||||
| Principal | and Fitch | ||||||||
| Amount | Revenue Bonds (continued) | (unaudited) | Value | ||||||
| Local Public Property (continued) | |||||||||
| El Paso, Texas Solid Waste Disposal | |||||||||
| System Revenue | |||||||||
| $ | 1,540,000 | 5.125%, 08/15/28 AGMC Insured | A2/AA-/NR | $ | 1,553,506 | ||||
| Herriman, Utah Special Assessment | |||||||||
| Towne Center Assessment Area | |||||||||
| 1,045,000 | 4.875%, 11/01/23 | NR/A/NR | 1,110,783 | ||||||
| 1,150,000 | 5.000%, 11/01/25 | NR/A/NR | 1,216,608 | ||||||
| 1,975,000 | 5.000%, 11/01/29 | NR/A/NR | 2,035,633 | ||||||
| Lincoln County, Wyoming Building | |||||||||
| Corp. Lease Revenue | |||||||||
| 700,000 | 5.000%, 05/01/32 | NR/A+/NR | 770,168 | ||||||
| New Albany, Indiana Development | |||||||||
| Authority | |||||||||
| 500,000 | 4.250%, 02/01/22 | NR/A-/NR | 516,020 | ||||||
| Orem, Utah Special Assessment | |||||||||
| 1,765,000 | 7.750%, 11/01/25 | NR/NR/NR* | 1,772,607 | ||||||
| Riverton City, Utah Franchise & Sales | |||||||||
| Tax Revenue | |||||||||
| 1,585,000 | 5.000%, 06/01/31 AMBAC Insured | NR/AA-/AA | 1,708,725 | ||||||
| Salt Lake Valley, Utah Fire Service | |||||||||
| District Lease Revenue | |||||||||
| 2,645,000 | 5.200%, 04/01/28 | Aa2/NR/AA- | 3,008,978 | ||||||
| 1,000,000 | 5.250%, 04/01/30 | Aa2/NR/AA- | 1,136,410 | ||||||
| Sevier County, Utah Municipal Building | |||||||||
| Authority Lease Revenue Refunding | |||||||||
| 915,000 | 5.000%, 11/15/19 NPFG/ FGIC Insured | ||||||||
| (pre-refunded) | NR/NR/NR* | 963,010 | |||||||
| South Dakota State Building Authority | |||||||||
| Revenue | |||||||||
| 500,000 | 4.500%, 06/01/24 NPFG/ FGIC | ||||||||
| Insured | NR/AA/NR | 553,245 | |||||||
| South Ogden City, Utah Sales Tax | |||||||||
| Revenue Refunding | |||||||||
| 1,895,000 | 4.375%, 05/01/29 NPFG/ FGIC | ||||||||
| Insured | Baa2/A+/NR | 1,958,047 | |||||||
| St. Augustine, Florida Capital | |||||||||
| Improvement Refunding | |||||||||
| 500,000 | 5.000%, 10/01/34 | Aa3/A+/A+ | 565,870 | ||||||
17 | Tax-Free Fund For Utah
TAX-FREE FUND FOR UTAH
SCHEDULE OF INVESTMENTS (continued)
MARCH 31, 2013
| Rating | |||||||||
| Moody’s, S&P | |||||||||
| Principal | and Fitch | ||||||||
| Amount | Revenue Bonds (continued) | (unaudited) | Value | ||||||
| Local Public Property (continued) | |||||||||
| St. Lucie County, Florida School Board | |||||||||
| COP Master Lease Program | |||||||||
| $ | 500,000 | 5.000%, 07/01/30 Series A | Aa3/A/A+ | $ | 571,950 | ||||
| Twin Creeks, Utah Special Services | |||||||||
| District | |||||||||
| 11,230,970 | 10.000%, 07/15/30 144A | NR/NR/NR* | 11,260,395 | ||||||
| Uintah County, Utah Municipal Building | |||||||||
| Authority Lease Revenue | |||||||||
| 500,000 | 5.000%, 06/01/24 | NR/A+/NR | 554,275 | ||||||
| 2,000,000 | 5.300%, 06/01/28 | NR/A+/NR | 2,191,280 | ||||||
| 1,005,000 | 5.500%, 06/01/37 | NR/A+/NR | 1,087,762 | ||||||
| 1,120,000 | 5.500%, 06/01/40 | NR/A+/NR | 1,208,413 | ||||||
| Utah State Municipal Finance Cooperative | |||||||||
| Local Government Capital Appreciation | |||||||||
| Pool Capital, Salt Lake | |||||||||
| 165,000 | zero coupon, 03/01/14 AGMC | ||||||||
| Insured | A2/AA-/AA | 162,990 | |||||||
| Utah Transit Authority Sales Tax Revenue, | |||||||||
| Series A | |||||||||
| 1,000,000 | 5.000%, 06/15/28 | Aa2/AAA/AA | 1,143,710 | ||||||
| Wasatch County, Utah Municipal Building | |||||||||
| Authority | |||||||||
| 600,000 | 0.250%, 12/01/13 | NR/AA-/AA- | 599,208 | ||||||
| 535,000 | 0.250%, 12/01/14 | NR/AA-/AA- | 531,030 | ||||||
| Washington County/St. George Interlocal | |||||||||
| Agency, Utah Lease Revenue Refunding | |||||||||
| 650,000 | 0.500%, 12/01/15 Series A | A1/A+/NR | 642,330 | ||||||
| 1,365,000 | 0.500%, 12/01/16 Series A | A1/A+/NR | 1,327,995 | ||||||
| Weber County, Utah Municipal Building | |||||||||
| Authority | |||||||||
| 325,000 | 5.250%, 12/15/19 AMBAC Insured | Aa3/NR/NR | 344,750 | ||||||
| West Bountiful, Utah Courthouse Revenue | |||||||||
| 410,000 | 5.000%, 05/01/19 (pre-refunded) | NR/A/NR | 430,992 | ||||||
| West Valley City, Utah Municipal Building | |||||||||
| Authority Lease Revenue Refunding | |||||||||
| 1,645,000 | 4.500%, 08/01/22 Series A NPFG/ FGIC | ||||||||
| Insured | NR/A+/A+ | 1,764,624 | |||||||
| 1,890,000 | 4.375%, 08/01/26 Series A NPFG/ FGIC | ||||||||
| Insured | NR/A+/A+ | 1,991,890 | |||||||
18 | Tax-Free Fund For Utah
TAX-FREE FUND FOR UTAH
SCHEDULE OF INVESTMENTS (continued)
MARCH 31, 2013
| Rating | |||||||||
| Moody’s, S&P | |||||||||
| Principal | and Fitch | ||||||||
| Amount | Revenue Bonds (continued) | (unaudited) | Value | ||||||
| Local Public Property (continued) | |||||||||
| West Valley City, Utah Sales Tax | |||||||||
| Revenue Capital Appreciation Bonds | |||||||||
| $ | 2,750,000 | zero coupon, 07/15/35 | NR/AA+/NR | $ | 985,215 | ||||
| Total Local Public Property | 50,488,721 | ||||||||
| State Agency (1.8%) | |||||||||
| Utah Infrastructure Agency | |||||||||
| Telecommunications & Franchise Tax | |||||||||
| 1,000,000 | 5.500%, 10/15/30 Series A AGMC | ||||||||
| Insured | Aa3/AA-/NR | 1,155,200 | |||||||
| 1,475,000 | 5.250%, 10/15/33 Series A AGMC | ||||||||
| Insured | A2/AA-/NR | 1,637,560 | |||||||
| Utah State Building Ownership Authority | |||||||||
| Lease Revenue Refunding State | |||||||||
| Facilities Master Lease Program | |||||||||
| 465,000 | 5.000%, 05/15/21 (pre-refunded) | Aa1/AA+/NR | 529,472 | ||||||
| 510,000 | 5.000%, 05/15/23 (pre-refunded) | Aa1/AA+/NR | 580,711 | ||||||
| 1,000,000 | 5.000%, 05/15/24 | Aa1/AA+/NR | 1,232,560 | ||||||
| 1,080,000 | 5.000%, 05/15/25 (pre-refunded) | Aa1/AA+/NR | 1,137,294 | ||||||
| 1,575,000 | 5.000%, 05/15/26 | Aa1/AA+/NR | 1,776,049 | ||||||
| Total State Agency | 8,048,846 | ||||||||
| Tax Revenue (6.6%) | |||||||||
| Bountiful City, Utah Sales Tax | |||||||||
| Refunding Bond | |||||||||
| 191,000 | 3.500%, 06/01/13 | NR/AA/NR | 191,762 | ||||||
| 832,000 | 4.000%, 06/01/17 | NR/AA/NR | 910,300 | ||||||
| Brigham, Utah Special Assessment | |||||||||
| Voluntary Assessment Area | |||||||||
| 1,140,000 | 5.250%, 08/01/23 | A1/NR/NR | 1,255,699 | ||||||
| 820,000 | 5.500%, 08/01/29 | A1/NR/NR | 891,455 | ||||||
| Clark County, Nevada Improvement | |||||||||
| District | |||||||||
| 250,000 | 5.000%, 08/01/16 | NR/NR/NR* | 238,915 | ||||||
| Coral Canyon, Utah Special Service | |||||||||
| District | |||||||||
| 25,000 | 5.000%, 07/15/13 Escrowed to | ||||||||
| Maturity | NR/NR/NR* | 25,335 | |||||||
| 250,000 | 5.500%, 07/15/18 (pre-refunded) | NR/NR/NR* | 253,707 | ||||||
19 | Tax-Free Fund For Utah
TAX-FREE FUND FOR UTAH
SCHEDULE OF INVESTMENTS (continued)
MARCH 31, 2013
| Rating | |||||||||
| Moody’s, S&P | |||||||||
| Principal | and Fitch | ||||||||
| Amount | Revenue Bonds (continued) | (unaudited) | Value | ||||||
| Tax Revenue (continued) | |||||||||
| Henderson, Nevada Local Improvement | |||||||||
| District | |||||||||
| $ | 285,000 | 5.000%, 09/01/14 | NR/NR/NR* | $ | 291,461 | ||||
| 285,000 | 5.000%, 09/01/15 | NR/NR/NR* | 293,527 | ||||||
| 220,000 | 5.000%, 03/01/16 | NR/NR/NR* | 219,109 | ||||||
| Holladay, Utah Redevelopment Agency | |||||||||
| 2,182,500 | 4.900%, 12/30/20 | NR/NR/NR* | 2,039,721 | ||||||
| Jordanelle, Utah Special Service District | |||||||||
| 186,000 | 5.000%, 11/15/14 | NR/NR/NR* | 186,093 | ||||||
| 196,000 | 5.100%, 11/15/15 | NR/NR/NR* | 196,051 | ||||||
| 206,000 | 5.200%, 11/15/16 | NR/NR/NR* | 206,029 | ||||||
| 216,000 | 5.300%, 11/15/17 | NR/NR/NR* | 216,017 | ||||||
| 228,000 | 5.400%, 11/15/18 | NR/NR/NR* | 228,002 | ||||||
| 240,000 | 5.500%, 11/15/19 | NR/NR/NR* | 239,974 | ||||||
| 253,000 | 5.600%, 11/15/20 | NR/NR/NR* | 251,745 | ||||||
| 268,000 | 5.700%, 11/15/21 | NR/NR/NR* | 264,755 | ||||||
| 283,000 | 5.800%, 11/15/22 | NR/NR/NR* | 278,280 | ||||||
| 299,000 | 6.000%, 11/15/23 | NR/NR/NR* | 294,832 | ||||||
| La Verkin, Utah Sales and Franchise | |||||||||
| Tax Revenue | |||||||||
| 571,000 | 5.100%, 07/15/27† | NR/NR/NR* | 565,250 | ||||||
| Lehi, Utah Sales Tax | |||||||||
| 790,000 | 5.000%, 06/01/24 AGMC Insured | A2/AA-/NR | 819,088 | ||||||
| Mesquite, Nevada New Special | |||||||||
| Improvement District | |||||||||
| 200,000 | 4.900%, 08/01/13 | NR/NR/NR* | 199,138 | ||||||
| 125,000 | 5.250%, 08/01/17 | NR/NR/NR* | 119,856 | ||||||
| 270,000 | 5.350%, 08/01/19 | NR/NR/NR* | 249,326 | ||||||
| 115,000 | 5.400%, 08/01/20 | NR/NR/NR* | 105,195 | ||||||
| 430,000 | 5.500%, 08/01/25 | NR/NR/NR* | 374,371 | ||||||
| North Ogden, Utah Sales Tax Revenue | |||||||||
| 195,000 | 5.000%, 11/01/24 Syncora Guarantee, | ||||||||
| Inc. Insured | NR/A+/AA | 204,413 | |||||||
| Payson City, Utah Sales Tax Revenue | |||||||||
| 445,000 | 5.000%, 08/01/21 AGMC Insured | A2/AA-/NR | 489,874 | ||||||
| Riverton City, Utah Franchise & Sales | |||||||||
| Tax Revenue | |||||||||
| 750,000 | 5.000%, 06/01/24 AMBAC Insured | NR/AA-/AA | 818,055 | ||||||
20 | Tax-Free Fund For Utah
TAX-FREE FUND FOR UTAH
SCHEDULE OF INVESTMENTS (continued)
MARCH 31, 2013
| Rating | |||||||||
| Moody’s, S&P | |||||||||
| Principal | and Fitch | ||||||||
| Amount | Revenue Bonds (continued) | (unaudited) | Value | ||||||
| Tax Revenue (continued) | |||||||||
| Salt Lake City, Utah Sales Tax | |||||||||
| $ | 1,060,000 | 5.000%, 02/01/23 (pre-refunded) | NR/AAA/NR | $ | 1,150,736 | ||||
| 1,115,000 | 5.000%, 02/01/24 (pre-refunded) | NR/AAA/NR | 1,210,444 | ||||||
| South Weber City, Utah | |||||||||
| 525,000 | 5.000%, 01/15/24 NPFG Insured | Baa2/A/AA- | 538,703 | ||||||
| Springville, Utah Special Assessment | |||||||||
| Revenue | |||||||||
| 120,000 | 5.500%, 01/15/17 | NR/NR/NR* | 120,001 | ||||||
| 127,000 | 5.650%, 01/15/18 | NR/NR/NR* | 126,935 | ||||||
| 135,000 | 5.800%, 01/15/19 | NR/NR/NR* | 134,267 | ||||||
| 116,000 | 5.900%, 01/15/20 | NR/NR/NR* | 114,651 | ||||||
| Utah Transit Authority Sales Tax Revenue | |||||||||
| 6,920,000 | 5.000%, 06/15/36 AGMC Insured | ||||||||
| Series A | Aa2/AAA/AA | 7,874,199 | |||||||
| Vernal City, Utah Sales Tax Revenue | |||||||||
| 515,000 | 4.750%, 09/01/31 AGC Insured | NR/AA/NR | 564,363 | ||||||
| 300,000 | 4.875%, 09/01/34 AGC Insured | NR/AA/NR | 327,456 | ||||||
| Wasatch County, Utah Building Authority | |||||||||
| 130,000 | 5.000%, 10/01/15 (pre-refunded) | A1/NR/NR | 133,076 | ||||||
| 135,000 | 5.000%, 10/01/16 (pre-refunded) | A1/NR/NR | 138,194 | ||||||
| Washington City, Utah Sales Tax | |||||||||
| 680,000 | 5.250%, 11/15/17 AMBAC Insured | ||||||||
| (pre-refunded) | NR/A/NR | 701,107 | |||||||
| Weber County, Utah Sales Tax | |||||||||
| 385,000 | 5.000%, 07/01/23 AMBAC Insured | ||||||||
| (pre-refunded) | A1/NR/NR | 389,505 | |||||||
| West Valley City, Utah Redevelopment | |||||||||
| Agency | |||||||||
| 1,625,000 | 5.000%, 03/01/21 | NR/A-/NR | 1,700,010 | ||||||
| 320,000 | 5.000%, 03/01/22 | NR/A-/NR | 334,099 | ||||||
| 350,000 | 5.000%, 03/01/23 | NR/A-/NR | 364,556 | ||||||
| 1,000,000 | 5.000%, 03/01/24 | NR/A-/NR | 1,041,020 | ||||||
| Total Tax Revenue | 29,880,657 | ||||||||
| Transportation (4.6%) | |||||||||
| Central Puget Sound, Washington | |||||||||
| Regional Transportation Authority | |||||||||
| Sales Tax | |||||||||
| 2,000,000 | 5.000%, 11/01/25 Series A AMBAC | ||||||||
| Insured (pre-refunded) | Aa2/AAA/NR | 2,194,560 | |||||||
21 | Tax-Free Fund For Utah
TAX-FREE FUND FOR UTAH
SCHEDULE OF INVESTMENTS (continued)
MARCH 31, 2013
| Rating | |||||||||
| Moody’s, S&P | |||||||||
| Principal | and Fitch | ||||||||
| Amount | Revenue Bonds (continued) | (unaudited) | Value | ||||||
| Transportation (continued) | |||||||||
| Dallas, Texas Area Rapid Transit Sales | |||||||||
| Tax Revenue Refunding Senior Lien | |||||||||
| $ | 1,000,000 | 5.000%, 12/01/36 AMBAC Insured | Aa2/AA+/AA | $ | 1,112,860 | ||||
| Indiana Finance Authority Highway | |||||||||
| Revenue | |||||||||
| 1,950,000 | 4.500%, 12/01/25 NPFG/ FGIC | ||||||||
| Insured | Aa1/AA+/AA+ | 2,169,414 | |||||||
| North Texas Turnpike Authority Revenue | |||||||||
| 2,000,000 | 6.100%, 01/01/28 | A2/A-/NR | 2,327,100 | ||||||
| Utah Transit Authority Sales Tax Revenue | |||||||||
| Capital Appreciation Refunding | |||||||||
| 2,000,000 | zero coupon, 06/15/29 NPFG Insured | ||||||||
| Series A | A1/A-/A+ | 968,120 | |||||||
| Utah Transit Authority Sales Tax Revenue | |||||||||
| Refunding | |||||||||
| 5,185,000 | zero coupon, 06/15/23 Series A NPFG | ||||||||
| Insured | A1/A-/A+ | 3,473,224 | |||||||
| 1,000,000 | 5.000%, 06/15/32 | A1/A-/A+ | 1,134,750 | ||||||
| Utah Transit Authority Sales Tax Revenue | |||||||||
| 2,000,000 | 5.000%, 06/15/27 Series A | Aa2/AAA/AA | 2,291,680 | ||||||
| Utah Transit Authority Sales Tax & | |||||||||
| Transportation Revenue | |||||||||
| 1,450,000 | 4.125%, 06/15/22 AGMC Insured | Aa2/AAA/AA | 1,553,515 | ||||||
| 195,000 | 5.250%, 06/15/32 AGMC Insured | Aa2/AAA/AA | 254,964 | ||||||
| Washoe County, Nevada Highway | |||||||||
| Revenue | |||||||||
| 1,000,000 | 5.500%, 02/01/28 | A1/A+/NR | 1,143,060 | ||||||
| Washoe County, Nevada Highway | |||||||||
| Revenue Fuel Tax | |||||||||
| 1,000,000 | 5.000%, 02/01/32** | A1/A+/NR | 1,089,970 | ||||||
| 1,000,000 | 5.000%, 02/01/38** | A1/A+/NR | 1,065,920 | ||||||
| Total Transportation | 20,779,137 | ||||||||
| Utility (10.6%) | |||||||||
| Clark County, Washington Public Utility | |||||||||
| District No. 001 Generating Refunding | |||||||||
| 1,000,000 | 5.000%, 01/01/24 | A2/A/A+ | 1,152,230 | ||||||
| Cowlitz County, Washington Public | |||||||||
| Utility District Electric Revenue | |||||||||
| 650,000 | 4.500%, 09/01/26 NPFG Insured | A1/NR/A | 677,729 | ||||||
22 | Tax-Free Fund For Utah
TAX-FREE FUND FOR UTAH
SCHEDULE OF INVESTMENTS (continued)
MARCH 31, 2013
| Rating | |||||||||
| Moody’s, S&P | |||||||||
| Principal | and Fitch | ||||||||
| Amount | Revenue Bonds (continued) | (unaudited) | Value | ||||||
| Utility (continued) | |||||||||
| Douglas County, Washington Public | |||||||||
| Utility District No. 001 Electric | |||||||||
| Distribution System | |||||||||
| $ | 635,000 | 0.050%, 12/01/15 | Aa3/AA/NR | $ | 623,310 | ||||
| Eagle Mountain, Utah Gas & Electric | |||||||||
| 1,385,000 | 4.250%, 06/01/20 Radian Insured | NR/NR/NR* | 1,394,889 | ||||||
| 1,440,000 | 5.000%, 06/01/21 Radian Insured | NR/NR/NR* | 1,477,570 | ||||||
| 1,215,000 | 5.000%, 06/01/22 Radian Insured | NR/NR/NR* | 1,245,424 | ||||||
| Energy Northwest Washington Wind | |||||||||
| Project | |||||||||
| 1,000,000 | 4.500%, 07/01/30 Series A AMBAC | ||||||||
| Insured | A2/A/A- | 1,052,650 | |||||||
| Houston, Texas Utility System Revenue, | |||||||||
| Refunding | |||||||||
| 1,165,000 | 5.125%, 05/15/28 Series A NPFG | ||||||||
| Insured | Aa2/AA/AA- | 1,220,489 | |||||||
| Intermountain Power Agency, Utah | |||||||||
| Power Supply Revenue, Refunding | |||||||||
| 250,000 | 5.250%, 07/01/23 (pre-refunded) | A1/A+/AA- | 253,078 | ||||||
| 1,000,000 | 5.000%, 07/01/21 Series A AGMC | ||||||||
| Insured (pre-refunded) | Aa3/AA-/AA- | 1,011,700 | |||||||
| 1,000,000 | 4.250%, 07/01/19 Series B | A1/A+/AA- | 1,054,090 | ||||||
| Jacksonville Electric Authority, Florida | |||||||||
| Bulk Power System Revenue, | |||||||||
| Scherer 4 Project | |||||||||
| 1,500,000 | 6.000%, 10/01/37 Series A | Aa2/AA-/AA | 1,576,185 | ||||||
| Jacksonville Electric Authority, Florida | |||||||||
| Electric System Revenue | |||||||||
| 500,000 | 5.000%, 10/01/26 | Aa3/A+/AA | 507,370 | ||||||
| 500,000 | 4.500%, 10/01/32 Series | ||||||||
| Three 2012A | Aa2/AA-/AA | 548,860 | |||||||
| 515,000 | 5.500%, 10/01/39 | Aa3/A+/AA | 530,491 | ||||||
| Lower Colorado River Authority, Texas | |||||||||
| 1,470,000 | 5.250%, 05/15/29 | A1/A/A | 1,678,226 | ||||||
| 60,000 | 5.250%, 05/15/29 (pre-refunded) | NR/NR/NR* | 74,449 | ||||||
| 5,000 | 5.250%, 05/15/29 (pre-refunded) | NR/NR/NR* | 6,221 | ||||||
| Lower Colorado River Authority, Texas | |||||||||
| Transmission Contract Revenue, | |||||||||
| Refunding | |||||||||
| 1,065,000 | 5.000%, 05/15/33 AMBAC Insured | A2/A/A+ | 1,070,549 | ||||||
23 | Tax-Free Fund For Utah
TAX-FREE FUND FOR UTAH
SCHEDULE OF INVESTMENTS (continued)
MARCH 31, 2013
| Rating | |||||||||
| Moody’s, S&P | |||||||||
| Principal | and Fitch | ||||||||
| Amount | Revenue Bonds (continued) | (unaudited) | Value | ||||||
| Utility (continued) | |||||||||
| Port St. Lucie, Florida Utility System | |||||||||
| Revenue | |||||||||
| $ | 1,200,000 | 5.250%, 09/01/26 NPFG Insured | |||||||
| (pre-refunded) | A1/NR/AA- | $ | 1,283,928 | ||||||
| Santa Clara, Utah Electric Revenue | |||||||||
| 1,005,000 | 4.250%, 08/01/26 AGC Insured | A3/NR/NR | 959,604 | ||||||
| Sarasota, Florida Utility System Revenue | |||||||||
| Refunding | |||||||||
| 1,455,000 | 5.000%, 10/01/27 | NR/AA+/AA | 1,759,051 | ||||||
| St. George, Utah Electric Revenue | |||||||||
| 500,000 | 4.500%, 06/01/20 AGMC Insured | A2/NR/NR | 530,340 | ||||||
| 3,750,000 | 5.000%, 06/01/38 AGMC Insured | A2/NR/NR | 4,035,337 | ||||||
| Tacoma, Washington Solid Waste Utility | |||||||||
| Revenue | |||||||||
| 1,000,000 | 5.000%, 12/01/23 Syncora Guarantee, | ||||||||
| Inc. Insured | A2/AA/AA- | 1,096,100 | |||||||
| Tallahassee, Florida Energy System | |||||||||
| Revenue Refunding | |||||||||
| 1,500,000 | 5.000%, 10/01/28 | Aa3/AA/AA- | 1,665,990 | ||||||
| Texas Municipal Power Agency Revenue | |||||||||
| Unrefunded Balance | |||||||||
| 1,665,000 | zero coupon, 09/01/14 NPFG | ||||||||
| Insured | A2/A+/A+ | 1,645,886 | |||||||
| Utah Associated Municipal Power | |||||||||
| System | |||||||||
| 1,000,000 | 5.000%, 04/01/21 AGMC Insured | ||||||||
| (pre-refunded) | A2/AA-/NR | 1,000,000 | |||||||
| Utah Associated Municipal Power System | |||||||||
| Revenue, Horse Butte Wind Project | |||||||||
| 2,120,000 | 0.050%, 09/01/13 Series A | NR/A-/A- | 2,116,947 | ||||||
| 1,005,000 | 5.000%, 09/01/32 Series A | NR/A-/A- | 1,125,811 | ||||||
| Utah Associated Municipal Power System | |||||||||
| Revenue Refunding, Payson Power | |||||||||
| Project | |||||||||
| 2,000,000 | 5.000%, 04/01/24 | NR/A-/A | 2,333,880 | ||||||
| 1,000,000 | 5.000%, 04/01/25 | NR/A-/A | 1,148,990 | ||||||
| 6,375,000 | 5.000%, 04/01/26 | NR/A-/A | 7,263,292 | ||||||
| Washington, Utah Electric Revenue | |||||||||
| 985,000 | 5.000%, 09/01/21 Syncora Guarantee, | ||||||||
| Inc. Insured | Baa1/NR/NR | 1,018,776 | |||||||
24 | Tax-Free Fund For Utah
TAX-FREE FUND FOR UTAH
SCHEDULE OF INVESTMENTS (continued)
MARCH 31, 2013
| Rating | |||||||||
| Moody’s, S&P | |||||||||
| Principal | and Fitch | ||||||||
| Amount | Revenue Bonds (continued) | (unaudited) | Value | ||||||
| Utility (continued) | |||||||||
| Washington, Utah Electric Revenue | |||||||||
| (continued) | |||||||||
| $ | 1,000,000 | 5.000%, 09/01/24 Syncora Guarantee, | |||||||
| Inc. Insured | Baa1/NR/NR | $ | 1,027,680 | ||||||
| Wyoming Municipal Power Agency | |||||||||
| Power Supply System Revenue | |||||||||
| 720,000 | 5.500%, 01/01/28 Series A | A2/A-/NR | 813,629 | ||||||
| Total Utility | 47,980,751 | ||||||||
| Water and Sewer (13.6%) | |||||||||
| Cape Coral, Florida Water & Sewer | |||||||||
| Revenue | |||||||||
| 1,000,000 | 5.000%, 10/01/36 AGMC-AMBAC | ||||||||
| Insured | A1/AA-/A | 1,100,060 | |||||||
| Central Utah Water Conservancy District | |||||||||
| 1,000,000 | 5.000%, 10/01/37 Series C | NR/AA+/AA+ | 1,148,140 | ||||||
| Central Utah Water Conservancy District | |||||||||
| Refunding, Jordanelle Hydrant | |||||||||
| 1,125,000 | 4.500%, 10/01/27 Series A | NR/AA+/AA | 1,270,507 | ||||||
| Central Weber, Utah Sewer Improvement | |||||||||
| District Revenue Refunding | |||||||||
| 1,000,000 | 5.000%, 03/01/28 Series A AGMC | ||||||||
| Insured | NR/AA-/AA | 1,125,970 | |||||||
| 2,000,000 | 4.375%, 03/01/30 Series A AGMC | ||||||||
| Insured | NR/AA-/AA | 2,145,900 | |||||||
| 4,000,000 | 5.000%, 03/01/33 Series A AGMC | ||||||||
| Insured | NR/AA-/AA | 4,435,280 | |||||||
| Davie, Florida Water & Sewer Revenue | |||||||||
| 1,000,000 | 5.000%, 10/01/32 AGMC Insured | A1/AA-/NR | 1,121,100 | ||||||
| Eagle Mountain, Utah Water and Sewer | |||||||||
| 690,000 | 4.750%, 11/15/25 NPFG Insured | Baa2/A+/AA- | 737,072 | ||||||
| Herriman City, Utah Water Revenue | |||||||||
| Refunding | |||||||||
| 1,210,000 | 4.500%, 01/01/33 AMBAC Insured | NR/A/NR | 1,270,439 | ||||||
| Jordan Valley, Utah Water Conservancy | |||||||||
| District Revenue | |||||||||
| 1,000,000 | 5.000%, 10/01/31 Series B | NR/AA+/AA | 1,149,650 | ||||||
| 6,000,000 | 5.000%, 10/01/35 Series B | NR/AA+/AA | 6,810,840 | ||||||
| King County, Washington Sewer Revenue | |||||||||
| 660,000 | 5.000%, 01/01/33 AGMC Insured | Aa2/AA+/NR | 745,048 | ||||||
25 | Tax-Free Fund For Utah
TAX-FREE FUND FOR UTAH
SCHEDULE OF INVESTMENTS (continued)
MARCH 31, 2013
| Rating | |||||||||
| Moody’s, S&P | |||||||||
| Principal | and Fitch | ||||||||
| Amount | Revenue Bonds (continued) | (unaudited) | Value | ||||||
| Water and Sewer (continued) | |||||||||
| Laredo, Texas Waterworks Sewer System | |||||||||
| Revenue | |||||||||
| $ | 1,450,000 | 5.000%, 03/01/24 Series 2010 | A1/AA-/AA- | $ | 1,719,164 | ||||
| Miami-Dade County, Florida Water | |||||||||
| and Sewer Revenue System | |||||||||
| 1,500,000 | 5.000%, 10/01/29 AGMC Insured | Aa2/AA-/A+ | 1,711,905 | ||||||
| Mountain Regional Water Special Service | |||||||||
| District Utah Water Revenue Refunding | |||||||||
| 3,000,000 | 5.000%, 12/15/33 AGMC Insured | NR/AA-/AA- | 3,424,230 | ||||||
| Murray City, Utah Sewer and Water | |||||||||
| 440,000 | 5.000%, 10/01/19 AMBAC Insured | ||||||||
| (pre-refunded) | Aa3/NR/NR | 450,410 | |||||||
| Ogden City, Utah Sewer & Water | |||||||||
| Revenue Refunding | |||||||||
| 750,000 | 4.625%, 06/15/38 AGMC Insured | Aa3/NR/NR | 797,835 | ||||||
| Orem, Utah Water & Storm Sewer | |||||||||
| Revenue | |||||||||
| 1,000,000 | 5.000%, 07/15/26 | NR/AA/AA+ | 1,140,510 | ||||||
| 1,250,000 | 5.250%, 07/15/28 | NR/AA/AA+ | 1,427,738 | ||||||
| Pleasant Grove City, Utah Storm Water | |||||||||
| Revenue | |||||||||
| 860,000 | 4.750%, 07/15/36 AGMC Insured | Aa3/AA-/AA- | 947,127 | ||||||
| Pleasant Grove City, Utah Water Revenue | |||||||||
| 450,000 | 4.300%, 12/01/20 NPFG Insured | Baa2/BBB+/NR | 476,861 | ||||||
| 760,000 | 4.625%, 12/01/23 AGMC Insured | NR/AA-/NR | 842,620 | ||||||
| 1,000,000 | 5.250%, 12/01/29 AGMC Insured | NR/AA-/NR | 1,117,410 | ||||||
| 1,370,000 | 5.000%, 12/01/31 Series B NPFG | ||||||||
| Insured | Baa2/BBB+/NR | 1,442,870 | |||||||
| Rapid City, South Dakota Water Revenue | |||||||||
| 500,000 | 5.000%, 11/01/29 | Aa3/NR/NR | 582,630 | ||||||
| 1,655,000 | 5.250%, 11/01/39 | Aa3/NR/NR | 1,873,642 | ||||||
| Salt Lake & Sandy, Utah Metropolitan | |||||||||
| Water District, Water Revenue, | |||||||||
| Refunding | |||||||||
| 1,190,000 | 5.000%, 07/01/31 Series A | NR/AA+/AA+ | 1,387,124 | ||||||
| 650,000 | 5.000%, 07/01/31 Series A | NR/AA+/AA+ | 725,849 | ||||||
| 1,000,000 | 5.000%, 07/01/37 Series A | NR/AA+/AA+ | 1,136,160 | ||||||
26 | Tax-Free Fund For Utah
TAX-FREE FUND FOR UTAH
SCHEDULE OF INVESTMENTS (continued)
MARCH 31, 2013
| Rating | |||||||||
| Moody’s, S&P | |||||||||
| Principal | and Fitch | ||||||||
| Amount | Revenue Bonds (continued) | (unaudited) | Value | ||||||
| Water and Sewer (continued) | |||||||||
| San Antonio, Texas Water Revenue | |||||||||
| Refunding | |||||||||
| $ | 1,050,000 | 5.000%, 05/15/36 NPFG Insured | Aa1/AA+/AA+ | $ | 1,141,434 | ||||
| South Valley, Utah Water Reclamation | |||||||||
| Facility Sewer Revenue | |||||||||
| 2,110,000 | 5.000%, 08/15/24 AMBAC Insured | NR/A+/NR | 2,214,023 | ||||||
| 425,000 | 5.000%, 08/15/30 AMBAC Insured | NR/A+/NR | 441,401 | ||||||
| South Weber City, Utah Water Revenue | |||||||||
| 930,000 | 5.000%, 06/01/40 AGMC Insured | NR/AA-/NR | 1,023,828 | ||||||
| Utah Water Conservancy District | |||||||||
| 1,400,000 | 5.250%, 01/15/27 | NR/A/NR | 1,536,416 | ||||||
| Utah Water Finance Agency Revenue | |||||||||
| 510,000 | 5.000%, 07/01/18 AMBAC Insured | ||||||||
| (pre-refunded) | A1/NR/NR | 515,967 | |||||||
| 970,000 | 4.000%, 10/01/20 AMBAC Insured | Aa3/NR/NR | 1,075,905 | ||||||
| 830,000 | 4.500%, 10/01/22 AMBAC Insured | Aa3/NR/NR | 883,477 | ||||||
| 870,000 | 4.500%, 10/01/23 AMBAC Insured | Aa3/NR/NR | 924,636 | ||||||
| 2,645,000 | 4.500%, 10/01/28 AMBAC Insured | Aa3/NR/NR | 2,877,972 | ||||||
| Washington County, Utah Water | |||||||||
| Conservancy District Refunding | |||||||||
| 1,770,000 | 4.500%, 10/01/24 | NR/AA/AA | 2,056,651 | ||||||
| White City, Utah Water Improvement | |||||||||
| District Revenue | |||||||||
| 500,000 | 5.000%, 02/01/23 AGMC Insured | A2/NR/NR | 546,300 | ||||||
| 700,000 | 5.000%, 02/01/25 AGMC Insured | A2/NR/NR | 759,479 | ||||||
| 840,000 | 5.000%, 02/01/27 AGMC Insured | A2/NR/NR | 905,654 | ||||||
| Total Water and Sewer | 61,167,234 | ||||||||
| Total Revenue Bonds | 338,873,176 | ||||||||
| Total Investments (cost $423,155,966 | |||||||||
| - note 4) | 97.8% | 441,351,406 | |||||||
| Other assets less liabilities | 2.2 | 9,724,442 | |||||||
| Net Assets | 100.0% | $ | 451,075,848 | ||||||
27 | Tax-Free Fund For Utah
TAX-FREE FUND FOR UTAH
SCHEDULE OF INVESTMENTS (continued)
MARCH 31, 2013
| * | Any security not rated (“NR”) by any of the Nationally Recognized Statistical Rating Organizations (“NRSRO” or “Credit Rating Agency”) has been determined by the Investment Adviser to have sufficient quality to be ranked in the top four credit ratings if a credit rating were to be assigned by a NRSRO. |
| ** | Security purchased on a delayed delivery or when-issued basis. |
| † | Illiquid security: Illiquid securities represent 0.9% of net assets. |
Notes: 144A – Private placement subject to SEC rule 144A, which modifies a two-year holding period requirement to permit qualified institutional buyers to trade these securities among themselves, thereby significantly improving the liquidity of these securities. |
| Percent of | ||||
| Portfolio Distribution by Quality Rating (unaudited) | Investments1 | |||
| Aaa of Moody’s or AAA of S&P and Fitch | 12.7 | % | ||
Pre-Refunded bonds2/ Escrowed to Maturity bonds | 6.5 | |||
| Aa of Moody’s or AA of S&P and Fitch | 43.1 | |||
| A of Moody’s or S&P and Fitch | 20.7 | |||
| Baa of Moody’s or BBB of S&P | 3.5 | |||
| BB+ of S&P | 0.2 | |||
| Not rated* | 13.3 | |||
| 100.0 | % | |||
| 1 | Calculated using the highest rating of the three NRSROs. |
2 | Pre-refunded bonds are bonds for which U.S. Government obligations usually have been placed in escrow ro retire the bonds at their earliest call date. |
PORTFOLIO ABBREVIATIONS: AGC - Assured Guaranty Corp. AGMC - Assured Guaranty Municipal Corp. AMBAC - American Municipal Bond Assurance Corp. AMT - Alternative Minimum Tax COP - Certificates of Participation FGIC - Financial Guaranty Insurance Co. FNMA - Federal National Mortgage Association IBC - Insured Bond Certificates NPFG - National Public Finance Guarantee NR - Not Rated PSF - Permanent School Fund | |
See accompanying notes to financial statements.
28 | Tax-Free Fund For Utah
TAX-FREE FUND FOR UTAH
STATEMENT OF ASSETS AND LIABILITIES
MARCH 31, 2013
| ASSETS | ||||
| Investments at value (cost $423,155,966) | $ | 441,351,406 | ||
| Cash | 8,873,732 | |||
| Interest receivable | 6,666,986 | |||
| Receivable for investment securities sold | 3,313,099 | |||
| Receivable for Fund shares sold | 304,109 | |||
| Other assets | 15,391 | |||
| Total assets | 460,524,723 | |||
| LIABILITIES | ||||
| Payble for investment securities purchased | 6,179,460 | |||
| Payable for Fund shares redeemed | 2,437,968 | |||
| Deferred income | 290,175 | |||
| Dividends payable | 198,157 | |||
| Management fees payable | 165,499 | |||
| Distribution and service fees payable | 21,540 | |||
| Accrued expenses | 156,076 | |||
| Total liabilities | 9,448,875 | |||
| NET ASSETS | $ | 451,075,848 | ||
| Net Assets consist of: | ||||
| Capital Stock - Authorized an unlimited number of shares, | ||||
| par value $0.01 per share | $ | 434,622 | ||
| Additional paid-in capital | 431,333,275 | |||
| Net unrealized appreciation on investments (note 4) | 18,195,440 | |||
| Accumulated net realized gain on investments | 931,745 | |||
| Undistributed net investment income | 180,766 | |||
| $ | 451,075,848 | |||
| CLASS A | ||||
| Net Assets | $ | 257,259,068 | ||
| Capital shares outstanding | 24,800,347 | |||
| Net asset value and redemption price per share | $ | 10.37 | ||
| Maximum offering price per share (100/96 of $10.37) | $ | 10.80 | ||
| CLASS C | ||||
| Net Assets | $ | 105,791,982 | ||
| Capital shares outstanding | 10,202,680 | |||
| Net asset value and offering price per share | $ | 10.37 | ||
| Redemption price per share (*a charge of 1% is imposed | ||||
| on the redemption proceeds, or on the original price, | ||||
| whichever is lower, if redeemed during the first 12 | ||||
| months after purchase) | $ | 10.37 | * | |
| CLASS Y | ||||
| Net Assets | $ | 88,024,798 | ||
| Capital shares outstanding | 8,459,164 | |||
| Net asset value, offering and redemption price per share | $ | 10.41 | ||
See accompanying notes to financial statements.
29 | Tax-Free Fund For Utah
TAX-FREE FUND FOR UTAH
STATEMENTS OF OPERATIONS
| Nine Months Ended | Year Ended | |||||||
March 31, 2013† | June 30, 2012 | |||||||
| Investment Income: | ||||||||
| Interest income | $ | 13,789,561 | $ | 17,881,597 | ||||
| Other income | 21,528 | 48,997 | ||||||
| 13,811,089 | 17,930,594 | |||||||
| Expenses: | ||||||||
| Management fees (note 3) | 1,678,907 | 1,944,425 | ||||||
| Distribution and service fees (note 3) | 1,164,476 | 1,350,779 | ||||||
| Legal fees | 159,760 | 104,618 | ||||||
| Transfer and shareholder servicing agent fees | 139,118 | 221,120 | ||||||
| Trustees’ fees and expenses (note 7) | 118,927 | 153,491 | ||||||
| Shareholders’ reports and proxy statements | 40,651 | 63,951 | ||||||
| Custodian fees (note 6) | 26,752 | 32,860 | ||||||
| Auditing and tax fees | 21,299 | 26,101 | ||||||
| Fund accounting fees | 19,586 | 26,115 | ||||||
| Registration fees and dues | 14,898 | 25,355 | ||||||
| Insurance | 14,820 | 14,907 | ||||||
| Chief compliance officer services (note 3) | 6,327 | 5,576 | ||||||
| Miscellaneous | 39,112 | 40,460 | ||||||
| Total expenses | 3,444,633 | 4,009,758 | ||||||
| Management fees waived (note 3) | (162,645 | ) | (195,670 | ) | ||||
| Expenses paid indirectly (note 6) | (2,093 | ) | (1,955 | ) | ||||
| Net expenses | 3,279,895 | 3,812,133 | ||||||
| Net investment income | 10,531,194 | 14,118,461 | ||||||
| Realized and Unrealized Gain (Loss) on Investments: | ||||||||
| Net realized gain from securities transactions | 1,005,127 | 1,784,883 | ||||||
| Change in unrealized appreciation on | ||||||||
| investments | 3,138,071 | 18,089,142 | ||||||
| Net realized and unrealized gain (loss) on | ||||||||
| investments | 4,143,198 | 19,874,025 | ||||||
| Net change in net assets resulting from | ||||||||
| operations | $ | 14,674,392 | $ | 33,992,486 | ||||
| † | Effective December 1, 2012, the Fund changed its fiscal year end from June 30 to March 31. The information presented is for the period July 1, 2012 to March 31, 2013. |
See accompanying notes to financial statements.
30 | Tax-Free Fund For Utah
TAX-FREE FUND FOR UTAH
STATEMENTS OF CHANGES IN NET ASSETS
| Nine Months Ended | Year Ended | Year Ended | ||||||||||
March 31, 2013† | June 30, 2012 | June 30, 2011 | ||||||||||
| OPERATIONS: | ||||||||||||
| Net investment income | $ | 10,531,194 | $ | 14,118,461 | $ | 15,669,819 | ||||||
| Net realized gain (loss) from | ||||||||||||
| securities transactions | 1,005,127 | 1,784,883 | 616,769 | |||||||||
| Change in unrealized appreciation | ||||||||||||
| (depreciation) on investments | 3,138,071 | 18,089,142 | (4,341,103 | ) | ||||||||
| Change in net assets from | ||||||||||||
| operations | 14,674,392 | 33,992,486 | 11,945,485 | |||||||||
| DISTRIBUTIONS TO SHAREHOLDERS (note 10): | ||||||||||||
| Class A Shares: | ||||||||||||
| Net investment income | (6,418,246 | ) | (8,808,164 | ) | (10,072,186 | ) | ||||||
| Class C Shares: | ||||||||||||
| Net investment income | (1,906,427 | ) | (2,616,170 | ) | (3,272,455 | ) | ||||||
| Class Y Shares: | ||||||||||||
| Net investment income | (2,171,616 | ) | (2,648,622 | ) | (2,727,358 | ) | ||||||
| Change in net assets from | ||||||||||||
| distributions | (10,496,289 | ) | (14,072,956 | ) | (16,071,999 | ) | ||||||
| CAPITAL SHARE TRANSACTIONS (note 8): | ||||||||||||
| Proceeds from shares sold | 85,792,177 | 138,764,606 | 90,761,022 | |||||||||
| Reinvested dividends and | ||||||||||||
| distributions | 7,409,642 | 8,525,121 | 9,574,958 | |||||||||
| Cost of shares redeemed | (73,826,381 | ) | (90,854,748 | ) | (124,122,693 | ) | ||||||
| Change in net assets from | ||||||||||||
| capital share transactions | 19,375,438 | 56,434,979 | (23,786,713 | ) | ||||||||
| Change in net assets | 23,553,541 | 76,354,509 | (27,913,227 | ) | ||||||||
| NET ASSETS: | ||||||||||||
| Beginning of period | 427,522,307 | 351,167,798 | 379,081,025 | |||||||||
| End of period* | $ | 451,075,848 | $ | 427,522,307 | $ | 351,167,798 | ||||||
| * Includes undistributed net | ||||||||||||
| investment income, | ||||||||||||
| respectively, of: | $ | 180,766 | $ | 143,558 | $ | 99,809 | ||||||
| † | Effective December 1, 2012, the Fund changed its fiscal year end from June 30 to March 31. The information presented is for the period July 1, 2012 to March 31, 2013. |
See accompanying notes to financial statements.
31 | Tax-Free Fund For Utah
TAX-FREE FUND FOR UTAH
NOTES TO FINANCIAL STATEMENTS
MARCH 31, 2013
1. Organization
Tax-Free Fund For Utah (the “Fund”), a non-diversified, open-end investment company, was organized on December 12, 1990 as a Massachusetts business trust and commenced operations on July 24, 1992. The Fund is authorized to issue an unlimited number of shares and, since its inception to May 21, 1996, offered only one class of shares. On that date, the Fund began offering two additional classes of shares, Class C and Class Y Shares. All shares outstanding prior to that date were designated as Class A Shares and are sold at net asset value plus a sales charge of varying size (depending upon a variety of factors) paid at the time of purchase and bear a distribution fee. Class C Shares are sold at net asset value with no sales charge payable at the time of purchase but with a level charge for service and distribution fees for six years thereafter. Class C Shares automatically convert to Class A Shares after six years. Class Y Shares are sold only through authorized financial institutions acting for investors in a fiduciary, advisory, agency, custodial or similar capacity, and are not offered directly to retail customers. Class Y Shares are sold at net asset value with no sales charge, no redemption fee, no contingent deferred sales charge (“CDSC”) and no distribution fee. On October 31, 1997, the Fund established Class I Shares which are offered and sold only through financial intermediaries and are not offered directly to retail customers. Class I Shares are sold at net asset value with no sales charge and no redemption fee or CDSC, although a financial intermediary may charge a fee for effecting a purchase or other transaction on behalf of its customers. Class I Shares carry a distribution and a service fee. As of the report date, there were no Class I Shares outstanding. All classes of shares represent interests in the same portfolio of investments and are identical as to rights and privileges but differ with respect to the effect of sales charges, the distribution and/or service fees borne by each class, expenses specific to each class, voting rights on matters affecting a single class and the exchange privileges of each class. On December 1, 2012, the Board of Trustees approved a change in the Fund’s fiscal and tax year end from June to March.
2. Significant Accounting Policies
The following is a summary of significant accounting policies followed by the Fund in the preparation of its financial statements. The policies are in conformity with accounting principles generally accepted in the United States of America for investment companies.
| a) | Portfolio valuation: Municipal securities which have remaining maturities of more than 60 days are valued each business day based upon information provided by a nationally prominent independent pricing service and periodically verified through other pricing services. In the case of securities for which market quotations are readily available, securities are valued by the pricing service at the mean of bid and asked quotations. If a market quotation or a valuation from the pricing service is not readily available, the security is valued at fair value determined in good faith under procedures established by and under the general supervision of the Board of Trustees. Securities which mature in 60 days or less are generally valued at amortized cost if their term to maturity at purchase is 60 days or less, or by amortizing their unrealized appreciation or depreciation on the 61st day prior to maturity, if their term to maturity at purchase exceeds 60 days. |
32 | Tax-Free Fund For Utah
TAX-FREE FUND FOR UTAH
NOTES TO FINANCIAL STATEMENTS (continued)
MARCH 31, 2013
| b) | Fair value measurements: The Fund follows a fair value hierarchy that distinguishes between market data obtained from independent sources (observable inputs) and the Fund’s own market assumptions (unobservable inputs). These inputs are used in determining the value of the Fund’s investments and are summarized in the following fair value hierarchy: |
Level 1 – Unadjusted quoted prices in active markets for identical assets or liabilities that the Fund has the ability to access.
Level 2 – Observable inputs other than quoted prices included in Level 1 that are observable for the asset or liability, either directly or indirectly. These inputs may include quoted prices for the identical instrument on an inactive market, prices for similar instruments, interest rates, prepayment speeds, credit risk, yield curves, default rates and similar data.
Level 3 – Unobservable inputs for the asset or liability, to the extent relevant observable inputs are not available, representing the Fund’s own assumptions about the assumptions a market participant would use in valuing the asset or liability, based on the best information available.
The inputs or methodology used for valuing securities are not an indication of the risk associated with investing in those securities
The following is a summary of the valuation inputs, representing 100% of the Fund’s investments, used to value the Fund’s net assets as of March 31, 2013:
| Valuation Inputs | Investments in Securities | ||||
| Level 1 – Quoted Prices | $ | — | |||
Level 2 – Other Significant Observable Inputs — Municipal Bonds* | 441,351,406 | ||||
| Level 3 – Significant Unobservable Inputs | — | ||||
| Total | $ | 441,351,406 | |||
*See schedule of investments for a detailed listing of securities.
| c) | Subsequent events: In preparing these financial statements, the Fund has evaluated events and transactions for potential recognition or disclosure through the date these financial statements were issued. |
| d) | Securities transactions and related investment income: Securities transactions are recorded on the trade date. Realized gains and losses from securities transactions are reported on the identified cost basis. Interest income is recorded daily on the accrual basis and is adjusted for amortization of premium and accretion of original issue and market discount. In connection with certain bonds, fee income is recognized by the Fund on a daily basis over the life of the bonds. |
| e) | Federal income taxes: It is the policy of the Fund to continue to qualify as a regulated investment company by complying with the provisions of the Internal Revenue Code applicable to certain investment companies. The Fund intends to make distributions of income and securities profits sufficient to relieve it from all, or substantially all, Federal income and excise taxes. |
33 | Tax-Free Fund For Utah
TAX-FREE FUND FOR UTAH
NOTES TO FINANCIAL STATEMENTS (continued)
MARCH 31, 2013
Management has reviewed the tax positions for each of the open tax years (2010-2012) or expected to be taken in the Fund’s 2013 tax returns and has concluded that there are no significant uncertain tax positions that would require recognition in the financial statements.
| f) | Multiple class allocations: All income, expenses (other than class-specific expenses), and realized and unrealized gains or losses are allocated daily to each class of shares based on the relative net assets of each class. Class-specific expenses, which include distribution and service fees and any other items that are specifically attributed to a particular class, are also charged directly to such class on a daily basis. |
| g) | Use of estimates: The preparation of financial statements in conformity with accounting principles generally accepted in the United States of America requires management to make estimates and assumptions that affect the reported amounts of assets and liabilities and disclosure of contingent assets and liabilities at the date of the financial statements and the reported amounts of increases and decreases in net assets from operations during the reporting period. Actual results could differ from those estimates. |
| h) | Accounting pronouncement: In January 2013, the Financial Accounting Standards Board (“FASB”) issued Accounting Standards Update (“ASU”) No. 2013-01 Clarifying the Scope of Disclosures about Offsetting Assets and Liabilities. This update gives additional clarification to the FASB ASU No. 2011-11 Disclosures about Offsetting Assets and Liabilities. The amendments in this ASU require an entity to disclose information about offsetting and related arrangements to enable users of its financial statements to understand the effect of those arrangements on its financial position. The ASU is effective for annual reporting periods beginning on or after January 1, 2013, and interim periods within those annual periods. The guidance requires retrospective application for all comparative periods presented. Management expects ASU 2013-01 to have no impact on the financial statement disclosures. |
3. Fees and Related Party Transactions
a) Management Arrangements:
Aquila Investment Management LLC (the “Manager”), a wholly-owned subsidiary of Aquila Management Corporation, the Fund’s founder and sponsor, serves as the Manager for the Fund under an Advisory and Administration Agreement with the Fund. Under the Advisory and Administration Agreement, the Manager provides all investment management and administrative services to the Fund. The Manager’s services include providing the office of the Fund and all related services as well as managing relationships with all the various support organizations to the Fund such as the shareholder servicing agent, custodian, legal counsel, fund accounting agent, auditors and distributor. For its services, the Manager is entitled to receive a fee which is payable monthly and computed as of the close of business each day at the annual rate of 0.50 of 1% on the Fund’s net assets.
The Manager has contractually undertaken to waive fees and/or reimburse Fund expenses so that total Fund expenses will not exceed 0.83% for Class A Shares, 1.63% for Class C Shares, 0.97% for Class I Shares (none of which are currently outstanding) and 0.63% for Class Y Shares. These expense limitations are in effect until October 31, 2013. Prior to October 31, 2013, the Manager may not terminate the arrangement without the approval of the Board of Trustees. For the nine months ended March 31, 2013, the Fund incurred management fees of $1,678,907 of which $162,645 was waived. For the year ended June 30, 2012, the Fund incurred management fees of $1,944,425 of which $195,670 was waived.
34 | Tax-Free Fund For Utah
TAX-FREE FUND FOR UTAH
NOTES TO FINANCIAL STATEMENTS (continued)
MARCH 31, 2013
Under a Compliance Agreement with the Manager, the Manager is compensated by the Fund for Chief Compliance Officer related services provided to enable the Fund to comply with Rule 38a-1 of the Investment Company Act of 1940.
Specific details as to the nature and extent of the services provided by the Manager are more fully defined in the Fund’s Prospectus and Statement of Additional Information.
b) Distribution and Service Fees:
The Fund has adopted a Distribution Plan (the “Plan”) pursuant to Rule 12b-1 (the “Rule”) under the Investment Company Act of 1940. Under one part of the Plan, with respect to Class A Shares, the Fund is authorized to make distribution fee payments to broker-dealers or others (“Qualified Recipients”) selected by Aquila Distributors, Inc. (the “Distributor”) including, but not limited to, any principal underwriter of the Fund, with which the Distributor has entered into written agreements contemplated by the Rule and which have rendered assistance in the distribution and/or retention of the Fund’s shares or servicing of shareholder accounts. The Fund makes payment of this distribution fee at the annual rate of 0.20% of the Fund’s average net assets represented by Class A Shares. For the nine months ended March 31, 2013, distribution fees on Class A Shares amounted to $391,892, of which the Distributor retained $11,243. For the year ended June 30, 2012, distribution fees on Class A Shares amounted to $467,376, of which the Distributor retained $14,608.
Under another part of the Plan, the Fund is authorized to make payments with respect to Class C Shares to Qualified Recipients which have rendered assistance in the distribution and/or retention of the Fund’s Class C shares or servicing of shareholder accounts. These payments are made at the annual rate of 0.75% of the Fund’s average net assets represented by Class C Shares. For the nine months ended March 31, 2013, these payments amounted to $579,438 and for the year ended June 30, 2012, amounted to $662,552. In addition, under a Shareholder Services Plan, the Fund is authorized to make service fee payments with respect to Class C Shares to Qualified Recipients for providing personal services and/or maintenance of shareholder accounts. These payments are made at the annual rate of 0.25% of the Fund’s average net assets represented by Class C Shares. For the nine months ended March 31, 2013, these payments amounted to $193,146 and for the year ended June 30, 2012, amounted to $220,851. For the nine months ended March 31, 2013, the total of these payments with respect to Class C Shares amounted to $772,584, of which the Distributor retained $161,008. For the year ended June 30, 2102, the total of these payments with respect to Class C Shares amounted to $883,403, of which the Distributor retained $180,247.
Specific details about the Plans are more fully defined in the Fund’s Prospectus and Statement of Additional Information.
Under a Distribution Agreement, the Distributor serves as the exclusive distributor of the Fund’s shares.Through agreements between the Distributor and various brokerage and advisory firms (“intermediaries”), the Fund’s shares are sold primarily through the facilities of these intermediaries having offices within Utah, with the bulk of any sales commissions inuring to such intermediaries. For the nine months ended March 31, 2013, total commissions on sales of Class A Shares amounted to $736,246, of which the Distributor received $75,350. For the year ended June 30, 2012, total commissions on sales of Class A Shares amounted to $924,226, of which the Distributor received $86,113.
35 | Tax-Free Fund For Utah
TAX-FREE FUND FOR UTAH
NOTES TO FINANCIAL STATEMENTS (continued)
MARCH 31, 2013
4. Purchases and Sales of Securities
During the nine months ended March 31, 2013, purchases of securities and proceeds from the sales of securities aggregated $87,358,349 and $73,432,312, respectively.
At March 31, 2013, the aggregate tax cost for all securities was $422,975,200. At March 31, 2013, the aggregate gross unrealized appreciation for all securities in which there is an excess of value over tax cost amounted to $19,277,777 and aggregate gross unrealized depreciation for all securities in which there is an excess of tax cost over value amounted to $901,571, for a net unrealized appreciation of $18,376,206.
5. Portfolio Orientation
At least 50% of the Fund’s assets will always consist of obligations of Utah-based issuers. At March 31, 2013, the Fund had 61% of its net assets invested in municipal obligations of issuers within Utah. The Fund is also permitted to invest in tax-free municipal obligations of non-Utah-based issuers that are exempt from regular Federal income taxes and, pursuant to an administrative determination of the Utah State Tax Commission issued under statutory authority, the interest on which is currently exempt from Utah individual income taxes. Since the Fund invests principally and may invest entirely in double tax-free municipal obligations of issuers within Utah, it is subject to possible risks associated with economic, political, or legal developments or industrial or regional matters specifically affecting Utah and whatever effects these may have upon Utah issuers’ ability to meet their obligations.
6. Expenses
The Fund has negotiated an expense offset arrangement with its custodian wherein it receives credit toward the reduction of custodian fees and other Fund expenses whenever there are uninvested cash balances. The Statement of Operations reflects the total expenses before any offset, the amount of offset and the net expenses.
7. Trustees’ Fees and Expenses
At March 31, 2013 there were 9 Trustees, one of whom is affiliated with the Manager and is not paid any fees. The total amount of Trustees’ service fees (for carrying out their responsibilities) and attendance fees paid during the nine months ended March 31, 2013 was $94,358 and for the year ended June 30, 2012, the amount was $122,661. Attendance fees are paid to those in attendance at regularly scheduled quarterly Board Meetings and meetings of the Independent Trustees held prior to each quarterly Board Meeting, as well as additional meetings (such as Audit, Nominating, Shareholder and special meetings). Trustees are reimbursed for their expenses such as travel, accommodations and meals incurred in connection with attendance at Board Meetings and the Annual Meeting of Shareholders. For the nine months ended March 31, 2013, such meeting-related expenses amounted to $24,569 and for the year ended June 30, 2012, amounted to $30,830.
36 | Tax-Free Fund For Utah
TAX-FREE FUND FOR UTAH
NOTES TO FINANCIAL STATEMENTS (continued)
MARCH 31, 2013
8. Capital Share Transactions
Transactions in Capital Shares of the Fund were as follows:
Nine Months Ended | Year Ended | Year Ended | ||||||||||
| March 31, 2013 | June 30, 2012 | June 30, 2011 | ||||||||||
| SHARES | ||||||||||||
| Class A Shares: | ||||||||||||
| Shares sold | 3,582,596 | 7,110,240 | 4,193,949 | |||||||||
| Reinvested distributions | 436,708 | 515,800 | 611,153 | |||||||||
| Shares redeemed | (4,082,135 | ) | (4,573,928 | ) | (6,624,373 | ) | ||||||
| Net change | (62,831 | ) | 3,052,112 | (1,819,271 | ) | |||||||
| Class C Shares: | ||||||||||||
| Shares sold | 2,116,197 | 3,676,797 | 2,478,584 | |||||||||
| Reinvested distributions | 138,495 | 178,950 | 218,150 | |||||||||
| Shares redeemed | (1,434,889 | ) | (2,945,514 | ) | (3,292,796 | ) | ||||||
| Net change | 819,803 | 910,233 | (596,062 | ) | ||||||||
| Class Y Shares: | ||||||||||||
| Shares sold | 2,519,087 | 2,978,473 | 2,605,011 | |||||||||
| Reinvested distributions | 134,835 | 150,033 | 154,518 | |||||||||
| Shares redeemed | (1,558,443 | ) | (1,510,885 | ) | (2,990,607 | ) | ||||||
| Net change | 1,095,479 | 1,617,621 | (231,078 | ) | ||||||||
| Total transactions in | ||||||||||||
| Fund shares | 1,852,451 | 5,579,966 | (2,646,411 | ) | ||||||||
| DOLLARS | ||||||||||||
| Class A Shares: | ||||||||||||
| Proceeds from shares sold | $ | 37,340,043 | $ | 71,675,930 | $ | 40,949,761 | ||||||
| Reinvested distributions | 4,554,571 | 5,202,390 | 5,947,989 | |||||||||
| Cost of shares redeemed | (42,595,287 | ) | (46,002,731 | ) | (63,577,122 | ) | ||||||
| Net change | (700,673 | ) | 30,875,589 | (16,679,372 | ) | |||||||
| Class C Shares: | ||||||||||||
| Proceeds from shares sold | 22,067,149 | 36,925,228 | 24,310,498 | |||||||||
| Reinvested distributions | 1,443,929 | 1,803,826 | 2,120,788 | |||||||||
| Cost of shares redeemed | (14,955,004 | ) | (29,480,749 | ) | (31,692,159 | ) | ||||||
| Net change | 8,556,074 | 9,248,305 | (5,260,873 | ) | ||||||||
| Class Y Shares: | ||||||||||||
| Proceeds from shares sold | 26,384,986 | 30,163,448 | 25,500,763 | |||||||||
| Reinvested distributions | 1,411,141 | 1,518,905 | 1,506,181 | |||||||||
| Cost of shares redeemed | (16,276,090 | ) | (15,371,268 | ) | (28,853,412 | ) | ||||||
| Net change | 11,520,037 | 16,311,085 | (1,846,468 | ) | ||||||||
| Total transactions in | ||||||||||||
| Fund shares | $ | 19,375,438 | $ | 56,434,979 | $ | (23,786,713 | ) | |||||
37 | Tax-Free Fund For Utah
TAX-FREE FUND FOR UTAH
NOTES TO FINANCIAL STATEMENTS (continued)
MARCH 31, 2013
9. Securities Traded on a When-Issued Basis
The Fund may purchase or sell securities on a when-issued basis. When-issued transactions arise when securities are purchased or sold by the Fund with payment and delivery taking place in the future in order to secure what is considered to be an advantageous price and yield to the Fund at the time of entering into the transaction. Beginning on the date the Fund enters into a when-issued transaction, cash or other liquid securities are segregated in an amount equal to or greater than the value of the when-issued transaction. These transactions are subject to market fluctuations and their current value is determined in the same manner as for other securities.
10. Income Tax Information and Distributions
The Fund declares dividends daily from net investment income and makes payments monthly. Net realized capital gains, if any, are distributed annually and are taxable. These distributions are paid in additional shares at the net asset value per share, in cash, or in a combination of both, at the shareholder’s option.
The Fund intends to maintain, to the maximum extent possible, the tax-exempt status of interest payments received from portfolio municipal securities in order to allow dividends paid to shareholders from net investment income to be exempt from regular Federal and State of Utah income taxes. Due to differences between financial statement reporting and Federal income tax reporting requirements, distributions made by the Fund may not be the same as the Fund’s net investment income, and/or net realized securities gains. In this regard, the Fund increased undistributed net investment income in the amount of $2,303, decreased additional paid-in capital in the amount of $376 and decreased net realized gain on investments by $1,927 at March 31, 2013. These adjustments had no impact on the Fund’s aggregate net assets at March 31, 2013. Further, a small portion of the dividends may, under some circumstances, be subject to taxes at ordinary income rates. For certain shareholders some dividend income may, under some circumstances, be subject to the alternative minimum tax. As a result of the passage of the Regulated Investment Company Act of 2010 (“the Act”), losses incurred in this fiscal year and beyond retain their character as short-term or long-term, have no expiration date and are utilized before capital losses incurred prior to the enactment of the Act.
The tax character of distributions:
Nine Months Ended | Year Ended June 30, | |||||||||||
| March 31, 2013 | 2012 | 2011 | ||||||||||
| Net tax-exempt income | $ | 10,496,289 | $ | 14,072,731 | $ | 15,590,252 | ||||||
| Ordinary income | – | 225 | 481,747 | |||||||||
| $ | 10,496,289 | $ | 14,072,956 | $ | 16,071,999 | |||||||
38 | Tax-Free Fund For Utah
TAX-FREE FUND FOR UTAH
NOTES TO FINANCIAL STATEMENTS (continued)
MARCH 31, 2013
As of March 31, 2013, the components of distributable earnings on a tax basis were as follows:
| Undistributed tax-exempt income | $ | 195,942 | ||
| Accumulated net realized gain | 505,061 | |||
| Unrealized appreciation | 18,376,206 | |||
| Other temporary differences | (198,157 | ) | ||
| Undistributed taxable income | 428,899 | |||
| $ | 19,307,951 |
The difference between book basis and tax basis unrealized appreciation and undistributed income is due to the timing difference in recognizing dividends paid.
11. Ongoing Development
Beginning in December 2007, the three major credit rating agencies (Standard & Poor’s, Moody’s and Fitch) downgraded or eliminated ratings of the municipal bond insurance companies due to loss of capital from investments in subprime mortgages Only a few insurers are now deemed to be investment grade. Thus, while certain bonds have insurance, some are no longer rated based upon the ratings of their insurers Furthermore, because the ability of many of the Fund’s insurers to pay claims has been downgraded, the protection of such insurance has been diminished, and there is no assurance that some of them may be relied upon for payment.
39 | Tax-Free Fund For Utah
TAX-FREE FUND FOR UTAH
FINANCIAL HIGHLIGHTS
For a share outstanding throughout each period
| Class A | ||||||||||||||||||||||||
| Nine Months | ||||||||||||||||||||||||
| Ended | Year Ended June 30, | |||||||||||||||||||||||
3/31/13† | 2012 | 2011 | 2010 | 2009 | 2008 | |||||||||||||||||||
| Net asset value, beginning of period | $ | 10.27 | $ | 9.74 | $ | 9.80 | $ | 9.35 | $ | 9.73 | $ | 9.91 | ||||||||||||
| Income (loss) from investment operations: | ||||||||||||||||||||||||
Net investment income(1) | 0.26 | 0.38 | 0.42 | 0.43 | 0.44 | 0.41 | ||||||||||||||||||
| Net gain (loss) on securities (both | ||||||||||||||||||||||||
| realized and unrealized) | 0.10 | 0.53 | (0.05 | ) | 0.47 | (0.37 | ) | (0.17 | ) | |||||||||||||||
| Total from investment operations | 0.36 | 0.91 | 0.37 | 0.90 | 0.07 | 0.24 | ||||||||||||||||||
| Less distributions (note 10): | ||||||||||||||||||||||||
| Dividends from net investment income | (0.26 | ) | (0.38 | ) | (0.43 | ) | (0.45 | ) | (0.45 | ) | (0.42 | ) | ||||||||||||
| Distributions from capital gains | – | – | – | – | – | – | ||||||||||||||||||
| Total distributions | (0.26 | ) | (0.38 | ) | (0.43 | ) | (0.45 | ) | (0.45 | ) | (0.42 | ) | ||||||||||||
| Net asset value, end of period | $ | 10.37 | $ | 10.27 | $ | 9.74 | $ | 9.80 | $ | 9.35 | $ | 9.73 | ||||||||||||
| Total return (not reflecting sales charge) | 3.48 | %(2) | 9.49 | % | 3.87 | % | 9.74 | % | 0.91 | % | 2.45 | % | ||||||||||||
| Ratios/supplemental data | ||||||||||||||||||||||||
| Net assets, end of period (in millions) | $ | 257 | $ | 255 | $ | 212 | $ | 232 | $ | 166 | $ | 158 | ||||||||||||
| Ratio of expenses to average net assets | 0.83 | %(3) | 0.83 | % | 0.83 | % | 0.80 | % | 0.75 | % | 0.63 | % | ||||||||||||
| Ratio of net investment income to | ||||||||||||||||||||||||
| average net assets | 3.28 | %(3) | 3.79 | % | 4.31 | % | 4.43 | % | 4.80 | % | 4.09 | % | ||||||||||||
| Portfolio turnover rate | 20 | %(2) | 17 | % | 25 | % | 9 | % | 25 | % | 19 | % | ||||||||||||
| The expense and net investment income ratios without the effect of the contractual expense cap were (note 3): | ||||||||||||||||||||||||
| Ratio of expenses to average net assets | 0.88 | %(3) | 0.88 | % | 0.87 | % | 0.87 | % | 0.87 | % | 0.90 | % | ||||||||||||
| Ratio of net investment income to | ||||||||||||||||||||||||
| average net assets | 3.23 | %(3) | 3.74 | % | 4.28 | % | 4.37 | % | 4.68 | % | 3.82 | % | ||||||||||||
The expense ratios after giving effect to the contractual expense cap and expense offset for uninvested cash balances were (note 3): | ||||||||||||||||||||||||
| Ratio of expenses to average net assets | 0.83 | %(3) | 0.83 | % | 0.83 | % | 0.80 | % | 0.74 | % | 0.61 | % | ||||||||||||
__________________
| (1) | Per share amounts have been calculated using the daily average shares method. |
| (2) | Not annualized. |
| (3) | Annualized. |
| † | Effective December 1, 2012, the Fund changed its fiscal year end from June 30 to March 31. The information presented is for the period July 1, 2012 to March 31, 2013. |
See accompanying notes to financial statements.
40 | Tax-Free Fund For Utah
TAX-FREE FUND FOR UTAH
FINANCIAL HIGHLIGHTS (continued)
For a share outstanding throughout each period
| Class C | ||||||||||||||||||||||||
| Nine Months | ||||||||||||||||||||||||
| Ended | Year Ended June 30, | |||||||||||||||||||||||
3/31/13† | 2012 | 2011 | 2010 | 2009 | 2008 | |||||||||||||||||||
| Net asset value, beginning of period | $ | 10.27 | $ | 9.74 | $ | 9.79 | $ | 9.34 | $ | 9.72 | $ | 9.91 | ||||||||||||
| Income (loss) from investment operations: | ||||||||||||||||||||||||
Net investment income(1) | 0.19 | 0.30 | 0.34 | 0.35 | 0.37 | 0.33 | ||||||||||||||||||
| Net gain (loss) on securities (both | ||||||||||||||||||||||||
| realized and unrealized) | 0.11 | 0.53 | (0.04 | ) | 0.47 | (0.37 | ) | (0.18 | ) | |||||||||||||||
| Total from investment operations | 0.30 | 0.83 | 0.30 | 0.82 | – | 0.15 | ||||||||||||||||||
| Less distributions (note 10): | ||||||||||||||||||||||||
| Dividends from net investment income | (0.20 | ) | (0.30 | ) | (0.35 | ) | (0.37 | ) | (0.38 | ) | (0.34 | ) | ||||||||||||
| Distributions from capital gains | – | – | – | – | – | – | ||||||||||||||||||
| Total distributions | (0.20 | ) | (0.30 | ) | (0.35 | ) | (0.37 | ) | (0.38 | ) | (0.34 | ) | ||||||||||||
| Net asset value, end of period | $ | 10.37 | $ | 10.27 | $ | 9.74 | $ | 9.79 | $ | 9.34 | $ | 9.72 | ||||||||||||
| Total return (not reflecting CDSC) | 2.86 | %(2) | 8.62 | % | 3.15 | % | 8.87 | % | 0.10 | % | 1.53 | % | ||||||||||||
| Ratios/supplemental data | ||||||||||||||||||||||||
| Net assets, end of period (in millions) | $ | 106 | $ | 96 | $ | 83 | $ | 89 | $ | 50 | $ | 32 | ||||||||||||
| Ratio of expenses to average net assets | 1.63 | %(3) | 1.63 | % | 1.63 | % | 1.60 | % | 1.55 | % | 1.43 | % | ||||||||||||
| Ratio of net investment income to | ||||||||||||||||||||||||
| average net assets | 2.47 | %(3) | 2.98 | % | 3.51 | % | 3.60 | % | 3.99 | % | 3.29 | % | ||||||||||||
| Portfolio turnover rate | 20 | %(2) | 17 | % | 25 | % | 9 | % | 25 | % | 19 | % | ||||||||||||
| The expense and net investment income ratios without the effect of the contractual expense cap were (note 3): | ||||||||||||||||||||||||
| Ratio of expenses to average net assets | 1.67 | %(3) | 1.68 | % | 1.67 | % | 1.66 | % | 1.67 | % | 1.70 | % | ||||||||||||
| Ratio of net investment income to | ||||||||||||||||||||||||
| average net assets | 2.42 | %(3) | 2.93 | % | 3.48 | % | 3.54 | % | 3.88 | % | 3.02 | % | ||||||||||||
The expense ratios after giving effect to the contractual expense cap and expense offset for uninvested cash balances were (note 3): | ||||||||||||||||||||||||
| Ratio of expenses to average net assets | 1.63 | %(3) | 1.63 | % | 1.63 | % | 1.60 | % | 1.54 | % | 1.42 | % | ||||||||||||
__________________
| (1) | Per share amounts have been calculated using the daily average shares method. |
| (2) | Not annualized. |
| (3) | Annualized. |
| † | Effective December 1, 2012, the Fund changed its fiscal year end from June 30 to March 31. The information presented is for the period July 1, 2012 to March 31, 2013. |
See accompanying notes to financial statements.
41 | Tax-Free Fund For Utah
TAX-FREE FUND FOR UTAH
FINANCIAL HIGHLIGHTS (continued)
For a share outstanding throughout each period
| Class Y | ||||||||||||||||||||||||
| Nine Months | ||||||||||||||||||||||||
| Ended | Year Ended June 30, | |||||||||||||||||||||||
3/31/13† | 2012 | 2011 | 2010 | 2009 | 2008 | |||||||||||||||||||
| Net asset value, beginning of period | $ | 10.30 | $ | 9.77 | $ | 9.83 | $ | 9.38 | $ | 9.76 | $ | 9.94 | ||||||||||||
| Income (loss) from investment operations: | ||||||||||||||||||||||||
Net investment income(1) | 0.27 | 0.40 | 0.44 | 0.45 | 0.46 | 0.43 | ||||||||||||||||||
| Net gain (loss) on securities (both | ||||||||||||||||||||||||
| realized and unrealized) | 0.11 | 0.53 | (0.05 | ) | 0.47 | (0.37 | ) | (0.17 | ) | |||||||||||||||
| Total from investment operations | 0.38 | 0.93 | 0.39 | 0.92 | 0.09 | 0.26 | ||||||||||||||||||
| Less distributions (note 10): | ||||||||||||||||||||||||
| Dividends from net investment income | (0.27 | ) | (0.40 | ) | (0.45 | ) | (0.47 | ) | (0.47 | ) | (0.44 | ) | ||||||||||||
| Distributions from capital gains | – | – | – | – | – | – | ||||||||||||||||||
| Total distributions | (0.27 | ) | (0.40 | ) | (0.45 | ) | (0.47 | ) | (0.47 | ) | (0.44 | ) | ||||||||||||
| Net asset value, end of period | $ | 10.41 | $ | 10.30 | $ | 9.77 | $ | 9.83 | $ | 9.38 | $ | 9.76 | ||||||||||||
| Total return (not reflecting CDSC) | 3.73 | %(2) | 9.69 | % | 4.08 | % | 9.94 | % | 1.13 | % | 2.67 | % | ||||||||||||
| Ratios/supplemental data | ||||||||||||||||||||||||
| Net assets, end of period (in millions) | $ | 88 | $ | 76 | $ | 56 | $ | 59 | $ | 44 | $ | 49 | ||||||||||||
| Ratio of expenses to average net assets | 0.63 | %(3) | 0.63 | % | 0.63 | % | 0.60 | % | 0.55 | % | 0.43 | % | ||||||||||||
| Ratio of net investment income to | ||||||||||||||||||||||||
| average net assets | 3.47 | %(3) | 3.98 | % | 4.51 | % | 4.64 | % | 5.00 | % | 4.29 | % | ||||||||||||
| Portfolio turnover rate | 20 | %(2) | 17 | % | 25 | % | 9 | % | 25 | % | 19 | % | ||||||||||||
| The expense and net investment income ratios without the effect of the contractual expense cap were (note 3): | ||||||||||||||||||||||||
| Ratio of expenses to average net assets | 0.68 | %(3) | 0.68 | % | 0.67 | % | 0.67 | % | 0.67 | % | 0.70 | % | ||||||||||||
| Ratio of net investment income to | ||||||||||||||||||||||||
| average net assets | 3.43 | %(3) | 3.93 | % | 4.47 | % | 4.57 | % | 4.88 | % | 4.02 | % | ||||||||||||
The expense ratios after giving effect to the contractual expense cap and expense offset for uninvested cash balances were (note 3): | ||||||||||||||||||||||||
| Ratio of expenses to average net assets | 0.63 | %(3) | 0.63 | % | 0.63 | % | 0.60 | % | 0.54 | % | 0.42 | % | ||||||||||||
__________________
| (1) | Per share amounts have been calculated using the daily average shares method. |
| (2) | Not annualized. |
| (3) | Annualized. |
| † | Effective December 1, 2012, the Fund changed its fiscal year end from June 30 to March 31. The information presented is for the period July 1, 2012 to March 31, 2013. |
See accompanying notes to financial statements.
42 | Tax-Free Fund For Utah
| Additional Information (unaudited) | ||||||||
Trustees(1) | ||||||||
| and Officers | ||||||||
| Number of | ||||||||
| Positions | Portfolios | |||||||
| Held with | in Fund | |||||||
| Name, | Fund and | Principal | Complex(4) | Other Directorships | ||||
Address(2) | Length of | Occupation(s) | Overseen | Held by Trustee | ||||
| and Year of Birth | Service(3) | During Past 5 Years | by Trustee | During Past 5 Years | ||||
Interested Trustee(5) | ||||||||
Diana P. Herrmann New York, NY (1958) | Trustee since 1997 and President since 1998 | Vice Chair and Chief Executive Officer of Aquila Management Corporation, Founder and Sponsor of the Aquila Group of Funds(6) and parent of Aquila Investment Management LLC, Manager, since 2004, President since 1997, Chief Operating Officer, 1997-2008, a Director since 1984, Secretary since 1986 and previously its Executive Vice President, Senior Vice President or Vice President, 1986-1997; Chief Executive Officer and Vice Chair since 2004, President and Manager since 2003, and Chief Operating Officer (2003-2008), of the Manager; Chair, Vice Chair, President, Executive Vice President and/or Senior Vice President of funds in the Aquila Group of Funds since 1986; Director of the Distributor since 1997; Governor, Investment Company Institute (the U.S. mutual fund industry trade organization dedicated to protecting shareholder interests and educating the public about investing) for various periods since 2004, and head of its Small Funds Committee, 2004-2009; active in charitable and volunteer organizations. | 11 | ICI Mutual Insurance Company, a Risk Retention Group (2006-2009 and since 2010); Vice Chair and Trustee of Pacific Capital Funds of Cash Assets Trust (three Aquila money-market funds) 2004-2012 | ||||
Non-interested Trustees | ||||||||
Gary C. Cornia Orem, UT (1948) | Chair of the Board of Trustees since 2005 and Trustee since 1993 | Dean, Marriott School of Management, Brigham Young University, since 2008; Director, Romney Institute of Public Management, Marriott School of Management, 2004-2008; Professor, Marriott School of Management, 1980-present; Past President, National Tax Association; Fellow, Lincoln Institute of Land Policy, 2002-present; Associate Dean, Marriott School of Management, Brigham Young University, 1991-2000; member, Utah Governor’s Tax Review Committee, 1993-2009. | 6 | Utah Foundation, Salt Lake City, UT; formerly director, Lincoln Institute of Land Policy, Cambridge, MA | ||||
43 | Tax-Free Fund For Utah
| Number of | ||||||||
| Positions | Portfolios | |||||||
| Held with | in Fund | |||||||
| Name, | Fund and | Principal | Complex(4) | Other Directorships | ||||
Address(2) | Length of | Occupation(s) | Overseen | Held by Trustee | ||||
| and Year of Birth | Service(3) | During Past 5 Years | by Trustee | During Past 5 Years |
| Tucker Hart Adams Colorado Springs, CO (1938) | Trustee since 2006 | Senior Partner, Summit Economics, since 2010; President, The Adams Group, an economic consulting firm, 1989-2010; formerly Chief Economist, United Banks of Colorado; currently or formerly active with numerous professional and community organizations. | 5 | Current or former Director of: Avista Labs (fuel cells), AgAmerica Farm Credit Bank (agricultural credit), Guaranty National Corporation (property and casualty insurance), Montana Power company (utility), ROC Communities (manufactured housing), Touch America Holdings, Inc. (telecommunications) and Mortgage Analysis Computer Corp., United Bank of Arapahoe, United Bank of Garden of the Gods and United Bank of Academy Place. | ||||
Ernest Calderón Phoenix, AZ (1957) | Trustee since 2010 | Partner, Ridenour, Heinton & Lewis, a Phoenix law firm since November 2012; Founder, Calderón Law Offices, 2004-2012; Equity Partner, Jennings, Strouss & Salmon, PLC, 1992-2004; member, regent emeritus and president emeritus Arizona Board of Regents; adjunct faculty, Northern Arizona University and Arizona State University; served six Arizona governors by appointment; Past President, Grand Canyon Council of Boy Scouts of America; Past President, State Bar of Arizona, 2003-2004; member, American Law Institute. | 3 | None |
44 | Tax-Free Fund For Utah
| Number of | ||||||||
| Positions | Portfolios | |||||||
| Held with | in Fund | |||||||
| Name, | Fund and | Principal | Complex(4) | Other Directorships | ||||
Address(2) | Length of | Occupation(s) | Overseen | Held by Trustee | ||||
| and Year of Birth | Service(3) | During Past 5 Years | by Trustee | During Past 5 Years | ||||
Thomas A. Christopher Danville, KY (1947) | Trustee since 2006 | Senior partner of Robinson, Hughes & Christopher, C.P.A.s, P.S.C., since 1977; Chairman of the Board, A Good Place for Fun, Inc., a sports facility, since 1987, President, 1987-2012; Director, Sunrise Children’s Services Inc., since 2010; Director, Global Outreach International, since 2011; currently or formerly active with various professional and community organizations. | 5 | None | ||||
Grady Gammage, Jr. Phoenix, AZ (1951) | Trustee since 2010 | Founding partner, Gammage & Burnham, PLC, a law firm, Phoenix, Arizona, since 1983; director, Central Arizona Water Conservation District, 1992-2004; director, Arizona State University Foundation since 1998; Senior Fellow, Morrison Institute for Public Policy; active with Urban Land Institute. | 5 | None | ||||
Lyle W. Hillyard Logan, UT (1940) | Trustee since 2003 | President of the law firm of Hillyard, Anderson & Olsen, Logan, Utah, since 1967; member of Utah Senate, 1985 to present, in the following positions: President, 2000, Senate Majority Leader, 1999-2000, Assistant Majority Whip, 1995-1998; served as Chairman of the following Utah Senate Committees: Tax and Revenue, Senate Judiciary Standing, Joint Executive Appropriations, and Senate Rules; currently serves as Co-Chair, Joint Executive Appropriations. | 3 | None | ||||
45 | Tax-Free Fund For Utah
| Number of | ||||||||
| Positions | Portfolios | |||||||
| Held with | in Fund | |||||||
| Name, | Fund and | Principal | Complex(4) | Other Directorships | ||||
Address(2) | Length of | Occupation(s) | Overseen | Held by Trustee | ||||
| and Year of Birth | Service(3) | During Past 5 Years | by Trustee | During Past 5 Years | ||||
John C. Lucking Phoenix, AZ (1943) | Trustee since 2004 | President, Econ-Linc, an economic consulting firm, since 1995; formerly Consulting Economist, Bank One Arizona and Chief Economist, Valley National Bank; member, Arizona’s Joint Legislative Budget Committee Economic Advisory Panel and the Western Blue Chip Economic Forecast Panel; Board member, Northern Arizona University Foundation since 1997; member, various historical, civic and economic associations. | 3 | John C. Lincoln Health Foundation | ||||
Anne J. Mills Scottsdale, AZ (1938) | Trustee since 2004 | President, Loring Consulting Company since 2001; Vice President for Business Management and CFO, Ottawa University, 1992-2001, 2006-2009; IBM Corporation, 1965-1991; currently active with various charitable, educational and religious organizations. | 5 | None |
46 | Tax-Free Fund For Utah
| Positions | ||||
| Held with | ||||
| Name, | Fund and | |||
Address(2) | Length of | |||
| and Year of Birth | Service(3) | Principal Occupation(s) During Past 5 Years |
| Officers | ||||
Charles E.Childs, III New York, NY (1957) | Executive Vice President since 2003 and Secretary since 2011 | Executive Vice President of all funds in the Aquila Group of Funds and the Manager and the Manager’s parent since 2003; Chief Operating Officer of the Manager and the Manager’s parent since 2008; Secretary of all funds in the Aquila Group of Funds since 2011; formerly Senior Vice President, corporate development, Vice President, Assistant Vice President and Associate of the Manager’s parent since 1987; Executive Vice President, Senior Vice President, Vice President or Assistant Vice President of the Aquila money-market funds, 1988-2012; Director of the Distributor since 2012. | ||
Marie E. Aro Denver, CO (1955) | Senior Vice President since 2010 | Co-President of the Distributor since 2010, Vice President, 1993-1997; Senior Vice President, Aquila Three Peaks Opportunity Growth Fund since 2004; Senior Vice President, Tax-Free Trust of Arizona since 2010 and Vice President, 2004-2010; Senior Vice President, Aquila Three Peaks High Income Fund since 2006; Senior Vice President, Churchill Tax-Free Fund of Kentucky, Hawaiian Tax-Free Trust, Aquila Narragansett Tax-Free Income Fund, Tax-Free Fund For Utah, Tax-Free Fund of Colorado and Tax-Free Trust of Oregon since 2010; Vice President, INVESCO Funds Group, 1998-2003. | ||
Paul G. O’Brien Charlotte, NC (1959) | Senior Vice President since 2010 | Co-President, Aquila Distributors, Inc. since 2010, Managing Director, 2009-2010; Senior Vice President of Aquila Three Peaks High Income Fund, Aquila Three Peaks Opportunity Growth Fund, and each of the Aquila Municipal Bond Funds since 2010; held various positions to Senior Vice President and Chief Administrative Officer of Evergreen Investments Services, Inc., 1997-2008; Mergers and Acquisitions Coordinator for Wachovia Corporation, 1994-1997. | ||
Todd W. Curtis Phoenix, AZ (1949) | Vice President and Co-Portfolio Manager since 2009 | Senior Vice President since 2004 and Portfolio Manager since 1986, Tax-Free Trust of Arizona; Vice President since 2004 and Co-Portfolio Manager since 2009, Churchill Tax-Free Fund of Kentucky, backup portfolio manager, 2004-2009; Vice President and Co-Portfolio Manager, Tax-Free Fund For Utah, since 2009; Vice President and Portfolio Manager, Banc One Investment Advisors, Inc. and its predecessors, 1981-2004. | ||
47 | Tax-Free Fund For Utah
| Positions | ||||
| Held with | ||||
| Name, | Fund and | |||
Address(2) | Length of | |||
| and Year of Birth | Service(3) | Principal Occupation(s) During Past 5 Years | ||
James T. Thompson Bountiful, UT (1955) | Vice President and Co-Portfolio Manager since 2009 | Vice President and Co-Portfolio Manager, Tax-Free Fund For Utah, since 2009; Assistant Vice President and Backup Portfolio Manager, Tax-Free Trust of Arizona and Churchill Tax-Free Fund of Kentucky, since 2009; Senior Vice President, First Security Bank/Wells Fargo Brokerage Services LLC, Salt Lake City, Utah 1991-2009. | ||
M. Kayleen Willis Salt Lake City, UT (1963) | Vice President since 2003 | Vice President, Tax-Free Fund For Utah since September 2003, Assistant Vice President, 2002-2003; Vice President, Aquila Three Peaks Opportunity Growth Fund, since 2004. | ||
Amy L. Rydalch Oakley, UT (1970) | Assistant Vice President since 2010 | Assistant Vice President since 2010, independent credit analyst, 2001-2009, for Tax-Free Fund For Utah. | ||
Randall S. Fillmore New York, NY (1960) | Chief Compliance Officer since 2012 | Chief Compliance Officer of each fund in the Aquila Group of Funds, the Manager and the Distributor since 2012; Managing Director, Fillmore & Associates, 2009-2012; Fund and Adviser Chief Compliance Officer (2002-2009), Senior Vice President - Broker Dealer Compliance (2004-2009), Schwab Funds Anti Money Laundering Officer and Identity Theft Prevention Officer (2004-2009), Vice President - Internal Audit (2000-2002), Charles Schwab Corporation; National Director, Information Systems Risk Management - Consulting Services (1999-2000), National Director, Investment Management Audit and Business Advisory Services (1992-1999), Senior Manager, Manager, Senior and Staff Roles (1983-1992), PricewaterhouseCoopers LLP. | ||
Joseph P. DiMaggio New York, NY (1956) | Chief Financial Officer since 2003 and Treasurer since 2000 | Chief Financial Officer of each fund in the Aquila Group of Funds since 2003 and Treasurer since 2000. | ||
Yolonda S. Reynolds New York, NY (1960) | Assistant Treasurer since 2010 | Assistant Treasurer of each fund in the Aquila Group of Funds since 2010; Director of Fund Accounting for the Aquila Group of Funds since 2007; Investment Accountant, TIAA-CREF, 2007; Senior Fund Accountant, JP Morgan Chase, 2003-2006. |
48 | Tax-Free Fund For Utah
| Positions | ||||
| Held with | ||||
| Name, | Fund and | |||
Address(2) | Length of | |||
| and Year of Birth | Service(3) | Principal Occupation(s) During Past 5 Years | ||
Lori A. Vindigni New York, NY (1966) | Assistant Treasurer since 2000 | Assistant Treasurer of each fund in the Aquila Group of Funds since 2000; Assistant Vice President of the Manager or its predecessor and current parent since 1998; Fund Accountant for the Aquila Group of Funds, 1995-1998. |
__________________
(1) The Fund’s Statement of Additional Information includes additional information about the Trustees and officers and is available, without charge, upon request by calling 800-437-1020 (toll-free) or by visiting www.aquilafunds.com or the EDGAR Database at the SEC’s internet site at www.sec.gov.
(2) The mailing address of each Trustee and officer is c/o Tax-Free Fund For Utah, 380 Madison Avenue, Suite 2300, New York, NY 10017.
(3) Each Trustee holds office until the next annual meeting of shareholders or until his or her successor is elected and qualifies. The term of office of each officer is one year.
(4) Includes certain Aquila-sponsored funds that are dormant and have no public shareholders.
(5) Ms. Herrmann is an interested person of the Fund as an officer of the Fund, as a director, officer and shareholder of the Manager’s corporate parent, as an officer and Manager of the Manager, and as a shareholder and director of the Distributor. Ms. Herrmann is the daughter of Lacy B. Herrmann, the Founder and former Trustee, Chairman and Chairman Emeritus of the Fund.
(6) The “Aquila Group of Funds” includes: Tax-Free Trust of Arizona, Tax-Free Fund of Colorado, Hawaiian Tax-Free Trust, Churchill Tax-Free Fund of Kentucky, Tax-Free Trust of Oregon, Aquila Narragansett Tax-Free Income Fund (Rhode Island) and Tax-Free Fund For Utah, each of which is a tax-free municipal bond fund and are called the “Aquila Municipal Bond Funds”; Aquila Three Peaks Opportunity Growth Fund, which is an equity fund; and Aquila Three Peaks High Income Fund, which is a high-income corporate bond fund.
49 | Tax-Free Fund For Utah
Analysis of Expenses (unaudited)
As a shareholder of the Fund, you may incur two types of costs: (1) transaction costs, including front-end sales charges with respect to Class A shares or contingent deferred sales charges (“CDSC”) with respect to Class C shares; and (2) ongoing costs, including management fees; distribution and/or service (12b-1) fees; and other Fund expenses. The table below is intended to help you understand your ongoing costs (in dollars) of investing in the Fund and to compare these costs with the ongoing costs of investing in other mutual funds.
The table below is based on an investment of $1,000 invested on October 1, 2012 and held for the six months ended March 31, 2013.
Actual Expenses
This table provides information about actual account values and actual expenses. You may use the information provided in this table, together with the amount you invested, to estimate the expenses that you paid over the period. To estimate the expenses you paid on your account, divide your ending account value by $1,000 (for example, an $8,600 ending account value divided by $1,000 = 8.6), then multiply the result by the number under the heading “Expenses Paid During the Period”.
Six months ended March 31, 2013
| Actual | ||||
| Total Return | Beginning | Ending | Expenses | |
| Without | Account | Account | Paid During | |
Sales Charges(1) | Value | Value | the Period(2) | |
| Class A | 1.03% | $1,000.00 | $1,010.30 | $4.16 |
| Class C | 0.62% | $1,000.00 | $1,006.20 | $8.15 |
| Class Y | 1.22% | $1,000.00 | $1,012.20 | $3.16 |
| (1) | Assumes reinvestment of all dividends and capital gain distributions, if any, at net asset value and does not reflect the deduction of the applicable sales charges with respect to Class A shares or the applicable CDSC with respect to Class C shares. Total return is not annualized, as it may not be representative of the total return for the year. |
| (2) | Expenses are equal to the annualized expense ratio of 0.83%, 1.63% and 0.63% for the Fund’s Class A, C and Y shares, respectively, multiplied by the average account value over the period, multiplied by 182/365 (to reflect the one-half year period). |
50 | Tax-Free Fund For Utah
Analysis of Expenses (unaudited) (continued)
Hypothetical Example for Comparison Purposes
The table below provides information about hypothetical account values and hypothetical expenses based on the actual expense ratio and an assumed rate of return of 5.00% per year before expenses, which is not the Fund’s actual return. The hypothetical account values and expenses may not be used to estimate the actual ending account balance or expenses you paid for the period. You may use the information provided in this table to compare the ongoing costs of investing in the Fund and other mutual funds. To do so, compare this 5.00% hypothetical example relating to the Fund with the 5.00% hypothetical examples that appear in the shareholder reports of other mutual funds.
Please note that the expenses shown in the table below are meant to highlight your ongoing costs only and do not reflect any transactional costs with respect to Class A shares. The example does not reflect the deduction of CDSC with respect to Class C shares. Therefore, the table is useful in comparing ongoing costs only, and will not help you determine the relative total costs of owning different mutual funds. In addition, if these transaction costs were included, your costs would have been higher.
Six months ended March 31, 2013
| Hypothetical | ||||
| Annualized | Beginning | Ending | Expenses | |
| Total | Account | Account | Paid During | |
| Return | Value | Value | the Period(1) | |
| Class A | 5.00% | $1,000.00 | $1,020.79 | $4.18 |
| Class C | 5.00% | $1,000.00 | $1,016.80 | $8.20 |
| Class Y | 5.00% | $1,000.00 | $1,021.79 | $3.18 |
| (1) | Expenses are equal to the annualized expense ratio of 0.83%, 1.63% and 0.63% for the Fund’s Class A, C and Y shares, respectively, multiplied by the average account value over the period, multiplied by 182/365 (to reflect the one-half year period). |
51 | Tax-Free Fund For Utah
Information Available (unaudited)
Much of the information that the funds in the Aquila Group of Funds produce is automatically sent to you and all other shareholders. Specifically, you are routinely sent your Fund’s entire list of portfolio securities twice a year in the semi-annual and annual reports you receive. Additionally, under Fund policies, the Manager publicly discloses the complete schedule of the Fund’s portfolio holdings, as of each calendar quarter, generally by the 15th day after the end of each calendar quarter. Such information remains accessible until the next schedule is made publicly available. You may obtain a copy of the Fund’s portfolio holdings schedule for the most recently completed period by visiting the Fund’s website at www.aquilafunds.com. The Fund may also disclose other portfolio holdings as of a specified date (currently the Fund discloses its five largest holdings and/or sector holdings by value as of the close of the last business day of each calendar month in a posting to its website on approximately the 5th business day following the month end). This information remains on the website until the next such posting. Whenever you wish to see a listing of your Fund’s portfolio other than in your shareholder reports, please check our website at www.aquilafunds.com or call us at 1-800-437-1020.
The Fund additionally files a complete list of its portfolio holdings with the SEC for the first and third quarters of each fiscal year on Form N-Q. Forms N-Q are available free of charge on the SEC website at www.sec.gov. You may also review or, for a fee, copy the forms at the SEC’s Public Reference Room in Washington, D.C. or by calling 1-800-SEC-0330.
Proxy Voting Record (unaudited)
During the 12 month period ended June 30, 2012, the Fund did not hold any portfolio securities for which the Fund was entitled to participate in proxy voting. Applicable regulations require us to inform you that the Fund’s proxy voting information is available on the SEC website at www.sec.gov.
Federal Tax Status of Distributions (unaudited)
This information is presented in order to comply with a requirement of the Internal Revenue Code. No action on the part of shareholders is required.
For the fiscal year ended March 31, 2013, $10,496,289 of dividends paid by Tax-Free Fund For Utah, constituting 100% of total dividends paid during fiscal 2013, were exempt-interest dividends.
Prior to February 15, 2013, shareholders were mailed the appropriate tax form(s) which contained information on the status of distributions paid for the 2012 calendar year.
52 | Tax-Free Fund For Utah
PRIVACY NOTICE (unaudited)
Tax-Free Fund of Utah
Our Privacy Policy. In providing services to you as an individual who owns or is considering investing in shares of the Fund, we collect certain non-public personal information about you. Our policy is to keep this information strictly safeguarded and confidential, and to use or disclose it only as necessary to provide services to you or as otherwise permitted by law. Our privacy policy applies equally to former shareholders and persons who inquire about the Fund.
Information We Collect. ”Non-public personal information” is personally identifiable financial information about you as an individual or your family. The kinds of non-public personal information we have about you may include the information you provide us on your share purchase application or in telephone calls or correspondence with us, and information about your fund transactions and holdings, how you voted your shares and the account where your shares are held.
Information We Disclose. We disclose non-public personal information about you to companies that provide necessary services to us, such as the Fund’s transfer agent, distributor, investment adviser or sub-adviser, if any, as permitted or required by law, or as authorized by you. Any other use is strictly prohibited. We do not sell information about you or any of our fund shareholders to anyone.
Non-California Residents: We also may disclose some of this information to another fund in the Aquila Group of Funds (or its service providers) under joint marketing agreements that permit the funds to use the information only to provide you with information about other funds in the Aquila Group of Funds or new services we are offering that may be of interest to you.
California Residents Only: In addition, unless you “opt-out” of the following disclosures using the form that was mailed to you under separate cover, we may disclose some of this information to another fund in the Aquila Group of Funds (or its service providers) under joint marketing agreements that permit the funds to use the information only to provide you with information about other funds in the Aquila Group of Funds or new services we are offering that may be of interest to you.
How We Safeguard Your Information. We restrict access to non-public personal information about you to only those persons who need it to provide services to you or who are permitted by law to receive it. We maintain physical, electronic and procedural safeguards to protect the confidentiality of all non-public personal information we have about you.
If you have any questions regarding our Privacy Policy, please contact us at 1-800-437-1020.
Aquila Investment Management LLC
Aquila Distributors, Inc.
This Privacy Policy also has been adopted by Aquila Investment Management LLC and Aquila Distributors, Inc. and applies to all non-public information about you that each of these companies may obtain in connection with services provided to the Fund or to you as a shareholder of the Fund.
53 | Tax-Free Fund For Utah
Founders
Lacy B. Herrmann (1929-2012)
Aquila Management Corporation, Sponsor
Manager
AQUILA INVESTMENT MANAGEMENT LLC
380 Madison Avenue, Suite 2300
New York, New York 10017
Board of Trustees
Gary C. Cornia, Chair
Tucker Hart Adams
Ernest Calderón
Thomas A. Christopher
Grady Gammage, Jr.
Diana P. Herrmann
Lyle W. Hillyard
John C. Lucking
Anne J. Mills
Officers
Diana P. Herrmann, President
Charles E. Childs, III, Executive Vice President and Secretary
Marie E. Aro, Senior Vice President
Paul G. O’Brien, Senior Vice President
Todd W. Curtis, Vice President and Co-Portfolio Manager
James T. Thompson, Vice President and Co-Portfolio Manager
M. Kayleen Willis, Vice President
Randall S. Fillmore, Chief Compliance Officer
Joseph P. DiMaggio, Chief Financial Officer and Treasurer
Distributor
AQUILA DISTRIBUTORS, INC.
380 Madison Avenue, Suite 2300
New York, New York 10017
Transfer and Shareholder Servicing Agent
BNY MELLON 4400 Computer Drive Westborough, Massachusetts 01581
Custodian
JPMORGAN CHASE BANK, N.A.
1111 Polaris Parkway
Columbus, Ohio 43240
Independent Registered Public Accounting Firm
TAIT, WELLER & BAKER LLP
1818 Market Street, Suite 2400
Philadelphia, Pennsylvania 19103
Further information is contained in the Prospectus,
which must precede or accompany this report.
| ITEM 2. | CODE OF ETHICS. |
(a) As of March 31, 2013 (the end of the reporting period) the Trust has adopted a code of ethics that applies to the Trust's principal executive officer(s)and principal financial officer(s) and persons performing similar functions ("Covered Officers") as defined in the Aquila Group of Funds Code of Ethics for Principal Executive and Senior Financial Officers under Section 406 of the Sarbanes-Oxley Act of 2002, as amended;
(f)(1) Pursuant to Item 10(a)(1), a copy of the Trust's Code of Ethics that applies to the Trust's principal executive officer(s) and principal financial officer(s) and persons performing similar functions is included as an exhibit to its annual report on this Form N-CSR;
(f)(2) The text of the Trust's Code of Ethics that applies to the Trust's principal executive officer(s) and principal financial officer(s) and persons performing similar functions has been posted on its Internet website which can be found at the Trust's Internet address at aquilafunds.com.
| ITEM 3. | AUDIT COMMITTEE FINANCIAL EXPERT. |
(a)(1)(i) The Registrant's board of trustees has determined that Ms. Anne J. Mills, a member of its audit committee, is an audit committee financial expert. Ms. Mills is 'independent' as such term is defined in Form N-CSR.
| ITEM 4. | PRINCIPAL ACCOUNTANT FEES AND SERVICES. |
a) Audit Fees - The aggregate fees billed for professional services rendered by the principal accountant for the audit of the Registrant's annual financial statements were $21,100 in 2012 and $17,900 in 2013.
b) Audit Related Fees - There were no amounts billed for audit-related fees over the past two years.
c) Tax Fees - The Registrant was billed by the principal accountant $3,400 and $3,400 in 2012 and 2013, respectively, for return preparation and tax compliance.
d) All Other Fees - There were no additional fees paid for audit and non-audit services other than those disclosed in a) thorough c) above.
e)(1) Currently, the audit committee of the Registrant pre-approves audit services and fees on an engagement-by-engagement basis
e)(2) None of the services described in b) through d) above were approved by the audit committee pursuant to paragraph (c)(7)(i)(C) of Rule 2-01 of Regulation S-X, all were pre-approved on an engagement-by-engagement basis.
f) No applicable.
g) There were no non-audit services fees billed by the Registrant's accountant to the Registrant's investment adviser or distributor over the past two years
h) Not applicable.
| ITEM 5. | AUDIT COMMITTEE OF LISTED REGISTRANTS. |
Not applicable.
| ITEM 6. | SCHEDULE OF INVESTMENTS. |
Included in Item 1 above
| ITEM 7. | DISCLOSURE OF PROXY VOTING POLICIES AND PROCEDURES FORCLOSED-END MANAGEMENT INVESTMENT COMPANIES. |
Not applicable.
| ITEM 8. | PORTFOLIO MANAGERS OF CLOSED-END MANAGEMENT INVESTMENT COMPANIES. |
Not applicable.
| ITEM 9. | PURCHASES OF EQUITY SECURITIES BY CLOSED-END MANAGEMENT INVESTMENTCOMPANY AND AFFILIATED PURCHASERS. |
Not applicable.
| ITEM 10. | SUBMISSION OF MATTERS TO A VOTE OF SECURITY HOLDERS. |
The Board of Directors of the Registrant has adopted a Nominating Committee Charter which provides that the Nominating Committee (the 'Committee') may consider and evaluate nominee candidates properly submitted by shareholders if a vacancy among the Independent Trustees of the Registrant occurs and if, based on the Board's then current size, composition and structure, the Committee determines that the vacancy should be filled. The Committee will consider candidates submitted by shareholders on the same basis as it considers and evaluates candidates recommended by other sources. A copy of the qualifications and procedures that must be met or followed by shareholders to properly submit a nominee candidate to the Committee may be obtained by submitting a request in writing to the Secretary of the Registrant.
| ITEM 11. | CONTROLS AND PROCEDURES. |
(a) Based on their evaluation of the registrant's disclosure controls and procedures (as defined in Rule 30a-2(c) under the Investment Company Act of 1940) as of a date within 90 days of the filing of this report, the registrant's chief financial and executive officers have concluded that the disclosure controls and procedures of the registrant are appropriately designed to ensure that information required to be disclosed in the registrant's reports that are filed under the Securities Exchange Act of 1934 are accumulated and communicated to registrant's management, including its principal executive officer(s) and principal financial officer(s), to allow timely decisions regarding required disclosure and is recorded, processed, summarized and reported, within the time periods specified in the rules and forms adopted by the Securities and Exchange Commission.
(b) There have been no significant changes in registrant's internal controls or in other factors that could significantly affect registrant's internal controls subsequent to the date of the most recent evaluation, including no significant deficiencies or material weaknesses that required corrective action.
| ITEM 12. | EXHIBITS. |
(a)(1) Aquila Group of Funds Code of Ethics for Principal Executive and Senior Financial Officers under Section 406 of the Sarbanes-Oxley Act of 2002, as amended.
(a)(2) Certifications of principal executive officer and principal financial officer as required by Rule 30a-2(a) under the Investment Company Act of 1940.
(b) Certifications of principal executive officer and principal financial officer as required by Rule 30a-2(b) under the Investment Company Act of 1940.
SIGNATURES
Pursuant to the requirements of the Securities Exchange Act of 1934 and the Investment Company Act of 1940, the registrant has duly caused this report to be signed on its behalf by the undersigned thereunto duly authorized.
TAX-FREE FUND FOR UTAH
| By: | /s/ Diana P. Herrmann | |
President and Trustee June 3, 2013 | ||
| By: | /s/ Joseph P. DiMaggio | |
Chief Financial Officer and Treasurer June 3, 2013 |
Pursuant to the requirements of the Securities Exchange Act of 1934 And the Investment Company Act of 1940, this report has been signed below by the following persons on behalf of the registrant and in the capacities and on the dates indicated.
| By: | /s/ Diana P. Herrmann | |
Diana P. Herrmann President and Trustee June 3, 2013 | ||
| By: | /s/ Joseph P. DiMaggio | |
Joseph P. DiMaggio Chief Financial Officer and Treasurer June 3, 2013 |
TAX-FREE FUND FOR UTAH
EXHIBIT INDEX
(a)(1) Aquila Group of Funds Code of Ethics for Principal Executive and Senior Financial Officers under Section 406 of the Sarbanes-Oxley Act of 2002, as amended.
(a) (2) Certifications of principal executive officer and principal financial officer as required by Rule 30a-2(a) under the Investment Company Act of 1940.
(b) Certification of chief executive officer and chief financial officer as required by Rule 30a-2(b) of the Investment Company Act of 1940.