UNITED STATES
SECURITIES AND EXCHANGE COMMISSION
WASHINGTON, D.C. 20549
FORM N-CSR
CERTIFIED SHAREHOLDER REPORT OF REGISTERED MANAGEMENT
INVESTMENT COMPANIES
Investment Company Act file number 811-6239
Tax-Free Fund for Utah
(Exact name of Registrant as specified in charter)
380 Madison Avenue
New York, New York 10017
(Address of principal executive offices) (Zip code)
Joseph P. DiMaggio
380 Madison Avenue
New York, New York 10017
(Name and address of agent for service)
Registrant's telephone number, including area code: (212) 697-6666
Date of fiscal year end: 6/30/12
Date of reporting period: 6/30/12
FORM N-CSR
ITEM 1. REPORTS TO STOCKHOLDERS.
Annual Report |
| June 30, 2012 |
 TAX-FREE FUND FOR UTAH A tax-free income investment  |
 | Serving Utah Investors For Two Decades Tax-Free Fund For Utah “Research Matters” |  |
August, 2012
Dear Fellow Shareholder:
While we didn’t necessarily coin the phrases, “Invest in what you know” or “If you don’t understand it, don’t buy it,” these concepts are certainly not new to Tax-Free Fund For Utah and the Aquila Group of Funds. In fact, they have been at the very core of our investment philosophy since day one.
Our country’s current volatile economic environment makes these adages ring true louder than ever.
The value provided by professional investment managers, such as those at Tax-Free Fund For Utah, who conduct initial research and provide on-going surveillance of issuers and individual bonds as markets develop and credit conditions change, has become increasingly important.
Over the past year or so, you may have read or heard about problems being experienced by certain municipalities – including growing concerns over budget shortfalls, infrastructure demands, pension funding, and high unemployment.
Even when concerns such as these don’t make the mainstream newspapers, it is in your best interest that your Fund’s investment team makes every effort to know about each and every little hiccup. And, since each municipality has its own distinct nuances, we feel it is vital to have a local presence.
Local investment management and research enables us to monitor the local economy, issuers in the state, and policy decisions that will impact issuers, while we conduct research on issues held by the Fund. The research conducted prior to investing in a bond, and ongoing credit monitoring, make it possible to evaluate both the risk associated with an individual bond, and the adequacy of the compensation provided for that risk.
Tax-Free Fund For Utah specifically benefits from its collective team of local Trustees, local Fund Officers and a local portfolio management team, including analysts, who seek to be intimately aware of any potential challenges facing the citizens of Utah throughout the state.
They know the ups and downs that affect you, our shareholders, because they too are affected. Your local representatives are also your friends, neighbors and co-workers.
They hear the same discussions at little league games and pot luck dinners. They read the same small and big town newspapers that you do, shop in the same supermarkets and gas up at the same pumps.
NOT A PART OF THE ANNUAL REPORT
They, like you, are Utahns.
As you know, by prospectus, Tax-Free Fund For Utah may only invest in investment grade securities. These higher rated securities are intended to indicate those municipal issues which have not only sufficient, but significant, cash flow strength in order to pay interest when due and to redeem the bonds at maturity. Nonetheless, we firmly believe in the importance of looking beyond credit ratings.
We invest in an issue based on our initial research, and we conduct frequent credit monitoring in order to evaluate the financial condition of the issuer. We devote significant resources to understanding the financial condition of issuers in Utah, the financing details of individual issues, and how payments of principal and interest on those issues are secured. We monitor the difficult, but necessary, steps being taken to balance budgets within the state. Based on the research we conduct, we select the bonds held in the Fund’s portfolio and decide whether or not to continue holding issues already in the portfolio.
The Aquila Group of Funds has been managing the assets of Utah investors for over 20 years. Our long history in the Utah market, the knowledge and experience of the Fund’s portfolio manager, and the research conducted on bonds held in Tax-Free Fund For Utah continue to provide shareholders with the benefits of local, professional investment management.
Sincerely,
 |  |  |
| Lacy B. Herrmann Founder and Chairman Emeritus | Diana P. Herrmann President |
Consideration should be given to the risks of investing, including potential loss of value, market risk, interest rate risk, credit risk, and geographic concentration. Past performance does not guarantee future results. Investment return and principal value will fluctuate so that an investor’s shares, when redeemed, may be worth more or less than their original cost. For certain investors, some dividends may be subject to Federal and state taxes, including the Alternative Minimum Tax (AMT).
NOT A PART OF THE ANNUAL REPORT
| Serving Utah Investors For Two Decades Tax-Free Fund For Utah ANNUAL REPORT Management Discussion | |
Fund Performance
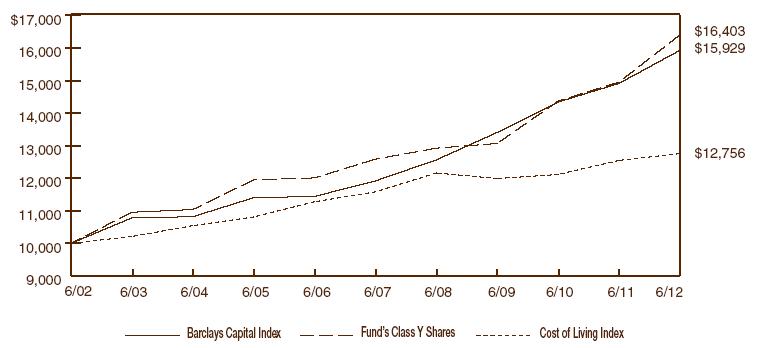
Tax-Free Fund For Utah had a total return of 9.49%, without sales charges, for its Class A shares, 8.62% without CDSC for Class C shares and 9.69% for the Class Y shares for the fiscal year ended June 30, 2012. The Barclays Capital Quality Intermediate Municipal Bond Index had a total return of 6.81% for the same period. (It should be noted that the index does not include any operating expenses, or sales charges, and being nationally oriented, does not reflect state-specific bond market performance for the limited number of states in which the Fund may invest.)
Municipal Market
Tax-Free Fund For Utah seeks as high a level of current income exempt from Utah state and regular Federal income taxes as is consistent with preservation of capital. While total return is one measure of overall investment performance, the Fund emphasizes both current state and federal tax exempt income and preservation of capital. In our efforts to continue to meet these goals, Tax-Free Fund For Utah has increased the amount of “AAA” rated bonds from 9% at the time of the 2011 fiscal year-end to 12% at the latest June 30, 2012 fiscal year end, and we have reduced the amount of non-rated and private placement debt from 21% in 2011 to 16% as of June 30, 2012.
Overall interest rates have declined during the past year, and municipal interest rates have also seen a sharp decline. The interest rate on a ten-year municipal on June 30, 2011 was approximately 2.89%, while at the same date in 2012 the rate was 1.86%. The over 100 basis point drop in interest rates has helped the Fund’s share price rise and increased total return. In this low interest rate environment, many municipalities have taken the opportunity to lower their borrowing costs by refinancing existing debt. These refinancings are helping the municipalities to cope with the lower tax revenues they have received over the past few years.
U.S. Economy
There are many lingering policy decisions on potential tax increases, including some uncertainty on the impact to tax-exempt municipal bonds. These uncertainties have generally made tax-exempt municipal bonds more attractive relative to investing in U.S. Treasuries and government agencies.
We believe, that as long as rates remain low, municipal borrowers will continue to refinance their debt, thereby reducing their interest expenses. We also feel that with the talk about tax rates and funding of Federal programs, such as health care, there will continue to be demand for investments, like tax-exempt bonds, that keep income from being taxed.
1
MANAGEMENT DISCUSSION (continued)
The Federal Reserve has said that they see interest rates staying low into 2014. The economies of the world have shown weakness in the past few months and this, in turn has slowed the economic growth of the U.S. If the U.S. economy continues to show downside risk, the Federal Reserve is ready to act, using Operation Twist and maybe introducing QE III. Growth, according to most economists, is around 2%, with inflation at the consumer level at about the same rate. During an election year, and with unemployment above 8%, there appears to be no upward pressure on inflation, keeping interest rates low for the foreseeable future.
Utah Economy
The State of Utah has seen the fruits of the tough cuts made by its legislature. For the second year in a row, the State will benefit by a budget surplus. Most state municipalities are also faring better after the deep cuts that were made, and with their capability to reduce interest expenses due to low interest rates, we see a bright future in investing here in Utah. Tax-Free Fund For Utah has increased its investments in Utah-based issuers from over $200 million at June 30, 2011 to over $250 million at June 30, 2012. We intend to continue to invest in our Utah communities and search for credits that are of the same quality in the other states that offer tax exemption for Utah.
Outlook and Strategy
For the past two years Tax-Free Fund For Utah has taken a defensive position in regard to interest rates. We generally seek to use this strategy in an effort to stabilize the Net Asset Value when there are indications of rising interest rates. With the economy slowing and no indication of a rise in interest rates for the foreseeable future, we intend to take an approach that should allow us to take advantage of higher interest rates on the long end of the curve, while at the same time increasing the amount of bonds on the short end of the curve. We expect this strategy, which is known as a barbell structure, to allow the Fund to continue delivering a reasonably high level of tax-free income while maintaining a relatively stable share price.
Performance data represents past performance, but does not guarantee future results. Investment return and principal value will fluctuate; shares, when redeemed, may be worth more or less than their original cost; current performance may be lower or higher than the data presented.
NOT FDIC INSURED – NO BANK GUARANTEE – MAY LOSE VALUE
2
PERFORMANCE REPORT
The following graph illustrates the value of $10,000 invested in the Class Y shares of Tax-Free Fund For Utah for the 10-year period ended June 30, 2012 as compared with the Barclays Capital Quality Intermediate Municipal Bond Index (the “Barclays Capital Index”) and the Consumer Price Index (a cost of living index). The performance of each of the other classes is not shown in the graph but is included in the table below. It should be noted that the Barclays Capital Index does not include any operating expenses nor sales charges, and being nationally oriented, does not reflect state-specific bond market performance for the limited number of states in which Tax-Free Fund for Utah may invest.
| Average Annual Total Return | |||||||||||||||||
| for periods ended June 30, 2012 | |||||||||||||||||
| Since | |||||||||||||||||
| Class and Inception Date | 1 Year | 5 Years | 10 Years | Inception | |||||||||||||
| Class A (commenced operations on 7/24/92) | |||||||||||||||||
| With Maximum Sales Charge | 5.07 | % | 4.38 | % | 4.46 | % | 5.14 | % | |||||||||
| Without Sales Charge | 9.49 | 5.23 | 4.88 | 5.36 | |||||||||||||
| Class C (commenced operations on 5/21/96) | |||||||||||||||||
| With CDSC* | 7.59 | 4.39 | 4.04 | 4.23 | |||||||||||||
| Without CDSC | 8.62 | 4.39 | 4.04 | 4.23 | |||||||||||||
| Class Y (commenced operations on 5/21/96) | |||||||||||||||||
| No Sales Charge | 9.69 | 5.44 | 5.07 | 5.37 | |||||||||||||
| Barclays Capital Index | 6.81 | 5.97 | 4.77 | 5.40 | (Class A) | ||||||||||||
| 5.23 | (Class C & Y) | ||||||||||||||||
Total return figures shown for the Fund reflect any change in price and assume all distributions within the period were invested in additional shares. The rates of return will vary and the principal value of an investment will fluctuate with market conditions. Shares, if redeemed, may be worth more or less than their original cost. A portion of each class’s income may be subject to Federal and state income taxes and/or the Federal Alternative Minimum Tax (AMT). Past performance is not predictive of future investment results.
* CDSC = 1% contingent deferred sales charge imposed on redemptions made within the first 12 months after purchase.
3
REPORT OF INDEPENDENT REGISTERED PUBLIC ACCOUNTING FIRM
To the Board of Trustees and Shareholders of
Tax-Free Fund For Utah:
We have audited the accompanying statement of assets and liabilities, including the schedule of investments, of Tax-Free Fund For Utah as of June 30, 2012 and the related statement of operations for the year then ended, the statements of changes in net assets for each of the two years in the period then ended, and the financial highlights for each of the five years in the period then ended. These financial statements and financial highlights are the responsibility of the Fund’s management. Our responsibility is to express an opinion on these financial statements and financial highlights based on our audits.
We conducted our audits in accordance with the standards of the Public Company Accounting Oversight Board (United States). Those standards require that we plan and perform the audit to obtain reasonable assurance about whether the financial statements and financial highlights are free of material misstatement. The Fund is not required to have, nor were we engaged to perform, an audit of the Fund’s internal control over financial reporting. Our audits included consideration of internal control over financial reporting as a basis for designing audit procedures that are appropriate in the circumstances, but not for the purpose of expressing an opinion on the effectiveness of the Fund’s internal control over financial reporting. Accordingly, we express no such opinion. An audit also includes examining, on a test basis, evidence supporting the amounts and disclosures in the financial statements. Our procedures included confirmation of securities owned as of June 30, 2012, by correspondence with the custodian and brokers, or by other appropriate auditing procedures where replies from brokers were not received. An audit also includes assessing the accounting principles used and significant estimates made by management, as well as evaluating the overall financial statement presentation. We believe that our audits provide a reasonable basis for our opinion.
In our opinion, the financial statements and financial highlights referred to above present fairly, in all material respects, the financial position of Tax-Free Fund For Utah as of June 30, 2012, the results of its operations for the year then ended, the changes in its net assets for each of the two years in the period then ended, and the financial highlights for each of the five years in the period then ended, in conformity with accounting principles generally accepted in the United States of America.
TAIT, WELLER & BAKER LLP
Philadelphia, Pennsylvania
August 28, 2012
4
| TAX-FREE FUND FOR UTAH | |||
| SCHEDULE OF INVESTMENTS | |||
| JUNE 30, 2012 |
| Rating | |||||||||
| Moody’s, S&P | |||||||||
| Principal | and Fitch | ||||||||
| Amount | General Obligation Bonds (21.8%) | (unaudited) | Value | ||||||
| City, County and State (5.9%) | |||||||||
| Anderson, Indiana San District | |||||||||
| $ | 505,000 | 4.600%, 07/15/23 AMBAC Insured | A1/A-/NR | $ | 524,311 | ||||
| Clark County, Nevada, Refunding | |||||||||
| 2,000,000 | 5.000%, 11/01/28 AGMC Insured | Aa1/AA+/AA | 2,199,260 | ||||||
| Clark County, Nevada, Refunding | |||||||||
| 1,000,000 | 5.000%, 07/01/23 Series B | Aa1/AA+/NR | 1,139,000 | ||||||
| Coral Canyon, Utah Special Service District | |||||||||
| 120,000 | 4.850%, 07/15/17 | NR/NR/NR* | 120,347 | ||||||
| 580,000 | 5.700%, 07/15/18 | NR/NR/NR* | 580,104 | ||||||
| Harris County, Texas Utility District #268 | |||||||||
| 905,000 | 4.375%, 09/01/27 Radian Insured | NR/NR/NR* | 909,299 | ||||||
| Houston, Texas Public Improvement | |||||||||
| 1,000,000 | 5.000%, 03/01/29 | Aa2/AA/NR | 1,131,410 | ||||||
| King County, Washington School District #401 | |||||||||
| 1,000,000 | 4.500%, 12/01/25 AGMC School Board Guaranty | ||||||||
| Insured | Aa1/AA+/NR | 1,089,950 | |||||||
| Laredo, Texas | |||||||||
| 500,000 | 4.500%, 02/15/24 NPFG Insured | Aa2/AA-/AA | 523,305 | ||||||
| Las Vegas Valley, Nevada Water District Refunding | |||||||||
| & Water Improvement | |||||||||
| 1,500,000 | 5.000%, 06/01/27 Series A NPFG/ FGIC Insured | ||||||||
| (pre-refunded) | Aa2/AA+/NR | 1,529,355 | |||||||
| McKinney, Texas | |||||||||
| 1,700,000 | 4.500%, 08/15/23 Syncora Guarantee, Inc. Insured | Aa1/AA+/NR | 1,803,224 | ||||||
| 1,375,000 | 5.000%, 08/15/24 AMBAC Insured | Aa1/AA+/NR | 1,535,806 | ||||||
| Montgomery County, Texas | |||||||||
| 2,975,000 | 5.250%, 03/01/32 | Aa1/AA/NR | 3,343,543 | ||||||
| Puerto Rico Commonwealth Refunding, Public | |||||||||
| Improvement | |||||||||
| 500,000 | 5.375%, 07/01/28 AGMC Insured Series C | Aa3/AA-/BBB+ | 531,745 | ||||||
| San Patricio County, Texas | |||||||||
| 450,000 | 4.600%, 04/01/25 AMBAC Insured | Aa3/NR/NR | 473,314 | ||||||
| Texas State Transportation Commission Mobility Fund | |||||||||
| 1,000,000 | 4.500%, 04/01/33 | Aaa/AA+/AAA | 1,065,310 | ||||||
5
| TAX-FREE FUND FOR UTAH | |||
| SCHEDULE OF INVESTMENTS (continued) | |||
| JUNE 30, 2012 |
| Rating | |||||||||
| Moody’s, S&P | |||||||||
| Principal | and Fitch | ||||||||
| Amount | General Obligation Bonds (continued) | (unaudited) | Value | ||||||
| City, County and State (continued) | |||||||||
| Washington State, Series D | |||||||||
| $ | 2,000,000 | 5.000%, 01/01/29 AMBAC Insured (pre-refunded) | Aa1/AA+/AA+ | $ | 2,138,300 | ||||
| Washington State Various Purpose | |||||||||
| 1,405,000 | 5.000%, 07/01/30 Series A | Aa1/AA+/AA+ | 1,600,604 | ||||||
| 2,465,000 | 5.000%, 07/01/31 Series A | Aa1/AA+/AA+ | 2,801,892 | ||||||
| Total City, County and State | 25,040,079 | ||||||||
| Education - Public Schools (1.0%) | |||||||||
| Carbon County, Wyoming School District #1 | |||||||||
| (Rawlins Building) | |||||||||
| 2,050,000 | 4.500%, 06/15/28 | NR/A+/NR | 2,211,929 | ||||||
| Florida State Board of Education Public Education | |||||||||
| Capital Outlay | |||||||||
| 2,000,000 | 4.750%, 06/01/30 2005 Series F | Aa1/AAA/AAA | 2,182,220 | ||||||
| Total Education - Public Schools | 4,394,149 | ||||||||
| Local Public Property (6.3%) | |||||||||
| Clark County, Nevada, Refunding | |||||||||
| 1,000,000 | 4.750%, 11/01/27 NPFG/ FGIC Insured | Aa1/AA+/NR | 1,075,070 | ||||||
| 2,000,000 | 4.750%, 06/01/30 AGMC Insured | Aa1/AA+/NR | 2,136,400 | ||||||
| Clark County, Nevada, Refunding | |||||||||
| 2,280,000 | 5.000%, 12/01/29 Series A | Aa1/AA+/NR | 2,529,592 | ||||||
| Harris County, Texas Refunding Permanent | |||||||||
| Improvement | |||||||||
| 1,300,000 | 5.000%, 10/01/31 Series A | NR/AAA/AAA | 1,506,102 | ||||||
| North Las Vegas, Nevada Building | |||||||||
| 4,350,000 | 5.000%, 05/01/27 NPFG Insured | A3/A+/BBB | 4,546,446 | ||||||
| 4,440,000 | 5.000%, 05/01/28 NPFG Insured | A3/A+/BBB | 4,627,679 | ||||||
| North Las Vegas, Nevada Refunding Ltd. Tax | |||||||||
| 1,000,000 | 5.000%, 06/01/36 | A3/A/BBB | 1,046,020 | ||||||
| Puerto Rico Commonwealth Refunding, Public | |||||||||
| Improvement | |||||||||
| 1,070,000 | 5.000%, 07/01/35 Series A AGMC Insured | Aa3/AA-/BBB+ | 1,124,089 | ||||||
| Utah State, Series A | |||||||||
| 2,500,000 | 5.000%, 07/01/26 | Aaa/AAA/AAA | 3,043,050 | ||||||
6
| TAX-FREE FUND FOR UTAH | |||
| SCHEDULE OF INVESTMENTS (continued) | |||
| JUNE 30, 2012 | |||
| Rating | |||||||||
| Moody’s, S&P | |||||||||
| Principal | and Fitch | ||||||||
| Amount | General Obligation Bonds (continued) | (unaudited) | Value | ||||||
| Local Public Property (continued) | |||||||||
| Washoe County, Nevada Refunding Reno Sparks | |||||||||
| Convention | |||||||||
| $ | 2,000,000 | 5.000%, 07/01/28 | Aa2/AA/NR | $ | 2,221,500 | ||||
| Williamson County, Texas | |||||||||
| 1,610,000 | 5.000%, 02/15/23 NPFG Insured | Aa1/AAA/NR | 1,710,786 | ||||||
| 1,445,000 | 5.000%, 02/15/23 NPFG Insured (pre-refunded) | Aa1/BBB/NR | 1,553,100 | ||||||
| Total Local Public Property | 27,119,834 | ||||||||
| School District (4.9%) | |||||||||
| Alamo, Texas Community College District | |||||||||
| 1,000,000 | 5.000%, 08/15/37 Series A | Aaa/AA+/NR | 1,001,090 | ||||||
| Clark County, Nevada School District | |||||||||
| 500,000 | 5.000%, 06/15/28 Series A | Aa3/AA-/AA- | 546,945 | ||||||
| Comal, Texas Independent School District | |||||||||
| 2,000,000 | 5.000%, 02/01/33 NPFG Insured | Aaa/BBB/AAA | 2,120,580 | ||||||
| Davis County, Utah School District, School Building, | |||||||||
| Utah School Board Guaranty Program | |||||||||
| 2,640,000 | 4.000%, 06/01/27 School Board Guaranty Insured | Aaa/NR/NR | 2,907,194 | ||||||
| Granite School District, Utah, Salt Lake County | |||||||||
| School Building | |||||||||
| 1,000,000 | 5.000%, 06/01/31 School Board Guaranty Insured | Aaa/NR/AAA | 1,162,900 | ||||||
| Houston, Texas Independent School District | |||||||||
| 3,000,000 | 5.000%, 02/15/28 AGMC Insured | Aaa/AA+/NR | 3,140,940 | ||||||
| Magnolia, Texas Independent School District | |||||||||
| Schoolhouse | |||||||||
| 1,495,000 | 5.000%, 08/15/25 NPFG/ FGIC Insured | A1/NR/NR | 1,638,610 | ||||||
| Navasota, Texas Independent School District | |||||||||
| 475,000 | 5.000%, 08/15/23 NPFG/ FGIC Insured | A1/NR/NR | 508,388 | ||||||
| North East Independent School District, Texas | |||||||||
| 1,000,000 | 5.000%, 08/01/33 NPFG Insured PSF Guaranteed | Aaa/AAA/NR | 1,056,820 | ||||||
| Port Arthur, Texas Independent School District | |||||||||
| School Building | |||||||||
| 2,000,000 | 5.250%, 02/15/30 NPFG/ FGIC Insured | ||||||||
| (pre-refunded) | Aa3/NR/AA- | 2,157,640 | |||||||
| Uintah County, Utah School District | |||||||||
| 455,000 | 4.250%, 02/01/24 School Board Guaranty Insured | Aaa/NR/NR | 489,848 | ||||||
7
| TAX-FREE FUND FOR UTAH | |||
| SCHEDULE OF INVESTMENTS (continued) | |||
| JUNE 30, 2012 |
| Rating | |||||||||
| Moody’s, S&P | |||||||||
| Principal | and Fitch | ||||||||
| Amount | General Obligation Bonds (continued) | (unaudited) | Value | ||||||
| School District (continued) | |||||||||
| Wasatch County, Utah School District | |||||||||
| $ | 880,000 | 5.000%, 06/01/25 School Board Guaranty Insured | Aaa/NR/NR | $ | 955,205 | ||||
| 900,000 | 4.375%, 06/01/26 School Board Guaranty Insured | Aaa/NR/NR | 972,063 | ||||||
| Washoe County, Nevada School District | |||||||||
| 200,000 | 4.625%, 06/01/23 NPFG/ FGIC Insured | ||||||||
| (pre-refunded) | Aa2/AA/AA- | 207,910 | |||||||
| Washoe County, Nevada School District Refunding | |||||||||
| & School Improvement | |||||||||
| 2,000,000 | 5.000%, 06/01/30 Series A | Aa2/AA/NR | 2,221,320 | ||||||
| Total School District | 21,087,453 | ||||||||
| Transportation (1.1%) | |||||||||
| Texas State Transportation Commission Mobility Fund | |||||||||
| 1,140,000 | 5.000%, 04/01/27 Series A | Aaa/AA+/AAA | 1,316,746 | ||||||
| 2,000,000 | 4.750%, 04/01/35 Series A NPFG - IBC Insured | Aaa/AA+/AAA | 2,136,980 | ||||||
| Titus County, Texas Unlimited Tax And Pass- | |||||||||
| Through Toll Revenue | |||||||||
| 1,000,000 | 5.000%, 03/01/28 Series 2012-A | NR/A/NR | 1,100,430 | ||||||
| Total Transportation | 4,554,156 | ||||||||
| Utilities (2.6%) | |||||||||
| Central Utah Water Conservancy District Refunding | |||||||||
| 765,000 | 5.000%, 04/01/28 Series B | NR/AA+/AAA | 897,873 | ||||||
| Clark County, Nevada Water Reclamation District | |||||||||
| 2,000,000 | 5.250%, 07/01/38 Series A | Aa1/AAA/NR | 2,258,940 | ||||||
| Las Vegas Valley, Nevada Water District Refunding | |||||||||
| 1,000,000 | 5.000%, 06/01/30 Series C | Aa2/AA+/NR | 1,114,700 | ||||||
| Las Vegas Valley, Nevada Water District Refunding | |||||||||
| & Water Improvement | |||||||||
| 2,500,000 | 5.000%, 02/01/38 Series A | Aa2/AA+/NR | 2,666,125 | ||||||
| San Angelo, Texas Certificates of Participation | |||||||||
| Obligation | |||||||||
| 2,765,000 | 5.000%, 02/15/30 Series A | Aa2/AA/AA+ | 3,090,828 | ||||||
| Virgin Valley, Nevada Water District | |||||||||
| 955,000 | 5.000%, 03/01/34 AGC Insured | Aa3/NR/NR | 1,014,783 | ||||||
| Total Utilities | 11,043,249 | ||||||||
| Total General Obligation Bonds | 93,238,920 | ||||||||
8
| TAX-FREE FUND FOR UTAH | |||
| SCHEDULE OF INVESTMENTS (continued) | |||
| JUNE 30, 2012 |
| Rating | |||||||||
| Moody’s, S&P | |||||||||
| Principal | and Fitch | ||||||||
| Amount | Revenue Bonds (76.3%) | (unaudited) | Value | ||||||
| Airport (1.9%) | |||||||||
| Alaska State International Airport Revenue | |||||||||
| $ | 35,000 | 5.000%, 10/01/24 AMBAC Insured AMT | Aa3/NR/A+ | $ | 35,042 | ||||
| Broward County, Florida Airport System Revenue | |||||||||
| Refunding | |||||||||
| 1,000,000 | 5.375%, 10/01/29 Series O | A1/A+/A | 1,127,100 | ||||||
| Clark County, Nevada Passenger Facility Charge | |||||||||
| 255,000 | 4.750%, 07/01/22 NPFG Insured AMT | A1/A+/A | 255,737 | ||||||
| Clark County, Nevada Passenger Facilities Charge | |||||||||
| Revenue Las Vegas-McCarran International Airport | |||||||||
| 1,500,000 | 5.000%, 07/01/30 | A1/A+/NR | 1,645,020 | ||||||
| Hillsborough County, Florida Aviation Authority | |||||||||
| 2,185,000 | 5.250%, 10/01/23 NPFG Insured AMT | A1/A+/A+ | 2,265,102 | ||||||
| Miami-Dade County, Florida Aviation Revenue Miami | |||||||||
| International Airport | |||||||||
| 1,675,000 | 5.000%, 10/01/22 Series A-1 | A2/A-/A | 1,928,411 | ||||||
| Reno-Tahoe, Nevada Airport Authority Revenue | |||||||||
| Refunding | |||||||||
| 1,000,000 | 5.000%, 07/01/26 AGMC Insured | Aa3/NR/A | 1,042,790 | ||||||
| Total Airport | 8,299,202 | ||||||||
| Education (9.4%) | |||||||||
| Florida Higher Education Facilities Authority Revenue, | |||||||||
| Refunding, Rollins College Project | |||||||||
| 1,000,000 | 5.000%, 12/01/37 Series A | A1/NR/NR | 1,084,400 | ||||||
| Florida State Board of Education Public Education | |||||||||
| 210,000 | 4.500%, 06/01/25 AGMC Insured | Aa1/AAA/AAA | 223,625 | ||||||
| Hammond, Indiana School Building Corp. First | |||||||||
| Mortgage | |||||||||
| 1,030,000 | 5.000%, 07/15/31 NPFG Insured | Baa2/AA+/NR | 1,098,691 | ||||||
| Hillsborough County, Florida School Board COP | |||||||||
| 510,000 | 4.250%, 07/01/26 NPFG Insured | Aa2/AA-/AA | 535,469 | ||||||
| Salt Lake County, Utah Westminster College Project | |||||||||
| 825,000 | 4.750%, 10/01/20 | NR/BBB/NR | 881,529 | ||||||
| 870,000 | 4.750%, 10/01/21 | NR/BBB/NR | 923,705 | ||||||
| 2,300,000 | 5.000%, 10/01/22 | NR/BBB/NR | 2,409,687 | ||||||
9
| TAX-FREE FUND FOR UTAH | |||
| SCHEDULE OF INVESTMENTS (continued) | |||
| JUNE 30, 2012 |
| Rating | |||||||||
| Moody’s, S&P | |||||||||
| Principal | and Fitch | ||||||||
| Amount | Revenue Bonds (continued) | (unaudited) | Value | ||||||
| Education (continued) | |||||||||
| Salt Lake County, Utah Westminster College Project | |||||||||
| (continued) | |||||||||
| $ | 1,250,000 | 5.000%, 10/01/25 | NR/BBB/NR | $ | 1,297,938 | ||||
| 600,000 | 5.000%, 10/01/27 | NR/BBB/NR | 627,480 | ||||||
| 2,025,000 | 5.125%, 10/01/28 | NR/BBB/NR | 2,091,582 | ||||||
| Southern Utah University Revenue Refunding, | |||||||||
| Auxiliary System Student Building Fee | |||||||||
| 875,000 | 4.000%, 05/01/19 | NR/AA/NR | 990,238 | ||||||
| Texas A&M University Revenue | |||||||||
| 1,700,000 | 5.000%, 07/01/34 | Aaa/AAA/AAA | 2,033,132 | ||||||
| Texas State University System Financing Revenue | |||||||||
| 2,000,000 | 5.250%, 03/15/25 | Aa2/AA-/AA | 2,343,440 | ||||||
| Tyler, Texas Independent School District | |||||||||
| 325,000 | 5.000%, 02/15/26 AGMC Insured (pre-refunded) | Aa3/AA/AA+ | 363,071 | ||||||
| University of North Texas Revenue Refunding | |||||||||
| Financing System | |||||||||
| 2,815,000 | 4.500%, 04/15/25 Series A | Aa2/NR/AA | 3,208,818 | ||||||
| University of Utah COP | |||||||||
| 3,170,000 | 4.350%, 12/01/26 AMBAC Insured | Aa2/AA-/NR | 3,335,094 | ||||||
| Utah State Board of Regents | |||||||||
| 2,980,000 | 4.500%, 04/01/29** | Aa2/AA/NR | 3,270,431 | ||||||
| Utah State Board of Regents Auxiliary & Campus | |||||||||
| Facility | |||||||||
| 1,000,000 | 4.125%, 04/01/20 NPFG Insured | Aa2/AA/NR | 1,055,790 | ||||||
| Utah State Board of Regents Lease Revenue | |||||||||
| 410,000 | 4.500%, 05/01/20 AMBAC Insured | NR/AA/NR | 447,212 | ||||||
| 425,000 | 4.500%, 05/01/21 AMBAC Insured | NR/AA/NR | 461,125 | ||||||
| 450,000 | 4.625%, 05/01/22 AMBAC Insured | NR/AA/NR | 488,749 | ||||||
| 120,000 | 4.650%, 05/01/23 AMBAC Insured | NR/AA/NR | 129,481 | ||||||
| Utah State Board of Regents Office Facility Revenue | |||||||||
| 1,045,000 | 5.000%, 04/01/23 NPFG Insured | Aa2/AA-/NR | 1,136,291 | ||||||
| State Board of Regents of the State of Utah, Utah | |||||||||
| Valley University Student Center Building Fee And | |||||||||
| Unified System Revenue | |||||||||
| 1,000,000 | 4.000%, 11/01/29 Series 2012A | NR/AA/NR | 1,041,200 | ||||||
10
| TAX-FREE FUND FOR UTAH | |||
| SCHEDULE OF INVESTMENTS (continued) | |||
| JUNE 30, 2012 |
| Rating | |||||||||
| Moody’s, S&P | |||||||||
| Principal | and Fitch | ||||||||
| Amount | Revenue Bonds (continued) | (unaudited) | Value | ||||||
| Education (continued) | |||||||||
| Warsaw, Indiana Multi-School Building Corp., First | |||||||||
| Mortgage | |||||||||
| $ | 1,800,000 | 5.450%, 01/15/28 Series B | NR/AA+/NR | $ | 2,016,270 | ||||
| Washington State Higher Education Facilities | |||||||||
| Authority Revenue, Refunding, Gonzaga | |||||||||
| University Project | |||||||||
| 950,000 | 5.000%, 04/01/24 Series B | A3/NR/NR | 1,036,621 | ||||||
| Washington State Higher Education Facilities | |||||||||
| Authority Revenue, Seattle University Project | |||||||||
| 1,250,000 | 5.250%, 11/01/27 AMBAC Insured | NR/A/NR | 1,373,150 | ||||||
| Washington State University Revenue | |||||||||
| 735,000 | 4.600%, 10/01/29 AGMC Insured | Aa2/AA-/NR | 791,720 | ||||||
| Weber State University, Utah Student Facilities System | |||||||||
| 1,825,000 | 4.400%, 04/01/27 AGMC Insured | NR/AA/NR | 1,922,966 | ||||||
| 1,275,000 | 5.125%, 04/01/32 NPFG Insured | Baa2/AA/NR | 1,340,650 | ||||||
| Total Education | 39,959,555 | ||||||||
| Education - Charter Schools (8.8%) | |||||||||
| La Vernia, Texas Higher Education Finance Corp., | |||||||||
| Jubilee Academy | |||||||||
| 3,454,900 | 6.500%, 03/15/38 144A | NR/NR/NR* | 3,357,956 | ||||||
| Utah County, Utah Charter School Revenue Lakeview | |||||||||
| Academy | |||||||||
| 260,000 | 5.350%, 07/15/17 Series A | NR/NR/NR* | 259,431 | ||||||
| Utah County, Utah Charter School Revenue Lincoln | |||||||||
| Academy | |||||||||
| 635,000 | 5.450%, 06/15/17 Series A 144A | NR/NR/NR* | 633,349 | ||||||
| Utah County, Utah Charter School Revenue | |||||||||
| Renaissance Academy | |||||||||
| 275,000 | 5.350%, 07/15/17 Series A 144A | NR/NR/NR* | 274,398 | ||||||
| Utah County, Utah School Facility, Ranches Academy | |||||||||
| 1,175,000 | 6.500%, 12/01/25 | NR/NR/NR* | 1,112,537 | ||||||
| Utah State Charter School Finance Authority Entheos | |||||||||
| Academy | |||||||||
| 5,677,000 | 6.750%, 08/15/38 144A | NR/NR/NR* | 5,520,542 | ||||||
11
| TAX-FREE FUND FOR UTAH | |||
| SCHEDULE OF INVESTMENTS (continued) | |||
| JUNE 30, 2012 |
| Rating | |||||||||
| Moody’s, S&P | |||||||||
| Principal | and Fitch | ||||||||
| Amount | Revenue Bonds (continued) | (unaudited) | Value | ||||||
| Education - Charter Schools (continued) | |||||||||
| Utah State Charter School Finance Authority Fast | |||||||||
| Forward Academy | |||||||||
| $ | 2,964,100 | 6.500%, 11/15/37 144A | NR/NR/NR* | $ | 2,707,498 | ||||
| Utah State Charter School Finance Authority George | |||||||||
| Washington Academy | |||||||||
| 1,000,000 | 6.750%, 07/15/28 | NR/BB+/NR* | 1,013,270 | ||||||
| Utah State Charter School Finance Authority Legacy | |||||||||
| Preparatory Academy | |||||||||
| 5,545,000 | 6.750%, 06/15/38 144A | NR/NR/NR* | 5,290,873 | ||||||
| 7,625,000 | 7.250%, 06/15/39 144A | NR/NR/NR* | 7,270,971 | ||||||
| Utah State Charter School Finance Authority, | |||||||||
| Refunding & Improvement, Davinci Academy | |||||||||
| 1,000,000 | 7.050%, 09/15/26 Series 2011A | NR/BBB-/NR | 1,068,110 | ||||||
| Utah State Charter School Finance Authority Rockwell | |||||||||
| Charter School | |||||||||
| 900,000 | 6.750%, 08/15/28 144A | NR/NR/NR* | 728,712 | ||||||
| Utah State Charter School Finance Authority Ronald | |||||||||
| Wilson Reagan Academy | |||||||||
| 1,315,000 | 5.750%, 02/15/22 Series A 144A | NR/BBB-/NR | 1,381,670 | ||||||
| Utah State Charter School Finance Authority Venture | |||||||||
| Academy | |||||||||
| 7,080,000 | 6.750%, 11/15/38 144A | NR/NR/NR* | 7,086,230 | ||||||
| Total Education - Charter Schools | 37,705,547 | ||||||||
| Healthcare (0.7%) | |||||||||
| Indiana Finance Authority Hospital Revenue, Parkview | |||||||||
| Health System | |||||||||
| 1,350,000 | 5.875%, 05/01/29 (pre-refunded) | A1/NR/NR | 1,485,621 | ||||||
| Indiana Finance Authority Hospital Revenue, Parkview | |||||||||
| Health System, Unrefunded balance | |||||||||
| 300,000 | 5.875%, 05/01/29 | A1/A+/NR | 317,364 | ||||||
| Tarrant County, Texas Cultural Education Facilities | |||||||||
| Finance Corp. Hospital Refunding, Scott & White | |||||||||
| Healthcare Project | |||||||||
| 1,000,000 | 5.250%, 08/15/25 | A1/A/AA- | 1,115,880 | ||||||
| Total Healthcare | 2,918,865 | ||||||||
12
| TAX-FREE FUND FOR UTAH | |||
| SCHEDULE OF INVESTMENTS (continued) | |||
| JUNE 30, 2012 |
| Rating | |||||||||
| Moody’s, S&P | |||||||||
| Principal | and Fitch | ||||||||
| Amount | Revenue Bonds (continued) | (unaudited) | Value | ||||||
| Hospital (3.6%) | |||||||||
| Campbell County, Wyoming Hospital District, | |||||||||
| Hospital Revenue, Memorial Hospital Project | |||||||||
| $ | 1,040,000 | 5.000%, 12/01/20 | NR/A-/NR | $ | 1,158,175 | ||||
| 1,000,000 | 5.500%, 12/01/34 | NR/A-/NR | 1,061,700 | ||||||
| Harris County, Texas Health Facility Development | |||||||||
| Corp. Christus Health Series A-6 | |||||||||
| 1,000,000 | 4.750%, 07/01/30 AGMC Insured | Aa3/AA-/NR | 1,058,560 | ||||||
| King County, Washington Public Hospital District No. | |||||||||
| 002, Refunding, Evergreen Healthcare | |||||||||
| 1,000,000 | 5.250%, 12/01/28 | Aa3/A+/NR | 1,098,180 | ||||||
| Laramie County, Wyoming Hospital Revenue, | |||||||||
| Cheyenne Regional Medical Center Project | |||||||||
| 1,000,000 | 5.000%, 05/01/32 | NR/A+/NR | 1,083,720 | ||||||
| Reno, Nevada Hospital Revenue, Washoe Medical | |||||||||
| Center | |||||||||
| 725,000 | 5.000%, 06/01/23 AGMC Insured | Aa3/AA-/NR | 767,855 | ||||||
| 680,000 | 5.000%, 06/01/23 AGMC Insured | Aa3/AA-/NR | 720,195 | ||||||
| Richmond, Indiana Hospital Revenue | |||||||||
| 250,000 | 5.000%, 01/01/19 | NR/A/A | 274,490 | ||||||
| Riverton, Utah Hospital Revenue, Intermountain | |||||||||
| Health Care Health Services, Inc. | |||||||||
| 825,000 | 5.000%, 08/15/36 | Aa1/AA+/NR | 900,652 | ||||||
| 2,000,000 | 5.000%, 08/15/41 | Aa1/AA+/NR | 2,171,600 | ||||||
| Utah State Board of Regents Revenue Hospital - | |||||||||
| University Utah | |||||||||
| 3,000,000 | 5.000%, 08/01/31 Series B | Aa2/AA/NR | 3,300,690 | ||||||
| Washington State Health Care Facilities Authority | |||||||||
| Revenue, Providence Health & Services | |||||||||
| 1,000,000 | 5.000%, 10/01/33 Series A** | Aa2/AA/AA | 1,079,790 | ||||||
| Washington State Health Care Facilities Authority | |||||||||
| Revenue, Refunding, Fred Hutchinson Cancer | |||||||||
| 595,000 | 5.000%, 01/01/18 | A2/A/NR | 675,426 | ||||||
| Total Hospital | 15,351,033 | ||||||||
13
| TAX-FREE FUND FOR UTAH | |||
| SCHEDULE OF INVESTMENTS (continued) | |||
| JUNE 30, 2012 |
| Rating | |||||||||
| Moody’s, S&P | |||||||||
| Principal | and Fitch | ||||||||
| Amount | Revenue Bonds (continued) | (unaudited) | Value | ||||||
| Housing (4.7%) | |||||||||
| Alaska Housing Finance Corp. Housing Revenue | |||||||||
| $ | 420,000 | 5.250%, 12/01/28 AMT | Aa2/AA+/AA+ | $ | 421,415 | ||||
| Florida Housing Finance Corp. | |||||||||
| 435,000 | 5.000%, 07/01/21 AMT | Aa1/AA+/AA+ | 453,927 | ||||||
| 390,000 | 6.000%, 07/01/28 | Aa1/AA+/AA+ | 416,824 | ||||||
| Indianapolis, Indiana Multi-Family | |||||||||
| 380,000 | 4.850%, 01/01/21 AMT FNMA Insured | A1/NR/NR | 390,458 | ||||||
| Miami-Dade County, Florida Housing Finance | |||||||||
| Authority | |||||||||
| 535,000 | 5.000%, 11/01/23 AGMC Insured AMT | Aa3/AA+/A- | 541,864 | ||||||
| North Dakota Housing Authority Home Mortgage | |||||||||
| Revenue | |||||||||
| 180,000 | 5.400%, 07/01/23 AMT | Aa1/NR/NR | 183,056 | ||||||
| Puerto Rico Housing Finance Authority | |||||||||
| 1,100,000 | 5.125%, 12/01/27 | NR/A+/A | 1,201,739 | ||||||
| South Dakota Housing Development Authority | |||||||||
| 45,000 | 6.000%, 05/01/28 | Aa1/AAA/NR | 45,396 | ||||||
| Utah Housing Corporation Single Family Mortgage | |||||||||
| 25,000 | 5.250%, 07/01/23 AMT | Aa2/AA/AA | 25,017 | ||||||
| 790,000 | 5.125%, 07/01/24 AMT | Aa3/AA-/AA- | 793,263 | ||||||
| 645,000 | 5.000%, 07/01/25 AMT | Aa3/AA-/AA- | 644,355 | ||||||
| 335,000 | 5.100%, 01/01/26 AMT | Aa3/AA-/AA- | 337,275 | ||||||
| 95,000 | 5.650%, 07/01/27 AMT | Aa2/AA/AA | 95,512 | ||||||
| 1,200,000 | 5.250%, 01/01/28 AMT | Aa3/AA-/AA- | 1,224,900 | ||||||
| 570,000 | 5.200%, 01/01/28 AMT | Aa3/AA-/AA- | 581,269 | ||||||
| 1,800,000 | 5.800%, 07/01/28 AMT | Aa3/AA-/AA- | 1,887,444 | ||||||
| 640,000 | 5.700%, 07/01/28 AMT | Aa3/AA-/AA- | 668,518 | ||||||
| 465,000 | 5.500%, 07/01/28 AMT | Aa3/AA-/AA- | 481,986 | ||||||
| 765,000 | 6.100%, 01/01/29 AMT | Aa3/AA-/AA- | 821,633 | ||||||
| Utah Housing Corporation Single Family Mortgage | |||||||||
| 1,270,000 | 5.250%, 07/01/28 Series A AMT | Aa3/AA-/AA- | 1,319,924 | ||||||
| Utah Housing Corporation Single Family Mortgage | |||||||||
| 1,000,000 | 4.000%, 07/01/28 Series B-1 Class I | Aaa/AAA/AAA | 1,013,670 | ||||||
| 590,000 | 4.950%, 01/01/32 Series A Class II | Aa2/AA/AA | 615,866 | ||||||
| 985,000 | 4.625%, 07/01/32 Series B-1 Class II | Aa2/AA/AA | 1,021,957 | ||||||
| 2,215,000 | 4.500%, 01/01/24 Series A Class III | Aa3/AA-/AA- | 2,316,403 | ||||||
14
| TAX-FREE FUND FOR UTAH | |||
| SCHEDULE OF INVESTMENTS (continued) | |||
| JUNE 30, 2012 |
| Rating | |||||||||
| Moody’s, S&P | |||||||||
| Principal | and Fitch | ||||||||
| Amount | Revenue Bonds (continued) | (unaudited) | Value | ||||||
| Housing (continued) | |||||||||
| Utah Housing Corporation Single Family Mortgage | |||||||||
| $ | 910,000 | 4.500%, 07/01/23 Series C | Aa3/AA-/AA- | $ | 959,631 | ||||
| Utah State Housing Finance Agency | |||||||||
| 45,000 | 5.700%, 07/01/15 AMT | Aa3/AA-/AA- | 45,408 | ||||||
| 20,000 | 5.400%, 07/01/16 AMT | Aa2/NR/NR | 20,000 | ||||||
| 360,000 | 5.500%, 07/01/18 AMT | Aa3/AA-/AA- | 366,156 | ||||||
| 20,000 | 5.000%, 07/01/18 AMT | Aaa/AA+/NR | 20,014 | ||||||
| 140,000 | 5.600%, 07/01/23 AMT | Aa2/AA/AA | 140,129 | ||||||
| Wyoming Community Development Authority | |||||||||
| Homeownership Mortgage Revenue | |||||||||
| 865,000 | 4.625%, 06/01/28 Series A | Aa2/NR/NR | 904,496 | ||||||
| Total Housing | 19,959,505 | ||||||||
| Lease (4.1%) | |||||||||
| Clark County, Nevada Improvement District Special | |||||||||
| Local Improvement #128 (Summerlin) | |||||||||
| 500,000 | 5.000%, 02/01/21 Series A | NR/NR/NR* | 445,820 | ||||||
| Middle Village, Florida Community Development | |||||||||
| District Special Assessment Revenue | |||||||||
| 1,000,000 | 6.750%, 05/01/25 | NR/NR/NR* | 1,000,110 | ||||||
| New Albany, Indiana Development Authority | |||||||||
| 500,000 | 4.250%, 02/01/22 | NR/A-/NR | 518,705 | ||||||
| Salt Lake Valley, Utah Fire Service District Lease | |||||||||
| Revenue | |||||||||
| 2,645,000 | 5.200%, 04/01/28 | Aa2/NR/AA+ | 2,905,665 | ||||||
| 1,000,000 | 5.250%, 04/01/30 | Aa2/NR/AA+ | 1,093,480 | ||||||
| South Dakota State Building Authority Revenue | |||||||||
| 500,000 | 4.500%, 06/01/24 NPFG/ FGIC Insured | NR/AA/NR | 540,605 | ||||||
| Tooele County, Utah Municipal Building Authority | |||||||||
| School District Lease Revenue | |||||||||
| 1,000,000 | 5.000%, 06/01/28 | A1/A+/NR | 1,062,910 | ||||||
15
| TAX-FREE FUND FOR UTAH | |||
| SCHEDULE OF INVESTMENTS (continued) | |||
| JUNE 30, 2012 |
| Rating | |||||||||
| Moody’s, S&P | |||||||||
| Principal | and Fitch | ||||||||
| Amount | Revenue Bonds (continued) | (unaudited) | Value | ||||||
| Lease (continued) | |||||||||
| Uintah County, Utah Municipal Building Authority | |||||||||
| Lease Revenue | |||||||||
| $ | 2,000,000 | 5.300%, 06/01/28 | NR/A+/NR | $ | 2,196,100 | ||||
| Utah State Building Ownership Authority Lease | |||||||||
| Revenue Refunding State Facilities Master | |||||||||
| Lease Program | |||||||||
| 465,000 | 5.000%, 05/15/21 | Aa1/AA+/NR | 517,126 | ||||||
| 510,000 | 5.000%, 05/15/23 | Aa1/AA+/NR | 560,184 | ||||||
| 1,000,000 | 5.000%, 05/15/24 | Aa1/AA+/NR | 1,229,790 | ||||||
| 1,080,000 | 5.000%, 05/15/25 | Aa1/AA+/NR | 1,131,786 | ||||||
| 1,575,000 | 5.000%, 05/15/26 | Aa1/AA+/NR | 1,785,672 | ||||||
| West Bountiful, Utah Courthouse Revenue | |||||||||
| 410,000 | 5.000%, 05/01/19 | NR/A/A+ | 430,533 | ||||||
| West Valley City, Utah Municipal Building Authority | |||||||||
| Lease Revenue Refunding | |||||||||
| 1,890,000 | 4.375%, 08/01/26 Series A NPFG/ FGIC Insured | NR/A+/A+ | 1,982,232 | ||||||
| Total Lease | 17,400,718 | ||||||||
| Local Public Property (7.1%) | |||||||||
| Herriman, Utah Special Assessment Towne Center | |||||||||
| Assessment Area | |||||||||
| 1,045,000 | 4.875%, 11/01/23 | NR/A/NR | 1,111,619 | ||||||
| 1,150,000 | 5.000%, 11/01/25 | NR/A/NR | 1,212,295 | ||||||
| 1,975,000 | 5.000%, 11/01/29 | NR/A/NR | 2,036,482 | ||||||
| Orange County, Florida Sales Tax Revenue | |||||||||
| 1,000,000 | 5.000%, 01/01/27 Series B NPFG/ FGIC Insured | ||||||||
| (pre-refunded) | Aa3/AA/AA+ | 1,023,340 | |||||||
| Orem, Utah Special Assessment | |||||||||
| 1,845,000 | 7.750%, 11/01/25 | NR/NR/NR* | 1,854,760 | ||||||
| Riverton City, Utah Franchise & Sales Tax Revenue | |||||||||
| 1,585,000 | 5.000%, 06/01/31 AMBAC Insured | NR/AA-/AA | 1,712,783 | ||||||
| Sevier County, Utah Municipal Building Authority | |||||||||
| Lease Revenue Refunding | |||||||||
| 915,000 | 5.000%, 11/15/19 NPFG/ FGIC Insured | ||||||||
| (pre-refunded) | NR/NR/NR* | 993,141 | |||||||
16
| TAX-FREE FUND FOR UTAH | |||
| SCHEDULE OF INVESTMENTS (continued) | |||
| JUNE 30, 2012 |
| Rating | |||||||||
| Moody’s, S&P | |||||||||
| Principal | and Fitch | ||||||||
| Amount | Revenue Bonds (continued) | (unaudited) | Value | ||||||
| Local Public Property (continued) | |||||||||
| South Ogden City, Utah Sales Tax Revenue Refunding | |||||||||
| $ | 1,895,000 | 4.375%, 05/01/29 NPFG/ FGIC Insured | Baa2/A+/NR | $ | 1,959,942 | ||||
| Tooele County, Utah Municipal Building Authority | |||||||||
| School District Lease Revenue | |||||||||
| 1,000,000 | 4.875%, 06/01/25 | A1/A+/NR | 1,070,000 | ||||||
| Twin Creeks, Utah Special Services District | |||||||||
| 11,454,702 | 10.000%, 07/15/30 144A | NR/NR/NR* | 11,544,163 | ||||||
| Uintah County, Utah Municipal Building Authority | |||||||||
| Lease Revenue | |||||||||
| 1,005,000 | 5.500%, 06/01/37 | NR/A+/NR | 1,083,561 | ||||||
| 1,120,000 | 5.500%, 06/01/40 | NR/A+/NR | 1,199,027 | ||||||
| Utah Transit Authority Sales Tax Revenue, Series A | |||||||||
| 1,000,000 | 5.000%, 06/15/28 | Aa2/AAA/AA | 1,149,200 | ||||||
| West Valley City, Utah Municipal Building Authority | |||||||||
| Lease Revenue Refunding | |||||||||
| 1,645,000 | 4.500%, 08/01/22 Series A NPFG/ FGIC Insured | NR/A+/A+ | 1,774,922 | ||||||
| West Valley City, Utah Sales Tax Revenue Capital | |||||||||
| Appreciation Bonds, Refunding | |||||||||
| 1,900,000 | zero coupon, 07/15/35 | NR/AA+/NR | 610,717 | ||||||
| Total Local Public Property | 30,335,952 | ||||||||
| State Agency (0.6%) | |||||||||
| Utah Infrastructure Agency Telecommunications & | |||||||||
| Franchise Tax | |||||||||
| 1,000,000 | 5.500%, 10/15/30 Series A AGMC Insured | Aa3/AA-/NR | 1,137,680 | ||||||
| 1,475,000 | 5.250%, 10/15/33 Series A AGMC Insured | Aa3/AA-/NR | 1,617,839 | ||||||
| Total State Agency | 2,755,519 | ||||||||
| Tax Revenue (7.8%) | |||||||||
| Bountiful City, Utah Sales Tax Refunding Bond | |||||||||
| 191,000 | 3.500%, 06/01/13 | NR/AA/NR | 195,223 | ||||||
| 832,000 | 4.000%, 06/01/17 | NR/AA/NR | 920,034 | ||||||
| Brigham, Utah Special Assessment Voluntary | |||||||||
| Assessment Area | |||||||||
| 1,140,000 | 5.250%, 08/01/23 | A1/NR/NR | 1,247,559 | ||||||
| 973,000 | 5.500%, 08/01/29 | A1/NR/NR | 1,052,144 | ||||||
17
| TAX-FREE FUND FOR UTAH | |||
| SCHEDULE OF INVESTMENTS (continued) | |||
| JUNE 30, 2012 |
| Rating | |||||||||
| Moody’s, S&P | |||||||||
| Principal | and Fitch | ||||||||
| Amount | Revenue Bonds (continued) | (unaudited) | Value | ||||||
| Tax Revenue (continued) | |||||||||
| Clark County, Nevada Improvement District | |||||||||
| $ | 250,000 | 5.000%, 08/01/16 | NR/NR/NR* | $ | 234,042 | ||||
| Coral Canyon, Utah Special Service District | |||||||||
| 50,000 | 5.000%, 07/15/13 | NR/NR/NR* | 50,433 | ||||||
| 250,000 | 5.500%, 07/15/18 | NR/NR/NR* | 250,465 | ||||||
| Florida State Department of Environmental Protection | |||||||||
| Revenue | |||||||||
| 1,250,000 | 5.250%, 07/01/20 NPFG/ FGIC Insured | A1/AA-/A | 1,262,500 | ||||||
| Henderson, Nevada Local Improvement District | |||||||||
| 95,000 | 4.500%, 09/01/12 | NR/NR/NR* | 95,205 | ||||||
| 290,000 | 5.000%, 09/01/14 | NR/NR/NR* | 297,969 | ||||||
| 290,000 | 5.000%, 09/01/15 | NR/NR/NR* | 298,416 | ||||||
| 225,000 | 5.000%, 03/01/16 | NR/NR/NR* | 221,521 | ||||||
| Holladay, Utah Redevelopment Agency | |||||||||
| 2,387,500 | 4.900%, 12/30/20 | NR/NR/NR* | 2,177,352 | ||||||
| Jordanelle, Utah Special Service District | |||||||||
| 186,000 | 5.000%, 11/15/14 | NR/NR/NR* | 185,172 | ||||||
| 196,000 | 5.100%, 11/15/15 | NR/NR/NR* | 192,727 | ||||||
| 206,000 | 5.200%, 11/15/16 | NR/NR/NR* | 201,283 | ||||||
| 216,000 | 5.300%, 11/15/17 | NR/NR/NR* | 209,235 | ||||||
| 228,000 | 5.400%, 11/15/18 | NR/NR/NR* | 220,136 | ||||||
| 240,000 | 5.500%, 11/15/19 | NR/NR/NR* | 229,762 | ||||||
| 253,000 | 5.600%, 11/15/20 | NR/NR/NR* | 240,813 | ||||||
| 268,000 | 5.700%, 11/15/21 | NR/NR/NR* | 252,577 | ||||||
| 283,000 | 5.800%, 11/15/22 | NR/NR/NR* | 265,165 | ||||||
| 299,000 | 6.000%, 11/15/23 | NR/NR/NR* | 282,280 | ||||||
| La Verkin, Utah Sales and Franchise Tax Revenue | |||||||||
| 571,000 | 5.100%, 07/15/27 | NR/NR/NR* | 532,886 | ||||||
| Lehi, Utah Sales Tax | |||||||||
| 790,000 | 5.000%, 06/01/24 AGMC Insured | Aa3/AA-/NR | 832,257 | ||||||
| Mesquite, Nevada New Special Improvement District | |||||||||
| 170,000 | 4.750%, 08/01/12 | NR/NR/NR* | 169,788 | ||||||
| 200,000 | 4.900%, 08/01/13 | NR/NR/NR* | 196,706 | ||||||
| 125,000 | 5.250%, 08/01/17 | NR/NR/NR* | 117,409 | ||||||
18
| TAX-FREE FUND FOR UTAH | |||
| SCHEDULE OF INVESTMENTS (continued) | |||
| JUNE 30, 2012 |
| Rating | |||||||||
| Moody’s, S&P | |||||||||
| Principal | and Fitch | ||||||||
| Amount | Revenue Bonds (continued) | (unaudited) | Value | ||||||
| Tax Revenue (continued) | |||||||||
| Mesquite, Nevada New Special Improvement District | |||||||||
| (continued) | |||||||||
| $ | 275,000 | 5.350%, 08/01/19 | NR/NR/NR* | $ | 247,313 | ||||
| 120,000 | 5.400%, 08/01/20 | NR/NR/NR* | 106,740 | ||||||
| 440,000 | 5.500%, 08/01/25 | NR/NR/NR* | 369,393 | ||||||
| North Ogden, Utah Sales Tax Revenue | |||||||||
| 195,000 | 5.000%, 11/01/24 Syncora Guarantee, Inc. Insured | NR/A+/AA | 207,655 | ||||||
| Payson City, Utah Sales Tax Revenue | |||||||||
| 445,000 | 5.000%, 08/01/21 AGMC Insured | Aa3/AA-/NR | 495,663 | ||||||
| Riverton City, Utah Franchise & Sales Tax Revenue | |||||||||
| 750,000 | 5.000%, 06/01/24 AMBAC Insured | NR/AA-/AA | 820,800 | ||||||
| Salt Lake City, Utah Sales Tax | |||||||||
| 1,060,000 | 5.000%, 02/01/23 (pre-refunded) | NR/AAA/NR | 1,183,776 | ||||||
| 1,115,000 | 5.000%, 02/01/24 (pre-refunded) | NR/AAA/NR | 1,245,199 | ||||||
| South Weber City, Utah | |||||||||
| 525,000 | 5.000%, 01/15/24 NPFG Insured | Baa2/A/AA- | 547,607 | ||||||
| Springville, Utah Special Assessment Revenue | |||||||||
| 397,000 | 5.500%, 01/15/17 | NR/NR/NR* | 379,079 | ||||||
| 420,000 | 5.650%, 01/15/18 | NR/NR/NR* | 392,343 | ||||||
| 442,000 | 5.800%, 01/15/19 | NR/NR/NR* | 409,553 | ||||||
| 380,000 | 5.900%, 01/15/20 | NR/NR/NR* | 350,421 | ||||||
| Uintah County, Utah Municipal Building Authority | |||||||||
| Lease Revenue | |||||||||
| 500,000 | 5.000%, 06/01/24 | NR/A+/NR | 554,595 | ||||||
| Utah Transit Authority Sales Tax Revenue | |||||||||
| 6,560,000 | 5.000%, 06/15/36 AGMC Insured Series A | Aa2/AAA/AA | 7,243,027 | ||||||
| Vernal City, Utah Sales Tax Revenue | |||||||||
| 515,000 | 4.750%, 09/01/31 AGC Insured | NR/AA/NR | 565,326 | ||||||
| 300,000 | 4.875%, 09/01/34 AGC Insured | NR/AA/NR | 326,691 | ||||||
| Wasatch County, Utah Building Authority | |||||||||
| 130,000 | 5.000%, 10/01/15 | A1/NR/NR | 134,453 | ||||||
| 135,000 | 5.000%, 10/01/16 | A1/NR/NR | 139,961 | ||||||
| Wasatch County, Utah Sales Tax | |||||||||
| 205,000 | 5.000%, 12/01/16 AMBAC Insured | NR/A+/NR | 207,827 | ||||||
| 210,000 | 5.000%, 12/01/17 AMBAC Insured | NR/A+/NR | 212,707 | ||||||
| 225,000 | 5.000%, 12/01/18 AMBAC Insured | NR/A+/NR | 227,799 | ||||||
19
| TAX-FREE FUND FOR UTAH | |||
| SCHEDULE OF INVESTMENTS (continued) | |||
| JUNE 30, 2012 |
| Rating | |||||||||
| Moody’s, S&P | |||||||||
| Principal | and Fitch | ||||||||
| Amount | Revenue Bonds (continued) | (unaudited) | Value | ||||||
| Tax Revenue (continued) | |||||||||
| Washington City, Utah Sales Tax | |||||||||
| $ | 680,000 | 5.250%, 11/15/17 AMBAC Insured (pre-refunded) | NR/A/NR | $ | 726,165 | ||||
| Weber County, Utah Sales Tax | |||||||||
| 385,000 | 5.000%, 07/01/23 AMBAC Insured | A1/NR/NR | 394,648 | ||||||
| West Valley City, Utah Redevelopment Agency | |||||||||
| 1,625,000 | 5.000%, 03/01/21 | NR/A-/NR | 1,719,672 | ||||||
| 320,000 | 5.000%, 03/01/22 | NR/A-/NR | 338,307 | ||||||
| 350,000 | 5.000%, 03/01/23 | NR/A-/NR | 368,459 | ||||||
| 1,000,000 | 5.000%, 03/01/24 | NR/A-/NR | 1,050,120 | ||||||
| Total Tax Revenue | 33,396,358 | ||||||||
| Transportation (3.5%) | |||||||||
| Central Puget Sound, Washington Regional | |||||||||
| Transportation Authority Sales Tax | |||||||||
| 2,000,000 | 5.000%, 11/01/25 Series A AMBAC Insured | Aa2/AAA/NR | 2,204,380 | ||||||
| Indiana Finance Authority Highway Revenue | |||||||||
| 1,950,000 | 4.500%, 12/01/25 NPFG/ FGIC Insured | Aa1/AA+/AA+ | 2,143,323 | ||||||
| North Texas Turnpike Authority Revenue | |||||||||
| 2,000,000 | 6.100%, 01/01/28 | A2/A-/NR | 2,299,500 | ||||||
| Utah Transit Authority Sales Tax Revenue Refunding | |||||||||
| 5,185,000 | zero coupon, 06/15/23 Series A NPFG Insured | A1/A-/A+ | 3,159,739 | ||||||
| Utah Transit Authority Sales Tax Revenue, Series A | |||||||||
| 2,000,000 | 5.000%, 06/15/27 | Aa2/AAA/AA | 2,308,000 | ||||||
| Utah Transit Authority Sales Tax & Transportation | |||||||||
| Revenue | |||||||||
| 1,450,000 | 4.125%, 06/15/22 AGMC Insured | Aa2/AAA/AA | 1,544,076 | ||||||
| 195,000 | 5.250%, 06/15/32 AGMC Insured | Aa2/AAA/AA | 252,176 | ||||||
| Washoe County, Nevada Highway Revenue | |||||||||
| 1,000,000 | 5.500%, 02/01/28 | A1/A+/NR | 1,122,730 | ||||||
| Total Transportation | 15,033,924 | ||||||||
| Utility (18.8%) | |||||||||
| Central Utah Water Conservancy District Refunding, | |||||||||
| Jordanelle Hydrant | |||||||||
| 1,125,000 | 4.500%, 10/01/27 Series A | NR/AA+/AA | 1,272,847 | ||||||
20
| TAX-FREE FUND FOR UTAH | |||
| SCHEDULE OF INVESTMENTS (continued) | |||
| JUNE 30, 2012 |
| Rating | |||||||||
| Moody’s, S&P | |||||||||
| Principal | and Fitch | ||||||||
| Amount | Revenue Bonds (continued) | (unaudited) | Value | ||||||
| Utility (continued) | |||||||||
| Central Weber, Utah Sewer Improvement District | |||||||||
| Revenue Refunding | |||||||||
| $ | 1,000,000 | 5.000%, 03/01/28 Series A AGMC Insured | NR/AA-/AA | $ | 1,124,930 | ||||
| 2,000,000 | 4.375%, 03/01/30 Series A AGMC Insured | NR/AA-/AA | 2,140,140 | ||||||
| 4,000,000 | 5.000%, 03/01/33 Series A AGMC Insured | NR/AA-/AA | 4,402,520 | ||||||
| Clark County, Washington Public Utility District | |||||||||
| No. 001 Generating Refunding | |||||||||
| 1,000,000 | 5.000%, 01/01/24 | A2/A/A+ | 1,121,140 | ||||||
| Corpus Christi, Texas Utility System Revenue | |||||||||
| 1,000,000 | 5.000%, 07/15/32 | Aa3/A+/AA- | 1,107,130 | ||||||
| Cowlitz County, Washington Public Utility District | |||||||||
| Electric Revenue | |||||||||
| 650,000 | 4.500%, 09/01/26 NPFG Insured | A1/NR/A | 676,442 | ||||||
| Davie, Florida Water & Sewer Revenue | |||||||||
| 1,000,000 | 5.000%, 10/01/32 AGMC Insured | Aa3/AA-/NR | 1,115,810 | ||||||
| Eagle Mountain, Utah Gas & Electric | |||||||||
| 1,385,000 | 4.250%, 06/01/20 Radian Insured | NR/NR/NR* | 1,386,080 | ||||||
| 1,440,000 | 5.000%, 06/01/21 Radian Insured | NR/NR/NR* | 1,476,302 | ||||||
| 1,515,000 | 5.000%, 06/01/22 Radian Insured | NR/NR/NR* | 1,551,102 | ||||||
| El Paso, Texas Solid Waste Disposal System Revenue | |||||||||
| 1,540,000 | 5.125%, 08/15/28 AGMC Insured | Aa3/AA-/NR | 1,579,193 | ||||||
| Herriman City, Utah Water Revenue Refunding | |||||||||
| 1,210,000 | 4.500%, 01/01/33 AMBAC Insured | NR/A/NR | 1,265,515 | ||||||
| Houston, Texas Utility System Revenue, Refunding | |||||||||
| 1,165,000 | 5.125%, 05/15/28 Series A NPFG Insured | Aa2/AA/AA- | 1,236,007 | ||||||
| Intermountain Power Agency, Utah Power Supply | |||||||||
| Revenue, Refunding | |||||||||
| 1,000,000 | 4.250%, 07/01/19 Series B | A1/A+/AA- | 1,073,800 | ||||||
| 1,000,000 | 5.000%, 07/01/21 Series A AGMC Insured | Aa3/AA-/AA- | 1,042,100 | ||||||
| 250,000 | 5.250%, 07/01/23 | A1/A+/AA- | 261,267 | ||||||
| Jacksonville Electric Authority, Florida Bulk Power | |||||||||
| System Revenue, Scherer 4 Project | |||||||||
| 1,500,000 | 6.000%, 10/01/37 Series A | Aa2/AA-/AA- | 1,626,495 | ||||||
21
| TAX-FREE FUND FOR UTAH | |||
| SCHEDULE OF INVESTMENTS (continued) | |||
| JUNE 30, 2012 |
| Rating | |||||||||
| Moody’s, S&P | |||||||||
| Principal | and Fitch | ||||||||
| Amount | Revenue Bonds (continued) | (unaudited) | Value | ||||||
| Utility (continued) | |||||||||
| Jacksonville Electric Authority, Florida Electric | |||||||||
| System Revenue | |||||||||
| $ | 500,000 | 5.000%, 10/01/26 | Aa3/A+/AA- | $ | 517,065 | ||||
| 500,000 | 4.500%, 10/01/32 Series Three 2012A | Aa2/AA-/AA- | 538,120 | ||||||
| King County, Washington Sewer Revenue | |||||||||
| 660,000 | 5.000%, 01/01/33 AGMC Insured | Aa2/AA+/NR | 720,740 | ||||||
| Laredo, Texas Waterworks Sewer System Revenue | |||||||||
| 1,450,000 | 5.000%, 03/01/24 Series 2010 | A1/AA-/AA- | 1,723,325 | ||||||
| Lower Colorado River Authority, Texas | |||||||||
| 1,470,000 | 5.250%, 05/15/29 | A1/A/A+ | 1,647,532 | ||||||
| 60,000 | 5.250%, 05/15/29 (pre-refunded) | NR/NR/NR* | 75,508 | ||||||
| 5,000 | 5.250%, 05/15/29 (pre-refunded) | NR/NR/NR* | 6,311 | ||||||
| Lower Colorado River Authority, Texas Transmission | |||||||||
| Contract Revenue, Refunding | |||||||||
| 1,065,000 | 5.000%, 05/15/33 AMBAC Insured | A2/A/A+ | 1,078,206 | ||||||
| Miami-Dade County, Florida Water and Sewer | |||||||||
| Revenue System | |||||||||
| 1,500,000 | 5.000%, 10/01/29 AGMC Insured | Aa2/AA-/AA- | 1,710,435 | ||||||
| Mountain Regional Water Special Service District | |||||||||
| Utah Water Revenue Refunding | |||||||||
| 3,000,000 | 5.000%, 12/15/33 AGMC Insured | NR/AA-/AA- | 3,410,880 | ||||||
| Orem, Utah Water & Storm Sewer Revenue | |||||||||
| 1,000,000 | 5.000%, 07/15/26 | NR/AA/AA+ | 1,121,830 | ||||||
| 1,250,000 | 5.250%, 07/15/28 | NR/AA/AA+ | 1,422,487 | ||||||
| Pleasant Grove City, Utah Storm Water Revenue | |||||||||
| 860,000 | 4.750%, 07/15/36 AGMC Insured | Aa3/AA-/AA- | 942,861 | ||||||
| Port St. Lucie, Florida Utility System Revenue | |||||||||
| 1,200,000 | 5.250%, 09/01/26 NPFG Insured | A1/NR/AA- | 1,271,388 | ||||||
| Salt Lake & Sandy, Utah Metropolitan Water District, | |||||||||
| Water Revenue, Refunding | |||||||||
| 1,190,000 | 5.000%, 07/01/31 Series A | NR/AA+/AA+ | 1,398,595 | ||||||
| 650,000 | 5.000%, 07/01/31 Series A | NR/AA+/AA+ | 728,800 | ||||||
| 1,000,000 | 5.000%, 07/01/37 Series A | NR/AA+/AA+ | 1,143,660 | ||||||
22
| TAX-FREE FUND FOR UTAH | |||
| SCHEDULE OF INVESTMENTS (continued) | |||
| JUNE 30, 2012 |
| Rating | |||||||||
| Moody’s, S&P | |||||||||
| Principal | and Fitch | ||||||||
| Amount | Revenue Bonds (continued) | (unaudited) | Value | ||||||
| Utility (continued) | |||||||||
| Santa Clara, Utah Electric Revenue | |||||||||
| $ | 1,005,000 | 4.250%, 08/01/26 AGC Insured | Aa3/NR/NR | $ | 943,715 | ||||
| Sarasota, Florida Utility System Revenue Refunding | |||||||||
| 1,455,000 | 5.000%, 10/01/27 | NR/AA+/AA | 1,765,410 | ||||||
| South Valley, Utah Water Reclamation Facility Sewer | |||||||||
| Revenue | |||||||||
| 2,110,000 | 5.000%, 08/15/24 AMBAC Insured | NR/A/NR | 2,229,890 | ||||||
| 425,000 | 5.000%, 08/15/30 AMBAC Insured | NR/A/NR | 443,241 | ||||||
| South Weber City, Utah Water Revenue | |||||||||
| 730,000 | 5.000%, 06/01/35 AGMC Insured | NR/AA-/NR | 793,466 | ||||||
| 930,000 | 5.000%, 06/01/40 AGMC Insured | NR/AA-/NR | 1,007,543 | ||||||
| Southern Utah Valley Power System | |||||||||
| 210,000 | 5.250%, 09/15/13 NPFG Insured | Baa2/BBB/NR | 211,705 | ||||||
| 225,000 | 5.250%, 09/15/14 NPFG Insured | Baa2/BBB/NR | 226,661 | ||||||
| 235,000 | 5.250%, 09/15/15 NPFG Insured | Baa2/BBB/NR | 236,661 | ||||||
| 185,000 | 5.125%, 09/15/21 NPFG Insured | Baa2/BBB/NR | 186,051 | ||||||
| St. George, Utah Electric Revenue | |||||||||
| 500,000 | 4.500%, 06/01/20 AGMC Insured | Aa3/NR/NR | 537,160 | ||||||
| 3,750,000 | 5.000%, 06/01/38 AGMC Insured | Aa3/NR/NR | 4,006,350 | ||||||
| Tacoma, Washington Solid Waste Utility Revenue | |||||||||
| 1,000,000 | 5.000%, 12/01/23 Syncora Guarantee, Inc. Insured | A2/AA/AA- | 1,091,860 | ||||||
| Tallahassee, Florida Energy System Revenue Refunding | |||||||||
| 1,500,000 | 5.000%, 10/01/28 | Aa3/AA/AA- | 1,662,255 | ||||||
| Utah Assessed Municipal Power System | |||||||||
| 1,000,000 | 5.000%, 04/01/21 AGMC Insured (pre-refunded) | Aa3/AA-/NR | 1,035,270 | ||||||
| Utah Assessed Municipal Power System Revenue | |||||||||
| Refunding, Payson Power Project | |||||||||
| 2,000,000 | 5.000%, 04/01/24 | NR/A-/A | 2,273,880 | ||||||
| 1,000,000 | 5.000%, 04/01/25 | NR/A-/A | 1,125,900 | ||||||
| 6,375,000 | 5.000%, 04/01/26 | NR/A-/A | 7,129,290 | ||||||
| Utah Water Conservancy District | |||||||||
| 1,400,000 | 5.250%, 01/15/27 | NR/A/NR | 1,531,600 | ||||||
23
| TAX-FREE FUND FOR UTAH | |||
| SCHEDULE OF INVESTMENTS (continued) | |||
| JUNE 30, 2012 |
| Rating | |||||||||
| Moody’s, S&P | |||||||||
| Principal | and Fitch | ||||||||
| Amount | Revenue Bonds (continued) | (unaudited) | Value | ||||||
| Utility (continued) | |||||||||
| Washington County, Utah Water Conservancy | |||||||||
| District Refunding | |||||||||
| $ | 1,770,000 | 4.500%, 10/01/24 | NR/AA/AA | $ | 2,054,333 | ||||
| Washington, Utah Electric Revenue | |||||||||
| 985,000 | 5.000%, 09/01/21 Syncora Guarantee, Inc. Insured | Baa1/NR/NR | 1,029,778 | ||||||
| 1,000,000 | 5.000%, 09/01/24 Syncora Guarantee, Inc. Insured | Baa1/NR/NR | 1,030,420 | ||||||
| White City, Utah Water Improvement District Revenue | |||||||||
| 500,000 | 5.000%, 02/01/23 AGMC Insured | Aa3/NR/NR | 550,955 | ||||||
| 700,000 | 5.000%, 02/01/25 AGMC Insured | Aa3/NR/NR | 762,510 | ||||||
| 840,000 | 5.000%, 02/01/27 AGMC Insured | Aa3/NR/NR | 910,510 | ||||||
| Wyoming Municipal Power Agency Power Supply | |||||||||
| System Revenue | |||||||||
| 720,000 | 5.500%, 01/01/28 Series A | A2/A-/NR | 793,231 | ||||||
| Total Utility | 80,486,208 | ||||||||
| Water and Sewer (5.3%) | |||||||||
| Eagle Mountain, Utah Water and Sewer | |||||||||
| 690,000 | 4.750%, 11/15/25 NPFG Insured | Baa2/A+/AA- | 735,271 | ||||||
| Jordan Valley, Utah Water Conservancy District | |||||||||
| Revenue | |||||||||
| 1,000,000 | 5.000%, 10/01/31 Series B | NR/AA+/AA | 1,156,030 | ||||||
| 6,000,000 | 5.000%, 10/01/35 Series B | NR/AA+/AA | 6,832,080 | ||||||
| Murray City, Utah Sewer and Water | |||||||||
| 440,000 | 5.000%, 10/01/19 AMBAC Insured (pre-refunded) | Aa3/NR/NR | 465,837 | ||||||
| Ogden City, Utah Sewer & Water Revenue Refunding | |||||||||
| 750,000 | 4.625%, 06/15/38 AGMC Insured | Aa3/NR/NR | 789,975 | ||||||
| Pleasant Grove City, Utah Water Revenue | |||||||||
| 450,000 | 4.300%, 12/01/20 NPFG Insured | Baa2/BBB+/NR | 477,594 | ||||||
| 760,000 | 4.625%, 12/01/23 AGMC Insured | NR/AA-/NR | 844,565 | ||||||
| 1,000,000 | 5.250%, 12/01/29 AGMC Insured | NR/AA-/NR | 1,120,310 | ||||||
| 1,370,000 | 5.000%, 12/01/31 Series B NPFG Insured | Baa2/BBB+/NR | 1,444,596 | ||||||
| Rapid City, South Dakota Water Revenue | |||||||||
| 500,000 | 5.000%, 11/01/29 | Aa3/NR/NR | 557,620 | ||||||
| 1,500,000 | 5.250%, 11/01/39 | Aa3/NR/NR | 1,660,020 | ||||||
24
| TAX-FREE FUND FOR UTAH | |||
| SCHEDULE OF INVESTMENTS (continued) | |||
| JUNE 30, 2012 |
| Rating | ||||||||||
| Moody’s, S&P | ||||||||||
| Principal | and Fitch | |||||||||
| Amount | Revenue Bonds (continued) | (unaudited) | Value | |||||||
| Water and Sewer (continued) | ||||||||||
| Utah Water Finance Agency Revenue | ||||||||||
| $ | 200,000 | 5.250%, 07/01/16 AMBAC Insured | NR/NR/NR* | $ | 200,000 | |||||
| 310,000 | 5.000%, 10/01/17 AMBAC Insured (pre-refunded) | NR/NR/NR* | 313,537 | |||||||
| 510,000 | 5.000%, 07/01/18 AMBAC Insured (pre-refunded) | A1/NR/NR | 533,909 | |||||||
| 105,000 | 5.000%, 10/01/20 AMBAC Insured (pre-refunded) | NR/NR/NR* | 106,198 | |||||||
| 830,000 | 4.500%, 10/01/22 AMBAC Insured | Aa3/NR/NR | 875,683 | |||||||
| 765,000 | 5.125%, 07/01/23 AMBAC Insured | NR/NR/NR* | 765,000 | |||||||
| 870,000 | 4.500%, 10/01/23 AMBAC Insured | Aa3/NR/NR | 914,100 | |||||||
| 2,645,000 | 4.500%, 10/01/28 AMBAC Insured | Aa3/NR/NR | 2,816,105 | |||||||
| Total Water and Sewer | 22,608,430 | |||||||||
| Total Revenue Bonds | 326,287,122 | |||||||||
| Total Investments (cost $404,392,367 - note 4) | 98.1 | % | 419,449,736 | |||||||
| Other assets less liabilities | 1.9 | 8,072,571 | ||||||||
| Net Assets | 100.0 | % | $ | 427,522,307 | ||||||
| * | Any security not rated (“NR”) by any of the Nationally Recognized Statistical Rating Organizations (“NRSRO” or “Credit Rating Agency”) has been determined by the Investment Adviser to have sufficient quality to be ranked in the top four credit ratings if a credit rating were to be assigned by a NRSRO. | |||||||||
| ** | Security purchased on a delayed delivery or when-issued basis. | |||||||||
Note: 144A – Private placement subject to SEC rule 144A, which modifies a two-year holding period requirement to permit qualified institutional buyers to trade these securities among themselves, thereby significantly improving the liquidity of these securities. | ||||||||||
25
TAX-FREE FUND FOR UTAH
SCHEDULE OF INVESTMENTS (continued)
JUNE 30, 2012
| Percent of | ||||
| Portfolio Distribution by Quality Rating (unaudited) | Investments1 | |||
| Aaa of Moody’s or AAA of S&P and Fitch | 12.0 | % | ||
| Aa of Moody’s or AA of S&P and Fitch | 46.9 | |||
| A of Moody’s or S&P and Fitch | 21.2 | |||
| Baa of Moody’s or BBB of S&P | 3.7 | |||
| BB+ of S&P | 0.3 | |||
| Not rated* | 15.9 | |||
| 100.0 | % | |||
1 Calculated using the highest rating of the three NRSROs. | ||||
| PORTFOLIO ABBREVIATIONS: AGC - Assured Guaranty Corp. AGMC - Assured Guaranty Municipal Corp. AMBAC - American Municipal Bond Assurance Corp. AMT - Alternative Minimum Tax COP - Certificates of Participation FGIC - Financial Guaranty Insurance Co. FNMA - Federal National Mortgage Association IBC - Insured Bond Certificates NPFG - National Public Finance Guarantee NR - Not Rated PSF - Permanent School Fund | ||||
See accompanying notes to financial statements.
26
| TAX-FREE FUND FOR UTAH | |
| STATEMENT OF ASSETS AND LIABILITIES | |
YEAR JUNE 30, 2012 |
| ASSETS | ||||
| Investments at value (cost $404,392,367) | $ | 419,449,736 | ||
| Cash | 6,322,613 | |||
| Interest receivable | 6,163,346 | |||
| Receivable for Fund shares sold | 1,095,310 | |||
| Other assets | 9,914 | |||
| Total assets | 433,040,919 | |||
| LIABILITIES | ||||
| Payable for investment securities purchased | 4,348,743 | |||
| Payable for Fund shares redeemed | 330,297 | |||
| Deferred income | 311,743 | |||
| Dividends payable | 257,297 | |||
| Management fees payable | 158,283 | |||
| Distribution and service fees payable | 16,073 | |||
| Accrued expenses | 96,176 | |||
| Total liabilities | 5,518,612 | |||
| NET ASSETS | $ | 427,522,307 | ||
| Net Assets consist of: | ||||
| Capital Stock - Authorized an unlimited number of shares, par value $0.01 per share | $ | 416,097 | ||
| Additional paid-in capital | 411,976,738 | |||
| Net unrealized appreciation on investments (note 4) | 15,057,369 | |||
| Accumulated net realized loss on investments | (71,455 | ) | ||
| Undistributed net investment income | 143,558 | |||
| $ | 427,522,307 | |||
| CLASS A | ||||
| Net Assets | $ | 255,339,274 | ||
| Capital shares outstanding | 24,863,178 | |||
| Net asset value and redemption price per share | $ | 10.27 | ||
| Maximum offering price per share (100/96 of $10.27 adjusted to nearest cent) | $ | 10.70 | ||
| CLASS C | ||||
| Net Assets | $ | 96,321,153 | ||
| Capital shares outstanding | 9,382,877 | |||
| Net asset value and offering price per share | $ | 10.27 | ||
| Redemption price per share (*a charge of 1% is imposed on the redemption | ||||
| proceeds of the shares, or on the original price, whichever is lower, if redeemed | ||||
| during the first 12 months after purchase) | $ | 10.27 | * | |
| CLASS Y | ||||
| Net Assets | $ | 75,861,880 | ||
| Capital shares outstanding | 7,363,685 | |||
| Net asset value, offering and redemption price per share | $ | 10.30 | ||
See accompanying notes to financial statements.
27
| TAX-FREE FUND FOR UTAH | ||
| STATEMENT OF OPERATIONS | ||
| YEAR ENDED JUNE 30, 2012 |
| Investment Income: | ||||||||
| Interest income | $ | 17,881,597 | ||||||
| Other income | 48,997 | |||||||
| 17,930,594 | ||||||||
| Expenses: | ||||||||
| Management fee (note 3) | $ | 1,944,425 | ||||||
| Distribution and service fees (note 3) | 1,350,779 | |||||||
| Transfer and shareholder servicing agent fees | 221,120 | |||||||
| Trustees’ fees and expenses (note 7) | 153,491 | |||||||
| Legal fees | 104,618 | |||||||
| Shareholders’ reports and proxy statements | 63,951 | |||||||
| Custodian fees (note 6) | 32,860 | |||||||
| Fund accounting fees | 26,115 | |||||||
| Auditing and tax fees | �� | 26,101 | ||||||
| Registration fees and dues | 25,355 | |||||||
| Insurance | 14,907 | |||||||
| Chief compliance officer services (note 3) | 5,576 | |||||||
| Miscellaneous | 40,460 | |||||||
| Total expenses | 4,009,758 | |||||||
| Management fee waived (note 3) | (195,670 | ) | ||||||
| Expenses paid indirectly (note 6) | (1,955 | ) | ||||||
| Net expenses | 3,812,133 | |||||||
| Net investment income | 14,118,461 | |||||||
| Realized and Unrealized Gain (Loss) on Investments: | ||||||||
| Net realized gain from securities transactions | 1,784,883 | |||||||
| Change in unrealized depreciation on investments | 18,089,142 | |||||||
| Net realized and unrealized gain (loss) on investments | 19,874,025 | |||||||
| Net change in net assets resulting from operations | $ | 33,992,486 | ||||||
See accompanying notes to financial statements.
28
| TAX-FREE FUND FOR UTAH | ||
| STATEMENTS OF CHANGES IN NET ASSETS |
| Year Ended | Year Ended | |||||||
| June 30, 2012 | June 30, 2011 | |||||||
| OPERATIONS: | ||||||||
| Net investment income | $ | 14,118,461 | $ | 15,669,819 | ||||
| Net realized gain (loss) from securities transactions | 1,784,883 | 616,769 | ||||||
| Change in unrealized appreciation (depreciation) on investments | 18,089,142 | (4,341,103 | ) | |||||
| Change in net assets from operations | 33,992,486 | 11,945,485 | ||||||
| DISTRIBUTIONS TO SHAREHOLDERS (note 10): | ||||||||
| Class A Shares: | ||||||||
| Net investment income | (8,808,164 | ) | (10,072,186 | ) | ||||
| Class C Shares: | ||||||||
| Net investment income | (2,616,170 | ) | (3,272,455 | ) | ||||
| Class Y Shares: | ||||||||
| Net investment income | (2,648,622 | ) | (2,727,358 | ) | ||||
| Change in net assets from distributions | (14,072,956 | ) | (16,071,999 | ) | ||||
| CAPITAL SHARE TRANSACTIONS (note 8): | ||||||||
| Proceeds from shares sold | 138,764,606 | 90,761,022 | ||||||
| Reinvested dividends and distributions | 8,525,121 | 9,574,958 | ||||||
| Cost of shares redeemed | (90,854,748 | ) | (124,122,693 | ) | ||||
| Change in net assets from capital share transactions | 56,434,979 | (23,786,713 | ) | |||||
| Change in net assets | 76,354,509 | (27,913,227 | ) | |||||
| NET ASSETS: | ||||||||
| Beginning of period | 351,167,798 | 379,081,025 | ||||||
| End of period* | $ | 427,522,307 | $ | 351,167,798 | ||||
| * Includes undistributed net investment income, respectively, of: | $ | 143,558 | $ | 99,809 | ||||
See accompanying notes to financial statements.
29
TAX-FREE FUND FOR UTAH
NOTES TO FINANCIAL STATEMENTS
JUNE 30, 2012
1. Organization
Tax-Free Fund For Utah (the “Fund”), a non-diversified, open-end investment company, was organized on December 12, 1990 as a Massachusetts business trust and commenced operations on July 24, 1992. The Fund is authorized to issue an unlimited number of shares and, since its inception to May 21, 1996, offered only one class of shares. On that date, the Fund began offering two additional classes of shares, Class C and Class Y Shares. All shares outstanding prior to that date were designated as Class A Shares and are sold at net asset value plus a sales charge of varying size (depending upon a variety of factors) paid at the time of purchase and bear a distribution fee. Class C Shares are sold at net asset value with no sales charge payable at the time of purchase but with a level charge for service and distribution fees for six years thereafter. Class C Shares automatically convert to Class A Shares after six years. Class Y Shares are sold only through authorized financial institutions acting for investors in a fiduciary, advisory, agency, custodial or similar capacity, and are not offered directly to retail customers. Class Y Shares are sold at net asset value with no sales charge, no redemption fee, no contingent deferred sales charge (“CDSC”) and no distribution fee. On October 31, 1997, the Fund established Class I Shares which are offered and sold only through financial intermediaries and are not offered directly to retail customers. Class I Shares are sold at net asset value with no sales charge and no redemption fee or CDSC, although a financial intermediary may charge a fee for effecting a purchase or other transaction on behalf of its customers. Class I Shares carry a distribution and a service fee. As of the report date, there were no Class I Shares outstanding. All classes of shares represent interests in the same portfolio of investments and are identical as to rights and privileges but differ with respect to the effect of sales charges, the distribution and/or service fees borne by each class, expenses specific to each class, voting rights on matters affecting a single class and the exchange privileges of each class.
2. Significant Accounting Policies
The following is a summary of significant accounting policies followed by the Fund in the preparation of its financial statements. The policies are in conformity with accounting principles generally accepted in the United States of America for investment companies.
| a) | Portfolio valuation: Municipal securities which have remaining maturities of more than 60 days are valued each business day based upon information provided by a nationally prominent independent pricing service and periodically verified through other pricing services. In the case of securities for which market quotations are readily available, securities are valued by the pricing service at the mean of bid and asked quotations. If a market quotation or a valuation from the pricing service is not readily available, the security is valued at fair value determined in good faith under procedures established by and under the general supervision of the Board of Trustees. Securities which mature in 60 days or less are generally valued at amortized cost if their term to maturity at purchase is 60 days or less, or by amortizing their unrealized appreciation or depreciation on the 61st day prior to maturity, if their term to maturity at purchase exceeds 60 days. |
30
TAX-FREE FUND FOR UTAH
NOTES TO FINANCIAL STATEMENTS (continued)
JUNE 30, 2012
| b) | Fair value measurements: The Fund follows a fair value hierarchy that distinguishes between market data obtained from independent sources (observable inputs) and the Fund’s own market assumptions (unobservable inputs). These inputs are used in determining the value of the Fund’s investments and are summarized in the following fair value hierarchy: Level 1 – Unadjusted quoted prices in active markets for identical assets or liabilities that the Fund has the ability to access. Level 2 – Observable inputs other than quoted prices included in Level 1 that are observable for the asset or liability, either directly or indirectly. These inputs may include quoted prices for the identical instrument on an inactive market, prices for similar instruments, interest rates, prepayment speeds, credit risk, yield curves, default rates and similar data. Level 3 – Unobservable inputs for the asset or liability, to the extent relevant observable inputs are not available, representing the Fund’s own assumptions about the assumptions a market participant would use in valuing the asset or liability, based on the best information available. The inputs or methodology used for valuing securities are not an indication of the risk associated with investing in those securities The following is a summary of the valuation inputs, representing 100% of the Fund’s investments, used to value the Fund’s net assets as of June 30, 2012: |
| Valuation Inputs | Investments in Securities | ||||
| Level 1 – Quoted Prices | $ | — | |||
Level 2 – Other Significant Observable Inputs — Municipal Bonds* | 419,449,736 | ||||
| Level 3 – Significant Unobservable Inputs | — | ||||
| Total | $ | 419,449,736 | |||
*See schedule of investments for a detailed listing of securities.
| c) | Subsequent events: In preparing these financial statements, the Fund has evaluated events and transactions for potential recognition or disclosure through the date these financial statements were issued. |
| d) | Securities transactions and related investment income: Securities transactions are recorded on the trade date. Realized gains and losses from securities transactions are reported on the identified cost basis. Interest income is recorded daily on the accrual basis and is adjusted for amortization of premium and accretion of original issue and market discount. In connection with certain bonds, fee income is recognized by the Fund on a daily basis over the life of the bonds. |
31
TAX-FREE FUND FOR UTAH
NOTES TO FINANCIAL STATEMENTS (continued)
JUNE 30, 2012
| e) | Federal income taxes: It is the policy of the Fund to continue to qualify as a regulated investment company by complying with the provisions of the Internal Revenue Code applicable to certain investment companies. The Fund intends to make distributions of income and securities profits sufficient to relieve it from all, or substantially all, Federal income and excise taxes. |
Management has reviewed the tax positions for each of the open tax years (2009-2011) or expected to be taken in the Fund’s 2012 tax returns and has concluded that there are no significant uncertain tax positions that would require recognition in the financial statements.
| f) | Multiple class allocations: All income, expenses (other than class-specific expenses), and realized and unrealized gains or losses are allocated daily to each class of shares based on the relative net assets of each class. Class-specific expenses, which include distribution and service fees and any other items that are specifically attributed to a particular class, are also charged directly to such class on a daily basis. |
| g) | Use of estimates: The preparation of financial statements in conformity with accounting principles generally accepted in the United States of America requires management to make estimates and assumptions that affect the reported amounts of assets and liabilities and disclosure of contingent assets and liabilities at the date of the financial statements and the reported amounts of increases and decreases in net assets from operations during the reporting period. Actual results could differ from those estimates. |
| h) | Accounting pronouncements: In May 2011, the Financial Accounting Standards Board (“FASB”) issued Accounting Standards Update (“ASU”) No. 2011-04, “Fair Value Measurement (Topic 820): Amendments to Achieve Common Fair Value Measurement and Disclosure Requirements in U.S. GAAP and International Financial Reporting Standards (“IFRS”). ASU No. 2011-04 clarifies existing requirements for measuring fair value and for disclosure about fair value measurements in converged guidance of the FASB and the International Accounting Standards Board. The amendments are effective during interim and annual periods beginning after December 15, 2011. In December 2011, FASB issued ASU No. 2011-11 related to disclosures about offsetting assets and liabilities. The amendments in this ASU require an entity to disclose information about offsetting and related arrangements to enable users of its financial statements to understand the effect of those arrangements on its financial position. The ASU is effective for annual reporting periods beginning on or after January 1, 2013, and interim periods within those annual periods. The guidance requires retrospective application for all comparative periods presented. Management is currently evaluating the impact these updates and amendments may have on the Fund’s financial statements. |
3. Fees and Related Party Transactions
a) Management Arrangements:
Aquila Investment Management LLC (the “Manager”), a wholly-owned subsidiary of Aquila Management Corporation, the Fund’s founder and sponsor, serves as the Manager for the Fund under an Advisory and Administration Agreement with the Fund. Under the Advisory and Administration Agreement, the Manager provides all investment management and administrative services to the Fund. The Manager’s services include providing the office of the Fund and all related services as well as managing relationships with all the various support organizations to the Fund such as the shareholder servicing agent, custodian, legal counsel, fund accounting agent, auditors and distributor. For its services, the Manager is entitled to receive a fee which is payable monthly and computed as of the close of business each day at the annual rate of 0.50 of 1% on the Fund’s net assets.
32
TAX-FREE FUND FOR UTAH
NOTES TO FINANCIAL STATEMENTS (continued)
JUNE 30, 2012
For the year ended June 30, 2012, the Fund incurred management fees of $1,944,425 of which $195,670 was waived. The Manager has contractually undertaken to waive fees and/or reimburse Fund expenses so that total Fund expenses will not exceed 0.83% for Class A Shares, 1.63% for Class C Shares, 0.99% for Class I Shares (none of which are currently outstanding) or 0.63% for Class Y Shares. These expense limitations are in effect until October 31, 2012. Prior to October 31, 2012, the Manager may not terminate the arrangement without the approval of the Board of Trustees.
On January 7, 2011, the Securities and Exchange Commission announced a settlement with two former portfolio managers of the Fund concerning fees paid by the issuers of certain bonds held by the Fund, that among other things required them to pay a total of $589,578 in disgorgement and prejudgment interest to the Fund over a one-year period. This entire amount was paid to the Fund by September 23, 2011. Furthermore, this settlement superceded the prior agreement of the Manager to pay the Fund $520,626 in installments (with interest) over a maximum period of 58 months, under which the Manager had paid $160,000 to the Fund. In addition, it was determined that the $160,000 that had been paid by the Manager to the Fund would be returned to the Manager from the receipt of the settlement proceeds. The entire $160,000 was returned to the Manager by September 30, 2011.
Under a Compliance Agreement with the Manager, the Manager is compensated by the Fund for Chief Compliance Officer related services provided to enable the Fund to comply with Rule 38a-1 of the Investment Company Act of 1940.
Specific details as to the nature and extent of the services provided by the Manager are more fully defined in the Fund’s Prospectus and Statement of Additional Information.
b) Distribution and Service Fees:
The Fund has adopted a Distribution Plan (the “Plan”) pursuant to Rule 12b-1 (the “Rule”) under the Investment Company Act of 1940. Under one part of the Plan, with respect to Class A Shares, the Fund is authorized to make distribution fee payments to broker-dealers or others (“Qualified Recipients”) selected by Aquila Distributors, Inc. (the “Distributor”) including, but not limited to, any principal underwriter of the Fund, with which the Distributor has entered into written agreements contemplated by the Rule and which have rendered assistance in the distribution and/or retention of the Fund’s shares or servicing of shareholder accounts. The Fund makes payment of this distribution fee at the annual rate of 0.20% of the Fund’s average net assets represented by Class A Shares. For the year ended June 30, 2012, distribution fees on Class A Shares amounted to $467,376, of which the Distributor retained $14,608.
33
TAX-FREE FUND FOR UTAH
NOTES TO FINANCIAL STATEMENTS (continued)
JUNE 30, 2012
Under another part of the Plan, the Fund is authorized to make payments with respect to Class C Shares to Qualified Recipients which have rendered assistance in the distribution and/or retention of the Fund’s Class C shares or servicing of shareholder accounts. These payments are made at the annual rate of 0.75% of the Fund’s average net assets represented by Class C Shares and for the year ended June 30, 2012, amounted to $662,552. In addition, under a Shareholder Services Plan, the Fund is authorized to make service fee payments with respect to Class C Shares to Qualified Recipients for providing personal services and/or maintenance of shareholder accounts. These payments are made at the annual rate of 0.25% of the Fund’s average net assets represented by Class C Shares and for the year ended June 30, 2012 amounted to $220,851. The total of these payments with respect to Class C Shares amounted to $883,403, of which the Distributor retained $180,247.
Specific details about the Plans are more fully defined in the Fund’s Prospectus and Statement of Additional Information.
Under a Distribution Agreement, the Distributor serves as the exclusive distributor of the Fund’s shares.Through agreements between the Distributor and various brokerage and advisory firms (“intermediaries”), the Fund’s shares are sold primarily through the facilities of these intermediaries having offices within Utah, with the bulk of any sales commissions inuring to such intermediaries. For the year ended June 30, 2012, total commissions on sales of Class A Shares amounted to $924,226, of which the Distributor received $86,113.
4. Purchases and Sales of Securities
During the year ended June 30, 2012, purchases of securities and proceeds from the sales of securities aggregated $125,628,048 and $64,880,011, respectively.
At June 30, 2012, the aggregate tax cost for all securities was $404,248,809. At June 30, 2012, the aggregate gross unrealized appreciation for all securities in which there is an excess of value over tax cost amounted to $17,388,516 and aggregate gross unrealized depreciation for all securities in which there is an excess of tax cost over value amounted to $2,187,589, for a net unrealized appreciation of $15,200,927.
5. Portfolio Orientation
At least 50% of the Fund’s assets will always consist of obligations of Utah-based issuers. At June 30, 2012, the Fund had 59% of its net assets invested in municipal obligations of issuers within Utah. The Fund is also permitted to invest in tax-free municipal obligations of non-Utah-based issuers that are exempt from regular Federal income taxes and, pursuant to an administrative determination of the Utah State Tax Commission issued under statutory authority, the interest on which is currently exempt from Utah individual income taxes. Since the Fund invests principally and may invest entirely in double tax-free municipal obligations of issuers within Utah, it is subject to possible risks associated with economic, political, or legal developments or industrial or regional matters specifically affecting Utah and whatever effects these may have upon Utah issuers’ ability to meet their obligations.
34
TAX-FREE FUND FOR UTAH
NOTES TO FINANCIAL STATEMENTS (continued)
JUNE 30, 2012
6. Expenses
The Fund has negotiated an expense offset arrangement with its custodian wherein it receives credit toward the reduction of custodian fees and other Fund expenses whenever there are uninvested cash balances. The Statement of Operations reflects the total expenses before any offset, the amount of offset and the net expenses.
7. Trustees’ Fees and Expenses
At June 30, 2012 there were 9 Trustees, one of whom is affiliated with the Manager and is not paid any fees. The total amount of Trustees’ service fees (for carrying out their responsibilities) and attendance fees paid during the year ended June 30, 2012 was $122,661. Attendance fees are paid to those in attendance at regularly scheduled quarterly Board Meetings and meetings of the Independent Trustees held prior to each quarterly Board Meeting, as well as additional meetings (such as Audit, Nominating, Shareholder and special meetings). Trustees are reimbursed for their expenses such as travel, accommodations and meals incurred in connection with attendance at Board Meetings and the Annual Meeting of Shareholders. For the year ended June 30, 2012, such meeting-related expenses amounted to $30,830.
35
TAX-FREE FUND FOR UTAH
NOTES TO FINANCIAL STATEMENTS (continued)
JUNE 30, 2012
8. Capital Share Transactions
Transactions in Capital Shares of the Fund were as follows:
| Year Ended | Year Ended | |||||||||||||||
| June 30, 2012 | June 30, 2011 | |||||||||||||||
| Shares | Amount | Shares | Amount | |||||||||||||
| Class A Shares: | ||||||||||||||||
| Proceeds from shares sold | 7,110,240 | $ | 71,675,930 | 4,193,949 | $ | 40,949,761 | ||||||||||
| Reinvested distributions | 515,800 | 5,202,390 | 611,153 | 5,947,989 | ||||||||||||
| Cost of shares redeemed | (4,573,928 | ) | (46,002,731 | ) | (6,624,373 | ) | (63,577,122 | ) | ||||||||
| Net change | 3,052,112 | 30,875,589 | (1,819,271 | ) | (16,679,372 | ) | ||||||||||
| Class C Shares: | ||||||||||||||||
| Proceeds from shares sold | 3,676,797 | 36,925,228 | 2,478,584 | 24,310,498 | ||||||||||||
| Reinvested distributions | 178,950 | 1,803,826 | 218,150 | 2,120,788 | ||||||||||||
| Cost of shares redeemed | (2,945,514 | ) | (29,480,749 | ) | (3,292,796 | ) | (31,692,159 | ) | ||||||||
| Net change | 910,233 | 9,248,305 | (596,062 | ) | (5,260,873 | ) | ||||||||||
| Class Y Shares: | ||||||||||||||||
| Proceeds from shares sold | 2,978,473 | 30,163,448 | 2,605,011 | 25,500,763 | ||||||||||||
| Reinvested distributions | 150,033 | 1,518,905 | 154,518 | 1,506,181 | ||||||||||||
| Cost of shares redeemed | (1,510,885 | ) | (15,371,268 | ) | (2,990,607 | ) | (28,853,412 | ) | ||||||||
| Net change | 1,617,621 | 16,311,085 | (231,078 | ) | (1,846,468 | ) | ||||||||||
| Total transactions in Fund | ||||||||||||||||
| shares | 5,579,966 | $ | 56,434,979 | (2,646,411 | ) | $ | (23,786,713 | ) | ||||||||
9. Securities Traded on a When-Issued Basis
The Fund may purchase or sell securities on a when-issued basis. When-issued transactions arise when securities are purchased or sold by the Fund with payment and delivery taking place in the future in order to secure what is considered to be an advantageous price and yield to the Fund at the time of entering into the transaction. Beginning on the date the Fund enters into a when-issued transaction, cash or other liquid securities are segregated in an amount equal to or greater than the value of the when-issued transaction. These transactions are subject to market fluctuations and their current value is determined in the same manner as for other securities.
36
TAX-FREE FUND FOR UTAH
NOTES TO FINANCIAL STATEMENTS (continued)
JUNE 30, 2012
10. Income Tax Information and Distributions
The Fund declares dividends daily from net investment income and makes payments monthly. Net realized capital gains, if any, are distributed annually and are taxable. These distributions are paid in additional shares at the net asset value per share, in cash, or in a combination of both, at the shareholder’s option.
The Fund intends to maintain, to the maximum extent possible, the tax-exempt status of interest payments received from portfolio municipal securities in order to allow dividends paid to shareholders from net investment income to be exempt from regular Federal and State of Utah income taxes. Due to differences between financial statement reporting and Federal income tax reporting requirements, distributions made by the Fund may not be the same as the Fund’s net investment income, and/or net realized securities gains. In this regard, the Fund decreased undistributed net investment income in the amount of $1,756 and increased additional paid-in capital in the amount of $1,756 at June 30, 2012. These adjustments had no impact on the Fund’s aggregate net assets at June 30, 2012. Further, a small portion of the dividends may, under some circumstances, be subject to taxes at ordinary income rates. For certain shareholders some dividend income may, under some circumstances, be subject to the alternative minimum tax. As a result of the passage of the Regulated Investment Company Act of 2010 (“the Act”), losses incurred in this fiscal year and beyond retain their character as short-term or long-term, have no expiration date and are utilized before capital losses incurred prior to the enactment of the Act.
At June 30, 2012, the Fund had a capital loss carryover of $71,455 which expires in 2018. Carryovers are available to offset future net realized gains on securities transactions to the extent provided for in the Internal Revenue Code.
| The tax character of distributions: | ||||||||
| Year Ended June 30, | ||||||||
| 2012 | 2011 | |||||||
| Net tax-exempt income | $ | 14,072,731 | $ | 15,590,252 | ||||
| Ordinary income | 225 | 481,747 | ||||||
| $ | 14,072,956 | $ | 16,071,999 | |||||
As of June 30, 2012, the components of distributable earnings on a tax basis were as follows:
| Undistributed tax-exempt income | $ | 257,297 | ||||||
| Accumulated net realized loss | (71,455 | ) | ||||||
| Unrealized depreciation | 15,200,927 | |||||||
| Other temporary differences | (257,297 | ) | ||||||
| $ | 15,129,472 |
The difference between book basis and tax basis undistributed income is due to the timing difference in recognizing dividends paid.
37
TAX-FREE FUND FOR UTAH
NOTES TO FINANCIAL STATEMENTS (continued)
JUNE 30, 2012
11. Ongoing Development
Since December 2007, the three major credit rating agencies (Standard & Poor’s, Moody’s and Fitch) downgraded or eliminated ratings of the majority of the municipal bond insurance companies due to loss of capital from investments in subprime mortgages. Only a few insurers are now deemed to be investment grade. Thus, while certain bonds have insurance, some are no longer rated based upon the ratings of their insurers. Furthermore, because the ability of many of the Fund’s insurers to pay claims has been downgraded, the protection of such insurance has been diminished, and there is no assurance that some of them may be relied upon for payment.
38
TAX-FREE FUND FOR UTAH
FINANCIAL HIGHLIGHTS
For a share outstanding throughout each period
| Class A | ||||||||||||||||||||
| Year Ended June 30, | ||||||||||||||||||||
| 2012 | 2011 | 2010 | 2009 | 2008 | ||||||||||||||||
| Net asset value, beginning of period | $ | 9.74 | $ | 9.80 | $ | 9.35 | $ | 9.73 | $ | 9.91 | ||||||||||
| Income (loss) from investment operations: | ||||||||||||||||||||
Net investment income(1) | 0.38 | 0.42 | 0.43 | 0.44 | 0.41 | |||||||||||||||
| Net gain (loss) on securities (both realized | ||||||||||||||||||||
| and unrealized) | 0.53 | (0.05 | ) | 0.47 | (0.37 | ) | (0.17 | ) | ||||||||||||
| Total from investment operations | 0.91 | 0.37 | 0.90 | 0.07 | 0.24 | |||||||||||||||
| Less distributions (note 10): | ||||||||||||||||||||
| Dividends from net investment income | (0.38 | ) | (0.43 | ) | (0.45 | ) | (0.45 | ) | (0.42 | ) | ||||||||||
| Net asset value, end of period | $ | 10.27 | $ | 9.74 | $ | 9.80 | $ | 9.35 | $ | 9.73 | ||||||||||
| Total return (not reflecting sales charge) | 9.49 | % | 3.87 | % | 9.74 | % | 0.91 | % | 2.45 | % | ||||||||||
| Ratios/supplemental data | ||||||||||||||||||||
| Net assets, end of period (in millions) | $ | 255 | $ | 212 | $ | 232 | $ | 166 | $ | 158 | ||||||||||
| Ratio of expenses to average net assets | 0.83 | % | 0.83 | % | 0.80 | % | 0.75 | % | 0.63 | % | ||||||||||
Ratio of net investment income to average net assets | 3.79 | % | 4.31 | % | 4.43 | % | 4.80 | % | 4.09 | % | ||||||||||
| Portfolio turnover rate | 17 | % | 25 | % | 9 | % | 25 | % | 19 | % | ||||||||||
| The expense and net investment income ratios without the effect of the contractual expense cap were (note 3): | ||||||||||||||||||||
| Ratio of expenses to average net assets | 0.88 | % | 0.87 | % | 0.87 | % | 0.87 | % | 0.90 | % | ||||||||||
Ratio of net investment income to average net assets | 3.74 | % | 4.28 | % | 4.37 | % | 4.68 | % | 3.82 | % | ||||||||||
| The expense ratios after giving effect to the contractual expense cap and expense offset for uninvested cash balances were (note 3): | ||||||||||||||||||||
| Ratio of expenses to average net assets | 0.83 | % | 0.83 | % | 0.80 | % | 0.74 | % | 0.61 | % | ||||||||||
___________________
(1) Per share amounts have been calculated using the daily average shares method.
See accompanying notes to financial statements.
39
TAX-FREE FUND FOR UTAH
FINANCIAL HIGHLIGHTS (continued)
For a share outstanding throughout each period
| Class C | Class Y | |||||||||||||||||||||||||||||||||||||||
| Year Ended June 30, | Year Ended June 30, | |||||||||||||||||||||||||||||||||||||||
| 2012 | 2011 | 2010 | 2009 | 2008 | 2012 | 2011 | 2010 | 2009 | 2008 | |||||||||||||||||||||||||||||||
| Net asset value, beginning of period | $ | 9.74 | $ | 9.79 | $ | 9.34 | $ | 9.72 | $ | 9.91 | $ | 9.77 | $ | 9.83 | $ | 9.38 | $ | 9.76 | $ | 9.94 | ||||||||||||||||||||
| Income (loss) from investment operations: | ||||||||||||||||||||||||||||||||||||||||
Net investment income(1) | 0.30 | 0.34 | 0.35 | 0.37 | 0.33 | 0.40 | 0.44 | 0.45 | 0.46 | 0.43 | ||||||||||||||||||||||||||||||
| Net gain (loss) on securities (both | ||||||||||||||||||||||||||||||||||||||||
| realized and unrealized) | 0.53 | (0.04 | ) | 0.47 | (0.37 | ) | (0.18 | ) | 0.53 | (0.05 | ) | 0.47 | (0.37 | ) | (0.17 | ) | ||||||||||||||||||||||||
| Total from investment operations | 0.83 | 0.30 | 0.82 | – | 0.15 | 0.93 | 0.39 | 0.92 | 0.09 | 0.26 | ||||||||||||||||||||||||||||||
| Less distributions (note 10): | ||||||||||||||||||||||||||||||||||||||||
| Dividends from net investment income | (0.30 | ) | (0.35 | ) | (0.37 | ) | (0.38 | ) | (0.34 | ) | (0.40 | ) | (0.45 | ) | (0.47 | ) | (0.47 | ) | (0.44 | ) | ||||||||||||||||||||
| Net asset value, end of period | $ | 10.27 | $ | 9.74 | $ | 9.79 | $ | 9.34 | $ | 9.72 | $ | 10.30 | $ | 9.77 | $ | 9.83 | $ | 9.38 | $ | 9.76 | ||||||||||||||||||||
| Total return | 8.62 | %(2) | 3.15 | %(2) | 8.87 | %(2) | 0.10 | %(2) | 1.53 | %(2) | 9.69 | % | 4.08 | % | 9.94 | % | 1.13 | % | 2.67 | % | ||||||||||||||||||||
| Ratios/supplemental data | ||||||||||||||||||||||||||||||||||||||||
| Net assets, end of period (in millions) | $ | 96 | $ | 83 | $ | 89 | $ | 50 | $ | 32 | $ | 76 | $ | 56 | $ | 59 | $ | 44 | $ | 49 | ||||||||||||||||||||
| Ratio of expenses to average net assets | 1.63 | % | 1.63 | % | 1.60 | % | 1.55 | % | 1.43 | % | 0.63 | % | 0.63 | % | 0.60 | % | 0.55 | % | 0.43 | % | ||||||||||||||||||||
Ratio of net investment income to average net assets | 2.98 | % | 3.51 | % | 3.60 | % | 3.99 | % | 3.29 | % | 3.98 | % | 4.51 | % | 4.64 | % | 5.00 | % | 4.29 | % | ||||||||||||||||||||
| Portfolio turnover rate | 17 | % | 25 | % | 9 | % | 25 | % | 19 | % | 17 | % | 25 | % | 9 | % | 25 | % | 19 | % | ||||||||||||||||||||
| The expense and net investment income ratios without the effect of the contractual expense cap were (note 3): | ||||||||||||||||||||||||||||||||||||||||
| Ratio of expenses to average net assets | 1.68 | % | 1.67 | % | 1.66 | % | 1.67 | % | 1.70 | % | 0.68 | % | 0.67 | % | 0.67 | % | 0.67 | % | 0.70 | % | ||||||||||||||||||||
Ratio of net investment income to average net assets | 2.93 | % | 3.48 | % | 3.54 | % | 3.88 | % | 3.02 | % | 3.93 | % | 4.47 | % | 4.57 | % | 4.88 | % | 4.02 | % | ||||||||||||||||||||
| The expense ratios after giving effect to the contractual expense cap and expense offset for uninvested cash balances were (note 3): | ||||||||||||||||||||||||||||||||||||||||
| Ratio of expenses to average net assets | 1.63 | % | 1.63 | % | 1.60 | % | 1.54 | % | 1.42 | % | 0.63 | % | 0.63 | % | 0.60 | % | 0.54 | % | 0.42 | % | ||||||||||||||||||||
___________________
(1) Per share amounts have been calculated using the daily average shares method .
(2) Not reflecting CDSC.
See accompanying notes to financial statements.
40
| Additional Information (unaudited) | ||||||||
Trustees(1) and Officers | ||||||||
| Number of | ||||||||
| Positions | Portfolios | |||||||
| Held with | in Fund | |||||||
| Name, | Fund and | Principal | Complex(4) | Other Directorships | ||||
Address(2) | Length of | Occupation(s) | Overseen | Held by Trustee | ||||
| and Year of Birth | Service(3) | During Past 5 Years | by Trustee | During Past 5 Years | ||||
Interested Trustee(5) | ||||||||
Diana P. Herrmann New York, NY (1958) | Trustee since 1997 and President since 1998 | Vice Chair and Chief Executive Officer of Aquila Management Corporation, Founder and Sponsor of the Aquila Group of Funds(6) and parent of Aquila Investment Management LLC, Manager, since 2004, President since 1997, Chief Operating Officer, 1997-2008, a Director since 1984, Secretary since 1986 and previously its Executive Vice President, Senior Vice President or Vice President, 1986-1997; Chief Executive Officer and Vice Chair since 2004, President and Manager since 2003, and Chief Operating Officer (2003-2008), of the Manager; Chair, Vice Chair, President, Executive Vice President and/ or Senior Vice President of funds in the Aquila Group of Funds since 1986; Director of the Distributor since 1997; Governor, Investment Company Institute (the U.S. mutual fund industry trade organization dedicated to protecting shareholder interests and educating the public about investing) for various periods since 2004, and head of its Small Funds Committee, 2004-2009; active in charitable and volunteer organizations. | 11 | ICI Mutual Insurance Company, a Risk Retention Group (2006-2009 and since 2010); Vice Chair and Trustee of Pacific Capital Funds of Cash Assets Trust (three Aquila money-market funds) 2004-2012 | ||||
41
| Number of | ||||||||
| Positions | Portfolios | |||||||
| Held with | in Fund | |||||||
| Name, | Fund and | Principal | Complex(4) | Other Directorships | ||||
Address(2) | Length of | Occupation(s) | Overseen | Held by Trustee | ||||
| and Year of Birth | Service(3) | During Past 5 Years | by Trustee | During Past 5 Years | ||||
| Non-Interested Trustee | ||||||||
Gary C. Cornia Orem, UT (1948) | Chair of the Board of Trustees since 2005 and Trustee since 1993 | Dean, Marriott School of Management, Brigham Young University, since 2008; Director, Romney Institute of Public Management, Marriott School of Management, 2004-2008; Professor, Marriott School of Management, 1980-present; Past President, National Tax Association; Fellow, Lincoln Institute of Land Policy, 2002-present; Associate Dean, Marriott School of Management, Brigham Young University, 1991-2000; member, Utah Governor’s Tax Review Committee, 1993-2009. | 5 | Utah Foundation, Salt Lake City, UT; formerly director, Lincoln Institute of Land Policy, Cambridge, MA | ||||
Tucker Hart Adams Colorado Springs, CO (1938) | Trustee since 2006 | Senior Partner, Summit Economics, since 2010; President, The Adams Group, an economic consulting firm, 1989-2010; formerly Chief Economist, United Banks of Colorado; currently or formerly active with numerous professional and community organizations. | 4 | Trustee, Colorado Health Facilities Authority; advisory board, Griffis/Blessings, Inc. (commercial property development and management); advisory board, Kachi Partners (middle market buyouts); formerly Director, Touch America and Mortgage Analysis Computer Corp. | ||||
Ernest Calderón Phoenix, AZ (1957) | Trustee since 2010 | Founder, Calderón Law Offices, since 2004; Equity Partner, Jennings, Strouss & Salmon, PLC, 1992-2004; member, regent emeritus and president emeritus Arizona Board of Regents; adjunct faculty, Northern Arizona University and Arizona State University; served six Arizona governors by appointment; Past President, Grand Canyon Council of Boy Scouts of America; Past President, State Bar of Arizona, 2003-2004; member, American Law Institute. | 3 | None | ||||
42
| Number of | ||||||||
| Positions | Portfolios | |||||||
| Held with | in Fund | |||||||
| Name, | Fund and | Principal | Complex(4) | Other Directorships | ||||
Address(2) | Length of | Occupation(s) | Overseen | Held by Trustee | ||||
| and Year of Birth | Service(3) | During Past 5 Years | by Trustee | During Past 5 Years | ||||
Thomas A. Christopher Danville, KY (1947) | Trustee since 2006 | Senior partner of Robinson, Hughes & Christopher, C.P.A.s, P.S.C., since 1977; President, A Good Place for Fun, Inc., a sports facility, since 1987; Director, Sunrise Children’s Services Inc. since 2010; Director, Global Outreach International, since 2011; currently or formerly active with various professional and community organizations. | 5 | None | ||||
Grady Gammage, Jr. Phoenix, AZ (1951) | Trustee since 2010 | Founding partner, Gammage & Burnham, PLC, a law firm, Phoenix, Arizona, since 1983; director, Central Arizona Water Conservation District, 1992-2004; director, Arizona State University Foundation since 1998; Senior Fellow, Morrison Institute for Public Policy; active with Urban Land Institute. | 4 | None | ||||
Lyle W. Hillyard Logan, UT (1940) | Trustee since 2003 | President of the law firm of Hillyard, Anderson & Olsen, Logan, Utah, since 1967; member of Utah Senate, 1985 to present, in the following positions: President, 2000, Senate Majority Leader, 1999-2000, Assistant Majority Whip, 1995-1998; served as Chairman of the following Utah Senate Committees: Tax and Revenue, Senate Judiciary Standing, Joint Executive Appropriations, and Senate Rules; currently serves as Co-Chair, Joint Executive Appropriations. | 3 | None | ||||
43
| Number of | ||||||||
| Positions | Portfolios | |||||||
| Held with | in Fund | |||||||
| Name, | Fund and | Principal | Complex(4) | Other Directorships | ||||
Address(2) | Length of | Occupation(s) | Overseen | Held by Trustee | ||||
| and Year of Birth | Service(3) | During Past 5 Years | by Trustee | During Past 5 Years | ||||
| John C. Lucking Phoenix, AZ (1943) | Trustee since 2004 | President, Econ-Linc, an economic consulting firm, since 1995; formerly Consulting Economist, Bank One Arizona and Chief Economist, Valley National Bank; member, Arizona’s Joint Legislative Budget Committee Economic Advisory Panel and the Western Blue Chip Economic Forecast Panel; Board member, Northern Arizona University Foundation since 1997; member, various historical, civic and economic associations. | 3 | John C. Lincoln Health Foundation; formerly Director, Sanu Resources | ||||
| Anne J. Mills Scottsdale, AZ (1938) | Trustee since 1994 | President, Loring Consulting Company since 2001; Vice President for Business Management and CFO, Ottawa University, 1992-2001, 2006-2009; IBM Corporation, 1965-1991; currently active with various charitable, educational and religious organizations. | 5 | None | ||||
44
| Positions | ||||
| Held with | ||||
| Fund and | ||||
Name, Address(2) | Length of | |||
and Year of Birth | Service(3) | Principal Occupation(s) During Past 5 Years | ||
Chairman Emeritus(7) | ||||
Lacy B. Herrmann New York, NY (1929) | Founder and Chairman Emeritus since 2005; Chairman of the Board of Trustees 1992-2005 | Founder and Chairman of the Board, Aquila Management Corporation, the sponsoring organization and parent of the Manager or Administrator and/or Adviser to each fund of the Aquila Group of Funds; Chairman of the Manager or Administrator and/or Adviser to each since 2004; Founder and Chairman Emeritus of each fund in the Aquila Group of Funds; previously Chairman and a Trustee of each fund in the Aquila Group of Funds since its establishment until 2004 or 2005; Director of the Distributor since 1981 and formerly Vice President or Secretary, 1981-1998; Director or trustee, Premier VIT, 1994-2009; Director or trustee of Oppenheimer Quest Value Funds Group, Oppenheimer Small Cap Value Fund, Oppenheimer Midcap Fund, 1987-2009, and Oppenheimer Rochester Group of Funds, 1995-2009; Trustee Emeritus, Brown University and the Hopkins School; active in university, school and charitable organizations. | ||
| Officers | ||||
Charles E. Childs, III New York, NY (1957) | Executive Vice President since 2003 and Secretary since 2011 | Executive Vice President of all funds in the Aquila Group of Funds and the Manager and the Manager’s parent since 2003; Chief Operating Officer of the Manager and the Manager’s parent since 2008; Secretary of all funds in the Aquila Group of Funds since 2011; formerly Senior Vice President, corporate development, Vice President, Assistant Vice President and Associate of the Manager’s parent since 1987; Executive Vice President, Senior Vice President, Vice President or Assistant Vice President of the Aquila money-market funds, 1988-2012. | ||
Marie E. Aro Denver, CO (1955) | Senior Vice President since 2010 | Co-President of the Distributor since 2010, Vice President, 1993-1997; Senior Vice President, Aquila Three Peaks Opportunity Growth Fund since 2004; Senior Vice President, Tax-Free Trust of Arizona since 2010 and Vice President, 2004-2010; Senior Vice President, Aquila Three Peaks High Income Fund since 2006; Senior Vice President, Churchill Tax-Free Fund of Kentucky, Hawaiian Tax-Free Trust, Narragansett Insured Tax-Free Income Fund, Tax-Free Fund For Utah, Tax-Free Fund of Colorado and Tax-Free Trust of Oregon since 2010; Vice President, INVESCO Funds Group, 1998-2003. | ||
Paul G. O’Brien Charlotte, NC (1959) | Senior Vice President since 2010 | Co-President, Aquila Distributors, Inc. since 2010, Managing Director, 2009-2010; Senior Vice President of Aquila Three Peaks High Income Fund, Aquila Three Peaks Opportunity Growth Fund, and each of the Aquila Municipal Bond Funds since 2010; held various positions to Senior Vice President and Chief Administrative Officer of Evergreen Investments Services, Inc., 1997-2008; Mergers and Acquisitions Coordinator for Wachovia Corporation, 1994-1997. |
45
| Positions | ||||
| Held with | ||||
| Fund and | ||||
Name, Address(2) | Length of | |||
and Year of Birth | Service(3) | Principal Occupation(s) During Past 5 Years | ||
Todd W. Curtis Phoenix, AZ (1949) | Vice President and Co-Portfolio Manager since 2009 | Senior Vice President and Portfolio Manager, Tax-Free Trust of Arizona, since August 2004; Vice President and Co-Portfolio Manager, Churchill Tax-Free Fund of Kentucky, since 2009, backup portfolio manager, 2004-2009; Vice President and Co-Portfolio Manager, Tax-Free Fund For Utah, since 2009; Vice President and Portfolio Manager, Banc One Investment Advisors, Inc. and its predecessors, 1981-2004. | ||
James T. Thompson Bountiful, UT (1955) | Vice President and Co-Portfolio Manager since 2009 | Vice President and Co-Portfolio Manager, Tax-Free Fund For Utah, since 2009; Assistant Vice President and Backup Portfolio Manager, Tax-Free Trust of Arizona and Churchill Tax-Free Fund of Kentucky, since 2009; Senior Vice President, First Security Bank/Wells Fargo Brokerage Services LLC, Salt Lake City, Utah 1991-2009. | ||
M. Kayleen Willis Salt Lake City, UT (1963) | Vice President since 2003 | Vice President, Tax-Free Fund For Utah since September 2003, Assistant Vice President, 2002-2003; Vice President, Aquila Three Peaks Opportunity Growth Fund, since 2004. | ||
Amy L. Rydalch Oakley, UT (1970) | Assistant Vice President since 2010 | Assistant Vice President since 2010, independent credit analyst, 2001-2009, for Tax-Free Fund For Utah. | ||
Randall S. Fillmore New York, NY (1960) | Chief Compliance Officer since 2012 | Chief Compliance Officer of each fund in the Aquila Group of Funds, the Manager and the Distributor since 2012; Managing Director, Fillmore & Associates, 2009-2012; Fund and Adviser Chief Compliance Officer (2002-2009), Senior Vice President - Broker Dealer Compliance (2004-2009), Schwab Funds Anti Money Laundering Officer and Identity Theft Prevention Officer (2004-2009), Vice President - Internal Audit (2000-2002), Charles Schwab Corporation; National Director, Information Systems Risk Management - Consulting Services (1999-2000), National Director, Investment Management Audit and Business Advisory Services (1992-1999), Senior Manager, Manager, Senior and Staff Roles (1983-1992), PricewaterhouseCoopers LLP |
46
| Positions | ||||
| Held with | ||||
| Fund and | ||||
Name, Address(2) | Length of | |||
and Year of Birth | Service(3) | Principal Occupation(s) During Past 5 Years | ||
| Joseph P. DiMaggio New York, NY (1956) | Chief Financial Officer since 2003 and Treasurer since 2000 | Chief Financial Officer of each fund in the Aquila Group of Funds since 2003 and Treasurer since 2000. | ||
| Yolonda S. Reynolds New York, NY (1960) | Assistant Treasurer since 2010 | Assistant Treasurer of each fund in the Aquila Group of Funds since 2010; Director of Fund Accounting for the Aquila Group of Funds since 2007; Investment Accountant, TIAA-CREF, 2007; Senior Fund Accountant, JP Morgan Chase, 2003-2006. | ||
| Lori A. Vindigni New York, NY (1966) | Assistant Treasurer since 2000 | Assistant Treasurer of each fund in the Aquila Group of Funds since 2000; Assistant Vice President of the Manager or its predecessor and current parent since 1998; Fund Accountant for the Aquila Group of Funds, 1995-1998. |
____________________
(1) The Fund’s Statement of Additional Information includes additional information about the Trustees and officers and is available, without charge, upon request by calling 800-437-1020 (toll-free) or by visiting www.aquilafunds.com or the EDGAR Database at the SEC’s internet site at www.sec.gov.
(2) The mailing address of each Trustee and officer is c/o Tax-Free Fund For Utah, 380 Madison Avenue, Suite 2300, New York, NY 10017.
(3) Each Trustee holds office until the next annual meeting of shareholders or until his or her successor is elected and qualifies. The term of office of each officer is one year.
(4) Includes certain Aquila-sponsored funds that are dormant and have no public shareholders.
(5) Ms. Herrmann is an interested person of the Fund as an officer of the Fund, as a director, officer and shareholder of the Manager’s corporate parent, as an officer and Manager of the Manager, and as a shareholder and director of the Distributor. Ms. Herrmann is the daughter of Lacy B. Herrmann, the Founder and Chairman Emeritus of the Fund.
(6) The “Aquila Group of Funds” includes: Tax-Free Trust of Arizona, Tax-Free Fund of Colorado, Hawaiian Tax-Free Trust, Churchill Tax-Free Fund of Kentucky, Tax-Free Trust of Oregon, Narragansett Insured Tax-Free Income Fund (Rhode Island) and Tax-Free Fund For Utah, each of which is a tax-free municipal bond fund and are called the “Aquila Municipal Bond Funds”; Aquila Three Peaks Opportunity Growth Fund, which is an equity fund; and Aquila Three Peaks High Income Fund, which is a high-income corporate bond fund.
(7) The Chairman Emeritus may attend Board meetings but has no voting power.
47
Analysis of Expenses (unaudited)
As a shareholder of the Fund, you may incur two types of costs: (1) transaction costs, including front-end sales charges with respect to Class A shares or contingent deferred sales charges (“CDSC”) with respect to Class C shares; and (2) ongoing costs, including management fees; distribution and/or service (12b-1) fees; and other Fund expenses. The table below is intended to help you understand your ongoing costs (in dollars) of investing in the Fund and to compare these costs with the ongoing costs of investing in other mutual funds.
The table below is based on an investment of $1,000 invested on January 1, 2012 and held for the six months ended June 30, 2012.
Actual Expenses
This table provides information about actual account values and actual expenses. You may use the information provided in this table, together with the amount you invested, to estimate the expenses that you paid over the period. To estimate the expenses you paid on your account, divide your ending account value by $1,000 (for example, an $8,600 ending account value divided by $1,000 = 8.6), then multiply the result by the number under the heading entitled “Expenses Paid During the Period”.
| Six months ended June 30, 2012 | ||||
| Actual | ||||
| Total Return | Beginning | Ending | Expenses | |
| Without | Account | Account | Paid During | |
Sales Charges(1) | Value | Value | the Period(2) | |
| Class A | 3.63% | $1,000.00 | $1,036.30 | $4.20 |
| Class C | 3.22% | $1,000.00 | $1,032.20 | $8.24 |
| Class Y | 3.73% | $1,000.00 | $1,037.30 | $3.19 |
| (1) | Assumes reinvestment of all dividends and capital gain distributions, if any, at net asset value and does not reflect the deduction of the applicable sales charges with respect to Class A shares or the applicable CDSC with respect to Class C shares. Total return is not annualized, as it may not be representative of the total return for the year. |
| (2) | Expenses are equal to the annualized expense ratio of 0.83%, 1.63% and 0.63% for the Fund’s Class A, C and Y shares, respectively, multiplied by the average account value over the period, multiplied by 182/366 (to reflect the one-half year period). |
48
Analysis of Expenses (unaudited) (continued) Hypothetical Example for Comparison Purposes
The table below provides information about hypothetical account values and hypothetical expenses based on the actual expense ratio and an assumed rate of return of 5.00% per year before expenses, which is not the Fund’s actual return. The hypothetical account values and expenses may not be used to estimate the actual ending account balance or expenses you paid for the period. You may use the information provided in this table to compare the ongoing costs of investing in the Fund and other mutual funds. To do so, compare this 5.00% hypothetical example relating to the Fund with the 5.00% hypothetical examples that appear in the shareholder reports of other mutual funds.
Please note that the expenses shown in the table below are meant to highlight your ongoing costs only and do not reflect any transactional costs with respect to Class A shares. The example does not reflect the deduction of CDSC with respect to Class C shares. Therefore, the table is useful in comparing ongoing costs only, and will not help you determine the relative total costs of owning different mutual funds. In addition, if these transaction costs were included, your costs would have been higher.
| Six months ended June 30, 2012 | ||||
| Hypothetical | ||||
| Annualized | Beginning | Ending | Expenses | |
| Total | Account | Account | Paid During | |
| Return | Value | Value | the Period(1) | |
| Class A | 5.00% | $1,000.00 | $1,020.74 | $4.17 |
| Class C | 5.00% | $1,000.00 | $1,016.76 | $8.17 |
| Class Y | 5.00% | $1,000.00 | $1,021.73 | $3.17 |
| (1) | Expenses are equal to the annualized expense ratio of 0.83%, 1.63% and 0.63% for the Fund’s Class A, C and Y shares, respectively, multiplied by the average account value over the period, multiplied by 182/366 (to reflect the one-half year period). |
49
Information Available (unaudited)
Much of the information that the funds in the Aquila Group of Funds produce is automatically sent to you and all other shareholders. Specifically, you are routinely sent your Fund’s entire list of portfolio securities twice a year in the semi-annual and annual reports you receive. Additionally, under Fund policies, the Manager publicly discloses the complete schedule of the Fund’s portfolio holdings, as of each calendar quarter, generally by the 15th day after the end of each calendar quarter. Such information remains accessible until the next schedule is made publicly available. You may obtain a copy of the Fund’s portfolio holdings schedule for the most recently completed period by visiting the Fund’s website at www.aquilafunds.com. The Fund may also disclose other portfolio holdings as of a specified date (currently the Fund discloses its five largest holdings by value as of the close of the last business day of each calendar month in a posting to its website on approximately the 5th business day following the month end). This information remains on the website until the next such posting. Whenever you wish to see a listing of your Fund’s portfolio other than in your shareholder reports, please check our website at www.aquilafunds.com or call us at 1-800-437-1020.
The Fund additionally files a complete list of its portfolio holdings with the SEC for the first and third quarters of each fiscal year on Form N-Q. Forms N-Q are available free of charge on the SEC website at www.sec.gov. You may also review or, for a fee, copy the forms at the SEC’s Public Reference Room in Washington, D.C. or by calling 1-800-SEC-0330.
Proxy Voting Record (unaudited)
The Fund does not invest in equity securities. Accordingly, there were no matters relating to a portfolio security considered at any shareholder meeting held during the 12 months ended June 30, 2012 with respect to which the Fund was entitled to vote. Applicable regulations require us to inform you that the foregoing proxy voting information is available on the SEC website at www.sec.gov.
Federal Tax Status of Distributions (unaudited)
This information is presented in order to comply with a requirement of the Internal Revenue Code and no action on the part of shareholders is required.
For the fiscal year ended June 30, 2012, $14,072,731 of dividends paid by Tax-Free Fund For Utah, constituting 99.998% of total dividends paid during fiscal 2012, were exempt-interest dividends, and the balance was ordinary dividend income.
Prior to February 15, 2013, shareholders will be mailed the appropriate tax form(s) which will contain information on the status of distributions paid for the 2012 calendar year.
50
PRIVACY NOTICE (unaudited)
Tax-Free Fund For Utah
Our Privacy Policy. In providing services to you as an individual who owns or is considering investing in shares of the Fund, we collect certain non-public personal information about you. Our policy is to keep this information strictly safeguarded and confidential, and to use or disclose it only as necessary to provide services to you or as otherwise permitted by law. Our privacy policy applies equally to former shareholders and persons who inquire about the Fund.
Information We Collect. ”Non-public personal information” is personally identifiable financial information about you as an individual or your family. The kinds of non-public personal information we have about you may include the information you provide us on your share purchase application or in telephone calls or correspondence with us, and information about your fund transactions and holdings, how you voted your shares and the account where your shares are held.
Information We Disclose. We disclose non-public personal information about you to companies that provide necessary services to us, such as the Fund’s transfer agent, distributor, investment adviser or sub-adviser, if any, as permitted or required by law, or as authorized by you. Any other use is strictly prohibited. We do not sell information about you or any of our fund shareholders to anyone.
Non-California Residents: We also may disclose some of this information to another fund in the Aquila Group of Funds (or its service providers) under joint marketing agreements that permit the funds to use the information only to provide you with information about other funds in the Aquila Group of Funds or new services we are offering that may be of interest to you.
California Residents Only: In addition, unless you “opt-out” of the following disclosures using the form that was mailed to you under separate cover, we may disclose some of this information to another fund in the Aquila Group of Funds (or its service providers) under joint marketing agreements that permit the funds to use the information only to provide you with information about other funds in the Aquila Group of Funds or new services we are offering that may be of interest to you.
How We Safeguard Your Information. We restrict access to non-public personal information about you to only those persons who need it to provide services to you or who are permitted by law to receive it. We maintain physical, electronic and procedural safeguards to protect the confidentiality of all non-public personal information we have about you.
If you have any questions regarding our Privacy Policy, please contact us at 1-800-437-1020.
Aquila Distributors, Inc.
Aquila Investment Management LLC
This Privacy Policy also has been adopted by Aquila Distributors, Inc. and Aquila Investment Management LLC and applies to all non-public information about you that each of these companies may obtain in connection with services provided to the Fund or to you as a shareholder of the Fund.
51
(THIS PAGE INTENTIONALLY LEFT BLANK)
(THIS PAGE INTENTIONALLY LEFT BLANK)
Founders
Lacy B. Herrmann, Chairman Emeritus
Aquila Management Corporation, Sponsor
Manager
AQUILA INVESTMENT MANAGEMENT LLC
380 Madison Avenue, Suite 2300
New York, New York 10017
Board of Trustees
Gary C. Cornia, Chair
Tucker Hart Adams
Ernest Calderón
Thomas A. Christopher
Grady Gammage, Jr.
Diana P. Herrmann
Lyle W. Hillyard
John C. Lucking
Anne J. Mills
Officers
Diana P. Herrmann, President
Charles E. Childs, III, Executive Vice President and Secretary
Marie E. Aro, Senior Vice President
Paul G. O’Brien, Senior Vice President
Todd W. Curtis, Vice President and Co-Portfolio Manager
James T. Thompson, Vice President and Co-Portfolio Manager
M. Kayleen Willis, Vice President
Randall S. Fillmore, Chief Compliance Officer
Joseph P. DiMaggio, Chief Financial Officer and Treasurer
Distributor
AQUILA DISTRIBUTORS, INC.
380 Madison Avenue, Suite 2300
New York, New York 10017
Transfer and Shareholder Servicing Agent
BNY MELLON
4400 Computer Drive
Westborough, Massachusetts 01581
Custodian
JPMORGAN CHASE BANK, N.A.
1111 Polaris Parkway
Columbus, Ohio 43240
Independent Registered Public Accounting Firm
TAIT, WELLER & BAKER LLP
1818 Market Street, Suite 2400
Philadelphia, Pennsylvania 19103
Further information is contained in the Prospectus,
which must precede or accompany this report.
| ITEM 2. | CODE OF ETHICS. |
(a) As of June 30, 2012 (the end of the reporting period) the Trust has adopted a code of ethics that applies to the Trust's principal executive officer(s)and principal financial officer(s) and persons performing similar functions ("Covered Officers") as defined in the Aquila Group of Funds Code of Ethics for Principal Executive and Senior Financial Officers under Section 406 of the Sarbanes-Oxley Act of 2002;
(f)(1) Pursuant to Item 10(a)(1), a copy of the Trust's Code of Ethics that applies to the Trust's principal executive officer(s) and principal financial officer(s) and persons performing similar functions is included as an exhibit to its annual report on this Form N-CSR;
(f)(2) The text of the Trust's Code of Ethics that applies to the Trust's principal executive officer(s) and principal financial officer(s) and persons performing similar functions has been posted on its Internet website which can be found at the Trust's Internet address at aquilafunds.com.
| ITEM 3. | AUDIT COMMITTEE FINANCIAL EXPERT. |
(a)(1)(i) The Registrant's board of trustees has determined that Ms. Anne J. Mills, a member of its audit committee, is an audit committee financial expert. Ms. Mills is 'independent' as such term is defined in Form N-CSR.
| ITEM 4. | PRINCIPAL ACCOUNTANT FEES AND SERVICES. |
a) Audit Fees - The aggregate fees billed for professional services rendered by the principal accountant for the audit of the Registrant's annual financial statements were $19,600 in 2011 and $21,100.
b) Audit Related Fees - There were no amounts billed for audit-related fees over the past two years.
c) Tax Fees - The Registrant was billed by the principal accountant $3,400 and $3,400 in 2011 and 2012, respectively, for return preparation and tax compliance.
d) All Other Fees - There were no additional fees paid for audit and non-audit services other than those disclosed in a) thorough c) above.
e)(1) Currently, the audit committee of the Registrant pre-approves audit services and fees on an engagement-by-engagement basis.
e)(2) None of the services described in b) through d) above were approved by the audit committee pursuant to paragraph (c)(7)(i)(C) of Rule 2-01 of Regulation S-X, all were pre-approved on an engagement-by-engagement basis.
f) No applicable.
g) There were no non-audit services fees billed by the Registrant's accountant to the Registrant's investment adviser or distributor over the past two years
h) Not applicable.
| ITEM 5. | AUDIT COMMITTEE OF LISTED REGISTRANTS. |
Not applicable.
| ITEM 6. | SCHEDULE OF INVESTMENTS. |
Included in Item 1 above
| ITEM 7. | DISCLOSURE OF PROXY VOTING POLICIES AND PROCEDURES FORCLOSED-END MANAGEMENT INVESTMENT COMPANIES. |
Not applicable.
| ITEM 8. | PORTFOLIO MANAGERS OF CLOSED-END MANAGEMENT INVESTMENT COMPANIES. |
Not applicable.
| ITEM 9. | PURCHASES OF EQUITY SECURITIES BY CLOSED-END MANAGEMENT INVESTMENTCOMPANY AND AFFILIATED PURCHASERS. |
Not applicable.
| ITEM 10. | SUBMISSION OF MATTERS TO A VOTE OF SECURITY HOLDERS. |
The Board of Directors of the Registrant has adopted a Nominating Committee Charter which provides that the Nominating Committee (the 'Committee') may consider and evaluate nominee candidates properly submitted by shareholders if a vacancy among the Independent Trustees of the Registrant occurs and if, based on the Board's then current size, composition and structure, the Committee determines that the vacancy should be filled. The Committee will consider candidates submitted by shareholders on the same basis as it considers and evaluates candidates recommended by other sources. A copy of the qualifications and procedures that must be met or followed by shareholders to properly submit a nominee candidate to the Committee may be obtained by submitting a request in writing to the Secretary of the Registrant.
| ITEM 11. | CONTROLS AND PROCEDURES. |
(a) Based on their evaluation of the registrant's disclosure controls and procedures (as defined in Rule 30a-2(c) under the Investment Company Act of 1940) as of a date within 90 days of the filing of this report, the registrant's chief financial and executive officers have concluded that the disclosure controls and procedures of the registrant are appropriately designed to ensure that information required to be disclosed in the registrant's reports that are filed under the Securities Exchange Act of 1934 are accumulated and communicated to registrant's management, including its principal executive officer(s) and principal financial officer(s), to allow timely decisions regarding required disclosure and is recorded, processed, summarized and reported, within the time periods specified in the rules and forms adopted by the Securities and Exchange Commission.
(b) There have been no significant changes in registrant's internal controls or in other factors that could significantly affect registrant's internal controls subsequent to the date of the most recent evaluation, including no significant deficiencies or material weaknesses that required corrective action.
| ITEM 12. | EXHIBITS. |
(a)(1) Aquila Group of Funds Code of Ethics for Principal Executive and Senior Financial Officers under Section 406 of the Sarbanes-Oxley Act of 2002, as amended.
(a)(2) Certifications of principal executive officer and principal financial officer as required by Rule 30a-2(a) under the Investment Company Act of 1940.
(b) Certifications of principal executive officer and principal financial officer as required by Rule 30a-2(b) under the Investment Company Act of 1940.
SIGNATURES
Pursuant to the requirements of the Securities Exchange Act of 1934 and the Investment Company Act of 1940, the registrant has duly caused this report to be signed on its behalf by the undersigned thereunto duly authorized.
| By: | /s/ Diana P. Herrmann | |
President and Trustee September 6, 2012 | ||
| By: | /s/ Joseph P. DiMaggio | |
Chief Financial Officer and Treasurer September 6, 2012 |
Pursuant to the requirements of the Securities Exchange Act of 1934 And the Investment Company Act of 1940, this report has been signed below by the following persons on behalf of the registrant and in the capacities and on the dates indicated.
| By: | /s/ Diana P. Herrmann | |
Diana P. Herrmann President and Trustee September 6, 2012 | ||
| By: | /s/ Joseph P. DiMaggio | |
Joseph P. DiMaggio Chief Financial Officer and Treasurer September 6, 2012 |
TAX-FREE FUND FOR UTAH
EXHIBIT INDEX
(a)(1) Aquila Group of Funds Code of Ethics for Principal Executive and Senior Financial Officers under Section 406 of the Sarbanes-Oxley Act of 2002, as amended.
(a) (2) Certifications of principal executive officer and principal financial officer as required by Rule 30a-2(a) under the Investment Company Act of 1940.
(b) Certification of chief executive officer and chief financial officer as required by Rule 30a-2(b) of the Investment Company Act of 1940.