UNITED STATES
SECURITIES AND EXCHANGE COMMISSION
Washington, D.C. 20549
FORM N-CSR
CERTIFIED SHAREHOLDER REPORT OF REGISTERED
MANAGEMENT INVESTMENT COMPANIES
Investment Company Act file number 811-06279
Harris Associates Investment Trust
(Exact name of Registrant as specified in charter)
111 South Wacker Drive, Suite 4600
Chicago, Illinois 60606-4319
(Address of principal executive offices) (Zip code)
| | Joseph J. Allessie, Esq. Harris Associates L.P. 111 South Wacker Drive, Suite 4600 Chicago, Illinois 60606-4319 | | Ndenisarya M. Meekins, Esq. K&L Gates LLP 1601 K Street, N.W. Washington, D.C. 20006-1600 |
| (Name and address of agents for service) |
Registrant's telephone number, including area code: (312) 646-3600
Date of fiscal year end: 09/30/24
Date of reporting period: March 31, 2024
Item 1. Reports to Shareholders.
| (a) | Following is a copy of the semi-annual report transmitted to shareholders pursuant to Rule 30e-1 under the Act. |
OAKMARK FUNDS
SEMI-ANNUAL REPORT | MARCH 31, 2024
OAKMARK FUND
OAKMARK SELECT FUND
OAKMARK GLOBAL FUND
OAKMARK GLOBAL SELECT FUND
OAKMARK INTERNATIONAL FUND
OAKMARK INTERNATIONAL SMALL CAP FUND
OAKMARK EQUITY AND INCOME FUND
OAKMARK BOND FUND

Oakmark Funds
2024 Semi-Annual Report
Fund Expenses | | | 1 | | |
U.S. Equity Market Commentary | | | 2 | | |
Oakmark Fund | |
Summary Information | | | 4 | | |
Portfolio Manager Commentary | | | 5 | | |
Schedule of Investments | | | 6 | | |
Oakmark Select Fund | |
Summary Information | | | 8 | | |
Portfolio Manager Commentary | | | 9 | | |
Schedule of Investments | | | 10 | | |
Oakmark Global Fund | |
Summary Information | | | 12 | | |
Portfolio Manager Commentary | | | 13 | | |
Schedule of Investments | | | 14 | | |
Oakmark Global Select Fund | |
Summary Information | | | 16 | | |
Portfolio Manager Commentary | | | 17 | | |
Schedule of Investments | | | 19 | | |
International Equity Market Commentary | | | 20 | | |
Oakmark International Fund | |
Summary Information | | | 22 | | |
Portfolio Manager Commentary | | | 23 | | |
Schedule of Investments | | | 24 | | |
Oakmark International Small Cap Fund | |
Summary Information | | | 26 | | |
Portfolio Manager Commentary | | | 27 | | |
Schedule of Investments | | | 28 | | |
Fixed Income Market Commentary | | | 30 | | |
Oakmark Equity and Income Fund | |
Summary Information | | | 36 | | |
Portfolio Manager Commentary | | | 37 | | |
Schedule of Investments | | | 39 | | |
Oakmark Bond Fund | |
Summary Information | | | 48 | | |
Portfolio Manager Commentary | | | 49 | | |
Schedule of Investments | | | 51 | | |
Financial Statements | |
Statements of Assets and Liabilities | | | 55 | | |
Statements of Operations | | | 58 | | |
Statements of Changes in Net Assets | | | 61 | | |
Notes to Financial Statements | | | 77 | | |
Financial Highlights | | | 87 | | |
Disclosure Regarding Investment Advisory
Agreements Approval | | | 95 | | |
Disclosures and Endnotes | | | 99 | | |
Trustees and Officers | | | 105 | | |
As permitted by regulations adopted by the U.S. Securities and Exchange Commission, paper copies of the Oakmark Funds' annual and semi-annual shareholder reports will no longer be sent by mail, unless you specifically request paper copies of the re-ports. Instead, the reports will be made available on Oakmark.com, and you will be notified by mail each time a re-port is posted and provided with a website link to access the re-port. If you already elected to receive shareholder reports electronically, you will not be affected by this change and you need not take any action. You may elect to receive shareholder reports and other communications from the Funds electronically anytime by contacting your financial intermediary (such as a broker-dealer or bank) or, if you hold your shares directly | |
with the Funds, by calling 1-800-OAKMARK (625-6275) or visiting Oakmark.com. | |
You may elect to receive all future reports in paper free of charge. If you invest through a financial intermediary, you can contact your financial intermediary to request that you continue to receive paper copies of your shareholder reports. If you hold your shares directly with the Funds, you can call 1-800-OAKMARK (625-6275) to let the Funds know you wish to continue receiving paper copies of your shareholder reports. Your election to receive reports in paper will apply to all Funds you hold directly or all Funds you hold through your financial intermediary, as applicable. | |
FORWARD-LOOKING STATEMENT DISCLOSURE
One of our most important responsibilities as mutual fund managers is to communicate with shareholders in an open and direct manner. Some of our comments in our letters to shareholders are based on current management expectations and are considered "forward-looking statements." Actual future results, however, may prove to be different from our expectations. You can identify forward-looking statements by words such as "estimate," "may," "will," "expect," "believe,"
"plan" and other similar terms. We cannot promise future returns. Our opinions are a reflection of our best judgment at the time this report is compiled, and we disclaim any obligation to update or alter forward-looking statements as a result of new information, future events or otherwise.
Oakmark.com
U.S. Equity Market Commentary March 31, 2024

William C. Nygren, CFA
Portfolio Manager
oakmx@oakmark.com
oaklx@oakmark.com
oakwx@oakmark.com
At Oakmark, we are long-term investors. We attempt to identify growing businesses that are managed to benefit their shareholders. We will purchase stock in those businesses only when priced substantially below our estimate of intrinsic value. After purchase, we patiently wait for the gap between stock price and intrinsic value to close.
Last quarter, the S&P 500 Index1 hit a new high every month as did each of our U.S. Funds. In March, I wrote a piece for our website discussing why new highs are important to us. On one of the recent new high days, I heard a portfolio manager on TV urging caution because it is "dangerous" to invest after new highs.
In the past 50 years, selling after the S&P 500 reached a new high would have allowed an investor to avoid four very painful declines: 44% after the dot-com bubble popped in 2000, 38% entering the great financial crisis in 2007, 19% in the 2020 Covid-19 shutdown, and 25% in 2022 when inflation and interest rates sharply increased. As with many market-timing schemes, the positive result from those correct calls has made selling after a new high a popular strategy.
But if we look back at the past 50 years (600 months), the S&P 500 achieved a new high in 156 of those months—or 26% of the time. It's much more common than people think. Despite those four very timely sell signals, selling all the new highs would have given many more sell signals that destroyed value. An investor who sold every new high and waited for a lower re-entry price would have missed the opportunity to make more than 200 times their money by just buying and holding the S&P 500 for 50 years.
As you know, we aren't market timers at Oakmark because we don't believe we can be right often enough to overcome the strong tailwind of rising equity values. Our approach to new highs is to do what we always do: make sure we sell those stocks that have achieved our price targets and reinvest in stocks that are selling well below our estimates of value. Today's market is giving us ample opportunity to find stocks we believe are inexpensive, despite the elevated P/E2 ratio of the S&P 500. For example, since the beginning of 2023, the stocks we added to the Oakmark Fund had a median P/E of 12 times 2024 estimates, just over half the S&P 500 multiple. We believe that by staying invested while always shifting the portfolio to the stocks that appear least expensive, we will achieve results far superior to moving in and out of cash.
Motley Fool Interview
Last quarter I was interviewed by John Rotonti for The Motley Fool. Below is an excerpt from that interview and you can find the full interview here. John also hosts a new podcast, "The JRo Show." Here are links to two episodes about Oakmark: one is an interview with me and the other is with Mike Nicolas and Alex Fitch.
John Rotonti: In a recent Morningstar podcast chief investment officer for T. Rowe Price Investment Management David Giroux said, "GARP4 investing over long periods of time generates the highest returns in the market—beats value, beats growth, and has better risk-adjusted returns than those two as
well..." My take is that he's really describing value investing (buying an above-average business at an average multiple with the thesis that the multiple should be higher)? What are your thoughts?
Bill Nygren: Buying great businesses at average prices is as much value investing as buying average businesses at great prices. The idea that every business trading at a low P/E2, P/B3, P/anything ratio is a "value stock" is just plain stupid. Some businesses are truly inferior and deserve to sell at low multiples. GARP4 is a segment of value investing. Munger says always invert. What would GAUP (Growth at Unreasonable Price) be? It would be a price-insensitive style of investing, much like momentum investing. It would be the opposite of value.
John Rotonti: If I remember correctly, you previously owned Amazon in the [Oakmark] Fund and sold it for a roughly 100% return. Was selling it a mistake? If you take into account where you redeployed the funds, taxes, opportunity cost, sticking to your proven framework, and everything else, do you think previously selling Amazon stock was a mistake?
Bill Nygren: We bought Amazon in 2014 and no doubt we would have made more had we kept it than reinvested the sales proceeds. Looking only at results, I guess you would conclude it was a mistake. But it's one I'd make again in the same circumstance. We bought Amazon back then because it was selling at what we believed was an unjustified discount to other retailers using a price-to-sales metric. After about a year, Amazon had risen to roughly what we thought the retail business was worth. Amazon Web Services (AWS) was brand new, and analyst reports were starting to attribute large potential valuations to it. We thought it was way too early to conclude that AWS would become one of two winners in the cloud business. Because the stock price fully reflected the values that we thought we understood, our process required us to sell it. That same process has kept us out of trouble in countless other situations. Because of that, I don't look back on selling Amazon as a mistake. (And as you know, now that the AWS value seems better defined, we again own Amazon on the theory that it sells at a discount to the sum of the retail and AWS businesses.)5
John Rotonti: Do you look for ten-baggers or even multi-baggers of larger size than 10x? Specifically, do you ever ask your analyst if they think the stock can 10x in a reasonable amount of time? Why or why not?
Bill Nygren: We don't set out looking for them, but have ended up owning some anyway (Visa, Mastercard, Apple, TE Connectivity, Capital One Financial). When we bought those stocks we thought we were buying fifty cents on the dollar, but the magnitude and duration of growth positively surprised us. I think a mistake young analysts often make is being too anxious to claim a win and recommend selling a successful stock too
See accompanying Disclosures and Endnotes on page 99.
2 OAKMARK FUNDS
U.S. Equity Market Commentary (continued) March 31, 2024
early. With experience, analysts learn to reassess their sell targets both up and down based on new fundamental information. Many times, when stocks are first recommended, the analysts present models that they think are conservative. We try to avoid conservatism in favor of better being able to rank order our Approved List based on attractiveness.
John Rotonti: Why is paying a low P/E multiple so important to compounded returns?
Bill Nygren: I'd like to slightly shift the question to, "Why is it so important to pay a low price relative to business value?" While that always translates to a low multiple on some metric, it doesn't have to mean a low P/E multiple. Efficient market theorists will say that regardless of the price you pay, you can get a fair return relative to the risk you incur. However, if you believe as we do, that most of the time a stock will trade reasonably close to intrinsic business value, then buying at a discount to business value beats a mostly efficient market. By purchasing at a discount to value, risk is reduced because the expected terminal price is a higher percentage of business value. Further, reward is amplified for the same reason, the terminal value is a higher percentage of business value. The efficient market hypothesis would say that an investor's holding period return should roughly match the change in business value during that time. To that, we add the increase in price due to the gap closing between initial price and initial value. Note that paying more than business value has exactly the opposite effect.
John Rotonti: What makes the investing process at Harris/Oakmark repeatable? Why will the proven process endure once you, Clyde McGregor, David Herro, and Tony Coniaris decide to retire?
Bill Nygren: First, let me make clear that we are not the first generation of leaders at Harris|Oakmark. The firm had a successful investing record before any of us joined, and I expect that will continue long after we are gone. Second, it is important to understand that there is a long list of current employees who contribute to our success today. Most of our investment decisions are made by people other than the four you mentioned.
I think most firms struggle with generational transitions because they typically have a dominant leader who fully controls decision making until they retire. That means that the retiring leader is replaced by someone who is new to being responsible for decision making, which of course, is a big risk. At Harris|Oakmark, our structure is much more horizontal, with democratic decision making on most products. So, when we retire, we are replaced by investors who for years have been responsible for important decisions. Further, we only hire investment teammates who believe in value investing, meaning we won't be facing a change in investment philosophy as today's leaders retire.
John Rotonti: What is your definition of a value trap? What types of stocks do you think are the most likely to end up being value traps? Do you think that companies with low or declining terminal values are susceptible to being value traps? And what actions do you take to actively try to avoid investing in potential value traps?
Bill Nygren: We define value traps as companies where value does not increase with time. The term would primarily be applied to structurally disadvantaged companies that currently trade at low multiples. To avoid them, we require analysts to
project business value seven years into the future. If the combination of expected annual value growth and dividend yield doesn't at least match the market, we won't buy them.
Of course, sometimes we expect value to grow as time passes, but we turn out to be wrong. We try to sell those mistakes as rapidly as we can. We track an analyst's estimated business value from the time the stock goes on our Approved List, and if actual growth meaningfully lags projected growth, the stock is given extra attention, including extra reviews, devil's advocate reviews and maybe even changing the analyst who covers the stock. The goal is to make the path of least resistance selling the stock rather than holding it.
John Rotonti: ...What sorts of conversation are you and your team having around the performance of the U.S. stock market in 2023 and around market valuations?
Bill Nygren: First, I think it highlights how hard market timing is. Most market timers a year ago were talking about what a tough year 2023 would be for equities. Our discussion has mostly been about the growth/value performance chasm. At the end of 2021, we agreed with most value investors that low P/E stocks had become unusually undervalued because of the decade-long bull market in growth. While 2022 was a relatively good year for value, dodging much of the S&P's decline, that entirely reversed in 2023. We look back on the two-year period and are surprised that growth has slightly outperformed despite the increase in interest rates. Because high P/E stocks have their cash generation further into the future than low P/E stocks do, they generally perform worse when interest rates rise. Given the attractive starting point for low P/E stocks at the beginning of 2022, and the subsequent underperformance, we again think low P/E stocks are unusually attractive today.
John Rotonti: Thoughts on the Magnificent 76?
Bill Nygren: We own a lot of Alphabet, so I can't say we think they are all grossly overvalued. I don't have much to add to a topic that dominated financial news in 2023, but one point I think is generally missed is that the group's strong performance has really increased the technology industry concentration in the S&P 500, and to an even greater degree, the Russell Growth7 and NASDAQ8. Many investors who have been taught to think of index investing as low risk may be unaware of how risky those investments have become.
John Rotonti: Have you ever considered launching a family office after you retire from day-to-day at Harris|Oakmark and shift more into a mentorship role at the firm?
Bill Nygren: No, I haven't considered that. I expect to stay with Harris|Oakmark for an extended period, eventually transferring my current responsibilities to the younger generation, but maintaining a role as an external spokesperson and internal mentor. I've been very happy having my assets invested in Harris|Oakmark and expect that to continue when I eventually retire.
See accompanying Disclosures and Endnotes on page 99.
Oakmark.com 3
A shareholder of each Fund incurs ongoing costs, including investment advisory fees, transfer agent fees and other Fund expenses. The examples below are intended to help shareholders understand the ongoing costs (in dollars) of investing in each Fund and to compare these costs with the ongoing costs of investing in other funds.
The following table provides information about actual account values and actual Fund expenses as well as hypothetical account values and hypothetical fund expenses for shares of each Fund.
ACTUAL EXPENSES
The following table shows the expenses a shareholder would have paid on a $1,000 investment in each Fund from October 1, 2023 to March 31, 2024, as well as how much a $1,000 investment would be worth at the close of the period, assuming actual Fund returns and expenses. A shareholder can estimate expenses incurred for the period by dividing the account value at March 31, 2024, by $1,000 and multiplying the result by the number in the "Actual—Expenses Paid During Period" column shown below.
HYPOTHETICAL EXAMPLE FOR COMPARISON PURPOSES
The following table provides information about hypothetical account values and hypothetical expenses for shares of each Fund based on actual expense ratios and an assumed rate of return of 5% per year before expenses, which are not the Funds' actual returns. The hypothetical account values and expenses may not be used to estimate the actual ending account balances or actual expenses shareholders paid for the period. Shareholders may use this information to compare the ongoing costs of investing in a Fund and other funds. To do so, compare this 5% hypothetical example with the 5% hypothetical examples that appear in the shareholder reports of the other funds.
Please note that the expenses shown in the table are meant to highlight your ongoing costs only and do not reflect any transaction costs, such as redemption fees. Therefore, the "Hypothetical—Expenses Paid During Period" column of the table is useful in comparing ongoing costs only and will not help you determine the relative total costs of owning different funds. If these transaction costs were included, the total costs would have been higher.
| | | | | ACTUAL | | HYPOTHETICAL
(5% annual return
before expenses) | | | |
| | Beginning
Account Value
(10/01/23) | | Ending
Account Value
(03/31/24) | | Expenses
Paid During
Period* | | Ending
Account Value
(03/31/24) | | Expenses
Paid During
Period* | | Annualized
Expense
Ratio | |
Oakmark Fund | |
Investor Class | | $ | 1,000.00 | | | $ | 1,245.30 | | | $ | 5.00 | | | $ | 1,020.55 | | | $ | 4.50 | | | | 0.89 | % | |
Advisor Class | | $ | 1,000.00 | | | $ | 1,246.40 | | | $ | 3.93 | | | $ | 1,021.50 | | | $ | 3.54 | | | | 0.70 | % | |
Institutional Class | | $ | 1,000.00 | | | $ | 1,246.60 | | | $ | 3.76 | | | $ | 1,021.65 | | | $ | 3.39 | | | | 0.67 | % | |
R6 Class | | $ | 1,000.00 | | | $ | 1,246.90 | | | $ | 3.48 | | | $ | 1,021.90 | | | $ | 3.13 | | | | 0.62 | % | |
Oakmark Select Fund | |
Investor Class | | $ | 1,000.00 | | | $ | 1,217.40 | | | $ | 5.49 | | | $ | 1,020.05 | | | $ | 5.00 | | | | 0.99 | % | |
Advisor Class | | $ | 1,000.00 | | | $ | 1,218.10 | | | $ | 4.82 | | | $ | 1,020.65 | | | $ | 4.39 | | | | 0.87 | % | |
Institutional Class | | $ | 1,000.00 | | | $ | 1,218.60 | | | $ | 4.27 | | | $ | 1,021.15 | | | $ | 3.89 | | | | 0.77 | % | |
R6 Class | | $ | 1,000.00 | | | $ | 1,219.10 | | | $ | 4.05 | | | $ | 1,021.35 | | | $ | 3.69 | | | | 0.73 | % | |
Oakmark Global Fund | |
Investor Class | | $ | 1,000.00 | | | $ | 1,122.40 | | | $ | 6.05 | | | $ | 1,019.30 | | | $ | 5.76 | | | | 1.14 | % | |
Advisor Class | | $ | 1,000.00 | | | $ | 1,123.60 | | | $ | 4.99 | | | $ | 1,020.30 | | | $ | 4.75 | | | | 0.94 | % | |
Institutional Class | | $ | 1,000.00 | | | $ | 1,123.70 | | | $ | 4.78 | | | $ | 1,020.50 | | | $ | 4.55 | | | | 0.90 | % | |
R6 Class | | $ | 1,000.00 | | | $ | 1,124.10 | | | $ | 4.62 | | | $ | 1,020.65 | | | $ | 4.39 | | | | 0.87 | % | |
Oakmark Global Select Fund | |
Investor Class | | $ | 1,000.00 | | | $ | 1,117.00 | | | $ | 6.03 | | | $ | 1,019.30 | | | $ | 5.76 | | | | 1.14 | % | |
Advisor Class | | $ | 1,000.00 | | | $ | 1,118.00 | | | $ | 5.14 | | | $ | 1,020.15 | | | $ | 4.90 | | | | 0.97 | % | |
Institutional Class | | $ | 1,000.00 | | | $ | 1,118.70 | | | $ | 4.82 | | | $ | 1,020.45 | | | $ | 4.60 | | | | 0.91 | % | |
R6 Class | | $ | 1,000.00 | | | $ | 1,118.70 | | | $ | 4.50 | | | $ | 1,020.75 | | | $ | 4.29 | | | | 0.85 | % | |
Oakmark International Fund | |
Investor Class | | $ | 1,000.00 | | | $ | 1,088.20 | | | $ | 5.48 | | | $ | 1,019.75 | | | $ | 5.30 | | | | 1.05 | % | |
Advisor Class | | $ | 1,000.00 | | | $ | 1,089.10 | | | $ | 4.60 | | | $ | 1,020.60 | | | $ | 4.45 | | | | 0.88 | % | |
Institutional Class | | $ | 1,000.00 | | | $ | 1,089.50 | | | $ | 4.18 | | | $ | 1,021.00 | | | $ | 4.04 | | | | 0.80 | % | |
R6 Class | | $ | 1,000.00 | | | $ | 1,089.60 | | | $ | 3.92 | | | $ | 1,021.25 | | | $ | 3.79 | | | | 0.75 | % | |
Oakmark International Small Cap Fund | |
Investor Class | | $ | 1,000.00 | | | $ | 1,120.40 | | | $ | 7.10 | | | $ | 1,018.30 | | | $ | 6.76 | | | | 1.34 | % | |
Advisor Class | | $ | 1,000.00 | | | $ | 1,121.10 | | | $ | 6.26 | | | $ | 1,019.10 | | | $ | 5.96 | | | | 1.18 | % | |
Institutional Class | | $ | 1,000.00 | | | $ | 1,121.80 | | | $ | 5.78 | | | $ | 1,019.55 | | | $ | 5.50 | | | | 1.09 | % | |
R6 Class | | $ | 1,000.00 | | | $ | 1,122.10 | | | $ | 5.68 | | | $ | 1,019.65 | | | $ | 5.40 | | | | 1.07 | % | |
Oakmark Equity and Income Fund | |
Investor Class | | $ | 1,000.00 | | | $ | 1,153.50 | | | $ | 4.63 | | | $ | 1,020.70 | | | $ | 4.34 | | | | 0.86 | % | |
Advisor Class | | $ | 1,000.00 | | | $ | 1,155.20 | | | $ | 3.34 | | | $ | 1,021.90 | | | $ | 3.13 | | | | 0.62 | % | |
Institutional Class | | $ | 1,000.00 | | | $ | 1,154.80 | | | $ | 3.18 | | | $ | 1,022.05 | | | $ | 2.98 | | | | 0.59 | % | |
R6 Class | | $ | 1,000.00 | | | $ | 1,154.90 | | | $ | 3.02 | | | $ | 1,022.20 | | | $ | 2.83 | | | | 0.56 | % | |
Oakmark Bond Fund | |
Investor Class | | $ | 1,000.00 | | | $ | 1,074.50 | | | $ | 3.84 | | | $ | 1,021.30 | | | $ | 3.74 | | | | 0.74 | % | |
Advisor Class | | $ | 1,000.00 | | | $ | 1,074.00 | | | $ | 2.80 | | | $ | 1,022.30 | | | $ | 2.73 | | | | 0.54 | % | |
Institutional Class | | $ | 1,000.00 | | | $ | 1,075.50 | | | $ | 2.70 | | | $ | 1,022.40 | | | $ | 2.63 | | | | 0.52 | % | |
R6 Class | | $ | 1,000.00 | | | $ | 1,076.10 | | | $ | 2.28 | | | $ | 1,022.80 | | | $ | 2.23 | | | | 0.44 | % | |
* The Annualized Expense Ratio is calculated using each class' actual net expenses incurred during the preceding six-month period divided by the average net assets of that class during the period.
Oakmark.com 1
Oakmark Fund March 31, 2024
Summary Information
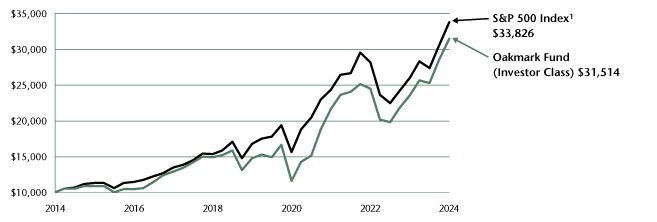
VALUE OF A $10,000 INVESTMENT
(Unaudited)
PERFORMANCE
| | | | | Average Annual Total Returns (as of 03/31/2024) | | | |
(Unaudited) | | Total Return
Last 3 Months | | 1-year | | 3-year | | 5-year | | 10-year | | Since
Inception | | Inception
Date | |
Oakmark Fund (Investor Class) | | | 10.27 | % | | | 33.52 | % | | | 13.26 | % | | | 16.35 | % | | | 12.16 | % | | | 12.96 | % | | 08/05/91 | |
S&P 500 Index | | | 10.56 | % | | | 29.88 | % | | | 11.49 | % | | | 15.05 | % | | | 12.96 | % | | | 10.51 | % | | | |
Dow Jones Industrial Average10 | | | 6.14 | % | | | 22.18 | % | | | 8.65 | % | | | 11.31 | % | | | 11.76 | % | | | 10.81 | % | | | |
Lipper Large Cap Value Fund Index11 | | | 10.11 | % | | | 24.72 | % | | | 9.75 | % | | | 11.94 | % | | | 9.85 | % | | | 9.24 | % | | | |
Oakmark Fund (Advisor Class) | | | 10.33 | % | | | 33.79 | % | | | 13.49 | % | | | 16.55 | % | | | N/A | | | | 14.00 | % | | 11/30/16 | |
Oakmark Fund (Institutional Class) | | | 10.34 | % | | | 33.83 | % | | | 13.51 | % | | | 16.60 | % | | | N/A | | | | 14.05 | % | | 11/30/16 | |
Oakmark Fund (R6 Class) | | | 10.34 | % | | | 33.89 | % | | | 13.56 | % | | | N/A | | | | N/A | | | | 18.02 | % | | 12/15/20 | |
The graph and table above do not reflect the deduction of taxes that a shareholder would pay on Fund distributions or the redemption of Fund shares.
Past performance is no guarantee of future results. The performance data quoted represents past performance. Current performance may be lower or higher than the performance data quoted. Total return includes change in share prices and, in each case, includes reinvestment of dividends and capital gain distributions. The investment return and principal value vary so that an investor's shares, when redeemed, may be worth more or less than the original cost. To obtain the most recent month-end performance, please visit Oakmark.com.
TOP TEN EQUITY HOLDINGS9 | | % of Net Assets | |
Alphabet, Inc., Class A | | | 3.1 | | |
ConocoPhillips | | | 2.7 | | |
General Motors Co. | | | 2.7 | | |
Charles Schwab Corp. | | | 2.7 | | |
Citigroup, Inc. | | | 2.7 | | |
Wells Fargo & Co. | | | 2.7 | | |
IQVIA Holdings, Inc. | | | 2.5 | | |
Deere & Co. | | | 2.5 | | |
Fiserv, Inc. | | | 2.5 | | |
Capital One Financial Corp. | | | 2.5 | | |
FUND STATISTICS | |
Ticker* | | OAKMX | |
Number of Equity Holdings | | 55 | |
Net Assets | | $22.1 billion | |
Weighted Average Market Cap | | $144.9 billion | |
Median Market Cap | | $52.4 billion | |
Net Expense Ratio - Investor Class*^ | | 0.91% | |
* This information is related to the Investor Class. Please visit Oakmark.com for information related to the Advisor, Institutional and R6 Classes.
^ The Expense Ratio is from the Fund's prospectus dated January 28, 2024. The actual Gross and Net Expense Ratios for the period can be found in the Financial Highlights section of this report.
SECTOR ALLOCATION | | % of Net Assets | |
Financials | | | 39.6 | | |
Communication Services | | | 9.9 | | |
Energy | | | 9.0 | | |
Health Care | | | 7.8 | | |
Industrials | | | 6.6 | | |
Consumer Discretionary | | | 5.9 | | |
Consumer Staples | | | 5.2 | | |
Information Technology | | | 3.9 | | |
Materials | | | 3.1 | | |
Real Estate | | | 2.2 | | |
Short-Term Investments and Other | | | 6.8 | | |
See accompanying Disclosures and Endnotes on page 99.
4 OAKMARK FUNDS
Oakmark Fund March 31, 2024
Portfolio Manager Commentary


William C. Nygren, CFA
Portfolio Manager
oakmx@oakmark.com
Michael A. Nicolas, CFA
Portfolio Manager
oakmx@oakmark.com
Robert F. Bierig
Portfolio Manager
oakmx@oakmark.com
The Oakmark Fund ("the Fund") returned 10.27% during the first quarter, fractionally underperforming the S&P 500 Index's return of 10.56%. Since its inception in August 1991, the Fund has returned an average of 12.96% per year, outperforming the S&P 500 Index's return of 10.51% over the same period.
In the first quarter, our largest contributing sectors were financials and consumer discretionary and there were no detractors. The largest individual contributors for the period were General Motors and Kroger, and our largest detractors were Charter Communications and Warner Bros. Discovery. Each of these businesses traded at meaningful discounts to our estimates of intrinsic value, so we purchased additional shares of all of them during the quarter. Amid the outperformance of growth stocks to start the year, we are finding attractive opportunities to buy stocks that meet our value investment criteria.
We initiated three new holdings and eliminated five others during the quarter.
We sold our positions in Amazon, HCA Healthcare, Hilton Worldwide, Meta Platforms and PHINIA during the period. Each position approached our estimate of intrinsic value, so we sold them in favor of more compelling alternatives, in our view.
The following is a brief description of our new holdings:
Deere & Company is a leading manufacturer of agricultural equipment with dominant market share in North America and Brazil. Despite its brand strength, technological capabilities and distribution advantages, the company's stock price has recently fallen due to fears about a downturn in the agriculture business cycle. Longer term, world population and food demand are expected to increase annually yet land and labor devoted to agriculture are expected to decline. Deere seems well-positioned to benefit from this dynamic as farms will have to become more productive. We were pleased to purchase shares in Deere at a low double-digit multiple of our estimate of normal earnings power.
Delta Air Lines is a leading global airline. Of the big three U.S.-based airlines (Delta, United and American), we see Delta as the most competitively advantaged. We believe the company's years of industry-leading operational performance and investments in the customer experience have established Delta as the premium brand in the industry. We also think its geographically optimal hubs, high local market share, robust loyalty program and unique corporate culture all support healthy returns on capital. Delta currently trades at 6x our estimate of normalized earnings per share13. We believe this is an attractive valuation for a competitively advantaged and growing business in an out-of-favor industry.
Kenvue became the largest standalone consumer health company following its split-off from Johnson & Johnson in May 2023. The company's highly recognizable brands, such as
Neutrogena, Listerine, Tylenol and Band-Aid, have been market share leaders in their respective categories for generations. However, Kenvue's first year as a public company was clouded by litigation and market share losses in certain categories. As a result, Kenvue now trades for just 16.5x trailing earnings, a substantial discount to the market and other consumer health and packaged goods companies. We see an opportunity for the company to improve efficiency and re-invest the cost savings into increased product development and marketing, which should help improve its growth and brand equity.
We thank you, our fellow shareholders, for your investment in the Oakmark Fund.
See accompanying Disclosures and Endnotes on page 99.
Oakmark.com 5
Oakmark Fund March 31, 2024 (Unaudited)
Schedule of Investments (in thousands)
| | | Shares | | Value | |
COMMON STOCKS - 93.2% | |
FINANCIALS - 39.6% | |
FINANCIAL SERVICES - 23.8% | |
Charles Schwab Corp. | | | 8,183 | | | $ | 591,958 | | |
Fiserv, Inc. (a) | | | 3,490 | | | | 557,772 | | |
Capital One Financial Corp. | | | 3,659 | | | | 544,789 | | |
Intercontinental Exchange, Inc. | | | 3,875 | | | | 532,569 | | |
Ally Financial, Inc. | | | 11,959 | | | | 485,420 | | |
American Express Co. | | | 1,908 | | | | 434,387 | | |
Bank of New York Mellon Corp. | | | 7,041 | | | | 405,675 | | |
KKR & Co., Inc. | | | 3,930 | | | | 395,279 | | |
State Street Corp. | | | 4,825 | | | | 373,054 | | |
Goldman Sachs Group, Inc. | | | 735 | | | | 307,002 | | |
Global Payments, Inc. | | | 1,750 | | | | 233,905 | | |
BlackRock, Inc. | | | 275 | | | | 229,267 | | |
Moody's Corp. | | | 430 | | | | 168,952 | | |
| | | | | | 5,260,029 | | |
BANKS - 10.4% | |
Citigroup, Inc. | | | 9,319 | | | | 589,346 | | |
Wells Fargo & Co. | | | 10,163 | | | | 589,048 | | |
Bank of America Corp. | | | 12,524 | | | | 474,891 | | |
First Citizens BancShares, Inc., Class A | | | 203 | | | | 331,905 | | |
Truist Financial Corp. | | | 7,860 | | | | 306,383 | | |
| | | | | | 2,291,573 | | |
INSURANCE - 5.4% | |
American International Group, Inc. | | | 6,943 | | | | 542,719 | | |
Willis Towers Watson PLC | | | 1,575 | | | | 433,125 | | |
Reinsurance Group of America, Inc. | | | 1,182 | | | | 227,990 | | |
| | | | | | 1,203,834 | | |
| | | | | | 8,755,436 | | |
COMMUNICATION SERVICES - 9.9% | |
MEDIA & ENTERTAINMENT - 9.9% | |
Alphabet, Inc., Class A (a) | | | 4,544 | | | | 685,796 | | |
Comcast Corp., Class A | | | 11,500 | | | | 498,525 | | |
Charter Communications, Inc., Class A (a) | | | 1,408 | | | | 409,269 | | |
Warner Bros. Discovery, Inc. (a) | | | 31,287 | | | | 273,135 | | |
Walt Disney Co. | | | 1,750 | | | | 214,130 | | |
Liberty Broadband Corp., Class C (a) | | | 2,020 | | | | 115,605 | | |
| | | | | | 2,196,460 | | |
ENERGY - 9.0% | |
ConocoPhillips | | | 4,684 | | | | 596,141 | | |
EOG Resources, Inc. | | | 4,067 | | | | 519,869 | | |
Phillips 66 | | | 2,761 | | | | 450,982 | | |
APA Corp. | | | 12,585 | | | | 432,666 | | |
| | | | | | 1,999,658 | | |
| | | Shares | | Value | |
HEALTH CARE - 7.8% | |
HEALTH CARE EQUIPMENT & SERVICES - 4.5% | |
Centene Corp. (a) | | | 6,445 | | | $ | 505,803 | | |
Baxter International, Inc. | | | 5,990 | | | | 256,013 | | |
CVS Health Corp. | | | 2,744 | | | | 218,861 | | |
| | | | | | 980,677 | | |
PHARMACEUTICALS, BIOTECHNOLOGY & LIFE SCIENCES - 3.3% | |
IQVIA Holdings, Inc. (a) | | | 2,220 | | | | 561,416 | | |
Danaher Corp. | | | 700 | | | | 174,804 | | |
| | | | | | 736,220 | | |
| | | | | | 1,716,897 | | |
INDUSTRIALS - 6.6% | |
CAPITAL GOODS - 5.3% | |
Deere & Co. | | | 1,360 | | | | 558,645 | | |
Masco Corp. | | | 4,224 | | | | 333,221 | | |
Fortune Brands Innovations, Inc. | | | 3,255 | | | | 275,558 | | |
| | | | | | 1,167,424 | | |
TRANSPORTATION - 1.0% | |
Delta Air Lines, Inc. | | | 4,568 | | | | 218,665 | | |
COMMERCIAL & PROFESSIONAL SERVICES - 0.3% | |
Equifax, Inc. | | | 290 | | | | 77,581 | | |
| | | | | | 1,463,670 | | |
CONSUMER DISCRETIONARY - 5.9% | |
AUTOMOBILES & COMPONENTS - 4.9% | |
General Motors Co. | | | 13,062 | | | | 592,361 | | |
Magna International, Inc. | | | 4,950 | | | | 269,676 | | |
BorgWarner, Inc. | | | 6,620 | | | | 229,979 | | |
| | | | | | 1,092,016 | | |
CONSUMER DISCRETIONARY DISTRIBUTION & RETAIL - 1.0% | |
eBay, Inc. | | | 4,253 | | | | 224,463 | | |
| | | | | | 1,316,479 | | |
CONSUMER STAPLES - 5.2% | |
CONSUMER STAPLES DISTRIBUTION & RETAIL - 2.4% | |
Kroger Co. | | | 9,225 | | | | 527,025 | | |
FOOD, BEVERAGE & TOBACCO - 1.7% | |
Altria Group, Inc. | | | 8,510 | | | | 371,206 | | |
HOUSEHOLD & PERSONAL PRODUCTS - 1.1% | |
Kenvue, Inc. | | | 11,600 | | | | 248,936 | | |
| | | | | | 1,147,167 | | |
INFORMATION TECHNOLOGY - 3.9% | |
SOFTWARE & SERVICES - 2.3% | |
Salesforce, Inc. | | | 985 | | | | 296,662 | | |
Oracle Corp. | | | 1,754 | | | | 220,345 | | |
| | | | | | 517,007 | | |
See accompanying Notes to Financial Statements.
6 OAKMARK FUNDS
Oakmark Fund March 31, 2024 (Unaudited)
Schedule of Investments (in thousands) (continued)
| | | Shares | | Value | |
COMMON STOCKS - 93.2% (continued) | |
INFORMATION TECHNOLOGY - 3.9% (continued) | |
TECHNOLOGY HARDWARE & EQUIPMENT - 1.6% | |
TE Connectivity Ltd. | | | 1,214 | | | $ | 176,386 | | |
Cisco Systems, Inc. | | | 3,470 | | | | 173,188 | | |
| | | | | | 349,574 | | |
| | | | | | 866,581 | | |
MATERIALS - 3.1% | |
Corteva, Inc. | | | 7,710 | | | | 444,618 | | |
Celanese Corp. | | | 1,432 | | | | 246,103 | | |
| | | | | | 690,721 | | |
REAL ESTATE - 2.2% | |
REAL ESTATE MANAGEMENT & DEVELOPMENT - 2.2% | |
CBRE Group, Inc., Class A (a) | | | 4,966 | | | | 482,894 | | |
TOTAL COMMON STOCKS - 93.2%
(COST $14,947,318) | | | | | 20,635,963 | | |
| | | Par Value | | Value | |
SHORT-TERM INVESTMENTS - 7.9% | |
REPURCHASE AGREEMENT - 7.5% | |
Fixed Income Clearing Corp. Repurchase
Agreement, 5.32% dated 03/28/24 due
04/01/24, repurchase price $1,656,169,
collateralized by United States Treasury
Notes, 0.125% - 5.000% due
10/15/25 - 12/15/25, aggregate value
plus accrued interest of $1,688,295
(Cost: $1,655,191) | | $ | 1,655,191 | | | | 1,655,191 | | |
U.S. GOVERNMENT BILL - 0.4% | |
U.S. Treasury Bills, 5.37%,
due 06/18/24 (b)
(Cost $98,872) | | | 100,000 | | | | 98,877 | | |
TOTAL SHORT-TERM INVESTMENTS - 7.9%
(COST $1,754,063) | | | | | 1,754,068 | | |
TOTAL INVESTMENTS - 101.1%
(COST $16,701,381) | | | | | 22,390,031 | | |
Liabilities In Excess of Other Assets - (1.1)% | | | | | (252,994 | ) | |
TOTAL NET ASSETS - 100.0% | | | | $ | 22,137,037 | | |
(a) Non-income producing security.
(b) The rate shown represents the annualized yield at the time of purchase; not a coupon rate.
See accompanying Notes to Financial Statements.
Oakmark.com 7
Oakmark Select Fund March 31, 2024
Summary Information
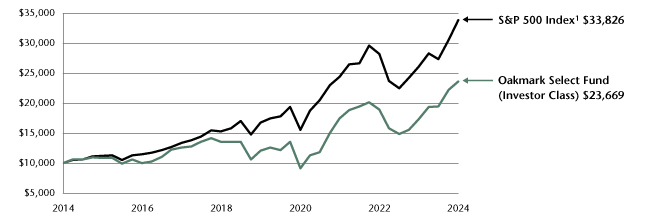
VALUE OF A $10,000 INVESTMENT
(Unaudited)
PERFORMANCE
| | | | | Average Annual Total Returns (as of 03/31/2024) | | | |
| (Unaudited) | | Total Return
Last 3 Months | | 1-year | | 3-year | | 5-year | | 10-year | | Since
Inception | | Inception
Date | |
Oakmark Select Fund (Investor Class) | | | 6.22 | % | | | 36.95 | % | | | 10.66 | % | | | 14.42 | % | | | 9.00 | % | | | 11.93 | % | | 11/01/96 | |
S&P 500 Index | | | 10.56 | % | | | 29.88 | % | | | 11.49 | % | | | 15.05 | % | | | 12.96 | % | | | 9.62 | % | | | |
Lipper Multi-Cap Value Fund Index12 | | | 9.04 | % | | | 23.06 | % | | | 8.85 | % | | | 10.97 | % | | | 8.40 | % | | | 7.99 | % | | | |
Oakmark Select Fund (Advisor Class) | | | 6.25 | % | | | 37.11 | % | | | 10.80 | % | | | 14.56 | % | | | N/A | | | | 9.95 | % | | 11/30/16 | |
Oakmark Select Fund (Institutional Class) | | | 6.29 | % | | | 37.24 | % | | | 10.90 | % | | | 14.65 | % | | | N/A | | | | 10.02 | % | | 11/30/16 | |
Oakmark Select Fund (R6 Class) | | | 6.29 | % | | | 37.29 | % | | | 10.94 | % | | | N/A | | | | N/A | | | | 15.33 | % | | 12/15/20 | |
The graph and table do not reflect the deduction of taxes that a shareholder would pay on Fund distributions or the redemption of Fund shares.
Past performance is no guarantee of future results. The performance data quoted represents past performance. Current performance may be lower or higher than the performance data quoted. Total return includes change in share prices and, in each case, includes reinvestment of dividends and capital gain distributions. The investment return and principal value vary so that an investor's shares, when redeemed, may be worth more or less than the original cost. To obtain the most recent month-end performance, please visit Oakmark.com.
TOP TEN EQUITY HOLDINGS9 | | % of Net Assets | |
IQVIA Holdings, Inc. | | | 7.4 | | |
CBRE Group, Inc., Class A | | | 7.3 | | |
Alphabet, Inc., Class A | | | 6.5 | | |
Capital One Financial Corp. | | | 6.1 | | |
Lithia Motors, Inc. | | | 5.9 | | |
First Citizens BancShares, Inc., Class A | | | 5.9 | | |
Paycom Software, Inc. | | | 5.7 | | |
Charles Schwab Corp. | | | 5.5 | | |
Intercontinental Exchange, Inc. | | | 4.8 | | |
Charter Communications, Inc., Class A | | | 3.9 | | |
FUND STATISTICS | |
Ticker* | | OAKLX | |
Number of Equity Holdings | | 22 | |
Net Assets | | $6.6 billion | |
Weighted Average Market Cap | | $201.2 billion | |
Median Market Cap | | $72 billion | |
Net Expense Ratio - Investor Class*^ | | 1.00% | |
* This information is related to the Investor Class. Please visit Oakmark.com for information related to the Advisor, Institutional and R6 Classes.
^ The Expense Ratio is from the Fund's prospectus dated January 28, 2024. The actual Gross and Net Expense Ratios for the period can be found in the Financial Highlights section of this report.
SECTOR ALLOCATION | | % of Net Assets | |
Financials | | | 37.4 | | |
Communication Services | | | 12.9 | | |
Energy | | | 11.2 | | |
Industrials | | | 8.3 | | |
Health Care | | | 7.4 | | |
Real Estate | | | 7.3 | | |
Consumer Discretionary | | | 6.0 | | |
Information Technology | | | 3.3 | | |
Short-Term Investments and Other | | | 6.2 | | |
See accompanying Disclosures and Endnotes on page 99.
8 OAKMARK FUNDS
Oakmark Select Fund March 31, 2024
Portfolio Manager Commentary


William C. Nygren, CFA
Portfolio Manager
oaklx@oakmark.com
Robert F. Bierig
Portfolio Manager
oaklx@oakmark.com
Alexander E. Fitch, CFA
Portfolio Manager
oaklx@oakmark.com
The Oakmark Select Fund ("the Fund") returned 6.22% during the first quarter compared to 10.56% for the S&P 500 Index, giving back a small amount of our strong relative performance over the past few quarters. Since its inception in November 1996, the Fund has returned an average of 11.93% per year, outperforming the S&P 500 Index's annualized total return of 9.62% over the same period.
In the first quarter, the largest contributing sectors were financials and energy. We slightly reduced our financials weighting due to the good price performance of our holdings in this area, but we continue to believe the sector offers an unusual number of bargains. The largest detracting sectors were communication services and consumer discretionary. The largest individual contributors were First Citizens BancShares and KKR, and the largest individual detractors were Charter Communications and Lithia Motors. Amid the outperformance of growth stocks to start the year, we are finding attractive opportunities to buy stocks that meet our value investment criteria.
We initiated one new holding during the quarter, Deere & Company:
Deere & Company is a leading manufacturer of agricultural equipment with dominant market share in North America and Brazil. Despite its brand strength, technological capabilities and distribution advantages, the company's stock price has recently fallen due to fears about a downturn in the agriculture business cycle. Longer term, world population and food demand are expected to increase annually yet land and labor devoted to agriculture are expected to decline. Deere seems well-positioned to benefit from this dynamic as farms will have to become more productive. We were pleased to purchase shares in Deere at a low double-digit multiple of our estimate of normal earnings power.
We sold our shares in Liberty Broadband to realize losses for taxable investors, and we increased our holdings in Charter Communications by an approximately equivalent dollar amount. Liberty's primary holding is its stake in Charter. Therefore, we view these holdings as largely substitutable.
We thank you, our fellow shareholders, for your investment in the Oakmark Select Fund.
See accompanying Disclosures and Endnotes on page 99.
Oakmark.com 9
Oakmark Select Fund March 31, 2024 (Unaudited)
Schedule of Investments (in thousands)
| | | Shares | | Value | |
COMMON STOCKS - 93.8% | |
FINANCIALS - 37.4% | |
FINANCIAL SERVICES - 27.7% | |
Capital One Financial Corp. | | | 2,690 | | | $ | 400,484 | | |
Charles Schwab Corp. | | | 5,048 | | | | 365,168 | | |
Intercontinental Exchange, Inc. | | | 2,322 | | | | 319,147 | | |
Fiserv, Inc. (a) | | | 1,313 | | | | 209,910 | | |
Ally Financial, Inc. | | | 4,826 | | | | 195,879 | | |
American Express Co. | | | 800 | | | | 182,038 | | |
KKR & Co., Inc. | | | 1,525 | | | | 153,384 | | |
| | | | | | 1,826,010 | | |
BANKS - 9.7% | |
First Citizens BancShares, Inc., Class A | | | 236 | | | | 385,505 | | |
Wells Fargo & Co. | | | 4,360 | | | | 252,691 | | |
| | | | | | 638,196 | | |
| | | | | | 2,464,206 | | |
COMMUNICATION SERVICES - 12.9% | |
MEDIA & ENTERTAINMENT - 12.9% | |
Alphabet, Inc., Class A (a) | | | 2,853 | | | | 430,652 | | |
Charter Communications, Inc., Class A (a) | | | 874 | | | | 253,981 | | |
Warner Bros. Discovery, Inc. (a) | | | 19,057 | | | | 166,368 | | |
| | | | | | 851,001 | | |
ENERGY - 11.2% | |
ConocoPhillips | | | 1,894 | | | | 241,057 | | |
Phillips 66 | | | 1,461 | | | | 238,640 | | |
APA Corp. | | | 4,211 | | | | 144,767 | | |
EOG Resources, Inc. | | | 871 | | | | 111,295 | | |
| | | | | | 735,759 | | |
INDUSTRIALS - 8.3% | |
COMMERCIAL & PROFESSIONAL SERVICES - 5.7% | |
Paycom Software, Inc. | | | 1,881 | | | | 374,415 | | |
CAPITAL GOODS - 2.6% | |
Deere & Co. | | | 423 | | | | 173,784 | | |
| | | | | | 548,199 | | |
HEALTH CARE - 7.4% | |
PHARMACEUTICALS, BIOTECHNOLOGY & LIFE SCIENCES - 7.4% | |
IQVIA Holdings, Inc. (a) | | | 1,924 | | | | 486,662 | | |
REAL ESTATE - 7.3% | |
REAL ESTATE MANAGEMENT & DEVELOPMENT - 7.3% | |
CBRE Group, Inc., Class A (a) | | | 4,919 | | | | 478,309 | | |
CONSUMER DISCRETIONARY - 6.0% | |
CONSUMER DISCRETIONARY DISTRIBUTION & RETAIL - 6.0% | |
Lithia Motors, Inc. | | | 1,299 | | | | 390,817 | | |
| | | Shares | | Value | |
INFORMATION TECHNOLOGY - 3.3% | |
SOFTWARE & SERVICES - 3.3% | |
Salesforce, Inc. | | | 728 | | | $ | 219,380 | | |
TOTAL COMMON STOCKS - 93.8%
(COST $4,386,742) | | | | | 6,174,333 | | |
| | | Par Value | | Value | |
SHORT-TERM INVESTMENTS - 6.4% | |
REPURCHASE AGREEMENT - 6.4% | |
Fixed Income Clearing Corp. Repurchase
Agreement, 5.32% dated 03/28/24 due
04/01/24, repurchase price $424,254,
collateralized by United States Treasury
Notes, 0.250% - 4.250% due
09/30/25 - 10/15/25, aggregate
value plus accrued interest of $432,484
(Cost: $424,003) | | $ | 424,003 | | | | 424,003 | | |
TOTAL SHORT-TERM INVESTMENTS - 6.4%
(COST $424,003) | | | | | 424,003 | | |
TOTAL INVESTMENTS - 100.2%
(COST $4,810,745) | | | | | 6,598,336 | | |
Liabilities In Excess of Other Assets - (0.2)% | | | | | (13,856 | ) | |
TOTAL NET ASSETS - 100.0% | | | | $ | 6,584,480 | | |
(a) Non-income producing security.
See accompanying Notes to Financial Statements.
10 OAKMARK FUNDS

This page intentionally left blank.
Oakmark.com 11
Oakmark Global Fund March 31, 2024
Summary Information
VALUE OF A $10,000 INVESTMENT
(Unaudited)

PERFORMANCE
| | | | | Average Annual Total Returns (as of 03/31/2024) | | | |
| (Unaudited) | | Total Return
Last 3 Months | | 1-year | | 3-year | | 5-year | | 10-year | | Since
Inception | | Inception
Date | |
Oakmark Global Fund (Investor Class) | | | 4.35 | % | | | 10.68 | % | | | 2.87 | % | | | 8.69 | % | | | 6.02 | % | | | 9.38 | % | | 08/04/99 | |
MSCI World Index (Net) | | | 8.88 | % | | | 25.11 | % | | | 8.60 | % | | | 12.07 | % | | | 9.39 | % | | | 6.18 | % | | | |
Lipper Global Fund Index15 | | | 8.93 | % | | | 23.39 | % | | | 5.76 | % | | | 10.22 | % | | | 7.99 | % | | | 6.25 | % | | | |
Oakmark Global Fund (Advisor Class) | | | 4.42 | % | | | 10.90 | % | | | 3.07 | % | | | 8.87 | % | | | N/A | | | | 8.62 | % | | 11/30/16 | |
Oakmark Global Fund (Institutional Class) | | | 4.42 | % | | | 10.95 | % | | | 3.09 | % | | | 8.91 | % | | | N/A | | | | 8.67 | % | | 11/30/16 | |
Oakmark Global Fund (R6 Class) | | | 4.45 | % | | | 10.95 | % | | | 3.12 | % | | | N/A | | | | N/A | | | | 6.76 | % | | 12/15/20 | |
The graph and table do not reflect the deduction of taxes that a shareholder would pay on Fund distributions or the redemption of Fund shares.
Past performance is no guarantee of future results. The performance data quoted represents past performance. Current performance may be lower or higher than the performance data quoted. Total return includes change in share prices and, in each case, includes reinvestment of dividends and capital gain distributions. The investment return and principal value vary so that an investor's shares, when redeemed, may be worth more or less than the original cost. To obtain the most recent month-end performance, please visit Oakmark.com.
TOP TEN EQUITY HOLDINGS9 | | % of Net Assets | |
Lloyds Banking Group PLC | | | 4.6 | | |
Mercedes-Benz Group AG | | | 4.2 | | |
| CNH Industrial NV | | | 3.9 | | |
Alphabet, Inc., Class A | | | 3.3 | | |
General Motors Co. | | | 3.2 | | |
Bayer AG | | | 3.2 | | |
IQVIA Holdings, Inc. | | | 3.2 | | |
Prudential PLC | | | 3.1 | | |
Julius Baer Group Ltd. | | | 3.1 | | |
Bank of America Corp. | | | 3.1 | | |
FUND STATISTICS | |
Ticker* | | OAKGX | |
Number of Equity Holdings | | 45 | |
Net Assets | | $1.2 billion | |
Weighted Average Market Cap | | $158.9 billion | |
Median Market Cap | | $48.8 billion | |
Net Expense Ratio - Investor Class*^ | | 1.13% | |
* This information is related to the Investor Class. Please visit Oakmark.com for information related to the Advisor, Institutional and R6 Classes.
^ The Expense Ratio is from the Fund's prospectus dated January 28, 2024. The actual Gross and Net Expense Ratios for the period can be found in the Financial Highlights section of this report.
SECTOR ALLOCATION | | % of Net Assets | |
Financials | | | 34.1 | | |
Consumer Discretionary | | | 17.1 | | |
Health Care | | | 13.2 | | |
Communication Services | | | 9.3 | | |
Industrials | | | 8.3 | | |
Information Technology | | | 7.5 | | |
Consumer Staples | | | 3.4 | | |
Energy | | | 2.5 | | |
Materials | | | 1.9 | | |
Short-Term Investments and Other | | | 2.7 | | |
GEOGRAPHIC ALLOCATION | |
| | | % of Equity | |
North America | | | 54.6 | | |
United States | | | 54.6 | | |
Europe | | | 41.5 | | |
Germany* | | | 13.7 | | |
United Kingdom | | | 10.3 | | |
Switzerland | | | 7.2 | | |
France* | | | 4.4 | | |
Netherlands* | | | 2.7 | | |
Belgium* | | | 1.7 | | |
Ireland* | | | 1.5 | | |
| | | % of Equity | |
Asia | | | 3.9 | | |
South Korea | | | 2.1 | | |
China | | | 1.8 | | |
* Euro currency countries comprise 24.0% of equity investments.
See accompanying Disclosures and Endnotes on page 99.
12 OAKMARK FUNDS
Oakmark Global Fund March 31, 2024
Portfolio Manager Commentary


David G. Herro, CFA
Portfolio Manager
oakgx@oakmark.com
Anthony P. Coniaris, CFA
Portfolio Manager
oakgx@oakmark.com
Jason E. Long, CFA
Portfolio Manager
oakgx@oakmark.com
M. Colin Hudson, CFA
Portfolio Manager
oakgx@oakmark.com
John A. Sitarz, CFA, CPA
Portfolio Manager
oakgx@oakmark.com
The first quarter reflected strong absolute returns for the Oakmark Global Fund ("the Fund"). The Fund generated a 4.35% return in the first quarter, compared to a 8.88% return for the MSCI World Index (net)14. Since its inception in August 1999, the Fund has returned an average of 9.38% per year, outperforming the MSCI World Index's return of 6.18% over the same period.
The most significant individual stock contributors for the quarter were Daimler Truck Holding (Germany), General Motors (U.S.) and Corebridge Financial (U.S.). The largest detractors were St. James's Place (U.K.), Charter Communications (U.S.) and Bayer (Germany).
Daimler Truck Holding was a top contributor during the quarter. In March, the truck and bus manufacturer released strong fourth-quarter results, accompanied by 2024 margin guidance that significantly exceeded consensus expectations. The expected margin resilience is in spite of a weaker global truck market and is a result of management's decisive actions to improve pricing, drive higher service penetration and increase the flexibility of the cost base. This is most evident in the Mercedes-Benz segment, primarily serving the European and Latin American markets, which increased its adjusted EBIT16 margin from less than 1% in 2019 to over 10% last year. We are impressed by management's execution following the 2021 spin-off from the former Daimler Group and believe the company is positioned to earn structurally higher through-cycle margins than in the past. We met with CEO Martin Daum following the release and continue to see an attractive upside for this investment.
St. James's Place was a top detractor during the quarter. In January, the wealth manager reported net inflows for 2023 that were £4.6 billion lower than in 2022. The disappointing update came on the heels of the company's announcement of a large overhaul of its fee structure. In February, the company reported full-year 2023 results. Underlying cash results fell below our expectations primarily due to the margin from new business and other revenues and expenses. The big miss, in our view, was the large provision charge that St. James's Place took to account for potential client reimbursements. There were increasing complaints from clients that the company was charging them without actually dispensing any advice. St. James's Place conducted
an internal investigation, which cited service gaps that existed before the company implemented Salesforce in 2021. The provision charge covers the appointment of an investigative assessment, the anticipated cost of refunding service fees, the administration costs to operate the refund program, and an interest expense to compensate for the time value of money. We met with management following the release of results and continue to believe in the long-term prospects of St. James's Place.
During the first quarter, we purchased one new position (Centene) and sold one holding (Danaher).
Centene (U.S.) is a large health insurer specializing in three major government-sponsored programs: Medicaid, Marketplace and Medicare Advantage. Each of these programs benefits from long-term secular tailwinds. In Medicaid, states are steadily outsourcing their programs to managed care companies like Centene to help reduce costs and improve care quality. Managed Medicaid penetration has increased meaningfully over the past two decades, and we expect further gains over time. In Marketplace, growth is driven by the trend toward more individuals buying health insurance. Centene holds the top market share in both of these programs and is well-positioned to capitalize on their continued growth. Finally, in Centene's Medicare Advantage business, past missteps will result in losses next year, but we believe Centene can turn its Medicare Advantage segment around and generate positive earnings in the next few years. Centene currently trades for about 9x our estimate of normal earnings power, which we believe is a compelling value for a business that generates healthy returns on capital and is capable of growing EPS13 at a low double-digit rate.
Geographically, we ended the quarter with 54.6% of the portfolio in the U.S., 31.2% in Europe, 10.3% in the U.K. and 3.9% in Asia, as a percent of equity. In the first quarter, Germany, Australia and Canada were the top contributors to the relative performance of countries owned. The U.K., U.S. and Switzerland detracted the most from relative performance.
See accompanying Disclosures and Endnotes on page 99.
Oakmark.com 13
Oakmark Global Fund March 31, 2024 (Unaudited)
Schedule of Investments (in thousands)
| | | Shares | | Value | |
COMMON STOCKS - 97.3% | |
FINANCIALS - 34.1% | |
FINANCIAL SERVICES - 15.8% | |
Julius Baer Group Ltd. (Switzerland) | | | 657 | | | $ | 37,946 | | |
Capital One Financial Corp. (United States) | | | 240 | | | | 35,704 | | |
Fiserv, Inc. (United States) (a) | | | 205 | | | | 32,683 | | |
Corebridge Financial, Inc. (United States) | | | 994 | | | | 28,569 | | |
Intercontinental Exchange, Inc. (United States) | | | 180 | | | | 24,779 | | |
St. James's Place PLC (United Kingdom) | | | 3,592 | | | | 21,059 | | |
KKR & Co., Inc. (United States) | | | 94 | | | | 9,424 | | |
| | | | | | 190,164 | | |
INSURANCE - 10.6% | |
Prudential PLC (United Kingdom) | | | 4,048 | | | | 37,962 | | |
Allianz SE (Germany) | | | 103 | | | | 30,967 | | |
Willis Towers Watson PLC (United States) | | | 110 | | | | 30,195 | | |
American International Group, Inc.
(United States) | | | 376 | | | | 29,368 | | |
| | | | | | 128,492 | | |
BANKS - 7.7% | |
Lloyds Banking Group PLC (United Kingdom) | | | 84,231 | | | | 55,027 | | |
Bank of America Corp. (United States) | | | 998 | | | | 37,829 | | |
| | | | | | 92,856 | | |
| | | | | | 411,512 | | |
CONSUMER DISCRETIONARY - 17.1% | |
AUTOMOBILES & COMPONENTS - 7.4% | |
Mercedes-Benz Group AG (Germany) | | | 632 | | | | 50,310 | | |
General Motors Co. (United States) | | | 850 | | | | 38,556 | | |
| | | | | | 88,866 | | |
CONSUMER DISCRETIONARY DISTRIBUTION & RETAIL - 5.6% | |
Prosus NV (Netherlands) | | | 1,024 | | | | 32,112 | | |
Alibaba Group Holding Ltd. (China) | | | 2,357 | | | | 21,156 | | |
Amazon.com, Inc. (United States) (a) | | | 78 | | | | 14,125 | | |
| | | | | | 67,393 | | |
CONSUMER DURABLES & APPAREL - 4.1% | |
Kering SA (France) | | | 90 | | | | 35,690 | | |
Brunswick Corp. (United States) | | | 150 | | | | 14,478 | | |
| | | | | | 50,168 | | |
| | | | | | 206,427 | | |
HEALTH CARE - 13.2% | |
PHARMACEUTICALS, BIOTECHNOLOGY & LIFE SCIENCES - 9.5% | |
Bayer AG (Germany) | | | 1,245 | | | | 38,173 | | |
IQVIA Holdings, Inc. (United States) (a) | | | 151 | | | | 38,161 | | |
Agilent Technologies, Inc. (United States) | | | 107 | | | | 15,497 | | |
Roche Holding AG (Switzerland) | | | 54 | | | | 13,677 | | |
Novartis AG (Switzerland) | | | 102 | | | | 9,882 | | |
| | | | | | 115,390 | | |
| | | Shares | | Value | |
HEALTH CARE EQUIPMENT & SERVICES - 3.7% | |
Centene Corp. (United States) (a) | | | 296 | | | $ | 23,246 | | |
Envista Holdings Corp. (United States) (a) | | | 988 | | | | 21,132 | | |
| | | | | | 44,378 | | |
| | | | | | 159,768 | | |
COMMUNICATION SERVICES - 9.3% | |
MEDIA & ENTERTAINMENT - 9.3% | |
Alphabet, Inc., Class A (United States) (a) | | | 267 | | | | 40,238 | | |
Interpublic Group of Cos., Inc.
(United States) | | | 1,022 | | | | 33,343 | | |
Charter Communications, Inc., Class A
(United States) (a) | | | 76 | | | | 21,972 | | |
Liberty Broadband Corp., Class C
(United States) (a) | | | 152 | | | | 8,705 | | |
Warner Bros. Discovery, Inc.
(United States) (a) | | | 911 | | | | 7,952 | | |
| | | | | | 112,210 | | |
INDUSTRIALS - 8.3% | |
CAPITAL GOODS - 6.9% | |
CNH Industrial NV (United States) | | | 3,632 | | | | 47,072 | | |
Daimler Truck Holding AG (Germany) | | | 576 | | | | 29,158 | | |
Travis Perkins PLC (United Kingdom) | | | 748 | | | | 6,888 | | |
| | | | | | 83,118 | | |
TRANSPORTATION - 1.4% | |
Ryanair Holdings PLC ADR (Ireland) (b) | | | 122 | | | | 17,695 | | |
| | | | | | 100,813 | | |
INFORMATION TECHNOLOGY - 7.5% | |
TECHNOLOGY HARDWARE & EQUIPMENT - 5.2% | |
Samsung Electronics Co. Ltd. (South Korea) | | | 397 | | | | 23,803 | | |
TE Connectivity Ltd. (United States) | | | 138 | | | | 20,101 | | |
Cisco Systems, Inc. (United States) | | | 369 | | | | 18,437 | | |
| | | | | | 62,341 | | |
SOFTWARE & SERVICES - 2.3% | |
Capgemini SE (France) | | | 68 | | | | 15,717 | | |
SAP SE (Germany) | | | 63 | | | | 12,285 | | |
| | | | | | 28,002 | | |
| | | | | | 90,343 | | |
CONSUMER STAPLES - 3.4% | |
CONSUMER STAPLES DISTRIBUTION & RETAIL - 1.7% | |
Kroger Co. (United States) | | | 359 | | | | 20,515 | | |
FOOD, BEVERAGE & TOBACCO - 1.7% | |
Anheuser-Busch InBev SA (Belgium) | | | 335 | | | | 20,400 | | |
| | | | | | 40,915 | | |
See accompanying Notes to Financial Statements.
14 OAKMARK FUNDS
Oakmark Global Fund March 31, 2024 (Unaudited)
Schedule of Investments (in thousands) (continued)
| | | Shares | | Value | |
COMMON STOCKS - 97.3% (continued) | |
ENERGY - 2.5% | |
ConocoPhillips (United States) | | | 234 | | | $ | 29,785 | | |
MATERIALS - 1.9% | |
Glencore PLC (Switzerland) | | | 4,223 | | | | 23,204 | | |
TOTAL COMMON STOCKS - 97.3%
(COST $903,431) | | | | | 1,174,977 | | |
| | | Par Value | | Value | |
SHORT-TERM INVESTMENT - 3.6% | |
REPURCHASE AGREEMENT - 3.6% | |
Fixed Income Clearing Corp. Repurchase
Agreement, 5.32% dated 03/28/24 due
04/01/24, repurchase price $44,054,
collateralized by United States Treasury
Notes, 0.125% - 4.250% due 10/15/25,
aggregate value plus accrued interest of
$44,908 (Cost: $44,028) | | $ | 44,028 | | | | 44,028 | | |
TOTAL SHORT-TERM INVESTMENTS - 3.6%
(COST $44,028) | | | | | 44,028 | | |
TOTAL INVESTMENTS - 100.9%
(COST $947,459) | | | | | 1,219,005 | | |
Foreign Currencies (Cost $0) (d) - 0.0% (c) | | | | | 0 | (d) | |
Liabilities In Excess of Other Assets - (0.9)% | | | | | (10,929 | ) | |
TOTAL NET ASSETS - 100.0% | | | | $ | 1,208,076 | | |
(a) Non-income producing security.
(b) Sponsored American Depositary Receipt
(c) Amount rounds to less than 0.1%.
(d) Amount rounds to less than $1,000.
See accompanying Notes to Financial Statements.
Oakmark.com 15
Oakmark Global Select Fund March 31, 2024
Summary Information
VALUE OF A $10,000 INVESTMENT
(Unaudited)

PERFORMANCE
| | | | | Average Annual Total Returns (as of 03/31/2024) | | | |
| (Unaudited) | | Total Return
Last 3 Months | | 1-year | | 3-year | | 5-year | | 10-year | | Since
Inception | | Inception
Date | |
Oakmark Global Select Fund (Investor Class) | | | 2.95 | % | | | 15.78 | % | | | 1.74 | % | | | 8.73 | % | | | 6.35 | % | | | 7.60 | % | | 10/02/06 | |
MSCI World Index (Net) | | | 8.88 | % | | | 25.11 | % | | | 8.60 | % | | | 12.07 | % | | | 9.39 | % | | | 7.42 | % | | | |
Lipper Global Fund Index15 | | | 8.93 | % | | | 23.39 | % | | | 5.76 | % | | | 10.22 | % | | | 7.99 | % | | | 6.69 | % | | | |
Oakmark Global Select Fund (Advisor Class) | | | 3.00 | % | | | 15.94 | % | | | 1.90 | % | | | 8.88 | % | | | N/A | | | | 7.46 | % | | 11/30/16 | |
Oakmark Global Select Fund (Institutional Class) | | | 3.05 | % | | | 16.02 | % | | | 1.97 | % | | | 8.97 | % | | | N/A | | | | 7.53 | % | | 11/30/16 | |
Oakmark Global Select Fund (R6 Class) | | | 3.04 | % | | | 16.13 | % | | | 2.02 | % | | | N/A | | | | N/A | | | | 5.59 | % | | 12/15/20 | |
The graph and table do not reflect the deduction of taxes that a shareholder would pay on Fund distributions or the redemption of Fund shares.
Past performance is no guarantee of future results. The performance data quoted represents past performance. Current performance may be lower or higher than the performance data quoted. Total return includes change in share prices and, in each case, includes reinvestment of dividends and capital gain distributions. The investment return and principal value vary so that an investor's shares, when redeemed, may be worth more or less than the original cost. To obtain the most recent month-end performance, please visit Oakmark.com.
TOP TEN EQUITY HOLDINGS9 | | % of Net Assets | |
Alphabet, Inc., Class A | | | 6.3 | | |
| CNH Industrial NV | | | 5.9 | | |
Lloyds Banking Group PLC | | | 5.9 | | |
Fiserv, Inc. | | | 5.6 | | |
Capital One Financial Corp. | | | 5.4 | | |
IQVIA Holdings, Inc. | | | 5.3 | | |
Mercedes-Benz Group AG | | | 5.2 | | |
American International Group, Inc. | | | 5.1 | | |
Charter Communications, Inc., Class A | | | 5.1 | | |
Intercontinental Exchange, Inc. | | | 5.0 | | |
FUND STATISTICS | |
Ticker* | | OAKWX | |
Number of Equity Holdings | | 22 | |
Net Assets | | $1.1 billion | |
Weighted Average Market Cap | | $254.9 billion | |
Median Market Cap | | $55.5 billion | |
Net Expense Ratio - Investor Class*^ | | 1.14% | |
* This information is related to the Investor Class. Please visit Oakmark.com for information related to the Advisor, Institutional and R6 Classes.
^ The Expense Ratio is from the Fund's prospectus dated January 28, 2024. The actual Gross and Net Expense Ratios for the period can be found in the Financial Highlights section of this report.
SECTOR ALLOCATION | | % of Net Assets | |
Financials | | | 31.6 | | |
Health Care | | | 17.0 | | |
Consumer Discretionary | | | 14.7 | | |
Communication Services | | | 12.7 | | |
Consumer Staples | | | 7.6 | | |
Industrials | | | 5.9 | | |
Energy | | | 4.9 | | |
Information Technology | | | 4.5 | | |
Short-Term Investments and Other | | | 1.1 | | |
GEOGRAPHIC ALLOCATION | |
| | | % of Equity | |
North America | | | 60.4 | | |
United States | | | 60.4 | | |
Europe | | | 31.4 | | |
United Kingdom | | | 9.7 | | |
Germany* | | | 9.5 | | |
Switzerland | | | 4.2 | | |
| | | % of Equity | |
Europe (cont'd) | |
Netherlands* | | | 4.0 | | |
France* | | | 4.0 | | |
Asia | | | 8.2 | | |
South Korea | | | 5.9 | | |
China | | | 2.3 | | |
* Euro currency countries comprise 17.5% of equity investments.
See accompanying Disclosures and Endnotes on page 99.
16 OAKMARK FUNDS
Oakmark Global Select Fund March 31, 2024
Portfolio Manager Commentary


David G. Herro, CFA
Portfolio Manager
oakwx@oakmark.com
Anthony P. Coniaris, CFA
Portfolio Manager
oakwx@oakmark.com
Eric Liu, CFA
Portfolio Manager
oakwx@oakmark.com
M. Colin Hudson, CFA
Portfolio Manager
oakwx@oakmark.com
John A. Sitarz, CFA, CPA
Portfolio Manager
oakwx@oakmark.com
The Oakmark Global Select Fund ("the Fund") returned 2.95% for the quarter, underperforming the MSCI World Index (net)14, which returned 8.88%. Since its inception in October 2006, the Fund has returned an average of 7.60% per year, outperforming the MSCI World Index's return of 7.42% over the same period.
Fiserv (U.S.) was a top contributor during the quarter. The company is a leader in merchant acquiring, issuer processing services, and core banking software. During the time we have held the stock, Fiserv, under the leadership of CEO Frank Bisignano, has delivered peer-leading organic growth, meaningful margin expansion, and mid-teens earnings-per-share growth. We believe the company can deliver similarly impressive results over the medium term, yet today the shares still trade at a meaningful discount to the S&P 500 Index1. We believe that Fiserv is performing well and remains an attractive investment.
Charter Communications (U.S.) was a top detractor during the quarter. In February, the stock price fell when the company reported that broadband subscribers declined 0.2% sequentially. We anticipate that broadband subscriber growth will remain challenging in the near term due to a heightened competitive environment and the likely wind-down of a government subsidy program. However, we expect these competitive forces will abate over the medium term and that Charter's broadband subscriber base will return to normal growth. In the meantime, the company continues to grow earnings, invest in high-return capital projects and repurchase stock. We maintain our belief in the long-term prospects of Charter Communications.
We purchased new positions in Reckitt Benckiser Group (U.K.), IQVIA Holdings (U.S.) and Centene (U.S.) during the first quarter.
Reckitt Benckiser Group is a global consumer products company with leading brands in consumer health, infant nutrition, home care and hygiene. We like that more than half of the company's sales are generated from consumer health products, which is a category with meaningful barriers to entry, high margins and attractive growth. Additionally, we believe the company's improved execution, particularly in sales and supply chain management, along with its investments in growth reacceleration, provide potential for future margin expansion. However, Reckitt's stock is trading meaningfully off its highs
following an adverse verdict in a product liability lawsuit over its infant formula product. Although there is a legal liability risk for Reckitt, we believe that the rare nature of the alleged disease in question limits the scope of this liability, well below the share price movement to date. This has afforded us the opportunity to purchase shares of Reckitt at a discount to our estimate of its intrinsic value.
Fears about biotech funding and the sell-off in the broader life sciences area created an opportunity for us to invest in IQVIA, which we view as a high-quality business, at an attractive valuation. We believe that IQVIA is positioned to benefit from the trends of advanced therapeutics and personalized medicine given its ability to perform decentralized clinical trials that require digital capabilities. In our view, IQVIA can grow even further due to its data and software capabilities that enable the company to deliver real-world evidence so that biopharma companies and other health care providers can satisfy their regulatory and reimbursement mandates. We also appreciate CEO Ari Bousbib's strong track record on operations and capital allocation, and we are impressed by his large equity holdings in the company, which give him significant skin in the game. We were pleased to purchase shares of IQVIA at a discount to our estimate of its intrinsic value.
Centene is a large health insurer specializing in three major government-sponsored programs: Medicaid, Marketplace and Medicare Advantage. Each of these programs benefits from long-term secular tailwinds. In Medicaid, states are steadily outsourcing their programs to managed care companies like Centene to help reduce costs and improve care quality. Managed Medicaid penetration has increased meaningfully over the past two decades, and we expect further gains over time. In Marketplace, growth is driven by the trend toward more individuals buying health insurance. Centene holds the top market share in both of these programs and is well-positioned to capitalize on their continued growth. Finally, in Centene's Medicare Advantage business, past missteps will result in losses next year, but we believe Centene can turn its Medicare Advantage segment around and generate positive earnings in the next few years. Centene currently trades for about 9x our estimate of normal earnings power, which we believe is a compelling value for a
See accompanying Disclosures and Endnotes on page 99.
Oakmark.com 17
Oakmark Global Select Fund March 31, 2024
Portfolio Manager Commentary (continued)
business that generates healthy returns on capital and is capable of growing EPS13 at a low double-digit rate.
During the quarter, we also sold our positions in SAP (Germany), CBRE Group (U.S.) and Danaher (U.S.) as they approached our estimate of intrinsic value.
Geographically, we ended the quarter with 60.4% of the portfolio in the U.S., 21.7% in Europe, 9.7% in the U.K., and 8.2% in Asia.
We thank you for your continued support.
See accompanying Disclosures and Endnotes on page 99.
18 OAKMARK FUNDS
Oakmark Global Select Fund March 31, 2024 (Unaudited)
Schedule of Investments (in thousands)
| | | Shares | | Value | |
COMMON STOCKS - 94.3% | |
FINANCIALS - 31.6% | |
FINANCIAL SERVICES - 16.0% | |
Fiserv, Inc. (United States) (a) | | | 372 | | | $ | 59,446 | | |
Capital One Financial Corp. (United States) | | | 383 | | | | 56,980 | | |
Intercontinental Exchange, Inc. (United States) | | | 391 | | | | 53,749 | | |
| | | | | | 170,175 | | |
BANKS - 10.5% | |
Lloyds Banking Group PLC (United Kingdom) | | | 95,510 | | | | 62,396 | | |
Bank of America Corp. (United States) | | | 1,313 | | | | 49,780 | | |
| | | | | | 112,176 | | |
INSURANCE - 5.1% | |
American International Group, Inc.
(United States) | | | 689 | | | | 53,886 | | |
| | | | | | 336,237 | | |
HEALTH CARE - 17.0% | |
PHARMACEUTICALS, BIOTECHNOLOGY & LIFE SCIENCES - 13.6% | |
IQVIA Holdings, Inc. (United States) (a) | | | 224 | | | | 56,521 | | |
Bayer AG (Germany) | | | 1,445 | | | | 44,330 | | |
Roche Holding AG (Switzerland) | | | 172 | | | | 43,808 | | |
| | | | | | 144,659 | | |
HEALTH CARE EQUIPMENT & SERVICES - 3.4% | |
Centene Corp. (United States) (a) | | | 466 | | | | 36,556 | | |
| | | | | | 181,215 | | |
CONSUMER DISCRETIONARY - 14.7% | |
CONSUMER DISCRETIONARY DISTRIBUTION & RETAIL - 9.5% | |
Prosus NV (Netherlands) | | | 1,360 | | | | 42,653 | | |
Amazon.com, Inc. (United States) (a) | | | 186 | | | | 33,627 | | |
Alibaba Group Holding Ltd. (China) | | | 2,699 | | | | 24,225 | | |
| | | | | | 100,505 | | |
AUTOMOBILES & COMPONENTS - 5.2% | |
Mercedes-Benz Group AG (Germany) | | | 697 | | | | 55,534 | | |
| | | | | | 156,039 | | |
COMMUNICATION SERVICES - 12.7% | |
MEDIA & ENTERTAINMENT - 12.7% | |
Alphabet, Inc., Class A (United States) (a) | | | 448 | | | | 67,609 | | |
Charter Communications, Inc., Class A
(United States) (a) | | | 185 | | | | 53,818 | | |
NAVER Corp. (South Korea) | | | 103 | | | | 14,343 | | |
| | | | | | 135,770 | | |
CONSUMER STAPLES - 7.6% | |
FOOD, BEVERAGE & TOBACCO - 3.9% | |
Danone SA (France) | | | 646 | | | | 41,740 | | |
HOUSEHOLD & PERSONAL PRODUCTS - 3.7% | |
Reckitt Benckiser Group PLC (United Kingdom) | | | 692 | | | | 39,402 | | |
| | | | | | 81,142 | | |
| | | Shares | | Value | |
INDUSTRIALS - 5.9% | |
CAPITAL GOODS - 5.9% | |
CNH Industrial NV (United States) | | | 4,833 | | | $ | 62,636 | | |
ENERGY - 4.8% | |
ConocoPhillips (United States) | | | 406 | | | | 51,663 | | |
TOTAL COMMON STOCKS - 94.3%
(COST $809,152) | | | | | 1,004,702 | | |
PREFERRED STOCKS - 4.5% | |
TECHNOLOGY HARDWARE, STORAGE & PERIPHERALS - 4.5% | |
Samsung Electronics Co. Ltd. (South Korea) | | | 953 | | | | 47,550 | | |
TOTAL PREFERRED STOCKS - 4.5%
(COST $41,883) | | | | | 47,550 | | |
| | | Par Value | | Value | |
SHORT-TERM INVESTMENTS - 6.1% | |
REPURCHASE AGREEMENT - 6.1% | |
Fixed Income Clearing Corp. Repurchase
Agreement, 5.32% dated 03/28/24 due
04/01/24, repurchase price $64,876,
collateralized by a United States Treasury
Note, 0.250% due 09/30/25, value plus
accrued interest of $66,134 (Cost: $64,837) | | $ | 64,837 | | | | 64,837 | | |
TOTAL SHORT-TERM INVESTMENTS - 6.1%
(COST $64,837) | | | | | 64,837 | | |
TOTAL INVESTMENTS - 104.9%
(COST $915,872) | | | | | 1,117,089 | | |
Foreign Currencies (Cost $0) (c) - 0.0% (b) | | | | | 0 | (c) | |
Liabilities In Excess of Other Assets - (4.9)% | | | | | (52,106 | ) | |
TOTAL NET ASSETS - 100.0% | | | | $ | 1,064,983 | | |
(a) Non-income producing security.
(b) Amount rounds to less than 0.1%.
(c) Amount rounds to less than $1,000.
See accompanying Notes to Financial Statements.
Oakmark.com 19
International Equity Market Commentary March 31, 2024

David G. Herro, CFA
Portfolio Manager
oakix@oakmark.com
oakex@oakmark.com
oakgx@oakmark.com
oakwx@oakmark.com
Fellow Shareholders,
After a relatively strong 2023, both the Oakmark International Fund and Oakmark International Small Cap Fund (collectively, the "Funds") had positive performance in the first quarter, but just barely—both earned less than 1% and underperformed their respective bogeys (see individual Fund letters for more details). Despite the muted quarter, we remain very optimistic about the future given the extremely attractive valuations at which these international portfolios are selling. As an example, both Funds are trading at around 53 cents on the dollar (at 100 cents on the dollar, the portfolios would be fully valued by our measurement), which—outside of extremes—is near the low end of their historical ranges. These levels are even more meaningful as we expect acceptable growth in earnings and value over the next one to two years.
Momentum versus value
Granolas! The Mag 7! Japan! Crypto! Today, the weight of money is flocking to a few, narrow bands of asset classes. As the money flows TO these areas, it flows OUT of other places. In the last quarter, Japan was the recipient of investor attention as the market rose approximately 20% in local currency. Toyota Motor and Tokyo Electron were two of the top five performing stocks in the MSCI EAFE Index18 this past quarter with gains of 37.61% and 46.77%, respectively. We know all about the Fab 5, formerly the Mag 7 before dropping Apple and Tesla, and how they continue to gain attention and flows. Now, there is a European equivalent called the Granolas, which includes weight reduction drug champ Novo Nordisk and semiconductor equipment manufacturer ASML Holding as well as a handful of other European growth companies. And, of course, there is bitcoin, which appreciated around 65% for the quarter.
As long-term investors who make decisions based on the underlying intrinsic value of an asset based on its balance sheet and cash generation, we are not disappointed that we tend to underperform in momentum-driven markets. Importantly, as risk minimization to us is defined as protecting capital and achieving long-term returns versus our asset class, we believe that it is extremely risky to purchase stocks that have markedly stretched valuations just because it is where the flow of money is moving. Many of the themes these stocks move on are real (e.g., innovative drug treatments, artificial intelligence, the demand for chips, etc.), but we must ultimately price the businesses based on estimated earning power and cash generation and then compare this to the prices at which the businesses sell. If there is not a fundamental value proposition, we won't chase momentum as the only chasing we do is for value.
The Japanese situation
As mentioned, the Japanese market was the world's best performing developed market last quarter, and we are measurably underweight in the country for both Funds. This underweight has had a negative impact on returns from an absolute and relative perspective. During the last quarter, the Japanese market also set new highs, surpassing the past high-water mark that was set way back in December of 1989. There is a great deal of enthusiasm surrounding improved corporate governance, better earnings and the fact that Japan isn't China. (There is a lot of money moving from China to Japan.) Though we share the enthusiasm surrounding this second effort to improve corporate governance (first attempt was in Prime Minister Shinzo Abe's "third arrow" in 2012), our belief is that the Japanese stock market has been priced for a massive improvement in corporate performance that has yet to materialize. One way to visualize this is through an analysis of Japanese company profitability as measured by return on equity (ROE)23. The last time the market peaked, in 1989, we saw an average ROE of the TOPIX Index of around 7.5%. Today, the expected ROE is just 8.73%, which compares to the S&P 500 Index's of 18.6% and the Stoxx Europe 600 of just under 13%. And note that several Japanese export-oriented companies have experienced exceptional earnings growth (Toyota in particular) due to the collapse of the yen. Despite Europe trading at a significantly higher ROE than Japan, its estimated 2024 P/E ratio is 13.7x versus Japan's 16x, demonstrating a greater value proposition. We are enthused about improving prospects in Japan and continue to spend time on the ground looking for attractive investments, but finding widespread value is challenging, thus our current underweight.
Closing
Though the last three months delivered disappointing returns, we believe our international Funds represent exceptional value as both are priced well below their respective indexes via conventional valuation metrics but offer significantly higher profitability as demonstrated by the ROE of each portfolio. We will continue our search for value and stay disciplined by avoiding high valuations that we believe to be fundamentally unwarranted.
See accompanying Disclosures and Endnotes on page 99.
20 OAKMARK FUNDS
International Equity Market Commentary (continued) March 31, 2024
| | Oakmark
International
Fund | | Oakmark
International
Small Cap Fund | | MSCI World
ex US Index**,17 | | S&P 500 Index**,1 | |
Portfolio Statistics | |
Price/earnings*,2 | | | 9.4 | | | | 9.6 | | | | 15.8 | | | | 24.7 | | |
Price/cash flow*,24 | | | 7.0 | | | | 8.7 | | | | 10.1 | | | | 29.2 | | |
Price/book*,3 | | | 1.2 | | | | 1.3 | | | | 1.9 | | | | 4.3 | | |
Dividend yield25 | | | 3.3 | % | | | 3.5 | % | | | 2.9 | % | | | 1.4 | % | |
ROE23 | | | 14.5 | % | | | 15.6 | % | | | 12.3 | % | | | 17.5 | % | |
* Projected for portfolio, TTM for benchmark
** Benchmark characteristics are sourced directly from the index provider and the underlying calculation methodology differs from the methodology used by Harris to calculate for the portfolio characteristics.
Thank you for your continued support.
See accompanying Disclosures and Endnotes on page 99.
Oakmark.com 21
Oakmark International Fund March 31, 2024
Summary Information
VALUE OF A $10,000 INVESTMENT
(Unaudited)
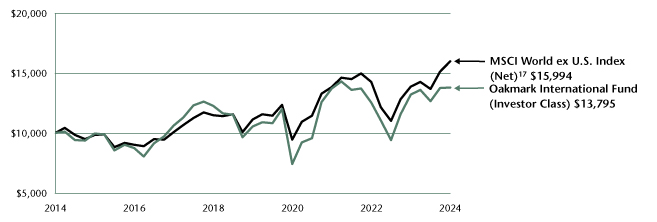
PERFORMANCE
| | | | Average Annual Total Returns (as of 03/31/24) | | | |
| (Unaudited) | | Total Return
Last 3 Months | | 1-year | | 3-year | | 5-year | | 10-year | | Since
Inception | | Inception
Date | |
Oakmark International Fund (Investor Class) | | | 0.11 | % | | | 4.42 | % | | | 0.12 | % | | | 5.51 | % | | | 3.27 | % | | | 8.55 | % | | 09/30/92 | |
MSCI World ex U.S. Index (Net) | | | 5.59 | % | | | 15.29 | % | | | 4.93 | % | | | 7.48 | % | | | 4.81 | % | | | 6.10 | % | | | |
MSCI EAFE Index (Net)18 | | | 5.79 | % | | | 15.32 | % | | | 4.78 | % | | | 7.33 | % | | | 4.80 | % | | | 5.96 | % | | | |
Lipper International Funds Index19 | | | 5.86 | % | | | 14.72 | % | | | 3.08 | % | | | 7.61 | % | | | 5.11 | % | | | 6.78 | % | | | |
Oakmark International Fund (Advisor Class) | | | 0.11 | % | | | 4.58 | % | | | 0.29 | % | | | 5.65 | % | | | N/A | | | | 5.48 | % | | 11/30/16 | |
Oakmark International Fund (Institutional Class) | | | 0.15 | % | | | 4.66 | % | | | 0.34 | % | | | 5.74 | % | | | N/A | | | | 5.56 | % | | 11/30/16 | |
Oakmark International Fund (R6 Class) | | | 0.15 | % | | | 4.72 | % | | | 0.40 | % | | | N/A | | | | N/A | | | | 3.33 | % | | 12/15/20 | |
The graph and table above do not reflect the deduction of taxes that a shareholder would pay on Fund distributions or the redemption of Fund shares.
Past performance is no guarantee of future results. The performance data quoted represents past performance. Current performance may be lower or higher than the performance data quoted. Total return includes change in share prices and, in each case, includes reinvestment of dividends and capital gain distributions. The investment return and principal value vary so that an investor's shares, when redeemed, may be worth more or less than the original cost. To obtain the most recent month-end performance, please visit Oakmark.com.
TOP TEN EQUITY HOLDINGS9 | | % of Net Assets | |
BNP Paribas SA | | | 4.0 | | |
Lloyds Banking Group PLC | | | 3.6 | | |
| CNH Industrial NV | | | 3.5 | | |
Bayer AG | | | 3.3 | | |
Prudential PLC | | | 2.9 | | |
Mercedes-Benz Group AG | | | 2.9 | | |
Kering SA | | | 2.6 | | |
Prosus NV | | | 2.6 | | |
Fresenius Medical Care AG | | | 2.6 | | |
Intesa Sanpaolo SpA | | | 2.5 | | |
FUND STATISTICS | |
Ticker* | | OAKIX | |
Number of Equity Holdings | | 66 | |
Net Assets | | $20 billion | |
Weighted Average Market Cap | | $49.3 billion | |
Median Market Cap | | $30.7 billion | |
Net Expense Ratio - Investor Class*^ | | 1.05% | |
* This information is related to the Investor Class. Please visit Oakmark.com for information related to the Advisor, Institutional and R6 Classes.
^ The Expense Ratio is from the Fund's prospectus dated January 28, 2024. The actual Gross and Net Expense Ratios for the period can be found in the Financial Highlights section of this report.
SECTOR ALLOCATION | | % of Net Assets | |
Consumer Discretionary | | | 22.2 | | |
Financials | | | 21.8 | | |
Industrials | | | 18.6 | | |
Health Care | | | 12.3 | | |
Information Technology | | | 6.3 | | |
Communication Services | | | 5.8 | | |
Materials | | | 4.8 | | |
Consumer Staples | | | 4.7 | | |
Short-Term Investments and Other | | | 3.5 | | |
GEOGRAPHIC ALLOCATION | |
| | % of Equity | |
Europe | | | 85.3 | | |
Germany* | | | 27.1 | | |
France* | | | 16.8 | | |
United Kingdom | | | 16.6 | | |
Switzerland | | | 8.1 | | |
Netherlands* | | | 5.4 | | |
Sweden | | | 3.2 | | |
Italy* | | | 2.6 | | |
Ireland* | | | 1.6 | | |
Denmark | | | 1.4 | | |
Spain* | | | 1.3 | | |
Belgium* | | | 1.2 | | |
| | % of Equity | |
Asia | | | 9.3 | | |
South Korea | | | 3.5 | | |
Japan | | | 3.1 | | |
China | | | 1.8 | | |
India | | | 0.7 | | |
Indonesia | | | 0.2 | | |
North America | | | 5.1 | | |
United States | | | 3.6 | | |
Canada | | | 1.5 | | |
Australasia | | | 0.3 | | |
Australia | | | 0.3 | | |
* Euro currency countries comprise 56.0% of equity investments.
See accompanying Disclosures and Endnotes on page 99.
22 OAKMARK FUNDS
Oakmark International Fund March 31, 2024
Portfolio Manager Commentary


David G. Herro, CFA
Portfolio Manager
oakix@oakmark.com
Michael L. Manelli, CFA
Portfolio Manager
oakix@oakmark.com
Eric Liu, CFA
Portfolio Manager
oakix@oakmark.com
The Oakmark International Fund ("the Fund") returned 0.11% for the quarter ended March 31, compared to the benchmark, the MSCI World ex US Index (net)17, which returned 5.59% for the same period. In addition, the Fund has returned an average of 8.55% per year since its inception in September 1992, outperforming the MSCI World ex U.S. Index's (net) return of 6.10% over the same period.
Daimler Truck Holding (Germany) was a top contributor during the quarter. In March, the truck and bus manufacturer released strong fourth-quarter results, accompanied by 2024 margin guidance that significantly exceeded consensus expectations. The expected margin resilience is in spite of a weaker global truck market and is a result of management's decisive actions to improve pricing, drive higher service penetration and increase the flexibility of the cost base. This is most evident in the Mercedes-Benz segment, primarily serving the European and Latin American markets, which increased its adjusted EBIT16 margin from sub-1% in 2019 to over 10% last year. We are impressed by management's execution following the 2021 spin-off from the former Daimler Group and believe the company is positioned to earn structurally higher through-cycle margins than in the past. We met with CEO Martin Daum following the release and continue to see an attractive upside for this investment.
Bayer (Germany) was a top detractor during the quarter. In January, Bayer had a larger than average adverse jury verdict in its long-running RoundUp litigation. We continue to believe that these headline verdicts will be reduced substantially on appeal and note that Bayer has since won two cases in a row. Then, in March, the company held its long-awaited capital markets day. The event contained limited material strategy updates as Bayer is no longer pre-communicating its litigation strategy, is erring conservatively by not issuing mid-term targets, and is deferring a break-up until its balance sheet is in better shape. This didn't bring the quick wins some investors had hoped for, but we support the strategy and appreciate management's sharp focus on improving profitability and cash generation while starting to cut away at the company's bureaucracy. The full-year 2023 results and 2024 guidance were both in line with our expectations.
We did not eliminate any positions during the quarter, and we initiated positions in Brambles, Smurfit Kappa Group and Smith & Nephew:
Brambles (Australia) is the world's largest provider of pooled pallets, crates and containers. The company's pallet-pooling model delivers an attractive value proposition to its customers by enabling standardization and seamlessly connecting supply chain participants to ensure the efficient flow of goods across the world. Much of the market still uses non-pooled pallets, which translates to attractive long-term growth opportunities
for the pooling model. As the market share leader, Brambles benefits from economies of scale, which have provided cost advantages and led to attractive returns on capital. In addition, we like that digital initiatives at the company are starting to yield results in the form of lower pallet loss rates, lower capital costs, lower operating expenses, and better returns. Since we sold our position in Brambles in 2022, its share price has lagged the market despite fundamental performance exceeding our estimates. This has provided us the opportunity to reestablish our position at a discount to our estimate of intrinsic value.
Smurfit Kappa Group (Ireland) is Europe's leading containerboard and corrugated box producer. The company's share price has been under pressure due to a unique downturn in industry volumes caused by supply chain reverberations from the Covid-19 pandemic, which we believe is beginning to unwind. In addition, in September 2023, Smurfit Kappa announced an agreement to acquire WestRock, the second-largest producer of containerboard and corrugated boxes in North America. WestRock has historically underperformed its competitors, and we believe the company's asset base stands to benefit from strategic investments and operational improvements under its experienced management team. As a part of the acquisition, Smurfit Kappa plans to list the combined entity in the U.S., which offers upside optionality as U.S. producers have historically traded at a premium to European peers. The improving industry outlook and the opportunity to drive improvements at WestRock provided the opportunity to purchase shares at a discount to our estimate of the intrinsic value of the anticipated combined company.
Smith & Nephew (U.K.) is a global medical device manufacturer operating in attractive end markets. The company currently generates the majority of its earnings through its sports medicine and advanced wound management businesses, which command strong market share positions and offer favorable growth prospects. The company's orthopedics business has historically underperformed its peers, but we are pleased by the decisive actions taken by new CEO Deepak Nath, which we expect will improve growth, margins and return on invested capital for the orthopedics segment. We believe the company is in the early stages of its margin improvement journey and an upgrade of the product portfolio in recent years will drive sustainably higher revenue growth than in the past. We were able to purchase Smith & Nephew shares at a discount to our estimate of intrinsic value, despite the company's improving fundamental outlook.
Geographically, we ended the quarter with approximately 68.6% of our holdings in Europe, 16.6% in the U.K. and 6.2% in Asia. The remaining positions are 3.1% in Japan, 5.1% in North America (Canada and the U.S.) and 0.3% in Australasia.
See accompanying Disclosures and Endnotes on page 99.
Oakmark.com 23
Oakmark International Fund March 31, 2024 (Unaudited)
Schedule of Investments (in thousands)
| | | Shares | | Value | |
COMMON STOCKS - 94.7% | |
CONSUMER DISCRETIONARY - 22.2% | |
AUTOMOBILES & COMPONENTS - 8.4% | |
Mercedes-Benz Group AG (Germany) | | | 7,375 | | | $ | 587,251 | | |
Continental AG (Germany) | | | 6,251 | | | | 451,172 | | |
Bayerische Motoren Werke AG (Germany) | | | 3,865 | | | | 446,041 | | |
Valeo SE (France) (a) | | | 15,711 | | | | 196,453 | | |
| | | | | | 1,680,917 | | |
CONSUMER DURABLES & APPAREL - 5.9% | |
Kering SA (France) | | | 1,330 | | | | 525,546 | | |
adidas AG (Germany) | | | 1,256 | | | | 280,448 | | |
Swatch Group AG (Switzerland) | | | 968 | | | | 224,700 | | |
Cie Financiere Richemont SA, Class A
(Switzerland) | | | 936 | | | | 142,664 | | |
| | | | | | 1,173,358 | | |
CONSUMER DISCRETIONARY DISTRIBUTION & RETAIL - 4.3% | |
Prosus NV (Netherlands) | | | 16,497 | | | | 517,483 | | |
Alibaba Group Holding Ltd. (China) | | | 38,205 | | | | 342,910 | | |
| | | | | | 860,393 | | |
CONSUMER SERVICES - 3.6% | |
Accor SA (France) | | | 7,069 | | | | 330,236 | | |
Amadeus IT Group SA (Spain) | | | 3,983 | | | | 255,447 | | |
Compass Group PLC (United Kingdom) | | | 4,694 | | | | 137,612 | | |
| | | | | | 723,295 | | |
| | | | | | 4,437,963 | | |
FINANCIALS - 21.8% | |
BANKS - 10.9% | |
BNP Paribas SA (France) | | | 11,198 | | | | 795,623 | | |
Lloyds Banking Group PLC
(United Kingdom) | | | 1,096,294 | | | | 716,197 | | |
Intesa Sanpaolo SpA (Italy) | | | 136,233 | | | | 494,275 | | |
Axis Bank Ltd. (India) | | | 10,331 | | | | 129,713 | | |
Bank Mandiri Persero Tbk. PT (Indonesia) | | | 93,765 | | | | 42,876 | | |
| | | | | | 2,178,684 | | |
FINANCIAL SERVICES - 5.7% | |
Schroders PLC (United Kingdom) | | | 74,599 | | | | 354,588 | | |
EXOR NV (Netherlands) | | | 2,824 | | | | 313,987 | | |
Edenred SE (France) | | | 5,316 | | | | 283,645 | | |
Worldline SA (France) (a) (b) | | | 15,482 | | | | 191,747 | | |
| | | | | | 1,143,967 | | |
INSURANCE - 5.2% | |
Prudential PLC (United Kingdom) | | | 62,913 | | | | 589,981 | | |
Allianz SE (Germany) | | | 1,493 | | | | 447,488 | | |
| | | | | | 1,037,469 | | |
| | | | | | 4,360,120 | | |
| | | Shares | | Value | |
INDUSTRIALS - 18.6% | |
CAPITAL GOODS - 14.9% | |
CNH Industrial NV (United States) | | | 54,395 | | | $ | 704,954 | | |
Daimler Truck Holding AG (Germany) | | | 8,300 | | | | 420,498 | | |
Siemens AG (Germany) | | | 1,586 | | | | 302,865 | | |
Ashtead Group PLC (United Kingdom) | | | 3,617 | | | | 257,506 | | |
SKF AB, Class B (Sweden) | | | 12,458 | | | | 254,314 | | |
Brenntag SE (Germany) | | | 2,717 | | | | 228,837 | | |
Volvo AB, Class B (Sweden) | | | 7,606 | | | | 206,150 | | |
Komatsu Ltd. (Japan) | | | 6,291 | | | | 185,457 | | |
Sandvik AB (Sweden) | | | 7,000 | | | | 155,442 | | |
Schindler Holding AG (Switzerland) | | | 454 | | | | 114,344 | | |
Smiths Group PLC (United Kingdom) | | | 5,495 | | | | 113,851 | | |
Bunzl PLC (United Kingdom) | | | 960 | | | | 36,931 | | |
| | | | | | 2,981,149 | | |
TRANSPORTATION - 2.7% | |
Ryanair Holdings PLC ADR (Ireland) (c) | | | 1,856 | | | | 270,205 | | |
DSV AS (Denmark) | | | 1,661 | | | | 270,068 | | |
| | | | | | 540,273 | | |
COMMERCIAL & PROFESSIONAL SERVICES - 1.0% | |
Recruit Holdings Co. Ltd. (Japan) | | | 3,443 | | | | 150,779 | | |
Brambles Ltd. (Australia) | | | 4,967 | | | | 52,278 | | |
| | | | | | 203,057 | | |
| | | | | | 3,724,479 | | |
HEALTH CARE - 12.3% | |
PHARMACEUTICALS, BIOTECHNOLOGY & LIFE SCIENCES - 7.2% | |
Bayer AG (Germany) | | | 21,623 | | | | 663,217 | | |
Roche Holding AG (Switzerland) | | | 1,166 | | | | 297,029 | | |
Eurofins Scientific SE (France) | | | 4,590 | | | | 292,580 | | |
Novartis AG (Switzerland) | | | 1,936 | | | | 187,596 | | |
| | | | | | 1,440,422 | | |
HEALTH CARE EQUIPMENT & SERVICES - 5.1% | |
Fresenius Medical Care AG (Germany) | | | 13,436 | | | | 516,777 | | |
Fresenius SE & Co. KGaA (Germany) | | | 15,385 | | | | 414,948 | | |
Smith & Nephew PLC (United Kingdom) | | | 6,768 | | | | 84,706 | | |
| | | | | | 1,016,431 | | |
| | | | | | 2,456,853 | | |
COMMUNICATION SERVICES - 5.8% | |
MEDIA & ENTERTAINMENT - 4.9% | |
WPP PLC (United Kingdom) | | | 38,787 | | | | 368,922 | | |
NAVER Corp. (South Korea) | | | 2,334 | | | | 324,399 | | |
Publicis Groupe SA (France) | | | 1,581 | | | | 172,401 | | |
Informa PLC (United Kingdom) | | | 11,300 | | | | 118,547 | | |
| | | | | | 984,269 | | |
TELECOMMUNICATION SERVICES - 0.9% | |
Liberty Global Ltd., Class A (United Kingdom) (b) | | | 10,496 | | | | 177,587 | | |
| | | | | | 1,161,856 | | |
See accompanying Notes to Financial Statements.
24 OAKMARK FUNDS
Oakmark International Fund March 31, 2024 (Unaudited)
Schedule of Investments (in thousands) (continued)
| | | Shares | | Value | |
COMMON STOCKS - 94.7% (continued) | |
MATERIALS - 4.8% | |
Glencore PLC (Switzerland) | | | 68,036 | | | $ | 373,799 | | |
Holcim AG (Switzerland) | | | 2,400 | | | | 217,351 | | |
Akzo Nobel NV (Netherlands) | | | 2,835 | | | | 211,619 | | |
thyssenkrupp AG (Germany) | | | 20,640 | | | | 110,759 | | |
Smurfit Kappa Group PLC (Ireland) | | | 1,010 | | | | 46,041 | | |
| | | | | | 959,569 | | |
CONSUMER STAPLES - 4.7% | |
FOOD, BEVERAGE & TOBACCO - 2.4% | |
Danone SA (France) | | | 3,811 | | | | 246,264 | | |
Anheuser-Busch InBev SA (Belgium) | | | 3,889 | | | | 236,880 | | |
| | | | | | 483,144 | | |
HOUSEHOLD & PERSONAL PRODUCTS - 2.3% | |
Reckitt Benckiser Group PLC (United Kingdom) | | | 4,506 | | | | 256,626 | | |
Henkel AG & Co. KGaA (Germany) | | | 2,755 | | | | 198,407 | | |
| | | | | | 455,033 | | |
| | | | | | 938,177 | | |
INFORMATION TECHNOLOGY - 4.5% | |
SOFTWARE & SERVICES - 4.5% | |
Open Text Corp. (Canada) | | | 7,675 | | | | 297,821 | | |
Fujitsu Ltd. (Japan) | | | 15,457 | | | | 246,845 | | |
Capgemini SE (France) | | | 927 | | | | 213,220 | | |
SAP SE (Germany) | | | 787 | | | | 153,298 | | |
| | | | | | 911,184 | | |
TOTAL COMMON STOCKS - 94.7%
(COST $17,330,690) | | | | | 18,950,201 | | |
PREFERRED STOCKS - 1.8% | |
INFORMATION TECHNOLOGY - 1.8% | |
TECHNOLOGY HARDWARE & EQUIPMENT - 1.8% | |
Samsung Electronics Co. Ltd. (South Korea) | | | 7,058 | | | | 352,320 | | |
TOTAL PREFERRED STOCKS - 1.8%
(COST $366,256) | | | | | 352,320 | | |
| | | Par Value | | Value | |
SHORT-TERM INVESTMENTS - 3.0% | |
REPURCHASE AGREEMENT - 2.6% | |
Fixed Income Clearing Corp. Repurchase
Agreement, 5.32% dated 03/28/24 due
04/01/24, repurchase price $525,438,
collateralized by a United States Treasury
Note, 4.000% due 12/15/25, value
plus accrued interest of $535,631
(Cost: $525,128) | | $ | 525,128 | | | $ | 525,128 | | |
COMMERCIAL PAPER - 0.4% | |
American Honda Finance Corp.,
5.52% - 5.58%, due
04/03/24 - 04/05/24 (d) | | | 57,065 | | | | 57,000 | | |
Campbell Soup Co., 144A,
5.71%, due 04/08/24 (d) (e) | | | 20,000 | | | | 19,965 | | |
Total Commercial Paper - 0.4%
(Cost $77,012) | | | | | 76,965 | | |
TOTAL SHORT-TERM INVESTMENTS - 3.0%
(COST $602,140) | | | | | 602,093 | | |
TOTAL INVESTMENTS - 99.5%
(COST $18,299,086) | | | | | 19,904,614 | | |
Foreign Currencies (Cost $1,781) - 0.0% (f) | | | | | 1,781 | | |
Other Assets In Excess of Liabilities - 0.5% | | | | | 105,273 | | |
TOTAL NET ASSETS - 100.0% | | | | $ | 20,011,668 | | |
(a) See Note 6 in the Notes to Financial Statements regarding investments in affiliated issuers.
(b) Non-income producing security.
(c) Sponsored American Depositary Receipt
(d) The rate shown represents the annualized yield at the time of purchase; not a coupon rate.
(e) Security exempt from registration under Rule 144A of the Securities Act of 1933, as amended. These securities may be resold, normally only to qualified institutional buyers.
(f) Amount rounds to less than 0.1%.
SCHEDULE OF TRANSACTIONS WITH AFFILIATED ISSUERS
Purchase and sale transactions and dividend and interest income earned during the period on these securities are set forth below (in thousands). The industry, country or geographic region for each of the below affiliates can be found in the Schedule of Investments.
| Affiliates | | Shares
Held | | Purchases
(Cost) | | Sales
(Proceeds) | | Realized
Gain/(Loss) | | Change in
Unrealized | | Dividend
Income | | Value
September 30,
2023 | | Value
March 31,
2024 | | Percent of
Net Assets | |
Valeo | | | 15,711 | | | $ | 19,766 | | | $ | 0 | | | $ | 0 | | | $ | (70,332 | ) | | $ | 0 | | | $ | 247,019 | | | $ | 196,453 | | | | 1.0 | % | |
Worldline | | | 15,482 | | | | 40,200 | | | | 0 | | | | 0 | | | | (204,140 | ) | | | 0 | | | | 355,687 | | | | 191,747 | | | | 1.0 | % | |
TOTAL | | | 31,193 | | | $ | 59,966 | | | $ | 0 | | | $ | 0 | | | $ | (274,472 | ) | | $ | 0 | | | $ | 602,706 | | | $ | 388,200 | | | | 2.0 | % | |
See accompanying Notes to Financial Statements.
Oakmark.com 25
Oakmark International Small Cap Fund March 31, 2024
Summary Information
VALUE OF A $10,000 INVESTMENT
(Unaudited)

PERFORMANCE
| | | | Average Annual Total Returns (as of 03/31/24) | | | |
| (Unaudited) | | Total Return
Last 3 Months | | 1-year | | 3-year | | 5-year | | 10-year | | Since
Inception | | Inception
Date | |
Oakmark International Small Cap Fund (Investor Class) | | | 0.51 | % | | | 12.74 | % | | | 3.15 | % | | | 8.45 | % | | | 4.65 | % | | | 8.62 | % | | 11/01/95 | |
MSCI World ex U.S. Small Cap Index (Net) | | | 2.58 | % | | | 10.04 | % | | | -0.93 | % | | | 5.39 | % | | | 4.54 | % | | | N/A | | | | |
MSCI World ex U.S. Index (Net)17 | | | 5.59 | % | | | 15.29 | % | | | 4.93 | % | | | 7.48 | % | | | 4.81 | % | | | 5.48 | % | | | |
Lipper International Small Cap Fund Index21 | | | 2.59 | % | | | 11.13 | % | | | -1.36 | % | | | 5.79 | % | | | 4.55 | % | | | N/A | | | | |
Oakmark International Small Cap Fund (Advisor Class) | | | 0.51 | % | | | 12.87 | % | | | 3.32 | % | | | 8.61 | % | | | N/A | | | | 7.48 | % | | 11/30/16 | |
Oakmark International Small Cap Fund (Institutional Class) | | | 0.51 | % | | | 12.94 | % | | | 3.39 | % | | | 8.69 | % | | | N/A | | | | 7.57 | % | | 11/30/16 | |
Oakmark International Small Cap Fund (R6 Class) | | | 0.51 | % | | | 12.97 | % | | | 3.42 | % | | | N/A | | | | N/A | | | | 6.99 | % | | 12/15/20 | |
The graph and table do not reflect the deduction of taxes that a shareholder would pay on Fund distributions or the redemption of Fund shares.
Past performance is no guarantee of future results. The performance data quoted represents past performance. Current performance may be lower or higher than the performance data quoted. Total return includes change in share prices and, in each case, includes reinvestment of dividends and capital gain distributions. The investment return and principal value vary so that an investor's shares, when redeemed, may be worth more or less than the original cost. Prior to December 3, 2018, the Fund imposed a 2% redemption fee on shares redeemed within 90 days of purchase; the Fund's performance for periods prior to that date does not reflect the 2% redemption fee. To obtain the most recent month-end performance, please visit Oakmark.com.
TOP TEN EQUITY HOLDINGS9 | | % of Net Assets | |
Duerr AG | | | 3.1 | | |
Julius Baer Group Ltd. | | | 3.1 | | |
ISS AS | | | 3.1 | | |
Atea ASA | | | 2.7 | | |
DS Smith PLC | | | 2.7 | | |
Azimut Holding SpA | | | 2.7 | | |
Dometic Group AB | | | 2.6 | | |
Loomis AB | | | 2.5 | | |
Hays PLC | | | 2.5 | | |
BNK Financial Group, Inc. | | | 2.5 | | |
FUND STATISTICS | |
Ticker* | | OAKEX | |
Number of Equity Holdings | | 63 | |
Net Assets | | $1.5 billion | |
Weighted Average Market Cap | | $4.2 billion | |
Median Market Cap | | $3.2 billion | |
Net Expense Ratio - Investor Class*^ | | 1.34% | |
* This information is related to the Investor Class. Please visit Oakmark.com for information related to the Advisor, Institutional and R6 Classes.
^ The Expense Ratio is from the Fund's prospectus dated January 28, 2024. The actual Gross and Net Expense Ratios for the period can be found in the Financial Highlights section of this report.
SECTOR ALLOCATION | | % of Net Assets | |
Industrials | | | 30.9 | | |
Financials | | | 18.4 | | |
Consumer Discretionary | | | 9.7 | | |
Information Technology | | | 8.5 | | |
Health Care | | | 6.8 | | |
Communication Services | | | 5.9 | | |
Materials | | | 5.9 | | |
Consumer Staples | | | 4.9 | | |
Real Estate | | | 4.1 | | |
Short-Term Investments and Other | | | 4.9 | | |
GEOGRAPHIC ALLOCATION | |
| | % of Equity | |
Europe | | | 75.3 | | |
United Kingdom | | | 20.5 | | |
Switzerland | | | 10.6 | | |
Germany* | | | 8.1 | | |
Sweden | | | 7.8 | | |
Finland* | | | 6.7 | | |
Italy* | | | 6.6 | | |
Denmark | | | 4.1 | | |
Netherlands* | | | 4.1 | | |
Norway | | | 3.5 | | |
Spain* | | | 2.9 | | |
Belgium* | | | 0.4 | | |
| | % of Equity | |
Asia | | | 13.7 | | |
Japan | | | 5.7 | | |
South Korea | | | 4.9 | | |
China | | | 2.2 | | |
Indonesia | | | 0.9 | | |
Australasia | | | 4.2 | | |
Australia | | | 4.2 | | |
Latin America | | | 3.1 | | |
Mexico | | | 3.1 | | |
North America | | | 2.3 | | |
Canada | | | 2.3 | | |
Africa/Middle East | | | 1.4 | | |
Israel | | | 1.4 | | |
* Euro currency countries comprise 28.8% of equity investments.
See accompanying Disclosures and Endnotes on page 99.
26 OAKMARK FUNDS
Oakmark International Small Cap Fund March 31, 2024
Portfolio Manager Commentary


David G. Herro, CFA
Portfolio Manager
oakex@oakmark.com
Michael L. Manelli, CFA
Portfolio Manager
oakex@oakmark.com
Justin D. Hance, CFA
Portfolio Manager
oakex@oakmark.com
The Oakmark International Small Cap Fund ("the Fund") returned 0.51% for the quarter ending March 31, underperforming the benchmark, the MSCI World ex U.S. Small Cap Index (net)20, which returned 2.58% for the same period. Since its inception in November 1995, the Fund has returned an average of 8.62% per year. For additional color on our views of the market environment during the most recent quarter, please see our international market commentary.
Konecranes (Finland) was a top contributor during the quarter. In February, the industrials company reported a strong set of fourth-quarter results. Organic revenue growth came in above our expectations, mainly driven by the service and port solutions segments. Service sales increased by 11% in local currencies, driven by strength in both spare parts and field service. We like that Konecranes' service business is delivering higher growth that is largely recurring in nature and of much higher quality than the growth in the equipment manufacturing divisions. This is a key component of our investment thesis. In addition, port solutions grew revenue by over 38% in local currencies in the fourth quarter as the business delivered on high order intake from prior periods while comparable EBITA22 margins increased. Also of note, port solutions entered 2024 with an order book higher than the previous year. Lastly, Konecranes reported 2024 guidance largely in line with our expectations. We continue to believe this investment offers an attractive upside.
St. James's Place (U.K.) was a top detractor during the quarter. In January, the wealth manager reported net inflows for 2023 that were £4.6 billion lower than in 2022. The disappointing update came on the heels of the company's announcement of a large overhaul of its fee structure. In February, the company reported full-year 2023 results. Underlying cash results fell below our expectations primarily due to the margin from new business and other revenues and expenses. The big miss, in our view, was the large provision charge that St. James's Place took to account for potential client reimbursements. There were increasing complaints from clients that the company was charging them without actually dispensing any advice. St. James's Place conducted an internal investigation, which cited service gaps that existed before the company implemented Salesforce in 2021. The provision charge covers the appointment of an investigative assessment, the anticipated cost of refunding service fees, the administration costs to operate the refund program, and an interest expense to compensate for the time value of money. We met with management following the release of results and continue to believe in the long-term prospects of St. James's Place.
We initiated new positions in the following during the quarter:
• Fielmann (Germany) is one of the largest optical retail companies in the world. It provides eyewear, contact lenses,
hearing aids and primary eyecare services—all products that benefit from steady demand and significant barriers from online disruption. Industry headwinds related to higher costs and weak consumer confidence have weighed on the stock price, but we are comfortable with Fielmann's defensive positioning and pricing actions to offset inflation. The company's margins have declined in recent years due to investments in internal initiatives that are nearly completed, which should provide the opportunity for improved cost control and profitability going forward. We believe the company's fundamental performance is nearing an inflection point, and we were able to purchase shares at a discount to our estimate of intrinsic value.
• TIS, Inc. (Japan) is one of Japan's largest IT services companies. We are familiar with TIS as we previously owned it but sold it when the stock price reached our estimate of intrinsic value. More recently, the stock has underperformed because growth is likely to slow next year due to the completion of several large-scale projects, which makes for a difficult comparison base. However, excluding these large projects, business fundamentals remain robust as IT spending in Japan continues to be very strong. In our view, the country lags most developed nations in digitizing its economy. This fact, combined with its shortage of IT engineering talent, should bode well for Japanese IT spending in the future. In addition to long-term structural demand for IT services, we like that TIS is led by a strong management team with a good track record of creating shareholder value through smart capital allocation decisions.
During the quarter, we sold Applus Services and Vitesco Technologies Group based on acquisition offers.
Geographically, we ended the quarter with approximately 54.9% of our holdings in Europe, 20.5% in the U.K., 7.9% in Asia and 5.7% in Japan. The remaining positions are 4.2% in Australasia, the Americas with 3.1% in Latin America and 2.3% in North America (Canada), and 1.4% in Africa/Middle East.
Thank you for your continued confidence and support.
See accompanying Disclosures and Endnotes on page 99.
Oakmark.com 27
Oakmark International Small Cap Fund March 31, 2024 (Unaudited)
Schedule of Investments (in thousands)
| | | Shares | | Value | |
COMMON STOCKS - 95.1% | |
INDUSTRIALS - 30.9% | |
CAPITAL GOODS - 18.8% | |
Duerr AG (Germany) | | | 1,982 | | | $ | 45,807 | | |
Konecranes OYJ (Finland) | | | 690 | | | | 35,805 | | |
Metso OYJ (Finland) | | | 2,561 | | | | 30,410 | | |
Travis Perkins PLC (United Kingdom) | | | 3,083 | | | | 28,384 | | |
Howden Joinery Group PLC (United Kingdom) | | | 2,415 | | | | 27,640 | | |
Valmet OYJ (Finland) | | | 1,010 | | | | 26,587 | | |
Fluidra SA (Spain) | | | 989 | | | | 23,379 | | |
Sulzer AG (Switzerland) | | | 161 | | | | 19,641 | | |
Babcock International Group PLC
(United Kingdom) | | | 2,919 | | | | 19,157 | | |
dormakaba Holding AG (Switzerland) | | | 34 | | | | 17,830 | | |
| | | | | | 274,640 | | |
COMMERCIAL & PROFESSIONAL SERVICES - 12.1% | |
ISS AS (Denmark) | | | 2,490 | | | | 45,363 | | |
Loomis AB (Sweden) | | | 1,309 | | | | 36,530 | | |
Hays PLC (United Kingdom) | | | 30,308 | | | | 36,130 | | |
Pagegroup PLC (United Kingdom) | | | 3,723 | | | | 21,080 | | |
SThree PLC (United Kingdom) | | | 2,953 | | | | 16,029 | | |
Mitie Group PLC (United Kingdom) | | | 7,243 | | | | 9,598 | | |
Randstad NV (Netherlands) | | | 143 | | | | 7,557 | | |
Adecco Group AG (Switzerland) | | | 132 | | | | 5,207 | | |
| | | | | | 177,494 | | |
| | | | | | 452,134 | | |
FINANCIALS - 18.4% | |
FINANCIAL SERVICES - 13.7% | |
Julius Baer Group Ltd. (Switzerland) | | | 793 | | | | 45,782 | | |
Azimut Holding SpA (Italy) | | | 1,445 | | | | 39,247 | | |
Nexi SpA (Italy) (a) | | | 5,462 | | | | 34,613 | | |
St. James's Place PLC (United Kingdom) | | | 4,554 | | | | 26,699 | | |
Euronext NV (Netherlands) | | | 260 | | | | 24,769 | | |
EFG International AG (Switzerland) | | | 1,340 | | | | 16,732 | | |
Intermediate Capital Group PLC
(United Kingdom) | | | 500 | | | | 12,962 | | |
| | | | | | 200,804 | | |
BANKS - 4.7% | |
BNK Financial Group, Inc. (South Korea) | | | 6,258 | | | | 37,095 | | |
DGB Financial Group, Inc. (South Korea) | | | 4,789 | | | | 30,949 | | |
| | | | | | 68,044 | | |
| | | | | | 268,848 | | |
CONSUMER DISCRETIONARY - 9.7% | |
AUTOMOBILES & COMPONENTS - 5.1% | |
Dometic Group AB (Sweden) | | | 4,674 | | | | 37,785 | | |
Pirelli & C SpA (Italy) | | | 3,036 | | | | 18,591 | | |
Autoliv, Inc. (Sweden) | | | 150 | | | | 18,052 | | |
| | | | | | 74,428 | | |
| | | Shares | | Value | |
CONSUMER SERVICES - 2.1% | |
Wynn Macau Ltd. (China) (a) | | | 35,031 | | | $ | 31,286 | | |
CONSUMER DURABLES & APPAREL - 1.9% | |
Gildan Activewear, Inc. (Canada) | | | 392 | | | | 14,544 | | |
GN Store Nord AS (Denmark) (a) | | | 471 | | | | 12,455 | | |
| | | | | | 26,999 | | |
CONSUMER DISCRETIONARY DISTRIBUTION & RETAIL - 0.6% | |
Fielmann Group AG (Germany) | | | 111 | | | | 5,097 | | |
Wickes Group PLC (United Kingdom) | | | 2,003 | | | | 3,921 | | |
| | | | | | 9,018 | | |
| | | | | | 141,731 | | |
INFORMATION TECHNOLOGY - 8.5% | |
SOFTWARE & SERVICES - 6.8% | |
Atea ASA (Norway) | | | 3,362 | | | | 40,190 | | |
TeamViewer SE (Germany) (a) | | | 1,925 | | | | 28,676 | | |
BIPROGY, Inc. (Japan) | | | 579 | | | | 17,138 | | |
Sapiens International Corp. NV (Israel) | | | 369 | | | | 11,873 | | |
TIS, Inc. (Japan) | | | 104 | | | | 2,220 | | |
| | | | | | 100,097 | | |
TECHNOLOGY HARDWARE & EQUIPMENT - 1.7% | |
Softwareone Holding AG (Switzerland) | | | 1,314 | | | | 24,223 | | |
| | | | | | 124,320 | | |
HEALTH CARE - 6.8% | |
HEALTH CARE EQUIPMENT & SERVICES - 5.6% | |
Ansell Ltd. (Australia) | | | 2,006 | | | | 32,128 | | |
ConvaTec Group PLC (United Kingdom) | | | 6,504 | | | | 23,511 | | |
Elekta AB, Class B (Sweden) | | | 2,128 | | | | 16,046 | | |
Medmix AG (Switzerland) | | | 623 | | | | 11,075 | | |
| | | | | | 82,760 | | |
PHARMACEUTICALS, BIOTECHNOLOGY & LIFE SCIENCES - 1.2% | |
Grifols SA ADR (Spain) (a) (b) | | | 2,584 | | | | 17,259 | | |
| | | | | | 100,019 | | |
COMMUNICATION SERVICES - 5.9% | |
MEDIA & ENTERTAINMENT - 5.1% | |
Megacable Holdings SAB de CV (Mexico) | | | 9,851 | | | | 27,388 | | |
oOh!media Ltd. (Australia) | | | 22,270 | | | | 25,832 | | |
Hakuhodo DY Holdings, Inc. (Japan) | | | 1,398 | | | | 12,563 | | |
Schibsted ASA, Class B (Norway) | | | 277 | | | | 8,396 | | |
| | | | | | 74,179 | | |
TELECOMMUNICATION SERVICES - 0.8% | |
Sarana Menara Nusantara Tbk. PT (Indonesia) | | | 221,714 | | | | 12,026 | | |
| | | | | | 86,205 | | |
See accompanying Notes to Financial Statements.
28 OAKMARK FUNDS
Oakmark International Small Cap Fund March 31, 2024 (Unaudited)
Schedule of Investments (in thousands) (continued)
| | | Shares | | Value | |
COMMON STOCKS - 95.1% (continued) | |
MATERIALS - 5.9% | |
DS Smith PLC (United Kingdom) | | | 7,858 | | | $ | 39,347 | | |
Lanxess AG (Germany) | | | 1,231 | | | | 32,957 | | |
Essentra PLC (United Kingdom) | | | 3,735 | | | | 8,288 | | |
Titan Cement International SA (Belgium) | | | 184 | | | | 5,273 | | |
| | | | | | 85,865 | | |
CONSUMER STAPLES - 4.9% | |
FOOD, BEVERAGE & TOBACCO - 2.2% | |
JDE Peet's NV (Netherlands) | | | 1,154 | | | | 24,223 | | |
Strauss Group Ltd. (Israel) (a) | | | 446 | | | | 8,410 | | |
| | | | | | 32,633 | | |
CONSUMER STAPLES DISTRIBUTION & RETAIL - 1.6% | |
Sugi Holdings Co. Ltd. (Japan) | | | 1,395 | | | | 23,789 | | |
HOUSEHOLD & PERSONAL PRODUCTS - 1.1% | |
Kimberly-Clark de Mexico SAB de CV, Class A
(Mexico) | | | 6,876 | | | | 15,965 | | |
| | | | | | 72,387 | | |
REAL ESTATE - 4.1% | |
REAL ESTATE MANAGEMENT & DEVELOPMENT - 4.1% | |
Katitas Co. Ltd. (Japan) | | | 1,761 | | | | 22,900 | | |
Colliers International Group, Inc. (Canada) | | | 140 | | | | 17,125 | | |
LSL Property Services PLC (United Kingdom) | | | 3,634 | | | | 12,200 | | |
IWG PLC (Switzerland) (a) | | | 2,881 | | | | 7,014 | | |
| | | | | | 59,239 | | |
TOTAL COMMON STOCKS - 95.1%
(COST $1,283,591) | | | | | 1,390,748 | | |
| | | Par Value | | Value | |
SHORT-TERM INVESTMENT - 4.0% | |
REPURCHASE AGREEMENT - 4.0% | |
Fixed Income Clearing Corp. Repurchase
Agreement, 5.32% dated 03/28/24 due
04/01/24, repurchase price $58,197,
collateralized by a United States Treasury
Note, 0.250% due 09/30/25, value plus
accrued interest of $59,326 (Cost: $58,163) | | $ | 58,163 | | | | 58,163 | | |
TOTAL SHORT-TERM INVESTMENTS - 4.0%
(COST $58,163) | | | | | 58,163 | | |
TOTAL INVESTMENTS - 99.1%
(COST $1,341,754) | | | | | 1,448,911 | | |
Foreign Currencies (Cost $818) - 0.1% | | | | | 818 | | |
Other Assets In Excess of Liabilities - 0.8% | | | | | 12,943 | | |
TOTAL NET ASSETS - 100.0% | | | | $ | 1,462,672 | | |
(a) Non-income producing security.
(b) Sponsored American Depositary Receipt
See accompanying Notes to Financial Statements.
Oakmark.com 29
Fixed Income Market Commentary March 31, 2024

Adam D. Abbas
Portfolio Manager
oakbx@oakmark.com
Key takeaways:
• Short-term events like the Federal Reserve's actions, inflation trends, and economic growth metrics seldom affect the foundational aspects of the long-term investment landscape.
• Regardless of whether inflation remains at 3% or reverts to 2%, the long-term investment outlook for fixed income remains positive.
• Periods of high volatility are more often precursors to higher future returns.
• Fixed income can act as a shock absorber in a downturn and provide higher income in a stable-rate environment—which enhances the expected returns.
Fixed income: Beyond the noise—a data-first approach
It's crucial to understand short-term fixed income market factors; however, don't let short-term events overshadow the broader, long-term investment story.
When I was starting out at Lehman Brothers, I found out a certain famous bond investor ignored the daily financial news that I, as a new analyst, was told to follow closely. This puzzled me initially, considering how much the media drives the market. But I eventually understood why. As I progressed in my career and increasingly leaned into long-term value investing, I understood why the renowned bond investor chose to ignore the daily financial noise, recognizing it as a potential distraction rather than a benefit. Today, the daily news churn pores over the Fed's moves, inflation and economic growth. While these are important short term, they don't really shake the long-term investment ground.
Take, for example, whether the Fed cuts rates in June or August, or if the CPI slightly changes; neither will drastically alter the long-term outlook for bonds. These details help predict market trends or price discovery in the short term, but they should never be allowed to eclipse the larger, long-term investment picture.
Our Chief Investment Officer-U.S., Bill Nygren, aptly stated in his Q1 2021 investment memo, "We believe we can take
advantage of [market inefficiencies] by forecasting further into the future and by unemotionally pursuing opportunities where other investors have overreacted." In that vein, in this commentary I will avoid the emotional pull of speculating on short run rates and inflation forecasts and replace that with a little bit of dispassionate bond math. I hope after some number crunching, I can demonstrate how today's bond market is more resilient than those of recent years and how high real and nominal yields27 set the stage for resilient expected returns for patient capital.
The misconception of perpetually high inflation preventing fixed income investments
The inflation debate—whether it's sticky and remains high or continues its descent toward the Fed's objective—certainly captures a lot of headlines. Some think ongoing budget deficits and changes in population and technology will keep inflation around 3%. Others believe the recent increase is just a blip and expect it to drop back to 2% soon. My take? The answer is probably somewhere in the middle. But here's what really matters for investors: no matter if inflation sticks at 3% or falls to 2%, it doesn't really change the game for bond investing.
Now, let's dive into the data and make simple assumptions to compare these scenarios with historical performance:
See accompanying Disclosures and Endnotes on page 99.
30 OAKMARK FUNDS
Fixed Income Market Commentary (continued) March 31, 2024
Figure 1: Expected Real Returns for Buy and Hold to Maturity28

Data source: Bloomberg, 4/1/2004-3/31/2024. AGG is the Bloomberg U.S. Aggregate Bond Index29; IG Corp Index is the Bloomberg U.S. Investment Grade Corporate Bond Index30; HY Corp is the Bloomberg U.S. High Yield Corporate Bond Index31. Data assumes historical average default rate and recovery for each index averages the historical normalized default rate (20 year). Nominal rates normalize to account for inflation scenario over 18-month period. Real returns set by nominal returns after loss average defaults and average recoveries minus inflation scenario (3% sticky or 2% target met). Assume seven-year life of holding period and all assets held to maturity or reinvested at 3/31/24 stated effective index yield.
Figure 2: Nominal total expected returns are relatively high versus recent history realized returns given much higher starting yields, thereby creating a more resilient total return. Inflation holding at 3% or at 2% should not meaningfully change outcomes assuming a normal default backdrop and hold to maturity.

Data source: Bloomberg, from 4/1/2004 to 3/31/2024. AGG is the Bloomberg Aggregate Bond Index; IG Corp Index is the Bloomberg U.S. Investment Grade Corporate Bond Index; HY Corp Index is the Bloomberg U.S. High Yield Corporate Bond Index. Data assumes historical average default rate and recovery for each index averages the historical normalized default rate (20 year). Nominal rates normalize to account for inflation scenario over 18-month period. Real returns set by nominal returns after loss average defaults and average recoveries minus inflation scenario (3% sticky or 2% target met). Assume a 7-year life of holding period and all assets held to maturity or reinvested at 3/31/24 stated effective index yield.
See accompanying Disclosures and Endnotes on page 99.
Oakmark.com 31
Fixed Income Market Commentary (continued) March 31, 2024
As Figure 1 shows, whether 3% or 2%, realized inflation will not fundamentally shift the attractiveness of fixed income as a long-term investment. By choosing to invest in fixed income securities and holding them to maturity, investors can capitalize on current high nominal and real yields. When we look ahead to the next seven years and compare it with the past seven, the appeal of these yields becomes increasingly apparent. The central point here is that, absent a significant economic setback, investors who engage in a long-term, buy-and-hold strategy can expect inflation-adjusted returns to be much higher than those experienced in the recent era of low-interest rates.
Navigating rate volatility and market uncertainty
Another recurring concern popularly broadcast as rates move higher is that the volatility and uncertainty in interest rate
markets make fixed income "un-investible." Whenever I see uncertainty or volatility as reasons to not invest, I remind myself that markets will always have a degree of uncertainty and that volatility as measured by things like the VIX or rate swings doesn't mean poor returns. Actually, periods of high swings in prices are often a predictor of above average future returns.
Higher yields usually mean better returns down the line. It's pretty straightforward, and the data below supports this idea. Look at the graph comparing rate volatility to future returns in the investment grade corporate bond market.
Figure 3: Rate volatility after spikes have been a signal for above-historical forward returns Rate Volatility (in black, left axis) vs the Investment Grade Bond Total Return (in dark green, right axis)
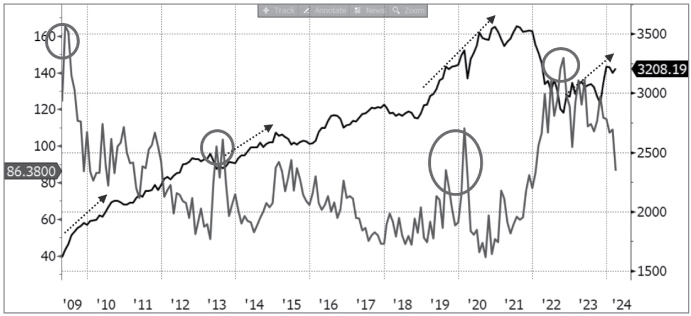
Source: Merrill Lynch and Bloomberg, as of 3/31/2024. Volatility is represented by Merrill Lynch Option Volatility Estimate Index (MOVE index)32. Investment Grade Bond Total Return is represented by Bloomberg Investment Grade Corporate Bond Fund Index30.
See accompanying Disclosures and Endnotes on page 99.
32 OAKMARK FUNDS
Fixed Income Market Commentary (continued) March 31, 2024
Figure 4: Investment grade corporate bond 1-, 3- and 7-year forward returns after peaks in rate volatility and sustained high levels of market uncertainty.
| | | Forward Returns After Rate Volatility Peak | |
| | 1-year | | 3-year | | 7-year | |
Oct 2022 - MOVE peak 148 | | | 8.5 | % | | | N/A | | | | N/A | | |
Aug 2013 - MOVE peak 104 | | | 9.1 | % | | | 19.0 | % | | | 46.5 | % | |
Jun 2009 - MOVE peak 165 | | | 16.6 | % | | | 38.4 | % | | | 61.3 | % | |
July 2003 - MOVE peak 160 | | | 7.7 | % | | | 13.6 | % | | | 51.1 | % | |
High volatility signal average | | | 10.5 | % | | | 23.6 | % | | | 53.0 | % | |
Average rolling return since 2000 | | | 5.0 | % | | | 16.0 | % | | | 42.0 | % | |
Median rolling return since 2000 | | | 5.2 | % | | | 16.0 | % | | | 43.6 | % | |
Excess return
after high volatility signal | | | 5.5 | % | | | 7.7 | % | | | 11.0 | % | |
Source: Bloomberg and Merrill Lynch, as of 3/31/2024. Volatility/MOVE is represented by Merrill Lynch Option Volatility Estimate Index (MOVE Index). Investment Grade Bond Total Return is represented by Bloomberg Investment Grade Corporate Bond Fund Index
As you can see from the graph and table, after a period of high volatility, we can expect better-than-average returns over one, three, and seven years. As fixed income investors, we must remember that uncertainty is a constant in investing, regardless of the current economic situation. Even amid wars, central bank actions or fluctuations in valuation and sentiment, the reliability of fixed income assets remains strong. The assurance of regular interest payments and the return of principal at maturity highlight the stability these investments offer.
Credit valuations: Are they too expensive?
The final criticism dominating headlines today regarding the bond market is about credit valuations. Specifically, the question on everyone's mind is: Are they too expensive?
Credit spreads provide extra yield to compensate investors for the risks linked to bankruptcy. It's increasingly common to argue that these spreads are currently too expensive or "tight," suggesting potential overvaluation. However, focusing solely on
credit spread valuations in a vacuum (versus historical levels) without considering significantly higher starting nominal and real rates overlooks a crucial aspect of generating returns in this interest rate regime compared to the last. While it's important to begin with current credit spread valuations and assess their implications for future default rates and recoveries, we must also recognize the role of elevated real rates during downturns and their protective cushion for returns. Also, we need to incorporate the impact of higher starting yields and income.
To tackle this, we created a model that incorporates all three factors: spreads, real rates and all-in yields. We also apply historical correlations to real rates and credit spreads to help model the resiliency of cushion that elevated levels today will provide in a slowdown. To help frame richness or cheapness, we then solve for the number of defaults needed to create average real returns. If those defaults are significantly higher than history, we can point to fundamental cheapness.
See accompanying Disclosures and Endnotes on page 99.
Oakmark.com 33
Fixed Income Market Commentary (continued) March 31, 2024
Figure 5: Required Annualized Defaults Needed to Experience Average Historical Returns Over 7-Year Life.
Assumes Real Rates Normalize over Time and Inflation Stabilizes at Elevated Level of 3%
| | | Historical
7-year
Nominal
Return1 | | Historical
7-year
Average
Real Return2 | | Average
Historical
Default
Rate3 | | Average
Historical
Default Rate
During
Recessions4 | | Average
Default
Rates During
Global
Financial
Crisis5 | | Required
Defaults to
Experience
Average
Historical
Real Returns
Assuming
3% Inflation6 | |
Bloomberg
Investment
Grade
Corporate
Index | | | 47.3 | % | | | 16.0 | % | | | 0.20 | % | | | 0.40 | % | | | 0.750 | % | | | 3.00 | % | |
Bloomberg
High Yield
Corporate
Index | | | 60.1 | % | | | 31.4 | % | | | 5.60 | % | | | 7.90 | % | | | 10.00 | % | | | 7.50 | % | |
Source: Bloomberg, 7-year rolling returns,4/1/1994-3/31/2024. 1. Data assumes real rates normalize to 50 bps over 3.5-year period. 2. For each 1% in assumed defaults, data assumes an increase of 50 bps of credit spread in year one and year two. 3. Nominal yields are set by last period real rate plus credit spread. 4. Assumes normalization back down to average historical credit spread in year three and year four. 5. Assumes average historical recoveries in defaults. 6. Uses 7-year average rolling CPI for real yield historical calculations
From the calculations, it's apparent that current high yields give investors a significant buffer against potential losses, despite narrow credit spreads. For example, conservative estimates show that investment-grade corporates could withstand defaults nearly four times the historical average and still yield average historical real returns for buy-and-hold investors over seven years. Similarly, while not as pronounced, high yield investors have a substantial safety margin compared to historical default rates to secure average real returns after accounting for inflation.
How can this be, especially when credit spreads are perceived as "rich" or "tight," ranking in the top decile historically? The answer lies partly in the current state of real yields, which are 150-200 basis points above the post-global financial crisis average. During economic slowdowns, real yields typically move inversely to credit spreads and can dip significantly during recessions. Presently, with real yields around 180-200 basis points in the five- and seven-year segments of the curve, they are poised to act as a far superior buffer in case of a severe economic downturn, compared to previous slowdowns in the low-rate era when real yields were negative. Moreover, these elevated real yields offer an extra 180-200 basis points of income carry, adding a cushion as we navigate through the end of the current rate hike cycle. This dual benefit—acting as a shock absorber in a downturn and providing higher income in a stable-rate environment—enhances the expected returns for fixed income asset classes. Investors focusing solely on credit spreads and historical comparisons are overlooking these crucial factors, which are necessary to accurately assess the relative value and attractiveness of credit investments in the market environment.
The case for a long-term investing view
Despite the transient uncertainties and fluctuations in the market, our long-term investment philosophy underscores the value of fixed income for generating stable returns over extended periods. The tendency to focus on daily market movements and to hang on every word from central bank officials should be moderated. Acknowledging the return potential and inherent resilience of fixed income instead—particularly when yields are favorable, capital is patient and time horizons are long—is paramount.
Yes, the risks of short-term rate and credit valuation fluctuations exist, but at Oakmark, we focus on the enduring risk-adjusted value proposition of fixed income over a five- to seven-year horizon. We remain opportunistic and ready to enhance our preferred positions when conditions align. Meanwhile, we encourage investors to appreciate the steady income that fixed income investments can provide, reinforcing the foundation for a well-rounded portfolio.
See accompanying Disclosures and Endnotes on page 99.
34 OAKMARK FUNDS

This page intentionally left blank.
Oakmark.com 35
Oakmark Equity and Income Fund March 31, 2024
Summary Information
VALUE OF A $10,000 INVESTMENT
(Unaudited)

PERFORMANCE
| | | | | Average Annual Total Returns (as of 03/31/24) | | | |
| (Unaudited) | | Total Return
Last 3 Months | | 1-year | | 3-year | | 5-year | | 10-year | | Since
Inception | | Inception
Date | |
Oakmark Equity and Income Fund (Investor Class) | | | 4.92 | % | | | 19.22 | % | | | 5.73 | % | | | 9.21 | % | | | 7.03 | % | | | 9.69 | % | | 11/01/95 | |
Lipper Balanced Funds Index | | | 5.15 | % | | | 14.89 | % | | | 3.28 | % | | | 7.74 | % | | | 6.77 | % | | | 6.97 | % | | | |
S&P 500 Index | | | 10.56 | % | | | 29.88 | % | | | 11.49 | % | | | 15.05 | % | | | 12.96 | % | | | 10.07 | % | | | |
Bloomberg U.S. Govt./Credit Index | | | -0.72 | % | | | 1.74 | % | | | -2.35 | % | | | 0.62 | % | | | 1.70 | % | | | 4.29 | % | | | |
Oakmark Equity and Income Fund (Advisor Class) | | | 5.01 | % | | | 19.55 | % | | | 6.00 | % | | | 9.42 | % | | | N/A | | | | 8.55 | % | | 11/30/16 | |
Oakmark Equity and Income Fund (Institutional Class) | | | 4.99 | % | | | 19.55 | % | | | 6.00 | % | | | 9.45 | % | | | N/A | | | | 8.58 | % | | 11/30/16 | |
Oakmark Equity and Income Fund (R6 Class) | | | 4.99 | % | | | 19.56 | % | | | 6.03 | % | | | N/A | | | | N/A | | | | 9.09 | % | | 12/15/20 | |
The graph and table above do not reflect the deduction of taxes that a shareholder would pay on Fund distributions or the redemption of Fund shares.
Past performance is no guarantee of future results. The performance data quoted represents past performance. Current performance may be lower or higher than the performance data quoted. Total return includes change in share prices and, in each case, includes reinvestment of dividends and capital gain distributions. The investment return and principal value vary so that an investor's shares, when redeemed, may be worth more or less than the original cost. To obtain the most recent month-end performance, please visit Oakmark.com.
TOP TEN EQUITY HOLDINGS9 | | % of Net Assets | |
Alphabet, Inc., Class A | | | 3.0 | | |
Fiserv, Inc. | | | 2.6 | | |
Bank of America Corp. | | | 2.2 | | |
Charles Schwab Corp. | | | 2.1 | | |
IQVIA Holdings, Inc. | | | 2.0 | | |
Centene Corp. | | | 2.0 | | |
Glencore PLC | | | 1.9 | | |
American International Group, Inc. | | | 1.8 | | |
Reinsurance Group of America, Inc. | | | 1.8 | | |
Deere & Co. | | | 1.7 | | |
FUND STATISTICS | |
Ticker* | | OAKBX | |
Number of Equity Holdings | | 49 | |
Net Assets | | $6.6 billion | |
Weighted Average Market Cap | | $199.9 billion | |
Median Market Cap | | $39.7 billion | |
Net Expense Ratio - Investor Class*^ | | 0.86% | |
* This information is related to the Investor Class. Please visit Oakmark.com for information related to the Advisor, Institutional and R6 Classes.
^ The Expense Ratio is from the Fund's prospectus dated January 28, 2024. The actual Gross and Net Expense Ratios for the period can be found in the Financial Highlights section of this report.
SECTOR ALLOCATION | | % of Net Assets | |
Equity Investments | |
Financials | | | 19.9 | | |
Consumer Discretionary | | | 9.5 | | |
Communication Services | | | 8.8 | | |
Health Care | | | 5.4 | | |
Industrials | | | 5.0 | | |
Materials | | | 4.0 | | |
Consumer Staples | | | 2.6 | | |
Energy | | | 2.5 | | |
Information Technology | | | 1.4 | | |
Real Estate | | | 0.9 | | |
Total Equity Investments | | | 60.0 | | |
Preferred Stocks | | | 0.1 | | |
Fixed Income Investments | |
Corporate Bonds | | | 15.4 | | |
Government and Agency Securities | | | 8.6 | | |
Collateralized Mortgage Obligations | | | 4.3 | | |
Asset Backed Securities | | | 4.2 | | |
Mortgage-Backed Securities | | | 3.1 | | |
Bank Loans | | | 2.0 | | |
Convertible Bond | | | 0.1 | | |
Total Fixed Income Investments | | | 37.7 | | |
Short-Term Investments and Other | | | 2.2 | | |
See accompanying Disclosures and Endnotes on page 99.
36 OAKMARK FUNDS
Oakmark Equity and Income Fund March 31, 2024
Portfolio Manager Commentary


M. Colin Hudson, CFA
Portfolio Manager
oakbx@oakmark.com
Adam D. Abbas
Portfolio Manager
oakbx@oakmark.com
Michael A. Nicolas, CFA
Portfolio Manager
oakbx@oakmark.com
Alexander E. Fitch, CFA
Portfolio Manager
oakbx@oakmark.com
Quarter and Calendar-Year Review
The Oakmark Equity and Income Fund ("the Fund") returned 4.92% during the first quarter, compared to 5.15% for the Lipper Balanced Fund Index34. This was driven by an 8.53% return on our equity portfolio37, which lagged the S&P 500 Index of 10.56%. This was partly due to an underweight in technology stocks, which were boosted by enthusiasm around artificial intelligence, as well as an overweight in mid-cap stocks, where we continue to find compelling valuations. Since its inception in November 1995, the Fund has returned an average of 9.69% per year, outperforming the Lipper Balanced Fund Index's return of 6.97% over the same period.
Our fixed income holdings37 returned 0.30% during the quarter, outperforming the Bloomberg U.S. Aggregate Government/Credit Index of–0.72%. As we've discussed previously, higher interest rates have improved the opportunities available in fixed income securities, and we currently see a more balanced risk-reward value proposition between equities and fixed income than we have in some time.
The Fund ended the quarter with 60.0% in equities, roughly in line with the balanced category average. Fixed income comprised 38.0% of the Fund assets, and cash comprised 2.0%. As always, we continually evaluate our asset allocation the same way that we evaluate our allocations to individual securities—with the goal of delivering attractive risk-adjusted returns with less volatility than a pure equity product would provide. We are pleased with how this approach has paid off over the long term.
The largest contributors to the portfolio's return in the quarter were Fiserv, Corebridge Financial, Reinsurance Group of America and KKR. The largest detractors were Charter Communications, Glencore, Howard Hughes and Warner Bros. Discovery. The largest contributors were all financial stocks, which is the Fund's largest sector weighting. Despite the already strong performance from our financial holdings, we continue to find their valuations attractive, and we have identified other compelling opportunities across a wide range of financial companies. In contrast, Charter was the biggest detractor from the Fund's performance due to fears about increasing competition from fiber overbuilding and fixed wireless. While these sources of competition will have a near-term impact, this impact should lessen over the coming years, enabling Charter to resume strong free cash flow growth.
Transactions
We added three new positions—Deere & Company, Kenvue and Delta Air Lines—in the quarter. Deere is a global manufacturer and distributor of equipment used in agriculture, construction and forestry. Deere dominates the highly profitable mid and large agricultural equipment markets in North America and Brazil. Farmers in these markets are highly focused on using technology to improve farm productivity. Deere directly capitalizes on technological developments over time, and we believe it has become the clear leader in precision agriculture. Currently, global agricultural markets have softened after a strong year in 2023. While the exact length of the downturn is impossible to predict, we believe it will be less severe than the previous downcycle as inventory shortages in recent years have contained this cycle's peak. For nearly two centuries, Deere has repeatedly emerged from downturns as a stronger and more profitable company. Trading at 13x our estimate of mid-cycle earnings, this stock offers what in our view is a highly attractive valuation for one of the world's best industrial businesses.
Kenvue became the largest standalone consumer health company following its split-off from Johnson & Johnson in May 2023. The company's highly recognizable brands, such as Neutrogena, Listerine, Tylenol and Band-Aid, have been market share leaders in their respective categories for generations. However, Kenvue's first year as a public company was clouded by market share losses in certain categories and worries over litigation. These concerns caused the company's stock to underperform the S&P 500 by more than 50 percentage points in Kenvue's first 10 months as an independent company. Kenvue now trades for 16.5x trailing earnings, a substantial discount to the market and other consumer health and packaged goods companies. Furthermore, we see an opportunity for Kenvue to operate more efficiently as a standalone entity and to re-invest cost savings into increased product development and marketing, which should help improve growth and ensure that the company's brands remain at the forefront of their categories. We believe that investors are overly pessimistic, and we find Kenvue's current price attractive for a leading consumer company that should grow earnings at a mid-single-digit rate or better over time.
We believe the "big three" U.S. airlines (Delta, United and American) have emerged from Covid-19 in the strongest competitive position they've ever occupied. Last year, the group accounted for 90% of industry profits, up from 70% in 2019. In
See accompanying Disclosures and Endnotes on page 99.
Oakmark.com 37
Oakmark Equity and Income Fund March 31, 2024
Portfolio Manager Commentary (continued)
our view, the increased profitability has been driven by a growing consumer preference for premium travel experiences and the airlines improving their product segmentation. Moreover, many low-cost carrier competitors have been disproportionately impacted by high-cost inflation in recent years. Of the big three, we see Delta as being best positioned. We believe that years of industry-leading operational performance and investments in customer experience have established Delta as the premium airline brand. We also think Delta's geographically optimal hubs, high local market share, robust loyalty program and unique corporate culture all support healthy returns on capital. Delta currently trades at 6x our estimate of normalized EPS13. We believe this is an attractive valuation for a competitively advantaged and growing business.
We eliminated one position, HCA, during the quarter as the stock traded at our estimate of fair value. HCA was a very good investment and more than quadrupled from our original investment price in 2016. We believe HCA is a well-managed business with the best collection of assets in the hospital space. Hospital stocks tend to be much more volatile than their actual intrinsic value, and we would gladly purchase HCA again if the discount to value warrants.
We would like to thank our fellow shareholders for their investment in the Fund and welcome any questions or comments.
See accompanying Disclosures and Endnotes on page 99.
38 OAKMARK FUNDS
Oakmark Equity and Income Fund March 31, 2024 (Unaudited)
Schedule of Investments (in thousands)
| | | Shares | | Value | |
COMMON STOCKS - 60.0% | |
FINANCIALS - 19.9% | |
FINANCIAL SERVICES - 12.7% | |
Fiserv, Inc. (a) | | | 1,094 | | | $ | 174,875 | | |
Charles Schwab Corp. | | | 1,898 | | | | 137,272 | | |
Intercontinental Exchange, Inc. | | | 831 | | | | 114,191 | | |
Corebridge Financial, Inc. | | | 3,646 | | | | 104,755 | | |
Capital One Financial Corp. | | | 682 | | | | 101,543 | | |
Ally Financial, Inc. | | | 2,300 | | | | 93,353 | | |
State Street Corp. | | | 653 | | | | 50,505 | | |
KKR & Co., Inc. | | | 361 | | | | 36,319 | | |
BlackRock, Inc. | | | 41 | | | | 33,765 | | |
| | | | | | 846,578 | | |
INSURANCE - 4.9% | |
American International Group, Inc. | | | 1,562 | | | | 122,133 | | |
Reinsurance Group of America, Inc. | | | 632 | | | | 121,880 | | |
Willis Towers Watson PLC | | | 298 | | | | 82,005 | | |
| | | | | | 326,018 | | |
BANKS - 2.3% | |
Bank of America Corp. | | | 3,925 | | | | 148,841 | | |
| | | | | | 1,321,437 | | |
CONSUMER DISCRETIONARY - 9.5% | |
AUTOMOBILES & COMPONENTS - 3.8% | |
General Motors Co. | | | 1,852 | | | | 84,006 | | |
BorgWarner, Inc. | | | 2,199 | | | | 76,404 | | |
Thor Industries, Inc. | | | 598 | | | | 70,137 | | |
Phinia, Inc. | | | 366 | | | | 14,060 | | |
Lear Corp. | | | 72 | | | | 10,363 | | |
| | | | | | 254,970 | | |
CONSUMER DISCRETIONARY DISTRIBUTION & RETAIL - 2.9% | |
Amazon.com, Inc. (a) (b) | | | 590 | | | | 106,496 | | |
Lithia Motors, Inc. | | | 296 | | | | 89,145 | | |
| | | | | | 195,641 | | |
CONSUMER SERVICES - 1.6% | |
Wendy's Co. | | | 5,568 | | | | 104,894 | | |
CONSUMER DURABLES & APPAREL - 1.2% | |
Brunswick Corp. | | | 402 | | | | 38,772 | | |
Carter's, Inc. | | | 446 | | | | 37,759 | | |
| | | | | | 76,531 | | |
| | | | | | 632,036 | | |
COMMUNICATION SERVICES - 8.8% | |
MEDIA & ENTERTAINMENT - 8.8% | |
Alphabet, Inc., Class A (a) | | | 1,334 | | | | 201,265 | | |
Charter Communications, Inc., Class A (a) | | | 388 | | | | 112,881 | | |
Comcast Corp., Class A | | | 1,993 | | | | 86,375 | | |
Warner Bros. Discovery, Inc. (a) | | | 7,863 | | | | 68,646 | | |
Interpublic Group of Cos., Inc. | | | 1,973 | | | | 64,376 | | |
Warner Music Group Corp., Class A | | | 1,608 | | | | 53,106 | | |
| | | | | | 586,649 | | |
| | | Shares | | Value | |
HEALTH CARE - 5.4% | |
HEALTH CARE EQUIPMENT & SERVICES - 3.2% | |
Centene Corp. (a) | | | 1,666 | | | $ | 130,709 | | |
Baxter International, Inc. | | | 1,979 | | | | 84,595 | | |
| | | | | | 215,304 | | |
PHARMACEUTICALS, BIOTECHNOLOGY & LIFE SCIENCES - 2.2% | |
IQVIA Holdings, Inc. (a) | | | 532 | | | | 134,462 | | |
Danaher Corp. | | | 45 | | | | 11,237 | | |
| | | | | | 145,699 | | |
| | | | | | 361,003 | | |
INDUSTRIALS - 5.0% | |
CAPITAL GOODS - 3.0% | |
Deere & Co. | | | 282 | | | | 115,829 | | |
Masco Corp. | | | 738 | | | | 58,198 | | |
Carlisle Cos., Inc. | | | 52 | | | | 20,554 | | |
| | | | | | 194,581 | | |
COMMERCIAL & PROFESSIONAL SERVICES - 1.3% | |
OPENLANE, Inc. (a) | | | 2,924 | | | | 50,585 | | |
ABM Industries, Inc. | | | 841 | | | | 37,507 | | |
| | | | | | 88,092 | | |
TRANSPORTATION - 0.7% | |
Delta Air Lines, Inc. | | | 976 | | | | 46,740 | | |
| | | | | | 329,413 | | |
MATERIALS - 4.0% | |
Glencore PLC | | | 22,886 | | | | 125,739 | | |
Corteva, Inc. | | | 1,906 | | | | 109,942 | | |
Sealed Air Corp. | | | 897 | | | | 33,376 | | |
| | | | | | 269,057 | | |
CONSUMER STAPLES - 2.6% | |
CONSUMER STAPLES DISTRIBUTION & RETAIL - 1.5% | |
Kroger Co. | | | 1,775 | | | | 101,417 | | |
HOUSEHOLD & PERSONAL PRODUCTS - 1.1% | |
Kenvue, Inc. | | | 3,207 | | | | 68,824 | | |
| | | | | | 170,241 | | |
ENERGY - 2.5% | |
Phillips 66 | | | 518 | | | | 84,626 | | |
ConocoPhillips | | | 389 | | | | 49,487 | | |
EOG Resources, Inc. | | | 275 | | | | 35,118 | | |
| | | | | | 169,231 | | |
INFORMATION TECHNOLOGY - 1.4% | |
TECHNOLOGY HARDWARE & EQUIPMENT - 1.4% | |
TE Connectivity Ltd. | | | 640 | | | | 92,994 | | |
REAL ESTATE - 0.9% | |
REAL ESTATE MANAGEMENT & DEVELOPMENT - 0.9% | |
Howard Hughes Holdings, Inc. (a) | | | 832 | | | | 60,392 | | |
TOTAL COMMON STOCKS - 60.0%
(COST $2,772,013) | | | | | 3,992,453 | | |
See accompanying Notes to Financial Statements.
Oakmark.com 39
Oakmark Equity and Income Fund March 31, 2024 (Unaudited)
Schedule of Investments (in thousands) (continued)
| | | Shares | | Value | |
PREFERRED STOCKS - 0.1% | |
COMMUNICATION SERVICES - 0.1% | |
Liberty Broadband Corp., Series A (c), 7.00% | | | 224 | | | $ | 5,217 | | |
TOTAL PREFERRED STOCKS - 0.1%
(COST $6,229) | | | | | 5,217 | | |
| | | Par Value | | Value | |
FIXED INCOME - 37.7% | |
CORPORATE BONDS - 15.4% | |
FINANCIALS - 5.4% | |
AerCap Ireland Capital DAC/AerCap
Global Aviation Trust
3.40%, due 10/29/33 | | $ | 15,500 | | | | 13,057 | | |
2.45%, due 10/29/26 | | | 12,500 | | | | 11,608 | | |
5.75%, due 06/06/28 | | | 4,000 | | | | 4,053 | | |
Ally Financial, Inc.
4.70%(5 yr. CMT + 3.868%) (c) (d) | | | 23,750 | | | | 20,362 | | |
6.992%(SOFR + 3.260%),
due 06/13/29 (d) | | | 9,250 | | | | 9,590 | | |
4.70%(7 yr. CMT + 3.481%) (c) (d) | | | 2,000 | | | | 1,586 | | |
Apollo Commercial Real Estate Finance,
Inc., 144A
4.625%, due 06/15/29 (e) | | | 20,373 | | | | 17,115 | | |
Bank of America Corp.
2.551%(SOFR + 1.050%),
due 02/04/28 (d) | | | 13,575 | | | | 12,618 | | |
4.45%, due 03/03/26 | | | 5,000 | | | | 4,925 | | |
Capital One Financial Corp.
7.624% (SOFR + 3.070%),
due 10/30/31 (d) | | | 19,600 | | | | 21,648 | | |
Charles Schwab Corp.
5.853% (SOFR + 2.500%),
due 05/19/34 (d) | | | 23,750 | | | | 24,321 | | |
Citigroup, Inc.
7.625%(5 yr. CMT + 3.211%) (c) (d) | | | 14,500 | | | | 15,223 | | |
3.40%, due 05/01/26 | | | 15,000 | | | | 14,443 | | |
3.352%(3 mo. USD Term
SOFR + 1.158%), due 04/24/25 (d) | | | 6,360 | | | | 6,349 | | |
CNO Financial Group, Inc.
5.25%, due 05/30/25 | | | 5,895 | | | | 5,863 | | |
Equitable Financial Life Global Funding, 144A
1.70%, due 11/12/26 (e) | | | 15,000 | | | | 13,666 | | |
First Citizens BancShares, Inc.
3.375% (3 mo. USD Term
SOFR + 2.465%), due 03/15/30 (d) | | | 15,000 | | | | 14,345 | | |
Goldman Sachs Group, Inc.
1.948%(SOFR + 0.913%),
due 10/21/27 (d) | | | 13,500 | | | | 12,409 | | |
3.814%(3 mo. USD Term
SOFR + 1.420%), due 04/23/29 (d) | | | 7,200 | | | | 6,825 | | |
JPMorgan Chase & Co.
1.47% (SOFR + 0.765%),
due 09/22/27 (d) | | | 31,000 | | | | 28,286 | | |
KKR Group Finance Co. XII LLC, 144A
4.85%, due 05/17/32 (e) | | | 9,000 | | | | 8,698 | | |
LPL Holdings, Inc.
6.75%, due 11/17/28 | | | 14,225 | | | | 14,898 | | |
| | | Par Value | | Value | |
Morgan Stanley
5.164%(SOFR + 1.590%),
due 04/20/29 (d) | | $ | 4,850 | | | $ | 4,846 | | |
5.173%(SOFR + 1.450%),
due 01/16/30 (d) | | | 4,500 | | | | 4,504 | | |
Pershing Square Holdings Ltd., 144A
3.25%, due 11/15/30 (e) | | | 14,000 | | | | 11,774 | | |
Reinsurance Group of America, Inc.
3.95%, due 09/15/26 | | | 4,905 | | | | 4,790 | | |
Rocket Mortgage LLC/Rocket Mortgage
Co-Issuer, Inc., 144A
4.00%, due 10/15/33 (e) | | | 7,075 | | | | 5,993 | | |
Stifel Financial Corp.
4.00%, due 05/15/30 | | | 12,242 | | | | 11,168 | | |
Truist Financial Corp.
5.867% (SOFR + 2.361%),
due 06/08/34 (d) | | | 9,750 | | | | 9,870 | | |
Wells Fargo & Co.
2.393%(SOFR + 2.100%),
due 06/02/28 (d) | | | 11,000 | | | | 10,068 | | |
5.499%(SOFR + 1.780%),
due 01/23/35 (d) | | | 1,350 | | | | 1,353 | | |
5.198%(SOFR + 1.500%),
due 01/23/30 (d) | | | 1,350 | | | | 1,347 | | |
Willis North America, Inc.
5.90%, due 03/05/54 | | | 9,600 | | | | 9,718 | | |
| | | | | | 357,319 | | |
INDUSTRIALS - 3.1% | |
AutoNation, Inc.
3.85%, due 03/01/32 | | | 11,750 | | | | 10,444 | | |
Bacardi Ltd., 144A
4.45%, due 05/15/25 (e) | | | 4,900 | | | | 4,832 | | |
BAT Capital Corp.
2.259%, due 03/25/28 | | | 2,975 | | | | 2,648 | | |
3.557%, due 08/15/27 | | | 1,835 | | | | 1,738 | | |
BAT International Finance PLC
1.668%, due 03/25/26 | | | 4,460 | | | | 4,151 | | |
Boeing Co.
5.805%, due 05/01/50 | | | 25,000 | | | | 23,653 | | |
Carlisle Cos., Inc.
2.20%, due 03/01/32 | | | 21,055 | | | | 16,897 | | |
Fortune Brands Innovations, Inc.
4.00%, due 06/15/25 | | | 13,430 | | | | 13,167 | | |
5.875%, due 06/01/33 | | | 10,000 | | | | 10,203 | | |
GXO Logistics, Inc.
1.65%, due 07/15/26 | | | 6,750 | | | | 6,189 | | |
Hilton Domestic Operating Co., Inc., 144A
3.625%, due 02/15/32 (e) | | | 18,500 | | | | 15,929 | | |
3.75%, due 05/01/29 (e) | | | 9,000 | | | | 8,256 | | |
Howmet Aerospace, Inc.
3.00%, due 01/15/29 | | | 23,560 | | | | 21,275 | | |
JBS USA LUX SA/JBS USA Food Co./JBS
Luxembourg SARL, 144A
6.75%, due 03/15/34 (e) | | | 3,750 | | | | 3,940 | | |
JBS USA LUX SA/JBS USA Food Co./JBS
USA Finance, Inc.
5.75%, due 04/01/33 | | | 5,000 | | | | 4,926 | | |
Lennox International, Inc.
1.35%, due 08/01/25 | | | 2,000 | | | | 1,892 | | |
Stanley Black & Decker, Inc.
2.30%, due 03/15/30 | | | 31,350 | | | | 26,540 | | |
See accompanying Notes to Financial Statements.
40 OAKMARK FUNDS
Oakmark Equity and Income Fund March 31, 2024 (Unaudited)
Schedule of Investments (in thousands) (continued)
| | | Par Value | | Value | |
FIXED INCOME - 37.7% (continued) | |
CORPORATE BONDS - 15.4% (continued) | |
United Parcel Service, Inc.
4.875%, due 03/03/33 | | $ | 6,350 | | | $ | 6,358 | | |
Viterra Finance BV, 144A
5.25%, due 04/21/32 (e) | | | 13,150 | | | | 12,955 | | |
2.00%, due 04/21/26 (e) | | | 11,400 | | | | 10,588 | | |
| | | | | | 206,581 | | |
CONSUMER DISCRETIONARY - 2.2% | |
AutoNation, Inc.
1.95%, due 08/01/28 | | | 4,940 | | | | 4,275 | | |
Brunswick Corp.
2.40%, due 08/18/31 | | | 35,813 | | | | 28,515 | | |
CCO Holdings LLC/CCO Holdings
Capital Corp., 144A
4.75%, due 03/01/30 (e) | | | 2,980 | | | | 2,559 | | |
5.125%, due 05/01/27 (e) | | | 250 | | | | 238 | | |
Charter Communications Operating LLC/
Charter Communications
Operating Capital
4.20%, due 03/15/28 | | | 9,950 | | | | 9,378 | | |
Expedia Group, Inc.
4.625%, due 08/01/27 | | | 13,576 | | | | 13,318 | | |
5.00%, due 02/15/26 | | | 4,334 | | | | 4,309 | | |
Lear Corp.
2.60%, due 01/15/32 | | | 6,935 | | | | 5,690 | | |
Lithia Motors, Inc., 144A
3.875%, due 06/01/29 (e) | | | 8,540 | | | | 7,696 | | |
4.625%, due 12/15/27 (e) | | | 2,980 | | | | 2,862 | | |
M/I Homes, Inc.
3.95%, due 02/15/30 | | | 7,100 | | | | 6,383 | | |
Marriott International, Inc.
2.75%, due 10/15/33 | | | 13,750 | | | | 11,175 | | |
4.625%, due 06/15/30 | | | 9,400 | | | | 9,145 | | |
MGM Resorts International
4.75%, due 10/15/28 | | | 13,875 | | | | 13,196 | | |
Raising Cane's Restaurants LLC, 144A
9.375%, due 05/01/29 (e) | | | 600 | | | | 648 | | |
Tapestry, Inc.
7.85%, due 11/27/33 | | | 4,150 | | | | 4,504 | | |
Thor Industries, Inc., 144A
4.00%, due 10/15/29 (e) | | | 17,250 | | | | 15,431 | | |
ZF North America Capital, Inc., 144A
6.875%, due 04/14/28 (e) | | | 9,250 | | | | 9,594 | | |
| | | | | | 148,916 | | |
ENERGY - 1.5% | |
Apache Corp.
5.35%, due 07/01/49 | | | 10,000 | | | | 8,453 | | |
Cheniere Energy, Inc., 144A
5.65%, due 04/15/34 (e) | | | 850 | | | | 856 | | |
Chesapeake Energy Corp., 144A
5.875%, due 02/01/29 (e) | | | 14,525 | | | | 14,406 | | |
6.75%, due 04/15/29 (e) | | | 8,000 | | | | 8,086 | | |
Florida Gas Transmission Co. LLC, 144A
2.30%, due 10/01/31 (e) | | | 14,750 | | | | 11,947 | | |
Hess Midstream Operations LP, 144A
4.25%, due 02/15/30 (e) | | | 20,000 | | | | 18,378 | | |
Parsley Energy LLC/Parsley Finance Corp., 144A
4.125%, due 02/15/28 (e) | | | 26,312 | | | | 25,092 | | |
| | | Par Value | | Value | |
Patterson-UTI Energy, Inc.
7.15%, due 10/01/33 | | $ | 10,000 | | | $ | 10,750 | | |
| | | | | | 97,968 | | |
REAL ESTATE - 1.2% | |
Alexandria Real Estate Equities, Inc.
4.75%, due 04/15/35 | | | 9,892 | | | | 9,348 | | |
CBRE Services, Inc.
5.50%, due 04/01/29 | | | 10,000 | | | | 10,060 | | |
2.50%, due 04/01/31 | | | 10,750 | | | | 8,896 | | |
Cushman & Wakefield U.S. Borrower LLC, 144A
6.75%, due 05/15/28 (e) | | | 15,000 | | | | 14,812 | | |
GLP Capital LP/GLP Financing II, Inc.
4.00%, due 01/15/31 | | | 9,425 | | | | 8,410 | | |
5.75%, due 06/01/28 | | | 4,975 | | | | 4,979 | | |
5.25%, due 06/01/25 | | | 4,975 | | | | 4,943 | | |
5.375%, due 04/15/26 | | | 3,925 | | | | 3,891 | | |
Howard Hughes Corp., 144A
4.375%, due 02/01/31 (e) | | | 4,250 | | | | 3,691 | | |
5.375%, due 08/01/28 (e) | | | 3,400 | | | | 3,261 | | |
RHP Hotel Properties LP/RHP Finance Corp.,
144A 4.50%, due 02/15/29 (e) | | | 10,875 | | | | 10,154 | | |
| | | | | | 82,445 | | |
MATERIALS - 0.5% | |
Anglo American Capital PLC, 144A
2.25%, due 03/17/28 (e) | | | 18,750 | | | | 16,664 | | |
3.875%, due 03/16/29 (e) | | | 1,000 | | | | 935 | | |
Glencore Funding LLC, 144A
2.625%, due 09/23/31 (e) | | | 10,000 | | | | 8,335 | | |
3.875%, due 10/27/27 (e) | | | 4,950 | | | | 4,722 | | |
| | | | | | 30,656 | | |
CONSUMER STAPLES - 0.4% | |
Dollar General Corp.
5.45%, due 07/05/33 | | | 15,000 | | | | 15,047 | | |
Imperial Brands Finance PLC, 144A
6.125%, due 07/27/27 (e) | | | 4,000 | | | | 4,081 | | |
Philip Morris International, Inc.
5.25%, due 02/13/34 | | | 8,750 | | | | 8,672 | | |
| | | | | | 27,800 | | |
HEALTH CARE - 0.4% | |
Embecta Corp., 144A
5.00%, due 02/15/30 (e) | | | 18,102 | | | | 14,788 | | |
Humana, Inc.
5.375%, due 04/15/31 | | | 1,650 | | | | 1,651 | | |
Universal Health Services, Inc.
1.65%, due 09/01/26 | | | 7,750 | | | | 7,063 | | |
| | | | | | 23,502 | | |
COMMUNICATION SERVICES - 0.3% | |
Charter Communications Operating LLC/
Charter Communications
Operating Capital
2.30%, due 02/01/32 | | | 8,665 | | | | 6,685 | | |
4.908%, due 07/23/25 | | | 2,985 | | | | 2,949 | | |
Meta Platforms, Inc.
4.95%, due 05/15/33 | | | 10,000 | | | | 10,122 | | |
| | | | | | 19,756 | | |
See accompanying Notes to Financial Statements.
Oakmark.com 41
Oakmark Equity and Income Fund March 31, 2024 (Unaudited)
Schedule of Investments (in thousands) (continued)
| | | Par Value | | Value | |
FIXED INCOME - 37.7% (continued) | |
CORPORATE BONDS - 15.4% (continued) | |
UTILITIES - 0.2% | |
NRG Energy, Inc., 144A
7.00%, due 03/15/33 (e) | | $ | 2,400 | | | $ | 2,561 | | |
Southern Co.
3.75% (5 yr. CMT + 2.915%),
due 09/15/51 (d) | | | 13,750 | | | | 12,853 | | |
| | | | | | 15,414 | | |
INFORMATION TECHNOLOGY - 0.2% | |
Apple, Inc.
2.65%, due 02/08/51 | | | 6,000 | | | | 3,950 | | |
Broadcom, Inc., 144A
3.469%, due 04/15/34 (e) | | | 9,955 | | | | 8,531 | | |
| | | | | | 12,481 | | |
Total Corporate Bonds
(Cost $1,080,431) | | | | | 1,022,838 | | |
GOVERNMENT AND AGENCY SECURITIES - 8.6% | |
U.S. GOVERNMENT NOTES - 5.3% | |
U.S. Treasury Notes
3.125%, due 08/15/25 | | | 142,000 | | | | 138,766 | | |
2.25%, due 11/15/24 | | | 75,000 | | | | 73,641 | | |
2.875%, due 05/15/32 | | | 75,000 | | | | 68,095 | | |
3.50%, due 02/15/33 | | | 50,000 | | | | 47,353 | | |
3.75%, due 12/31/28 | | | 25,000 | | | | 24,467 | | |
| | | | | | 352,322 | | |
U.S. GOVERNMENT BONDS - 3.3% | |
U.S. Treasury Bonds
2.75%, due 08/15/42 | | | 90,000 | | | | 70,626 | | |
3.625%, due 02/15/53 | | | 75,000 | | | | 65,859 | | |
3.875%, due 02/15/43 | | | 50,000 | | | | 46,221 | | |
3.00%, due 08/15/52 | | | 45,000 | | | | 34,954 | | |
| | | | | | 217,660 | | |
Total Government and Agency Securities
(Cost $607,268) | | | | | 569,982 | | |
COLLATERALIZED MORTGAGE OBLIGATIONS - 4.3% | |
Federal Home Loan Mortgage Corp.
Multifamily Structured Pass-Through
Certificates, Series K-159-Class A2
4.50%, due 07/25/33 (d) | | | 41,800 | | | | 41,223 | | |
Federal Home Loan Mortgage Corp.
Multifamily Structured Pass Through
Certificates, Series K-147-Class A2
3.00%, due 06/25/32 (d) | | | 40,000 | | | | 35,492 | | |
Federal Home Loan Mortgage Corp.
Multifamily Structured Pass Through
Certificates, Series K-155-Class A2
4.25%, due 04/25/33 | | | 27,000 | | | | 26,144 | | |
Federal Home Loan Mortgage Corp.
Multifamily Structured Pass Through
Certificates, Series K-1522-Class A2
2.361%, due 10/25/36 | | | 32,850 | | | | 25,285 | | |
| | | Par Value | | Value | |
Federal Home Loan Mortgage Corp.
Multifamily Structured
Pass-Through Certificates,
Series K-148-Class A2
3.50%, due 07/25/32 (d) | | $ | 20,000 | | | $ | 18,406 | | |
Bank, Series 2022-BNK40-Class A4
3.394%, due 03/15/64 (d) | | | 17,000 | | | | 15,176 | | |
Federal Home Loan Mortgage Corp.
STACR REMICS Trust,
Series 2022-DNA5-Class M1A, 144A
8.27% (30 day USD SOFR Average +
2.950%), due 06/25/42 (d) (e) | | | 13,200 | | | | 13,547 | | |
Federal Home Loan Mortgage Corp.
Multifamily Structured Pass Through
Certificates, Series K-145-Class A2
2.58%, due 05/25/32 | | | 15,600 | | | | 13,421 | | |
Chase Home Lending Mortgage Trust,
Series 2024-1-Class B1, 144A
6.725%, due 01/25/55 (d) (e) | | | 12,673 | | | | 13,234 | | |
JP Morgan Mortgage Trust,
Series 2024-2-Class B1, 144A
7.449%, due 08/25/54 (d) (e) | | | 10,060 | | | | 11,004 | | |
Federal Home Loan Mortgage Corp.
STACR REMICS Trust,
Series 2022-DNA6- Class M1A, 144A
7.47% (30 day USD SOFR Average +
2.150%), due 09/25/42 (d) (e) | | | 10,222 | | | | 10,350 | | |
Federal National Mortgage Association
Connecticut Avenue Securities,
Series 2022-R06-Class 1M1, 144A
8.07% (30 day USD SOFR Average +
2.750%), due 05/25/42 (d) (e) | | | 9,251 | | | | 9,494 | | |
JP Morgan Mortgage Trust,
Series 2021-10-Class B1, 144A
2.806%, due 12/25/51 (d) (e) | | | 9,971 | | | | 7,876 | | |
JP Morgan Mortgage Trust,
Series 2024-2-Class B2, 144A
7.449%, due 08/25/54 (d) (e) | | | 7,302 | | | | 7,778 | | |
Federal Home Loan Mortgage Corp.
STACR REMICS Trust,
Series 2022-DNA1-Class M1A, 144A
6.32% (30 day USD SOFR Average +
1.000%), due 01/25/42 (d) (e) | | | 6,757 | | | | 6,756 | | |
GS Mortgage-Backed Securities
Trust, Series 2021-PJ6-Class B1, 144A
2.68%, due 11/25/51 (d) (e) | | | 7,272 | | | | 5,763 | | |
JP Morgan Mortgage Trust,
Series 2022-6-Class B1, 144A
3.305%, due 11/25/52 (d) (e) | | | 4,574 | | | | 3,756 | | |
Federal Home Loan Mortgage Corp.
Multifamily Structured Pass Through
Certificates, Series K-1521-Class A2
2.184%, due 08/25/36 | | | 5,000 | | | | 3,756 | | |
Federal Home Loan Mortgage Corp.
STACR REMICS Trust,
Series 2022-DNA3-Class M1A, 144A
7.32% (30 day USD SOFR Average +
2.000%), due 04/25/42 (d) (e) | | | 3,048 | | | | 3,087 | | |
Bank, Series 2022-BNK40-Class AS
3.394%, due 03/15/64 (d) | | | 3,500 | | | | 2,985 | | |
Federal Home Loan Mortgage Corp.
Multifamily Structured Pass Through
Certificates, Series K-1517-Class A2
1.716%, due 07/25/35 | | | 4,000 | | | | 2,939 | | |
See accompanying Notes to Financial Statements.
42 OAKMARK FUNDS
Oakmark Equity and Income Fund March 31, 2024 (Unaudited)
Schedule of Investments (in thousands) (continued)
| | | Par Value | | Value | |
FIXED INCOME - 37.7% (continued) | |
COLLATERALIZED MORTGAGE OBLIGATIONS - 4.3% (continued) | |
Sequoia Mortgage Trust,
Series 2021-9-Class B2, 144A
2.86%, due 01/25/52 (d) (e) | | $ | 2,846 | | | $ | 2,283 | | |
GS Mortgage-Backed Securities Trust,
Series 2021-PJ8-Class B1, 144A
2.763%, due 01/25/52 (d) (e) | | | 1,519 | | | | 1,209 | | |
Federal National Mortgage Association
Connecticut Avenue Securities,
Series 2022-R03-Class 1M1, 144A
7.42% (30 day USD SOFR Average +
2.100%), due 03/25/42 (d) (e) | | | 1,105 | | | | 1,121 | | |
JP Morgan Mortgage Trust,
Series 2022-3-Class B1, 144A
3.106%, due 08/25/52 (d) (e) | | | 884 | | | | 705 | | |
Total Collateralized Mortgage
Obligations - 4.3%
(Cost $288,588) | | | | | 282,790 | | |
ASSET BACKED SECURITIES - 4.2% | |
Ford Credit Auto Owner Trust,
Series 2023-B-Class C,
5.71%, due 12/15/30 | | | 11,410 | | | | 11,449 | | |
CCG Receivables Trust,
Series 2023-1-Class B, 144A,
5.99%, due 09/16/30 (e) | | | 10,000 | | | | 10,025 | | |
Ford Credit Auto Owner Trust,
Series 2023-A-Class C,
5.51%, due 09/15/30 | | | 10,000 | | | | 9,951 | | |
Santander Drive Auto Receivables
Trust, Series 2022-3-Class C,
4.49%, due 08/15/29 | | | 10,000 | | | | 9,809 | | |
Carvana Auto Receivables Trust,
Series 2021-N2-Class E, 144A,
2.90%, due 03/10/28 (e) | | | 10,391 | | | | 9,707 | | |
CPS Auto Receivables Trust,
Series 2023-D-Class D, 144A,
7.80%, due 01/15/30 (e) | | | 9,237 | | | | 9,687 | | |
GreatAmerica Leasing Receivables
Funding LLC,
Series 2022-1-Class B, 144A,
5.74%, due 07/16/29 (e) | | | 9,500 | | | | 9,495 | | |
GM Financial Consumer Automobile
Receivables Trust, Series 2023-4-Class C,
6.41%, due 05/16/29 | | | 8,750 | | | | 9,014 | | |
CarMax Auto Owner Trust,
Series 2023-1-Class D,
6.27%, due 11/15/29 | | | 8,500 | | | | 8,603 | | |
HPEFS Equipment Trust,
Series 2023-2A-Class-C, 144A,
6.48%, due 01/21/31 (e) | | | 8,000 | | | | 8,105 | | |
CCG Receivables Trust,
Series 2023-1-Class C, 144A,
6.28%, due 09/16/30 (e) | | | 8,000 | | | | 8,038 | | |
Sierra Timeshare Receivables
Funding LLC,
Series 2024-1A-Class C, 144A,
5.94%, due 01/20/43 (e) | | | 7,750 | | | | 7,716 | | |
CPS Auto Receivables Trust,
Series 2022-B-Class E, 144A,
7.14%, due 10/15/29 (e) | | | 7,250 | | | | 7,231 | | |
| | | Par Value | | Value | |
GreatAmerica Leasing Receivables
Funding LLC,
Series 2022-1-Class C, 144A,
5.98%, due 07/15/30 (e) | | $ | 7,250 | | | $ | 7,214 | | |
LAD Auto Receivables Trust,
Series 2022-1A-Class A, 144A,
5.21%, due 06/15/27 (e) | | | 7,176 | | | | 7,157 | | |
CPS Auto Receivables Trust,
Series 2022-A-Class E, 144A,
4.88%, due 04/16/29 (e) | | | 7,500 | | | | 7,106 | | |
Carmax Auto Owner Trust,
Series 2023-3-Class C,
5.61%, due 02/15/29 | | | 6,330 | | | | 6,332 | | |
Ford Credit Auto Owner Trust,
Series 2022-D-Class C,
6.46%, due 05/15/30 | | | 6,050 | | | | 6,198 | | |
Sierra Timeshare Receivables
Funding LLC,
Series 2023-3A-Class C, 144A,
7.12%, due 09/20/40 (e) | | | 5,964 | | | | 6,019 | | |
Ford Credit Auto Owner Trust,
Series 2022-C-Class C,
5.22%, due 03/15/30 | | | 6,000 | | | | 5,987 | | |
CarMax Auto Owner Trust,
Series 2023-1-Class C,
5.19%, due 01/16/29 | | | 6,000 | | | | 5,958 | | |
Santander Drive Auto Receivables Trust,
Series 2022-5-Class C,
4.74%, due 10/16/28 | | | 5,750 | | | | 5,681 | | |
HPEFS Equipment Trust,
Series 2022-3A-Class-C, 144A,
6.13%, due 08/20/29 (e) | | | 5,500 | | | | 5,517 | | |
Sierra Timeshare Receivables
Funding LLC,
Series 2023-2A-Class C, 144A,
7.30%, due 04/20/40 (e) | | | 5,024 | | | | 5,103 | | |
Carvana Auto Receivables Trust,
Series 2023-P2-Class C, 144A,
5.84%, due 07/10/29 (e) | | | 4,982 | | | | 4,958 | | |
Carvana Auto Receivables Trust,
Series 2023-P4-Class D, 144A,
7.37%, due 10/10/30 (e) | | | 4,740 | | | | 4,950 | | |
CCG Receivables Trust,
Series 2022-1-Class B, 144A,
4.42%, due 07/16/29 (e) | | | 5,000 | | | | 4,874 | | |
CPS Auto Receivables Trust,
Series 2023-C-Class D, 144A,
6.77%, due 10/15/29 (e) | | | 4,750 | | | | 4,859 | | |
CarMax Auto Owner Trust,
Series 2022-2-Class D,
4.75%, due 10/16/28 | | | 5,000 | | | | 4,858 | | |
HPEFS Equipment Trust,
Series 2023-2A-Class-D, 144A,
6.97%, due 07/21/31 (e) | | | 4,750 | | | | 4,834 | | |
Carvana Auto Receivables Trust,
Series 2023-P2-Class D, 144A,
6.72%, due 06/10/30 (e) | | | 4,000 | | | | 4,076 | | |
CPS Auto Receivables Trust,
Series 2023-C-Class E, 144A,
9.66%, due 02/18/31 (e) | | | 3,750 | | | | 3,955 | | |
GreatAmerica Leasing Receivables
Funding LLC,
Series 2023-1-Class B, 144A,
5.21%, due 03/15/30 (e) | | | 4,000 | | | | 3,945 | | |
See accompanying Notes to Financial Statements.
Oakmark.com 43
Oakmark Equity and Income Fund March 31, 2024 (Unaudited)
Schedule of Investments (in thousands) (continued)
| | | Par Value | | Value | |
FIXED INCOME - 37.7% (continued) | |
ASSET BACKED SECURITIES - 4.2% (continued) | |
CarMax Auto Owner Trust,
Series 2023-2-Class C,
5.57%, due 11/15/28 | | $ | 3,750 | | | $ | 3,737 | | |
GreatAmerica Leasing Receivables
Funding LLC,
Series 2024-1-Class B, 144A,
5.18%, due 12/16/30 (e) | | | 3,700 | | | | 3,688 | | |
CarMax Auto Owner Trust,
Series 2023-2-Class D,
6.55%, due 10/15/29 | | | 3,610 | | | | 3,645 | | |
CPS Auto Receivables Trust,
Series 2024-A-Class D, 144A,
6.13%, due 04/15/30 (e) | | | 3,200 | | | | 3,211 | | |
CPS Auto Receivables Trust,
Series 2022-C-Class E, 144A,
9.08%, due 04/15/30 (e) | | | 3,000 | | | | 3,111 | | |
CPS Auto Receivables Trust,
Series 2024-A-Class E, 144A,
8.42%, due 08/15/31 (e) | | | 3,100 | | | | 3,110 | | |
Carmax Auto Owner Trust,
Series 2023-3-Class D,
6.44%, due 12/16/30 | | | 3,000 | | | | 3,022 | | |
GreatAmerica Leasing Receivables
Funding LLC,
Series 2023-1-Class C, 144A,
5.50%, due 03/17/31 (e) | | | 3,000 | | | | 2,950 | | |
CCG Receivables Trust,
Series 2022-1-Class C, 144A,
4.67%, due 07/16/29 (e) | | | 3,000 | | | | 2,924 | | |
Sierra Timeshare Receivables
Funding LLC,
Series 2023-2A-Class D, 144A,
9.72%, due 04/20/40 (e) | | | 2,772 | | | | 2,827 | | |
Carvana Auto Receivables
Trust, Series 2023-P3-Class B, 144A,
5.97%, due 09/10/29 (e) | | | 2,750 | | | | 2,786 | | |
Carvana Auto Receivables Trust,
Series 2023-P3-Class C, 144A,
6.09%, due 11/13/29 (e) | | | 2,675 | | | | 2,710 | | |
Sierra Timeshare Receivables
Funding LLC,
Series 2024-1A-Class D, 144A,
8.02%, due 01/20/43 (e) | | | 2,300 | | | | 2,293 | | |
CCG Receivables Trust,
Series 2023-2-Class C, 144A,
6.45%, due 04/14/32 (e) | | | 2,033 | | | | 2,067 | | |
GreatAmerica Leasing Receivables
Funding LLC,
Series 2024-1-Class C, 144A,
5.43%, due 12/15/31 (e) | | | 1,950 | | | | 1,944 | | |
Santander Drive Auto Receivables Trust,
Series 2024-1-Class C,
5.45%, due 03/15/30 | | | 1,250 | | | | 1,246 | | |
Carvana Auto Receivables Trust,
Series 2022-P1-Class D,
4.80%, due 01/10/29 | | | 1,247 | | | | 1,199 | | |
Carvana Auto Receivables
Trust, Series 2020-P1-Class D,
1.82%, due 09/08/27 | | | 1,250 | | | | 1,161 | | |
Carvana Auto Receivables Trust,
Series 2023-P3-Class D, 144A,
6.82%, due 08/12/30 (e) | | | 1,000 | | | | 1,039 | | |
| | | Par Value | | Value | |
Sierra Timeshare Receivables
Funding LLC,
Series 2022-2A-Class C, 144A,
6.36%, due 06/20/40 (e) | | $ | 788 | | | $ | 781 | | |
Carvana Auto Receivables Trust,
Series 2021-P2-Class D,
2.02%, due 05/10/28 | | | 605 | | | | 544 | | |
Sierra Timeshare Receivables
Funding LLC,
Series 2022-2A-Class D, 144A,
9.22%, due 06/20/40 (e) | | | 394 | | | | 396 | | |
Carvana Auto Receivables Trust,
Series 2023-P4-Class N, 144A,
8.05%, due 10/10/30 (e) | | | 188 | | | | 188 | | |
Total Asset Backed Securities
(Cost $275,609) | | | | | 278,990 | | |
MORTGAGE-BACKED SECURITIES - 3.1% | |
Federal National Mortgage Association,
Pool FS3883 4.50%, due 02/01/53 | | | 39,621 | | | | 37,747 | | |
Federal National Mortgage Association,
Pool CB4555 4.50%, due 09/01/52 | | | 34,883 | | | | 33,223 | | |
Federal National Mortgage Association,
Pool BW9842 4.50%, due 09/01/52 | | | 30,119 | | | | 28,858 | | |
Federal Home Loan Mortgage Corp.,
Pool QD3619 2.50%, due 12/01/51 | | | 29,353 | | | | 24,324 | | |
Federal Home Loan Mortgage Corp.,
Pool RA8038 4.50%, due 10/01/52 | | | 20,294 | | | | 19,333 | | |
Federal National Mortgage Association,
Pool FS5296 4.50%, due 05/01/53 | | | 14,897 | | | | 14,185 | | |
Federal Home Loan Mortgage Corp.,
Pool SD2473 5.00%, due 02/01/53 | | | 12,722 | | | | 12,414 | | |
Federal Home Loan Mortgage Corp.,
Pool SD1724 4.00%, due 09/01/52 | | | 9,252 | | | | 8,589 | | |
Federal National Mortgage Association,
Pool MA4700 4.00%, due 08/01/52 | | | 9,182 | | | | 8,516 | | |
Federal National Mortgage Association,
Pool FM8692 2.50%, due 09/01/51 | | | 8,831 | | | | 7,303 | | |
Federal National Mortgage Association,
Pool MA4464 1.50%, due 11/01/51 | | | 7,488 | | | | 5,643 | | |
Federal Home Loan Mortgage Corp.,
Pool RA7522 4.50%, due 06/01/52 | | | 5,887 | | | | 5,606 | | |
Federal Home Loan Mortgage Corp.,
Pool SD8149 1.50%, due 06/01/51 | | | 1,909 | | | | 1,439 | | |
Total Mortgage-Backed Securities - 3.1%
(Cost $211,358) | | | | | 207,180 | | |
BANK LOANS - 2.0% (f) | |
FINANCIALS - 0.5% | |
GTCR W Merger Sub LLC USD Term Loan B
8.309% (1 mo. USD Term SOFR +
3.000%), due 01/31/31 (d) | | | 15,000 | | | | 15,041 | | |
Citadel Securities LP 2024 Term Loan B
7.577% (1 mo. USD Term
SOFR + 2.250%), due 07/29/30 (d) | | | 19,827 | | | | 19,801 | | |
| | | | | | 34,842 | | |
CONSUMER DISCRETIONARY - 0.5% | |
Peer Holding III BV 2023 Term Loan B4
8.559% (3 mo. USD Term
SOFR + 3.250%), due 10/28/30 (d) | | | 8,900 | | | | 8,911 | | |
See accompanying Notes to Financial Statements.
44 OAKMARK FUNDS
Oakmark Equity and Income Fund March 31, 2024 (Unaudited)
Schedule of Investments (in thousands) (continued)
| | | Par Value | | Value | |
FIXED INCOME - 37.7% (continued) | |
BANK LOANS - 2.0% (f) (continued) | |
Wand Newco 3, Inc. 2024 Term Loan B
9.08% (1 mo. USD Term
SOFR + 3.750%), due 01/30/31 (d) | | $ | 25,000 | | | $ | 25,059 | | |
| | | | | | 33,970 | | |
INDUSTRIALS - 0.4% | |
Vestis Corp. Term Loan
7.576% (3 mo. USD Term
SOFR + 2.250%), due 02/22/31 (d) | | | 2,500 | | | | 2,497 | | |
Uber Technologies, Inc. 2023 Term Loan B
8.079% (3 mo. USD Term
SOFR + 2.750%), due 03/03/30 (d) | | | 12,694 | | | | 12,743 | | |
Skymiles IP Ltd. 2020 Term Loan B
9.068% (3 mo. USD Term
SOFR + 3.750%), due 10/20/27 (d) | | | 10,500 | | | | 10,819 | | |
| | | | | | 26,059 | | |
HEALTH CARE - 0.4% | |
Medline Borrower LP 2024 Term Loan B
8.079% (3 mo. USD Term
SOFR + 2.750%), due 10/23/28 (d) | | | 20,205 | | | | 20,247 | | |
Fortrea Holdings, Inc. Term Loan B
9.08% (1 mo. USD Term
SOFR + 3.750%), due 07/01/30 (d) | | | 4,963 | | | | 4,975 | | |
| | | | | | 25,222 | | |
ENERGY - 0.2% | |
ChampionX Corp. 2022 Term Loan B2
8.18% (1 mo. USD Term
SOFR + 2.750%), due 06/07/29 (d) | | | 16,294 | | | | 16,343 | | |
Total Bank Loans
(Cost $135,762) | | | | | 136,436 | | |
CONVERTIBLE BOND - 0.1% | |
HEALTH CARE - 0.1% | |
Envista Holdings Corp., 144A (e) | | | 9,900 | | | | 8,706 | | |
Total Convertible Bond
(Cost $8,800) | | | | | 8,706 | | |
TOTAL FIXED INCOME - 37.7%
(COST $2,607,816) | | | | | 2,506,922 | | |
SHORT-TERM INVESTMENTS - 2.9% | |
REPURCHASE AGREEMENT - 2.9% | |
Fixed Income Clearing Corp. Repurchase
Agreement, 5.32% dated 03/28/24 due
04/01/24, repurchase price $194,171,
collateralized by United States Treasury
Notes, 4.000% - 4.250% due 12/15/25 -
02/15/54, aggregate value plus accrued
interest of $197,937 (Cost: $194,056) | | | 194,056 | | | | 194,056 | | |
TOTAL SHORT-TERM INVESTMENTS - 2.9%
(COST $194,056) | | | | | 194,056 | | |
TOTAL INVESTMENTS - 100.7%
(COST $5,580,114) | | | | | 6,698,648 | | |
Liabilities In Excess of Other Assets - (0.7)% | | | | | (49,598 | ) | |
NET ASSETS - 100.0% | | | | $ | 6,649,050 | | |
(a) Non-income producing security.
(b) All or a portion of this investment is held in connection with one or more options within the Fund.
(c) Security is perpetual and has no stated maturity date.
(d) Floating Rate Note. Rate shown is as of March 31, 2024.
(e) Security exempt from registration under Rule 144A of the Securities Act of 1933, as amended. These securities may be resold, normally only to qualified institutional buyers.
(f) Bank loans generally are subject to mandatory and/or optional prepayment. As a result, the actual remaining maturity of bank loans may be substantially less than the stated maturities shown.
Abbreviations:
REIT: Real Estate Investment Trust
SOFR: Secured Overnight Financing Rate
See accompanying Notes to Financial Statements.
Oakmark.com 45
Oakmark Equity and Income Fund March 31, 2024 (Unaudited)
Schedule of Investments (in thousands) (continued)
WRITTEN OPTIONS
Description | | Exercise
Price | | Expiration
Date | | Number of
Contracts | | Notional
Amount | | Market
Value | | Premiums
(Received)
by Fund | | Unrealized
Gain/(Loss) | |
CALLS | |
Amazon.com, Inc. | | $ | 195.00 | | | 5/17/24 | | | (2,000 | ) | | $ | (36,076 | ) | | $ | (770 | ) | | $ | (720 | ) | | $ | (50 | ) | |
| | | | | | | | | $ | (36,076 | ) | | $ | (770 | ) | | $ | (720 | ) | | $ | (50 | ) | |
See accompanying Notes to Financial Statements.
46 OAKMARK FUNDS

This page intentionally left blank.
Oakmark.com 47
Oakmark Bond Fund March 31, 2024
Summary Information
VALUE OF A $250,000 INVESTMENT
Since Inception - 06/10/20 (Unaudited)

PERFORMANCE
| | | | | Average Annual Total Returns (as of 03/31/24) | | | |
| (Unaudited) | | Total Return
Last 3 Months | | 1-year | | 3-year | | 5-year | | 10-year | | Since
Inception | | Inception
Date | |
Oakmark Bond Fund (Institutional Class) | | | 0.38 | % | | | 5.50 | % | | | -0.87 | % | | | N/A | | | | N/A | | | | 0.28 | % | | 06/10/20 | |
Bloomberg U.S. Aggregate Bond Index | | | -0.78 | % | | | 1.70 | % | | | N/A | | | | N/A | | | | N/A | | | | -2.38 | % | | | |
Lipper Core Plus Bond Fund Index36 | | | -0.23 | % | | | 2.81 | % | | | N/A | | | | N/A | | | | N/A | | | | -1.46 | % | | | |
Oakmark Bond Fund (Advisor Class) | | | 0.26 | % | | | 5.47 | % | | | -0.87 | % | | | N/A | | | | N/A | | | | 0.24 | % | | 06/10/20 | |
Oakmark Bond Fund (R6 Class) | | | 0.42 | % | | | 5.49 | % | | | -0.76 | % | | | N/A | | | | N/A | | | | -0.86 | % | | 12/15/20 | |
Oakmark Bond Fund (Investor Class) | | | 0.34 | % | | | 5.29 | % | | | N/A | | | | N/A | | | | N/A | | | | -1.46 | % | | 01/28/22 | |
The table above does not reflect the deduction of taxes that a shareholder would pay on Fund distributions or the redemption of Fund shares.
Past performance is no guarantee of future results. The performance data quoted represents past performance. Current performance may be lower or higher than the performance data quoted. Total return includes change in share prices and, in each case, includes reinvestment of dividends and capital gain distributions. The investment return and principal value vary so that an investor's shares, when redeemed, may be worth more or less than the original cost. To obtain the most recent month-end performance, please visit Oakmark.com.
TOP TEN FIXED INCOME HOLDINGS9 | | % of Net Assets | |
FN MA4182 2.000% Due 11-01-50 | | | 2.6 | % | |
FHMS K1522 A2 2.361% Due 10-25-36 | | | 2.6 | % | |
FN CB2773 2.000% Due 02-01-52 | | | 2.6 | % | |
FHMS K-1515 A2 1.940% Due 02-25-35 | | | 2.6 | % | |
FHMS K-1521 A2 2.184% Due 08-25-36 | | | 2.6 | % | |
FN FS6468 5.000% Due 10-01-53 | | | 2.5 | % | |
FN BW9855 5.000% Due 09-01-52 | | | 2.4 | % | |
US Treasury Note 4.000% Due 01-31-31 | | | 2.0 | % | |
US Treasury Note 2.875% Due 05-15-32 | | | 1.8 | % | |
US Treasury Note 3.500% Due 01-31-30 | | | 1.6 | % | |
FUND STATISTICS | |
Ticker* | | OANCX | |
Number of Fixed Income Holdings | | 142 | |
Net Assets | | $154.0 million | |
Weighted Average Maturity | | 13.92 | |
Effective Duration | | 5.85 | |
30-Day SEC Yield-Unsubsidized | | 4.79% | |
30-Day SEC Yield-Subsidized | | 5.08% | |
Gross Expense Ratio - Institutional Class*^ | | 1.33% | |
Net Expense Ratio - Investor Class*+† | | 0.74% | |
* This information is related to the Institutional Class. Please visit Oakmark.com for information related to the Advisor, R6 and Investor Classes.
† The net expense ratio reflects an expense limitation agreement through January 27, 2025.
@ SEC Yield is an annualization of the Fund's net investment income for the trailing 30-day period. Dividends paid by the Fund may be higher or lower than implied by the SEC Yield.
^ The Expense Ratio is from the Fund's prospectus dated January 28, 2024. The actual Gross and Net Expense Ratios for the period can be found in the Financial Highlights section of this report.
SECTOR ALLOCATION | | % of Net Assets | |
Corporate Bonds | | | 38.1 | | |
Government and Agency Securities | | | 15.6 | | |
Collateralized Mortgage Obligations | | | 14.4 | | |
Mortgage-Backed Securities | | | 12.2 | | |
Bank Loans | | | 9.0 | | |
Asset Backed Securities | | | 8.4 | | |
Preferred Stock | | | 0.5 | | |
Convertible Bond | | | 0.3 | | |
Short-Term Investments and Other | | | 1.5 | | |
See accompanying Disclosures and Endnotes on page 99.
48 OAKMARK FUNDS
Oakmark Bond Fund March 31, 2024
Portfolio Manager Commentary


M. Colin Hudson, CFA
Portfolio Manager
Adam D. Abbas
Portfolio Manager
MARKET OUTLOOK POSITIONING
Performance
The Oakmark Bond Fund ("the Fund") returned 0.38% in the first quarter, outperforming its benchmark, the Bloomberg U.S. Aggregate Bond Index29, which returned–0.78% over the same period. Since its inception in June 2020, the Fund has returned an average of 0.28% per year, outperforming the benchmark's return of –2.38% over the same period.
Approximately 90 basis points of the Fund's outperformance this quarter was a result of prudent security selection as corporate credit and asset backed securities spreads tightened. The securities contributing most significantly to this quarter's security selection were Ally Financial 4.7% Perpetual Preferred, BANK 2022-A4 Commercial Mortgage Pass Through due 3/15/2064, Freddie Mac Multifamily Structured Pass Through due 10/25/2036 (FHMS k1522 A2) and Capital One Financial 3.95% Perpetual Preferred Notes. Positions that weighed on performance during the quarter were Boeing Corp. 5% Sr. Unsecured Notes due 5/1/50, Fannie Mae 2% conventional RMBS due 11/1/2050 (FNMA4182), Fannie Mae 2.0% conventional 30yr RMBS due 2/1/2052 (FNCB2773) and Parsley Energy LLC 4.125% Sr. Unsecured Notes due 2/15/2028.
Allocation decisions contributed approximately 22 basis points to the Fund's performance during the quarter as strong excess returns in both corporate credit and structured securities were captured by the Oakmark Bond Fund's overweight in both asset classes versus the Bloomberg U.S. Aggregate Bond Index. These allocation decisions were the byproduct of strong, individual-security-level, risk-adjusted expected returns across spread product. The Fund maintains a higher proportion of corporate debt and securitized debt compared to the benchmark, at 48% versus 26% and 36% versus 28%, respectively. Although still overweight spread products, the Fund's quality within credit and structured product is arguably the highest it has been since inception.
While security selection and allocation decisions were the main drivers of outperformance during the quarter, the Fund's modestly shorter average duration relative to the benchmark also contributed to positive relative returns for the quarter compared to the benchmark. The Fund maintained its duration position of roughly 5.9 years throughout the quarter. This position is relatively neutral compared to the benchmark's duration of approximately 6.2 years.
Positioning and Market Outlook
During the first quarter of 2024, yields27 shifted higher across the curve. The 2s10s yield curve, which measures the difference in interest rates between the 2-year and 10-year Treasury bonds,
moved modestly flatter over the quarter as 2-year U.S. Treasury yield increased 35 basis points and the 10-year Treasury yield increased 32 basis points. Credit spreads continued to tighten over the quarter. Corporate spreads generically have tightened by 10 basis points since the end of 2023, led by lower rated quality buckets. Leveraged loans were the leading asset class within credit, benefitting from their floating rate nature (which protected them from the increase in interest rates), high current carry and strong inflows that drove technical demand. Securitized agency index spreads traded sideways in the quarter, as a decline in implied volatility and modestly increasing interest rates supported valuations and carry for high coupon mortgages. This was offset by the prospect of additional asset sales by banks, which pressured spreads for deals backed by lower coupon pools. In unguaranteed residential mortgage-backed securities and asset-backed securities, investment grade spreads tightened 30 to 50 basis points on continued improvements in investor confidence and attractive yield advantage over competing alternatives.
Our Fund maintains a preference for agency-backed securitized assets over U.S. Treasurys, and we are poised to continue the shift initiated over the previous 12 months in our government and government-backed securities portfolio, should we encounter wider spreads or heightened implied rate volatility. Even though the relative attractiveness of agency securities versus U.S. Treasurys has waned since the latter half of last year, our pivot toward agency paper still secures a beneficial balance of improved spread and yield without considerably affecting the volatility or liquidity of the broader portfolio. Our stance on the yield curve still leans toward the belly of the curve, endorsing the enduring value in the 5-, 7-, and 10-year maturities. We project the curve to revert to a more normal historical shape over the mid to long term, which will create a pronounced steepening of the 5-, 7- and 10-year U.S. Treasury maturities relative to the longer 20- and 30-year maturities. Always mindful of the risk posed by a potentially severe economic downturn that could significantly flatten or re-invert curve relationships in the short run, we are strategically cautious about maintaining our duration38 levels close to the index, given our view that nominal rates anchoring to the 10-year are within our fair value range. Our duration exposure goal is to be at the intersection of maximizing income, mitigating exposure to potential curve steepening, and fortifying against risks associated with our overweight positions in corporate and lower-quality segments. In the event of a notable curve steepening, we would likely reallocate toward the longer end of the curve to enhance the protection of our portfolio and simultaneously unlock capital to pursue opportunistic investments in individual corporate credits and non-guaranteed agency securities.
See accompanying Disclosures and Endnotes on page 99.
Oakmark.com 49
Oakmark Bond Fund March 31, 2024
Portfolio Manager Commentary (continued)
Within our credit portfolio, we continued to lower our exposure to corporate credit risk (albeit at a much more gradual pace), pivoting toward alternative asset classes that offer enticing potential, and we are gradually enhancing the quality of our remaining corporate exposures. As corporate credit spreads have continued to tighten since the start of the year, our shift has increasingly favored leveraged loans and non-guaranteed securitized assets, acknowledging their sustained appeal, although this is somewhat diminished compared to last year. Our investment strategy remains proactive in identifying potential in both high-yield and investment grade corporate sectors, albeit acknowledging that the endeavor to secure investments with an adequate safety margin has grown more demanding since the Fund's inception in June 2020.
The market's shift in perspective regarding rate cuts, shaped by definitive guidance from Federal Reserve Chair Jerome Powell and the persistent nature of inflation, has led to a recalibration of expectations. Acknowledging an economy that continues to demonstrate resilience, alongside the prospect of enduring inflation over 2.5%, has moderated default risks, propelled real interest rates upward and stabilized nominal rates. As the fixed income landscape progressively assimilates these factors, the focus is increasingly on the normalization of real rates to generate attractive income, produce robust total returns and provide a safeguard against potential future downturns. This strategic evolution underscores our preference for quality and extended duration in comparison to our position at the start of 2023.
Our strength continues to be credit selection, and we're happy that for the third consecutive quarter it has been the standout driver of returns. We believe that the Oakmark Bond Fund's core value proposition is that it offers a concentrated fixed income product in which returns are driven by asset class allocation and security selection and in which duration and curve decisions are not the focus, unless we are in an exceptionally abnormal rate environment. The term "concentrated" should not cause concern. We manage the Fund to be on the efficient frontier of diversification, defined by the point where additional positions do not reduce volatility or drawdown outcomes but would dilute our ability to generate idiosyncratic returns, or alpha, from credit selection. We believe this optimal level is between 75 to 125 positions. As we enter a new era of fixed income characterized by higher yields and reduced Fed influence, we expect the market's focus to gradually return to individual security and asset class fundamentals, and we are excited to offer a vehicle designed to maximize our ability to capture value through understanding these fundamentals.
Connect with us
We value our relationship with our investors and strive to keep you informed through regular updates, but we also welcome any questions or concerns. Please don't hesitate to reach out to our team: aabbas@harrisassoc.com or mhudson@harrisassoc.com.
See accompanying Disclosures and Endnotes on page 99.
50 OAKMARK FUNDS
Oakmark Bond Fund March 31, 2024 (Unaudited)
Schedule of Investments (in thousands)
| | | Shares | | Value | |
PREFERRED STOCKS - 0.5% | |
COMMUNICATION SERVICES - 0.5% | |
Liberty Broadband Corp., Series A (a), 7.00% | | | 31 | | | $ | 714 | | |
TOTAL PREFERRED STOCKS - 0.5%
(COST $821) | | | | | 714 | | |
| | | Par Value | | Value | |
FIXED INCOME - 98.0% | |
CORPORATE BONDS - 38.1% | |
FINANCIALS - 10.0% | |
AerCap Ireland Capital DAC/AerCap Global
Aviation Trust
3.40%, due 10/29/33 | | $ | 850 | | | | 716 | | |
5.75%, due 06/06/28 | | | 500 | | | | 507 | | |
Ally Financial, Inc.
4.70% (7 yr. CMT + 3.481%) (a) (b) | | | 1,000 | | | | 793 | | |
Apollo Commercial Real Estate Finance, Inc.,
144A 4.625%, due 06/15/29 (c) | | | 1,250 | | | | 1,050 | | |
Capital One Financial Corp.
3.95%(5 yr. CMT + 3.157%) (a) (b) | | | 1,000 | | | | 888 | | |
7.624%(SOFR + 3.070%),
due 10/30/31 (b) | | | 600 | | | | 663 | | |
Charles Schwab Corp.
5.853% (SOFR + 2.500%),
due 05/19/34 (b) | | | 1,350 | | | | 1,383 | | |
Citigroup, Inc.
4.70%(SOFR + 3.234%) (a) (b) | | | 1,250 | | | | 1,219 | | |
7.625%(5 yr. CMT + 3.211%) (a) (b) | | | 500 | | | | 525 | | |
KKR Group Finance Co. XII LLC, 144A
4.85%, due 05/17/32 (c) | | | 1,000 | | | | 966 | | |
LPL Holdings, Inc.
6.75%, due 11/17/28 | | | 500 | | | | 524 | | |
Morgan Stanley
5.173% (SOFR + 1.450%),
due 01/16/30 (b) | | | 1,000 | | | | 1,001 | | |
Rocket Mortgage LLC/Rocket Mortgage
Co-Issuer, Inc., 144A
3.875%, due 03/01/31 (c) | | | 750 | | | | 653 | | |
4.00%, due 10/15/33 (c) | | | 500 | | | | 424 | | |
Truist Financial Corp.
5.867% (SOFR + 2.361%),
due 06/08/34 (b) | | | 1,100 | | | | 1,114 | | |
Wells Fargo & Co.
3.90%(5 yr. CMT + 3.453%) (a) (b) | | | 1,000 | | | | 951 | | |
5.499%(SOFR + 1.780%),
due 01/23/35 (b) | | | 850 | | | | 852 | | |
5.198%(SOFR + 1.500%),
due 01/23/30 (b) | | | 850 | | | | 848 | | |
Willis North America, Inc.
5.90%, due 03/05/54 | | | 250 | | | | 253 | | |
| | | | | | 15,330 | | |
INDUSTRIALS - 7.1% | |
AAR Escrow Issuer LLC, 144A
6.75%, due 03/15/29 (c) | | | 250 | | | | 252 | | |
AutoNation, Inc.
3.85%, due 03/01/32 | | | 1,350 | | | | 1,200 | | |
| | | Par Value | | Value | |
BAT Capital Corp.
2.259%, due 03/25/28 | | $ | 1,000 | | | $ | 890 | | |
Boeing Co.
5.805%, due 05/01/50 | | | 1,000 | | | | 946 | | |
3.625%, due 02/01/31 | | | 200 | | | | 176 | | |
GXO Logistics, Inc.
2.65%, due 07/15/31 | | | 500 | | | | 407 | | |
Hilton Domestic Operating Co., Inc., 144A
3.625%, due 02/15/32 (c) | | | 1,000 | | | | 861 | | |
Howmet Aerospace, Inc.
3.00%, due 01/15/29 | | | 900 | | | | 813 | | |
JBS USA LUX SA/JBS USA Food Co./JBS
Luxembourg SARL, 144A
6.75%, due 03/15/34 (c) | | | 1,350 | | | | 1,418 | | |
Stanley Black & Decker, Inc.
2.30%, due 03/15/30 | | | 500 | | | | 423 | | |
Uber Technologies, Inc., 144A
4.50%, due 08/15/29 (c) | | | 1,100 | | | | 1,044 | | |
United Parcel Service, Inc.
4.875%, due 03/03/33 | | | 1,250 | | | | 1,252 | | |
Viterra Finance BV, 144A
2.00%, due 04/21/26 (c) | | | 1,000 | | | | 929 | | |
5.25%, due 04/21/32 (c) | | | 250 | | | | 246 | | |
| | | | | | 10,857 | | |
CONSUMER DISCRETIONARY - 6.5% | |
Amer Sports Co., 144A
6.75%, due 02/16/31 (c) | | | 500 | | | | 499 | | |
Brunswick Corp.
2.40%, due 08/18/31 | | | 1,600 | | | | 1,274 | | |
Daimler Truck Finance North America
LLC, 144A
5.40%, due 09/20/28 (c) | | | 500 | | | | 507 | | |
Lithia Motors, Inc., 144A
4.375%, due 01/15/31 (c) | | | 1,100 | | | | 985 | | |
M/I Homes, Inc.
3.95%, due 02/15/30 | | | 850 | | | | 764 | | |
Marriott International, Inc.
2.75%, due 10/15/33 | | | 1,000 | | | | 813 | | |
Phinia, Inc., 144A
6.75%, due 04/15/29 (c) | | | 1,000 | | | | 1,010 | | |
Raising Cane's Restaurants LLC, 144A
9.375%, due 05/01/29 (c) | | | 1,000 | | | | 1,081 | | |
Starbucks Corp.
5.00%, due 02/15/34 | | | 1,000 | | | | 991 | | |
Tapestry, Inc.
7.85%, due 11/27/33 | | | 1,250 | | | | 1,356 | | |
ZF North America Capital, Inc., 144A
6.875%, due 04/14/28 (c) | | | 750 | | | | 778 | | |
| | | | | | 10,058 | | |
ENERGY - 5.3% | |
Apache Corp.
5.35%, due 07/01/49 | | | 750 | | | | 634 | | |
Cheniere Energy, Inc., 144A
5.65%, due 04/15/34 (c) | | | 1,000 | | | | 1,007 | | |
Chesapeake Energy Corp., 144A
5.875%, due 02/01/29 (c) | | | 1,617 | | | | 1,604 | | |
EQT Corp.
5.70%, due 04/01/28 | | | 1,000 | | | | 1,009 | | |
Hess Midstream Operations LP, 144A
4.25%, due 02/15/30 (c) | | | 1,100 | | | | 1,011 | | |
See accompanying Notes to Financial Statements.
Oakmark.com 51
Oakmark Bond Fund March 31, 2024 (Unaudited)
Schedule of Investments (in thousands) (continued)
| | | Par Value | | Value | |
FIXED INCOME - 98.0% (continued) | |
CORPORATE BONDS - 38.1% (continued) | |
Noble Finance II LLC, 144A
8.00%, due 04/15/30 (c) | | $ | 500 | | | $ | 521 | | |
Parsley Energy LLC/Parsley Finance
Corp., 144A
4.125%, due 02/15/28 (c) | | | 1,500 | | | | 1,430 | | |
Patterson-UTI Energy, Inc.
7.15%, due 10/01/33 | | | 900 | | | | 968 | | |
| | | | | | 8,184 | | |
REAL ESTATE - 2.3% | |
Alexandria Real Estate Equities, Inc.
4.75%, due 04/15/35 | | | 1,150 | | | | 1,087 | | |
CBRE Services, Inc.
2.50%, due 04/01/31 | | | 1,000 | | | | 827 | | |
5.50%, due 04/01/29 | | | 250 | | | | 252 | | |
Cushman & Wakefield U.S. Borrower LLC, 144A
6.75%, due 05/15/28 (c) | | | 1,000 | | | | 987 | | |
Howard Hughes Corp., 144A
4.375%, due 02/01/31 (c) | | | 500 | | | | 434 | | |
| | | | | | 3,587 | | |
HEALTH CARE - 2.2% | |
CVS Health Corp.
5.25%, due 02/21/33 | | | 500 | | | | 500 | | |
Embecta Corp., 144A
5.00%, due 02/15/30 (c) | | | 830 | | | | 678 | | |
Fortrea Holdings, Inc., 144A
7.50%, due 07/01/30 (c) | | | 200 | | | | 206 | | |
Humana, Inc.
5.375%, due 04/15/31 | | | 1,000 | | | | 1,001 | | |
Tenet Healthcare Corp., 144A
6.75%, due 05/15/31 (c) | | | 1,000 | | | | 1,018 | | |
| | | | | | 3,403 | | |
MATERIALS - 1.9% | |
Anglo American Capital PLC, 144A
3.875%, due 03/16/29 (c) | | | 1,000 | | | | 936 | | |
Celanese U.S. Holdings LLC
6.70%, due 11/15/33 | | | 800 | | | | 853 | | |
Glencore Funding LLC, 144A
2.625%, due 09/23/31 (c) | | | 1,350 | | | | 1,125 | | |
| | | | | | 2,914 | | |
CONSUMER STAPLES - 1.7% | |
Dollar General Corp.
5.45%, due 07/05/33 | | | 850 | | | | 853 | | |
Imperial Brands Finance PLC, 144A
6.125%, due 07/27/27 (c) | | | 750 | | | | 765 | | |
Philip Morris International, Inc.
5.25%, due 02/13/34 | | | 1,000 | | | | 991 | | |
| | | | | | 2,609 | | |
UTILITIES - 1.1% | |
NRG Energy, Inc., 144A
7.00%, due 03/15/33 (c) | | | 750 | | | | 800 | | |
| | | Par Value | | Value | |
Southern Co.
3.75% (5 yr. CMT + 2.915%),
due 09/15/51 (b) | | $ | 1,000 | | | $ | 935 | | |
| | | | | | 1,735 | | |
Total Corporate Bonds
(Cost $59,393) | | | | | 58,677 | | |
GOVERNMENT AND AGENCY SECURITIES - 15.6% | |
U.S. GOVERNMENT NOTES - 8.6% | |
U.S. Treasury Notes
4.00%, due 01/31/31 | | | 3,000 | | | | 2,960 | | |
2.875%, due 05/15/32 | | | 3,000 | | | | 2,724 | | |
3.50%, due 01/31/30 | | | 2,500 | | | | 2,406 | | |
0.625%, due 08/15/30 | | | 3,000 | | | | 2,402 | | |
4.00%, due 02/15/34 | | | 2,000 | | | | 1,967 | | |
1.625%, due 05/15/31 | | | 1,000 | | | | 843 | | |
| | | | | | 13,302 | | |
U.S. GOVERNMENT BONDS - 7.0% | |
U.S. Treasury Bonds
4.25%, due 02/15/54 | | | 2,400 | | | | 2,360 | | |
4.75%, due 11/15/43 | | | 2,000 | | | | 2,075 | | |
3.00%, due 08/15/52 | | | 2,500 | | | | 1,942 | | |
4.375%, due 08/15/43 | | | 1,500 | | | | 1,482 | | |
3.625%, due 05/15/53 | | | 1,500 | | | | 1,318 | | |
4.125%, due 08/15/53 | | | 500 | | | | 480 | | |
3.375%, due 08/15/42 | | | 500 | | | | 432 | | |
2.00%, due 11/15/41 | | | 500 | | | | 351 | | |
2.00%, due 08/15/51 | | | 500 | | | | 310 | | |
| | | | | | 10,750 | | |
Total Government and Agency Securities
(Cost $24,854) | | | | | 24,052 | | |
COLLATERALIZED MORTGAGE OBLIGATIONS - 14.4% | |
Federal Home Loan Mortgage Corp.
Multifamily Structured Pass Through
Certificates, Series K-1522-Class A2
2.361%, due 10/25/36 | | | 5,200 | | | | 4,003 | | |
Federal Home Loan Mortgage Corp.
Multifamily Structured Pass-Through
Certificates, Series K-1515-Class A2
1.94%, due 02/25/35 | | | 5,200 | | | | 3,985 | | |
Federal Home Loan Mortgage Corp.
Multifamily Structured Pass Through
Certificates, Series K-1521-Class A2
2.184%, due 08/25/36 | | | 5,200 | | | | 3,906 | | |
Bank, Series 2022-BNK40-Class A4
3.394%, due 03/15/64 (b) | | | 2,400 | | | | 2,143 | | |
JP Morgan Mortgage Trust,
Series 2018-6-Class B2, 144A
3.888%, due 12/25/48 (b) (c) | | | 2,173 | | | | 1,955 | | |
GS Mortgage-Backed Securities Trust,
Series 2021-PJ6-Class B1, 144A
2.68%, due 11/25/51 (b) (c) | | | 1,391 | | | | 1,103 | | |
JP Morgan Mortgage Trust,
Series 2021-11-Class B1, 144A
3.024%, due 01/25/52 (b) (c) | | | 1,062 | | | | 851 | | |
See accompanying Notes to Financial Statements.
52 OAKMARK FUNDS
Oakmark Bond Fund March 31, 2024 (Unaudited)
Schedule of Investments (in thousands) (continued)
| | | Par Value | | Value | |
FIXED INCOME - 98.0% (continued) | |
COLLATERALIZED MORTGAGE OBLIGATIONS - 14.4% (continued) | |
Chase Home Lending Mortgage Trust,
Series 2024-1-Class B1, 144A
6.725%, due 01/25/55 (b) (c) | | $ | 798 | | | $ | 834 | | |
Federal Home Loan Mortgage Corp.
Multifamily Structured Pass Through
Certificates, Series K-1517-Class A2
1.716%, due 07/25/35 | | | 1,050 | | | | 771 | | |
JP Morgan Mortgage Trust,
Series 2022-3-Class B1, 144A
3.106%, due 08/25/52 (b) (c) | | | 955 | | | | 762 | | |
JP Morgan Mortgage Trust,
Series 2022-8-Class B2, 144A
4.672%, due 01/25/53 (b) (c) | | | 592 | | | | 526 | | |
Sequoia Mortgage Trust,
Series 2021-9-Class B2, 144A
2.86%, due 01/25/52 (b) (c) | | | 650 | | | | 521 | | |
JP Morgan Mortgage Trust,
Series 2020-5-Class B1, 144A
3.572%, due 12/25/50 (b) (c) | | | 459 | | | | 392 | | |
JP Morgan Mortgage Trust,
Series 2021-13-Class B1, 144A
3.14%, due 04/25/52 (b) (c) | | | 452 | | | | 369 | | |
Total Collateralized Mortgage
Obligations - 14.4%
(Cost $21,744) | | | | | 22,121 | | |
MORTGAGE-BACKED SECURITIES - 12.2% | |
Federal National Mortgage Association,
Pool MA4182
2.00%, due 11/01/50 | | | 5,026 | | | | 4,009 | | |
Federal National Mortgage Association,
Pool CB2773
2.00%, due 02/01/52 | | | 5,039 | | | | 3,991 | | |
Federal National Mortgage Association,
Pool FS6468
5.00%, due 10/01/53 | | | 3,855 | | | | 3,775 | | |
Federal National Mortgage Association,
Pool BW9855
5.00%, due 09/01/52 | | | 3,691 | | | | 3,615 | | |
Federal National Mortgage Association,
Pool DA8695
5.00%, due 02/01/54 | | | 2,336 | | | | 2,284 | | |
Federal Home Loan Mortgage Corp.,
Pool SD2473
5.00%, due 02/01/53 | | | 1,130 | | | | 1,103 | | |
Total Mortgage-Backed Securities - 12.2%
(Cost $18,302) | | | | | 18,777 | | |
BANK LOANS - 9.0% (d) | |
CONSUMER DISCRETIONARY - 2.6% | |
Amer Sports Co. Usd Term Loan
8.576% (3 mo. USD Term SOFR +
3.250%), due 02/17/31 (b) (c) | | | 1,000 | | | | 1,000 | | |
Peer Holding III BV 2023 Term Loan B4
8.559% (3 mo. USD Term SOFR +
3.250%), due 10/28/30 (b) | | | 1,500 | | | | 1,502 | | |
| | | Par Value | | Value | |
Wand Newco 3, Inc. 2024 Term Loan B
9.08% (1 mo. USD Term SOFR +
3.750%), due 01/30/31 (b) | | $ | 1,500 | | | $ | 1,503 | | |
| | | | | | 4,005 | | |
FINANCIALS - 2.1% | |
GTCR W Merger Sub LLC USD Term Loan B
8.309% (1 mo. USD Term SOFR +
3.000%), due 01/31/31 (b) | | | 1,500 | | | | 1,504 | | |
Citadel Securities LP 2024 Term Loan B
7.577% (1 mo. USD Term SOFR +
2.250%), due 07/29/30 (b) | | | 1,732 | | | | 1,730 | | |
| | | | | | 3,234 | | |
INDUSTRIALS - 2.1% | |
Vestis Corp. Term Loan 7.576%
(3 mo. USD Term SOFR + 2.250%),
due 02/22/31 (b) | | | 1,500 | | | | 1,498 | | |
Skymiles IP Ltd. 2020 Term Loan B
9.068% (3 mo. USD Term SOFR +
3.750%), due 10/20/27 (b) | | | 750 | | | | 773 | | |
Uber Technologies, Inc. 2023 Term Loan B
8.079% (3 mo. USD Term SOFR +
2.750%), due 03/03/30 (b) | | | 897 | | | | 901 | | |
| | | | | | 3,172 | | |
HEALTH CARE - 1.6% | |
Medline Borrower LP 2024 Term Loan B
8.079% (3 mo. USD Term SOFR +
2.750%), due 10/23/28 (b) | | | 1,353 | | | | 1,355 | | |
Owens & Minor, Inc. 2022 Term Loan B
9.18% (3 mo. USD Term SOFR +
3.750%), due 03/29/29 (b) | | | 430 | | | | 431 | | |
Fortrea Holdings, Inc. Term Loan B
9.08% (1 mo. USD Term SOFR +
3.750%), due 07/01/30 (b) | | | 744 | | | | 746 | | |
| | | | | | 2,532 | | |
ENERGY - 0.6% | |
ChampionX Corp. 2022 Term Loan B2
8.18% (1 mo. USD Term SOFR +
2.750%), due 06/07/29 (b) | | | 988 | | | | 991 | | |
Total Bank Loans
(Cost $13,830) | | | | | 13,934 | | |
ASSET BACKED SECURITIES - 8.4% | |
HPEFS Equipment Trust,
Series 2022-3A-Class-C, 144A,
6.13%, due 08/20/29 (c) | | | 1,000 | | | | 1,003 | | |
Ford Credit Auto Owner Trust,
Series 2022-C-Class C,
5.22%, due 03/15/30 | | | 1,000 | | | | 998 | | |
Carvana Auto Receivables Trust,
Series 2022-P1-Class D,
4.80%, due 01/10/29 | | | 1,000 | | | | 961 | | |
Carvana Auto Receivables Trust,
Series 2021-P1-Class D,
1.82%, due 12/10/27 | | | 880 | | | | 807 | | |
CPS Auto Receivables Trust,
Series 2022-C-Class E, 144A,
9.08%, due 04/15/30 (c) | | | 750 | | | | 778 | | |
See accompanying Notes to Financial Statements.
Oakmark.com 53
Oakmark Bond Fund March 31, 2024 (Unaudited)
Schedule of Investments (in thousands) (continued)
| | | Par Value | | Value | |
FIXED INCOME - 98.0% (continued) | |
ASSET BACKED SECURITIES - 8.4% (continued) | |
Sierra Timeshare Receivables Funding LLC,
Series 2023-2A-Class D, 144A,
9.72%, due 04/20/40 (c) | | $ | 693 | | | $ | 707 | | |
HPEFS Equipment Trust,
Series 2024-1A-Class D, 144A,
5.82%, due 11/20/31 (c) | | | 650 | | | | 650 | | |
CPS Auto Receivables Trust,
Series 2023-C-Class E, 144A,
9.66%, due 02/18/31 (c) | | | 500 | | | | 527 | | |
Ford Credit Auto Owner Trust,
Series 2022-D-Class C,
6.46%, due 05/15/30 | | | 500 | | | | 512 | | |
HPEFS Equipment Trust,
Series 2023-2A-Class-D, 144A,
6.97%, due 07/21/31 (c) | | | 500 | | | | 509 | | |
CCG Receivables Trust,
Series 2023-2-Class C, 144A,
6.45%, due 04/14/32 (c) | | | 500 | | | | 508 | | |
CarMax Auto Owner Trust ,
Series 2023-2-Class D,
6.55%, due 10/15/29 | | | 500 | | | | 505 | | |
Carmax Auto Owner Trust,
Series 2023-3-Class D,
6.44%, due 12/16/30 | | | 500 | | | | 504 | | |
GreatAmerica Leasing Receivables Funding
LLC, Series 2022-1-Class B, 144A,
5.74%, due 07/16/29 (c) | | | 500 | | | | 500 | | |
Santander Drive Auto Receivables Trust,
Series 2024-1-Class C,
5.45%, due 03/15/30 | | | 500 | | | | 498 | | |
GreatAmerica Leasing Receivables Funding
LLC, Series 2022-1-Class C, 144A,
5.98%, due 07/15/30 (c) | | | 500 | | | | 498 | | |
Santander Drive Auto Receivables Trust,
Series 2022-5-Class C,
4.74%, due 10/16/28 | | | 500 | | | | 494 | | |
CarMax Auto Owner Trust ,
Series 2022-2-Class D,
4.75%, due 10/16/28 | | | 500 | | | | 486 | | |
Sierra Timeshare Receivables Funding LLC,
Series 2022-1A-Class C, 144A,
3.94%, due 10/20/38 (c) | | | 502 | | | | 478 | | |
CarMax Auto Owner Trust,
Series 2021-4-Class D,
1.48%, due 03/15/28 | | | 495 | | | | 457 | | |
Sierra Timeshare Receivables Funding LLC,
Series 2022-2A-Class D, 144A,
9.22%, due 06/20/40 (c) | | | 295 | | | | 297 | | |
Carvana Auto Receivables Trust,
Series 2023-P4-Class D, 144A,
7.37%, due 10/10/30 (c) | | | 250 | | | | 261 | | |
Carvana Auto Receivables Trust,
Series 2023-P4-Class N, 144A,
8.05%, due 10/10/30 (c) | | | 29 | | | | 29 | | |
Total Asset Backed Securities
(Cost $12,875) | | | | | 12,967 | | |
| | | Shares | | Value | |
CONVERTIBLE BOND - 0.3% | |
HEALTH CARE - 0.3% | |
Envista Holdings Corp., 144A (c) | | | 500 | | | $ | 440 | | |
Total Convertible Bond
(Cost $450) | | | | | 440 | | |
TOTAL FIXED INCOME - 98.0%
(COST $151,448) | | | | | 150,968 | | |
| | | Par Value | | Value | |
SHORT-TERM INVESTMENTS - 1.4% | |
REPURCHASE AGREEMENT - 1.4% | |
Fixed Income Clearing Corp. Repurchase
Agreement, 5.32% dated 03/28/24 due
04/01/24, repurchase price $2,105,
collateralized by a United States Treasury
Note, 4.250% due 10/15/25, value plus
accrued interest of $2,146 (Cost: $2,104) | | $ | 2,104 | | | | 2,104 | | |
TOTAL SHORT-TERM INVESTMENTS - 1.4%
(COST $2,104) | | | | | 2,104 | | |
TOTAL INVESTMENTS - 99.9%
(COST $154,373) | | | | | 153,786 | | |
Other Assets In Excess of Liabilities - 0.1% | | | | | 167 | | |
NET ASSETS - 100.0% | | | | $ | 153,953 | | |
(a) Security is perpetual and has no stated maturity date.
(b) Floating Rate Note. Rate shown is as of March 31, 2024.
(c) Security exempt from registration under Rule 144A of the Securities Act of 1933, as amended. These securities may be resold, normally only to qualified institutional buyers.
(d) Bank loans generally are subject to mandatory and/or optional prepayment. As a result, the actual remaining maturity of bank loans may be substantially less than the stated maturities shown.
Abbreviations:
REIT: Real Estate Investment Trust
SOFR: Secured Overnight Financing Rate
See accompanying Notes to Financial Statements.
54 OAKMARK FUNDS
Oakmark Funds
Statements of Assets and Liabilities—March 31, 2024 (Unaudited)
(in thousands except per share amounts)
| | | Oakmark
Fund | | Oakmark
Select
Fund | | Oakmark
Global
Fund | |
Assets | |
Investments in unaffiliated securities, at value (a) | | $ | 22,390,031 | | | $ | 6,598,336 | | | $ | 1,219,005 | | |
Cash | | | 2 | | | | 0 | (b) | | | 0 | (b) | |
Foreign currency, at value (c) | | | 0 | | | | 0 | | | | 0 | (b) | |
Receivable for: | |
Securities sold | | | 0 | | | | 0 | | | | 2,666 | | |
Fund shares sold | | | 43,096 | | | | 13,145 | | | | 21 | | |
Dividends and interest from unaffiliated securities
(Net of foreign tax withheld) | | | 23,616 | | | | 2,203 | | | | 1,504 | | |
Tax reclaim from unaffiliated securities | | | 0 | | | | 0 | | | | 1,458 | | |
Total receivables | | | 66,712 | | | | 15,348 | | | | 5,649 | | |
Other assets | | | 109 | | | | 32 | | | | 6 | | |
Total assets | | $ | 22,456,854 | | | $ | 6,613,716 | | | $ | 1,224,660 | | |
Liabilities and net assets | |
Payable for: | |
Securities purchased | | $ | 298,419 | | | $ | 22,293 | | | $ | 2,163 | | |
Fund shares redeemed | | | 12,322 | | | | 3,730 | | | | 13,255 | | |
Investment advisory fee | | | 1,791 | | | | 631 | | | | 136 | | |
Other shareholder servicing fees | | | 1,579 | | | | 814 | | | | 69 | | |
Transfer and dividend disbursing agent fees | | | 154 | | | | 81 | | | | 42 | | |
Trustee fees | | | 5 | | | | 4 | | | | 4 | | |
Deferred trustee compensation | | | 1,871 | | | | 816 | | | | 495 | | |
Other | | | 3,676 | | | | 867 | | | | 420 | | |
Total liabilities | | | 319,817 | | | | 29,236 | | | | 16,584 | | |
Net assets applicable to Fund shares outstanding | | $ | 22,137,037 | | | $ | 6,584,480 | | | $ | 1,208,076 | | |
Analysis of net assets | |
Paid in capital | | $ | 15,438,583 | | | $ | 4,607,308 | | | $ | 864,395 | | |
Distributable earnings | | | 6,698,454 | | | | 1,977,172 | | | | 343,681 | | |
Net assets applicable to Fund shares outstanding | | $ | 22,137,037 | | | $ | 6,584,480 | | | $ | 1,208,076 | | |
Price of shares | |
Net asset value, offering and redemption price
per share: Investor Class | | $ | 146.18 | | | $ | 74.79 | | | $ | 33.57 | | |
Investor Class—Net assets | | $ | 9,910,905 | | | $ | 1,824,300 | | | $ | 590,906 | | |
Investor Class—Shares outstanding (Unlimited
shares authorized) | | | 67,798 | | | | 24,392 | | | | 17,601 | | |
Net asset value, offering and redemption price
per share: Advisor Class | | $ | 146.20 | | | $ | 74.64 | | | $ | 33.56 | | |
Advisor Class—Net assets | | $ | 2,604,391 | | | $ | 3,372,821 | | | $ | 143,360 | | |
Advisor Class—Shares outstanding (Unlimited
shares authorized) | | | 17,814 | | | | 45,186 | | | | 4,272 | | |
Net asset value, offering and redemption price
per share: Institutional Class | | $ | 146.21 | | | $ | 74.72 | | | $ | 33.55 | | |
Institutional Class—Net assets | | $ | 6,771,146 | | | $ | 760,097 | | | $ | 356,917 | | |
Institutional Class—Shares outstanding (Unlimited
shares authorized) | | | 46,310 | | | | 10,172 | | | | 10,638 | | |
Net asset value, offering and redemption price
per share: R6 Class | | $ | 146.25 | (d) | | $ | 74.72 | | | $ | 33.54 | | |
R6 Class—Net assets | | $ | 2,850,595 | | | $ | 627,262 | | | $ | 116,893 | | |
R6 Class—Shares outstanding (Unlimited
shares authorized) | | | 19,492 | | | | 8,395 | | | | 3,485 | | |
| (a) Identified cost of investments in unaffiliated securities. | | $ | 16,701,381 | | | $ | 4,810,745 | | | $ | 947,459 | | |
| (b) Amount rounds to less than $1,000. | | | | | | | | | | | | | |
| (c) Identified cost of foreign currency. | | | 0 | | | | 0 | | | | 0 | (b) | |
| (d) Net assets have been rounded for presentation purposes. The net asset value per share shown is as reported on March 31, 2024. | | | | | | | | | | | | | |
See accompanying Notes to Financial Statements.
Oakmark.com 55
Oakmark Funds
Statements of Assets and Liabilities—March 31, 2024 (Unaudited) (continued)
(in thousands except per share amounts)
| | | Oakmark
Global Select
Fund | | Oakmark
International
Fund | | Oakmark
International
Small Cap Fund | |
Assets | |
Investments in unaffiliated securities, at value (a) | | $ | 1,117,089 | | | $ | 19,516,414 | | | $ | 1,448,911 | | |
Investments in affiliated securities, at value (b) | | | 0 | | | | 388,200 | | | | 0 | | |
Cash | | | 0 | (d) | | | 1 | | | | 0 | | |
Foreign currency, at value (c) | | | 0 | (d) | | | 1,781 | | | | 818 | | |
Receivable for: | |
Securities sold | | | 0 | | | | 82,135 | | | | 4,020 | | |
Fund shares sold | | | 874 | | | | 36,213 | | | | 10,484 | | |
Dividends and interest from unaffiliated securities
(Net of foreign tax withheld) | | | 1,122 | | | | 52,147 | | | | 6,264 | | |
Tax reclaim from unaffiliated securities | | | 1,518 | | | | 29,851 | | | | 2,450 | | |
Total receivables | | | 3,514 | | | | 200,346 | | | | 23,218 | | |
Other assets | | | 5 | | | | 101 | | | | 6 | | |
Total assets | | $ | 1,120,608 | | | $ | 20,106,843 | | | $ | 1,472,953 | | |
Liabilities and net assets | |
Payable for: | |
Securities purchased | | $ | 36,498 | | | $ | 47,430 | | | $ | 8,307 | | |
Fund shares redeemed | | | 18,168 | | | | 34,833 | | | | 783 | | |
Investment advisory fee | | | 118 | | | | 1,982 | | | | 196 | | |
Other shareholder servicing fees | | | 88 | | | | 1,628 | | | | 93 | | |
Transfer and dividend disbursing agent fees | | | 17 | | | | 84 | | | | 19 | | |
Trustee fees | | | 4 | | | | 7 | | | | 4 | | |
Deferred trustee compensation | | | 407 | | | | 2,717 | | | | 478 | | |
Other | | | 325 | | | | 6,494 | | | | 401 | | |
Total liabilities | | | 55,625 | | | | 95,175 | | | | 10,281 | | |
Net assets applicable to Fund shares outstanding | | $ | 1,064,983 | | | $ | 20,011,668 | | | $ | 1,462,672 | | |
Analysis of net assets | |
Paid in capital | | $ | 829,837 | | | $ | 21,624,265 | | | $ | 1,358,887 | | |
Distributable earnings | | | 235,146 | | | | (1,612,597 | ) | | | 103,785 | | |
Net assets applicable to Fund shares outstanding | | $ | 1,064,983 | | | $ | 20,011,668 | | | $ | 1,462,672 | | |
Price of shares | |
Net asset value, offering and redemption price
per share: Investor Class | | $ | 22.02 | | | $ | 26.87 | | | $ | 19.60 | | |
Investor Class—Net assets | | $ | 339,515 | | | $ | 5,610,552 | | | $ | 380,885 | | |
Investor Class—Shares outstanding (Unlimited
shares authorized) | | | 15,416 | | | | 208,835 | | | | 19,437 | | |
Net asset value, offering and redemption price
per share: Advisor Class | | $ | 22.00 | | | $ | 26.81 | | | $ | 19.60 | | |
Advisor Class—Net assets | | $ | 134,525 | | | $ | 2,565,443 | | | $ | 173,757 | | |
Advisor Class—Shares outstanding (Unlimited
shares authorized) | | | 6,116 | | | | 95,677 | | | | 8,865 | | |
Net asset value, offering and redemption price
per share: Institutional Class | | $ | 21.99 | | | $ | 26.81 | | | $ | 19.54 | | |
Institutional Class—Net assets | | $ | 463,716 | | | $ | 8,968,761 | | | $ | 574,617 | | |
Institutional Class—Shares outstanding (Unlimited
shares authorized) | | | 21,084 | | | | 334,487 | | | | 29,400 | | |
Net asset value, offering and redemption price
per share: R6 Class | | $ | 22.00 | | | $ | 26.82 | | | $ | 19.54 | | |
R6 Class—Net assets | | $ | 127,227 | | | $ | 2,866,912 | | | $ | 333,413 | | |
R6 Class—Shares outstanding (Unlimited
shares authorized) | | | 5,783 | | | | 106,882 | | | | 17,062 | | |
| (a) Identified cost of investments in unaffiliated securities. | | $ | 915,872 | | | $ | 17,052,495 | | | $ | 1,341,754 | | |
| (b) Identified cost of investments in affiliated securities. | | | 0 | | | | 1,246,591 | | | | 0 | | |
| (c) Identified cost of foreign currency. | | | 0 | (d) | | | 1,781 | | | | 818 | | |
(d) Amount rounds to less than $1,000.
See accompanying Notes to Financial Statements.
56 OAKMARK FUNDS
Oakmark Funds
Statements of Assets and Liabilities—March 31, 2024 (Unaudited) (continued)
(in thousands except per share amounts)
| | | Oakmark
Equity and
Income Fund | | Oakmark
Bond
Fund | |
Assets | |
Investments in unaffiliated securities, at value (a) | | $ | 6,698,648 | | | $ | 153,786 | | |
Cash | | | 0 | (b) | | | 0 | (b) | |
Foreign currency, at value (c) | | | 0 | | | | 0 | | |
Receivable for: | |
Securities sold | | | 61 | | | | 7 | | |
Fund shares sold | | | 3,683 | | | | 330 | | |
Dividends and interest from unaffiliated securities
(Net of foreign tax withheld) | | | 23,746 | | | | 1,138 | | |
Tax reclaim from unaffiliated securities | | | 1,836 | | | | 0 | | |
Total receivables | | | 29,326 | | | | 1,475 | | |
Other assets | | | 28 | | | | 1 | | |
Total assets | | $ | 6,728,002 | | | $ | 155,262 | | |
Liabilities and net assets | |
Payable for: | |
Securities purchased | | $ | 67,260 | | | $ | 1,000 | | |
Fund shares redeemed | | | 6,147 | | | | 6 | | |
Options written, at value (d) | | | 770 | | | | 0 | | |
Investment advisory fee | | | 490 | | | | (1 | ) | |
Other shareholder servicing fees | | | 574 | | | | 3 | | |
Transfer and dividend disbursing agent fees | | | 100 | | | | 2 | | |
Trustee fees | | | 4 | | | | 3 | | |
Deferred trustee compensation | | | 1,711 | | | | 124 | | |
Other | | | 1,896 | | | | 172 | | |
Total liabilities | | | 78,952 | | | | 1,309 | | |
Net assets applicable to Fund shares outstanding | | $ | 6,649,050 | | | $ | 153,953 | | |
Analysis of net assets | |
Paid in capital | | $ | 5,328,312 | | | $ | 165,139 | | |
Distributable earnings | | | 1,320,738 | | | | (11,186 | ) | |
Net assets applicable to Fund shares outstanding | | $ | 6,649,050 | | | $ | 153,953 | | |
Price of shares | |
Net asset value, offering and redemption price
per share: Investor Class | | $ | 35.25 | | | $ | 8.82 | | |
Investor Class—Net assets | | $ | 4,589,313 | | | $ | 29,604 | | |
Investor Class—Shares outstanding (Unlimited
shares authorized) | | | 130,211 | | | | 3,358 | | |
Net asset value, offering and redemption price
per share: Advisor Class | | $ | 35.21 | | | $ | 8.83 | | |
Advisor Class—Net assets | | $ | 596,576 | | | $ | 15,279 | | |
Advisor Class—Shares outstanding (Unlimited
shares authorized) | | | 16,945 | | | | 1,730 | | |
Net asset value, offering and redemption price
per share: Institutional Class | | $ | 35.20 | | | $ | 8.83 | | |
Institutional Class—Net assets | | $ | 1,170,516 | | | $ | 14,508 | | |
Institutional Class—Shares outstanding (Unlimited
shares authorized) | | | 33,252 | | | | 1,643 | | |
Net asset value, offering and redemption price
per share: R6 Class | | $ | 35.20 | | | $ | 8.83 | | |
R6 Class—Net assets | | $ | 292,645 | | | $ | 94,562 | | |
R6 Class—Shares outstanding (Unlimited
shares authorized) | | | 8,314 | | | | 10,708 | | |
| (a) Identified cost of investments in unaffiliated securities. | | $ | 5,580,114 | | | $ | 154,373 | | |
| (b) Amount rounds to less than $1,000. | | | | | | | | | |
| (c) Identified cost of foreign currency. | | | 0 | | | | 0 | | |
| (d) Written options premiums received of $720 (in thousands) for the Oakmark Equity and Income Fund. | | | | | | | | | |
| (e) Net assets have been rounded for presentation purposes. The net asset value per share shown is as reported on March 31, 2024. | | | | | | | | | |
See accompanying Notes to Financial Statements.
Oakmark.com 57
Oakmark Funds
Statements of Operations—March 31, 2024 (Unaudited)
(in thousands)
| | | Oakmark
Fund | | Oakmark
Select
Fund | | Oakmark
Global
Fund | |
Investment Income: | |
Dividends from unaffiliated securities | | $ | 174,253 | | | $ | 29,888 | | | $ | 8,148 | | |
Interest income from unaffiliated securities | | | 35,098 | | | | 13,679 | | | | 950 | | |
Other income | | | 6,479 | | | | 6,312 | | | | 1 | | |
Foreign taxes withheld | | | (632 | ) | | | 0 | | | | (172 | ) | |
Total investment income | | | 215,198 | | | | 49,879 | | | | 8,927 | | |
Expenses: | |
Investment advisory fee | | | 57,243 | | | | 20,774 | | | | 4,713 | | |
Transfer and dividend disbursing agent fees | | | 421 | | | | 208 | | | | 96 | | |
Other shareholder servicing fees—Investor Class | | | 2,579 | | | | 500 | | | | 154 | | |
Other shareholder servicing fees—Advisor Class | | | 831 | | | | 1,941 | | | | 39 | | |
Other shareholder servicing fees—Institutional Class | | | 1,288 | | | | 103 | | | | 53 | | |
Service fee—Investor Class | | | 8,989 | | | | 1,544 | | | | 519 | | |
Reports to shareholders | | | 349 | | | | 178 | | | | 20 | | |
Custody and accounting fees | | | 145 | | | | 67 | | | | 69 | | |
Registration and blue sky expenses | | | 159 | | | | 70 | | | | 35 | | |
Trustees fees | | | 501 | | | | 236 | | | | 147 | | |
Legal fees | | | 161 | | | | 82 | | | | 55 | | |
Audit and tax services fees | | | 29 | | | | 28 | | | | 28 | | |
Other | | | 268 | | | | 130 | | | | 79 | | |
Total expenses | | | 72,963 | | | | 25,861 | | | | 6,007 | | |
Net expenses | | | 72,963 | | | | 25,861 | | | | 6,007 | | |
Net investment income | | $ | 142,235 | | | $ | 24,018 | | | $ | 2,920 | | |
Net realized and unrealized gain (loss): | |
Net realized gain (loss) on: | |
Unaffiliated investments | | | 28,704 | | | | (77,637 | ) | | | 12,213 | | |
Unaffiliated in-kind transactions | | | 1,230,006 | | | | 496,866 | | | | 64,378 | | |
Foreign currency transactions | | | 0 | | | | 0 | | | | (36 | ) | |
Purchased options | | | (28,202 | ) | | | 15,874 | | | | 0 | | |
Written options | | | 23,203 | | | | 9,563 | | | | 0 | | |
Net realized gain | | | 1,253,711 | | | | 444,666 | | | | 76,555 | | |
Net change in unrealized appreciation (depreciation) on: | |
Unaffiliated investments | | | 2,908,929 | | | | 709,638 | | | | 59,699 | | |
Securities sold short | | | 1,017 | | | | 0 | | | | 33 | | |
Foreign currency translation | | | 0 | | | | 0 | | | | 13 | | |
Written options | | | (10,343 | ) | | | 0 | | | | 0 | | |
Net change in unrealized appreciation (depreciation) | | | 2,899,603 | | | | 709,638 | | | | 59,745 | | |
Net realized and unrealized gain | | | 4,153,314 | | | | 1,154,304 | | | | 136,300 | | |
Net increase (decrease) in net assets resulting from
operations | | $ | 4,295,549 | | | $ | 1,178,322 | | | $ | 139,220 | | |
See accompanying Notes to Financial Statements.
58 OAKMARK FUNDS
Oakmark Funds
Statements of Operations—March 31, 2024 (Unaudited) (continued)
(in thousands)
| | | Oakmark
Global Select
Fund | | Oakmark
International
Fund | | Oakmark
International
Small Cap Fund | |
Investment Income: | |
Dividends from unaffiliated securities | | $ | 5,618 | | | $ | 150,991 | | | $ | 15,556 | | |
Interest income from unaffiliated securities | | | 1,003 | | | | 15,484 | | | | 1,100 | | |
Other income | | | 38 | | | | 26 | | | | 1,552 | | |
Foreign taxes withheld | | | (358 | ) | | | 9,935 | | | | (3,025 | ) | |
Total investment income | | | 6,301 | | | | 176,436 | | | | 15,183 | | |
Expenses: | |
Investment advisory fee | | | 4,115 | | | | 70,656 | | | | 6,818 | | |
Transfer and dividend disbursing agent fees | | | 36 | | | | 215 | | | | 42 | | |
Other shareholder servicing fees—Investor Class | | | 101 | | | | 1,907 | | | | 121 | | |
Other shareholder servicing fees—Advisor Class | | | 83 | | | | 1,557 | | | | 97 | | |
Other shareholder servicing fees—Institutional Class | | | 136 | | | | 2,130 | | | | 90 | | |
Service fee—Investor Class | | | 360 | | | | 6,306 | | | | 368 | | |
Reports to shareholders | | | 19 | | | | 753 | | | | 37 | | |
Custody and accounting fees | | | 56 | | | | 551 | | | | 104 | | |
Registration and blue sky expenses | | | 44 | | | | 178 | | | | 44 | | |
Trustees fees | | | 136 | | | | 616 | | | | 147 | | |
Legal fees | | | 55 | | | | 173 | | | | 56 | | |
Audit and tax services fees | | | 39 | | | | 34 | | | | 40 | | |
Other | | | 78 | | | | 296 | | | | 81 | | |
Total expenses | | | 5,258 | | | | 85,372 | | | | 8,045 | | |
Net expenses | | | 5,258 | | | | 85,372 | | | | 8,045 | | |
Net investment income | | $ | 1,043 | | | $ | 91,064 | | | $ | 7,138 | | |
Net realized and unrealized gain (loss): | |
Net realized gain (loss) on: | |
Unaffiliated investments | | | 6,619 | | | | 734,830 | (a) | | | 62,908 | | |
Unaffiliated in-kind transactions | | | 89,036 | | | | 0 | | | | 0 | | |
Foreign currency transactions | | | (326 | ) | | | (2,836 | ) | | | 362 | | |
Net realized gain | | | 95,329 | | | | 731,994 | | | | 63,270 | | |
Net change in unrealized appreciation (depreciation) on: | |
Unaffiliated investments | | | 25,169 | | | | 1,125,753 | (b) | | | 88,941 | | |
Affiliated investments | | | 0 | | | | (274,472 | ) | | | 0 | | |
Securities sold short | | | 67 | | | | 0 | | | | 0 | | |
Foreign currency translation | | | (4 | ) | | | 66 | | | | (74 | ) | |
Net change in unrealized appreciation (depreciation) | | | 25,232 | | | | 851,347 | | | | 88,867 | | |
Net realized and unrealized gain | | | 120,561 | | | | 1,583,341 | | | | 152,137 | | |
Net increase (decrease) in net assets resulting from
operations | | $ | 121,604 | | | $ | 1,674,405 | | | $ | 159,275 | | |
(a) Net of capital gain withholding taxes of $2,197 (in thousands) for the Oakmark International Fund.
(b) Includes net change in capital gain withholding taxes of $2,473 (in thousands) for the Oakmark International Fund.
See accompanying Notes to Financial Statements.
Oakmark.com 59
Oakmark Funds
Statements of Operations—March 31, 2024 (Unaudited) (continued)
(in thousands)
| | | Oakmark
Equity and
Income Fund | | Oakmark
Bond
Fund | |
Investment Income: | |
Dividends from unaffiliated securities | | $ | 35,488 | | | $ | 68 | | |
Interest income from unaffiliated securities | | | 63,627 | | | | 3,308 | | |
Total investment income | | | 99,115 | | | | 3,376 | | |
Expenses: | |
Investment advisory fee | | | 16,689 | | | | 236 | | |
Transfer and dividend disbursing agent fees | | | 251 | | | | 3 | | |
Other shareholder servicing fees—Investor Class | | | 1,540 | | | | 5 | | |
Other shareholder servicing fees—Advisor Class | | | 140 | | | | 3 | | |
Other shareholder servicing fees—Institutional Class | | | 177 | | | | 1 | | |
Service fee—Investor Class | | | 4,747 | | | | 10 | | |
Reports to shareholders | | | 91 | | | | 0 | (a) | |
Custody and accounting fees | | | 110 | | | | 64 | | |
Registration and blue sky expenses | | | 60 | | | | 28 | | |
Trustees fees | | | 345 | | | | 92 | | |
Legal fees | | | 86 | | | | 47 | | |
Audit and tax services fees | | | 28 | | | | 28 | | |
Other | | | 144 | | | | 39 | | |
Total expenses | | | 24,408 | | | | 556 | | |
Advisory fee waiver / Expense Reimbursement from Advisor | | | 0 | | | | (272 | ) | |
Net expenses | | | 24,408 | | | | 284 | | |
Net investment income | | $ | 74,707 | | | $ | 3,092 | | |
Net realized and unrealized gain (loss): | |
Net realized gain (loss) on: | |
Unaffiliated investments | | | 52,622 | | | | (2,449 | ) | |
Unaffiliated in-kind transactions | | | 292,483 | | | | 0 | | |
Foreign currency transactions | | | (19 | ) | | | 0 | | |
Written options | | | 0 | | | | (183 | ) | |
Net realized gain (loss) | | | 345,086 | | | | (2,632 | ) | |
Net change in unrealized appreciation (depreciation) on: | |
Unaffiliated investments | | | 489,502 | | | | 8,037 | | |
Securities sold short | | | 241 | | | | 0 | | |
Written options | | | (50 | ) | | | 59 | | |
Net change in unrealized appreciation (depreciation) | | | 489,693 | | | | 8,096 | | |
Net realized and unrealized gain | | | 834,779 | | | | 5,464 | | |
Net increase (decrease) in net assets resulting from operations | | $ | 909,486 | | | $ | 8,556 | | |
(a) Amount rounds to less than $1,000.
See accompanying Notes to Financial Statements.
60 OAKMARK FUNDS
Oakmark Funds
Statements of Changes in Net Assets
(in thousands)
| | | Oakmark Fund | |
| | | Six Months Ended
March 31, 2024
(Unaudited) | | Year Ended
September 30, 2023 | |
From Operations: | |
Net investment income | | $ | 142,235 | | | $ | 189,598 | | |
Net realized gain (loss) | | | 1,253,711 | | | | 2,433,754 | | |
Net change in unrealized appreciation (depreciation) | | | 2,899,603 | | | | 1,118,883 | | |
Net increase in net assets from operations | | | 4,295,549 | | | | 3,742,235 | | |
Distributions to shareholders from: | |
Distributions to shareholders—Investor Class | | | (89,756 | ) | | | (61,712 | ) | |
Distributions to shareholders—Advisor Class | | | (27,077 | ) | | | (28,474 | ) | |
Distributions to shareholders—Institutional Class | | | (68,850 | ) | | | (44,072 | ) | |
Distributions to shareholders—R6 Class | | | (29,318 | ) | | | (17,750 | ) | |
Total distributions to shareholders | | | (215,001 | ) | | | (152,008 | ) | |
From Fund share transactions: | |
Proceeds from shares sold—Investor Class | | | 955,281 | | | | 1,108,645 | | |
Proceeds from shares sold—Advisor Class | | | 409,986 | | | | 277,749 | | |
Proceeds from shares sold—Institutional Class | | | 1,178,662 | | | | 1,581,236 | | |
Proceeds from shares sold—R6 Class | | | 2,879,432 | | | | 6,729,283 | | |
Reinvestment of distributions—Investor Class | | | 87,270 | | | | 60,036 | | |
Reinvestment of distributions—Advisor Class | | | 26,091 | | | | 27,043 | | |
Reinvestment of distributions—Institutional Class | | | 60,610 | | | | 38,248 | | |
Reinvestment of distributions—R6 Class | | | 23,464 | | | | 13,612 | | |
Payment for shares redeemed—Investor Class | | | (881,415 | ) | | | (1,433,782 | ) | |
Payment for shares redeemed—Advisor Class | | | (337,166 | ) | | | (1,335,581 | ) | |
Payment for shares redeemed—Institutional Class | | | (521,001 | ) | | | (1,328,206 | ) | |
Payment for shares redeemed—R6 Class | | | (2,678,045 | ) | | | (6,181,816 | ) | |
Net increase (decrease) in net assets from Fund share transactions | | | 1,203,169 | | | | (443,533 | ) | |
Total increase in net assets | | | 5,283,717 | | | | 3,146,694 | | |
Net assets: | |
Beginning of period | | | 16,853,320 | | | | 13,706,626 | | |
End of period | | $ | 22,137,037 | | | $ | 16,853,320 | | |
See accompanying Notes to Financial Statements.
Oakmark.com 61
Oakmark Funds
Statements of Changes in Net Assets (continued)
(in thousands)
| | | Oakmark Fund (continued) | |
| | | Six Months Ended
March 31, 2024
(Unaudited) | | Year Ended
September 30, 2023 | |
Fund share transactions—Investor Class: | |
Shares sold | | | 7,375 | | | | 9,677 | | |
Shares issued in reinvestment of dividends | | | 662 | | | | 585 | | |
Less shares redeemed | | | (6,864 | ) | | | (12,968 | ) | |
Net increase (decrease) in shares outstanding | | | 1,173 | | | | (2,706 | ) | |
Fund share transactions—Advisor Class: | |
Shares sold | | | 3,103 | | | | 2,442 | | |
Shares issued in reinvestment of dividends | | | 198 | | | | 264 | | |
Less shares redeemed | | | (2,564 | ) | | | (12,062 | ) | |
Net increase (decrease) in shares outstanding | | | 737 | | | | (9,356 | ) | |
Fund share transactions—Institutional Class: | |
Shares sold | | | 9,163 | | | | 13,987 | | |
Shares issued in reinvestment of dividends | | | 460 | | | | 373 | | |
Less shares redeemed | | | (3,999 | ) | | | (11,785 | ) | |
Net increase in shares outstanding | | | 5,624 | | | | 2,575 | | |
Fund share transactions—R6 Class: | |
Shares sold | | | 21,586 | | | | 59,388 | | |
Shares issued in reinvestment of dividends | | | 178 | | | | 133 | | |
Less shares redeemed | | | (19,910 | ) | | | (54,330 | ) | |
Net increase in shares outstanding | | | 1,854 | | | | 5,191 | | |
See accompanying Notes to Financial Statements.
62 OAKMARK FUNDS
Oakmark Funds
Statements of Changes in Net Assets (continued)
(in thousands)
| | | Oakmark Select Fund | |
| | | Six Months Ended
March 31, 2024
(Unaudited) | | Year Ended
September 30, 2023 | |
From Operations: | |
Net investment income | | $ | 24,018 | | | $ | 26,834 | | |
Net realized gain (loss) | | | 444,666 | | | | 509,609 | | |
Net change in unrealized appreciation (depreciation) | | | 709,638 | | | | 756,663 | | |
Net increase in net assets from operations | | | 1,178,322 | | | | 1,293,106 | | |
Distributions to shareholders from: | |
Distributions to shareholders—Investor Class | | | (9,049 | ) | | | (4,151 | ) | |
Distributions to shareholders—Advisor Class | | | (19,168 | ) | | | (10,151 | ) | |
Distributions to shareholders—Institutional Class | | | (4,644 | ) | | | (2,342 | ) | |
Distributions to shareholders—R6 Class | | | (4,142 | ) | | | (1,857 | ) | |
Total distributions to shareholders | | | (37,003 | ) | | | (18,501 | ) | |
From Fund share transactions: | |
Proceeds from shares sold—Investor Class | | | 62,562 | | | | 73,244 | | |
Proceeds from shares sold—Advisor Class | | | 364,581 | | | | 563,537 | | |
Proceeds from shares sold—Institutional Class | | | 101,327 | | | | 270,817 | | |
Proceeds from shares sold—R6 Class | | | 1,079,482 | | | | 1,798,794 | | |
Reinvestment of distributions—Investor Class | | | 8,792 | | | | 4,004 | | |
Reinvestment of distributions—Advisor Class | | | 18,994 | | | | 9,975 | | |
Reinvestment of distributions—Institutional Class | | | 4,227 | | | | 2,006 | | |
Reinvestment of distributions—R6 Class | | | 3,735 | | | | 1,836 | | |
Payment for shares redeemed—Investor Class | | | (166,754 | ) | | | (186,133 | ) | |
Payment for shares redeemed—Advisor Class | | | (244,847 | ) | | | (694,227 | ) | |
Payment for shares redeemed—Institutional Class | | | (62,804 | ) | | | (281,093 | ) | |
Payment for shares redeemed—R6 Class | | | (1,068,983 | ) | | | (1,719,535 | ) | |
Net increase (decrease) in net assets from Fund share transactions | | | 100,312 | | | | (156,775 | ) | |
Total increase in net assets | | | 1,241,631 | | | | 1,117,830 | | |
Net assets: | |
Beginning of period | | | 5,342,849 | | | | 4,225,019 | | |
End of period | | $ | 6,584,480 | | | $ | 5,342,849 | | |
See accompanying Notes to Financial Statements.
Oakmark.com 63
Oakmark Funds
Statements of Changes in Net Assets (continued)
(in thousands)
| | | Oakmark Select Fund (continued) | |
| | | Six Months Ended
March 31, 2024
(Unaudited) | | Year Ended
September 30, 2023 | |
Fund share transactions—Investor Class: | |
Shares sold | | | 926 | | | | 1,237 | | |
Shares issued in reinvestment of dividends | | | 126 | | | | 81 | | |
Less shares redeemed | | | (2,471 | ) | | | (3,297 | ) | |
Net decrease in shares outstanding | | | (1,419 | ) | | | (1,979 | ) | |
Fund share transactions—Advisor Class: | |
Shares sold | | | 5,439 | | | | 10,019 | | |
Shares issued in reinvestment of dividends | | | 274 | | | | 202 | | |
Less shares redeemed | | | (3,627 | ) | | | (12,425 | ) | |
Net increase (decrease) in shares outstanding | | | 2,086 | | | | (2,204 | ) | |
Fund share transactions—Institutional Class: | |
Shares sold | | | 1,481 | | | | 4,892 | | |
Shares issued in reinvestment of dividends | | | 61 | | | | 41 | | |
Less shares redeemed | | | (951 | ) | | | (5,168 | ) | |
Net increase (decrease) in shares outstanding | | | 591 | | | | (235 | ) | |
Fund share transactions—R6 Class: | |
Shares sold | | | 16,134 | | | | 31,794 | | |
Shares issued in reinvestment of dividends | | | 54 | | | | 37 | | |
Less shares redeemed | | | (15,885 | ) | | | (29,960 | ) | |
Net increase in shares outstanding | | | 303 | | | | 1,871 | | |
See accompanying Notes to Financial Statements.
64 OAKMARK FUNDS
Oakmark Funds
Statements of Changes in Net Assets (continued)
(in thousands)
| | | Oakmark Global Fund | |
| | | Six Months Ended
March 31, 2024
(Unaudited) | | Year Ended
September 30, 2023 | |
From Operations: | |
Net investment income | | $ | 2,920 | | | $ | 17,870 | | |
Net realized gain (loss) | | | 76,555 | | | | 230,748 | | |
Net change in unrealized appreciation (depreciation) | | | 59,745 | | | | 26,162 | | |
Net increase in net assets from operations | | | 139,220 | | | | 274,780 | | |
Distributions to shareholders from: | |
Distributions to shareholders—Investor Class | | | (25,319 | ) | | | (4,349 | ) | |
Distributions to shareholders—Advisor Class | | | (6,234 | ) | | | (1,648 | ) | |
Distributions to shareholders—Institutional Class | | | (16,375 | ) | | | (3,213 | ) | |
Distributions to shareholders—R6 Class | | | (5,164 | ) | | | (791 | ) | |
Total distributions to shareholders | | | (53,092 | ) | | | (10,001 | ) | |
From Fund share transactions: | |
Proceeds from shares sold—Investor Class | | | 7,285 | | | | 18,572 | | |
Proceeds from shares sold—Advisor Class | | | 4,919 | | | | 6,878 | | |
Proceeds from shares sold—Institutional Class | | | 11,506 | | | | 84,219 | | |
Proceeds from shares sold—R6 Class | | | 144,106 | | | | 359,157 | | |
Reinvestment of distributions—Investor Class | | | 24,634 | | | | 4,240 | | |
Reinvestment of distributions—Advisor Class | | | 5,949 | | | | 1,554 | | |
Reinvestment of distributions—Institutional Class | | | 15,792 | | | | 3,101 | | |
Reinvestment of distributions—R6 Class | | | 4,996 | | | | 747 | | |
Payment for shares redeemed—Investor Class | | | (63,642 | ) | | | (91,795 | ) | |
Payment for shares redeemed—Advisor Class | | | (13,261 | ) | | | (64,813 | ) | |
Payment for shares redeemed—Institutional Class | | | (52,104 | ) | | | (89,787 | ) | |
Payment for shares redeemed—R6 Class | | | (151,456 | ) | | | (337,177 | ) | |
Net decrease in net assets from Fund share transactions | | | (61,276 | ) | | | (105,104 | ) | |
Total increase in net assets | | | 24,852 | | | | 159,675 | | |
Net assets: | |
Beginning of period | | | 1,183,224 | | | | 1,023,549 | | |
End of period | | $ | 1,208,076 | | | $ | 1,183,224 | | |
See accompanying Notes to Financial Statements.
Oakmark.com 65
Oakmark Funds
Statements of Changes in Net Assets (continued)
(in thousands)
| | | Oakmark Global Fund (continued) | |
| | | Six Months Ended
March 31, 2024
(Unaudited) | | Year Ended
September 30, 2023 | |
Fund share transactions—Investor Class: | |
Shares sold | | | 230 | | | | 594 | | |
Shares issued in reinvestment of dividends | | | 772 | | | | 147 | | |
Less shares redeemed | | | (2,011 | ) | | | (2,985 | ) | |
Net decrease in shares outstanding | | | (1,009 | ) | | | (2,244 | ) | |
Fund share transactions—Advisor Class: | |
Shares sold | | | 156 | | | | 227 | | |
Shares issued in reinvestment of dividends | | | 186 | | | | 54 | | |
Less shares redeemed | | | (418 | ) | | | (2,089 | ) | |
Net decrease in shares outstanding | | | (76 | ) | | | (1,808 | ) | |
Fund share transactions—Institutional Class: | |
Shares sold | | | 363 | | | | 2,699 | | |
Shares issued in reinvestment of dividends | | | 495 | | | | 108 | | |
Less shares redeemed | | | (1,630 | ) | | | (2,895 | ) | |
Net decrease in shares outstanding | | | (772 | ) | | | (88 | ) | |
Fund share transactions—R6 Class: | |
Shares sold | | | 4,552 | | | | 11,227 | | |
Shares issued in reinvestment of dividends | | | 157 | | | | 26 | | |
Less shares redeemed | | | (4,744 | ) | | | (10,507 | ) | |
Net increase (decrease) in shares outstanding | | | (35 | ) | | | 746 | | |
See accompanying Notes to Financial Statements.
66 OAKMARK FUNDS
Oakmark Funds
Statements of Changes in Net Assets (continued)
(in thousands)
| | | Oakmark Global Select Fund | |
| | | Six Months Ended
March 31, 2024
(Unaudited) | | Year Ended
September 30, 2023 | |
From Operations: | |
Net investment income | | $ | 1,043 | | | $ | 9,832 | | |
Net realized gain (loss) | | | 95,329 | | | | 136,743 | | |
Net change in unrealized appreciation (depreciation) | | | 25,232 | | | | 115,309 | | |
Net increase in net assets from operations | | | 121,604 | | | | 261,884 | | |
Distributions to shareholders from: | |
Distributions to shareholders—Investor Class | | | (3,008 | ) | | | (1,201 | ) | |
Distributions to shareholders—Advisor Class | | | (1,485 | ) | | | (779 | ) | |
Distributions to shareholders—Institutional Class | | | (5,144 | ) | | | (2,856 | ) | |
Distributions to shareholders—R6 Class | | | (1,360 | ) | | | (666 | ) | |
Total distributions to shareholders | | | (10,997 | ) | | | (5,502 | ) | |
From Fund share transactions: | |
Proceeds from shares sold—Investor Class | | | 5,831 | | | | 16,564 | | |
Proceeds from shares sold—Advisor Class | | | 15,528 | | | | 9,834 | | |
Proceeds from shares sold—Institutional Class | | | 13,370 | | | | 45,815 | | |
Proceeds from shares sold—R6 Class | | | 192,765 | | | | 297,502 | | |
Reinvestment of distributions—Investor Class | | | 2,909 | | | | 1,172 | | |
Reinvestment of distributions—Advisor Class | | | 1,457 | | | | 757 | | |
Reinvestment of distributions—Institutional Class | | | 4,190 | | | | 2,309 | | |
Reinvestment of distributions—R6 Class | | | 1,332 | | | | 663 | | |
Payment for shares redeemed—Investor Class | | | (55,747 | ) | | | (86,664 | ) | |
Payment for shares redeemed—Advisor Class | | | (33,891 | ) | | | (60,172 | ) | |
Payment for shares redeemed—Institutional Class | | | (60,062 | ) | | | (114,329 | ) | |
Payment for shares redeemed—R6 Class | | | (194,714 | ) | | | (296,568 | ) | |
Net decrease in net assets from Fund share transactions | | | (107,032 | ) | | | (183,117 | ) | |
Total increase in net assets | | | 3,575 | | | | 73,265 | | |
Net assets: | |
Beginning of period | | | 1,061,408 | | | | 988,143 | | |
End of period | | $ | 1,064,983 | | | $ | 1,061,408 | | |
See accompanying Notes to Financial Statements.
Oakmark.com 67
Oakmark Funds
Statements of Changes in Net Assets (continued)
(in thousands)
| | | Oakmark Global Select Fund (continued) | |
| | | Six Months Ended
March 31, 2024
(Unaudited) | | Year Ended
September 30, 2023 | |
Fund share transactions—Investor Class: | |
Shares sold | | | 282 | | | | 877 | | |
Shares issued in reinvestment of dividends | | | 138 | | | | 67 | | |
Less shares redeemed | | | (2,678 | ) | | | (4,668 | ) | |
Net decrease in shares outstanding | | | (2,258 | ) | | | (3,724 | ) | |
Fund share transactions—Advisor Class: | |
Shares sold | | | 750 | | | | 535 | | |
Shares issued in reinvestment of dividends | | | 70 | | | | 43 | | |
Less shares redeemed | | | (1,585 | ) | | | (3,323 | ) | |
Net decrease in shares outstanding | | | (765 | ) | | | (2,745 | ) | |
Fund share transactions—Institutional Class: | |
Shares sold | | | 648 | | | | 2,427 | | |
Shares issued in reinvestment of dividends | | | 199 | | | | 132 | | |
Less shares redeemed | | | (2,882 | ) | | | (6,098 | ) | |
Net decrease in shares outstanding | | | (2,035 | ) | | | (3,539 | ) | |
Fund share transactions—R6 Class: | |
Shares sold | | | 9,248 | | | | 15,115 | | |
Shares issued in reinvestment of dividends | | | 63 | | | | 38 | | |
Less shares redeemed | | | (9,255 | ) | | | (14,987 | ) | |
Net increase in shares outstanding | | | 56 | | | | 166 | | |
See accompanying Notes to Financial Statements.
68 OAKMARK FUNDS
Oakmark Funds
Statements of Changes in Net Assets (continued)
(in thousands)
| | | Oakmark International Fund | |
| | | Six Months Ended
March 31, 2024
(Unaudited) | | Year Ended
September 30, 2023 | |
From Operations: | |
Net investment income | | $ | 91,064 | | | $ | 438,918 | | |
Net realized gain (loss) | | | 731,994 | | | | (2,067,235 | ) | |
Net change in unrealized appreciation (depreciation) | | | 851,347 | | | | 7,186,877 | | |
Net increase in net assets from operations | | | 1,674,405 | | | | 5,558,560 | | |
Distributions to shareholders from: | |
Distributions to shareholders—Investor Class | | | (109,012 | ) | | | (168,264 | ) | |
Distributions to shareholders—Advisor Class | | | (52,642 | ) | | | (83,923 | ) | |
Distributions to shareholders—Institutional Class | | | (187,845 | ) | | | (267,697 | ) | |
Distributions to shareholders—R6 Class | | | (60,520 | ) | | | (75,355 | ) | |
Total distributions to shareholders | | | (410,019 | ) | | | (595,239 | ) | |
From Fund share transactions: | |
Proceeds from shares sold—Investor Class | | | 240,986 | | | | 927,733 | | |
Proceeds from shares sold—Advisor Class | | | 295,769 | | | | 552,209 | | |
Proceeds from shares sold—Institutional Class | | | 1,230,796 | | | | 1,879,041 | | |
Proceeds from shares sold—R6 Class | | | 215,711 | | | | 1,227,050 | | |
Reinvestment of distributions—Investor Class | | | 102,241 | | | | 158,296 | | |
Reinvestment of distributions—Advisor Class | | | 52,178 | | | | 82,906 | | |
Reinvestment of distributions—Institutional Class | | | 126,725 | | | | 165,754 | | |
Reinvestment of distributions—R6 Class | | | 50,785 | | | | 69,927 | | |
Payment for shares redeemed—Investor Class | | | (961,108 | ) | | | (1,769,957 | ) | |
Payment for shares redeemed—Advisor Class | | | (524,286 | ) | | | (989,684 | ) | |
Payment for shares redeemed—Institutional Class | | | (1,083,964 | ) | | | (3,317,614 | ) | |
Payment for shares redeemed—R6 Class | | | (277,852 | ) | | | (1,588,542 | ) | |
Net decrease in net assets from Fund share transactions | | | (532,019 | ) | | | (2,602,881 | ) | |
Total increase in net assets | | | 732,367 | | | | 2,360,440 | | |
Net assets: | |
Beginning of period | | | 19,279,301 | | | | 16,918,861 | | |
End of period | | $ | 20,011,668 | | | $ | 19,279,301 | | |
See accompanying Notes to Financial Statements.
Oakmark.com 69
Oakmark Funds
Statements of Changes in Net Assets (continued)
(in thousands)
| | | Oakmark International Fund (continued) | |
| | | Six Months Ended
March 31, 2024
(Unaudited) | | Year Ended
September 30, 2023 | |
Fund share transactions—Investor Class: | |
Shares sold | | | 9,420 | | | | 37,083 | | |
Shares issued in reinvestment of dividends | | | 3,829 | | | | 6,873 | | |
Less shares redeemed | | | (37,673 | ) | | | (71,822 | ) | |
Net decrease in shares outstanding | | | (24,424 | ) | | | (27,866 | ) | |
Fund share transactions—Advisor Class: | |
Shares sold | | | 11,762 | | | | 22,498 | | |
Shares issued in reinvestment of dividends | | | 1,959 | | | | 3,608 | | |
Less shares redeemed | | | (20,853 | ) | | | (39,903 | ) | |
Net decrease in shares outstanding | | | (7,132 | ) | | | (13,797 | ) | |
Fund share transactions—Institutional Class: | |
Shares sold | | | 48,586 | | | | 75,119 | | |
Shares issued in reinvestment of dividends | | | 4,759 | | | | 7,213 | | |
Less shares redeemed | | | (42,171 | ) | | | (135,163 | ) | |
Net increase (decrease) in shares outstanding | | | 11,174 | | | | (52,831 | ) | |
Fund share transactions—R6 Class: | |
Shares sold | | | 8,359 | | | | 47,279 | | |
Shares issued in reinvestment of dividends | | | 1,907 | | | | 3,043 | | |
Less shares redeemed | | | (10,989 | ) | | | (66,566 | ) | |
Net decrease in shares outstanding | | | (723 | ) | | | (16,244 | ) | |
See accompanying Notes to Financial Statements.
70 OAKMARK FUNDS
Oakmark Funds
Statements of Changes in Net Assets (continued)
(in thousands)
| | | Oakmark International Small Cap Fund | |
| | | Six Months Ended
March 31, 2024
(Unaudited) | | Year Ended
September 30, 2023 | |
From Operations: | |
Net investment income | | $ | 7,138 | | | $ | 28,283 | | |
Net realized gain (loss) | | | 63,270 | | | | (1,831 | ) | |
Net change in unrealized appreciation (depreciation) | | | 88,867 | | | | 396,824 | | |
Net increase in net assets from operations | | | 159,275 | | | | 423,276 | | |
Distributions to shareholders from: | |
Distributions to shareholders—Investor Class | | | (7,113 | ) | | | (6,833 | ) | |
Distributions to shareholders—Advisor Class | | | (3,597 | ) | | | (3,403 | ) | |
Distributions to shareholders—Institutional Class | | | (11,336 | ) | | | (8,950 | ) | |
Distributions to shareholders—R6 Class | | | (6,957 | ) | | | (10,676 | ) | |
Total distributions to shareholders | | | (29,003 | ) | | | (29,862 | ) | |
From Fund share transactions: | |
Proceeds from shares sold—Investor Class | | | 15,531 | | | | 52,310 | | |
Proceeds from shares sold—Advisor Class | | | 20,215 | | | | 40,251 | | |
Proceeds from shares sold—Institutional Class | | | 74,434 | | | | 95,863 | | |
Proceeds from shares sold—R6 Class | | | 14,561 | | | | 51,812 | | |
Reinvestment of distributions—Investor Class | | | 6,873 | | | | 6,610 | | |
Reinvestment of distributions—Advisor Class | | | 3,562 | | | | 3,340 | | |
Reinvestment of distributions—Institutional Class | | | 7,531 | | | | 5,855 | | |
Reinvestment of distributions—R6 Class | | | 3,483 | | | | 6,475 | | |
Payment for shares redeemed—Investor Class | | | (43,819 | ) | | | (101,686 | ) | |
Payment for shares redeemed—Advisor Class | | | (29,700 | ) | | | (57,342 | ) | |
Payment for shares redeemed—Institutional Class | | | (38,428 | ) | | | (62,582 | ) | |
Payment for shares redeemed—R6 Class | | | (19,204 | ) | | | (284,698 | ) | |
Net increase (decrease) in net assets from Fund share transactions | | | 15,039 | | | | (243,792 | ) | |
Total increase in net assets | | | 145,311 | | | | 149,622 | | |
Net assets: | |
Beginning of period | | | 1,317,361 | | | | 1,167,739 | | |
End of period | | $ | 1,462,672 | | | $ | 1,317,361 | | |
See accompanying Notes to Financial Statements.
Oakmark.com 71
Oakmark Funds
Statements of Changes in Net Assets (continued)
(in thousands)
| | | Oakmark International Small Cap Fund (continued) | |
| | | Six Months Ended
March 31, 2024
(Unaudited) | | Year Ended
September 30, 2023 | |
Fund share transactions—Investor Class: | |
Shares sold | | | 831 | | | | 2,966 | | |
Shares issued in reinvestment of dividends | | | 360 | | | | 400 | | |
Less shares redeemed | | | (2,369 | ) | | | (5,896 | ) | |
Net decrease in shares outstanding | | | (1,178 | ) | | | (2,530 | ) | |
Fund share transactions—Advisor Class: | |
Shares sold | | | 1,114 | | | | 2,291 | | |
Shares issued in reinvestment of dividends | | | 186 | | | | 202 | | |
Less shares redeemed | | | (1,604 | ) | | | (3,252 | ) | |
Net decrease in shares outstanding | | | (304 | ) | | | (759 | ) | |
Fund share transactions—Institutional Class: | |
Shares sold | | | 3,995 | | | | 5,467 | | |
Shares issued in reinvestment of dividends | | | 396 | | | | 355 | | |
Less shares redeemed | | | (2,056 | ) | | | (3,601 | ) | |
Net increase in shares outstanding | | | 2,335 | | | | 2,221 | | |
Fund share transactions—R6 Class: | |
Shares sold | | | 784 | | | | 3,022 | | |
Shares issued in reinvestment of dividends | | | 183 | | | | 393 | | |
Less shares redeemed | | | (1,043 | ) | | | (16,498 | ) | |
Net decrease in shares outstanding | | | (76 | ) | | | (13,083 | ) | |
See accompanying Notes to Financial Statements.
72 OAKMARK FUNDS
Oakmark Funds
Statements of Changes in Net Assets (continued)
(in thousands)
| | | Oakmark Equity and Income Fund | |
| | | Six Months Ended
March 31, 2024
(Unaudited) | | Year Ended
September 30, 2023 | |
From Operations: | |
Net investment income | | $ | 74,707 | | | $ | 138,155 | | |
Net realized gain (loss) | | | 345,086 | | | | 579,672 | | |
Net change in unrealized appreciation (depreciation) | | | 489,693 | | | | 115,741 | | |
Net increase in net assets from operations | | | 909,486 | | | | 833,568 | | |
Distributions to shareholders from: | |
Distributions to shareholders—Investor Class | | | (124,429 | ) | | | (62,568 | ) | |
Distributions to shareholders—Advisor Class | | | (18,027 | ) | | | (13,222 | ) | |
Distributions to shareholders—Institutional Class | | | (34,375 | ) | | | (15,641 | ) | |
Distributions to shareholders—R6 Class | | | (9,178 | ) | | | (1,576 | ) | |
Total distributions to shareholders | | | (186,009 | ) | | | (93,007 | ) | |
From Fund share transactions: | |
Proceeds from shares sold—Investor Class | | | 105,258 | | | | 186,138 | | |
Proceeds from shares sold—Advisor Class | | | 37,911 | | | | 26,600 | | |
Proceeds from shares sold—Institutional Class | | | 81,484 | | | | 384,625 | | |
Proceeds from shares sold—R6 Class | | | 653,282 | | | | 1,517,989 | | |
Reinvestment of distributions—Investor Class | | | 119,699 | | | | 59,853 | | |
Reinvestment of distributions—Advisor Class | | | 17,259 | | | | 12,510 | | |
Reinvestment of distributions—Institutional Class | | | 30,527 | | | | 13,944 | | |
Reinvestment of distributions—R6 Class | | | 7,799 | | | | 1,537 | | |
Payment for shares redeemed—Investor Class | | | (352,008 | ) | | | (749,496 | ) | |
Payment for shares redeemed—Advisor Class | | | (72,511 | ) | | | (318,053 | ) | |
Payment for shares redeemed—Institutional Class | | | (94,638 | ) | | | (390,328 | ) | |
Payment for shares redeemed—R6 Class | | | (633,137 | ) | | | (1,395,873 | ) | |
Net decrease in net assets from Fund share transactions | | | (99,075 | ) | | | (650,554 | ) | |
Total increase in net assets | | | 624,402 | | | | 90,007 | | |
Net assets: | |
Beginning of period | | | 6,024,648 | | | | 5,934,641 | | |
End of period | | $ | 6,649,050 | | | $ | 6,024,648 | | |
See accompanying Notes to Financial Statements.
Oakmark.com 73
Oakmark Funds
Statements of Changes in Net Assets (continued)
(in thousands)
| | | Oakmark Equity and Income Fund (continued) | |
| | | Six Months Ended
March 31, 2024
(Unaudited) | | Year Ended
September 30, 2023 | |
Fund share transactions—Investor Class: | |
Shares sold | | | 3,187 | | | | 6,025 | | |
Shares issued in reinvestment of dividends | | | 3,538 | | | | 2,015 | | |
Less shares redeemed | | | (10,636 | ) | | | (24,544 | ) | |
Net decrease in shares outstanding | | | (3,911 | ) | | | (16,504 | ) | |
Fund share transactions—Advisor Class: | |
Shares sold | | | 1,142 | | | | 858 | | |
Shares issued in reinvestment of dividends | | | 511 | | | | 422 | | |
Less shares redeemed | | | (2,173 | ) | | | (10,310 | ) | |
Net decrease in shares outstanding | | | (520 | ) | | | (9,030 | ) | |
Fund share transactions—Institutional Class: | |
Shares sold | | | 2,444 | | | | 12,467 | | |
Shares issued in reinvestment of dividends | | | 903 | | | | 470 | | |
Less shares redeemed | | | (2,859 | ) | | | (12,862 | ) | |
Net increase in shares outstanding | | | 488 | | | | 75 | | |
Fund share transactions—R6 Class: | |
Shares sold | | | 19,629 | | | | 48,997 | | |
Shares issued in reinvestment of dividends | | | 231 | | | | 52 | | |
Less shares redeemed | | | (18,935 | ) | | | (44,921 | ) | |
Net increase in shares outstanding | | | 925 | | | | 4,128 | | |
See accompanying Notes to Financial Statements.
74 OAKMARK FUNDS
Oakmark Funds
Statements of Changes in Net Assets (continued)
(in thousands)
| | | Oakmark Bond Fund | |
| | | Six Months Ended
March 31, 2024
(Unaudited) | | Year Ended
September 30, 2023 | |
From Operations: | |
Net investment income | | $ | 3,092 | | | $ | 4,230 | | |
Net realized gain (loss) | | | (2,632 | ) | | | (4,713 | ) | |
Net change in unrealized appreciation (depreciation) | | | 8,096 | | | | 1,984 | | |
Net increase in net assets from operations | | | 8,556 | | | | 1,501 | | |
Distributions to shareholders from: | |
Distributions to shareholders—Investor Class | | | (221 | ) | | | (44 | ) | |
Distributions to shareholders—Advisor Class | | | (122 | ) | | | (50 | ) | |
Distributions to shareholders—Institutional Class | | | (141 | ) | | | (127 | ) | |
Distributions to shareholders—R6 Class | | | (2,510 | ) | | | (3,974 | ) | |
Total distributions to shareholders | | | (2,994 | ) | | | (4,195 | ) | |
From Fund share transactions: | |
Proceeds from shares sold—Investor Class | | | 29,992 | | | | 757 | | |
Proceeds from shares sold—Advisor Class | | | 14,726 | | | | 290 | | |
Proceeds from shares sold—Institutional Class | | | 13,692 | | | | 4,687 | | |
Proceeds from shares sold—R6 Class | | | 8,071 | | | | 30,907 | | |
Reinvestment of distributions—Investor Class | | | 219 | | | | 41 | | |
Reinvestment of distributions—Advisor Class | | | 121 | | | | 50 | | |
Reinvestment of distributions—Institutional Class | | | 141 | | | | 127 | | |
Reinvestment of distributions—R6 Class | | | 2,199 | | | | 3,123 | | |
Payment for shares redeemed—Investor Class | | | (1,892 | ) | | | (667 | ) | |
Payment for shares redeemed—Advisor Class | | | (421 | ) | | | (929 | ) | |
Payment for shares redeemed—Institutional Class | | | (2,034 | ) | | | (5,246 | ) | |
Payment for shares redeemed—R6 Class | | | (23,673 | ) | | | (10,021 | ) | |
Net increase in net assets from Fund share transactions | | | 41,141 | | | | 23,119 | | |
Total increase in net assets | | | 46,703 | | | | 20,425 | | |
Net assets: | |
Beginning of period | | | 107,250 | | | | 86,825 | | |
End of period | | $ | 153,953 | | | $ | 107,250 | | |
See accompanying Notes to Financial Statements.
Oakmark.com 75
Oakmark Funds
Statements of Changes in Net Assets (continued)
(in thousands)
| | | Oakmark Bond Fund (continued) | |
| | | Six Months Ended
March 31, 2024
(Unaudited) | | Year Ended
September 30, 2023 | |
Fund share transactions—Investor Class: | |
Shares sold | | | 3,415 | | | | 86 | | |
Shares issued in reinvestment of dividends | | | 25 | | | | 5 | | |
Less shares redeemed | | | (216 | ) | | | (75 | ) | |
Net increase in shares outstanding | | | 3,224 | | | | 16 | | |
Fund share transactions—Advisor Class: | |
Shares sold | | | 1,671 | | | | 34 | | |
Shares issued in reinvestment of dividends | | | 14 | | | | 6 | | |
Less shares redeemed | | | (48 | ) | | | (107 | ) | |
Net increase (decrease) in shares outstanding | | | 1,637 | | | | (67 | ) | |
Fund share transactions—Institutional Class: | |
Shares sold | | | 1,554 | | | | 540 | | |
Shares issued in reinvestment of dividends | | | 16 | | | | 14 | | |
Less shares redeemed | | | (230 | ) | | | (604 | ) | |
Net increase (decrease) in shares outstanding | | | 1,340 | | | | (50 | ) | |
Fund share transactions—R6 Class: | |
Shares sold | | | 933 | | | | 3,560 | | |
Shares issued in reinvestment of dividends | | | 253 | | | | 360 | | |
Less shares redeemed | | | (2,699 | ) | | | (1,153 | ) | |
Net increase (decrease) in shares outstanding | | | (1,513 | ) | | | 2,767 | | |
See accompanying Notes to Financial Statements.
76 OAKMARK FUNDS
Oakmark Funds
Notes to Financial Statements
1. ORGANIZATION
The following are the significant accounting policies of Oakmark Fund ("Oakmark"), Oakmark Select Fund ("Select"), Oakmark Global Fund ("Global"), Oakmark Global Select Fund ("Global Select"), Oakmark International Fund ("International"), Oakmark International Small Cap Fund ("Int'l Small Cap"), Oakmark Equity and Income Fund ("Equity and Income") and Oakmark Bond Fund ("Bond") collectively referred to as the "Funds," each a series of Harris Associates Investment Trust (the "Trust"), a Massachusetts business trust, organized on February 1, 1991, which is registered as an open-end management investment company under the Investment Company Act of 1940, as amended (the "1940 Act") and accordingly follows the investment company accounting and reporting guidance of the Financial Accounting Standards Board ("FASB") Accounting Standards Codification ("ASC") Topic 946 Financial Services—Investment Companies. Each Fund, other than Select and Global Select, is diversified in accordance with the 1940 Act. The following policies are in conformity with accounting principles generally accepted in the United States of America ("GAAP"). The presentation of financial statements in conformity with GAAP requires management to make estimates and assumptions that affect the reported amounts of assets and liabilities at the date of the financial statements and the reported amounts of revenues and expenses during the reporting period. Actual results could differ from those estimates and assumptions.
Each Fund offers four classes of shares: Investor Class Shares, Advisor Class Shares, Institutional Class Shares and R6 Class Shares. Shares of each Class are offered for purchase directly from the Funds and through certain intermediaries who have entered into an agreement with the Funds' distributor and/or Harris Associates L.P., investment adviser to the Funds (the "Adviser"). Investor Class Shares are also offered to certain retirement plans, such as 401(k) and profit sharing plans. Investor Class Shares of a Fund pay a service fee not to exceed 0.25% per annum of the average daily net assets of the Fund's Investor Shares. This service fee is paid to third-party intermediaries who provide services for and/or maintain shareholder accounts.
Income, realized and unrealized capital gains and losses, and expenses of the Funds not directly attributable to a specific class of shares are allocated to each class pro rata based on the relative net assets of each class. Transfer and dividend disbursing agent fees, service fees, other shareholder servicing fees, and reports to shareholders expenses are specific to each class.
2. SIGNIFICANT ACCOUNTING POLICIES
Security valuation
A Fund's share price is also called the net asset value (the "NAV") of a share. The NAV per share of each class of each Fund is normally determined by the Funds' custodian as of the close of regular session trading (usually 4:00 p.m. Eastern time) on the New York Stock Exchange (the "NYSE") on any day on which the NYSE is open for regular trading. If the NYSE is unexpectedly closed on a day it would normally be open for business, or if the NYSE has an unscheduled early closure, the Funds reserve the right to accept purchase and redemption orders and calculate their share price as of the normally scheduled close of regular trading on the NYSE for that day.
The NYSE is closed on Saturdays and Sundays and on New Year's Day, the third Mondays in January and February, Good Friday, the last Monday in May, Juneteenth, Independence Day, Labor Day, Thanksgiving, and Christmas. If one of these holidays falls on a Saturday or Sunday, the NYSE will be closed on the preceding Friday or the following Monday, respectively. A Fund's NAV will not be calculated on days when the NYSE is closed. The NAV of a class of Fund shares is determined by dividing the value of the assets attributable to that class, less liabilities attributable to that class, by the number of outstanding shares of that class.
Trading in securities of non-U.S. issuers takes place in various markets on some days and at times when the NYSE is not open for trading. In addition, securities of non-U.S. issuers may not trade on some days when the NYSE is open for trading. The value of the Funds' portfolio holdings may change on days when the NYSE is not open for trading and you cannot purchase or redeem Fund shares.
Equity securities principally traded on securities exchanges in the United States are valued at the last reported sale price or the official closing price as of the time of valuation on that exchange, or lacking a reported sale price on the principal exchange at the time of valuation, at the most recent bid quotation on the principal exchange. Each over-the-counter security traded on the NASDAQ National Market System shall be valued at the NASDAQ Official Closing Price ("NOCP"), or lacking a NOCP at the time of valuation, at the most recent bid quotation. Other over-the-counter securities are valued at the last sales prices at the time of valuation or, lacking any reported sales on that day, at the most recent bid quotations.
Each equity security principally traded on a securities exchange outside the United States shall be valued, depending on local convention or regulation, at the last sale price, the last bid or asked price, the mean between the last bid and asked prices, the official closing price, an auction price, or the pricing convention accepted as the official closing price by MSCI for their index calculations. If there are unexpected disruptions in the primary market or valuations from the primary market are deemed suspect, equity securities may be valued based on a pricing composite or valuations from another exchange as of the close of the regular trading hours on the appropriate exchange or other designated time.
Short-term debt instruments (i.e., debt instruments whose maturities or expiration dates at the time of acquisition are one year or less) or money market instruments are valued at the latest bid quotation or an evaluated price from an independent pricing service. If a bid quotation or evaluated price from a pricing vendor is not available for short-term debt instrument or money market instrument maturing in 60 days or less from date of valuation, such instruments are valued at amortized cost, which approximates market value.
Oakmark.com 77
Oakmark Funds
Notes to Financial Statements (continued)
Long-term debt instruments are valued at the latest bid quotation or at an evaluated price provided by an independent pricing service. The pricing service may use standard inputs, such as benchmark yields, reported trades, broker-dealer quotes, issuer spreads, two-sided markets, benchmark securities, bids, offers, and reference data, including market research publications. For certain security types, additional inputs may be used or some of the standard inputs may not be applicable. Additionally, the pricing service monitors market indicators and industry and economic events, which may serve as a trigger to gather and possibly use additional market data.
Options are valued at the mean of the most recent bid and asked quotations. In the event an option is out of the money and no bid is available, a zero value may be assumed as the bid for purposes of calculating the mean of the most recent bid and ask quotations. In the event that designated pricing vendors are unable to provide valuations or timely valuations for Flexible Exchange ("FLEX") options on a given day, each FLEX option purchased or written may be valued using the Option Valuation ("OVME") function on Bloomberg. The OVME function requires objective inputs (strike price, exercise style and expiration dates) to derive a valuation using Bloomberg's proprietary calculations. If Flex options are valued using the OVME function, they shall be valued at the mid of the buy and sell valuations produced by OVME.
To the extent available, prices for all portfolio investments held by the Funds shall be obtained from one or more pricing vendors designated by the custodian. If values or prices are not readily available or are deemed unreliable, or if an event that is expected to affect the value of a portfolio security occurs after the close of the primary market or exchange on which that security is traded and before the close of the NYSE, the security will be valued at a fair value determined in good faith in accordance with the Funds' valuation procedures approved by the Board. As permitted by Rule 2a-5 of the 1940 Act, the Board has designated the Adviser as the Funds' valuation designee (as defined in the rule). The valuation designee is responsible for determining fair value in good faith for any and all Fund investments, subject to oversight by the Board. The Funds may use a systematic fair valuation model provided by an independent pricing service to value securities of non-U.S. issuers in order to adjust for changes in value that may occur between the close of certain foreign exchanges and the NYSE. All assets and liabilities initially expressed in foreign currencies are converted into U.S. dollars at a current exchange price quoted by an independent pricing service or any major bank or dealer. If such quotations are not available, the rate of exchange will be determined in good faith in accordance with Fund policies and procedures. Although fair valuation may be more commonly used with equity securities of non-U.S. issuers, it also may be used in a range of other circumstances, including thinly-traded domestic securities or fixed-income securities. When fair value pricing is employed, the value of a portfolio security used by a Fund to calculate its NAV may differ from quoted or published prices for the same security.
Fair value measurement
Various inputs are used in determining the value of each Fund's investments. These inputs are prioritized into three broad levels as follows:
Level 1—quoted prices in active markets for identical securities
Level 2—other significant observable inputs (including quoted prices for similar investments, interest rates, prepayment speeds, credit risk and others)
Level 3—significant unobservable inputs (including the assumptions of the Adviser in determining the fair value of investments)
Observable inputs are those based on market data obtained from independent sources and unobservable inputs reflect the Adviser's own assumptions based on the best information available. The input levels are not necessarily an indication of risk or liquidity associated with investing in those securities.
The following is a summary of the inputs used as of March 31, 2024, in valuing each Fund's assets and liabilities. Except for the industries or investment types separately stated below, the total amounts for common stocks, fixed income and short-term investments in the table below are presented by industry or investment type in each Fund's Schedule of Investments. Information on forward foreign currency contracts is presented in each Fund's Schedule of Investments.
(in thousands) | | Quoted Prices
in Active
Markets for
Identical
Assets
(Level 1) | | Other
Significant
Observable
Inputs
(Level 2) | | Significant
Unobservable
Inputs
(Level 3) | |
Oakmark | | | | | | | | | | | | | |
Common Stocks | | $ | 20,635,963 | | | $ | 0 | | | $ | 0 | | |
Short-Term Investments | | | 0 | | | | 1,754,068 | | | | 0 | | |
Total | | $ | 20,635,963 | | | $ | 1,754,068 | | | $ | 0 | | |
Select | | | | | | | | | | | | | |
Common Stocks | | $ | 6,174,333 | | | $ | 0 | | | $ | 0 | | |
Short-Term Investments | | | 0 | | | | 424,003 | | | | 0 | | |
Total | | $ | 6,174,333 | | | $ | 424,003 | | | $ | 0 | | |
78 OAKMARK FUNDS
Oakmark Funds
Notes to Financial Statements (continued)
(in thousands) | | Quoted Prices
in Active
Markets for
Identical
Assets
(Level 1) | | Other
Significant
Observable
Inputs
(Level 2) | | Significant
Unobservable
Inputs
(Level 3) | |
Global | | | | | | | | | | | | | |
Common Stocks | | $ | 1,174,977 | | | $ | 0 | | | $ | 0 | | |
Short-Term Investments | | | 0 | | | | 44,028 | | | | 0 | | |
Total | | $ | 1,174,977 | | | $ | 44,028 | | | $ | 0 | | |
Global Select | | | | | | | | | | | | | |
Common Stocks | | $ | 1,004,702 | | | $ | 0 | | | $ | 0 | | |
Preferred Stocks | | | 47,550 | | | | 0 | | | | 0 | | |
Short-Term Investments | | | 0 | | | | 64,837 | | | | 0 | | |
Total | | $ | 1,052,252 | | | $ | 64,837 | | | $ | 0 | | |
International | | | | | | | | | | | | | |
Common Stocks | | $ | 18,680,133 | | | $ | 270,068 | | | $ | 0 | | |
Preferred Stocks | | | 352,320 | | | | 0 | | | | 0 | | |
Short-Term Investments | | | 0 | | | | 602,093 | | | | 0 | | |
Total | | $ | 19,032,453 | | | $ | 872,161 | | | $ | 0 | | |
Int'l Small Cap | | | | | | | | | | | | | |
Common Stocks | | $ | 1,332,930 | | | $ | 57,818 | | | $ | 0 | | |
Short-Term Investments | | | 0 | | | | 58,163 | | | | 0 | | |
Total | | $ | 1,332,930 | | | $ | 115,981 | | | $ | 0 | | |
Equity and Income | | | | | | | | | | | | | |
Common Stocks | | $ | 3,992,453 | | | $ | 0 | | | $ | 0 | | |
Preferred Stocks | | | 5,217 | | | | 0 | | | | 0 | | |
Corporate Bonds | | | 0 | | | | 1,022,838 | | | | 0 | | |
Government and Agency Securities | | | 0 | | | | 569,982 | | | | 0 | | |
Collateralized Mortgage Obligations | | | 0 | | | | 282,790 | | | | 0 | | |
Asset Backed Securities | | | 0 | | | | 278,990 | | | | 0 | | |
Mortgage-Backed Securities | | | 0 | | | | 207,180 | | | | 0 | | |
Bank Loans | | | 0 | | | | 136,436 | | | | 0 | | |
Convertible Bonds | | | 0 | | | | 8,706 | | | | 0 | | |
Short-Term Investments | | | 0 | | | | 194,056 | | | | 0 | | |
Call Options Written - Liabilities | | | (770 | ) | | | 0 | | | | 0 | | |
Total | | $ | 3,996,900 | | | $ | 2,700,978 | | | $ | 0 | | |
Bond | | | | | | | | | | | | | |
Preferred Stocks | | $ | 714 | | | $ | 0 | | | $ | 0 | | |
Corporate Bonds | | | 0 | | | | 58,677 | | | | 0 | | |
Government and Agency Securities | | | 0 | | | | 24,052 | | | | 0 | | |
Collateralized Mortgage Obligations | | | 0 | | | | 22,121 | | | | 0 | | |
Mortgage-Backed Securities | | | 0 | | | | 18,777 | | | | 0 | | |
Bank Loans | | | 0 | | | | 13,934 | | | | 0 | | |
Asset Backed Securities | | | 0 | | | | 12,967 | | | | 0 | | |
Convertible Bond | | | 0 | | | | 440 | | | | 0 | | |
Short-Term Investments | | | 0 | | | | 2,104 | | | | 0 | | |
Total | | $ | 714 | | | $ | 153,072 | | | $ | 0 | | |
Offsetting assets and liabilities
ASC 210 requires entities to disclose gross and net information about instruments and transactions eligible for offset on the Statement of Assets and Liabilities and disclose instruments and transactions subject to master netting or similar agreements.
Oakmark.com 79
Oakmark Funds
Notes to Financial Statements (continued)
This disclosure is limited to derivative instruments, repurchase and reverse repurchase agreements, and securities borrowing and lending transactions.
At March 31, 2024, none of the Funds held open forward foreign currency contracts.
At March 31, 2024, each Fund held investments in repurchase agreements. The gross value of these investments and the value of the related collateral are presented in each Fund's Schedule of Investments. The value of the related collateral for each Fund exceeded the value of the repurchase agreements held at period end.
The value of the securities on loan and the value of the related collateral as of period end, if any, are included in the Securities lending section of Note 2 to Financial Statements.
Foreign currency translations
Certain Funds invest in foreign securities, which may involve a number of risk factors and special considerations not present with investments in securities of U.S. corporations. Values of investments and other assets and liabilities denominated in foreign currencies are translated into U.S. dollars at current exchange rates obtained by a recognized bank, dealer or independent pricing service on the day of valuation. Purchases and sales of investments and dividend and interest income are converted at the prevailing rate of exchange on the respective dates of such transactions.
The Funds do not isolate that portion of the results of operations resulting from changes in foreign exchange rates on investments from the fluctuations arising from changes in market prices of securities held. Such fluctuations are included in net realized gain (loss) on investments and net change in unrealized appreciation (depreciation) on investments in the Statements of Operations. Net realized gains and losses on foreign currency transactions arising from the sale of foreign currencies, currency gains or losses realized between the trade and settlement dates on securities transactions and the difference between the amounts of dividends, interest and tax reclaims recorded and the U.S. dollar equivalent of the amounts actually received or paid are included in net realized gain (loss) on foreign currency transactions in the Statements of Operations. Unrealized gains and losses arising from changes in the fair value of assets and liabilities, other than investments in securities, resulting from changes in exchange rates are included in net change in unrealized appreciation (depreciation) on foreign currency translation in the Statements of Operations.
Forward foreign currency contracts
Forward foreign currency contracts are agreements to exchange one currency for another at a future date and at a specified price. The Funds' transactions in forward foreign currency contracts are limited to transaction and portfolio hedging. The contractual amounts of forward foreign currency contracts do not necessarily represent the amounts potentially subject to risk. The measurement of the risks associated with these instruments is meaningful only when all related and offsetting transactions are considered and could exceed the net unrealized value shown in the tables below. Risks arise from the possible inability of counterparties to meet the terms of their contracts and from movements in currency values. Forward foreign currency contracts are valued at the current day's interpolated foreign exchange rates. Unrealized gain or loss on the contracts, as measured by the difference between the forward foreign exchange rates at the dates of entry into the contracts and the forward rates at the end of the period, if any, is included in the Statements of Assets and Liabilities. Realized gains and losses and the net change in unrealized appreciation (depreciation) on forward foreign currency contracts for the period, if any, are included in the Statements of Operations.
At March 31, 2024, none of the Funds engaged in forward foreign currency contracts.
Security transactions and investment income
Security transactions are accounted for on the trade date (date the order to buy or sell is executed) and dividend income is recorded on the ex-dividend date, except that certain dividends from foreign securities are recorded as soon as the information becomes available after the ex-dividend date. Interest income and expenses are recorded on an accrual basis. Discount is accreted on long-term fixed income securities using the yield-to-maturity method. Premium is amortized on long-term fixed income securities using the yield-to-earliest call method. Withholding taxes and tax reclaims on foreign dividends have been provided for in accordance with the Funds' understanding of the applicable country's tax rules and rates. Net realized gains and losses on investments are determined by the specific identification method.
Short sales
Each Fund may sell a security it does not own in anticipation of a decline in the fair value of that security. When a Fund sells a security short, it must borrow the security sold short and deliver it to the broker-dealer through which it made the short sale. A gain, limited to the price at which the Fund sold the security short, or loss, unlimited in size, will be recognized upon the termination of the short sale. Each Fund may sell shares of when-issued securities. Typically, a Fund sells when-issued securities when a company announces a spin-off or re-organization, and the post spin-off or post reorganization shares begin trading on a when-issued basis prior to the effective date of the corporate action. A sale of a when-issued security is treated as a short sale under the U.S. Generally Accepted Accounting Principles. After the effective date, when shares of the new company are received, any shares sold on a when-issued basis will be delivered to the counterparty. At March 31, 2024, none of the Funds had short sales.
When-issued or delayed-delivery securities
Each Fund may purchase securities on a when-issued or delayed-delivery basis. At March 31, 2024, each Fund qualifies as a limited derivatives user under Rule 18f-4 of the 1940 Act and has adopted policies and procedures to manage its derivatives risk. Although the payment and interest terms of these securities are established at the time a Fund enters into the commitment, the securities may be delivered and paid for a month or more after the date of purchase when their value may have changed. A Fund makes
80 OAKMARK FUNDS
Oakmark Funds
Notes to Financial Statements (continued)
such commitments only with the intention of actually acquiring the securities, but may sell the securities before the settlement date if the Adviser deems it advisable for investment reasons. At March 31, 2024, none of the Funds held when-issued securities.
Accounting for options
When a Fund writes an option, the premium received by the Fund is recorded as a liability and is subsequently adjusted to the current fair value of the option written. Premiums received from writing options that expire are recorded by the Fund on the expiration date as realized gains from option transactions. The difference between the premium and the amount paid on effecting a closing purchase transaction, including brokerage commissions, is also treated as a realized gain, or if the premium is less than the amount paid for the closing purchase transaction, as a realized loss. If a call option is exercised, the premium is added to the proceeds from the sale of the underlying security or currency in determining whether the Fund has realized a gain or a loss. If a put option is exercised, the premium reduces the cost basis of the security or currency purchased by the Fund. In writing an option, the Fund bears the market risk of an unfavorable change in the price of the security or currency underlying the written option. As the writer of a covered call option on a security, a Fund foregoes, during the option's life, the opportunity to profit from increases in the market value of the security covering the call option above the sum of the premium and the exercise price of the call. Exercise of an option written by the Fund could result in the Fund selling or buying a security or currency at a price different from the current fair value. Options written by the Fund do not give rise to counterparty credit risk, as they obligate the Fund, not its counterparties, to perform.
When a Fund purchases an option, the premium paid by the Fund is recorded as an asset and is subsequently adjusted to the current fair value of the option purchased. Purchasing call options tends to increase the Fund's exposure to the underlying instrument. Purchasing put options tends to decrease the Fund's exposure to the underlying instrument. Premiums paid for purchasing options that expire are treated as realized losses. Premiums paid for purchasing options that are exercised or closed are added to the amounts paid or offset against the proceeds on the underlying security to determine the realized gain or loss. The risks associated with purchasing put and call options are potential loss of the premium paid and, in the instances of OTC derivatives, the failure of the counterparty to honor its obligation under the contract.
Oakmark and Select used purchased options for tax management and as an investment strategy in an effort to increase the Funds' returns during the period ended March 31, 2024. Realized gains and losses and the net change in unrealized appreciation (depreciation) on purchased equity options for the period, if any, are included in each Fund's Statement of Operations. There were no purchased options outstanding at March 31, 2024.
Oakmark, Select, Equity and Income and Bond used options written for tax management and as an investment strategy in an effort to increase the Funds' returns during the period ended March 31, 2024. Realized gains and losses and the net change in unrealized appreciation (depreciation) on written equity options for the period, if any, are included in each Fund's Statement of Operations. Written options outstanding, if any, are listed on each Fund's Schedule of Investments.
For the period ended March 31, 2024, the amount of premiums paid (received) for equity options purchased and written are listed by Fund in the table below (in thousands):
Fund | | Equity Options
Purchased | | Equity Options
Written | |
Oakmark | | $ | 36,524 | | | $ | (53,321 | ) | |
Select | | | 13,563 | | | | (9,563 | ) | |
Equity and Income | | | — | | | | (720 | ) | |
Bond | | | — | | | | (46 | ) | |
Credit facility
The Trust has a $200 million committed unsecured line of credit and a $300 million uncommitted unsecured discretionary demand line of credit (the "Facility") with State Street. Borrowings under the Facility bear interest at 1.35% above the greater of the Federal Funds Effective Rate or the Overnight Bank Fund Rate, as defined in the credit agreement. To maintain the Facility, an annualized commitment fee of 0.20% on the unused committed portion is charged to the Trust. Fees and interest expense, if any, related to the Facility are included in other expenses in the Statements of Operations. There were no borrowings under the Facility during the period ended March 31, 2024.
Expense offset arrangement
State Street serves as custodian of the Funds. State Street's fee may be reduced by credits that are an earnings allowance calculated on the average daily cash balances each Fund maintains with State Street. Credit balances used to reduce the Funds' custodian fees, if any, are reported as a reduction of total expenses in the Statements of Operations. During the period ended March 31, 2024, none of the Funds received an expense offset credit.
Repurchase agreements
Each Fund may invest in repurchase agreements, which are short-term investments whereby the Fund acquires ownership of a debt security and the seller agrees to repurchase the security at a future date at a specified price.
The Funds' custodian receives delivery of the underlying securities collateralizing repurchase agreements. It is the Funds' policy that the value of the collateral be at least equal to 102% of the repurchase price, including interest. The Adviser is responsible for determining that the value of the collateral is at all times at least equal to 102% of the repurchase price, including interest.
Oakmark.com 81
Oakmark Funds
Notes to Financial Statements (continued)
Repurchase agreements could involve certain risks in the event of default or insolvency of the counterparty, including possible delays or restrictions upon a Fund's ability to dispose of the underlying securities. At March 31, 2024, all of the Funds held repurchase agreements.
Security lending
Each Fund may lend its portfolio securities to broker-dealers and banks. Any such loan must be continuously secured by collateral in cash, cash equivalents, or U.S. Treasury or agency securities maintained on a current basis in an amount at least equal to the fair value of the securities loaned by a Fund. The Fund would continue to receive the equivalent of the interest or dividends paid by the issuer on the securities loaned and would also receive an additional return that may be in the form of a fixed fee or a percentage of the earnings on the collateral. The Fund has the right to call the loan and attempt to obtain the securities loaned at any time on notice of not more than five business days. In the event of bankruptcy or other default of the borrower, the Fund could experience delays in liquidating the loan collateral or recovering the loaned securities and incur expenses related to enforcing its rights. There could also be a decline in the value of the collateral or in the fair value of the securities loaned while the Fund seeks to enforce its rights thereto and the Fund could experience subnormal levels of income or lack of access to income during that period. A Fund may not exercise proxy voting rights for a security that is on loan if it is unable to recall the security prior to the record date. The Trust, on behalf of the Funds, has entered into an agreement with State Street to serve as its agent for the purpose of lending securities and maintaining the collateral account. Security lending income, if any, net of any fees retained by the securities lending agent, is included in the Statement of Operations.
At March 31, 2024, none of the Funds had securities on loan.
Interfund lending
Pursuant to an exemptive order issued by the SEC, the Funds may participate in an interfund lending program. This program provides an alternative credit facility that allows the Funds to lend money to, and borrow money from, each other for temporary purposes (an "Interfund Loan"). All Interfund Loans are subject to conditions pursuant to the SEC exemptive order designed to ensure fair and equitable treatment of participating Funds. Any Interfund Loan would consist only of uninvested cash reserves that the lending Fund otherwise would invest in short-term repurchase agreements or other short-term instruments. There were no interfund loans during the period ended March 31, 2024.
3. TRANSACTIONS WITH AFFILIATES
Each Fund has an investment advisory agreement with the Adviser. For management services and facilities furnished, the Adviser receives from each Fund a monthly fee based on that Fund's average daily net assets. Annual fee rates are as follows:
The annual rates of fees as a percentage of each Fund's net assets were as follows for the period ended March 31, 2024:
Fund | | Advisory Fees | |
Oakmark
| | 0.666% up to $250 million;
0.641% on the next $250 million;
0.621% on the next $4.5 billion;
0.606% on the next $10 billion;
0.576% on the next $5 billion;
0.546% on the next $5 billion;
0.516% on the next $10 billion; and
0.496% over $35 billion | |
Select
| | 0.758% up to $250 million;
0.733% on the next $250 million;
0.713% on the next $3.5 billion;
0.693% on the next $5 billion;
0.633% on the next $2 billion; and
0.608% over $11 billion | |
Global
| | 0.830% up to $250 million;
0.805% on the next $250 million;
0.785% on the next $4.5 billion;
0.770% on the next $10 billion; and
0.760% over $15 billion | |
Global Select
| | 0.800% up to $250 million;
0.775% on the next $250 million;
0.755% on the next $4.5 billion;
0.740% on the next $10 billion; and
0.730% over $15 billion | |
Fund | | Advisory Fees | |
International
| | 0.785% up to $250 million;
0.760% on the next $250 million;
0.740% on the next $4.5 billion;
0.725% on the next $10 billion;
0.710% on the next $20 billion;
0.700% on the next $5 billion;
0.690% on the next $5 billion; and
0.680% over $45 billion | |
Int'l Small Cap
| | 1.020% up to $250 million;
0.995% on the next $250 million;
0.975% on the next $4.5 billion;
0.960% on the next $10 billion; and
0.950% over $15 billion | |
Equity and Income
| | 0.580% up to $250 million;
0.555% on the next $250 million;
0.535% on the next $4.5 billion;
0.505% on the next $5 billion;
0.475% on the next $3 billion;
0.445% on the next $3.5 billion;
0.415% on the next $10 billion; and
0.385% over $26.5 billion | |
Bond | | 0.39% of net assets | |
82 OAKMARK FUNDS
Oakmark Funds
Notes to Financial Statements (continued)
The Adviser has contractually agreed, through January 27, 2025, to reimburse each Fund Class to the extent, but only to the extent that the annualized expenses (excluding taxes, interest, all commissions and other normal charges incident to the purchase and sale of portfolio securities, and extraordinary charges such as litigation costs, but including fees paid to the Adviser) exceed the percent set forth below of average daily net assets of each Fund Class.
Fund | | Investor
Class | | Advisor
Class | | Institutional
Class | | R6
Class | |
Oakmark | | | 1.40 | % | | | 1.15 | % | | | 1.10 | % | | | 0.95 | % | |
Select | | | 1.50 | | | | 1.25 | | | | 1.20 | | | | 1.05 | | |
Global | | | 1.55 | | | | 1.30 | | | | 1.25 | | | | 1.10 | | |
Global Select | | | 1.55 | | | | 1.30 | | | | 1.25 | | | | 1.10 | | |
International | | | 1.55 | | | | 1.30 | | | | 1.25 | | | | 1.10 | | |
Int'l Small Cap | | | 1.75 | | | | 1.50 | | | | 1.45 | | | | 1.30 | | |
Equity and Income | | | 1.25 | | | | 1.00 | | | | 0.95 | | | | 0.80 | | |
Bond | | | 0.74 | | | | 0.54 | | | | 0.52 | | | | 0.44 | | |
During the period ended March 31, 2024, Fund Class expenses (in thousands) have been reimbursed as follows@:
Fund | | Class | | Amount | |
Bond | | Investor | | $ | 19 | | |
Bond | | Advisor | | | 10 | | |
Bond | | Institutional | | | 10 | | |
Bond | | R6 | | | 234 | | |
@ Expenses reimbursed are subject to possible recovery until September 30, 2027.
The Adviser is entitled to recoup from assets attributable to any Fund Class amounts reimbursed to that Fund Class, except to the extent that the Fund Class already has paid such recoupment to the Adviser or such recoupment would cause that Class' total operating expenses to exceed the expense limitation or to exceed any lower limit in effect at the time of recoupment. Any such repayment must be made within three fiscal years after the year in which the reimbursement occurred. As of March 31, 2024, the following amounts are subject to recoupment (in thousands).
| | | | | Amount & Expiration Date | | | |
Fund | | Class | | 09/30/24 | | 09/30/25 | | 09/30/26 | | Total | |
Bond | | Investor | | $ | — | | | $ | 4 | | | $ | 6 | | | $ | 10 | | |
Bond | | Advisor | | | 5 | | | | 9 | | | | 7 | | | | 21 | | |
Bond | | Institutional | | | 85 | | | | 17 | | | | 16 | | | | 118 | | |
Bond | | R6 | | | 339 | | | | 498 | | | | 520 | | | | 1,357 | | |
The Adviser and/or the Funds have entered into agreements with financial intermediaries to provide recordkeeping, processing, shareholder communications and other services to customers of the intermediaries and have agreed to compensate the intermediaries for providing those services. Certain of those services would be provided by the Funds if the shares of those customers were registered directly with the Funds' transfer agent. Accordingly, the Funds pay the majority of the intermediary fees pursuant to an agreement with the Adviser and the Adviser pays the remainder of the fees. The fees incurred by the Funds are reflected as other shareholder servicing fees in the Statements of Operations.
The Independent Trustees of the Trust may participate in the Trust's Deferred Compensation Plan for Independent Trustees. Participants in the plan may elect to defer all or a portion of their compensation. Amounts deferred are retained by the Trust and represent an unfunded obligation of the Trust. The value of a participant's deferral account is determined by reference to the change in value of one or more approved funds as specified by the participant. Benefits would be payable after a stated number of years or retirement from the Board of Trustees. The accrued obligations of the Funds under the plan are reflected as deferred Trustee compensation in the Statements of Assets and Liabilities. The change in the accrued obligations for the period is included in Trustees' fees in the Statements of Operations. The Trust pays the compensation of any trustee who is not an "interested person" of the Trust, and any other Trustee who has been approved by the Governance Committee of the Board of Trustees of the Trust to receive compensation from the Trust for his or her service as a Trustee of the Trust, and all expenses incurred in connection with their services to the Trust. The Trust does not provide any pension or retirement benefits to its Trustees.
The Funds reimburse the Adviser for the compensation paid to the Funds' Chief Compliance Officer ("CCO"). The CCO expenses incurred by the Funds are included in other expenses in the Statements of Operations.
Oakmark.com 83
Oakmark Funds
Notes to Financial Statements (continued)
4. FEDERAL INCOME TAXES
It is each Fund's policy to comply with the requirements of the Internal Revenue Code applicable to regulated investment companies and to distribute substantially all of its net taxable income, including any net realized gains on investments, to its shareholders. Therefore, no federal income tax provision is required. The Adviser has determined that no income tax provision for uncertain tax positions is required in the Funds' financial statements. Generally, each of the tax years in the four-year period ended March 31, 2024, remains subject to examination by taxing authorities.
At March 31, 2024, the cost of investments for federal income tax purposes and related composition of unrealized gains and losses for each Fund were as follows (in thousands):
Fund | | Cost of Investments
for Federal Income
Tax Purposes | | Gross Unrealized
Appreciation | | Gross Unrealized
(Depreciation) | | Net Unrealized
Appreciation
(Depreciation) | |
Oakmark | | $ | 16,725,028 | | | $ | 5,728,995 | | | $ | (63,992 | ) | | $ | 5,665,003 | | |
Select | | | 4,878,255 | | | | 1,769,158 | | | | (49,077 | ) | | | 1,720,081 | | |
Global | | | 948,499 | | | | 333,470 | | | | (62,964 | ) | | | 270,506 | | |
Global Select | | | 918,762 | | | | 251,248 | | | | (52,921 | ) | | | 198,327 | | |
International | | | 18,895,095 | | | | 3,627,216 | | | | (2,617,697 | ) | | | 1,009,519 | | |
Int'l Small Cap | | | 1,367,029 | | | | 209,535 | | | | (127,653 | ) | | | 81,882 | | |
Equity and Income | | | 5,580,114 | | | | 1,273,670 | | | | (155,136 | ) | | | 1,118,534 | | |
Bond | | | 154,425 | | | | 2,553 | | | | (3,193 | ) | | | (640 | ) | |
As of March 31, 2024, the short- and long-term capital losses available to offset future capital gains were as follows (in thousands):
Fund CLCF | | Utilized During the Year | | Short-Term | | Long-Term | | Total at Period End | |
Oakmark | | $ | — | | | $ | 260,361 | | | $ | — | | | $ | 260,361 | | |
Select | | | 2,605 | | | | 241,573 | | | | 2,604 | | | | 244,177 | | |
Global | | | — | | | | — | | | | — | | | | — | | |
Global Select | | | 2,799 | | | | 46,656 | | | | 2,226 | | | | 48,882 | | |
International | | | 733,898 | | | | 1,719,193 | | | | 981,103 | | | | 2,700,296 | | |
Int'l Small Cap | | | 43,099 | | | | — | | | | — | | | | — | | |
Equity and Income | | | 52,601 | | | | 67,008 | | | | 14,901 | | | | 81,909 | | |
Bond | | | — | | | | 4,041 | | | | 6,682 | | | | 10,723 | | |
At March 31, 2024, the components of distributable earnings on a tax basis (excluding unrealized appreciation (depreciation)) were as follows (in thousands):
| | | Undistributed
Ordinary Income | | Undistributed Long-
Term Gain | | Total Distributable
Earnings | |
Oakmark | | $ | 63,807 | | | $ | — | | | $ | 63,807 | | |
Select | | | 4,402 | | | | — | | | | 4,402 | | |
Global | | | (3,392 | ) | | | 12,173 | | | | 8,781 | | |
Global Select | | | (3,358 | ) | | | — | | | | (3,358 | ) | |
International | | | 81,815 | | | | — | | | | 81,815 | | |
Int'l Small Cap | | | 2,180 | | | | 19,704 | | | | 21,884 | | |
Equity and Income | | | (8,319 | ) | | | — | | | | (8,319 | ) | |
Bond | | | 176 | | | | — | | | | 176 | | |
84 OAKMARK FUNDS
Oakmark Funds
Notes to Financial Statements (continued)
During the six-month period ended March 31, 2024, and the year ended September 30, 2023, the tax character of distributions paid was as follows (in thousands):
| | | Period Ended
March 31, 2024 | | Year Ended
September 30, 2023 | |
Fund | | Distributions Paid
from Ordinary
Income | | Distributions Paid
from Long-Term
Capital Gain | | Distributions Paid
from Ordinary
Income | | Distributions Paid
from Long-Term
Capital Gain | |
Oakmark | | $ | 215,001 | | | $ | — | | | $ | 152,008 | | | $ | — | | |
Select | | | 37,003 | | | | — | | | | 18,501 | | | | — | | |
Global | | | 21,001 | | | | 32,091 | | | | 10,001 | | | | — | | |
Global Select | | | 10,997 | | | | — | | | | 5,502 | | | | — | | |
International | | | 410,019 | | | | — | | | | 595,239 | | | | — | | |
Int'l Small Cap | | | 29,003 | | | | — | | | | 22,004 | | | | 7,858 | | |
Equity and Income | | | 186,009 | | | | — | | | | 93,007 | | | | — | | |
Bond | | | 2,994 | | | | — | | | | 4,194 | | | | — | | |
On March 31, 2024, the Funds had temporary book/tax differences in undistributed earnings that were primarily attributable to trustee deferred compensation expenses and deferrals of capital losses on wash sales and straddle adjustments. Temporary differences will reverse over time. The Funds have permanent differences in book/tax undistributed earnings primarily attributable to redemptions in kind.
Permanent differences incurred during the six-month period ended March 31, 2024, will result in the following reclassifications among the components of net assets for the year ended September 30, 2024 (in thousands):
Fund | | Paid in Capital | | Distributable
Earnings | |
Oakmark | | $ | 1,230,006 | | | $ | (1,230,006 | ) | |
Select | | | 496,866 | | | | (496,866 | ) | |
Global | | | 64,378 | | | | (64,378 | ) | |
Global Select | | | 89,036 | | | | (89,036 | ) | |
International | | | — | | | | — | | |
Int'l Small Cap | | | — | | | | — | | |
Equity and Income | | | 292,483 | | | | (292,483 | ) | |
Bond | | | — | | | | — | | |
5. INVESTMENT TRANSACTIONS
For the six-month period ended March 31, 2024, transactions in investment securities (excluding short-term, in-kind transaction and U.S. government securities) were as follows (in thousands):
| | | Oakmark | | Select | | Global | | Global
Select | | International | | Int'l
Small Cap | | Equity &
Income | | Bond | |
Purchases | | $ | 4,540,345 | | | $ | 1,634,416 | | | $ | 168,392 | | | $ | 327,644 | | | $ | 2,762,036 | | | $ | 238,545 | | | $ | 900,039 | | | $ | 41,390 | | |
Proceeds from sales | | | 1,537,340 | | | | 500,395 | | | | 122,018 | | | | 201,008 | | | | 3,737,649 | | | | 265,417 | | | | 435,323 | | | | 17,167 | | |
During the six-month period ended March 31, 2024, Oakmark, Select, Global, Global Select and Equity and Income had in-kind sales transactions (in thousands) of $ 2,482,230; $1,050,712; $140,767; $189,625 and $620,861, respectively. These amounts are included in the Portfolio Turnover Rate presented in the Financial Highlights.
Purchases at cost (in thousands) of long-term U.S. government securities for the period ended March 31, 2024, were $39,805 and $42,523, respectively, for Equity and Income and Bond. Proceeds from sales (in thousands) of long-term U.S. government securities for the period ended March 31, 2024 were $35,673 and $24,451, respectively, for Equity and Income and Bond.
During the period ended March 31, 2024, Select engaged in purchase transactions (in thousands) totaling $7,049, with a fund that have a common investment advisor. Select engaged in sale transactions (in thousands) totaling $7,124 with a fund that have a common investment advisor. These transactions complied with Rule 17a-7 under the 1940 Act.
6. INVESTMENTS IN AFFILIATED ISSUERS
A company was considered to be an affiliate of a Fund because that Fund owned 5% or more of the company's voting securities during all or part of the six-month period ended March 31, 2024. Purchase and sale transactions and dividend and interest income earned during the period on these securities are listed after the applicable Fund's Schedule of Investments.
Oakmark.com 85
Oakmark Funds
Notes to Financial Statements (continued)
7. SUBSEQUENT EVENTS
The Adviser has evaluated the possibility of subsequent events existing in the Funds' financial statements. The Adviser has determined that there are no material events that would require adjustment or disclosure in the Funds' financial statements through the date of the publication of this report.
8. RECENT REGULATORY PRONOUNCEMENT
Effective January 24, 2023, the SEC adopted new rules that require funds to transition to a new shareholder report format known as a Tailored Shareholder Report. A Tailored Shareholder Report will only cover the share class of the fund in which a shareholder is invested. Tailored Shareholder Reports are only intended to be three to four pages in length and will highlight key information. Other, more detailed information, including portfolio of investments and financial statements, will no longer appear in the Tailored Shareholder Report but will be available online, delivered free of charge upon request and filed on a semi-annual basis on Form N-CSR. The first Tailored Shareholder Report for the Oakmark Funds will be for the reporting period ended September 30, 2024.
86 OAKMARK FUNDS
Oakmark Funds
Financial Highlights
For a share outstanding throughout each period
| | | | | Income from Investment Operations: | | Less Distributions: | |
| | | Net Asset
Value,
Beginning of
Period | | Net
Investment
Income(a) | | Net Gain
(Loss) on
Investments
(Both
Realized and
Unrealized) | | Total from
Investment
Operations | | Distributions
from Net
Investment
Income | | Distributions
from
Capital
Gains | | Total
Distributions | | Redemption
Fees | |
Oakmark Fund | |
Investor Class | |
10/01/2023-3/31/24+ | | $ | 118.59 | | | | 0.89 | | | | 28.05 | | | | 28.94 | | | | (1.35 | ) | | | 0.00 | | | | (1.35 | ) | | | 0.00 | | |
9/30/23 | | $ | 93.61 | | | | 1.20 | | | | 24.72 | | | | 25.92 | | | | (0.94 | ) | | | 0.00 | | | | (0.94 | ) | | | 0.00 | | |
9/30/22 | | $ | 115.48 | | | | 0.91 | | | | (21.04 | ) | | | (20.13 | ) | | | (0.62 | ) | | | (1.12 | ) | | | (1.74 | ) | | | 0.00 | | |
9/30/21 | | $ | 72.67 | | | | 0.43 | | | | 42.53 | | | | 42.96 | | | | (0.15 | ) | | | 0.00 | | | | (0.15 | ) | | | 0.00 | | |
9/30/20 | | $ | 77.89 | | | | 0.58 | | | | 0.86 | | | | 1.44 | | | | (0.65 | ) | | | (6.01 | ) | | | (6.66 | ) | | | 0.00 | | |
9/30/19 | | $ | 88.99 | | | | 0.88 | | | | (6.43 | ) | | | (5.55 | ) | | | (0.50 | ) | | | (5.05 | ) | | | (5.55 | ) | | | 0.00 | | |
Advisor Class | |
10/01/2023-3/31/24+ | | $ | 118.70 | | | | 1.01 | | | | 28.07 | | | | 29.08 | | | | (1.58 | ) | | | 0.00 | | | | (1.58 | ) | | | 0.00 | | |
9/30/23 | | $ | 93.72 | | | | 1.39 | | | | 24.77 | | | | 26.16 | | | | (1.18 | ) | | | 0.00 | | | | (1.18 | ) | | | 0.00 | | |
9/30/22 | | $ | 115.58 | | | | 1.15 | | | | (21.05 | ) | | | (19.90 | ) | | | (0.84 | ) | | | (1.12 | ) | | | (1.96 | ) | | | 0.00 | | |
9/30/21 | | $ | 72.67 | | | | 0.61 | | | | 42.54 | | | | 43.15 | | | | (0.24 | ) | | | 0.00 | | | | (0.24 | ) | | | 0.00 | | |
9/30/20 | | $ | 77.88 | | | | 0.66 | | | | 0.87 | | | | 1.53 | | | | (0.73 | ) | | | (6.01 | ) | | | (6.74 | ) | | | 0.00 | | |
9/30/19 | | $ | 89.07 | | | | 0.96 | | | | (6.46 | ) | | | (5.50 | ) | | | (0.64 | ) | | | (5.05 | ) | | | (5.69 | ) | | | 0.00 | | |
Institutional Class | |
10/01/2023-3/31/24+ | | $ | 118.72 | | | | 1.04 | | | | 28.06 | | | | 29.10 | | | | (1.61 | ) | | | 0.00 | | | | (1.61 | ) | | | 0.00 | | |
9/30/23 | | $ | 93.73 | | | | 1.46 | | | | 24.73 | | | | 26.19 | | | | (1.20 | ) | | | 0.00 | | | | (1.20 | ) | | | 0.00 | | |
9/30/22 | | $ | 115.64 | | | | 1.16 | | | | (21.05 | ) | | | (19.89 | ) | | | (0.90 | ) | | | (1.12 | ) | | | (2.02 | ) | | | 0.00 | | |
9/30/21 | | $ | 72.72 | | | | 0.70 | | | | 42.52 | | | | 43.22 | | | | (0.30 | ) | | | 0.00 | | | | (0.30 | ) | | | 0.00 | | |
9/30/20 | | $ | 77.95 | | | | 0.71 | | | | 0.87 | | | | 1.58 | | | | (0.80 | ) | | | (6.01 | ) | | | (6.81 | ) | | | 0.00 | | |
9/30/19 | | $ | 89.09 | | | | 1.01 | | | | (6.44 | ) | | | (5.43 | ) | | | (0.66 | ) | | | (5.05 | ) | | | (5.71 | ) | | | 0.00 | | |
Class R6 | |
10/01/2023-3/31/24+ | | $ | 118.77 | | | | 1.07 | | | | 28.08 | | | | 29.15 | | | | (1.67 | ) | | | 0.00 | | | | (1.67 | ) | | | 0.00 | | |
9/30/23 | | $ | 93.77 | | | | 1.54 | | | | 24.71 | | | | 26.25 | | | | (1.25 | ) | | | 0.00 | | | | (1.25 | ) | | | 0.00 | | |
9/30/22 | | $ | 115.67 | | | | 1.25 | | | | (21.10 | ) | | | (19.85 | ) | | | (0.93 | ) | | | (1.12 | ) | | | (2.05 | ) | | | 0.00 | | |
9/30/21(b) | | $ | 88.42 | | | | 0.52 | | | | 26.73 | | | | 27.25 | | | | 0.00 | | | | 0.00 | | | | 0.00 | | | | 0.00 | | |
Oakmark Select Fund | |
Investor Class | |
10/01/2023-3/31/24+ | | $ | 61.75 | | | | 0.24 | | | | 13.16 | | | | 13.40 | | | | (0.36 | ) | | | 0.00 | | | | (0.36 | ) | | | 0.00 | | |
9/30/23 | | $ | 47.43 | | | | 0.25 | | | | 14.22 | | | | 14.47 | | | | (0.15 | ) | | | 0.00 | | | | (0.15 | ) | | | 0.00 | | |
9/30/22 | | $ | 62.27 | | | | 0.13 | | | | (14.79 | ) | | | (14.66 | ) | | | (0.03 | ) | | | (0.15 | ) | | | (0.18 | ) | | | 0.00 | | |
9/30/21 | | $ | 37.98 | | | | (0.03 | ) | | | 24.32 | | | | 24.29 | | | | 0.00 | | | | 0.00 | | | | 0.00 | | | | 0.00 | | |
9/30/20 | | $ | 39.20 | | | | 0.05 | | | | (0.98 | ) | | | (0.93 | ) | | | (0.29 | ) | | | 0.00 | | | | (0.29 | ) | | | 0.00 | | |
9/30/19 | | $ | 45.84 | | | | 0.45 | | | | (5.37 | ) | | | (4.92 | ) | | | (0.06 | ) | | | (1.66 | ) | | | (1.72 | ) | | | 0.00 | | |
Advisor Class | |
10/01/2023-3/31/24+ | | $ | 61.66 | | | | 0.28 | | | | 13.14 | | | | 13.42 | | | | (0.44 | ) | | | 0.00 | | | | (0.44 | ) | | | 0.00 | | |
9/30/23 | | $ | 47.37 | | | | 0.31 | | | | 14.21 | | | | 14.52 | | | | (0.23 | ) | | | 0.00 | | | | (0.23 | ) | | | 0.00 | | |
9/30/22 | | $ | 62.21 | | | | 0.20 | | | | (14.78 | ) | | | (14.58 | ) | | | (0.11 | ) | | | (0.15 | ) | | | (0.26 | ) | | | 0.00 | | |
9/30/21 | | $ | 37.99 | | | | 0.03 | | | | 24.31 | | | | 24.34 | | | | (0.12 | ) | | | 0.00 | | | | (0.12 | ) | | | 0.00 | | |
9/30/20 | | $ | 39.21 | | | | 0.10 | | | | (0.97 | ) | | | (0.87 | ) | | | (0.35 | ) | | | 0.00 | | | | (0.35 | ) | | | 0.00 | | |
9/30/19 | | $ | 45.90 | | | | 0.52 | | | | (5.41 | ) | | | (4.89 | ) | | | (0.14 | ) | | | (1.66 | ) | | | (1.80 | ) | | | 0.00 | | |
Institutional Class | |
10/01/2023-3/31/24+ | | $ | 61.75 | | | | 0.31 | | | | 13.15 | | | | 13.46 | | | | (0.49 | ) | | | 0.00 | | | | (0.49 | ) | | | 0.00 | | |
9/30/23 | | $ | 47.43 | | | | 0.37 | | | | 14.22 | | | | 14.59 | | | | (0.27 | ) | | | 0.00 | | | | (0.27 | ) | | | 0.00 | | |
9/30/22 | | $ | 62.29 | | | | 0.25 | | | | (14.79 | ) | | | (14.54 | ) | | | (0.17 | ) | | | (0.15 | ) | | | (0.32 | ) | | | 0.00 | | |
9/30/21 | | $ | 38.01 | | | | 0.09 | | | | 24.32 | | | | 24.41 | | | | (0.13 | ) | | | 0.00 | | | | (0.13 | ) | | | 0.00 | | |
9/30/20 | | $ | 39.23 | | | | 0.13 | | | | (0.98 | ) | | | (0.85 | ) | | | (0.37 | ) | | | 0.00 | | | | (0.37 | ) | | | 0.00 | | |
9/30/19 | | $ | 45.91 | | | | 0.54 | | | | (5.40 | ) | | | (4.86 | ) | | | (0.16 | ) | | | (1.66 | ) | | | (1.82 | ) | | | 0.00 | | |
Class R6 | |
10/01/2023-3/31/24+ | | $ | 61.75 | | | | 0.33 | | | | 13.16 | | | | 13.49 | | | | (0.52 | ) | | | 0.00 | | | | (0.52 | ) | | | 0.00 | | |
9/30/23 | | $ | 47.45 | | | | 0.40 | | | | 14.20 | | | | 14.60 | | | | (0.30 | ) | | | 0.00 | | | | (0.30 | ) | | | 0.00 | | |
9/30/22 | | $ | 62.29 | | | | 0.27 | | | | (14.78 | ) | | | (14.51 | ) | | | (0.18 | ) | | | (0.15 | ) | | | (0.33 | ) | | | 0.00 | | |
9/30/21(b) | | $ | 47.61 | | | | 0.08 | | | | 14.60 | | | | 14.68 | | | | 0.00 | | | | 0.00 | | | | 0.00 | | | | 0.00 | | |
+ Unaudited.
† Data has been annualized.
(a) Computed using average shares outstanding throughout the period.
(b) Commenced on 12/15/2020.
Oakmark.com 87
Oakmark Funds
Financial Highlights
For a share outstanding throughout each period
| | | | | | | Ratios/Supplemental Data: | | | |
| | | Net Asset
Value,
End of
Period | | Total
Return | | Net Assets,
End of
Period
($million) | | Ratio of
Net
Investment
Income to
Average
Net Assets | | Ratio of
Gross
Expenses
to Average
Net Assets | | Ratio of
Net
Expenses
to Average
Net Assets | | Portfolio
Turnover
Rate | |
Oakmark Fund | |
Investor Class | |
10/01/2023-3/31/24+ | | $ | 146.18 | | | | 24.53 | % | | $ | 9,910.9 | | | | 1.37 | %† | | | 0.89 | %† | | | 0.89 | %† | | | 23 | % | |
9/30/23 | | $ | 118.59 | | | | 27.84 | % | | $ | 7,901.4 | | | | 1.06 | % | | | 0.91 | % | | | 0.91 | % | | | 52 | % | |
9/30/22 | | $ | 93.61 | | | | -17.73 | % | | $ | 6,489.9 | | | | 0.81 | % | | | 0.91 | % | | | 0.89 | % | | | 65 | % | |
9/30/21 | | $ | 115.48 | | | | 59.18 | % | | $ | 8,486.6 | | | | 0.43 | % | | | 0.92 | % | | | 0.90 | % | | | 19 | % | |
9/30/20 | | $ | 72.67 | | | | 1.18 | % | | $ | 6,153.4 | | | | 0.79 | % | | | 0.96 | % | | | 0.92 | % | | | 35 | % | |
9/30/19 | | $ | 77.89 | | | | -5.68 | % | | $ | 9,044.6 | | | | 1.13 | % | | | 0.92 | % | | | 0.88 | % | | | 51 | % | |
Advisor Class | |
10/01/2023-3/31/24+ | | $ | 146.20 | | | | 24.64 | % | | $ | 2,604.4 | | | | 1.57 | %† | | | 0.70 | %† | | | 0.70 | %† | | | 23 | % | |
9/30/23 | | $ | 118.70 | | | | 28.10 | % | | $ | 2,027.0 | | | | 1.25 | % | | | 0.70 | % | | | 0.70 | % | | | 52 | % | |
9/30/22 | | $ | 93.72 | | | | -17.55 | % | | $ | 2,477.4 | | | | 1.03 | % | | | 0.70 | % | | | 0.68 | % | | | 65 | % | |
9/30/21 | | $ | 115.58 | | | | 59.49 | % | | $ | 2,822.8 | | | | 0.61 | % | | | 0.73 | % | | | 0.70 | % | | | 19 | % | |
9/30/20 | | $ | 72.67 | | | | 1.30 | % | | $ | 3,269.5 | | | | 0.90 | % | | | 0.85 | % | | | 0.81 | % | | | 35 | % | |
9/30/19 | | $ | 77.88 | | | | -5.59 | % | | $ | 4,786.4 | | | | 1.23 | % | | | 0.82 | % | | | 0.78 | % | | | 51 | % | |
Institutional Class | |
10/01/2023-3/31/24+ | | $ | 146.21 | | | | 24.66 | % | | $ | 6,771.1 | | | | 1.60 | %† | | | 0.67 | %† | | | 0.67 | %† | | | 23 | % | |
9/30/23 | | $ | 118.72 | | | | 28.14 | % | | $ | 4,830.2 | | | | 1.30 | % | | | 0.68 | % | | | 0.68 | % | | | 52 | % | |
9/30/22 | | $ | 93.73 | | | | -17.55 | % | | $ | 3,572.1 | | | | 1.03 | % | | | 0.69 | % | | | 0.67 | % | | | 65 | % | |
9/30/21 | | $ | 115.64 | | | | 59.56 | % | | $ | 4,517.7 | | | | 0.68 | % | | | 0.69 | % | | | 0.66 | % | | | 19 | % | |
9/30/20 | | $ | 72.72 | | | | 1.36 | % | | $ | 1,839.7 | | | | 0.98 | % | | | 0.79 | % | | | 0.74 | % | | | 35 | % | |
9/30/19 | | $ | 77.95 | | | | -5.51 | % | | $ | 2,302.3 | | | | 1.29 | % | | | 0.75 | % | | | 0.70 | % | | | 51 | % | |
Class R6 | |
10/01/2023-3/31/24+ | | $ | 146.25 | | | | 24.69 | % | | $ | 2,850.6 | | | | 1.66 | %† | | | 0.62 | %† | | | 0.62 | %† | | | 23 | % | |
9/30/23 | | $ | 118.77 | | | | 28.20 | % | | $ | 2,094.8 | | | | 1.36 | % | | | 0.63 | % | | | 0.63 | % | | | 52 | % | |
9/30/22 | | $ | 93.77 | | | | -17.52 | % | | $ | 1,167.2 | | | | 1.13 | % | | | 0.65 | % | | | 0.63 | % | | | 65 | % | |
9/30/21(b) | | $ | 115.67 | | | | 30.82 | % | | $ | 1,081.0 | | | | 0.60 | %† | | | 0.65 | %† | | | 0.63 | %† | | | 19 | % | |
Oakmark Select Fund | |
Investor Class | |
10/01/2023-3/31/24+ | | $ | 74.79 | | | | 21.74 | % | | $ | 1,824.3 | | | | 0.71 | %† | | | 0.99 | %† | | | 0.99 | %† | | | 29 | % | |
9/30/23 | | $ | 61.75 | | | | 30.59 | % | | $ | 1,593.9 | | | | 0.44 | % | | | 1.00 | % | | | 1.00 | % | | | 70 | % | |
9/30/22 | | $ | 47.43 | | | | -23.64 | % | | $ | 1,318.0 | | | | 0.21 | % | | | 1.00 | % | | | 0.98 | % | | | 60 | % | |
9/30/21 | | $ | 62.27 | | | | 64.01 | % | | $ | 1,975.3 | | | | (0.06 | %) | | | 1.01 | % | | | 0.98 | % | | | 20 | % | |
9/30/20 | | $ | 37.98 | | | | -2.45 | % | | $ | 1,410.1 | | | | 0.14 | % | | | 1.11 | % | | | 1.04 | % | | | 28 | % | |
9/30/19 | | $ | 39.20 | | | | -10.34 | % | | $ | 3,154.9 | | | | 1.14 | % | | | 1.08 | % | | | 1.00 | % | | | 45 | % | |
Advisor Class | |
10/01/2023-3/31/24+ | | $ | 74.64 | | | | 21.81 | % | | $ | 3,372.8 | | | | 0.83 | %† | | | 0.87 | %† | | | 0.87 | %† | | | 29 | % | |
9/30/23 | | $ | 61.66 | | | | 30.77 | % | | $ | 2,657.6 | | | | 0.56 | % | | | 0.88 | % | | | 0.88 | % | | | 70 | % | |
9/30/22 | | $ | 47.37 | | | | -23.55 | % | | $ | 2,146.2 | | | | 0.34 | % | | | 0.88 | % | | | 0.86 | % | | | 60 | % | |
9/30/21 | | $ | 62.21 | | | | 64.18 | % | | $ | 2,454.2 | | | | 0.05 | % | | | 0.89 | % | | | 0.87 | % | | | 20 | % | |
9/30/20 | | $ | 37.99 | | | | -2.31 | % | | $ | 1,436.2 | | | | 0.27 | % | | | 1.00 | % | | | 0.92 | % | | | 28 | % | |
9/30/19 | | $ | 39.21 | | | | -10.24 | % | | $ | 638.5 | | | | 1.31 | % | | | 0.94 | % | | | 0.86 | % | | | 45 | % | |
Institutional Class | |
10/01/2023-3/31/24+ | | $ | 74.72 | | | | 21.86 | % | | $ | 760.1 | | | | 0.93 | %† | | | 0.77 | %† | | | 0.77 | %† | | | 29 | % | |
9/30/23 | | $ | 61.75 | | | | 30.90 | % | | $ | 591.6 | | | | 0.65 | % | | | 0.78 | % | | | 0.78 | % | | | 70 | % | |
9/30/22 | | $ | 47.43 | | | | -23.48 | % | | $ | 465.6 | | | | 0.42 | % | | | 0.80 | % | | | 0.78 | % | | | 60 | % | |
9/30/21 | | $ | 62.29 | | | | 64.35 | % | | $ | 638.6 | | | | 0.18 | % | | | 0.79 | % | | | 0.76 | % | | | 20 | % | |
9/30/20 | | $ | 38.01 | | | | -2.27 | % | | $ | 550.2 | | | | 0.33 | % | | | 0.93 | % | | | 0.85 | % | | | 28 | % | |
9/30/19 | | $ | 39.23 | | | | -10.18 | % | | $ | 660.3 | | | | 1.36 | % | | | 0.90 | % | | | 0.82 | % | | | 45 | % | |
Class R6 | |
10/01/2023-3/31/24+ | | $ | 74.72 | | | | 21.91 | % | | $ | 627.3 | | | | 0.98 | %† | | | 0.73 | %† | | | 0.73 | %† | | | 29 | % | |
9/30/23 | | $ | 61.75 | | | | 30.93 | % | | $ | 499.7 | | | | 0.69 | % | | | 0.74 | % | | | 0.74 | % | | | 70 | % | |
9/30/22 | | $ | 47.45 | | | | -23.44 | % | | $ | 295.2 | | | | 0.47 | % | | | 0.75 | % | | | 0.73 | % | | | 60 | % | |
9/30/21(b) | | $ | 62.29 | | | | 30.85 | % | | $ | 331.2 | | | | 0.16 | %† | | | 0.76 | %† | | | 0.74 | %† | | | 20 | % | |
+ Unaudited.
† Data has been annualized.
(a) Computed using average shares outstanding throughout the period.
(b) Commenced on 12/15/2020.
88 OAKMARK FUNDS
Oakmark Funds
Financial Highlights
For a share outstanding throughout each period
| | | | | Income from Investment Operations: | | Less Distributions: | |
| | | Net Asset
Value,
Beginning of
Period | | Net
Investment
Income(a) | | Net Gain
(Loss) on
Investments
(Both
Realized and
Unrealized) | | Total from
Investment
Operations | | Distributions
from Net
Investment
Income | | Distributions
from
Capital
Gains | | Total
Distributions | | Redemption
Fees | |
Oakmark Global Fund | |
Investor Class | |
10/01/2023-3/31/24+ | | $ | 31.22 | | | | 0.06 | | | | 3.69 | | | | 3.75 | | | | (0.53 | ) | | | (0.87 | ) | | | (1.40 | ) | | | 0.00 | | |
9/30/23 | | $ | 24.79 | | | | 0.41 | | | | 6.24 | | | | 6.65 | | | | (0.22 | ) | | | 0.00 | | | | (0.22 | ) | | | 0.00 | | |
9/30/22 | | $ | 36.53 | | | | 0.37 | | | | (8.90 | ) | | | (8.53 | ) | | | (0.34 | ) | | | (2.87 | ) | | | (3.21 | ) | | | 0.00 | | |
9/30/21 | | $ | 24.73 | | | | 0.11 | | | | 11.74 | | | | 11.85 | | | | (0.05 | ) | | | 0.00 | | | | (0.05 | ) | | | 0.00 | | |
9/30/20 | | $ | 27.52 | | | | 0.02 | | | | (1.72 | ) | | | (1.70 | ) | | | (0.40 | ) | | | (0.69 | ) | | | (1.09 | ) | | | 0.00 | | |
9/30/19 | | $ | 32.21 | | | | 0.50 | | | | (1.71 | ) | | | (1.21 | ) | | | (0.29 | ) | | | (3.19 | ) | | | (3.48 | ) | | | 0.00 | | |
Advisor Class | |
10/01/2023-3/31/24+ | | $ | 31.24 | | | | 0.09 | | | | 3.69 | | | | 3.78 | | | | (0.59 | ) | | | (0.87 | ) | | | (1.46 | ) | | | 0.00 | | |
9/30/23 | | $ | 24.80 | | | | 0.42 | | | | 6.29 | | | | 6.71 | | | | (0.27 | ) | | | 0.00 | | | | (0.27 | ) | | | 0.00 | | |
9/30/22 | | $ | 36.57 | | | | 0.43 | | | | (8.91 | ) | | | (8.48 | ) | | | (0.42 | ) | | | (2.87 | ) | | | (3.29 | ) | | | 0.00 | | |
9/30/21 | | $ | 24.74 | | | | 0.18 | | | | 11.74 | | | | 11.92 | | | | (0.09 | ) | | | 0.00 | | | | (0.09 | ) | | | 0.00 | | |
9/30/20 | | $ | 27.53 | | | | 0.07 | | | | (1.73 | ) | | | (1.66 | ) | | | (0.44 | ) | | | (0.69 | ) | | | (1.13 | ) | | | 0.00 | | |
9/30/19 | | $ | 32.22 | | | | 0.49 | | | | (1.66 | ) | | | (1.17 | ) | | | (0.33 | ) | | | (3.19 | ) | | | (3.52 | ) | | | 0.00 | | |
Institutional Class | |
10/01/2023-3/31/24+ | | $ | 31.24 | | | | 0.10 | | | | 3.69 | | | | 3.79 | | | | (0.61 | ) | | | (0.87 | ) | | | (1.48 | ) | | | 0.00 | | |
9/30/23 | | $ | 24.80 | | | | 0.51 | | | | 6.21 | | | | 6.72 | | | | (0.28 | ) | | | 0.00 | | | | (0.28 | ) | | | 0.00 | | |
9/30/22 | | $ | 36.58 | | | | 0.44 | | | | (8.91 | ) | | | (8.47 | ) | | | (0.44 | ) | | | (2.87 | ) | | | (3.31 | ) | | | 0.00 | | |
9/30/21 | | $ | 24.75 | | | | 0.18 | | | | 11.76 | | | | 11.94 | | | | (0.11 | ) | | | 0.00 | | | | (0.11 | ) | | | 0.00 | | |
9/30/20 | | $ | 27.54 | | | | 0.08 | | | | (1.73 | ) | | | (1.65 | ) | | | (0.45 | ) | | | (0.69 | ) | | | (1.14 | ) | | | 0.00 | | |
9/30/19 | | $ | 32.25 | | | | 0.59 | | | | (1.75 | ) | | | (1.16 | ) | | | (0.36 | ) | | | (3.19 | ) | | | (3.55 | ) | | | 0.00 | | |
Class R6 | |
10/01/2023-3/31/24+ | | $ | 31.23 | | | | 0.10 | | | | 3.70 | | | | 3.80 | | | | (0.62 | ) | | | (0.87 | ) | | | (1.49 | ) | | | 0.00 | | |
9/30/23 | | $ | 24.80 | | | | 0.54 | | | | 6.18 | | | | 6.72 | | | | (0.29 | ) | | | 0.00 | | | | (0.29 | ) | | | 0.00 | | |
9/30/22 | | $ | 36.58 | | | | 0.44 | | | | (8.91 | ) | | | (8.47 | ) | | | (0.44 | ) | | | (2.87 | ) | | | (3.31 | ) | | | 0.00 | | |
9/30/21(b) | | $ | 31.38 | | | | 0.23 | | | | 4.97 | | | | 5.20 | | | | 0.00 | | | | 0.00 | | | | 0.00 | | | | 0.00 | | |
Oakmark Global Select Fund | |
Investor Class | |
10/01/2023-3/31/24+ | | $ | 19.88 | | | | 0.00 | (c) | | | 2.32 | | | | 2.32 | | | | (0.18 | ) | | | 0.00 | | | | (0.18 | ) | | | 0.00 | | |
9/30/23 | | $ | 15.62 | | | | 0.14 | | | | 4.18 | | | | 4.32 | | | | (0.06 | ) | | | 0.00 | | | | (0.06 | ) | | | 0.00 | | |
9/30/22 | | $ | 24.45 | | | | 0.26 | | | | (6.88 | ) | | | (6.62 | ) | | | (0.20 | ) | | | (2.01 | ) | | | (2.21 | ) | | | 0.00 | | |
9/30/21 | | $ | 16.86 | | | | 0.06 | | | | 7.53 | | | | 7.59 | | | | 0.00 | | | | 0.00 | | | | 0.00 | | | | 0.00 | | |
9/30/20 | | $ | 16.81 | | | | 0.03 | | | | 0.24 | | | | 0.27 | | | | (0.22 | ) | | | 0.00 | | | | (0.22 | ) | | | 0.00 | | |
9/30/19 | | $ | 18.58 | | | | 0.31 | | | | (1.31 | ) | | | (1.00 | ) | | | (0.22 | ) | | | (0.55 | ) | | | (0.77 | ) | | | 0.00 | | |
Advisor Class | |
10/01/2023-3/31/24+ | | $ | 19.87 | | | | 0.02 | | | | 2.32 | | | | 2.34 | | | | (0.21 | ) | | | 0.00 | | | | (0.21 | ) | | | 0.00 | | |
9/30/23 | | $ | 15.62 | | | | 0.16 | | | | 4.18 | | | | 4.34 | | | | (0.09 | ) | | | 0.00 | | | | (0.09 | ) | | | 0.00 | | |
9/30/22 | | $ | 24.44 | | | | 0.29 | | | | (6.86 | ) | | | (6.57 | ) | | | (0.24 | ) | | | (2.01 | ) | | | (2.25 | ) | | | 0.00 | | |
9/30/21 | | $ | 16.85 | | | | 0.09 | | | | 7.52 | | | | 7.61 | | | | (0.02 | ) | | | 0.00 | | | | (0.02 | ) | | | 0.00 | | |
9/30/20 | | $ | 16.80 | | | | 0.05 | | | | 0.24 | | | | 0.29 | | | | (0.24 | ) | | | 0.00 | | | | (0.24 | ) | | | 0.00 | | |
9/30/19 | | $ | 18.60 | | | | 0.37 | | | | (1.37 | ) | | | (1.00 | ) | | | (0.25 | ) | | | (0.55 | ) | | | (0.80 | ) | | | 0.00 | | |
Institutional Class | |
10/01/2023-3/31/24+ | | $ | 19.87 | | | | 0.03 | | | | 2.32 | | | | 2.35 | | | | (0.23 | ) | | | 0.00 | | | | (0.23 | ) | | | 0.00 | | |
9/30/23 | | $ | 15.63 | | | | 0.19 | | | | 4.16 | | | | 4.35 | | | | (0.11 | ) | | | 0.00 | | | | (0.11 | ) | | | 0.00 | | |
9/30/22 | | $ | 24.46 | | | | 0.30 | | | | (6.86 | ) | | | (6.56 | ) | | | (0.26 | ) | | | (2.01 | ) | | | (2.27 | ) | | | 0.00 | | |
9/30/21 | | $ | 16.86 | | | | 0.11 | | | | 7.53 | | | | 7.64 | | | | (0.04 | ) | | | 0.00 | | | | (0.04 | ) | | | 0.00 | | |
9/30/20 | | $ | 16.81 | | | | 0.06 | | | | 0.24 | | | | 0.30 | | | | (0.25 | ) | | | 0.00 | | | | (0.25 | ) | | | 0.00 | | |
9/30/19 | | $ | 18.61 | | | | 0.35 | | | | (1.34 | ) | | | (0.99 | ) | | | (0.26 | ) | | | (0.55 | ) | | | (0.81 | ) | | | 0.00 | | |
Class R6 | |
10/01/2023-3/31/24+ | | $ | 19.89 | | | | 0.04 | | | | 2.31 | | | | 2.35 | | | | (0.24 | ) | | | 0.00 | | | | (0.24 | ) | | | 0.00 | | |
9/30/23 | | $ | 15.64 | | | | 0.21 | | | | 4.16 | | | | 4.37 | | | | (0.12 | ) | | | 0.00 | | | | (0.12 | ) | | | 0.00 | | |
9/30/22 | | $ | 24.47 | | | | 0.31 | | | | (6.86 | ) | | | (6.55 | ) | | | (0.27 | ) | | | (2.01 | ) | | | (2.28 | ) | | | 0.00 | | |
9/30/21(b) | | $ | 20.65 | | | | 0.15 | | | | 3.67 | | | | 3.82 | | | | 0.00 | | | | 0.00 | | | | 0.00 | | | | 0.00 | | |
+ Unaudited.
† Data has been annualized.
(a) Computed using average shares outstanding throughout the period.
(b) Commenced on 12/15/2020.
(c) Amount rounds to less than $0.01 per share.
Oakmark.com 89
Oakmark Funds
Financial Highlights
For a share outstanding throughout each period
| | | | | | | Ratios/Supplemental Data: | | | |
| | | Net Asset
Value,
End of
Period | | Total
Return | | Net Assets,
End of
Period
($million) | | Ratio of
Net
Investment
Income to
Average
Net Assets | | Ratio of
Gross
Expenses
to Average
Net Assets | | Ratio of
Net
Expenses
to Average
Net Assets | | Portfolio
Turnover
Rate | |
Oakmark Global Fund | |
Investor Class | |
10/01/2023-3/31/24+ | | $ | 33.57 | | | | 12.24 | % | | $ | 590.9 | | | | 0.38 | %† | | | 1.14 | %† | | | 1.14 | %† | | | 15 | % | |
9/30/23 | | $ | 31.22 | | | | 26.88 | % | | $ | 581.0 | | | | 1.33 | % | | | 1.13 | % | | | 1.13 | % | | | 47 | % | |
9/30/22 | | $ | 24.79 | | | | -25.74 | % | | $ | 516.9 | | | | 1.13 | % | | | 1.13 | % | | | 1.11 | % | | | 58 | % | |
9/30/21 | | $ | 36.53 | | | | 47.96 | % | | $ | 802.1 | | | | 0.31 | % | | | 1.16 | % | | | 1.13 | % | | | 40 | % | |
9/30/20 | | $ | 24.73 | | | | -6.73 | % | | $ | 645.2 | | | | 0.10 | % | | | 1.26 | % | | | 1.20 | % | | | 24 | % | |
9/30/19 | | $ | 27.52 | | | | -2.48 | % | | $ | 1,077.3 | | | | 1.82 | % | | | 1.23 | % | | | 1.17 | % | | | 20 | % | |
Advisor Class | |
10/01/2023-3/31/24+ | | $ | 33.56 | | | | 12.36 | % | | $ | 143.4 | | | | 0.57 | %† | | | 0.94 | %† | | | 0.94 | %† | | | 15 | % | |
9/30/23 | | $ | 31.24 | | | | 27.17 | % | | $ | 135.8 | | | | 1.35 | % | | | 0.94 | % | | | 0.94 | % | | | 47 | % | |
9/30/22 | | $ | 24.80 | | | | -25.63 | % | | $ | 152.7 | | | | 1.32 | % | | | 0.93 | % | | | 0.91 | % | | | 58 | % | |
9/30/21 | | $ | 36.57 | | | | 48.25 | % | | $ | 214.6 | | | | 0.51 | % | | | 0.96 | % | | | 0.93 | % | | | 40 | % | |
9/30/20 | | $ | 24.74 | | | | -6.61 | % | | $ | 209.0 | | | | 0.26 | % | | | 1.14 | % | | | 1.08 | % | | | 24 | % | |
9/30/19 | | $ | 27.53 | | | | -2.35 | % | | $ | 263.0 | | | | 1.79 | % | | | 1.10 | % | | | 1.05 | % | | | 20 | % | |
Institutional Class | |
10/01/2023-3/31/24+ | | $ | 33.55 | | | | 12.37 | % | | $ | 356.9 | | | | 0.61 | %† | | | 0.90 | %† | | | 0.90 | %† | | | 15 | % | |
9/30/23 | | $ | 31.24 | | | | 27.21 | % | | $ | 356.4 | | | | 1.65 | % | | | 0.90 | % | | | 0.90 | % | | | 47 | % | |
9/30/22 | | $ | 24.80 | | | | -25.61 | % | | $ | 285.2 | | | | 1.34 | % | | | 0.91 | % | | | 0.89 | % | | | 58 | % | |
9/30/21 | | $ | 36.58 | | | | 48.31 | % | | $ | 432.4 | | | | 0.53 | % | | | 0.92 | % | | | 0.89 | % | | | 40 | % | |
9/30/20 | | $ | 24.75 | | | | -6.57 | % | | $ | 313.4 | | | | 0.33 | % | | | 1.08 | % | | | 1.02 | % | | | 24 | % | |
9/30/19 | | $ | 27.54 | | | | -2.30 | % | | $ | 313.8 | | | | 2.17 | % | | | 1.06 | % | | | 1.00 | % | | | 20 | % | |
Class R6 | |
10/01/2023-3/31/24+ | | $ | 33.54 | | | | 12.41 | % | | $ | 116.9 | | | | 0.66 | %† | | | 0.87 | %† | | | 0.87 | %† | | | 15 | % | |
9/30/23 | | $ | 31.23 | | | | 27.15 | % | | $ | 109.9 | | | | 1.73 | % | | | 0.87 | % | | | 0.87 | % | | | 47 | % | |
9/30/22 | | $ | 24.80 | | | | -25.57 | % | | $ | 68.8 | | | | 1.37 | % | | | 0.88 | % | | | 0.86 | % | | | 58 | % | |
9/30/21(b) | | $ | 36.58 | | | | 16.57 | % | | $ | 91.9 | | | | 0.77 | %† | | | 0.89 | %† | | | 0.87 | %† | | | 40 | % | |
Oakmark Global Select Fund | |
Investor Class | |
10/01/2023-3/31/24+ | | $ | 22.02 | | | | 11.70 | % | | $ | 339.5 | | | | 0.03 | %† | | | 1.14 | %† | | | 1.14 | %† | | | 32 | % | |
9/30/23 | | $ | 19.88 | | | | 27.70 | % | | $ | 351.3 | | | | 0.73 | % | | | 1.14 | % | | | 1.14 | % | | | 32 | % | |
9/30/22 | | $ | 15.62 | | | | -29.77 | % | | $ | 334.3 | | | | 1.22 | % | | | 1.12 | % | | | 1.10 | % | | | 46 | % | |
9/30/21 | | $ | 24.45 | | | | 45.02 | % | | $ | 574.8 | | | | 0.27 | % | | | 1.12 | % | | | 1.09 | % | | | 49 | % | |
9/30/20 | | $ | 16.86 | | | | 1.50 | % | | $ | 483.7 | | | | 0.16 | % | | | 1.25 | % | | | 1.19 | % | | | 33 | % | |
9/30/19 | | $ | 16.81 | | | | -4.90 | % | | $ | 798.4 | | | | 1.88 | % | | | 1.25 | % | | | 1.18 | % | | | 21 | % | |
Advisor Class | |
10/01/2023-3/31/24+ | | $ | 22.00 | | | | 11.80 | % | | $ | 134.5 | | | | 0.22 | %† | | | 0.97 | %† | | | 0.97 | %† | | | 32 | % | |
9/30/23 | | $ | 19.87 | | | | 27.89 | % | | $ | 136.7 | | | | 0.86 | % | | | 0.97 | % | | | 0.97 | % | | | 32 | % | |
9/30/22 | | $ | 15.62 | | | | -29.63 | % | | $ | 150.4 | | | | 1.37 | % | | | 0.95 | % | | | 0.93 | % | | | 46 | % | |
9/30/21 | | $ | 24.44 | | | | 45.21 | % | | $ | 257.6 | | | | 0.43 | % | | | 0.95 | % | | | 0.92 | % | | | 49 | % | |
9/30/20 | | $ | 16.85 | | | | 1.64 | % | | $ | 392.7 | | | | 0.29 | % | | | 1.14 | % | | | 1.07 | % | | | 33 | % | |
9/30/19 | | $ | 16.80 | | | | -4.85 | % | | $ | 449.0 | | | | 2.25 | % | | | 1.14 | % | | | 1.07 | % | | | 21 | % | |
Institutional Class | |
10/01/2023-3/31/24+ | | $ | 21.99 | | | | 11.87 | % | | $ | 463.7 | | | | 0.27 | %† | | | 0.91 | %† | | | 0.91 | %† | | | 32 | % | |
9/30/23 | | $ | 19.87 | | | | 27.92 | % | | $ | 459.5 | | | | 1.00 | % | | | 0.90 | % | | | 0.90 | % | | | 32 | % | |
9/30/22 | | $ | 15.63 | | | | -29.57 | % | | $ | 416.6 | | | | 1.44 | % | | | 0.89 | % | | | 0.87 | % | | | 46 | % | |
9/30/21 | | $ | 24.46 | | | | 45.33 | % | | $ | 762.7 | | | | 0.46 | % | | | 0.89 | % | | | 0.86 | % | | | 49 | % | |
9/30/20 | | $ | 16.86 | | | | 1.70 | % | | $ | 414.3 | | | | 0.36 | % | | | 1.07 | % | | | 1.00 | % | | | 33 | % | |
9/30/19 | | $ | 16.81 | | | | -4.79 | % | | $ | 538.8 | | | | 2.15 | % | | | 1.07 | % | | | 1.01 | % | | | 21 | % | |
Class R6 | |
10/01/2023-3/31/24+ | | $ | 22.00 | | | | 11.87 | % | | $ | 127.2 | | | | 0.36 | %† | | | 0.85 | %† | | | 0.85 | %† | | | 32 | % | |
9/30/23 | | $ | 19.89 | | | | 28.04 | % | | $ | 113.9 | | | | 1.09 | % | | | 0.85 | % | | | 0.85 | % | | | 32 | % | |
9/30/22 | | $ | 15.64 | | | | -29.54 | % | | $ | 87.0 | | | | 1.47 | % | | | 0.84 | % | | | 0.82 | % | | | 46 | % | |
9/30/21(b) | | $ | 24.47 | | | | 18.50 | % | | $ | 124.1 | | | | 0.76 | %† | | | 0.84 | %† | | | 0.82 | %† | | | 49 | % | |
+ Unaudited.
† Data has been annualized.
(a) Computed using average shares outstanding throughout the period.
(b) Commenced on 12/15/2020.
(c) Amount rounds to less than $0.01 per share.
90 OAKMARK FUNDS
Oakmark Funds
Financial Highlights
For a share outstanding throughout each period
| | | | | Income from Investment Operations: | | Less Distributions: | |
| | | Net Asset
Value,
Beginning of
Period | | Net
Investment
Income(a) | | Net Gain
(Loss) on
Investments
(Both
Realized and
Unrealized) | | Total from
Investment
Operations | | Distributions
from Net
Investment
Income | | Distributions
from
Capital
Gains | | Total
Distributions | | Redemption
Fees | |
Oakmark International Fund | |
Investor Class | |
10/01/2023-3/31/24+ | | $ | 25.15 | | | | 0.10 | | | | 2.12 | | | | 2.22 | | | | (0.50 | ) | | | 0.00 | | | | (0.50 | ) | | | 0.00 | | |
9/30/23 | | $ | 19.27 | | | | 0.51 | | | | 6.05 | | | | 6.56 | | | | (0.68 | ) | | | 0.00 | | | | (0.68 | ) | | | 0.00 | | |
9/30/22 | | $ | 28.17 | | | | 0.58 | | | | (9.13 | ) | | | (8.55 | ) | | | (0.35 | ) | | | 0.00 | | | | (0.35 | ) | | | 0.00 | | |
9/30/21 | | $ | 19.91 | | | | 0.27 | | | | 8.08 | | | | 8.35 | | | | (0.09 | ) | | | 0.00 | | | | (0.09 | ) | | | 0.00 | | |
9/30/20 | | $ | 22.88 | | | | 0.08 | | | | (2.60 | ) | | | (2.52 | ) | | | (0.45 | ) | | | 0.00 | | | | (0.45 | ) | | | 0.00 | | |
9/30/19 | | $ | 26.14 | | | | 0.64 | | | | (2.43 | ) | | | (1.79 | ) | | | (0.44 | ) | | | (1.03 | ) | | | (1.47 | ) | | | 0.00 | | |
Advisor Class | |
10/01/2023-3/31/24+ | | $ | 25.12 | | | | 0.12 | | | | 2.11 | | | | 2.23 | | | | (0.54 | ) | | | 0.00 | | | | (0.54 | ) | | | 0.00 | | |
9/30/23 | | $ | 19.27 | | | | 0.53 | | | | 6.06 | | | | 6.59 | | | | (0.74 | ) | | | 0.00 | | | | (0.74 | ) | | | 0.00 | | |
9/30/22 | | $ | 28.15 | | | | 0.62 | | | | (9.12 | ) | | | (8.50 | ) | | | (0.38 | ) | | | 0.00 | | | | (0.38 | ) | | | 0.00 | | |
9/30/21 | | $ | 19.89 | | | | 0.27 | | | | 8.11 | | | | 8.38 | | | | (0.12 | ) | | | 0.00 | | | | (0.12 | ) | | | 0.00 | | |
9/30/20 | | $ | 22.86 | | | | 0.12 | | | | (2.61 | ) | | | (2.49 | ) | | | (0.48 | ) | | | 0.00 | | | | (0.48 | ) | | | 0.00 | | |
9/30/19 | | $ | 26.17 | | | | 0.76 | | | | (2.54 | ) | | | (1.78 | ) | | | (0.50 | ) | | | (1.03 | ) | | | (1.53 | ) | | | 0.00 | | |
Institutional Class | |
10/01/2023-3/31/24+ | | $ | 25.13 | | | | 0.13 | | | | 2.12 | | | | 2.25 | | | | (0.57 | ) | | | 0.00 | | | | (0.57 | ) | | | 0.00 | | |
9/30/23 | | $ | 19.28 | | | | 0.57 | | | | 6.04 | | | | 6.61 | | | | (0.76 | ) | | | 0.00 | | | | (0.76 | ) | | | 0.00 | | |
9/30/22 | | $ | 28.19 | | | | 0.64 | | | | (9.13 | ) | | | (8.49 | ) | | | (0.42 | ) | | | 0.00 | | | | (0.42 | ) | | | 0.00 | | |
9/30/21 | | $ | 19.92 | | | | 0.37 | | | | 8.04 | | | | 8.41 | | | | (0.14 | ) | | | 0.00 | | | | (0.14 | ) | | | 0.00 | | |
9/30/20 | | $ | 22.89 | | | | 0.13 | | | | (2.60 | ) | | | (2.47 | ) | | | (0.50 | ) | | | 0.00 | | | | (0.50 | ) | | | 0.00 | | |
9/30/19 | | $ | 26.19 | | | | 0.73 | | | | (2.50 | ) | | | (1.77 | ) | | | (0.50 | ) | | | (1.03 | ) | | | (1.53 | ) | | | 0.00 | | |
Class R6 | |
10/01/2023-3/31/24+ | | $ | 25.15 | | | | 0.14 | | | | 2.11 | | | | 2.25 | | | | (0.58 | ) | | | 0.00 | | | | (0.58 | ) | | | 0.00 | | |
9/30/23 | | $ | 19.29 | | | | 0.58 | | | | 6.05 | | | | 6.63 | | | | (0.77 | ) | | | 0.00 | | | | (0.77 | ) | | | 0.00 | | |
9/30/22 | | $ | 28.20 | | | | 0.67 | | | | (9.15 | ) | | | (8.48 | ) | | | (0.43 | ) | | | 0.00 | | | | (0.43 | ) | | | 0.00 | | |
9/30/21(b) | | $ | 25.83 | | | | 0.38 | | | | 1.99 | | | | 2.37 | | | | 0.00 | | | | 0.00 | | | | 0.00 | | | | 0.00 | | |
Oakmark International Small Cap Fund | |
Investor Class | |
10/01/2023-3/31/24+ | | $ | 17.82 | | | | 0.08 | | | | 2.06 | | | | 2.14 | | | | (0.36 | ) | | | 0.00 | | | | (0.36 | ) | | | 0.00 | | |
9/30/23 | | $ | 13.25 | | | | 0.33 | | | | 4.55 | | | | 4.88 | | | | (0.22 | ) | | | (0.09 | ) | | | (0.31 | ) | | | 0.00 | | |
9/30/22 | | $ | 19.92 | | | | 0.29 | | | | (6.64 | ) | | | (6.35 | ) | | | (0.32 | ) | | | 0.00 | | | | (0.32 | ) | | | 0.00 | | |
9/30/21 | | $ | 13.67 | | | | 0.22 | | | | 6.35 | | | | 6.57 | | | | (0.32 | ) | | | 0.00 | | | | (0.32 | ) | | | 0.00 | | |
9/30/20 | | $ | 14.61 | | | | 0.31 | | | | (1.22 | ) | | | (0.91 | ) | | | (0.03 | ) | | | 0.00 | | | | (0.03 | ) | | | 0.00 | | |
9/30/19 | | $ | 16.34 | | | | 0.27 | | | | (0.89 | ) | | | (0.62 | ) | | | (0.20 | ) | | | (0.91 | ) | | | (1.11 | ) | | | 0.00 | (c) | |
Advisor Class | |
10/01/2023-3/31/24+ | | $ | 17.84 | | | | 0.09 | | | | 2.06 | | | | 2.15 | | | | (0.39 | ) | | | 0.00 | | | | (0.39 | ) | | | 0.00 | | |
9/30/23 | | $ | 13.28 | | | | 0.35 | | | | 4.56 | | | | 4.91 | | | | (0.26 | ) | | | (0.09 | ) | | | (0.35 | ) | | | 0.00 | | |
9/30/22 | | $ | 19.96 | | | | 0.34 | | | | (6.67 | ) | | | (6.33 | ) | | | (0.35 | ) | | | 0.00 | | | | (0.35 | ) | | | 0.00 | | |
9/30/21 | | $ | 13.69 | | | | 0.23 | | | | 6.38 | | | | 6.61 | | | | (0.34 | ) | | | 0.00 | | | | (0.34 | ) | | | 0.00 | | |
9/30/20 | | $ | 14.64 | | | | 0.30 | | | | (1.19 | ) | | | (0.89 | ) | | | (0.06 | ) | | | 0.00 | | | | (0.06 | ) | | | 0.00 | | |
9/30/19 | | $ | 16.33 | | | | 0.31 | | | | (0.90 | ) | | | (0.59 | ) | | | (0.19 | ) | | | (0.91 | ) | | | (1.10 | ) | | | 0.00 | (c) | |
Institutional Class | |
10/01/2023-3/31/24+ | | $ | 17.79 | | | | 0.10 | | | | 2.06 | | | | 2.16 | | | | (0.41 | ) | | | 0.00 | | | | (0.41 | ) | | | 0.00 | | |
9/30/23 | | $ | 13.24 | | | | 0.38 | | | | 4.53 | | | | 4.91 | | | | (0.27 | ) | | | (0.09 | ) | | | (0.36 | ) | | | 0.00 | | |
9/30/22 | | $ | 19.91 | | | | 0.34 | | | | (6.64 | ) | | | (6.30 | ) | | | (0.37 | ) | | | 0.00 | | | | (0.37 | ) | | | 0.00 | | |
9/30/21 | | $ | 13.65 | | | | 0.26 | | | | 6.35 | | | | 6.61 | | | | (0.35 | ) | | | 0.00 | | | | (0.35 | ) | | | 0.00 | | |
9/30/20 | | $ | 14.59 | | | | 0.33 | | | | (1.21 | ) | | | (0.88 | ) | | | (0.06 | ) | | | 0.00 | | | | (0.06 | ) | | | 0.00 | | |
9/30/19 | | $ | 16.36 | | | | 0.29 | | | | (0.90 | ) | | | (0.61 | ) | | | (0.25 | ) | | | (0.91 | ) | | | (1.16 | ) | | | 0.00 | (c) | |
Class R6 | |
10/01/2023-3/31/24+ | | $ | 17.79 | | | | 0.11 | | | | 2.05 | | | | 2.16 | | | | (0.41 | ) | | | 0.00 | | | | (0.41 | ) | | | 0.00 | | |
9/30/23 | | $ | 13.24 | | | | 0.33 | | | | 4.58 | | | | 4.91 | | | | (0.27 | ) | | | (0.09 | ) | | | (0.36 | ) | | | 0.00 | | |
9/30/22 | | $ | 19.91 | | | | 0.37 | | | | (6.67 | ) | | | (6.30 | ) | | | (0.37 | ) | | | 0.00 | | | | (0.37 | ) | | | 0.00 | | |
9/30/21(b) | | $ | 16.66 | | | | 0.25 | | | | 3.00 | | | | 3.25 | | | | 0.00 | | | | 0.00 | | | | 0.00 | | | | 0.00 | | |
+ Unaudited.
† Data has been annualized.
(a) Computed using average shares outstanding throughout the period.
(b) Commenced on 12/15/2020.
(c) Amount rounds to less than $0.01 per share.
Oakmark.com 91
Oakmark Funds
Financial Highlights
For a share outstanding throughout each period
| | | | | | | Ratios/Supplemental Data: | | | |
| | | Net Asset
Value,
End of
Period | | Total
Return | | Net Assets,
End of
Period
($million) | | Ratio of
Net
Investment
Income to
Average
Net Assets | | Ratio of
Gross
Expenses
to Average
Net Assets | | Ratio of
Net
Expenses
to Average
Net Assets | | Portfolio
Turnover
Rate | |
Oakmark International Fund | |
Investor Class | |
10/01/2023-3/31/24+ | | $ | 26.87 | | | | 8.82 | % | | $ | 5,610.6 | | | | 0.75 | %† | | | 1.05 | %† | | | 1.05 | %† | | | 15 | % | |
9/30/23 | | $ | 25.15 | | | | 34.39 | % | | $ | 5,865.4 | | | | 2.02 | % | | | 1.05 | % | | | 1.05 | % | | | 27 | % | |
9/30/22 | | $ | 19.27 | | | | -30.72 | % | | $ | 5,032.4 | | | | 2.25 | % | | | 1.06 | % | | | 1.04 | % | | | 35 | % | |
9/30/21 | | $ | 28.17 | | | | 41.96 | % | | $ | 8,756.6 | | | | 0.99 | % | | | 1.05 | % | | | 1.02 | % | | | 42 | % | |
9/30/20 | | $ | 19.91 | | | | -11.37 | % | | $ | 7,959.9 | | | | 0.39 | % | | | 1.05 | % | | | 1.00 | % | | | 32 | % | |
9/30/19 | | $ | 22.88 | | | | -6.41 | % | | $ | 14,446.5 | | | | 2.84 | % | | | 1.04 | % | | | 0.98 | % | | | 35 | % | |
Advisor Class | |
10/01/2023-3/31/24+ | | $ | 26.81 | | | | 8.91 | % | | $ | 2,565.4 | | | | 0.93 | %† | | | 0.88 | %† | | | 0.88 | %† | | | 15 | % | |
9/30/23 | | $ | 25.12 | | | | 34.57 | % | | $ | 2,582.7 | | | | 2.13 | % | | | 0.88 | % | | | 0.88 | % | | | 27 | % | |
9/30/22 | | $ | 19.27 | | | | -30.59 | % | | $ | 2,246.8 | | | | 2.44 | % | | | 0.88 | % | | | 0.86 | % | | | 35 | % | |
9/30/21 | | $ | 28.15 | | | | 42.22 | % | | $ | 3,316.0 | | | | 1.03 | % | | | 0.88 | % | | | 0.85 | % | | | 42 | % | |
9/30/20 | | $ | 19.89 | | | | -11.28 | % | | $ | 6,282.8 | | | | 0.59 | % | | | 0.95 | % | | | 0.90 | % | | | 32 | % | |
9/30/19 | | $ | 22.86 | | | | -6.34 | % | | $ | 6,701.4 | | | | 3.35 | % | | | 0.95 | % | | | 0.90 | % | | | 35 | % | |
Institutional Class | |
10/01/2023-3/31/24+ | | $ | 26.81 | | | | 8.95 | % | | $ | 8,968.8 | | | | 1.02 | %† | | | 0.80 | %† | | | 0.80 | %† | | | 15 | % | |
9/30/23 | | $ | 25.13 | | | | 34.65 | % | | $ | 8,125.2 | | | | 2.26 | % | | | 0.81 | % | | | 0.81 | % | | | 27 | % | |
9/30/22 | | $ | 19.28 | | | | -30.54 | % | | $ | 7,250.7 | | | | 2.51 | % | | | 0.81 | % | | | 0.79 | % | | | 35 | % | |
9/30/21 | | $ | 28.19 | | | | 42.30 | % | | $ | 11,748.6 | | | | 1.34 | % | | | 0.80 | % | | | 0.77 | % | | | 42 | % | |
9/30/20 | | $ | 19.92 | | | | -11.19 | % | | $ | 7,233.5 | | | | 0.62 | % | | | 0.87 | % | | | 0.82 | % | | | 32 | % | |
9/30/19 | | $ | 22.89 | | | | -6.27 | % | | $ | 9,457.3 | | | | 3.20 | % | | | 0.86 | % | | | 0.81 | % | | | 35 | % | |
Class R6 | |
10/01/2023-3/31/24+ | | $ | 26.82 | | | | 8.96 | % | | $ | 2,866.9 | | | | 1.07 | %† | | | 0.75 | %† | | | 0.75 | %† | | | 15 | % | |
9/30/23 | | $ | 25.15 | | | | 34.76 | % | | $ | 2,706.0 | | | | 2.31 | % | | | 0.75 | % | | | 0.75 | % | | | 27 | % | |
9/30/22 | | $ | 19.29 | | | | -30.51 | % | | $ | 2,389.0 | | | | 2.63 | % | | | 0.77 | % | | | 0.75 | % | | | 35 | % | |
9/30/21(b) | | $ | 28.20 | | | | 9.18 | % | | $ | 2,997.8 | | | | 1.62 | %† | | | 0.77 | %† | | | 0.75 | %† | | | 42 | % | |
Oakmark International Small Cap Fund | |
Investor Class | |
10/01/2023-3/31/24+ | | $ | 19.60 | | | | 12.04 | % | | $ | 380.9 | | | | 0.84 | %† | | | 1.34 | %† | | | 1.34 | %† | | | 18 | % | |
9/30/23 | | $ | 17.82 | | | | 37.05 | % | | $ | 367.3 | | | | 1.91 | % | | | 1.34 | % | | | 1.34 | % | | | 32 | % | |
9/30/22 | | $ | 13.25 | | | | -32.37 | % | | $ | 306.8 | | | | 1.67 | % | | | 1.36 | % | | | 1.34 | % | | | 37 | % | |
9/30/21 | | $ | 19.92 | | | | 48.51 | % | | $ | 560.1 | | | | 1.18 | % | | | 1.37 | % | | | 1.35 | % | | | 48 | % | |
9/30/20 | | $ | 13.67 | | | | -6.23 | % | | $ | 388.9 | | | | 2.21 | % | | | 1.45 | % | | | 1.45 | % | | | 42 | % | |
9/30/19 | | $ | 14.61 | | | | -2.91 | % | | $ | 546.4 | | | | 1.88 | % | | | 1.38 | % | | | 1.38 | % | | | 39 | % | |
Advisor Class | |
10/01/2023-3/31/24+ | | $ | 19.60 | | | | 12.11 | % | | $ | 173.8 | | | | 1.00 | %† | | | 1.18 | %† | | | 1.18 | %† | | | 18 | % | |
9/30/23 | | $ | 17.84 | | | | 37.16 | % | | $ | 163.5 | | | | 2.02 | % | | | 1.18 | % | | | 1.18 | % | | | 32 | % | |
9/30/22 | | $ | 13.28 | | | | -32.24 | % | | $ | 131.8 | | | | 1.96 | % | | | 1.18 | % | | | 1.16 | % | | | 37 | % | |
9/30/21 | | $ | 19.96 | | | | 48.76 | % | | $ | 189.3 | | | | 1.26 | % | | | 1.20 | % | | | 1.19 | % | | | 48 | % | |
9/30/20 | | $ | 13.69 | | | | -6.16 | % | | $ | 155.7 | | | | 2.14 | % | | | 1.35 | % | | | 1.35 | % | | | 42 | % | |
9/30/19 | | $ | 14.64 | | | | -2.72 | % | | $ | 142.5 | | | | 2.13 | % | | | 1.26 | % | | | 1.26 | % | | | 39 | % | |
Institutional Class | |
10/01/2023-3/31/24+ | | $ | 19.54 | | | | 12.18 | % | | $ | 574.6 | | | | 1.11 | %† | | | 1.09 | %† | | | 1.09 | %† | | | 18 | % | |
9/30/23 | | $ | 17.79 | | | | 37.30 | % | | $ | 481.6 | | | | 2.15 | % | | | 1.10 | % | | | 1.10 | % | | | 32 | % | |
9/30/22 | | $ | 13.24 | | | | -32.20 | % | | $ | 329.0 | | | | 1.95 | % | | | 1.11 | % | | | 1.09 | % | | | 37 | % | |
9/30/21 | | $ | 19.91 | | | | 48.93 | % | | $ | 526.9 | | | | 1.41 | % | | | 1.11 | % | | | 1.09 | % | | | 48 | % | |
9/30/20 | | $ | 13.65 | | | | -6.09 | % | | $ | 614.2 | | | | 2.37 | % | | | 1.26 | % | | | 1.26 | % | | | 42 | % | |
9/30/19 | | $ | 14.59 | | | | -2.75 | % | | $ | 735.8 | | | | 2.03 | % | | | 1.23 | % | | | 1.23 | % | | | 39 | % | |
Class R6 | |
10/01/2023-3/31/24+ | | $ | 19.54 | | | | 12.21 | % | | $ | 333.4 | | | | 1.14 | %† | | | 1.07 | %† | | | 1.07 | %† | | | 18 | % | |
9/30/23 | | $ | 17.79 | | | | 37.34 | % | | $ | 304.9 | | | | 1.94 | % | | | 1.07 | % | | | 1.07 | % | | | 32 | % | |
9/30/22 | | $ | 13.24 | | | | -32.19 | % | | $ | 400.2 | | | | 2.19 | % | | | 1.08 | % | | | 1.06 | % | | | 37 | % | |
9/30/21(b) | | $ | 19.91 | | | | 19.51 | % | | $ | 367.6 | | | | 1.55 | %† | | | 1.09 | %† | | | 1.07 | %† | | | 48 | % | |
+ Unaudited.
† Data has been annualized.
(a) Computed using average shares outstanding throughout the period.
(b) Commenced on 12/15/2020.
(c) Amount rounds to less than $0.01 per share.
92 OAKMARK FUNDS
Oakmark Funds
Financial Highlights
For a share outstanding throughout each period
| | | | | Income from Investment Operations: | | Less Distributions: | |
| | | Net Asset
Value,
Beginning of
Period | | Net
Investment
Income(a) | | Net Gain
(Loss) on
Investments
(Both
Realized and
Unrealized) | | Total from
Investment
Operations | | Distributions
from Net
Investment
Income | | Distributions
from
Capital
Gains | | Total
Distributions | | Redemption
Fees | |
Oakmark Equity and Income Fund | |
Investor Class | |
10/01/2023-3/31/24+ | | $ | 31.41 | | | | 0.38 | | | | 4.41 | | | | 4.79 | | | | (0.95 | ) | | | 0.00 | | | | (0.95 | ) | | | 0.00 | | |
9/30/23 | | $ | 27.85 | | | | 0.66 | | | | 3.33 | | | | 3.99 | | | | (0.43 | ) | | | 0.00 | | | | (0.43 | ) | | | 0.00 | | |
9/30/22 | | $ | 35.94 | | | | 0.44 | | | | (5.63 | ) | | | (5.19 | ) | | | (0.29 | ) | | | (2.61 | ) | | | (2.90 | ) | | | 0.00 | | |
9/30/21 | | $ | 27.50 | | | | 0.32 | | | | 9.40 | | | | 9.72 | | | | (0.35 | ) | | | (0.93 | ) | | | (1.28 | ) | | | 0.00 | | |
9/30/20 | | $ | 30.30 | | | | 0.42 | | | | (0.56 | ) | | | (0.14 | ) | | | (0.51 | ) | | | (2.15 | ) | | | (2.66 | ) | | | 0.00 | | |
9/30/19 | | $ | 32.52 | | | | 0.52 | | | | (0.04 | ) | | | 0.48 | | | | (0.50 | ) | | | (2.20 | ) | | | (2.70 | ) | | | 0.00 | | |
Advisor Class | |
10/01/2023-3/31/24+ | | $ | 31.43 | | | | 0.42 | | | | 4.41 | | | | 4.83 | | | | (1.05 | ) | | | 0.00 | | | | (1.05 | ) | | | 0.00 | | |
9/30/23 | | $ | 27.87 | | | | 0.71 | | | | 3.36 | | | | 4.07 | | | | (0.51 | ) | | | 0.00 | | | | (0.51 | ) | | | 0.00 | | |
9/30/22 | | $ | 35.98 | | | | 0.53 | | | | (5.65 | ) | | | (5.12 | ) | | | (0.38 | ) | | | (2.61 | ) | | | (2.99 | ) | | | 0.00 | | |
9/30/21 | | $ | 27.51 | | | | 0.39 | | | | 9.40 | | | | 9.79 | | | | (0.39 | ) | | | (0.93 | ) | | | (1.32 | ) | | | 0.00 | | |
9/30/20 | | $ | 30.31 | | | | 0.46 | | | | (0.56 | ) | | | (0.10 | ) | | | (0.55 | ) | | | (2.15 | ) | | | (2.70 | ) | | | 0.00 | | |
9/30/19 | | $ | 32.55 | | | | 0.55 | | | | (0.03 | ) | | | 0.52 | | | | (0.56 | ) | | | (2.20 | ) | | | (2.76 | ) | | | 0.00 | | |
Institutional Class | |
10/01/2023-3/31/24+ | | $ | 31.43 | | | | 0.42 | | | | 4.41 | | | | 4.83 | | | | (1.06 | ) | | | 0.00 | | | | (1.06 | ) | | | 0.00 | | |
9/30/23 | | $ | 27.87 | | | | 0.75 | | | | 3.32 | | | | 4.07 | | | | (0.51 | ) | | | 0.00 | | | | (0.51 | ) | | | 0.00 | | |
9/30/22 | | $ | 35.99 | | | | 0.52 | | | | (5.63 | ) | | | (5.11 | ) | | | (0.40 | ) | | | (2.61 | ) | | | (3.01 | ) | | | 0.00 | | |
9/30/21 | | $ | 27.52 | | | | 0.41 | | | | 9.40 | | | | 9.81 | | | | (0.41 | ) | | | (0.93 | ) | | | (1.34 | ) | | | 0.00 | | |
9/30/20 | | $ | 30.33 | | | | 0.47 | | | | (0.56 | ) | | | (0.09 | ) | | | (0.57 | ) | | | (2.15 | ) | | | (2.72 | ) | | | 0.00 | | |
9/30/19 | | $ | 32.56 | | | | 0.59 | | | | (0.05 | ) | | | 0.54 | | | | (0.57 | ) | | | (2.20 | ) | | | (2.77 | ) | | | 0.00 | | |
Class R6 | |
10/01/2023-3/31/24+ | | $ | 31.45 | | | | 0.43 | | | | 4.39 | | | | 4.82 | | | | (1.07 | ) | | | 0.00 | | | | (1.07 | ) | | | 0.00 | | |
9/30/23 | | $ | 27.88 | | | | 0.79 | | | | 3.30 | | | | 4.09 | | | | (0.52 | ) | | | 0.00 | | | | (0.52 | ) | | | 0.00 | | |
9/30/22 | | $ | 36.00 | | | | 0.57 | | | | (5.68 | ) | | | (5.11 | ) | | | (0.40 | ) | | | (2.61 | ) | | | (3.01 | ) | | | 0.00 | | |
9/30/21(b) | | $ | 30.24 | | | | 0.49 | | | | 5.27 | | | | 5.76 | | | | 0.00 | | | | 0.00 | | | | 0.00 | | | | 0.00 | | |
Oakmark Bond Fund | |
Investor Class | |
3/31/24+ | | $ | 8.40 | | | | 0.22 | | | | 0.40 | | | | 0.62 | | | | (0.20 | ) | | | 0.00 | | | | (0.20 | ) | | | 0.00 | | |
9/30/23 | | $ | 8.60 | | | | 0.36 | | | | (0.20 | ) | | | 0.16 | | | | (0.36 | ) | | | 0.00 | | | | (0.36 | ) | | | 0.00 | | |
9/30/22(c) | | $ | 9.89 | | | | 0.17 | | | | (1.29 | ) | | | (1.12 | ) | | | (0.17 | ) | | | 0.00 | | | | (0.17 | ) | | | 0.00 | | |
Advisor Class | |
3/31/24+ | | $ | 8.41 | | | | 0.22 | | | | 0.41 | | | | 0.63 | | | | (0.21 | ) | | | 0.00 | | | | (0.21 | ) | | | 0.00 | | |
9/30/23 | | $ | 8.61 | | | | 0.38 | | | | (0.21 | ) | | | 0.17 | | | | (0.37 | ) | | | 0.00 | | | | (0.37 | ) | | | 0.00 | | |
9/30/22 | | $ | 10.35 | | | | 0.23 | | | | (1.55 | ) | | | (1.32 | ) | | | (0.23 | ) | | | (0.19 | ) | | | (0.42 | ) | | | 0.00 | | |
9/30/21 | | $ | 10.16 | | | | 0.16 | | | | 0.24 | | | | 0.40 | | | | (0.16 | ) | | | (0.05 | ) | | | (0.21 | ) | | | 0.00 | | |
9/30/20(d) | | $ | 10.00 | | | | 0.04 | | | | 0.15 | | | | 0.19 | | | | (0.03 | ) | | | 0.00 | | | | (0.03 | ) | | | 0.00 | | |
Institutional Class | |
3/31/24+ | | $ | 8.41 | | | | 0.22 | | | | 0.41 | | | | 0.63 | | | | (0.21 | ) | | | 0.00 | | | | (0.21 | ) | | | 0.00 | | |
9/30/23 | | $ | 8.61 | | | | 0.39 | | | | (0.21 | ) | | | 0.18 | | | | (0.38 | ) | | | 0.00 | | | | (0.38 | ) | | | 0.00 | | |
9/30/22 | | $ | 10.35 | | | | 0.24 | | | | (1.56 | ) | | | (1.32 | ) | | | (0.23 | ) | | | (0.19 | ) | | | (0.42 | ) | | | 0.00 | | |
9/30/21 | | $ | 10.17 | | | | 0.18 | | | | 0.22 | | | | 0.40 | | | | (0.17 | ) | | | (0.05 | ) | | | (0.22 | ) | | | 0.00 | | |
9/30/20(d) | | $ | 10.00 | | | | 0.04 | | | | 0.17 | | | | 0.21 | | | | (0.04 | ) | | | 0.00 | | | | (0.04 | ) | | | 0.00 | | |
Class R6 | |
3/31/24+ | | $ | 8.41 | | | | 0.22 | | | | 0.41 | | | | 0.63 | | | | (0.21 | ) | | | 0.00 | | | | (0.21 | ) | | | 0.00 | | |
9/30/23 | | $ | 8.61 | | | | 0.39 | | | | (0.21 | ) | | | 0.18 | | | | (0.38 | ) | | | 0.00 | | | | (0.38 | ) | | | 0.00 | | |
9/30/22 | | $ | 10.35 | | | | 0.25 | | | | (1.56 | ) | | | (1.31 | ) | | | (0.24 | ) | | | (0.19 | ) | | | (0.43 | ) | | | 0.00 | | |
9/30/21(b) | | $ | 10.32 | | | | 0.14 | | | | 0.04 | | | | 0.18 | | | | (0.15 | ) | | | 0.00 | | | | (0.15 | ) | | | 0.00 | | |
+ Unaudited.
† Data has been annualized.
(a) Computed using average shares outstanding throughout the period.
(b) Commenced on 12/15/2020.
(c) Commenced on 01/28/2022.
(d) Commenced operations on 6/10/2020.
Oakmark.com 93
Oakmark Funds
Financial Highlights
For a share outstanding throughout each period
| | | | | | | Ratios/Supplemental Data: | | | |
| | | Net Asset
Value,
End of
Period | | Total
Return | | Net Assets,
End of
Period
($million) | | Ratio of
Net
Investment
Income to
Average
Net Assets | | Ratio of
Gross
Expenses
to Average
Net Assets | | Ratio of
Net
Expenses
to Average
Net Assets | | Portfolio
Turnover
Rate | |
Oakmark Equity and Income Fund | |
Investor Class | |
10/01/2023-3/31/24+ | | $ | 35.25 | | | | 15.35 | % | | $ | 4,589.3 | | | | 2.30 | %† | | | 0.86 | %† | | | 0.86 | %† | | | 15 | % | |
9/30/23 | | $ | 31.41 | | | | 14.40 | % | | $ | 4,213.3 | | | | 2.13 | % | | | 0.86 | % | | | 0.86 | % | | | 45 | % | |
9/30/22 | | $ | 27.85 | | | | -15.84 | % | | $ | 4,194.4 | | | | 1.34 | % | | | 0.85 | % | | | 0.83 | % | | | 49 | % | |
9/30/21 | | $ | 35.94 | | | | 36.19 | % | | $ | 5,587.1 | | | | 0.97 | % | | | 0.87 | % | | | 0.84 | % | | | 14 | % | |
9/30/20 | | $ | 27.50 | | | | -0.90 | % | | $ | 5,492.4 | | | | 1.52 | % | | | 0.94 | % | | | 0.84 | % | | | 15 | % | |
9/30/19 | | $ | 30.30 | | | | 2.29 | % | | $ | 9,006.7 | | | | 1.74 | % | | | 0.91 | % | | | 0.81 | % | | | 11 | % | |
Advisor Class | |
10/01/2023-3/31/24+ | | $ | 35.21 | | | | 15.52 | % | | $ | 596.6 | | | | 2.54 | %† | | | 0.62 | %† | | | 0.62 | %† | | | 15 | % | |
9/30/23 | | $ | 31.43 | | | | 14.70 | % | | $ | 549.0 | | | | 2.33 | % | | | 0.61 | % | | | 0.61 | % | | | 45 | % | |
9/30/22 | | $ | 27.87 | | | | -15.66 | % | | $ | 738.4 | | | | 1.61 | % | | | 0.60 | % | | | 0.58 | % | | | 49 | % | |
9/30/21 | | $ | 35.98 | | | | 36.49 | % | | $ | 868.4 | | | | 1.20 | % | | | 0.66 | % | | | 0.62 | % | | | 14 | % | |
9/30/20 | | $ | 27.51 | | | | -0.76 | % | | $ | 951.9 | | | | 1.65 | % | | | 0.81 | % | | | 0.71 | % | | | 15 | % | |
9/30/19 | | $ | 30.31 | | | | 2.41 | % | | $ | 1,347.6 | | | | 1.86 | % | | | 0.78 | % | | | 0.68 | % | | | 11 | % | |
Institutional Class | |
10/01/2023-3/31/24+ | | $ | 35.20 | | | | 15.48 | % | | $ | 1,170.5 | | | | 2.57 | %† | | | 0.59 | %† | | | 0.59 | %† | | | 15 | % | |
9/30/23 | | $ | 31.43 | | | | 14.73 | % | | $ | 1,029.9 | | | | 2.42 | % | | | 0.59 | % | | | 0.59 | % | | | 45 | % | |
9/30/22 | | $ | 27.87 | | | | -15.66 | % | | $ | 911.0 | | | | 1.59 | % | | | 0.60 | % | | | 0.58 | % | | | 49 | % | |
9/30/21 | | $ | 35.99 | | | | 36.57 | % | | $ | 1,138.5 | | | | 1.22 | % | | | 0.62 | % | | | 0.58 | % | | | 14 | % | |
9/30/20 | | $ | 27.52 | | | | -0.73 | % | | $ | 844.3 | | | | 1.72 | % | | | 0.75 | % | | | 0.65 | % | | | 15 | % | |
9/30/19 | | $ | 30.33 | | | | 2.49 | % | | $ | 1,188.9 | | | | 1.96 | % | | | 0.72 | % | | | 0.63 | % | | | 11 | % | |
Class R6 | |
10/01/2023-3/31/24+ | | $ | 35.20 | | | | 15.49 | % | | $ | 292.6 | | | | 2.61 | %† | | | 0.56 | %† | | | 0.56 | %† | | | 15 | % | |
9/30/23 | | $ | 31.45 | | | | 14.77 | % | | $ | 232.4 | | | | 2.54 | % | | | 0.56 | % | | | 0.56 | % | | | 45 | % | |
9/30/22 | | $ | 27.88 | | | | -15.63 | % | | $ | 90.9 | | | | 1.75 | % | | | 0.56 | % | | | 0.54 | % | | | 49 | % | |
9/30/21(b) | | $ | 36.00 | | | | 19.05 | % | | $ | 87.3 | | | | 1.78 | %† | | | 0.57 | %† | | | 0.55 | %† | | | 14 | % | |
| | | | | | | Ratios/Supplemental Data: | | | |
| | | Net Asset
Value,
End of
Period | | Total
Return | | Net Assets,
End of
Period
($million) | | Ratio of
Net
Investment
Income to
Average
Net Assets | | Ratio of
Gross
Expenses
to Average
Net Assets | | Ratio of
Waiver/
Reimbursement
to Average
Net Assets | | Ratio of
Net
Expenses
to Average
Net Assets | | Portfolio
Turnover
Rate | |
Oakmark Bond Fund | |
Investor Class | |
3/31/24+ | | $ | 8.82 | | | | 7.45 | % | | $ | 29.6 | | | | 5.06 | %† | | | 1.17 | %† | | | (0.43 | %)† | | | 0.74 | %† | | | 35 | % | |
9/30/23 | | $ | 8.40 | | | | 1.78 | % | | $ | 1.1 | | | | 4.18 | % | | | 1.33 | % | | | (0.59 | %) | | | 0.74 | % | | | 75 | % | |
9/30/22(c) | | $ | 8.60 | | | | -11.43 | % | | $ | 1.0 | | | | 2.76 | %† | | | 1.64 | %† | | | (0.90 | %)† | | | 0.74 | %† | | | 97 | % | |
Advisor Class | |
3/31/24+ | | $ | 8.83 | | | | 7.40 | % | | $ | 15.3 | | | | 5.08 | %† | | | 0.93 | %† | | | (0.39 | %)† | | | 0.54 | %† | | | 35 | % | |
9/30/23 | | $ | 8.41 | | | | 2.10 | % | | $ | 0.8 | | | | 4.31 | % | | | 1.12 | % | | | (0.58 | %) | | | 0.54 | % | | | 75 | % | |
9/30/22 | | $ | 8.61 | | | | -13.11 | % | | $ | 1.4 | | | | 2.41 | % | | | 1.06 | % | | | (0.52 | %) | | | 0.54 | % | | | 97 | % | |
9/30/21 | | $ | 10.35 | | | | 3.81 | % | | $ | 2.4 | | | | 1.59 | % | | | 0.93 | % | | | (0.37 | %) | | | 0.57 | % | | | 112 | % | |
9/30/20(d) | | $ | 10.16 | | | | 2.04 | % | | $ | 0.6 | | | | 1.19 | %† | | | 3.14 | %† | | | (2.60 | %)† | | | 0.54 | %† | | | 25 | % | |
Institutional Class | |
3/31/24+ | | $ | 8.83 | | | | 7.55 | % | | $ | 14.5 | | | | 5.09 | %† | | | 0.88 | %† | | | (0.36 | %)† | | | 0.52 | %† | | | 35 | % | |
9/30/23 | | $ | 8.41 | | | | 2.00 | % | | $ | 2.6 | | | | 4.41 | % | | | 1.08 | % | | | (0.56 | %) | | | 0.52 | % | | | 75 | % | |
9/30/22 | | $ | 8.61 | | | | -13.10 | % | | $ | 3.0 | | | | 2.50 | % | | | 1.05 | % | | | (0.53 | %) | | | 0.52 | % | | | 97 | % | |
9/30/21 | | $ | 10.35 | | | | 3.88 | % | | $ | 3.3 | | | | 1.75 | % | | | 0.89 | % | | | (0.43 | %) | | | 0.46 | % | | | 112 | % | |
9/30/20(d) | | $ | 10.17 | | | | 2.07 | % | | $ | 79.0 | | | | 1.32 | %† | | | 2.42 | %† | | | (1.98 | %)† | | | 0.44 | %† | | | 25 | % | |
Class R6 | |
3/31/24+ | | $ | 8.83 | | | | 7.61 | % | | $ | 94.6 | | | | 5.12 | %† | | | 0.90 | %† | | | (0.46 | %)† | | | 0.44 | %† | | | 35 | % | |
9/30/23 | | $ | 8.41 | | | | 2.08 | % | | $ | 102.8 | | | | 4.50 | % | | | 1.02 | % | | | (0.58 | %) | | | 0.44 | % | | | 75 | % | |
9/30/22 | | $ | 8.61 | | | | -13.03 | % | | $ | 81.4 | | | | 2.57 | % | | | 1.02 | % | | | (0.58 | %) | | | 0.44 | % | | | 97 | % | |
9/30/21(b) | | $ | 10.35 | | | | 1.74 | % | | $ | 91.3 | | | | 1.71 | %† | | | 0.93 | %† | | | (0.49 | %)† | | | 0.44 | %† | | | 112 | % | |
+ Unaudited.
† Data has been annualized.
(a) Computed using average shares outstanding throughout the period.
(b) Commenced on 12/15/2020.
(c) Commenced on 01/28/2022.
(d) Commenced operations on 6/10/2020.
94 OAKMARK FUNDS
Oakmark Funds Disclosure Regarding the Board of Trustees' Approval of Investment Advisory Agreements as Approved October 24, 2023
On an annual basis, the Board of Trustees (the "Board" or "Trustees") of Harris Associates Investment Trust (the "Trust"), including a majority of the Trustees who are not "interested persons" of the Trust or of Harris Associates L.P. (the "Adviser") (including its affiliates), as such term is defined under the Investment Company Act of 1940, as amended (the "1940 Act") (the "Independent Trustees"), considers whether to continue the investment advisory agreements with the Adviser (each, an "Agreement," and collectively, the "Agreements") with respect to each series of the Trust (each, a "Fund"). At a meeting held on October 24, 2023, the Board, including all of the Independent Trustees, determined that the continuation of the Agreement for each Fund was in the best interest of the Fund and its shareholders, and approved the continuation of each Agreement through October 31, 2024. In reaching its determination, the Board considered all factors it believed relevant, including (i) the nature, extent, and quality of the services provided to each Fund and its shareholders; (ii) a comparison of each Fund's performance, fees and expenses relative to various comparable funds and accounts; (iii) the costs of the services provided and the estimated profit or loss realized by the Adviser from its relationships with each Fund; (iv) any achieved or anticipated economies of scale in relation to the services the Adviser provides to each Fund and whether any such economies of scale are shared with Fund shareholders; and (v) any "fall-out" benefits likely to accrue to the Adviser and its affiliates from their relationship with each Fund.
In evaluating the Agreements with respect to each Fund, the Board's Committee on Contracts (the "Committee"), together with the other Independent Trustees, requested, received, reviewed and considered extensive materials provided by the Adviser in response to questions submitted by the Independent Trustees. The Committee is comprised solely of Independent Trustees and leads the Board in its evaluation of the Agreements. During the annual contract approval process, the Committee and the other Independent Trustees met multiple times specifically to review and consider materials related to the proposed continuation of each Agreement; and to ensure that the Adviser had time to respond to questions from the Independent Trustees and that the Independent Trustees had time to consider those responses. They also met with senior representatives of the Adviser regarding, among other things, its personnel, operations and financial condition as they relate to the Funds. In addition, the Board retained Broadridge Financial Solutions, Inc. ("Broadridge"), an independent consulting firm that specializes in the analysis of fund industry data, to provide performance and expense information for each Fund and a group of comparable funds, as selected by Broadridge. As a general matter, the Board considered each Fund's performance and fees in light of the limitations inherent in the methodology used by Broadridge to construct such comparative groups and determine which investment companies should be included in the comparative groups. In connection with its deliberations, the Board also considered a broad range of information relevant to the annual contract approval process that is provided to the Board (including its various standing committees) at meetings throughout the year. While the Board considered the continuation of the Agreements for all of the Funds at the same meetings, the Board considered each Fund's Agreement separately from those of each other Fund.
The Independent Trustees were advised by legal counsel that is experienced in 1940 Act matters and that is independent from the Adviser ("Independent Counsel") throughout the annual contract approval process and they received a memorandum from Independent Counsel discussing the legal standards for their consideration of the proposed continuation of the Agreements. During the course of the year and during their deliberations regarding the annual contract approval process, the Committee and the other Independent Trustees met with Independent Counsel separately from representatives of the Adviser.
Provided below is a description of the Board's annual contract approval process and material factors that the Board considered regarding continuation of the Agreements and the compensation to be paid thereunder. In connection with its approval of the continuation of the Agreements, the Board evaluated the terms of the Agreements, the overall fairness of the Agreements to each Fund, the costs and benefits of the Agreements to each Fund, and to each Fund's underlying shareholders, and whether the Agreements were in the best interests of each respective Fund and its shareholders. The Board's determination to approve the continuation of the Agreements was based on a comprehensive consideration of all information provided to the Board throughout the year and specifically in connection with the annual contract approval process.
This description is not intended to include all of the factors considered by the Board. The Trustees did not identify any particular information or factor that was all-important or controlling, and each Independent Trustee may have attributed different weights to the various factors based on their business judgment.
Nature, Extent and Quality of Services
The Board's consideration of the nature, extent and quality of the Adviser's services to the Funds took into account the knowledge the Board gained during meetings with the Adviser throughout the year. In addition, the Board considered: the Adviser's long-term history of care and conscientiousness in the management of the Funds; the consistency of the Adviser's investment approach; the qualifications, experience and capabilities of, and the resources available to, the Adviser's investment personnel and other personnel responsible for managing the Funds; the Adviser's performance as administrator of the Funds; and the Adviser's compliance program. The Board also considered the Adviser's resources and reviewed key personnel involved in providing investment management services to the Funds, including the time that investment personnel devoted to each Fund, and the investment results produced as a result of the Adviser's in-house research. The Trustees also reviewed information regarding each Fund's "active share" in relation to its benchmark index.
The Board noted the extensive range of services that the Adviser provides to the Funds beyond the investment management services. The Board considered that, pursuant to each Agreement, the Adviser provides administrative services, including, among others, oversight of shareholder communications, fund administration and accounting services, regulatory and legal obligation oversight, supervision of Fund operations and Board support. The Board also considered the Adviser's policies and practices regarding
Oakmark.com 95
brokerage, commissions, trade execution, transaction and other trading costs, and allocation of portfolio transactions. The Board noted that the Adviser is also responsible for monitoring compliance with each Fund's investment objectives, policies and restrictions, as well as compliance with applicable law, including implementing changes and considering proposed regulation resulting from rulemaking initiatives of the U.S. Securities and Exchange Commission. The Board also considered that the Adviser's responsibilities include continual management of investment, operational, cybersecurity, enterprise, legal, regulatory and compliance risks as they relate to the Funds, and on a regular basis it considers information regarding the Adviser's processes for identifying, monitoring and managing risk. The Board also noted the Adviser's oversight of the Funds' various outside service providers, including its negotiation of certain service providers' fees and its evaluation of service providers' infrastructure, cybersecurity programs, compliance programs and business continuity programs, among other matters. The Board also considered the Adviser's ongoing development of its own internal infrastructure, including, among other things, its operational and trading capabilities, and its information technology to support the Funds' compliance structure through, among other things, cybersecurity programs, business continuity planning and risk management. In addition, the Board noted the positive compliance history of the Adviser.
The Board also considered the general structure of the Adviser's compensation program for portfolio managers, analysts and certain other employees, and whether this structure provides appropriate incentives to act in the best interests of the Funds. In addition, the Board considered the ability of the Adviser to attract and retain qualified personnel to service the Funds. The Board also noted the significant personal investments that the Adviser's personnel have made in the Funds, which serve to further align the interests of the Adviser and its personnel with those of the Funds' shareholders.
The Board also considered the manner in which the Adviser addressed various matters that arose during the year. These matters may have been the result of developments in the broader fund industry or the regulations governing it. In addition, the Board considered the Adviser's response to market conditions over the past year and considered the overall performance of the Adviser in this context.
Fund Performance
The Board considered each Fund's short-, intermediate- and long-term investment performance, as applicable, net of the Fund's fees and expenses, both on an absolute basis and compared to the performance of a broader group of comparable funds pursuing generally similar strategies with the same investment classification and/or objective as each Fund (the Fund's "Performance Universe"), as selected by Broadridge. The performance periods considered by the Board were those ended April 30, 2023. Performance information for Institutional Class was provided for the 1-, 3-, and 5-year periods, as applicable, and information for Investor Class was provided for the 10-year period, as applicable. With respect to performance quintile rankings for each Fund compared to its Performance Universe, the first quintile represents the highest performance and the fifth quintile represents the lowest performance.
Further detail considered by the Board regarding the investment performance of each Fund is set forth below:
Oakmark Fund. The Board considered that the Oakmark Fund's performance was in the first quintile for the 1-, 3-, 5- and 10-year periods.
Oakmark Select Fund. The Board considered that the Oakmark Select Fund's performance was in the second quintile for the 1-year period, the first quintile for the 3-year period, the fifth quintile for the 5-year period, and the third quintile for the 10-year period.
Oakmark Global Fund. The Board considered that the Oakmark Global Fund's performance was in the first quintile for the 1- and 3-year periods, the fourth quintile for the 5- year period, and the second quintile for the 10-year period.
Oakmark Global Select Fund. The Board considered that the Oakmark Global Select Fund's performance was in the third quintile for the 1-year period, the second quintile for the 3- and 10-year periods, and the fifth quintile for the 5-year period.
Oakmark International Fund. The Board considered that the Oakmark International Fund's performance was in the first quintile for the 1- and 3-year periods, the fourth quintile for the 5-year period, and the second quintile for the 10-year period.
Oakmark International Small Cap Fund. The Board considered that the Oakmark International Small Cap Fund's performance was in the first quintile for the 1-, 3-, 5-, and 10-year periods.
Oakmark Equity and Income Fund. The Board considered that the Oakmark Equity and Income Fund's performance was in the fourth quintile for the 1-year period, the first quintile for the 3-year period, and the second quintile for the 5- and 10-year periods.
Oakmark Bond Fund. The Board considered that the Oakmark Bond Fund's performance was in the first quintile for the 1-year period. The Fund was launched in June 2020 and therefore does not have 3-, 5-, or 10-year performance as of April 30, 2023.
In addition to considering each Fund's performance as compared to that of its respective Performance Universe, the Board also considered each Fund's performance as compared to that of its benchmark and other comparative data provided by Broadridge, including each Fund's total return and performance relative to risk and relative to its Morningstar rating, and separate comparative data provided by the Adviser. The Board also considered updated performance information at its October meeting at which the Agreements were approved.
In the case of underperformance for a Fund for any of the periods reviewed, the Board considered the magnitude and duration of that underperformance relative to the Performance Universe and/or the Fund's benchmark. For each Fund that the Board identified as having underperformed its Performance Universe and/or benchmark index to an extent, or over a period of time, that the Board felt warranted additional inquiry, the Board discussed with the Adviser the Fund's performance, the factors that caused such underperformance and how the Adviser evaluates underperformance. The Board considered the Adviser's responses with respect to each Fund that experienced underperformance. In addition, the Board met quarterly with the portfolio managers of each Fund to discuss the Fund's performance during the year prior to voting on the contract renewal. The Board recognized that the performance data reflects a snapshot of a period as of a particular date and that selecting a different performance period could produce significantly different results. The Board further acknowledged that long-term performance could be impacted by even one period of significant outperformance or underperformance, and that the market's view of any single investment theme could disproportionately affect performance.
96 OAKMARK FUNDS
Costs of Services Provided and Profits Realized by the Adviser
The Board considered the fee structure for each Fund under its Agreement as compared to a group of comparable funds provided by Broadridge. Specifically, using the information provided by Broadridge, the Board considered each Fund's management fee and the management fees for other mutual funds comparable in fund type, investment classification/category, load type and asset size to each Fund (the Fund's "Expense Group"), and considered each Fund's total expense ratio, which reflects the total fees paid by an investor, and those of its Expense Group (excluding any 12b-1/non-12b-1 service fees). The Board received and reviewed information for each Fund's Institutional Class for this purpose. When considering a Fund's management fee or total expense ratio versus the comparable information in the Expense Group, the Board considered whether specific factors contributed to the Fund's management fee or total expenses and the Adviser's representations regarding the competitiveness of each Fund's pricing. With respect to the quintile rankings for management fees net of fees waived for each Fund compared to its Expense Group, the first quintile represents the lowest fees and/or total expenses and the fifth quintile represents the highest fees and/or total expenses.
Further detail considered by the Board regarding each Fund's management fee and total expense ratio as of the conclusion of its fiscal year ended September 30, 2022, as compared to its Expense Group, is set forth below:
Oakmark Fund. The Board considered that the Oakmark Fund's management fee net of fees waived by the Adviser ranked in the fourth quintile and the Fund's total expense ratio ranked in the third quintile.
Oakmark Select Fund. The Board considered that the Oakmark Select Fund's management fee net of fees waived by the Adviser and the Fund's total expense ratio each ranked in the fifth quintile.
Oakmark Global Fund. The Board considered that the Oakmark Global Fund's management fee net of fees waived by the Adviser ranked in the fifth quintile and the Fund's total expense ratio ranked in the third quintile.
Oakmark Global Select Fund. The Board considered that the Oakmark Global Select Fund's management fee net of fees waived by the Adviser ranked in the fifth quintile and the Fund's total expense ratio ranked in the third quintile.
Oakmark International Fund. The Board considered that the Oakmark International Fund's management fee net of fees waived by the Adviser ranked in the fourth quintile and the Fund's total expense ratio ranked in the first quintile.
Oakmark International Small Cap Fund. The Board considered that the Oakmark International Small Cap Fund's management fee net of fees waived by the Adviser ranked in the fifth quintile and the Fund's total expense ratio ranked in the fourth quintile.
Oakmark Equity and Income Fund. The Board considered that the Oakmark Equity and Income Fund's management fee net of fees waived by the Adviser and the Fund's total expense ratio each ranked in the second quintile.
Oakmark Bond Fund. The Board considered that the Oakmark Bond Fund's management fee net of fees waived by the Adviser ranked in the first quintile and the Fund's total expense ratio ranked in the second quintile.
The Board also reviewed the Adviser's management fees for comparable institutional separate account clients and sub-advised funds (for which the Adviser provides portfolio management services only). The Board considered the appropriateness and reasonableness of any differences between the fees charged to a Fund and any such comparable separate account clients and/or sub-advised funds, including any breakpoints, and noted the Adviser's explanation that, although in most instances the fees paid by those other clients were lower than the fees paid by the Funds, the differences reflected the Adviser's significantly greater level of responsibilities and broader scope of services with respect to the Funds. The Board further noted the more extensive regulatory obligations and the various risks associated with managing the Funds as compared to any such comparable separate account clients and/or sub-advised funds.
The Board also noted that each Fund's management fee is a single fee that compensates the Adviser for its services as investment adviser and manager under the Agreements, and further noted that, for comparative purposes, where possible, Broadridge aggregated the separate investment advisory and administrative fees into a single management fee for the mutual funds in the Expense Group that clearly identify two separate fees. The Board noted that some mutual funds in the Expense Group may pay directly from fund assets for certain services that the Adviser is compensated for out of the management fee for the Funds. Accordingly, the Board also considered each Fund's management fee net of fees waived by the Adviser and total expense ratio as compared with its respective Expense Group as a way of taking account of these differences. The Board also considered the Adviser's agreement to continue the expense limitation agreement for each Fund. In addition, the Board took into account that effective October 1, 2022, the contractual management fee for each Fund, except Oakmark Bond Fund, was permanently reduced by two basis points and the Adviser's corresponding contractual management fee waiver by that amount of such Funds' fee rate was terminated.
The Board also considered the Adviser's costs in serving as the Funds' investment adviser and manager. Finally, the Board considered the Adviser's profitability analysis, as well as an Investment Management Industry Profitability Analysis prepared by Broadridge. The Board examined the estimated pre-tax profits realized by the Adviser and its affiliates from their relationship with each Fund, as presented in the profitability analyses, as well as the financial condition of the Adviser. The Board reviewed the Adviser's methodology for allocating costs among the Adviser's lines of business and among the Funds, for purposes of calculating its estimated profitability, and recognized that the methodology may not reflect all of the costs or risks associated with offering and managing a mutual fund complex. The Board also recognized that the Adviser and its affiliates are entitled to earn a reasonable level of profits for services they provide to each Fund.
Economies of Scale and Other Benefits Derived from the Relationship with the Funds
The Board considered whether each Fund's management fee structure reflects any potential economies of scale that may be realized by the Adviser for the benefit of each Fund's shareholders. The Board reviewed each Agreement, which includes breakpoints that decrease the management fee rate as Fund assets increase for each Fund except Oakmark Bond Fund. Since the Oakmark Bond Fund Agreement does not include breakpoints, the Board considered the Adviser's representations that the Fund's fee rate was set competitively and priced to scale before it has actually experienced an increase in assets which is another way of sharing potential economies of scale with shareholders. In addition, the Board considered each Fund's expense limitation agreement that reduces each Fund's
Oakmark.com 97
expenses at all asset levels, which can have an effect similar to breakpoints in sharing economies of scale with shareholders and provides protection from an increase in expenses if a Fund's assets decline. The Board also considered that each Fund potentially shares in indirect economies of scale through the Adviser's ongoing investments in its business in support of the Funds and that the Adviser has provided, at no added cost to the Funds, certain additional services to the Funds. The Board considered that this is a way of sharing economies of scale with the Funds and their shareholders. The Board also considered any fall-out benefits likely to accrue to the Adviser or its affiliates from their relationship with each Fund.
Conclusion
After full consideration of the above factors, as well as other factors that were instructive in evaluating the Agreements, the Board, including all of the Independent Trustees, in its business judgment, concluded that approval of the continuation of each Agreement was in the best interests of the respective Fund and its shareholders. In reaching this determination, the Board considered that the nature, extent and quality of the services provided by the Adviser to each Fund were appropriate and consistent with the Fund's Agreement and that each Fund was likely to continue to benefit from services provided under its Agreement with the Adviser; that the Adviser was delivering performance for each Fund that was consistent with the long-term investment strategies being pursued by the Fund, and that the Fund and its shareholders were benefiting from the Adviser's management of the Fund; that the management fees paid by each Fund to the Adviser were reasonable in light of the services provided; that each Fund's management fees allow shareholders to benefit from potential economies of scale that may be achieved by the Adviser; that the profitability of the Adviser's relationship with each Fund appeared to be reasonable in relation to the services performed; and that the benefits accruing to the Adviser and its affiliates by virtue of their relationship with the Funds were reasonable in light of the costs and risks associated with providing the investment advisory and other services to each Fund and the benefits accruing to each Fund. The Board's conclusions are based in part on its consideration of materials prepared in connection with the approval or continuance of the Agreements in prior years and on the Board's ongoing regular review of Fund performance and operations throughout the year, in addition to material prepared specifically for the most recent annual contract approval process.
98 OAKMARK FUNDS
Disclosures and Endnotes
Reporting to Shareholders. The Funds reduce the number of duplicate prospectuses, annual and semi-annual reports your household receives by sending only one copy of each to those addresses shared by two or more accounts. Call the Funds at 1-800-OAKMARK (625-6275) to request individual copies of these documents. The Funds will begin sending individual copies 30 days after receiving your request.
Before investing in any Oakmark Fund, you should carefully consider the Fund's investment objectives, risks, management fees and other expenses. This and other important information is contained in the Funds' prospectus and a Fund's summary prospectus. Please read the prospectus and summary prospectus carefully before investing. For more information, please visit www.oakmark.com or call 1-800-OAKMARK (625-6275).
The discussion of the Funds' investments and investment strategy (including current investment themes, the portfolio managers' research and investment process, and portfolio characteristics) represents the Funds' investments and the views of the portfolio managers and Harris Associates L.P., the Funds' investment adviser, at the time of this report, and are subject to change without notice.
All Oakmark Funds: Investing in value stocks presents the risk that value stocks may fall out of favor with investors and under-perform growth stocks during given periods.
Oakmark, Oakmark Equity and Income, Oakmark Global, Oakmark International, Oakmark International Small Cap, and Oakmark Bond Funds: The Funds' portfolios tend to be invested in a relatively small number of investments. As a result, the appreciation or depreciation of any one security held will have a greater impact on the Funds' net asset value than it would if the Funds invest in a larger number of securities. Although that strategy has the potential to generate attractive returns over time, it also increases the Funds' volatility.
Because the Oakmark Select and Oakmark Global Select Funds are non-diversified, the performance of each holding will have a greater impact on the Funds' total return and may make the Funds' returns more volatile than a more diversified fund.
Oakmark Select and Oakmark Equity and Income Funds: The stocks of medium-sized companies tend to be more volatile than those of large companies and have underperformed the stocks of small and large companies during some periods.
Oakmark Global, Oakmark Global Select, Oakmark International, Oakmark International Small Cap and Oakmark Bond Funds: Investing in foreign securities presents risks which in some ways may be greater than U.S. investments. Those risks include: currency fluctuation; different regulation, accounting standards, trading practices and levels of available information; generally higher transaction costs; and political risks.
The percentages of hedge exposure for each foreign currency are calculated by dividing the market value of all same-currency forward contracts by the market value of the underlying equity exposure to that currency.
Oakmark Equity and Income and Oakmark Bond Funds invest in medium- and lower quality debt securities that have higher yield potential but present greater investment and credit risk than higher quality securities. These risks may result in greater share price volatility.
Oakmark International Small Cap Fund: The stocks of smaller companies often involve more risk than the stocks of larger companies. Stocks of small companies tend to be more volatile and have a smaller public market than stocks of larger companies.
Small companies may have a shorter history of operations than larger companies, may not have as great an ability to raise additional capital and may have a less diversified product line, making them more susceptible to market pressure.
Oakmark Equity and Income and Oakmark Bond Funds: The Funds may be subject to prepayment and extension risk, which may shorten or lengthen the duration of the Funds' investments. The Funds may also be subject to credit risk, which is the risk the issuer or guarantor of a debt security will be unable or unwilling to make timely payments of interest or principal or to otherwise honor its obligations. The Funds' yield and share price will fluctuate in response to changes in interest rates and there is a risk of loss due to changes in interest rates. Investing in when-issued or forward-settling transactions may be less favorable than the price or yield available in the market when the transaction takes place. The Funds' exposure to loan interests may be subject to restrictions on transfer, illiquid and difficult to value.
Endnotes:
1. The S&P 500 Total Return Index is a float-adjusted, capitalization-weighted index of 500 U.S. large-capitalization stocks representing all major industries. It is a widely recognized index of broad U.S. equity market performance. Returns reflect the reinvestment of dividends. This index is unmanaged and investors cannot invest directly in this index.
2. The price to earnings ratio ("P/E") compares a company's current share price to its per-share earnings. It may also be known as the "price multiple" or "earnings multiple," and gives a general indication of how expensive or cheap a stock is. Investors should not base investment decisions on any single attribute or characteristic data point.
3. Price to book ratio ("P/B") is a stock's capitalization divided by its book value. The projected P/B ratio uses the forecast book value for next year and the stock's price at the indicated date.
4. Growth at a reasonable price (GARP) is an equity investment strategy that combines growth and value investing attributes.
5. Note that Oakmark Fund sold Amazon last quarter because we believe the current market price better reflects the combined value of retail and AWS.
6. Magnificent 7 stocks refer to Alphabet Class A, Amazon.com, Apple, Meta Platforms, Microsoft, NVIDIA and Tesla.
7. The Russell 1000® Growth Index is an unmanaged index that measures the performance of the large-cap growth segment of the U.S. equity universe. It includes those Russell 1000® companies with higher price-to-book ratios and higher forecasted growth values. This index is unmanaged and investors cannot invest directly in this index.
8. The NASDAQ Composite Index is a broad-based market-capitalization weighted index of all common type stocks on the NASDAQ Stock Market, including common stocks, American depositary receipts, ordinary shares, shares of beneficial interest or limited partnership interests, and tracking stocks. The index includes all NASDAQ listed stocks that are not derivatives, preferred shares, funds, exchange-traded funds (ETFs) or debentures. This index is
Oakmark.com 99
Disclosures and Endnotes (continued)
unmanaged and investors cannot invest directly in this index.
9. Portfolio holdings are subject to change without notice and are not intended as recommendations of individual stocks.
10. The Dow Jones Industrial Average is a price-weighted measure of 30 U.S. blue-chip companies. The index covers all industries except transportation and utilities. This index is unmanaged and investors cannot invest directly in this index.
11. The Lipper Large-Cap Value Fund Index measures the equal-weighted performance of the 30 largest U.S. large-cap value funds as defined by Lipper. This index is unmanaged and investors cannot invest directly in this index.
12. The Lipper Multi-Cap Value Fund Index measures the equal-weighted performance of the 30 largest U.S. multi-cap value funds as defined by Lipper. This index is unmanaged and investors cannot invest directly in this index.
13. EPS refers to Earnings Per Share and is calculated by dividing total earnings by the number of shares outstanding.
14. The MSCI World Index (Net) is a free float-adjusted, market capitalization-weighted index that is designed to measure the global equity market performance of developed markets. The index covers approximately 85% of the free float-adjusted market capitalization in each country. This benchmark calculates reinvested dividends net of withholding taxes. This index is unmanaged and investors cannot invest directly in this index.
15. The Lipper Global Fund Index measures the equal-weighted performance of the 30 largest global equity funds as defined by Lipper. This index is unmanaged and investors cannot invest directly in this index.
16. EBIT is a measure of a firm's profit that includes all expenses except interest and income tax expenses. It is the difference between operating revenues and operating expenses.
17. The MSCI World ex U.S. Index (Net) is a free float-adjusted, market capitalization-weighted index that is designed to measure international developed market equity performance, excluding the U.S. The index covers approximately 85% of the free float-adjusted market capitalization in each country. This benchmark calculates reinvested dividends net of withholding taxes. This index is unmanaged and investors cannot invest directly in this index.
18. The MSCI EAFE Index (Net) is designed to represent the performance of large- and mid-cap securities across 21 developed markets, including countries in Europe, Australasia and the Far East, excluding the U.S. and Canada. The index covers approximately 85% of the free float-adjusted market capitalization in each of the 21 countries. This benchmark calculates reinvested dividends net of withholding taxes. This index is unmanaged and investors cannot invest directly in this index.
19. The Lipper International Fund Index measures the equal-weighted performance of the 30 largest international equity funds as defined by Lipper. This index is unmanaged and investors cannot invest directly in this index.
20. The MSCI World ex U.S. Small Cap Index (Net) is designed to measure performance of small-cap stocks across 22 of 23 developed markets (excluding the U.S.). The index covers approximately 14% of the free float-adjusted market capitalization in each country. This benchmark calculates reinvested dividends net of withholding taxes. This index is unmanaged and investors cannot invest directly in this index.
21. The Lipper International Small-Cap Fund Index measures the equal-weighted performance of the 30 largest international small-cap equity funds as defined by Lipper. This index is unmanaged and investors cannot invest directly in this index.
22. EBITA refers to Earnings Before the deduction of expenses for Interest, Taxes and Amortization, which is a measure of operating income.
23. ROE refers to return on equity and measures profitability as a percentage of the money shareholders have invested.
24. Price-to-cash flow is defined as a stock's capitalization divided by its cash flow for the latest fiscal year.
25. Dividend Yield is a stock's expected annual dividend divided by the stock's price at the indicated date, expressed as a percentage.
26. TTM stands for twelve trailing months.
27. Yield is the annual rate of return of an investment paid in dividends or interest, expressed as a percentage. A snapshot of a fund's interest and dividend income, yield is expressed as a percentage of a fund's net asset value, is based on income earned over a certain time period and is annualized, or projected, for the coming year.
28. Maturity is the weighted average of the stated time to maturity for the securities held in the portfolio.
29. The Bloomberg U.S. Aggregate Bond Index is a broad-based benchmark that measures the investment grade, U.S. dollar-denominated, fixed-rate taxable bond market. The index includes Treasurys, government-related and corporate securities, mortgage-backed securities (agency fixed-rate and hybrid ARM pass-throughs), asset-backed securities, and commercial mortgage-backed securities (agency and non-agency). This index is unmanaged and investors cannot invest directly in this index.
30. The Bloomberg U.S. Investment Grade Corporate Bond Index measures the investment grade, fixed-rate, taxable corporate bond market. It includes USD denominated securities publicly issued by US and non-US industrial, utility, and financial issuers.
31. The Bloomberg U.S. High Yield Corporate Bond Index measures the USD-denominated, high yield, fixed-rate corporate bond market. Securities are classified as high yield if the middle rating of Moody's, Fitch and S&P is Ba1/BB+/BB+ or below. Bonds from issuers with an emerging markets country of risk, based on the indices' EM country definition, are excluded.
32. The Merrill Lynch Option Volatility Estimate Index (MOVE index) is a market-implied measure of bond market volatility. The MOVE index calculates the implied volatility of U.S. Treasury options using a weighted average of option prices on Treasury futures across multiple maturities (2, 5, 10, and 30 years).
100 OAKMARK FUNDS
Disclosures and Endnotes (continued)
33. The Bloomberg Investment Grade Corporate Bond Fund Index is a fund that mimics the composition and performance of the Bloomberg Investment Grade Corporate Bond Index.
34. The Lipper Balanced Fund Index measures the equal-weighted performance of the 30 largest U.S. balanced funds as defined by Lipper. This index is unmanaged and investors cannot invest directly in this index.
35. The Bloomberg U.S. Government/Credit Index measures the non-securitized component of the U.S. Aggregate Index. It includes investment grade, U.S. dollar-denominated, fixed-rate Treasurys, government-related and corporate securities. This index is unmanaged and investors cannot invest directly in this index.
36. The Lipper Core Plus Bond Fund Index is an equally weighted performance index of the largest qualifying funds (based on net assets) in the Lipper Core Plus Bond Funds classification. There are currently 30 funds represented in this Index.
37. The asset class returns noted are unaudited and sourced from our proprietary account system.
38. Duration is a measure of the sensitivity of the price of a bond or other debt instrument to a change in interest rates.
Oakmark.com 101

This page intentionally left blank.
102 OAKMARK FUNDS

This page intentionally left blank.
Oakmark.com 103

This page intentionally left blank.
104 OAKMARK FUNDS
Oakmark Funds
Trustees and Officers
Trustees
Thomas H. Hayden—Chair
Hugh T. Hurley, III
Patricia Louie
Christine M. Maki
Laurence C. Morse, Ph.D.
Mindy M. Posoff
Steven S. Rogers
Kristi L. Rowsell
Rana J. Wright
Officers
Rana J. Wright—President and Principal Executive Officer
Adam D. Abbas—Vice President
Joseph J. Allessie—Vice President, Secretary and Chief Legal Officer
Robert F. Bierig—Vice President
Anthony P. Coniaris—Executive Vice President
Rick J. Dercks—Vice President and Assistant Treasurer
Alexander E. Fitch—Vice President
Kathleen O. Gerdes—Vice President
Justin D. Hance—Vice President
David G. Herro—Vice President
M. Colin Hudson—Vice President
John J. Kane—Vice President, Chief Compliance Officer, Assistant Secretary and Anti-Money Laundering Officer
Christopher W. Keller—Vice President
Eric Liu—Vice President
Jason E. Long—Vice President
Michael L. Manelli—Vice President
Michael J. Neary—Vice President
Michael A. Nicolas—Vice President
William C. Nygren—Vice President
Howard M. Reich—Vice President
John A. Sitarz—Vice President
Zachary D. Weber—Vice President, Principal Accounting Officer, Principal Financial Officer and Treasurer
Other Information
Investment Adviser
Harris Associates L.P.
111 S. Wacker Drive
Chicago, Illinois 60606-4319
Transfer Agent
SS&C GIDS, Inc.
Quincy, Massachusetts
Legal Counsel
K&L Gates LLP
Washington, D.C.
Independent Registered Public Accounting Firm
Deloitte & Touche LLP
Chicago, Illinois
Contact Us
Please call 1-800-OAKMARK
(1-800-625-6275)
or 617-483-8327
Website
www.oakmark.com
X
@HarrisOakmark
To obtain a prospectus, an application or periodic reports, access our website at Oakmark.com or call 1-800-OAKMARK (625-6275) or 617-483-8327.
Each Fund files its complete schedule of portfolio holdings with the Securities and Exchange Commission ("SEC") for the first and third quarters of each fiscal year as an exhibit on Form N-PORT. The Funds' Form N-PORTs are available at www.oakmark.com or on the SEC's website at www.sec.gov.
A description of the policies and procedures the Funds use to determine how to vote proxies relating to portfolio securities is available without charge, upon request, by calling toll free 1-800-625-6275; on the Funds' website at www.oakmark.com; and on the SEC's website at www.sec.gov.
No later than August 31 of each year, information regarding how the Adviser, on behalf of the Funds, voted proxies relating to the Funds' portfolio securities for the 12 months ended the preceding June 30 will be available through a link on the Funds' website at www.oakmark.com and on the SEC's website at www.sec.gov.
This report is submitted for the general information of the shareholders of the Funds. The report is not authorized for distribution to prospective investors in the Funds unless it is accompanied or preceded by a currently effective prospectus of the Funds.
No sales charge to the shareholder or to the new investor is made in offering the shares of the Funds.
Oakmark.com 105


| (b) | Not applicable to the Registrant. |
Item 2. Code of Ethics.
Not required in this filing.
Item 3. Audit Committee Financial Expert.
Not required in this filing.
Item 4. Principal Accountant Fees and Services.
Not required in this filing.
Item 5. Audit Committee of Listed Registrants.
Item 6. Investments.
| (a) | The Schedule of Investments in securities of unaffiliated issuers as of the close of the reporting period is included as part of the semi-annual report to shareholders filed under Item 1 of this Form. |
Item 7. Reserved.
Item 8. Reserved.
Item 9. Reserved.
Item 10. Reserved.
Item 11. Reserved.
Item 12. Disclosure of Proxy Voting Policies and Procedures for Closed-End Management Investment Companies.
Not applicable.
Item 13. Portfolio Managers of Closed-End Management Investment Companies.
Not applicable.
Item 14. Purchases of Equity Securities by Closed-End Management Investment Company and Affiliated Purchasers.
Not applicable.
Item 15. Submission of Matters to a Vote of Security Holders.
During the period covered by this report, no material changes were made to the procedures by which shareholders may recommend nominees to the Registrant’s board of trustees.
Item 16. Controls and Procedures.
| (a) | Based on an evaluation of the Registrant’s disclosure controls and procedures (as defined in Rule 30a-3(c) under the Investment Company Act of 1940, the “Disclosure Controls”), the Disclosure Controls are effectively designed to ensure that information required to be disclosed by the Registrant in this report is recorded, processed, summarized, and reported within 90 days prior to the filing of this report, including ensuring that information required to be disclosed in this report is accumulated and communicated to the Registrant's management, including the Registrant's principal executive officer and principal financial officer, as appropriate to allow timely decisions regarding required disclosure. |
| (b) | There were no changes in the Registrant's internal controls over financial reporting (as defined in Rule 30a-3(d) under the Investment Company Act of 1940) that occurred during the period covered by this report that has materially affected, or is reasonably likely to materially affect, the Registrant's internal control over financial reporting. |
Item 17. Disclosure of Securities Lending Activities for Closed-End Management Investment Companies.
Not applicable.
Item 18. Recovery of Erroneously Awarded Compensation
Not applicable.
Item 19. Exhibits.
SIGNATURES
Pursuant to the requirements of the Securities Exchange Act of 1934 and the Investment Company Act of 1940, the Registrant has duly caused this report to be signed on its behalf by the undersigned, thereunto duly authorized.
Harris Associates Investment Trust
| By: | /s/ Rana J. Wright | |
| | Rana J. Wright | |
| | Principal Executive Officer | |
| | | |
| Date: | May 28, 2024 | |
Pursuant to the requirements of the Securities Exchange Act of 1934 and the Investment Company Act of 1940, this report has been signed below by the following persons on behalf of the Registrant and in the capacities and on the dates indicated.
| By: | /s/ Rana J. Wright | |
| | Rana J. Wright | |
| | Principal Executive Officer | |
| | | |
| Date: | May 28, 2024 | |
| | | |
| | | |
| By: | /s/ Zachary D. Weber | |
| | Zachary D. Weber | |
| | Principal Financial Officer, Principal Accounting Officer and Treasurer | |
| | | |
| Date: | May 28, 2024 | |