UNITED STATES
SECURITIES AND EXCHANGE COMMISSION
Washington, D.C. 20549
FORM N-CSR
CERTIFIED SHAREHOLDER REPORT OF REGISTERED
MANAGEMENT INVESTMENT COMPANIES
Investment Company Act file number 811-06279
Harris Associates Investment Trust
(Exact name of Registrant as specified in charter)
111 South Wacker Drive, Suite 4600
Chicago, Illinois 60606-4319
(Address of principal executive offices) (Zip code)
| | Rana J. Wright Harris Associates L.P. 111 South Wacker Drive, Suite 4600 Chicago, Illinois 60606-4319 | | Ndenisarya M. Bregasi, Esq. K&L Gates LLP 1601 K Street, N.W. Washington, D.C. 20006-1600 |
| | (Name and address of agents for service) |
Registrant's telephone number, including area code: (312) 646-3600
Date of fiscal year end: 09/30/20
Date of reporting period: 03/31/21
Item 1. Reports to Shareholders.
OAKMARK FUNDS
SEMI-ANNUAL REPORT | MARCH 31, 2021
OAKMARK FUND
OAKMARK SELECT FUND
OAKMARK GLOBAL FUND
OAKMARK GLOBAL SELECT FUND
OAKMARK INTERNATIONAL FUND
OAKMARK INTERNATIONAL SMALL CAP FUND
OAKMARK EQUITY AND INCOME FUND
OAKMARK BOND FUND

Oakmark Funds
2021 Semi-Annual Report
Fund Expenses | | | 1 | | |
Commentary on Oakmark and Oakmark Select Funds | | | 2 | | |
Oakmark Fund | |
Summary Information | | | 4 | | |
Portfolio Manager Commentary | | | 5 | | |
Schedule of Investments | | | 6 | | |
Oakmark Select Fund | |
Summary Information | | | 10 | | |
Portfolio Manager Commentary | | | 11 | | |
Schedule of Investments | | | 12 | | |
Oakmark Global Fund | |
Summary Information | | | 14 | | |
Portfolio Manager Commentary | | | 15 | | |
Schedule of Investments | | | 17 | | |
Oakmark Global Select Fund | |
Summary Information | | | 20 | | |
Portfolio Manager Commentary | | | 21 | | |
Schedule of Investments | | | 22 | | |
Oakmark International Fund | |
Summary Information | | | 24 | | |
Portfolio Manager Commentary | | | 25 | | |
Schedule of Investments | | | 26 | | |
Oakmark International Small Cap Fund | |
Summary Information | | | 30 | | |
Portfolio Manager Commentary | | | 31 | | |
Schedule of Investments | | | 32 | | |
Oakmark Equity and Income Fund | |
Summary Information | | | 36 | | |
Portfolio Manager Commentary | | | 37 | | |
Schedule of Investments | | | 39 | | |
Oakmark Bond Fund | |
Summary Information | | | 44 | | |
Portfolio Manager Commentary | | | 45 | | |
Schedule of Investments | | | 47 | | |
Financial Statements | |
Statements of Assets and Liabilities | | | 50 | | |
Statements of Operations | | | 52 | | |
Statements of Changes in Net Assets | | | 54 | | |
Notes to Financial Statements | | | 68 | | |
Financial Highlights | | | 80 | | |
Disclosures and Endnotes | | | 96 | | |
Trustees and Officers | | | 101 | | |
Beginning on January 1, 2021, as permitted by regulations adopted by the U.S. Securities and Exchange Commission, paper copies of the Oakmark Funds' annual and semi-annual shareholder reports will no longer be sent by mail, unless you specifically request paper copies of the reports. Instead, the reports will be made available on Oakmark.com, and you will be notified by mail each time a report is posted and provided with a website link to access the report. If you already elected to receive shareholder reports electronically, you will not be affected by this change and you need not take any action. You may elect to receive shareholder reports and other communications from the Funds electronically anytime by contacting your financial intermediary (such as a broker-dealer or bank) or, if you hold your shares directly with the Funds, by calling 1-800-OAKMARK (625-6275) or visiting Oakmark.com. | |
You may elect to receive all future reports in paper free of charge. If you invest through a financial intermediary, you can contact your financial intermediary to request that you continue to receive paper copies of your shareholder reports. If you hold your shares directly with the Funds, you can call 1-800-OAKMARK (625-6275) to let the Funds know you wish to continue receiving paper copies of your shareholder reports. Your election to receive reports in paper will apply to all Funds you hold directly or all Funds you hold through your financial intermediary, as applicable.
FORWARD-LOOKING STATEMENT DISCLOSURE
One of our most important responsibilities as mutual fund managers is to communicate with shareholders in an open and direct manner. Some of our comments in our letters to shareholders are based on current management expectations and are considered "forward-looking statements." Actual future results, however, may prove to be different from our expectations. You can identify forward-looking statements by words such as "estimate", "may", "will", "expect", "believe",
"plan" and other similar terms. We cannot promise future returns. Our opinions are a reflection of our best judgment at the time this report is compiled, and we disclaim any obligation to update or alter forward-looking statements as a result of new information, future events, or otherwise.
Oakmark.com
Fund Expenses (Unaudited)
A shareholder of each Fund incurs ongoing costs, including investment advisory fees, transfer agent fees and other Fund expenses. The examples below are intended to help shareholders understand the ongoing costs (in dollars) of investing in each Fund and to compare these costs with the ongoing costs of investing in other funds.
The following table provides information about actual account values and actual Fund expenses as well as hypothetical account values and hypothetical fund expenses for shares of each Fund.
ACTUAL EXPENSES
The following table shows the expenses a shareholder would have paid on a $1,000 investment in each Fund from October 1, 2020 to March 31, 2021, as well as how much a $1,000 investment would be worth at the close of the period, assuming actual Fund returns and expenses. A shareholder can estimate expenses incurred for the period by dividing the account value at March 31, 2021, by $1,000 and multiplying the result by the number in the "Actual—Expenses Paid During Period" column shown below.
HYPOTHETICAL EXAMPLE FOR COMPARISON PURPOSES
The following table provides information about hypothetical account values and hypothetical expenses for shares of each Fund based on actual expense ratios and an assumed rate of return of 5% per year before expenses, which are not the Funds' actual returns. The hypothetical account values and expenses may not be used to estimate the actual ending account balances or actual expenses shareholders paid for the period. Shareholders may use this information to compare the ongoing costs of investing in a Fund and other funds. To do so, compare this 5% hypothetical example with the 5% hypothetical examples that appear in the shareholder reports of the other funds.
Please note that the expenses shown in the table are meant to highlight your ongoing costs only and do not reflect any transaction costs, such as redemption fees. Therefore, the "Hypothetical—Expenses Paid During Period" column of the table is useful in comparing ongoing costs only and will not help you determine the relative total costs of owning different funds. If these transaction costs were included, the total costs would have been higher.
| | | | | ACTUAL | | HYPOTHETICAL
(5% annual return
before expenses) | | | |
| | Beginning
Account Value
(10/1/20) | | Ending
Account Value
(3/31/21) | | Expenses
Paid During
Period* | | Ending
Account Value
(3/31/21) | | Expenses
Paid During
Period* | | Annualized
Expense
Ratio | |
Oakmark Fund | |
Investor Class | | $ | 1,000.00 | | | $ | 1,435.10 | | | $ | 5.46 | | | $ | 1,020.44 | | | $ | 4.53 | | | | 0.90 | % | |
Advisor Class | | $ | 1,000.00 | | | $ | 1,436.30 | | | $ | 4.43 | | | $ | 1,021.29 | | | $ | 3.68 | | | | 0.73 | % | |
Institutional Class | | $ | 1,000.00 | | | $ | 1,436.70 | | | $ | 4.07 | | | $ | 1,021.59 | | | $ | 3.38 | | | | 0.67 | % | |
Service Class | | $ | 1,000.00 | | | $ | 1,433.50 | | | $ | 6.73 | | | $ | 1,019.40 | | | $ | 5.59 | | | | 1.11 | % | |
R6 Class | | $ | 1,000.00 | | | $ | 1,177.80 | | | $ | 2.02 | (a) | | $ | 1,021.74 | | | $ | 3.23 | | | | 0.64 | % | |
Oakmark Select Fund | |
Investor Class | | $ | 1,000.00 | | | $ | 1,469.20 | | | $ | 6.09 | | | $ | 1,020.00 | | | $ | 4.99 | | | | 0.99 | % | |
Advisor Class | | $ | 1,000.00 | | | $ | 1,469.80 | | | $ | 5.48 | | | $ | 1,020.49 | | | $ | 4.48 | | | | 0.89 | % | |
Institutional Class | | $ | 1,000.00 | | | $ | 1,470.70 | | | $ | 4.74 | | | $ | 1,021.09 | | | $ | 3.88 | | | | 0.77 | % | |
Service Class | | $ | 1,000.00 | | | $ | 1,467.20 | | | $ | 7.32 | | | $ | 1,019.00 | | | $ | 5.99 | | | | 1.19 | % | |
R6 Class | | $ | 1,000.00 | | | $ | 1,171.00 | | | $ | 2.36 | (a) | | $ | 1,021.19 | | | $ | 3.78 | | | | 0.75 | % | |
Oakmark Global Fund | |
Investor Class | | $ | 1,000.00 | | | $ | 1,437.50 | | | $ | 6.87 | | | $ | 1,019.30 | | | $ | 5.69 | | | | 1.13 | % | |
Advisor Class | | $ | 1,000.00 | | | $ | 1,438.80 | | | $ | 5.78 | | | $ | 1,020.19 | | | $ | 4.78 | | | | 0.95 | % | |
Institutional Class | | $ | 1,000.00 | | | $ | 1,439.30 | | | $ | 5.47 | | | $ | 1,020.44 | | | $ | 4.53 | | | | 0.90 | % | |
Service Class | | $ | 1,000.00 | | | $ | 1,436.30 | | | $ | 8.20 | | | $ | 1,018.20 | | | $ | 6.79 | | | | 1.35 | % | |
R6 Class | | $ | 1,000.00 | | | $ | 1,131.00 | | | $ | 2.75 | (a) | | $ | 1,020.49 | | | $ | 4.48 | | | | 0.89 | % | |
Oakmark Global Select Fund | |
Investor Class | | $ | 1,000.00 | | | $ | 1,379.60 | | | $ | 6.59 | | | $ | 1,019.40 | | | $ | 5.59 | | | | 1.11 | % | |
Advisor Class | | $ | 1,000.00 | | | $ | 1,380.80 | | | $ | 5.64 | | | $ | 1,020.19 | | | $ | 4.78 | | | | 0.95 | % | |
Institutional Class | | $ | 1,000.00 | | | $ | 1,381.40 | | | $ | 5.22 | | | $ | 1,020.54 | | | $ | 4.43 | | | | 0.88 | % | |
R6 Class | | $ | 1,000.00 | | | $ | 1,126.40 | | | $ | 2.59 | (a) | | $ | 1,020.74 | | | $ | 4.23 | | | | 0.84 | % | |
Oakmark International Fund | |
Investor Class | | $ | 1,000.00 | | | $ | 1,433.20 | | | $ | 6.07 | | | $ | 1,019.95 | | | $ | 5.04 | | | | 1.00 | % | |
Advisor Class | | $ | 1,000.00 | | | $ | 1,434.30 | | | $ | 5.16 | | | $ | 1,020.69 | | | $ | 4.28 | | | | 0.85 | % | |
Institutional Class | | $ | 1,000.00 | | | $ | 1,435.10 | | | $ | 4.61 | | | $ | 1,021.14 | | | $ | 3.83 | | | | 0.76 | % | |
Service Class | | $ | 1,000.00 | | | $ | 1,431.90 | | | $ | 7.28 | | | $ | 1,018.95 | | | $ | 6.04 | | | | 1.20 | % | |
R6 Class | | $ | 1,000.00 | | | $ | 1,100.70 | | | $ | 2.35 | (a) | | $ | 1,021.09 | | | $ | 3.88 | | | | 0.77 | % | |
Oakmark International Small Cap Fund | |
Investor Class | | $ | 1,000.00 | | | $ | 1,405.30 | | | $ | 8.16 | | | $ | 1,018.15 | | | $ | 6.84 | | | | 1.36 | % | |
Advisor Class | | $ | 1,000.00 | | | $ | 1,405.60 | | | $ | 7.26 | | | $ | 1,018.90 | | | $ | 6.09 | | | | 1.21 | % | |
Institutional Class | | $ | 1,000.00 | | | $ | 1,407.00 | | | $ | 6.66 | | | $ | 1,019.40 | | | $ | 5.59 | | | | 1.11 | % | |
Service Class | | $ | 1,000.00 | | | $ | 1,403.40 | | | $ | 9.77 | | | $ | 1,016.80 | | | $ | 8.20 | | | | 1.63 | % | |
R6 Class | | $ | 1,000.00 | | | $ | 1,129.10 | | | $ | 3.37 | (a) | | $ | 1,019.50 | | | $ | 5.49 | | | | 1.09 | % | |
Oakmark Equity and Income Fund | |
Investor Class | | $ | 1,000.00 | | | $ | 1,279.70 | | | $ | 4.77 | | | $ | 1,020.74 | | | $ | 4.23 | | | | 0.84 | % | |
Advisor Class | | $ | 1,000.00 | | | $ | 1,280.70 | | | $ | 3.70 | | | $ | 1,021.69 | | | $ | 3.28 | | | | 0.65 | % | |
Institutional Class | | $ | 1,000.00 | | | $ | 1,281.50 | | | $ | 3.36 | | | $ | 1,021.99 | | | $ | 2.97 | | | | 0.59 | % | |
Service Class | | $ | 1,000.00 | | | $ | 1,278.50 | | | $ | 5.91 | | | $ | 1,019.75 | | | $ | 5.24 | | | | 1.04 | % | |
R6 Class | | $ | 1,000.00 | | | $ | 1,116.70 | | | $ | 1.75 | (a) | | $ | 1,022.09 | | | $ | 2.87 | | | | 0.57 | % | |
Oakmark Bond Fund | |
Advisor Class | | $ | 1,000.00 | | | $ | 1,015.20 | | | $ | 3.06 | | | $ | 1,021.89 | | | $ | 3.07 | | | | 0.61 | % | |
Institutional Class | | $ | 1,000.00 | | | $ | 1,016.70 | | | $ | 2.26 | | | $ | 1,022.69 | | | $ | 2.27 | | | | 0.45 | % | |
R6 Class | | $ | 1,000.00 | | | $ | 994.30 | | | $ | 1.27 | (a) | | $ | 1,022.74 | | | $ | 2.22 | | | | 0.44 | % | |
* Expenses are calculated using the Annualized Expense Ratio, multiplied by the average account value over the period, multiplied by 182 and divided by 365 (to reflect one-half year period)
(a) Expenses are calculated using the Annualized Expense Ratio, multiplied by the average account value over the period, multiplied by 106 and divided by 365 (to reflect number of days the class was open)
Oakmark.com 1
Oakmark and Oakmark Select Funds March 31, 2021
Portfolio Manager Commentary

William C. Nygren, CFA
Portfolio Manager
oakmx@oakmark.com
oaklx@oakmark.com
oakwx@oakmark.com
At Oakmark, we are long-term investors. We attempt to identify growing businesses that are managed to benefit their shareholders. We will purchase stock in those businesses only when priced substantially below our estimate of intrinsic value. After purchase, we patiently wait for the gap between stock price and intrinsic value to close.
"We laughed and said they are trying to put a computer on a phone, that it won't work. We are now 3-4 years too late."
Anonymous BlackBerry employee letter quoted in Think Again by Adam Grant
What a difference a year makes
When writing this commentary a year ago, the United States was close to completing its lockdown for "15 days to flatten the curve." I wrote about the 34% decline in the S&P 500 Index,1 the abrupt transition to work from home, the benefits of rebalancing portfolios and our focus on owning companies that could prosper in the unlikely event the shutdown lingered. The commentary (https://oakmark.com/news-insights/bill-nygren-market-commentary-1q20/) closed with this paragraph:
"We are hopeful that three months from now, when you read our second-quarter commentary, the Cubs will be playing baseball, we will be eating inside of restaurants and we will all be rescheduling the trips we've had to cancel. If that has happened, we believe the economy will likely recover quickly as will the stock market. But if it takes longer to return to normal, know that we have weighted our portfolios toward companies that we believe can survive a longer downturn and that we fully expect can emerge stronger on the other side."
In hindsight, that sounds so naïve! A full year later, Dr. Fauci is still leading the daily news, restaurant capacity is still limited, vacations are still being deferred and the Cubs have yet to play in front of live fans (though they will be allowed 25% of capacity for opening day). But the lingering effect of Covid-19 didn't stop the stock market. On March 23, 2021, the S&P 500 recorded its largest one-year price increase in the past 85 years, 75%. And just a few days earlier, on March 18, the Oakmark Fund recorded its largest ever one-year increase of 113%. Last year was just another example of how difficult the market timing game can be and why Oakmark doesn't play it. Instead of trying to time the market, we encourage you to consider portfolio rebalancing. If you invested near the low last March to restore your equity allocation, congratulations, but now you may want to make sure it hasn't grown too large.
Following a painful four years for value investors, we've finally had two consecutive quarters where value has outperformed growth, the first time in more than four years. In my September commentary (https://oakmark.com/news-insights/bill-nygren-market-commentary-3q20/), I wrote about the stock market having seemingly bifurcated into two markets: one including many tech and other rapid growth stocks that had become very expensive relative to historic norms and one with more traditional businesses that had not. The two-quarter outperformance of value has done very little to change that. Low P/E2 stocks remain priced at historically large discounts to
high-growth stocks. Though we certainly don't expect the market or our Funds to reproduce the returns of the past year, we remain excited about the prospects for our portfolios. We expect the market's two-tiered valuation gap to continue to narrow, and we believe our Funds are positioned to benefit.
Think Again
We attribute our outperformance over the past year to two primary factors: how quickly we rethought our financial models at the onset of the pandemic and our much longer forecast horizon. While most investors worried about how bad 2020 might be, we focused on how good things could be in 2025. As is often the case during a crisis, we had more confidence in our accuracy forecasting 2025 than 2020. Certainly, the economic downturn made us think again about many of the assumptions that underlie our business value estimates, but for most companies, we found that the loss in intrinsic value was much less than the stock price decline.
In his book Think Again,3 author Adam Grant points out, "Intelligence is traditionally viewed as the ability to think and learn. Yet in a turbulent world, there's another set of cognitive skills that might matter more: the ability to rethink and unlearn." The quote at the top of the page, a classic example of not rethinking assumptions, came from an employee at BlackBerry. In 2009, BlackBerry accounted for nearly half the smartphone market, but in five short years, its market share fell to 1% because it refused to rethink the importance of its physical keyboard. It's nearly impossible to maintain success in either business or investing without frequently rethinking one's assumptions.
Grant, quoting work by his colleague Phil Tetlock, says we often get so caught up preaching, prosecuting or politicking that we don't take time to rethink our own views. Investment professionals spend a lot of time preaching about the merits of their favorite investments, prosecuting those who disagree and politicking to broaden support for their beliefs. In contrast, Grant says if you think like a scientist, you simply search for the truth. He says, if you are truly a scientist, you are "expected to doubt what you know, be curious about what you don't know, and update your views based on new data." Scientists' work is also subject to replication and extensive peer review, which results in rejecting incorrect theories. Grant's book was not aimed specifically at investors, but it sure could have been. His description of thinking like a scientist is exactly what Oakmark asks of its research analysts. Further, we also submit each analyst's research to extensive internal peer review to reduce our error rate. If investors can't shift to scientist mode and search for new information that might change their minds, they are doomed.
See accompanying Disclosures and Endnotes on page 96.
2 OAKMARK FUNDS
Oakmark and Oakmark Select Funds March 31, 2021
Portfolio Manager Commentary (continued)
Before you're tempted to dismiss this by saying investors tend to be smarter than average, Grant quotes studies showing that the higher someone's IQ, the more resistant they are to rethinking their beliefs. He explains, "In psychology there are at least two biases that drive this pattern. One is confirmation bias: seeing what we expect to see. The other is desirability bias: seeing what we want to see. These biases don't just prevent us from applying our intelligence. They can actually contort our intelligence into a weapon against the truth." That's one reason it can be so difficult for a smart investor to give up on a stock when its thesis comes into question.
Grant extensively discusses how intelligent people can fall prey to the psychological irony referred to as the Dunning-Kruger effect—the inverse relationship between our competence in a subject and our confidence in our opinion. It's why in a group of football fans, the most vocal critic is often the one who knows the least about the sport. It may also explain our unwillingness to ask for directions when we are lost. Our brain is telling us to rely on ourselves at the very time it is most important to challenge our assumptions and seek new input. As investors, we can't ever think we know so much that we don't need to bother with new information.
We've written previously about the delicate balancing act facing investors between seemingly contradictory traits. You have to be patient, but you can't be stubborn. Risk averse, but not fearful. Confident, but not arrogant. It's no wonder that investing is such a challenge. Grant believes that the state for optimum decision-making is "confident humility—having faith in our capability while appreciating that we may not have the right solution or even be addressing the right problem. That gives us enough doubt to reexamine our old knowledge and enough confidence to pursue new insights." The best investors are
always seeking new information, especially information that could prove them wrong.
In scientist mode, getting to the right answer is more important than being right. If you were to observe Oakmark's weekly meetings where new stock ideas are presented, you might ask how colleagues at a firm that so highly values collaboration and collegiality can have such aggressive arguments with one another. But, as Grant asserts, "The absence of conflict is not harmony, it's apathy." Clearly, our investment team is not apathetic about stocks we are considering buying! The more mistakes we can identify before we invest, the better off our clients will be. Grant goes on to say that "when I argue with someone it's not a display of disrespect—it's a sign of respect. It means I value their views enough to contest them. If their opinion didn't matter to me, I wouldn't bother." The intensity of our debates definitely shows that Oakmark's investment team has a lot of mutual respect for each other. And that's why after our knockdown, drag-out arguments, we can all enjoy lunch together.
In closing, I'll largely repeat what I said a year ago. We hope that by the time we are writing our next quarterly report, most of us will have had the opportunity to be vaccinated and will be well on our way to enjoying the freedoms we took for granted before 2020. By next quarter, capacity limits at restaurants and Wrigley Field should be much higher, families will again take summer vacations, employees will return to the office and someone other than Dr. Fauci will lead the evening news. If those things happen, we expect a very strong economy. Importantly, as we continue to rethink our assumptions, the window for the return to normal is narrowing. Last year, as the disease progressed, the debate became which year would finally be normal again. Now, it's which quarter. That's progress.
See accompanying Disclosures and Endnotes on page 96.
Oakmark.com 3
Oakmark Fund March 31, 2021
Summary Information
VALUE OF A $10,000 INVESTMENT
Since Inception - 08/05/91 (Unaudited)

PERFORMANCE
| | | | Average Annual Total Returns (as of 03/31/21) | | | |
| (Unaudited) | | Total Return
Last 3 Months | | 1-year | | 3-year | | 5-year | | 10-year | | Since
Inception | | Inception
Date | |
Oakmark Fund (Investor Class) | | | 15.52 | % | | | 87.43 | % | | | 13.40 | % | | | 15.83 | % | | | 13.57 | % | | | 12.93 | % | | 08/05/91 | |
S&P 500 Index | | | 6.18 | % | | | 56.35 | % | | | 16.78 | % | | | 16.29 | % | | | 13.91 | % | | | 10.41 | % | | | |
Dow Jones Industrial Average4 | | | 8.29 | % | | | 53.78 | % | | | 13.61 | % | | | 15.99 | % | | | 13.09 | % | | | 11.04 | % | | | |
Lipper Large Cap Value Fund Index5 | | | 11.05 | % | | | 58.83 | % | | | 11.98 | % | | | 12.93 | % | | | 10.95 | % | | | 9.19 | % | | | |
Oakmark Fund (Advisor Class) | | | 15.59 | % | | | 87.69 | % | | | 13.53 | % | | | N/A | | | | N/A | | | | 14.36 | % | | 11/30/16 | |
Oakmark Fund (Institutional Class) | | | 15.61 | % | | | 87.81 | % | | | 13.61 | % | | | N/A | | | | N/A | | | | 14.42 | % | | 11/30/16 | |
Oakmark Fund (Service Class) | | | 15.47 | % | | | 86.97 | % | | | 13.10 | % | | | 15.52 | % | | | 13.23 | % | | | 9.17 | % | | 04/05/01 | |
Oakmark Fund (R6 Class) | | | 15.61 | % | | | N/A | | | | N/A | | | | N/A | | | | N/A | | | | 17.78 | % | | 12/15/20 | |
The graph and table above do not reflect the deduction of taxes that a shareholder would pay on Fund distributions or the redemption of Fund shares.
Past performance is no guarantee of future results. The performance data quoted represents past performance. Current performance may be lower or higher than the performance data quoted. Total return includes change in share prices and, in each case, includes reinvestment of dividends and capital gain distributions. The investment return and principal value vary so that an investor's shares, when redeemed, may be worth more or less than the original cost. To obtain the most recent month-end performance, please visit Oakmark.com.
TOP TEN EQUITY HOLDINGS6 | | % of Net Assets | |
Ally Financial, Inc. | | | 4.0 | | |
Alphabet, Inc., Class A | | | 3.6 | | |
Bank of America Corp. | | | 3.6 | | |
Capital One Financial Corp. | | | 3.5 | | |
Citigroup, Inc. | | | 3.3 | | |
Facebook, Inc., Class A | | | 3.1 | | |
EOG Resources, Inc. | | | 2.9 | | |
The Charles Schwab Corp. | | | 2.8 | | |
Comcast Corp., Class A | | | 2.7 | | |
General Motors Co. | | | 2.6 | | |
FUND STATISTICS | |
Ticker* | | OAKMX | |
Number of Equity Holdings | | 51 | |
Net Assets | | $15.2 billion | |
Weighted Average Market Cap | | $165.6 billion | |
Median Market Cap | | $60.4 billion | |
Gross Expense Ratio - Investor Class (as of 12/15/20)* | | 0.93% | |
Net Expense Ratio - Investor Class (as of 12/15/20)*† | | 0.91% | |
* This information is related to the Investor Class. Please visit Oakmark.com for information related to the Advisor, Institutional and R6 Classes.
† The net expense ratio reflects a contractual advisory fee waiver agreement through January 27, 2022, as per the Prospectus dated 12/15/2020.
SECTOR ALLOCATION | | % of Net Assets | |
Financials | | | 34.0 | | |
Communication Services | | | 14.3 | | |
Information Technology | | | 11.9 | | |
Consumer Discretionary | | | 11.8 | | |
Health Care | | | 7.3 | | |
Energy | | | 6.5 | | |
Industrials | | | 6.5 | | |
Consumer Staples | | | 4.6 | | |
Real Estate | | | 1.1 | | |
Short-Term Investments and Other | | | 2.0 | | |
See accompanying Disclosures and Endnotes on page 96.
4 OAKMARK FUNDS
Oakmark Fund March 31, 2021
Portfolio Manager Commentary


William C. Nygren, CFA
Portfolio Manager
oakmx@oakmark.com
Kevin Grant, CFA
Portfolio Manager
oakmx@oakmark.com
Michael A. Nicolas, CFA
Portfolio Manager
oakmx@oakmark.com
The Oakmark Fund produced a 15.5% return during the first quarter, which compares to the S&P 500 Index's1 return of 6.2% for the same period. The economic recovery that began late last year carried into the first quarter, benefitting many of our cyclical holdings. In a reversal from what transpired during the first quarter of 2020, both interest rates and oil prices increased meaningfully during the recent quarter, helping many of our financial and energy holdings. Indeed, our worst performing sectors during 2020 are among our best performers year to date (financials, energy) and our holdings in these sectors still trade at healthy discounts to our intrinsic value estimates.
Our highest contributors during the first quarter were EOG Resources and Ally Financial and our largest detractors were Netflix and Charter Communications. No individual position cost the Fund more than 20 basis points of performance. Each sector contributed to the Fund's performance during the period and the strongest returns were generated by our energy, real estate and financial holdings. As often happens during a cyclical recovery, our holdings that withstood the initial downturn the best, such as those within the communication services and technology sectors, were some of our weakest performers during the most recent quarter.
We initiated a new position in Altria, which commands roughly 50% of the cigarette and smokeless tobacco market in the U.S. Both of these markets are duopolies that we believe have exhibited strong pricing power over time. While the shares trade at a low multiple of reported earnings, Altria also owns valuable stakes in other non-core businesses, including ~10% of AB InBev, 35% of Juul and 45% of Cronos. Excluding the values of these stakes and their respective earnings contribution, we were able to purchase shares of Altria for less than seven times our estimate of next year's earnings. This compares to other consumer brands with less favorable earnings growth profiles that trade for three times Altria's multiple. The company also has several promising reduced-risk products that may appeal to tobacco users, including On! and iQOS. We believe these products position the company well to help consumers slowly transition to a tobacco-free future. We expect management to return the vast majority of future earnings to shareholders given the company's strong balance sheet, high free cash flow conversion and limited capital requirements.
We elected to retain a position in ConocoPhillips following its all-stock acquisition of portfolio holding Concho Resources after determining that the combined entity was nearly as undervalued as stand-alone Concho. We believe Conoco is one of the highest quality independent oil producers in the world today. The company has decades of low-cost drilling inventory in attractive oil basins, minimal leverage and industry-leading returns on invested capital. Conoco management has built this enviable competitive position through years of shrewd capital allocation and efficient operations. This includes a history of
accretive divestitures and opportunistic acquisitions, the latest example being Concho. For Conoco, the Concho deal adds some of the highest quality acreage in the Permian Basin at an attractive all-in cost, with an opportunity to create incremental value by eliminating duplicative costs and monetizing excess acreage. We believe this value-focused approach to both acquisitions and divestitures is rare in oil and gas and we are pleased to invest alongside these stewards of capital. The shares are priced at a double-digit free cash flow yield and a discount to peers on most earnings metrics, so we took advantage of the opportunity to own the business at an attractive price.
Aptiv and Parker Hannifin approached our estimates of intrinsic value and were, therefore, eliminated during the period. Both companies were longstanding investments of the Fund and produced successful outcomes. We continue to believe that Aptiv is a well-positioned auto supplier that is likely to continue outgrowing light vehicle production for the foreseeable future, but this dynamic is now more fully appreciated by the market. We believe Parker Hannifin, one of our longest tenured positions, is a high-quality, well-managed industrial with strong competitive positions in good end markets. However, after the market price reflected these positives, we elected to sell to pursue more attractive alternatives that were priced at steeper discounts to our estimates of intrinsic value.
We thank you, our fellow shareholders, for your investment and continued support of the Oakmark Fund.
See accompanying Disclosures and Endnotes on page 96.
Oakmark.com 5
Oakmark Fund March 31, 2021 (Unaudited)
Schedule of Investments (in thousands)
| | | Shares | | Value | |
COMMON STOCKS - 98.0% | |
FINANCIALS - 34.0% | |
DIVERSIFIED FINANCIALS - 21.3% | |
Ally Financial, Inc. | | | 13,423 | | | $ | 606,858 | | |
Capital One Financial Corp. | | | 4,164 | | | | 529,786 | | |
The Charles Schwab Corp. | | | 6,600 | | | | 430,188 | | |
The Goldman Sachs Group, Inc. | | | 1,105 | | | | 361,335 | | |
State Street Corp. | | | 3,951 | | | | 331,907 | | |
American Express Co. | | | 2,004 | | | | 283,488 | | |
The Bank of New York Mellon Corp. | | | 4,786 | | | | 226,308 | | |
S&P Global, Inc. | | | 473 | | | | 166,759 | | |
KKR & Co., Inc. | | | 3,300 | | | | 161,205 | | |
Moody's Corp. | | | 502 | | | | 149,864 | | |
| | | | | | 3,247,698 | | |
BANKS - 8.7% | |
Bank of America Corp. | | | 13,976 | | | | 540,712 | | |
Citigroup, Inc. | | | 6,904 | | | | 502,274 | | |
Wells Fargo & Co. | | | 7,000 | | | | 273,490 | | |
| | | | | | 1,316,476 | | |
INSURANCE - 4.0% | |
American International Group, Inc. | | | 7,233 | | | | 334,228 | | |
Reinsurance Group of America, Inc. | | | 2,134 | | | | 268,969 | | |
| | | | | | 603,197 | | |
| | | | | | 5,167,371 | | |
COMMUNICATION SERVICES - 14.3% | |
MEDIA & ENTERTAINMENT - 13.5% | |
Alphabet, Inc., Class A (a) | | | 269 | | | | 555,055 | | |
Facebook, Inc., Class A (a) | | | 1,611 | | | | 474,606 | | |
Comcast Corp., Class A | | | 7,709 | | | | 417,140 | | |
Netflix, Inc. (a) | | | 588 | | | | 306,788 | | |
Charter Communications, Inc., Class A (a) | | | 487 | | | | 300,180 | | |
| | | | | | 2,053,769 | | |
TELECOMMUNICATION SERVICES - 0.8% | |
T-Mobile US, Inc. (a) | | | 1,000 | | | | 125,290 | | |
| | | | | | 2,179,059 | | |
INFORMATION TECHNOLOGY - 11.9% | |
SOFTWARE & SERVICES - 10.2% | |
Gartner, Inc. (a) | | | 1,668 | | | | 304,552 | | |
DXC Technology Co. | | | 9,139 | | | | 285,688 | | |
Fiserv, Inc. (a) | | | 2,000 | | | | 238,080 | | |
Automatic Data Processing, Inc. | | | 1,149 | | | | 216,533 | | |
Workday, Inc., Class A (a) | | | 857 | | | | 212,855 | | |
Visa, Inc., Class A | | | 881 | | | | 186,471 | | |
Mastercard, Inc., Class A | | | 300 | | | | 106,744 | | |
| | | | | | 1,550,923 | | |
TECHNOLOGY HARDWARE & EQUIPMENT - 1.7% | |
TE Connectivity, Ltd. | | | 2,051 | | | | 264,772 | | |
| | | | | | 1,815,695 | | |
| | | Shares | | Value | |
CONSUMER DISCRETIONARY - 11.8% | |
CONSUMER SERVICES - 6.7% | |
Booking Holdings, Inc. (a) | | | 162 | | | $ | 376,502 | | |
MGM Resorts International (b) | | | 8,682 | | | | 329,833 | | |
Hilton Worldwide Holdings, Inc. | | | 2,572 | | | | 311,018 | | |
| | | | | | 1,017,353 | | |
AUTOMOBILES & COMPONENTS - 2.6% | |
General Motors Co. | | | 6,846 | | | | 393,371 | | |
RETAILING - 2.5% | |
eBay, Inc. | | | 4,376 | | | | 267,968 | | |
Qurate Retail, Inc., Class A | | | 9,976 | | | | 117,313 | | |
| | | | | | 385,281 | | |
| | | | | | 1,796,005 | | |
HEALTH CARE - 7.3% | |
HEALTH CARE EQUIPMENT & SERVICES - 5.7% | |
HCA Healthcare, Inc. | | | 1,683 | | | | 316,975 | | |
Humana, Inc. | | | 748 | | | | 313,599 | | |
CVS Health Corp. | | | 3,078 | | | | 231,571 | | |
| | | | | | 862,145 | | |
PHARMACEUTICALS, BIOTECHNOLOGY & LIFE SCIENCES - 1.6% | |
Regeneron Pharmaceuticals, Inc. (a) | | | 524 | | | | 247,876 | | |
| | | | | | 1,110,021 | | |
ENERGY - 6.5% | |
EOG Resources, Inc. | | | 6,099 | | | | 442,329 | | |
APA Corp. | | | 13,744 | | | | 246,014 | | |
Diamondback Energy, Inc. | | | 2,600 | | | | 191,074 | | |
ConocoPhillips | | | 2,156 | | | | 114,187 | | |
| | | | | | 993,604 | | |
INDUSTRIALS - 6.5% | |
CAPITAL GOODS - 6.5% | |
Caterpillar, Inc. (b) | | | 1,420 | | | | 329,209 | | |
General Electric Co. | | | 24,000 | | | | 315,120 | | |
Cummins, Inc. | | | 777 | | | | 201,328 | | |
General Dynamics Corp. | | | 800 | | | | 145,248 | | |
| | | | | | 990,905 | | |
CONSUMER STAPLES - 4.6% | |
FOOD, BEVERAGE & TOBACCO - 4.6% | |
Constellation Brands, Inc., Class A | | | 1,485 | | | | 338,557 | | |
Keurig Dr Pepper, Inc. | | | 5,978 | | | | 205,461 | | |
Altria Group, Inc. | | | 3,000 | | | | 153,480 | | |
| | | | | | 697,498 | | |
REAL ESTATE - 1.1% | |
CBRE Group, Inc., Class A (a) | | | 2,000 | | | | 158,220 | | |
TOTAL COMMON STOCKS - 98.0%
(COST $7,404,934) | | | | | 14,908,378 | | |
See accompanying Notes to Financial Statements.
6 OAKMARK FUNDS
Oakmark Fund March 31, 2021 (Unaudited)
Schedule of Investments (in thousands) (continued)
| | | Par Value | | Value | |
SHORT-TERM INVESTMENT - 2.2% | |
REPURCHASE AGREEMENT - 2.2% | |
Fixed Income Clearing Corp. Repurchase
Agreement, 0.00% dated 03/31/21 due
04/01/21, repurchase price $338,138,
collateralized by United States
Treasury Note, 0.125% due 03/31/23,
value plus accrued interest of $344,901
(Cost: $338,138) | | $ | 338,138 | | | $ | 338,138 | | |
TOTAL SHORT-TERM INVESTMENTS - 2.2%
(COST $338,138) | | | | | 338,138 | | |
TOTAL INVESTMENTS - 100.2%
(COST $7,743,072) | | | | | 15,246,516 | | |
Foreign Currencies (Cost $0) - 0.0% (c) | | | | | 0 | (d) | |
Liabilities In Excess of Other Assets - (0.2)% | | | | | (27,872 | ) | |
TOTAL NET ASSETS - 100.0% | | | | $ | 15,218,644 | | |
(a) Non-income producing security
(b) All or a portion of this investment is held in connection with one or more options within the Fund.
(c) Amount rounds to less than 0.1%.
(d) Amount rounds to less than $1,000.
See accompanying Notes to Financial Statements.
Oakmark.com 7
Oakmark Fund March 31, 2021 (Unaudited)
Schedule of Investments (in thousands) (continued)
WRITTEN OPTIONS
Description | | Exercise
Price | | Expiration
Date | | Number of
Contracts | | Notional
Amount | | Market
Value | | Premiums
(Received)
by Fund | | Unrealized
Gain/(Loss) | |
CALLS | |
Caterpillar, Inc. | | $ | 220.00 | | | 5/21/21 | | | (10,000 | ) | | $ | (231,870 | ) | | $ | (17,700 | ) | | $ | (15,957 | ) | | $ | (1,743 | ) | |
Caterpillar, Inc. | | $ | 210.00 | | | 5/21/21 | | | (4,000 | ) | | $ | (92,748 | ) | | $ | (10,020 | ) | | $ | (6,124 | ) | | $ | (3,896 | ) | |
MGM Resorts International | | $ | 38.00 | | | 6/18/21 | | | (22,143 | ) | | $ | (84,121 | ) | | $ | (7,529 | ) | | $ | (9,833 | ) | | $ | 2,304 | | |
MGM Resorts International | | $ | 39.00 | | | 6/18/21 | | | (10,684 | ) | | $ | (40,589 | ) | | $ | (3,093 | ) | | $ | (4,731 | ) | | $ | 1,638 | | |
MGM Resorts International | | $ | 37.00 | | | 6/18/21 | | | (7,173 | ) | | $ | (27,250 | ) | | $ | (2,654 | ) | | $ | (3,040 | ) | | $ | 386 | | |
| | | | | | | | | $ | (476,578 | ) | | $ | (40,996 | ) | | $ | (39,685 | ) | | $ | (1,311 | ) | |
See accompanying Notes to Financial Statements.
8 OAKMARK FUNDS

This page intentionally left blank.
Oakmark.com 9
Oakmark Select Fund March 31, 2021
Summary Information
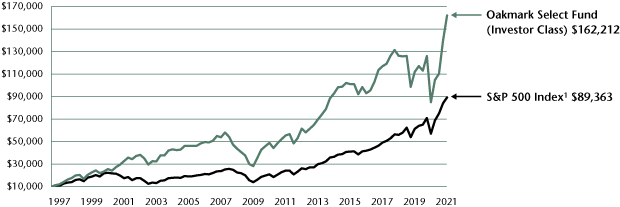
VALUE OF A $10,000 INVESTMENT
Since Inception - 11/01/96 (Unaudited)
PERFORMANCE
| | | | Average Annual Total Returns (as of 03/31/21) | | | |
| (Unaudited) | | Total Return
Last 3 Months | | 1-year | | 3-year | | 5-year | | 10-year | | Since
Inception | | Inception
Date | |
Oakmark Select Fund (Investor Class) | | | 16.08 | % | | | 90.57 | % | | | 8.67 | % | | | 11.75 | % | | | 11.30 | % | | | 12.09 | % | | 11/01/96 | |
S&P 500 Index | | | 6.18 | % | | | 56.35 | % | | | 16.78 | % | | | 16.29 | % | | | 13.91 | % | | | 9.39 | % | | | |
Lipper Multi-Cap Value Fund Index7 | | | 13.05 | % | | | 66.68 | % | | | 9.58 | % | | | 10.90 | % | | | 9.68 | % | | | 7.89 | % | | | |
Oakmark Select Fund (Advisor Class) | | | 16.09 | % | | | 90.77 | % | | | 8.81 | % | | | N/A | | | | N/A | | | | 9.36 | % | | 11/30/16 | |
Oakmark Select Fund (Institutional Class) | | | 16.15 | % | | | 90.99 | % | | | 8.87 | % | | | N/A | | | | N/A | | | | 9.42 | % | | 11/30/16 | |
Oakmark Select Fund (Service Class) | | | 16.00 | % | | | 90.15 | % | | | 8.43 | % | | | 11.46 | % | | | 10.99 | % | | | 9.20 | % | | 12/31/99 | |
Oakmark Select Fund (R6 Class) | | | 16.15 | % | | | — | | | | — | | | | N/A | | | | N/A | | | | 17.10 | % | | 12/15/20 | |
The graph and table do not reflect the deduction of taxes that a shareholder would pay on Fund distributions or the redemption of Fund shares.
Past performance is no guarantee of future results. The performance data quoted represents past performance. Current performance may be lower or higher than the performance data quoted. Total return includes change in share prices and, in each case, includes reinvestment of dividends and capital gain distributions. The investment return and principal value vary so that an investor's shares, when redeemed, may be worth more or less than the original cost. To obtain the most recent month-end performance, please visit Oakmark.com.
TOP TEN EQUITY HOLDINGS6 | | % of Net Assets | |
Alphabet, Inc., Class A | | | 10.1 | | |
CBRE Group, Inc., Class A | | | 9.5 | | |
Ally Financial, Inc. | | | 6.1 | | |
Citigroup, Inc. | | | 5.9 | | |
Bank of America Corp. | | | 5.4 | | |
Charter Communications, Inc., Class A | | | 5.0 | | |
Capital One Financial Corp. | | | 5.0 | | |
Facebook, Inc., Class A | | | 4.8 | | |
American International Group, Inc. | | | 4.5 | | |
General Electric Co. | | | 4.4 | | |
FUND STATISTICS | |
Ticker* | | OAKLX | |
Number of Equity Holdings | | 24 | |
Net Assets | | $4.8 billion | |
Weighted Average Market Cap | | $256.0 billion | |
Median Market Cap | | $47.7 billion | |
Gross Expense Ratio - Investor Class (as of 12/15/20)* | | 1.03% | |
Net Expense Ratio - Investor Class (as of 12/15/20)*† | | 1.01% | |
* This information is related to the Investor Class. Please visit Oakmark.com for information related to the Advisor, Institutional and R6 Classes.
† The net expense ratio reflects a contractual advisory fee waiver agreement through January 27, 2022, as per the Prospectus dated 12/15/2020.
SECTOR ALLOCATION | | % of Net Assets | |
Financials | | | 29.4 | | |
Communication Services | | | 23.8 | | |
Consumer Discretionary | | | 14.9 | | |
Real Estate | | | 9.5 | | |
Health Care | | | 6.0 | | |
Energy | | | 5.4 | | |
Industrials | | | 4.4 | | |
Consumer Staples | | | 4.3 | | |
Short-Term Investments and Other | | | 2.3 | | |
See accompanying Disclosures and Endnotes on page 96.
10 OAKMARK FUNDS
Oakmark Select Fund March 31, 2021
Portfolio Manager Commentary


William C. Nygren, CFA
Portfolio Manager
oaklx@oakmark.com
Anthony P. Coniaris, CFA
Portfolio Manager
oaklx@oakmark.com
Win Murray
Portfolio Manager
oaklx@oakmark.com
The Oakmark Select Fund was up 16.1% for the quarter, ahead of the S&P 500 Index's1 6.2% return. For the trailing 12-month period, the Fund increased by 90.6%, compared to the S&P's 56.4% return. The preponderance of that one-year outperformance came from November onwards, after data was announced indicating that effective vaccines would launch in the upcoming months.
Clients regularly ask us, "How do you incorporate macroeconomic factors and forecasts into your investment process?" Our answer is always, "We don't. We just assume things will be normal five years from now." By "normal," we mean that everything should pretty much look like it always does, with extremes moving toward their long-term levels. In other words, if current interest rates are negative or the current oil price is $20 or current unemployment is 12% or if there's some currency exchange rate that means a Big Mac in Europe would cost $40 American dollars, we don't extrapolate those conditions into perpetuity. We assume that five years from now, natural market forces will have worked in such a way as to produce a rational economic backdrop.
Most of the time, this keeps us in line with most other investors' expectations. This means that we don't have a unique or ideological macroeconomic belief that shapes our portfolios. In normal environments (i.e., most of the time), our returns are driven by what we do best: identifying individual businesses that sell at a substantial discount to our estimate of their intrinsic value or what we consider to be their private market values.
However, on rare occasions, the idea that things will be normal in five years looks like a heroically outlier opinion. The last time this occurred, pre-pandemic, was in 2008 during the depths of the global financial crisis. The market was in a state of panic, presuming that the world economy was almost irreparably broken. Our belief that markets would return to normal wasn't widely shared and, thus, our portfolios were loaded with cyclical recovery investments that looked far too cheap relative to our assessment of their intrinsic values. In retrospect, our portfolio positioning proved correct.
Similarly, even in the first few months of the pandemic, we had faith that human ingenuity and market forces would develop solutions that would enable something that resembled normal life (and normal economic activity) to recur. As such, the assumptions underpinning our company valuations presumed future cash flows that were likely higher than the market was forecasting at the time and, thus, our bottom-up portfolios were full of "return to normal" stocks that were priced, in our minds, far too cheaply. We didn't know when "normal" would occur, so we sold out of some cyclical companies with high debt loads (unsure as to whether they could survive an extended downturn), replacing them with similarly valued companies that had better balance sheets. In retrospect, the recovery happened even
more rapidly than we had thought, and these trades, while prudent, weren't necessary.
The most significant contributors to performance during the quarter were CBRE Group (+26%) and Alphabet (+18%). The most significant detractors were Charter Communications (-7%) and Netflix (-4%). We continue to hold all of these investments, as they are still selling at a sizable discount to our estimates of their intrinsic values.
We bought two new positions in the Fund this quarter: Humana and First Citizens BancShares. The rationale behind our Humana purchase is well articulated in the Oakmark Equity and Income letter (https://oakmark.com/news-insights/oakmark-equity-and-income-fund-first-quarter-2021/) this quarter. First Citizens BancShares is a well-run, undervalued community bank that we believe is creating significant shareholder value through a nicely timed merger with CIT Group. Note that we consider our purchases of the A & B share classes of First Citizens and of CIT Group to be investments in the same entity.
We eliminated our longstanding position in TE Connectivity during the quarter. The company is still selling at a discount to our estimate of its intrinsic value, but that discount has narrowed as TE's stock price has increased sharply in recent quarters. As such, we don't believe the stock is attractive enough to merit holding in a concentrated portfolio.
Thank you, our fellow shareholders, for your continued investment in our Fund.
See accompanying Disclosures and Endnotes on page 96.
Oakmark.com 11
Oakmark Select Fund March 31, 2021 (Unaudited)
Schedule of Investments (in thousands)
| | | Shares | | Value | |
COMMON STOCKS - 97.7% | |
FINANCIALS - 29.4% | |
BANKS - 13.8% | |
Citigroup, Inc. | | | 3,862 | | | $ | 280,960 | | |
Bank of America Corp. | | | 6,603 | | | | 255,486 | | |
CIT Group, Inc. | | | 1,357 | | | | 69,874 | | |
First Citizens BancShares, Inc., Class A | | | 56 | | | | 46,745 | | |
First Citizens BancShares, Inc., Class B | | | 7 | | | | 5,345 | | |
| | | | | | 658,410 | | |
DIVERSIFIED FINANCIALS - 11.1% | |
Ally Financial, Inc. (a) | | | 6,440 | | | | 291,139 | | |
Capital One Financial Corp. | | | 1,875 | | | | 238,544 | | |
| | | | | | 529,683 | | |
INSURANCE - 4.5% | |
American International Group, Inc. | | | 4,619 | | | | 213,458 | | |
| | | | | | 1,401,551 | | |
COMMUNICATION SERVICES - 23.8% | |
MEDIA & ENTERTAINMENT - 23.8% | |
Alphabet, Inc., Class A (b) | | | 234 | | | | 483,065 | | |
Charter Communications, Inc., Class A (b) | | | 389 | | | | 239,959 | | |
Facebook, Inc., Class A (b) | | | 783 | | | | 230,617 | | |
Netflix, Inc. (b) | | | 350 | | | | 182,372 | | |
| | | | | | 1,136,013 | | |
CONSUMER DISCRETIONARY - 14.9% | |
CONSUMER SERVICES - 10.5% | |
Booking Holdings, Inc. (b) | | | 82 | | | | 191,047 | | |
MGM Resorts International (a) | | | 4,688 | | | | 178,078 | | |
Hilton Worldwide Holdings, Inc. | | | 1,116 | | | | 135,004 | | |
| | | | | | 504,129 | | |
AUTOMOBILES & COMPONENTS - 4.4% | |
Lear Corp. | | | 1,150 | | | | 208,438 | | |
| | | | | | 712,567 | | |
REAL ESTATE - 9.5% | |
CBRE Group, Inc., Class A (a) (b) | | | 5,755 | | | | 455,243 | | |
HEALTH CARE - 6.0% | |
HEALTH CARE EQUIPMENT & SERVICES - 5.8% | |
HCA Healthcare, Inc. | | | 764 | | | | 143,957 | | |
Humana, Inc. | | | 317 | | | | 132,902 | | |
| | | | | | 276,859 | | |
PHARMACEUTICALS, BIOTECHNOLOGY & LIFE SCIENCES - 0.2% | |
Regeneron Pharmaceuticals, Inc. (b) | | | 20 | | | | 9,463 | | |
| | | | | | 286,322 | | |
ENERGY - 5.4% | |
EOG Resources, Inc. | | | 2,054 | | | | 148,950 | | |
APA Corp. | | | 6,000 | | | | 107,400 | | |
| | | | | | 256,350 | | |
| | | Shares | | Value | |
INDUSTRIALS - 4.4% | |
CAPITAL GOODS - 4.4% | |
General Electric Co. | | | 16,000 | | | $ | 210,080 | | |
CONSUMER STAPLES - 4.3% | |
FOOD, BEVERAGE & TOBACCO - 4.3% | |
Constellation Brands, Inc., Class A | | | 910 | | | | 207,389 | | |
TOTAL COMMON STOCKS - 97.7%
(COST $2,265,730) | | | | | 4,665,515 | | |
| | | Par Value | | Value | |
SHORT-TERM INVESTMENTS - 2.8% | |
REPURCHASE AGREEMENT - 2.8% | |
Fixed Income Clearing Corp. Repurchase
Agreement, 0.00% dated 03/31/21 due
04/01/21, repurchase price $133,733,
collateralized by United States
Treasury Note, 0.125% due 03/31/23,
value plus accrued interest of $136,408
(Cost: $133,733) | | $ | 133,733 | | | | 133,733 | | |
TOTAL SHORT-TERM INVESTMENTS - 2.8%
(COST $133,733) | | | | | 133,733 | | |
TOTAL INVESTMENTS - 100.5%
(COST $2,399,463) | | | | | 4,799,248 | | |
Liabilities In Excess of Other Assets - (0.5)% | | | | | (25,226 | ) | |
TOTAL NET ASSETS - 100.0% | | | | $ | 4,774,022 | | |
(a) All or a portion of this investment is held in connection with one or more options within the Fund.
(b) Non-income producing security
See accompanying Notes to Financial Statements.
12 OAKMARK FUNDS
Oakmark Select Fund March 31, 2021 (Unaudited)
Schedule of Investments (in thousands) (continued)
WRITTEN OPTIONS
Description | | Exercise
Price | | Expiration
Date | | Number of
Contracts | | Notional
Amount | | Market
Value | | Premiums
(Received)
by Fund | | Unrealized
Gain/(Loss) | |
CALLS | |
Ally Financial, Inc. | | $ | 40.00 | | | 6/18/21 | | | (2,000 | ) | | $ | (9,042 | ) | | $ | (1,280 | ) | | $ | (958 | ) | | $ | (322 | ) | |
CBRE Group, Inc., Class A | | $ | 70.00 | | | 6/18/21 | | | (15,000 | ) | | $ | (118,665 | ) | | $ | (16,050 | ) | | $ | (11,879 | ) | | $ | (4,171 | ) | |
CBRE Group, Inc., Class A | | $ | 75.00 | | | 6/18/21 | | | (5,000 | ) | | $ | (39,555 | ) | | $ | (3,450 | ) | | $ | (3,702 | ) | | $ | 252 | | |
MGM Resorts International | | $ | 38.00 | | | 5/21/21 | | | (8,201 | ) | | $ | (31,156 | ) | | $ | (2,284 | ) | | $ | (3,664 | ) | | $ | 1,380 | | |
MGM Resorts International | | $ | 39.00 | | | 5/21/21 | | | (11,799 | ) | | $ | (44,824 | ) | | $ | (2,779 | ) | | $ | (5,199 | ) | | $ | 2,420 | | |
| | | | | | | | | $ | (243,242 | ) | | $ | (25,843 | ) | | $ | (25,402 | ) | | $ | (441 | ) | |
See accompanying Notes to Financial Statements.
Oakmark.com 13
Oakmark Global Fund March 31, 2021
Summary Information
VALUE OF A $10,000 INVESTMENT
Since Inception - 08/04/99 (Unaudited)

PERFORMANCE
| | | | Average Annual Total Returns (as of 03/31/21) | | | |
| (Unaudited) | | Total Return
Last 3 Months | | 1-year | | 3-year | | 5-year | | 10-year | | Since
Inception | | Inception
Date | |
Oakmark Global Fund (Investor Class) | | | 11.05 | % | | | 85.83 | % | | | 9.27 | % | | | 12.76 | % | | | 8.83 | % | | | 10.31 | % | | 08/04/99 | |
MSCI World Index | | | 4.92 | % | | | 54.03 | % | | | 12.81 | % | | | 13.36 | % | | | 9.88 | % | | | 5.85 | % | | | |
Lipper Global Fund Index9 | | | 3.72 | % | | | 58.61 | % | | | 11.42 | % | | | 12.80 | % | | | 8.79 | % | | | 6.31 | % | | | |
Oakmark Global Fund (Advisor Class) | | | 11.08 | % | | | 86.17 | % | | | 9.41 | % | | | N/A | | | | N/A | | | | 12.64 | % | | 11/30/16 | |
Oakmark Global Fund (Institutional Class) | | | 11.11 | % | | | 86.21 | % | | | 9.47 | % | | | N/A | | | | N/A | | | | 12.71 | % | | 11/30/16 | |
Oakmark Global Fund (Service Class) | | | 10.98 | % | | | 85.38 | % | | | 8.98 | % | | | 12.46 | % | | | 8.49 | % | | | 10.37 | % | | 10/10/01 | |
Oakmark Global Fund (R6 Class) | | | 11.08 | % | | | — | | | | — | | | | N/A | | | | N/A | | | | 13.10 | % | | 12/15/20 | |
The graph and table do not reflect the deduction of taxes that a shareholder would pay on Fund distributions or the redemption of Fund shares.
Past performance is no guarantee of future results. The performance data quoted represents past performance. Current performance may be lower or higher than the performance data quoted. Total return includes change in share prices and, in each case, includes reinvestment of dividends and capital gain distributions. The investment return and principal value vary so that an investor's shares, when redeemed, may be worth more or less than the original cost. To obtain the most recent month-end performance, please visit Oakmark.com.
TOP TEN EQUITY HOLDINGS6 | | % of Net Assets | |
Alphabet Inc., Class C | | | 5.7 | | |
Lloyds Banking Group PLC | | | 5.3 | | |
General Motors Co. | | | 4.9 | | |
TE Connectivity, Ltd. | | | 4.3 | | |
Bayer AG | | | 4.3 | | |
Daimler AG | | | 4.1 | | |
Bank of America Corp. | | | 3.9 | | |
Credit Suisse Group AG | | | 3.7 | | |
Allianz SE | | | 3.5 | | |
Naspers, Ltd., N Shares | | | 3.0 | | |
FUND STATISTICS | |
Ticker* | | OAKGX | |
Number of Equity Holdings | | 48 | |
Net Assets | | $1.6 billion | |
Weighted Average Market Cap | | $162.2 billion | |
Median Market Cap | | $45.7 billion | |
Gross Expense Ratio - Investor Class (as of 12/15/20)* | | 1.14% | |
Net Expense Ratio - Investor Class (as of 12/15/20)*† | | 1.12% | |
* This information is related to the Investor Class. Please visit Oakmark.com for information related to the Advisor, Institutional and R6 Classes.
† The net expense ratio reflects a contractual advisory fee waiver agreement through January 27, 2022, as per the Prospectus dated 12/15/2020.
SECTOR ALLOCATION | | % of Net Assets | |
Financials | | | 22.5 | | |
Consumer Discretionary | | | 19.6 | | |
Communication Services | | | 13.4 | | |
Industrials | | | 12.3 | | |
Information Technology | | | 12.0 | | |
Health Care | | | 11.4 | | |
Materials | | | 2.8 | | |
Consumer Staples | | | 2.3 | | |
Energy | | | 1.2 | | |
Short-Term Investments and Other | | | 2.5 | | |
GEOGRAPHIC ALLOCATION | |
| | % of Equity | |
North America | | | 47.1 | | |
United States | | | 47.1 | | |
Europe | | | 42.9 | | |
Germany* | | | 16.2 | | |
United Kingdom | | | 14.7 | | |
Switzerland | | | 8.6 | | |
Ireland* | | | 1.3 | | |
Belgium* | | | 1.2 | | |
France* | | | 0.9 | | |
| | | % of Equity | |
Asia | | | 3.8 | | |
China | | | 1.6 | | |
Japan | | | 1.1 | | |
India | | | 1.1 | | |
Africa | | | 3.1 | | |
South Africa | | | 3.1 | | |
Australasia | | | 2.4 | | |
Australia | | | 2.4 | | |
Latin America | | | 0.7 | | |
Mexico | | | 0.7 | | |
* Euro currency countries comprise 19.6% of equity investments.
See accompanying Disclosures and Endnotes on page 96.
14 OAKMARK FUNDS
Oakmark Global Fund March 31, 2021
Portfolio Manager Commentary


David G. Herro, CFA
Portfolio Manager
oakgx@oakmark.com
Clyde S. McGregor, CFA
Portfolio Manager
oakgx@oakmark.com
Anthony P. Coniaris, CFA
Portfolio Manager
oakgx@oakmark.com
Jason E. Long, CFA
Portfolio Manager
oakgx@oakmark.com
Quarter Review
It was an eventful quarter. Israel experienced another inconclusive election, Turkey's Recep Tayyip Erdogan fired another central bank head and caused a local currency crisis, Italy installed former European Central Bank leader Mario Draghi as prime minister, and the Suez Canal was blocked for six days due to a grounded container ship, which threw logistics out of balance around the world. And this is just a small sample of global events. In the financial sphere, failures of both a family office hedge fund and a little-known supply chain finance entity caused significant losses for funding institutions. These events are all symptomatic of the global attempt to regain equilibrium from a massive pandemic, but they also reflect an environment of historically low interest rates, which have encouraged risk-taking and heavy use of leverage. Fortunately, Covid-19 vaccine development has been a source of hope. At this time last year, few believed that effective vaccines could be developed in less than three to five years, but the medical/pharmaceutical industry met the challenge and exceeded expectations. Although conditions are still far from normal, we are getting closer and one of our regular questions to corporate managers is how they expect the new "normal" will be different from the old "normal."
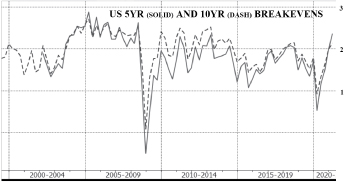
Securities markets have also gone through an interesting period. In March, Japan's Nikkei Index10 crossed the 30,000 mark for the first time since the early 1990s. Beginning in November, European and North American stocks rotated toward value investing, though U.S. market returns continued to dominate European markets. In part, the U.S. outperformance may derive from greater Covid-19 vaccination success. However, given that the S&P 500 Index1 has nearly tripled the return of the Euro Stoxx 5011 over the past decade, we anticipate some reversion to the mean. Compared to U.S. stocks, European companies sell for lower average price/earnings ratios2 yet have greater expectations for earning improvement this year. Last year in this report, we wrote that then-current opportunities available across the globe would provide the foundation for strong future returns and we think that the past 12 months have validated that opinion. As prices have started to recover from their pandemic lows, our search for value has led us to new areas of the market (as the five purchases discussed below demonstrate).
The Oakmark Global Fund gained 11.1% in the quarter, which compares to the MSCI World Index's8 4.9% return in the period and the Lipper Global Fund Index's 3.7% return. For the first six months of the Fund's fiscal year, the Fund returned 43.8%, the MSCI World Index returned 19.6% and the Lipper Global Fund Index9 returned 20.5%. Since its inception in 1999, the Fund has achieved a compound annual rate of return of 10.3%,
which compares to 5.9% for the MSCI World Index and 6.3% for the Lipper Global Fund Index.
General Motors (U.S.), Daimler (Germany), Alphabet (U.S.), Bank of America (U.S.) and Lloyds Banking Group (U.K.) were the largest contributors to the quarter's return. The U.S., U.K. and Germany contributed most to return, reversing their outcomes from the year-ago quarter. Credit Suisse (Switzerland), Continental (Germany), Liberty Broadband (U.S.), Mastercard (U.S.) and Arconic (U.S.) detracted from the Fund's return. The countries that detracted were Switzerland, Belgium and China.
For the first six months of the Fund's fiscal year, the U.S., U.K. and Germany contributed most to investment return, while China was the only detractor. General Motors led the contributor list, followed by Lloyds Banking Group, CNH Industrial (U.K.), Alphabet and Daimler. Only three stocks detracted: Alibaba Group (China), Novartis (Switzerland) and SAP (Germany—a new purchase, discussed below).
Portfolio Activity
The strong performance of the Fund's equity holdings spurred considerable portfolio action on our part. During the quarter, we introduced five names to the portfolio and eliminated two. But this understates the actual activity level. We also pruned back 21 holdings as their prices increased. In November, equity market conditions began to rotate in favor of value, and we have taken advantage of this positive turn to upgrade the quality of the portfolio. We believe that after such a strong rally in equities, the portfolio will benefit from higher quality and increased diversification.
We initiated two new international holdings in the quarter and three from the U.S. Beginning alphabetically, Capgemini is Europe's largest IT consulting firm—an attractive sector that is growing faster than the economy as companies continue to outsource this function in a relentless pursuit of greater efficiency. Over the past decade, the French-based firm has radically transformed its business model to focus more on its digital products, diversify its client base and make its delivery model more cost effective. Yet investors have not fairly appreciated these changes. Approximately 60% of the company's sales are now digital—one of the highest levels in the industry. This should enable Capgemini to enjoy a wave of corporate technology investment as Covid-19 prompts companies to accelerate their digital transformation roadmaps. In addition, the company has a strong business model, comparable to its U.S.- and Indian-based peers, and we believe it generates an excellent return on invested capital, converts a substantial amount of earnings into cash, trades at a significant discount to its peers and offers an
See accompanying Disclosures and Endnotes on page 96.
Oakmark.com 15
Oakmark Global Fund March 31, 2021
Portfolio Manager Commentary (continued)
attractive absolute valuation. Given the company's strong future growth outlook, promising merger-and-acquisition opportunities, and ongoing margin improvement, we believe Capgemini offers exciting potential to add shareholder value.
Second alphabetically is U.S.-based Fiserv. Following its transformative acquisition of First Data Corporation in 2019, Fiserv is now a top provider of digital banking solutions, core account processing software and merchant acquiring services in the U.S. The company's mission-critical software and services generate highly recurring revenue and are tied to strong secular growth trends within both digital payments and banking. We expect Fiserv's revenues to grow in the mid- to high-single-digits over the coming years and that the company will enjoy significant margin expansion as it realizes the cost synergies from the First Data acquisition. We estimate this will produce near-term earnings per share growth of over 20%. Furthermore, with its significant free cash flow generation and excess debt capacity, the company should be able to return about 35% of its market capitalization through dividends and share repurchases over the next five years, in our view. We believe Fiserv offers an attractive risk-adjusted return potential for a well-managed business that trades for a market multiple of our estimate of normal earnings.
The second new U.S. equity purchase was General Dynamics, a leading U.S. defense contractor and owner of the world's premier business jet franchise (Gulfstream). We were able to purchase this high-quality and durable business at a meaningful discount to our estimate of its intrinsic value after a series of near-term concerns hurt its share price. Taking a longer term view, the company's business jet franchise should benefit from a multi-year investment program in new, differentiated product. Also, its free cash flow conversion is set to improve materially and the company is poised to benefit from a highly visible ramp up in revenue related to next generation nuclear-powered submarines. As these positives come into clearer view, we expect sentiment to improve, along with the company's share price.
The third U.S. addition was Humana, a leader and near pure play in the fastest growing sector of managed care, Medicare Advantage. Each year, more seniors choose Medicare Advantage over traditional Medicare due to the compelling combination of lower costs and expanded benefits. Humana's scale advantages and focus on senior care allow the company to make targeted investments in its members' health, culminating in fewer unnecessary hospitalizations and lower chronic care costs. Much of these savings are then reinvested in the health plan, resulting in a continuously improving customer value proposition. The company's brand also resonates well in the marketplace and has helped drive double-digit annual membership growth over the past decade—well above the rest of the industry. Further, we believe Humana has a long runway ahead as it benefits from an aging population and continued conversion of the approximately 60% of seniors who are still enrolled in traditional Medicare. Yet Humana's shares are currently trading at a nearly 20% discount to the S&P 500 earnings multiple, which we believe doesn't give the company enough credit for its durable competitive advantages and strong secular growth outlook.
Finally, SAP is the largest European enterprise software company and the global leader in enterprise resource planning (ERP) software products. Its share price underperformed both
the broader market and its software peers over the past year as a result of a revised business strategy, unveiled in October 2020, which called for an accelerated transition to the cloud. This transition will depress near-term revenue and profits as upfront license sales become overtime subscription payments, but long term, this move will increase growth and improve customer economics. This short-term setback gave us an opportunity to invest in one of the most defensive software companies in the market. The company's recent IPO of a portion of Qualtrics highlights the disconnect between how the market values SAP's parts compared to its whole. We expect SAP to accelerate to high single-digit, top-line growth over the next five years as the economic benefits of its cloud transition become apparent.
We eliminated Samsung and Rolls-Royce. Samsung approached our estimate of intrinsic value, and we redeployed this capital into more attractive opportunities. We have owned the company on several occasions and we would welcome the opportunity to own this security again at the right price.
Rolls-Royce is one of the leading producers of wide-body aircraft engines, which are typically used in larger airplanes designed for long-haul and international travel. The Covid-19 pandemic has materially hurt the company's business. Although we expect travel will rebound strongly following vaccine distribution, we believe it will take longer for long-haul and international travel to revert back to pre-pandemic levels. As a result, our intrinsic value estimate fell quite materially during the pandemic, though we continued to hold our position since the share price remained below our estimate of intrinsic value. As the share price moved closer to our estimate of intrinsic value in the fourth quarter, we began reducing our position until we were fully exited during the past quarter. We allocated the capital from the divesture of Rolls-Royce into securities with strong risk-return profiles.
The net effect of this activity and the volatile market action was to increase the U.S. portfolio weight from 44% to 46%. As always, we do not set top-down targets for these weights. Instead, we populate the portfolio with the most attractive opportunities wherever they may be found.
Currency Hedges
We defensively hedge a portion of the Fund's exposure to currencies that we believe to be overvalued versus the U.S. dollar. As of quarter end, we found the Swiss franc to be overvalued and have hedged approximately 14% of the Fund's franc exposure.
Thank you for being our partners in the Oakmark Global Fund. Please feel free to contact us with your questions or comments.
See accompanying Disclosures and Endnotes on page 96.
16 OAKMARK FUNDS
Oakmark Global Fund March 31, 2021 (Unaudited)
Schedule of Investments (in thousands)
| | | Shares | | Value | |
COMMON STOCKS - 97.5% | |
FINANCIALS - 22.5% | |
BANKS - 11.2% | |
Lloyds Banking Group PLC
(United Kingdom) (a) | | | 140,448 | | | $ | 82,357 | | |
Bank of America Corp. (United States) | | | 1,590 | | | | 61,525 | | |
Axis Bank, Ltd. (India) (a) | | | 1,732 | | | | 16,521 | | |
Citigroup, Inc. (United States) | | | 194 | | | | 14,077 | | |
| | | | | | 174,480 | | |
DIVERSIFIED FINANCIALS - 6.4% | |
Credit Suisse Group AG (Switzerland) | | | 5,580 | | | | 58,459 | | |
Julius Baer Group, Ltd. (Switzerland) (a) | | | 654 | | | | 41,815 | | |
| | | | | | 100,274 | | |
INSURANCE - 4.9% | |
Allianz SE (Germany) | | | 215 | | | | 54,807 | | |
Prudential PLC (United Kingdom) | | | 1,051 | | | | 22,327 | | |
| | | | | | 77,134 | | |
| | | | | | 351,888 | | |
CONSUMER DISCRETIONARY - 19.6% | |
AUTOMOBILES & COMPONENTS - 12.7% | |
General Motors Co. (United States) | | | 1,323 | | | | 76,031 | | |
Daimler AG (Germany) | | | 716 | | | | 63,831 | | |
Continental AG (Germany) | | | 308 | | | | 40,693 | | |
Toyota Motor Corp. (Japan) | | | 228 | | | | 17,742 | | |
| | | | | | 198,297 | | |
RETAILING - 4.5% | |
Naspers, Ltd., N Shares (South Africa) | | | 196 | | | | 46,789 | | |
Alibaba Group Holding, Ltd. (China) (a) | | | 431 | | | | 12,191 | | |
Alibaba Group Holding, Ltd. ADR (China) (a) (b) | | | 52 | | | | 11,813 | | |
| | | | | | 70,793 | | |
CONSUMER SERVICES - 1.8% | |
Booking Holdings, Inc. (United States) (a) | | | 7 | | | | 16,938 | | |
Compass Group PLC (United Kingdom) (a) | | | 569 | | | | 11,460 | | |
| | | | | | 28,398 | | |
CONSUMER DURABLES & APPAREL - 0.6% | |
Cie Financiere Richemont SA, Class A (Switzerland) | | | 95 | | | | 9,092 | | |
| | | | | | 306,580 | | |
COMMUNICATION SERVICES - 13.4% | |
MEDIA & ENTERTAINMENT - 11.4% | |
Alphabet, Inc., Class C (United States) (a) | | | 43 | | | | 88,753 | | |
Liberty Broadband Corp., Class C
(United States) (a) | | | 248 | | | | 37,267 | | |
The Interpublic Group of Cos., Inc.
(United States) | | | 1,152 | | | | 33,652 | | |
Grupo Televisa SAB ADR (Mexico) (a) (b) | | | 1,281 | | | | 11,349 | | |
Charter Communications, Inc., Class A
(United States) (a) | | | 11 | | | | 6,972 | | |
| | | | | | 177,993 | | |
| | | Shares | | Value | |
TELECOMMUNICATION SERVICES - 2.0% | |
Liberty Global PLC, Class A (United Kingdom) (a) | | | 1,259 | | | $ | 32,316 | | |
| | | | | | 210,309 | | |
INDUSTRIALS - 12.3% | |
CAPITAL GOODS - 11.0% | |
CNH Industrial N.V. (United Kingdom) (a) | | | 2,922 | | | | 45,215 | | |
Howmet Aerospace, Inc. (United States) | | | 1,030 | | | | 33,097 | | |
Travis Perkins PLC (United Kingdom) (a) | | | 1,442 | | | | 30,634 | | |
Flowserve Corp. (United States) | | | 615 | | | | 23,849 | | |
Johnson Controls International PLC (United States) | | | 341 | | | | 20,354 | | |
General Dynamics Corp. (United States) | | | 100 | | | | 18,174 | | |
| | | | | | 171,323 | | |
TRANSPORTATION - 1.3% | |
Ryanair Holdings PLC ADR (Ireland) (a) (b) | | | 169 | | | | 19,405 | | |
Ryanair Holdings PLC (Ireland) (a) | | | 62 | | | | 1,209 | | |
| | | | | | 20,614 | | |
| | | | | | 191,937 | | |
INFORMATION TECHNOLOGY - 12.0% | |
SOFTWARE & SERVICES - 7.7% | |
Mastercard, Inc., Class A (United States) | | | 100 | | | | 35,534 | | |
Oracle Corp. (United States) | | | 483 | | | | 33,878 | | |
SAP SE (Germany) | | | 171 | | | | 20,964 | | |
Fiserv, Inc. (United States) (a) | | | 137 | | | | 16,249 | | |
Capgemini SE (France) | | | 85 | | | | 14,480 | | |
| | | | | | 121,105 | | |
TECHNOLOGY HARDWARE & EQUIPMENT - 4.3% | |
TE Connectivity, Ltd. (United States) | | | 519 | | | | 67,008 | | |
| | | | | | 188,113 | | |
HEALTH CARE - 11.4% | |
HEALTH CARE EQUIPMENT & SERVICES - 5.8% | |
Tenet Healthcare Corp. (United States) (a) | | | 768 | | | | 39,928 | | |
Humana, Inc. (United States) | | | 66 | | | | 27,629 | | |
Envista Holdings Corp. (United States) (a) | | | 559 | | | | 22,799 | | |
| | | | | | 90,356 | | |
PHARMACEUTICALS, BIOTECHNOLOGY & LIFE SCIENCES - 5.6% | |
Bayer AG (Germany) | | | 1,057 | | | | 66,910 | | |
Novartis AG (Switzerland) | | | 248 | | | | 21,176 | | |
| | | | | | 88,086 | | |
| | | | | | 178,442 | | |
MATERIALS - 2.8% | |
Incitec Pivot, Ltd. (Australia) (a) | | | 16,395 | | | | 36,238 | | |
Arconic Corp. (United States) (a) | | | 306 | | | | 7,770 | | |
| | | | | | 44,008 | | |
See accompanying Notes to Financial Statements.
Oakmark.com 17
Oakmark Global Fund March 31, 2021 (Unaudited)
Schedule of Investments (in thousands) (continued)
| | | Shares | | Value | |
COMMON STOCKS - 97.5% (continued) | |
CONSUMER STAPLES - 2.3% | |
FOOD, BEVERAGE & TOBACCO - 2.3% | |
Keurig Dr Pepper, Inc. (United States) | | | 526 | | | $ | 18,082 | | |
Anheuser-Busch InBev SA/NV (Belgium) | | | 287 | | | | 18,065 | | |
| | | | | | 36,147 | | |
ENERGY - 1.2% | |
Nov, Inc. (United States) | | | 1,357 | | | | 18,618 | | |
TOTAL COMMON STOCKS - 97.5%
(COST $977,219) | | | | | 1,526,042 | | |
WARRANT - 0.0% (C) | |
CONSUMER DISCRETIONARY - 0.0% (c) | |
Cie Financiere Richemont SA (Switzerland) (a) | | | 414 | | | | 157 | | |
TOTAL WARRANTS - 0.0%
(COST $ - ) | | | | | 157 | | |
| | | Par Value | | Value | |
SHORT-TERM INVESTMENT - 2.5% | |
REPURCHASE AGREEMENT - 2.5% | |
Fixed Income Clearing Corp. Repurchase
Agreement, 0.00% dated 03/31/21 due
04/01/21, repurchase price $39,580,
collateralized by United States
Treasury Note, 0.125% due 03/31/23,
value plus accrued interest of $40,371
(Cost: $39,580) | | $ | 39,580 | | | | 39,580 | | |
TOTAL SHORT-TERM INVESTMENTS - 2.5%
(COST $39,580) | | | | | 39,580 | | |
TOTAL INVESTMENTS - 100.0%
(COST $1,016,799) | | | | | 1,565,779 | | |
Foreign Currencies (Cost $0) - 0.0% (c) | | | | | 0 | (d) | |
Liabilities In Excess of Other Assets - 0.0% (c) | | | | | (272 | ) | |
TOTAL NET ASSETS - 100.0% | | | | $ | 1,565,507 | | |
(a) Non-income producing security
(b) Sponsored American Depositary Receipt
(c) Amount rounds to less than 0.1%.
(d) Amount rounds to less than $1,000.
See accompanying Notes to Financial Statements.
18 OAKMARK FUNDS
Oakmark Global Fund March 31, 2021 (Unaudited)
Schedule of Investments (in thousands) (continued)
FORWARD FOREIGN CURRENCY CONTRACT (in thousands)
| | | Local
Contract
Amount | | Base
Contract
Amount | | Settlement
Date | | Valuation at
3/31/21 | | Unrealized
Appreciation/
(Depreciation) | |
Foreign Currency Sold: | |
Swiss Franc | | | 17,228 | | | $ | 19,526 | | | 06/16/21 | | $ | 18,267 | | | $ | 1,259 | | |
| | | | | | | | | $ | 18,267 | | | $ | 1,259 | | |
See accompanying Notes to Financial Statements.
Oakmark.com 19
Oakmark Global Select Fund March 31, 2021
Summary Information
VALUE OF A $10,000 INVESTMENT
Since Inception - 10/02/06 (Unaudited)

PERFORMANCE
| | | | Average Annual Total Returns (as of 03/31/21) | | | |
| (Unaudited) | | Total Return
Last 3 Months | | 1-year | | 3-year | | 5-year | | 10-year | | Since
Inception | | Inception
Date | |
Oakmark Global Select Fund (Investor Class) | | | 10.87 | % | | | 80.73 | % | | | 9.86 | % | | | 12.17 | % | | | 10.23 | % | | | 8.86 | % | | 10/02/06 | |
MSCI World Index | | | 4.92 | % | | | 54.03 | % | | | 12.81 | % | | | 13.36 | % | | | 9.88 | % | | | 7.18 | % | | | |
Lipper Global Fund Index9 | | | 3.72 | % | | | 58.61 | % | | | 11.42 | % | | | 12.80 | % | | | 8.79 | % | | | 6.89 | % | | | |
Oakmark Global Select Fund (Advisor Class) | | | 10.93 | % | | | 80.92 | % | | | 10.00 | % | | | N/A | | | | N/A | | | | 11.49 | % | | 11/30/16 | |
Oakmark Global Select Fund (Institutional Class) | | | 10.93 | % | | | 81.11 | % | | | 10.06 | % | | | N/A | | | | N/A | | | | 11.56 | % | | 11/30/16 | |
Oakmark Global Select Fund (R6 Class) | | | 10.97 | % | | | — | | | | — | | | | N/A | | | | N/A | | | | 12.64 | % | | 12/15/20 | |
The graph and table do not reflect the deduction of taxes that a shareholder would pay on Fund distributions or the redemption of Fund shares.
Past performance is no guarantee of future results. The performance data quoted represents past performance. Current performance may be lower or higher than the performance data quoted. Total return includes change in share prices and, in each case, includes reinvestment of dividends and capital gain distributions. The investment return and principal value vary so that an investor's shares, when redeemed, may be worth more or less than the original cost. To obtain the most recent month-end performance, please visit Oakmark.com.
TOP TEN EQUITY HOLDINGS6 | | % of Net Assets | |
Alphabet, Inc., Class A | | | 10.3 | | |
Daimler AG | | | 7.1 | | |
Lloyds Banking Group PLC | | | 6.5 | | |
Bank of America Corp. | | | 6.5 | | |
Humana, Inc. | | | 5.3 | | |
Credit Suisse Group AG | | | 5.2 | | |
HCA Healthcare, Inc. | | | 5.0 | | |
CBRE Group, Inc., Class A | | | 5.0 | | |
Charter Communications, Inc., Class A | | | 5.0 | | |
Bayer AG | | | 4.9 | | |
FUND STATISTICS | |
Ticker* | | OAKWX | |
Number of Equity Holdings | | 23 | |
Net Assets | | $1.6 billion | |
Weighted Average Market Cap | | $242.2 billion | |
Median Market Cap | | $63.5 billion | |
Gross Expense Ratio - Investor Class (as of 12/15/20)* | | 1.11% | |
Net Expense Ratio - Investor Class (as of 12/15/20)*† | | 1.09% | |
* This information is related to the Investor Class. Please visit Oakmark.com for information related to the Advisor, Institutional and R6 Classes.
† The net expense ratio reflects a contractual advisory fee waiver agreement through January 27, 2022, as per the Prospectus dated 12/15/2020.
SECTOR ALLOCATION | | % of Net Assets | |
Financials | | | 26.7 | | |
Health Care | | | 22.1 | | |
Consumer Discretionary | | | 19.3 | | |
Communication Services | | | 17.4 | | |
Real Estate | | | 5.0 | | |
Industrials | | | 4.8 | | |
Information Technology | | | 2.0 | | |
Short-Term Investments and Other | | | 2.7 | | |
GEOGRAPHIC ALLOCATION | |
| | % of Equity | |
North America | | | 50.5 | | |
United States | | | 50.5 | | |
Europe | | | 45.4 | | |
Germany* | | | 18.7 | | |
United Kingdom | | | 13.7 | | |
Switzerland | | | 10.0 | | |
| | % of Equity | |
Europe (cont'd) | | | 45.4 | | |
Netherlands* | | | 3.0 | | |
Asia | | | 4.1 | | |
South Korea | | | 2.2 | | |
China | | | 1.9 | | |
* Euro currency countries comprise 21.7% of equity investments.
See accompanying Disclosures and Endnotes on page 96.
20 OAKMARK FUNDS
Oakmark Global Select Fund March 31, 2021
Portfolio Manager Commentary
William C. Nygren, CFA
Portfolio Manager
oakwx@oakmark.com
David G. Herro, CFA
Portfolio Manager
oakwx@oakmark.com
Anthony P. Coniaris, CFA
Portfolio Manager
oakwx@oakmark.com
Eric Liu, CFA
Portfolio Manager
oakwx@oakmark.com


The Oakmark Global Select Fund had a strong quarter in terms of both absolute and relative performance, returning 10.87% for the period ending March 31. The benchmark, MSCI World Index8, returned 4.92% for the same quarter. Since its inception in October 2006, the Fund has returned an average of 8.86% per year, outperforming the MSCI World Index's annualized gain of 7.18% over the same period.
Daimler AG was a top contributor for the first quarter as the German automotive manufacturer's share price soared on the announcement it would spin off a majority stake in Daimler Truck. In our view, this is momentous news that represents fundamental change by establishing two distinct companies—one, a pure-play premium car company, and the other, a global leader in trucks and buses. This transition should lead to increased accountability, allow for more agile decision-making and unlock value for shareholders. In addition to this announcement, Daimler released its full-year 2020 earnings report and the results were well above our and consensus expectations. Adjusted earnings improved dramatically in the fourth quarter and management was able to convert this into cash. As a result, the company outperformed expectations by generating more than EUR 8 billion of free cash flow. Management indicated that there would likely be "significant growth" in unit sales and that Mercedes-Benz would hit earnings margins of 8-10% in 2021. We anticipate that the global vehicle manufacturer will continue to do well throughout the year, thanks to successful cost discipline, ongoing improvement in underlying demand, and important product launches of both internal combustion engine and battery electric vehicles. We believe Daimler's management team is executing well and demonstrating strong commitment to shareholder value creation.
Credit Suisse was a top detractor for the first quarter, following a series of negative headlines in March. Early in the month, the Switzerland-based financial services firm lost ~$2 billion—$3 billion in market cap because a fund in its asset management division had exposure to the now-insolvent Greensill Capital. This market cap decline far surpassed Credit Suisse's direct exposure to Greensill and ignored the fact that a large portion of its clients' exposure was in cash, highly rated securities or insured investments. At the end of March, the company's share price dropped again when a New York-based hedge fund client, called Archegos, defaulted on its margin calls to Credit Suisse's prime brokerage business. As a result, Credit Suisse announced an expected charge of approximately CHF 4.4 billion and a first quarter 2021 pre-tax loss of approximately CHF 900 million. The company also provided updated profitability guidance that greatly exceeded analysts' estimates,
although this news was largely overshadowed by the Archegos headlines. We are pleased with Credit Suisse's profitability improvements, excluding the charge, and we will continue to monitor the situation closely. We expect the company to make material changes to its risk management leadership in the wake of these events and we believe incoming Chairman António Horta-Osório will bring fresh perspective to Credit Suisse, given his impressive tenure as CEO of Lloyds Banking Group.
During the quarter, we sold our holdings of TE Connectivity as the share price approached our estimate of intrinsic value. We initiated positions in Humana (U.S.) and SAP (Germany). Humana is a leader and near pure play in the fastest growing sector of managed care, Medicare Advantage. Humana's growth and scale advantages have allowed the company to make targeted investments in its members' health, resulting in fewer unnecessary hospitalizations and lower chronic care costs. The company reinvests most of these savings back into the health plan, resulting in a continuously improving customer value proposition. Further, we believe Humana has a long runway ahead as it benefits from an aging population and continued conversion of the more than 60% of seniors who are still enrolled in traditional Medicare. We were able to purchase shares at a near 20% discount to the S&P 5001 earnings multiple, which we believe doesn't give the company enough credit for its competitive advantages and secular growth outlook. SAP is a global enterprise resource planning software company, specializing in customizable software for some of the largest enterprises across the globe. SAP is in the midst of transitioning customers to cloud computing and subscription-based payment models, which we believe could generate robust, long-term earnings growth despite short-term earnings volatility.
We continue to believe the Swiss franc is overvalued versus the U.S. dollar. As a result, we defensively hedged a portion of the Fund's exposure. Approximately 15% of the Swiss franc exposure was hedged at quarter end.
Geographically, we ended the quarter with 51% of the portfolio in the U.S., 45% in the U.K. and Europe, and 4% in Asia.
We thank you for your continued support.
See accompanying Disclosures and Endnotes on page 96.
Oakmark.com 21
Oakmark Global Select Fund March 31, 2021 (Unaudited)
Schedule of Investments (in thousands)
| | | Shares | | Value | |
COMMON STOCKS - 97.3% | |
FINANCIALS - 26.7% | |
BANKS - 17.8% | |
Lloyds Banking Group PLC
(United Kingdom) (a) | | | 182,534 | | | $ | 107,035 | | |
Bank of America Corp. (United States) | | | 2,752 | | | | 106,490 | | |
Citigroup, Inc. (United States) | | | 1,070 | | | | 77,821 | | |
| | | | | | 291,346 | | |
DIVERSIFIED FINANCIALS - 5.2% | |
Credit Suisse Group AG (Switzerland) | | | 8,094 | | | | 84,794 | | |
INSURANCE - 3.7% | |
American International Group, Inc.
(United States) | | | 1,314 | | | | 60,711 | | |
| | | | | | 436,851 | | |
HEALTH CARE - 22.1% | |
HEALTH CARE EQUIPMENT & SERVICES - 14.6% | |
Humana, Inc. (United States) | | | 205 | | | | 85,946 | | |
HCA Healthcare, Inc. (United States) | | | 438 | | | | 82,531 | | |
Fresenius Medical Care AG & Co.
KGaA (Germany) | | | 942 | | | | 69,271 | | |
| | | | | | 237,748 | | |
PHARMACEUTICALS, BIOTECHNOLOGY & LIFE SCIENCES - 7.5% | |
Bayer AG (Germany) | | | 1,257 | | | | 79,516 | | |
Novartis AG (Switzerland) | | | 507 | | | | 43,327 | | |
| | | | | | 122,843 | | |
| | | | | | 360,591 | | |
CONSUMER DISCRETIONARY - 19.3% | |
AUTOMOBILES & COMPONENTS - 7.1% | |
Daimler AG (Germany) | | | 1,304 | | | | 116,234 | | |
CONSUMER SERVICES - 5.5% | |
Booking Holdings, Inc. (United States) (a) | | | 24 | | | | 56,988 | | |
Compass Group PLC (United Kingdom) (a) | | | 1,646 | | | | 33,168 | | |
| | | | | | 90,156 | | |
RETAILING - 4.8% | |
Prosus N.V. (Netherlands) | | | 429 | | | | 47,681 | | |
Alibaba Group Holding, Ltd. (China) (a) | | | 550 | | | | 15,562 | | |
Alibaba Group Holding, Ltd. ADR (China) (a) (b) | | | 67 | | | | 15,259 | | |
| | | | | | 78,502 | | |
CONSUMER DURABLES & APPAREL - 1.9% | |
Cie Financiere Richemont SA, Class A
(Switzerland) | | | 314 | | | | 30,187 | | |
| | | | | | 315,079 | | |
COMMUNICATION SERVICES - 17.4% | |
MEDIA & ENTERTAINMENT - 17.4% | |
Alphabet, Inc., Class A (United States) (a) | | | 82 | | | | 168,473 | | |
Charter Communications, Inc., Class A
(United States) (a) | | | 133 | | | | 82,064 | | |
NAVER Corp. (South Korea) | | | 103 | | | | 34,177 | | |
| | | | | | 284,714 | | |
| | | Shares | | Value | |
REAL ESTATE - 5.0% | |
CBRE Group, Inc., Class A
(United States) (a) | | | 1,039 | | | $ | 82,195 | | |
INDUSTRIALS - 4.8% | |
CAPITAL GOODS - 4.8% | |
CNH Industrial N.V. (United Kingdom) (a) | | | 5,062 | | | | 78,326 | | |
INFORMATION TECHNOLOGY - 2.0% | |
SOFTWARE & SERVICES - 2.0% | |
SAP SE (Germany) | | | 265 | | | | 32,438 | | |
TOTAL COMMON STOCKS - 97.3%
(COST $1,145,736) | | | | | 1,590,194 | | |
| | | Par Value | | Value | |
SHORT-TERM INVESTMENTS - 2.8% | |
REPURCHASE AGREEMENT - 2.8% | |
Fixed Income Clearing Corp. Repurchase
Agreement, 0.00% dated 03/31/21 due
04/01/21, repurchase price $44,996,
collateralized by United States
Treasury Note, 0.125% due 03/31/23,
value plus accrued interest of $45,896
(Cost: $44,996) | | $ | 44,996 | | | | 44,996 | | |
TOTAL SHORT-TERM INVESTMENTS - 2.8%
(COST $44,996) | | | | | 44,996 | | |
TOTAL INVESTMENTS - 100.1%
(COST $1,190,732) | | | | | 1,635,190 | | |
Foreign Currencies (Cost $0) - 0.0% (c) | | | | | 0 | (d) | |
Liabilities In Excess of Other Assets - (0.1)% | | | | | (902 | ) | |
TOTAL NET ASSETS - 100.0% | | | | $ | 1,634,288 | | |
(a) Non-income producing security
(b) Sponsored American Depositary Receipt
(c) Amount rounds to less than 0.1%.
(d) Amount rounds to less than $1,000.
See accompanying Notes to Financial Statements.
22 OAKMARK FUNDS
Oakmark Global Select Fund March 31, 2021 (Unaudited)
Schedule of Investments (in thousands) (continued)
FORWARD FOREIGN CURRENCY CONTRACT (in thousands)
| | | Local
Contract
Amount | | Base
Contract
Amount | | Settlement
Date | | Valuation at
3/31/21 | | Unrealized
Appreciation/
(Depreciation) | |
Foreign Currency Sold: | |
Swiss Franc | | | 22,516 | | | $ | 25,520 | | | 06/16/21 | | $ | 23,874 | | | $ | 1,646 | | |
| | | | | | | | | $ | 23,874 | | | $ | 1,646 | | |
See accompanying Notes to Financial Statements.
Oakmark.com 23
Oakmark International Fund March 31, 2021
Summary Information
VALUE OF A $10,000 INVESTMENT
Since Inception - 08/05/91 (Unaudited)
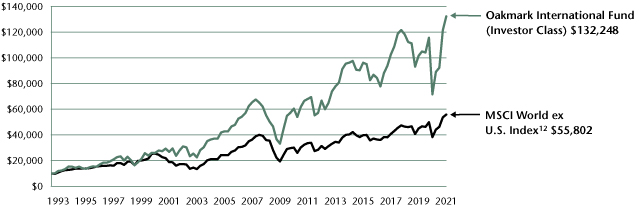
PERFORMANCE
| | | | Average Annual Total Returns (as of 03/31/21) | | | |
| (Unaudited) | | Total Return
Last 3 Months | | 1-year | | 3-year | | 5-year | | 10-year | | Since
Inception | | Inception
Date | |
Oakmark International Fund (Investor Class) | | | 9.01 | % | | | 84.81 | % | | | 3.81 | % | | | 9.43 | % | | | 6.88 | % | | | 9.48 | % | | 09/30/92 | |
MSCI World ex U.S. Index | | | 4.04 | % | | | 45.86 | % | | | 6.34 | % | | | 8.92 | % | | | 5.21 | % | | | 6.22 | % | | | |
MSCI EAFE Index13 | | | 3.48 | % | | | 44.57 | % | | | 6.02 | % | | | 8.85 | % | | | 5.52 | % | | | 6.08 | % | | | |
Lipper International Fund Index14 | | | 4.78 | % | | | 54.06 | % | | | 7.69 | % | | | 10.17 | % | | | 6.13 | % | | | 7.18 | % | | | |
Oakmark International Fund (Advisor Class) | | | 9.07 | % | | | 85.01 | % | | | 3.93 | % | | | N/A | | | | N/A | | | | 9.24 | % | | 11/30/16 | |
Oakmark International Fund (Institutional Class) | | | 9.09 | % | | | 85.27 | % | | | 4.02 | % | | | N/A | | | | N/A | | | | 9.33 | % | | 11/30/16 | |
Oakmark International Fund (Service Class) | | | 9.01 | % | | | 84.42 | % | | | 3.57 | % | | | 9.14 | % | | | 6.54 | % | | | 7.83 | % | | 11/04/99 | |
Oakmark International Fund (R6 Class) | | | 9.14 | % | | | — | | | | — | | | | N/A | | | | N/A | | | | 10.07 | % | | 12/15/20 | |
The graph and table above do not reflect the deduction of taxes that a shareholder would pay on Fund distributions or the redemption of Fund shares.
Past performance is no guarantee of future results. The performance data quoted represents past performance. Current performance may be lower or higher than the performance data quoted. Total return includes change in share prices and, in each case, includes reinvestment of dividends and capital gain distributions. The investment return and principal value vary so that an investor's shares, when redeemed, may be worth more or less than the original cost. To obtain the most recent month-end performance, please visit Oakmark.com.
TOP TEN EQUITY HOLDINGS6 | | % of Net Assets | |
Lloyds Banking Group PLC | | | 4.7 | | |
Intesa Sanpaolo SPA | | | 4.1 | | |
Daimler AG | | | 4.0 | | |
Bayerische Motoren Werke AG | | | 4.0 | | |
Glencore PLC | | | 4.0 | | |
Bayer AG | | | 3.9 | | |
BNP Paribas SA | | | 3.8 | | |
Allianz SE | | | 3.6 | | |
Credit Suisse Group AG | | | 3.2 | | |
CNH Industrial N.V. | | | 3.2 | | |
FUND STATISTICS | |
Ticker* | | OAKIX | |
Number of Equity Holdings | | 65 | |
Net Assets | | $27.5 billion | |
Weighted Average Market Cap | | $61.6 billion | |
Median Market Cap | | $29.2 billion | |
Gross Expense Ratio - Investor Class (as of 12/15/20)* | | 1.06% | |
Net Expense Ratio - Investor Class (as of 12/15/20)*† | | 1.04% | |
* This information is related to the Investor Class. Please visit Oakmark.com for information related to the Advisor, Institutional and R6 Classes.
† The net expense ratio reflects a contractual advisory fee waiver agreement through January 27, 2022, as per the Prospectus dated 12/15/2020.
SECTOR ALLOCATION | | % of Net Assets | |
Financials | | | 27.9 | | |
Consumer Discretionary | | | 24.1 | | |
Industrials | | | 10.8 | | |
Materials | | | 9.2 | | |
Health Care | | | 8.6 | | |
Communication Services | | | 6.8 | | |
Information Technology | | | 5.0 | | |
Consumer Staples | | | 2.3 | | |
Energy | | | 1.6 | | |
Short-Term Investments and Other | | | 3.7 | | |
GEOGRAPHIC ALLOCATION | |
| | | % of Equity | |
Europe | | | 84.1 | | |
Germany* | | | 25.3 | | |
United Kingdom | | | 19.9 | | |
Switzerland | | | 13.4 | | |
France* | | | 10.5 | | |
Italy* | | | 4.3 | | |
Sweden | | | 3.9 | | |
Netherlands* | | | 1.8 | | |
Spain* | | | 1.4 | | |
Ireland* | | | 1.4 | | |
Belgium* | | | 1.3 | | |
Finland* | | | 0.9 | | |
| | % of Equity | |
Asia | | | 6.3 | | |
Japan | | | 2.2 | | |
China | | | 1.4 | | |
India | | | 1.3 | | |
South Korea | | | 1.0 | | |
Indonesia | | | 0.4 | | |
North America | | | 3.7 | | |
Canada | | | 3.7 | | |
Australasia | | | 2.6 | | |
Australia | | | 2.6 | | |
Africa | | | 2.4 | | |
South Africa | | | 2.4 | | |
Latin America | | | 0.9 | | |
Mexico | | | 0.9 | | |
* Euro currency countries comprise 46.9% of equity investments.
See accompanying Disclosures and Endnotes on page 96.
24 OAKMARK FUNDS
Oakmark International Fund March 31, 2021
Portfolio Manager Commentary
David G. Herro, CFA
Portfolio Manager
oakix@oakmark.com
Michael L. Manelli, CFA
Portfolio Manager
oakix@oakmark.com


The Oakmark International Fund had a strong first quarter of absolute and relative performance, returning 9.0% versus its benchmark, the MSCI World ex U.S. Index12, which returned 4.0% for the same period. In addition, the Fund has returned an average of 9.5% per year since its inception in September 1992, outperforming the MSCI World ex U.S. Index, which has averaged 6.2% per year over the same period.
Glencore, one of the world's largest mining firms, was a top contributor for the first quarter. In January, the Swiss-headquartered company announced it would sell its considerable stake in Mopani Copper Mines to the Zambian government for $1.5 billion. We view Mopani as a geographically difficult asset and believe this is an excellent outcome for Glencore. This is part of the company's larger efforts to reduce exposure to the long tail of less financially significant assets. In addition, we were pleased with Glencore's full-year results, disclosed in February, as earnings in both the industrials segment and the marketing segment exceeded our expectations by 10% and 4%, respectively. The industrials segment benefited from a recovery in commodities prices from Covid-19 lows, strict cost-control measures and higher production. In addition, the company's group adjusted earnings for the full-year period ($11.56 billion vs. $10.69 billion) came in ahead of consensus estimates. Balance sheet leverage at the end of the year was within management's target range, and Glencore proposed a $0.12 per share dividend, which surpassed analysts' estimates of $0.0625 per share. Following the release, we spoke with current CEO Ivan Glasenberg and his newly appointed replacement Gary Nagle. In our view, Nagle's focus on improving asset returns should lead to improved financial results over time. As a result, we remain optimistic that further value can be unlocked under Glencore's new leadership.
Credit Suisse was a top detractor for the first quarter, following a series of negative headlines in March. Early in the month, the Switzerland-based financial services firm lost ~$2 billion—$3 billion in market cap because a fund in its asset management division had exposure to the now-insolvent Greensill Capital. This market cap decline far surpassed Credit Suisse's direct exposure to Greensill and ignored the fact that a large portion of its clients' exposure was in cash, highly rated securities or insured investments. At the end of March, the company's share price dropped again when a New York-based hedge fund client, called Archegos, defaulted on its margin calls to Credit Suisse's prime brokerage business. As a result, Credit Suisse announced an expected charge of approximately CHF 4.4 billion and a first quarter 2021 pre-tax loss of approximately CHF 900 million. The company also provided updated profitability guidance that greatly exceeded analysts' estimates, although this news was largely overshadowed by the Archegos headlines. We are pleased with Credit Suisse's profitability improvements, excluding the charge, and we will continue to
monitor the situation closely. We expect the company to make material changes to its risk management leadership in the wake of these events and we believe incoming Chairman António Horta-Osório will bring fresh perspective to Credit Suisse, given his impressive tenure as CEO of Lloyds Banking Group.
During the quarter, we sold our holding of G4S (U.K.), recently acquired by Allied Universal, in favor of other opportunities that we found more attractive. We also sold our Trip.com (China) position as its share price approached our estimate of intrinsic value. We initiated positions in SAP (Germany), a global enterprise resource planning software company that specializes in customizable software for some of the largest enterprises across the globe; Capgemini (France), a global IT services firm that provides technology, consulting, professional and outsourcing services; and Danone (France), a leader in the food processing industry that operates through divisions, such as fresh dairy products, waters, early life nutrition and medical nutrition.
We continue to believe the Swiss franc is overvalued versus the U.S. dollar. As a result, we defensively hedged a portion of the Fund's exposure. Approximately 13% of the Swiss franc exposure was hedged at quarter end.
Geographically, we ended the quarter with approximately 84% of our holdings in Europe and the U.K., 6% in Asia, and 3% in Australasia. The remaining positions are 2% in South Africa, 4% in North America (Canada) and 1% in Latin America (Mexico).
We thank you for your continued support.
See accompanying Disclosures and Endnotes on page 96.
Oakmark.com 25
Oakmark International Fund March 31, 2021 (Unaudited)
Schedule of Investments (in thousands)
| | | Shares | | Value | |
COMMON STOCKS - 96.1% | |
FINANCIALS - 27.9% | |
BANKS - 15.9% | |
Lloyds Banking Group PLC
(United Kingdom) (a) | | | 2,200,764 | | | $ | 1,290,500 | | |
Intesa Sanpaolo SPA (Italy) (a) | | | 419,573 | | | | 1,136,842 | | |
BNP Paribas SA (France) (a) | | | 16,980 | | | | 1,033,070 | | |
NatWest Group PLC (United Kingdom) (a) | | | 175,234 | | | | 474,096 | | |
Axis Bank, Ltd. (India) (a) | | | 36,370 | | | | 346,940 | | |
Bank Mandiri Persero Tbk PT (Indonesia) | | | 245,282 | | | | 103,854 | | |
| | | | | | 4,385,302 | | |
DIVERSIFIED FINANCIALS - 6.8% | |
Credit Suisse Group AG (Switzerland) | | | 83,630 | | | | 876,161 | | |
EXOR N.V. (Netherlands) | | | 5,748 | | | | 484,931 | | |
Schroders PLC (United Kingdom) | | | 7,330 | | | | 353,656 | | |
AMP, Ltd. (Australia) | | | 170,767 | | | | 164,078 | | |
Schroders PLC, Non-Voting
(United Kingdom) | | | 31 | | | | 1,076 | | |
| | | | | | 1,879,902 | | |
INSURANCE - 5.2% | |
Allianz SE (Germany) | | | 3,857 | | | | 981,637 | | |
Prudential PLC (United Kingdom) | | | 20,450 | | | | 434,292 | | |
| | | | | | 1,415,929 | | |
| | | | | | 7,681,133 | | |
CONSUMER DISCRETIONARY - 24.1% | |
AUTOMOBILES & COMPONENTS - 13.1% | |
Daimler AG (Germany) | | | 12,489 | | | | 1,113,227 | | |
Bayerische Motoren Werke AG (Germany) | | | 10,727 | | | | 1,112,921 | | |
Continental AG (Germany) | | | 5,417 | | | | 715,974 | | |
Toyota Motor Corp. (Japan) | | | 4,837 | | | | 376,399 | | |
Valeo SA (France) | | | 8,278 | | | | 281,217 | | |
| | | | | | 3,599,738 | | |
RETAILING - 5.1% | |
Naspers, Ltd., N Shares (South Africa) | | | 2,678 | | | | 640,718 | | |
H & M Hennes & Mauritz AB, Class B
(Sweden) (a) | | | 18,009 | | | | 405,721 | | |
Alibaba Group Holding, Ltd. ADR (China) (a) (b) | | | 818 | | | | 185,442 | | |
Alibaba Group Holding, Ltd. (China) (a) | | | 6,512 | | | | 184,286 | | |
| | | | | | 1,416,167 | | |
CONSUMER SERVICES - 3.7% | |
Accor SA (France) (a) (c) | | | 15,083 | | | | 568,841 | | |
Compass Group PLC (United Kingdom) (a) | | | 13,079 | | | | 263,521 | | |
Restaurant Brands International, Inc. (Canada) | | | 2,887 | | | | 187,627 | | |
| | | | | | 1,019,989 | | |
CONSUMER DURABLES & APPAREL - 2.2% | |
The Swatch Group AG, Bearer Shares
(Switzerland) | | | 801 | | | | 230,542 | | |
Cie Financiere Richemont SA, Class A
(Switzerland) | | | 2,395 | | | | 229,955 | | |
EssilorLuxottica SA (France) | | | 880 | | | | 143,334 | | |
| | | | | | 603,831 | | |
| | | | | | 6,639,725 | | |
| | | Shares | | Value | |
INDUSTRIALS - 10.8% | |
CAPITAL GOODS - 8.5% | |
CNH Industrial N.V. (United Kingdom) (a) (c) | | | 56,226 | | | $ | 870,024 | | |
Volvo AB, Class B (Sweden) (a) (d) | | | 12,998 | | | | 328,761 | | |
SKF AB, Class B (Sweden) | | | 10,572 | | | | 300,449 | | |
Komatsu, Ltd. (Japan) | | | 7,028 | | | | 217,022 | | |
Ashtead Group PLC
(United Kingdom) | | | 3,121 | | | | 186,190 | | |
Smiths Group PLC (United Kingdom) | | | 8,059 | | | | 170,818 | | |
Rolls-Royce Holdings PLC
(United Kingdom) (a) | | | 110,695 | | | | 160,693 | | |
Bunzl PLC (United Kingdom) | | | 3,198 | | | | 102,419 | | |
| | | | | | 2,336,376 | | |
TRANSPORTATION - 1.3% | |
Ryanair Holdings PLC ADR (Ireland) (a) (b) (c) | | | 3,059 | | | | 351,780 | | |
Ryanair Holdings PLC (Ireland) (a) (c) | | | 1,147 | | | | 22,262 | | |
| | | | | | 374,042 | | |
COMMERCIAL & PROFESSIONAL SERVICES - 1.0% | |
Brambles, Ltd. (Australia) | | | 27,851 | | | | 223,810 | | |
Bureau Veritas SA (France) (a) | | | 1,496 | | | | 42,588 | | |
| | | | | | 266,398 | | |
| | | | | | 2,976,816 | | |
MATERIALS - 9.2% | |
Glencore PLC (Switzerland) (a) | | | 277,494 | | | | 1,087,406 | | |
thyssenkrupp AG (Germany) (a) (c) | | | 41,450 | | | | 553,408 | | |
LafargeHolcim, Ltd. (Switzerland) | | | 6,131 | | | | 360,288 | | |
Orica, Ltd. (Australia) (c) | | | 27,194 | | | | 288,141 | | |
UPM-Kymmene OYJ (Finland) | | | 6,521 | | | | 234,222 | | |
| | | | | | 2,523,465 | | |
HEALTH CARE - 8.6% | |
PHARMACEUTICALS, BIOTECHNOLOGY & LIFE SCIENCES - 6.6% | |
Bayer AG (Germany) | | | 16,869 | | | | 1,067,482 | | |
Novartis AG (Switzerland) | | | 5,040 | | | | 430,688 | | |
Roche Holding AG (Switzerland) | | | 997 | | | | 322,078 | | |
| | | | | | 1,820,248 | | |
HEALTH CARE EQUIPMENT & SERVICES - 2.0% | |
Fresenius Medical Care AG & Co.
KGaA (Germany) | | | 7,566 | | | | 556,507 | | |
| | | | | | 2,376,755 | | |
COMMUNICATION SERVICES - 6.8% | |
MEDIA & ENTERTAINMENT - 4.8% | |
WPP PLC (United Kingdom) | | | 33,154 | | | | 420,766 | | |
Publicis Groupe SA (France) (c) | | | 6,761 | | | | 412,601 | | |
NAVER Corp. (South Korea) | | | 764 | | | | 254,414 | | |
Grupo Televisa SAB ADR (Mexico) (a) (b) | | | 26,974 | | | | 238,994 | | |
| | | | | | 1,326,775 | | |
See accompanying Notes to Financial Statements.
26 OAKMARK FUNDS
Oakmark International Fund March 31, 2021 (Unaudited)
Schedule of Investments (in thousands) (continued)
| | | Shares | | Value | |
COMMON STOCKS - 96.1% (continued) | |
TELECOMMUNICATION SERVICES - 2.0% | |
Liberty Global PLC, Class A
(United Kingdom) (a) | | | 18,654 | | | $ | 478,661 | | |
Liberty Global PLC, Class C
(United Kingdom) (a) | | | 3,145 | | | | 80,319 | | |
| | | | | | 558,980 | | |
| | | | | | 1,885,755 | | |
INFORMATION TECHNOLOGY - 5.0% | |
SOFTWARE & SERVICES - 5.0% | |
Amadeus IT Group SA (Spain) (a) | | | 5,316 | | | | 376,400 | | |
SAP SE (Germany) | | | 3,055 | | | | 374,058 | | |
Open Text Corp. (Canada) | | | 7,742 | | | | 369,123 | | |
Capgemini SE (France) | | | 1,460 | | | | 248,466 | | |
| | | | | | 1,368,047 | | |
TECHNOLOGY HARDWARE & EQUIPMENT - 0.0% (e) | |
Samsung Electronics Co., Ltd. (South Korea) | | | 152 | | | | 10,907 | | |
| | | | | | 1,378,954 | | |
CONSUMER STAPLES - 2.1% | |
FOOD, BEVERAGE & TOBACCO - 1.5% | |
Anheuser-Busch InBev SA/NV (Belgium) | | | 5,433 | | | | 342,431 | | |
Danone SA (France) | | | 797 | | | | 54,704 | | |
| | | | | | 397,135 | | |
HOUSEHOLD & PERSONAL PRODUCTS - 0.6% | |
Henkel AG & Co. KGaA (Germany) | | | 1,764 | | | | 174,687 | | |
| | | | | | 571,822 | | |
ENERGY - 1.6% | |
Cenovus Energy, Inc. (Canada) (c) | | | 57,382 | | | | 431,037 | | |
TOTAL COMMON STOCKS - 96.1%
(COST $22,747,111) | | | | | 26,465,462 | | |
PREFERRED STOCKS - 0.2% | |
CONSUMER STAPLES - 0.2% | |
HOUSEHOLD & PERSONAL PRODUCTS - 0.2% | |
Henkel AG & Co. KGaA (Germany) | | | 477 | | | | 53,644 | | |
TOTAL PREFERRED STOCKS - 0.2%
(COST $47,881) | | | | | 53,644 | | |
| | | Par Value | | Value | |
SHORT-TERM INVESTMENTS - 3.0% | |
REPURCHASE AGREEMENT - 1.6% | |
Fixed Income Clearing Corp. Repurchase
Agreement, 0.00% dated 03/31/21
due 04/01/21, repurchase price $428,880,
collateralized by United States
Treasury Note, 0.125% due 03/31/23,
value plus accrued interest of $437,457
(Cost: $428,880) | | $ | 428,880 | | | | 428,880 | | |
| | | Par Value | | Value | |
COMMERCIAL PAPER - 1.4% | |
American Honda Finance Corp.,
0.19% - 0.25%, due
04/19/21 - 05/10/21 (f) | | $ | 162,067 | | | $ | 162,047 | | |
Walgreens Boots, 144A,
0.20% - 0.25%, due
04/16/21 - 05/12/21 (f) (g) | | | 137,500 | | | | 137,481 | | |
Kellogg Co., 144A,
0.10% - 0.13%, due
04/01/21 - 04/16/21 (f) (g) | | | 91,000 | | | | 90,997 | | |
TOTAL COMMERCIAL PAPER - 1.4%
(COST $390,523) | | | | | 390,525 | | |
TOTAL SHORT-TERM INVESTMENTS - 3.0%
(COST $819,403) | | | | | 819,405 | | |
TOTAL INVESTMENTS - 99.3%
(COST $23,614,395) | | | | | 27,338,511 | | |
Foreign Currencies (Cost $7,251) - 0.0% (e) | | | | | 7,240 | | |
Other Assets In Excess of Liabilities - 0.7% | | | | | 179,029 | | |
TOTAL NET ASSETS - 100.0% | | | | $ | 27,524,780 | | |
(a) Non-income producing security
(b) Sponsored American Depositary Receipt
(c) See Note 5 in the Notes to Financial Statements regarding investments in affiliated issuers.
(d) A portion of the security out on loan.
(e) Amount rounds to less than 0.1%.
(f) The rate shown represents the annualized yield at the time of purchase; not a coupon rate.
(g) Security exempt from registration under Rule 144A of the Securities Act of 1933, as amended. These securities may be resold, normally only to qualified institutional buyers.
See accompanying Notes to Financial Statements.
Oakmark.com 27
Oakmark International Fund March 31, 2021 (Unaudited)
Schedule of Investments (in thousands) (continued)
FORWARD FOREIGN CURRENCY CONTRACT (in thousands)
| | | Local
Contract
Amount | | Base
Contract
Amount | | Settlement
Date | | Valuation at
3/31/21 | | Unrealized
Appreciation/
(Depreciation) | |
Foreign Currency Sold: | |
Swiss Franc | | | 291,027 | | | $ | 329,846 | | | 06/16/21 | | $ | 308,575 | | | $ | 21,271 | | |
| | | | | | | | | $ | 308,575 | | | $ | 21,271 | | |
SCHEDULE OF TRANSACTIONS WITH AFFILIATED ISSUERS
Purchase and sale transactions and dividend and interest income earned during the period on these securities are set forth below (in thousands). The industry, country, or geographic region for each of the below affiliates can be found in the Schedule of Investments.
Affiliates | | Shares
Held | | Purchases
(Cost) | | Sales
(Proceeds) | | Realized
Gain/(Loss) | | Change in
Unrealized | | Dividend
Income | | Value
September 30,
2020 | | Value
March 31,
2021 | | Percent of
Net Assets | |
Accor SA | | | 15,083 | | | $ | 19,439 | | | $ | 82,873 | | | $ | (24,539 | ) | | $ | 186,887 | | | $ | 0 | | | $ | 469,927 | | | $ | 568,841 | | | | 2.1 | % | |
CNH Industrial
N.V. (a) | | | 56,226 | | | | 0 | | | | 497,272 | | | | 28,214 | | | | 578,572 | | | | 0 | | | | 760,509 | | | | 870,024 | | | | 3.2 | % | |
Cenovus Energy,
Inc. (a) | | | 57,382 | | | | 81,013 | | | | 178,148 | | | | (53,802 | ) | | | 323,612 | | | | 813 | | | | 258,362 | | | | 431,037 | | | | 1.6 | % | |
G4S PLC (a) | | | 0 | | | | 0 | | | | 392,316 | | | | 33,033 | | | | 58,587 | | | | 0 | | | | 300,695 | | | | 0 | | | | 0.0 | % | |
Orica, Ltd. | | | 27,194 | | | | 23,829 | | | | 933 | | | | 203 | | | | (10,088 | ) | | | 3,015 | | | | 275,131 | | | | 288,141 | | | | 1.0 | % | |
Publicis Groupe
SA (a) | | | 6,761 | | | | 0 | | | | 344,512 | | | | (120,012 | ) | | | 423,215 | | | | 0 | | | | 453,911 | | | | 412,601 | | | | 1.5 | % | |
Ryanair Holdings
PLC ADR (a) | | | 3,059 | | | | 32,797 | | | | 222,507 | | | | 17,098 | | | | 119,537 | | | | 0 | | | | 404,855 | | | | 351,780 | | | | 1.3 | % | |
Ryanair Holdings
PLC (a) | | | 1,147 | | | | 0 | | | | 0 | | | | 0 | | | | 6,912 | | | | 0 | | | | 15,350 | | | | 22,262 | | | | 0.1 | % | |
thyssenkrupp AG | | | 41,450 | | | | 761 | | | | 27,505 | | | | (32,688 | ) | | | 391,418 | | | | 0 | | | | 221,422 | | | | 553,408 | | | | 2.0 | % | |
TOTAL | | | 208,302 | | | $ | 157,839 | | | $ | 1,746,066 | | | $ | (152,493 | ) | | $ | 2,078,652 | | | $ | 3,828 | | | $ | 3,160,162 | | | $ | 3,498,094 | | | | 12.8 | % | |
(a) Due to transactions during the year ended March 31, 2021, the company is no longer an affiliate.
See accompanying Notes to Financial Statements.
28 OAKMARK FUNDS

This page intentionally left blank.
Oakmark.com 29
Oakmark International Small Cap Fund March 31, 2021
Summary Information
VALUE OF A $10,000 INVESTMENT
Since 03/31/11 (Unaudited)

PERFORMANCE
| | | | Average Annual Total Returns (as of 03/31/21) | | | |
| (Unaudited) | | Total Return
Last 3 Months | | 1-year | | 3-year | | 5-year | | 10-year | | Since
Inception | | Inception
Date | |
Oakmark International Small Cap Fund (Investor Class) | | | 11.54 | % | | | 89.83 | % | | | 6.84 | % | | | 9.82 | % | | | 6.15 | % | | | 9.29 | % | | 11/01/95 | |
MSCI World ex U.S. Small Cap Index | | | 4.88 | % | | | 65.17 | % | | | 6.89 | % | | | 10.55 | % | | | 7.14 | % | | | N/A | | | | |
MSCI World ex U.S. Index12 | | | 4.04 | % | | | 45.86 | % | | | 6.34 | % | | | 8.92 | % | | | 5.21 | % | | | 5.55 | % | | | |
Lipper International Small Cap Fund Index16 | | | 3.76 | % | | | 70.44 | % | | | 7.47 | % | | | 10.85 | % | | | 7.94 | % | | | N/A | | | | |
Oakmark International Small Cap Fund (Advisor Class) | | | 11.53 | % | | | 90.15 | % | | | 6.95 | % | | | N/A | | | | N/A | | | | 10.46 | % | | 11/30/16 | |
Oakmark International Small Cap Fund (Institutional Class) | | | 11.57 | % | | | 90.35 | % | | | 7.05 | % | | | N/A | | | | N/A | | | | 10.56 | % | | 11/30/16 | |
Oakmark International Small Cap Fund (Service Class) | | | 11.41 | % | | | 89.16 | % | | | 6.54 | % | | | 9.49 | % | | | 5.84 | % | | | 9.31 | % | | 01/08/01 | |
Oakmark International Small Cap Fund (R6 Class) | | | 11.57 | % | | | — | | | | — | | | | N/A | | | | N/A | | | | 12.91 | % | | 12/15/20 | |
The graph and table do not reflect the deduction of taxes that a shareholder would pay on Fund distributions or the redemption of Fund shares.
Past performance is no guarantee of future results. The performance data quoted represents past performance. Current performance may be lower or higher than the performance data quoted. Total return includes change in share prices and, in each case, includes reinvestment of dividends and capital gain distributions. The investment return and principal value vary so that an investor's shares, when redeemed, may be worth more or less than the original cost. The performance of the Fund does not reflect the 2% redemption fee imposed on shares redeemed within 90 days of purchase. To obtain the most recent month-end performance, please visit Oakmark.com.
TOP TEN EQUITY HOLDINGS6 | | % of Net Assets | |
Konecranes OYJ | | | 4.0 | | |
Julius Baer Group, Ltd. | | | 3.6 | | |
Duerr AG | | | 3.3 | | |
Atea ASA | | | 3.2 | | |
Software AG | | | 3.1 | | |
Azimut Holding SpA | | | 3.1 | | |
Travis Perkins PLC | | | 3.1 | | |
BNK Financial Group, Inc. | | | 3.0 | | |
ISS A/S | | | 3.0 | | |
Kimberly-Clark de Mexico SAB de CV, Class A | | | 2.7 | | |
FUND STATISTICS | |
Ticker* | | OAKEX | |
Number of Equity Holdings | | 55 | |
Net Assets | | $1.5 billion | |
Weighted Average Market Cap | | $4.5 billion | |
Median Market Cap | | $3.5 billion | |
Gross Expense Ratio - Investor Class (as of 12/15/20)* | | 1.39% | |
Net Expense Ratio - Investor Class (as of 12/15/20)*† | | 1.37% | |
* This information is related to the Investor Class. Please visit Oakmark.com for information related to the Advisor, Institutional and R6 Classes.
† The net expense ratio reflects a contractual advisory fee waiver agreement through January 27, 2022, as per the Prospectus dated 12/15/2020.
SECTOR ALLOCATION | | % of Net Assets | |
Industrials | | | 34.7 | | |
Financials | | | 19.6 | | |
Information Technology | | | 9.7 | | |
Consumer Discretionary | | | 8.5 | | |
Communication Services | | | 7.5 | | |
Materials | | | 5.3 | | |
Health Care | | | 5.1 | | |
Consumer Staples | | | 3.5 | | |
Real Estate | | | 2.2 | | |
Short-Term Investments and Other | | | 3.9 | | |
GEOGRAPHIC ALLOCATION | |
| | | % of Equity | |
Europe | | | 70.1 | | |
United Kingdom | | | 23.5 | | |
Switzerland | | | 9.8 | | |
Germany* | | | 6.7 | | |
Italy* | | | 6.4 | | |
Finland* | | | 6.4 | | |
Sweden | | | 4.6 | | |
Norway | | | 3.3 | | |
Denmark | | | 3.2 | | |
Spain* | | | 2.4 | | |
Portugal* | | | 1.7 | | |
Netherlands* | | | 1.3 | | |
Belgium* | | | 0.8 | | |
| | % of Equity | |
Asia | | | 11.5 | | |
South Korea | | | 4.9 | | |
Japan | | | 3.2 | | |
China | | | 1.9 | | |
Indonesia | | | 1.5 | | |
Australasia | | | 7.5 | | |
Australia | | | 7.5 | | |
Latin America | | | 6.4 | | |
Mexico | | | 6.4 | | |
North America | | | 4.5 | | |
Canada | | | 4.5 | | |
* Euro currency countries comprise 25.7% of equity investments.
See accompanying Disclosures and Endnotes on page 96.
30 OAKMARK FUNDS
Oakmark International Small Cap Fund March 31, 2021
Portfolio Manager Commentary


David G. Herro, CFA
Portfolio Manager
oakex@oakmark.com
Michael L. Manelli, CFA
Portfolio Manager
oakex@oakmark.com
Justin D. Hance, CFA
Portfolio Manager
oakex@oakmark.com
The Oakmark International Small Cap Fund returned 11.5% for the quarter ending March 31, outperforming the MSCI World ex U.S. Small Cap Index,15 which returned 4.9% for the same period. Since its November 1995 inception, the Fund has returned an average of 9.3% per year.
During the first quarter, markets reacted positively to news of worldwide vaccine rollouts and signs of economic recovery. In our view, the Fund is well positioned to benefit from global economic growth and we have been pleased to see better than expected earnings for many of our holdings. Our bottom-up stock selection process has generated a portfolio tilted toward cyclical sectors, so as demand improves and supply chains evolve, we believe many of our companies will enjoy increases in earnings and free cash flow. This is particularly true for names within the industrials sector, where the Fund has significant exposure.
Finnish engineering firm Konecranes, which specializes in overhead lifting equipment, was a top contributor to the Fund's returns in the first quarter. In February, investors responded favorably to Konecranes' fourth-quarter earnings report and guidance for 2021. During the fourth quarter, the company's sales and adjusted earnings exceeded consensus estimates by over 10%, primarily driven by outperformance in the industrial equipment business. This segment's significantly increased profitability indicates that management's efforts to structurally improve the segment are beginning to pay off. The stronger profitability was driven by cost-cutting efforts (factory closures and efficiency measures), successful new product platforms and an increased focus on the process crane business. Konecranes' service division, its highest quality segment, also delivered a record EBITA17 margin in the fourth quarter that surpassed our forecasts. In its earnings release, Konecranes pointed to signs of increased demand and it expects net sales to increase year-over-year in 2021 with improving EBITA margins. We believe the company remains an attractive investment positioned for long-term growth and profitability.
Applus Services, another industrial name, was a top detractor from the Fund's first-quarter returns. The Spanish-headquartered company provides testing, inspection and certification services through four divisions: energy & industry, laboratories, automotive, and IDIADA (design, testing, engineering and homologation services for the global automotive industry). Applus' business has been hurt by Covid-19-related restrictions in Europe and by low commodity prices in the oil and gas industry. In addition, the company is navigating the renewal of several key contracts within its automotive and IDIADA businesses. This operational uncertainty was another weight on the company's share price in the first quarter. Long aware of these upcoming contract renewals, we have regularly spoken with Applus management over the past year to discuss possible risks. We continue to believe the company's incumbency and industry leadership position make it very likely these
contracts will be renewed on favorable terms. In addition, the company's recent difficulties should turn around as Europe emerges from lockdowns and revenues recover to pre-Covid-19 levels. We continue to view Applus as a high-quality business with an attractive risk-return profile.
We exited four positions during the first quarter due to stock price appreciation. The most notable sale was Canadian software and services technology firm BlackBerry, which contributed just over 1% to the Fund's return during the period. As discussed in last quarter's letter (https://oakmark.com/news-insights/oakmark-international-small-cap-fund-fourth-quarter-2020/), BlackBerry's stock price increased after the company's announcement of a multi-year partnership with Amazon to develop and market IVY, an intelligent vehicle data software platform. Expected to launch in 2023, the product will enable auto manufacturers to securely collect standardized data from vehicle sensors via the cloud. In addition to the IVY-related movement, BlackBerry's share price rose markedly in January when the company was targeted by Reddit users as an attractive buying opportunity. In the 10 trading days between January 14 and January 27, BlackBerry stock appreciated nearly 300%, pushing the share price well beyond our estimate of its intrinsic value and leading us to exit the position in favor of investment opportunities with more upside potential. BlackBerry's share price peaked north of C$30 per share in late January, but closed the quarter at C$10.54 per share, which was similar to its trading level before the Reddit-driven run-up. In addition to BlackBerry, we completed full sales of Hirose Electric (Japanese electronic parts supplier), Nordic Entertainment (Swedish-headquartered media group) and Tower Bersama (Indonesian telecommunication tower provider). No new names were added to the portfolio during the quarter.
Geographically, we ended the quarter with approximately 70% of our holdings in Europe and the U.K., 12% in Asia, and 7% in Australasia. The remaining positions are in the Americas with 6% in Latin America (Mexico) and 5% in North America (Canada). We believe the Swiss franc remains overvalued versus the U.S. dollar, and we ended March with hedges on 14% of the Fund's franc exposure.
We are grateful for your support during this turbulent year. Our approach during this time did not change and we will continue to adjust the portfolio by adding to names on weakness and trimming those nearing our estimates of intrinsic value. Despite recent outperformance, we are excited about the Fund's position for the future.
See accompanying Disclosures and Endnotes on page 96.
Oakmark.com 31
Oakmark International Small Cap Fund March 31, 2021 (Unaudited)
Schedule of Investments (in thousands)
| | | Shares | | Value | |
COMMON STOCKS - 96.1% | |
INDUSTRIALS - 34.7% | |
CAPITAL GOODS - 17.1% | |
Konecranes OYJ (Finland) | | | 1,371 | | | $ | 61,074 | | |
Duerr AG (Germany) | | | 1,207 | | | | 50,249 | | |
Travis Perkins PLC (United Kingdom) (a) | | | 2,206 | | | | 46,875 | | |
Sulzer AG (Switzerland) | | | 304 | | | | 34,176 | | |
Metso Outotec Oyj (Finland) | | | 2,967 | | | | 33,072 | | |
Howden Joinery Group PLC
(United Kingdom) (a) | | | 1,266 | | | | 12,790 | | |
Morgan Advanced Materials PLC
(United Kingdom) | | | 2,449 | | | | 10,516 | | |
dormakaba Holding AG (Switzerland) | | | 15 | | | | 9,903 | | |
Bucher Industries AG (Switzerland) | | | 7 | | | | 3,363 | | |
| | | | | | 262,018 | | |
COMMERCIAL & PROFESSIONAL SERVICES - 16.0% | |
ISS A/S (Denmark) (a) | | | 2,438 | | | | 45,441 | | |
Applus Services SA (Spain) (a) | | | 3,474 | | | | 35,971 | | |
Loomis AB (Sweden) | | | 1,085 | | | | 33,000 | | |
Pagegroup PLC (United Kingdom) (a) | | | 3,931 | | | | 25,470 | | |
Mitie Group PLC (United Kingdom) (a) | | | 28,942 | | | | 25,097 | | |
SThree PLC (United Kingdom) (a) | | | 4,137 | | | | 21,958 | | |
Babcock International Group PLC
(United Kingdom) (a) | | | 6,275 | | | | 19,774 | | |
Randstad N.V. (Netherlands) (b) | | | 278 | | | | 19,567 | | |
Hays PLC (United Kingdom) (a) | | | 8,723 | | | | 17,977 | | |
| | | | | | 244,255 | | |
TRANSPORTATION - 1.6% | |
Controladora Vuela Cia de Aviacion
SAB de CV ADR (Mexico) (a) (c) | | | 1,632 | | | | 23,272 | | |
DSV PANALPINA A/S (Denmark) | | | 6 | | | | 1,271 | | |
| | | | | | 24,543 | | |
| | | | | | 530,816 | | |
FINANCIALS - 19.6% | |
DIVERSIFIED FINANCIALS - 14.8% | |
Julius Baer Group, Ltd. (Switzerland) (a) | | | 863 | | | | 55,175 | | |
Azimut Holding SpA (Italy) | | | 2,061 | | | | 46,972 | | |
Element Fleet Management Corp. (Canada) | | | 3,242 | | | | 35,469 | | |
St James's Place PLC (United Kingdom) | | | 1,983 | | | | 34,823 | | |
EFG International AG (Switzerland) | | | 3,698 | | | | 28,329 | | |
Standard Life Aberdeen PLC
(United Kingdom) | | | 6,410 | | | | 25,618 | | |
| | | | | | 226,386 | | |
BANKS - 4.8% | |
BNK Financial Group, Inc. (South Korea) | | | 7,637 | | | | 45,820 | | |
DGB Financial Group, Inc. (South Korea) | | | 3,547 | | | | 26,449 | | |
| | | | | | 72,269 | | |
| | | | | | 298,655 | | |
| | | Shares | | Value | |
INFORMATION TECHNOLOGY - 9.7% | |
SOFTWARE & SERVICES - 9.7% | |
Atea ASA (Norway) (a) | | | 2,863 | | | $ | 48,675 | | |
Software AG (Germany) | | | 1,134 | | | | 47,807 | | |
TIS, Inc. (Japan) | | | 848 | | | | 20,236 | | |
Equiniti Group PLC (United Kingdom) (a) | | | 9,736 | | | | 17,340 | | |
Link Administration Holdings, Ltd. (Australia) | | | 3,770 | | | | 14,691 | | |
| | | | | | 148,749 | | |
CONSUMER DISCRETIONARY - 8.5% | |
AUTOMOBILES & COMPONENTS - 3.9% | |
Pirelli & C SpA (Italy) (a) | | | 6,112 | | | | 35,851 | | |
Autoliv, Inc. (Sweden) | | | 233 | | | | 21,613 | | |
Dometic Group AB (Sweden) (a) | | | 143 | | | | 2,078 | | |
| | | | | | 59,542 | | |
CONSUMER SERVICES - 2.6% | |
Wynn Macau, Ltd. (China) (a) | | | 14,149 | | | | 27,519 | | |
Autogrill SpA (Italy) (a) | | | 1,405 | | | | 11,614 | | |
| | | | | | 39,133 | | |
CONSUMER DURABLES & APPAREL - 2.0% | |
Gildan Activewear, Inc. (Canada) | | | 1,029 | | | | 31,491 | | |
| | | | | | 130,166 | | |
COMMUNICATION SERVICES - 7.5% | |
MEDIA & ENTERTAINMENT - 4.5% | |
Megacable Holdings SAB de CV (Mexico) | | | 8,164 | | | | 29,252 | | |
oOh!media, Ltd. (Australia) (a) | | | 18,845 | | | | 24,906 | | |
Hakuhodo DY Holdings, Inc. (Japan) | | | 845 | | | | 14,072 | | |
| | | | | | 68,230 | | |
TELECOMMUNICATION SERVICES - 3.0% | |
NOS SGPS SA (Portugal) | | | 6,695 | | | | 24,370 | | |
Sarana Menara Nusantara Tbk PT
(Indonesia) | | | 290,664 | | | | 22,012 | | |
| | | | | | 46,382 | | |
| | | | | | 114,612 | | |
MATERIALS - 5.3% | |
Incitec Pivot, Ltd. (Australia) (a) | | | 18,265 | | | | 40,372 | | |
DS Smith PLC (United Kingdom) (a) | | | 5,104 | | | | 28,687 | | |
Titan Cement International SA (Belgium) (a) | | | 606 | | | | 11,224 | | |
| | | | | | 80,283 | | |
HEALTH CARE - 5.1% | |
HEALTH CARE EQUIPMENT & SERVICES - 5.1% | |
ConvaTec Group PLC (United Kingdom) | | | 13,722 | | | | 37,097 | | |
Healius, Ltd. (Australia) | | | 6,089 | | | | 18,870 | | |
Ansell, Ltd. (Australia) | | | 376 | | | | 11,210 | | |
Elekta AB, Class B (Sweden) | | | 823 | | | | 10,675 | | |
| | | | | | 77,852 | | |
See accompanying Notes to Financial Statements.
32 OAKMARK FUNDS
Oakmark International Small Cap Fund March 31, 2021 (Unaudited)
Schedule of Investments (in thousands) (continued)
| | | Shares | | Value | |
COMMON STOCKS - 96.1% (continued) | |
CONSUMER STAPLES - 3.5% | |
HOUSEHOLD & PERSONAL PRODUCTS - 2.7% | |
Kimberly-Clark de Mexico SAB de CV,
Class A (Mexico) | | | 23,961 | | | $ | 40,947 | | |
FOOD & STAPLES RETAILING - 0.8% | |
Sugi Holdings Co., Ltd. (Japan) | | | 162 | | | | 12,823 | | |
| | | | | | 53,770 | | |
REAL ESTATE - 2.2% | |
LSL Property Services PLC
(United Kingdom) (a) | | | 5,072 | | | | 21,325 | | |
IWG PLC (Switzerland) (a) | | | 2,732 | | | | 12,830 | | |
| | | | | | 34,155 | | |
TOTAL COMMON STOCKS - 96.1%
(COST $1,207,825) | | | | | 1,469,058 | | |
| | | Par Value | | Value | |
SHORT-TERM INVESTMENT - 3.3% | |
REPURCHASE AGREEMENT - 3.3% | |
Fixed Income Clearing Corp. Repurchase
Agreement, 0.00% dated 03/31/21 due
04/01/21, repurchase price $50,045,
collateralized by United States
Treasury Note, 0.125% due 03/31/23,
value plus accrued interest of $51,046
(Cost: $50,045) | | $ | 50,045 | | | | 50,045 | | |
TOTAL SHORT-TERM INVESTMENTS - 3.3%
(COST $50,045) | | | | | 50,045 | | |
TOTAL INVESTMENTS - 99.4%
(COST $1,257,870) | | | | | 1,519,103 | | |
Foreign Currencies (Cost $31) - 0.0% (d) | | | | | 31 | | |
Other Assets In Excess of Liabilities - 0.6% | | | | | 8,554 | | |
TOTAL NET ASSETS - 100.0% | | | | $ | 1,527,688 | | |
(a) Non-income producing security
(b) A portion of the security out on loan.
(c) Sponsored American Depositary Receipt
(d) Amount rounds to less than 0.1%.
See accompanying Notes to Financial Statements.
Oakmark.com 33
Oakmark International Small Cap Fund March 31, 2021 (Unaudited)
Schedule of Investments (in thousands) (continued)
FORWARD FOREIGN CURRENCY CONTRACT (in thousands)
| | | Local
Contract
Amount | | Base
Contract
Amount | | Settlement
Date | | Valuation at
3/31/21 | | Unrealized
Appreciation/
(Depreciation) | |
Foreign Currency Sold: | |
Swiss Franc | | | 16,833 | | | $ | 19,078 | | | 06/16/21 | | $ | 17,848 | | | $ | 1,230 | | |
| | | | | | | | | $ | 17,848 | | | $ | 1,230 | | |
See accompanying Notes to Financial Statements.
34 OAKMARK FUNDS

This page intentionally left blank.
Oakmark.com 35
Oakmark Equity and Income Fund March 31, 2021
Summary Information
VALUE OF A $10,000 INVESTMENT
Since Inception - 11/01/95 (Unaudited)

PERFORMANCE
| | | | Average Annual Total Returns (as of 03/31/21) | | | |
| (Unaudited) | | Total Return
Last 3 Months | | 1-year | | 3-year | | 5-year | | 10-year | | Since
Inception | | Inception
Date | |
Oakmark Equity and Income Fund (Investor Class) | | | 10.25 | % | | | 53.68 | % | | | 10.03 | % | | | 10.56 | % | | | 8.26 | % | | | 10.16 | % | | 11/01/95 | |
Lipper Balanced Fund Index | | | 5.39 | % | | | 37.31 | % | | | 11.23 | % | | | 10.47 | % | | | 8.44 | % | | | 7.41 | % | | | |
S&P 500 Index | | | 6.18 | % | | | 56.35 | % | | | 16.78 | % | | | 16.29 | % | | | 13.91 | % | | | 9.90 | % | | | |
Barclays U.S. Govt./Credit Index | | | -4.28 | % | | | 0.86 | % | | | 4.99 | % | | | 3.36 | % | | | 3.70 | % | | | 5.10 | % | | | |
Oakmark Equity and Income Fund (Advisor Class) | | | 10.29 | % | | | 53.85 | % | | | 10.17 | % | | | N/A | | | | N/A | | | | 10.35 | % | | 11/30/16 | |
Oakmark Equity and Income Fund (Institutional Class) | | | 10.32 | % | | | 54.00 | % | | | 10.24 | % | | | N/A | | | | N/A | | | | 10.40 | % | | 11/30/16 | |
Oakmark Equity and Income Fund (Service Class) | | | 10.19 | % | | | 53.32 | % | | | 9.76 | % | | | 10.28 | % | | | 7.95 | % | | | 8.72 | % | | 07/12/00 | |
Oakmark Equity and Income Fund (R6 Class) | | | 10.32 | % | | | — | | | | — | | | | N/A | | | | N/A | | | | 11.67 | % | | 12/15/20 | |
The graph and table above do not reflect the deduction of taxes that a shareholder would pay on Fund distributions or the redemption of Fund shares.
Past performance is no guarantee of future results. The performance data quoted represents past performance. Current performance may be lower or higher than the performance data quoted. Total return includes change in share prices and, in each case, includes reinvestment of dividends and capital gain distributions. The investment return and principal value vary so that an investor's shares, when redeemed, may be worth more or less than the original cost. To obtain the most recent month-end performance, please visit Oakmark.com.
TOP TEN EQUITY HOLDINGS6 | | % of Net Assets | |
Bank of America Corp. | | | 5.1 | | |
Alphabet, Inc., Class A | | | 5.0 | | |
General Motors Co. | | | 4.2 | | |
CVS Health Corp. | | | 3.4 | | |
TE Connectivity, Ltd. | | | 3.4 | | |
Philip Morris International, Inc. | | | 2.7 | | |
Ally Financial, Inc. | | | 2.5 | | |
Citigroup, Inc. | | | 2.4 | | |
Charter Communications, Inc., Class A | | | 2.3 | | |
Lear Corp. | | | 2.1 | | |
FUND STATISTICS | |
Ticker* | | OAKBX | |
Number of Equity Holdings | | 46 | |
Net Assets | | $7.8 billion | |
Weighted Average Market Cap | | $196.5 billion | |
Median Market Cap | | $43.6 billion | |
Gross Expense Ratio - Investor Class (as of 12/15/20)* | | 0.86% | |
Net Expense Ratio - Investor Class (as of 12/15/20)*† | | 0.84% | |
* This information is related to the Investor Class. Please visit Oakmark.com for information related to the Advisor, Institutional and R6 Classes.
† The net expense ratio reflects a contractual advisory fee waiver agreement through January 27, 2022, as per the Prospectus dated 12/15/2020.
SECTOR ALLOCATION | | % of Net Assets | |
Equity Investments | |
Financials | | | 13.4 | | |
Consumer Discretionary | | | 11.1 | | |
Health Care | | | 9.7 | | |
Communication Services | | | 9.3 | | |
Consumer Staples | | | 6.7 | | |
Industrials | | | 6.2 | | |
Information Technology | | | 5.7 | | |
Energy | | | 2.9 | | |
Materials | | | 2.3 | | |
Real Estate | | | 1.3 | | |
Total Equity Investments | | | 68.6 | | |
Preferred Stocks | | | 0.3 | | |
Fixed Income Investments | |
Corporate Bonds | | | 17.6 | | |
Government and Agency Securities | | | 6.8 | | |
Bank Loans | | | 1.0 | | |
Total Fixed Income Investments | | | 25.4 | | |
Short-Term Investments and Other | | | 5.7 | | |
See accompanying Disclosures and Endnotes on page 96.
36 OAKMARK FUNDS
Oakmark Equity and Income Fund March 31, 2021
Portfolio Manager Commentary


Clyde S. McGregor, CFA
Portfolio Manager
oakbx@oakmark.com
M. Colin Hudson, CFA
Portfolio Manager
oakbx@oakmark.com
Adam D. Abbas
Portfolio Manager
oakbx@oakmark.com
A Truly Extraordinary 12 Months
Perhaps readers do not wish to be reminded, but one year ago in this report, we were recounting the effects of the new pandemic on society, the economy and the securities markets. Forgive us for quoting a previous report extensively, but it seems appropriate at this moment to dramatize how the investment context has changed. One year ago (https://oakmark.com/news-insights/oakmark-equity-and-income-fund-first-quarter-2020/), we wrote:
"Fastest decline into a bear market ever. Shortest time spent in a bear market ever. Eight consecutive days when the market either rose or fell by over 4%. Largest one-day stock market gain since 1933. Second-largest one-day drop ever. A collapse in the price of oil. Remarkable individual stock volatility. Growth outperforms value by a near-record amount. Small- and mid-cap issues suffer major price declines, far in excess of large caps. The U.S. registers the largest number of weekly unemployment claims ever by a factor of more than three times. The Federal Reserve reduces the Fed funds rate to 0%. Congress passes an economic stimulus package of more than $2 trillion. We are truly living and investing in an extraordinary time.
History teaches us that it takes time for the market to stabilize and regain its footing after such an amazing disruption. We believe that our proper course of action in such a time is to attempt to seize moments of extreme price dislocation and to improve the Fund's tax position for our taxable clients. To that end, we have been fairly active. Market turmoil has affected the Fund's asset allocation, and we are working to realign the portfolio appropriately. Our most important advice to clients at this tumultuous time is to take the same action we are—rebalance. If two months ago your asset allocation was appropriate for your circumstances, you probably need to act to return to that allocation."
All time periods are unique by definition, and the 12 months following this report certainly qualify. The pandemic proved far more lethal and contagious than any other viral outbreak in the past 100 years, and the consequent limitations on activity crushed some economic sectors while enhancing others. Some of these favorable outcomes were completely unexpected even by knowledgeable industry insiders. Taking an example from the Equity and Income Fund portfolio, one year ago we purchased shares of Thor, a manufacturer of towable trailers and motorized recreational vehicles. We had previously owned shares in the company, admired the management team and perceived Thor's industry competitive dynamics to be favorable. The company's share price declined significantly in the first quarter of 2020, and we merely thought that we were being offered a bargain price for a good company. What we did not foresee was that families would gravitate to recreational vehicles as a method of vacationing safely during the pandemic. Thor's business began to boom during the summer of 2020 and this
has helped the share price nearly to triple from our acquisition price.
Growth outperforming value was another story that we described often last year. Through October, growth stocks trounced value names partly because investors believed that technology companies would benefit from the pandemic. But interest rates may have been the most important factor to growth's success. When it became clear that the pandemic was depressing economic activity, the Federal Reserve's response was to drive short-term interest rates nearly to zero. This benefited the shares of companies that show little or no profitability in the present but that grow rapidly. That's because when these companies are discounted due to low interest rates, their future earnings become more valuable. This narrative began to shift late last year as price inflation became more evident in the economy, helping to push the yield on the benchmark 10-year U.S. Treasury from a low of 0.5% to a recent high around 1.75%. The Fed has continued to suppress short rates, but higher long-term yields have helped relative performance in equities to shift.
This rotation in favor of value can be seen across the equities in the Fund. As of March 31, 2020, 19 of the Fund's 41 holdings showed losses since their purchase. Compare that to March 31 of this year, when only one very recent purchase shows even a small loss. In fact, since March 2020, 10 of the Fund's equity holdings have more than doubled in price and this group ranges from previously mentioned Thor to a financial company (Ally Financial), a hospital chain (HCA Healthcare) and a company supposedly disrupted by technological change (General Motors). We welcome this development in the investing environment and have begun to reposition the portfolio given the new opportunity set. In the section quoted above from last year's report, we advised rebalancing to return to one's desired asset allocation. Circumstances are far different today, but our advice once again is to review one's positioning and rebalance, if needed.
Quarter Review
The Equity and Income Fund gained 10.3% in the quarter, which contrasts to a 5.4% return for the Lipper Balanced Fund Index,18 the Fund's performance benchmark. For the fiscal six months, the Fund showed a gain of 28.0% compared to 15.5% for the Lipper Index. Since inception in 1995, the Fund's compound annual rate of return is 10.2%, while the corresponding return to the Lipper Index is 7.4%. One factor that contributed to the Fund's relative performance in the quarter was the short duration of the fixed income allocation. We have argued for several years that longer term bonds had become biased toward risk rather than return. At least in the recent quarter that assertion proved prophetic as the benchmark 10-year U.S. Treasury lost roughly 7%.
See accompanying Disclosures and Endnotes on page 96.
Oakmark.com 37
Oakmark Equity and Income Fund March 31, 2021
Portfolio Manager Commentary (continued)
The largest contributors to portfolio return in the quarter were General Motors (GM), Bank of America, Alphabet, Ally and BorgWarner. Interestingly, GM, Bank of America and Ally were all on the largest detractor list for the quarter one year ago. Charter Communications led the detractors' list, followed by Nestlé, Arconic, Mastercard, and Gaming and Leisure Properties. For the first six months of the Fund's fiscal year, the contributors' list was almost the same: GM, Bank of America, Alphabet, Ally and Howmet Aerospace. Only three companies detracted: Nestlé, Regeneron Pharmaceuticals and new purchase Salesforce. One year ago in this report, we noted that the pandemic had convinced investors to flee financial company stocks. We suggested that financials entered the pandemic in far better shape than the 2008 financial crisis and that—combined with the extraordinary support that governments worldwide were throwing at the economy—financial company shares were undervalued. In the past six months, the financials sector has been the second-best performer in the S&P 500 Index1 and the top contributing sector for the Equity and Income Fund. Were interest rates to increase materially, we believe that this industry could continue to perform well.
Transaction Activity
We were active in the quarter and initiated four new holdings, but our selling was limited to cutting back positions that approached their sell targets (i.e., no complete eliminations). In the first section of this report, we discussed the market's rotation toward value stocks. This rotation has produced opportunities in market sectors previously unrepresented in the portfolio. Proceeding alphabetically, we purchased shares of Facebook, the company that controls two of the world's most dominant social networking platforms, Facebook and Instagram. Facebook's unprecedented global reach and ad-targeting capabilities have made these platforms some of the most sought after and effective advertising platforms ever created. We believe that the long-term outlook for digital advertising remains bright, and we expect Facebook's advertising market share to increase. Excluding its large net cash balance, the company is trading at a modest discount to the S&P 500, based on next year's consensus earnings forecast, even though those estimates include little to no contribution from valuable assets like WhatsApp and AR/VR (augmented reality/virtual reality), which Facebook has yet to monetize meaningfully. We believe this is an attractive valuation for a company that is projected to grow its revenue in the double digits for the foreseeable future and we think that Facebook's operating margin potential is substantially higher than what the company is likely to report in the coming years.
Our second new purchase was Fiserv. Following its transformative acquisition of First Data Corporation in 2019, Fiserv is now a top provider of digital banking solutions, core account processing software and merchant acquiring services in the U.S. The company's mission-critical software and services generate recurring revenue and are tied to strong secular growth trends within both digital payments and banking. We expect Fiserv's revenue to grow in the mid- to high-single-digits over the coming years and that the company will enjoy significant margin expansion as it realizes the cost synergies from the First Data acquisition. In our estimate, this would produce near-term earnings per share growth of over 20%. Furthermore, with its significant free cash flow generation and excess debt capacity, the company should be able to return something like 35% of its market capitalization through dividends and share repurchases
over the next five years, in our view. We believe the risk-adjusted return potential is attractive for this well-managed, above-average business that's trading for a market multiple on our estimate of normal earnings.
The third new purchase was Humana, the industry leader and near pure play in the fastest growing sector of managed care, Medicare Advantage. Each year, more seniors choose Medicare Advantage over traditional Medicare due to the compelling combination of lower costs and expanded benefits. Humana's scale advantages and focus on senior care allow the company to make targeted investments in its members' health, resulting in fewer unnecessary hospitalizations and lower chronic care costs. Much of these savings are then reinvested in the health plan, resulting in a continuously improving customer value proposition. The company's brand also resonates well in the marketplace and has helped drive double-digit annual membership growth over the past decade—well above the rest of the industry. Further, we believe Humana has a long runway ahead as it benefits from an aging population and continued conversion of the approximately 60% of seniors who are still enrolled in traditional Medicare. Yet Humana's shares are currently trading at a nearly 20% discount to the S&P 500 earnings multiple, which we believe doesn't give the company enough credit for its durable competitive advantages and strong secular growth outlook.
Salesforce was the final new portfolio addition. The company is executing a tried-and-true strategy in the software space of buying young, best-of-breed software companies and then driving these products into their massive installed base. Companies like Tableau, ExactTarget and Mulesoft have considerably more reach in the hands of Salesforce than they could have achieved as standalone companies. However, when Salesforce announced a deal to buy Slack Technologies, the market reduced Salesforce's pre-announcement market capitalization by roughly $40 billion, effectively offering investors the opportunity to get Slack for free. We believe management should be given the benefit of the doubt. Slack has the potential to be a game-changing technology with a huge addressable market, and management's track record on acquisitions has been superb. We estimate that the company's shares now trade at a material discount to industry peer Microsoft, despite showing nearly twice the growth, giving investors the chance to own a top-tier software company at a bottom-tier multiple.
We thank our shareholders for investing alongside us in the Equity and Income Fund and wish you good health and safety.
See accompanying Disclosures and Endnotes on page 96.
38 OAKMARK FUNDS
Oakmark Equity and Income Fund March 31, 2021 (Unaudited)
Schedule of Investments (in thousands)
| | | Shares | | Value | |
COMMON STOCKS - 68.6% | |
FINANCIALS - 13.4% | |
BANKS - 7.5% | |
Bank of America Corp. | | | 10,240 | | | $ | 396,201 | | |
Citigroup, Inc. | | | 2,530 | | | | 184,031 | | |
| | | | | | 580,232 | | |
DIVERSIFIED FINANCIALS - 3.3% | |
Ally Financial, Inc. | | | 4,364 | | | | 197,283 | | |
State Street Corp. | | | 653 | | | | 54,875 | | |
| | | | | | 252,158 | | |
INSURANCE - 2.6% | |
Reinsurance Group of America, Inc. | | | 1,087 | | | | 136,979 | | |
American International Group, Inc. | | | 1,460 | | | | 67,448 | | |
| | | | | | 204,427 | | |
| | | | | | 1,036,817 | | |
CONSUMER DISCRETIONARY - 11.1% | |
AUTOMOBILES & COMPONENTS - 9.8% | |
General Motors Co. | | | 5,671 | | | | 325,861 | | |
Lear Corp. | | | 915 | | | | 165,850 | | |
BorgWarner, Inc. | | | 3,407 | | | | 157,953 | | |
Thor Industries, Inc. | | | 808 | | | | 108,833 | | |
| | | | | | 758,497 | | |
CONSUMER SERVICES - 0.8% | |
Booking Holdings, Inc. (a) | | | 27 | | | | 62,766 | | |
CONSUMER DURABLES & APPAREL - 0.5% | |
Carter's, Inc. | | | 471 | | | | 41,922 | | |
| | | | | | 863,185 | | |
HEALTH CARE - 9.7% | |
HEALTH CARE EQUIPMENT & SERVICES - 7.9% | |
CVS Health Corp. | | | 3,540 | | | | 266,288 | | |
HCA Healthcare, Inc. | | | 691 | | | | 130,067 | | |
LivaNova PLC (a) | | | 1,280 | | | | 94,375 | | |
UnitedHealth Group, Inc. | | | 116 | | | | 43,160 | | |
Humana, Inc. | | | 100 | | | | 42,051 | | |
Zimmer Biomet Holdings, Inc. | | | 236 | | | | 37,763 | | |
| | | | | | 613,704 | | |
PHARMACEUTICALS, BIOTECHNOLOGY & LIFE SCIENCES - 1.8% | |
Agilent Technologies, Inc. | | | 612 | | | | 77,848 | | |
Regeneron Pharmaceuticals, Inc. (a) | | | 122 | | | | 57,628 | | |
| | | | | | 135,476 | | |
| | | | | | 749,180 | | |
COMMUNICATION SERVICES - 9.3% | |
MEDIA & ENTERTAINMENT - 9.3% | |
Alphabet, Inc., Class A (a) | | | 187 | | | | 384,866 | | |
Charter Communications, Inc., Class A (a) | | | 290 | | | | 178,813 | | |
Comcast Corp., Class A | | | 1,760 | | | | 95,239 | | |
Facebook, Inc., Class A (a) | | | 213 | | | | 62,735 | | |
| | | | | | 721,653 | | |
| | | Shares | | Value | |
CONSUMER STAPLES - 6.7% | |
FOOD, BEVERAGE & TOBACCO - 6.7% | |
Philip Morris International, Inc. | | | 2,388 | | | $ | 211,893 | | |
Keurig Dr Pepper, Inc. | | | 3,092 | | | | 106,258 | | |
Nestlé SA (b) | | | 723 | | | | 80,622 | | |
Constellation Brands, Inc., Class A | | | 280 | | | | 63,909 | | |
Diageo PLC (b) | | | 367 | | | | 60,298 | | |
| | | | | | 522,980 | | |
INDUSTRIALS - 6.2% | |
CAPITAL GOODS - 6.2% | |
Howmet Aerospace, Inc. | | | 5,017 | | | | 161,184 | | |
Carlisle Cos., Inc. | | | 773 | | | | 127,171 | | |
Johnson Controls International PLC | | | 1,703 | | | | 101,642 | | |
General Dynamics Corp. | | | 518 | | | | 93,993 | | |
| | | | | | 483,990 | | |
INFORMATION TECHNOLOGY - 5.7% | |
TECHNOLOGY HARDWARE & EQUIPMENT - 3.4% | |
TE Connectivity, Ltd. | | | 2,053 | | | | 265,102 | | |
SOFTWARE & SERVICES - 2.3% | |
Mastercard, Inc., Class A | | | 221 | | | | 78,687 | | |
salesforce.com, Inc. (a) | | | 277 | | | | 58,751 | | |
Fiserv, Inc. (a) | | | 357 | | | | 42,438 | | |
| | | | | | 179,876 | | |
| | | | | | 444,978 | | |
ENERGY - 2.9% | |
PDC Energy, Inc. (a) | | | 2,465 | | | | 84,782 | | |
ChampionX Corp. (a) | | | 3,205 | | | | 69,637 | | |
Diamondback Energy, Inc. | | | 615 | | | | 45,215 | | |
Nov, Inc. | | | 1,615 | | | | 22,160 | | |
| | | | | | 221,794 | | |
MATERIALS - 2.3% | |
Glencore PLC | | | 28,371 | | | | 111,175 | | |
Arconic Corp. (a) | | | 1,823 | | | | 46,280 | | |
Sealed Air Corp. | | | 521 | | | | 23,877 | | |
| | | | | | 181,332 | | |
REAL ESTATE - 1.3% | |
The Howard Hughes Corp. (a) | | | 622 | | | | 59,180 | | |
Gaming and Leisure Properties, Inc. REIT | | | 914 | | | | 38,777 | | |
| | | | | | 97,957 | | |
TOTAL COMMON STOCKS - 68.6%
(COST $2,554,223) | | | | | 5,323,866 | | |
PREFERRED STOCKS - 0.3% | |
FINANCIALS - 0.2% | |
Signature Bank/New York NY (c), 5.00% | | | 377 | | | | 9,695 | | |
GMAC Capital Trust I (d), 5.98%
(3 mo. USD LIBOR + 5.785%) | | | 237 | | | | 6,033 | | |
| | | | | | 15,728 | | |
See accompanying Notes to Financial Statements.
Oakmark.com 39
Oakmark Equity and Income Fund March 31, 2021 (Unaudited)
Schedule of Investments (in thousands) (continued)
| | | Shares | | Value | |
PREFERRED STOCKS - 0.3% (continued) | |
CONSUMER STAPLES - 0.1% | |
Bunge, Ltd. (c), 4.88% , | | | 62 | | | $ | 7,217 | | |
COMMUNICATION SERVICES - 0.0% (e) | |
Liberty Broadband Corp. (c), 7.00% , | | | 50 | | | | 1,324 | | |
TOTAL PREFERRED STOCKS - 0.3%
(COST $23,266) | | | | | 24,269 | | |
| | | Par Value | | Value | |
FIXED INCOME - 25.4% | |
CORPORATE BONDS - 17.6% | |
CONSUMER DISCRETIONARY - 4.3% | |
Aramark Services, Inc., 144A
6.375%, due 05/01/25 (f) | | $ | 9,900 | | | | 10,494 | | |
Asbury Automotive Group, Inc.
4.50%, due 03/01/28 | | | 1,600 | | | | 1,637 | | |
Booking Holdings, Inc.
3.60%, due 06/01/26 | | | 14,730 | | | | 16,097 | | |
3.55%, due 03/15/28 | | | 9,950 | | | | 10,861 | | |
4.625%, due 04/13/30 | | | 4,950 | | | | 5,762 | | |
4.10%, due 04/13/25 | | | 1,950 | | | | 2,172 | | |
BorgWarner, Inc.
2.65%, due 07/01/27 | | | 4,215 | | | | 4,374 | | |
Boyd Gaming Corp.
6.00%, due 08/15/26 | | | 4,975 | | | | 5,180 | | |
Caesars Resort Collection LLC / CRC
Finco, Inc., 144A
5.25%, due 10/15/25 (f) | | | 25,870 | | | | 26,094 | | |
CCO Holdings LLC / CCO Holdings
Capital Corp., 144A
4.75%, due 03/01/30 (f) | | | 2,980 | | | | 3,088 | | |
5.125%, due 05/01/27 (f) | | | 250 | | | | 264 | | |
Charter Communications Operating
LLC / Charter Communications
Operating Capital
4.20%, due 03/15/28 | | | 9,950 | | | | 10,972 | | |
4.50%, due 02/01/24 | | | 2,985 | | | | 3,265 | | |
Expedia Group, Inc.
5.00%, due 02/15/26 | | | 22,860 | | | | 25,802 | | |
3.25%, due 02/15/30 | | | 5,860 | | | | 5,902 | | |
International Game Technology PLC, 144A
6.50%, due 02/15/25 (f) | | | 19,600 | | | | 21,462 | | |
6.25%, due 01/15/27 (f) | | | 200 | | | | 222 | | |
KFC Holding Co. / Pizza Hut Holdings
LLC / Taco Bell of America LLC, 144A
5.25%, due 06/01/26 (f) | | | 1,000 | | | | 1,031 | | |
Lear Corp.
4.25%, due 05/15/29 | | | 7,955 | | | | 8,808 | | |
3.50%, due 05/30/30 | | | 6,950 | | | | 7,241 | | |
Lithia Motors, Inc., 144A
4.625%, due 12/15/27 (f) | | | 2,980 | | | | 3,100 | | |
4.375%, due 01/15/31 (f) | | | 2,000 | | | | 2,076 | | |
5.25%, due 08/01/25 (f) | | | 1,990 | | | | 2,050 | | |
Marriott International, Inc.
4.625%, due 06/15/30 | | | 9,400 | | | | 10,509 | | |
4.00%, due 04/15/28 | | | 9,761 | | | | 10,388 | | |
4.15%, due 12/01/23 | | | 8,094 | | | | 8,705 | | |
3.60%, due 04/15/24 | | | 6,960 | | | | 7,405 | | |
| | | Par Value | | Value | |
MGM Resorts International
4.75%, due 10/15/28 | | $ | 13,875 | | | $ | 14,331 | | |
6.75%, due 05/01/25 | | | 9,850 | | | | 10,589 | | |
Penske Automotive Group, Inc.
5.50%, due 05/15/26 | | | 11,343 | | | | 11,673 | | |
Rent-A-Center, Inc., 144A
6.375%, due 02/15/29 (f) | | | 350 | | | | 371 | | |
Sands China, Ltd.
5.40%, due 08/08/28 | | | 5,000 | | | | 5,712 | | |
5.125%, due 08/08/25 | | | 3,000 | | | | 3,355 | | |
4.60%, due 08/08/23 | | | 2,000 | | | | 2,139 | | |
Scientific Games International, Inc., 144A
5.00%, due 10/15/25 (f) | | | 19,910 | | | | 20,621 | | |
Starbucks Corp.
3.80%, due 08/15/25 | | | 9,950 | | | | 10,963 | | |
4.00%, due 11/15/28 | | | 2,985 | | | | 3,340 | | |
The William Carter Co., 144A
5.625%, due 03/15/27 (f) | | | 1,750 | | | | 1,848 | | |
Tractor Supply Co.
1.75%, due 11/01/30 | | | 1,980 | | | | 1,825 | | |
Under Armour, Inc.
3.25%, due 06/15/26 | | | 12,565 | | | | 12,573 | | |
Wolverine World Wide, Inc., 144A
5.00%, due 09/01/26 (f) | | | 12,140 | | | | 12,307 | | |
Yum! Brands, Inc.
3.875%, due 11/01/23 | | | 6,329 | | | | 6,669 | | |
| | | | | | 333,277 | | |
INDUSTRIALS - 3.8% | |
Albertsons Cos., Inc. / Safeway, Inc. /
New Albertsons, LP /
Albertsons LLC, 144A
3.50%, due 02/15/23 (f) | | | 12,470 | | | | 12,719 | | |
Bacardi, Ltd., 144A
4.45%, due 05/15/25 (f) | | | 4,900 | | | | 5,445 | | |
BAT Capital Corp.
3.557%, due 08/15/27 | | | 6,965 | | | | 7,401 | | |
2.259%, due 03/25/28 | | | 2,975 | | | | 2,927 | | |
BAT International Finance PLC
1.668%, due 03/25/26 | | | 4,460 | | | | 4,413 | | |
Carrier Global Corp.
2.242%, due 02/15/25 | | | 4,965 | | | | 5,139 | | |
2.493%, due 02/15/27 | | | 4,965 | | | | 5,125 | | |
CSX Corp.
2.50%, due 05/15/51 | | | 3,400 | | | | 2,868 | | |
Delta Air Lines, Inc.
3.40%, due 04/19/21 | | | 11,590 | | | | 11,590 | | |
3.80%, due 04/19/23 | | | 9,425 | | | | 9,604 | | |
FedEx Corp.
3.80%, due 05/15/25 | | | 6,950 | | | | 7,636 | | |
Fedex Corp. Pass Through Trust
1.875%, due 08/20/35 | | | 10,609 | | | | 10,267 | | |
Fortune Brands Home & Security, Inc.
4.00%, due 06/15/25 | | | 13,430 | | | | 14,787 | | |
4.00%, due 09/21/23 | | | 9,945 | | | | 10,733 | | |
Hilton Domestic Operating Co., Inc., 144A
4.00%, due 05/01/31 (f) | | | 19,250 | | | | 19,250 | | |
3.625%, due 02/15/32 (f) | | | 13,500 | | | | 13,103 | | |
3.75%, due 05/01/29 (f) | | | 9,000 | | | | 8,910 | | |
See accompanying Notes to Financial Statements.
40 OAKMARK FUNDS
Oakmark Equity and Income Fund March 31, 2021 (Unaudited)
Schedule of Investments (in thousands) (continued)
| | | Par Value | | Value | |
FIXED INCOME - 25.4% (continued) | |
CORPORATE BONDS - 17.6% (continued) | |
Howmet Aerospace, Inc.
6.875%, due 05/01/25 | | $ | 14,890 | | | $ | 17,254 | | |
Kraft Heinz Foods Co.
3.875%, due 05/15/27 | | | 1,900 | | | | 2,078 | | |
Lennox International, Inc.
1.35%, due 08/01/25 | | | 2,000 | | | | 1,989 | | |
1.70%, due 08/01/27 | | | 1,995 | | | | 1,961 | | |
Raytheon Technologies Corp.
3.65%, due 08/16/23 | | | 169 | | | | 181 | | |
Southwest Airlines Co.
5.125%, due 06/15/27 | | | 15,853 | | | | 18,216 | | |
5.25%, due 05/04/25 | | | 7,875 | | | | 8,957 | | |
The Boeing Co.
2.70%, due 02/01/27 | | | 41,847 | | | | 42,490 | | |
Uber Technologies, Inc., 144A
8.00%, due 11/01/26 (f) | | | 21,430 | | | | 23,198 | | |
7.50%, due 05/15/25 (f) | | | 7,940 | | | | 8,569 | | |
7.50%, due 09/15/27 (f) | | | 4,470 | | | | 4,940 | | |
WESCO Distribution, Inc.
5.375%, due 06/15/24 | | | 13,675 | | | | 13,931 | | |
| | | | | | 295,681 | | |
FINANCIALS - 3.2% | |
Ally Financial, Inc.
3.875%, due 05/21/24 | | | 7,950 | | | | 8,587 | | |
Bank of America Corp.
4.45%, due 03/03/26 | | | 5,000 | | | | 5,616 | | |
Berkshire Hathaway Finance Corp.
1.45%, due 10/15/30 | | | 1,980 | | | | 1,846 | | |
CenterState Bank Corp.
5.75% (SOFRRATE + 5.617%),
due 06/01/30 (d) | | | 4,960 | | | | 5,276 | | |
Citigroup, Inc.
3.352%(3 mo. USD LIBOR + 0.897%),
due 04/24/25 (d) | | | 22,860 | | | | 24,431 | | |
3.40%, due 05/01/26 | | | 15,000 | | | | 16,330 | | |
CNO Financial Group, Inc.
5.25%, due 05/30/25 | | | 5,895 | | | | 6,673 | | |
Credit Suisse Group AG, 144A
7.50% (USD 5 Year Swap
rate + 4.598%) (c) (d) (f) | | | 30,000 | | | | 32,470 | | |
E*TRADE Financial Corp.
2.95%, due 08/24/22 | | | 11,965 | | | | 12,355 | | |
JPMorgan Chase & Co.
1.448% (3 mo. USD LIBOR + 1.230%),
due 10/24/23 (d) | | | 19,910 | | | | 20,220 | | |
LPL Holdings, Inc., 144A
4.00%, due 03/15/29 (f) | | | 3,850 | | | | 3,879 | | |
MSCI, Inc., 144A
5.375%, due 05/15/27 (f) | | | 6,965 | | | | 7,449 | | |
4.75%, due 08/01/26 (f) | | | 5,925 | | | | 6,138 | | |
Nasdaq, Inc.
1.65%, due 01/15/31 | | | 8,750 | | | | 8,006 | | |
Pershing Square Holdings, Ltd, 144A
3.25%, due 11/15/30 (f) | | | 14,000 | | | | 13,709 | | |
Principal Life Global Funding II, 144A
2.375%, due 11/21/21 (f) | | | 6,970 | | | | 7,065 | | |
| | | Par Value | | Value | |
Reinsurance Group of America, Inc.
3.15%, due 06/15/30 | | $ | 6,900 | | | $ | 7,132 | | |
3.95%, due 09/15/26 | | | 4,905 | | | | 5,458 | | |
S&P Global, Inc.
2.95%, due 01/22/27 | | | 9,810 | | | | 10,463 | | |
Stifel Financial Corp.
4.00%, due 05/15/30 | | | 6,900 | | | | 7,447 | | |
The Charles Schwab Corp.
3.25%, due 05/21/21 | | | 19,895 | | | | 19,936 | | |
The Goldman Sachs Group, Inc.
3.20%, due 02/23/23 | | | 7,000 | | | | 7,325 | | |
1.969%(3 mo. USD LIBOR + 1.750%),
due 10/28/27 (d) | | | 2,975 | | | | 3,113 | | |
Wells Fargo & Co.
1.442% (3 mo. USD LIBOR + 1.230%),
due 10/31/23 (d) | | | 8,603 | | | | 8,737 | | |
| | | | | | 249,661 | | |
INFORMATION TECHNOLOGY - 1.4% | |
Apple, Inc.
1.65%, due 02/08/31 | | | 9,750 | | | | 9,299 | | |
2.65%, due 02/08/51 | | | 6,000 | | | | 5,465 | | |
Avnet, Inc.
4.875%, due 12/01/22 | | | 8,275 | | | | 8,783 | | |
3.75%, due 12/01/21 | | | 4,710 | | | | 4,792 | | |
Broadcom Corp. / Broadcom
Cayman Finance, Ltd.
3.00%, due 01/15/22 | | | 6,684 | | | | 6,803 | | |
3.50%, due 01/15/28 | | | 4,975 | | | | 5,279 | | |
Broadcom, Inc., 144A
3.469%, due 04/15/34 (f) | | | 9,955 | | | | 10,015 | | |
3.419%, due 04/15/33 (f) | | | 6,950 | | | | 6,987 | | |
CommScope, Inc., 144A
5.50%, due 03/01/24 (f) | | | 3,480 | | | | 3,589 | | |
Dell International LLC / EMC Corp., 144A
5.45%, due 06/15/23 (f) | | | 14,725 | | | | 16,092 | | |
Itron, Inc., 144A
5.00%, due 01/15/26 (f) | | | 11,035 | | | | 11,305 | | |
Lam Research Corp.
2.80%, due 06/15/21 | | | 4,910 | | | | 4,924 | | |
Motorola Solutions, Inc.
4.60%, due 02/23/28 | | | 2,985 | | | | 3,396 | | |
NortonLifeLock, Inc.,144A
5.00%, due 04/15/25 (f) | | | 1,000 | | | | 1,013 | | |
Tyco Electronics Group SA
3.70%, due 02/15/26 | | | 9,830 | | | | 10,754 | | |
| | | | | | 108,496 | | |
ENERGY - 1.2% | |
Apergy Corp.
6.375%, due 05/01/26 | | | 16,119 | | | | 16,885 | | |
Diamondback Energy, Inc.
3.125%, due 03/24/31 | | | 7,250 | | | | 7,221 | | |
4.75%, due 05/31/25 | | | 2,900 | | | | 3,239 | | |
NOV, Inc.
3.60%, due 12/01/29 | | | 24,835 | | | | 24,960 | | |
Occidental Petroleum Corp.
3.50%, due 08/15/29 | | | 6,945 | | | | 6,511 | | |
Oceaneering International, Inc.
4.65%, due 11/15/24 | | | 4,005 | | | | 3,865 | | |
See accompanying Notes to Financial Statements.
Oakmark.com 41
Oakmark Equity and Income Fund March 31, 2021 (Unaudited)
Schedule of Investments (in thousands) (continued)
| | | Par Value | | Value | |
FIXED INCOME - 25.4% (continued) | |
CORPORATE BONDS - 17.6% (continued) | |
Parsley Energy LLC / Parsley
Finance Corp, 144A
4.125%, due 02/15/28 (f) | | $ | 18,076 | | | $ | 19,138 | | |
Schlumberger Holdings Corp., 144A
4.00%, due 12/21/25 (f) | | | 9,830 | | | | 10,870 | | |
Valero Energy Corp.
2.85%, due 04/15/25 | | | 2,975 | | | | 3,109 | | |
| | | | | | 95,798 | | |
COMMUNICATION SERVICES - 1.2% | |
Netflix, Inc.
4.875%, due 04/15/28 | | | 33,740 | | | | 38,360 | | |
5.875%, due 02/15/25 | | | 11,940 | | | | 13,686 | | |
5.875%, due 11/15/28 | | | 6,965 | | | | 8,425 | | |
Netflix, Inc., 144A
5.375%, due 11/15/29 (f) | | | 4,970 | | | | 5,877 | | |
T-Mobile USA, Inc., 144A
3.75%, due 04/15/27 (f) | | | 19,855 | | | | 21,702 | | |
3.50%, due 04/15/25 (f) | | | 1,985 | | | | 2,143 | | |
Twitter, Inc., 144A
3.875%, due 12/15/27 (f) | | | 700 | | | | 734 | | |
Zayo Group Holdings, Inc., 144A
4.00%, due 03/01/27 (f) | | | 250 | | | | 246 | | |
| | | | | | 91,173 | | |
REAL ESTATE - 1.1% | |
CBRE Services, Inc.
2.50%, due 04/01/31 | | | 10,750 | | | | 10,411 | | |
GLP Capital, LP / GLP Financing II, Inc. REIT
5.375%, due 11/01/23 | | | 12,000 | | | | 13,102 | | |
4.00%, due 01/15/31 | | | 9,425 | | | | 9,740 | | |
5.75%, due 06/01/28 | | | 4,975 | | | | 5,739 | | |
5.25%, due 06/01/25 | | | 4,975 | | | | 5,577 | | |
5.375%, due 04/15/26 | | | 3,925 | | | | 4,405 | | |
MGM Growth Properties Operating
Partnership, LP / MGP Finance
Co-Issuer, Inc. REIT
5.625%, due 05/01/24 | | | 2,945 | | | | 3,161 | | |
MPT Operating Partnership, LP /
MPT Finance Corp. REIT
3.50%, due 03/15/31 | | | 3,900 | | | | 3,825 | | |
Omega Healthcare Investors, Inc. REIT
5.25%, due 01/15/26 | | | 4,982 | | | | 5,630 | | |
4.375%, due 08/01/23 | | | 3,098 | | | | 3,327 | | |
The Howard Hughes Corp., 144A
4.375%, due 02/01/31 (f) | | | 8,750 | | | | 8,569 | | |
5.375%, due 08/01/28 (f) | | | 3,400 | | | | 3,574 | | |
Ventas Realty, LP REIT
3.125%, due 06/15/23 | | | 2,490 | | | | 2,604 | | |
3.50%, due 02/01/25 | | | 900 | | | | 971 | | |
| | | | | | 80,635 | | |
HEALTH CARE - 0.8% | |
AbbVie, Inc.
2.95%, due 11/21/26 | | | 6,955 | | | | 7,405 | | |
Centene Corp.
4.25%, due 12/15/27 | | | 2,980 | | | | 3,133 | | |
| | | Par Value | | Value | |
Charles River Laboratories
International, Inc., 144A
4.00%, due 03/15/31 (f) | | $ | 1,350 | | | $ | 1,372 | | |
Cigna Corp.
2.375%, due 03/15/31 | | | 5,850 | | | | 5,752 | | |
CVS Health Corp.
5.00%, due 12/01/24 | | | 6,880 | | | | 7,791 | | |
HCA, Inc.
5.625%, due 09/01/28 | | | 2,985 | | | | 3,433 | | |
5.375%, due 09/01/26 | | | 500 | | | | 564 | | |
IQVIA, Inc., 144A
5.00%, due 10/15/26 (f) | | | 7,800 | | | | 8,102 | | |
Johnson & Johnson
1.30%, due 09/01/30 | | | 915 | | | | 858 | | |
Perrigo Finance Unlimite Co.
3.15%, due 06/15/30 | | | 1,050 | | | | 1,030 | | |
Regeneron Pharmaceuticals, Inc.
1.75%, due 09/15/30 | | | 5,950 | | | | 5,499 | | |
Universal Health Services, Inc., 144A
5.00%, due 06/01/26 (f) | | | 8,325 | | | | 8,533 | | |
Zimmer Biomet Holdings, Inc.
3.05%, due 01/15/26 | | | 4,965 | | | | 5,301 | | |
3.15%, due 04/01/22 | | | 3,810 | | | | 3,893 | | |
| | | | | | 62,666 | | |
MATERIALS - 0.3% | |
Anglo American Capital PLC, 144A
2.25%, due 03/17/28 (f) | | | 3,750 | | | | 3,700 | | |
Glencore Funding LLC, 144A
3.875%, due 10/27/27 (f) | | | 9,950 | | | | 10,915 | | |
3.00%, due 10/27/22 (f) | | | 9,950 | | | | 10,268 | | |
| | | | | | 24,883 | | |
CONSUMER STAPLES - 0.3% | |
Altria Group, Inc.
2.45%, due 02/04/32 | | | 10,750 | | | | 10,215 | | |
Philip Morris International, Inc.
1.75%, due 11/01/30 | | | 2,970 | | | | 2,777 | | |
Post Holdings, Inc., 144A
5.75%, due 03/01/27 (f) | | | 500 | | | | 526 | | |
Smithfield Foods, Inc., 144A
3.35%, due 02/01/22 (f) | | | 4,975 | | | | 5,074 | | |
2.65%, due 10/03/21 (f) | | | 3,980 | | | | 4,010 | | |
4.25%, due 02/01/27 (f) | | | 995 | | | | 1,096 | | |
Sysco Corp.
5.65%, due 04/01/25 | | | 995 | | | | 1,157 | | |
| | | | | | 24,855 | | |
Total Corporate Bonds
(Cost $1,295,938) | | | | | 1,367,125 | | |
GOVERNMENT AND AGENCY SECURITIES - 6.8% | |
U.S. GOVERNMENT NOTES - 6.5% | |
United States Treasury Notes
2.125%, due 08/15/21 | | | 250,000 | | | | 251,934 | | |
2.00%, due 11/30/22 | | | 74,625 | | | | 76,922 | | |
1.75%, due 03/31/22 | | | 74,645 | | | | 75,881 | | |
2.125%, due 12/31/22 | | | 49,745 | | | | 51,451 | | |
1.875%, due 11/30/21 | | | 49,785 | | | | 50,388 | | |
| | | | | | 506,576 | | |
See accompanying Notes to Financial Statements.
42 OAKMARK FUNDS
Oakmark Equity and Income Fund March 31, 2021 (Unaudited)
Schedule of Investments (in thousands) (continued)
| | | Par Value | | Value | |
FIXED INCOME - 25.4% (continued) | |
GOVERNMENT AND AGENCY SECURITIES - 6.8% (continued) | |
U.S. GOVERNMENT AGENCIES - 0.3% | |
Federal Farm Credit Banks Funding Corp.,
0.37%, due 04/13/23 | | $ | 25,000 | | | $ | 24,985 | | |
Total Government and Agency Securities
(Cost $525,128) | | | | | 531,561 | | |
BANK LOANS - 1.0% | |
INDUSTRIALS - 0.3% | |
Skymiles IP, Ltd. 2020 Term Loan B
4.75% (1 mo. USD LIBOR + 3.750%),
due 10/20/27 (d) | | | 11,000 | | | | 11,539 | | |
US Foods, Inc. 2016 Term Loan B
1.87% (1 mo. USD LIBOR + 1.750%),
due 06/27/23 (d) | | | 9,948 | | | | 9,807 | | |
| | | | | | 21,346 | | |
FINANCIALS - 0.2% | |
Blackstone Mortgage Trust, Inc. Term Loan B
0.00%, due 04/23/26 (g) | | | 16,959 | | | | 16,747 | | |
ENERGY - 0.2% | |
Apergy Corp. 2020 Term Loan
6.00% (3 mo. USD LIBOR + 5.000%),
due 06/03/27 (d) | | | 13,186 | | | | 13,417 | | |
MATERIALS - 0.2% | |
Asplundh Tree Expert LLC 2021 Term Loan B
0.00%, due 09/07/27 (g) | | | 12,000 | | | | 11,961 | | |
HEALTH CARE - 0.1% | |
HCA, Inc. Term Loan B13
1.87% (1 mo. USD LIBOR + 1.750%),
due 03/18/26 (d) | | | 4,937 | | | | 4,933 | | |
HCA, Inc. Term Loan B12
1.87% (1 mo. USD LIBOR + 1.750%),
due 03/13/25 (d) | | | 4,165 | | | | 4,160 | | |
CONSUMER DISCRETIONARY - 0.0% (e) | |
Rent-A-Center, Inc. 2021 Term Loan B
4.75% (1 mo. USD LIBOR + 4.000%),
due 02/17/28 (d) | | | 1,000 | | | | 1,004 | | |
Total Bank Loans
(Cost $73,078) | | | | | 73,568 | | |
TOTAL FIXED INCOME - 25.4%
(COST $1,894,144) | | | | | 1,972,254 | | |
SHORT-TERM INVESTMENTS - 6.1% | |
REPURCHASE AGREEMENT - 5.8% | |
Fixed Income Clearing Corp. Repurchase
Agreement, 0.00% dated 03/31/21 due
04/01/21, repurchase price $453,183
collateralized by United States Treasury
Notes, 0.125% - 1.750%
due 03/31/23 - 12/31/24, aggregate
value plus accrued interest of $462,246
(Cost: $453,183) | | | 453,183 | | | | 453,183 | | |
| | | Par Value | | Value | |
COMMERCIAL PAPER - 0.3% | |
Walgreens Boots, 144A,
0.23%, due 04/30/21 (f) (h)
(Cost $22,496) | | $ | 22,500 | | | $ | 22,496 | | |
TOTAL SHORT-TERM INVESTMENTS - 6.1%
(COST $475,679) | | | | | 475,679 | | |
TOTAL INVESTMENTS - 100.4%
(COST $4,947,312) | | | | | 7,796,068 | | |
Foreign Currencies - 0.0% (e) | | | | | 0 | (i) | |
Liabilities In Excess of Other Assets - (0.4)% | | | | | (32,728 | ) | |
NET ASSETS - 100.0% | | | | $ | 7,763,340 | | |
(a) Non-income producing security
(b) Sponsored American Depositary Receipt
(c) Security is perpetual and has no stated maturity date.
(d) Floating Rate Note. Rate shown is as of March 31, 2021.
(e) Amount rounds to less than 0.1%.
(f) Security exempt from registration under Rule 144A of the Securities Act of 1933, as amended. These securities may be resold, normally only to qualified institutional buyers.
(g) This position represents an unsettled loan commitment at period end. Certain details associated with this purchase are not known prior to the settlement date, including coupon rate, which will be adjusted on settlement date.
(h) The rate shown represents the annualized yield at the time of purchase; not a coupon rate.
(i) Amount rounds to less than $1,000.
Abbreviations:
REIT: Real Estate Investment Trust
See accompanying Notes to Financial Statements.
Oakmark.com 43
Oakmark Bond Fund March 31, 2021
Summary Information
PERFORMANCE
| | | | Average Annual Total Returns (as of 03/31/21) | | | |
| (Unaudited) | | Total Return
Last 3 Months | | 1-year | | 3-year | | 5-year | | 10-year | | Since
Inception | | Inception
Date | |
Oakmark Bond Fund (Institutional Class) | | | -1.08 | % | | | N/A | | | | N/A | | | | N/A | | | | N/A | | | | 3.77 | % | | 06/10/20 | |
Bloomberg Barclays U.S. Aggregate Bond Index20 | | | -3.37 | % | | | N/A | | | | N/A | | | | N/A | | | | N/A | | | | -1.71 | % | | | |
Lipper Core Plus Bond Fund Index21 | | | -2.44 | % | | | N/A | | | | N/A | | | | N/A | | | | N/A | | | | 0.90 | % | | | |
Oakmark Bond Fund (Advisor Class) | | | -1.20 | % | | | N/A | | | | N/A | | | | N/A | | | | N/A | | | | 3.60 | % | | 06/10/20 | |
Oakmark Bond Fund (R6 Class) | | | -1.15 | % | | | N/A | | | | N/A | | | | N/A | | | | N/A | | | | -0.57 | % | | 12/15/20 | |
The table above does not reflect the deduction of taxes that a shareholder would pay on Fund distributions or the redemption of Fund shares.
Past performance is no guarantee of future results. The performance data quoted represents past performance. Current performance may be lower or higher than the performance data quoted. Total return includes change in share prices and, in each case, includes reinvestment of dividends and capital gain distributions. The investment return and principal value vary so that an investor's shares, when redeemed, may be worth more or less than the original cost. To obtain the most recent month-end performance, please visit Oakmark.com.
TOP TEN FIXED INCOME HOLDINGS6 | | % of Net Assets | |
Fed Farm Credit CC 06/21 0.320% due 12/23/24 | | | 5.6 | | |
US Treasury Note 0.375% due 03/31/22 | | | 4.5 | | |
Fed Farm Credit CC 09/21 0.360% due 09/24/24 | | | 4.4 | | |
US Treasury Note 0.250% due 05/31/25 | | | 4.4 | | |
Fed Home Ln Bks CC20 0.440% due 06/29/23 | | | 4.1 | | |
Netflix 5.500% due 02/15/22 | | | 2.4 | | |
Marriott CC 11/23 4.150% due 12/01/23 | | | 1.8 | | |
Netflix 5.750% due 03/01/24 | | | 1.7 | | |
T/Mobile CC 03/22 4.000% due 04/15/22 | | | 1.4 | | |
Southwest Airlines CC 04/27 5.125% due 06/15/27 | | | 1.3 | | |
FUND STATISTICS | |
Ticker* | | OANCX | |
Number of Fixed Income Holdings | | 81 | |
Net Assets | | $89.3 million | |
Weighted Average Maturity | | 8.2 years | |
Effective Duration | | 5.4 years | |
30-Day SEC Yield-Unsubsidized*@ | | 1.06% | |
30-Day SEC Yield-Subsidized*@ | | 1.43% | |
Gross Expense Ratio - Institutional Class (as of 12/15/20)* | | 2.82% | |
Net Expense Ratio - Institutional Class (as of 12/15/20)*+ | | 0.59% | |
* This information is related to the Institutional Class. Please visit Oakmark.com for information related to the Advisor and R6 Classes.
+ Data has been annualized.
@ SEC Yield is an annualization of the Fund's net investment income for the trailing 30-day period. Dividends paid by the Fund may be higher or lower than implied by the SEC Yield.
SECTOR ALLOCATION | | % of Net Assets | |
Corporate Bonds | | | 60.1 | | |
U.S. Government Agencies | | | 14.1 | | |
U.S. Government Notes | | | 10.4 | | |
Bank Loans | | | 6.7 | | |
Preferred Stock | | | 2.2 | | |
Short-Term Investments and Other | | | 6.5 | | |
See accompanying Disclosures and Endnotes on page 96.
44 OAKMARK FUNDS
Oakmark Bond Fund March 31, 2021
Portfolio Manager Commentary


M. Colin Hudson, CFA
Portfolio Manager
Adam D. Abbas
Portfolio Manager
The prevailing sentiment surrounding rates is scary stuff. The most common threads read like a collection of nightmares from the Fed's past: stark warnings of runaway inflation, taper tantrums and lost credibility are the most popular. Low-probability events like these can cause large problems across financial markets, but it's important to frame the current risks properly. We are skeptical that all of today's prognosticators have investors' best interests at heart. Instead, many are driven by ratings, clicks, views, likes and retweets. And in a world where competition for attention grows every day, you better project something riveting if you want to get noticed, even if your prediction isn't very likely. In this environment, compelling doomsday forecasts proliferate, while far more likely scenarios receive much less coverage than they should. So, in Oakmark fashion, we'll take this opportunity to offer a counterbalance to the fever-pitch analysis that's dominating today's news and make some more measured comments on rates and inflation.
Rates are doing exactly what one would hope at the beginning of a sustainable recovery. As painful as the rate moves have been for bond returns, nothing about the degree of the rate rise has been unusual. In fact, since 1990, every meaningful U.S. economic contraction (defined by a GDP contraction of >1.5%) has been quickly followed by large, short bursts in rates. Specifically, following the four most recent recessionary periods prior to 2020, the U.S. 10-year Treasury rates rose an average of about 150 basis points within the first four quarters of the expansion. [See Table 1.] Today, four quarters after the Covid-19-related
sudden stop to the economy, the magnitude of the current 10-year upswing falls short of the average, reaching 107 basis points. What's more, previous jumps in rates like this have not derailed the markets. In fact, it's been quite the contrary. In the three to five years following such increases, most major asset classes, including investment grade credit, high yield credit and equities, to name a few, have experienced above-average returns.
Table 1: Large bursts in 10-year U.S. rates are normal after periods of economic contraction and precede strong periods of market returns

Source: Harris Associates, Bloomberg as of 03/31/21
And inflationary risks might be overblown. Today, we hear a lot about how we may be approaching the same kind of runaway inflation experienced in the 1970s. The basic thesis is that unprecedented amounts of both monetary and fiscal stimulus, combined with
See accompanying Disclosures and Endnotes on page 96.
Oakmark.com 45
Oakmark Bond Fund March 31, 2021
Portfolio Manager Commentary (continued)
a more reactionary approach to monetary policy by the Fed, will eventually undermine the central bank's ability to anchor expectations, causing prices to increase uncontrollably. Yet, if we've learned anything from the past two decades, it's that major structural differences in the modern economy and a vastly more intelligent central banking system have produced much shorter inflationary periods. Current data continue to indicate that inflationary risks are limited and recent fears about inflation are more rooted in fear than in reality. For example, today, the U.S. core PCE22 is approximately 1.4%; Europe, Japan and Chinese core runs even weaker at 1%, 0.3% and 0%, respectively. U.S. breakevens tell a similarly benign story, stalling out despite several significant catalysts, including a new multi-trillion infrastructure plan, positive reopening news and very strong employment reports. Sure, prices will likely spike across several categories as we move into summer, but inflation does not get out of control due to isolated, temporary spikes over a few months. Instead, it requires sustained upward price pressure over multiple quarters, if not years. It must be long enough to embed a fundamental, widespread change in marketplace psychology.
A lift in yields at the beginning of a recovery should be welcomed, not feared. Rates are a friend, not foe, when they reflect a positive inflection in the potential real growth of an economy and prices are relatively well-anchored. Of course, increasing rates during an economic recovery will inevitably cause some volatility and disruption. We should expect more of these periods over the coming quarters, though we expect they will be brief. When they occur, it will be critical to lean on the data, rather than emotional reactions, to evaluate the risk. Talk of hyper-inflationary risk appears to only be growing louder and alarms have been sounded time and time again over the past two decades only to leave investors disappointed. It may serve as a less catchy story, but we think they could be disappointed again.
Performance and Outlook
The Oakmark Bond Fund returned -1.08% year to date through March 31, 2021, and generated 229 basis points of excess returns versus its benchmark, the Bloomberg Barclays U.S. Aggregate Index,20. Inception-to-date performance was 3.77% through March 31, 2021, generating excess return against the benchmark of 548 basis points.
The Fund's outperformance continues to be driven by the portfolio's overweight allocation to corporate credit, our short curve positioning and security selection. Specifically, during the quarter, our corporate ownership averaged 58% compared to the benchmark average of 28%. Recent credit spread tightening especially helped our corporate holdings. We maintain shorter curve positioning because we continue to believe that rates will increase. At the end of the quarter, the duration in the portfolio was a full 1.0 years below the benchmark, averaging 5.4 years, compared to the benchmark's 6.4 year average duration. The last main contributor to the Fund's outperformance came from security selection, including Chesapeake Energy, Broadcom Inc. 3.5 2/15/41 and Range Resources 8.25 1/15/29. We remain conservative about security quality. Currently, about 10% of the Fund's corporate holdings are "A" rated credit or higher, 25% are "BBB," 18% of corporates in BB, and just 4% of the overall portfolio in B or below rated credit. We are also underweight in volatile sectors, like basic materials and energy. During the quarter, we decreased our exposure to lower rated credit as
spreads contracted and portfolio duration was modestly increased when yields increased.
Outlook and Positioning
Despite a rather dramatic backdrop for fixed income in the first quarter, we ended the period with a consistent approach to positioning. We maintained an overweight position in corporate credit risk, an underweight position in duration and a modest overweight to the short end of the yield curve. Looking forward, we believe corporate credit should perform well—especially relative to rates—and we expect growing economic tailwinds to maintain downward pressure on corporate default risk. As we highlighted in our opening commentary (https://oakmark.com/news-insights/oakmark-bond-fund-fourth-quarter-2020/), we think that even as rates return to more normal levels, they can continue to support healthy markets and we believe that the risks of central banks losing control remain low. That being said, there are several risks that warrant careful observation in the second quarter. We will continue to monitor key price metrics heading into the summer, especially to make sure that rate spikes are absorbed and inflation expectations remain relatively well anchored at just above 2%. Also, Fed tapering will likely become more topical, so we will carefully examine even the slightest changes in Powell's positioning. At the company level, capital structures now offer little in the way of covenant protection and wide-open capital markets are allowing fundamentally challenged companies to access debt markets. Because of these significant risks, our focus on bottom-up research remains critical.
See accompanying Disclosures and Endnotes on page 96.
46 OAKMARK FUNDS
Oakmark Bond Fund March 31, 2021 (Unaudited)
Schedule of Investments (in thousands)
| | | Shares | | Value | |
PREFERRED STOCKS - 2.2% | |
FINANCIALS - 0.8% | |
Signature Bank/New York NY (a), 5.00% | | | 20 | | | $ | 515 | | |
GMAC Capital Trust I (b), 5.98%
(3 mo. USD LIBOR + 5.785%) | | | 8 | | | | 216 | | |
| | | | | | 731 | | |
COMMUNICATION SERVICES - 0.7% | |
Liberty Broadband Corp. (a), 7.00% | | | 25 | | | | 655 | | |
CONSUMER STAPLES - 0.7% | |
Bunge, Ltd. (a), 4.88% | | | 5 | | | | 579 | | |
TOTAL PREFERRED STOCKS - 2.2%
(COST $1,839) | | | | | 1,965 | | |
| | | Par Value | | Value | |
FIXED INCOME - 91.3% | |
CORPORATE BONDS - 60.1% | |
INDUSTRIALS - 11.4% | |
BAT Capital Corp.
2.259%, due 03/25/28 | | $ | 1,000 | | | | 984 | | |
Delta Air Lines, Inc. / SkyMiles IP, Ltd, 144A
4.75%, due 10/20/28 (c) | | | 1,000 | | | | 1,087 | | |
Fedex Corp. Pass Through Trust
1.875%, due 08/20/35 | | | 973 | | | | 942 | | |
Hilton Domestic Operating Co., Inc., 144A
3.625%, due 02/15/32 (c) | | | 1,000 | | | | 971 | | |
Howmet Aerospace, Inc.
6.875%, due 05/01/25 | | | 750 | | | | 869 | | |
Kraft Heinz Foods Co.
3.875%, due 05/15/27 | | | 500 | | | | 547 | | |
Lennox International, Inc.
1.70%, due 08/01/27 | | | 1,000 | | | | 983 | | |
Southwest Airlines Co.
5.125%, due 06/15/27 | | | 1,000 | | | | 1,149 | | |
The Boeing Co.
2.70%, due 02/01/27 | | | 750 | | | | 761 | | |
Uber Technologies, Inc., 144A
7.50%, due 09/15/27 (c) | | | 1,000 | | | | 1,105 | | |
United Rentals North America, Inc.
3.875%, due 02/15/31 | | | 500 | | | | 503 | | |
US Foods, Inc., 144A
4.75%, due 02/15/29 (c) | | | 250 | | | | 250 | | |
| | | | | | 10,151 | | |
CONSUMER DISCRETIONARY - 10.9% | |
Aramark Services, Inc, 144A
5.00%, due 02/01/28 (c) | | | 500 | | | | 519 | | |
Booking Holdings, Inc.
3.55%, due 03/15/28 | | | 1,000 | | | | 1,092 | | |
BorgWarner, Inc.
2.65%, due 07/01/27 | | | 750 | | | | 778 | | |
CCO Holdings LLC / CCO Holdings
Capital Corp., 144A
4.25%, due 02/01/31 (c) | | | 500 | | | | 501 | | |
Lithia Motors, Inc., 144A
4.375%, due 01/15/31 (c) | | | 750 | | | | 779 | | |
| | | Par Value | | Value | |
M/I Homes, Inc.
4.95%, due 02/01/28 | | $ | 500 | | | $ | 518 | | |
Marriott International, Inc.
4.15%, due 12/01/23 | | | 1,500 | | | | 1,613 | | |
4.625%, due 06/15/30 | | | 750 | | | | 839 | | |
3.125%, due 06/15/26 | | | 250 | | | | 261 | | |
MGM Resorts International
4.75%, due 10/15/28 | | | 500 | | | | 516 | | |
Rent-A-Center, Inc., 144A
6.375%, due 02/15/29 (c) | | | 500 | | | | 530 | | |
The Home Depot, Inc.
2.375%, due 03/15/51 | | | 1,000 | | | | 855 | | |
Tractor Supply Co.
1.75%, due 11/01/30 | | | 1,000 | | | | 922 | | |
| | | | | | 9,723 | | |
HEALTH CARE - 9.4% | |
AbbVie, Inc.
2.95%, due 11/21/26 | | | 750 | | | | 799 | | |
Charles River Laboratories
International, Inc., 144A
4.00%, due 03/15/31 (c) | | | 1,000 | | | | 1,017 | | |
Cigna Corp.
2.375%, due 03/15/31 | | | 1,000 | | | | 983 | | |
Emergent BioSolutions, Inc., 144A
3.875%, due 08/15/28 (c) | | | 250 | | | | 244 | | |
Johnson & Johnson
1.30%, due 09/01/30 | | | 1,000 | | | | 938 | | |
Merck & Co, Inc.
1.45%, due 06/24/30 | | | 1,000 | | | | 946 | | |
Perrigo Finance Unlimite Co.
3.15%, due 06/15/30 | | | 750 | | | | 736 | | |
Regeneron Pharmaceuticals, Inc.
1.75%, due 09/15/30 | | | 1,250 | | | | 1,155 | | |
Tenet Healthcare Corp, 144A
6.125%, due 10/01/28 (c) | | | 500 | | | | 521 | | |
Zimmer Biomet Holdings, Inc.
3.55%, due 03/20/30 | | | 1,000 | | | | 1,068 | | |
| | | | | | 8,407 | | |
FINANCIALS - 9.1% | |
Credit Suisse Group AG
7.50% (USD 5 Year
Swap rate + 4.600%) (a) (b) (c) | | | 250 | | | | 264 | | |
LPL Holdings, Inc., 144A
4.00%, due 03/15/29 (c) | | | 1,000 | | | | 1,007 | | |
Nasdaq, Inc.
1.65%, due 01/15/31 | | | 1,000 | | | | 915 | | |
Pershing Square Holdings, Ltd, 144A
3.25%, due 11/15/30 (c) | | | 1,000 | | | | 979 | | |
Reinsurance Group of America, Inc.
3.15%, due 06/15/30 | | | 1,000 | | | | 1,034 | | |
Signature Bank/New York NY
4.00% (AMERIBOR + 3.890%),
due 10/15/30 (b) | | | 1,000 | | | | 1,031 | | |
SVB Financial Group
4.10% (10 year Treasury
Constant Maturity
Rate + 3.064%) (a) (b) | | | 1,000 | | | | 1,006 | | |
See accompanying Notes to Financial Statements.
Oakmark.com 47
Oakmark Bond Fund March 31, 2021 (Unaudited)
Schedule of Investments (in thousands) (continued)
| | | Par Value | | Value | |
FIXED INCOME - 91.3% (continued) | |
CORPORATE BONDS - 60.1% (continued) | |
US Bancorp
1.375%, due 07/22/30 | | $ | 1,000 | | | $ | 924 | | |
Wells Fargo & Co.
1.654% (SOFRRATE + 1.600%),
due 06/02/24 (b) | | | 1,000 | | | | 1,022 | | |
| | | | | | 8,182 | | |
COMMUNICATION SERVICES - 6.1% | |
Netflix, Inc.
5.50%, due 02/15/22 | | | 2,000 | | | | 2,080 | | |
5.75%, due 03/01/24 | | | 1,385 | | | | 1,553 | | |
4.875%, due 04/15/28 | | | 500 | | | | 569 | | |
T-Mobile USA, Inc.
4.00%, due 04/15/22 | | | 1,211 | | | | 1,232 | | |
| | | | | | 5,434 | | |
REAL ESTATE - 3.7% | |
CBRE Services, Inc.
2.50%, due 04/01/31 | | | 1,000 | | | | 968 | | |
GLP Capital, LP / GLP Financing II, Inc. REIT
4.00%, due 01/15/31 | | | 500 | | | | 517 | | |
MPT Operating Partnership, LP /
MPT Finance Corp. REIT
3.50%, due 03/15/31 | | | 1,000 | | | | 981 | | |
The Howard Hughes Corp., 144A
4.375%, due 02/01/31 (c) | | | 250 | | | | 245 | | |
Ventas Realty, LP / Ventas Capital Corp. REIT
3.25%, due 08/15/22 | | | 590 | | | | 607 | | |
| | | | | | 3,318 | | |
ENERGY - 3.2% | |
Chesapeake Energy Corp, 144A
5.875%, due 02/01/29 (c) | | | 1,000 | | | | 1,060 | | |
Diamondback Energy, Inc.
3.125%, due 03/24/31 | | | 500 | | | | 498 | | |
NOV, Inc.
3.60%, due 12/01/29 | | | 750 | | | | 754 | | |
Parsley Energy LLC / Parsley
Finance Corp, 144A
4.125%, due 02/15/28 (c) | | | 500 | | | | 529 | | |
| | | | | | 2,841 | | |
CONSUMER STAPLES - 3.0% | |
Altria Group, Inc.
2.45%, due 02/04/32 | | | 1,000 | | | | 950 | | |
Philip Morris International, Inc.
1.75%, due 11/01/30 | | | 1,000 | | | | 935 | | |
Sysco Corp.
3.30%, due 07/15/26 | | | 750 | | | | 807 | | |
| | | | | | 2,692 | | |
MATERIALS - 1.7% | |
Anglo American Capital PLC, 144A
2.25%, due 03/17/28 (c) | | | 1,000 | | | | 987 | | |
Kraton Polymers LLC / Kraton Polymers
Capital Corp, 144A
4.25%, due 12/15/25 (c) | | | 500 | | | | 502 | | |
| | | | | | 1,489 | | |
| | | Par Value | | Value | |
INFORMATION TECHNOLOGY - 1.6% | |
Apple, Inc.
2.65%, due 02/08/51 | | $ | 1,000 | | | $ | 911 | | |
CDW LLC / CDW Finance Corp.
4.125%, due 05/01/25 | | | 500 | | | | 520 | | |
| | | | | | 1,431 | | |
Total Corporate Bonds
(Cost $53,434) | | | | | 53,668 | | |
GOVERNMENT AND AGENCY SECURITIES - 24.5% | |
U.S. GOVERNMENT AGENCIES - 14.1% | |
Federal Farm Credit Banks Funding Corp.
0.32%, due 12/23/24 | | | 5,000 | | | | 4,955 | | |
0.36%, due 09/24/24 | | | 4,000 | | | | 3,973 | | |
Federal Home Loan Bank,
0.44%, due 06/29/23 | | | 3,658 | | | | 3,658 | | |
| | | | | | 12,586 | | |
U.S. GOVERNMENT NOTES - 10.4% | |
United States Treasury Notes
0.375%, due 03/31/22 | | | 4,000 | | | | 4,011 | | |
0.25%, due 05/31/25 | | | 4,000 | | | | 3,923 | | |
0.875%, due 11/15/30 | | | 1,000 | | | | 924 | | |
1.125%, due 02/15/31 | | | 500 | | | | 472 | | |
| | | | | | 9,330 | | |
Total Government and Agency Securities
(Cost $22,114) | | | | | 21,916 | | |
BANK LOANS - 6.7% | |
INDUSTRIALS - 3.4% | |
Skymiles IP, Ltd. 2020 Term Loan B
4.75% (1 mo. USD LIBOR + 3.750%),
due 10/20/27 (b) | | | 1,000 | | | | 1,049 | | |
US Foods, Inc. 2016 Term Loan B
1.87% (1 mo. USD LIBOR + 1.750%),
due 06/27/23 (b) | | | 995 | | | | 981 | | |
Asplundh Tree Expert LLC 2021 Term Loan B
0.00%, due 09/07/27 (d) | | | 1,000 | | | | 997 | | |
| | | | | | 3,027 | | |
CONSUMER DISCRETIONARY - 1.1% | |
Rent-A-Center, Inc. 2021 Term Loan B 4.75%
(1 mo. USD LIBOR + 4.00%),
due 02/17/28 (b) | | | 1,000 | | | | 1,004 | | |
FINANCIALS - 1.1% | |
Blackstone Mortgage Trust, Inc. Term Loan B
0.00%, due 04/23/26 (d) | | | 1,000 | | | | 988 | | |
ENERGY - 1.1% | |
Apergy Corp. 2020 Term Loan
6.00% (3 mo. USD LIBOR + 5.00%),
due 06/03/27 (b) | | | 963 | | | | 979 | | |
Total Bank Loans
(Cost $5,929) | | | | | 5,998 | | |
TOTAL FIXED INCOME - 91.3%
(COST $81,477) | | | | | 81,582 | | |
See accompanying Notes to Financial Statements.
48 OAKMARK FUNDS
Oakmark Bond Fund March 31, 2021 (Unaudited)
Schedule of Investments (in thousands) (continued)
| | | Par Value | | Value | |
SHORT-TERM INVESTMENTS - 8.5% | |
REPURCHASE AGREEMENT - 8.5% | |
Fixed Income Clearing Corp. Repurchase
Agreement, 0.00% dated 03/31/21 due
04/01/21, repurchase price $7,563,
collateralized by United States
Treasury Note, 0.125% due 03/31/23,
value plus accrued interest of $7,714
(Cost: $7,563) | | $ | 7,563 | | | $ | 7,563 | | |
TOTAL SHORT-TERM INVESTMENTS - 8.5%
(COST $7,563) | | | | | 7,563 | | |
TOTAL INVESTMENTS - 102.0%
(COST $90,879) | | | | | 91,110 | | |
Liabilities In Excess of Other Assets - (2.0)% | | | | | (1,808 | ) | |
NET ASSETS - 100.0% | | | | $ | 89,302 | | |
(a) Security is perpetual and has no stated maturity date.
(b) Floating Rate Note. Rate shown is as of March 31, 2021.
(c) Security exempt from registration under Rule 144A of the Securities Act of 1933, as amended. These securities may be resold, normally only to qualified institutional buyers.
(d) This position represents an unsettled loan commitment at period end. Certain details associated with this purchase are not known prior to the settlement date, including coupon rate, which will be adjusted on settlement date.
Abbreviations:
REIT: Real Estate Investment Trust
See accompanying Notes to Financial Statements.
Oakmark.com 49
Oakmark Funds
Statements of Assets and Liabilities—March 31, 2021 (Unaudited)
(in thousands except per share amounts)
| | | Oakmark
Fund | | Oakmark
Select
Fund | | Oakmark
Global
Fund | | Oakmark
Global Select
Fund | |
Assets | |
Investments in unaffiliated securities, at value (a) | | $ | 15,246,516 | | | $ | 4,799,248 | | | $ | 1,565,779 | | | $ | 1,635,190 | | |
Investments in affiliated securities, at value (b) | | | 0 | | | | 0 | | | | 0 | | | | 0 | | |
Cash | | | 0 | | | | 0 | | | | 0 | | | | 0 | | |
Foreign currency, at value (c) | | | 0 | (d) | | | 0 | | | | 0 | (d) | | | 0 | (d) | |
Receivable for: | |
Securities sold | | | 0 | | | | 0 | | | | 2,569 | | | | 0 | | |
Fund shares sold | | | 24,032 | | | | 4,517 | | | | 658 | | | | 1,142 | | |
Dividends and interest from unaffiliated securities
(Net of foreign tax withheld) | | | 8,225 | | | | 411 | | | | 796 | | | | 188 | | |
Forward foreign currency contracts | | | 0 | | | | 0 | | | | 1,259 | | | | 1,646 | | |
Tax reclaim from unaffiliated securities | | | 0 | | | | 0 | | | | 1,545 | | | | 1,489 | | |
Total receivables | | | 32,257 | | | | 4,928 | | | | 6,827 | | | | 4,465 | | |
Other assets | | | 88 | | | | 23 | | | | 7 | | | | 8 | | |
Total assets | | $ | 15,278,861 | | | $ | 4,804,199 | | | $ | 1,572,613 | | | $ | 1,639,663 | | |
Liabilities and net assets | |
Payable for: | |
Securities purchased | | | 0 | | | | 0 | | | | 375 | | | | 0 | | |
Fund shares redeemed | | | 12,762 | | | | 2,089 | | | | 4,736 | | | | 4,480 | | |
Options written, at value | | | 40,996 | (e) | | | 25,843 | (e) | | | 0 | | | | 0 | | |
Investment advisory fee | | | 1,784 | | | | 650 | | | | 241 | | | | 242 | | |
Transfer agent fees | | | 1,076 | | | | 442 | | | | 128 | | | | 101 | | |
Trustee fees | | | 13 | | | | 7 | | | | 6 | | | | 8 | | |
Deferred trustee compensation | | | 1,365 | | | | 571 | | | | 334 | | | | 254 | | |
Other | | | 2,221 | | | | 575 | | | | 1,286 | | | | 290 | | |
Total liabilities | | | 60,217 | | | | 30,177 | | | | 7,106 | | | | 5,375 | | |
Net assets applicable to Fund shares outstanding | | $ | 15,218,644 | | | $ | 4,774,022 | | | $ | 1,565,507 | | | $ | 1,634,288 | | |
Analysis of net assets | |
Paid in capital | | $ | 6,813,402 | | | $ | 2,151,647 | | | $ | 905,121 | | | $ | 1,072,347 | | |
Distributable Earnings | | | 8,405,242 | | | | 2,622,375 | | | | 660,386 | | | | 561,941 | | |
Net assets applicable to Fund shares outstanding | | $ | 15,218,644 | | | $ | 4,774,022 | | | $ | 1,565,507 | | | $ | 1,634,288 | | |
Price of shares | |
Net asset value, offering and redemption price
per share: Investor Class | | $ | 104.11 | | | $ | 55.80 | | | $ | 35.49 | | | $ | 23.26 | | |
Investor Class—Net assets | | $ | 7,905,972 | | | $ | 1,838,771 | | | $ | 827,055 | | | $ | 599,467 | | |
Investor Class—Shares outstanding (Unlimited
shares authorized) | | | 75,940 | | | | 32,954 | | | | 23,305 | | | | 25,768 | | |
Net asset value, offering and redemption price
per share: Advisor Class | | $ | 104.09 | | | $ | 55.70 | | | $ | 35.49 | | | $ | 23.24 | | |
Advisor Class—Net assets | | $ | 4,595,074 | | | $ | 2,127,012 | | | $ | 299,361 | | | $ | 519,473 | | |
Advisor Class—Shares outstanding (Unlimited
shares authorized) | | | 44,146 | | | | 38,185 | | | | 8,435 | | | | 22,351 | | |
Net asset value, offering and redemption price
per share: Institutional Class | | $ | 104.13 | | | $ | 55.75 | | | $ | 35.50 | | | $ | 23.25 | | |
Institutional Class—Net assets | | $ | 1,756,669 | | | $ | 509,800 | | | $ | 335,272 | | | $ | 380,648 | | |
Institutional Class—Shares outstanding (Unlimited
shares authorized) | | | 16,870 | | | | 9,144 | | | | 9,445 | | | | 16,370 | | |
Net asset value, offering and redemption price
per share: Service Class | | $ | 103.73 | (f) | | $ | 55.02 | (f) | | $ | 34.37 | (f) | | $ | 0 | | |
Service Class—Net assets | | $ | 66,475 | | | $ | 22,848 | | | $ | 10,325 | | | $ | 0 | | |
Service Class—Shares outstanding (Unlimited
shares authorized) | | | 641 | | | | 415 | | | | 300 | | | | 0 | | |
Net asset value, offering and redemption price
per share: Class R6 (g) | | $ | 104.14 | | | $ | 55.75 | (f) | | $ | 35.49 | (f) | | $ | 23.26 | | |
Class R6—Net assets | | | 894,454 | | | | 275,591 | | | | 93,494 | | | | 134,700 | | |
Class R6—Shares outstanding (Unlimited
shares authorized) | | | 8,589 | | | | 4,944 | | | | 2,634 | | | | 5,792 | | |
| (a) Identified cost of investments in unaffiliated securities. | | $ | 7,743,072 | | | $ | 2,399,463 | | | $ | 1,016,799 | | | $ | 1,190,732 | | |
| (b) Identified cost of investments in affiliated securities. | | $ | 0 | | | $ | 0 | | | $ | 0 | | | $ | 0 | | |
| (c) Identified cost of foreign currency. | | $ | 0 | (d) | | $ | 0 | | | $ | 0 | (d) | | $ | 0 | (d) | |
| (d) Amount rounds to less than $1,000. | | | | | | | | | | | | | | | | | |
| (e) Written options premiums received of $39,685 and $25,402 (in thousands) for the Oakmark Fund and the Oakmark Select Fund, respectively. | | | | | | | | | | | | | | | | | |
| (f) Net assets have been rounded for presentation purposes. The net asset value per share shown is as reported on March 31, 2021. | | | | | | | | | | | | | | | | | |
| (g) Commenced on 12/15/2020. | | | | | | | | | | | | | | | | | |
See accompanying Notes to Financial Statements.
50 OAKMARK FUNDS
| | | Oakmark
International
Fund | | Oakmark
International
Small Cap Fund | | Oakmark
Equity and
Income Fund | | Oakmark
Bond
Fund | |
Assets | |
Investments in unaffiliated securities, at value (a) | | $ | 25,928,121 | | | $ | 1,519,103 | | | $ | 7,796,068 | | | $ | 91,110 | | |
Investments in affiliated securities, at value (b) | | | 1,410,390 | | | | 0 | | | | 0 | | | | 0 | | |
Cash | | | 0 | | | | 0 | | | | 2,009 | | | | 0 | | |
Foreign currency, at value (c) | | | 7,240 | | | | 31 | | | | 0 | (d) | | | 0 | | |
Receivable for: | |
Securities sold | | | 120,051 | | | | 3,810 | | | | 171 | | | | 12 | | |
Fund shares sold | | | 52,279 | | | | 1,500 | | | | 4,704 | | | | 0 | | |
Dividends and interest from unaffiliated securities
(Net of foreign tax withheld) | | | 48,940 | | | | 5,208 | | | | 23,379 | | | | 493 | | |
Forward foreign currency contracts | | | 21,271 | | | | 1,230 | | | | 0 | | | | 0 | | |
Tax reclaim from unaffiliated securities | | | 36,369 | | | | 1,576 | | | | 1,402 | | | | 0 | | |
Total receivables | | | 278,910 | | | | 13,324 | | | | 29,656 | | | | 505 | | |
Other assets | | | 17,839 | | | | 7 | | | | 45 | | | | 1 | | |
Total assets | | $ | 27,642,500 | | | $ | 1,532,465 | | | $ | 7,827,778 | | | $ | 91,616 | | |
Liabilities and net assets | |
Payable for: | |
Securities purchased | | | 54,404 | | | | 3,051 | | | | 19,312 | | | | 2,260 | | |
Fund shares redeemed | | | 30,384 | | | | 785 | | | | 40,354 | | | | 0 | | |
Options written, at value | | | 0 | | | | 0 | | | | 0 | | | | 0 | | |
Investment advisory fee | | | 3,825 | | | | 287 | | | | 787 | | | | (19 | ) | |
Transfer agent fees | | | 1,133 | | | | 54 | | | | 831 | | | | 2 | | |
Trustee fees | | | 17 | | | | 6 | | | | 9 | | | | 4 | | |
Deferred trustee compensation | | | 2,052 | | | | 316 | | | | 1,358 | | | | 15 | | |
Other | | | 25,905 | | | | 278 | | | | 1,787 | | | | 52 | | |
Total liabilities | | | 117,720 | | | | 4,777 | | | | 64,438 | | | | 2,314 | | |
Net assets applicable to Fund shares outstanding | | $ | 27,524,780 | | | $ | 1,527,688 | | | $ | 7,763,340 | | | $ | 89,302 | | |
Analysis of net assets | |
Paid in capital | | $ | 26,634,601 | | | $ | 1,419,839 | | | $ | 3,850,937 | | | $ | 87,928 | | |
Distributable Earnings | | | 890,179 | | | | 107,849 | | | | 3,912,403 | | | | 1,374 | | |
Net assets applicable to Fund shares outstanding | | $ | 27,524,780 | | | $ | 1,527,688 | | | $ | 7,763,340 | | | $ | 89,302 | | |
Price of shares | |
Net asset value, offering and redemption price
per share: Investor Class | | $ | 28.44 | | | $ | 18.85 | | | $ | 33.77 | | | $ | 0 | | |
Investor Class—Net assets | | $ | 9,501,683 | | | $ | 521,590 | | | $ | 5,668,570 | | | $ | 0 | | |
Investor Class—Shares outstanding (Unlimited
shares authorized) | | | 334,058 | | | | 27,674 | | | | 167,871 | | | | 0 | | |
Net asset value, offering and redemption price
per share: Advisor Class | | $ | 28.39 | | | $ | 18.86 | | | $ | 33.77 | | | $ | 10.20 | (f) | |
Advisor Class—Net assets | | $ | 8,405,498 | | | $ | 209,925 | | | $ | 1,126,874 | | | $ | 1,272 | | |
Advisor Class—Shares outstanding (Unlimited
shares authorized) | | | 296,031 | | | | 11,130 | | | | 33,373 | | | | 125 | | |
Net asset value, offering and redemption price
per share: Institutional Class | | $ | 28.43 | | | $ | 18.81 | | | $ | 33.77 | | | $ | 10.21 | | |
Institutional Class—Net assets | | $ | 8,309,338 | | | $ | 724,549 | | | $ | 721,534 | | | $ | 3,022 | | |
Institutional Class—Shares outstanding (Unlimited
shares authorized) | | | 292,320 | | | | 38,519 | | | | 21,366 | | | | 296 | | |
Net asset value, offering and redemption price
per share: Service Class | | $ | 28.68 | | | $ | 18.74 | (f) | | $ | 33.62 | | | $ | 0 | | |
Service Class—Net assets | | $ | 168,710 | | | $ | 779 | | | $ | 164,696 | | | $ | 0 | | |
Service Class—Shares outstanding (Unlimited
shares authorized) | | | 5,883 | | | | 42 | | | | 4,899 | | | | 0 | | |
Net asset value, offering and redemption price
per share: Class R6 (g) | | $ | 28.43 | | | $ | 18.81 | | | $ | 33.77 | | | $ | 10.20 | | |
Class R6—Net assets | | | 1,139,551 | | | | 70,845 | | | | 81,666 | | | | 85,008 | | |
Class R6—Shares outstanding (Unlimited
shares authorized) | | | 40,083 | | | | 3,766 | | | | 2,418 | | | | 8,331 | | |
| (a) Identified cost of investments in unaffiliated securities. | | $ | 21,808,101 | | | $ | 1,257,870 | | | $ | 4,947,312 | | | $ | 90,879 | | |
| (b) Identified cost of investments in affiliated securities. | | $ | 1,806,294 | | | $ | 0 | | | $ | 0 | | | $ | 0 | | |
| (c) Identified cost of foreign currency. | | $ | 7,251 | | | $ | 31 | | | $ | 0 | (d) | | $ | 0 | | |
| (d) Amount rounds to less than $1,000. | | | | | | | | | | | | | | | |
| (e) Written options premiums received of $39,685 and $25,402 (in thousands) for the Oakmark Fund and the Oakmark Select Fund, respectively. | | | | | | | | | | | | | | | |
| (f) Net assets have been rounded for presentation purposes. The net asset value per share shown is as reported on March 31, 2021. | | | | | | | | | | | | | | | |
| (g) Commenced on 12/15/2020. | | | | | | | | | | | | | | | |
Oakmark.com 51
Oakmark Funds
Statements of Operations—March 31, 2021 (Unaudited)
(in thousands)
| | | Oakmark
Fund | | Oakmark
Select
Fund | | Oakmark
Global
Fund | | Oakmark
Global Select
Fund | |
Investment Income: | |
Dividends from unaffiliated securities | | $ | 96,585 | | | $ | 18,937 | | | $ | 6,009 | | | $ | 6,772 | | |
Dividends from affiliated securities | | | 0 | | | | 0 | | | | 0 | | | | 0 | | |
Interest income from unaffiliated securities | | | 105 | | | | 36 | | | | 5 | | | | 8 | | |
Non-cash dividends from affiliated securities | | | 0 | | | | 0 | | | | 0 | | | | 0 | | |
Non-cash dividends from unaffiliated securities | | | 0 | | | | 0 | | | | 0 | | | | 0 | | |
Security lending income | | | 0 | | | | 0 | | | | 7 | | | | 0 | | |
Other income | | | 0 | | | | 0 | | | | 0 | | | | 0 | | |
Foreign taxes withheld | | | 0 | | | | 0 | | | | (296 | ) | | | (358 | ) | |
Total investment income | | | 96,690 | | | | 18,973 | | | | 5,725 | | | | 6,422 | | |
Expenses: | |
Investment advisory fee | | | 44,616 | | | | 15,985 | | | | 6,111 | | | | 6,314 | | |
Transfer Agent Fees—Investor Class | | | 3,931 | | | | 969 | | | | 449 | | | | 301 | | |
Transfer Agent Fees—Advisor Class | | | 1,211 | | | | 1,021 | | | | 77 | | | | 162 | | |
Transfer Agent Fees—Institutional Class | | | 6 | | | | 2 | | | | 1 | | | | 2 | | |
Transfer Agent Fees—Service Class | | | 60 | | | | 17 | | | | 10 | | | | 0 | | |
Transfer Agent Fees—R6 Class | | | 0 | (c) | | | 0 | (c) | | | 0 | (c) | | | 0 | (c) | |
Service fee—Investor Class | | | 4,458 | | | | 885 | | | | 437 | | | | 345 | | |
Service fee—Service Class | | | 76 | | | | 23 | | | | 12 | | | | 0 | | |
Reports to shareholders | | | 397 | | | | 163 | | | | 32 | | | | 36 | | |
Custody and accounting fees | | | 199 | | | | 114 | | | | 135 | | | | 119 | | |
Registration fees | | | 107 | | | | 92 | | | | 45 | | | | 69 | | |
Trustees fees | | | 523 | | | | 240 | | | | 157 | | | | 139 | | |
Professional fees | | | 166 | | | | 94 | | | | 81 | | | | 82 | | |
Interest expense | | | 4 | | | | 0 | | | | 0 | | | | 0 | | |
Miscellaneous expenses | | | 213 | | | | 110 | | | | 80 | | | | 80 | | |
Total expenses | | | 55,967 | | | | 19,715 | | | | 7,627 | | | | 7,649 | | |
Advisory fee waiver | | | (1,912 | ) | | | (831 | ) | | | (248 | ) | | | (281 | ) | |
Net expenses | | | 54,055 | | | | 18,884 | | | | 7,379 | | | | 7,368 | | |
Net investment income (loss) | | | 42,635 | | | | 89 | | | | (1,654 | ) | | | (946 | ) | |
Net realized and unrealized gain (loss): | |
Net realized gain (loss) on: | |
Unaffiliated investments | | | 155,836 | | | | 30,770 | | | | 130,476 | (a) | | | 147,693 | | |
Affiliated investments | | | 0 | | | | 0 | | | | 0 | | | | 0 | | |
Unaffiliated in-kind transactions | | | 787,135 | | | | 256,764 | | | | 0 | | | | 0 | | |
Affiliated in-kind transactions | | | 0 | | | | 0 | | | | 0 | | | | 0 | | |
Forward foreign currency contracts | | | 0 | | | | 0 | | | | (1,010 | ) | | | (1,605 | ) | |
Foreign currency transactions | | | 0 | | | | 0 | | | | (29 | ) | | | 16 | | |
Written options | | | 12,717 | | | | (844 | ) | | | 0 | | | | 0 | | |
Net realized gain | | | 955,688 | | | | 286,690 | | | | 129,437 | | | | 146,104 | | |
Net change in unrealized appreciation (depreciation) on: | |
Unaffiliated investments | | | 3,749,325 | | | | 1,271,607 | | | | 369,292 | (b) | | | 322,305 | | |
Affiliated investments | | | 0 | | | | 0 | | | | 0 | | | | 0 | | |
Forward foreign currency contracts | | | 0 | | | | 0 | | | | 1,700 | | | | 2,347 | | |
Foreign currency translation | | | 0 | (c) | | | 0 | | | | (19 | ) | | | (50 | ) | |
Written options | | | 2,195 | | | | (6,002 | ) | | | 0 | | | | 0 | | |
Net change in unrealized appreciation (depreciation) | | | 3,751,520 | | | | 1,265,605 | | | | 370,973 | | | | 324,602 | | |
Net realized and unrealized gain | | | 4,707,208 | | | | 1,552,295 | | | | 500,410 | | | | 470,706 | | |
Net increase (decrease) in net assets resulting
from operations | | $ | 4,749,843 | | | $ | 1,552,384 | | | $ | 498,756 | | | $ | 469,760 | | |
(a) Net of capital gain withholding taxes of $1,150 and $3,367 (in thousands) for the Oakmark Global Fund and the Oakmark
International Fund, respectively.
(b) Includes net change in capital gain withholding taxes of $981 and $21,852 (in thousands) for the Oakmark Global Fund and the Oakmark
International Fund, respectively.
(c) Amount rounds to less than $1,000.
See accompanying Notes to Financial Statements.
52 OAKMARK FUNDS
| | | Oakmark
International
Fund | | Oakmark
International
Small Cap Fund | | Oakmark
Equity and
Income Fund | | Oakmark
Bond
Fund | |
Investment Income: | |
Dividends from unaffiliated securities | | $ | 113,314 | | | $ | 11,193 | | | $ | 36,861 | | | $ | 48 | | |
Dividends from affiliated securities | | | 813 | | | | 0 | | | | 0 | | | | 0 | | |
Interest income from unaffiliated securities | | | 303 | | | | 8 | | | | 34,376 | | | | 881 | | |
Non-cash dividends from affiliated securities | | | 3,015 | | | | 0 | | | | 0 | | | | 0 | | |
Non-cash dividends from unaffiliated securities | | | 0 | | | | 0 | | | | 1,306 | | | | 0 | | |
Security lending income | | | 166 | | | | 2 | | | | 0 | | | | 0 | | |
Other income | | | 17,974 | | | | 0 | | | | 0 | | | | 0 | | |
Foreign taxes withheld | | | (4,448 | ) | | | (1,215 | ) | | | 0 | | | | 0 | | |
Total investment income | | | 131,137 | | | | 9,988 | | | | 72,543 | | | | 929 | | |
Expenses: | |
Investment advisory fee | | | 95,982 | | | | 7,163 | | | | 23,498 | | | | 166 | | |
Transfer Agent Fees—Investor Class | | | 5,102 | | | | 272 | | | | 3,469 | | | | 0 | | |
Transfer Agent Fees—Advisor Class | | | 3,570 | | | | 95 | | | | 315 | | | | 0 | (c) | |
Transfer Agent Fees—Institutional Class | | | 13 | | | | 2 | | | | 2 | | | | 1 | | |
Transfer Agent Fees—Service Class | | | 190 | | | | 1 | | | | 169 | | | | 0 | | |
Transfer Agent Fees—R6 Class | | | 0 | (c) | | | 0 | (c) | | | 0 | (c) | | | 3 | | |
Service fee—Investor Class | | | 6,269 | | | | 301 | | | | 3,580 | | | | 0 | | |
Service fee—Service Class | | | 235 | | | | 1 | | | | 210 | | | | 0 | | |
Reports to shareholders | | | 1,048 | | | | 48 | | | | 157 | | | | 13 | | |
Custody and accounting fees | | | 1,464 | | | | 158 | | | | 168 | | | | 27 | | |
Registration fees | | | 215 | | | | 50 | | | | 68 | | | | 25 | | |
Trustees fees | | | 805 | | | | 152 | | | | 478 | | | | 66 | | |
Professional fees | | | 293 | | | | 104 | | | | 124 | | | | 69 | | |
Interest expense | | | 0 | | | | 0 | | | | 0 | | | | 0 | | |
Miscellaneous expenses | | | 346 | | | | 79 | | | | 159 | | | | 31 | | |
Total expenses | | | 115,532 | | | | 8,426 | | | | 32,397 | | | | 401 | | |
Advisory fee waiver | | | (4,106 | ) | | | (86 | ) | | | (2,012 | ) | | | (211 | ) | |
Net expenses | | | 111,426 | | | | 8,340 | | | | 30,385 | | | | 190 | | |
Net investment income (loss) | | | 19,711 | | | | 1,648 | | | | 42,158 | | | | 739 | | |
Net realized and unrealized gain (loss): | |
Net realized gain (loss) on: | |
Unaffiliated investments | | | 236,945 | (a) | | | 72,962 | | | | 507,789 | | | | 1,324 | | |
Affiliated investments | | | (159,557 | ) | | | 0 | | | | 0 | | | | 0 | | |
Unaffiliated in-kind transactions | | | 33,400 | | | | 0 | | | | 543,371 | | | | 0 | | |
Affiliated in-kind transactions | | | 7,064 | | | | 0 | | | | 0 | | | | 0 | | |
Forward foreign currency contracts | | | (13,325 | ) | | | (809 | ) | | | 0 | | | | 0 | | |
Foreign currency transactions | | | (485 | ) | | | 24 | | | | 0 | | | | 0 | | |
Written options | | | 0 | | | | 0 | | | | 0 | | | | 0 | | |
Net realized gain | | | 104,042 | | | | 72,177 | | | | 1,051,160 | | | | 1,324 | | |
Net change in unrealized appreciation (depreciation) on: | |
Unaffiliated investments | | | 6,669,617 | (b) | | | 386,444 | | | | 803,670 | | | | (787 | ) | |
Affiliated investments | | | 2,078,652 | | | | 0 | | | | 0 | | | | 0 | | |
Forward foreign currency contracts | | | 27,090 | | | | 1,583 | | | | 0 | | | | 0 | | |
Foreign currency translation | | | (396 | ) | | | (168 | ) | | | 0 | (c) | | | 0 | | |
Written options | | | 0 | | | | 0 | | | | 0 | | | | 0 | | |
Net change in unrealized appreciation (depreciation) | | | 8,774,963 | | | | 387,859 | | | | 803,670 | | | | (787 | ) | |
Net realized and unrealized gain | | | 8,879,005 | | | | 460,036 | | | | 1,854,830 | | | | 537 | | |
Net increase (decrease) in net assets resulting
from operations | | $ | 8,898,716 | | | $ | 461,684 | | | $ | 1,896,988 | | | $ | 1,276 | | |
Oakmark.com 53
Oakmark Funds
Statements of Changes in Net Assets
(in thousands)
| | | Oakmark Fund | |
| | | Six Months Ended
March 31, 2021
(Unaudited) | | Year Ended
September 30, 2020 | |
From Operations: | |
Net investment income | | $ | 42,635 | | | $ | 114,585 | | |
Net realized gain (loss) | | | 955,688 | | | | 1,318,418 | | |
Net change in unrealized appreciation (depreciation) | | | 3,751,520 | | | | (1,387,555 | ) | |
Net increase in net assets from operations | | | 4,749,843 | | | | 45,448 | | |
Distributions to shareholders from: | |
Distributions to shareholders—Investor Class | | | (11,993 | ) | | | (726,552 | ) | |
Distributions to shareholders—Advisor Class | | | (10,728 | ) | | | (408,372 | ) | |
Distributions to shareholders—Institutional Class | | | (7,585 | ) | | | (195,832 | ) | |
Distributions to shareholders—Service Class | | | 0 | | | | (7,172 | ) | |
Total distributions to shareholders | | | (30,306 | ) | | | (1,337,928 | ) | |
From Fund share transactions: | |
Proceeds from shares sold—Investor Class | | | 394,033 | | | | 853,510 | | |
Proceeds from shares sold—Advisor Class | | | 445,974 | | | | 907,524 | | |
Proceeds from shares sold—Institutional Class | | | 836,538 | | | | 2,782,421 | | |
Proceeds from shares sold—Service Class | | | 3,636 | | | | 15,779 | | |
Proceeds from shares sold—Class R6 | | | 1,465,841 | | | | 0 | | |
Reinvestment of distributions—Investor Class | | | 11,275 | | | | 685,615 | | |
Reinvestment of distributions—Advisor Class | | | 9,621 | | | | 369,720 | | |
Reinvestment of distributions—Institutional Class | | | 7,201 | | | | 185,312 | | |
Reinvestment of distributions—Service Class | | | 0 | | | | 5,070 | | |
Payment for shares redeemed—Investor Class | | | (1,153,257 | ) | | | (3,725,155 | ) | |
Payment for shares redeemed—Advisor Class | | | (511,230 | ) | | | (2,408,832 | ) | |
Payment for shares redeemed—Institutional Class | | | (1,649,471 | )(a) | | | (3,235,993 | )(b) | |
Payment for shares redeemed—Service Class | | | (12,570 | ) | | | (57,050 | ) | |
Payment for shares redeemed—Class R6 | | | (664,834 | )(c) | | | 0 | | |
Net decrease in net assets from Fund share transactions | | | (817,243 | ) | | | (3,622,079 | ) | |
Total increase (decrease) in net assets | | | 3,902,294 | | | | (4,914,559 | ) | |
Net assets: | |
Beginning of period | | | 11,316,350 | | | | 16,230,909 | | |
End of period | | $ | 15,218,644 | | | $ | 11,316,350 | | |
See accompanying Notes to Financial Statements.
54 OAKMARK FUNDS
Oakmark Funds
Statements of Changes in Net Assets (continued)
(in thousands)
| | | Oakmark Fund (continued) | |
| | | Six Months Ended
March 31, 2021
(Unaudited) | | Year Ended
September 30, 2020 | |
Fund share transactions—Investor Class: | |
Shares sold | | | 4,272 | | | | 12,333 | | |
Shares issued in reinvestment of dividends | | | 127 | | | | 8,695 | | |
Less shares redeemed | | | (13,139 | ) | | | (52,469 | ) | |
Net decrease in shares outstanding | | | (8,740 | ) | | | (31,441 | ) | |
Fund share transactions—Advisor Class: | |
Shares sold | | | 4,761 | | | | 12,784 | | |
Shares issued in reinvestment of dividends | | | 108 | | | | 4,693 | | |
Less shares redeemed | | | (5,716 | ) | | | (33,941 | ) | |
Net increase in shares outstanding | | | (847 | ) | | | (16,464 | ) | |
Fund share transactions—Institutional Class: | |
Shares sold | | | 10,432 | | | | 37,014 | | |
Shares issued in reinvestment of dividends | | | 81 | | | | 2,352 | | |
Less shares redeemed | | | (18,943 | )(d) | | | (43,602 | )(e) | |
Net increase in shares outstanding | | | (8,430 | ) | | | (4,236 | ) | |
Fund share transactions—Service Class: | |
Shares sold | | | 41 | | | | 214 | | |
Shares issued in reinvestment of dividends | | | 0 | | | | 64 | | |
Less shares redeemed | | | (142 | ) | | | (795 | ) | |
Net decrease in shares outstanding | | | (101 | ) | | | (517 | ) | |
Fund share transactions—Class R6: | |
Shares sold | | | 15,552 | | | | 0 | | |
Less shares redeemed | | | (6,963 | )(f) | | | 0 | | |
Net increase in shares outstanding | | | 8,589 | | | | 0 | | |
(a) $554,190 were redeemed through in-kind transactions.
(b) $2,321,718 were redeemed through in-kind transactions.
(c) $620,314 were redeemed through in-kind transactions.
(d) 7,260 shares were redeemed through in-kind transactions.
(e) 27,690 shares were redeemed through in-kind transactions.
(f) 6,525 shares were redeemed through in-kind transactions.
See accompanying Notes to Financial Statements.
Oakmark.com 55
Oakmark Funds
Statements of Changes in Net Assets (continued)
(in thousands)
| | | Oakmark Select Fund | |
| | | Six Months Ended
March 31, 2021
(Unaudited) | | Year Ended
September 30, 2020 | |
From Operations: | |
Net investment income | | $ | 89 | | | $ | 7,815 | | |
Net realized gain (loss) | | | 286,690 | | | | 223,804 | | |
Net change in unrealized appreciation (depreciation) | | | 1,265,605 | | | | (343,629 | ) | |
Net increase (decrease) in net assets from operations | | | 1,552,384 | | | | (112,010 | ) | |
Distributions to shareholders from: | |
Distributions to shareholders—Investor Class | | | 0 | | | | (22,703 | ) | |
Distributions to shareholders—Advisor Class | | | (4,450 | ) | | | (5,554 | ) | |
Distributions to shareholders—Institutional Class | | | (1,826 | ) | | | (6,360 | ) | |
Distributions to shareholders—Service Class | | | (38 | ) | | | (3 | ) | |
Total distributions to shareholders | | | (6,314 | ) | | | (34,620 | ) | |
From Fund share transactions: | |
Proceeds from shares sold—Investor Class | | | 44,343 | | | | 554,470 | | |
Proceeds from shares sold—Advisor Class | | | 208,117 | | | | 1,187,198 | | |
Proceeds from shares sold—Institutional Class | | | 202,061 | | | | 528,003 | | |
Proceeds from shares sold—Service Class | | | 18,738 | | | | 517 | | |
Proceeds from shares sold—Class R6 | | | 441,093 | | | | 0 | | |
Reinvestment of distributions—Investor Class | | | 0 | | | | 22,285 | | |
Reinvestment of distributions—Advisor Class | | | 4,233 | | | | 4,733 | | |
Reinvestment of distributions—Institutional Class | | | 1,706 | | | | 5,855 | | |
Reinvestment of distributions—Service Class | | | 38 | | | | 2 | | |
Payment for shares redeemed—Investor Class | | | (236,099 | ) | | | (2,210,140 | ) | |
Payment for shares redeemed—Advisor Class | | | (191,172 | ) | | | (391,430 | ) | |
Payment for shares redeemed—Institutional Class | | | (463,077 | )(a) | | | (611,595 | )(c) | |
Payment for shares redeemed—Service Class | | | (6,066 | ) | | | (4,985 | ) | |
Payment for shares redeemed—Class R6 | | | (195,057 | )(f) | | | 0 | | |
Net decrease in net assets from Fund share transactions | | | (171,142 | ) | | | (915,087 | ) | |
Total increase (decrease) in net assets | | | 1,374,928 | | | | (1,061,717 | ) | |
Net assets: | |
Beginning of period | | | 3,399,094 | | | | 4,460,811 | | |
End of period | | $ | 4,774,022 | | | $ | 3,399,094 | | |
See accompanying Notes to Financial Statements.
56 OAKMARK FUNDS
Oakmark Funds
Statements of Changes in Net Assets (continued)
(in thousands)
| | | Oakmark Select Fund (continued) | |
| | | Six Months Ended
March 31, 2021
(Unaudited) | | Year Ended
September 30, 2020 | |
Fund share transactions—Investor Class: | |
Shares sold | | | 876 | | | | 16,022 | | |
Shares issued in reinvestment of dividends | | | 0 | | | | 523 | | |
Less shares redeemed | | | (5,049 | ) | | | (59,911 | ) | |
Net decrease in shares outstanding | | | (4,173 | ) | | | (43,366 | ) | |
Fund share transactions—Advisor Class: | |
Shares sold | | | 4,330 | | | | 31,564 | | |
Shares issued in reinvestment of dividends | | | 89 | | | | 111 | | |
Less shares redeemed | | | (4,036 | ) | | | (10,156 | ) | |
Net increase in shares outstanding | | | 383 | | | | 21,519 | | |
Fund share transactions—Institutional Class: | |
Shares sold | | | 5,003 | | | | 14,605 | | |
Shares issued in reinvestment of dividends | | | 35 | | | | 138 | | |
Less shares redeemed | | | (10,369 | )(b) | | | (17,102 | )(d) | |
Net increase in shares outstanding | | | (5,331 | ) | | | (2,359 | ) | |
Fund share transactions—Service Class: | |
Shares sold | | | 473 | | | | 14 | | |
Shares issued in reinvestment of dividends | | | 1 | | | | 0 | (e) | |
Less shares redeemed | | | (127 | ) | | | (129 | ) | |
Net increase (decrease) in shares outstanding | | | 347 | | | | (115 | ) | |
Fund share transactions—Class R6: | |
Shares sold | | | 8,980 | | | | 0 | | |
Less shares redeemed | | | (4,036 | )(g) | | | 0 | | |
Net increase in shares outstanding | | | 4,944 | | | | 0 | | |
(a) $165,999 were redeemed through in-kind transactions
(b) 4,302 shares were redeemed through in-kind transactions.
(c) $318,165 were redeemed through in-kind transactions
(d) 9,238 shares were redeemed through in-kind transactions.
(e) Amount rounds to less than $1,000.
(f) $194,032 were redeemed through in-kind transactions
(g) 4,023 shares were redeemed through in-kind transactions.
See accompanying Notes to Financial Statements.
Oakmark.com 57
Oakmark Funds
Statements of Changes in Net Assets (continued)
(in thousands)
| | | Oakmark Global Fund | |
| | | Six Months Ended
March 31, 2021
(Unaudited) | | Year Ended
September 30, 2020 | |
From Operations: | |
Net investment income (loss) | | $ | (1,654 | ) | | $ | 2,497 | | |
Net realized gain (loss) | | | 129,437 | | | | 2,255 | | |
Net change in unrealized appreciation (depreciation) | | | 370,973 | | | | (133,928 | ) | |
Net increase (decrease) in net assets from operations | | | 498,756 | | | | (129,176 | ) | |
Distributions to shareholders from: | |
Distributions to shareholders—Investor Class | | | (1,297 | ) | | | (41,340 | ) | |
Distributions to shareholders—Advisor Class | | | (778 | ) | | | (10,502 | ) | |
Distributions to shareholders—Institutional Class | | | (1,351 | ) | | | (13,776 | ) | |
Distributions to shareholders—Service Class | | | 0 | | | | (453 | ) | |
Total distributions to shareholders | | | (3,426 | ) | | | (66,071 | ) | |
From Fund share transactions: | |
Proceeds from shares sold—Investor Class | | | 39,940 | | | | 78,289 | | |
Proceeds from shares sold—Advisor Class | | | 28,069 | | | | 82,992 | | |
Proceeds from shares sold—Institutional Class | | | 10,653 | | | | 125,982 | | |
Proceeds from shares sold—Service Class | | | 748 | | | | 1,470 | | |
Proceeds from shares sold—Class R6 | | | 87,551 | | | | 0 | | |
Reinvestment of distributions—Investor Class | | | 1,268 | | | | 40,612 | | |
Reinvestment of distributions—Advisor Class | | | 704 | | | | 8,434 | | |
Reinvestment of distributions—Institutional Class | | | 1,336 | | | | 13,670 | | |
Reinvestment of distributions—Service Class | | | 0 | | | | 369 | | |
Payment for shares redeemed—Investor Class | | | (126,755 | ) | | | (425,768 | ) | |
Payment for shares redeemed—Advisor Class | | | (29,097 | ) | | | (120,742 | ) | |
Payment for shares redeemed—Institutional Class | | | (115,713 | ) | | | (95,981 | ) | |
Payment for shares redeemed—Service Class | | | (2,074 | ) | | | (4,589 | ) | |
Payment for shares redeemed—Class R6 | | | (2,314 | ) | | | 0 | | |
Net decrease in net assets from Fund share transactions | | | (105,684 | ) | | | (295,262 | ) | |
Total increase (decrease) in net assets | | | 389,646 | | | | (490,509 | ) | |
Net assets: | |
Beginning of period | | | 1,175,861 | | | | 1,666,370 | | |
End of period | | $ | 1,565,507 | | | $ | 1,175,861 | | |
See accompanying Notes to Financial Statements.
58 OAKMARK FUNDS
Oakmark Funds
Statements of Changes in Net Assets (continued)
(in thousands)
| | | Oakmark Global Fund (continued) | |
| | | Six Months Ended
March 31, 2021
(Unaudited) | | Year Ended
September 30, 2020 | |
Fund share transactions—Investor Class: | |
Shares sold | | | 1,235 | | | | 3,302 | | |
Shares issued in reinvestment of dividends | | | 40 | | | | 1,413 | | |
Less shares redeemed | | | (4,063 | ) | | | (17,769 | ) | |
Net decrease in shares outstanding | | | (2,788 | ) | | | (13,054 | ) | |
Fund share transactions—Advisor Class: | |
Shares sold | | | 900 | | | | 3,564 | | |
Shares issued in reinvestment of dividends | | | 22 | | | | 294 | | |
Less shares redeemed | | | (934 | ) | | | (4,962 | ) | |
Net increase in shares outstanding | | | (12 | ) | | | (1,104 | ) | |
Fund share transactions—Institutional Class: | |
Shares sold | | | 338 | | | | 5,080 | | |
Shares issued in reinvestment of dividends | | | 42 | | | | 476 | | |
Less shares redeemed | | | (3,599 | ) | | | (4,286 | ) | |
Net increase in shares outstanding | | | (3,219 | ) | | | 1,270 | | |
Fund share transactions—Service Class: | |
Shares sold | | | 24 | | | | 63 | | |
Shares issued in reinvestment of dividends | | | 0 | | | | 13 | | |
Less shares redeemed | | | (71 | ) | | | (192 | ) | |
Net decrease in shares outstanding | | | (47 | ) | | | (116 | ) | |
Fund share transactions—Class R6: | |
Shares sold | | | 2,703 | | | | 0 | | |
Less shares redeemed | | | (69 | ) | | | 0 | | |
Net increase in shares outstanding | | | 2,634 | | | | 0 | | |
See accompanying Notes to Financial Statements.
Oakmark.com 59
Oakmark Funds
Statements of Changes in Net Assets (continued)
(in thousands)
| | | Oakmark Global Select Fund | |
| | | Six Months Ended
March 31, 2021
(Unaudited) | | Year Ended
September 30, 2020 | |
From Operations: | |
Net investment income (loss) | | $ | (946 | ) | | $ | 4,012 | | |
Net realized gain (loss) | | | 146,104 | | | | 3,662 | | |
Net change in unrealized appreciation (depreciation) | | | 324,602 | | | | (41,292 | ) | |
Net increase (decrease) in net assets from operations | | | 469,760 | | | | (33,618 | ) | |
Distributions to shareholders from: | |
Distributions to shareholders—Investor Class | | | 0 | | | | (10,219 | ) | |
Distributions to shareholders—Advisor Class | | | (530 | ) | | | (6,484 | ) | |
Distributions to shareholders—Institutional Class | | | (825 | ) | | | (8,055 | ) | |
Total distributions to shareholders | | | (1,355 | ) | | | (24,758 | ) | |
From Fund share transactions: | |
Proceeds from shares sold—Investor Class | | | 29,810 | | | | 133,024 | | |
Proceeds from shares sold—Advisor Class | | | 43,453 | | | | 160,344 | | |
Proceeds from shares sold—Institutional Class | | | 15,628 | | | | 106,721 | | |
Proceeds from shares sold—Class R6 | | | 128,723 | | | | 0 | | |
Reinvestment of distributions—Investor Class | | | 0 | | | | 9,817 | | |
Reinvestment of distributions—Advisor Class | | | 469 | | | | 5,434 | | |
Reinvestment of distributions—Institutional Class | | | 741 | | | | 6,866 | | |
Payment for shares redeemed—Investor Class | | | (87,671 | ) | | | (431,915 | ) | |
Payment for shares redeemed—Advisor Class | | | (63,099 | ) | | | (214,678 | ) | |
Payment for shares redeemed—Institutional Class | | | (188,854 | ) | | | (212,840 | ) | |
Payment for shares redeemed—Class R6 | | | (4,016 | ) | | | 0 | | |
Net decrease in net assets from Fund share transactions | | | (124,816 | ) | | | (437,227 | ) | |
Total increase (decrease) in net assets | | | 343,589 | | | | (495,603 | ) | |
Net assets: | |
Beginning of period | | | 1,290,699 | | | | 1,786,302 | | |
End of period | | $ | 1,634,288 | | | $ | 1,290,699 | | |
Fund share transactions—Investor Class: | |
Shares sold | | | 1,405 | | | | 8,132 | | |
Shares issued in reinvestment of dividends | | | 0 | | | | 542 | | |
Less shares redeemed | | | (4,327 | ) | | | (27,481 | ) | |
Net decrease in shares outstanding | | | (2,922 | ) | | | (18,807 | ) | |
Fund share transactions—Advisor Class: | |
Shares sold | | | 2,049 | | | | 10,097 | | |
Shares issued in reinvestment of dividends | | | 23 | | | | 301 | | |
Less shares redeemed | | | (3,032 | ) | | | (13,811 | ) | |
Net increase in shares outstanding | | | (960 | ) | | | (3,413 | ) | |
Fund share transactions—Institutional Class: | |
Shares sold | | | 755 | | | | 6,515 | | |
Shares issued in reinvestment of dividends | | | 35 | | | | 380 | | |
Less shares redeemed | | | (8,992 | ) | | | (14,372 | ) | |
Net increase in shares outstanding | | | (8,202 | ) | | | (7,477 | ) | |
Fund share transactions—Class R6: | |
Shares sold | | | 5,967 | | | | 0 | | |
Less shares redeemed | | | (175 | ) | | | 0 | | |
Net increase in shares outstanding | | | 5,792 | | | | 0 | | |
See accompanying Notes to Financial Statements.
60 OAKMARK FUNDS
Oakmark Funds
Statements of Changes in Net Assets (continued)
(in thousands)
| | | Oakmark International Fund | |
| | | Six Months Ended
March 31, 2021
(Unaudited) | | Year Ended
September 30, 2020 | |
From Operations: | |
Net investment income | | $ | 19,711 | | | $ | 131,269 | | |
Net realized gain (loss) | | | 104,042 | | | | (1,492,438 | ) | |
Net change in unrealized appreciation (depreciation) | | | 8,774,963 | | | | (2,280,055 | ) | |
Net increase (decrease) in net assets from operations | | | 8,898,716 | | | | (3,641,224 | ) | |
Distributions to shareholders from: | |
Distributions to shareholders—Investor Class | | | (31,246 | ) | | | (273,582 | ) | |
Distributions to shareholders—Advisor Class | | | (37,862 | ) | | | (137,704 | ) | |
Distributions to shareholders—Institutional Class | | | (48,820 | ) | | | (205,472 | ) | |
Distributions to shareholders—Service Class | | | (110 | ) | | | (4,362 | ) | |
Total distributions to shareholders | | | (118,038 | ) | | | (621,120 | ) | |
From Fund share transactions: | |
Proceeds from shares sold—Investor Class | | | 689,165 | | | | 2,496,412 | | |
Proceeds from shares sold—Advisor Class | | | 997,488 | | | | 3,889,737 | | |
Proceeds from shares sold—Institutional Class | | | 848,843 | | | | 3,114,225 | | |
Proceeds from shares sold—Service Class | | | 17,499 | | | | 70,063 | | |
Proceeds from shares sold—Class R6 | | | 1,132,622 | | | | 0 | | |
Reinvestment of distributions—Investor Class | | | 29,913 | | | | 262,972 | | |
Reinvestment of distributions—Advisor Class | | | 21,958 | | | | 86,948 | | |
Reinvestment of distributions—Institutional Class | | | 42,668 | | | | 177,573 | | |
Reinvestment of distributions—Service Class | | | 53 | | | | 2,484 | | |
Payment for shares redeemed—Investor Class | | | (2,350,277 | ) | | | (7,343,638 | ) | |
Payment for shares redeemed—Advisor Class | | | (1,485,255 | ) | | | (3,432,251 | ) | |
Payment for shares redeemed—Institutional Class | | | (2,727,409 | )(a) | | | (4,148,695 | ) | |
Payment for shares redeemed—Service Class | | | (100,680 | ) | | | (165,169 | ) | |
Payment for shares redeemed—Class R6 | | | (32,539 | ) | | | 0 | | |
Net decrease in net assets from Fund share transactions | | | (2,915,951 | ) | | | (4,989,339 | ) | |
Total increase (decrease) in net assets | | | 5,864,727 | | | | (9,251,683 | ) | |
Net assets: | |
Beginning of period | | | 21,660,053 | | | | 30,911,736 | | |
End of period | | $ | 27,524,780 | | | $ | 21,660,053 | | |
See accompanying Notes to Financial Statements.
Oakmark.com 61
Oakmark Funds
Statements of Changes in Net Assets (continued)
(in thousands)
| | | Oakmark International Fund (continued) | |
| | | Six Months Ended
March 31, 2021
(Unaudited) | | Year Ended
September 30, 2020 | |
Fund share transactions—Investor Class: | |
Shares sold | | | 27,399 | | | | 129,849 | | |
Shares issued in reinvestment of dividends | | | 1,174 | | | | 10,795 | | |
Less shares redeemed | | | (94,297 | ) | | | (372,394 | ) | |
Net decrease in shares outstanding | | | (65,724 | ) | | | (231,750 | ) | |
Fund share transactions—Advisor Class: | |
Shares sold | | | 38,792 | | | | 198,617 | | |
Shares issued in reinvestment of dividends | | | 864 | | | | 3,575 | | |
Less shares redeemed | | | (59,465 | ) | | | (179,524 | ) | |
Net increase in shares outstanding | | | (19,809 | ) | | | 22,668 | | |
Fund share transactions—Institutional Class: | |
Shares sold | | | 32,931 | | | | 158,670 | | |
Shares issued in reinvestment of dividends | | | 1,677 | | | | 7,298 | | |
Less shares redeemed | | | (105,445 | )(b) | | | (216,010 | ) | |
Net increase in shares outstanding | | | (70,837 | ) | | | (50,042 | ) | |
Fund share transactions—Service Class: | |
Shares sold | | | 702 | | | | 3,604 | | |
Shares issued in reinvestment of dividends | | | 2 | | | | 101 | | |
Less shares redeemed | | | (3,995 | ) | | | (7,860 | ) | |
Net decrease in shares outstanding | | | (3,291 | ) | | | (4,155 | ) | |
Fund share transactions—Class R6: | |
Shares sold | | | 41,220 | | | | 0 | | |
Less shares redeemed | | | (1,137 | ) | | | 0 | | |
Net increase in shares outstanding | | | 40,083 | | | | 0 | | |
(a) $87,634 were redeemed through in-kind transactions.
(b) 3,243 shares were redeemed through in-kind transactions.
See accompanying Notes to Financial Statements.
62 OAKMARK FUNDS
Oakmark Funds
Statements of Changes in Net Assets (continued)
(in thousands)
| | | Oakmark International Small Cap Fund | |
| | | Six Months Ended
March 31, 2021
(Unaudited) | | Year Ended
September 30, 2020 | |
From Operations: | |
Net investment income | | $ | 1,648 | | | $ | 29,190 | | |
Net realized gain (loss) | | | 72,177 | | | | (77,323 | ) | |
Net change in unrealized appreciation (depreciation) | | | 387,859 | | | | (68,628 | ) | |
Net increase (decrease) in net assets from operations | | | 461,684 | | | | (116,761 | ) | |
Distributions to shareholders from: | |
Distributions to shareholders—Investor Class | �� | | (9,119 | ) | | | (1,243 | ) | |
Distributions to shareholders—Advisor Class | | | (3,675 | ) | | | (541 | ) | |
Distributions to shareholders—Institutional Class | | | (15,216 | ) | | | (3,050 | ) | |
Distributions to shareholders—Service Class | | | (12 | ) | | | 0 | | |
Total distributions to shareholders | | | (28,022 | ) | | | (4,834 | ) | |
From Fund share transactions: | |
Proceeds from shares sold—Investor Class | | | 52,542 | | | | 95,404 | | |
Proceeds from shares sold—Advisor Class | | | 21,222 | | | | 80,461 | | |
Proceeds from shares sold—Institutional Class | | | 54,311 | | | | 223,287 | | |
Proceeds from shares sold—Service Class | | | 51 | | | | 278 | | |
Proceeds from shares sold—Class R6 | | | 63,787 | | | | 0 | | |
Reinvestment of distributions—Investor Class | | | 8,902 | | | | 1,216 | | |
Reinvestment of distributions—Advisor Class | | | 3,299 | | | | 454 | | |
Reinvestment of distributions—Institutional Class | | | 8,177 | | | | 1,781 | | |
Reinvestment of distributions—Service Class | | | 7 | | | | 0 | | |
Payment for shares redeemed—Investor Class | | | (76,692 | ) | | | (217,061 | ) | |
Payment for shares redeemed—Advisor Class | | | (27,921 | ) | | | (52,851 | ) | |
Payment for shares redeemed—Institutional Class | | | (172,691 | ) | | | (277,131 | ) | |
Payment for shares redeemed—Service Class | | | (355 | ) | | | (425 | ) | |
Payment for shares redeemed—Class R6 | | | (179 | ) | | | 0 | | |
Net decrease in net assets from Fund share transactions | | | (65,540 | ) | | | (144,587 | ) | |
Total increase (decrease) in net assets | | | 368,122 | | | | (266,182 | ) | |
Net assets: | |
Beginning of period | | | 1,159,566 | | | | 1,425,748 | | |
End of period | | $ | 1,527,688 | | | $ | 1,159,566 | | |
See accompanying Notes to Financial Statements.
Oakmark.com 63
Oakmark Funds
Statements of Changes in Net Assets (continued)
(in thousands)
| | | Oakmark International Small Cap Fund (continued) | |
| | | Six Months Ended
March 31, 2021
(Unaudited) | | Year Ended
September 30, 2020 | |
Fund share transactions—Investor Class: | |
Shares sold | | | 3,319 | | | | 7,380 | | |
Shares issued in reinvestment of dividends | | | 539 | | | | 76 | | |
Less shares redeemed | | | (4,627 | ) | | | (16,403 | ) | |
Net decrease in shares outstanding | | | (769 | ) | | | (8,947 | ) | |
Fund share transactions—Advisor Class: | |
Shares sold | | | 1,246 | | | | 5,926 | | |
Shares issued in reinvestment of dividends | | | 200 | | | | 29 | | |
Less shares redeemed | | | (1,690 | ) | | | (4,316 | ) | |
Net increase in shares outstanding | | | (244 | ) | | | 1,639 | | |
Fund share transactions—Institutional Class: | |
Shares sold | | | 3,208 | | | | 17,551 | | |
Shares issued in reinvestment of dividends | | | 497 | | | | 112 | | |
Less shares redeemed | | | (10,165 | ) | | | (23,109 | ) | |
Net increase in shares outstanding | | | (6,460 | ) | | | (5,446 | ) | |
Fund share transactions—Service Class: | |
Shares sold | | | 3 | | | | 21 | | |
Shares issued in reinvestment of dividends | | | 1 | | | | 0 | | |
Less shares redeemed | | | (24 | ) | | | (30 | ) | |
Net decrease in shares outstanding | | | (20 | ) | | | (9 | ) | |
Fund share transactions—Class R6: | |
Shares sold | | | 3,776 | | | | 0 | | |
Less shares redeemed | | | (10 | ) | | | 0 | | |
Net increase in shares outstanding | | | 3,766 | | | | 0 | | |
See accompanying Notes to Financial Statements.
64 OAKMARK FUNDS
Oakmark Funds
Statements of Changes in Net Assets (continued)
(in thousands)
| | | Oakmark Equity and Income Fund | |
| | | Six Months Ended
March 31, 2021
(Unaudited) | | Year Ended
September 30, 2020 | |
From Operations: | |
Net investment income | | $ | 42,158 | | | $ | 149,625 | | |
Net realized gain (loss) | | | 1,051,160 | | | | 609,843 | | |
Net change in unrealized appreciation (depreciation) | | | 803,670 | | | | (994,011 | ) | |
Net increase (decrease) in net assets from operations | | | 1,896,988 | | | | (234,543 | ) | |
Distributions to shareholders from: | |
Distributions to shareholders—Investor Class | | | (235,119 | ) | | | (749,755 | ) | |
Distributions to shareholders—Advisor Class | | | (43,545 | ) | | | (119,524 | ) | |
Distributions to shareholders—Institutional Class | | | (38,067 | ) | | | (106,615 | ) | |
Distributions to shareholders—Service Class | | | (6,285 | ) | | | (23,160 | ) | |
Total distributions to shareholders | | | (323,016 | ) | | | (999,054 | ) | |
From Fund share transactions: | |
Proceeds from shares sold—Investor Class | | | 131,187 | | | | 425,123 | | |
Proceeds from shares sold—Advisor Class | | | 60,550 | | | | 188,704 | | |
Proceeds from shares sold—Institutional Class | | | 739,731 | | | | 622,056 | | |
Proceeds from shares sold—Service Class | | | 9,044 | | | | 23,233 | | |
Proceeds from shares sold—Class R6 | | | 78,643 | | | | 0 | | |
Reinvestment of distributions—Investor Class | | | 223,724 | | | | 718,160 | | |
Reinvestment of distributions—Advisor Class | | | 37,649 | | | | 98,593 | | |
Reinvestment of distributions—Institutional Class | | | 35,843 | | | | 101,501 | | |
Reinvestment of distributions—Service Class | | | 5,684 | | | | 20,919 | | |
Payment for shares redeemed—Investor Class | | | (1,330,417 | ) | | | (3,746,674 | ) | |
Payment for shares redeemed—Advisor Class | | | (134,587 | ) | | | (529,667 | ) | |
Payment for shares redeemed—Institutional Class | | | (1,067,579 | )(a) | | | (925,603 | )(c) | |
Payment for shares redeemed—Service Class | | | (59,698 | ) | | | (136,264 | ) | |
Payment for shares redeemed—Class R6 | | | (3,247 | ) | | | 0 | | |
Net decrease in net assets from Fund share transactions | | | (1,273,473 | ) | | | (3,139,919 | ) | |
Total increase (decrease) in net assets | | | 300,499 | | | | (4,373,516 | ) | |
Net assets: | |
Beginning of period | | | 7,462,841 | | | | 11,836,357 | | |
End of period | | $ | 7,763,340 | | | $ | 7,462,841 | | |
See accompanying Notes to Financial Statements.
Oakmark.com 65
Oakmark Funds
Statements of Changes in Net Assets (continued)
(in thousands)
| | | Oakmark Equity and Income Fund (continued) | |
| | | Six Months Ended
March 31, 2021
(Unaudited) | | Year Ended
September 30, 2020 | |
Fund share transactions—Investor Class: | |
Shares sold | | | 4,185 | | | | 15,463 | | |
Shares issued in reinvestment of dividends | | | 7,381 | | | | 24,764 | | |
Less shares redeemed | | | (43,437 | ) | | | (137,779 | ) | |
Net decrease in shares outstanding | | | (31,871 | ) | | | (97,552 | ) | |
Fund share transactions—Advisor Class: | |
Shares sold | | | 1,923 | | | | 6,663 | | |
Shares issued in reinvestment of dividends | | | 1,243 | | | | 3,402 | | |
Less shares redeemed | | | (4,394 | ) | | | (19,924 | ) | |
Net increase in shares outstanding | | | (1,228 | ) | | | (9,859 | ) | |
Fund share transactions—Institutional Class: | |
Shares sold | | | 24,599 | | | | 22,918 | | |
Shares issued in reinvestment of dividends | | | 1,183 | | | | 3,502 | | |
Less shares redeemed | | | (35,092 | )(b) | | | (34,948 | )(d) | |
Net increase in shares outstanding | | | (9,310 | ) | | | (8,528 | ) | |
Fund share transactions—Service Class: | |
Shares sold | | | 291 | | | | 852 | | |
Shares issued in reinvestment of dividends | | | 188 | | | | 725 | | |
Less shares redeemed | | | (1,961 | ) | | | (4,932 | ) | |
Net decrease in shares outstanding | | | (1,482 | ) | | | (3,355 | ) | |
Fund share transactions—Class R6: | |
Shares sold | | | 2,516 | | | | 0 | | |
Less shares redeemed | | | (98 | ) | | | 0 | | |
Net increase in shares outstanding | | | 2,418 | | | | 0 | | |
(a) $698,005 were redeemed through in-kind transactions.
(b) 23,097 shares were redeemed through in-kind transactions.
(c) $370,235 were redeemed through in-kind transactions.
(d) 14,058 shares were redeemed through in-kind transactions.
See accompanying Notes to Financial Statements.
66 OAKMARK FUNDS
Oakmark Funds
Statements of Changes in Net Assets (continued)
(in thousands)
| | | Oakmark Bond Fund | |
| | | Six Months Ended
March 31, 2021
(Unaudited) | | Year Ended
September 30, 2020(a) | |
From Operations: | |
Net investment income | | $ | 739 | | | $ | 284 | | |
Net realized gain (loss) | | | 1,324 | | | | 174 | | |
Net change in unrealized appreciation (depreciation) | | | (787 | ) | | | 1,018 | | |
Net increase in net assets from operations | | | 1,276 | | | | 1,476 | | |
Distributions to shareholders from: | |
Distributions to shareholders—Advisor Class | | | (8 | ) | | | (2 | ) | |
Distributions to shareholders—Institutional Class | | | (605 | ) | | | (268 | ) | |
Distributions to shareholders—Class R6 | | | (495 | ) | | | 0 | | |
Total distributions to shareholders | | | (1,108 | ) | | | (270 | ) | |
From Fund share transactions: | |
Proceeds from shares sold—Advisor Class | | | 767 | | | | 600 | | |
Proceeds from shares sold—Institutional Class | | | 4,254 | | | | 77,527 | | |
Proceeds from shares sold—Class R6 | | | 85,488 | | | | 0 | | |
Reinvestment of distributions—Advisor Class | | | 9 | | | | 2 | | |
Reinvestment of distributions—Institutional Class | | | 605 | | | | 268 | | |
Reinvestment of distributions—Class R6 | | | 495 | | | | 0 | | |
Payment for shares redeemed—Advisor Class | | | (108 | ) | | | (1 | ) | |
Payment for shares redeemed—Institutional Class | | | (81,970 | ) | | | (3 | ) | |
Payment for shares redeemed—Class R6 | | | (5 | ) | | | 0 | | |
Net increase in net assets from Fund share transactions | | | 9,535 | | | | 78,393 | | |
Total increase in net assets | | | 9,703 | | | | 79,599 | | |
Net assets: | |
Beginning of period | | | 79,599 | | | | — | | |
End of period | | $ | 89,302 | | | $ | 79,599 | | |
Fund share transactions—Advisor Class: | |
Shares sold | | | 74 | | | | 60 | | |
Shares issued in reinvestment of dividends | | | 1 | | | | 0 | (b) | |
Less shares redeemed | | | (10 | ) | | | 0 | (b) | |
Net increase in shares outstanding | | | 65 | | | | 60 | | |
Fund share transactions—Institutional Class: | |
Shares sold | | | 413 | | | | 7,740 | | |
Shares issued in reinvestment of dividends | | | 59 | | | | 26 | | |
Less shares redeemed | | | (7,942 | ) | | | 0 | (b) | |
Net increase in shares outstanding | | | (7,470 | ) | | | 7,766 | | |
Fund share transactions—Class R6: | |
Shares sold | | | 8,283 | | | | 0 | | |
Shares issued in reinvestment of dividends | | | 48 | | | | 0 | | |
Less shares redeemed | | | 0 | (b) | | | 0 | | |
Net increase in shares outstanding | | | 8,331 | | | | 0 | | |
(a) Commenced operations on 6/10/2020.
(b) Amount rounds to less than $1,000.
See accompanying Notes to Financial Statements.
Oakmark.com 67
Oakmark Funds
Notes to Financial Statements
1. SIGNIFICANT ACCOUNTING POLICIES
Organization
The following are the significant accounting policies of Oakmark Fund ("Oakmark"), Oakmark Select Fund ("Select"), Oakmark Global Fund ("Global"), Oakmark Global Select Fund ("Global Select"), Oakmark International Fund ("International"), Oakmark International Small Cap Fund ("Int'l Small Cap"), Oakmark Equity and Income Fund ("Equity and Income") and Oakmark Bond Fund ("Bond") collectively referred to as the "Funds," each a series of Harris Associates Investment Trust (the "Trust"), a Massachusetts business trust, organized on February 1, 1991, which is registered as an open-end management investment company under the Investment Company Act of 1940, as amended (the "1940 Act") and accordingly follows the investment company accounting and reporting guidance of the Financial Accounting Standards Board ("FASB") Accounting Standards Codification ("ASC") Topic 946 Financial Services—Investment Companies. Each Fund, other than Select and Global Select, is diversified in accordance with the 1940 Act. The following policies are in conformity with accounting principles generally accepted in the United States of America ("GAAP"). The presentation of financial statements in conformity with GAAP requires management to make estimates and assumptions that affect the reported amounts of assets and liabilities at the date of the financial statements and the reported amounts of revenues and expenses during the reporting period. Actual results could differ from those estimates and assumptions.
Class disclosure
Each Fund, except Bond Fund, offers five classes of shares: Investor Class Shares, Advisor Class Shares, Institutional Class Shares, R6 Class Shares and Service Class Shares. Bond Fund offers Advisor Class Shares, Institutional Class Shares and R6 Class Shares. Investor Class, Advisor Class, Institutional Class and R6 Class Shares are offered for purchase directly from the Funds and through certain intermediaries who have entered into an agreement with the Funds' distributor and/or Harris Associates L.P., investment adviser to the Funds (the "Adviser"). Investor Class and Service Class Shares are offered to certain retirement plans, such as 401(k) and profit sharing plans. Investor Class and Service Class Shares of a Fund each pay a service fee not to exceed 0.25% per annum of the average daily net assets of the Fund's Investor or Service Class Shares. This service fee is paid to third-party intermediaries who provide services for and/or maintain shareholder accounts. Global Select had no outstanding Service Class Shares during the six-month period ended March 31, 2021.
Income, realized and unrealized capital gains and losses, and expenses of the Funds not directly attributable to a specific class of shares are allocated to each class pro rata based on the relative net assets of each class. Transfer and divided disbursing agent fees, other shareholder servicing fees, and reports to shareholders expenses are specific to each class.
Security valuation
The share price is also called the net asset value (the "NAV") of a share. The NAV of shares of each class is normally determined by the Funds' custodian as of the close of regular session trading (usually 4:00 p.m. Eastern time) on the New York Stock Exchange (the "NYSE") on any day on which the NYSE is open for regular trading. If the NYSE is unexpectedly closed on a day it would normally be open for business, or if the NYSE has an unscheduled early closure, the Funds reserve the right to accept purchase and redemption orders and calculate their share price as of the normally scheduled close of regular trading on the NYSE for that day.
The NYSE is closed on Saturdays and Sundays and on New Year's Day, the third Mondays in January and February, Good Friday, the last Monday in May, Independence Day, Labor Day, Thanksgiving, and Christmas. If one of these holidays falls on a Saturday or Sunday, the NYSE will be closed on the preceding Friday or the following Monday, respectively. A Fund's NAV will not be calculated on days when the NYSE is closed. The NAV of a class of Fund shares is determined by dividing the value of the assets attributable to that class, less liabilities attributable to that class, by the number of outstanding shares of that class.
Trading in securities of non-U.S. issuers takes place in various markets on some days and at times when the NYSE is not open for trading. In addition, securities of non-U.S. issuers may not trade on some days when the NYSE is open for trading. The value of the Funds' portfolio holdings may change on days when the NYSE is not open for trading and you cannot purchase or redeem Fund shares.
Equity securities principally traded on securities exchanges in the United States are valued at the last sale price or the official closing price as of the time of valuation on that exchange, or lacking a reported sale price on the principal exchange at the time of valuation, at the most recent bid quotation. Each over-the-counter security traded on the NASDAQ National Market System shall be valued at the NASDAQ Official Closing Price ("NOCP"), or lacking a NOCP at the time of valuation, at the most recent bid quotation. Other over-the-counter securities are valued at the last sales prices at the time of valuation or, lacking any reported sales on that day, at the most recent bid quotations. Each equity security principally traded on a securities exchange outside the United States shall be valued, depending on local convention or regulation, at the last sale price, the last bid or asked price, the mean between the last bid and asked prices, the official closing price, an auction price, or the pricing convention accepted as the official closing price by MSCI for their index calculations. If there are unexpected disruptions in the primary market or valuations from the primary market are deemed suspect, equity securities may be valued based on a pricing composite or valuations from another exchange as of the close of the regular trading hours on the appropriate exchange or other designated time. The market value of exchange-traded securities is determined by using prices provided by one or more independent pricing services, or, as needed, by obtaining market quotations from independent broker-dealers. Short-term debt instruments (i.e., debt instruments whose maturities or expiration dates at the time of acquisition are one year or less) or money market instruments are valued at the latest bid quotation or an evaluated price from an independent pricing service. If a bid quotation or evaluated price from a pricing vendor is not available for short-term debt instrument or money market instrument maturing in 60 days or less from date of valuation, such
68 OAKMARK FUNDS
Oakmark Funds
Notes to Financial Statements (continued)
instruments are valued at amortized cost, which approximates market value. All other debt instruments are valued at the latest bid quotation or at an evaluated price provided by an independent pricing service. The pricing service may use standard inputs, such as benchmark yields, reported trades, broker-dealer quotes, issuer spreads, two-sided markets, benchmark securities, bids, offers, and reference data, including market research publications. For certain security types, additional inputs may be used or some of the standard inputs may not be applicable. Additionally, the pricing service monitors market indicators and industry and economic events, which may serve as a trigger to gather and possibly use additional market data. Options are valued at the mean of the most recent bid and asked quotations. In the event an option is out-of-the-money and no bid is available, a zero value may be assumed as the bid for purposes of calculating the mean of the most recent bid and ask quotations. In the event that designated pricing vendors are unable to provide valuations or timely valuations for FLEX options on a given day, each FLEX option purchased or written may be valued using the Option Valuation (OVME) function on Bloomberg. The OVME function requires objective inputs (strike price, exercise style and expiration dates) to derive a valuation using Bloomberg's proprietary calculations. FLEX options shall be valued at the mid of the buy and sell valuations produced by OVME. If values or prices are not readily available or are deemed unreliable, or if an event that is expected to affect the value of a portfolio security occurs after the close of the primary market or exchange on which that security is traded and before the close of the NYSE, the security will be valued at a fair value determined in good faith in accordance with Fund policies and procedures approved by the Board. The Funds may use a systematic fair valuation model provided by an independent pricing service to value securities of non-U.S. issuers in order to adjust for changes in value that may occur between the close of certain foreign exchanges and the NYSE. All assets and liabilities initially expressed in foreign currencies are converted into U.S. dollars at a current exchange price quoted by an independent pricing service or any major bank or dealer. If such quotations are not available, the rate of exchange will be determined in good faith in accordance with Fund policies and procedures. Although fair valuation may be more commonly used with equity securities of non-U.S. issuers, it also may be used in a range of other circumstances, including thinly-traded domestic securities or fixed-income securities. When fair value pricing is employed, the value of a portfolio security used by a Fund to calculate its NAV may differ from quoted or published prices for the same security.
Fair value measurement
Various inputs are used in determining the value of each Fund's investments. These inputs are prioritized into three broad levels as follows:
Level 1—quoted prices in active markets for identical securities
Level 2—other significant observable inputs (including quoted prices for similar investments, interest rates, prepayment speeds, credit risk and others)
Level 3—significant unobservable inputs (including the assumptions of the Adviser in determining the fair value of investments)
Observable inputs are those based on market data obtained from independent sources and unobservable inputs reflect the Adviser's own assumptions based on the best information available. The input levels are not necessarily an indication of risk or liquidity associated with investing in those securities.
The following is a summary of the inputs used as of March 31, 2021, in valuing each Fund's assets and liabilities. Except for the industries or investment types separately stated below, the total amounts for common stocks, fixed income and short-term investments in the table below are presented by industry or investment type in each Fund's Schedule of Investments. Information on forward foreign currency contracts is presented in each Fund's Schedule of Investments.
(in thousands) | | Quoted Prices
in Active
Markets for
Identical
Assets
(Level 1) | | Other
Significant
Observable
Inputs
(Level 2) | | Significant
Unobservable
Inputs
(Level 3) | |
Oakmark | | | | | | | | | | | | | |
Common Stocks | | $ | 14,908,378 | | | $ | 0 | | | $ | 0 | | |
Short-Term Investments | | | 0 | | | | 338,138 | | | | 0 | | |
Call Options Written | | | (40,996 | ) | | | 0 | | | | 0 | | |
Total | | $ | 14,867,382 | | | $ | 338,138 | | | $ | 0 | | |
Select | | | | | | | | | | | | | |
Common Stocks | | $ | 4,665,515 | | | $ | 0 | | | $ | 0 | | |
Short-Term Investments | | | 0 | | | | 133,733 | | | | 0 | | |
Call Options Written | | | (25,843 | ) | | | 0 | | | | 0 | | |
Total | | $ | 4,639,672 | | | $ | 133,733 | | | $ | 0 | | |
Oakmark.com 69
Oakmark Funds
Notes to Financial Statements (continued)
(in thousands) | | Quoted Prices
in Active
Markets for
Identical
Assets
(Level 1) | | Other
Significant
Observable
Inputs
(Level 2) | | Significant
Unobservable
Inputs
(Level 3) | |
Global | | | | | | | | | | | | | |
Common Stocks | | $ | 1,526,042 | | | $ | 0 | | | $ | 0 | | |
Warrants | | | 157 | | | | 0 | | | | 0 | | |
Short-Term Investments | | | 0 | | | | 39,580 | | | | 0 | | |
Forward Foreign Currency Contracts - Assets | | | 0 | | | | 1,259 | | | | 0 | | |
Total | | $ | 1,526,199 | | | $ | 40,839 | | | $ | 0 | | |
Global Select | | | | | | | | | | | | | |
Common Stocks | | $ | 1,590,194 | | | $ | 0 | | | $ | 0 | | |
Short-Term Investments | | | 0 | | | | 44,996 | | | | 0 | | |
Forward Foreign Currency Contracts - Assets | | | 0 | | | | 1,646 | | | | 0 | | |
Total | | $ | 1,590,194 | | | $ | 46,642 | | | $ | 0 | | |
International | | | | | | | | | | | | | |
Common Stocks | | $ | 26,465,462 | | | $ | 0 | | | $ | 0 | | |
Preferred Stocks | | | 53,644 | | | | 0 | | | | 0 | | |
Short-Term Investments | | | 0 | | | | 819,405 | | | | 0 | | |
Forward Foreign Currency Contracts - Assets | | | 0 | | | | 21,271 | | | | 0 | | |
Total | | $ | 26,519,106 | | | $ | 840,676 | | | $ | 0 | | |
Int'l Small Cap | | | | | | | | | | | | | |
Common Stocks | | $ | 1,469,058 | | | $ | 0 | | | $ | 0 | | |
Short-Term Investments | | | 0 | | | | 50,045 | | | | 0 | | |
Forward Foreign Currency Contracts - Assets | | | 0 | | | | 1,230 | | | | 0 | | |
Total | | $ | 1,469,058 | | | $ | 51,275 | | | $ | 0 | | |
Equity and Income | | | | | | | | | | | | | |
Common Stocks | | $ | 5,323,866 | | | $ | 0 | | | $ | 0 | | |
Preferred Stocks | | | 24,269 | | | | 0 | | | | 0 | | |
Corporate Bonds | | | 0 | | | | 1,367,125 | | | | 0 | | |
Government and Agency Securities | | | 0 | | | | 531,561 | | | | 0 | | |
Bank Loans | | | 0 | | | | 73,568 | | | | 0 | | |
Short-Term Investments | | | 0 | | | | 475,679 | | | | 0 | | |
Total | | $ | 5,348,135 | | | $ | 2,447,933 | | | $ | 0 | | |
Bond | | | | | | | | | | | | | |
Preferred Stocks | | $ | 1,965 | | | $ | 0 | | | $ | 0 | | |
Corporate Bonds | | | 0 | | | | 53,668 | | | | 0 | | |
Government and Agency Securities | | | 0 | | | | 21,916 | | | | 0 | | |
Bank Loans | | | 0 | | | | 5,998 | | | | 0 | | |
Short-Term Investments | | | 0 | | | | 7,563 | | | | 0 | | |
Total | | $ | 1,965 | | | $ | 89,145 | | | $ | 0 | | |
Offsetting assets and liabilities
ASC 210 requires entities to disclose gross and net information about instruments and transactions eligible for offset on the Statement of Assets and Liabilities and disclose instruments and transactions subject to master netting or similar agreements. This disclosure is limited to derivative instruments, repurchase and reverse repurchase agreements, and securities borrowing and lending transactions.
70 OAKMARK FUNDS
Oakmark Funds
Notes to Financial Statements (continued)
At March 31, 2021, certain Funds held open forward foreign currency contracts that were subject to a foreign exchange settlement and netting agreement with the same counterparty. The agreement includes provisions for general obligations, representations and certain events of default or termination. The agreement includes provisions for netting arrangements that may reduce credit risk and counterparty risk associated with relevant transactions in the event a counterparty fails to meet its obligations. The net recognized assets or liabilities related to open forward foreign currency contracts are presented in the Statements of Assets and Liabilities. The gross recognized assets (appreciation) and liabilities (depreciation) by contract are presented in the forward foreign currency contract table included in the Fund's Schedule of Investments.
At March 31, 2021, each Fund held investments in repurchase agreements. The gross value of these investments and the value of the related collateral are presented in each Fund's Schedule of Investments. The value of the related collateral for each Fund exceeded the value of the repurchase agreements held at period end.
The value of the securities on loan and the value of the related collateral as of period end, if any, are included in the Securities lending section of Note 1 to Financial Statements.
Foreign currency translations
Certain Funds invest in foreign securities, which may involve a number of risk factors and special considerations not present with investments in securities of U.S. corporations. Values of investments and other assets and liabilities denominated in foreign currencies are translated into U.S. dollars at current exchange rates obtained by a recognized bank, dealer or independent pricing service on the day of valuation. Purchases and sales of investments and dividend and interest income are converted at the prevailing rate of exchange on the respective dates of such transactions.
The Funds do not isolate that portion of the results of operations resulting from changes in foreign exchange rates on investments from the fluctuations arising from changes in market prices of securities held. Such fluctuations are included in net realized gain (loss) on investments and net change in unrealized appreciation (depreciation) on investments in the Statements of Operations. Net realized gains and losses on foreign currency transactions arising from the sale of foreign currencies, currency gains or losses realized between the trade and settlement dates on securities transactions and the difference between the amounts of dividends, interest and tax reclaims recorded and the U.S. dollar equivalent of the amounts actually received or paid are included in net realized gain (loss) on foreign currency transactions in the Statements of Operations. Unrealized gains and losses arising from changes in the fair value of assets and liabilities, other than investments in securities, resulting from changes in exchange rates are included in net change in unrealized appreciation (depreciation) on foreign currency translation in the Statements of Operations.
Forward foreign currency contracts
Forward foreign currency contracts are agreements to exchange one currency for another at a future date and at a specified price. The Funds' transactions in forward foreign currency contracts are limited to transaction and portfolio hedging. The contractual amounts of forward foreign currency contracts do not necessarily represent the amounts potentially subject to risk. The measurement of the risks associated with these instruments is meaningful only when all related and offsetting transactions are considered and could exceed the net unrealized value shown in the tables below. Risks arise from the possible inability of counterparties to meet the terms of their contracts and from movements in currency values. Forward foreign currency contracts are valued at the current day's interpolated foreign exchange rates. Unrealized gain or loss on the contracts, as measured by the difference between the forward foreign exchange rates at the dates of entry into the contracts and the forward rates at the end of the period, is included in the Statements of Assets and Liabilities. Realized gains and losses and the net change in unrealized appreciation (depreciation) on forward foreign currency contracts for the period are included in the Statements of Operations.
At March 31, 2021, Global, Global Select, International and Int'l Small Cap held non-collateralized, forward foreign currency contracts, which are considered derivative instruments, each of whose counterparty is State Street Bank and Trust Company ("State Street") and are listed in the Fund's Schedule of Investments.
For the period ended March 31, 2021, the notional value of forward foreign currency contracts opened and the notional value of settled contracts is listed by Fund in the table below (in thousands):
Fund | | Currency
Contracts Opened | | Currency
Contracts Settled | |
Global | | $ | 19,526 | | | $ | 16,577 | | |
Global Select | | | 25,519 | | | | 26,336 | | |
International | | | 329,846 | | | | 218,612 | | |
Int'l Small Cap | | | 19,078 | | | | 13,267 | | |
Security transactions and investment income
Security transactions are accounted for on the trade date (date the order to buy or sell is executed) and dividend income is recorded on the ex-dividend date, except that certain dividends from foreign securities are recorded as soon as the information becomes available after the ex-dividend date. Interest income and expenses are recorded on an accrual basis. Discount is accreted on long-term fixed income securities using the yield-to-maturity method. Premium is amortized on long-term fixed income securities using the yield-to-earliest call method. Withholding taxes and tax reclaims on foreign dividends have been provided for in
Oakmark.com 71
Oakmark Funds
Notes to Financial Statements (continued)
accordance with the Funds' understanding of the applicable country's tax rules and rates. Net realized gains and losses on investments are determined by the specific identification method.
Short sales
Each Fund may sell a security it does not own in anticipation of a decline in the fair value of that security. When a Fund sells a security short, it must borrow the security sold short and deliver it to the broker-dealer through which it made the short sale. A gain, limited to the price at which the Fund sold the security short, or loss, unlimited in size, will be recognized upon the termination of the short sale. Each Fund may sell shares of when-issued securities. Typically, a Fund sells when-issued securities when a company announces a spin-off or re-organization, and the post-spin-off or post-re-organization shares begin trading on a when-issued basis prior to the effective date of the corporate action. A sale of a when-issued security is treated as a short sale for accounting purposes. After the effective date, when shares of the new company are received, any shares sold on a when-issued basis will be delivered to the counterparty. At March 31, 2021, none of the Funds had short sales.
When-issued or delayed-delivery securities
Each Fund may purchase securities on a when-issued or delayed-delivery basis. Although the payment and interest terms of these securities are established at the time a Fund enters into the commitment, the securities may be delivered and paid for a month or more after the date of purchase when their value may have changed. A Fund makes such commitments only with the intention of actually acquiring the securities, but may sell the securities before the settlement date if the Adviser deems it advisable for investment reasons. At March 31, 2021, none of the Funds held when-issued securities.
Accounting for options
When a Fund writes an option, the premium received by the Fund is recorded as a liability and is subsequently adjusted to the current fair value of the option written. Premiums received from writing options that expire are recorded by the Fund on the expiration date as realized gains from option transactions. The difference between the premium and the amount paid on effecting a closing purchase transaction, including brokerage commissions, is also treated as a realized gain, or if the premium is less than the amount paid for the closing purchase transaction, as a realized loss. If a call option is exercised, the premium is added to the proceeds from the sale of the underlying security or currency in determining whether the Fund has realized a gain or a loss. If a put option is exercised, the premium reduces the cost basis of the security or currency purchased by the Fund. In writing an option, the Fund bears the market risk of an unfavorable change in the price of the security or currency underlying the written option. As the writer of a covered call option on a security, a Fund foregoes, during the option's life, the opportunity to profit from increases in the market value of the security covering the call option above the sum of the premium and the exercise price of the call. Exercise of an option written by the Fund could result in the Fund selling or buying a security or currency at a price different from the current fair value. Options written by the Fund do not give rise to counterparty credit risk, as they obligate the Fund, not its counterparties, to perform.
When a Fund purchases an option, the premium paid by the Fund is recorded as an asset and is subsequently adjusted to the current fair value of the option purchased. Purchasing call options tends to increase the Fund's exposure to the underlying instrument. Purchasing put options tends to decrease the Fund's exposure to the underlying instrument. Premiums paid for purchasing options that expire are treated as realized losses. Premiums paid for purchasing options that are exercised or closed are added to the amounts paid or offset against the proceeds on the underlying security to determine the realized gain or loss. The risks associated with purchasing put and call options are potential loss of the premium paid and, in the instances of OTC derivatives, the failure of the counterparty to honor its obligation under the contract.
Oakmark and Select used purchased options for tax management purposes during the period ended March 31, 2021. Realized gains and losses and the net change in unrealized appreciation (depreciation) on purchased equity options for the period, if any, are included in the Fund's Statement of Operations. There were no outstanding purchased options as of March 31, 2021.
Oakmark and Select used options written for tax management purposes during the period ended March 31, 2021. Realized gains and losses and the net change in unrealized appreciation (depreciation) on written equity options for the period, if any, are included in the Fund's Statement of Operations. Written options outstanding, if any, are listed on each Fund's Schedule of Investments and shown as liabilities on the Fund's Statement of Assets and Liabilities.
For the period ended March 31, 2021, the amount of premiums paid (received) for equity options purchased and written are listed by Fund in the table below (in thousands):
Fund | | Equity Options
Purchased | | Equity Options
Written | |
Oakmark | | $ | 8,297 | | | $ | (62,974 | ) | |
Select | | | 6,332 | | | | (38,468 | ) | |
Credit facility
The Trust has a $200 million committed unsecured line of credit and a $300 million uncommitted unsecured discretionary demand line of credit (the "Facility") with State Street. Prior to February 26, 2021, borrowings under the Facility bore interest at
72 OAKMARK FUNDS
Oakmark Funds
Notes to Financial Statements (continued)
1.25% above the greater of the Federal Funds Effective Rate or LIBOR, as defined in the credit agreement. Beginning February 26, 2021, borrowings under the Facility bear interest at 1.35% above the greater of the Federal Funds Effective Rate or the Overnight Bank Fund Rate, as defined in the credit agreement. To maintain the Facility, an annualized commitment fee of 0.20% on the unused committed portion is charged to the Trust. Fees and interest expense, if any, related to the Facility are included in other expenses in the Statements of Operations. There were no borrowings under the Facility during the period ended March 31, 2021.
Expense offset arrangement
State Street serves as custodian of the Funds. State Street's fee may be reduced by credits that are an earnings allowance calculated on the average daily cash balances each Fund maintains with State Street. Credit balances used to reduce the Funds' custodian fees, if any, are reported as a reduction of total expenses in the Statements of Operations. During the period ended March 31, 2021, none of the Funds received an expense offset credit.
Repurchase agreements
Each Fund may invest in repurchase agreements, which are short-term investments whereby the Fund acquires ownership of a debt security and the seller agrees to repurchase the security at a future date at a specified price.
The Funds' custodian receives delivery of the underlying securities collateralizing repurchase agreements. It is the Funds' policy that the value of the collateral be at least equal to 102% of the repurchase price, including interest. The Adviser is responsible for determining that the value of the collateral is at all times at least equal to 102% of the repurchase price, including interest. Repurchase agreements could involve certain risks in the event of default or insolvency of the counterparty, including possible delays or restrictions upon a Fund's ability to dispose of the underlying securities. At March 31, 2021, all of the Funds held repurchase agreements.
Security lending
Each Fund may lend its portfolio securities to broker-dealers and banks. Any such loan must be continuously secured by collateral in cash, cash equivalents or U.S. Treasury or agency securities maintained on a current basis in an amount at least equal to the fair value of the securities loaned by a Fund. The Fund would continue to receive the equivalent of the interest or dividends paid by the issuer on the securities loaned and would also receive an additional return that may be in the form of a fixed fee or a percentage of the earnings on the collateral. The Fund has the right to call the loan and attempt to obtain the securities loaned at any time on notice of not more than five business days. In the event of bankruptcy or other default of the borrower, the Fund could experience delays in liquidating the loan collateral or recovering the loaned securities and incur expenses related to enforcing its rights. There could also be a decline in the value of the collateral or in the fair value of the securities loaned while the Fund seeks to enforce its rights thereto and the Fund could experience subnormal levels of income or lack of access to income during that period. A Fund may not exercise proxy voting rights for a security that is on loan if it is unable to recall the security prior to the record date. The Trust, on behalf of the Funds, has entered into an agreement with State Street to serve as its agent for the purpose of lending securities and maintaining the collateral account. Security lending income, if any, net of any fees retained by the securities lending agent, is included in the Statement of Operations.
At March 31, 2021, International and Int'l Small Cap had securities on loan with a value of $75,541,717 and $14,560,737, respectively, and held as collateral for the loans U.S. Treasury securities with a value of $79,436,112 and $15,298,630, respectively.
Interfund lending
Pursuant to an exemptive order issued by the SEC, the Funds may participate in an interfund lending program. This program provides an alternative credit facility that allows the Funds to lend money to, and borrow money from, each other for temporary purposes (an "Interfund Loan"). All Interfund Loans are subject to conditions pursuant to the SEC exemptive order designed to ensure fair and equitable treatment of participating Funds. Any Interfund Loan would consist only of uninvested cash reserves that the lending Fund otherwise would invest in short-term repurchase agreements or other short-term instruments. There were no interfund loans during the period ended March 31, 2021.
Oakmark.com 73
Oakmark Funds
Notes to Financial Statements (continued)
2. TRANSACTIONS WITH AFFILIATES
Each Fund has an investment advisory agreement with the Adviser. For management services and facilities furnished, the Adviser receives from each Fund a monthly fee based on that Fund's net assets at the end of the preceding month. Annual fee rates are as follows:
Effective December 15, 2020, the annual rates of fees as a percentage of each other Fund's net assets are as follows:
Fund | | Advisory Fees | |
Oakmark
| | 0.686% up to $250 million;
0.661% on the next $250 million;
0.641% on the next 4.5 billion;
0.626% on the next $10 billion;
0.596% on the next $5 billion;
0.566% on the next $5 billion;
0.536% on the next $10 billion; and
0.516% over $35 billion | |
Select
| | 0.778% up to $250 million;
0.753% on the next $250 million;
0.733% on the next $3.5 billion;
0.713% on the next $5 billion;
0.653% on the next $2 billion; and
0.628% over $11 billion | |
Global
| | 0.850% up to $250 million;
0.825% on the next $250 million;
0.805% on the next $4.5 billion;
0.790% on the next $10 billion; and
0.780% over $15 billion | |
Global Select
| | 0.820% up to $250 million;
0.795% up to $250 million;
0.775% on the next $4.5 billion;
0.760% on the next $10 billion; and
0.750% over $15 billion | |
Fund | | Advisory Fees | |
International
| | 0.805% up to $250 million;
0.780% on the next $250 million;
0.760% on the next 4.5 billion;
0.745% on the next $10 billion;
0.730% on the next $20 billion;
0.720% on the next $5 billion;
0.710% on the next $5 billion; and
0.700% over $45 billion | |
Int'l Small Cap
| | 1.040% up to $250 million;
1.015% on the next $250 million;
0.995% on the next $4.5 billion;
0.980% on the next $10 billion; and
0.970% over $15 billion | |
Equity and Income
| | 0.600% up to $250 million;
0.575% on the next 250 million;
0.555% on the next $4.5 billion;
0.525% on the next $5 billion;
0.495% on the next $3 billion;
0.465% on the next $3.5 billion;
0.435% on the next $10 billion; and
0.405% over $26.5 billion | |
Bond | | 0.39% of net assets | |
Prior to December 15, 2020, the annual rates of fees as a percentage of each other Fund's net assets are as follows:
Fund | | Advisory Fees | |
Oakmark
| | 1.00% up to $2 billion;
0.90% on the next $1 billion;
0.80% on the next $2 billion;
0.75% on the next $2.5 billion;
0.675% on the next $2.5 billion;
0.625% on the next $2.5 billion;
0.620% on the next $12.5 billion;
0.615% on the next $10 billion; and
0.610% over $35 billion | |
Select
| | 1.00% up to $1 billion;
0.95% on the next $500 million;
0.90% on the next $500 million;
0.85% on the next $500 million;
0.80% on the next $2.5 billion;
0.75% on the next $5 billion; and
0.725% over $10 billion | |
Global
| | 1.00% up to $2 billion;
0.95% on the next $2 billion;
0.90% on the next $4 billion; and
0.875% over $8 billion | |
Global Select
| | 1.00% up to $2 billion;
0.95% on the next $1 billion;
0.875% over $4 billion; and
0.85% over $7 billion | |
Fund | | Advisory Fees | |
International
| | 1.00% up to $2 billion;
0.95% on the next $1 billion;
0.85% on the next $2 billion;
0.825% on the next $2.5 billion;
0.815% on the next $3.5 billion;
0.805% on the next $5.5 billion;
0.80% on the next $6.5 billion;
0.795% on the next $7 billion;
0.790% on the next $5 billion;
0.785% on the next $10 billion;
0.775% on the next $5 billion; and
0.770% over $50 billion | |
Int'l Small Cap
| | 1.25% up to $500 million;
1.10% on the next $1 billion;
1.05% on the next $2 billion;
1.025% on the next $1.5 billion; and
1.00% over $5 billion | |
Equity and Income
| | 0.75% up to $5 billion;
0.70% on the next $2.5 billion;
0.675% on the next $2.5 billion;
0.65% on the next $2.5 billion;
0.60% on the next $3.5 billion;
0.585% on the next $5 billion;
0.5775% on the next $7 billion; and
0.5725% over $28 billion | |
Bond | | 0.39% of net assets | |
74 OAKMARK FUNDS
Oakmark Funds
Notes to Financial Statements (continued)
Effective December 15, 2020, the Adviser has contractually agreed, through January 27, 2022, to waive the advisory fee otherwise payable to it by 0.02% with respect to each Fund, except Bond Fund. When determining whether a Fund's total expenses exceed the additional contractual expense cap described below, a Fund's net advisory fee, reflecting application of the advisory fee waiver, will be used to calculate a Fund's total expenses. The Adviser is not entitled to collect on or make a claim for waived fees that are the subject of this undertaking at any time in the future. This arrangement may only be modified or amended with approval from a Fund and the Adviser. The advisory fees waived for each Fund are included in the Statement of Operations.
Prior to December 15, 2020, the Adviser had contractually agreed, through January 27, 2021, to waive the advisory fee otherwise payable to it by the following percentages with respect to each Fund: 0.043% for Oakmark; 0.074% for Select; 0.059% for Global; 0.066% for Global Select; 0.052% for International and 0.099% for Equity and Income.
The Adviser has contractually agreed, through January 27, 2022, to reimburse each Fund Class to the extent, but only to the extent that the annualized expenses (excluding taxes, interest, all commissions and other normal charges incident to the purchase and sale of portfolio securities, and extraordinary charges such as litigation costs, but including fees paid to the Adviser) exceed the percent set forth below of average daily net assets of each Fund Class.
Fund | | Investor
Class | | Advisor
Class | | Institutional
Class | | R6
Class | | Service
Class | |
Oakmark | | | 1.40 | % | | | 1.15 | % | | | 1.10 | % | | | 0.95 | % | | | 1.40 | % | |
Select | | | 1.50 | | | | 1.25 | | | | 1.20 | | | | 1.05 | | | | 1.50 | | |
Global | | | 1.55 | | | | 1.30 | | | | 1.25 | | | | 1.10 | | | | 1.55 | | |
Global Select | | | 1.55 | | | | 1.30 | | | | 1.25 | | | | 1.10 | | | | — | | |
International | | | 1.55 | | | | 1.30 | | | | 1.25 | | | | 1.10 | | | | 1.55 | | |
Int'l Small Cap | | | 1.75 | | | | 1.50 | | | | 1.45 | | | | 1.30 | | | | 1.75 | | |
Equity and Income | | | 1.25 | | | | 1.00 | | | | 0.95 | | | | 0.80 | | | | 1.25 | | |
Bond | | | — | | | | 0.64 | | | | 0.59 | | | | 0.44 | | | | — | | |
Prior to December 15, 2020, the Adviser had contractually agreed, through January 27, 2021, to reimburse each Fund Class to the extent, but only to the extent that the annualized expenses (excluding taxes, interest, all commissions and other normal charges incident to the purchase and sale of portfolio securities, and extraordinary charges such as litigation costs, but including fees paid to the Adviser) exceed the percent set forth below of average daily net assets of each Fund Class.
Fund | | Investor
Class | | Advisor
Class | | Institutional
Class | | Service
Class | |
Oakmark | | | 1.50 | % | | | 1.40 | % | | | 1.30 | % | | | 1.75 | % | |
Select | | | 1.50 | | | | 1.40 | | | | 1.30 | | | | 1.75 | | |
Global | | | 1.75 | | | | 1.65 | | | | 1.55 | | | | 2.00 | | |
Global Select | | | 1.75 | | | | 1.65 | | | | 1.55 | | | | 2.00 | | |
International | | | 2.00 | | | | 1.90 | | | | 1.80 | | | | 2.25 | | |
Int'l Small Cap | | | 2.00 | | | | 1.90 | | | | 1.80 | | | | 2.25 | | |
Equity and Income | | | 1.00 | | | | 0.90 | | | | 0.80 | | | | 1.25 | | |
Bond | | | — | | | | 0.54 | | | | 0.44 | | | | — | | |
During the six-month period ended March 31, 2021, Fund Class expenses have been reimbursed as follows1:
Fund | | Class | | Amount | |
Bond | | Advisor | | $ | 1 | | |
Bond | | Institutional | | | 79 | | |
Bond | | R6 | | | 121 | | |
The Adviser is entitled to recoup from assets attributable to any Fund Class amounts reimbursed to that Fund Class, except to the extent that the Fund Class already has paid such recoupment to the Adviser or such recoupment would cause that Class' total operating expenses to exceed the expense limitation or to exceed any lower limit in effect at the time of recoupment. Any such repayment must be made within three fiscal years after the year in which the reimbursement occurred. As of March 31, 2021, the following amounts are subject to recoupment (in thousands).
Fund | | Class | | Amount Incurred | | Date | | Expiration Date | |
Bond | | Advisor | | $ | 5 | | | 09/30/20 | | 09/30/2023 | |
Bond | | Institutional | | | 422 | | | 09/30/20 | | 09/30/2023 | |
1 Expenses reimbursed are subject to possible recovery until September 30, 2024
Oakmark.com 75
Oakmark Funds
Notes to Financial Statements (continued)
The Adviser and/or the Funds have entered into agreements with financial intermediaries to provide recordkeeping, processing, shareholder communications and other services to customers of the intermediaries and have agreed to compensate the intermediaries for providing those services. Certain of those services would be provided by the Funds if the shares of those customers were registered directly with the Funds' transfer agent. Accordingly, the Funds pay a portion of the intermediary fees pursuant to an agreement with the Adviser and the Adviser pays the remainder of the fees. The fees incurred by the Funds are reflected as other shareholder servicing fees in the Statements of Operations.
The Independent Trustees of the Trust may participate in the Trust's Deferred Compensation Plan for Independent Trustees. Participants in the plan may elect to defer all or a portion of their compensation. Amounts deferred are retained by the Trust and represent an unfunded obligation of the Trust. The value of a participant's deferral account is determined by reference to the change in value of one or more approved funds as specified by the participant. Benefits would be payable after a stated number of years or retirement from the Board of Trustees. The accrued obligations of the Funds under the plan are reflected as deferred Trustee compensation in the Statements of Assets and Liabilities. The change in the accrued obligations for the period is included in Trustees' fees in the Statements of Operations. The Trust pays the compensation of the Trustees other than those affiliated with the Adviser and all expenses incurred in connection with their services to the Trust. The Trust does not provide any pension or retirement benefits to its Trustees.
The Funds reimburse the Adviser for a portion of the compensation paid to the Funds' Chief Compliance Officer ("CCO"). The CCO expenses incurred by the Funds are included in other expenses in the Statements of Operations.
3. FEDERAL INCOME TAXES
It is each Fund's policy to comply with the requirements of the Internal Revenue Code applicable to regulated investment companies and to distribute substantially all of its net taxable income, including any net realized gains on investments, to its shareholders. Therefore, no federal income tax provision is required. The Adviser has determined that no income tax provision for uncertain tax positions is required in the Funds' financial statements. Generally, each of the tax years in the four-year period ended March 31, 2021, remains subject to examination by taxing authorities.
At March 31, 2021, the cost of investments for federal income tax purposes and related composition of unrealized gains and losses for each Fund were as follows (in thousands):
Fund | | Cost of Investments
for Federal Income
Tax Purposes | | Gross Unrealized
Appreciation | | Gross Unrealized
(Depreciation) | | Net Unrealized
Appreciation
(Depreciation) | |
Oakmark | | $ | 7,792,993 | | | $ | 7,418,169 | | | $ | (5,639 | ) | | $ | 7,412,530 | | |
Select | | | 2,403,406 | | | | 2,369,999 | | | | (4,493 | ) | | | 2,365,506 | | |
Global | | | 1,035,913 | | | | 556,756 | | | | (27,871 | ) | | | 528,885 | | |
Global Select | | | 1,205,664 | | | | 505,114 | | | | (75,588 | ) | | | 429,526 | | |
International | | | 24,547,563 | | | | 4,831,332 | | | | (2,062,240 | ) | | | 2,769,092 | | |
Int'l Small Cap | | | 1,286,539 | | | | 314,088 | | | | (81,525 | ) | | | 232,563 | | |
Equity and Income | | | 4,946,449 | | | | 2,855,608 | | | | (5,989 | ) | | | 2,849,619 | | |
Bond | | | 90,879 | | | | 1,249 | | | | (1,018 | ) | | | 231 | | |
As of March 31, 2021, the short- and long-term capital losses available to offset future capital gains were as follows (in thousands):
| | | Short-Term | | Long-Term | | Total | |
Select | | $ | 4,095 | | | $ | 0 | | | $ | 4,095 | | |
International | | | 1,530,208 | | | | 565,661 | | | | 2,095,869 | | |
Int'l Small Cap | | | 101,887 | | | | 27,065 | | | | 128,952 | | |
At March 31, 2021, the components of distributable earnings on a tax basis (excluding unrealized appreciation (depreciation)) were as follows (in thousands):
| | | Undistributed
Ordinary Income | | Undistributed Long-
Term Gain | | Total Distributable
Earnings | |
Oakmark | | $ | 85,448 | | | $ | 113,342 | | | $ | 198,790 | | |
Select | | | 56 | | | | 0 | | | | 56 | | |
Global | | | 4,375 | | | | 116,627 | | | | 121,002 | | |
Global Select | | | 724 | | | | 118,648 | | | | 119,372 | | |
International | | | 187,089 | | | | 0 | | | | 187,089 | | |
Int'l Small Cap | | | 4,240 | | | | 0 | | | | 4,240 | | |
Equity and Income | | | 24,077 | | | | 427,557 | | | | 451,634 | | |
Bond | | | 1,158 | | | | 0 | | | | 1,158 | | |
76 OAKMARK FUNDS
Oakmark Funds
Notes to Financial Statements (continued)
During the six-month period ended March 31, 2021, and the year ended September 30, 2020, the tax character of distributions paid was as follows (in thousands):
| | | Period Ended
March 31, 2020 | | Year Ended
September 30, 2020 | |
Fund | | Distributions Paid
from Ordinary
Income | | Distributions Paid
from Long-Term
Capital Gain | | Distributions Paid
from Ordinary
Income | | Distributions Paid
from Long-Term
Capital Gain | |
Oakmark | | $ | 30,306 | | | $ | 0 | | | $ | 138,686 | | | $ | 1,199,242 | | |
Select | | | 6,314 | | | | 0 | | | | 34,620 | | | | 0 | | |
Global | | | 3,426 | | | | 0 | | | | 25,072 | | | | 40,099 | | |
Global Select | | | 1,355 | | | | 0 | | | | 24,758 | | | | 0 | | |
International | | | 118,038 | | | | 0 | | | | 621,120 | | | | 0 | | |
Int'l Small Cap | | | 28,022 | | | | 0 | | | | 4,834 | | | | 0 | | |
Equity and Income | | | 90,402 | | | | 232,614 | | | | 194,449 | | | | 804,605 | | |
Bond | | | 1,108 | | | | 0 | | | | 270 | | | | 0 | | |
On March 31, 2021, the Funds had temporary book/tax differences in undistributed earnings that were primarily attributable to trustee deferred compensation expenses, passive foreign investment companies, foreign currency contracts, deferrals of capital losses on wash sales and straddle adjustments. Temporary differences will reverse over time. The Funds have permanent differences in book/tax undistributed earnings primarily attributable to equalization debits, redemptions in kind and distribution re-designations. Permanent differences will be recorded in their respective component of the Analysis of Net Assets at the year ended September 30, 2021.
Permanent differences incurred during the six-month period ended March 31, 2021, will result in the following reclassifications among the components of net assets for the year ended September 30, 2021 (in thousands):
Fund | | Paid in Capital | | Distributable
Earnings | |
Oakmark | | $ | 795,290 | | | $ | (795,290 | ) | |
Select | | | 256,986 | | | | (256,986 | ) | |
Global | | | 10,783 | | | | (10,783 | ) | |
Global Select | | | 13,267 | | | | (13,267 | ) | |
International | | | 30,719 | | | | (30,719 | ) | |
Int'l Small Cap | | | 373 | | | | (373 | ) | |
Equity and Income | | | 612,508 | | | | (612,508 | ) | |
Bond | | | 0 | | | | 0 | | |
4. INVESTMENT TRANSACTIONS
For the six-month period ended March 31, 2021, transactions in investment securities (excluding short-term, in-kind transactions and U.S. government securities) were as follows (in thousands):
| | | Oakmark | | Select | | Global | | Global
Select | | International | | Int'l
Small Cap | | Equity and
Income | | Bond | |
Purchases | | $ | 1,466,149 | | | $ | 285,992 | | | $ | 255,643 | | | $ | 301,684 | | | $ | 5,930,492 | | | $ | 251,410 | | | $ | 616,572 | | | $ | 38,845 | | |
Proceeds from sales | | | 667,931 | | | | 138,013 | | | | 372,848 | | | | 423,460 | | | | 9,181,612 | | | | 363,386 | | | | 1,518,376 | | | | 28,484 | | |
Purchases at cost (in thousands) of long-term U.S. government securities for the period ended March 31, 2021, were $0 and $6,462, respectively, for Equity and Income and Bond. Proceeds from sales (in thousands) of long-term U.S. government securities for the period ended March 31, 2021 were $299,571 and $6,323, respectively, for Equity and Income and Bond.
During the six-month period ended March 31, 2021, Oakmark, Select, International, and Equity and Income had in-kind sales transactions (in thousands) of $ 1,174,503, $ 360,031, $87,634 and $ 698,005 respectively.
During the six-month period ended March 31, 2021, none of the Funds engaged in transactions with funds that have a common advisor.
5. INVESTMENTS IN AFFILIATED ISSUERS
A company was considered to be an affiliate of a Fund because that Fund owned 5% or more of the company's voting securities during all or part of the six-month period ended March 31, 2021. Purchase and sale transactions and dividend and interest income earned during the period on these securities are listed after the applicable Fund's Schedule of Investments.
Oakmark.com 77
Oakmark Funds
Notes to Financial Statements (continued)
6. SUBSEQUENT EVENTS
The Adviser has evaluated the possibility of subsequent events existing in the Funds' financial statements. The Adviser has determined that there are no material events that would require adjustment or disclosure in the Funds' financial statements through the date of the publication of this report.
The continued impact of the coronavirus pandemic ("COVID-19") on the financial results of each Fund will depend on future developments, including the duration and spread of COVID-19 and related advisories and restrictions. COVID-19 has resulted, and may continue to result, in significant market volatility, exchange trading suspensions and closures, global financial market declines, higher default rates, and substantial economic downturn in economies throughout the world. These developments and the impact of COVID-19 on the financial markets and the overall economy are highly uncertain and cannot be predicted. The effects of COVID-19 may materially impact the value and performance of each Fund, its ability to buy and sell fund investments at appropriate valuations, and its ability to achieve its investment objectives. If the financial markets and/or the overall economy are impacted for an extended period, the future financial results of each Fund may be materially adversely affected.
78 OAKMARK FUNDS

This page intentionally left blank.
Oakmark.com 79
Oakmark Funds
Financial Highlights
For a share outstanding throughout each period
| | | | | Income from Investment Operations: | | Less Distributions: | |
| | | Net Asset
Value,
Beginning of
Period | | Net
Investment
Income | | Net Gain
(Loss) on
Investments
(Both
Realized and
Unrealized) | | Total from
Investment
Operations | | Distributions
from Net
Investment
Income | | Distributions
from
Capital
Gains | | Total
Distributions | | Redemption
Fees | |
Oakmark Fund | |
Investor Class | |
10/1/2020-3/31/21+ | | $ | 72.67 | | | | 0.25 | (a) | | | 31.34 | | | | 31.59 | | | | (0.15 | ) | | | 0.00 | | | | (0.15 | ) | | | 0.00 | | |
9/30/20 | | $ | 77.89 | | | | 0.58 | (a) | | | 0.86 | | | | 1.44 | | | | (0.65 | ) | | | (6.01 | ) | | | (6.66 | ) | | | 0.00 | | |
9/30/19 | | $ | 88.99 | | | | 0.88 | (a) | | | (6.43 | ) | | | (5.55 | ) | | | (0.50 | ) | | | (5.05 | ) | | | (5.55 | ) | | | 0.00 | | |
9/30/18 | | $ | 82.85 | | | | 0.58 | (a) | | | 8.99 | | | | 9.57 | | | | (0.40 | ) | | | (3.03 | ) | | | (3.43 | ) | | | 0.00 | | |
9/30/17 | | $ | 68.70 | | | | 0.76 | | | | 15.26 | | | | 16.02 | | | | (0.77 | ) | | | (1.10 | ) | | | (1.87 | ) | | | 0.00 | | |
9/30/16 | | $ | 60.93 | | | | 0.82 | | | | 7.85 | | | | 8.67 | | | | (0.60 | ) | | | (0.30 | ) | | | (0.90 | ) | | | 0.00 | | |
Advisor Class | |
10/1/2020-3/31/21+ | | $ | 72.67 | | | | 0.32 | (a) | | | 31.34 | | | | 31.66 | | | | (0.24 | ) | | | 0.00 | | | | (0.24 | ) | | | 0.00 | | |
9/30/20 | | $ | 77.88 | | | | 0.66 | (a) | | | 0.87 | | | | 1.53 | | | | (0.73 | ) | | | (6.01 | ) | | | (6.74 | ) | | | 0.00 | | |
9/30/19 | | $ | 89.07 | | | | 0.96 | (a) | | | (6.46 | ) | | | (5.50 | ) | | | (0.64 | ) | | | (5.05 | ) | | | (5.69 | ) | | | 0.00 | | |
9/30/18 | | $ | 82.97 | | | | 0.68 | (a) | | | 8.99 | | | | 9.67 | | | | (0.54 | ) | | | (3.03 | ) | | | (3.57 | ) | | | 0.00 | | |
9/30/17(c) | | $ | 71.35 | | | | 0.66 | (a) | | | 10.96 | | | | 11.62 | | | | 0.00 | | | | 0.00 | | | | 0.00 | | | | 0.00 | | |
Institutional Class | |
10/1/2020-3/31/21+ | | $ | 72.72 | | | | 0.36 | (a) | | | 31.35 | | | | 31.71 | | | | (0.30 | ) | | | 0.00 | | | | (0.30 | ) | | | 0.00 | | |
9/30/20 | | $ | 77.95 | | | | 0.71 | (a) | | | 0.87 | | | | 1.58 | | | | (0.80 | ) | | | (6.01 | ) | | | (6.81 | ) | | | 0.00 | | |
9/30/19 | | $ | 89.09 | | | | 1.01 | (a) | | | (6.44 | ) | | | (5.43 | ) | | | (0.66 | ) | | | (5.05 | ) | | | (5.71 | ) | | | 0.00 | | |
9/30/18 | | $ | 82.97 | | | | 0.72 | (a) | | | 8.99 | | | | 9.71 | | | | (0.56 | ) | | | (3.03 | ) | | | (3.59 | ) | | | 0.00 | | |
9/30/17(c) | | $ | 71.35 | | | | 0.67 | (a) | | | 10.95 | | | | 11.62 | | | | 0.00 | | | | 0.00 | | | | 0.00 | | | | 0.00 | | |
Service Class | |
10/1/2020-3/31/21+ | | $ | 72.36 | | | | 0.16 | (a) | | | 31.21 | | | | 31.37 | | | | 0.00 | | | | 0.00 | | | | 0.00 | | | | 0.00 | | |
9/30/20 | | $ | 77.55 | | | | 0.37 | (a) | | | 0.84 | | | | 1.21 | | | | (0.39 | ) | | | (6.01 | ) | | | (6.40 | ) | | | 0.00 | | |
9/30/19 | | $ | 88.54 | | | | 0.66 | (a) | | | (6.37 | ) | | | (5.71 | ) | | | (0.23 | ) | | | (5.05 | ) | | | (5.28 | ) | | | 0.00 | | |
9/30/18 | | $ | 82.48 | | | | 0.33 | (a) | | | 8.95 | | | | 9.28 | | | | (0.19 | ) | | | (3.03 | ) | | | (3.22 | ) | | | 0.00 | | |
9/30/17 | | $ | 68.34 | | | | 0.47 | (a) | | | 15.28 | | | | 15.75 | | | | (0.51 | ) | | | (1.10 | ) | | | (1.61 | ) | | | 0.00 | | |
9/30/16 | | $ | 60.59 | | | | 0.59 | | | | 7.83 | | | | 8.42 | | | | (0.37 | ) | | | (0.30 | ) | | | (0.67 | ) | | | 0.00 | | |
Class R6 | |
3/31/21(d)+ | | $ | 88.42 | | | | 0.17 | (a) | | | 15.55 | | | | 15.72 | | | | 0.00 | | | | 0.00 | | | | 0.00 | | | | 0.00 | | |
| + Unaudited. | |
| † Data has been annualized. | |
| (a) Computed using average shares outstanding throughout the period. | |
| (b) Includes interest expense that amounts to less than 0.01%. | |
| (c) Commenced on 11/30/2016. | |
| (d) Commenced on 12/15/2020. | |
80 OAKMARK FUNDS
| | | | | | | Ratios/Supplemental Data: | | | |
| | | Net Asset
Value,
End of
Period | | Total
Return | | Net Assets,
End of
Period
($million) | | Ratio of
Net
Expenses
to Average
Net Assets | | Ratio of
Net
Investment
Income to
Average
Net Assets | | Ratio of
Gross
Expenses
to Average
Net Assets | | Portfolio
Turnover
Rate | |
Oakmark Fund | |
Investor Class | |
10/1/2020-3/31/21+ | | $ | 104.11 | | | | 43.51 | % | | $ | 7,906.0 | | | | 0.90 | %†(b) | | | 0.55 | %† | | | 0.93 | %†(b) | | | 5 | % | |
9/30/20 | | $ | 72.67 | | | | 1.18 | % | | $ | 6,153.4 | | | | 0.92 | % | | | 0.79 | % | | | 0.96 | % | | | 35 | % | |
9/30/19 | | $ | 77.89 | | | | -5.68 | % | | $ | 9,044.6 | | | | 0.88 | % | | | 1.13 | % | | | 0.92 | % | | | 51 | % | |
9/30/18 | | $ | 88.99 | | | | 11.84 | % | | $ | 12,626.2 | | | | 0.85 | % | | | 0.68 | % | | | 0.89 | % | | | 29 | % | |
9/30/17 | | $ | 82.85 | | | | 23.79 | % | | $ | 14,200.2 | | | | 0.86 | % | | | 0.91 | % | | | 0.90 | % | | | 19 | % | |
9/30/16 | | $ | 68.70 | | | | 14.36 | % | | $ | 14,636.0 | | | | 0.89 | % | | | 1.14 | % | | | 0.89 | % | | | 20 | % | |
Advisor Class | |
10/1/2020-3/31/21+ | | $ | 104.09 | | | | 43.63 | % | | $ | 4,595.1 | | | | 0.73 | %†(b) | | | 0.72 | %† | | | 0.76 | %†(b) | | | 5 | % | |
9/30/20 | | $ | 72.67 | | | | 1.30 | % | | $ | 3,269.5 | | | | 0.81 | % | | | 0.90 | % | | | 0.85 | % | | | 35 | % | |
9/30/19 | | $ | 77.88 | | | | -5.59 | % | | $ | 4,786.4 | | | | 0.78 | % | | | 1.23 | % | | | 0.82 | % | | | 51 | % | |
9/30/18 | | $ | 89.07 | | | | 11.96 | % | | $ | 5,400.6 | | | | 0.73 | % | | | 0.79 | % | | | 0.77 | % | | | 29 | % | |
9/30/17(c) | | $ | 82.97 | | | | 16.29 | % | | $ | 1,839.8 | | | | 0.72 | %† | | | 1.01 | %† | | | 0.76 | %† | | | 19 | % | |
Institutional Class | |
10/1/2020-3/31/21+ | | $ | 104.13 | | | | 43.67 | % | | $ | 1,756.7 | | | | 0.67 | %†(b) | | | 0.81 | %† | | | 0.70 | %†(b) | | | 5 | % | |
9/30/20 | | $ | 72.72 | | | | 1.36 | % | | $ | 1,839.7 | | | | 0.74 | % | | | 0.98 | % | | | 0.79 | % | | | 35 | % | |
9/30/19 | | $ | 77.95 | | | | -5.51 | % | | $ | 2,302.3 | | | | 0.70 | % | | | 1.29 | % | | | 0.75 | % | | | 51 | % | |
9/30/18 | | $ | 89.09 | | | | 12.01 | % | | $ | 3,330.6 | | | | 0.70 | % | | | 0.83 | % | | | 0.74 | % | | | 29 | % | |
9/30/17(c) | | $ | 82.97 | | | | 16.29 | % | | $ | 2,569.2 | | | | 0.68 | %† | | | 1.02 | %† | | | 0.73 | %† | | | 19 | % | |
Service Class | |
10/1/2020-3/31/21+ | | $ | 103.73 | | | | 43.35 | % | | $ | 66.5 | | | | 1.11 | %†(b) | | | 0.35 | %† | | | 1.14 | %†(b) | | | 5 | % | |
9/30/20 | | $ | 72.36 | | | | 0.90 | % | | $ | 53.7 | | | | 1.19 | % | | | 0.51 | % | | | 1.23 | % | | | 35 | % | |
9/30/19 | | $ | 77.55 | | | | -5.93 | % | | $ | 97.6 | | | | 1.15 | % | | | 0.86 | % | | | 1.19 | % | | | 51 | % | |
9/30/18 | | $ | 88.54 | | | | 11.51 | % | | $ | 143.4 | | | | 1.13 | % | | | 0.39 | % | | | 1.17 | % | | | 29 | % | |
9/30/17 | | $ | 82.48 | | | | 23.45 | % | | $ | 168.4 | | | | 1.14 | % | | | 0.63 | % | | | 1.18 | % | | | 19 | % | |
9/30/16 | | $ | 68.34 | | | | 14.00 | % | | $ | 177.2 | | | | 1.21 | % | | | 0.86 | % | | | 1.21 | % | | | 20 | % | |
Class R6 | |
3/31/21(d)+ | | $ | 104.14 | | | | 17.78 | % | | $ | 894.5 | | | | 0.64 | %†(b) | | | 0.58 | %† | | | 0.66 | %†(b) | | | 5 | % | |
| + Unaudited. | |
| † Data has been annualized. | |
| (a) Computed using average shares outstanding throughout the period. | |
| (b) Includes interest expense that amounts to less than 0.01%. | |
| (c) Commenced on 11/30/2016. | |
| (d) Commenced on 12/15/2020. | |
Oakmark.com 81
Oakmark Funds
Financial Highlights
For a share outstanding throughout each period
| | | | | Income from Investment Operations: | | Less Distributions: | |
| | | Net Asset
Value,
Beginning of
Period | | Net
Investment
Income | | Net Gain
(Loss) on
Investments
(Both
Realized and
Unrealized) | | Total from
Investment
Operations | | Distributions
from Net
Investment
Income | | Distributions
from
Capital
Gains | | Total
Distributions | | Redemption
Fees | |
Oakmark Select Fund | |
Investor Class | |
10/1/2020-3/31/21+ | | $ | 37.98 | | | | (0.02 | )(a) | | | 17.84 | | | | 17.82 | | | | 0.00 | | | | 0.00 | | | | 0.00 | | | | 0.00 | | |
9/30/20 | | $ | 39.20 | | | | 0.05 | (a) | | | (0.98 | ) | | | (0.93 | ) | | | (0.29 | ) | | | 0.00 | | | | (0.29 | ) | | | 0.00 | | |
9/30/19 | | $ | 45.84 | | | | 0.45 | (a) | | | (5.37 | ) | | | (4.92 | ) | | | (0.06 | ) | | | (1.66 | ) | | | (1.72 | ) | | | 0.00 | | |
9/30/18 | | $ | 47.84 | | | | 0.09 | (a) | | | (0.08 | ) | | | 0.01 | | | | (0.14 | ) | | | (1.87 | ) | | | (2.01 | ) | | | 0.00 | | |
9/30/17 | | $ | 40.99 | | | | 0.17 | | | | 8.78 | | | | 8.95 | | | | (0.40 | ) | | | (1.70 | ) | | | (2.10 | ) | | | 0.00 | | |
9/30/16 | | $ | 36.79 | | | | 0.39 | | | | 3.93 | | | | 4.32 | | | | (0.12 | ) | | | 0.00 | | | | (0.12 | ) | | | 0.00 | | |
Advisor Class | |
10/1/2020-3/31/21+ | | $ | 37.99 | | | | 0.00 | (a)(b) | | | 17.83 | | | | 17.83 | | | | (0.12 | ) | | | 0.00 | | | | (0.12 | ) | | | 0.00 | | |
9/30/20 | | $ | 39.21 | | | | 0.10 | (a) | | | (0.97 | ) | | | (0.87 | ) | | | (0.35 | ) | | | 0.00 | | | | (0.35 | ) | | | 0.00 | | |
9/30/19 | | $ | 45.90 | | | | 0.52 | (a) | | | (5.41 | ) | | | (4.89 | ) | | | (0.14 | ) | | | (1.66 | ) | | | (1.80 | ) | | | 0.00 | | |
9/30/18 | | $ | 47.90 | | | | 0.16 | (a) | | | (0.08 | ) | | | 0.08 | | | | (0.21 | ) | | | (1.87 | ) | | | (2.08 | ) | | | 0.00 | | |
9/30/17(c) | | $ | 41.93 | | | | 0.20 | (a) | | | 5.77 | | | | 5.97 | | | | 0.00 | | | | 0.00 | | | | 0.00 | | | | 0.00 | | |
Institutional Class | |
10/1/2020-3/31/21+ | | $ | 38.01 | | | | 0.04 | (a) | | | 17.83 | | | | 17.87 | | | | (0.13 | ) | | | 0.00 | | | | (0.13 | ) | | | 0.00 | | |
9/30/20 | | $ | 39.23 | | | | 0.13 | (a) | | | (0.98 | ) | | | (0.85 | ) | | | (0.37 | ) | | | 0.00 | | | | (0.37 | ) | | | 0.00 | | |
9/30/19 | | $ | 45.91 | | | | 0.54 | (a) | | | (5.40 | ) | | | (4.86 | ) | | | (0.16 | ) | | | (1.66 | ) | | | (1.82 | ) | | | 0.00 | | |
9/30/18 | | $ | 47.91 | | | | 0.17 | (a) | | | (0.08 | ) | | | 0.09 | | | | (0.22 | ) | | | (1.87 | ) | | | (2.09 | ) | | | 0.00 | | |
9/30/17(c) | | $ | 41.93 | | | | 0.22 | (a) | | | 5.76 | | | | 5.98 | | | | 0.00 | | | | 0.00 | | | | 0.00 | | | | 0.00 | | |
Service Class | |
10/1/2020-3/31/21+ | | $ | 37.57 | | | | (0.05 | )(a) | | | 17.59 | | | | 17.54 | | | | (0.09 | ) | | | 0.00 | | | | (0.09 | ) | | | 0.00 | | |
9/30/20 | | $ | 38.63 | | | | (0.04 | )(a) | | | (1.00 | ) | | | (1.04 | ) | | | (0.02 | ) | | | 0.00 | | | | (0.02 | ) | | | 0.00 | | |
9/30/19 | | $ | 45.23 | | | | 0.35 | (a) | | | (5.29 | ) | | | (4.94 | ) | | | 0.00 | | | | (1.66 | ) | | | (1.66 | ) | | | 0.00 | | |
9/30/18 | | $ | 47.21 | | | | (0.03 | )(a) | | | (0.08 | ) | | | (0.11 | ) | | | 0.00 | | | | (1.87 | ) | | | (1.87 | ) | | | 0.00 | | |
9/30/17 | | $ | 40.44 | | | | 0.05 | (a) | | | 8.68 | | | | 8.73 | | | | (0.26 | ) | | | (1.70 | ) | | | (1.96 | ) | | | 0.00 | | |
9/30/16 | | $ | 36.31 | | | | 0.23 | (a) | | | 3.90 | | | | 4.13 | | | | 0.00 | | | | 0.00 | | | | 0.00 | | | | 0.00 | | |
Class R6 | |
3/31/21(d)+ | | $ | 47.61 | | | | 0.01 | (a) | | | 8.13 | | | | 8.14 | | | | 0.00 | | | | 0.00 | | | | 0.00 | | | | 0.00 | | |
| + Unaudited. | |
| † Data has been annualized. | |
| (a) Computed using average shares outstanding throughout the period. | |
| (b) Amount rounds to less than $0.01 per share. | |
| (c) Commenced on 11/30/2016. | |
| (d) Commenced on 12/15/2020. | |
82 OAKMARK FUNDS
| | | | | | | Ratios/Supplemental Data: | | | |
| | | Net Asset
Value,
End of
Period | | Total
Return | | Net Assets,
End of
Period
($million) | | Ratio of
Net
Expenses
to Average
Net Assets | | Ratio of
Net
Investment
Income to
Average
Net Assets | | Ratio of
Gross
Expenses
to Average
Net Assets | | Portfolio
Turnover
Rate | |
Oakmark Select Fund | |
Investor Class | |
10/1/2020-3/31/21+ | | $ | 55.80 | | | | 46.92 | % | | $ | 1,838.8 | | | | 0.99 | %† | | | (0.08 | %)† | | | 1.03 | %† | | | 4 | % | |
9/30/20 | | $ | 37.98 | | | | -2.45 | % | | $ | 1,410.1 | | | | 1.04 | % | | | 0.14 | % | | | 1.11 | % | | | 28 | % | |
9/30/19 | | $ | 39.20 | | | | -10.34 | % | | $ | 3,154.9 | | | | 1.00 | % | | | 1.14 | % | | | 1.08 | % | | | 45 | % | |
9/30/18 | | $ | 45.84 | | | | -0.08 | % | | $ | 4,376.3 | | | | 0.97 | % | | | 0.20 | % | | | 1.04 | % | | | 41 | % | |
9/30/17 | | $ | 47.84 | | | | 22.61 | % | | $ | 4,854.7 | | | | 0.96 | % | | | 0.39 | % | | | 1.03 | % | | | 22 | % | |
9/30/16 | | $ | 40.99 | | | | 11.76 | % | | $ | 4,962.7 | | | | 0.98 | % | | | 0.92 | % | | | 0.98 | % | | | 38 | % | |
Advisor Class | |
10/1/2020-3/31/21+ | | $ | 55.70 | | | | 46.98 | % | | $ | 2,127.0 | | | | 0.89 | %† | | | 0.02 | %† | | | 0.93 | %† | | | 4 | % | |
9/30/20 | | $ | 37.99 | | | | -2.31 | % | | $ | 1,436.2 | | | | 0.92 | % | | | 0.27 | % | | | 1.00 | % | | | 28 | % | |
9/30/19 | | $ | 39.21 | | | | -10.24 | % | | $ | 638.5 | | | | 0.86 | % | | | 1.31 | % | | | 0.94 | % | | | 45 | % | |
9/30/18 | | $ | 45.90 | | | | 0.08 | % | | $ | 711.4 | | | | 0.82 | % | | | 0.34 | % | | | 0.89 | % | | | 41 | % | |
9/30/17(c) | | $ | 47.90 | | | | 14.24 | % | | $ | 571.3 | | | | 0.81 | %† | | | 0.54 | %† | | | 0.89 | %† | | | 22 | % | |
Institutional Class | |
10/1/2020-3/31/21+ | | $ | 55.75 | | | | 47.07 | % | | $ | 509.8 | | | | 0.77 | %† | | | 0.19 | %† | | | 0.81 | %† | | | 4 | % | |
9/30/20 | | $ | 38.01 | | | | -2.27 | % | | $ | 550.2 | | | | 0.85 | % | | | 0.33 | % | | | 0.93 | % | | | 28 | % | |
9/30/19 | | $ | 39.23 | | | | -10.18 | % | | $ | 660.3 | | | | 0.82 | % | | | 1.36 | % | | | 0.90 | % | | | 45 | % | |
9/30/18 | | $ | 45.91 | | | | 0.10 | % | | $ | 852.0 | | | | 0.79 | % | | | 0.37 | % | | | 0.86 | % | | | 41 | % | |
9/30/17(c) | | $ | 47.91 | | | | 14.26 | % | | $ | 768.9 | | | | 0.79 | %† | | | 0.58 | %† | | | 0.87 | %† | | | 22 | % | |
Service Class | |
10/1/2020-3/31/21+ | | $ | 55.02 | | | | 46.72 | % | | $ | 22.8 | | | | 1.19 | %† | | | (0.20 | %)† | | | 1.23 | %† | | | 4 | % | |
9/30/20 | | $ | 37.57 | | | | -2.69 | % | | $ | 2.5 | | | | 1.30 | % | | | (0.12 | %) | | | 1.37 | % | | | 28 | % | |
9/30/19 | | $ | 38.63 | | | | -10.55 | % | | $ | 7.1 | | | | 1.24 | % | | | 0.89 | % | | | 1.31 | % | | | 45 | % | |
9/30/18 | | $ | 45.23 | | | | -0.32 | % | | $ | 14.1 | | | | 1.23 | % | | | (0.06 | %) | | | 1.30 | % | | | 41 | % | |
9/30/17 | | $ | 47.21 | | | | 22.29 | % | | $ | 27.9 | | | | 1.24 | % | | | 0.11 | % | | | 1.31 | % | | | 22 | % | |
9/30/16 | | $ | 40.44 | | | | 11.37 | % | | $ | 34.6 | | | | 1.32 | % | | | 0.62 | % | | | 1.32 | % | | | 38 | % | |
Class R6 | |
3/31/21(d)+ | | $ | 55.75 | | | | 17.10 | % | | $ | 275.6 | | | | 0.75 | %† | | | 0.04 | %† | | | 0.77 | %† | | | 4 | % | |
| + Unaudited. | |
| † Data has been annualized. | |
| (a) Computed using average shares outstanding throughout the period. | |
| (b) Amount rounds to less than $0.01 per share. | |
| (c) Commenced on 11/30/2016. | |
| (d) Commenced on 12/15/2020. | |
Oakmark.com 83
Oakmark Funds
Financial Highlights
For a share outstanding throughout each period
| | | | | Income from Investment Operations: | | Less Distributions: | |
| | | Net Asset
Value,
Beginning of
Period | | Net
Investment
Income | | Net Gain
(Loss) on
Investments
(Both
Realized and
Unrealized) | | Total from
Investment
Operations | | Distributions
from Net
Investment
Income | | Distributions
from
Capital
Gains | | Total
Distributions | | Redemption
Fees | |
Oakmark Global Fund | |
Investor Class | |
10/1/2020-3/31/21+ | | $ | 24.73 | | | | (0.05 | )(a) | | | 10.86 | | | | 10.81 | | | | (0.05 | ) | | | 0.00 | | | | (0.05 | ) | | | 0.00 | | |
9/30/20 | | $ | 27.52 | | | | 0.02 | (a) | | | (1.72 | ) | | | (1.70 | ) | | | (0.40 | ) | | | (0.69 | ) | | | (1.09 | ) | | | 0.00 | | |
9/30/19 | | $ | 32.21 | | | | 0.50 | (a) | | | (1.71 | ) | | | (1.21 | ) | | | (0.29 | ) | | | (3.19 | ) | | | (3.48 | ) | | | 0.00 | | |
9/30/18 | | $ | 34.32 | | | | 0.25 | | | | 0.12 | | | | 0.37 | | | | (0.30 | ) | | | (2.18 | ) | | | (2.48 | ) | | | 0.00 | | |
9/30/17 | | $ | 26.36 | | | | 0.29 | (a) | | | 7.97 | | | | 8.26 | | | | (0.30 | ) | | | 0.00 | | | | (0.30 | ) | | | 0.00 | | |
9/30/16 | | $ | 26.34 | | | | 0.32 | | | | 0.48 | | | | 0.80 | | | | (0.31 | ) | | | (0.47 | ) | | | (0.78 | ) | | | 0.00 | | |
Advisor Class | |
10/1/2020-3/31/21+ | | $ | 24.74 | | | | (0.02 | )(a) | | | 10.86 | | | | 10.84 | | | | (0.09 | ) | | | 0.00 | | | | (0.09 | ) | | | 0.00 | | |
9/30/20 | | $ | 27.53 | | | | 0.07 | (a) | | | (1.73 | ) | | | (1.66 | ) | | | (0.44 | ) | | | (0.69 | ) | | | (1.13 | ) | | | 0.00 | | |
9/30/19 | | $ | 32.22 | | | | 0.49 | (a) | | | (1.66 | ) | | | (1.17 | ) | | | (0.33 | ) | | | (3.19 | ) | | | (3.52 | ) | | | 0.00 | | |
9/30/18 | | $ | 34.36 | | | | 0.30 | | | | 0.10 | | | | 0.40 | | | | (0.36 | ) | | | (2.18 | ) | | | (2.54 | ) | | | 0.00 | | |
9/30/17(b) | | $ | 27.22 | | | | 0.24 | (a) | | | 6.90 | | | | 7.14 | | | | 0.00 | | | | 0.00 | | | | 0.00 | | | | 0.00 | | |
Institutional Class | |
10/1/2020-3/31/21+ | | $ | 24.75 | | | | (0.01 | )(a) | | | 10.87 | | | | 10.86 | | | | (0.11 | ) | | | 0.00 | | | | (0.11 | ) | | | 0.00 | | |
9/30/20 | | $ | 27.54 | | | | 0.08 | (a) | | | (1.73 | ) | | | (1.65 | ) | | | (0.45 | ) | | | (0.69 | ) | | | (1.14 | ) | | | 0.00 | | |
9/30/19 | | $ | 32.25 | | | | 0.59 | (a) | | | (1.75 | ) | | | (1.16 | ) | | | (0.36 | ) | | | (3.19 | ) | | | (3.55 | ) | | | 0.00 | | |
9/30/18 | | $ | 34.38 | | | | 0.31 | | | | 0.12 | | | | 0.43 | | | | (0.38 | ) | | | (2.18 | ) | | | (2.56 | ) | | | 0.00 | | |
9/30/17(b) | | $ | 27.22 | | | | 0.26 | | | | 6.90 | | | | 7.16 | | | | 0.00 | | | | 0.00 | | | | 0.00 | | | | 0.00 | | |
Service Class | |
10/1/2020-3/31/21+ | | $ | 23.93 | | | | (0.08 | )(a) | | | 10.52 | | | | 10.44 | | | | 0.00 | | | | 0.00 | | | | 0.00 | | | | 0.00 | | |
9/30/20 | | $ | 26.68 | | | | (0.04 | )(a) | | | (1.68 | ) | | | (1.72 | ) | | | (0.34 | ) | | | (0.69 | ) | | | (1.03 | ) | | | 0.00 | | |
9/30/19 | | $ | 31.27 | | | | 0.44 | (a) | | | (1.68 | ) | | | (1.24 | ) | | | (0.16 | ) | | | (3.19 | ) | | | (3.35 | ) | | | 0.00 | | |
9/30/18 | | $ | 33.40 | | | | 0.14 | | | | 0.13 | | | | 0.27 | | | | (0.22 | ) | | | (2.18 | ) | | | (2.40 | ) | | | 0.00 | | |
9/30/17 | | $ | 25.65 | | | | (0.14 | ) | | | 8.11 | | | | 7.97 | | | | (0.22 | ) | | | 0.00 | | | | (0.22 | ) | | | 0.00 | | |
9/30/16 | | $ | 25.62 | | | | 0.21 | (a) | | | 0.47 | | | | 0.68 | | | | (0.18 | ) | | | (0.47 | ) | | | (0.65 | ) | | | 0.00 | | |
Class R6 | |
3/31/21(c)+ | | $ | 31.38 | | | | (0.01 | )(a) | | | 4.12 | | | | 4.11 | | | | 0.00 | | | | 0.00 | | | | 0.00 | | | | 0.00 | | |
| + Unaudited. | |
| † Data has been annualized. | |
| (a) Computed using average shares outstanding throughout the period. | |
| (b) Commenced on 11/30/2016. | |
| (c) Commenced on 12/15/2020. | |
84 OAKMARK FUNDS
| | | | | | | Ratios/Supplemental Data: | | | |
| | | Net Asset
Value,
End of
Period | | Total
Return | | Net Assets,
End of
Period
($million) | | Ratio of
Net
Expenses
to Average
Net Assets | | Ratio of
Net
Investment
Income to
Average
Net Assets | | Ratio of
Gross
Expenses
to Average
Net Assets | | Portfolio
Turnover
Rate | |
Oakmark Global Fund | |
Investor Class | |
10/1/2020-3/31/21+ | | $ | 35.49 | | | | 43.75 | % | | $ | 827.1 | | | | 1.13 | %† | | | (0.33 | %)† | | | 1.16 | %† | | | 19 | % | |
9/30/20 | | $ | 24.73 | | | | -6.73 | % | | $ | 645.2 | | | | 1.20 | % | | | 0.10 | % | | | 1.26 | % | | | 24 | % | |
9/30/19 | | $ | 27.52 | | | | -2.48 | % | | $ | 1,077.3 | | | | 1.17 | % | | | 1.82 | % | | | 1.23 | % | | | 20 | % | |
9/30/18 | | $ | 32.21 | | | | 1.02 | % | | $ | 1,492.7 | | | | 1.15 | % | | | 0.68 | % | | | 1.21 | % | | | 25 | % | |
9/30/17 | | $ | 34.32 | | | | 31.64 | % | | $ | 1,811.8 | | | | 1.15 | % | | | 0.96 | % | | | 1.21 | % | | | 32 | % | |
9/30/16 | | $ | 26.36 | | | | 2.93 | % | | $ | 2,328.9 | | | | 1.17 | % | | | 1.14 | % | | | 1.17 | % | | | 32 | % | |
Advisor Class | |
10/1/2020-3/31/21+ | | $ | 35.49 | | | | 43.88 | % | | $ | 299.4 | | | | 0.95 | %† | | | (0.15 | %)† | | | 0.99 | %† | | | 19 | % | |
9/30/20 | | $ | 24.74 | | | | -6.61 | % | | $ | 209.0 | | | | 1.08 | % | | | 0.26 | % | | | 1.14 | % | | | 24 | % | |
9/30/19 | | $ | 27.53 | | | | -2.35 | % | | $ | 263.0 | | | | 1.05 | % | | | 1.79 | % | | | 1.10 | % | | | 20 | % | |
9/30/18 | | $ | 32.22 | | | | 1.10 | % | | $ | 440.2 | | | | 1.06 | % | | | 0.89 | % | | | 1.12 | % | | | 25 | % | |
9/30/17(b) | | $ | 34.36 | | | | 26.23 | % | | $ | 499.9 | | | | 1.01 | %† | | | 0.89 | %† | | | 1.07 | %† | | | 32 | % | |
Institutional Class | |
10/1/2020-3/31/21+ | | $ | 35.50 | | | | 43.93 | % | | $ | 335.3 | | | | 0.90 | %† | | | (0.09 | %)† | | | 0.94 | %† | | | 19 | % | |
9/30/20 | | $ | 24.75 | | | | -6.57 | % | | $ | 313.4 | | | | 1.02 | % | | | 0.33 | % | | | 1.08 | % | | | 24 | % | |
9/30/19 | | $ | 27.54 | | | | -2.30 | % | | $ | 313.8 | | | | 1.00 | % | | | 2.17 | % | | | 1.06 | % | | | 20 | % | |
9/30/18 | | $ | 32.25 | | | | 1.18 | % | | $ | 333.5 | | | | 0.98 | % | | | 0.93 | % | | | 1.04 | % | | | 25 | % | |
9/30/17(b) | | $ | 34.38 | | | | 26.30 | % | | $ | 309.6 | | | | 0.96 | %† | | | 1.55 | %† | | | 1.02 | %† | | | 32 | % | |
Service Class | |
10/1/2020-3/31/21+ | | $ | 34.37 | | | | 43.63 | % | | $ | 10.3 | | | | 1.35 | %† | | | (0.55 | %)† | | | 1.39 | %† | | | 19 | % | |
9/30/20 | | $ | 23.93 | | | | -7.01 | % | | $ | 8.3 | | | | 1.47 | % | | | (0.16 | %) | | | 1.53 | % | | | 24 | % | |
9/30/19 | | $ | 26.68 | | | | -2.71 | % | | $ | 12.3 | | | | 1.41 | % | | | 1.66 | % | | | 1.47 | % | | | 20 | % | |
9/30/18 | | $ | 31.27 | | | | 0.73 | % | | $ | 16.6 | | | | 1.44 | % | | | 0.43 | % | | | 1.50 | % | | | 25 | % | |
9/30/17 | | $ | 33.40 | | | | 31.27 | % | | $ | 22.5 | | | | 1.42 | % | | | 0.63 | % | | | 1.48 | % | | | 32 | % | |
9/30/16 | | $ | 25.65 | | | | 2.60 | % | | $ | 25.6 | | | | 1.50 | % | | | 0.82 | % | | | 1.50 | % | | | 32 | % | |
Class R6 | |
3/31/21(c)+ | | $ | 35.49 | | | | 13.10 | % | | $ | 93.5 | | | | 0.89 | %† | | | (0.11 | %)† | | | 0.91 | %† | | | 19 | % | |
| + Unaudited. | |
| † Data has been annualized. | |
| (a) Computed using average shares outstanding throughout the period. | |
| (b) Commenced on 11/30/2016. | |
| (c) Commenced on 12/15/2020. | |
Oakmark.com 85
Oakmark Funds
Financial Highlights
For a share outstanding throughout each period
| | | | | Income from Investment Operations: | | Less Distributions: | |
| | | Net Asset
Value,
Beginning of
Period | | Net
Investment
Income | | Net Gain
(Loss) on
Investments
(Both
Realized and
Unrealized) | | Total from
Investment
Operations | | Distributions
from Net
Investment
Income | | Distributions
from
Capital
Gains | | Total
Distributions | | Redemption
Fees | |
Oakmark Global Select Fund | |
Investor Class | |
10/1/2020-3/31/21+ | | $ | 16.86 | | | | (0.03 | )(a) | | | 6.43 | | | | 6.40 | | | | 0.00 | | | | 0.00 | | | | 0.00 | | | | 0.00 | | |
9/30/20 | | $ | 16.81 | | | | 0.03 | (a) | | | 0.24 | | | | 0.27 | | | | (0.22 | ) | | | 0.00 | | | | (0.22 | ) | | | 0.00 | | |
9/30/19 | | $ | 18.58 | | | | 0.31 | (a) | | | (1.31 | ) | | | (1.00 | ) | | | (0.22 | ) | | | (0.55 | ) | | | (0.77 | ) | | | 0.00 | | |
9/30/18 | | $ | 19.78 | | | | 0.22 | (a) | | | (0.36 | ) | | | (0.14 | ) | | | (0.17 | ) | | | (0.89 | ) | | | (1.06 | ) | | | 0.00 | | |
9/30/17 | | $ | 15.81 | | | | 0.26 | | | | 3.88 | | | | 4.14 | | | | (0.17 | ) | | | 0.00 | | | | (0.17 | ) | | | 0.00 | | |
9/30/16 | | $ | 15.19 | | | | 0.18 | | | | 1.31 | | | | 1.49 | | | | (0.13 | ) | | | (0.74 | ) | | | (0.87 | ) | | | 0.00 | | |
Advisor Class | |
10/1/2020-3/31/21+ | | $ | 16.85 | | | | (0.01 | )(a) | | | 6.42 | | | | 6.41 | | | | (0.02 | ) | | | 0.00 | | | | (0.02 | ) | | | 0.00 | | |
9/30/20 | | $ | 16.80 | | | | 0.05 | (a) | | | 0.24 | | | | 0.29 | | | | (0.24 | ) | | | 0.00 | | | | (0.24 | ) | | | 0.00 | | |
9/30/19 | | $ | 18.60 | | | | 0.37 | (a) | | | (1.37 | ) | | | (1.00 | ) | | | (0.25 | ) | | | (0.55 | ) | | | (0.80 | ) | | | 0.00 | | |
9/30/18 | | $ | 19.81 | | | | 0.25 | (a) | | | (0.37 | ) | | | (0.12 | ) | | | (0.20 | ) | | | (0.89 | ) | | | (1.09 | ) | | | 0.00 | | |
9/30/17(b) | | $ | 16.39 | | | | 0.25 | (a) | | | 3.17 | | | | 3.42 | | | | 0.00 | | | | 0.00 | | | | 0.00 | | | | 0.00 | | |
Institutional Class | |
10/1/2020-3/31/21+ | | $ | 16.86 | | | | 0.00 | (a)(c) | | | 6.43 | | | | 6.43 | | | | (0.04 | ) | | | 0.00 | | | | (0.04 | ) | | | 0.00 | | |
9/30/20 | | $ | 16.81 | | | | 0.06 | (a) | | | 0.24 | | | | 0.30 | | | | (0.25 | ) | | | 0.00 | | | | (0.25 | ) | | | 0.00 | | |
9/30/19 | | $ | 18.61 | | | | 0.35 | (a) | | | (1.34 | ) | | | (0.99 | ) | | | (0.26 | ) | | | (0.55 | ) | | | (0.81 | ) | | | 0.00 | | |
9/30/18 | | $ | 19.81 | | | | 0.27 | (a) | | | (0.37 | ) | | | (0.10 | ) | | | (0.21 | ) | | | (0.89 | ) | | | (1.10 | ) | | | 0.00 | | |
9/30/17(b) | | $ | 16.39 | | | | 0.23 | (a) | | | 3.19 | | | | 3.42 | | | | 0.00 | | | | 0.00 | | | | 0.00 | | | | 0.00 | | |
Class R6 | |
3/31/21(d)+ | | $ | 20.65 | | | | 0.01 | | | | 2.60 | | | | 2.61 | | | | 0.00 | | | | 0.00 | | | | 0.00 | | | | 0.00 | | |
| + Unaudited. | |
| † Data has been annualized. | |
| (a) Computed using average shares outstanding throughout the period. | |
| (b) Commenced on 11/30/2016. | |
| (c) Amount rounds to less than $0.01 per share. | |
| (d) Commenced on 12/15/2020. | |
86 OAKMARK FUNDS
| | | | | | | Ratios/Supplemental Data: | | | |
| | | Net Asset
Value,
End of
Period | | Total
Return | | Net Assets,
End of
Period
($million) | | Ratio of
Net
Expenses
to Average
Net Assets | | Ratio of
Net
Investment
Income to
Average
Net Assets | | Ratio of
Gross
Expenses
to Average
Net Assets | | Portfolio
Turnover
Rate | |
Oakmark Global Select Fund | |
Investor Class | |
10/1/2020-3/31/21+ | | $ | 23.26 | | | | 37.96 | % | | $ | 599.5 | | | | 1.11 | %† | | | (0.25 | %)† | | | 1.15 | %† | | | 21 | % | |
9/30/20 | | $ | 16.86 | | | | 1.50 | % | | $ | 483.7 | | | | 1.19 | % | | | 0.16 | % | | | 1.25 | % | | | 33 | % | |
9/30/19 | | $ | 16.81 | | | | -4.90 | % | | $ | 798.4 | | | | 1.18 | % | | | 1.88 | % | | | 1.25 | % | | | 21 | % | |
9/30/18 | | $ | 18.58 | | | | -0.86 | % | | $ | 1,404.8 | | | | 1.12 | % | | | 1.15 | % | | | 1.19 | % | | | 26 | % | |
9/30/17 | | $ | 19.78 | | | | 26.41 | % | | $ | 2,035.3 | | | | 1.12 | % | | | 1.25 | % | | | 1.18 | % | | | 39 | % | |
9/30/16 | | $ | 15.81 | | | | 9.92 | % | | $ | 2,037.1 | | | | 1.15 | % | | | 1.12 | % | | | 1.15 | % | | | 17 | % | |
Advisor Class | |
10/1/2020-3/31/21+ | | $ | 23.24 | | | | 38.08 | % | | $ | 519.5 | | | | 0.95 | %† | | | (0.08 | %)† | | | 0.98 | %† | | | 21 | % | |
9/30/20 | | $ | 16.85 | | | | 1.64 | % | | $ | 392.7 | | | | 1.07 | % | | | 0.29 | % | | | 1.14 | % | | | 33 | % | |
9/30/19 | | $ | 16.80 | | | | -4.85 | % | | $ | 449.0 | | | | 1.07 | % | | | 2.25 | % | | | 1.14 | % | | | 21 | % | |
9/30/18 | | $ | 18.60 | | | | -0.75 | % | | $ | 457.6 | | | | 1.02 | % | | | 1.32 | % | | | 1.09 | % | | | 26 | % | |
9/30/17(b) | | $ | 19.81 | | | | 20.87 | % | | $ | 148.4 | | | | 1.00 | %† | | | 1.58 | %† | | | 1.07 | %† | | | 39 | % | |
Institutional Class | |
10/1/2020-3/31/21+ | | $ | 23.25 | | | | 38.14 | % | | $ | 380.6 | | | | 0.88 | %† | | | (0.04 | %)† | | | 0.92 | %† | | | 21 | % | |
9/30/20 | | $ | 16.86 | | | | 1.70 | % | | $ | 414.3 | | | | 1.00 | % | | | 0.36 | % | | | 1.07 | % | | | 33 | % | |
9/30/19 | | $ | 16.81 | | | | -4.79 | % | | $ | 538.8 | | | | 1.01 | % | | | 2.15 | % | | | 1.07 | % | | | 21 | % | |
9/30/18 | | $ | 18.61 | | | | -0.66 | % | | $ | 780.8 | | | | 0.96 | % | | | 1.39 | % | | | 1.03 | % | | | 26 | % | |
9/30/17(b) | | $ | 19.81 | | | | 20.87 | % | | $ | 608.0 | | | | 0.94 | %† | | | 1.46 | %† | | | 1.00 | %† | | | 39 | % | |
Class R6 | |
3/31/21(d)+ | | $ | 23.26 | | | | 12.64 | % | | $ | 134.7 | | | | 0.84 | %† | | | 0.18 | %† | | | 0.86 | %† | | | 21 | % | |
| + Unaudited. | |
| † Data has been annualized. | |
| (a) Computed using average shares outstanding throughout the period. | |
| (b) Commenced on 11/30/2016. | |
| (c) Amount rounds to less than $0.01 per share. | |
| (d) Commenced on 12/15/2020. | |
Oakmark.com 87
Oakmark Funds
Financial Highlights
For a share outstanding throughout each period
| | | | | Income from Investment Operations: | | Less Distributions: | |
| | | Net Asset
Value,
Beginning of
Period | | Net
Investment
Income | | Net Gain
(Loss) on
Investments
(Both
Realized and
Unrealized) | | Total from
Investment
Operations | | Distributions
from Net
Investment
Income | | Distributions
from
Capital
Gains | | Total
Distributions | | Redemption
Fees | |
Oakmark International Fund | |
Investor Class | |
10/1/2020-3/31/21+ | | $ | 19.91 | | | | 0.00 | (a)(b) | | | 8.62 | | | | 8.62 | | | | (0.09 | ) | | | 0.00 | | | | (0.09 | ) | | | 0.00 | | |
9/30/20 | | $ | 22.88 | | | | 0.08 | (a) | | | (2.60 | ) | | | (2.52 | ) | | | (0.45 | ) | | | 0.00 | | | | (0.45 | ) | | | 0.00 | | |
9/30/19 | | $ | 26.14 | | | | 0.64 | (a) | | | (2.43 | ) | | | (1.79 | ) | | | (0.44 | ) | | | (1.03 | ) | | | (1.47 | ) | | | 0.00 | | |
9/30/18 | | $ | 28.77 | | | | 0.60 | | | | (2.36 | ) | | | (1.76 | ) | | | (0.39 | ) | | | (0.48 | ) | | | (0.87 | ) | | | 0.00 | | |
9/30/17 | | $ | 21.66 | | | | 0.44 | | | | 7.01 | | | | 7.45 | | | | (0.34 | ) | | | 0.00 | | | | (0.34 | ) | | | 0.00 | | |
9/30/16 | | $ | 21.34 | | | | 0.36 | (a) | | | 1.04 | | | | 1.40 | | | | (0.50 | ) | | | (0.58 | ) | | | (1.08 | ) | | | 0.00 | | |
Advisor Class | |
10/1/2020-3/31/21+ | | $ | 19.89 | | | | 0.02 | (a) | | | 8.60 | | | | 8.62 | | | | (0.12 | ) | | | 0.00 | | | | (0.12 | ) | | | 0.00 | | |
9/30/20 | | $ | 22.86 | | | | 0.12 | (a) | | | (2.61 | ) | | | (2.49 | ) | | | (0.48 | ) | | | 0.00 | | | | (0.48 | ) | | | 0.00 | | |
9/30/19 | | $ | 26.17 | | | | 0.76 | (a) | | | (2.54 | ) | | | (1.78 | ) | | | (0.50 | ) | | | (1.03 | ) | | | (1.53 | ) | | | 0.00 | | |
9/30/18 | | $ | 28.82 | | | | 0.70 | (a) | | | (2.44 | ) | | | (1.74 | ) | | | (0.43 | ) | | | (0.48 | ) | | | (0.91 | ) | | | 0.00 | | |
9/30/17(c) | | $ | 21.96 | | | | 0.53 | (a) | | | 6.33 | | | | 6.86 | | | | 0.00 | | | | 0.00 | | | | 0.00 | | | | 0.00 | | |
Institutional Class | |
10/1/2020-3/31/21+ | | $ | 19.92 | | | | 0.03 | (a) | | | 8.62 | | | | 8.65 | | | | (0.14 | ) | | | 0.00 | | | | (0.14 | ) | | | 0.00 | | |
9/30/20 | | $ | 22.89 | | | | 0.13 | (a) | | | (2.60 | ) | | | (2.47 | ) | | | (0.50 | ) | | | 0.00 | | | | (0.50 | ) | | | 0.00 | | |
9/30/19 | | $ | 26.19 | | | | 0.73 | (a) | | | (2.50 | ) | | | (1.77 | ) | | | (0.50 | ) | | | (1.03 | ) | | | (1.53 | ) | | | 0.00 | | |
9/30/18 | | $ | 28.82 | | | | 0.63 | (a) | | | (2.35 | ) | | | (1.72 | ) | | | (0.43 | ) | | | (0.48 | ) | | | (0.91 | ) | | | 0.00 | | |
9/30/17(c) | | $ | 21.96 | | | | 0.46 | (a) | | | 6.40 | | | | 6.86 | | | | 0.00 | | | | 0.00 | | | | 0.00 | | | | 0.00 | | |
Service Class | |
10/1/2020-3/31/21+ | | $ | 20.04 | | | | (0.03 | )(a) | | | 8.68 | | | | 8.65 | | | | (0.01 | ) | | | 0.00 | | | | (0.01 | ) | | | 0.00 | | |
9/30/20 | | $ | 23.00 | | | | 0.04 | (a) | | | (2.63 | ) | | | (2.59 | ) | | | (0.37 | ) | | | 0.00 | | | | (0.37 | ) | | | 0.00 | | |
9/30/19 | | $ | 26.26 | | | | 0.61 | (a) | | | (2.48 | ) | | | (1.87 | ) | | | (0.36 | ) | | | (1.03 | ) | | | (1.39 | ) | | | 0.00 | | |
9/30/18 | | $ | 28.90 | | | | 0.57 | | | | (2.42 | ) | | | (1.85 | ) | | | (0.31 | ) | | | (0.48 | ) | | | (0.79 | ) | | | 0.00 | | |
9/30/17 | | $ | 21.74 | | | | 0.46 | | | | 6.96 | | | | 7.42 | | | | (0.26 | ) | | | 0.00 | | | | (0.26 | ) | | | 0.00 | | |
9/30/16 | | $ | 21.40 | | | | 0.29 | (a) | | | 1.04 | | | | 1.33 | | | | (0.41 | ) | | | (0.58 | ) | | | (0.99 | ) | | | 0.00 | | |
Class R6 | |
3/31/21(d)+ | | $ | 25.83 | | | | 0.09 | (a) | | | 2.51 | | | | 2.60 | | | | 0.00 | | | | 0.00 | | | | 0.00 | | | | 0.00 | | |
| + Unaudited. | |
| † Data has been annualized. | |
| (a) Computed using average shares outstanding throughout the period. | |
| (b) Amount rounds to less than $0.01 per share. | |
| (c) Commenced on 11/30/2016. | |
| (d) Commenced on 12/15/2020. | |
88 OAKMARK FUNDS
| | | | | | | Ratios/Supplemental Data: | | | |
| | | Net Asset
Value,
End of
Period | | Total
Return | | Net Assets,
End of
Period
($million) | | Ratio of
Net
Expenses
to Average
Net Assets | | Ratio of
Net
Investment
Income to
Average
Net Assets | | Ratio of
Gross
Expenses
to Average
Net Assets | | Portfolio
Turnover
Rate | |
Oakmark International Fund | |
Investor Class | |
10/1/2020-3/31/21+ | | $ | 28.44 | | | | 43.32 | % | | $ | 9,501.7 | | | | 1.00 | %† | | | 0.02 | %† | | | 1.03 | %† | | | 25 | % | |
9/30/20 | | $ | 19.91 | | | | -11.37 | % | | $ | 7,959.9 | | | | 1.00 | % | | | 0.39 | % | | | 1.05 | % | | | 32 | % | |
9/30/19 | | $ | 22.88 | | | | -6.41 | % | | $ | 14,446.5 | | | | 0.98 | % | | | 2.84 | % | | | 1.04 | % | | | 35 | % | |
9/30/18 | | $ | 26.14 | | | | -6.33 | % | | $ | 24,866.2 | | | | 0.96 | % | | | 1.84 | % | | | 1.01 | % | | | 36 | % | |
9/30/17 | | $ | 28.77 | | | | 34.88 | % | | $ | 31,058.2 | | | | 0.95 | % | | | 1.72 | % | | | 1.00 | % | | | 41 | % | |
9/30/16 | | $ | 21.66 | | | | 6.66 | % | | $ | 23,277.7 | | | | 1.00 | % | | | 1.72 | % | | | 1.00 | % | | | 44 | % | |
Advisor Class | |
10/1/2020-3/31/21+ | | $ | 28.39 | | | | 43.43 | % | | $ | 8,405.5 | | | | 0.85 | %† | | | 0.19 | %† | | | 0.88 | %† | | | 25 | % | |
9/30/20 | | $ | 19.89 | | | | -11.28 | % | | $ | 6,282.8 | | | | 0.90 | % | | | 0.59 | % | | | 0.95 | % | | | 32 | % | |
9/30/19 | | $ | 22.86 | | | | -6.34 | % | | $ | 6,701.4 | | | | 0.90 | % | | | 3.35 | % | | | 0.95 | % | | | 35 | % | |
9/30/18 | | $ | 26.17 | | | | -6.25 | % | | $ | 5,757.4 | | | | 0.83 | % | | | 2.53 | % | | | 0.88 | % | | | 36 | % | |
9/30/17(c) | | $ | 28.82 | | | | 31.24 | % | | $ | 914.3 | | | | 0.81 | %† | | | 2.42 | %† | | | 0.86 | %† | | | 41 | % | |
Institutional Class | |
10/1/2020-3/31/21+ | | $ | 28.43 | | | | 43.51 | % | | $ | 8,309.3 | | | | 0.76 | %† | | | 0.25 | %† | | | 0.79 | %† | | | 25 | % | |
9/30/20 | | $ | 19.92 | | | | -11.19 | % | | $ | 7,233.5 | | | | 0.82 | % | | | 0.62 | % | | | 0.87 | % | | | 32 | % | |
9/30/19 | | $ | 22.89 | | | | -6.27 | % | | $ | 9,457.3 | | | | 0.81 | % | | | 3.20 | % | | | 0.86 | % | | | 35 | % | |
9/30/18 | | $ | 26.19 | | | | -6.16 | % | | $ | 12,174.4 | | | | 0.79 | % | | | 2.25 | % | | | 0.84 | % | | | 36 | % | |
9/30/17(c) | | $ | 28.82 | | | | 31.24 | % | | $ | 7,658.7 | | | | 0.77 | %† | | | 2.06 | %† | | | 0.83 | %† | | | 41 | % | |
Service Class | |
10/1/2020-3/31/21+ | | $ | 28.68 | | | | 43.19 | % | | $ | 168.7 | | | | 1.20 | %† | | | (0.22 | %)† | | | 1.23 | %† | | | 25 | % | |
9/30/20 | | $ | 20.04 | | | | -11.55 | % | | $ | 183.8 | | | | 1.26 | % | | | 0.17 | % | | | 1.32 | % | | | 32 | % | |
9/30/19 | | $ | 23.00 | | | | -6.70 | % | | $ | 306.6 | | | | 1.24 | % | | | 2.68 | % | | | 1.29 | % | | | 35 | % | |
9/30/18 | | $ | 26.26 | | | | -6.59 | % | | $ | 442.9 | | | | 1.24 | % | | | 1.53 | % | | | 1.29 | % | | | 36 | % | |
9/30/17 | | $ | 28.90 | | | | 34.51 | % | | $ | 579.7 | | | | 1.22 | % | | | 1.38 | % | | | 1.27 | % | | | 41 | % | |
9/30/16 | | $ | 21.74 | | | | 6.32 | % | | $ | 532.3 | | | | 1.34 | % | | | 1.38 | % | | | 1.34 | % | | | 44 | % | |
Class R6 | |
3/31/21(d)+ | | $ | 28.43 | | | | 10.07 | % | | $ | 1,139.6 | | | | 0.77 | %† | | | 1.17 | %† | | | 0.79 | %† | | | 25 | % | |
| + Unaudited. | |
| † Data has been annualized. | |
| (a) Computed using average shares outstanding throughout the period. | |
| (b) Amount rounds to less than $0.01 per share. | |
| (c) Commenced on 11/30/2016. | |
| (d) Commenced on 12/15/2020. | |
Oakmark.com 89
Oakmark Funds
Financial Highlights
For a share outstanding throughout each period
| | | | | Income from Investment Operations: | | Less Distributions: | |
| | | Net Asset
Value,
Beginning of
Period | | Net
Investment
Income | | Net Gain
(Loss) on
Investments
(Both
Realized and
Unrealized) | | Total from
Investment
Operations | | Distributions
from Net
Investment
Income | | Distributions
from
Capital
Gains | | Total
Distributions | | Redemption
Fees | |
Oakmark International Small Cap Fund | |
Investor Class | |
10/1/2020-3/31/21+ | | $ | 13.67 | | | | 0.01 | (a) | | | 5.49 | | | | 5.50 | | | | (0.32 | ) | | | 0.00 | | | | (0.32 | ) | | | 0.00 | | |
9/30/20 | | $ | 14.61 | | | | 0.31 | (a) | | | (1.22 | ) | | | (0.91 | ) | | | (0.03 | ) | | | 0.00 | | | | (0.03 | ) | | | 0.00 | | |
9/30/19 | | $ | 16.34 | | | | 0.27 | (a) | | | (0.89 | ) | | | (0.62 | ) | | | (0.20 | ) | | | (0.91 | ) | | | (1.11 | ) | | | 0.00 | (b) | |
9/30/18 | | $ | 18.12 | | | | 0.23 | (a) | | | (1.37 | ) | | | (1.14 | ) | | | (0.14 | ) | | | (0.50 | ) | | | (0.64 | ) | | | 0.00 | (b) | |
9/30/17 | | $ | 14.84 | | | | 0.23 | (a) | | | 3.50 | | | | 3.73 | | | | (0.36 | ) | | | (0.09 | ) | | | (0.45 | ) | | | 0.00 | (b) | |
9/30/16 | | $ | 14.63 | | | | 0.42 | (a) | | | 0.51 | | | | 0.93 | | | | (0.36 | ) | | | (0.36 | ) | | | (0.72 | ) | | | 0.00 | (b) | |
Advisor Class | |
10/1/2020-3/31/21+ | | $ | 13.69 | | | | 0.02 | (a) | | | 5.49 | | | | 5.51 | | | | (0.34 | ) | | | 0.00 | | | | (0.34 | ) | | | 0.00 | | |
9/30/20 | | $ | 14.64 | | | | 0.30 | (a) | | | (1.19 | ) | | | (0.89 | ) | | | (0.06 | ) | | | 0.00 | | | | (0.06 | ) | | | 0.00 | | |
9/30/19 | | $ | 16.33 | | | | 0.31 | (a) | | | (0.90 | ) | | | (0.59 | ) | | | (0.19 | ) | | | (0.91 | ) | | | (1.10 | ) | | | 0.00 | (b) | |
9/30/18 | | $ | 18.14 | | | | 0.25 | | | | (1.38 | ) | | | (1.13 | ) | | | (0.18 | ) | | | (0.50 | ) | | | (0.68 | ) | | | 0.00 | (b) | |
9/30/17(c) | | $ | 14.16 | | | | 0.19 | (a) | | | 3.79 | | | | 3.98 | | | | 0.00 | | | | 0.00 | | | | 0.00 | | | | 0.00 | (b) | |
Institutional Class | |
10/1/2020-3/31/21+ | | $ | 13.65 | | | | 0.03 | (a) | | | 5.48 | | | | 5.51 | | | | (0.35 | ) | | | 0.00 | | | | (0.35 | ) | | | 0.00 | | |
9/30/20 | | $ | 14.59 | | | | 0.33 | (a) | | | (1.21 | ) | | | (0.88 | ) | | | (0.06 | ) | | | 0.00 | | | | (0.06 | ) | | | 0.00 | | |
9/30/19 | | $ | 16.36 | | | | 0.29 | (a) | | | (0.90 | ) | | | (0.61 | ) | | | (0.25 | ) | | | (0.91 | ) | | | (1.16 | ) | | | 0.00 | (b) | |
9/30/18 | | $ | 18.15 | | | | 0.26 | | | | (1.36 | ) | | | (1.10 | ) | | | (0.19 | ) | | | (0.50 | ) | | | (0.69 | ) | | | 0.00 | (b) | |
9/30/17(c) | | $ | 14.16 | | | | 0.21 | (a) | | | 3.78 | | | | 3.99 | | | | 0.00 | | | | 0.00 | | | | 0.00 | | | | 0.00 | (b) | |
Service Class | |
10/1/2020-3/31/21+ | | $ | 13.56 | | | | (0.02 | )(a) | | | 5.45 | | | | 5.43 | | | | (0.25 | ) | | | 0.00 | | | | (0.25 | ) | | | 0.00 | | |
9/30/20 | | $ | 14.51 | | | | 0.26 | (a) | | | (1.21 | ) | | | (0.95 | ) | | | 0.00 | | | | 0.00 | | | | 0.00 | | | | 0.00 | | |
9/30/19 | | $ | 16.21 | | | | 0.24 | (a) | | | (0.88 | ) | | | (0.64 | ) | | | (0.15 | ) | | | (0.91 | ) | | | (1.06 | ) | | | 0.00 | (b) | |
9/30/18 | | $ | 18.00 | | | | 0.16 | (a) | | | (1.34 | ) | | | (1.18 | ) | | | (0.11 | ) | | | (0.50 | ) | | | (0.61 | ) | | | 0.00 | (b) | |
9/30/17 | | $ | 14.75 | | | | 0.17 | (a) | | | 3.49 | | | | 3.66 | | | | (0.32 | ) | | | (0.09 | ) | | | (0.41 | ) | | | 0.00 | (b) | |
9/30/16 | | $ | 14.53 | | | | 0.38 | (a) | | | 0.51 | | | | 0.89 | | | | (0.31 | ) | | | (0.36 | ) | | | (0.67 | ) | | | 0.00 | (b) | |
Class R6 | |
3/31/21(d)+ | | $ | 16.66 | | | | 0.01 | (a) | | | 2.14 | | | | 2.15 | | | | 0.00 | | | | 0.00 | | | | 0.00 | | | | 0.00 | | |
| + Unaudited. | |
| † Data has been annualized. | |
| (a) Computed using average shares outstanding throughout the period. | |
| (b) Amount rounds to less than $0.01 per share. | |
| (c) Commenced on 11/30/2016. | |
| (d) Commenced on 12/15/2020. | |
90 OAKMARK FUNDS
| | | | | | | Ratios/Supplemental Data: | | | |
| | | Net Asset
Value,
End of
Period | | Total
Return | | Net Assets,
End of
Period
($million) | | Ratio of
Net
Expenses
to Average
Net Assets | | Ratio of
Net
Investment
Income to
Average
Net Assets | | Ratio of
Gross
Expenses
to Average
Net Assets | | Portfolio
Turnover
Rate | |
Oakmark International Small Cap Fund | |
Investor Class | |
10/1/2020-3/31/21+ | | $ | 18.85 | | | | 40.53 | % | | $ | 521.6 | | | | 1.36 | %† | | | 0.11 | %† | | | 1.37 | %† | | | 19 | % | |
9/30/20 | | $ | 13.67 | | | | -6.23 | % | | $ | 388.9 | | | | 1.45 | % | | | 2.21 | % | | | 1.45 | % | | | 42 | % | |
9/30/19 | | $ | 14.61 | | | | -2.91 | % | | $ | 546.4 | | | | 1.38 | % | | | 1.88 | % | | | 1.38 | % | | | 39 | % | |
9/30/18 | | $ | 16.34 | | | | -6.43 | % | | $ | 1,013.6 | | | | 1.36 | % | | | 1.32 | % | | | 1.36 | % | | | 45 | % | |
9/30/17 | | $ | 18.12 | | | | 25.98 | % | | $ | 1,835.5 | | | | 1.36 | % | | | 1.40 | % | | | 1.36 | % | | | 34 | % | |
9/30/16 | | $ | 14.84 | | | | 6.66 | % | | $ | 2,365.1 | | | | 1.38 | % | | | 2.97 | % | | | 1.38 | % | | | 38 | % | |
Advisor Class | |
10/1/2020-3/31/21+ | | $ | 18.86 | | | | 40.56 | % | | $ | 209.9 | | | | 1.21 | %† | | | 0.22 | %† | | | 1.22 | %† | | | 19 | % | |
9/30/20 | | $ | 13.69 | | | | -6.16 | % | | $ | 155.7 | | | | 1.35 | % | | | 2.14 | % | | | 1.35 | % | | | 42 | % | |
9/30/19 | | $ | 14.64 | | | | -2.72 | % | | $ | 142.5 | | | | 1.26 | % | | | 2.13 | % | | | 1.26 | % | | | 39 | % | |
9/30/18 | | $ | 16.33 | | | | -6.39 | % | | $ | 346.6 | | | | 1.32 | % | | | 1.41 | % | | | 1.32 | % | | | 45 | % | |
9/30/17(c) | | $ | 18.14 | | | | 28.11 | % | | $ | 388.5 | | | | 1.21 | %† | | | 1.29 | %† | | | 1.21 | %† | | | 34 | % | |
Institutional Class | |
10/1/2020-3/31/21+ | | $ | 18.81 | | | | 40.70 | % | | $ | 724.5 | | | | 1.11 | %† | | | 0.33 | %† | | | 1.12 | %† | | | 19 | % | |
9/30/20 | | $ | 13.65 | | | | -6.09 | % | | $ | 614.2 | | | | 1.26 | % | | | 2.37 | % | | | 1.26 | % | | | 42 | % | |
9/30/19 | | $ | 14.59 | | | | -2.75 | % | | $ | 735.8 | | | | 1.23 | % | | | 2.03 | % | | | 1.23 | % | | | 39 | % | |
9/30/18 | | $ | 16.36 | | | | -6.23 | % | | $ | 863.3 | | | | 1.17 | % | | | 1.49 | % | | | 1.17 | % | | | 45 | % | |
9/30/17(c) | | $ | 18.15 | | | | 28.18 | % | | $ | 839.1 | | | | 1.14 | %† | | | 1.47 | %† | | | 1.14 | %† | | | 34 | % | |
Service Class | |
10/1/2020-3/31/21+ | | $ | 18.74 | | | | 40.34 | % | | $ | 0.8 | | | | 1.63 | %† | | | (0.20 | %)† | | | 1.64 | %† | | | 19 | % | |
9/30/20 | | $ | 13.56 | | | | -6.55 | % | | $ | 0.8 | | | | 1.77 | % | | | 1.91 | % | | | 1.77 | % | | | 42 | % | |
9/30/19 | | $ | 14.51 | | | | -3.11 | % | | $ | 1.0 | | | | 1.58 | % | | | 1.70 | % | | | 1.58 | % | | | 39 | % | |
9/30/18 | | $ | 16.21 | | | | -6.73 | % | | $ | 1.5 | | | | 1.71 | % | | | 0.93 | % | | | 1.71 | % | | | 45 | % | |
9/30/17 | | $ | 18.00 | | | | 25.56 | % | | $ | 2.1 | | | | 1.66 | % | | | 1.04 | % | | | 1.66 | % | | | 34 | % | |
9/30/16 | | $ | 14.75 | | | | 6.39 | % | | $ | 1.5 | | | | 1.69 | % | | | 2.69 | % | | | 1.69 | % | | | 38 | % | |
Class R6 | |
3/31/21(d)+ | | $ | 18.81 | | | | 12.91 | % | | $ | 70.8 | | | | 1.09 | %† | | | 0.22 | %† | | | 1.11 | %† | | | 19 | % | |
| + Unaudited. | |
| † Data has been annualized. | |
| (a) Computed using average shares outstanding throughout the period. | |
| (b) Amount rounds to less than $0.01 per share. | |
| (c) Commenced on 11/30/2016. | |
| (d) Commenced on 12/15/2020. | |
Oakmark.com 91
Oakmark Funds
Financial Highlights
For a share outstanding throughout each period
| | | | | Income from Investment Operations: | | Less Distributions: | |
| | | Net Asset
Value,
Beginning of
Period | | Net
Investment
Income | | Net Gain
(Loss) on
Investments
(Both
Realized and
Unrealized) | | Total from
Investment
Operations | | Distributions
from Net
Investment
Income | | Distributions
from
Capital
Gains | | Total
Distributions | | Redemption
Fees | |
Oakmark Equity and Income Fund | |
Investor Class | |
10/1/2020-3/31/21+ | | $ | 27.50 | | | | 0.16 | (a) | | | 7.39 | | | | 7.55 | | | | (0.35 | ) | | | (0.93 | ) | | | (1.28 | ) | | | 0.00 | | |
9/30/20 | | $ | 30.30 | | | | 0.42 | (a) | | | (0.56 | ) | | | (0.14 | ) | | | (0.51 | ) | | | (2.15 | ) | | | (2.66 | ) | | | 0.00 | | |
9/30/19 | | $ | 32.52 | | | | 0.52 | (a) | | | (0.04 | ) | | | 0.48 | | | | (0.50 | ) | | | (2.20 | ) | | | (2.70 | ) | | | 0.00 | | |
9/30/18 | | $ | 33.41 | | | | 0.49 | (a) | | | 1.22 | | | | 1.71 | | | | (0.43 | ) | | | (2.17 | ) | | | (2.60 | ) | | | 0.00 | | |
9/30/17 | | $ | 30.20 | | | | 0.58 | | | | 3.89 | | | | 4.47 | | | | (0.47 | ) | | | (0.79 | ) | | | (1.26 | ) | | | 0.00 | | |
9/30/16 | | $ | 29.98 | | | | 0.36 | (a) | | | 1.73 | | | | 2.09 | | | | (0.34 | ) | | | (1.53 | ) | | | (1.87 | ) | | | 0.00 | | |
Advisor Class | |
10/1/2020-3/31/21+ | | $ | 27.51 | | | | 0.19 | (a) | | | 7.39 | | | | 7.58 | | | | (0.39 | ) | | | (0.93 | ) | | | (1.32 | ) | | | 0.00 | | |
9/30/20 | | $ | 30.31 | | | | 0.46 | (a) | | | (0.56 | ) | | | (0.10 | ) | | | (0.55 | ) | | | (2.15 | ) | | | (2.70 | ) | | | 0.00 | | |
9/30/19 | | $ | 32.55 | | | | 0.55 | (a) | | | (0.03 | ) | | | 0.52 | | | | (0.56 | ) | | | (2.20 | ) | | | (2.76 | ) | | | 0.00 | | |
9/30/18 | | $ | 33.46 | | | | 0.56 | (a) | | | 1.20 | | | | 1.76 | | | | (0.50 | ) | | | (2.17 | ) | | | (2.67 | ) | | | 0.00 | | |
9/30/17(b) | | $ | 29.97 | | | | 0.55 | (a) | | | 2.94 | | | | 3.49 | | | | 0.00 | | | | 0.00 | | | | 0.00 | | | | 0.00 | | |
Institutional Class | |
10/1/2020-3/31/21+ | | $ | 27.52 | | | | 0.20 | (a) | | | 7.39 | | | | 7.59 | | | | (0.41 | ) | | | (0.93 | ) | | | (1.34 | ) | | | 0.00 | | |
9/30/20 | | $ | 30.33 | | | | 0.47 | (a) | | | (0.56 | ) | | | (0.09 | ) | | | (0.57 | ) | | | (2.15 | ) | | | (2.72 | ) | | | 0.00 | | |
9/30/19 | | $ | 32.56 | | | | 0.59 | (a) | | | (0.05 | ) | | | 0.54 | | | | (0.57 | ) | | | (2.20 | ) | | | (2.77 | ) | | | 0.00 | | |
9/30/18 | | $ | 33.46 | | | | 0.58 | (a) | | | 1.19 | | | | 1.77 | | | | (0.50 | ) | | | (2.17 | ) | | | (2.67 | ) | | | 0.00 | | |
9/30/17(b) | | $ | 29.97 | | | | 0.59 | (a) | | | 2.90 | | | | 3.49 | | | | 0.00 | | | | 0.00 | | | | 0.00 | | | | 0.00 | | |
Service Class | |
10/1/2020-3/31/21+ | | $ | 27.32 | | | | 0.13 | (a) | | | 7.35 | | | | 7.48 | | | | (0.25 | ) | | | (0.93 | ) | | | (1.18 | ) | | | 0.00 | | |
9/30/20 | | $ | 30.11 | | | | 0.35 | (a) | | | (0.56 | ) | | | (0.21 | ) | | | (0.43 | ) | | | (2.15 | ) | | | (2.58 | ) | | | 0.00 | | |
9/30/19 | | $ | 32.29 | | | | 0.44 | (a) | | | (0.02 | ) | | | 0.42 | | | | (0.40 | ) | | | (2.20 | ) | | | (2.60 | ) | | | 0.00 | | |
9/30/18 | | $ | 33.19 | | | | 0.40 | (a) | | | 1.21 | | | | 1.61 | | | | (0.34 | ) | | | (2.17 | ) | | | (2.51 | ) | | | 0.00 | | |
9/30/17 | | $ | 30.00 | | | | 0.45 | | | | 3.90 | | | | 4.35 | | | | (0.37 | ) | | | (0.79 | ) | | | (1.16 | ) | | | 0.00 | | |
9/30/16 | | $ | 29.75 | | | | 0.26 | (a) | | | 1.73 | | | | 1.99 | | | | (0.21 | ) | | | (1.53 | ) | | | (1.74 | ) | | | 0.00 | | |
Class R6 | |
3/31/21(c)+ | | $ | 30.24 | | | | 0.13 | (a) | | | 3.40 | | | | 3.53 | | | | 0.00 | | | | 0.00 | | | | 0.00 | | | | 0.00 | | |
| + Unaudited. | |
| † Data has been annualized. | |
| (a) Computed using average shares outstanding throughout the period. | |
| (b) Commenced on 11/30/2016. | |
| (c) Commenced on 12/15/2020. | |
92 OAKMARK FUNDS
| | | | | | | Ratios/Supplemental Data: | | | |
| | | Net Asset
Value,
End of
Period | | Total
Return | | Net Assets,
End of
Period
($million) | | Ratio of
Net
Expenses
to Average
Net Assets | | Ratio of
Net
Investment
Income to
Average
Net Assets | | Ratio of
Gross
Expenses
to Average
Net Assets | | Portfolio
Turnover
Rate | |
Oakmark Equity and Income Fund | |
Investor Class | |
10/1/2020-3/31/21+ | | $ | 33.77 | | | | 27.97 | % | | $ | 5,668.6 | | | | 0.84 | %† | | | 1.05 | %† | | | 0.89 | %† | | | 9 | % | |
9/30/20 | | $ | 27.50 | | | | -0.90 | % | | $ | 5,492.4 | | | | 0.84 | % | | | 1.52 | % | | | 0.94 | % | | | 15 | % | |
9/30/19 | | $ | 30.30 | | | | 2.29 | % | | $ | 9,006.7 | | | | 0.81 | % | | | 1.74 | % | | | 0.91 | % | | | 11 | % | |
9/30/18 | | $ | 32.52 | | | | 5.29 | % | | $ | 12,159.5 | | | | 0.78 | % | | | 1.51 | % | | | 0.88 | % | | | 23 | % | |
9/30/17 | | $ | 33.41 | | | | 15.30 | % | | $ | 14,249.1 | | | | 0.78 | % | | | 1.71 | % | | | 0.87 | % | | | 18 | % | |
9/30/16 | | $ | 30.20 | | | | 7.34 | % | | $ | 15,367.7 | | | | 0.79 | % | | | 1.22 | % | | | 0.79 | % | | | 18 | % | |
Advisor Class | |
10/1/2020-3/31/21+ | | $ | 33.77 | | | | 28.07 | % | | $ | 1,126.9 | | | | 0.65 | %† | | | 1.24 | %† | | | 0.70 | %† | | | 9 | % | |
9/30/20 | | $ | 27.51 | | | | -0.76 | % | | $ | 951.9 | | | | 0.71 | % | | | 1.65 | % | | | 0.81 | % | | | 15 | % | |
9/30/19 | | $ | 30.31 | | | | 2.41 | % | | $ | 1,347.6 | | | | 0.68 | % | | | 1.86 | % | | | 0.78 | % | | | 11 | % | |
9/30/18 | | $ | 32.55 | | | | 5.42 | % | | $ | 1,720.5 | | | | 0.64 | % | | | 1.72 | % | | | 0.74 | % | | | 23 | % | |
9/30/17(b) | | $ | 33.46 | | | | 11.64 | % | | $ | 724.7 | | | | 0.61 | %† | | | 2.07 | %† | | | 0.71 | %† | | | 18 | % | |
Institutional Class | |
10/1/2020-3/31/21+ | | $ | 33.77 | | | | 28.15 | % | | $ | 721.5 | | | | 0.59 | %† | | | 1.31 | %† | | | 0.65 | %† | | | 9 | % | |
9/30/20 | | $ | 27.52 | | | | -0.73 | % | | $ | 844.3 | | | | 0.65 | % | | | 1.72 | % | | | 0.75 | % | | | 15 | % | |
9/30/19 | | $ | 30.33 | | | | 2.49 | % | | $ | 1,188.9 | | | | 0.63 | % | | | 1.96 | % | | | 0.72 | % | | | 11 | % | |
9/30/18 | | $ | 32.56 | | | | 5.47 | % | | $ | 1,035.0 | | | | 0.59 | % | | | 1.77 | % | | | 0.69 | % | | | 23 | % | |
9/30/17(b) | | $ | 33.46 | | | | 11.64 | % | | $ | 536.3 | | | | 0.59 | %† | | | 2.19 | %† | | | 0.69 | %† | | | 18 | % | |
Service Class | |
10/1/2020-3/31/21+ | | $ | 33.62 | | | | 27.85 | % | | $ | 164.7 | | | | 1.04 | %† | | | 0.85 | %† | | | 1.10 | %† | | | 9 | % | |
9/30/20 | | $ | 27.32 | | | | -1.16 | % | | $ | 174.3 | | | | 1.10 | % | | | 1.25 | % | | | 1.20 | % | | | 15 | % | |
9/30/19 | | $ | 30.11 | | | | 2.05 | % | | $ | 293.1 | | | | 1.05 | % | | | 1.48 | % | | | 1.15 | % | | | 11 | % | |
9/30/18 | | $ | 32.29 | | | | 4.99 | % | | $ | 447.5 | | | | 1.05 | % | | | 1.23 | % | | | 1.15 | % | | | 23 | % | |
9/30/17 | | $ | 33.19 | | | | 14.95 | % | | $ | 622.1 | | | | 1.05 | % | | | 1.44 | % | | | 1.14 | % | | | 18 | % | |
9/30/16 | | $ | 30.00 | | | | 7.02 | % | | $ | 744.2 | | | | 1.10 | % | | | 0.90 | % | | | 1.10 | % | | | 18 | % | |
Class R6 | |
3/31/21(c)+ | | $ | 33.77 | | | | 11.67 | % | | $ | 81.7 | | | | 0.57 | %† | | | 1.40 | %† | | | 0.59 | %† | | | 9 | % | |
| + Unaudited. | |
| † Data has been annualized. | |
| (a) Computed using average shares outstanding throughout the period. | |
| (b) Commenced on 11/30/2016. | |
| (c) Commenced on 12/15/2020. | |
Oakmark.com 93
Oakmark Funds
Financial Highlights
For a share outstanding throughout each period
| | | | | Income from Investment Operations: | | Less Distributions: | |
| | | Net Asset
Value,
Beginning of
Period | | Net
Investment
Income | | Net Gain
(Loss) on
Investments
(Both
Realized and
Unrealized) | | Total from
Investment
Operations | | Distributions
from Net
Investment
Income | | Distributions
from
Capital
Gains | | Total
Distributions | | Redemption
Fees | |
Oakmark Bond Fund | |
Advisor Class | |
10/1/2020-3/31/21+ | | $ | 10.16 | | | | 0.08 | (a) | | | 0.09 | | | | 0.17 | | | | (0.08 | ) | | | (0.05 | ) | | | (0.13 | ) | | | 0.00 | | |
9/30/20(b) | | $ | 10.00 | | | | 0.04 | (a) | | | 0.15 | | | | 0.19 | | | | (0.03 | ) | | | 0.00 | | | | (0.03 | ) | | | 0.00 | | |
Institutional Class | |
10/1/2020-3/31/21+ | | $ | 10.17 | | | | 0.09 | (a) | | | 0.08 | | | | 0.17 | | | | (0.08 | ) | | | (0.05 | ) | | | (0.13 | ) | | | 0.00 | | |
9/30/20(b) | | $ | 10.00 | | | | 0.04 | (a) | | | 0.17 | | | | 0.21 | | | | (0.04 | ) | | | 0.00 | | | | (0.04 | ) | | | 0.00 | | |
Class R6 | |
3/31/21(c)+ | | $ | 10.32 | | | | 0.05 | (a) | | | (0.11 | ) | | | (0.06 | ) | | | (0.06 | ) | | | 0.00 | | | | (0.06 | ) | | | 0.00 | | |
| + Unaudited. | |
| † Data has been annualized. | |
| (a) Computed using average shares outstanding throughout the period. | |
| (b) Commenced operations on 6/10/2020. | |
| (c) Commenced on 12/15/2020. | |
94 OAKMARK FUNDS
| | | | | | | Ratios/Supplemental Data: | | | |
| | | Net Asset
Value,
End of
Period | | Total
Return | | Net Assets,
End of
Period
($million) | | Ratio of
Net
Expenses
to Average
Net Assets | | Ratio of
Net
Investment
Income to
Average
Net Assets | | Ratio of
Gross
Expenses
to Average
Net Assets | | Portfolio
Turnover
Rate | |
Oakmark Bond Fund | |
Advisor Class | |
10/1/2020-3/31/21+ | | $ | 10.20 | | | | 1.52 | % | | $ | 1.3 | | | | 0.61 | %† | | | 1.59 | %† | | | 0.97 | %† | | | 45 | % | |
9/30/20(b) | | $ | 10.16 | | | | 2.04 | % | | $ | 0.6 | | | | 0.54 | %† | | | 1.19 | %† | | | 3.14 | %† | | | 21 | % | |
Institutional Class | |
10/1/2020-3/31/21+ | | $ | 10.21 | | | | 1.67 | % | | $ | 3.0 | | | | 0.45 | %† | | | 1.75 | %† | | | 0.88 | %† | | | 45 | % | |
9/30/20(b) | | $ | 10.17 | | | | 2.07 | % | | $ | 79.0 | | | | 0.44 | %† | | | 1.32 | %† | | | 2.42 | %† | | | 21 | % | |
Class R6 | |
3/31/21(c)+ | | $ | 10.20 | | | | -0.57 | % | | $ | 85.0 | | | | 0.44 | %† | | | 1.73 | %† | | | 0.99 | %† | | | 45 | % | |
| + Unaudited. | |
| † Data has been annualized. | |
| (a) Computed using average shares outstanding throughout the period. | |
| (b) Commenced operations on 6/10/2020. | |
| (c) Commenced on 12/15/2020. | |
Oakmark.com 95
Disclosures and Endnotes
Reporting to Shareholders. The Funds reduce the number of duplicate prospectuses, annual and semi-annual reports your household receives by sending only one copy of each to those addresses shared by two or more accounts. Call the Funds at 1-800-OAKMARK (625-6275) to request individual copies of these documents. The Funds will begin sending individual copies 30 days after receiving your request.
Before investing in any Oakmark Fund, you should carefully consider the Fund's investment objectives, risks, management fees and other expenses. This and other important information is contained in the Funds' prospectus and a Fund's summary prospectus. Please read the prospectus and summary prospectus carefully before investing. For more information, please visit Oakmark.com or call 1-800-OAKMARK (625-6275).
The discussion of the Funds' investments and investment strat- egy (including current investment themes, the portfolio managers' research and investment process, and portfolio char- acteristics) represents the Funds' investments and the views of the portfolio managers and Harris Associates L.P., the Funds' investment adviser, at the time of this report, and are subject to change without notice.
All Oakmark Funds: Investing in value stocks presents the risk that value stocks may fall out of favor with investors and under- perform growth stocks during given periods.
Oakmark, Oakmark Equity and Income, Oakmark Global, Oakmark International, and Oakmark International Small Cap and Oakmark Bond Funds: The Funds' portfolios tend to be invested in a relatively small number of stocks. As a result, the appreciation or depreciation of any one security held will have a greater impact on the Funds' net asset value than it would if the Funds invest in a larger number of securities. Although that strategy has the potential to generate attractive returns over time, it also increases the Funds' volatility.
Oakmark Select and Oakmark Equity and Income Funds: The stocks of medium-sized companies tend to be more volatile than those of large companies and have underperformed the stocks of small and large companies during some periods.
Because the Oakmark Select and Oakmark Global Select Funds are non-diversified, the performance of each holding will have a greater impact on the Funds' total return and may make the Funds' returns more volatile than a more diversified fund.
Oakmark Global, Oakmark Global Select, Oakmark International, Oakmark International Small Cap and Oakmark Bond Funds: Investing in foreign securities presents risks which in some ways may be greater than U.S. investments. Those risks include: currency fluctuation; different regulation, accounting standards, trading practices and levels of available information; generally higher transaction costs; and political risks.
The percentages of hedge exposure for each foreign currency are calculated by dividing the market value of all same-currency forward contracts by the market value of the underlying equity exposure to that currency.
Oakmark Equity and Income and Oakmark Bond Funds invests in medium- and lower quality debt securities that have higher yield potential but present greater investment and credit risk than higher quality securities. These risks may result in greater share price volatility.
Oakmark International Small Cap Fund: The stocks of smaller companies often involve more risk than the stocks of larger companies. Stocks of small companies tend to be more volatile and have a smaller public market than stocks of larger companies.
Small companies may have a shorter history of operations than larger companies, may not have as great an ability to raise addi- tional capital and may have a less diversified product line, making them more susceptible to market pressure.
Oakmark Equity and Income and Oakmark Bond Funds: The Funds' may be subject to prepayment and extension risk which may shorten or lengthen the duration of the Funds' investments. The Funds' may also be subject to credit risk which is the risk the issuer or guarantor of a debt security will be unable or unwilling to make timely payments of interest or principal or to otherwise honor its obligations. The Funds' yield and share price will fluctuate in response to changes in interest rates and there is a risk of loss due to changes in interest rates. Investing in when-issued or forward-settling transactions may be less favorable than the price or yield available in the market when the transaction takes place. The Funds' exposure to loan interests may be subject to restrictions on transfer, illiquid, and difficult to value.
Endnotes:
1. The S&P 500 Total Return Index is a float-adjusted, capitalization-weighted index of 500 U.S. large- capitalization stocks representing all major industries. It is a widely recognized index of broad U.S. equity market performance. Returns reflect the reinvestment of dividends. This index is unmanaged and investors cannot invest directly in this index.
2. The Price-Earnings Ratio ("P/E") is the most common measure of the expensiveness of a stock.
3. Grant, Adam. (2021). Think Again. Viking.
4. The Dow Jones Industrial Average is a price-weighted measure of 30 U.S. blue-chip companies. The index covers all industries except transportation and utilities. This index is unmanaged and investors cannot invest directly in this index.
5. The Lipper Large-Cap Value Fund Index measures the equal-weighted performance of the 30 largest U.S. large-cap value funds as defined by Lipper. This index is unmanaged and investors cannot invest directly in this index.
6. Portfolio holdings are subject to change without notice and are not intended as recommendations of individual stocks.
7. The Lipper Multi-Cap Value Fund Index measures the equal-weighted performance of the 30 largest U.S. multi-cap value funds as defined by Lipper. This index is unmanaged and investors cannot invest directly in this index.
8. The MSCI World Index (Net) is a free float-adjusted, market capitalization-weighted index that is designed to measure the global equity market performance of developed markets. The index covers approximately 85% of the free float-adjusted market capitalization in each country. This benchmark calculates reinvested dividends net of withholding taxes. This index is unmanaged and investors cannot invest directly in this index.
9. The Lipper Global Fund Index measures the equal-weighted performance of the 30 largest global equity funds as defined by Lipper. This index is unmanaged and investors cannot invest directly in this index.
10. The Nikkei Stock Average (Nikkei 225) is a price-weighted average of 225 Japanese companies listed in the First Section of the Tokyo Stock Exchange. Constituents are
96 OAKMARK FUNDS
Disclosures and Endnotes (continued)
selected based on liquidity and industry representation. This index is unmanaged and investors cannot invest directly in this index.
11. The EURO STOXX 50 Index, Europe's leading blue-chip index for the Eurozone, provides a blue-chip representation of supersector leaders in the Eurozone. The index covers 50 stocks from 11 Eurozone countries. This index is unmanaged and investors cannot invest directly in this index.
12. The MSCI World ex U.S. Index (Net) is a free float-adjusted, market capitalization-weighted index that is designed to measure international developed market equity performance, excluding the U.S. The index covers approximately 85% of the free float-adjusted market capitalization in each country. This benchmark calculates reinvested dividends net of withholding taxes. This index is unmanaged and investors cannot invest directly in this index.
13. The MSCI EAFE Index (Net) is designed to represent the performance of large- and mid-cap securities across 21 developed markets, including countries in Europe, Australasia and the Far East, excluding the U.S. and Canada. The index covers approximately 85% of the free float- adjusted market capitalization in each of the 21 countries. This benchmark calculates reinvested dividends net of withholding taxes. This index is unmanaged and investors cannot invest directly in this index.
14. The Lipper International Fund Index measures the equal- weighted performance of the 30 largest international equity funds as defined by Lipper. This index is unmanaged and investors cannot invest directly in this index.
15. The MSCI World ex U.S. Small Cap Index (Net) is designed to measure performance of small-cap stocks across 22 of 23 developed markets (excluding the U.S.). The index covers approximately 14% of the free float-adjusted market capitalization in each country. This benchmark calculates reinvested dividends net of withholding taxes. This index is unmanaged and investors cannot invest directly in this index.
16. The Lipper International Small-Cap Fund Index measures the equal-weighted performance of the 30 largest international small-cap equity funds as defined by Lipper. This index is unmanaged and investors cannot invest directly in this index.
17. EBITA refers to earnings before the deduction of expenses of interest, taxes and amortization, which is a measure of operating income.
18. The Lipper Balanced Fund Index measures the equal- weighted performance of the 30 largest U.S. balanced funds as defined by Lipper. This index is unmanaged and investors cannot invest directly in this index.
19. The Barclays U.S. Government/Credit Index measures the non-securitized component of the U.S. Aggregate Index. It includes investment grade, U.S. dollar-denominated, fixed- rate Treasuries, government-related and corporate securities. This index is unmanaged and investors cannot invest directly in this index.
20. The Bloomberg Barclays U.S. Aggregate Bond Index is a broad-based benchmark that measures the investment grade, U.S. dollar-denominated, fixed-rate taxable bond market. The index includes Treasuries, government-related
and corporate securities, mortgage-backed securities (agency fixed-rate and hybrid ARM pass-throughs), asset-backed securities and commercial mortgage-backed securities (agency and non-agency). This index is unmanaged and investors cannot invest directly in this index.
21. The Lipper Core Plus Bond Funds Index is an equally weighted performance index of the largest qualifying funds (based on net assets) in the Lipper Core Plus Bond Funds classification. There are currently 30 funds represented in this Index.
22. The "core" PCE price index is defined as personal consumption expenditures (PCE) prices excluding food and energy prices. The core PCE price index measures the prices paid by consumers for goods and services without the volatility caused by movements in food and energy prices to reveal underlying inflation trends.
Oakmark.com 97

This page intentionally left blank.
98 OAKMARK FUNDS

This page intentionally left blank.
Oakmark.com 99

This page intentionally left blank.
100 OAKMARK FUNDS
Oakmark Funds
Trustees and Officers
Trustees
Thomas H. Hayden—Chair*
Hugh T. Hurley, III
Patricia Louie
Christine M. Maki
Laurence C. Morse, Ph.D.
Mindy M. Posoff
Steven S. Rogers
Kristi L. Rowsell
Rana J. Wright**
Officers
Rana J. Wright—President and Principal Executive Officer
Adam D. Abbas—Vice President
Joseph J. Allessie—Vice President, Secretary and Chief Legal Officer***
Anthony P. Coniaris—Executive Vice President
Rick J. Dercks—Vice President
Kathleen O. Gerdes—Vice President****
Kevin G. Grant—Executive Vice President
Justin D. Hance—Vice President
David G. Herro—Vice President
M. Colin Hudson—Vice President
John J. Kane—Vice President, Chief Compliance Officer, Assistant Secretary and Anti-Money Laundering Officer
Christopher W. Keller—Vice President
Eric Liu—Vice President
Jason E. Long—Vice President
Michael L. Manelli—Vice President
Clyde S. McGregor—Vice President
Thomas W. Murray—Vice President
Michael J. Neary—Vice President
Michael A. Nicolas—Vice President
William C. Nygren—Vice President
Howard M. Reich—Vice President
Zachary D. Weber—Vice President, Principal Accounting Officer, Principal Financial Officer and Treasurer
* Mr. Hayden became Chair of the Board effective January 1, 2021.
** Ms. Wright became Trustee, Principal Executive Officer, and President each effective January 1, 2021.
*** Mr. Allessie assumed his new duties effective January 1, 2021.
**** Ms. Gerdes assumed her duties effective January 27, 2021.
Other Information
Investment Adviser
Harris Associates L.P.
111 S. Wacker Drive
Chicago, Illinois 60606-4319
Transfer Agent
DST Asset Manager Solutions, Inc.
Quincy, Massachusetts
Legal Counsel
K&L Gates LLP
Washington, D.C.
Independent Registered Public Accounting Firm
Deloitte & Touche LLP
Chicago, Illinois
Contact Us
Please call 1-800-OAKMARK
(1-800-625-6275)
or 617-483-8327
Website
Oakmark.com
Twitter
@HarrisOakmark
To obtain a prospectus, an application or periodic reports, access our website at Oakmark.com or call 1-800-OAKMARK (625-6275) or 617-483-8327.
Each Fund files its complete schedule of portfolio holdings with the Securities and Exchange Commission ("SEC") for the first and third quarters of each fiscal year on Form N-PORT. The Funds' Form N-PORTs are available on the SEC's website at www.sec.gov.
A description of the policies and procedures the Funds use to determine how to vote proxies relating to portfolio securities is available without charge, upon request, by calling toll-free 1-800-625-6275; on the Funds' website at Oakmark.com; and on the SEC's website at www.sec.gov.
No later than August 31 of each year, information regarding how the Adviser, on behalf of the Funds, voted proxies relating to the Funds' portfolio securities for the 12 months ended the preceding June 30 will be available through a link on the Funds' website at Oakmark.com and on the SEC's website at www.sec.gov.
This report is submitted for the general information of the shareholders of the Funds. The report is not authorized for distribution to prospective investors in the Funds unless it is accompanied or preceded by a currently effective prospectus of the Funds.
No sales charge to the shareholder or to the new investor is made in offering the shares of the Funds.
Oakmark.com 101


Item 2. Code of Ethics.
Not required in this filing.
Item 3. Audit Committee Financial Expert.
Not required in this filing.
Item 4. Principal Accountant Fees and Services.
Not required in this filing.
Item 5. Audit Committee of Listed Registrants.
Not applicable.
Item 6. Investments.
| (a) | The Schedule of Investments in securities of unaffiliated issuers as of the close of the reporting period is included as part of the semi-annual report to shareholders filed under Item 1 of this Form. |
Item 7. Disclosure of Proxy Voting Policies and Procedures for Closed-End Management Investment Companies.
Not applicable.
Item 8. Portfolio Managers of Closed-End Management Investment Companies.
Not applicable.
Item 9. Purchases of Equity Securities by Closed-End Management Investment Company and Affiliated Purchasers.
Not applicable.
Item 10. Submission of Matters to a Vote of Security Holders.
During the period covered by this report, no material changes were made to the procedures by which shareholders may recommend nominees to the Registrant’s board of trustees.
Item 11. Controls and Procedures.
| (a) | Based on an evaluation of the Registrant’s disclosure controls and procedures (as defined in Rule 30a-3(c) under the Investment Company Act of 1940, the “Disclosure Controls”), the Disclosure Controls are effectively designed to ensure that information required to be disclosed by the Registrant in this report is recorded, processed, summarized, and reported within 90 days prior to the filing of this report, including ensuring that information required to be disclosed in this report is accumulated and communicated to the Registrant's management, including the Registrant's principal executive officer and principal financial officer, as appropriate to allow timely decisions regarding required disclosure. |
| (b) | There were no changes in the Registrant's internal controls over financial reporting (as defined in Rule 30a-3(d) under the Investment Company Act of 1940) that occurred during the Registrant’s most recent fiscal half-year period covered by this report that has materially affected, or is reasonably likely to materially affect, the Registrant's internal control over financial reporting. |
Item 12. Disclosure of Securities Lending Activities for Closed-End Management Investment Companies.
Not applicable.
Item 13. Exhibits.
| | | (3) | Not applicable. |
| | | |
| | | (4) | Not applicable. |
SIGNATURES
Pursuant to the requirements of the Securities Exchange Act of 1934 and the Investment Company Act of 1940, the Registrant has duly caused this report to be signed on its behalf by the undersigned, thereunto duly authorized.
Harris Associates Investment Trust
| By: | /s/ Rana J. Wright | |
| | Rana J. Wright | |
| | Principal Executive Officer | |
| | | |
| Date: | May 25, 2021 | |
Pursuant to the requirements of the Securities Exchange Act of 1934 and the Investment Company Act of 1940, this report has been signed below by the following persons on behalf of the Registrant and in the capacities and on the dates indicated.
| By: | /s/ Rana J. Wright | |
| | Rana J. Wright | |
| | Principal Executive Officer | |
| | | |
| Date: | May 25, 2021 | |
| | | |
| By: | /s/ Zachary D. Weber | |
| | Zachary D. Weber | |
| | Principal Financial Officer, Principal Accounting Officer and Treasurer | |
| | | |
| Date: | May 25, 2021 |