UNITED STATES
SECURITIES AND EXCHANGE COMMISSION
Washington, D.C. 20549
FORM N-CSR
CERTIFIED SHAREHOLDER REPORT OF REGISTERED
MANAGEMENT INVESTMENT COMPANIES
Investment Company Act file number | 811-06279 |
|
Harris Associates Investment Trust |
(Exact name of registrant as specified in charter) |
|
111 South Wacker Drive, Suite 4600 Chicago, Illinois | | 60606-4319 |
(Address of principal executive offices) | | (Zip code) |
|
Kristi L. Rowsell Harris Associates L.P. 111 South Wacker Drive, Suite 4600 Chicago, Illinois 60606-4319 | Ndenisarya M. Bregasi, Esq. K&L Gates LLP 1601 K Street, N.W. Washington, D.C. 20006-1600 |
(Name and address of agent for service) |
|
Registrant’s telephone number, including area code: | (312) 646-3600 | |
|
Date of fiscal year end: | 09/30/18 | |
|
Date of reporting period: | 03/31/18 | |
| | | | | | | | | |
Item 1. Reports to Shareholders.
OAKMARK FUNDS
SEMI-ANNUAL REPORT | MARCH 31, 2018
OAKMARK FUND
OAKMARK SELECT FUND
OAKMARK EQUITY AND INCOME FUND
OAKMARK GLOBAL FUND
OAKMARK GLOBAL SELECT FUND
OAKMARK INTERNATIONAL FUND
OAKMARK INTERNATIONAL SMALL CAP FUND

Oakmark Funds
2018 Semi-Annual Report
TABLE OF CONTENTS
Fund Expenses | | | 1 | | |
Commentary on Oakmark and Oakmark Select Funds | | | 2 | | |
Oakmark Fund | |
Summary Information | | | 4 | | |
Portfolio Manager Commentary | | | 5 | | |
Schedule of Investments | | | 6 | | |
Oakmark Select Fund | |
Summary Information | | | 8 | | |
Portfolio Manager Commentary | | | 9 | | |
Schedule of Investments | | | 10 | | |
Oakmark Equity and Income Fund | |
Summary Information | | | 12 | | |
Portfolio Manager Commentary | | | 13 | | |
Schedule of Investments | | | 15 | | |
Oakmark Global Fund | |
Summary Information | | | 22 | | |
Portfolio Manager Commentary | | | 23 | | |
Schedule of Investments | | | 25 | | |
Oakmark Global Select Fund | |
Summary Information | | | 28 | | |
Portfolio Manager Commentary | | | 29 | | |
Schedule of Investments | | | 30 | | |
Oakmark International Fund | |
Summary Information | | | 32 | | |
Portfolio Manager Commentary | | | 33 | | |
Schedule of Investments | | | 34 | | |
Oakmark International Small Cap Fund | |
Summary Information | | | 38 | | |
Portfolio Manager Commentary | | | 39 | | |
Schedule of Investments | | | 40 | | |
Financial Statements | |
Statements of Assets and Liabilities | | | 44 | | |
Statements of Operations | | | 46 | | |
Statements of Changes in Net Assets | | | 48 | | |
Notes to Financial Statements | | | 61 | | |
Financial Highlights | | | 72 | | |
Disclosure Regarding Investment Advisory
Agreements Approval | | | 80 | | |
Disclosures and Endnotes | | | 83 | | |
Trustees and Officers | | | 85 | | |
FORWARD-LOOKING STATEMENT DISCLOSURE
One of our most important responsibilities as mutual fund managers is to communicate with shareholders in an open and direct manner. Some of our comments in our letters to shareholders are based on current management expectations and are considered "forward-looking statements." Actual future results, however, may prove to be different from our expectations. You can identify forward-looking statements by words such as "estimate", "may", "will", "expect", "believe",
"plan" and other similar terms. We cannot promise future returns. Our opinions are a reflection of our best judgment at the time this report is compiled, and we disclaim any obligation to update or alter forward-looking statements as a result of new information, future events, or otherwise.
Oakmark.com
Fund Expenses (Unaudited)
A shareholder of each Fund incurs ongoing costs, including investment advisory fees, transfer agent fees and other Fund expenses. The examples below are intended to help shareholders understand the ongoing costs (in dollars) of investing in each Fund and to compare these costs with the ongoing costs of investing in other funds.
The following table provides information about actual account values and actual Fund expenses as well as hypothetical account values and hypothetical fund expenses for shares of each Fund.
ACTUAL EXPENSES
The following table shows the expenses a shareholder would have paid on a $1,000 investment in each Fund from October 1, 2017 to March 31, 2018, as well as how much a $1,000 investment would be worth at the close of the period, assuming actual Fund returns and expenses. A shareholder can estimate expenses incurred for the period by dividing the account value at March 31, 2018, by $1,000 and multiplying the result by the number in the "Actual—Expenses Paid During Period" column shown below.
Shares of Oakmark International Small Cap Fund, invested for 90 days or less, may be charged a 2% redemption fee upon redemption. Please consult the Funds' prospectus at Oakmark.com for more information.
HYPOTHETICAL EXAMPLE FOR COMPARISON PURPOSES
The following table provides information about hypothetical account values and hypothetical expenses for shares of each Fund based on actual expense ratios and an assumed rate of return of 5% per year before expenses, which are not the Funds' actual returns. The hypothetical account values and expenses may not be used to estimate the actual ending account balances or actual expenses shareholders paid for the period. Shareholders may use this information to compare the ongoing costs of investing in a Fund and other funds. To do so, compare this 5% hypothetical example with the 5% hypothetical examples that appear in the shareholder reports of the other funds.
Please note that the expenses shown in the table are meant to highlight your ongoing costs only and do not reflect any transaction costs, such as redemption fees. Therefore, the "Hypothetical—Expenses Paid During Period" column of the table is useful in comparing ongoing costs only and will not help you determine the relative total costs of owning different funds. If these transaction costs were included, the total costs would have been higher.
| | | | | ACTUAL | | HYPOTHETICAL
(5% annual return
before expenses) | | | |
| | | Beginning
Account Value
(10/1/17) | | Ending
Account Value
(3/31/18) | | Expenses
Paid During
Period* | | Ending
Account Value
(3/31/18) | | Expenses
Paid During
Period* | | Annualized
Expense
Ratio | |
Oakmark Fund | |
Investor Class | | $ | 1,000.00 | | | $ | 1,050.50 | | | $ | 4.29 | | | $ | 1,020.74 | | | $ | 4.23 | | | | 0.84 | % | |
Advisor Class | | $ | 1,000.00 | | | $ | 1,050.90 | | | $ | 3.83 | | | $ | 1,021.19 | | | $ | 3.78 | | | | 0.75 | % | |
Institutional Class | | $ | 1,000.00 | | | $ | 1,051.20 | | | $ | 3.58 | | | $ | 1,021.44 | | | $ | 3.53 | | | | 0.70 | % | |
Service Class | | $ | 1,000.00 | | | $ | 1,048.80 | | | $ | 5.82 | | | $ | 1,019.25 | | | $ | 5.74 | | | | 1.14 | % | |
Oakmark Select Fund | |
Investor Class | | $ | 1,000.00 | | | $ | 1,000.60 | | | $ | 4.79 | | | $ | 1,020.14 | | | $ | 4.84 | | | | 0.96 | % | |
Advisor Class | | $ | 1,000.00 | | | $ | 1,001.30 | | | $ | 4.04 | | | $ | 1,020.89 | | | $ | 4.08 | | | | 0.81 | % | |
Institutional Class | | $ | 1,000.00 | | | $ | 1,001.40 | | | $ | 3.94 | | | $ | 1,020.99 | | | $ | 3.98 | | | | 0.79 | % | |
Service Class | | $ | 1,000.00 | | | $ | 998.80 | | | $ | 6.53 | | | $ | 1,018.40 | | | $ | 6.59 | | | | 1.31 | % | |
Oakmark Equity and Income Fund | |
Investor Class | | $ | 1,000.00 | | | $ | 1,025.30 | | | $ | 3.94 | | | $ | 1,021.04 | | | $ | 3.93 | | | | 0.78 | % | |
Advisor Class | | $ | 1,000.00 | | | $ | 1,026.00 | | | $ | 3.28 | | | $ | 1,021.69 | | | $ | 3.28 | | | | 0.65 | % | |
Institutional Class | | $ | 1,000.00 | | | $ | 1,026.50 | | | $ | 2.98 | | | $ | 1,021.99 | | | $ | 2.97 | | | | 0.59 | % | |
Service Class | | $ | 1,000.00 | | | $ | 1,023.90 | | | $ | 5.35 | | | $ | 1,019.65 | | | $ | 5.34 | | | | 1.06 | % | |
Oakmark Global Fund | |
Investor Class | | $ | 1,000.00 | | | $ | 1,012.40 | | | $ | 5.72 | | | $ | 1,019.25 | | | $ | 5.74 | | | | 1.14 | % | |
Advisor Class | | $ | 1,000.00 | | | $ | 1,012.80 | | | $ | 5.27 | | | $ | 1,019.70 | | | $ | 5.29 | | | | 1.05 | % | |
Institutional Class | | $ | 1,000.00 | | | $ | 1,013.30 | | | $ | 4.87 | | | $ | 1,020.09 | | | $ | 4.89 | | | | 0.97 | % | |
Service Class | | $ | 1,000.00 | | | $ | 1,011.20 | | | $ | 7.12 | | | $ | 1,017.85 | | | $ | 7.14 | | | | 1.42 | % | |
Oakmark Global Select Fund | |
Investor Class | | $ | 1,000.00 | | | $ | 995.70 | | | $ | 5.57 | | | $ | 1,019.35 | | | $ | 5.64 | | | | 1.12 | % | |
Advisor Class | | $ | 1,000.00 | | | $ | 995.70 | | | $ | 5.27 | | | $ | 1,019.65 | | | $ | 5.34 | | | | 1.06 | % | |
Institutional Class | | $ | 1,000.00 | | | $ | 996.60 | | | $ | 4.78 | | | $ | 1,020.14 | | | $ | 4.84 | | | | 0.96 | % | |
Oakmark International Fund | |
Investor Class | | $ | 1,000.00 | | | $ | 995.50 | | | $ | 4.73 | | | $ | 1,020.19 | | | $ | 4.78 | | | | 0.95 | % | |
Advisor Class | | $ | 1,000.00 | | | $ | 995.50 | | | $ | 4.23 | | | $ | 1,020.69 | | | $ | 4.28 | | | | 0.85 | % | |
Institutional Class | | $ | 1,000.00 | | | $ | 996.10 | | | $ | 3.93 | | | $ | 1,020.99 | | | $ | 3.98 | | | | 0.79 | % | |
Service Class | | $ | 1,000.00 | | | $ | 993.50 | | | $ | 6.21 | | | $ | 1,018.70 | | | $ | 6.29 | | | | 1.25 | % | |
Oakmark International Small Cap Fund | |
Investor Class | | $ | 1,000.00 | | | $ | 981.50 | | | $ | 6.62 | | | $ | 1,018.25 | | | $ | 6.74 | | | | 1.34 | % | |
Advisor Class | | $ | 1,000.00 | | | $ | 982.00 | | | $ | 6.37 | | | $ | 1,018.50 | | | $ | 6.49 | | | | 1.29 | % | |
Institutional Class | | $ | 1,000.00 | | | $ | 982.40 | | | $ | 5.73 | | | $ | 1,019.15 | | | $ | 5.84 | | | | 1.16 | % | |
Service Class | | $ | 1,000.00 | | | $ | 979.80 | | | $ | 8.14 | | | $ | 1,016.70 | | | $ | 8.30 | | | | 1.65 | % | |
* Expenses are calculated using the Annualized Expense Ratio, multiplied by the average account value over the period, multiplied by 182 and divided by 365 (to reflect one-half year period)
Oakmark.com 1
Oakmark and Oakmark Select Funds March 31, 2018
Portfolio Manager Commentary

William C. Nygren, CFA
Portfolio Manager
oakmx@oakmark.com
oaklx@oakmark.com
oakwx@oakmark.com
At Oakmark, we are long-term investors. We attempt to identify growing businesses that are managed to benefit their shareholders. We will purchase stock in those businesses only when priced substantially below our estimate of intrinsic value. After purchase, we patiently wait for the gap between stock price and intrinsic value to close.
"What makes a decision great is not that it has a great outcome. A great decision is the result of a good process, and that process must include an attempt to accurately represent our own state of knowledge. That state of knowledge, in turn, is some variation of 'I'm not sure.'"
-Annie Duke, Thinking in Bets1
Toward the end of most close games, you get a glimpse of decision making under great uncertainty. A college basketball game is made up of about 140 possessions, but when the game comes down to the wire, most of the analysis is about the possessions in the last few seconds. In the second-round NCAA Tournament game last month between Tennessee and Loyola-Chicago, Tennessee, trailing 61-59, got the ball with 28 seconds left. The shot clock was off, so the announcers said that Tennessee would no doubt hold the ball to end the game on a last-second shot, hoping for overtime. But Tennessee, apparently aware that data supports taking the first available good shot, got a basket and foul to take the lead 62-61 with 21 seconds remaining. The announcers dutifully questioned the coach's "risky decision to trust his defense." The coach soon appeared vindicated when the best shot Loyola could get was an off-balance jumper that clanked off the front rim with five seconds remaining. But then the unlikely happened: the ball bounced straight up in the air and fell down through the hoop for the Loyola win. Did the Tennessee coach make the wrong decision? Even the Loyola player who took the last shot realized how lucky he'd been. He said he knew the shot was short, but "the basketball gods helped that one go in." Thank you, Sister Jean!
Professional poker player turned author Annie Duke writes about many similar situations in her book, Thinking in Bets. Throughout the book, Duke uses the probabilistic thinking she mastered to become a champion poker player and applies it to everyday decision making. Duke says, "When we think probabilistically, we are less likely to use adverse results alone as proof that we made a decision error, because we recognize the possibility that the decision might have been good but luck and/or incomplete information (and a sample size of one) intervened." Just like it isn't wrong to double 11 against a 6 in blackjack even if the dealer makes an unlikely draw to 21, an unlikely bounce in a basketball game doesn't make it wrong to put the game in the hands of the defense.
Learning to say "I'm not sure" isn't easy, but it is imperative for successful decision making, especially in investing. Duke says, "Embracing 'I'm not sure' is difficult. We are trained in school that saying 'I don't know' is a bad thing." This creates a tendency to overstate our confidence and speak with certainty. Instead of saying that doubling 11 against a 6 will win two-thirds of the time, we say it's the "right" play, and then one-third of the time it appears to be the wrong advice. You see the same thing when sports commentators speak with certainty
about who will win an upcoming game, when meteorologists say if it will rain tomorrow and, yes, when portfolio managers predict the direction of the stock market.
But there is a big difference between answering "What is 9 X 8?" with "I'm not sure," compared to saying that, "I'm not sure if Citigroup stock will go up." The first is a fact; any answer other than 72 is simply wrong. The statement about whether or not a stock will go up is a statement about probabilities given estimates of business value and similarities to stocks that have gone up in the past. It is ironic that investment professionals, who are part of an industry where the best practitioners are wrong about 40% of the time, are among the guiltiest of overstating confidence about their opinions.
Duke says that her colleagues have a unique way of dealing with each other when one of them overstates a level of conviction. "As is often the case with poker players, a conversation about a hypothetical turned into an opportunity to propose a wager...A lot of good can come from someone saying, 'Wanna bet?'" In that respect, poker players are no different than the investment professionals at Oakmark.
Oakmark analysts are constantly making their best forecasts about an uncertain future. But they occasionally speak of those forecasts as if they are more certain than they actually are. When one of our analysts says that a company being researched is going to earn $5 per share next year, it is as likely as not that another analyst will respond with a comment like, "I'll take the under on $4.50." These bets are so common that the stakes don't even need to be spelled out. All of our analysts know that if they lose a bet, they'll be buying someone's lunch the next day. The realization that anything they say could result in having to back up their statement with a wager promotes an environment of probabilistic thinking that leads to better decision making. It doesn't take long for our new analysts to get comfortable with saying, "I'm not sure."
Another way in which poker and investing are similar is exposure to a constant flow of new information that allows participants to refine their beliefs. The most successful practitioners quickly adapt to new information. In Texas Hold 'Em, no starting hand is better than a pair of aces, but as more cards get dealt, even those aces may no longer produce a winning hand. As additional cards come out, seasoned players are constantly adjusting their win probabilities, where amateurs often stay attached to the strength of their starting hands. Duke writes, "There is no sin to finding out there is evidence that contradicts what we believe. The only sin is not using that evidence as objectively as possible to refine that belief going forward." She also cites studies that suggest one's ability to adjust to new information doesn't correlate with intelligence. Instead "It turns out the better you are with numbers, the better
See accompanying Disclosures and Endnotes on page 83.
2 OAKMARK FUNDS
Oakmark and Oakmark Select Funds March 31, 2018
Portfolio Manager Commentary (continued)
you are at spinning those numbers to conform to and support your beliefs."
That's a problem for investors who tend to be above average with numerical skills. It is so easy to tell yourself that an earnings shortfall is just temporary or that a competitor's strong new product launch will fade. And the smarter you are, the more convincing your story is. Anchoring to one's original thesis is a common bias for everyone and a very costly one for investors. This is something that our process at Oakmark focuses on. We know we have an anchoring bias, so we create hurdles that make it harder for analysts to maintain their original beliefs in the face of news that is contradictory. It doesn't eliminate the bias, but it diminishes the negative consequences.
Duke says that "Truthseeking, the desire to know the truth regardless of whether the truth aligns with the beliefs we currently hold, is not naturally supported by the way we process information...Instead of altering our beliefs to fit new information, we do the opposite, altering our interpretation of that information to fit our beliefs." That comment, which she learned through poker, could just as easily be applied to many situations, including investing. While it is usually considered an asset to stick to one's beliefs, it becomes a liability when new information suggests those initial beliefs were wrong.
At Oakmark, we are far from perfect at processing information and thinking probabilistically. However, we are aware of our tendencies to crave certainty or ignore information that we disagree with. So we make it a goal of our corporate culture and our investment process to reduce those biases in our decision making. Success at investing draws on many disciplines—it is fun to realize that we have as much to learn from a great poker player as we do from a great investor!
See accompanying Disclosures and Endnotes on page 83.
Oakmark.com 3
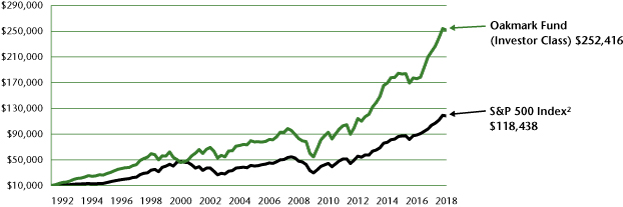
Oakmark Fund March 31, 2018
Summary Information
VALUE OF A $10,000 INVESTMENT
Since Inception - 08/05/91 (Unaudited)
PERFORMANCE
| | | | Average Annual Total Returns (as of 3/31/18) | | | |
| (Unaudited) | | Total Return
Last 3 Months | | 1-year | | 3-year | | 5-year | | 10-year | | Since
Inception | | Inception
Date | |
Oakmark Fund (Investor Class) | | | -0.88 | % | | | 15.34 | % | | | 11.14 | % | | | 13.78 | % | | | 11.76 | % | | | 12.88 | % | | 08/05/91 | |
S&P 500 Index | | | -0.76 | % | | | 13.99 | % | | | 10.78 | % | | | 13.31 | % | | | 9.49 | % | | | 9.72 | % | | | |
Dow Jones Industrial Average3 | | | -1.96 | % | | | 19.39 | % | | | 13.48 | % | | | 13.32 | % | | | 9.86 | % | | | 10.75 | % | | | |
Lipper Large-Cap Value Fund Index4 | | | -2.34 | % | | | 9.43 | % | | | 8.34 | % | | | 11.06 | % | | | 7.68 | % | | | 8.88 | % | | | |
Oakmark Fund (Advisor Class) | | | -0.87 | % | | | 15.46 | % | | | N/A | | | | N/A | | | | N/A | | | | 16.26 | % | | 11/30/16 | |
Oakmark Fund (Institutional Class) | | | -0.85 | % | | | 15.50 | % | | | N/A | | | | N/A | | | | N/A | | | | 16.28 | % | | 11/30/16 | |
Oakmark Fund (Service Class) | | | -0.96 | % | | | 15.01 | % | | | 10.80 | % | | | 13.43 | % | | | 11.44 | % | | | 8.49 | % | | 04/05/01 | |
The graph and table above do not reflect the deduction of taxes that a shareholder would pay on Fund distributions or the redemption of Fund shares.
Past performance is no guarantee of future results. The performance data quoted represents past performance. Current performance may be lower or higher than the performance data quoted. Total return includes change in share prices and, in each case, includes reinvestment of dividends and capital gain distributions. The investment return and principal value vary so that an investor's shares when redeemed may be worth more or less than the original cost. To obtain the most recent month-end performance, please visit Oakmark.com.
TOP TEN EQUITY HOLDINGS5 | | % of Net Assets | |
Citigroup, Inc. | | | 3.2 | | |
Alphabet Inc., Class C | | | 3.0 | | |
Bank of America Corp. | | | 2.8 | | |
MasterCard, Inc., Class A | | | 2.6 | | |
Intel Corp. | | | 2.6 | | |
TE Connectivity, Ltd. | | | 2.5 | | |
Capital One Financial Corp. | | | 2.5 | | |
Apple, Inc. | | | 2.5 | | |
Fiat Chrysler Automobiles N.V. | | | 2.5 | | |
Ally Financial, Inc. | | | 2.4 | | |
FUND STATISTICS | |
Ticker* | | OAKMX | |
Number of Equity Holdings | | 55 | |
Net Assets | | $19.4 billion | |
Weighted Average Market Cap | | $142.9 billion | |
Median Market Cap | | $50.9 billion | |
Gross Expense Ratio - Investor Class (as of 09/30/17)* | | 0.90% | |
Net Expense Ratio - Investor Class (as of 09/30/17)*† | | 0.86% | |
* This information is related to the Investor Class. Please visit Oakmark.com for information related to the Advisor, Institutional and Service Classes.
† The net expense ratio reflects a contractual advisory fee waiver agreement through January 28, 2019.
SECTOR ALLOCATION | | % of Net Assets | |
Financials | | | 24.8 | | |
Information Technology | | | 23.6 | | |
Consumer Discretionary | | | 17.1 | | |
Industrials | | | 9.2 | | |
Health Care | | | 8.3 | | |
Consumer Staples | | | 8.1 | | |
Energy | | | 4.8 | | |
Short-Term Investments and Other | | | 4.1 | | |
See accompanying Disclosures and Endnotes on page 83.
4 OAKMARK FUNDS
Oakmark Fund March 31, 2018
Portfolio Manager Commentary


William C. Nygren, CFA
Portfolio Manager
oakmx@oakmark.com
Kevin Grant, CFA
Portfolio Manager
oakmx@oakmark.com
With a strong start to the quarter, the Fund hit an all-time high adjusted NAV in January, the seventh quarter in a row of new Fund highs. The subsequent decline in the market and the Fund, however, resulted in a small decline (0.9% decline vs. a decline of 0.8% for the S&P 500)2. Volatility returned to the market, as concerns about inflation, higher interest rates and a global trade war caused the S&P 500's returns to range from +8% to –4% during the quarter. While we remain focused on long-term business fundamentals as we evaluate potential investments, we don't mind taking advantage of higher volatility to increase exposure to high-quality businesses at more attractive prices. During the quarter, we added three new names to the portfolio (see below), and we increased weightings in other companies, including CVS Health and American Airlines.
Our best contributing sectors during the first quarter were consumer discretionary and information technology. Collectively, they accounted for 42% of our equity investments at the end of the quarter. Although financials, our highest weighted sector, enjoyed a strong 2017, that sector's performance turned negative during the quarter. Netflix and Mastercard were our best individual contributors for the quarter, up 54% and 16%, respectively. Our lowest contributing sectors for the quarter were industrials and financials, and our worst contributing securities were General Electric and Comcast. We added new positions in Facebook, Flex and Regeneron, and we eliminated positions in AutoNation, JPMorgan Chase and Whirlpool. JPMorgan Chase reached our estimate of intrinsic value, and we sold AutoNation and Whirlpool after we reassessed their return potential.
Facebook, Inc. (FB-$160)
Facebook controls the world's most dominant social networking platforms, Facebook and Instagram. The company's unprecedented global reach and infamous ad-targeting capabilities have made Facebook one of the most sought after and effective advertising platforms ever created. More recently, a considerable amount of negative press has surrounded the company, as has happened occasionally in the past. Facebook's business has repeatedly withstood these historical setbacks, due in part to its superior products, powerful network effect and track record of out-innovating, replicating or acquiring its would-be competitors. Without ascribing value to the company's non-earning assets, which include messaging platforms WhatsApp and Messenger (among others), Facebook is trading at less than 15x next year's earnings (excluding net cash), a discount to the S&P 500 Index. This is a very attractive valuation for a company that is projected to grow its revenue well in excess of 20% for the foreseeable future. We believe that Facebook's normalized operating margin is substantially higher than what it reports, as the company continues to invest heavily in a variety of growth initiatives.
Flex Ltd. (FLEX-$16)
Flex is undergoing a business transformation that should result in structurally higher returns on invested capital. A decade ago, the company, then known as Flextronics, looked like a classic contract manufacturer. Like its peers, it had a concentrated customer base, composed almost entirely of electronics companies, and it would manufacture products to meet customer specifications. Contract manufacturers have few meaningful competitive advantages in the low-margin manufacturing business, as their main value-add is locating production in low-cost regions. However, since Mike McNamara took over as CEO in 2006, Flex has been investing in what it calls "sketch-to-scale" capabilities, in which Flex's engineers are actually involved in the design phase of customers' products. This is a better business than contract manufacturing due to higher barriers to entry, stickier customer relationships and higher profit margins. Sketch-to-scale arrangements account for about 23% of revenues today and should almost double to 40% by 2020. In our view, this business shift and the accompanying boosts to both margin and ROIC are not priced into the stock, which trades for less than 14x next year's consensus EPS6 after adding back intangible amortization.
Regeneron Pharmaceuticals (REGN-$345)
Regeneron is a biotech company with industry-leading research and development (R&D) productivity and a proven management team. The company is led by its founder Len Schleifer who maintains a culture focused on internal development of novel new drugs. Schleifer also holds a significant equity stake in the company. Over the past decade, Regeneron has received approval for six drugs, all of which were developed in-house. Regeneron prices its drugs responsibly, and the company has never initiated a price increase. Recent drug approvals provide a strong path for long-term growth, and we expect that its largest drug, Eylea, will be sustainable for at least several more years. Regeneron spends significantly more than its peers on R&D, and its selling, general and administrative (SG&A) spending is elevated, as a result of several recent drug launches. We believe Regeneron's R&D spending provides a great return on investment, and we expect launch costs to normalize over time. Although the company's consensus P/E7 multiple appears high, if its R&D and SG&A costs are adjusted to average levels, Regeneron would trade at a low-teens P/E. We believe this is a compelling valuation for a growing business with a strong management team that is aligned with shareholders.
See accompanying Disclosures and Endnotes on page 83.
Oakmark.com 5
Oakmark Fund March 31, 2018 (Unaudited)
Schedule of Investments (in thousands)
| | | Shares | | Value | |
COMMON STOCKS - 95.9% | |
FINANCIALS - 24.8% | |
DIVERSIFIED FINANCIALS - 11.9% | |
Capital One Financial Corp. | | | 5,063 | | | $ | 485,118 | | |
Ally Financial, Inc. | | | 17,435 | | | | 473,360 | | |
State Street Corp. | | | 4,700 | | | | 468,731 | | |
The Bank of New York Mellon Corp. | | | 6,320 | | | | 325,651 | | |
The Goldman Sachs Group, Inc. | | | 1,105 | | | | 278,305 | | |
Moody's Corp. | | | 1,706 | | | | 275,254 | | |
| | | | | | 2,306,419 | | |
BANKS - 7.9% | |
Citigroup, Inc. | | | 9,130 | | | | 616,275 | | |
Bank of America Corp. | | | 18,300 | | | | 548,817 | | |
Wells Fargo & Co. | | | 7,110 | | | | 372,635 | | |
| | | | | | 1,537,727 | | |
INSURANCE - 5.0% | |
American International Group, Inc. | | | 8,180 | | | | 445,155 | | |
Aon PLC | | | 2,590 | | | | 363,455 | | |
Aflac, Inc. | | | 3,558 | | | | 155,698 | | |
| | | | | | 964,308 | | |
| | | | | | 4,808,454 | | |
INFORMATION TECHNOLOGY - 23.6% | |
SOFTWARE & SERVICES - 13.4% | |
Alphabet, Inc., Class C (a) | | | 558 | | | | 576,003 | | |
MasterCard, Inc., Class A | | | 2,920 | | | | 511,467 | | |
Visa, Inc., Class A | | | 3,735 | | | | 446,781 | | |
Oracle Corp. | | | 8,765 | | | | 400,999 | | |
Automatic Data Processing, Inc. | | | 3,320 | | | | 376,754 | | |
Facebook, Inc., Class A (a) | | | 1,200 | | | | 191,748 | | |
Alphabet, Inc., Class A (a) | | | 93 | | | | 96,550 | | |
| | | | | | 2,600,302 | | |
TECHNOLOGY HARDWARE & EQUIPMENT - 6.1% | |
TE Connectivity, Ltd. | | | 4,936 | | | | 493,071 | | |
Apple, Inc. | | | 2,887 | | | | 484,381 | | |
Flex, Ltd. (a) | | | 12,000 | | | | 195,960 | | |
| | | | | | 1,173,412 | | |
SEMICONDUCTORS & SEMICONDUCTOR EQUIPMENT - 4.1% | |
Intel Corp. | | | 9,655 | | | | 502,832 | | |
Texas Instruments, Inc. | | | 2,720 | | | | 282,581 | | |
| | | | | | 785,413 | | |
| | | | | | 4,559,127 | | |
CONSUMER DISCRETIONARY - 17.1% | |
MEDIA - 5.4% | |
Comcast Corp., Class A | | | 12,438 | | | | 425,020 | | |
Charter Communications, Inc., Class A (a) | | | 1,200 | | | | 373,464 | | |
News Corp., Class A | | | 15,401 | | | | 243,332 | | |
| | | | | | 1,041,816 | | |
| | | Shares | | Value | |
RETAILING - 5.1% | |
Netflix, Inc. (a) | | | 1,550 | | | $ | 457,792 | | |
Liberty Interactive Corp. QVC Group,
Class A (a) | | | 12,115 | | | | 304,945 | | |
Booking Holdings, Inc. (a) | | | 110 | | | | 228,843 | | |
| | | | | | 991,580 | | |
AUTOMOBILES & COMPONENTS - 4.9% | |
Fiat Chrysler Automobiles N.V. | | | 23,160 | | | | 475,245 | | |
General Motors Co. | | | 6,850 | | | | 248,929 | | |
Aptiv PLC | | | 2,200 | | | | 186,934 | | |
Delphi Technologies PLC | | | 733 | | | | 34,943 | | |
Harley-Davidson, Inc. | | | 17 | | | | 728 | | |
| | | | | | 946,779 | | |
CONSUMER SERVICES - 1.7% | |
MGM Resorts International | | | 9,400 | | | | 329,188 | | |
| | | | | | 3,309,363 | | |
INDUSTRIALS - 9.2% | |
CAPITAL GOODS - 5.5% | |
Parker-Hannifin Corp. | | | 2,439 | | | | 417,187 | | |
General Electric Co. | | | 25,050 | | | | 337,674 | | |
Caterpillar, Inc. | | | 1,150 | | | | 169,487 | | |
Cummins, Inc. | | | 870 | | | | 141,018 | | |
| | | | | | 1,065,366 | | |
TRANSPORTATION - 3.7% | |
American Airlines Group, Inc. | | | 7,700 | | | | 400,092 | | |
FedEx Corp. | | | 1,330 | | | | 319,346 | | |
| | | | | | 719,438 | | |
| | | | | | 1,784,804 | | |
HEALTH CARE - 8.3% | |
HEALTH CARE EQUIPMENT & SERVICES - 7.0% | |
HCA Healthcare, Inc. | | | 4,316 | | | | 418,603 | | |
Baxter International, Inc. | | | 5,300 | | | | 344,712 | | |
UnitedHealth Group, Inc. | | | 1,545 | | | | 330,630 | | |
Medtronic PLC | | | 3,190 | | | | 255,902 | | |
| | | | | | 1,349,847 | | |
PHARMACEUTICALS, BIOTECHNOLOGY & LIFE SCIENCES - 1.3% | |
Regeneron Pharmaceuticals, Inc. (a) | | | 744 | | | | 256,135 | | |
| | | | | | 1,605,982 | | |
CONSUMER STAPLES - 8.1% | |
FOOD, BEVERAGE & TOBACCO - 4.0% | |
Diageo PLC (b) | | | 3,100 | | | | 419,802 | | |
Nestlé SA (b) | | | 4,565 | | | | 360,863 | | |
| | | | | | 780,665 | | |
HOUSEHOLD & PERSONAL PRODUCTS - 2.1% | |
Unilever PLC (b) | | | 7,163 | | | | 397,977 | | |
FOOD & STAPLES RETAILING - 2.0% | |
CVS Health Corp. | | | 6,300 | | | | 391,923 | | |
| | | | | | 1,570,565 | | |
See accompanying Notes to Financial Statements.
6 OAKMARK FUNDS
Oakmark Fund March 31, 2018 (Unaudited)
Schedule of Investments (in thousands) (continued)
| | | Shares | | Value | |
COMMON STOCKS - 95.9% (continued) | |
ENERGY - 4.8% | |
Anadarko Petroleum Corp. | | | 5,600 | | | $ | 338,296 | | |
Apache Corp. | | | 8,540 | | | | 328,614 | | |
National Oilwell Varco, Inc. | | | 5,929 | | | | 218,243 | | |
Chesapeake Energy Corp. (a) | | | 15,000 | | | | 45,300 | | |
| | | | | | 930,453 | | |
TOTAL COMMON STOCKS - 95.9%
(COST $11,371,664) | | | | | 18,568,748 | | |
| | | Par Value | | Value | |
SHORT-TERM INVESTMENTS - 4.4% | |
U.S. GOVERNMENT BILL - 3.1% | |
United States Treasury Bill,
1.52% - 1.62%, due
04/12/18 - 05/10/18 (c)
(Cost $599,281) | | $ | 600,000 | | | | 599,281 | | |
GOVERNMENT AND AGENCY SECURITIES - 1.0% | |
Federal National Mortgage Association,
1.47%, due 04/02/18 - 04/03/18 (c)
(Cost: $199,992) | | | 200,000 | | | | 199,992 | | |
REPURCHASE AGREEMENT - 0.3% | |
Fixed Income Clearing Corp. Repurchase
Agreement, 0.90% dated 03/29/18
due 04/02/18, repurchase price
$57,438, collateralized by a
United States Treasury Note,
2.000% due 11/15/21, value
plus accrued interest of $58,582
(Cost: $57,432) | | | 57,432 | | | | 57,432 | | |
TOTAL SHORT-TERM INVESTMENTS - 4.4%
(COST $856,705) | | | | | 856,705 | | |
TOTAL INVESTMENTS - 100.3%
(COST $12,228,369) | | | | | 19,425,453 | | |
Foreign Currencies (Cost $0) - 0.0% (d) | | | | | 0 | (e) | |
Liabilities In Excess of Other Assets - (0.3)% | | | | | (64,147 | ) | |
TOTAL NET ASSETS - 100.0% | | | | $ | 19,361,306 | | |
| | | Shares | | Value | |
CALL OPTIONS WRITTEN - 0.0% (d) | |
RETAILING - 0.0% (d) | |
Netflix, Inc., Strike Price $350.00,
Expires 9/21/2018 | | | (100 | ) | | | (1,720 | ) | |
TOTAL CALL OPTIONS WRITTEN
(PREMIUMS RECEIVED $(3,254)) - 0.0% | | | | | (1,720 | ) | |
(a) Non-income producing security
(b) Sponsored American Depositary Receipt
(c) The rate shown represents the annualized yield at the time of purchase; not a coupon rate.
(d) Amount rounds to less than 0.1%.
(e) Amount rounds to less than $1,000.
See accompanying Notes to Financial Statements.
Oakmark.com 7
Oakmark Select Fund March 31, 2018
Summary Information
VALUE OF A $10,000 INVESTMENT
Since Inception - 11/01/96 (Unaudited)

PERFORMANCE
| | | | Average Annual Total Returns (as of 03/31/18) | | | |
| (Unaudited) | | Total Return
Last 3 Months | | 1-year | | 3-year | | 5-year | | 10-year | | Since
Inception | | Inception
Date | |
Oakmark Select Fund (Investor Class) | | | -3.89 | % | | | 7.98 | % | | | 7.69 | % | | | 12.62 | % | | | 11.19 | % | | | 12.58 | % | | 11/01/96 | |
S&P 500 Index | | | -0.76 | % | | | 13.99 | % | | | 10.78 | % | | | 13.31 | % | | | 9.49 | % | | | 8.39 | % | | | |
Lipper Multi-Cap Value Fund Index8 | | | -2.87 | % | | | 7.30 | % | | | 6.71 | % | | | 10.16 | % | | | 7.49 | % | | | 7.65 | % | | | |
Oakmark Select Fund (Advisor Class) | | | -3.85 | % | | | 8.12 | % | | | N/A | | | | N/A | | | | N/A | | | | 10.62 | % | | 11/30/16 | |
Oakmark Select Fund (Institutional Class) | | | -3.85 | % | | | 8.16 | % | | | N/A | | | | N/A | | | | N/A | | | | 10.65 | % | | 11/30/16 | |
Oakmark Select Fund (Service Class) | | | -3.98 | % | | | 7.68 | % | | | 7.35 | % | | | 12.27 | % | | | 10.89 | % | | | 9.33 | % | | 12/31/99 | |
The graph and table do not reflect the deduction of taxes that a shareholder would pay on Fund distributions or the redemption of Fund shares.
Past performance is no guarantee of future results. The performance data quoted represents past performance. Current performance may be lower or higher than the performance data quoted. Total return includes change in share prices and, in each case, includes reinvestment of dividends and capital gain distributions. The investment return and principal value vary so that an investor's shares when redeemed may be worth more or less than the original cost. To obtain the most recent month-end performance, please visit Oakmark.com.
TOP TEN EQUITY HOLDINGS5 | | % of Net Assets | |
CBRE Group, Inc., Class A | | | 8.1 | | |
Alphabet, Inc., Class C | | | 7.5 | | |
TE Connectivity, Ltd. | | | 7.2 | | |
Fiat Chrysler Automobiles N.V. | | | 6.6 | | |
Citigroup, Inc. | | | 5.6 | | |
Ally Financial, Inc. | | | 5.1 | | |
American International Group, Inc. | | | 5.1 | | |
MasterCard, Inc., Class A | | | 5.0 | | |
MGM Resorts International | | | 4.6 | | |
Charter Communications, Inc., Class A | | | 4.2 | | |
FUND STATISTICS | |
Ticker* | | OAKLX | |
Number of Equity Holdings | | 22 | |
Net Assets | | $6.1 billion | |
Weighted Average Market Cap | | $129.5 billion | |
Median Market Cap | | $37.5 billion | |
Gross Expense Ratio - Investor Class (as of 09/30/17)* | | 1.03% | |
Net Expense Ratio - Investor Class (as of 09/30/17)*† | | 0.96% | |
* This information is related to the Investor Class. Please visit Oakmark.com for information related to the Advisor, Institutional and Service Classes.
† The net expense ratio reflects a contractual advisory fee waiver agreement through January 28, 2019.
SECTOR ALLOCATION | | % of Net Assets | |
Information Technology | | | 24.8 | | |
Financials | | | 23.3 | | |
Consumer Discretionary | | | 23.2 | | |
Energy | | | 8.2 | | |
Real Estate | | | 8.1 | | |
Industrials | | | 6.3 | | |
Short-Term Investments and Other | | | 6.1 | | |
See accompanying Disclosures and Endnotes on page 83.
8 OAKMARK FUNDS
Oakmark Select Fund March 31, 2018
Portfolio Manager Commentary


William C. Nygren, CFA
Portfolio Manager
oaklx@oakmark.com
Anthony P. Coniaris, CFA
Portfolio Manager
oaklx@oakmark.com
Win Murray
Portfolio Manager
oaklx@oakmark.com
For the quarter, the Oakmark Select Fund declined 3.9%, compared to a 0.8% decline in the S&P 500 Index2. We are not satisfied with either the absolute or relative return. Long-time fund holders (ourselves included) understand that a relatively concentrated portfolio like Oakmark Select is capable of volatile quarterly results as we focus on maximizing returns over a multi-year, not multi-month, timeframe. We remain steadfast in that mission, weak quarter notwithstanding.
Roughly three-quarters of this quarter's underperformance was driven by our energy sector holdings, which declined between 8% and 45%, despite relatively strong oil supply and demand fundamentals as reflected by a 7% increase in West Texas Intermediate (WTI) oil prices during the first quarter. The largest individual performance detractors were Weatherford (–45%), Adient (–22%) and General Electric (–21%). Investors are more concerned with Weatherford's balance sheet than we (or its new and capable management team) are, which is in part due to a delay in asset sales. With Adient, we believe the market significantly overreacted to disappointing results in a less valuable, non-core segment of its business, so we added to our holdings during the quarter. General Electric announced a large legacy insurance reserve charge as part of new CEO John Flannery's continued efforts to clean up more than a decade of mismanagement at the company. The largest contributors to performance were Fiat Chrysler (+15%), Mastercard (+16%) and CBRE Group (+9%).
We completed the sale of FNF Group during the quarter due to price. FNF Group has been a very profitable investment for the Fund thanks in part to a terrific management team, led by longtime chairman Bill Foley, that is constantly looking to maximize and highlight per share value through smart capital allocation and corporate actions. We sold almost all of our position in Harley-Davidson during the quarter. Our Harley-Davidson thesis required continued strong growth internationally and improved U.S. sales as the number of used bikes, which date back to peak year deliveries more than 10 years ago, become less attractive substitutes for new bike sales. The company's international and U.S. sales have lagged behind our expectations, and after reassessing Harley-Davidson's per share value, we found a better alternative for the portfolio, American Airlines.
American Airlines was discussed last quarter in the Oakmark Fund letter. The reasons to own are the same, so we've left the write up unchanged (see below). The market volatility this quarter provided a particularly attractive buying opportunity for the Oakmark Select Fund.
American Airlines Group, Inc. (AAL)
Although the airlines have always provided a useful consumer service, we feel they have historically been unattractive long-term investment candidates. In the past, the major U.S. airlines lacked pricing power and faced problems related to poor corporate cultures. However, after years of consolidation capped by the merger of US Airways and American Airlines in 2013, the industry has become more mature and disciplined. The three major hub-and-spoke carriers each have strengths in their respective hubs, and their management teams are making wiser decisions about capacity additions and capital allocation. American Airlines' CEO Doug Parker sees substantial opportunity to grow value as the company completes the US Airways merger integration. He is improving the company's culture and restoring credibility with employees. Parker believes that American Airlines has around $5 billion of pretax earnings power, which is up 50% from our 2017 estimate, and he has bought back 37% of the company's shares since the merger closed. With the stock selling for a single-digit multiple of normal earnings power, we believe American Airlines is an attractive investment.
Thank you, our fellow shareholders, for your continued investment in the Oakmark Select Fund.
See accompanying Disclosures and Endnotes on page 83.
Oakmark.com 9
Oakmark Select Fund March 31, 2018 (Unaudited)
Schedule of Investments (in thousands)
| | | Shares | | Value | |
COMMON STOCKS - 93.9% | |
INFORMATION TECHNOLOGY - 24.8% | |
SOFTWARE & SERVICES - 17.6% | |
Alphabet, Inc., Class C (a) | | | 444 | | | $ | 457,754 | | |
MasterCard, Inc., Class A | | | 1,759 | | | | 308,106 | | |
Oracle Corp. | | | 5,167 | | | | 236,390 | | |
Alphabet, Inc., Class A (a) | | | 73 | | | | 75,787 | | |
| | | | | | 1,078,037 | | |
TECHNOLOGY HARDWARE & EQUIPMENT - 7.2% | |
TE Connectivity, Ltd. | | | 4,443 | | | | 443,850 | | |
| | | | | | 1,521,887 | | |
FINANCIALS - 23.3% | |
BANKS - 9.5% | |
Citigroup, Inc. | | | 5,112 | | | | 345,060 | | |
Bank of America Corp. | | | 8,001 | | | | 239,938 | | |
| | | | | | 584,998 | | |
DIVERSIFIED FINANCIALS - 8.7% | |
Ally Financial, Inc. | | | 11,500 | | | | 312,225 | | |
Capital One Financial Corp. | | | 2,285 | | | | 218,939 | | |
| | | | | | 531,164 | | |
INSURANCE - 5.1% | |
American International Group, Inc. | | | 5,695 | | | | 309,933 | | |
| | | | | | 1,426,095 | | |
CONSUMER DISCRETIONARY - 23.2% | |
AUTOMOBILES & COMPONENTS - 10.7% | |
Fiat Chrysler Automobiles N.V. | | | 19,634 | | | | 402,892 | | |
Adient PLC | | | 4,200 | | | | 250,992 | | |
Harley-Davidson, Inc. | | | 22 | | | | 925 | | |
| | | | | | 654,809 | | |
CONSUMER SERVICES - 4.6% | |
MGM Resorts International | | | 8,000 | | | | 280,160 | | |
MEDIA - 4.1% | |
Charter Communications, Inc., Class A (a) | | | 820 | | | | 255,200 | | |
RETAILING - 3.8% | |
Liberty Interactive Corp. QVC Group,
Class A (a) | | | 9,293 | | | | 233,902 | | |
| | | | | | 1,424,071 | | |
ENERGY - 8.2% | |
Apache Corp. | | | 6,071 | | | | 233,612 | | |
Chesapeake Energy Corp. (a) | | | 44,860 | | | | 135,478 | | |
Weatherford International PLC (a) (b) | | | 57,380 | | | | 131,401 | | |
| | | | | | 500,491 | | |
| | | Shares | | Value | |
REAL ESTATE - 8.1% | |
CBRE Group, Inc., Class A (a) | | | 10,448 | | | $ | 493,331 | | |
INDUSTRIALS - 6.3% | |
TRANSPORTATION - 4.1% | |
American Airlines Group, Inc. | | | 4,800 | | | | 249,408 | | |
CAPITAL GOODS - 2.2% | |
General Electric Co. | | | 10,268 | | | | 138,412 | | |
| | | | | | 387,820 | | |
TOTAL COMMON STOCKS - 93.9%
(COST $3,820,723) | | | | | 5,753,695 | | |
| | | Par Value | | Value | |
SHORT-TERM INVESTMENTS - 10.1% | |
GOVERNMENT AND AGENCY SECURITIES - 9.0% | |
Federal National Mortgage Association,
1.47%, due 04/02/18 - 04/03/18 (c)
(Cost $549,978) | | $ | 550,000 | | | | 549,978 | | |
REPURCHASE AGREEMENT - 1.1% | |
Fixed Income Clearing Corp. Repurchase
Agreement, 0.90% dated 03/29/18 due
04/02/18, repurchase price $65,097,
collateralized by a United States
Treasury Inflation Index Note, 0.125%
due 07/15/22 value plus accrued
interest of $66,393
(Cost: $65,091) | | | 65,091 | | | | 65,091 | | |
TOTAL SHORT-TERM INVESTMENTS - 10.1%
(COST $615,069) | | | | | 615,069 | | |
TOTAL INVESTMENTS - 104.0%
(COST $4,435,792) | | | | | 6,368,764 | | |
Liabilities In Excess of Other Assets - (4.0)% | | | | | (243,057 | ) | |
TOTAL NET ASSETS - 100.0% | | | | $ | 6,125,707 | | |
(a) Non-income producing security
(b) See Note 5 in the Notes to Financial Statements regarding investments in affiliated issuers.
(c) The rate shown represents the annualized yield at the time of purchase; not a coupon rate.
See accompanying Notes to Financial Statements.
10 OAKMARK FUNDS
Oakmark Select Fund March 31, 2018 (Unaudited)
Schedule of Investments (in thousands) (continued)
SCHEDULE OF TRANSACTIONS WITH AFFILIATED ISSUERS
Purchase and sale transactions and dividend and interest income earned during the period on these securities are set forth below (in thousands). The industry for the below affiliate can be found in the Schedule of Investments.
Affiliates | | Shares
Held | | Purchases
(Cost) | | Sales
(Proceeds) | | Realized
Gain/(Loss) | | Change in
Unrealized | | Dividend
Income | | Value
September 30,
2017 | | Value
March 31,
2018 | | Percent of
Net Assets | |
Weatherford
International PLC | | | 57,380 | | | $ | 79,765 | | | $ | 55,359 | | | $ | (22,596 | ) | | $ | (95,805 | ) | | $ | 0 | | | $ | 229,883 | | | $ | 131,401 | | | | 2.1 | % | |
TOTAL | | | 57,380 | | | $ | 79,765 | | | $ | 55,359 | | | $ | (22,596 | ) | | $ | (95,805 | ) | | $ | 0 | | | $ | 229,883 | | | $ | 131,401 | | | | 2.1 | % | |
See accompanying Notes to Financial Statements.
Oakmark.com 11
Oakmark Equity and Income Fund March 31, 2018
Summary Information
VALUE OF A $10,000 INVESTMENT
Since Inception - 11/01/95 (Unaudited)

PERFORMANCE
| | | | Average Annual Total Returns (as of 03/31/18) | | | |
| (Unaudited) | | Total Return
Last 3 Months | | 1-year | | 3-year | | 5-year | | 10-year | | Since
Inception | | Inception
Date | |
Oakmark Equity and Income Fund (Investor Class) | | | -1.62 | % | | | 8.13 | % | | | 5.72 | % | | | 8.33 | % | | | 6.59 | % | | | 10.18 | % | | 11/01/95 | |
Lipper Balanced Fund Index | | | -0.98 | % | | | 8.48 | % | | | 5.82 | % | | | 7.38 | % | | | 6.21 | % | | | 6.91 | % | | | |
S&P 500 Index | | | -0.76 | % | | | 13.99 | % | | | 10.78 | % | | | 13.31 | % | | | 9.49 | % | | | 9.01 | % | | | |
Barclays U.S. Govt./Credit Index | | | -1.58 | % | | | 1.38 | % | | | 1.22 | % | | | 1.84 | % | | | 3.65 | % | | | 5.11 | % | | | |
Oakmark Equity and Income Fund (Advisor Class) | | | -1.58 | % | | | 8.30 | % | | | N/A | | | | N/A | | | | N/A | | | | 10.74 | % | | 11/30/16 | |
Oakmark Equity and Income Fund (Institutional Class) | | | -1.55 | % | | | 8.35 | % | | | N/A | | | | N/A | | | | N/A | | | | 10.78 | % | | 11/30/16 | |
Oakmark Equity and Income Fund (Service Class) | | | -1.69 | % | | | 7.85 | % | | | 5.41 | % | | | 7.99 | % | | | 6.26 | % | | | 8.54 | % | | 07/12/00 | |
The graph and table above do not reflect the deduction of taxes that a shareholder would pay on Fund distributions or the redemption of Fund shares.
Past performance is no guarantee of future results. The performance data quoted represents past performance. Current performance may be lower or higher than the performance data quoted. Total return includes change in share prices and, in each case, includes reinvestment of dividends and capital gain distributions. The investment return and principal value vary so that an investor's shares when redeemed may be worth more or less than the original cost. To obtain the most recent month-end performance, please visit Oakmark.com.
TOP TEN EQUITY HOLDINGS5 | | % of Net Assets | |
Bank of America Corp. | | | 4.8 | | |
General Motors Co. | | | 4.7 | | |
TE Connectivity, Ltd. | | | 4.1 | | |
Nestlé SA | | | 2.8 | | |
MasterCard, Inc., Class A | | | 2.8 | | |
UnitedHealth Group, Inc. | | | 2.4 | | |
Citigroup, Inc. | | | 2.2 | | |
Dover Corp. | | | 2.2 | | |
Philip Morris International, Inc. | | | 2.0 | | |
Oracle Corp. | | | 2.0 | | |
FUND STATISTICS | |
Ticker* | | OAKBX | |
Number of Equity Holdings | | 46 | |
Net Assets | | $15.8 billion | |
Weighted Average Market Cap | | $114.9 billion | |
Median Market Cap | | $25.5 billion | |
Gross Expense Ratio - Investor Class (as of 09/30/17)* | | 0.88% | |
Net Expense Ratio - Investor Class (as of 09/30/17)*† | | 0.78% | |
* This information is related to the Investor Class. Please visit Oakmark.com for information related to the Advisor, Institutional and Service Classes.
† The net expense ratio reflects a contractual advisory fee waiver agreement through January 28, 2019.
SECTOR ALLOCATION | | % of Net Assets | |
Equity Investments | | | |
Financials | | | 13.2 | | |
Information Technology | | | 12.1 | | |
Consumer Discretionary | | | 11.6 | | |
Consumer Staples | | | 8.8 | | |
Industrials | | | 4.9 | | |
Health Care | | | 4.6 | | |
Energy | | | 3.3 | | |
Real Estate | | | 1.5 | | |
Materials | | | 1.1 | | |
Total Equity Investments | | | 61.1 | | |
Preferred Stocks | | | 0.1 | | |
Fixed Income Investments | |
Corporate Bonds | | | 13.3 | | |
Government and Agency Securities | | | 12.0 | | |
Convertible Bond | | | 0.1 | | |
Total Fixed Income Investments | | | 25.4 | | |
Short-Term Investments and Other | | | 13.4 | | |
See accompanying Disclosures and Endnotes on page 83.
12 OAKMARK FUNDS
Oakmark Equity and Income Fund March 31, 2018
Portfolio Manager Commentary


Clyde S. McGregor, CFA
Portfolio Manager
oakbx@oakmark.com
M. Colin Hudson, CFA
Portfolio Manager
oakbx@oakmark.com
Edward J. Wojciechowski, CFA
Portfolio Manager
oakbx@oakmark.com
The Return of Volatility
In our long history of writing these reports, the title above is one of the least creative we have ever posted for the opening section. But it is hard to ignore or underplay the considerable change in the investing environment that became evident in the recent quarter. To review, 2017 was the first so-called "perfect year," meaning that the S&P 5002 generated positive returns in each month. And these returns were accomplished with few individual days experiencing moves of 1% or more. In January 2018, this trend continued and even amplified as the S&P 500 returned nearly 6% in the month. But in February, market action changed drastically: returns shifted to negative and intraday volatility expanded. Market commentators ascribed this change to many factors, but trade war fears, a hint of increase in the rate of inflation and rising interest rates almost certainly contributed. Whatever the causes, this more volatile period is closer to typical for the stock market than the remarkable quiescence of 2017. We are usually more active in volatile time periods, and as you will see later in this report, we initiated holdings in an unusually large group of issues during the past quarter.
For the March quarter, the Equity and Income Fund showed a loss of 1.6%, compared to a 1.0% loss for the Lipper Balanced Fund Index9, the Fund's performance benchmark. For the six months of the Fund's fiscal year, the Fund earned 2.5%, which contrasts to a 2.6% gain for the Lipper Index. We are pleased to report that the annualized compound rate of return since the Fund's inception in 1995 is 10.2%, while the corresponding return to the Lipper Index is 6.9%.
The largest contributors to portfolio return in the quarter were Mastercard, TE Connectivity, Jones Lang LaSalle, Bank of America and HCA Healthcare. General Motors, CVS Health, Nestlé, Citigroup and Arconic detracted most. For the six months, Bank of America, TE Connectivity, Mastercard, Jones Lang LaSalle and UnitedHealth Group led the contributors, while CVS Health, General Motors, Baker Hughes, Philip Morris International and Nestlé detracted most from return.
Are Today's Interest Rates the New Normal?
As value managers, we often are described as seeking "regression toward the mean" or mean reversion. Mean reversion is observed in many processes. Given that we are writing this during college basketball's championship tournament, a good example is a team that starts a game with an extremely high three-point field goal shooting percentage. The pull of mean reversion suggests that this shooting will cool off as the game progresses to something closer to that team's historic record. Relative to investing, we value investors look to identify equities
selling for prices well below our estimate of their intrinsic value because history has taught us that the prices of these securities will converge toward their true worth. After purchasing a holding, we aim to sell it when its price has converged with—or exceeded—our intrinsic value estimate. Our type of value investing requires only that human nature stays constant (i.e., not perfectly rational) such that price and value diverge and converge periodically. Where value investors face meaningful error potential, however, is either from mis-estimating the intrinsic value to begin with or from ignoring that a company's intrinsic value is declining.
As managers of a balanced fund, we also apply our value philosophy to fixed income investing. We look to identify fixed income issues that trade for less than we believe them to be worth, and we attempt to increase (or decrease) our fixed income portfolio weight when the term structure of interest rates is itself attractive (or unattractive). For much of the current decade, we have found interest rates generically to be too low. Low interest rates increase duration, an attribute that helps to describe the price volatility that a bond will exhibit, meaning that low interest rates amplify bond price volatility. We invest in bonds for the Equity and Income Fund in part to dampen volatility, so low interest rates are unhelpful to that effort. As well, most of us involved in investing today have considerable experience with periods of interest rates far in excess of today's levels. Many of us believe that history represents the norm (the mean expectation) and that the current time period is extraordinary (from which rates should be reverting).
But what if the mean value for interest rates has itself shifted to a much lower level such that today's term structure is the new normal? A recent paper published by the National Bureau of Economic Research makes that argument. The authors write, "Viewed from a long-run perspective, it may be fair to characterize the real safe rate as normally fluctuating around the levels that we see today, so that today's level is not so unusual. Consequently, we think the puzzle may well be why was the safe rate so high in the mid-1980s rather than why has it declined ever since."11 This argument suggests that those of us who began our careers in the 1980s may be allowing an anomalous period to influence our understanding of normal levels of interest rates. Of course, this argument also has broader implications for projected returns from pension plans, endowment funds, retirement savings, etc.
Another way that economists discuss this is to estimate a neutral (or natural) rate of interest where the neutral rate is one that neither stimulates nor retards economic activity. Some postulate that the neutral rate is in part a function of economic productivity and population growth and that the low interest
See accompanying Disclosures and Endnotes on page 83.
Oakmark.com 13
Oakmark Equity and Income Fund March 31, 2018
Portfolio Manager Commentary (continued)
rate structure evident today reflects the current low productivity level.
All of this is problematic for investors and portfolio managers, even as it is advantageous for governments and other borrowers. We must work harder and perhaps differently to identify value in fixed income securities in a world of secular low rates. To dampen portfolio volatility, we may need to continue to hold higher levels of cash and other short-term instruments. And we may all have to become acclimated to a world with lower potential nominal returns.
Transaction Activity
The Fund was especially active in the quarter, adding six new positions and exiting three. The new additions were Anadarko, Carlisle, Comcast, Liberty Broadband (LBRDA, LBRDK), Qorvo and Regeneron. The Fund also built up a position in CoreLogic, having initiated it at the end of the previous quarter.
Anadarko acquires, explores, develops, produces and markets oil and natural gas. Anadarko has some of the highest quality assets in the U.S. onshore market, generating high returns on invested capital and holding a large inventory of undrilled locations. Its management team is one of the best in the industry and has a track record of operational excellence and value-accretive capital allocation. Despite these positives, the stock is trading at a discount to its E&P (exploration and production) peers.
Carlisle is a diversified manufacturing company, consisting of construction materials, interconnect technologies and other industrial products. A new management team is in the process of reshaping the portfolio through a series of acquisitions and divestitures. These activities depress short-term results but will add value in the long run. Additionally, raw material inflation has hurt the company's current financials, but we believe these pressures should prove transitory as Carlisle should eventually be able to pass costs through to customers.
Our investments in Comcast and Liberty Broadband (which we view as a cheaper way to own Charter Communications) should be covered together. We believe that the cable business has become a much higher quality, internet connectivity-centric business, and that this fact is underappreciated by the market. In many markets, Charter and Comcast have the only fiber-rich networks capable of providing consumers with the high internet speeds they increasingly demand. Competitor efforts to enter the market have proven uneconomic due to the fractional penetration available to new entrants. Thus, barriers to entry are quite high, providing a long runway for growth for the incumbent cable operators. We have great respect for the management teams at both companies and think shareholders will continue to be rewarded by their stewardship. Further, the competitive position of these companies should enable them to capture much of the economics from U.S. corporate tax reform, yet the stocks both trade for lower prices than before the passage of the bill.
CoreLogic provides residential real estate information to the financial services sector. The shares have been weak due to near-term cyclical concerns about declining mortgage refinancing activity. We do not believe this has a long-term impact on
business value. Unique data businesses tend to have great returns and are difficult to replicate. CoreLogic fits this mold. The management team has been good stewards of capital and has reduced the share count 30% since 2010. Management has been improving margins for years, and we believe there is more room for improvement going forward. Meanwhile, CoreLogic is selling well below public and private market values of other high-quality data providers.
Qorvo is a semiconductor company engaged in the design and production of the radio frequency modules that allow mobile handsets to communicate with wireless networks. Qorvo enjoys the favorable economics associated with being one of just three large competitors controlling 70% of a technically complex market. Over the long term, Qorvo and the radio frequency chip industry are exposed to many of the most favorable trends we see in the market today—increasing data consumption and mobile computer usage, internet-of-things, driverless vehicles, and a universal move toward a more connected world. We expect demand growth from these secular trends, coupled with recent design wins in the high-end of the market, to allow Qorvo to increase manufacturing utilization, which will significantly grow its margins and revenues.
Regeneron is a biotech company that is an industry leader in research and development (R&D). The company is led by its founder Leonard Schleifer who maintains a culture focused on developing novel drugs. He continues to hold a significant equity stake. Recent drug approvals provide a long growth runway, and we expect the company's largest drug, Eylea, will be sustainable for at least several more years. Regeneron spends significantly more than its peers on R&D, which—when combined with its elevated selling, general and administrative (SG&A) spending on recent drug launches—has caused its margins to look unusually low compared to its peers. However, we believe that Regeneron will earn above-average returns on its R&D spend and that its launch costs will normalize over time. Although the company's consensus multiples appear high, if its R&D costs are adjusted and its launch costs are normalized, Regeneron would be trading at a low-teens earnings multiple. We believe this is a compelling valuation for a growing business with a proven management team that is aligned with shareholders.
During the quarter, the Fund sold positions in Black Knight (received into the portfolio as a distribution from Fidelity National Financial), Manitowoc and Principal Financial. All three stocks reached their target prices and performed well during our holding period. The proceeds from these sales were used to purchase more attractively priced alternatives.
As always, we thank our fellow shareholders for investing in the Equity and Income Fund and welcome your questions or comments.
See accompanying Disclosures and Endnotes on page 83.
14 OAKMARK FUNDS
Oakmark Equity and Income Fund March 31, 2018 (Unaudited)
Schedule of Investments (in thousands)
| | | Shares | | Value | |
COMMON STOCKS - 61.1% | |
FINANCIALS - 13.2% | |
BANKS - 7.6% | |
Bank of America Corp. | | | 25,084 | | | $ | 752,254 | | |
Citigroup, Inc. | | | 5,165 | | | | 348,631 | | |
Wells Fargo & Co. | | | 1,824 | | | | 95,580 | | |
| | | | | | 1,196,465 | | |
DIVERSIFIED FINANCIALS - 3.7% | |
Ally Financial, Inc. | | | 9,973 | | | | 270,754 | | |
The Bank of New York Mellon Corp. | | | 3,030 | | | | 156,118 | | |
State Street Corp. | | | 1,551 | | | | 154,701 | | |
| | | | | | 581,573 | | |
INSURANCE - 1.9% | |
American International Group, Inc. | | | 3,646 | | | | 198,399 | | |
FNF Group | | | 2,764 | | | | 110,612 | | |
| | | | | | 309,011 | | |
| | | | | | 2,087,049 | | |
INFORMATION TECHNOLOGY - 12.1% | |
SOFTWARE & SERVICES - 6.9% | |
MasterCard, Inc., Class A | | | 2,502 | | | | 438,320 | | |
Oracle Corp. | | | 6,939 | | | | 317,464 | | |
Alphabet, Inc., Class C (a) | | | 263 | | | | 271,154 | | |
CoreLogic, Inc. (a) | | | 1,248 | | | | 56,457 | | |
| | | | | | 1,083,395 | | |
TECHNOLOGY HARDWARE & EQUIPMENT - 4.9% | |
TE Connectivity, Ltd. | | | 6,483 | | | | 647,662 | | |
CommScope Holding Co., Inc. (a) | | | 3,280 | | | | 131,110 | | |
| | | | | | 778,772 | | |
SEMICONDUCTORS & SEMICONDUCTOR EQUIPMENT - 0.3% | |
Qorvo, Inc. (a) | | | 609 | | | | 42,932 | | |
| | | | | | 1,905,099 | | |
CONSUMER DISCRETIONARY - 11.6% | |
AUTOMOBILES & COMPONENTS - 7.6% | |
General Motors Co. | | | 20,307 | | | | 737,971 | | |
Lear Corp. | | | 1,316 | | | | 244,975 | | |
BorgWarner, Inc. | | | 4,282 | | | | 215,080 | | |
| | | | | | 1,198,026 | | |
RETAILING - 1.6% | |
Foot Locker, Inc. | | | 4,066 | | | | 185,184 | | |
Liberty Interactive Corp. QVC Group,
Class A (a) | | | 2,327 | | | | 58,582 | | |
| | | | | | 243,766 | | |
MEDIA - 1.5% | |
Comcast Corp., Class A | | | 4,707 | | | | 160,824 | | |
Liberty Broadband Corp., Class C (a) | | | 754 | | | | 64,585 | | |
Liberty Broadband Corp., Class A (a) | | | 95 | | | | 8,090 | | |
| | | | | | 233,499 | | |
| | | Shares | | Value | |
CONSUMER SERVICES - 0.5% | |
MGM Resorts International | | | 2,351 | | | $ | 82,340 | | |
CONSUMER DURABLES & APPAREL - 0.4% | |
Carter's, Inc. | | | 664 | | | | 69,154 | | |
| | | | | | 1,826,785 | | |
CONSUMER STAPLES - 8.8% | |
FOOD, BEVERAGE & TOBACCO - 6.9% | |
Nestlé SA (b) | | | 5,623 | | | | 444,498 | | |
Philip Morris International, Inc. | | | 3,250 | | | | 323,070 | | |
Diageo PLC (b) | | | 2,310 | | | | 312,834 | | |
| | | | | | 1,080,402 | | |
FOOD & STAPLES RETAILING - 1.9% | |
CVS Health Corp. | | | 4,911 | | | | 305,535 | | |
| | | | | | 1,385,937 | | |
INDUSTRIALS - 4.9% | |
CAPITAL GOODS - 4.9% | |
Dover Corp. | | | 3,545 | | | | 348,141 | | |
Arconic, Inc. | | | 7,685 | | | | 177,055 | | |
Johnson Controls International plc | | | 4,970 | | | | 175,146 | | |
WESCO International, Inc. (a) | | | 682 | | | | 42,293 | | |
Carlisle Cos., Inc. | | | 333 | | | | 34,718 | | |
| | | | | | 777,353 | | |
HEALTH CARE - 4.6% | |
HEALTH CARE EQUIPMENT & SERVICES - 4.1% | |
UnitedHealth Group, Inc. | | | 1,795 | | | | 384,117 | | |
HCA Healthcare, Inc. | | | 2,186 | | | | 212,013 | | |
LivaNova PLC (a) | | | 567 | | | | 50,160 | | |
| | | | | | 646,290 | | |
PHARMACEUTICALS, BIOTECHNOLOGY & LIFE SCIENCES - 0.5% | |
Regeneron Pharmaceuticals, Inc. (a) | | | 240 | | | | 82,647 | | |
| | | | | | 728,937 | | |
ENERGY - 3.3% | |
National Oilwell Varco, Inc. | | | 7,573 | | | | 278,769 | | |
PDC Energy, Inc. (a) | | | 1,773 | | | | 86,906 | | |
Anadarko Petroleum Corp. | | | 1,417 | | | | 85,583 | | |
Baker Hughes a GE Co. | | | 2,682 | | | | 74,465 | | |
| | | | | | 525,723 | | |
REAL ESTATE - 1.5% | |
Jones Lang LaSalle, Inc. | | | 550 | | | | 96,059 | | |
The Howard Hughes Corp. (a) | | | 555 | | | | 77,156 | | |
Gaming and Leisure Properties, Inc. REIT | | | 1,833 | | | | 61,337 | | |
| | | | | | 234,552 | | |
MATERIALS - 1.1% | |
Glencore PLC | | | 35,440 | | | | 175,918 | | |
TOTAL COMMON STOCKS - 61.1%
(COST $5,575,960) | | | | | 9,647,353 | | |
See accompanying Notes to Financial Statements.
Oakmark.com 15
Oakmark Equity and Income Fund March 31, 2018 (Unaudited)
Schedule of Investments (in thousands) (continued)
| | | Shares | | Value | |
PREFERRED STOCKS - 0.1% | |
FINANCIALS - 0.1% | |
GMAC Capital Trust I (c), 7.62%
(3 mo. USD LIBOR + 5.785%), | | | 498 | | | $ | 12,925 | | |
TOTAL PREFERRED STOCKS - 0.1%
(COST $13,007) | | | | | 12,925 | | |
| | | Par Value | | Value | |
FIXED INCOME - 25.4% | |
CORPORATE BONDS - 13.3% | |
FINANCIALS - 3.7% | |
Aflac, Inc.
2.875%, due 10/15/26 | | $ | 980 | | | | 922 | | |
Ally Financial, Inc.
4.75%, due 09/10/18 | | | 4,743 | | | | 4,780 | | |
American Express Credit Corp.
1.875%, due 11/05/18 | | | 4,915 | | | | 4,895 | | |
2.60%, due 09/14/20 | | | 2,945 | | | | 2,912 | | |
American International Group, Inc.
3.30%, due 03/01/21 | | | 14,665 | | | | 14,680 | | |
Aon Corp.
5.00%, due 09/30/20 | | | 14,745 | | | | 15,396 | | |
Bank of America Corp.
1.95%, due 05/12/18 | | | 31,675 | | | | 31,660 | | |
2.151%, due 11/09/20 | | | 6,970 | | | | 6,833 | | |
4.45%, due 03/03/26 | | | 5,000 | | | | 5,108 | | |
Capital One Bank USA NA
2.15%, due 11/21/18 | | | 3,768 | | | | 3,755 | | |
Capital One NA
1.85%, due 09/13/19 | | | 39,255 | | | | 38,589 | | |
2.35%, due 08/17/18 | | | 5,000 | | | | 4,994 | | |
Citigroup, Inc.
1.70%, due 04/27/18 | | | 32,933 | | | | 32,915 | | |
2.45%, due 01/10/20 | | | 19,910 | | | | 19,725 | | |
3.40%, due 05/01/26 | | | 15,000 | | | | 14,498 | | |
4.05%, due 07/30/22 | | | 13,338 | | | | 13,554 | | |
2.05%, due 12/07/18 | | | 2,098 | | | | 2,090 | | |
CNO Financial Group, Inc.
4.50%, due 05/30/20 | | | 9,830 | | | | 9,891 | | |
5.25%, due 05/30/25 | | | 5,895 | | | | 5,866 | | |
Credit Suisse Group AG, 144A
7.50%(USD 5 Year Swap
rate + 4.598%) (c) (d) (e) | | | 30,000 | | | | 32,481 | | |
6.25%(USD 5 Year Swap
rate + 3.455%) (c) (d) (e) | | | 7,000 | | | | 7,184 | | |
Credit Suisse Group Funding Guernsey, Ltd.
3.125%, due 12/10/20 | | | 25,000 | | | | 24,861 | | |
3.80%, due 06/09/23 | | | 14,750 | | | | 14,778 | | |
E*TRADE Financial Corp.
2.95%, due 08/24/22 | | | 6,965 | | | | 6,780 | | |
3.80%, due 08/24/27 | | | 4,975 | | | | 4,831 | | |
JPMorgan Chase & Co.
2.972%, due 01/15/23 | | | 29,765 | | | | 29,195 | | |
2.971%(3 mo. USD LIBOR + 1.230%),
due 10/24/23 (c) | | | 19,910 | | | | 20,203 | | |
Moody's Corp.
4.50%, due 09/01/22 | | | 9,820 | | | | 10,244 | | |
5.50%, due 09/01/20 | | | 3,780 | | | | 3,995 | | |
| | | Par Value | | Value | |
MSCI, Inc., 144A
5.25%, due 11/15/24 (e) | | $ | 24,830 | | | $ | 25,351 | | |
4.75%, due 08/01/26 (e) | | | 5,925 | | | | 5,866 | | |
5.75%, due 08/15/25 (e) | | | 2,950 | | | | 3,082 | | |
Principal Life Global Funding II, 144A
2.15%, due 01/10/20 (e) | | | 19,910 | | | | 19,550 | | |
2.375%, due 11/21/21 (e) | | | 6,970 | | | | 6,764 | | |
Reinsurance Group of America, Inc.
3.95%, due 09/15/26 | | | 4,905 | | | | 4,855 | | |
S&P Global, Inc.
4.00%, due 06/15/25 | | | 17,150 | | | | 17,522 | | |
2.95%, due 01/22/27 | | | 9,810 | | | | 9,322 | | |
4.40%, due 02/15/26 | | | 1,970 | | | | 2,068 | | |
3.30%, due 08/14/20 | | | 1,970 | | | | 1,981 | | |
2.50%, due 08/15/18 | | | 1,970 | | | | 1,969 | | |
S&P Global, Inc., 144A
2.50%, due 08/15/18 (e) | | | 1,267 | | | | 1,266 | | |
The Bear Stearns Cos. LLC
4.65%, due 07/02/18 | | | 8,205 | | | | 8,247 | | |
The Goldman Sachs Group, Inc.
2.35%, due 11/15/21 | | | 14,616 | | | | 14,093 | | |
3.20%, due 02/23/23 | | | 7,000 | | | | 6,899 | | |
2.30%, due 12/13/19 | | | 6,970 | | | | 6,895 | | |
3.51%(3 mo. USD LIBOR + 1.750%),
due 10/28/27 (c) | | | 2,975 | | | | 3,115 | | |
2.625%, due 04/25/21 | | | 2,000 | | | | 1,959 | | |
2.875%, due 02/25/21 | | | 1,000 | | | | 990 | | |
2.55%, due 10/23/19 | | | 980 | | | | 975 | | |
Voya Financial, Inc.
3.65%, due 06/15/26 | | | 1,960 | | | | 1,910 | | |
Wells Fargo & Co.
3.069%, due 01/24/23 | | | 14,930 | | | | 14,682 | | |
3.002%(3 mo. USD LIBOR + 1.230%),
due 10/31/23 (c) | | | 8,603 | | | | 8,728 | | |
Wells Fargo Bank NA
1.80%, due 11/28/18 | | | 9,900 | | | | 9,853 | | |
2.15%, due 12/06/19 | | | 9,900 | | | | 9,793 | | |
| | | | | | 575,350 | | |
CONSUMER DISCRETIONARY - 3.5% | |
Amazon.com, Inc., 144A
3.15%, due 08/22/27 (e) | | | 9,950 | | | | 9,600 | | |
Booking Holdings, Inc.
3.60%, due 06/01/26 | | | 14,730 | | | | 14,471 | | |
3.55%, due 03/15/28 | | | 9,950 | | | | 9,628 | | |
2.75%, due 03/15/23 | | | 6,965 | | | | 6,721 | | |
BorgWarner, Inc.
4.625%, due 09/15/20 | | | 10,810 | | | | 11,187 | | |
Caesars Resort Collection LLC / CRC
Finco, Inc., 144A
5.25%, due 10/15/25 (e) | | | 24,875 | | | | 23,847 | | |
CCO Holdings LLC / CCO Holdings
Capital Corp., 144A
5.125%, due 05/01/27 (e) | | | 250 | | | | 237 | | |
Charter Communications Operating
LLC / Charter Communications
Operating Capital
3.579%, due 07/23/20 | | | 29,148 | | | | 29,230 | | |
4.20%, due 03/15/28 | | | 9,950 | | | | 9,524 | | |
See accompanying Notes to Financial Statements.
16 OAKMARK FUNDS
Oakmark Equity and Income Fund March 31, 2018 (Unaudited)
Schedule of Investments (in thousands) (continued)
| | | Par Value | | Value | |
FIXED INCOME - 25.4% (continued) | |
CORPORATE BONDS - 13.3% (continued) | |
Dana, Inc.
6.00%, due 09/15/23 | | $ | 3,925 | | | $ | 4,056 | | |
Delphi Technologies PLC, 144A
5.00%, due 10/01/25 (e) | | | 1,000 | | | | 959 | | |
Dollar Tree, Inc.
5.75%, due 03/01/23 | | | 2,950 | | | | 3,079 | | |
EMI Music Publishing Group North
America Holdings, Inc., 144A
7.625%, due 06/15/24 (e) | | | 4,910 | | | | 5,315 | | |
Expedia Group, Inc.
5.00%, due 02/15/26 | | | 28,360 | | | | 29,261 | | |
Foot Locker, Inc.
8.50%, due 01/15/22 | | | 4,340 | | | | 5,002 | | |
General Motors Co.
4.875%, due 10/02/23 | | | 41,400 | | | | 43,202 | | |
3.50%, due 10/02/18 | | | 29,525 | | | | 29,568 | | |
General Motors Financial Co., Inc.
3.50%, due 07/10/19 | | | 4,975 | | | | 5,001 | | |
3.10%, due 01/15/19 | | | 4,915 | | | | 4,920 | | |
International Game Technology PLC, 144A
6.50%, due 02/15/25 (e) | | | 19,600 | | | | 20,997 | | |
6.25%, due 02/15/22 (e) | | | 14,800 | | | | 15,503 | | |
5.625%, due 02/15/20 (e) | | | 9,800 | | | | 10,045 | | |
KFC Holding Co/Pizza Hut Holdings
LLC/Taco Bell of America LLC, 144A
5.25%, due 06/01/26 (e) | | | 1,000 | | | | 996 | | |
5.00%, due 06/01/24 (e) | | | 1,000 | | | | 994 | | |
Lear Corp.
5.25%, due 01/15/25 | | | 11,060 | | | | 11,686 | | |
5.375%, due 03/15/24 | | | 10,512 | | | | 11,025 | | |
Lithia Motors, Inc., 144A
5.25%, due 08/01/25 (e) | | | 1,990 | | | | 1,990 | | |
Live Nation Entertainment Inc., 144A
4.875%, due 11/01/24 (e) | | | 14,935 | | | | 14,562 | | |
5.625%, due 03/15/26 (e) | | | 4,975 | | | | 5,037 | | |
5.375%, due 06/15/22 (e) | | | 2,000 | | | | 2,045 | | |
Mattel Inc., 144A
6.75%, due 12/31/25 (e) | | | 4,980 | | | | 4,868 | | |
MGM Resorts International
8.625%, due 02/01/19 | | | 2,612 | | | | 2,728 | | |
Netflix, Inc.
5.875%, due 02/15/25 | | | 4,975 | | | | 5,211 | | |
Netflix, Inc., 144A
4.875%, due 04/15/28 (e) | | | 25,870 | | | | 24,877 | | |
Omnicom Group, Inc.
3.625%, due 05/01/22 | | | 30,425 | | | | 30,621 | | |
6.25%, due 07/15/19 | | | 2,950 | | | | 3,074 | | |
Penn National Gaming, Inc., 144A
5.625%, due 01/15/27 (e) | | | 6,970 | | | | 6,719 | | |
Penske Automotive Group, Inc.
5.50%, due 05/15/26 | | | 11,343 | | | | 11,144 | | |
5.375%, due 12/01/24 | | | 3,580 | | | | 3,598 | | |
Scientific Games International, Inc.
10.00%, due 12/01/22 | | | 19,665 | | | | 21,177 | | |
Scripps Networks Interactive, Inc.
2.80%, due 06/15/20 | | | 3,930 | | | | 3,879 | | |
| | | Par Value | | Value | |
Station Casinos LLC, 144A
5.00%, due 10/01/25 (e) | | $ | 1,990 | | | $ | 1,891 | | |
Tapestry, Inc.
3.00%, due 07/15/22 | | | 12,145 | | | | 11,736 | | |
4.125%, due 07/15/27 | | | 4,975 | | | | 4,883 | | |
Tempur Sealy International, Inc.
5.50%, due 06/15/26 | | | 1,965 | | | | 1,891 | | |
The Gap, Inc.
5.95%, due 04/12/21 | | | 1,965 | | | | 2,064 | | |
The William Carter Co.
5.25%, due 08/15/21 | | | 36,132 | | | | 36,900 | | |
Tribune Media Co.
5.875%, due 07/15/22 | | | 1,000 | | | | 1,014 | | |
Under Armour, Inc.
3.25%, due 06/15/26 | | | 12,565 | | | | 11,080 | | |
Wolverine World Wide, Inc., 144A
5.00%, due 09/01/26 (e) | | | 12,140 | | | | 11,837 | | |
Yum! Brands, Inc.
3.875%, due 11/01/23 | | | 6,329 | | | | 6,076 | | |
| | | | | | 546,956 | | |
INFORMATION TECHNOLOGY - 1.6% | |
Activision Blizzard, Inc., 144A
6.125%, due 09/15/23 (e) | | | 70,853 | | | | 74,113 | | |
Avnet, Inc.
4.875%, due 12/01/22 | | | 5,290 | | | | 5,478 | | |
3.75%, due 12/01/21 | | | 2,985 | | | | 2,982 | | |
Broadcom Corp. / Broadcom
Cayman Finance, Ltd.
3.00%, due 01/15/22 | | | 14,930 | | | | 14,650 | | |
2.375%, due 01/15/20 | | | 9,955 | | | | 9,816 | | |
3.625%, due 01/15/24 | | | 9,955 | | | | 9,793 | | |
3.50%, due 01/15/28 | | | 4,975 | | | | 4,676 | | |
CDW LLC / CDW Finance Corp.
5.00%, due 09/01/25 | | | 9,955 | | | | 9,905 | | |
5.00%, due 09/01/23 | | | 6,965 | | | | 7,062 | | |
CommScope Technologies LLC, 144A
5.00%, due 03/15/27 (e) | | | 14,438 | | | | 13,716 | | |
CommScope, Inc., 144A
5.50%, due 06/15/24 (e) | | | 2,985 | | | | 3,048 | | |
5.00%, due 06/15/21 (e) | | | 995 | | | | 1,009 | | |
Dell International LLC / EMC Corp., 144A
5.45%, due 06/15/23 (e) | | | 14,725 | | | | 15,609 | | |
4.42%, due 06/15/21 (e) | | | 2,940 | | | | 3,016 | | |
Electronic Arts, Inc.
4.80%, due 03/01/26 | | | 19,655 | | | | 21,052 | | |
3.70%, due 03/01/21 | | | 14,740 | | | | 14,969 | | |
Itron Inc., 144A
5.00%, due 01/15/26 (e) | | | 5,970 | | | | 5,882 | | |
Lam Research Corp.
2.75%, due 03/15/20 | | | 19,660 | | | | 19,577 | | |
2.80%, due 06/15/21 | | | 4,910 | | | | 4,845 | | |
Motorola Solutions, Inc.
4.60%, due 02/23/28 | | | 2,985 | | | | 3,005 | | |
Symantec Corp., 144A
5.00%, due 04/15/25 (e) | | | 1,000 | | | | 1,009 | | |
Tyco Electronics Group SA
3.70%, due 02/15/26 | | | 9,830 | | | | 9,974 | | |
2.35%, due 08/01/19 | | | 1,812 | | | | 1,802 | | |
| | | | | | 256,988 | | |
See accompanying Notes to Financial Statements.
Oakmark.com 17
Oakmark Equity and Income Fund March 31, 2018 (Unaudited)
Schedule of Investments (in thousands) (continued)
| | | Par Value | | Value | |
FIXED INCOME - 25.4% (continued) | |
CORPORATE BONDS - 13.3% (continued) | |
HEALTH CARE - 1.5% | |
Abbott Laboratories
2.90%, due 11/30/21 | | $ | 16,625 | | | $ | 16,449 | | |
2.35%, due 11/22/19 | | | 9,409 | | | | 9,328 | | |
AbbVie, Inc.
1.80%, due 05/14/18 | | | 4,937 | | | | 4,933 | | |
Becton Dickinson and Co.
2.675%, due 12/15/19 | | | 12,811 | | | | 12,737 | | |
3.30%, due 03/01/23 | | | 11,204 | | | | 11,081 | | |
2.944%(3 mo. USD LIBOR + 0.8750%),
due 12/29/20 (c) | | | 9,950 | | | | 9,961 | | |
2.133%, due 06/06/19 | | | 9,950 | | | | 9,837 | | |
2.894%, due 06/06/22 | | | 2,985 | | | | 2,896 | | |
3.363%, due 06/06/24 | | | 2,985 | | | | 2,873 | | |
Centene Corp.
4.75%, due 05/15/22 | | | 20,084 | | | | 20,335 | | |
Express Scripts Holding Co.
3.30%, due 02/25/21 | | | 4,915 | | | | 4,906 | | |
HCA, Inc.
6.50%, due 02/15/20 | | | 9,895 | | | | 10,377 | | |
5.00%, due 03/15/24 | | | 7,465 | | | | 7,540 | | |
3.75%, due 03/15/19 | | | 3,965 | | | | 3,980 | | |
4.25%, due 10/15/19 | | | 1,990 | | | | 2,005 | | |
Johnson & Johnson
2.90%, due 01/15/28 | | | 14,925 | | | | 14,345 | | |
McKesson Corp.
3.95%, due 02/16/28 | | | 2,985 | | | | 2,948 | | |
Quest Diagnostics, Inc.
4.70%, due 04/01/21 | | | 5,128 | | | | 5,341 | | |
Quintiles IMS, Inc., 144A
5.00%, due 10/15/26 (e) | | | 7,800 | | | | 7,772 | | |
St Jude Medical LLC
2.00%, due 09/15/18 | | | 13,485 | | | | 13,433 | | |
Thermo Fisher Scientific, Inc.
3.00%, due 04/15/23 | | | 1,970 | | | | 1,920 | | |
Universal Health Services, Inc., 144A
4.75%, due 08/01/22 (e) | | | 32,695 | | | | 33,207 | | |
5.00%, due 06/01/26 (e) | | | 12,805 | | | | 12,869 | | |
3.75%, due 08/01/19 (e) | | | 6,970 | | | | 7,005 | | |
Zimmer Biomet Holdings, Inc.
2.928%(3 mo. USD LIBOR + 0.7500%),
due 03/19/21 (c) | | | 4,975 | | | | 4,981 | | |
3.15%, due 04/01/22 | | | 3,810 | | | | 3,755 | | |
3.70%, due 03/19/23 | | | 2,985 | | | | 2,991 | | |
2.00%, due 04/01/18 | | | 1,815 | | | | 1,815 | | |
| | | | | | 241,620 | | |
REAL ESTATE - 1.0% | |
CBRE Services, Inc.
5.25%, due 03/15/25 | | | 24,930 | | | | 26,669 | | |
4.875%, due 03/01/26 | | | 19,665 | | | | 20,623 | | |
GLP Capital , LP / GLP Financing II, Inc.
4.375%, due 11/01/18 | | | 39,180 | | | | 39,254 | | |
4.875%, due 11/01/20 | | | 14,975 | | | | 15,247 | | |
5.375%, due 11/01/23 | | | 12,000 | | | | 12,432 | | |
5.375%, due 04/15/26 | | | 3,925 | | | | 3,984 | | |
4.375%, due 04/15/21 | | | 1,965 | | | | 1,970 | | |
| | | Par Value | | Value | |
MGM Growth Properties Operating Partnership,
LP / MGP Finance Co-Issuer, Inc. REIT
5.625%, due 05/01/24 | | $ | 2,945 | | | $ | 3,033 | | |
Omega Healthcare Investors, Inc. REIT
4.375%, due 08/01/23 | | | 15,046 | | | | 15,039 | | |
5.25%, due 01/15/26 | | | 9,835 | | | | 9,985 | | |
The Howard Hughes Corp., 144A
5.375%, due 03/15/25 (e) | | | 11,945 | | | | 11,796 | | |
Ventas Realty , LP REIT
3.125%, due 06/15/23 | | | 2,490 | | | | 2,439 | | |
3.50%, due 02/01/25 | | | 1,000 | | | | 974 | | |
| | | | | | 163,445 | | |
CONSUMER STAPLES - 0.8% | |
CVS Health Corp.
4.00%, due 12/05/23 | | | 18,198 | | | | 18,412 | | |
5.00%, due 12/01/24 | | | 6,880 | | | | 7,262 | | |
4.75%, due 12/01/22 | | | 6,880 | | | | 7,206 | | |
2.25%, due 08/12/19 | | | 2,884 | | | | 2,855 | | |
Kraft Heinz Foods Co, 144A
4.875%, due 02/15/25 (e) | | | 6,260 | | | | 6,527 | | |
Kraft Heinz Foods Co.
2.00%, due 07/02/18 | | | 34,173 | | | | 34,139 | | |
Mead Johnson Nutrition Co.
4.125%, due 11/15/25 | | | 13,955 | | | | 14,322 | | |
3.00%, due 11/15/20 | | | 6,885 | | | | 6,858 | | |
Mondelez International Holdings
Netherlands BV, 144A
2.00%, due 10/28/21 (e) | | | 8,585 | | | | 8,192 | | |
1.625%, due 10/28/19 (e) | | | 7,764 | | | | 7,604 | | |
Post Holdings, Inc., 144A
5.00%, due 08/15/26 (e) | | | 2,000 | | | | 1,900 | | |
5.75%, due 03/01/27 (e) | | | 500 | | | | 497 | | |
5.50%, due 03/01/25 (e) | | | 500 | | | | 493 | | |
Smithfield Foods, Inc., 144A
2.70%, due 01/31/20 (e) | | | 6,420 | | | | 6,329 | | |
3.35%, due 02/01/22 (e) | | | 4,975 | | | | 4,871 | | |
2.65%, due 10/03/21 (e) | | | 3,980 | | | | 3,811 | | |
4.25%, due 02/01/27 (e) | | | 995 | | | | 985 | | |
| | | | | | 132,263 | | |
INDUSTRIALS - 0.6% | |
BAT Capital Corp., 144A
2.297%, due 08/14/20 (e) | | | 19,900 | | | | 19,511 | | |
3.557%, due 08/15/27 (e) | | | 6,965 | | | | 6,671 | | |
IHS Markit, Ltd., 144A
4.75%, due 02/15/25 (e) | | | 100 | | | | 102 | | |
Pentair Finance Sarl
2.90%, due 09/15/18 | | | 10,602 | | | | 10,604 | | |
Southwest Airlines Co.
2.65%, due 11/05/20 | | | 12,148 | | | | 12,021 | | |
Stanley Black & Decker, Inc.
2.451%, due 11/17/18 | | | 6,875 | | | | 6,861 | | |
USG Corp., 144A
4.875%, due 06/01/27 (e) | | | 6,965 | | | | 7,035 | | |
Welbilt, Inc.
9.50%, due 02/15/24 | | | 4,915 | | | | 5,480 | | |
WESCO Distribution, Inc.
5.375%, due 06/15/24 | | | 13,675 | | | | 13,726 | | |
5.375%, due 12/15/21 | | | 5,305 | | | | 5,391 | | |
| | | | | | 87,402 | | |
See accompanying Notes to Financial Statements.
18 OAKMARK FUNDS
Oakmark Equity and Income Fund March 31, 2018 (Unaudited)
Schedule of Investments (in thousands) (continued)
| | | Par Value | | Value | |
FIXED INCOME - 25.4% (continued) | |
CORPORATE BONDS - 13.3% (continued) | |
ENERGY - 0.3% | |
Cameron International Corp.
6.375%, due 07/15/18 | | $ | 2,375 | | | $ | 2,404 | | |
Cenovus Energy, Inc.
5.70%, due 10/15/19 | | | 9,470 | | | | 9,795 | | |
Oceaneering International, Inc.
4.65%, due 11/15/24 | | | 5,895 | | | | 5,688 | | |
Schlumberger Holdings Corp., 144A
2.35%, due 12/21/18 (e) | | | 14,740 | | | | 14,700 | | |
4.00%, due 12/21/25 (e) | | | 9,830 | | | | 9,996 | | |
Weatherford International LLC, 144A
9.875%, due 03/01/25 (e) | | | 9,950 | | | | 8,952 | | |
| | | | | | 51,535 | | |
TELECOMMUNICATION SERVICES - 0.2% | |
AT&T, Inc.
5.00%, due 03/01/21 | | | 16,710 | | | | 17,549 | | |
Zayo Group LLC / Zayo Capital, Inc.
6.00%, due 04/01/23 | | | 14,745 | | | | 15,150 | | |
| | | | | | 32,699 | | |
MATERIALS - 0.1% | |
Glencore Funding LLC, 144A
3.00%, due 10/27/22 (e) | | | 9,950 | | | | 9,597 | | |
3.875%, due 10/27/27 (e) | | | 9,950 | | | | 9,438 | | |
| | | | | | 19,035 | | |
Total Corporate Bonds
(Cost $2,102,232) | | | | | 2,107,293 | | |
GOVERNMENT AND AGENCY SECURITIES - 12.0% | |
U.S. GOVERNMENT NOTES - 11.7% | |
United States Treasury Bonds (TIPS)
1.25%, due 07/15/20 | | | 477,050 | | | | 489,754 | | |
1.375%, due 07/15/18 | | | 431,538 | | | | 435,881 | | |
2.125%, due 01/15/19 | | | 230,140 | | | | 234,183 | | |
United States Treasury Notes
1.00%, due 09/15/18 | | | 199,000 | | | | 198,215 | | |
1.375%, due 12/15/19 | | | 99,500 | | | | 98,015 | | |
1.25%, due 11/30/18 | | | 73,725 | | | | 73,354 | | |
2.00%, due 11/30/22 | | | 74,625 | | | | 72,844 | | |
1.75%, due 03/31/22 | | | 74,645 | | | | 72,534 | | |
2.125%, due 12/31/22 | | | 49,745 | | | | 48,787 | | |
1.875%, due 11/30/21 | | | 49,785 | | | | 48,750 | | |
1.50%, due 11/30/19 | | | 24,875 | | | | 24,569 | | |
2.125%, due 01/31/21 | | | 24,570 | | | | 24,391 | | |
1.75%, due 10/31/20 | | | 24,570 | | | | 24,191 | | |
| | | | | | 1,845,468 | | |
U.S. GOVERNMENT AGENCIES - 0.3% | |
Federal National Mortgage Association,
1.25%, due 09/27/18 | | | 24,680 | | | | 24,588 | | |
Federal Farm Credit Banks,
1.68%, due 08/16/21 | | | 17,165 | | | | 16,639 | | |
| | | | | | 41,227 | | |
Total Government and Agency Securities
(Cost $1,878,018) | | | | | 1,886,695 | | |
| | | Par Value | | Value | |
CONVERTIBLE BOND - 0.1% | |
Chesapeake Energy Corp.,
5.50%, due 09/15/26
(Cost $14,482) | | $ | 14,915 | | | $ | 12,843 | | |
TOTAL FIXED INCOME - 25.4%
(COST $3,994,732) | | | | | 4,006,831 | | |
SHORT-TERM INVESTMENTS - 14.3% | |
COMMERCIAL PAPER - 8.7% | |
American Honda Finance Corp.,
1.67%, due 04/06/18 (f) | | | 40,790 | | | | 40,781 | | |
Anthem, Inc., 144A, 2.28% - 2.34%,
due 04/06/18 - 04/20/18 (e) (f) | | | 99,500 | | | | 99,424 | | |
Campbell Soup Co., 144A, 1.93% - 2.29%,
due 04/12/18 - 06/11/18 (e) (f) | | | 109,450 | | | | 109,181 | | |
Chevron Corp., 144A,
1.71%, due 04/04/18 (e) (f) | | | 49,750 | | | | 49,743 | | |
General Mills, Inc., 144A, 1.93% - 2.28%,
due 04/02/18 - 04/19/18 (e) (f) | | | 284,086 | | | | 283,928 | | |
J.P. Morgan Securities LLC,
2.04%, due 05/23/18 (f) | | | 49,750 | | | | 49,606 | | |
Kellogg Co., 144A,
2.13%, due 04/05/18 (e) (f) | | | 39,500 | | | | 39,491 | | |
Kraft Food Group, Inc., 144A,
1.81% - 2.03%,
due 04/02/18 - 05/01/18 (e) (f) | | | 199,000 | | | | 198,856 | | |
MetLife Short Term Funding
LLC, 144A, 1.95%,
due 05/07/18 - 05/08/18 (e) (f) | | | 94,600 | | | | 94,416 | | |
Schlumberger Holdings Corp.,
2.51%, due 05/15/18 (e) (f) | | | 44,750 | | | | 44,616 | | |
Schlumberger Holdings Corp., 144A,
1.81% - 2.58%,
due 04/04/18 - 05/30/18 (e) (f) | | | 60,500 | | | | 60,392 | | |
Toyota Motor Credit Corp.,
1.71% - 1.99%,
due 04/10/18 - 05/16/18 (f) | | | 149,250 | | | | 149,045 | | |
Walgreens Boots,
1.99% - 2.21%,
due 04/04/18 - 06/18/18 (f) | | | 148,325 | | | | 148,007 | | |
Total Commercial Paper
(Cost $1,367,533) | | | | | 1,367,486 | | |
GOVERNMENT AND AGENCY SECURITIES - 4.4% | |
Federal National Mortgage Association,
1.47%, due 04/02/18 - 04/03/18 (f)
(Cost $699,972) | | | 700,000 | | | | 699,972 | | |
REPURCHASE AGREEMENT - 0.9% | |
Fixed Income Clearing Corp. Repurchase
Agreement, 0.90% dated 03/29/18 due
04/02/18, repurchase price $145,304,
collateralized by a United States Treasury
Note, 2.125%, due 12/31/21, value plus
accrued interest of $148,196
(Cost: $145,290) | | | 145,290 | | | | 145,290 | | |
See accompanying Notes to Financial Statements.
Oakmark.com 19
Oakmark Equity and Income Fund March 31, 2018 (Unaudited)
Schedule of Investments (in thousands) (continued)
| | | Par Value | | Value | |
SHORT-TERM INVESTMENTS - 14.3% (continued) | |
CORPORATE BONDS - 0.3% | |
FINANCIALS - 0.2% | |
The Goldman Sachs Group, Inc.,
6.15%, due 04/01/18 | | $ | 38,800 | | | $ | 38,800 | | |
CONSUMER DISCRETIONARY - 0.1% | |
Expedia, Inc.,
7.456%, due 08/15/18 | | | 14,752 | | | | 14,997 | | |
Total Corporate Bonds
(Cost $53,858) | | | | | 53,797 | | |
TOTAL SHORT-TERM INVESTMENTS - 14.3%
(COST $2,266,653) | | | | | 2,266,545 | | |
TOTAL INVESTMENTS - 100.9%
(COST $11,850,352) | | | | | 15,933,654 | | |
Foreign Currencies - 0.0% (g) | | | | | 0 | (h) | |
Liabilities In Excess of Other Assets - (0.9)% | | | | | (141,629 | ) | |
NET ASSETS - 100.0% | | | | $ | 15,792,025 | | |
(a) Non-income producing security
(b) Sponsored American Depositary Receipt
(c) Floating Rate Note. Rate shown is as of March 31, 2018.
(d) Security is perpetual and has no stated maturity date.
(e) See Note 1 in the Notes to Financial Statements regarding restricted securities. These securities may be resold subject to restrictions on resale under federal securities law.
(f) The rate shown represents the annualized yield at the time of purchase; not a coupon rate.
(g) Amount rounds to less than 0.1%.
(h) Amount rounds to less than $1,000.
Abbreviations:
REIT: Real Estate Investment Trust
See accompanying Notes to Financial Statements.
20 OAKMARK FUNDS

This page intentionally left blank.
Oakmark.com 21
Oakmark Global Fund March 31, 2018
Summary Information
VALUE OF A $10,000 INVESTMENT
Since Inception - 08/04/99 (Unaudited)

PERFORMANCE
| | | | Average Annual Total Returns (as of 03/31/18) | | | |
| (Unaudited) | | Total Return
Last 3 Months | | 1-year | | 3-year | | 5-year | | 10-year | | Since
Inception | | Inception
Date | |
Oakmark Global Fund (Investor Class) | | | -2.57 | % | | | 15.08 | % | | | 6.66 | % | | | 9.71 | % | | | 7.09 | % | | | 10.48 | % | | 08/04/99 | |
MSCI World Index | | | -1.28 | % | | | 13.59 | % | | | 7.97 | % | | | 9.70 | % | | | 5.90 | % | | | 4.77 | % | | | |
Lipper Global Fund Index13 | | | -1.03 | % | | | 13.52 | % | | | 7.82 | % | | | 9.51 | % | | | 5.75 | % | | | 5.52 | % | | | |
Oakmark Global Fund (Advisor Class) | | | -2.57 | % | | | 15.20 | % | | | N/A | | | | N/A | | | | N/A | | | | 20.26 | % | | 11/30/16 | |
Oakmark Global Fund (Institutional Class) | | | -2.53 | % | | | 15.32 | % | | | N/A | | | | N/A | | | | N/A | | | | 20.36 | % | | 11/30/16 | |
Oakmark Global Fund (Service Class) | | | -2.64 | % | | | 14.84 | % | | | 6.32 | % | | | 9.35 | % | | | 6.73 | % | | | 10.62 | % | | 10/10/01 | |
The graph and table do not reflect the deduction of taxes that a shareholder would pay on Fund distributions or the redemption of Fund shares.
Past performance is no guarantee of future results. The performance data quoted represents past performance. Current performance may be lower or higher than the performance data quoted. Total return includes change in share prices and, in each case, includes reinvestment of dividends and capital gain distributions. The investment return and principal value vary so that an investor's shares when redeemed may be worth more or less than the original cost. To obtain the most recent month-end performance, please visit Oakmark.com.
TOP TEN EQUITY HOLDINGS5 | | % of Net Assets | |
Daimler AG | | | 5.7 | | |
Lloyds Banking Group PLC | | | 5.0 | | |
Allianz SE | | | 4.7 | | |
TE Connectivity, Ltd. | | | 4.6 | | |
Alphabet, Inc., Class C | | | 4.5 | | |
Bank of America Corp. | | | 4.5 | | |
Citigroup, Inc. | | | 4.0 | | |
General Motors Co. | | | 3.8 | | |
Credit Suisse Group AG | | | 3.7 | | |
MasterCard, Inc., Class A | | | 3.7 | | |
FUND STATISTICS | |
Ticker* | | OAKGX | |
Number of Equity Holdings | | 40 | |
Net Assets | | $2.6 billion | |
Weighted Average Market Cap | | $105.6 billion | |
Median Market Cap | | $32.9 billion | |
Gross Expense Ratio - Investor Class (as of 09/30/17)* | | 1.21% | |
Net Expense Ratio - Investor Class (as of 09/30/17)*† | | 1.15% | |
* This information is related to the Investor Class. Please visit Oakmark.com for information related to the Advisor, Institutional and Service Classes.
† The net expense ratio reflects a contractual advisory fee waiver agreement through January 28, 2019.
SECTOR ALLOCATION | | % of Net Assets | |
Consumer Discretionary | | | 27.7 | | |
Financials | | | 25.7 | | |
Information Technology | | | 19.1 | | |
Industrials | | | 12.5 | | |
Materials | | | 5.5 | | |
Health Care | | | 3.2 | | |
Energy | | | 1.8 | | |
Consumer Staples | | | 1.5 | | |
Short-Term Investments and Other | | | 3.0 | | |
GEOGRAPHIC ALLOCATION | |
| | % of Equity | |
North America | | | 46.2 | | |
United States | | | 46.2 | | |
Europe | | | 40.6 | | |
United Kingdom | | | 15.9 | | |
Germany* | | | 13.2 | | |
Switzerland | | | 11.4 | | |
Netherlands* | | | 0.1 | | |
Asia | | | 7.3 | | |
Japan | | | 4.8 | | |
| | % of Equity | |
Asia (cont'd) | | | 7.3 | | |
China | | | 1.5 | | |
India | | | 1.0 | | |
Australasia | | | 2.9 | | |
Australia | | | 2.9 | | |
Latin America | | | 1.9 | | |
Mexico | | | 1.9 | | |
Africa | | | 1.1 | | |
South Africa | | | 1.1 | | |
* Euro-currency countries comprise 13.3% of equity investments.
See accompanying Disclosures and Endnotes on page 83.
22 OAKMARK FUNDS
Oakmark Global Fund March 31, 2018
Portfolio Manager Commentary


David G. Herro, CFA
Portfolio Manager
oakgx@oakmark.com
Clyde S. McGregor, CFA
Portfolio Manager
oakgx@oakmark.com
Anthony P. Coniaris, CFA
Portfolio Manager
oakgx@oakmark.com
Jason E. Long, CFA
Portfolio Manager
oakgx@oakmark.com
The Markets Go Negative
Although worldwide equity markets started off well in 2018, they could not sustain the rally and posted declines for the quarter as a whole. Politics, especially relating to trade, contributed to this outcome, as did the inference that central banks were diminishing their market-supporting quantitative easing policies. The quarter ended up being the worst March quarter for stocks since 2009. The Oakmark Global Fund felt the downtrend's pull and lost 2.6% in the quarter, which compares to a 1.3% loss for the MSCI World Index12 and a 1.0% loss for the Lipper Global Fund Index13. For the six months of the Fund's fiscal year, it gained 1.2%, compared to a return of 4.2% for the MSCI World Index and 3.8% for the Lipper Global Fund Index.
Holdings in the U.S. and Japan boosted returns this quarter while the U.K., Australia and Switzerland detracted most. U.S. companies dominated the contributors' list: Tenet Healthcare, Mastercard, Interpublic Group, TE Connectivity and USG. The largest detractors were Travis Perkins (U.K.), General Motors (U.S.), Citigroup (U.S.), Incitec Pivot (Australia) and Grupo Televisa (Mexico). For the fiscal six months, the leading contributors once again all came from the U.S.: TE Connectivity, Bank of America, Mastercard, USG and Tenet Healthcare. USG shows up on both contributors' lists because the company has received a premium-priced takeover offer, which, as of this report date, has been spurned. The largest detractors from return in the period were Grupo Televisa, General Electric (U.S.—sold), CarMax (U.S.), General Motors and Travis Perkins. The countries that contributed most were the U.S., Germany and Japan, while Mexico, the U.K. and South Africa detracted most.
Portfolio Activity
Market volatility in the quarter provided opportunities for trading activity, and we took advantage by adding three new holdings while eliminating two. Although the number of U.S. portfolio holdings did not change, the comparatively stronger returns in the U.S. caused the U.S. portfolio weight to increase to 45%. This is still a meaningful discount to the U.S. weight in the MSCI World Index (60%) and reflects our view that international markets currently offer better opportunities. We never target a particular country (or industry) weight. Instead, our weightings are the result of our efforts to populate the Fund with our best ideas, while also seeking appropriate diversification.
Taking the new ideas in alphabetical order, Bayer is a German-based company with sizable global businesses in pharmaceuticals, agricultural productivity and consumer health products. Bayer's standalone businesses are high quality and the group will become even stronger if the acquisition of Monsanto is
approved. Combining Bayer's agricultural productivity business with Monsanto's capabilities would create the world's leading agricultural productivity business and offer significant synergy potential. It should position Bayer to benefit from the structural demand for increased agricultural productivity, given flat growth in arable land and the growing demand for food. Bayer's management team remained disciplined during the price negotiations and divested certain assets at good prices to create room for the purchase in the company's balance sheet. Regardless of whether the Monsanto acquisition is approved, though, we believe that Bayer's valuation will remain attractive.
We also initiated a holding in Charter Communications, the second-largest U.S. cable television and broadband company. Charter is a freshly consolidated, high-quality asset with significant integration potential, led by unusually strong management. Renowned cable executive John Malone sits on Charter's board of directors, and in our many years of following his activities, we have found him to be one of the finest capital allocators in the media industry. We believe that the cable business has improved significantly as it has increasingly focused on internet connectivity, and investors are underappreciating this fact. Consumer demand for faster broadband seems to be nearly insatiable, and in many of its markets, Charter has the only fiber-rich network capable of meeting this demand. Competitor efforts to enter these markets have proven uneconomic because of the fractional penetration available to new entrants. Thus, barriers to entry are quite high, providing a long runway for growth for the incumbent cable operators. With an advantaged competitive position and strong management, Charter provides an attractive investment opportunity in our view.
Last alphabetically is Naspers, a South African-based holding company with leading internet and media assets. Naspers was an early investor in Tencent, one of China's most valuable technology companies, and today it owns a 31% stake in the company. In addition, Naspers is a global leader in various online businesses, such as classifieds, food delivery and e-commerce. We are attracted to the quality of the company's assets and to its attractive valuation. The company trades near an all-time high discount to the underlying assets it owns. Naspers management team also has an excellent long-term track record of value creation, and we believe the discount to underlying assets will close over time.
We eliminated two holdings, General Electric and Wirecard. The former was a disappointment, and the latter was a success. We sold General Electric in favor of other opportunities and to help balance the Fund's net capital gain realization as part of
See accompanying Disclosures and Endnotes on page 83.
Oakmark.com 23
Oakmark Global Fund March 31, 2018
Portfolio Manager Commentary (continued)
our commitment to make the portfolio as tax-friendly as possible, while always being cognizant of the many tax-exempt entities invested in the Fund. Wirecard's strong returns reduced our margin of safety on the investment, and we exited our position as the market price approached our estimate of intrinsic value. We recycled the Wirecard profits into securities with better risk/return profiles.
Currency Hedge
We defensively hedge a portion of the Fund's exposure to currencies that we believe are overvalued versus the U.S. dollar. The only currency in the portfolio that we currently believe is overvalued is the Swiss franc and we accordingly hedged a portion of the Fund's exposure. The Swiss franc strengthened further during the quarter, leading us to increase our hedge from the beginning of quarter position. Approximately 22% of the Swiss franc exposure was hedged at quarter end.
As always, we thank you for being our partners in the Oakmark Global Fund. We invite you to send us your comments or questions.
See accompanying Disclosures and Endnotes on page 83.
24 OAKMARK FUNDS
Oakmark Global Fund March 31, 2018 (Unaudited)
Schedule of Investments (in thousands)
| | | Shares | | Value | |
COMMON STOCKS - 97.0% | |
CONSUMER DISCRETIONARY - 27.7% | |
AUTOMOBILES & COMPONENTS - 13.1% | |
Daimler AG (Germany) | | | 1,745 | | | $ | 148,063 | | |
General Motors Co. (United States) | | | 2,756 | | | | 100,164 | | |
Toyota Motor Corp. (Japan) | | | 1,465 | | | | 94,182 | | |
| | | | | | 342,409 | | |
MEDIA - 10.6% | |
The Interpublic Group of Cos., Inc.
(United States) | | | 2,823 | | | | 65,024 | | |
Grupo Televisa SAB (Mexico) (a) | | | 2,999 | | | | 47,870 | | |
Liberty Global PLC, Class C
(United Kingdom) (b) | | | 1,502 | | | | 45,709 | | |
Charter Communications, Inc., Class A
(United States) (b) | | | 116 | | | | 35,946 | | |
Liberty Global PLC, Class A
(United Kingdom) (b) | | | 929 | | | | 29,081 | | |
Naspers, Ltd. (South Africa) | | | 115 | | | | 28,188 | | |
Live Nation Entertainment, Inc.
(United States) (b) | | | 618 | | | | 26,031 | | |
| | | | | | 277,849 | | |
CONSUMER DURABLES & APPAREL - 2.5% | |
Cie Financiere Richemont SA (Switzerland) | | | 552 | | | | 49,554 | | |
Under Armour, Inc., Class C (United States) (b) | | | 1,154 | | | | 16,563 | | |
| | | | | | 66,117 | | |
RETAILING - 1.5% | |
CarMax, Inc. (United States) (b) | | | 605 | | | | 37,468 | | |
| | | | | | 723,843 | | |
FINANCIALS - 25.7% | |
BANKS - 14.5% | |
Lloyds Banking Group PLC
(United Kingdom) | | | 143,762 | | | | 130,418 | | |
Bank of America Corp. (United States) | | | 3,909 | | | | 117,228 | | |
Citigroup, Inc. (United States) | | | 1,559 | | | | 105,260 | | |
Axis Bank, Ltd. (India) | | | 3,257 | | | | 25,495 | | |
| | | | | | 378,401 | | |
DIVERSIFIED FINANCIALS - 6.5% | |
Credit Suisse Group AG (Switzerland) | | | 5,837 | | | | 97,629 | | |
Julius Baer Group, Ltd. (Switzerland) | | | 1,167 | | | | 71,729 | | |
| | | | | | 169,358 | | |
INSURANCE - 4.7% | |
Allianz SE (Germany) | | | 546 | | | | 123,196 | | |
| | | | | | 670,955 | | |
| | | Shares | | Value | |
INFORMATION TECHNOLOGY - 19.1% | |
SOFTWARE & SERVICES - 13.4% | |
Alphabet, Inc., Class C (United States) (b) | | | 114 | | | $ | 118,077 | | |
MasterCard, Inc., Class A (United States) | | | 556 | | | | 97,389 | | |
Oracle Corp. (United States) | | | 1,597 | | | | 73,076 | | |
Baidu, Inc. (China) (a) (b) | | | 168 | | | | 37,525 | | |
CoreLogic, Inc. (United States) (b) | | | 561 | | | | 25,356 | | |
| | | | | | 351,423 | | |
TECHNOLOGY HARDWARE & EQUIPMENT - 5.7% | |
TE Connectivity, Ltd. (United States) | | | 1,193 | | | | 119,181 | | |
Hirose Electric Co., Ltd. (Japan) | | | 208 | | | | 28,396 | | |
| | | | | | 147,577 | | |
| | | | | | 499,000 | | |
INDUSTRIALS - 12.5% | |
CAPITAL GOODS - 12.5% | |
CNH Industrial N.V. (United Kingdom) | | | 7,350 | | | | 90,713 | | |
Travis Perkins PLC (United Kingdom) | | | 3,876 | | | | 67,109 | | |
USG Corp. (United States) (b) | | | 1,459 | | | | 58,961 | | |
Johnson Controls International plc
(United States) | | | 1,388 | | | | 48,913 | | |
Arconic, Inc. (United States) | | | 1,594 | | | | 36,721 | | |
MTU Aero Engines AG (Germany) | | | 146 | | | | 24,542 | | |
| | | | | | 326,959 | | |
MATERIALS - 5.5% | |
Incitec Pivot, Ltd. (Australia) | | | 27,550 | | | | 74,271 | | |
LafargeHolcim, Ltd. (Switzerland) | | | 1,292 | | | | 70,662 | | |
| | | | | | 144,933 | | |
HEALTH CARE - 3.2% | |
HEALTH CARE EQUIPMENT & SERVICES - 1.8% | |
Tenet Healthcare Corp. (United States) (b) | | | 1,800 | | | | 43,645 | | |
Koninklijke Philips N.V. (Netherlands) | | | 77 | | | | 2,964 | | |
| | | | | | 46,609 | | |
PHARMACEUTICALS, BIOTECHNOLOGY & LIFE SCIENCES - 1.4% | |
Bayer AG (Germany) | | | 337 | | | | 38,039 | | |
| | | | | | 84,648 | | |
ENERGY - 1.8% | |
National Oilwell Varco, Inc. (United States) | | | 1,251 | | | | 46,035 | | |
CONSUMER STAPLES - 1.5% | |
FOOD, BEVERAGE & TOBACCO - 1.5% | |
Diageo PLC (United Kingdom) | | | 1,167 | | | | 39,502 | | |
TOTAL COMMON STOCKS - 97.0%
(COST $1,883,979) | | | | | 2,535,875 | | |
See accompanying Notes to Financial Statements.
Oakmark.com 25
Oakmark Global Fund March 31, 2018 (Unaudited)
Schedule of Investments (in thousands) (continued)
| | | Par Value | | Value | |
SHORT-TERM INVESTMENT - 2.9% | |
REPURCHASE AGREEMENT - 2.9% | |
Fixed Income Clearing Corp. Repurchase
Agreement, 0.90% dated 03/29/18 due
04/02/18, repurchase price $74,051,
collateralized by a United States
Treasury Inflation Index Note, 0.125%
due 07/15/22 and a United States
Treasury Note, 2.125% due 12/31/21,
aggregate value plus accrued interest
of $75,526 (Cost: $74,043) | | $ | 74,043 | | | $ | 74,043 | | |
TOTAL SHORT-TERM INVESTMENTS - 2.9%
(COST $74,043) | | | | | 74,043 | | |
TOTAL INVESTMENTS - 99.9%
(COST $1,958,022) | | | | | 2,609,918 | | |
Foreign Currencies (Cost $0) - 0.0% (c) | | | | | 0 | (d) | |
Other Assets In Excess of Liabilities - 0.1% | | | | | 3,711 | | |
TOTAL NET ASSETS - 100.0% | | | | $ | 2,613,629 | | |
(a) Sponsored American Depositary Receipt
(b) Non-income producing security
(c) Amount rounds to less than 0.1%.
(d) Amount rounds to less than $1,000.
See accompanying Notes to Financial Statements.
26 OAKMARK FUNDS
Oakmark Global Fund March 31, 2018 (Unaudited)
Schedule of Investments (in thousands) (continued)
FORWARD FOREIGN CURRENCY CONTRACTS
| | | Local
Contract
Amount | | Base
Contract
Amount | | Settlement
Date | | Valuation at
3/31/18 | | Unrealized
Appreciation/
(Depreciation) | |
Foreign Currency Sold: | |
Swiss Franc | | | 59,915 | | | | 63,782 | | | 09/19/18 | | $ | 63,654 | | | $ | 129 | | |
| | | | | | | | | | | | | | | $ | 63,654 | | | $ | 129 | | |
See accompanying Notes to Financial Statements.
Oakmark.com 27
Oakmark Global Select Fund March 31, 2018
Summary Information
VALUE OF A $10,000 INVESTMENT
Since Inception - 10/02/06 (Unaudited)

PERFORMANCE
| | | | Average Annual Total Returns (as of 03/31/18) | | | |
| (Unaudited) | | Total Return
Last 3 Months | | 1-year | | 3-year | | 5-year | | 10-year | | Since
Inception | | Inception
Date | |
Oakmark Global Select Fund (Investor Class) | | | -3.32 | % | | | 10.71 | % | | | 8.60 | % | | | 10.85 | % | | | 10.51 | % | | | 8.60 | % | | 10/02/06 | |
MSCI World Index | | | -1.28 | % | | | 13.59 | % | | | 7.97 | % | �� | | 9.70 | % | | | 5.90 | % | | | 5.76 | % | | | |
Lipper Global Fund Index13 | | | -1.03 | % | | | 13.52 | % | | | 7.82 | % | | | 9.51 | % | | | 5.75 | % | | | 5.74 | % | | | |
Oakmark Global Select Fund (Advisor Class) | | | -3.32 | % | | | 10.75 | % | | | N/A | | | | N/A | | | | N/A | | | | 14.92 | % | | 11/30/16 | |
Oakmark Global Select Fund (Institutional Class) | | | -3.26 | % | | | 10.85 | % | | | N/A | | | | N/A | | | | N/A | | | | 15.00 | % | | 11/30/16 | |
The graph and table do not reflect the deduction of taxes that a shareholder would pay on Fund distributions or the redemption of Fund shares.
Past performance is no guarantee of future results. The performance data quoted represents past performance. Current performance may be lower or higher than the performance data quoted. Total return includes change in share prices and, in each case, includes reinvestment of dividends and capital gain distributions. The investment return and principal value vary so that an investor's shares when redeemed may be worth more or less than the original cost. To obtain the most recent month-end performance, please visit Oakmark.com.
TOP TEN EQUITY HOLDINGS5 | | % of Net Assets | |
Daimler AG | | | 8.0 | | |
Lloyds Banking Group PLC | | | 7.9 | | |
CNH Industrial N.V. | | | 6.1 | | |
TE Connectivity, Ltd. | | | 5.8 | | |
Bank of America Corp. | | | 5.6 | | |
Credit Suisse Group AG | | | 5.5 | | |
Alphabet, Inc., Class C | | | 5.2 | | |
LafargeHolcim, Ltd. | | | 5.1 | | |
WPP PLC | | | 5.1 | | |
MasterCard, Inc., Class A | | | 5.1 | | |
FUND STATISTICS | |
Ticker* | | OAKWX | |
Number of Equity Holdings | | 21 | |
Net Assets | | $2.8 billion | |
Weighted Average Market Cap | | $124.8 billion | |
Median Market Cap | | $54.2 billion | |
Gross Expense Ratio - Investor Class (as of 09/30/17)* | | 1.19% | |
Net Expense Ratio - Investor Class (as of 09/30/17)*† | | 1.12% | |
* This information is related to the Investor Class. Please visit Oakmark.com for information related to the Advisor, Institutional and Service Classes.
† The net expense ratio reflects a contractual advisory fee waiver agreement through January 28, 2019.
SECTOR ALLOCATION | | % of Net Assets | |
Financials | | | 32.4 | | |
Information Technology | | | 21.0 | | |
Consumer Discretionary | | | 16.9 | | |
Industrials | | | 11.0 | | |
Materials | | | 5.1 | | |
Consumer Staples | | | 5.1 | | |
Energy | | | 3.4 | | |
Short-Term Investments and Other | | | 5.1 | | |
GEOGRAPHIC ALLOCATION | |
| | % of Equity | |
Europe | | | 51.9 | | |
United Kingdom | | | 22.6 | | |
Switzerland | | | 18.0 | | |
Germany* | | | 8.5 | | |
France* | | | 2.8 | | |
| | % of Equity | |
North America | | | 48.1 | | |
United States | | | 48.1 | | |
* Euro-currency countries comprise 11.3% of equity investments.
See accompanying Disclosures and Endnotes on page 83.
28 OAKMARK FUNDS
Oakmark Global Select Fund March 31, 2018
Portfolio Manager Commentary


William C. Nygren, CFA
Portfolio Manager
oakwx@oakmark.com
David G. Herro, CFA
Portfolio Manager
oakwx@oakmark.com
Anthony P. Coniaris, CFA
Portfolio Manager
oakwx@oakmark.com
Eric Liu, CFA
Portfolio Manager
oakwx@oakmark.com
The Oakmark Global Select Fund declined 3.3% for the quarter ended March 31, 2018, compared to the MSCI World Index, which declined 1.3%. However, the Fund has returned an average of 8.6% per year since its inception in October 2006, outperforming the MSCI World Index's12 annualized gain of 5.8% over the same period.
Mastercard, the second largest payment system in the U.S., was the top contributor for the quarter. We were pleased with the underlying trends exhibited in Mastercard's fourth-quarter earnings report. A 13% increase in gross dollar volume translated to revenue growth of 15%, thanks to gains in switched transactions (+17%), cross-border growth (+17%) and acquisitions. For the full-year period, 10% gross dollar volume growth translated to 14% organic revenue growth and to 21% adjusted earnings per share growth. We believe that Mastercard can retain the benefits it gained from the recent U.S. tax reform. Management plans to invest a portion of the savings to boost revenue growth and will then return the remainder to shareholders, which will further enhance per share value growth. In our estimation, Mastercard is a great business with years of secular growth ahead that is trading at a discount to our perception of its underlying value.
WPP, a leading global advertising company, was the largest detractor for the quarter. Investors reacted negatively to the company's fiscal 2017 results, reported in March. Account losses from 2016 had an abnormally high negative effect on growth in 2017. The company also announced weaker guidance for 2018. However, management indicated this is primarily due to the poor performance of legacy businesses rather than problems in the company's digital or media divisions. Many developed-market multinational companies are cutting their advertising spending to control costs, which has in turn put pressure on global advertising agencies. WPP has admitted they were slow to recognize this trend and subsequently contain costs, but management will be more diligent to such changes going forward. WPP's media and digital businesses are performing well and have good growth prospects, although the company is facing some short-term pressure. Despite the challenging short-term situation, our investment thesis for WPP is intact, and we used its recent share price weakness to increase our position.
Geographically, 48% of the Fund's holdings were invested in U.S. companies as of March 31, while approximately 52% were allocated to equities in Europe and the U.K.
We continue to believe the Swiss franc is overvalued versus the U.S. dollar. As a result, we defensively hedged a portion of the
Fund's exposure. Approximately 20% of the Swiss franc exposure was hedged at quarter end.
We thank you, our shareholders, for your continued support and confidence.
See accompanying Disclosures and Endnotes on page 83.
Oakmark.com 29
Oakmark Global Select Fund March 31, 2018 (Unaudited)
Schedule of Investments (in thousands)
| | | Shares | | Value | |
COMMON STOCKS - 94.9% | |
FINANCIALS - 32.4% | |
BANKS - 18.3% | |
Lloyds Banking Group PLC (United Kingdom) | | | 245,828 | | | $ | 223,010 | | |
Bank of America Corp. (United States) | | | 5,237 | | | | 157,058 | | |
Citigroup, Inc. (United States) | | | 2,036 | | | | 137,430 | | |
| | | | | | 517,498 | | |
INSURANCE - 8.6% | |
Willis Towers Watson PLC (United States) | | | 812 | | | | 123,593 | | |
American International Group, Inc.
(United States) | | | 2,197 | | | | 119,561 | | |
| | | | | | 243,154 | | |
DIVERSIFIED FINANCIALS - 5.5% | |
Credit Suisse Group AG (Switzerland) | | | 9,308 | | | | 155,685 | | |
| | | | | | 916,337 | | |
INFORMATION TECHNOLOGY - 21.0% | |
SOFTWARE & SERVICES - 15.1% | |
Alphabet, Inc., Class C (United States) (a) | | | 142 | | | | 146,901 | | |
MasterCard, Inc., Class A (United States) | | | 822 | | | | 143,929 | | |
Oracle Corp. (United States) | | | 2,450 | | | | 112,088 | | |
Alphabet, Inc., Class A (United States) (a) | | | 24 | | | | 24,916 | | |
| | | | | | 427,834 | | |
TECHNOLOGY HARDWARE & EQUIPMENT - 5.9% | |
TE Connectivity, Ltd. (United States) | | | 1,654 | | | | 165,224 | | |
| | | | | | 593,058 | | |
CONSUMER DISCRETIONARY - 16.9% | |
AUTOMOBILES & COMPONENTS - 8.0% | |
Daimler AG (Germany) | | | 2,675 | | | | 226,986 | | |
MEDIA - 5.1% | |
WPP PLC (United Kingdom) | | | 9,089 | | | | 144,421 | | |
CONSUMER DURABLES & APPAREL - 3.8% | |
Cie Financiere Richemont SA (Switzerland) | | | 1,194 | | | | 107,095 | | |
| | | | | | 478,502 | | |
INDUSTRIALS - 11.0% | |
CAPITAL GOODS - 8.4% | |
CNH Industrial N.V. (United Kingdom) | | | 14,036 | | | | 173,230 | | |
General Electric Co. (United States) | | | 4,750 | | | | 64,030 | | |
| | | | | | 237,260 | | |
TRANSPORTATION - 2.6% | |
Kuehne + Nagel International AG (Switzerland) | | | 475 | | | | 74,725 | | |
| | | | | | 311,985 | | |
MATERIALS - 5.1% | |
LafargeHolcim, Ltd. (Switzerland) | | | 2,655 | | | | 145,262 | | |
| | | Shares | | Value | |
CONSUMER STAPLES - 5.1% | |
FOOD, BEVERAGE & TOBACCO - 5.1% | |
Danone SA (France) | | | 938 | | | $ | 75,826 | | |
Diageo PLC (United Kingdom) | | | 1,981 | | | | 67,021 | | |
| | | | | | 142,847 | | |
ENERGY - 3.4% | |
Apache Corp. (United States) | | | 2,515 | | | | 96,777 | | |
TOTAL COMMON STOCKS - 94.9%
(COST $2,201,082) | | | | | 2,684,768 | | |
| | | Par Value | | Value | |
SHORT-TERM INVESTMENTS - 4.9% | |
GOVERNMENT AND AGENCY SECURITIES - 2.6% | |
Federal National Mortgage Association,
1.47%, due 04/02/18 (b)
(Cost $74,997) | | $ | 75,000 | | | | 74,997 | | |
REPURCHASE AGREEMENT - 2.3% | |
Fixed Income Clearing Corp. Repurchase
Agreement, 0.90% dated 03/29/18 due
04/02/18, repurchase price $63,734,
collateralized by a United States Treasury
Note, 2.125% due 12/31/21, value
plus accrued interest of $65,005
(Cost: $63,728) | | | 63,728 | | | | 63,728 | | |
TOTAL SHORT-TERM INVESTMENTS - 4.9%
(COST $138,725) | | | | | 138,725 | | |
TOTAL INVESTMENTS - 99.8%
(COST $2,339,807) | | | | | 2,823,493 | | |
Foreign Currencies (Cost $0) - 0.0% (c) | | | | | 0 | (d) | |
Other Assets In Excess of Liabilities - 0.2% | | | | | 5,005 | | |
TOTAL NET ASSETS - 100.0% | | | | $ | 2,828,498 | | |
(a) Non-income producing security
(b) The rate shown represents the annualized yield at the time of purchase; not a coupon rate.
(c) Amount rounds to less than 0.1%.
(d) Amount rounds to less than $1,000.
See accompanying Notes to Financial Statements.
30 OAKMARK FUNDS
Oakmark Global Select Fund March 31, 2018 (Unaudited)
Schedule of Investments (in thousands) (continued)
FORWARD FOREIGN CURRENCY CONTRACTS
| | | Local
Contract
Amount | | Base
Contract
Amount | | Settlement
Date | | Valuation at
3/31/18 | | Unrealized
Appreciation/
(Depreciation) | |
Foreign Currency Sold: | |
Swiss Franc | | | 92,381 | | | $ | 98,344 | | | 09/19/18 | | $ | 98,146 | | | $ | 198 | | |
| | | | | | | | | | | | | | | $ | 98,146 | | | $ | 198 | | |
See accompanying Notes to Financial Statements.
Oakmark.com 31
Oakmark International Fund March 31, 2018
Summary Information
VALUE OF A $10,000 INVESTMENT
Since Inception - 09/30/92 (Unaudited)

PERFORMANCE
| | | | Average Annual Total Returns (as of 03/31/18) | | | |
| (Unaudited) | | Total Return
Last 3 Months | | 1-year | | 3-year | | 5-year | | 10-year | | Since
Inception | | Inception
Date | |
Oakmark International Fund (Investor Class) | | | -2.77 | % | | | 15.29 | % | | | 7.12 | % | | | 8.74 | % | | | 7.91 | % | | | 10.17 | % | | 09/30/92 | |
MSCI World ex U.S. Index | | | -2.04 | % | | | 13.92 | % | | | 5.30 | % | | | 6.04 | % | | | 2.59 | % | | | 6.20 | % | | | |
MSCI EAFE Index15 | | | -1.53 | % | | | 14.80 | % | | | 5.55 | % | | | 6.50 | % | | | 2.74 | % | | | 6.09 | % | | | |
Lipper International Fund Index16 | | | -0.74 | % | | | 16.34 | % | | | 6.29 | % | | | 7.12 | % | | | 3.44 | % | | | 7.12 | % | | | |
Oakmark International Fund (Advisor Class) | | | -2.76 | % | | | 15.41 | % | | | N/A | | | | N/A | | | | N/A | | | | 22.24 | % | | 11/30/16 | |
Oakmark International Fund (Institutional Class) | | | -2.76 | % | | | 15.47 | % | | | N/A | | | | N/A | | | | N/A | | | | 22.29 | % | | 11/30/16 | |
Oakmark International Fund (Service Class) | | | -2.89 | % | | | 14.94 | % | | | 6.77 | % | | | 8.37 | % | | | 7.56 | % | | | 8.55 | % | | 11/04/99 | |
The graph and table above do not reflect the deduction of taxes that a shareholder would pay on Fund distributions or the redemption of Fund shares.
Past performance is no guarantee of future results. The performance data quoted represents past performance. Current performance may be lower or higher than the performance data quoted. Total return includes change in share prices and, in each case, includes reinvestment of dividends and capital gain distributions. The investment return and principal value vary so that an investor's shares when redeemed may be worth more or less than the original cost. To obtain the most recent month-end performance, please visit Oakmark.com.
TOP TEN EQUITY HOLDINGS5 | | % of Net Assets | |
Daimler AG | | | 5.0 | | |
BNP Paribas SA | | | 4.7 | | |
Allianz SE | | | 4.5 | | |
Lloyds Banking Group PLC | | | 4.5 | | |
Bayerische Motoren Werke (BMW) AG | | | 4.5 | | |
Credit Suisse Group AG | | | 3.8 | | |
Intesa Sanpaolo SPA | | | 3.8 | | |
Hennes & Mauritz AB (H&M) - Class B | | | 3.6 | | |
Glencore PLC | | | 3.5 | | |
Toyota Motor Corp. | | | 3.2 | | |
FUND STATISTICS | |
Ticker* | | OAKIX | |
Number of Equity Holdings | | 57 | |
Net Assets | | $46.1 billion | |
Weighted Average Market Cap | | $53.7 billion | |
Median Market Cap | | $26.1 billion | |
Gross Expense Ratio - Investor Class (as of 09/30/17)* | | 1.00% | |
Net Expense Ratio - Investor Class (as of 09/30/17)*† | | 0.95% | |
* This information is related to the Investor Class. Please visit Oakmark.com for information related to the Advisor, Institutional and Service Classes.
† The net expense ratio reflects a contractual advisory fee waiver agreement through January 28, 2019.
SECTOR ALLOCATION | | % of Net Assets | |
Financials | | | 32.0 | | |
Consumer Discretionary | | | 31.8 | | |
Industrials | | | 13.1 | | |
Materials | | | 7.7 | | |
Health Care | | | 4.4 | | |
Consumer Staples | | | 3.2 | | |
Information Technology | | | 2.1 | | |
Energy | | | 0.1 | | |
Short-Term Investments and Other | | | 5.6 | | |
GEOGRAPHIC ALLOCATION | |
| | % of Equity | |
Europe | | | 84.7 | | |
United Kingdom | | | 22.3 | | |
Germany* | | | 20.0 | | |
Switzerland | | | 14.6 | | |
France* | | | 14.1 | | |
Sweden | | | 5.5 | | |
Netherlands* | | | 4.0 | | |
Italy* | | | 4.0 | | |
Ireland* | | | 0.2 | | |
Asia | | | 8.7 | | |
Japan | | | 4.7 | | |
India | | | 1.5 | | |
China | | | 1.1 | | |
| | % of Equity | |
Asia (cont'd) | | | 8.7 | | |
Indonesia | | | 1.0 | | |
Taiwan | | | 0.3 | | |
South Korea | | | 0.1 | | |
Australasia | | | 2.5 | | |
Australia | | | 2.5 | | |
North America | | | 2.2 | | |
United States | | | 2.0 | | |
Canada | | | 0.2 | | |
Latin America | | | 1.0 | | |
Mexico | | | 1.0 | | |
Africa | | | 0.9 | | |
South Africa | | | 0.9 | | |
* Euro-currency countries comprise 42.3% of equity investments.
See accompanying Disclosures and Endnotes on page 83.
32 OAKMARK FUNDS
Oakmark International Fund March 31, 2018
Portfolio Manager Commentary


David G. Herro, CFA
Portfolio Manager
oakix@oakmark.com
Michael L. Manelli, CFA
Portfolio Manager
oakix@oakmark.com
The Oakmark International Fund declined 2.8% for the quarter ended March 31, 2018, underperforming the MSCI World ex U.S. Index14, which declined 2.0% over the same period. However, the Fund has returned an average of 10.2% per year since its inception in September 1992, outperforming the MSCI World ex U.S. Index, which has averaged 6.2% per year over the same period.
Intesa Sanpaolo, an Italian retail and commercial bank, was the top contributor to performance for the quarter. During the quarter, Intesa released fiscal 2017 earnings that exceeded expectations. The company's total amount of non-performing loans declined for the ninth straight quarter, further improving its asset quality, and Intesa's capital position was stronger than expected. The company also announced its new business plan for 2018-2021. At first glance the plan appears ambitious, but we have confidence in CEO Carlo Messina who largely delivered on the previous plan (2013-2017). A few highlights include revenue CAGR of 4%, credit costs declining to pre-crisis levels, net income increasing nearly 60% to E6 billion and a CET1 ratio of 13.1% by 2021. We continue to be impressed by Messina and believe he has great command of both the big picture and the details of the business. We believe Intesa remains an extremely well-run bank, trading at a significant discount to our estimate of intrinsic value.
H&M, a global fashion designer and retailer, was the largest detractor for the quarter. Shares reacted negatively to fiscal 2017 results reported in January. Disappointing fourth-quarter sales and elevated inventory levels led to increased markdowns. H&M didn't have enough of the right product overall or enough of the right product in the right stores, which resulted in poor sell-through. In addition, it seems price grouping projections were apparently incorrect, and there were too many relatively high-cost items that didn't sell. These internal issues amplified the external pressures facing the entire retail sector. Weak sales, combined with gross margin pressure, led to a significant decline in earnings year-over-year. First-quarter numbers reported in March were also weak, though management signaled these results in February at the company's capital markets day (CMD). Also at the CMD, in a show of increased transparency, management provided insight into current performance and highlighted that the online offering was stronger than many expected. The management team provided more detail on plans to grow the like-for-like sales in physical stores and profits over the long term. In the short term, however, we expect conditions to remain challenging. The second half of fiscal 2018 will be a critical period for H&M's evolution and for determining if their many initiatives will be successful. Despite H&M's performance, management's guidance still indicates improved results and a slight increase in EBIT during the year.
H&M has been a frustrating investment, but we believe management is making progress and that the investment will reward shareholders in the long term.
During the quarter, we sold our position in Infosys (India), Kering (France) and Komatsu (Japan) and added four new names to the portfolio: Bayer (Germany), a leading global agricultural, pharmaceutical and consumer health company; Cenovus Energy (Canada), an integrated oil and gas company; Naspers (South Africa), a media and internet conglomerate; and Ryanair Holdings (Ireland), the leading ultra-low cost carrier in Europe.
Geographically, we ended the quarter with 85% of our holdings in Europe, 5% in Japan and 3% in Australia. The remaining positions are in the U.S., Mexico, Canada, India, China, Indonesia, Taiwan, South Korea and South Africa.
We continue to believe the Swiss franc is overvalued versus the U.S. dollar. As a result, we defensively hedged a portion of the Fund's exposure. Approximately 20% of the Swiss franc exposure was hedged at quarter end.
We continue to focus on finding attractive, undervalued international companies with management teams focused on building shareholder value. We thank you for your support.
See accompanying Disclosures and Endnotes on page 83.
Oakmark.com 33
Oakmark International Fund March 31, 2018 (Unaudited)
Schedule of Investments (in thousands)
| | | Shares | | Value | |
COMMON STOCKS - 94.4% | |
FINANCIALS - 32.0% | |
BANKS - 17.4% | |
BNP Paribas SA (France) | | | 29,422 | | | $ | 2,178,317 | | |
Lloyds Banking Group PLC
(United Kingdom) | | | 2,304,460 | | | | 2,090,561 | | |
Intesa Sanpaolo SPA (Italy) | | | 478,390 | | | | 1,738,533 | | |
Royal Bank of Scotland Group PLC
(United Kingdom) (a) | | | 252,499 | | | | 916,816 | | |
Axis Bank, Ltd. (India) | | | 84,027 | | | | 657,696 | | |
Bank Mandiri Persero Tbk PT (Indonesia) | | | 801,384 | | | | 446,749 | | |
| | | | | | 8,028,672 | | |
DIVERSIFIED FINANCIALS - 8.2% | |
Credit Suisse Group AG (Switzerland) | | | 105,003 | | | | 1,756,270 | | |
EXOR N.V. (Netherlands) (b) | | | 13,271 | | | | 942,496 | | |
AMP, Ltd. (Australia) | | | 145,462 | | | | 557,491 | | |
Schroders PLC (United Kingdom) | | | 11,263 | | | | 504,391 | | |
Schroders PLC, Non-Voting (United Kingdom) | | | 31 | | | | 1,003 | | |
| | | | | | 3,761,651 | | |
INSURANCE - 6.4% | |
Allianz SE (Germany) | | | 9,278 | | | | 2,093,625 | | |
Willis Towers Watson PLC (United States) | | | 5,789 | | | | 880,975 | | |
| | | | | | 2,974,600 | | |
| | | | | | 14,764,923 | | |
CONSUMER DISCRETIONARY - 31.8% | |
AUTOMOBILES & COMPONENTS - 17.1% | |
Daimler AG (Germany) | | | 27,134 | | | | 2,302,686 | | |
Bayerische Motoren Werke AG (Germany) | | | 19,272 | | | | 2,090,310 | | |
Toyota Motor Corp. (Japan) | | | 22,907 | | | | 1,472,973 | | |
Continental AG (Germany) | | | 4,020 | | | | 1,109,452 | | |
Valeo SA (France) (b) | | | 13,955 | | | | 921,076 | | |
| | | | | | 7,896,497 | | |
MEDIA - 8.4% | |
Publicis Groupe SA (France) (b) | | | 15,236 | | | | 1,060,695 | | |
WPP PLC (United Kingdom) | | | 59,575 | | | | 946,588 | | |
Liberty Global PLC, Class C
(United Kingdom) (a) | | | 23,799 | | | | 724,203 | | |
Grupo Televisa SAB (Mexico) (c) | | | 27,033 | | | | 431,446 | | |
Naspers, Ltd. (South Africa) | | | 1,654 | | | | 404,119 | | |
Liberty Global PLC, Class A
(United Kingdom) (a) | | | 9,398 | | | | 294,236 | | |
| | | | | | 3,861,287 | | |
RETAILING - 3.6% | |
Hennes & Mauritz AB (H&M) - Class B
(Sweden) (b) (d) | | | 109,244 | | | | 1,637,782 | | |
CONSUMER DURABLES & APPAREL - 2.7% | |
Cie Financiere Richemont SA (Switzerland) | | | 9,099 | | | | 816,232 | | |
The Swatch Group AG, Bearer Shares
(Switzerland) | | | 972 | | | | 428,453 | | |
| | | | | | 1,244,685 | | |
| | | | | | 14,640,251 | | |
| | | Shares | | Value | |
INDUSTRIALS - 13.1% | |
CAPITAL GOODS - 8.8% | |
CNH Industrial N.V. (United Kingdom) (b) | | | 113,022 | | | $ | 1,394,852 | | |
Safran SA (France) | | | 5,954 | | | | 629,877 | | |
SKF AB, Class B (Sweden) (b) (d) | | | 26,996 | | | | 551,239 | | |
Ashtead Group PLC (United Kingdom) (b) | | | 18,664 | | | | 508,010 | | |
Smiths Group PLC (United Kingdom) | | | 18,498 | | | | 392,784 | | |
Meggitt PLC (United Kingdom) (b) | | | 45,818 | | | | 277,571 | | |
Volvo AB, Class B (Sweden) (d) | | | 10,272 | | | | 187,301 | | |
Ferguson PLC (United Kingdom) | | | 1,659 | | | | 124,596 | | |
| | | | | | 4,066,230 | | |
COMMERCIAL & PROFESSIONAL SERVICES - 3.2% | |
Experian PLC (United Kingdom) | | | 28,706 | | | | 619,223 | | |
Bureau Veritas SA (France) (b) | | | 19,197 | | | | 498,645 | | |
G4S PLC (United Kingdom) (b) | | | 103,817 | | | | 361,371 | | |
| | | | | | 1,479,239 | | |
TRANSPORTATION - 1.1% | |
Kuehne + Nagel International AG (Switzerland) | | | 2,475 | | | | 389,144 | | |
Ryanair Holdings PLC (Ireland) (a) (c) | | | 859 | | | | 105,521 | | |
| | | | | | 494,665 | | |
| | | | | | 6,040,134 | | |
MATERIALS - 7.7% | |
Glencore PLC (Switzerland) | | | 322,244 | | | | 1,599,561 | | |
LafargeHolcim, Ltd. (Switzerland) | | | 22,788 | | | | 1,246,663 | | |
Orica, Ltd. (Australia) (b) | | | 37,811 | | | | 515,769 | | |
Akzo Nobel N.V. (Netherlands) | | | 1,757 | | | | 165,864 | | |
| | | | | | 3,527,857 | | |
HEALTH CARE - 4.4% | |
PHARMACEUTICALS, BIOTECHNOLOGY & LIFE SCIENCES - 2.5% | |
Bayer AG (Germany) | | | 9,870 | | | | 1,114,770 | | |
Sanofi (France) | | | 839 | | | | 67,403 | | |
| | | | | | 1,182,173 | | |
HEALTH CARE EQUIPMENT & SERVICES - 1.9% | |
Olympus Corp. (Japan) | | | 15,340 | | | | 579,563 | | |
Koninklijke Philips N.V. (Netherlands) | | | 7,504 | | | | 287,772 | | |
| | | | | | 867,335 | | |
| | | | | | 2,049,508 | | |
CONSUMER STAPLES - 3.2% | |
FOOD, BEVERAGE & TOBACCO - 3.2% | |
Diageo PLC (United Kingdom) | | | 16,867 | | | | 570,772 | | |
Danone SA (France) | | | 6,118 | | | | 494,800 | | |
Pernod Ricard SA (France) | | | 1,843 | | | | 306,636 | | |
Nestlé SA (Switzerland) | | | 1,335 | | | | 105,573 | | |
| | | | | | 1,477,781 | | |
INFORMATION TECHNOLOGY - 2.1% | |
SOFTWARE & SERVICES - 1.0% | |
Baidu, Inc. (China) (a) (c) | | | 2,177 | | | | 485,814 | | |
See accompanying Notes to Financial Statements.
34 OAKMARK FUNDS
Oakmark International Fund March 31, 2018 (Unaudited)
Schedule of Investments (in thousands) (continued)
| | | Shares | | Value | |
COMMON STOCKS - 94.4% (continued) | |
INFORMATION TECHNOLOGY - 2.1% (continued) | |
SEMICONDUCTORS & SEMICONDUCTOR EQUIPMENT - 1.0% | |
ASML Holding N.V. (Netherlands) | | | 1,795 | | | $ | 353,624 | | |
Taiwan Semiconductor Manufacturing
Co., Ltd. (Taiwan) | | | 12,074 | | | | 101,041 | | |
| | | | | | 454,665 | | |
TECHNOLOGY HARDWARE & EQUIPMENT - 0.1% | |
Samsung Electronics Co., Ltd. (South Korea) | | | 20 | | | | 45,417 | | |
| | | | | | 985,896 | | |
ENERGY - 0.1% | |
Cenovus Energy, Inc. (Canada) | | | 7,961 | | | | 67,786 | | |
TOTAL COMMON STOCKS - 94.4%
(COST $38,731,194) | | | | | 43,554,136 | | |
| | | Par Value | | Value | |
SHORT-TERM INVESTMENTS - 6.3% | |
U.S. GOVERNMENT BILL - 2.4% | |
United States Treasury Bill,
1.52% - 1.75%, due
04/12/18 - 06/21/18 (e)
(Cost $1,097,521) | | $ | 1,100,000 | | | | 1,097,580 | | |
GOVERNMENT AND AGENCY SECURITIES - 2.2% | |
Federal National Mortgage Association,
1.47%, due 04/02/18 - 04/03/18 (e)
(Cost $999,960) | | | 1,000,000 | | | | 999,960 | | |
COMMERCIAL PAPER - 1.2% | |
Toyota Motor Credit Corp.,
1.71% - 1.99%, due
04/10/18 - 05/18/18 (e) | | | 150,000 | | | | 149,789 | | |
J.P. Morgan Securities LLC,
2.04% - 2.1%, due
05/23/18 - 05/29/18 (e) | | | 100,000 | | | | 99,678 | | |
General Mills, Inc., 144A,
1.93% - 2.08%, due
04/05/18 - 04/20/18 (e) (f) | | | 90,000 | | | | 89,952 | | |
Anthem, Inc., 144A,
2.30% - 2.34%, due
04/11/18 - 04/19/18 (e) (f) | | | 85,000 | | | | 84,923 | | |
Abbvie, Inc., 144A,
1.88%, due 04/02/18 (e) (f) | | | 50,000 | | | | 49,997 | | |
Chevron Corp., 144A,
1.71%, due 04/04/18 (e) (f) | | | 50,000 | | | | 49,993 | | |
Kraft Food Group, Inc., 144A,
1.82%, due 04/09/18 (e) (f) | | | 25,000 | | | | 24,990 | | |
Total Commercial Paper
(Cost $549,334) | | | | | 549,322 | | |
| | | Par Value | | Value | |
REPURCHASE AGREEMENT - 0.5% | |
Fixed Income Clearing Corp. Repurchase
Agreement, 0.90% dated 03/29/18 due
04/02/18, repurchase price $228,059,
collateralized by United States
Treasury Notes, 2.000% - 2.125%
due 11/15/21 - 12/31/21, aggregate
value plus accrued interest of $232,598
(Cost: $228,036) | | $ | 228,036 | | | $ | 228,036 | | |
TOTAL SHORT-TERM INVESTMENTS - 6.3%
(COST $2,874,851) | | | | | 2,874,898 | | |
TOTAL INVESTMENTS - 100.7%
(COST $41,606,045) | | | | | 46,429,034 | | |
Foreign Currencies (Cost $17,006) - 0.0% (g) | | | | | 17,007 | | |
Liabilities In Excess of Other Assets - (0.7)% | | | | | (330,968 | ) | |
TOTAL NET ASSETS - 100.0% | | | | $ | 46,115,073 | | |
(a) Non-income producing security
(b) See Note 5 in the Notes to Financial Statements regarding investments in affiliated issuers.
(c) Sponsored American Depositary Receipt
(d) A portion of the security out on loan.
(e) The rate shown represents the annualized yield at the time of purchase; not a coupon rate.
(f) See Note 1 in the Notes to Financial Statements regarding restricted securities. These securities may be resold subject to restrictions on resale under federal securities law.
(g) Amount rounds to less than 0.1%.
See accompanying Notes to Financial Statements.
Oakmark.com 35
Oakmark International Fund March 31, 2018 (Unaudited)
Schedule of Investments (in thousands) (continued)
FORWARD FOREIGN CURRENCY CONTRACTS
| | | Local
Contract
Amount | | Base
Contract
Amount | | Settlement
Date | | Valuation at
3/31/18 | | Unrealized
Appreciation/
(Depreciation) | |
Foreign Currency Sold: | |
Swiss Franc | | | 917,182 | | | | 976,385 | | | 09/19/18 | | $ | 974,415 | | | $ | 1,970 | | |
| | | | | | | | | | | | | | | $ | 974,415 | | | $ | 1,970 | | |
SCHEDULE OF TRANSACTIONS WITH AFFILIATED ISSUERS
Purchase and sale transactions and dividend and interest income earned during the period on these securities are set forth below (in thousands). The industry, country, or geographic region for each of the below affiliates can be found in the Schedule of Investments.
Affiliates | | Shares
Held | | Purchases
(Cost) | | Sales
(Proceeds) | | Realized
Gain/(Loss) | | Change in
Unrealized | | Dividend
Income | | Value
September 30,
2017 | | Value
March 31,
2018 | | Percent of
Net Assets | |
Ashtead Group PLC (a) | | | 18,664 | | | $ | 82,733 | | | $ | 296,818 | | | $ | 152,067 | | | $ | (90,706 | ) | | $ | 1,207 | | | $ | 660,733 | | | $ | 508,010 | | | | 1.1 | % | |
Bureau Veritas SA (a) | | | 19,197 | | | | — | | | | 152,399 | | | | 26,953 | | | | (16,651 | ) | | | 0 | | | | 640,741 | | | | 498,645 | | | | 1.1 | % | |
CNH Industrial N.V. | | | 113,022 | | | | 236,115 | | | | 22,960 | | | | 3,866 | | | | 11,102 | | | | 0 | | | | 1,166,730 | | | | 1,394,852 | | | | 3.0 | % | |
EXOR N.V. | | | 13,271 | | | | 63,893 | | | | — | | | | 0 | | | | 102,708 | | | | 0 | | | | 775,895 | | | | 942,496 | | | | 2.0 | % | |
G4S PLC | | | 103,817 | | | | 138,850 | | | | — | | | | 0 | | | | (16,576 | ) | | | 0 | | | | 239,098 | | | | 361,372 | | | | 0.8 | % | |
Hennes & Mauritz
AB (H&M) - Class B | | | 109,244 | | | | 1,095,816 | | | | — | | | | 0 | | | | (877,137 | ) | | | 35,109 | | | | 1,419,102 | | | | 1,637,782 | | | | 3.6 | % | |
Meggitt PLC | | | 45,818 | | | | 24,501 | | | | — | | | | 0 | | | | (40,731 | ) | | | 6,975 | | | | 293,801 | | | | 277,571 | | | | 0.6 | % | |
Orica, Ltd. | | | 37,811 | | | | 69,685 | | | | 0 | | | | 0 | | | | (64,910 | ) | | | 7,030 | | | | 510,994 | | | | 515,769 | | | | 1.1 | % | |
Publicis Groupe SA | | | 15,236 | | | | 220,979 | | | | 40,606 | | | | 1,303 | | | | (3,209 | ) | | | 0 | | | | 882,229 | | | | 1,060,695 | | | | 2.3 | % | |
| SKF AB, Class B | | | 26,996 | | | | 24,441 | | | | — | | | | 0 | | | | (39,404 | ) | | | 17,883 | | | | 566,203 | | | | 551,239 | | | | 1.2 | % | |
Valeo SA | | | 13,955 | | | | 415,832 | | | | 60,146 | | | | 17,084 | | | | (97,018 | ) | | | 0 | | | | 645,324 | | | | 921,076 | | | | 2.0 | % | |
TOTAL | | | 517,031 | | | $ | 2,372,845 | | | $ | 572,929 | | | $ | 201,273 | | | $ | (1,132,532 | ) | | $ | 68,204 | | | $ | 7,800,850 | | | $ | 8,669,507 | | | | 18.8 | % | |
(a) Due to transactions during the period ended March 31, 2018, the company is no longer an affiliate.
See accompanying Notes to Financial Statements.
36 OAKMARK FUNDS

This page intentionally left blank.
Oakmark.com 37
Oakmark International Small Cap Fund March 31, 2018
Summary Information
VALUE OF A $10,000 INVESTMENT
Since 3/31/08 (Unaudited)

PERFORMANCE
| | | | Average Annual Total Returns (as of 03/31/18) | | | |
| (Unaudited) | | Total Return
Last 3 Months | | 1-year | | 3-year | | 5-year | | 10-year | | Since
Inception | | Inception
Date | |
Oakmark International Small Cap Fund (Investor Class) | | | -3.38 | % | | | 11.15 | % | | | 6.11 | % | | | 7.74 | % | | | 6.22 | % | | | 9.62 | % | | 11/01/95 | |
MSCI World ex U.S. Small Cap Index | | | -0.50 | % | | | 21.16 | % | | | 11.30 | % | | | 9.71 | % | | | 5.81 | % | | | N/A | | | | |
MSCI World ex U.S. Index14 | | | -2.04 | % | | | 13.92 | % | | | 5.30 | % | | | 6.04 | % | | | 2.59 | % | | | 5.44 | % | | | |
Lipper International Small Cap Fund Index18 | | | 0.44 | % | | | 22.60 | % | | | 10.51 | % | | | 9.89 | % | | | 6.17 | % | | | N/A | | | | |
Oakmark International Small Cap Fund (Advisor Class) | | | -3.38 | % | | | 11.19 | % | | | N/A | | | | N/A | | | | N/A | | | | 18.81 | % | | 11/30/16 | |
Oakmark International Small Cap Fund (Institutional Class) | | | -3.38 | % | | | 11.30 | % | | | N/A | | | | N/A | | | | N/A | | | | 18.90 | % | | 11/30/16 | |
Oakmark International Small Cap Fund (Service Class) | | | -3.51 | % | | | 10.79 | % | | | 5.82 | % | | | 7.40 | % | | | 5.92 | % | | | 9.80 | % | | 01/08/01 | |
The graph and table do not reflect the deduction of taxes that a shareholder would pay on Fund distributions or the redemption of Fund shares.
Past performance is no guarantee of future results. The performance data quoted represents past performance. Current performance may be lower or higher than the performance data quoted. Total return includes change in share prices and, in each case, includes reinvestment of dividends and capital gain distributions. The investment return and principal value vary so that an investor's shares when redeemed may be worth more or less than the original cost. The performance of the Fund does not reflect the 2% redemption fee imposed on shares redeemed within 90 days of purchase. To obtain the most recent month-end performance, please visit Oakmark.com.
TOP TEN EQUITY HOLDINGS5 | | % of Net Assets | |
Azimut Holding SPA | | | 4.1 | | |
IWG PLC | | | 4.1 | | |
BNK Financial Group, Inc. | | | 4.0 | | |
Sugi Holdings Co., Ltd. | | | 3.6 | | |
Incitec Pivot, Ltd. | | | 3.2 | | |
Konecranes OYJ | | | 3.2 | | |
Travis Perkins PLC | | | 3.0 | | |
DGB Financial Group, Inc. | | | 2.9 | | |
Ontex Group N.V. | | | 2.9 | | |
Howden Joinery Group PLC | | | 2.7 | | |
FUND STATISTICS | |
Ticker* | | OAKEX | |
Number of Equity Holdings | | 58 | |
Net Assets | | $2.9 billion | |
Weighted Average Market Cap | | $3.8 billion | |
Median Market Cap | | $2.8 billion | |
Gross Expense Ratio - Investor Class (as of 09/30/17)* | | 1.36% | |
Net Expense Ratio - Investor Class (as of 09/30/17)* | | 1.36% | |
* This information is related to the Investor Class. Please visit Oakmark.com for information related to the Advisor, Institutional and Service Classes.
SECTOR ALLOCATION | | % of Net Assets | |
Industrials | | | 36.2 | | |
Financials | | | 19.2 | | |
Consumer Discretionary | | | 14.4 | | |
Information Technology | | | 6.5 | | |
Consumer Staples | | | 6.5 | | |
Materials | | | 4.2 | | |
Health Care | | | 4.0 | | |
Telecommunication Services | | | 2.4 | | |
Real Estate | | | 1.7 | | |
Short-Term Investments and Other | | | 4.9 | | |
GEOGRAPHIC ALLOCATION | |
| | % of Equity | |
Europe | | | 66.2 | | |
United Kingdom | | | 19.8 | | |
Switzerland | | | 10.5 | | |
Italy* | | | 6.3 | | |
Finland* | | | 5.8 | | |
Netherlands* | | | 5.4 | | |
France* | | | 4.7 | | |
Belgium | | | 3.0 | | |
Spain* | | | 2.3 | | |
Norway | | | 2.3 | | |
Portugal | | | 1.8 | | |
Turkey | | | 1.4 | | |
Greece* | | | 1.0 | | |
Denmark | | | 1.0 | | |
Germany* | | | 0.9 | | |
| | % of Equity | |
Asia | | | 17.3 | | |
South Korea | | | 7.4 | | |
Japan | | | 7.1 | | |
Indonesia | | | 2.5 | | |
China | | | 0.3 | | |
Australasia | | | 9.6 | | |
Australia | | | 7.4 | | |
New Zealand | | | 2.2 | | |
Latin America | | | 3.5 | | |
Mexico | | | 3.0 | | |
Brazil | | | 0.5 | | |
North America | | | 3.4 | | |
Canada | | | 3.0 | | |
United States | | | 0.4 | | |
* Euro-currency countries comprise 26.4% of equity investments.
See accompanying Disclosures and Endnotes on page 83.
38 OAKMARK FUNDS
Oakmark International Small Cap Fund March 31, 2018
Portfolio Manager Commentary


David G. Herro, CFA
Portfolio Manager
oakex@oakmark.com
Michael L. Manelli, CFA
Portfolio Manager
oakex@oakmark.com
Justin D. Hance, CFA
Portfolio Manager
oakex@oakmark.com
The Oakmark International Small Cap Fund declined 3.4% for the quarter ended March 31, 2018, underperforming the MSCI World ex U.S. Small Cap Index17, which declined 0.5% for the same period. Since the Fund's inception in November 1995, it has returned an average of 9.6%, annualized.
The largest contributor to the Fund for the quarter was U.K.-based PageGroup, a provider of permanent, contract and temporary recruitment focused on the white-collar market. The company has significantly benefited from the strengthening global economy. In Page's most recent quarter, it posted double-digit growth in gross profits in every region, except the U.K. Given the company's significant exposure to the permanent placement market—a high-margin business—we believe that strong top-line trends will continue to grow Page's profits in the coming years. Although we modestly reduced our weighting in Page during the quarter due to the share price appreciation, it still remains a significant holding of the Fund.
The largest detractor from performance for the quarter was Element Fleet Management. Based in Canada, Element offers acquisition, servicing and financing services for vehicles spanning from cars and trucks to municipal and industrial fleets. Element serves customers in the U.S. and Canada, including companies ranging from agriculture and manufacturing to pharmaceutical and health care.
Many factors hurt Element's stock performance during the quarter. First, in early February, Element announced the completion of its strategic review and informed the market it was no longer looking to sell the company. The same release also stated that 2018 fleet operating income would decline by 3-5%, due to increased customer attrition, and that CEO Bradley Nullmeyer would be retiring from his management position, including his seat on the board. The first two items were clearly negative and investors reacted accordingly. We view the CEO change as a positive step, however, given that the legacy management bungled the GE integration having not achieved the expected level of synergies, which resulted in customer attrition. In addition, management lost focus on the core fleet management business to pursue growth in less value-added areas. COO Dan Jauernig was announced as an interim CEO and the board is expected to announce a permanent CEO when its search concludes in the next few months. We spoke with Board Chairman Brian Tobin post the February announcement (and again in March) and continue to support his efforts to refocus on the core fleet management operations, improve the management team and increase the number of independent board members.
To our surprise, further bad news surfaced in mid-March when Element reported its fiscal-year results. Although the company's core operations performed in-line with our estimates, losses from 19th Capital, a non-core joint venture that involves leasing highway tractors and trucks in the U.S., resulted in higher
than expected debt levels. Moreover, insufficient disclosure surrounding the 19th Capital joint venture has resulted in increased uncertainty about the value of these assets. We agree with the view that these non-core losses have stretched Element's balance sheet, but we believe the company can still pursue several options that would improve its capital position. Moreover, Element's non-core segments account for only 6% of its assets and the problematic 19th Capital joint venture accounts for less than 5%. Because these non-core businesses are such a small part of Element's operation, we believe that the company can contain the damages to its balance sheet.
Although Element has so far been a frustrating investment, the company still possesses a strong competitive position and has the dominant fleet management platform in North America. Element's scale advantage should enable it to provide an unsurpassed value proposition to its clients and a new management team and enhanced board oversight should lead to better execution. Although there remains uncertainty about the value of non-core joint venture assets and the company's balance sheet is more leveraged than we would like, we believe Element's extremely discounted valuation adequately compensates us for these risks.
We initiated positions in two new holdings this quarter: Babcock International Group and Dignity, both of which are headquartered in the U.K. Babcock International provides engineering services for a range of government bodies and private sector customers in the U.K. and across the globe. The company manages, maintains, upgrades and operates complex infrastructure and essential equipment. These services tend to be highly technical and complex and are geared toward customers who require a high level of security clearances. The other new holding, Dignity, is the leading provider of funeral services and pre-paid funeral plans in the U.K. The company operates nearly 800 funeral homes and holds over 10% share of the market in the U.K. We eliminated positions in Bucher Industries (Switzerland), Finning International (Canada), Melco International Development (Hong Kong), OTSUKA CORP (Japan) and Wirecard (Germany) during the quarter.
Geographically, we ended the quarter with 17% of our holdings in Asia, 66% in Europe and the U.K., and 10% in Australasia. The remaining positions are 3% in North America (Canada and the U.S.) and 4% in Latin America (Mexico and Brazil).
We continue to believe the Swiss franc and Norwegian krone are overvalued versus the U.S. dollar. As a result, we defensively hedged 20% of the Fund's Swiss franc exposure and increased the Fund's krone exposure hedged to 25%.
Thank you for your continued confidence and support.
See accompanying Disclosures and Endnotes on page 83.
Oakmark.com 39
Oakmark International Small Cap Fund March 31, 2018 (Unaudited)
Schedule of Investments (in thousands)
| | | Shares | | Value | |
COMMON STOCKS - 95.1% | |
INDUSTRIALS - 36.2% | |
COMMERCIAL & PROFESSIONAL SERVICES - 16.9% | |
IWG PLC (Switzerland) | | | 37,113 | | | $ | 119,083 | | |
Pagegroup PLC (United Kingdom) | | | 8,763 | | | | 65,956 | | |
Applus Services SA (Spain) | | | 4,942 | | | | 64,336 | | |
Randstad Holding N.V. (Netherlands) | | | 877 | | | | 57,625 | | |
Mitie Group PLC (United Kingdom) (a) | | | 24,331 | | | | 54,277 | | |
Babcock International Group PLC
(United Kingdom) | | | 4,931 | | | | 46,271 | | |
Hays PLC (United Kingdom) | | | 14,869 | | | | 39,283 | | |
SThree PLC (United Kingdom) | | | 6,352 | | | | 28,784 | | |
Brunel International N.V. (Netherlands) | | | 799 | | | | 14,636 | | |
ALS, Ltd. (Australia) | | | 657 | | | | 3,745 | | |
| | | | | | 493,996 | | |
CAPITAL GOODS - 15.7% | |
Konecranes OYJ (Finland) | | | 2,164 | | | | 93,851 | | |
Travis Perkins PLC (United Kingdom) | | | 5,047 | | | | 87,374 | | |
Howden Joinery Group PLC (United Kingdom) | | | 12,064 | | | | 77,991 | | |
Metso OYJ (Finland) | | | 2,058 | | | | 64,842 | | |
Sulzer AG (Switzerland) | | | 302 | | | | 39,694 | | |
Morgan Advanced Materials PLC
(United Kingdom) | | | 8,617 | | | | 38,493 | | |
MTU Aero Engines AG (Germany) | | | 154 | | | | 25,939 | | |
Wajax Corp. (Canada) (a) | | | 1,071 | | | | 20,241 | | |
dormakaba Holding AG (Switzerland) | | | 11 | | | | 8,846 | | |
Outotec OYJ (Finland) (b) | | | 459 | | | | 4,100 | | |
| | | | | | 461,371 | | |
TRANSPORTATION - 3.6% | |
Freightways, Ltd. (New Zealand) | | | 5,118 | | | | 28,001 | | |
Controladora Vuela Cia de Aviacion
SAB de CV (Mexico) (b) (c) | | | 3,391 | | | | 27,637 | | |
DSV AS (Denmark) | | | 345 | | | | 27,020 | | |
Panalpina Welttransport Holding AG
(Switzerland) | | | 186 | | | | 23,482 | | |
| | | | | | 106,140 | | |
| | | | | | 1,061,507 | | |
FINANCIALS - 19.2% | |
DIVERSIFIED FINANCIALS - 12.2% | |
Azimut Holding SPA (Italy) | | | 5,553 | | | | 119,185 | | |
Julius Baer Group, Ltd. (Switzerland) | | | 1,219 | | | | 74,893 | | |
Element Fleet Management Corp. (Canada) (a) | | | 19,206 | | | | 61,866 | | |
Haci Omer Sabanci Holding AS (Turkey) | | | 14,624 | | | | 38,845 | | |
Standard Life Aberdeen PLC (United Kingdom) | | | 6,927 | | | | 34,960 | | |
EFG International AG (Switzerland) | | | 3,442 | | | | 27,545 | | |
| | | | | | 357,294 | | |
BANKS - 7.0% | |
BNK Financial Group, Inc. (South Korea) | | | 12,170 | | | | 121,595 | | |
DGB Financial Group, Inc. (South Korea) | | | 7,810 | | | | 85,362 | | |
| | | | | | 206,957 | | |
| | | | | | 564,251 | | |
| | | Shares | | Value | |
CONSUMER DISCRETIONARY - 14.4% | |
MEDIA - 9.0% | |
Criteo SA (France) (b) (c) | | | 2,477 | | | $ | 64,011 | | |
Megacable Holdings SAB de CV (Mexico) | | | 12,020 | | | | 55,517 | | |
NOS SGPS SA (Portugal) | | | 8,689 | | | | 51,209 | | |
Hakuhodo DY Holdings, Inc. (Japan) | | | 3,336 | | | | 45,554 | | |
SKY Network Television, Ltd. (New Zealand) | | | 19,357 | | | | 32,035 | | |
APN Outdoor Group, Ltd. (Australia) | | | 4,171 | | | | 14,864 | | |
| | | | | | 263,190 | | |
RETAILING - 2.6% | |
GrandVision N.V. (Netherlands) | | | 3,380 | | | | 77,028 | | |
CONSUMER DURABLES & APPAREL - 1.8% | |
Salvatore Ferragamo SPA (Italy) (d) | | | 1,604 | | | | 44,241 | | |
Cosmo Lady China Holdings Co., Ltd. (China) | | | 16,244 | | | | 8,796 | | |
| | | | | | 53,037 | | |
CONSUMER SERVICES - 1.0% | |
Dignity PLC (United Kingdom) | | | 2,412 | | | | 29,595 | | |
| | | | | | 422,850 | | |
INFORMATION TECHNOLOGY - 6.5% | |
TECHNOLOGY HARDWARE & EQUIPMENT - 3.8% | |
Ingenico Group SA (France) | | | 816 | | | | 66,162 | | |
Hirose Electric Co., Ltd. (Japan) | | | 336 | | | | 45,898 | | |
| | | | | | 112,060 | | |
SOFTWARE & SERVICES - 2.7% | |
Atea ASA (Norway) (a) | | | 3,931 | | | | 63,785 | | |
Totvs SA (Brazil) | | | 1,712 | | | | 14,939 | | |
| | | | | | 78,724 | | |
| | | | | | 190,784 | | |
CONSUMER STAPLES - 6.5% | |
FOOD & STAPLES RETAILING - 3.6% | |
Sugi Holdings Co., Ltd. (Japan) | | | 1,903 | | | | 106,223 | | |
HOUSEHOLD & PERSONAL PRODUCTS - 2.9% | |
Ontex Group N.V. (Belgium) | | | 3,138 | | | | 83,861 | | |
| | | | | | 190,084 | | |
MATERIALS - 4.2% | |
Incitec Pivot, Ltd. (Australia) | | | 34,884 | | | | 94,043 | | |
Titan Cement Co. SA (Greece) | | | 1,181 | | | | 29,287 | | |
| | | | | | 123,330 | | |
HEALTH CARE - 4.0% | |
HEALTH CARE EQUIPMENT & SERVICES - 3.6% | |
Primary Health Care, Ltd. (Australia) (a) | | | 21,440 | | | | 64,222 | | |
Ansell, Ltd. (Australia) | | | 1,560 | | | | 30,269 | | |
Amplifon SPA (Italy) | | | 628 | | | | 11,169 | | |
| | | | | | 105,660 | | |
PHARMACEUTICALS, BIOTECHNOLOGY & LIFE SCIENCES - 0.4% | |
QIAGEN N.V. (United States) (b) | | | 383 | | | | 12,359 | | |
| | | | | | 118,019 | | |
See accompanying Notes to Financial Statements.
40 OAKMARK FUNDS
Oakmark International Small Cap Fund March 31, 2018 (Unaudited)
Schedule of Investments (in thousands) (continued)
| | | Shares | | Value | |
COMMON STOCKS - 95.1% (continued) | |
TELECOMMUNICATION SERVICES - 2.4% | |
Tower Bersama Infrastructure Tbk PT
(Indonesia) | | | 108,063 | | | $ | 43,759 | | |
Sarana Menara Nusantara Tbk PT (Indonesia) | | | 96,021 | | | | 24,969 | | |
| | | | | | 68,728 | | |
REAL ESTATE - 1.7% | |
LSL Property Services PLC
(United Kingdom) (a) | | | 10,024 | | | | 31,502 | | |
Countrywide PLC (United Kingdom) (a) (b) | | | 12,249 | | | | 18,148 | | |
| | | | | | 49,650 | | |
TOTAL COMMON STOCKS - 95.1%
(COST $2,758,283) | | | | | 2,789,203 | | |
| | | Par Value | | Value | |
SHORT-TERM INVESTMENTS - 4.2% | |
GOVERNMENT AND AGENCY SECURITIES - 2.5% | |
Federal National Mortgage Association,
1.47%, due 04/02/18 (e)
(Cost $74,997) | | $ | 75,000 | | | | 74,997 | | |
REPURCHASE AGREEMENT - 1.7% | |
Fixed Income Clearing Corp. Repurchase
Agreement, 0.90% dated 03/29/18 due
04/02/18, repurchase price $50,557,
collateralized by a United States
Treasury Note, 2.125%, due 12/31/21,
value plus accrued interest of $51,566
(Cost: $50,552) | | | 50,552 | | | | 50,552 | | |
TOTAL SHORT-TERM INVESTMENTS - 4.2%
(COST $125,549) | | | | | 125,549 | | |
TOTAL INVESTMENTS - 99.3%
(COST $2,883,832) | | | | | 2,914,752 | | |
Foreign Currencies (Cost $24) - 0.0% (f) | | | | | 24 | | |
Other Assets In Excess of Liabilities - 0.7% | | | | | 19,434 | | |
TOTAL NET ASSETS - 100.0% | | | | $ | 2,934,210 | | |
(a) See Note 5 in the Notes to Financial Statements regarding investments in affiliated issuers.
(b) Non-income producing security
(c) Sponsored American Depositary Receipt
(d) A portion of the security out on loan.
(e) The rate shown represents the annualized yield at the time of purchase; not a coupon rate.
(f) Amount rounds to less than 0.1%.
See accompanying Notes to Financial Statements.
Oakmark.com 41
Oakmark International Small Cap Fund March 31, 2018 (Unaudited)
Schedule of Investments (in thousands) (continued)
FORWARD FOREIGN CURRENCY CONTRACTS
| | | Local
Contract
Amount | | Base
Contract
Amount | | Settlement
Date | | Valuation at
3/31/18 | | Unrealized
Appreciation/
(Depreciation) | |
Foreign Currency Sold: | |
Norwegian Krona | | | 127,161 | | | $ | 16,565 | | | 09/19/18 | | $ | 16,324 | | | $ | 241 | | |
Swiss Franc | | | 33,136 | | | | 35,275 | | | 09/19/18 | | | 35,204 | | | | 71 | | |
| | | | | | | | | | | | | | | $ | 51,528 | | | $ | 312 | | |
SCHEDULE OF TRANSACTIONS WITH AFFILIATED ISSUERS
Purchase and sale transactions and dividend and interest income earned during the period on these securities are set forth below (in thousands). The industry, country, or geographic region for each of the below affiliates can be found in the Schedule of Investments.
Affiliates | | Shares
Held | | Purchases
(Cost) | | Sales
(Proceeds) | | Realized
Gain/(Loss) | | Change in
Unrealized | | Dividend
Income | | Value
September 30,
2017 | | Value
March 31,
2018 | | Percent of
Net Assets | |
Atea ASA (a) | | | 3,931 | | | $ | — | | | $ | 35,771 | | | $ | 12,116 | | | $ | 4,336 | | | $ | 2,443 | | | $ | 83,103 | | | $ | 63,785 | | | | 2.2 | % | |
Countrywide PLC | | | 12,249 | | | | — | | | | — | | | | 0 | | | | 421 | | | | 0 | | | | 17,727 | | | | 18,148 | | | | 0.6 | % | |
Element Fleet
Management Corp. | | | 19,206 | | | | 46,405 | | | | — | | | | 0 | | | | (66,431 | ) | | | 1,812 | | | | 81,892 | | | | 61,866 | | | | 2.1 | % | |
LSL Property
Services PLC | | | 10,024 | | | | — | | | | 1,495 | | | | (1,386 | ) | | | 1,556 | | | | 1,032 | | | | 32,827 | | | | 31,502 | | | | 1.1 | % | |
Mitie Group PLC | | | 24,331 | | | | 21,421 | | | | — | | | | 0 | | | | (23,543 | ) | | | 403 | | | | 56,398 | | | | 54,277 | | | | 1.8 | % | |
Primary Health
Care Ltd. (a) | | | 21,440 | | | | 2,039 | | | | 19,301 | | | | (6,676 | ) | | | 22,427 | | | | 864 | | | | 65,732 | | | | 64,222 | | | | 2.2 | % | |
Wajax Corp. | | | 1,071 | | | | — | | | | — | | | | 0 | | | | 2,756 | | | | 415 | | | | 17,485 | | | | 20,241 | | | | 0.7 | % | |
TOTAL | | | 92,252 | | | $ | 69,865 | | | $ | 56,567 | | | $ | 4,054 | | | $ | (58,478 | ) | | $ | 6,969 | | | $ | 355,164 | | | $ | 314,041 | | | | 10.7 | % | |
(a) Due to transactions during the period ended March 31, 2018, the company is no longer an affiliate.
See accompanying Notes to Financial Statements.
42 OAKMARK FUNDS

This page intentionally left blank.
Oakmark.com 43
Oakmark Funds
Statements of Assets and Liabilities—March 31, 2018 (Unaudited)
(in thousands except per share amounts)
| | | Oakmark
Fund | | Oakmark
Select
Fund | | Oakmark
Equity and
Income Fund | | Oakmark
Global
Fund | |
Assets | |
Investments in unaffiliated securities, at value (a) | | $ | 19,425,453 | | | $ | 6,237,363 | | | $ | 15,933,654 | | | $ | 2,609,918 | | |
Investments in affiliated securities, at value (b) | | | 0 | | | | 131,401 | | | | 0 | | | | 0 | | |
Cash | | | 4,003 | | | | 984 | | | | 5,909 | | | | 313 | | |
Foreign currency, at value (c) | | | 0 | (d) | | | 0 | | | | 0 | (d) | | | 0 | (d) | |
Receivable for: | |
Securities sold | | | 30,405 | | | | 3,043 | | | | 106,915 | | | | 10,618 | | |
Fund shares sold | | | 19,994 | | | | 5,493 | | | | 7,521 | | | | 1,165 | | |
Dividends and interest from unaffiliated securities (Net of foreign tax withheld) | | | 14,808 | | | | 2,197 | | | | 37,348 | | | | 2,528 | | |
Dividends and interest from affiliated securities (Net of foreign tax withheld) | | | 0 | | | | 0 | | | | 0 | | | | 0 | | |
Forward foreign currency contracts | | | 0 | | | | 0 | | | | 0 | | | | 129 | | |
Tax reclaim from unaffiliated securities | | | 5,425 | | | | 28 | | | | 10,465 | | | | 1,361 | | |
Total receivables | | | 70,632 | | | | 10,761 | | | | 162,249 | | | | 15,801 | | |
Other assets | | | 76 | | | | 46 | | | | 70 | | | | 37 | | |
Total assets | | $ | 19,500,164 | | | $ | 6,380,555 | | | $ | 16,101,882 | | | $ | 2,626,069 | | |
Liabilities and Net Assets | |
Payable for: | |
Due to custodian | | $ | 0 | | | $ | 0 | | | $ | 0 | | | $ | 0 | | |
Securities purchased | | | 124,667 | | | | 249,990 | | | | 294,607 | | | | 10,175 | | |
Fund shares redeemed | | | 2,924 | | | | 867 | | | | 5,398 | | | | 260 | | |
Options written, at value | | | 1,720 | (e) | | | 0 | | | | 0 | | | | 0 | | |
Investment advisory fee | | | 1,804 | | | | 665 | | | | 1,276 | | | | 341 | | |
Other shareholder servicing fees | | | 5,491 | | | | 1,801 | | | | 6,611 | | | | 845 | | |
Transfer and dividend disbursing agent fees | | | 291 | | | | 162 | | | | 211 | | | | 83 | | |
Trustee fees | | | 5 | | | | 3 | | | | 6 | | | | 0 | | |
Deferred trustee compensation | | | 1,171 | | | | 1,031 | | | | 1,008 | | | | 488 | | |
Other | | | 785 | | | | 329 | | | | 740 | | | | 248 | | |
Total liabilities | | | 138,858 | | | | 254,848 | | | | 309,857 | | | | 12,440 | | |
Net assets applicable to Fund shares outstanding | | $ | 19,361,306 | | | $ | 6,125,707 | | | $ | 15,792,025 | | | $ | 2,613,629 | | |
Analysis of Net Assets | |
Paid in capital | | $ | 11,168,115 | | | $ | 3,810,972 | | | $ | 10,819,807 | | | $ | 1,875,267 | | |
Accumulated undistributed net realized gain (loss) | | | 967,990 | | | | 381,000 | | | | 836,791 | | | | 91,377 | | |
Net unrealized appreciation (depreciation) | | | 7,198,618 | | | | 1,932,972 | | | | 4,083,302 | | | | 652,032 | | |
Accumulated undistributed net investment income
(Distributions in excess of net investment income) | | | 26,583 | | | | 763 | | | | 52,125 | | | | (5,047 | ) | |
Net assets applicable to Fund shares outstanding | | $ | 19,361,306 | | | $ | 6,125,707 | | | $ | 15,792,025 | | | $ | 2,613,629 | | |
Price of Shares | |
Net asset value, offering and redemption price per share: Investor Class | | $ | 83.59 | | | $ | 45.90 | | | $ | 31.67 | | | $ | 32.28 | | |
Investor Class—Net assets | | $ | 13,806,456 | | | $ | 4,630,689 | | | $ | 12,877,102 | | | $ | 1,653,123 | | |
Investor Class—Shares outstanding (Unlimited shares authorized) | | | 165,172 | | | | 100,881 | | | | 406,592 | | | | 51,212 | | |
Net asset value, offering and redemption price per share: Advisor Class | | $ | 83.61 | | | $ | 45.92 | | | $ | 31.68 | | | $ | 32.28 | | |
Advisor Class—Net Assets | | $ | 2,404,060 | | | $ | 677,200 | | | $ | 1,510,045 | | | $ | 575,410 | | |
Advisor Class—Shares outstanding (Unlimited shares authorized) | | | 28,754 | | | | 14,746 | | | | 47,667 | | | | 17,824 | | |
Net asset value, offering and redemption price per share: Institutional Class | | $ | 83.61 | | | $ | 45.93 | | | $ | 31.69 | | | $ | 32.30 | | |
Institutional Class—Net Assets | | $ | 2,996,446 | | | $ | 799,486 | | | $ | 861,725 | | | $ | 363,243 | | |
Institutional Class—Shares outstanding (Unlimited shares authorized) | | | 35,838 | | | | 17,406 | | | | 27,195 | | | | 11,247 | | |
Net asset value, offering and redemption price per share: Service Class | | $ | 83.27 | (g) | | $ | 45.32 | (g) | | $ | 31.49 | | | $ | 31.38 | (g) | |
Service Class—Net assets | | $ | 154,344 | | | $ | 18,332 | | | $ | 543,153 | | | $ | 21,853 | | |
Service Class—Shares outstanding (Unlimited shares authorized) | | | 1,853 | | | | 405 | | | | 17,247 | | | | 696 | | |
| (a) Identified cost of investments in unaffiliated securities. | | $ | 12,228,369 | | | $ | 4,214,323 | | | $ | 11,850,352 | | | $ | 1,958,022 | | |
| (b) Identified cost of investments in affiliated securities. | | | 0 | | | | 221,469 | | | | 0 | | | | 0 | | |
| (c) Identified cost of foreign currency. | | | 0 | (d) | | | 0 | | | | 0 | (d) | | | 0 | (d) | |
| (d) Amount rounds to less than $1,000. | | | | | | | | | | | | | | | | | |
| (e) Written options premiums received $3,254 (in thousands). | | | | | | | | | | | | | | | | | |
| (f) The redemption price per share does not reflect a 2% redemption fee on redemptions of shares held for 90 days or less. | | | | | | | | | | | | | | | | | |
| (g) Net assets have been rounded for presentation purposes. The net asset value per share shown is as reported on March 31, 2018. | | | | | | | | | | | | | | | | | |
See accompanying Notes to Financial Statements.
44 OAKMARK FUNDS
| | | Oakmark
Global Select
Fund | | Oakmark
International
Fund | | Oakmark
International
Small Cap Fund | |
Assets | |
Investments in unaffiliated securities, at value (a) | | $ | 2,823,493 | | | $ | 38,766,182 | | | $ | 2,728,718 | | |
Investments in affiliated securities, at value (b) | | | 0 | | | | 7,662,852 | | | | 186,034 | | |
Cash | | | 628 | | | | 0 | | | | 2,014 | | |
Foreign currency, at value (c) | | | 0 | (d) | | | 17,007 | | | | 24 | | |
Receivable for: | |
Securities sold | | | 0 | | | | 122,961 | | | | 4,168 | | |
Fund shares sold | | | 1,672 | | | | 107,843 | | | | 14,750 | | |
Dividends and interest from unaffiliated securities (Net of foreign tax withheld) | | | 1,754 | | | | 57,307 | | | | 14,139 | | |
Dividends and interest from affiliated securities (Net of foreign tax withheld) | | | 0 | | | | 22,175 | | | | 2,158 | | |
Forward foreign currency contracts | | | 198 | | | | 1,970 | | | | 312 | | |
Tax reclaim from unaffiliated securities | | | 2,289 | | | | 29,392 | | | | 2,013 | | |
Total receivables | | | 5,913 | | | | 341,648 | | | | 37,540 | | |
Other assets | | | 38 | | | | 128 | | | | 39 | | |
Total assets | | $ | 2,830,072 | | | $ | 46,787,817 | | | $ | 2,954,369 | | |
Liabilities and Net Assets | |
Payable for: | |
Due to custodian | | $ | 0 | | | $ | 13,150 | | | $ | 0 | | |
Securities purchased | | | 0 | | | | 610,526 | | | | 6,440 | | |
Fund shares redeemed | | | 68 | | | | 24,394 | | | | 11,399 | | |
Options written, at value | | | 0 | | | | 0 | | | | 0 | | |
Investment advisory fee | | | 366 | | | | 4,781 | | | | 440 | | |
Other shareholder servicing fees | | | 793 | | | | 12,873 | | | | 856 | | |
Transfer and dividend disbursing agent fees | | | 34 | | | | 212 | | | | 46 | | |
Trustee fees | | | 2 | | | | 0 | | | | 0 | | |
Deferred trustee compensation | | | 15 | | | | 813 | | | | 468 | | |
Other | | | 296 | | | | 5,995 | | | | 510 | | |
Total liabilities | | | 1,574 | | | | 672,744 | | | | 20,159 | | |
Net assets applicable to Fund shares outstanding | | $ | 2,828,498 | | | $ | 46,115,073 | | | $ | 2,934,210 | | |
Analysis of Net Assets | |
Paid in capital | | $ | 2,341,007 | | | $ | 40,653,623 | | | $ | 2,717,739 | | |
Accumulated undistributed net realized gain (loss) | | | 3,792 | | | | 638,297 | | | | 197,097 | | |
Net unrealized appreciation (depreciation) | | | 483,952 | | | | 4,825,004 | | | | 31,283 | | |
Accumulated undistributed net investment income
(Distributions in excess of net investment income) | | | (253 | ) | | | (1,851 | ) | | | (11,909 | ) | |
Net assets applicable to Fund shares outstanding | | $ | 2,828,498 | | | $ | 46,115,073 | | | $ | 2,934,210 | | |
Price of Shares | |
Net asset value, offering and redemption price per share: Investor Class | | $ | 18.66 | | | $ | 27.78 | | | $ | 17.14 | (f) | |
Investor Class—Net assets | | $ | 1,827,313 | | | $ | 31,674,891 | | | $ | 1,613,080 | | |
Investor Class—Shares outstanding (Unlimited shares authorized) | | | 97,929 | | | | 1,140,350 | | | | 94,139 | | |
Net asset value, offering and redemption price per share: Advisor Class | | $ | 18.66 | | | $ | 27.79 | | | $ | 17.13 | (f) | |
Advisor Class—Net Assets | | $ | 245,500 | | | $ | 2,331,297 | | | $ | 423,695 | | |
Advisor Class—Shares outstanding (Unlimited shares authorized) | | | 13,156 | | | | 83,887 | | | | 24,738 | | |
Net asset value, offering and redemption price per share: Institutional Class | | $ | 18.67 | | | $ | 27.80 | | | $ | 17.14 | (f) | |
Institutional Class—Net Assets | | $ | 755,685 | | | $ | 11,588,286 | | | $ | 895,521 | | |
Institutional Class—Shares outstanding (Unlimited shares authorized) | | | 40,484 | | | | 416,829 | | | | 52,249 | | |
Net asset value, offering and redemption price per share: Service Class | | $ | 0 | | | $ | 27.93 | | | $ | 17.03 | (f)(g) | |
Service Class—Net assets | | $ | 0 | | | $ | 520,599 | | | $ | 1,914 | | |
Service Class—Shares outstanding (Unlimited shares authorized) | | | 0 | | | | 18,637 | | | | 112 | | |
| (a) Identified cost of investments in unaffiliated securities. | | $ | 2,339,807 | | | $ | 33,286,931 | | | $ | 2,516,388 | | |
| (b) Identified cost of investments in affiliated securities. | | | 0 | | | | 8,319,114 | | | | 367,444 | | |
| (c) Identified cost of foreign currency. | | | 0 | (d) | | | 17,006 | | | | 24 | | |
| (d) Amount rounds to less than $1,000. | | | | | | | | | | | | | |
| (e) Written options premiums received $3,254 (in thousands). | | | | | | | | | | | | | |
| (f) The redemption price per share does not reflect a 2% redemption fee on redemptions of shares held for 90 days or less. | | | | | | | | | | | | | |
| (g) Net assets have been rounded for presentation purposes. The net asset value per share shown is as reported on March 31, 2018. | | | | | | | | | | | | | |
Oakmark.com 45
Oakmark Funds
Statements of Operations—March 31, 2018 (Unaudited)
(in thousands)
| | | Oakmark
Fund | | Oakmark
Select
Fund | | Oakmark
Equity and
Income Fund | | Oakmark
Global
Fund | |
Investment Income: | |
Dividends from unaffiliated securities | | $ | 136,562 | | | $ | 35,391 | | | $ | 87,875 | | | $ | 11,542 | | |
Dividends from affiliated securities | | | 0 | | | | 0 | | | | 0 | | | | 0 | | |
Non-cash dividends from affiliated securities | | | 0 | | | | 0 | | | | 0 | | | | 0 | | |
Interest income from unaffiliated securities | | | 5,247 | | | | 1,211 | | | | 80,605 | | | | 236 | | |
Security lending income | | | 0 | | | | 0 | | | | 0 | | | | 0 | | |
Foreign taxes withheld | | | 0 | | | | 0 | | | | 0 | | | | (192 | ) | |
Total investment income | | | 141,809 | | | | 36,602 | | | | 168,480 | | | | 11,586 | | |
Expenses: | |
Investment advisory fee | | | 70,484 | | | | 27,098 | | | | 56,072 | | | | 13,588 | | |
Transfer and dividend disbursing agent fees | | | 516 | | | | 282 | | | | 369 | | | | 138 | | |
Other shareholder servicing fees | | | 11,308 | | | | 3,841 | | | | 13,277 | | | | 1,679 | | |
Service fee—Service Class | | | 211 | | | | 34 | | | | 761 | | | | 28 | | |
Reports to shareholders | | | 274 | | | | 118 | | | | 264 | | | | 47 | | |
Custody and accounting fees | | | 253 | | | | 129 | | | | 237 | | | | 154 | | |
Trustees fees | | | 179 | | | | 118 | | | | 163 | | | | 81 | | |
Other | | | 325 | | | | 202 | | | | 13 | | | | 144 | | |
Total expenses | | | 83,550 | | | | 31,822 | | | | 71,156 | | | | 15,859 | | |
Advisory fee waiver and expense reimbursements | | | (4,214 | ) | | | (2,358 | ) | | | (8,095 | ) | | | (805 | ) | |
Net expenses | | | 79,336 | | | | 29,464 | | | | 63,061 | | | | 15,054 | | |
Net Investment Income (Loss) | | $ | 62,473 | | | $ | 7,138 | | | $ | 105,419 | | | $ | (3,468 | ) | |
Net realized and unrealized gain (loss): | |
Net realized gain (loss) on: | |
Unaffiliated investments | | | 996,747 | | | | 407,183 | | | | 914,592 | | | | 109,417 | | |
Affiliated investments | | | 0 | | | | (22,596 | ) | | | 0 | | | | 0 | | |
Forward foreign currency contracts | | | 0 | | | | 0 | | | | 0 | | | | 362 | | |
Foreign currency transactions | | | 0 | (b) | | | 0 | | | | 0 | | | | 21 | | |
Written options | | | 0 | | | | 1,379 | | | | 0 | | | | 0 | | |
Net realized gain | | | 996,747 | | | | 385,966 | | | | 914,592 | | | | 109,800 | | |
Net change in unrealized appreciation (depreciation) on: | |
Unaffiliated investments | | | (114,442 | ) | | | (293,102 | ) | | | (599,509 | ) | | | (71,066 | )(c) | |
Affiliated investments | | | 0 | | | | (95,805 | ) | | | 0 | | | | 0 | | |
Forward foreign currency contracts | | | 0 | | | | 0 | | | | 0 | | | | (251 | ) | |
Foreign currency translation | | | 0 | (b) | | | 0 | | | | 0 | (b) | | | (55 | ) | |
Written options | | | 1,534 | | | | 0 | | | | 0 | | | | 0 | | |
Net change in unrealized appreciation (depreciation) | | | (112,908 | ) | | | (388,907 | ) | | | (599,509 | ) | | | (71,372 | ) | |
Net realized and unrealized gain (loss) | | | 883,839 | | | | (2,941 | ) | | | 315,083 | | | | 38,428 | | |
Net increase (decrease) in net assets resulting from operations | | $ | 946,312 | | | $ | 4,197 | | | $ | 420,502 | | | $ | 34,960 | | |
| (a) Net of capital gain withholding taxes of $3,729 (in thousands) for the Oakmark International Fund. | | | | | | | | | | | | | | | | | |
| (b) Amount rounds to less than $1,000. | | | | | | | | | | | | | | | | | |
(c) Includes net change in capital gain withholding taxes of $(13) and $69 (in thousands) for the Oakmark Global Fund and the Oakmark
International Fund, respectively. | | | | | | | | | | | | | | | | | |
See accompanying Notes to Financial Statements.
46 OAKMARK FUNDS
| | | Oakmark
Global Select
Fund | | Oakmark
International
Fund | | Oakmark
International
Small Cap Fund | |
Investment Income: | |
Dividends from unaffiliated securities | | $ | 12,996 | | | $ | 125,577 | | | $ | 22,798 | | |
Dividends from affiliated securities | | | 0 | | | | 61,174 | | | | 6,969 | | |
Non-cash dividends from affiliated securities | | | 0 | | | | 7,030 | | | | 0 | | |
Interest income from unaffiliated securities | | | 443 | | | | 14,659 | | | | 354 | | |
Security lending income | | | 0 | | | | 3,972 | | | | 739 | | |
Foreign taxes withheld | | | 0 | | | | (14,780 | ) | | | (2,945 | ) | |
Total investment income | | | 13,439 | | | | 197,632 | | | | 27,915 | | |
Expenses: | |
Investment advisory fee | | | 14,354 | | | | 178,607 | | | | 16,924 | | |
Transfer and dividend disbursing agent fees | | | 51 | | | | 455 | | | | 79 | | |
Other shareholder servicing fees | | | 1,549 | | | | 26,942 | | | | 1,632 | | |
Service fee—Service Class | | | 0 | | | | 721 | | | | 2 | | |
Reports to shareholders | | | 41 | | | | 1,088 | | | | 156 | | |
Custody and accounting fees | | | 135 | | | | 2,073 | | | | 269 | | |
Trustees fees | | | 71 | | | | 250 | | | | 82 | | |
Other | | | 318 | | | | 2,566 | | | | 269 | | |
Total expenses | | | 16,519 | | | | 212,702 | | | | 19,413 | | |
Advisory fee waiver and expense reimbursements | | | (955 | ) | | | (11,510 | ) | | | 0 | | |
Net expenses | | | 15,564 | | | | 201,192 | | | | 19,413 | | |
Net Investment Income (Loss) | | $ | (2,125 | ) | | $ | (3,560 | ) | | $ | 8,502 | | |
Net realized and unrealized gain (loss): | |
Net realized gain (loss) on: | |
Unaffiliated investments | | | 20,314 | | | | 1,421,210 | (a) | | | 226,107 | | |
Affiliated investments | | | 0 | | | | 201,273 | | | | 4,054 | | |
Forward foreign currency contracts | | | 618 | | | | 6,823 | | | | (2 | ) | |
Foreign currency transactions | | | 80 | | | | (2,579 | ) | | | (175 | ) | |
Written options | | | 0 | | | | 0 | | | | 0 | | |
Net realized gain | | | 21,012 | | | | 1,626,727 | | | | 229,984 | | |
Net change in unrealized appreciation (depreciation) on: | |
Unaffiliated investments | | | (34,325 | ) | | | (832,113 | )(c) | | | (176,960 | ) | |
Affiliated investments | | | 0 | | | | (1,232,984 | ) | | | (114,718 | ) | |
Forward foreign currency contracts | | | (293 | ) | | | (2,640 | ) | | | (297 | ) | |
Foreign currency translation | | | (106 | ) | | | (642 | ) | | | (44 | ) | |
Written options | | | 0 | | | | 0 | | | | 0 | | |
Net change in unrealized appreciation (depreciation) | | | (34,724 | ) | | | (2,068,379 | ) | | | (292,019 | ) | |
Net realized and unrealized gain (loss) | | | (13,712 | ) | | | (441,652 | ) | | | (62,035 | ) | |
Net increase (decrease) in net assets resulting from operations | | $ | (15,837 | ) | | $ | (445,212 | ) | | $ | (53,533 | ) | |
| (a) Net of capital gain withholding taxes of $3,729 (in thousands) for the Oakmark International Fund. | | | | | | | | | | | | | |
| (b) Amount rounds to less than $1,000. | | | | | | | | | | | | | |
(c) Includes net change in capital gain withholding taxes of $(13) and $69 (in thousands) for the Oakmark Global Fund and the Oakmark
International Fund, respectively. | | | | | | | | | | | | | |
Oakmark.com 47
Oakmark Funds
Statements of Changes in Net Assets
(in thousands)
| | | Oakmark Fund | |
| | | Six Months Ended
March 31, 2018
(Unaudited) | | Year Ended
September 30, 2017 | |
From Operations: | |
Net investment income | | $ | 62,473 | | | $ | 155,613 | | |
Net realized gain (loss) | | | 996,747 | | | | 824,949 | | |
Net change in unrealized appreciation (depreciation) | | | (112,908 | ) | | | 2,597,773 | | |
Net increase in net assets from operations | | | 946,312 | | | | 3,578,335 | | |
Distributions to shareholders from: | |
Net investment income—Investor Class | | | (63,708 | ) | | | (164,699 | ) | |
Net investment income—Advisor Class | | | (15,077 | ) | | | 0 | | |
Net investment income—Institutional Class | | | (18,636 | ) | | | 0 | | |
Net investment income—Service Class | | | (366 | ) | | | (1,209 | ) | |
Net realized gain—Investor Class | | | (486,814 | ) | | | (235,492 | ) | |
Net realized gain—Advisor Class | | | (85,057 | ) | | | 0 | | |
Net realized gain—Institutional Class | | | (101,453 | ) | | | 0 | | |
Net realized gain—Service Class | | | (5,864 | ) | | | (2,593 | ) | |
Total distributions to shareholders | | | (776,975 | ) | | | (403,993 | ) | |
From Fund share transactions: | |
Proceeds from shares sold—Investor Class | | | 1,267,967 | | | | 3,333,331 | | |
Proceeds from shares sold—Advisor Class | | | 689,946 | | | | 1,773,679 | | |
Proceeds from shares sold—Institutional Class | | | 795,855 | | | | 2,507,343 | | |
Proceeds from shares sold—Service Class | | | 14,669 | | | | 27,240 | | |
Reinvestment of distributions—Investor Class | | | 509,060 | | | | 373,326 | | |
Reinvestment of distributions—Advisor Class | | | 96,927 | | | | 0 | | |
Reinvestment of distributions—Institutional Class | | | 114,294 | | | | 0 | | |
Reinvestment of distributions—Service Class | | | 4,007 | | | | 2,466 | | |
Payment for shares redeemed—Investor Class | | | (2,312,991 | ) | | | (6,959,152 | ) | |
Payment for shares redeemed—Advisor Class | | | (232,367 | ) | | | (88,078 | ) | |
Payment for shares redeemed—Institutional Class | | | (498,000 | ) | | | (110,417 | ) | |
Payment for shares redeemed—Service Class | | | (34,970 | ) | | | (69,729 | ) | |
Net increase in net assets from Fund share transactions | | | 414,397 | | | | 790,009 | | |
Total increase in net assets | | | 583,734 | | | | 3,964,351 | | |
Net assets: | |
Beginning of period | | | 18,777,572 | | | | 14,813,221 | | |
End of period | | $ | 19,361,306 | | | $ | 18,777,572 | | |
Accumulated undistributed net investment income | | $ | 26,583 | | | $ | 95,263 | | |
See accompanying Notes to Financial Statements.
48 OAKMARK FUNDS
Oakmark Funds
Statements of Changes in Net Assets (continued)
(in thousands)
| | | Oakmark Fund (continued) | |
| | | Six Months Ended
March 31, 2018
(Unaudited) | | Year Ended
September 30, 2017 | |
Fund Share Transactions—Investor Class: | |
Shares sold | | | 14,773 | | | | 44,645 | | |
Shares issued in reinvestment of dividends | | | 6,131 | | | | 5,290 | | |
Less shares redeemed | | | (27,120 | ) | | | (91,577 | ) | |
Net decrease in shares outstanding | | | (6,216 | ) | | | (41,642 | ) | |
Fund Share Transactions—Advisor Class: | |
Shares sold | | | 8,131 | | | | 23,306 | | |
Shares issued in reinvestment of dividends | | | 1,167 | | | | 0 | | |
Less shares redeemed | | | (2,719 | ) | | | (1,131 | ) | |
Net increase in shares outstanding | | | 6,579 | | | | 22,175 | | |
Fund Share Transactions—Institutional Class: | |
Shares sold | | | 9,308 | | | | 32,361 | | |
Shares issued in reinvestment of dividends | | | 1,377 | | | | 0 | | |
Less shares redeemed | | | (5,812 | ) | | | (1,396 | ) | |
Net increase in shares outstanding | | | 4,873 | | | | 30,965 | | |
Fund Share Transactions—Service Class: | |
Shares sold | | | 173 | | | | 365 | | |
Shares issued in reinvestment of dividends | | | 48 | | | | 35 | | |
Less shares redeemed | | | (409 | ) | | | (952 | ) | |
Net decrease in shares outstanding | | | (188 | ) | | | (552 | ) | |
See accompanying Notes to Financial Statements.
Oakmark.com 49
Oakmark Funds
Statements of Changes in Net Assets (continued)
(in thousands)
| | | Oakmark Select Fund | |
| | | Six Months Ended
March 31, 2018
(Unaudited) | | Year Ended
September 30, 2017 | |
From Operations: | |
Net investment income | | $ | 7,138 | | | $ | 23,329 | | |
Net realized gain (loss) | | | 385,966 | | | | 278,186 | | |
Net change in unrealized appreciation (depreciation) | | | (388,907 | ) | | | 829,614 | | |
Net increase in net assets from operations | | | 4,197 | | | | 1,131,129 | | |
Distributions to shareholders from: | |
Net investment income—Investor Class | | | (13,245 | ) | | | (48,511 | ) | |
Net investment income—Advisor Class | | | (2,889 | ) | | | 0 | | |
Net investment income—Institutional Class | | | (3,476 | ) | | | 0 | | |
Net investment income—Service Class | | | 0 | | | | (204 | ) | |
Net realized gain—Investor Class | | | (183,323 | ) | | | (203,667 | ) | |
Net realized gain—Advisor Class | | | (25,610 | ) | | | 0 | | |
Net realized gain—Institutional Class | | | (29,814 | ) | | | 0 | | |
Net realized gain—Service Class | | | (947 | ) | | | (1,343 | ) | |
Total distributions to shareholders | | | (259,304 | ) | | | (253,725 | ) | |
From Fund share transactions: | |
Proceeds from shares sold—Investor Class | | | 468,518 | | | | 1,095,129 | | |
Proceeds from shares sold—Advisor Class | | | 153,697 | | | | 557,393 | | |
Proceeds from shares sold—Institutional Class | | | 138,989 | | | | 736,992 | | |
Proceeds from shares sold—Service Class | | | 1,565 | | | | 7,257 | | |
Reinvestment of distributions—Investor Class | | | 174,064 | | | | 229,106 | | |
Reinvestment of distributions—Advisor Class | | | 27,196 | | | | 0 | | |
Reinvestment of distributions—Institutional Class | | | 32,196 | | | | 0 | | |
Reinvestment of distributions—Service Class | | | 692 | | | | 1,255 | | |
Payment for shares redeemed—Investor Class | | | (673,814 | ) | | | (2,187,831 | ) | |
Payment for shares redeemed—Advisor Class | | | (46,001 | ) | | | (37,728 | ) | |
Payment for shares redeemed—Institutional Class | | | (108,015 | ) | | | (33,499 | ) | |
Payment for shares redeemed—Service Class | | | (11,211 | ) | | | (19,885 | ) | |
Net increase in net assets from Fund share transactions | | | 157,876 | | | | 348,189 | | |
Total increase (decrease) in net assets | | | (97,231 | ) | | | 1,225,593 | | |
Net assets: | |
Beginning of period | | | 6,222,938 | | | | 4,997,345 | | |
End of period | | $ | 6,125,707 | | | $ | 6,222,938 | | |
Accumulated undistributed net investment income | | $ | 763 | | | $ | 16,483 | | |
See accompanying Notes to Financial Statements.
50 OAKMARK FUNDS
Oakmark Funds
Statements of Changes in Net Assets (continued)
(in thousands)
| | | Oakmark Select Fund (continued) | |
| | | Six Months Ended
March 31, 2018
(Unaudited) | | Year Ended
September 30, 2017 | |
Fund Share Transactions—Investor Class: | |
Shares sold | | | 9,625 | | | | 24,851 | | |
Shares issued in reinvestment of dividends | | | 3,719 | | | | 5,507 | | |
Less shares redeemed | | | (13,942 | ) | | | (49,955 | ) | |
Net decrease in shares outstanding | | | (598 | ) | | | (19,597 | ) | |
Fund Share Transactions—Advisor Class: | |
Shares sold | | | 3,190 | | | | 12,771 | | |
Shares issued in reinvestment of dividends | | | 581 | | | | 0 | | |
Less shares redeemed | | | (952 | ) | | | (844 | ) | |
Net increase in shares outstanding | | | 2,819 | | | | 11,927 | | |
Fund Share Transactions—Institutional Class: | |
Shares sold | | | 2,874 | | | | 16,786 | | |
Shares issued in reinvestment of dividends | | | 688 | | | | 0 | | |
Less shares redeemed | | | (2,205 | ) | | | (737 | ) | |
Net increase in shares outstanding | | | 1,357 | | | | 16,049 | | |
Fund Share Transactions—Service Class: | |
Shares sold | | | 33 | | | | 168 | | |
Shares issued in reinvestment of dividends | | | 15 | | | | 30 | | |
Less shares redeemed | | | (235 | ) | | | (463 | ) | |
Net decrease in shares outstanding | | | (187 | ) | | | (265 | ) | |
See accompanying Notes to Financial Statements.
Oakmark.com 51
Oakmark Funds
Statements of Changes in Net Assets (continued)
(in thousands)
| | | Oakmark Equity and Income Fund | |
| | | Six Months Ended
March 31, 2018
(Unaudited) | | Year Ended
September 30, 2017 | |
From Operations: | |
Net investment income | | $ | 105,419 | | | $ | 277,367 | | |
Net realized gain (loss) | | | 914,592 | | | | 1,077,625 | | |
Net change in unrealized appreciation (depreciation) | | | (599,509 | ) | | | 936,613 | | |
Net increase in net assets from operations | | | 420,502 | | | | 2,291,605 | | |
Distributions to shareholders from: | |
Net investment income—Investor Class | | | (171,186 | ) | | | (231,364 | ) | |
Net investment income—Advisor Class | | | (21,828 | ) | | | 0 | | |
Net investment income—Institutional Class | | | (9,787 | ) | | | 0 | | |
Net investment income—Service Class | | | (6,141 | ) | | | (8,692 | ) | |
Net realized gain—Investor Class | | | (857,087 | ) | | | (393,093 | ) | |
Net realized gain—Advisor Class | | | (95,419 | ) | | | 0 | | |
Net realized gain—Institutional Class | | | (42,296 | ) | | | 0 | | |
Net realized gain—Service Class | | | (39,136 | ) | | | (18,736 | ) | |
Total distributions to shareholders | | | (1,242,880 | ) | | | (651,885 | ) | |
From Fund share transactions: | |
Proceeds from shares sold—Investor Class | | | 686,169 | | | | 1,511,900 | | |
Proceeds from shares sold—Advisor Class | | | 865,145 | | | | 710,402 | | |
Proceeds from shares sold—Institutional Class | | | 378,340 | | | | 543,955 | | |
Proceeds from shares sold—Service Class | | | 39,293 | | | | 101,901 | | |
Reinvestment of distributions—Investor Class | | | 964,308 | | | | 587,325 | | |
Reinvestment of distributions—Advisor Class | | | 114,065 | | | | 0 | | |
Reinvestment of distributions—Institutional Class | | | 49,867 | | | | 0 | | |
Reinvestment of distributions—Service Class | | | 40,453 | | | | 24,677 | | |
Payment for shares redeemed—Investor Class | | | (2,359,901 | ) | | | (4,701,699 | ) | |
Payment for shares redeemed—Advisor Class | | | (106,809 | ) | | | (42,779 | ) | |
Payment for shares redeemed—Institutional Class | | | (58,742 | ) | | | (37,555 | ) | |
Payment for shares redeemed—Service Class | | | (130,024 | ) | | | (317,545 | ) | |
Net increase (decrease) in net assets from Fund share transactions | | | 482,164 | | | | (1,619,418 | ) | |
Total increase (decrease) in net assets | | | (340,214 | ) | | | 20,302 | | |
Net assets: | |
Beginning of period | | | 16,132,239 | | | | 16,111,937 | | |
End of period | | $ | 15,792,025 | | | $ | 16,132,239 | | |
Accumulated undistributed net investment income | | $ | 52,125 | | | $ | 186,573 | | |
See accompanying Notes to Financial Statements.
52 OAKMARK FUNDS
Oakmark Funds
Statements of Changes in Net Assets (continued)
(in thousands)
| | | Oakmark Equity and Income Fund (continued) | |
| | | Six Months Ended
March 31, 2018
(Unaudited) | | Year Ended
September 30, 2017 | |
Fund Share Transactions—Investor Class: | |
Shares sold | | | 20,818 | | | | 48,217 | | |
Shares issued in reinvestment of dividends | | | 30,257 | | | | 19,722 | | |
Less shares redeemed | | | (70,947 | ) | | | (150,273 | ) | |
Net decrease in shares outstanding | | | (19,872 | ) | | | (82,334 | ) | |
Fund Share Transactions—Advisor Class: | |
Shares sold | | | 25,662 | | | | 23,003 | | |
Shares issued in reinvestment of dividends | | | 3,579 | | | | 0 | | |
Less shares redeemed | | | (3,234 | ) | | | (1,343 | ) | |
Net increase in shares outstanding | | | 26,007 | | | | 21,660 | | |
Fund Share Transactions—Institutional Class: | |
Shares sold | | | 11,394 | | | | 17,203 | | |
Shares issued in reinvestment of dividends | | | 1,565 | | | | 0 | | |
Less shares redeemed | | | (1,789 | ) | | | (1,178 | ) | |
Net increase in shares outstanding | | | 11,170 | | | | 16,025 | | |
Fund Share Transactions—Service Class: | |
Shares sold | | | 1,199 | | | | 3,263 | | |
Shares issued in reinvestment of dividends | | | 1,275 | | | | 832 | | |
Less shares redeemed | | | (3,968 | ) | | | (10,165 | ) | |
Net decrease in shares outstanding | | | (1,494 | ) | | | (6,070 | ) | |
See accompanying Notes to Financial Statements.
Oakmark.com 53
Oakmark Funds
Statements of Changes in Net Assets (continued)
(in thousands)
| | | Oakmark Global Fund | |
| | | Six Months Ended
March 31, 2018
(Unaudited) | | Year Ended
September 30, 2017 | |
From Operations: | |
Net investment income (loss) | | $ | (3,468 | ) | | $ | 25,228 | | |
Net realized gain (loss) | | | 109,800 | | | | 242,742 | | |
Net change in unrealized appreciation (depreciation) | | | (71,372 | ) | | | 434,067 | | |
Net increase in net assets from operations | | | 34,960 | | | | 702,037 | | |
Distributions to shareholders from: | |
Net investment income—Investor Class | | | (15,655 | ) | | | (26,172 | ) | |
Net investment income—Advisor Class | | | (5,650 | ) | | | 0 | | |
Net investment income—Institutional Class | | | (3,752 | ) | | | 0 | | |
Net investment income—Service Class | | | (151 | ) | | | (208 | ) | |
Net realized gain—Investor Class | | | (111,966 | ) | | | 0 | | |
Net realized gain—Advisor Class | | | (34,080 | ) | | | 0 | | |
Net realized gain—Institutional Class | | | (21,645 | ) | | | 0 | | |
Net realized gain—Service Class | | | (1,469 | ) | | | 0 | | |
Total distributions to shareholders | | | (194,368 | ) | | | (26,380 | ) | |
From Fund share transactions: | |
Proceeds from shares sold—Investor Class | | | 116,236 | | | | 275,693 | | |
Proceeds from shares sold—Advisor Class | | | 122,075 | | | | 611,457 | | |
Proceeds from shares sold—Institutional Class | | | 83,432 | | | | 297,488 | | |
Proceeds from shares sold—Service Class | | | 2,425 | | | | 3,684 | | |
Reinvestment of distributions—Investor Class | | | 120,084 | | | | 24,367 | | |
Reinvestment of distributions—Advisor Class | | | 38,466 | | | | 0 | | |
Reinvestment of distributions—Institutional Class | | | 25,035 | | | | 0 | | |
Reinvestment of distributions—Service Class | | | 1,382 | | | | 188 | | |
Payment for shares redeemed—Investor Class | | | (294,845 | ) | | | (1,377,221 | ) | |
Payment for shares redeemed—Advisor Class | | | (49,476 | ) | | | (179,579 | ) | |
Payment for shares redeemed—Institutional Class | | | (32,472 | ) | | | (29,095 | ) | |
Payment for shares redeemed—Service Class | | | (3,115 | ) | | | (13,332 | ) | |
Net increase (decrease) in net assets from Fund share transactions | | | 129,227 | | | | (386,350 | ) | |
Total increase (decrease) in net assets | | | (30,181 | ) | | | 289,307 | | |
Net assets: | |
Beginning of period | | | 2,643,810 | | | | 2,354,503 | | |
End of period | | $ | 2,613,629 | | | $ | 2,643,810 | | |
Accumulated undistributed net investment income (loss) | | $ | (5,047 | ) | | $ | 20,425 | | |
See accompanying Notes to Financial Statements.
54 OAKMARK FUNDS
Oakmark Funds
Statements of Changes in Net Assets (continued)
(in thousands)
| | | Oakmark Global Fund (continued) | |
| | | Six Months Ended
March 31, 2018
(Unaudited) | | Year Ended
September 30, 2017 | |
Fund Share Transactions—Investor Class: | |
Shares sold | | | 3,388 | | | | 9,382 | | |
Shares issued in reinvestment of dividends | | | 3,688 | | | | 898 | | |
Less shares redeemed | | | (8,652 | ) | | | (45,841 | ) | |
Net decrease in shares outstanding | | | (1,576 | ) | | | (35,561 | ) | |
Fund Share Transactions—Advisor Class: | |
Shares sold | | | 3,559 | | | | 19,869 | | |
Shares issued in reinvestment of dividends | | | 1,181 | | | | 0 | | |
Less shares redeemed | | | (1,465 | ) | | | (5,320 | ) | |
Net increase in shares outstanding | | | 3,275 | | | | 14,549 | | |
Fund Share Transactions—Institutional Class: | |
Shares sold | | | 2,431 | | | | 9,900 | | |
Shares issued in reinvestment of dividends | | | 769 | | | | 0 | | |
Less shares redeemed | | | (957 | ) | | | (896 | ) | |
Net increase in shares outstanding | | | 2,243 | | | | 9,004 | | |
Fund Share Transactions—Service Class: | |
Shares sold | | | 73 | | | | 124 | | |
Shares issued in reinvestment of dividends | | | 44 | | | | 7 | | |
Less shares redeemed | | | (94 | ) | | | (455 | ) | |
Net increase (decrease) in shares outstanding | | | 23 | | | | (324 | ) | |
See accompanying Notes to Financial Statements.
Oakmark.com 55
Oakmark Funds
Statements of Changes in Net Assets (continued)
(in thousands)
| | | Oakmark Global Select Fund | |
| | | Six Months Ended
March 31, 2018
(Unaudited) | |
Year Ended
September 30, 2017 | |
From Operations: | |
Net investment income (loss) | | $ | (2,125 | ) | | $ | 30,812 | | |
Net realized gain (loss) | | | 21,012 | | | | 158,579 | | |
Net change in unrealized appreciation (depreciation) | | | (34,724 | ) | | | 363,879 | | |
Net increase (decrease) in net assets from operations | | | (15,837 | ) | | | 553,270 | | |
Distributions to shareholders from: | |
Net investment income—Investor Class | | | (16,418 | ) | | | (21,509 | ) | |
Net investment income—Advisor Class | | | (2,523 | ) | | | 0 | | |
Net investment income—Institutional Class | | | (7,313 | ) | | | 0 | | |
Net realized gain—Investor Class | | | (83,949 | ) | | | 0 | | |
Net realized gain—Advisor Class | | | (10,926 | ) | | | 0 | | |
Net realized gain—Institutional Class | | | (30,662 | ) | | | 0 | | |
Total distributions to shareholders | | | (151,791 | ) | | | (21,509 | ) | |
From Fund share transactions: | |
Proceeds from shares sold—Investor Class | | | 209,929 | | | | 539,870 | | |
Proceeds from shares sold—Advisor Class | | | 135,238 | | | | 193,698 | | |
Proceeds from shares sold—Institutional Class | | | 194,779 | | | | 573,533 | | |
Reinvestment of distributions—Investor Class | | | 90,867 | | | | 19,755 | | |
Reinvestment of distributions—Advisor Class | | | 13,241 | | | | 0 | | |
Reinvestment of distributions—Institutional Class | | | 34,448 | | | | 0 | | |
Payment for shares redeemed—Investor Class | | | (401,184 | ) | | | (1,035,762 | ) | |
Payment for shares redeemed—Advisor Class | | | (36,550 | ) | | | (61,408 | ) | |
Payment for shares redeemed—Institutional Class | | | (36,293 | ) | | | (6,861 | ) | |
Net increase in net assets from Fund share transactions | | | 204,475 | | | | 222,825 | | |
Total increase in net assets | | | 36,847 | | | | 754,586 | | |
Net assets: | |
Beginning of period | | | 2,791,651 | | | | 2,037,065 | | |
End of period | | $ | 2,828,498 | | | $ | 2,791,651 | | |
Accumulated undistributed net investment income (loss) | | $ | (253 | ) | | $ | 30,348 | | |
Fund Share Transactions—Investor Class: | |
Shares sold | | | 10,615 | | | | 30,245 | | |
Shares issued in reinvestment of dividends | | | 4,763 | | | | 1,219 | | |
Less shares redeemed | | | (20,324 | ) | | | (57,430 | ) | |
Net decrease in shares outstanding | | | (4,946 | ) | | | (25,966 | ) | |
Fund Share Transactions—Advisor Class: | |
Shares sold | | | 6,817 | | | | 10,639 | | |
Shares issued in reinvestment of dividends | | | 694 | | | | 0 | | |
Less shares redeemed | | | (1,844 | ) | | | (3,150 | ) | |
Net increase in shares outstanding | | | 5,667 | | | | 7,489 | | |
Fund Share Transactions—Institutional Class: | |
Shares sold | | | 9,828 | | | | 31,047 | | |
Shares issued in reinvestment of dividends | | | 1,805 | | | | 0 | | |
Less shares redeemed | | | (1,833 | ) | | | (363 | ) | |
Net increase in shares outstanding | | | 9,800 | | | | 30,684 | | |
See accompanying Notes to Financial Statements.
56 OAKMARK FUNDS
Oakmark Funds
Statements of Changes in Net Assets (continued)
(in thousands)
| | | Oakmark International Fund | |
| | | Six Months Ended
March 31, 2018
(Unaudited) | | Year Ended
September 30, 2017 | |
From Operations: | |
Net investment income (loss) | | $ | (3,560 | ) | | $ | 535,813 | | |
Net realized gain (loss) | | | 1,626,727 | | | | 1,026,647 | | |
Net change in unrealized appreciation (depreciation) | | | (2,068,379 | ) | | | 7,596,069 | | |
Net increase (decrease) in net assets from operations | | | (445,212 | ) | | | 9,158,529 | | |
Distributions to shareholders from: | |
Net investment income—Investor Class | | | (408,227 | ) | | | (361,117 | ) | |
Net investment income—Advisor Class | | | (28,473 | ) | | | 0 | | |
Net investment income—Institutional Class | | | (137,469 | ) | | | 0 | | |
Net investment income—Service Class | | | (6,033 | ) | | | (6,151 | ) | |
Net realized gain—Investor Class | | | (511,315 | ) | | | 0 | | |
Net realized gain—Advisor Class | | | (32,142 | ) | | | 0 | | |
Net realized gain—Institutional Class | | | (153,251 | ) | | | 0 | | |
Net realized gain—Service Class | | | (9,445 | ) | | | 0 | | |
Total distributions to shareholders | | | (1,286,355 | ) | | | (367,268 | ) | |
From Fund share transactions: | |
Proceeds from shares sold—Investor Class | | | 6,619,741 | | | | 11,985,102 | | |
Proceeds from shares sold—Advisor Class | | | 1,609,294 | | | | 836,504 | | |
Proceeds from shares sold—Institutional Class | | | 4,827,843 | | | | 7,221,520 | | |
Proceeds from shares sold—Service Class | | | 89,750 | | | | 141,028 | | |
Reinvestment of distributions—Investor Class | | | 784,197 | | | | 301,316 | | |
Reinvestment of distributions—Advisor Class | | | 59,372 | | | | 0 | | |
Reinvestment of distributions—Institutional Class | | | 253,244 | | | | 0 | | |
Reinvestment of distributions—Service Class | | | 10,046 | | | | 4,068 | | |
Payment for shares redeemed—Investor Class | | | (5,617,035 | ) | | | (12,285,652 | ) | |
Payment for shares redeemed—Advisor Class | | | (168,002 | ) | | | (60,462 | ) | |
Payment for shares redeemed—Institutional Class | | | (690,667 | ) | | | (280,865 | ) | |
Payment for shares redeemed—Service Class | | | (142,101 | ) | | | (252,874 | ) | |
Net increase in net assets from Fund share transactions | | | 7,635,682 | | | | 7,609,685 | | |
Total increase in net assets | | | 5,904,115 | | | | 16,400,946 | | |
Net assets: | |
Beginning of period | | | 40,210,958 | | | | 23,810,012 | | |
End of period | | $ | 46,115,073 | | | $ | 40,210,958 | | |
Accumulated undistributed net investment income (loss) | | $ | (1,851 | ) | | $ | 555,442 | | |
See accompanying Notes to Financial Statements.
Oakmark.com 57
Oakmark Funds
Statements of Changes in Net Assets (continued)
(in thousands)
| | | Oakmark International Fund (continued) | |
| | | Six Months Ended
March 31, 2018
(Unaudited) | | Year Ended
September 30, 2017 | |
Fund Share Transactions—Investor Class: | |
Shares sold | | | 227,346 | | | | 479,015 | | |
Shares issued in reinvestment of dividends | | | 27,888 | | | | 13,822 | | |
Less shares redeemed | | | (194,259 | ) | | | (487,955 | ) | |
Net increase in shares outstanding | | | 60,975 | | | | 4,882 | | |
Fund Share Transactions—Advisor Class: | |
Shares sold | | | 55,855 | | | | 34,011 | | |
Shares issued in reinvestment of dividends | | | 2,111 | | | | 0 | | |
Less shares redeemed | | | (5,806 | ) | | | (2,284 | ) | |
Net increase in shares outstanding | | | 52,160 | | | | 31,727 | | |
Fund Share Transactions—Institutional Class: | |
Shares sold | | | 165,985 | | | | 276,088 | | |
Shares issued in reinvestment of dividends | | | 9,002 | | | | 0 | | |
Less shares redeemed | | | (23,860 | ) | | | (10,386 | ) | |
Net increase in shares outstanding | | | 151,127 | | | | 265,702 | | |
Fund Share Transactions—Service Class: | |
Shares sold | | | 3,087 | | | | 5,608 | | |
Shares issued in reinvestment of dividends | | | 355 | | | | 185 | | |
Less shares redeemed | | | (4,867 | ) | | | (10,215 | ) | |
Net decrease in shares outstanding | | | (1,425 | ) | | | (4,422 | ) | |
See accompanying Notes to Financial Statements.
58 OAKMARK FUNDS
Oakmark Funds
Statements of Changes in Net Assets (continued)
(in thousands)
| | | Oakmark International Small Cap Fund | |
| | | Six Months Ended
March 31, 2018
(Unaudited) | | Year Ended
September 30, 2017 | |
From Operations: | |
Net investment income | | $ | 8,502 | | | $ | 37,047 | | |
Net realized gain (loss) | | | 229,984 | | | | 74,934 | | |
Net change in unrealized appreciation (depreciation) | | | (292,019 | ) | | | 493,283 | | |
Net increase (decrease) in net assets from operations | | | (53,533 | ) | | | 605,264 | | |
Distributions to shareholders from: | |
Net investment income—Investor Class | | | (13,476 | ) | | | (56,204 | ) | |
Net investment income—Advisor Class | | | (4,261 | ) | | | 0 | | |
Net investment income—Institutional Class | | | (9,407 | ) | | | 0 | | |
Net investment income—Service Class | | | (11 | ) | | | (35 | ) | |
Net realized gain—Investor Class | | | (47,478 | ) | | | (13,930 | ) | |
Net realized gain—Advisor Class | | | (11,802 | ) | | | 0 | | |
Net realized gain—Institutional Class | | | (25,164 | ) | | | 0 | | |
Net realized gain—Service Class | | | (55 | ) | | | (10 | ) | |
Total distributions to shareholders | | | (111,654 | ) | | | (70,179 | ) | |
From Fund share transactions: | |
Proceeds from shares sold—Investor Class | | | 199,005 | | | | 613,337 | | |
Proceeds from shares sold—Advisor Class | | | 92,990 | | | | 383,394 | | |
Proceeds from shares sold—Institutional Class | | | 213,221 | | | | 816,394 | | |
Proceeds from shares sold—Service Class | | | 163 | | | | 864 | | |
Reinvestment of distributions—Investor Class | | | 57,642 | | | | 65,293 | | |
Reinvestment of distributions—Advisor Class | | | 15,895 | | | | 0 | | |
Reinvestment of distributions—Institutional Class | | | 28,214 | | | | 0 | | |
Reinvestment of distributions—Service Class | | | 45 | | | | 32 | | |
Payment for shares redeemed—Investor Class | | | (386,621 | ) | | | (1,666,097 | ) | |
Payment for shares redeemed—Advisor Class | | | (50,327 | ) | | | (14,528 | ) | |
Payment for shares redeemed—Institutional Class | | | (135,895 | ) | | | (34,795 | ) | |
Payment for shares redeemed—Service Class | | | (252 | ) | | | (657 | ) | |
Redemption fees—Investor Class | | | 105 | | | | 200 | | |
Redemption fees—Advisor Class | | | 27 | | | | 0 | (a) | |
Redemption fees—Institutional Class | | | 13 | | | | 18 | | |
Redemption fees—Service Class | | | 0 | (a) | | | 0 | (a) | |
Net increase in net assets from Fund share transactions | | | 34,225 | | | | 163,455 | | |
Total increase (decrease) in net assets | | | (130,962 | ) | | | 698,540 | | |
Net assets: | |
Beginning of period | | | 3,065,172 | | | | 2,366,632 | | |
End of period | | $ | 2,934,210 | | | $ | 3,065,172 | | |
Accumulated undistributed net investment income (loss) | | $ | (11,909 | ) | | $ | 14,210 | | |
(a) Amount rounds to less than $1,000.
See accompanying Notes to Financial Statements.
Oakmark.com 59
Oakmark Funds
Statements of Changes in Net Assets (continued)
(in thousands)
| | | Oakmark International Small Cap Fund (continued) | |
| | | Six Months Ended
March 31, 2018
(Unaudited) | | Year Ended
September 30, 2017 | |
Fund Share Transactions—Investor Class: | |
Shares sold | | | 11,136 | | | | 38,179 | | |
Shares issued in reinvestment of dividends | | | 3,361 | | | | 4,598 | | |
Less shares redeemed | | | (21,682 | ) | | | (100,803 | ) | |
Net decrease in shares outstanding | | | (7,185 | ) | | | (58,026 | ) | |
Fund Share Transactions—Advisor Class: | |
Shares sold | | | 5,238 | | | | 22,240 | | |
Shares issued in reinvestment of dividends | | | 927 | | | | 0 | | |
Less shares redeemed | | | (2,840 | ) | | | (827 | ) | |
Net increase in shares outstanding | | | 3,325 | | | | 21,413 | | |
Fund Share Transactions—Institutional Class: | |
Shares sold | | | 11,975 | | | | 48,238 | | |
Shares issued in reinvestment of dividends | | | 1,646 | | | | 0 | | |
Less shares redeemed | | | (7,602 | ) | | | (2,008 | ) | |
Net increase in shares outstanding | | | 6,019 | | | | 46,230 | | |
Fund Share Transactions—Service Class: | |
Shares sold | | | 9 | | | | 55 | | |
Shares issued in reinvestment of dividends | | | 2 | | | | 2 | | |
Less shares redeemed | | | (14 | ) | | | (43 | ) | |
Net increase (decrease) in shares outstanding | | | (3 | ) | | | 14 | | |
See accompanying Notes to Financial Statements.
60 OAKMARK FUNDS
Oakmark Funds
Notes to Financial Statements
1. SIGNIFICANT ACCOUNTING POLICIES
Organization
The following are the significant accounting policies of Oakmark Fund ("Oakmark"), Oakmark Select Fund ("Select"), Oakmark Equity and Income Fund ("Equity and Income"), Oakmark Global Fund ("Global"), Oakmark Global Select Fund ("Global Select"), Oakmark International Fund ("International") and Oakmark International Small Cap Fund ("Int'l Small Cap"), collectively referred to as the "Funds," each a series of Harris Associates Investment Trust (the "Trust"), a Massachusetts business trust, organized on February 1, 1991, which is registered as an open-end management investment company under the Investment Company Act of 1940, as amended (the "1940 Act") and accordingly follows the investment company accounting and reporting guidance of the Financial Accounting Standards Board ("FASB") Accounting Standards Codification Topic 946 Financial Services—Investment Companies. Each Fund, other than Select and Global Select, is diversified in accordance with the 1940 Act. The following policies are in conformity with accounting principles generally accepted in the United States of America ("GAAP"). The presentation of financial statements in conformity with GAAP requires management to make estimates and assumptions that affect the reported amounts of assets and liabilities at the date of the financial statements and the reported amounts of revenues and expenses during the reporting period. Actual results could differ from those estimates and assumptions.
Class disclosure
Each Fund offers four classes of shares: Investor Class (formerly Class I) Shares, Advisor Class Shares, Institutional Class Shares and Service Class (formerly Class II) Shares. Investor Class, Advisor Class and Institutional Class Shares are offered for purchase directly from the Funds and through certain intermediaries who have entered into an agreement with the Funds' distributor and/or Harris Associates L.P., investment adviser to the Funds (the "Adviser"). Service Class (formerly Class II) Shares are offered to certain retirement plans such as 401(k) and profit sharing plans. Service Class Shares pay a service fee at the annual rate of up to 0.25% of the average net assets of Service Class Shares of the Funds. This service fee is paid to intermediaries for performing the services associated with the administration of such retirement plans. Global Select had no outstanding Service Class Shares during the six-month period ended March 31, 2018.
Income, realized and unrealized capital gains and losses, and expenses of the Funds not directly attributable to a specific class of shares are allocated to each class pro rata based on the relative net assets of each class. Transfer and divided disbursing agent fees, other shareholder servicing fees and reports to shareholders expenses are specific to each class.
Redemption fees
Int'l Small Cap imposes a short-term trading fee on redemptions of shares held for 90 days or less to deter abusive trading activities and to help offset two types of costs to the Fund caused by abusive trading: portfolio transaction and market impact costs associated with erratic redemption activity and administrative costs associated with processing redemptions. The fee is paid to the Fund and is 2% of the redemption value and is deducted from either the redemption proceeds or from the balance in the account. The "first-in, first-out" ("FIFO") method is used to determine the holding period. The Fund may approve the waiver of redemption fees, pursuant to the Fund's policies and procedures. Redemption fees collected by the Fund, if any, are included in the Statements of Changes in Net Assets.
Security valuation
The Funds' share prices or net asset values ("NAVs") are calculated as of the close of regular session trading (usually 4:00 p.m. Eastern time) on the New York Stock Exchange ("NYSE") on any day on which the NYSE is open for trading. Equity securities principally traded on securities exchanges in the United States and over-the-counter securities are valued at the last sales price or the official closing price on the day of valuation, or lacking any reported sales that day, at the most recent bid quotation. Securities traded on the NASDAQ National Market System are valued at the NASDAQ Official Closing Price ("NOCP"), or lacking an NOCP, at the most recent bid quotation on the NASDAQ National Market System. Equity securities principally traded on securities exchanges outside the United States are valued, depending on local convention or regulation, at the last sales price, the last bid or asked price, the mean between the last bid and asked prices, or the official closing price, or are based on a pricing composite as of the close of the regular trading hours on the appropriate exchange or other designated time. Each long-term debt instrument is valued at the latest bid quotation or an evaluated price provided by an independent pricing service. The pricing service may use standard inputs such as benchmark yields, reported trades, broker/dealer quotes, issuer spreads, two-sided markets, benchmark securities, bids, offers and reference data, including market research publications. For certain security types, additional inputs may be used or some of the standard inputs may not be applicable. Additionally, the pricing service monitors market indicators and industry and economic events, which may serve as a trigger to gather and possibly use additional market data. Each short-term debt instrument (i.e., debt instruments whose maturities or expiration dates at the time of acquisition are one year or less) or money market instrument maturing in 61 days or more from the date of valuation is valued at the latest bid quotation or an evaluated price provided by an independent pricing service. Each short-term instrument maturing in 60 days or less from the date of valuation is valued at amortized cost, which approximates market value. Options are valued at the mean of the most recent bid and asked quotations.
Securities for which quotations are not readily available or securities that may have been affected by a significant event occurring between the close of a foreign market and the close of the NYSE are valued at fair value, determined by or under the direction of the pricing committee authorized by the Board of Trustees. A significant event may include the performance of U.S. markets since the close of foreign markets. The Funds may use a systematic fair valuation model provided by an independent pricing service to value foreign securities in order to adjust local closing prices for information or events that may occur between the close of certain foreign exchanges and the close of the NYSE.
Oakmark.com 61
Oakmark Funds
Notes to Financial Statements (continued)
Fair value measurement
Various inputs are used in determining the value of each Fund's investments. These inputs are prioritized into three broad levels as follows:
Level 1—quoted prices in active markets for identical securities
Level 2—other significant observable inputs (including quoted prices for similar investments, interest rates, prepayment speeds, credit risk and others)
Level 3—significant unobservable inputs (including the assumptions of Harris Associates L.P. (the "Adviser") in determining the fair value of investments)
Observable inputs are those based on market data obtained from independent sources and unobservable inputs reflect the Adviser's own assumptions based on the best information available. The input levels are not necessarily an indication of risk or liquidity associated with investing in those securities.
The Funds recognize transfers between level 1 and level 2 at the end of the reporting cycle. At March 31, 2018, there were no transfers between level 1 and level 2 securities.
The following is a summary of the inputs used as of March 31, 2018, in valuing each Fund's assets and liabilities. Except for the industries or investment types separately stated below, the total amounts for common stocks, fixed income and short-term investments in the table below are presented by industry or investment type in each Fund's Schedule of Investments. Information on forward foreign currency contracts is presented in each Fund's Schedule of Investments.
(in thousands) | | Quoted Prices
in Active
Markets for
Identical
Assets
(Level 1) | | Other
Significant
Observable
Inputs
(Level 2) | | Significant
Unobservable
Inputs
(Level 3) | |
Oakmark | | | | | | | | | | | | | |
Common Stocks | | $ | 18,568,748 | | | $ | 0 | | | $ | 0 | | |
Short-Term Investments | | | 0 | | | | 856,705 | | | | 0 | | |
Put Options Written | | | (1,720 | ) | | | 0 | | | | 0 | | |
Total | | $ | 18,567,028 | | | $ | 856,705 | | | $ | 0 | | |
Select | | | | | | | | | | | | | |
Common Stocks | | $ | 5,753,695 | | | $ | 0 | | | $ | 0 | | |
Short-Term Investments | | | 0 | | | | 615,069 | | | | 0 | | |
Total | | $ | 5,753,695 | | | $ | 615,069 | | | $ | 0 | | |
Equity and Income | | | | | | | | | | | | | |
Common Stocks | | $ | 9,647,353 | | | $ | 0 | | | $ | 0 | | |
Preferred Stocks | | | 12,925 | | | | 0 | | | | 0 | | |
Government and Agency Securities | | | 0 | | | | 1,886,695 | | | | 0 | | |
Corporate Bonds | | | 0 | | | | 2,107,293 | | | | 0 | | |
Convertible Bonds | | | 0 | | | | 12,843 | | | | 0 | | |
Short-Term Investments | | | 0 | | | | 2,266,545 | | | | 0 | | |
Total | | $ | 9,660,278 | | | $ | 6,273,376 | | | $ | 0 | | |
Global | | | | | | | | | | | | | |
Common Stocks | | $ | 2,535,875 | | | $ | 0 | | | $ | 0 | | |
Short-Term Investments | | | 0 | | | | 74,043 | | | | 0 | | |
Forward Foreign Currency Contracts - Assets | | | 0 | | | | 129 | | | | 0 | | |
Total | | $ | 2,535,875 | | | $ | 74,172 | | | $ | 0 | | |
Global Select | | | | | | | | | | | | | |
Common Stocks | | $ | 2,684,768 | | | $ | 0 | | | $ | 0 | | |
Short-Term Investments | | | 0 | | | | 138,725 | | | | 0 | | |
Forward Foreign Currency Contracts - Assets | | | 0 | | | | 198 | | | | 0 | | |
Total | | $ | 2,684,768 | | | $ | 138,923 | | | $ | 0 | | |
62 OAKMARK FUNDS
Oakmark Funds
Notes to Financial Statements (continued)
(in thousands) | | Quoted Prices
in Active
Markets for
Identical
Assets
(Level 1) | | Other
Significant
Observable
Inputs
(Level 2) | | Significant
Unobservable
Inputs
(Level 3) | |
International | | | | | | | | | | | | | |
Common Stocks | | $ | 43,554,136 | | | $ | 0 | | | $ | 0 | | |
Short-Term Investments | | | 0 | | | | 2,874,898 | | | | 0 | | |
Forward Foreign Currency Contracts - Assets | | | 0 | | | | 1,970 | | | | 0 | | |
Total | | $ | 43,554,136 | | | $ | 2,876,868 | | | $ | 0 | | |
Int'l Small Cap | | | | | | | | | | | | | |
Common Stocks | | $ | 2,789,203 | | | $ | 0 | | | $ | 0 | | |
Short-Term Investments | | | 0 | | | | 125,549 | | | | 0 | | |
Forward Foreign Currency Contracts - Assets | | | 0 | | | | 312 | | | | 0 | | |
Total | | $ | 2,789,203 | | | $ | 125,861 | | | $ | 0 | | |
Offsetting assets and liabilities
Accounting Standards Codification 210 requires entities to disclose gross and net information about instruments and transactions eligible for offset on the Statement of Assets and Liabilities, and disclose instruments and transactions subject to master netting or similar agreements. This disclosure is limited to derivative instruments, repurchase and reverse repurchase agreements, and securities borrowing and lending transactions.
At March 31, 2018, certain Funds held open forward foreign currency contracts that were subject to a foreign exchange settlement and netting agreement with the same counterparty. The agreement includes provisions for general obligations, representations and certain events of default or termination. The agreement includes provisions for netting arrangements that may reduce credit risk and counterparty risk associated with relevant transactions, in the event a counterparty fails to meet its obligations. The net recognized assets or liabilities related to open forward foreign currency contracts are presented in the Statements of Assets and Liabilities. The gross recognized assets (appreciation) and liabilities (depreciation) by contract are presented in the forward foreign currency contract table included in the Fund's Schedule of Investments.
At March 31, 2018, each Fund held investments in repurchase agreements. The gross value of these investments and the value of the related collateral are presented in each Fund's Schedule of Investments. The value of the related collateral for each Fund exceeded the value of the repurchase agreements held at period end.
The value of the securities on loan and the value of the related collateral as of period end, if any, are included in the Securities lending section of Note 1 to Financial Statements.
Foreign currency translations
Certain Funds invest in foreign securities, which may involve a number of risk factors and special considerations not present with investments in securities of U.S. corporations. Values of investments and other assets and liabilities denominated in foreign currencies are translated into U.S. dollars at current exchange rates obtained by a recognized bank, dealer or independent pricing service on the day of valuation. Purchases and sales of investments and dividend and interest income are converted at the prevailing rate of exchange on the respective dates of such transactions.
The Funds do not isolate that portion of the results of operations resulting from changes in foreign exchange rates on investments from the fluctuations arising from changes in market prices of securities held. Such fluctuations are included in net realized gain (loss) on investments and net change in unrealized appreciation (depreciation) on investments in the Statements of Operations. Net realized gains and losses on foreign currency transactions arising from the sale of foreign currencies, currency gains or losses realized between the trade and settlement dates on securities transactions and the difference between the amounts of dividends, interest and tax reclaims recorded and the U.S. dollar equivalent of the amounts actually received or paid are included in net realized gain (loss) on foreign currency transactions in the Statements of Operations. Unrealized gains and losses arising from changes in the fair value of assets and liabilities, other than investments in securities, resulting from changes in exchange rates are included in net change in unrealized appreciation (depreciation) on foreign currency translation in the Statements of Operations.
Forward foreign currency contracts
Forward foreign currency contracts are agreements to exchange one currency for another at a future date and at a specified price. The Funds' transactions in forward foreign currency contracts are limited to transaction and portfolio hedging. The contractual amounts of forward foreign currency contracts do not necessarily represent the amounts potentially subject to risk. The measurement of the risks associated with these instruments is meaningful only when all related and offsetting transactions are considered and could exceed the net unrealized value shown in the tables below. Risks arise from the possible inability of counterparties to
Oakmark.com 63
Oakmark Funds
Notes to Financial Statements (continued)
meet the terms of their contracts and from movements in currency values. Forward foreign currency contracts are valued at the current day's interpolated foreign exchange rates. Unrealized gain or loss on the contracts as measured by the difference between the forward foreign exchange rates at the dates of entry into the contracts and the forward rates at the end of the period is included in the Statements of Assets and Liabilities. Realized gains and losses and the net change in unrealized appreciation (depreciation) on forward foreign currency contracts for the period are included in the Statements of Operations.
At March 31, 2018, Global, Global Select, International and Int'l Small Cap held non-collateralized, forward foreign currency contracts, which are considered derivative instruments, each of whose counterparty is State Street Bank and Trust Company ("State Street"), and are listed in the Fund's Schedule of Investments.
During the period ended March 31, 2018, the notional value of forward foreign currency contracts opened and the notional value of settled contracts is listed by the Fund in the table below (in thousands):
Fund | | Currency
Contracts Opened | | Currency
Contracts Settled | |
Global | | $ | 67,895 | | | $ | 55,851 | | |
Global Select | | | 112,216 | | | | 80,675 | | |
International | | | 1,165,073 | | | | 814,497 | | |
Int'l Small Cap | | | 51,840 | | | | 56,029 | | |
Security transactions and investment income
Security transactions are accounted for on the trade date (date the order to buy or sell is executed), and dividend income is recorded on the ex-dividend date, except that certain dividends from foreign securities are recorded as soon as the information becomes available after the ex-dividend date. Interest income and expenses are recorded on an accrual basis. Discount is accreted on long-term fixed income securities using the yield-to-maturity method. Premium is amortized on long-term fixed income securities using the yield-to-earliest call method. Withholding taxes and tax reclaims on foreign dividends have been provided for in accordance with the Funds' understanding of the applicable country's tax rules and rates. Net realized gains and losses on investments are determined by the specific identification method.
Short sales
Each Fund may sell a security it does not own in anticipation of a decline in the fair value of that security. When a Fund sells a security short, it must borrow the security sold short and deliver it to the broker-dealer through which it made the short sale. A gain, limited to the price at which the Fund sold the security short, or loss, unlimited in size, will be recognized upon the termination of the short sale. Each Fund may sell shares of when-issued securities. Typically, a Fund sells when-issued securities when a company announces a spin-off or re-organization, and the post-spin-off or post-re-organization shares begin trading on a when-issued basis prior to the effective date of the corporate action. A sale of a when-issued security is treated as a short sale for accounting purposes. After the effective date, when shares of the new company are received, any shares sold on a when-issued basis will be delivered to the counterparty. At March 31, 2018, none of the Funds had short sales.
When-issued or delayed-delivery securities
Each Fund may purchase securities on a when-issued or delayed-delivery basis. Although the payment and interest terms of these securities are established at the time a Fund enters into the commitment, the securities may be delivered and paid for a month or more after the date of purchase, when their value may have changed. A Fund makes such commitments only with the intention of actually acquiring the securities, but may sell the securities before the settlement date if the Adviser deems it advisable for investment reasons. At March 31, 2018, none of the Funds held when-issued securities.
Accounting for options
When a Fund writes an option, the premium received by the Fund is recorded as a liability and is subsequently adjusted to the current fair value of the option written. Premiums received from writing options that expire are recorded by the Fund on the expiration date as realized gains from option transactions. The difference between the premium and the amount paid on effecting a closing purchase transaction, including brokerage commissions, is also treated as a realized gain, or if the premium is less than the amount paid for the closing purchase transaction, as a realized loss. If a call option is exercised, the premium is added to the proceeds from the sale of the underlying security or currency in determining whether the Fund has realized a gain or a loss. If a put option is exercised, the premium reduces the cost basis of the security or currency purchased by the Fund. In writing an option, the Fund bears the market risk of an unfavorable change in the price of the security or currency underlying the written option. As the writer of a covered call option on a security, a Fund foregoes, during the option's life, the opportunity to profit from increases in the market value of the security covering the call option above the sum of the premium and the exercise price of the call. Exercise of an option written by the Fund could result in the Fund selling or buying a security or currency at a price different from the current fair value. Options written by the Fund do not give rise to counterparty credit risk, as they obligate the Fund, not its counterparties, to perform.
When a Fund purchases an option, the premium paid by the Fund is recorded as an asset and is subsequently adjusted to the current fair value of the option purchased. Purchasing call options tends to increase the Fund's exposure to the underlying instrument. Purchasing put options tends to decrease the Fund's exposure to the underlying instrument. Premiums paid for purchasing options that expire are treated as realized losses. Premiums paid for purchasing options that are exercised or closed are
64 OAKMARK FUNDS
Oakmark Funds
Notes to Financial Statements (continued)
added to the amounts paid or offset against the proceeds on the underlying security to determine the realized gain or loss. The risks associated with purchasing put and call options are potential loss of the premium paid and, in the instances of OTC derivatives, the failure of the counterparty to honor its obligation under the contract.
Oakmark and Select used options written for tax management purposes during the period ended March 31, 2018. Written options outstanding, if any, are listed on each Fund's Schedule of Investments.
Credit facility
The Trust has a $200 million committed unsecured line of credit and a $300 million uncommitted unsecured discretionary demand line of credit (the "Facility") with State Street. Borrowings under the facility bear interest at 1.25% above the greater of the Federal Funds Effective Rate or LIBOR, as defined in the credit agreement. To maintain the Facility, an annualized commitment fee of 0.20% on the unused committed portion is charged to the Trust. Fees and interest expense, if any, related to the Facility are included in other expenses in the Statements of Operations. There were no borrowings under the Facility during the period ended March 31, 2018.
Expense offset arrangement
State Street serves as custodian of the Funds. State Street's fee may be reduced by credits that are an earnings allowance calculated on the average daily cash balances each Fund maintains with State Street. Credit balances used to reduce the Funds' custodian fees, if any, are reported as a reduction of total expenses in the Statements of Operations. During the period ended March 31, 2018 none of the Funds received an expense offset credit.
Repurchase agreements
Each Fund may invest in repurchase agreements, which are short-term investments whereby the Fund acquires ownership of a debt security and the seller agrees to repurchase the security at a future date at a specified price.
The Funds' custodian receives delivery of the underlying securities collateralizing repurchase agreements. It is the Funds' policy that the value of the collateral be at least equal to 102% of the repurchase price, including interest. The Adviser is responsible for determining that the value of the collateral is at all times at least equal to 102% of the repurchase price, including interest. Repurchase agreements could involve certain risks in the event of default or insolvency of the counterparty, including possible delays or restrictions upon a Fund's ability to dispose of the underlying securities. At March 31, 2018 all of the Funds held repurchase agreements.
Security lending
Each Fund may lend its portfolio securities to broker-dealers and banks. Any such loan must be continuously secured by collateral in cash, cash equivalents or U.S. Treasury or agency securities maintained on a current basis in an amount at least equal to the fair value of the securities loaned by a Fund. The Fund would continue to receive the equivalent of the interest or dividends paid by the issuer on the securities loaned, and would also receive an additional return that may be in the form of a fixed fee or a percentage of the earnings on the collateral. The Fund has the right to call the loan and attempt to obtain the securities loaned at any time on notice of not more than five business days. In the event of bankruptcy or other default of the borrower, the Fund could experience delays in liquidating the loan collateral or recovering the loaned securities and incur expenses related to enforcing its rights. There could also be a decline in the value of the collateral or in the fair value of the securities loaned while the Fund seeks to enforce its rights thereto, and the Fund could experience subnormal levels of income or lack of access to income during that period. A Fund may not exercise proxy voting rights for a security that is on loan if it is unable to recall the security prior to the record date. The Trust, on behalf of the Funds, has entered into an agreement with State Street to serve as its agent for the purpose of lending securities and maintaining the collateral account. Security lending income, if any, net of any fees retained by the securities lending agent, is included in the Statement of Operations.
At March 31, 2018 International and Int'l Small Cap had securities on loan with a value of $870,105,714 and $22,300,303, respectively, and held as collateral for the loans U.S. Treasury securities with a value of $914,014,754 and $23,441,831, respectively.
Interfund lending
Pursuant to an exemptive order issued by the SEC, the Funds may participate in an interfund lending program. This program provides an alternative credit facility that allows the Funds to lend money to, and borrow money from, each other for temporary purposes (an "Interfund Loan"). All Interfund Loans are subject to conditions pursuant to the SEC exemptive order designed to ensure fair and equitable treatment of participating Funds. Any Interfund Loan would consist only of uninvested cash reserves that the lending Fund otherwise would invest in short-term repurchase agreements or other short-term instruments. There were no Interfund Loans during the period ended March 31, 2018.
Restricted securities
Each Fund may invest in restricted securities, which generally are considered illiquid, but such illiquid securities may not comprise over 15% of the value of a Fund's net assets at the time of investment. The following investments, the sales of which are subject to restrictions on resale under federal securities laws, have been valued in good faith according to the securities valuation procedures established by the Board of Trustees (as stated in the Security valuation section) since their acquisition dates.
Oakmark.com 65
Oakmark Funds
Notes to Financial Statements (continued)
At March 31, 2018 Equity and Income and International held the following restricted securities:
Equity and Income
Par Value
(000) | | Security
Name | | Acquisition
Date | | Cost
(000) | | Value
(000) | | Percentage of
Net Assets | |
$ | 70,853 | | | Activision Blizzard, Inc. | | 09/12/13 - 05/08/17 | | $ | 74,012 | | | $ | 74,113 | | | | 0.47 | % | |
| | 9,950 | | | Amazon.com, Inc. | | 08/15/17 | | | 9,933 | | | | 9,600 | | | | 0.06 | % | |
| | 99,500 | | | Anthem, Inc. | | 03/23/18 | | | 99,424 | | | | 99,424 | | | | 0.63 | % | |
| | 26,865 | | | BAT Capital Corp. | | 08/08/17 | | | 26,865 | | | | 26,182 | | | | 0.17 | % | |
| | 250 | | | CCO Holdings LLC / CCO Holdings Capital Corp. | | 03/09/17 | | | 248 | | | | 237 | | | | 0.00 | % | |
| | 24,875 | | | Caesars Resort Collection LLC / CRC Finco, Inc. | | 09/29/17 | | | 24,743 | | | | 23,847 | | | | 0.15 | % | |
| | 109,450 | | | Campbell Soup Co. | | 02/26/18 - 03/22/18 | | | 109,197 | | | | 109,181 | | | | 0.69 | % | |
| | 49,750 | | | Chevron Corp. | | 03/02/18 | | | 49,743 | | | | 49,743 | | | | 0.32 | % | |
| | 14,438 | | | CommScope Technologies LLC | | 03/02/17 - 06/22/17 | | | 14,299 | | | | 13,716 | | | | 0.09 | % | |
| | 3,980 | | | CommScope, Inc. | | 05/26/17 - 07/07/17 | | | 4,115 | | | | 4,057 | | | | 0.03 | % | |
| | 37,000 | | | Credit Suisse Group AG | | 12/04/13 - 06/11/14 | | | 37,000 | | | | 39,665 | | | | 0.25 | % | |
| | 17,665 | | | Dell International LLC / EMC Corp. | | 05/17/16 | | | 17,660 | | | | 18,625 | | | | 0.12 | % | |
| | 1,000 | | | Delphi Technologies PLC | | 09/14/17 | | | 995 | | | | 959 | | | | 0.01 | % | |
| | 4,910 | | | EMI Music Publishing Group North America
Holdings, Inc. | | 05/26/16 | | | 4,910 | | | | 5,315 | | | | 0.03 | % | |
| | 284,086 | | | General Mills, Inc. | | 03/08/18 - 03/29/18 | | | 283,928 | | | | 283,928 | | | | 1.80 | % | |
| | 19,900 | | | Glencore Funding LLC | | 10/20/17 | | | 19,779 | | | | 19,035 | | | | 0.12 | % | |
| | 100 | | | IHS Markit, Ltd. | | 02/06/17 | | | 100 | | | | 102 | | | | 0.00 | % | |
| | 44,200 | | | International Game Technology PLC | | 02/09/15 | | | 44,210 | | | | 46,545 | | | | 0.29 | % | |
| | 5,970 | | | Itron Inc. | | 12/08/17 | | | 5,948 | | | | 5,882 | | | | 0.04 | % | |
| | 2,000 | | | KFC Holding Co/Pizza Hut Holdings LLC/Taco
Bell of America LLC | | 06/02/16 | | | 2,000 | | | | 1,990 | | | | 0.01 | % | |
| | 39,500 | | | Kellogg Co. | | 03/16/18 - 03/19/18 | | | 39,491 | | | | 39,491 | | | | 0.25 | % | |
| | 199,000 | | | Kraft Food Group, Inc. | | 02/01/18 - 02/20/18 | | | 198,856 | | | | 198,856 | | | | 1.26 | % | |
| | 6,260 | | | Kraft Heinz Foods Co | | 02/17/16 - 02/23/16 | | | 6,573 | | | | 6,527 | | | | 0.04 | % | |
| | 1,990 | | | Lithia Motors, Inc. | | 07/17/17 | | | 1,990 | | | | 1,990 | | | | 0.01 | % | |
| | 21,910 | | | Live Nation Entertainment, Inc. | | 08/15/12 - 03/15/18 | | | 21,910 | | | | 21,644 | | | | 0.14 | % | |
| | 33,705 | | | MSCI, Inc. | | 08/10/15 - 09/01/16 | | | 34,625 | | | | 34,299 | | | | 0.22 | % | |
| | 4,980 | | | Mattel Inc. | | 12/15/17 | | | 4,980 | | | | 4,868 | | | | 0.03 | % | |
| | 94,600 | | | MetLife Short Term Funding LLC | | 02/20/18 - 03/29/18 | | | 94,416 | | | | 94,416 | | | | 0.60 | % | |
| | 16,349 | | | Mondelez International Holdings
Netherlands BV | | 01/03/17 - 01/25/17 | | | 15,976 | | | | 15,796 | | | | 0.10 | % | |
| | 25,870 | | | Netflix, Inc. | | 10/23/17 - 10/25/17 | | | 25,745 | | | | 24,877 | | | | 0.16 | % | |
| | 6,970 | | | Penn National Gaming, Inc. | | 01/17/17 | | | 6,970 | | | | 6,719 | | | | 0.04 | % | |
| | 3,000 | | | Post Holdings, Inc. | | 07/25/16 - 02/09/17 | | | 3,000 | | | | 2,890 | | | | 0.02 | % | |
| | 26,880 | | | Principal Life Global Funding II | | 11/14/16 - 01/03/17 | | | 26,847 | | | | 26,314 | | | | 0.17 | % | |
| | 7,800 | | | Quintiles IMS, Inc. | | 09/14/16 | | | 7,806 | | | | 7,772 | | | | 0.05 | % | |
| | 1,267 | | | S&P Global, Inc. | | 01/19/17 | | | 1,269 | | | | 1,266 | | | | 0.01 | % | |
| | 129,820 | | | Schlumberger Holdings Corp. | | 12/10/15 - 03/29/18 | | | 129,571 | | | | 129,704 | | | | 0.82 | % | |
| | 16,370 | | | Smithfield Foods, Inc. | | 01/25/17 - 09/28/17 | | | 16,359 | | | | 15,996 | | | | 0.10 | % | |
| | 1,990 | | | Station Casinos LLC | | 09/07/17 | | | 1,990 | | | | 1,891 | | | | 0.01 | % | |
| | 1,000 | | | Symantec Corp. | | 02/07/17 | | | 1,000 | | | | 1,009 | | | | 0.01 | % | |
| | 11,945 | | | The Howard Hughes Corp. | | 03/03/17 | | | 11,945 | | | | 11,796 | | | | 0.07 | % | |
| | 6,965 | | | USG Corp. | | 05/01/17 | | | 6,965 | | | | 7,035 | | | | 0.04 | % | |
| | 52,470 | | | Universal Health Services, Inc. | | 01/14/16 - 11/09/16 | | | 52,942 | | | | 53,081 | | | | 0.34 | % | |
| | 9,950 | | | Weatherford International LLC | | 02/21/18 | | | 9,885 | | | | 8,952 | | | | 0.06 | % | |
| | 12,140 | | | Wolverine World Wide, Inc. | | 09/16/16 - 05/11/17 | | | 12,070 | | | | 11,837 | | | | 0.08 | % | |
| | | | | | | | | $ | 1,561,172 | | | $ | 9.91 | % | |
66 OAKMARK FUNDS
Oakmark Funds
Notes to Financial Statements (continued)
International
Par Value
(000) | | Security
Name | | Acquisition
Date | | Cost
(000) | | Value
(000) | | Percentage of
Net Assets | |
$ | 50,000 | | | Abbvie, Inc. | | 03/15/18 | | $ | 49,997 | | | $ | 49,997 | | | | 0.11 | % | |
| | 85,000 | | | Anthem, Inc. | | 03/02/18 - 03/23/18 | | | 84,923 | | | | 84,923 | | | | 0.18 | % | |
| | 50,000 | | | Chevron Corp. | | 03/02/18 | | | 49,993 | | | | 49,993 | | | | 0.11 | % | |
| | 90,000 | | | General Mills, Inc. | | 03/07/18 - 03/14/18 | | | 89,952 | | | | 89,952 | | | | 0.20 | % | |
| | 25,000 | | | Kraft Food Group, Inc. | | 02/12/18 | | | 24,990 | | | | 24,990 | | | | 0.05 | % | |
| | | | | | | | | $ | 299,855 | | | | 0.65 | % | |
Federal income taxes
It is each Fund's policy to comply with the requirements of the Internal Revenue Code applicable to regulated investment companies and to distribute substantially all of its net taxable income, including any net realized gains on investments, to its shareholders. Therefore, no federal income tax provision is required. There is no material liability for unrecognized tax benefits in the accompanying financial statements. Generally, each of the tax years in the four-year period ended September 30, 2017 remains subject to examination by taxing authorities.
2. TRANSACTIONS WITH AFFILIATES
Each Fund has an investment advisory agreement with the Adviser. For management services and facilities furnished, the Adviser receives from each Fund a monthly fee based on that Fund's net assets at the end of the preceding month. Annual fee rates are as follows:
Fund | | Advisory Fees | |
Oakmark
| | 1.00% up to $2 billion;
0.90% on the next $1 billion;
0.80% on the next $2 billion;
0.75% on the next $2.5 billion;
0.675% on the next $2.5 billion;
0.625% on the next $2.5 billion;
0.620% on the next $12.5 billion;
0.615% on the next $10 billion; and
0.610% over $35 billion | |
Select
| | 1.00% up to $1 billion;
0.95% on the next $500 million;
0.90% on the next $500 million;
0.85% on the next $500 million;
0.80% on the next $2.5 billion;
0.75% on the next $5 billion; and
0.725% over $10 billion | |
Equity and Income
| | 0.75% up to $5 billion;
0.70% on the next $2.5 billion;
0.675% on the next $2.5 billion;
0.65% on the next $2.5 billion;
0.60% on the next $3.5 billion;
0.585% on the next $5 billion;
0.5775% on the next $7 billion; and
0.5725% over $28 billion | |
Fund | | Advisory Fees | |
Global
| | 1.00% up to $2 billion;
0.95% on the next $2 billion;
0.90% on the next $4 billion; and
0.875% over $8 billion | |
Global Select
| | 1.00% up to $2 billion;
0.95% on the next $1 billion;
0.875% on the next $4 billion; and
0.85% over $7 billion | |
International
| | 1.00% up to $2 billion;
0.95% on the next $1 billion;
0.85% on the next $2 billion;
0.825% on the next $2.5 billion;
0.815% on the next $3.5 billion;
0.805% on the next $5.5 billion;
0.80% on the next $6.5 billion;
0.795% on the next $7 billion;
0.790% on the next $5 billion;
0.785% on the next $10 billion;
0.775% on the next $5 billion; and
0.770% over $50 billion | |
Int'l Small Cap
| | 1.25% up to $500 million;
1.10% on the next $1 billion;
1.05% on the next $2 billion;
1.025% on the next $1.5 billion; and
1.00% over $5 billion | |
The Adviser has contractually agreed, through January 28, 2019, to waive the advisory fee otherwise payable to it by the following percentages with respect to each Fund: 0.043% for Oakmark; 0.074% for Select; 0.099% for Equity and Income; 0.059% for Global; 0.066% for Global Select; and 0.052% for International. When determining whether a Fund's total expenses exceed the additional contractual expense cap described below, a Fund's net advisory fee, reflecting application of the advisory fee waiver, will be used to calculate a Fund's total expenses. The Adviser is not entitled to collect on or make a claim for waived fees that are the subject of this undertaking at any time in the future. This arrangement may only be modified or amended with approval from a Fund and the Adviser. The advisory fees waived for each Fund are included in the Statement of Operations.
The Adviser has contractually agreed, through January 28, 2019, to reimburse each Fund Class to the extent, but only to the extent, that the annualized expenses (excluding taxes, interest, all commissions and other normal charges incident to the
Oakmark.com 67
Oakmark Funds
Notes to Financial Statements (continued)
purchase and sale of portfolio securities, and extraordinary charges such as litigation costs, but including fees paid to the Adviser) exceed the percent set forth below of average daily net assets of each Fund Class.
Fund | | Investor
Class | | Advisor
Class | | Institutional
Class | | Service
Class | |
Oakmark | | | 1.50 | % | | | 1.40 | % | | | 1.30 | % | | | 1.75 | % | |
Select | | | 1.50 | | | | 1.40 | | | | 1.30 | | | | 1.75 | | |
Equity and Income | | | 1.00 | | | | 0.90 | | | | 0.80 | | | | 1.25 | | |
Global | | | 1.75 | | | | 1.65 | | | | 1.55 | | | | 2.00 | | |
Global Select | | | 1.75 | | | | 1.65 | | | | 1.55 | | | | 2.00 | | |
International | | | 2.00 | | | | 1.90 | | | | 1.80 | | | | 2.25 | | |
Int'l Small Cap | | | 2.00 | | | | 1.90 | | | | 1.80 | | | | 2.25 | | |
The Adviser is entitled to recoup from assets attributable to any Fund Class amounts reimbursed to that Fund Class, except to the extent that the Fund Class already has paid such recoupment to the Adviser or such recoupment would cause that Class' total operating expenses to exceed the expense limitation or to exceed any lower limit in effect at the time of recoupment. Any such repayment must be made within three fiscal years after the year in which the reimbursement occurred. As of March 31, 2018, there were no amounts subject to recoupment.
The Adviser has voluntarily reimbursed certain of the Funds for a portion of Transfer Agency costs. For the period ended March 31, 2018, the Adviser reimbursed $3,865 and $68,421 to Oakmark and International for transfer agency expenses related to Institutional Class Shares. These amounts are not subject to recovery under the contractual expense reimbursement agreement described above.
The Adviser and/or the Funds have entered into agreements with financial intermediaries to provide recordkeeping, processing, shareholder communications and other services to customers of the intermediaries and have agreed to compensate the intermediaries for providing those services. Certain of those services would be provided by the Funds if the shares of those customers were registered directly with the Funds' transfer agent. Accordingly, the Funds pay a portion of the intermediary fees pursuant to an agreement with the Adviser and the Adviser pays the remainder of the fees. The fees incurred by the Funds are reflected as other shareholder servicing fees in the Statements of Operations.
The Independent Trustees of the Trust may participate in the Trust's Deferred Compensation Plan for Independent Trustees. Participants in the plan may elect to defer all or a portion of their compensation. Amounts deferred are retained by the Trust and represent an unfunded obligation of the Trust. The value of a participant's deferral account is determined by reference to the change in value of Investor Class shares of one or more of the Funds or a money market fund as specified by the participant. Benefits would be payable after a stated number of years or retirement from the Board of Trustees. The accrued obligations of the Funds under the plan are reflected as deferred Trustee compensation in the Statements of Assets and Liabilities. The change in the accrued obligations for the period is included in Trustees fees in the Statements of Operations. The Trust pays the compensation of the Trustees other than those affiliated with the Adviser and all expenses incurred in connection with their services to the Trust. The Trust does not provide any pension or retirement benefits to its Trustees.
The Funds reimburse the Adviser for a portion of the compensation paid to the Funds' Chief Compliance Officer ("CCO"). The CCO expenses incurred by the Funds are included in other expenses in the Statements of Operations.
3. FEDERAL INCOME TAXES
At March 31, 2018 the cost of investments for federal income tax purposes and related composition of unrealized gains and losses for each Fund were as follows (in thousands):
Fund | | Cost of Investments
for Federal Income
Tax Purposes | | Gross Unrealized
Appreciation | | Gross Unrealized
(Depreciation) | | Net Unrealized
Appreciation
(Depreciation) | |
Oakmark | | $ | 12,255,906 | | | $ | 7,449,437 | | | $ | (279,890 | ) | | $ | 7,169,547 | | |
Select | | | 4,435,792 | | | | 2,248,603 | | | | (315,631 | ) | | | 1,932,972 | | |
Equity and Income | | | 11,849,867 | | | | 4,178,879 | | | | (95,092 | ) | | | 4,083,787 | | |
Global | | | 1,978,469 | | | | 681,203 | | | | (49,625 | ) | | | 631,578 | | |
Global Select | | | 2,352,822 | | | | 596,293 | | | | (125,424 | ) | | | 470,869 | | |
International | | | 42,005,551 | | | | 6,328,936 | | | | (1,904,445 | ) | | | 4,424,491 | | |
Int'l Small Cap | | | 2,901,486 | | | | 350,246 | | | | (336,676 | ) | | | 13,570 | | |
68 OAKMARK FUNDS
Oakmark Funds
Notes to Financial Statements (continued)
At March 31, 2018, the components of distributable earnings on a tax basis (excluding unrealized appreciation (depreciation)) were as follows (in thousands):
| | | Undistributed
Ordinary Income | | Undistributed Long-
Term Gain | | Total Distributable
Earnings | |
Oakmark | | $ | 27,826 | | | $ | 995,527 | | | $ | 1,023,353 | | |
Select | | | 1,837 | | | | 381,000 | | | | 382,837 | | |
Equity and Income | | | 53,159 | | | | 836,307 | | | | 889,466 | | |
Global | | | 0 | | | | 108,393 | | | | 108,393 | | |
Global Select | | | 0 | | | | 16,610 | | | | 16,610 | | |
International | | | 40,092 | | | | 996,703 | | | | 1,036,795 | | |
Int'l Small Cap | | | 376 | | | | 202,467 | | | | 202,843 | | |
During the six-month period ended March 31, 2018, and the year ended September 30, 2017, the tax character of distributions paid was as follows (in thousands):
| | Period Ended
March 31, 2018 | | Year Ended
September 30, 2017 | |
Fund | | Distributions Paid
from Ordinary
Income | | Distributions Paid
from Long-Term
Capital Gain | | Distributions Paid
from Ordinary
Income | | Distributions Paid
from Long-Term
Capital Gain | |
Oakmark | | $ | 97,786 | | | $ | 679,189 | | | $ | 164,730 | | | $ | 239,263 | | |
Select | | | 19,610 | | | | 239,694 | | | | 48,723 | | | | 205,002 | | |
Equity and Income | | | 216,184 | | | | 1,026,696 | | | | 240,000 | | | | 411,885 | | |
Global | | | 36,069 | | | | 158,299 | | | | 26,380 | | | | 0 | | |
Global Select | | | 26,254 | | | | 125,537 | | | | 21,509 | | | | 0 | | |
International | | | 580,202 | | | | 706,153 | | | | 367,268 | | | | 0 | | |
Int'l Small Cap | | | 37,634 | | | | 74,020 | | | | 56,246 | | | | 13,933 | | |
On March 31, 2018, the Funds had temporary book/tax differences in undistributed earnings that were primarily attributable to trustee deferred compensation expenses, passive foreign investment companies, foreign currency contracts and deferrals of capital losses on wash sales. Temporary differences will reverse over time. The Funds have permanent differences in book/tax undistributed earnings primarily attributable to currency gains and losses, equalization debits, and distribution re-designations. Permanent differences have been recorded in their respective component of the Analysis of Net Assets.
During the six-month period ended March 31, 2018, the following amounts were classified due to permanent differences between book and tax accounting. (In thousands):
Fund | | Paid in Capital | | Accumulated Net
Realized Gain (Loss)
on Investments | | Undistributed
Net Investment
Income (Loss) | |
Oakmark | | $ | 171,871 | | | $ | (138,505 | ) | | $ | (33,366 | ) | |
Select | | | 41,749 | | | | (38,501 | ) | | | (3,248 | ) | |
Equity and Income | | | 149,759 | | | | (118,834 | ) | | | (30,925 | ) | |
Global | | | 61,807 | | | | (65,011 | ) | | | 3,204 | | |
Global Select | | | 35,863 | | | | (33,641 | ) | | | (2,222 | ) | |
International | | | 103,404 | | | | (129,873 | ) | | | 26,469 | | |
Int'l Small Cap | | | 18,902 | | | | (11,436 | ) | | | (7,466 | ) | |
4. INVESTMENT TRANSACTIONS
For the six-month period ended March 31, 2018, transactions in investment securities (excluding short-term and U.S. government securities) were as follows (in thousands):
| | | Oakmark | | Select | | Equity and
Income | | Global | | Global
Select | | International | | Int'l
Small Cap | |
Purchases | | $ | 2,786,486 | | | $ | 1,260,259 | | | $ | 1,362,307 | | | $ | 325,246 | | | $ | 160,088 | | | $ | 11,617,932 | | | $ | 758,445 | | |
Proceeds from sales | | | 2,937,852 | | | | 1,455,188 | | | | 2,179,823 | | | | 434,970 | | | | 119,673 | | | | 5,947,461 | | | | 803,032 | | |
Oakmark.com 69
Oakmark Funds
Notes to Financial Statements (continued)
Purchases at cost and proceeds from sales (in thousands) of long-term U.S. government securities for the six-month period ended March 31, 2018, were $247,508 and $0, respectively, for Equity and Income.
During the six-month period ended March 31, 2018, Oakmark and Select engaged in sale transactions (in thousands) totaling $442,037, respectively, with funds that have a common investment adviser. These sale transactions complied with Rule 17a-7 under the 1940 act.
5. INVESTMENTS IN AFFILIATED ISSUERS
A company was considered to be an affiliate of a Fund because that Fund owned 5% or more of the company's voting securities during all or part of the six-month period ended March 31, 2018. Purchase and sale transactions and dividend and interest income earned during the period on these securities are listed after the Fund's Schedule of Investments.
6. SUBSEQUENT EVENTS
Management has evaluated the possibility of subsequent events existing in the Funds' financial statements. Management has determined that there are no material events that would require adjustment or disclosure in the Funds' financial statements through the date of the publication of this report.
70 OAKMARK FUNDS

This page intentionally left blank.
Oakmark.com 71
Oakmark Funds
Financial Highlights
For a share outstanding throughout each period
| | | | | Income from Investment Operations: | | Less Distributions: | | | | | | Ratios/Supplemental Data: | | | |
| | | Net Asset
Value,
Beginning of
Period | | Net
Investment
Income
(Loss) | | Net Gain
(Loss) on
Investments
(both
realized and
unrealized) | | Total From
Investment
Operations | | Dividends
From Net
Investment
Income | | Distributions
From
Capital
Gains | | Total
Distributions | | Redemption
Fees | | Net Asset
Value,
End of
Period | | Total
Return | | Net Assets,
End of
Period
($million) | | Ratio of
Net
Expenses
to Average
Net Assets | | Ratio of Net
Investment
Income
(Loss) to
Average
Net Assets | | Ratio of
Gross
Expenses to
Average Net
Assets | | Portfolio
Turnover
Rate | |
Oakmark Fund | |
Investor Class | |
10/1/17-3/31/18+ | | $ | 82.85 | | | | 0.29 | | | | 3.88 | | | | 4.17 | | | | (0.40 | ) | | | (3.03 | ) | | | (3.43 | ) | | | 0.00 | | | $ | 83.59 | | | | 5.05 | % | | $ | 13,806.5 | | | | 0.84 | %† | | | 0.61 | %† | | | 0.88 | %† | | | 15 | % | |
9/30/17 | | $ | 68.70 | | | | 0.76 | | | | 15.26 | | | | 16.02 | | | | (0.77 | ) | | | (1.10 | ) | | | (1.87 | ) | | | 0.00 | | | $ | 82.85 | | | | 23.79 | % | | $ | 14,200.2 | | | | 0.86 | % | | | 0.91 | % | | | 0.90 | % | | | 19 | % | |
9/30/16 | | $ | 60.93 | | | | 0.82 | | | | 7.85 | | | | 8.67 | | | | (0.60 | ) | | | (0.30 | ) | | | (0.90 | ) | | | 0.00 | | | $ | 68.70 | | | | 14.36 | % | | $ | 14,636.0 | | | | 0.89 | % | | | 1.14 | % | | | 0.89 | % | | | 20 | % | |
9/30/15 | | $ | 68.46 | | | | 0.59 | | | | (3.57 | ) | | | (2.98 | ) | | | (0.42 | ) | | | (4.13 | ) | | | (4.55 | ) | | | 0.00 | | | $ | 60.93 | | | | -4.87 | % | | $ | 16,445.0 | | | | 0.85 | %(a) | | | 0.92 | % | | | 0.85 | %(a) | | | 33 | % | |
9/30/14 | | $ | 59.73 | | | | 0.43 | | | | 11.22 | | | | 11.65 | | | | (0.32 | ) | | | (2.60 | ) | | | (2.92 | ) | | | 0.00 | | | $ | 68.46 | | | | 20.01 | % | | $ | 16,489.4 | | | | 0.87 | % | | | 0.76 | % | | | 0.87 | % | | | 25 | % | |
9/30/13 | | $ | 48.97 | | | | 0.42 | (b) | | | 12.22 | | | | 12.64 | | | | (0.38 | ) | | | (1.50 | ) | | | (1.88 | ) | | | 0.00 | | | $ | 59.73 | | | | 26.75 | % | | $ | 10,409.0 | | | | 0.95 | % | | | 0.78 | % | | | 0.95 | % | | | 19 | % | |
Advisor Class | |
10/1/17-3/31/18+ | | $ | 82.97 | | | | 0.30 | (b) | | | 3.91 | | | | 4.21 | | | | (0.54 | ) | | | (3.03 | ) | | | (3.57 | ) | | | 0.00 | | | $ | 83.61 | | | | 5.09 | % | | $ | 2,404.1 | | | | 0.75 | %† | | | 0.69 | %† | | | 0.79 | %† | | | 15 | % | |
9/30/17(c) | | $ | 71.35 | | | | 0.66 | (b) | | | 10.96 | | | | 11.62 | | | | 0.00 | | | | 0.00 | | | | 0.00 | | | | 0.00 | | | $ | 82.97 | | | | 16.29 | % | | $ | 1,839.8 | | | | 0.72 | %† | | | 1.01 | %† | | | 0.76 | %† | | | 19 | % | |
Institutional Class | |
10/1/17-3/31/18+ | | $ | 82.97 | | | | 0.32 | (b) | | | 3.91 | | | | 4.23 | | | | (0.56 | ) | | | (3.03 | ) | | | (3.59 | ) | | | 0.00 | | | $ | 83.61 | | | | 5.12 | % | | $ | 2,996.4 | | | | 0.70 | %† | | | 0.75 | %† | | | 0.74 | %† | | | 15 | % | |
9/30/17(c) | | $ | 71.35 | | | | 0.67 | (b) | | | 10.95 | | | | 11.62 | | | | 0.00 | | | | 0.00 | | | | 0.00 | | | | 0.00 | | | $ | 82.97 | | | | 16.29 | % | | $ | 2,569.2 | | | | 0.68 | %† | | | 1.02 | %† | | | 0.73 | %† | | | 19 | % | |
Service Class | |
10/1/17-3/31/18+ | | $ | 82.48 | | | | 0.13 | (b) | | | 3.88 | | | | 4.01 | | | | (0.19 | ) | | | (3.03 | ) | | | (3.22 | ) | | | 0.00 | | | $ | 83.27 | | | | 4.88 | % | | $ | 154.3 | | | | 1.14 | %† | | | 0.31 | %† | | | 1.18 | %† | | | 15 | % | |
9/30/17 | | $ | 68.34 | | | | 0.47 | (b) | | | 15.28 | | | | 15.75 | | | | (0.51 | ) | | | (1.10 | ) | | | (1.61 | ) | | | 0.00 | | | $ | 82.48 | | | | 23.45 | % | | $ | 168.4 | | | | 1.14 | % | | | 0.63 | % | | | 1.18 | % | | | 19 | % | |
9/30/16 | | $ | 60.59 | | | | 0.59 | | | | 7.83 | | | | 8.42 | | | | (0.37 | ) | | | (0.30 | ) | | | (0.67 | ) | | | 0.00 | | | $ | 68.34 | | | | 14.00 | % | | $ | 177.2 | | | | 1.21 | % | | | 0.86 | % | | | 1.21 | % | | | 20 | % | |
9/30/15 | | $ | 68.18 | | | | 0.38 | (b) | | | (3.56 | ) | | | (3.18 | ) | | | (0.28 | ) | | | (4.13 | ) | | | (4.41 | ) | | | 0.00 | | | $ | 60.59 | | | | -5.19 | % | | $ | 194.4 | | | | 1.19 | %(a) | | | 0.57 | % | | | 1.19 | %(a) | | | 33 | % | |
9/30/14 | | $ | 59.58 | | | | 0.23 | | | | 11.19 | | | | 11.42 | | | | (0.22 | ) | | | (2.60 | ) | | | (2.82 | ) | | | 0.00 | | | $ | 68.18 | | | | 19.64 | % | | $ | 170.7 | | | | 1.18 | % | | | 0.45 | % | | | 1.18 | % | | | 25 | % | |
9/30/13 | | $ | 48.89 | | | | 0.27 | (b) | | | 12.20 | | | | 12.47 | | | | (0.28 | ) | | | (1.50 | ) | | | (1.78 | ) | | | 0.00 | | | $ | 59.58 | | | | 26.41 | % | | $ | 93.8 | | | | 1.23 | % | | | 0.49 | % | | | 1.23 | % | | | 19 | % | |
| + | | Unaudited. | |
† | | Data has been annualized. | |
(a) | | Includes interest expense that amounts to less than 0.01%. | |
(b) | | Computed using average shares outstanding throughout the period. | |
(c) | | Commenced on 11/30/2016. | |
Oakmark Select Fund | |
Investor Class | |
10/1/17-3/31/18+ | | $ | 47.84 | | | | 0.06 | | | | 0.01 | | | | 0.07 | | | | (0.14 | ) | | | (1.87 | ) | | | (2.01 | ) | | | 0.00 | | | $ | 45.90 | | | | 0.06 | % | | $ | 4,630.7 | | | | 0.96 | %† | | | 0.19 | %† | | | 1.03 | %† | | | 21 | % | |
9/30/17 | | $ | 40.99 | | | | 0.17 | | | | 8.78 | | | | 8.95 | | | | (0.40 | ) | | | (1.70 | ) | | | (2.10 | ) | | | 0.00 | | | $ | 47.84 | | | | 22.61 | % | | $ | 4,854.7 | | | | 0.96 | % | | | 0.39 | % | | | 1.03 | % | | | 22 | % | |
9/30/16 | | $ | 36.79 | | | | 0.39 | | | | 3.93 | | | | 4.32 | | | | (0.12 | ) | | | 0.00 | | | | (0.12 | ) | | | 0.00 | | | $ | 40.99 | | | | 11.76 | % | | $ | 4,962.7 | | | | 0.98 | % | | | 0.92 | % | | | 0.98 | % | | | 38 | % | |
9/30/15 | | $ | 44.71 | | | | 0.08 | (a) | | | (2.60 | ) | | | (2.52 | ) | | | 0.00 | | | | (5.40 | ) | | | (5.40 | ) | | | 0.00 | | | $ | 36.79 | | | | -6.75 | % | | $ | 5,499.3 | | | | 0.95 | % | | | 0.20 | % | | | 0.95 | % | | | 46 | % | |
9/30/14 | | $ | 37.74 | | | | (0.00 | )(b) | | | 9.14 | | | | 9.14 | | | | (0.04 | ) | | | (2.13 | ) | | | (2.17 | ) | | | 0.00 | | | $ | 44.71 | | | | 25.03 | % | | $ | 6,238.8 | | | | 0.95 | % | | | (0.03 | )% | | | 0.95 | % | | | 37 | % | |
9/30/13 | | $ | 32.33 | | | | 0.04 | | | | 8.40 | | | | 8.44 | | | | (0.03 | ) | | | (3.00 | ) | | | (3.03 | ) | | | 0.00 | | | $ | 37.74 | | | | 28.40 | % | | $ | 3,944.6 | | | | 1.01 | % | | | 0.11 | % | | | 1.01 | % | | | 24 | % | |
Advisor Class | |
10/1/17-3/31/18+ | | $ | 47.90 | | | | 0.08 | (a) | | | 0.02 | | | | 0.10 | | | | (0.21 | ) | | | (1.87 | ) | | | (2.08 | ) | | | 0.00 | | | $ | 45.92 | | | | 0.13 | % | | $ | 677.2 | | | | 0.81 | %† | | | 0.33 | %† | | | 0.89 | %† | | | 21 | % | |
9/30/17(c) | | $ | 41.93 | | | | 0.20 | (a) | | | 5.77 | | | | 5.97 | | | | 0.00 | | | | 0.00 | | | | 0.00 | | | | 0.00 | | | $ | 47.90 | | | | 14.24 | % | | $ | 571.3 | | | | 0.81 | %† | | | 0.54 | %† | | | 0.89 | %† | | | 22 | % | |
Institutional Class | |
10/1/17-3/31/18+ | | $ | 47.91 | | | | 0.09 | (a) | | | 0.02 | | | | 0.11 | | | | (0.22 | ) | | | (1.87 | ) | | | (2.09 | ) | | | 0.00 | | | $ | 45.93 | | | | 0.14 | % | | $ | 799.5 | | | | 0.79 | %† | | | 0.35 | %† | | | 0.87 | %† | | | 21 | % | |
9/30/17(c) | | $ | 41.93 | | | | 0.22 | (a) | | | 5.76 | | | | 5.98 | | | | 0.00 | | | | 0.00 | | | | 0.00 | | | | 0.00 | | | $ | 47.91 | | | | 14.26 | % | | $ | 768.9 | | | | 0.79 | %† | | | 0.58 | %† | | | 0.87 | %† | | | 22 | % | |
Service Class | |
10/1/17-3/31/18+ | | $ | 47.21 | | | | (0.03 | )(a) | | | 0.01 | | | | (0.02 | ) | | | 0.00 | | | | (1.87 | ) | | | (1.87 | ) | | | 0.00 | | | $ | 45.32 | | | | -0.12 | % | | $ | 18.3 | | | | 1.31 | %† | | | (0.14 | )%† | | | 1.38 | %† | | | 21 | % | |
9/30/17 | | $ | 40.44 | | | | 0.05 | (a) | | | 8.68 | | | | 8.73 | | | | (0.26 | ) | | | (1.70 | ) | | | (1.96 | ) | | | 0.00 | | | $ | 47.21 | | | | 22.29 | % | | $ | 27.9 | | | | 1.24 | % | | | 0.11 | % | | | 1.31 | % | | | 22 | % | |
9/30/16 | | $ | 36.31 | | | | 0.23 | (a) | | | 3.90 | | | | 4.13 | | | | 0.00 | | | | 0.00 | | | | 0.00 | | | | 0.00 | | | $ | 40.44 | | | | 11.37 | % | | $ | 34.6 | | | | 1.32 | % | | | 0.62 | % | | | 1.32 | % | | | 38 | % | |
9/30/15 | | $ | 44.32 | | | | (0.05 | )(a) | | | (2.56 | ) | | | (2.61 | ) | | | 0.00 | | | | (5.40 | ) | | | (5.40 | ) | | | 0.00 | | | $ | 36.31 | | | | -7.04 | % | | $ | 36.8 | | | | 1.27 | % | | | (0.12 | )% | | | 1.27 | % | | | 46 | % | |
9/30/14 | | $ | 37.50 | | | | (0.18 | ) | | | 9.13 | | | | 8.95 | | | | 0.00 | | | | (2.13 | ) | | | (2.13 | ) | | | 0.00 | | | $ | 44.32 | | | | 24.66 | % | | $ | 24.4 | | | | 1.23 | % | | | (0.30 | )% | | | 1.23 | % | | | 37 | % | |
9/30/13 | | $ | 32.21 | | | | (0.11 | ) | | | 8.40 | | | | 8.29 | | | | 0.00 | | | | (3.00 | ) | | | (3.00 | ) | | | 0.00 | | | $ | 37.50 | | | | 27.99 | % | | $ | 15.0 | | | | 1.33 | % | | | (0.21 | )% | | | 1.33 | % | | | 24 | % | |
| + | | Unaudited. | |
† | | Data has been annualized. | |
(a) | | Computed using average shares outstanding throughout the period. | |
(b) | | Amount rounds to less than $0.01 per share. | |
(c) | | Commenced on 11/30/2016. | |
72 OAKMARK FUNDS
Oakmark.com 73
Oakmark Funds
Financial Highlights
For a share outstanding throughout each period
| | | | | Income from Investment Operations: | | Less Distributions: | | | | | | Ratios/Supplemental Data: | | | |
| | | Net Asset
Value,
Beginning of
Period | | Net
Investment
Income
(Loss) | | Net Gain
(Loss) on
Investments
(both
realized and
unrealized) | | Total From
Investment
Operations | | Dividends
From Net
Investment
Income | | Distributions
From
Capital
Gains | | Total
Distributions | | Redemption
Fees | | Net Asset
Value,
End of
Period | | Total
Return | | Net Assets,
End of
Period
($million) | | Ratio of
Net
Expenses
to Average
Net Assets | | Ratio of Net
Investment
Income
(Loss) to
Average
Net Assets | | Ratio of
Gross
Expenses to
Average Net
Assets | | Portfolio
Turnover
Rate | |
Oakmark Equity and Income Fund | |
Investor Class | |
10/1/17-3/31/18+ | | $ | 33.41 | | | | 0.21 | (a) | | | 0.65 | | | | 0.86 | | | | (0.43 | ) | | | (2.17 | ) | | | (2.60 | ) | | | 0.00 | | | $ | 31.67 | | | | 2.53 | % | | $ | 12,877.1 | | | | 0.78 | %† | | | 1.27 | %† | | | 0.88 | %† | | | 11 | % | |
9/30/17 | | $ | 30.20 | | | | 0.58 | | | | 3.89 | | | | 4.47 | | | | (0.47 | ) | | | (0.79 | ) | | | (1.26 | ) | | | 0.00 | | | $ | 33.41 | | | | 15.30 | % | | $ | 14,249.1 | | | | 0.78 | % | | | 1.71 | % | | | 0.87 | % | | | 18 | % | |
9/30/16 | | $ | 29.98 | | | | 0.36 | (a) | | | 1.73 | | | | 2.09 | | | | (0.34 | ) | | | (1.53 | ) | | | (1.87 | ) | | | 0.00 | | | $ | 30.20 | | | | 7.34 | % | | $ | 15,367.7 | | | | 0.79 | % | | | 1.22 | % | | | 0.79 | % | | | 18 | % | |
9/30/15 | | $ | 33.65 | | | | 0.36 | | | | (1.04 | ) | | | (0.68 | ) | | | (0.27 | ) | | | (2.72 | ) | | | (2.99 | ) | | | 0.00 | | | $ | 29.98 | | | | -2.53 | % | | $ | 17,285.5 | | | | 0.75 | % | | | 1.06 | % | | | 0.75 | % | | | 25 | % | |
9/30/14 | | $ | 33.06 | | | | 0.29 | | | | 3.02 | | | | 3.31 | | | | (0.17 | ) | | | (2.55 | ) | | | (2.72 | ) | | | 0.00 | | | $ | 33.65 | | | | 10.39 | % | | $ | 19,392.7 | | | | 0.74 | % | | | 0.85 | % | | | 0.74 | % | | | 18 | % | |
9/30/13 | | $ | 29.09 | | | | 0.28 | | | | 4.68 | | | | 4.96 | | | | (0.27 | ) | | | (0.72 | ) | | | (0.99 | ) | | | 0.00 | | | $ | 33.06 | | | | 17.63 | % | | $ | 18,222.5 | | | | 0.77 | % | | | 0.89 | % | | | 0.77 | % | | | 25 | %(b) | |
Advisor Class | |
10/1/17-3/31/18+ | | $ | 33.46 | | | | 0.24 | (a) | | | 0.65 | | | | 0.89 | | | | (0.50 | ) | | | (2.17 | ) | | | (2.67 | ) | | | 0.00 | | | $ | 31.68 | | | | 2.60 | % | | $ | 1,510.0 | | | | 0.65 | %† | | | 1.47 | %† | | | 0.75 | %† | | | 11 | % | |
9/30/17(c) | | $ | 29.97 | | | | 0.55 | (a) | | | 2.94 | | | | 3.49 | | | | 0.00 | | | | 0.00 | | | | 0.00 | | | | 0.00 | | | $ | 33.46 | | | | 11.64 | % | | $ | 724.7 | | | | 0.61 | %† | | | 2.07 | %† | | | 0.71 | %† | | | 18 | % | |
Institutional Class | |
10/1/17-3/31/18+ | | $ | 33.46 | | | | 0.25 | (a) | | | 0.65 | | | | 0.90 | | | | (0.50 | ) | | | (2.17 | ) | | | (2.67 | ) | | | 0.00 | | | $ | 31.69 | | | | 2.65 | % | | $ | 861.7 | | | | 0.59 | %† | | | 1.50 | %† | | | 0.69 | %† | | | 11 | % | |
9/30/17(c) | | $ | 29.97 | | | | 0.59 | (a) | | | 2.90 | | | | 3.49 | | | | 0.00 | | | | 0.00 | | | | 0.00 | | | | 0.00 | | | $ | 33.46 | | | | 11.64 | % | | $ | 536.3 | | | | 0.59 | %† | | | 2.19 | %† | | | 0.69 | %† | | | 18 | % | |
Service Class | |
10/1/17-3/31/18+ | | $ | 33.19 | | | | 0.16 | (a) | | | 0.65 | | | | 0.81 | | | | (0.34 | ) | | | (2.17 | ) | | | (2.51 | ) | | | 0.00 | | | $ | 31.49 | | | | 2.39 | % | | $ | 543.2 | | | | 1.06 | %† | | | 0.99 | %† | | | 1.16 | %† | | | 11 | % | |
9/30/17 | | $ | 30.00 | | | | 0.45 | | | | 3.90 | | | | 4.35 | | | | (0.37 | ) | | | (0.79 | ) | | | (1.16 | ) | | | 0.00 | | | $ | 33.19 | | | | 14.95 | % | | $ | 622.1 | | | | 1.05 | % | | | 1.44 | % | | | 1.14 | % | | | 18 | % | |
9/30/16 | | $ | 29.75 | | | | 0.26 | (a) | | | 1.73 | | | | 1.99 | | | | (0.21 | ) | | | (1.53 | ) | | | (1.74 | ) | | | 0.00 | | | $ | 30.00 | | | | 7.02 | % | | $ | 744.2 | | | | 1.10 | % | | | 0.90 | % | | | 1.10 | % | | | 18 | % | |
9/30/15 | | $ | 33.41 | | | | 0.25 | | | | (1.03 | ) | | | (0.78 | ) | | | (0.16 | ) | | | (2.72 | ) | | | (2.88 | ) | | | 0.00 | | | $ | 29.75 | | | | -2.84 | % | | $ | 900.7 | | | | 1.09 | % | | | 0.71 | % | | | 1.09 | % | | | 25 | % | |
9/30/14 | | $ | 32.83 | | | | 0.18 | (a) | | | 3.00 | | | | 3.18 | | | | (0.05 | ) | | | (2.55 | ) | | | (2.60 | ) | | | 0.00 | | | $ | 33.41 | | | | 10.04 | % | | $ | 1,157.2 | | | | 1.05 | % | | | 0.54 | % | | | 1.05 | % | | | 18 | % | |
9/30/13 | | $ | 28.90 | | | | 0.17 | | | | 4.66 | | | | 4.83 | | | | (0.18 | ) | | | (0.72 | ) | | | (0.90 | ) | | | 0.00 | | | $ | 32.83 | | | | 17.23 | % | | $ | 1,211.4 | | | | 1.10 | % | | | 0.56 | % | | | 1.10 | % | | | 25 | %(b) | |
| + | | Unaudited. | |
† | | Data has been annualized. | |
(a) | | Computed using average shares outstanding throughout the period. | |
(b) | | The ratio excludes in-kind transactions. | |
(c) | | Commenced on 11/30/2016. | |
Oakmark Global Fund | |
Investor Class | |
10/1/17-3/31/18+ | | $ | 34.32 | | | | (0.05 | ) | | | 0.49 | | | | 0.44 | | | | (0.30 | ) | | | (2.18 | ) | | | (2.48 | ) | | | 0.00 | | | $ | 32.28 | | | | 1.24 | % | | $ | 1,653.1 | | | | 1.14 | %† | | | (0.30 | )%† | | | 1.20 | %† | | | 12 | % | |
9/30/17 | | $ | 26.36 | | | | 0.29 | (a) | | | 7.97 | | | | 8.26 | | | | (0.30 | ) | | | 0.00 | | | | (0.30 | ) | | | 0.00 | | | $ | 34.32 | | | | 31.64 | % | | $ | 1,811.8 | | | | 1.15 | % | | | 0.96 | % | | | 1.21 | % | | | 32 | % | |
9/30/16 | | $ | 26.34 | | | | 0.32 | | | | 0.48 | | | | 0.80 | | | | (0.31 | ) | | | (0.47 | ) | | | (0.78 | ) | | | 0.00 | | | $ | 26.36 | | | | 2.93 | % | | $ | 2,328.9 | | | | 1.17 | % | | | 1.14 | % | | | 1.17 | % | | | 32 | % | |
9/30/15 | | $ | 30.34 | | | | 0.25 | (a) | | | (2.16 | ) | | | (1.91 | ) | | | (0.35 | ) | | | (1.74 | ) | | | (2.09 | ) | | | 0.00 | | | $ | 26.34 | | | | -6.92 | % | | $ | 2,950.8 | | | | 1.12 | % | | | 0.86 | % | | | 1.12 | % | | | 36 | % | |
9/30/14 | | $ | 29.70 | | | | 0.23 | (a) | | | 1.71 | | | | 1.94 | | | | (0.75 | ) | | | (0.55 | ) | | | (1.30 | ) | | | 0.00 | | | $ | 30.34 | | | | 6.70 | % | | $ | 3,503.8 | | | | 1.11 | % | | | 0.76 | % | | | 1.11 | % | | | 31 | % | |
9/30/13 | | $ | 21.63 | | | | 0.21 | | | | 8.23 | | | | 8.44 | | | | (0.37 | ) | | | 0.00 | | | | (0.37 | ) | | | 0.00 | (b) | | $ | 29.70 | | | | 39.55 | % | | $ | 2,880.4 | | | | 1.13 | % | | | 0.75 | % | | | 1.13 | % | | | 45 | %(c) | |
Advisor Class | |
10/1/17-3/31/18+ | | $ | 34.36 | | | | (0.03 | )(a) | | | 0.49 | | | | 0.46 | | | | (0.36 | ) | | | (2.18 | ) | | | (2.54 | ) | | | 0.00 | | | $ | 32.28 | | | | 1.28 | % | | $ | 575.4 | | | | 1.05 | %† | | | (0.18 | )%† | | | 1.10 | %† | | | 12 | % | |
9/30/17(d) | | $ | 27.22 | | | | 0.24 | (a) | | | 6.90 | | | | 7.14 | | | | 0.00 | | | | 0.00 | | | | 0.00 | | | | 0.00 | | | $ | 34.36 | | | | 26.23 | % | | $ | 499.9 | | | | 1.01 | %† | | | 0.89 | %† | | | 1.07 | %† | | | 32 | % | |
Institutional Class | |
10/1/17-3/31/18+ | | $ | 34.38 | | | | (0.02 | )(a) | | | 0.50 | | | | 0.48 | | | | (0.38 | ) | | | (2.18 | ) | | | (2.56 | ) | | | 0.00 | | | $ | 32.30 | | | | 1.33 | % | | $ | 363.2 | | | | 0.97 | %† | | | (0.11 | )%† | | | 1.03 | %† | | | 12 | % | |
9/30/17(d) | | $ | 27.22 | | | | 0.26 | | | | 6.90 | | | | 7.16 | | | | 0.00 | | | | 0.00 | | | | 0.00 | | | | 0.00 | | | $ | 34.38 | | | | 26.30 | % | | $ | 309.6 | | | | 0.96 | %† | | | 1.55 | %† | | | 1.02 | %† | | | 32 | % | |
Service Class | |
10/1/17-3/31/18+ | | $ | 33.40 | | | | (0.09 | )(a) | | | 0.47 | | | | 0.38 | | | | (0.22 | ) | | | (2.18 | ) | | | (2.40 | ) | | | 0.00 | | | $ | 31.38 | | | | 1.12 | % | | $ | 21.9 | | | | 1.42 | %† | | | (0.57 | )%† | | | 1.48 | %† | | | 12 | % | |
9/30/17 | | $ | 25.65 | | | | (0.14 | ) | | | 8.11 | | | | 7.97 | | | | (0.22 | ) | | | 0.00 | | | | (0.22 | ) | | | 0.00 | | | $ | 33.40 | | | | 31.27 | % | | $ | 22.5 | | | | 1.42 | % | | | 0.63 | % | | | 1.48 | % | | | 32 | % | |
9/30/16 | | $ | 25.62 | | | | 0.21 | (a) | | | 0.47 | | | | 0.68 | | | | (0.18 | ) | | | (0.47 | ) | | | (0.65 | ) | | | 0.00 | | | $ | 25.65 | | | | 2.60 | % | | $ | 25.6 | | | | 1.50 | % | | | 0.82 | % | | | 1.50 | % | | | 32 | % | |
9/30/15 | | $ | 29.57 | | | | 0.13 | (a) | | | (2.10 | ) | | | (1.97 | ) | | | (0.24 | ) | | | (1.74 | ) | | | (1.98 | ) | | | 0.00 | | | $ | 25.62 | | | | -7.33 | % | | $ | 32.3 | | | | 1.52 | % | | | 0.46 | % | | | 1.52 | % | | | 36 | % | |
9/30/14 | | $ | 28.98 | | | | 0.13 | (a) | | | 1.67 | | | | 1.80 | | | | (0.66 | ) | | | (0.55 | ) | | | (1.21 | ) | | | 0.00 | | | $ | 29.57 | | | | 6.35 | % | | $ | 41.8 | | | | 1.45 | % | | | 0.42 | % | | | 1.45 | % | | | 31 | % | |
9/30/13 | | $ | 21.11 | | | | 0.03 | | | | 8.14 | | | | 8.17 | | | | (0.30 | ) | | | 0.00 | | | | (0.30 | ) | | | 0.00 | (b) | | $ | 28.98 | | | | 39.11 | % | | $ | 38.9 | | | | 1.48 | % | | | 0.40 | % | | | 1.48 | % | | | 45 | %(c) | |
| + | | Unaudited. | |
† | | Data has been annualized. | |
(a) | | Computed using average shares outstanding throughout the period. | |
(b) | | Amount rounds to less than $0.01 per share. | |
(c) | | The ratio excludes in-kind transactions. | |
| (d) | | Commenced on 11/30/2016. | |
74 OAKMARK FUNDS
Oakmark.com 75
Oakmark Funds
Financial Highlights
For a share outstanding throughout each period
| | | | | Income from Investment Operations: | | Less Distributions: | | | | | | Ratios/Supplemental Data: | | | |
| | | Net Asset
Value,
Beginning of
Period | | Net
Investment
Income
(Loss) | | Net Gain
(Loss) on
Investments
(both
realized and
unrealized) | | Total From
Investment
Operations | | Dividends
From Net
Investment
Income | | Distributions
From
Capital
Gains | | Total
Distributions | | Redemption
Fees | | Net Asset
Value,
End of
Period | | Total
Return | | Net Assets,
End of
Period
($million) | | Ratio of
Net
Expenses
to Average
Net Assets | | Ratio of Net
Investment
Income
(Loss) to
Average
Net Assets | | Ratio of
Gross
Expenses to
Average Net
Assets | | Portfolio
Turnover
Rate | |
Oakmark Global Select Fund | |
Investor Class | |
10/1/17-3/31/18+ | | $ | 19.78 | | | | (0.02 | )(a) | | | (0.04 | ) | | | (0.06 | ) | | | (0.17 | ) | | | (0.89 | ) | | | (1.06 | ) | | | 0.00 | | | $ | 18.66 | | | | -0.43 | % | | $ | 1,827.3 | | | | 1.12 | %† | | | (0.18 | )%† | | | 1.18 | %† | | | 4 | % | |
9/30/17 | | $ | 15.81 | | | | 0.26 | | | | 3.88 | | | | 4.14 | | | | (0.17 | ) | | | 0.00 | | | | (0.17 | ) | | | 0.00 | | | $ | 19.78 | | | | 26.41 | % | | $ | 2,035.3 | | | | 1.12 | % | | | 1.25 | % | | | 1.18 | % | | | 39 | % | |
9/30/16 | | $ | 15.19 | | | | 0.18 | | | | 1.31 | | | | 1.49 | | | | (0.13 | ) | | | (0.74 | ) | | | (0.87 | ) | | | 0.00 | | | $ | 15.81 | | | | 9.92 | % | | $ | 2,037.1 | | | | 1.15 | % | | | 1.12 | % | | | 1.15 | % | | | 17 | % | |
9/30/15 | | $ | 16.63 | | | | 0.12 | | | | (0.65 | ) | | | (0.53 | ) | | | (0.14 | ) | | | (0.77 | ) | | | (0.91 | ) | | | 0.00 | | | $ | 15.19 | | | | -3.44 | % | | $ | 2,033.4 | | | | 1.13 | % | | | 0.70 | % | | | 1.13 | % | | | 48 | % | |
9/30/14 | | $ | 15.71 | | | | 0.12 | | | | 1.21 | | | | 1.33 | | | | (0.14 | ) | | | (0.27 | ) | | | (0.41 | ) | | | 0.00 | | | $ | 16.63 | | | | 8.52 | % | | $ | 1,937.3 | | | | 1.13 | % | | | 0.92 | % | | | 1.13 | % | | | 24 | % | |
9/30/13 | | $ | 11.65 | | | | 0.14 | | | | 4.18 | | | | 4.32 | | | | (0.16 | ) | | | (0.10 | ) | | | (0.26 | ) | | | 0.00 | | | $ | 15.71 | | | | 37.69 | % | | $ | 1,159.8 | | | | 1.15 | % | | | 1.01 | % | | | 1.15 | % | | | 36 | % | |
Advisor Class | |
10/1/17-3/31/18+ | | $ | 19.81 | | | | (0.02 | )(a) | | | (0.04 | ) | | | (0.06 | ) | | | (0.20 | ) | | | (0.89 | ) | | | (1.09 | ) | | | 0.00 | | | $ | 18.66 | | | | -0.43 | % | | $ | 245.5 | | | | 1.06 | %† | | | (0.16 | )%† | | | 1.12 | %† | | | 4 | % | |
9/30/17(b) | | $ | 16.39 | | | | 0.25 | (a) | | | 3.17 | | | | 3.42 | | | | 0.00 | | | | 0.00 | | | | 0.00 | | | | 0.00 | | | $ | 19.81 | | | | 20.87 | % | | $ | 148.4 | | | | 1.00 | %† | | | 1.58 | %† | | | 1.07 | %† | | | 39 | % | |
Institutional Class | |
10/1/17-3/31/18+ | | $ | 19.81 | | | | 0.00 | (c) | | | (0.04 | ) | | | (0.04 | ) | | | (0.21 | ) | | | (0.89 | ) | | | (1.10 | ) | | | 0.00 | | | $ | 18.67 | | | | -0.34 | % | | $ | 755.7 | | | | 0.96 | %† | | | (0.05 | )%† | | | 1.03 | %† | | | 4 | % | |
9/30/17(b) | | $ | 16.39 | | | | 0.23 | (a) | | | 3.19 | | | | 3.42 | | | | 0.00 | | | | 0.00 | | | | 0.00 | | | | 0.00 | | | $ | 19.81 | | | | 20.87 | % | | $ | 608.0 | | | | 0.94 | %† | | | 1.46 | %† | | | 1.00 | %† | | | 39 | % | |
| + | | Unaudited. | |
† | | Data has been annualized. | |
(a) | | Computed using average shares outstanding throughout the period. | |
(b) | | Commenced on 11/30/2016. | |
(c) | | Amount rounds to less than $0.01 per share. | |
Oakmark International Fund | |
Investor Class | |
10/1/17-3/31/18+ | | $ | 28.77 | | | | 0.00 | (a) | | | (0.12 | ) | | | (0.12 | ) | | | (0.39 | ) | | | (0.48 | ) | | | (0.87 | ) | | | 0.00 | | | $ | 27.78 | | | | -0.45 | % | | $ | 31,674.9 | | | | 0.95 | %† | | | (0.06 | )%† | | | 1.00 | %† | | | 14 | % | |
9/30/17 | | $ | 21.66 | | | | 0.44 | | | | 7.01 | | | | 7.45 | | | | (0.34 | ) | | | 0.00 | | | | (0.34 | ) | | | 0.00 | | | $ | 28.77 | | | | 34.88 | % | | $ | 31,058.2 | | | | 0.95 | % | | | 1.72 | % | | | 1.00 | % | | | 41 | % | |
9/30/16 | | $ | 21.34 | | | | 0.36 | (b) | | | 1.04 | | | | 1.40 | | | | (0.50 | ) | | | (0.58 | ) | | | (1.08 | ) | | | 0.00 | | | $ | 21.66 | | | | 6.66 | % | | $ | 23,277.7 | | | | 1.00 | % | | | 1.72 | % | | | 1.00 | % | | | 44 | % | |
9/30/15 | | $ | 25.01 | | | | 0.46 | | | | (2.55 | ) | | | (2.09 | ) | | | (0.51 | ) | | | (1.07 | ) | | | (1.58 | ) | | | 0.00 | | | $ | 21.34 | | | | -8.98 | % | | $ | 25,915.2 | | | | 0.95 | % | | | 1.81 | % | | | 0.95 | % | | | 48 | % | |
9/30/14 | | $ | 25.89 | | | | 0.46 | (b) | | | (0.61 | ) | | | (0.15 | ) | | | (0.44 | ) | | | (0.29 | ) | | | (0.73 | ) | | | 0.00 | | | $ | 25.01 | | | | -0.64 | % | | $ | 29,759.6 | | | | 0.95 | % | | | 1.76 | % | | | 0.95 | % | | | 39 | %(c) | |
9/30/13 | | $ | 18.79 | | | | 0.28 | | | | 7.26 | | | | 7.54 | | | | (0.44 | ) | | | 0.00 | | | | (0.44 | ) | | | 0.00 | | | $ | 25.89 | | | | 40.79 | % | | $ | 23,886.0 | | | | 0.98 | % | | | 1.58 | % | | | 0.98 | % | | | 37 | %(c) | |
Advisor Class | |
10/1/17-3/31/18+ | | $ | 28.82 | | | | 0.00 | (a)(b) | | | (0.12 | ) | | | (0.12 | ) | | | (0.43 | ) | | | (0.48 | ) | | | (0.91 | ) | | | 0.00 | | | $ | 27.79 | | | | -0.45 | % | | $ | 2,331.3 | | | | 0.85 | %† | | | 0.02 | %† | | | 0.90 | %† | | | 14 | % | |
9/30/17(d) | | $ | 21.96 | | | | 0.53 | (b) | | | 6.33 | | | | 6.86 | | | | 0.00 | | | | 0.00 | | | | 0.00 | | | | 0.00 | | | $ | 28.82 | | | | 31.24 | % | | $ | 914.3 | | | | 0.81 | %† | | | 2.42 | %† | | | 0.86 | %† | | | 41 | % | |
Institutional Class | |
10/1/17-3/31/18+ | | $ | 28.82 | | | | 0.02 | (b) | | | (0.13 | ) | | | (0.11 | ) | | | (0.43 | ) | | | (0.48 | ) | | | (0.91 | ) | | | 0.00 | | | $ | 27.80 | | | | -0.39 | % | | $ | 11,588.3 | | | | 0.79 | %† | | | 0.13 | %† | | | 0.84 | %† | | | 14 | % | |
9/30/17(d) | | $ | 21.96 | | | | 0.46 | (b) | | | 6.40 | | | | 6.86 | | | | 0.00 | | | | 0.00 | | | | 0.00 | | | | 0.00 | | | $ | 28.82 | | | | 31.24 | % | | $ | 7,658.7 | | | | 0.77 | %† | | | 2.06 | %† | | | 0.83 | %† | | | 41 | % | |
Service Class | |
10/1/17-3/31/18+ | | $ | 28.90 | | | | (0.05 | )(b) | | | (0.13 | ) | | | (0.18 | ) | | | (0.31 | ) | | | (0.48 | ) | | | (0.79 | ) | | | 0.00 | | | $ | 27.93 | | | | -0.65 | % | | $ | 520.6 | | | | 1.25 | %† | | | (0.37 | )%† | | | 1.30 | %† | | | 14 | % | |
9/30/17 | | $ | 21.74 | | | | 0.46 | | | | 6.96 | | | | 7.42 | | | | (0.26 | ) | | | 0.00 | | | | (0.26 | ) | | | 0.00 | | | $ | 28.90 | | | | 34.51 | % | | $ | 579.7 | | | | 1.22 | % | | | 1.38 | % | | | 1.27 | % | | | 41 | % | |
9/30/16 | | $ | 21.40 | | | | 0.29 | (b) | | | 1.04 | | | | 1.33 | | | | (0.41 | ) | | | (0.58 | ) | | | (0.99 | ) | | | 0.00 | | | $ | 21.74 | | | | 6.32 | % | | $ | 532.3 | | | | 1.34 | % | | | 1.38 | % | | | 1.34 | % | | | 44 | % | |
9/30/15 | | $ | 25.07 | | | | 0.36 | (b) | | | (2.55 | ) | | | (2.19 | ) | | | (0.41 | ) | | | (1.07 | ) | | | (1.48 | ) | | | 0.00 | | | $ | 21.40 | | | | -9.31 | % | | $ | 559.1 | | | | 1.33 | % | | | 1.48 | % | | | 1.33 | % | | | 48 | % | |
9/30/14 | | $ | 25.98 | | | | 0.37 | (b) | | | (0.63 | ) | | | (0.26 | ) | | | (0.36 | ) | | | (0.29 | ) | | | (0.65 | ) | | | 0.00 | | | $ | 25.07 | | | | -1.04 | % | | $ | 538.9 | | | | 1.33 | % | | | 1.40 | % | | | 1.33 | % | | | 39 | %(c) | |
9/30/13 | | $ | 18.86 | | | | 0.27 | (b) | | | 7.23 | | | | 7.50 | | | | (0.38 | ) | | | 0.00 | | | | (0.38 | ) | | | 0.00 | | | $ | 25.98 | | | | 40.31 | % | | $ | 386.9 | | | | 1.34 | % | | | 1.20 | % | | | 1.34 | % | | | 37 | %(c) | |
| + | | Unaudited. | |
† | | Data has been annualized. | |
(a) | | Amount rounds to less than $0.01 per share. | |
(b) | | Computed using average shares outstanding throughout the period. | |
(c) | | The ratio excludes in-kind transactions. | |
(d) | | Commenced on 11/30/2016. | |
76 OAKMARK FUNDS
Oakmark.com 77
Oakmark Funds
Financial Highlights
For a share outstanding throughout each period
| | | | | Income from Investment Operations: | | Less Distributions: | | | | | | Ratios/Supplemental Data: | | | |
| | | Net Asset
Value,
Beginning of
Period | | Net
Investment
Income | | Net Gain
(Loss) on
Investments
(both
realized and
unrealized) | | Total From
Investment
Operations | | Dividends
From Net
Investment
Income | | Distributions
From
Capital
Gains | | Total
Distributions | | Redemption
Fees | | Net Asset
Value,
End of
Period | | Total
Return | | Net Assets,
End of
Period
($million) | | Ratio of
Net
Expenses
to Average
Net Assets | | Ratio of Net
Investment
Income to
Average
Net Assets | | Ratio of
Gross
Expenses to
Average Net
Assets | | Portfolio
Turnover
Rate | |
Oakmark International Small Cap Fund | |
Investor Class | |
10/1/17-3/31/18+ | | $ | 18.12 | | | | 0.04 | (a) | | | (0.38 | ) | | | (0.34 | ) | | | (0.14 | ) | | | (0.50 | ) | | | (0.64 | ) | | | 0.00 | (b) | | $ | 17.14 | | | | -1.85 | % | | $ | 1,613.1 | | | | 1.34 | %† | | | 0.49 | %† | | | 1.34 | %† | | | 26 | % | |
9/30/17 | | $ | 14.84 | | | | 0.23 | (a) | | | 3.50 | | | | 3.73 | | | | (0.36 | ) | | | (0.09 | ) | | | (0.45 | ) | | | 0.00 | (b) | | $ | 18.12 | | | | 25.98 | % | | $ | 1,835.5 | | | | 1.36 | % | | | 1.40 | % | | | 1.36 | % | | | 34 | % | |
9/30/16 | | $ | 14.63 | | | | 0.42 | (a) | | | 0.51 | | | | 0.93 | | | | (0.36 | ) | | | (0.36 | ) | | | (0.72 | ) | | | 0.00 | (b) | | $ | 14.84 | | | | 6.66 | % | | $ | 2,365.1 | | | | 1.38 | % | | | 2.97 | % | | | 1.38 | % | | | 38 | % | |
9/30/15 | | $ | 16.38 | | | | 0.19 | (a) | | | (0.78 | ) | | | (0.59 | ) | | | (0.26 | ) | | | (0.90 | ) | | | (1.16 | ) | | | 0.00 | (b) | | $ | 14.63 | | | | -3.70 | % | | $ | 2,852.0 | | | | 1.35 | % | | | 1.18 | % | | | 1.35 | % | | | 46 | % | |
9/30/14 | | $ | 17.29 | | | | 0.17 | | | | (0.53 | ) | | | (0.36 | ) | | | (0.55 | ) | | | 0.00 | | | | (0.55 | ) | | | 0.00 | (b) | | $ | 16.38 | | | | -2.14 | % | | $ | 2,910.0 | | | | 1.31 | % | | | 1.07 | % | | | 1.31 | % | | | 38 | % | |
9/30/13 | | $ | 13.06 | | | | 0.18 | | | | 4.26 | | | | 4.44 | | | | (0.21 | ) | | | 0.00 | | | | (0.21 | ) | | | 0.00 | (b) | | $ | 17.29 | | | | 34.42 | % | | $ | 2,254.1 | | | | 1.35 | % | | | 1.23 | % | | | 1.35 | % | | | 50 | % | |
Advisor Class | |
10/1/17-3/31/18+ | | $ | 18.14 | | | | 0.05 | (a) | | | (0.38 | ) | | | (0.33 | ) | | | (0.18 | ) | | | (0.50 | ) | | | (0.68 | ) | | | 0.00 | (b) | | $ | 17.13 | | | | -1.80 | % | | $ | 423.7 | | | | 1.29 | %† | | | 0.58 | %† | | | 1.29 | %† | | | 26 | % | |
9/30/17(c) | | $ | 14.16 | | | | 0.19 | (a) | | | 3.79 | | | | 3.98 | | | | 0.00 | | | | 0.00 | | | | 0.00 | | | | 0.00 | (b) | | $ | 18.14 | | | | 28.11 | % | | $ | 388.5 | | | | 1.21 | %† | | | 1.29 | %† | | | 1.21 | %† | | | 34 | % | |
Institutional Class | |
10/1/17-3/31/18+ | | $ | 18.15 | | | | 0.06 | (a) | | | (0.38 | ) | | | (0.32 | ) | | | (0.19 | ) | | | (0.50 | ) | | | (0.69 | ) | | | 0.00 | (b) | | $ | 17.14 | | | | -1.76 | % | | $ | 895.5 | | | | 1.16 | %† | | | 0.69 | %† | | | 1.16 | %† | | | 26 | % | |
9/30/17(c) | | $ | 14.16 | | | | 0.21 | (a) | | | 3.78 | | | | 3.99 | | | | 0.00 | | | | 0.00 | | | | 0.00 | | | | 0.00 | (b) | | $ | 18.15 | | | | 28.18 | % | | $ | 839.1 | | | | 1.14 | %† | | | 1.47 | %† | | | 1.14 | %† | | | 34 | % | |
Service Class | |
10/1/17-3/31/18+ | | $ | 18.00 | | | | 0.02 | (a) | | | (0.38 | ) | | | (0.36 | ) | | | (0.11 | ) | | | (0.50 | ) | | | (0.61 | ) | | | 0.00 | (b) | | $ | 17.03 | | | | -2.02 | % | | $ | 1.9 | | | | 1.65 | %† | | | 0.19 | %† | | | 1.65 | %† | | | 26 | % | |
9/30/17 | | $ | 14.75 | | | | 0.17 | (a) | | | 3.49 | | | | 3.66 | | | | (0.32 | ) | | | (0.09 | ) | | | (0.41 | ) | | | 0.00 | (b) | | $ | 18.00 | | | | 25.56 | % | | $ | 2.1 | | | | 1.66 | % | | | 1.04 | % | | | 1.66 | % | | | 34 | % | |
9/30/16 | | $ | 14.53 | | | | 0.38 | (a) | | | 0.51 | | | | 0.89 | | | | (0.31 | ) | | | (0.36 | ) | | | (0.67 | ) | | | 0.00 | (b) | | $ | 14.75 | | | | 6.39 | % | | $ | 1.5 | | | | 1.69 | % | | | 2.69 | % | | | 1.69 | % | | | 38 | % | |
9/30/15 | | $ | 16.26 | | | | 0.13 | (a) | | | (0.77 | ) | | | (0.64 | ) | | | (0.19 | ) | | | (0.90 | ) | | | (1.09 | ) | | | 0.00 | (b) | | $ | 14.53 | | | | -4.00 | % | | $ | 1.9 | | | | 1.62 | % | | | 0.85 | % | | | 1.62 | % | | | 46 | % | |
9/30/14 | | $ | 17.17 | | | | 0.14 | | | | (0.54 | ) | | | (0.40 | ) | | | (0.51 | ) | | | 0.00 | | | | (0.51 | ) | | | 0.00 | (b) | | $ | 16.26 | | | | -2.42 | % | | $ | 3.3 | | | | 1.62 | % | | | 0.70 | % | | | 1.62 | % | | | 38 | % | |
9/30/13 | | $ | 12.98 | | | | 0.13 | (a) | | | 4.24 | | | | 4.37 | | | | (0.18 | ) | | | 0.00 | | | | (0.18 | ) | | | 0.00 | (b) | | $ | 17.17 | | | | 34.04 | % | | $ | 3.5 | | | | 1.64 | % | | | 0.90 | % | | | 1.64 | % | | | 50 | % | |
| + | | Unaudited. | |
† | | Data has been annualized. | |
(a) | | Computed using average shares outstanding throughout the period. | |
(b) | | Amount rounds to less than $0.01 per share. | |
(c) | | Commenced on 11/30/2016. | |
78 OAKMARK FUNDS
Oakmark.com 79
The Oakmark Funds Disclosure Regarding The Board Of Trustees' Approval Of Investment Advisory Agreements As Approved October 25, 2017
On an annual basis, the Board of Trustees (the "Board") of the Oakmark Funds (the "Funds"), including a majority of the Trustees who are not "interested persons" of Harris Associates L.P., the Funds' investment adviser (the "Adviser") or the Funds ("Independent Trustees"), considers whether to continue each Fund's investment advisory agreement (each, an "Agreement," and collectively, the "Agreements") with the Adviser. At a meeting held on October 25, 2017, the Board, including all of the Independent Trustees, determined that the continuation of the Agreement for each Fund was in the best interest of the Fund and its shareholders, and approved the continuation of the Agreements through October 31, 2018.
The Board's Committee on Contracts (the "Committee") leads the Board in its evaluation of the Agreements. The Committee is comprised entirely of Independent Trustees, and more than 75% of the Board is comprised of Independent Trustees. The Committee, including the Independent Trustees, requested, received, and reviewed materials provided by the Adviser in response to questions submitted by the Independent Trustees that they believed to be relevant to the continuation of the Agreements with respect to each Fund in light of the legal advice furnished to them by their legal counsel that is experienced in 1940 matters and that is independent of the Adviser ("Independent Counsel") and their own business judgment. During the annual contract review, the Committee and the Independent Trustees met multiple times specifically to review and consider materials related to the proposed continuation of each Agreement and to ensure that the Adviser had time to respond to questions from the Independent Trustees and that the Independent Trustees had time to consider those responses. They also met with senior representatives of the Adviser regarding its personnel, operations and financial condition as they relate to the Funds. In addition, the Board retained Broadridge Financial Solutions, Inc. ("Broadridge"), an independent data provider, to provide performance and expense information for each Fund and for comparable funds. While the Board considered the continuation of the Agreements for all of the Funds at the same meetings, the Board considered each Fund's investment advisory relationship separately.
In connection with its deliberations, the Board also considered a broad range of information relevant to the annual contract review that is provided to the Board (including its various standing committees) at meetings throughout the year, including investment performance reports and related portfolio information for each Fund, as well as periodic reports on, among other matters, pricing and valuation; brokerage and execution; compliance; and shareholder and other services provided by the Adviser and its affiliates.
The Independent Trustees were advised by Independent Counsel throughout the process and they received a memorandum from Independent Counsel discussing the legal standards for their consideration of the proposed continuation of the Agreements. During the course of the year and during their deliberations regarding the annual contract review, the Committee and the Independent Trustees met with Independent Counsel separately from representatives of the Adviser.
Provided below is a description of the Board's contract approval process and the material factors that the Board considered regarding continuation of the Agreements and the compensation to be paid thereunder. The Board's determination to approve the continuation of the Agreements was based on a comprehensive consideration of all information provided to the Board throughout the year and specifically in connection with the annual contract review.
This description is not intended to include all of the factors considered by the Board. The Board members did not identify any particular information or factor that was all-important or controlling, and each Trustee may have attributed different weights to the various factors. The Board focused on the costs and benefits of the Agreements to each Fund and, through the Funds, their shareholders.
Nature, Extent and Quality of Services
The Board's consideration of the nature, extent and quality of the Adviser's services to the Funds took into account the knowledge the Board gained during meetings with the Adviser throughout the year. In addition, the Board considered: the Adviser's long-term history of care and conscientiousness in the management of the Funds; the consistency of its investment approach; the qualifications, experience, and capabilities of, and the resources available to, the Adviser's investment and other personnel responsible for managing the Funds; the Adviser's performance as administrator of the Funds; and the Adviser's compliance program. The Board also reviewed the Adviser's resources and key personnel involved in providing investment management services to the Funds, including the time that investment personnel devoted to each Fund and the investment results produced as a result of the Adviser's in-house research.
The Board considered that, pursuant to each Agreement, the Adviser provides administrative services, including, among other things, oversight of shareholder communications, fund administration and accounting services, regulatory and legal obligation oversight, supervision of fund operations, and Board support. The Board also considered that the Adviser's responsibilities include daily management of investment, operational, enterprise, legal, regulatory, and compliance risks as they relate to the Funds, and considered information regarding the Adviser's processes for managing risk. It also noted the Adviser's oversight of the Funds' various outside service providers. The Board also considered the Adviser's ongoing development of its own infrastructure, including, among other things, its operational and trading capabilities, and its information technology to support the Funds' compliance structure through, among other things, cybersecurity, business continuity planning, and risk management. In addition, the Board noted the positive compliance history of the Adviser.
The Board also considered the general structure of the Adviser's compensation program for portfolio managers, analysts and certain other employees and whether this structure provides appropriate incentives to act in the best interests of the Funds. The Board also considered the ability of the Adviser to attract and retain qualified personnel to service the Funds. The Board also noted the significant personal investments that the Adviser's personnel have made in the Funds, which serve to further align the interests of the Adviser and its personnel with those of the Funds' shareholders.
80 OAKMARK FUNDS
The Board also considered the manner in which the Adviser addressed various matters that arose during the year. These matters may have been the result of developments in the broader fund industry or the regulations governing it, including, for example, the Liquidity Risk Management Program rules, the development of the interfund lending program, and the launch of the new share classes for each Fund. In addition, the Board considered the Adviser's response to recent market conditions and considered the overall performance of the Adviser in this context.
Investment Performance of the Funds
The Board considered each Fund's investment performance over various time periods, and the performance of a group of comparable funds pursuing broadly similar strategies with the same investment classification and/or objective as each Fund (the Fund's "Performance Universe") selected by Broadridge. Because the Committee commenced its review in June, the performance periods considered by the Board were those ended on April 30, 2017. The Board considered one-, three-, five-, and ten-year performance for each Fund. The Board also considered updated performance information at its October meeting at which the Agreements were approved.
Further detail considered by the Board regarding the investment performance of each Fund is set forth below:
Oakmark Fund. The Board considered that the Oakmark Fund outperformed the median annualized returns of its respective Performance Universe during the one-, three-, five-, and ten-year periods ending April 30, 2017.
Oakmark Select Fund. The Board considered that the Oakmark Select Fund outperformed the median annualized returns of its respective Performance Universe during the one-, five- and ten-year periods ending April 30, 2017, but underperformed the median annualized return of its respective Performance Universe during the three-year period ending April 30, 2017.
Oakmark Equity and Income Fund. The Board considered that the Oakmark Equity and Income Fund outperformed the median annualized returns of its respective Performance Universe during the one-, three-, five-, and ten-year periods ending April 30, 2017.
Oakmark Global Fund. The Board considered that the Oakmark Global Fund outperformed the median annualized returns of its respective Performance Universe during the one-, three-, five-, and ten-year periods ending April 30, 2017.
Oakmark Global Select Fund. The Board considered that the Oakmark Global Select Fund outperformed the median annualized returns of its respective Performance Universe during the one-, three-, five-, and ten-year periods ending April 30, 2017.
Oakmark International Fund. The Board considered that the Oakmark International Fund outperformed the median annualized returns of its respective Performance Universe during the one-, three-, five-, and ten-year periods ending April 30, 2017.
Oakmark International Small Cap Fund. The Board considered that the Oakmark International Small Cap Fund outperformed the median annualized return of its respective Performance Universe during the one-year period ending April 30, 2017, but underperformed the median annualized returns of its respective Performance Universe during the three-, five-, and ten-year periods ending April 30, 2017.
In addition to considering each Fund's performance as compared to that of its respective Performance Universe, the Board also considered each Fund's performance as compared to that of its benchmark and other comparative data provided by Broadridge, including each Fund's total return and performance relative to risk. In the case of Oakmark International Small Cap Fund, that had underperformed its Performance Universe over multiple periods, the Board discussed with the Adviser the factors that caused the Fund's underperformance.
Costs of Services Provided and Profits Realized by the Adviser
The Board considered the fee structure for each Fund under the Agreements as compared to the peer group provided by Broadridge. Specifically, using the information provided by Broadridge, the Board considered each Fund's management fee and the management fees for other mutual funds comparable in size, character and investment strategy to each Fund (the "Expense Group"), and considered each Fund's expense ratio and those of the Expense Group.
Further detail considered by the Board regarding the management fee rate and expense ratio of each Fund as of the conclusion of its last semi-annual year ended March 31, 2017 is set forth below:
Oakmark Fund and Oakmark International Small Cap Fund. The Board considered that each Fund's management fee rate (net of fees waived by the Adviser for Oakmark Fund) and total expense ratio are higher than the respective medians of each Fund's Expense Group.
Oakmark Select Fund. The Board considered that the Fund's management fee rate net of fees waived by the Adviser is higher than the median of the Fund's Expense Group. The Board noted, however, that the Fund's total expense ratio, which reflects the total fees paid by an investor, is equal to the median of the Fund's Expense Group.
Oakmark Equity and Income Fund and Oakmark Global Fund. The Board considered that each Fund's management fee rate net of fees waived by the Adviser and total expense ratio are equal to the respective medians of each Fund's Expense Group.
Oakmark Global Select Fund. The Board considered that the Fund's management fee rate net of fees waived by the Adviser is higher than the median of the Fund's Expense Group. The Board noted, however, that the Fund's total expense ratio, which reflects the total fees paid by an investor, is lower than the median of the Fund's Expense Group.
Oakmark International Fund. The Board considered that the Fund's management fee rate net of fees waived by the Adviser and total expense ratio are lower than the respective medians of each Fund's Expense Group. The Board also considered its negotiation with the Adviser, the result of which was the Adviser's agreement to add additional breakpoints to its investment advisory agreement with the Oakmark International Fund to reduce the Adviser's fees at levels that would come into effect as fund assets continue to grow.
The Board also reviewed the Adviser's management fees for comparable institutional separate account clients and subadvised funds (for which the Adviser provides portfolio management services only). The Board considered the appropriateness and reasonableness of any differences between the fees charged to a Fund and any such comparable funds and/or separate accounts, including any breakpoints, and noted the Adviser's explanation that, although in most instances, the fees paid by those other clients were lower
Oakmark.com 81
than the fees paid by the Funds, the differences reflected the Adviser's significantly greater level of responsibilities and broader scope of services regarding the Funds, and the more extensive regulatory obligations and the various risks (e.g., operational, enterprise, legal, regulatory, compliance) associated with managing the Funds.
The Board also noted that each Fund's management fee is a single fee that compensates the Adviser for its services as investment adviser and manager under the Agreements, and further noted that, for comparative purposes, Broadridge aggregated the separate administrative and advisory fees into a single fee for certain of the mutual funds in the Expense Group. The Board also considered the Adviser's agreement to continue the expense limitation agreement for each Fund. In addition, the Board considered the Adviser's agreement to continue the investment advisory fee waiver agreement for Oakmark Fund, Oakmark Select Fund, Oakmark Equity and Income Fund, Oakmark Global Fund, Oakmark Global Select Fund, and Oakmark International Fund.
The Board also considered the Adviser's costs in serving as the Funds' investment adviser and manager, including costs associated with technology, infrastructure, and compliance necessary to manage the Funds. Finally, the Board considered the Adviser's profitability analysis, as well as an Investment Management Industry Profitability Analysis prepared by Broadridge. The Board examined the pre-tax profits realized by the Adviser and its affiliates from their relationship with each Fund, as presented in the profitability analyses, as well as the financial condition of the Adviser. The Board reviewed the Adviser's methodology for allocating costs among the Adviser's lines of business and among the Funds, for purposes of calculating its profitability, and recognized that the methodology may not reflect all of the costs or risks associated with offering and managing a mutual fund complex. The Board also recognized that the Adviser and its affiliates are entitled to earn a reasonable level of profits for services they provide to the each Fund.
Economies of Scale
The Board considered whether each Fund's management fee structure reflects any potential economies of scale that may be realized by the Adviser for the benefit of each Fund's shareholders. The Board reviewed each Agreement, which includes breakpoints that decrease the management fee rate as Fund assets increase. The Board also considered that the Adviser has provided, at no added cost to the Funds, certain additional services that were required by new regulations or regulatory interpretations and/or requested by the Board.
Other Benefits Derived from the Relationship with the Funds
The Board considered fall-out benefits received by the Adviser or its affiliates from their relationship with each Fund. The Board noted that an affiliate of the Adviser serves as the Funds' distributor, without compensation, pursuant to a written agreement the Board evaluates annually. The Board also considered the Adviser's use of a portion of the commissions paid by the Funds on their portfolio brokerage transactions to obtain research products and services benefiting the Funds and/or other clients of the Adviser, and considered the Adviser's assertion that its use of "soft" commission dollars to obtain research products and services was consistent with regulatory requirements.
Conclusion
After full consideration of the above factors, as well as other factors that were instructive in evaluating the Agreements, the Board, including all of the Independent Trustees, concluded that approval of the continuation of each Agreement was in the best interests of the respective Fund and its shareholders. In reaching this determination, the Board considered that the nature, extent and quality of the services provided by the Adviser to each Fund were appropriate and consistent with the Fund's Agreement and that each Fund was likely to continue to benefit from services provided under its Agreement with the Adviser; that the Adviser was delivering performance for each Fund that was consistent with the long-term investment strategies being pursued by the Fund, and that the Fund and its shareholders were benefiting from the Adviser's investment management of the Fund; that the management fees paid by each Fund to the Adviser were reasonable in light of the services provided; that the breakpoints in the fee schedule for each Fund allow shareholders to benefit from potential economies of scale that may be achieved by the Adviser; that the profitability of the Adviser's relationship with each Fund appeared to be reasonable in relation to the services performed; and that the benefits accruing to the Adviser and its affiliates by virtue of their relationship with the Funds were reasonable in light of the costs and risks associated with providing the investment advisory and other services and the benefits accruing to each Fund. The Board's conclusions are based in part on its consideration of materials prepared in connection with the approval or continuance of the Agreements in prior years and on the Board's ongoing regular review of Fund performance and operations throughout the year, in addition to material prepared specifically for the most recent annual review of the Agreements.
82 OAKMARK FUNDS
Disclosures and Endnotes
Reporting to Shareholders. The Funds reduce the number of duplicate prospectuses, annual and semi-annual reports your household receives by sending only one copy of each to those addresses shared by two or more accounts. Call the Funds at 1-800-OAKMARK to request individual copies of these documents. The Funds will begin sending individual copies 30 days after receiving your request.
Before investing in any Oakmark Fund, you should carefully consider the Fund's investment objectives, risks, management fees and other expenses. This and other important information is contained in the Funds' prospectus and a Fund's summary prospectus. Please read the prospectus and summary prospectus carefully before investing. For more information, please visit Oakmark.com or call 1-800-OAKMARK (625-6275).
The discussion of the Funds' investments and investment strategy (including current investment themes, the portfolio managers' research and investment process, and portfolio characteristics) represents the Funds' investments and the views of the portfolio managers and Harris Associates L.P., the Funds' investment adviser, at the time of this report, and are subject to change without notice.
All Oakmark Funds: Investing in value stocks presents the risk that value stocks may fall out of favor with investors and underperform growth stocks during given periods.
Oakmark, Oakmark Equity and Income, Oakmark Global, Oakmark International and Oakmark International Small Cap Funds: The Funds' portfolios tend to be invested in a relatively small number of stocks. As a result, the appreciation or depreciation of any one security held will have a greater impact on the Funds' net asset value than it would if the Funds invest in a larger number of securities. Although that strategy has the potential to generate attractive returns over time, it also increases the Funds' volatility.
Oakmark Select Fund: The stocks of medium-sized companies tend to be more volatile than those of large companies and have underperformed the stocks of small and large companies during some periods.
Because the Oakmark Select and Oakmark Global Select Funds are non-diversified, the performance of each holding will have a greater impact on the Funds' total return, and may make the Fund's returns more volatile than a more diversified fund.
Oakmark Global, Oakmark Global Select, Oakmark International and Oakmark International Small Cap Funds: Investing in foreign securities presents risks which in some ways may be greater than U.S. investments. Those risks include: currency fluctuation; different regulation, accounting standards, trading practices and levels of available information; generally higher transaction costs; and political risks.
The percentages of hedge exposure for each foreign currency are calculated by dividing the market value of all same-currency forward contracts by the market value of the underlying equity exposure to that currency.
The Oakmark Equity and Income Fund invests in medium- and lower-quality debt securities that have higher yield potential but present greater investment and credit risk than higher-quality securities. These risks may result in greater share price volatility.
Oakmark International Small Cap Fund: The stocks of smaller companies often involve more risk than the stocks of larger companies. Stocks of small companies tend to be more volatile and have a smaller public market than stocks of larger companies.
Small companies may have a shorter history of operations than larger companies, may not have as great an ability to raise additional capital and may have a less diversified product line, making them more susceptible to market pressure.
Endnotes:
1. Duke, A. (2018). Thinking in Bets: Making Smarter Decisions When You Don't Have All the Facts. Portfolio.
2. The S&P 500 Total Return Index is a float-adjusted, capitalization-weighted index of 500 U.S. large-capitalization stocks representing all major industries. It is a widely recognized index of broad, U.S. equity market performance. Returns reflect the reinvestment of dividends. This index is unmanaged and investors cannot invest directly in this index.
3. The Dow Jones Industrial Average is a price-weighted measure of 30 U.S. blue-chip companies. The index covers all industries except transportation and utilities. This index is unmanaged and investors cannot invest directly in this index.
4. The Lipper Large-Cap Value Fund Index measures the equal-weighted performance of the 30 largest U.S. large-cap value funds as defined by Lipper. This index is unmanaged and investors cannot invest directly in this index.
5. Portfolio holdings are subject to change without notice and are not intended as recommendations of individual stocks.
6. EPS refers to Earnings Per Share and is calculated by dividing total earnings by the number of shares outstanding.
7. The Price-Earnings Ratio ("P/E") is the most common measure of the expensiveness of a stock.
8. The Lipper Multi-Cap Value Fund Index measures the equal-weighted performance of the 30 largest U.S. multi-cap value funds as defined by Lipper. This index is unmanaged and investors cannot invest directly in this index.
9. The Lipper Balanced Fund Index measures the equal-weighted performance of the 30 largest U.S. balanced funds as defined by Lipper. This index is unmanaged and investors cannot invest directly in this index.
10. The Barclays U.S. Government/Credit Index measures the non-securitized component of the U.S. Aggregate Index. It includes investment grade, U.S. dollar-denominated, fixed-rate Treasuries, government-related and corporate securities. This index is unmanaged and investors cannot invest directly in this index.
11. Jordà, Ò, Knoll, K., Kuvshinov, D., Schularick, M., & Taylor, A. (2017). The Rate of Return on Everything, 1870—2015. The National Bureau of Economic Research. doi:10.3386/w24112.
12. The MSCI World Index (Net) is a free float-adjusted, market capitalization-weighted index that is designed to measure the global equity market performance of developed markets. The index covers approximately 85% of the free float-adjusted market capitalization in each country. This benchmark calculates reinvested dividends net of withholding taxes. This index is unmanaged and investors cannot invest directly in this index.
13. The Lipper Global Fund Index measures the equal-weighted performance of the 30 largest global equity funds as defined
Oakmark.com 83
Disclosures and Endnotes (continued)
by Lipper. This index is unmanaged and investors cannot invest directly in this index.
14. The MSCI World ex U.S. Index (Net) is a free float-adjusted, market capitalization-weighted index that is designed to measure international developed market equity performance, excluding the U.S. The index covers approximately 85% of the free float-adjusted market capitalization in each country. This benchmark calculates reinvested dividends net of withholding taxes. This index is unmanaged and investors cannot invest directly in this index.
15. The MSCI EAFE Index (Net) is designed to represent the performance of large and mid-cap securities across 21 developed markets countries in Europe, Australasia and the Far East, excluding the U.S. and Canada. The index covers approximately 85% of the free float-adjusted market capitalization in each of the 21 countries. This benchmark calculates reinvested dividends net of withholding taxes. This index is unmanaged and investors cannot invest directly in this index.
16. The Lipper International Fund Index measures the equal-weighted performance of the 30 largest international equity funds, as defined by Lipper. This index is unmanaged and investors cannot invest directly in this index.
17. The MSCI World ex U.S. Small Cap Index (Net) is designed to measure performance of small-cap stocks across 22 of 23 developed markets (excluding the U.S.). The index covers approximately 14% of the free float-adjusted market capitalization in each country. This benchmark calculates reinvested dividends net of withholding taxes. This index is unmanaged and investors cannot invest directly in this index.
18. The Lipper International Small-Cap Fund Index measures the equal-weighted performance of the 30 largest international small-cap equity funds as defined by Lipper. This index is unmanaged and investors cannot invest directly in this index.
84 OAKMARK FUNDS
Oakmark Funds
Trustees and Officers
Trustees
Allan J. Reich—Chair
Thomas H. Hayden
Christine M. Maki
Laurence C. Morse, Ph. D.
Mindy M. Posoff
Steven S. Rogers
Kristi L. Rowsell
Peter S. Voss
Officers
Kristi L. Rowsell—President and Principal Executive Officer
Anthony P. Coniaris—Executive Vice President
Kevin G. Grant—Executive Vice President
Judson H. Brooks—Vice President
Megan J. Claucherty—Vice President
Richard J. Gorman—Vice President, Chief Compliance
Officer, Anti-Money Laundering Officer and Assistant Secretary*
Justin D. Hance—Vice President
David G. Herro—Vice President
M. Colin Hudson—Vice President
John J. Kane—Vice President, Principal Financial Officer and
Treasurer
Chris W. Keller—Vice President
Eric Liu—Vice President
Jason E. Long—Vice President
Michael L. Manelli—Vice President
Colin P. McFarland—Chief Compliance Officer and Anti-Money Laundering Officer**
Clyde S. McGregor—Vice President
Ian J. McPheron—Vice President and Chief Legal Officer‡
Thomas W. Murray—Vice President
Michael J. Neary—Vice President
William C. Nygren—Vice President
Vineeta D. Raketich—Vice President
Andrew J. Tedeschi—Vice President and Assistant Treasurer
Zachary D. Weber—Vice President
Edward J. Wojciechowski—Vice President
Rana J. Wright—Vice President, Secretary and Chief Legal Officer†
* Mr. Gorman is no longer an Officer of the Trust as of February 1, 2018.
** Mr. McFarland assumed his duties effective February 1, 2018.
† Ms. Wright assumed her duties effective January 23, 2018.
‡ Mr. McPheron relinquished his duties as Chief Legal Officer effective January 23, 2018.
^ Prior to January 1, 2018, DST Asset Manager Solutions, Inc. was named Boston Financial Data Services.
Other Information
Investment Adviser
Harris Associates L.P.
111 S. Wacker Drive
Chicago, Illinois 60606-4319
Transfer Agent
DST Asset Manager Solutions, Inc.^
Quincy, Massachusetts
Legal Counsel
K&L Gates LLP
Washington, D.C.
Independent Registered Public Accounting Firm
Deloitte & Touche LLP
Chicago, Illinois
Contact Us
Please call 1-800-OAKMARK
(1-800-625-6275)
or 617-483-8327
Website
Oakmark.com
Twitter
@HarrisOakmark
To obtain a prospectus, an application or periodic reports, access our website at Oakmark.com or call 1-800-OAKMARK (625-6275) or (617) 483-8327.
Each Fund will file its complete schedule of portfolio holdings with the Securities and Exchange Commission ("SEC") for the first and third quarters of each fiscal year on Form N-Q. The Funds' Form N-Qs are available on the SEC's website at www.sec.gov. The Funds' Form N-Qs may be reviewed and copied at the SEC's Public Reference Room in Washington, DC, and information on the operation of the Public Reference Room may be obtained by calling 1-800-SEC-0330.
A description of the policies and procedures the Funds use to determine how to vote proxies relating to portfolio securities is available without charge, upon request, by calling toll-free 1-800-625-6275; on the Funds' website at Oakmark.com; and on the SEC's website at www.sec.gov.
No later than August 31 of each year, information regarding how the Adviser, on behalf of the Funds, voted proxies relating to the Funds' portfolio securities for the twelve months ended the preceding June 30 will be available through a link on the Funds' website at Oakmark.com and on the SEC's website at www.sec.gov.
This report is submitted for the general information of the shareholders of the Funds. The report is not authorized for distribution to prospective investors in the Funds unless it is accompanied or preceded by a currently effective prospectus of the Funds.
No sales charge to the shareholder or to the new investor is made in offering the shares of the Funds; however, a shareholder of the Oakmark International Small Cap Fund may incur a 2% redemption fee on an exchange or redemption of shares held for 90 days or less.
Oakmark.com 85


Item 2. Code of Ethics.
Not required in this filing.
Item 3. Audit Committee Financial Expert.
Not required in this filing.
Item 4. Principal Accountant Fees and Services.
Not required in this filing.
Item 5. Audit Committee of Listed Registrants.
Not applicable.
Item 6. Investments.
(a) The Schedule of Investments in securities of unaffiliated issuers as of the close of the reporting period is included as part of the semi-annual report to shareholders filed under Item 1 of this Form.
(b) Not applicable.
Item 7. Disclosure of Proxy Voting Policies and Procedures for Closed-End Management Investment Companies.
Not applicable.
Item 8. Portfolio Managers of Closed-End Management Investment Companies.
Not applicable.
Item 9. Purchases of Equity Securities by Closed-End Management Investment Company and Affiliated Purchasers.
Not applicable.
Item 10. Submission of Matters to a Vote of Security Holders.
During the period covered by this report, no material changes were made to the procedures by which shareholders may recommend nominees to the Registrant’s board of trustees.
Item 11. Controls and Procedures.
(a) Based on an evaluation of the Registrant’s disclosure controls and procedures (as defined in Rule 30a-3(c) under the Investment Company Act of 1940, the “Disclosure Controls”), the Disclosure Controls are effectively designed to ensure that information required to be disclosed by the Registrant in this report is recorded, processed, summarized, and reported within 90 days prior to the filing of this report, including ensuring that information required to be disclosed in this report is accumulated and communicated to the Registrant’s management, including the Registrant’s principal executive officer and principal financial officer, as appropriate to allow timely decisions regarding required disclosure.
(b) There were no changes in the Registrant’s internal controls over financial reporting (as defined in Rule 30a-3(d) under the Investment Company Act of 1940) that occurred during the Registrant’s second fiscal quarter of the time period covered by this report that has materially affected, or is reasonably likely to materially affect, the Registrant’s internal control over financial reporting.
Item 12. Disclosure of Securities Lending Activities for Closed-End Management Investment Companies.
Not applicable.
Item 13. Exhibits.
(a)(1) A copy of the Code is incorporated by reference to the Registrant’s Form N-CSR, Investment Company Act file number 811-06279 (filed November 25, 2015).
(2) Certifications of Kristi L. Rowsell, Principal Executive Officer, and John J. Kane, Principal Financial Officer, pursuant to Rule 30a-2(a) under the Investment Company Act of 1940 (17 CFR 270.30a-2), attached hereto as Exhibits (a)(2)(i) and (a)(2)(ii), respectively.
(3) Not applicable.
(4) Not applicable.
(b) Certification of Kristi L. Rowsell, Principal Executive Officer, and John J. Kane, Principal Financial Officer, pursuant to Section 906 of the Sarbanes-Oxley Act of 2002, attached hereto as Exhibit (b).
SIGNATURES
Pursuant to the requirements of the Securities Exchange Act of 1934 and the Investment Company Act of 1940, the Registrant has duly caused this report to be signed on its behalf by the undersigned, thereunto duly authorized.
Harris Associates Investment Trust
By: | /s/ Kristi L. Rowsell | |
| Kristi L. Rowsell | |
| Principal Executive Officer | |
| | |
Date: | May 25, 2018 | |
Pursuant to the requirements of the Securities Exchange Act of 1934 and the Investment Company Act of 1940, this report has been signed below by the following persons on behalf of the Registrant and in the capacities and on the dates indicated.
By: | /s/ Kristi L. Rowsell | |
| Kristi L. Rowsell | |
| Principal Executive Officer | |
| | |
Date: | May 25, 2018 | |
| | |
| | |
By: | /s/ John J. Kane | |
| John J. Kane | |
| Principal Financial Officer | |
| | |
Date: | May 25, 2018 | |