UNITED STATES
SECURITIES AND EXCHANGE COMMISSION
Washington, D.C. 20549
FORM N-CSR
CERTIFIED SHAREHOLDER REPORT OF REGISTERED
MANAGEMENT INVESTMENT COMPANIES
Investment Company Act file number | 811-06279 |
|
Harris Associates Investment Trust |
(Exact name of registrant as specified in charter) |
|
111 South Wacker Drive, Suite 4600
Chicago, Illinois | | 60606-4319 |
(Address of principal executive offices) | | (Zip code) |
|
Kristi L. Rowsell Harris Associates L.P. 111 South Wacker Drive, Suite 4600 Chicago, Illinois 60606 | Ndenisarya M. Bregasi K&L Gates LLP 1601 K Street, NW Washington, DC 20006 |
(Name and address of agent for service) |
|
Registrant’s telephone number, including area code: | (312) 646-3600 | |
|
Date of fiscal year end: | 9/30/16 | |
|
Date of reporting period: | 3/31/16 | |
| | | | | | | | | |
Item 1. Reports to Shareholders.
OAKMARK FUNDS
SEMI-ANNUAL REPORT | MARCH 31, 2016
OAKMARK FUND
OAKMARK SELECT FUND
OAKMARK EQUITY AND INCOME FUND
OAKMARK GLOBAL FUND
OAKMARK GLOBAL SELECT FUND
OAKMARK INTERNATIONAL FUND
OAKMARK INTERNATIONAL SMALL CAP FUND

Oakmark Funds
2016 Semi-Annual Report
TABLE OF CONTENTS
Fund Expenses | | | 1 | | |
Commentary on Oakmark and Oakmark Select Funds | | | 2 | | |
Oakmark Fund | |
Summary Information | | | 4 | | |
Portfolio Manager Commentary | | | 5 | | |
Schedule of Investments | | | 6 | | |
Oakmark Select Fund | |
Summary Information | | | 8 | | |
Portfolio Manager Commentary | | | 9 | | |
Schedule of Investments | | | 10 | | |
Oakmark Equity and Income Fund | |
Summary Information | | | 12 | | |
Portfolio Manager Commentary | | | 13 | | |
Schedule of Investments | | | 15 | | |
Oakmark Global Fund | |
Summary Information | | | 22 | | |
Portfolio Manager Commentary | | | 23 | | |
Schedule of Investments | | | 25 | | |
Oakmark Global Select Fund | |
Summary Information | | | 28 | | |
Portfolio Manager Commentary | | | 29 | | |
Schedule of Investments | | | 30 | | |
Oakmark International Fund | |
Summary Information | | | 32 | | |
Portfolio Manager Commentary | | | 33 | | |
Schedule of Investments | | | 34 | | |
Oakmark International Small Cap Fund | |
Summary Information | | | 38 | | |
Portfolio Manager Commentary | | | 39 | | |
Schedule of Investments | | | 40 | | |
Financial Statements | |
Statements of Assets and Liabilities | | | 44 | | |
Statements of Operations | | | 46 | | |
Statements of Changes in Net Assets | | | 48 | | |
Notes to Financial Statements | | | 55 | | |
Financial Highlights | | | 66 | | |
Disclosures and Endnotes | | | 76 | | |
Trustees and Officers | | | 78 | | |
FORWARD-LOOKING STATEMENT DISCLOSURE
One of our most important responsibilities as mutual fund managers is to communicate with shareholders in an open and direct manner. Some of our comments in our letters to shareholders are based on current management expectations and are considered "forward-looking statements." Actual future results, however, may prove to be different from our expectations. You can identify forward-looking statements by words such as "estimate", "may", "will", "expect", "believe",
"plan" and other similar terms. We cannot promise future returns. Our opinions are a reflection of our best judgment at the time this report is compiled, and we disclaim any obligation to update or alter forward-looking statements as a result of new information, future events, or otherwise.
OAKMARK FUNDS
Fund Expenses (Unaudited)
A shareholder of each Fund incurs ongoing costs, including investment advisory fees, transfer agent fees and other Fund expenses. The examples below are intended to help shareholders understand the ongoing costs (in dollars) of investing in each Fund and to compare these costs with the ongoing costs of investing in other funds.
The following table provides information about actual account values and actual Fund expenses as well as hypothetical account values and hypothetical fund expenses for shares of each Fund.
ACTUAL EXPENSES
The following table shows the expenses a shareholder would have paid on a $1,000 investment in each Fund from October 1, 2015 to March 31, 2016, as well as how much a $1,000 investment would be worth at the close of the period, assuming actual Fund returns and expenses. A shareholder can estimate expenses incurred for the period by dividing the account value at March 31, 2016, by $1,000 and multiplying the result by the number in the "Actual—Expenses Paid During Period" column shown below.
Shares of Oakmark International Small Cap Fund, invested for 90 days or less, may be charged a 2% redemption fee upon redemption. Please consult the Funds' prospectus at Oakmark.com for more information.
HYPOTHETICAL EXAMPLE FOR COMPARISON PURPOSES
The following table provides information about hypothetical account values and hypothetical expenses for shares of each Fund based on actual expense ratios and an assumed rate of return of 5% per year before expenses, which are not the Funds' actual returns. The hypothetical account values and expenses may not be used to estimate the actual ending account balances or actual expenses shareholders paid for the period. Shareholders may use this information to compare the ongoing costs of investing in a Fund and other funds. To do so, compare this 5% hypothetical example with the 5% hypothetical examples that appear in the shareholder reports of the other funds.
Please note that the expenses shown in the table are meant to highlight your ongoing costs only and do not reflect any transaction costs, such as redemption fees. Therefore, the "Hypothetical—Expenses Paid During Period" column of the table is useful in comparing ongoing costs only and will not help you determine the relative total costs of owning different funds. If these transaction costs were included, the total costs would have been higher.
| | | | ACTUAL | | HYPOTHETICAL
(5% annual return
before expenses) | | | |
| | Beginning
Account Value
(10/1/15) | | Ending
Account Value
(3/31/16) | | Expenses
Paid During
Period* | | Ending
Account Value
(3/31/16) | | Expenses
Paid During
Period* | | Annualized
Expense
Ratio | |
Oakmark Fund | |
Class I | | $ | 1,000.00 | | | $ | 1,039.90 | | | $ | 4.49 | | | $ | 1,020.60 | | | $ | 4.45 | | | | 0.88 | % | |
Class II | | $ | 1,000.00 | | | $ | 1,038.10 | | | $ | 6.17 | | | $ | 1,018.95 | | | $ | 6.11 | | | | 1.21 | % | |
Oakmark Select Fund | |
Class I | | $ | 1,000.00 | | | $ | 1,009.60 | | | $ | 4.87 | | | $ | 1,020.15 | | | $ | 4.90 | | | | 0.97 | % | |
Class II | | $ | 1,000.00 | | | $ | 1,007.70 | | | $ | 6.68 | | | $ | 1,018.35 | | | $ | 6.71 | | | | 1.33 | % | |
Oakmark Equity and Income Fund | |
Class I | | $ | 1,000.00 | | | $ | 1,023.30 | | | $ | 3.95 | | | $ | 1,021.10 | | | $ | 3.94 | | | | 0.78 | % | |
Class II | | $ | 1,000.00 | | | $ | 1,021.40 | | | $ | 5.71 | | | $ | 1,019.35 | | | $ | 5.70 | | | | 1.13 | % | |
Oakmark Global Fund | |
Class I | | $ | 1,000.00 | | | $ | 981.60 | | | $ | 5.70 | | | $ | 1,019.25 | | | $ | 5.81 | | | | 1.15 | % | |
Class II | | $ | 1,000.00 | | | $ | 980.00 | | | $ | 7.43 | | | $ | 1,017.50 | | | $ | 7.57 | | | | 1.50 | % | |
Oakmark Global Select Fund | |
Class I | | $ | 1,000.00 | | | $ | 1,033.20 | | | $ | 5.85 | | | $ | 1,019.25 | | | $ | 5.81 | | | | 1.15 | % | |
Oakmark International Fund | |
Class I | | $ | 1,000.00 | | | $ | 1,020.90 | | | $ | 4.95 | | | $ | 1,020.10 | | | $ | 4.95 | | | | 0.98 | % | |
Class II | | $ | 1,000.00 | | | $ | 1,019.20 | | | $ | 6.76 | | | $ | 1,018.30 | | | $ | 6.76 | | | | 1.34 | % | |
Oakmark International Small Cap Fund | |
Class I | | $ | 1,000.00 | | | $ | 1,006.90 | | | $ | 6.97 | | | $ | 1,018.05 | | | $ | 7.01 | | | | 1.39 | % | |
Class II | | $ | 1,000.00 | | | $ | 1,006.20 | | | $ | 8.58 | | | $ | 1,016.45 | | | $ | 8.62 | | | | 1.71 | % | |
* Expenses for each share class is equal to the annualized expense ratio, multiplied by the average account value over the period, multiplied by the number of days in the most recent half-year divided by 365 (to reflect one-half year period)
Oakmark.com 1
Oakmark and Oakmark Select Funds March 31, 2016
Portfolio Manager Commentary

William C. Nygren, CFA
Portfolio Manager
oakmx@oakmark.com
oaklx@oakmark.com
At Oakmark, we are long-term investors. We attempt to identify growing businesses that are managed to benefit their shareholders. We will purchase stock in those businesses only when priced substantially below our estimate of intrinsic value. After purchase, we patiently wait for the gap between stock price and intrinsic value to close.
Last month, I had a Q&A session with John Rotonti of The Motley Fool. I thought John's questions gave an unusually good opportunity to explain how we at Oakmark approach investment decision making. What follows is an excerpt from that interview. The full interview is available at Oakmark.com.
John Rotonti: What's your definition of a high-quality business?
Bill Nygren: Oakmark would consider a business to be high-quality if it had many of the following attributes:
• high return on incremental invested capital
• high free cash generation
• above-average growth opportunities
• competitive advantage not subject to replication
• low cyclicality
• low risk of obsolescence
I'm no doubt missing other important characteristics, but you get the idea. More importantly, however, is that there is a big difference between a high-quality business and a great stock, and that difference is stock price. Just as consumers do, we are always making trade-offs between price and quality.
John Rotonti: What's your definition of a high-quality management team?
Bill Nygren: I think all investors would agree that a very important measure of a management team is its ability to maximize long-term returns for the business. It is rare that we disagree with the consensus on how well management runs the business. The issue we spend a great deal of time analyzing—that many other investors gloss over—is how a manager allocates capital.
If you buy a stock expecting to sell it after the next earnings release, capital allocation barely matters. But if you buy a stock expecting to hold it for five years, like we do, capital allocation becomes critically important. We define good capital allocators as always searching for the option that maximizes long-term risk-adjusted return. That means thinking like an owner, not a professional manager. A professional manager is almost always focused on making the company bigger—effectively focusing on the numerator. An owner pays just as much attention to the denominator, meaning maximizing per-share values.
John Rotonti: Do you think there's one source of competitive advantage that's stronger and more enduring than others?
Bill Nygren: As soon as it is obvious that a business is successful (meaning it earns a higher return than its cost of capital), other businesses begin trying to replicate that success. The most
obvious enduring protection is a patent that can't be bypassed (think pharmaceuticals), which gives relative certainty to monopoly status until expiration. Unfortunately, most investors recognize and are willing to pay for that advantage. Other competitive advantages we like are brand names, high switching costs, and scale. The longer I've been at this, the more respect I gain for corporate culture being a sustainable advantage. One would think that Liberty Media's (NASDAQ: LMCA) singular focus on per-share value, 3G's focus on cost reduction, or Goldman Sachs's (NYSE: GS) focus on hiring the best and brightest ought to be easily copied, but it isn't. I think that an advantaged corporate culture is the "moat" that is most often available for free.
John Rotonti: Now a few questions on valuation. In a previous conversation, you told me that your preferred method for estimating intrinsic value is to look at recent acquisition multiples for comparable businesses and that you use discounted cash flow analysis just as a sanity check. For businesses that don't have comparable acquisition multiples (such as Apple (NASDAQ: AAPL), Google holding company Alphabet (NASDAQ: GOOG) (NASDAQ: GOOGL), or Amazon (NASDAQ: AMZN)), what's your next preferred method?
Bill Nygren: Our preferred method is not encompassed by one summary statistic. We want to apply the statistic(s) that best captures each company's unique value. We owned Amazon most of last year—an odd holding for a value manager given a P/E1 ratio of several hundred. The metric that gave us confidence that Amazon was cheaper than other retailers was enterprise value divided by sales. It seemed odd to us that Amazon, growing sales at 20%-plus annually, was priced at a smaller percentage of sales than were average brick-and-mortar stores. Other investors were focused on Amazon's low margin; we believed forfeiting a year of earnings was a small price to pay to grow more than 2000 basis points faster than competitors.
In the case of Google, now Alphabet, we use a sum-of-the-parts approach explicitly valuing cash, cumulative investments in venture cap-like projects, and YouTube valued at a similar price-to-hours-watched ratio as other media companies. We then apply an appropriate multiple to search EBITA2 considering its low incremental capital needs, high market share, and strong industry tailwind.
John Rotonti: Are there ways of identifying what I'll call non-GAAP compounders, and is this something you try to do? These are fast-growth companies that are investing heavily today so they may not be generating a GAAP profit. I think some metrics to focus on may be customer retention and market share.
Bill Nygren: Any time you can identify a measure of value that isn't earnings-based, you have the potential to see value compounding where investors focused on reported earnings don't
2 OAKMARK FUNDS
Oakmark and Oakmark Select Funds March 31, 2016
Portfolio Manager Commentary (continued)
see it. Examples we have profited from include using price-to-sales3 to identify value growth at Amazon, using price-to-subscriber to value cable TV or programming companies, price-to- EBITDA plus R&D for drug companies. All can be examples of businesses where growth capital is invested through the income statement rather than being capitalized.
John Rotonti: From what I can tell, you have tended to sell once a stock price approaches your estimate of fair value. Is this always the case, or are there some companies that you consider of such high quality that you would consider holding as long as the valuation does not balloon outside a zone of reasonableness?
Bill Nygren: When we purchase a stock at Oakmark, we set a sell target that is based on our best estimate of the value of that company. Our value estimate incorporates our belief about how the business quality compares to other businesses—higher-quality companies would benefit from higher multiples used to set sell targets. While we own a stock, the analyst's job is to constantly refine and update our estimate of fundamental value, and thus the sell target. When that target is reached, unless we are delaying the sale to allow a gain to benefit from lower long-term capital gain tax rates, we sell.
Investing is always about opportunity cost—by definition, having your assets invested in a specific portfolio of stocks means you have no capital remaining for the stocks not in the portfolio. One of the all-time great investors, Charlie Munger, is constantly reminding us that some conclusions are easier to reach if we invert our thinking. So let's assume we want to hold stocks of great businesses when they appear fully valued. The capital used to make room for holding those stocks means you no longer have as much capital to buy all the stocks you have identified as undervalued. You would effectively be saying that a fully valued stock is a superior investment to an undervalued stock. The only way that could be true is if you didn't build in an appropriate multiple premium for a great business when setting your sell target. I think it is a very risky game for a value investor to become a momentum investor once a stock has reached its sell target.
John Rotonti: Do you meet with management?
Bill Nygren: Yes, we meet with almost every management we invest with.
When I joined Harris Associates (the advisor to the Oakmark Funds) in 1983, my boss asked me to go to a due diligence meeting for an IPO and report back. Upon returning, I told him the CEO was extremely impressive. He leaned back in his chair, took a big puff of his cigar, and then said, "I don't want you giving your opinion on a CEO until you've seen 100 of them. Only then can you start to tell the top from the bottom decile. Of course they are impressive, how do you think they get to be CEOs?"
Though I didn't appreciate his comment at the time, the more years that have passed, the more I see the wisdom in what he said. It is too easy to complete all your work on a company, then meet management and convince yourself they are exceptional. Rating managements effectively requires just as much rigor as does a valuation model.
We have specific goals of what we want to learn from management meetings. As long-term holders, our questions are never about next quarter or the outlook for the year. We are trying to
learn how they think, what their long-term goals are, how they are incentivized, and how they will judge their own success or failure. It is a very different conversation than we would have if we were trying to refine our earnings estimate. Think about the questions you would ask someone you didn't know personally who wanted you to become their business partner—that is the direction our conversations normally go.
Just like our valuation models aren't always perfect, neither are our qualitative assessments of managements. But if you judge our success against a goal of being directionally right more often than not, I believe getting to know management teams has been very additive to our process.
John Rotonti: Do you have any performance metrics that you prefer management compensation be based on?
Bill Nygren: We have one objective when looking at management compensation: We want to believe that they will maximize their personal economics by maximizing the long-term return on the stock. For that reason, we prefer performance metrics that drive fundamental value and that they be measured on a per-share basis. It is easy to make a company bigger by diluting the shareholders. Every management team says they want to maximize shareholder value; the elite management teams maximize per-share value.
John Rotonti: When we experience a broad market sell-off (say 20% or 30% or more), what are you looking to buy first? Do you buy more of your core holdings? Do you look to purchase shares of businesses that may have been on your watch list but the valuation never made sense? Do you go first to the companies offering the largest margin of safety?
Bill Nygren: People who own the Oakmark Funds expect us to be reasonably fully invested most of the time. They are hiring us to find stocks that are better than the average stock, not to guess future stock market direction. In an ideal world, our investors would respond to a 20% correction by giving us more money to capitalize on the price decline. But unfortunately, very few investors behave that way. The result is that when the market corrects, we rarely have much new cash to invest. So our process is the same whether stocks are down 20% or up 20%. We want our assets invested in the stocks that have the best risk-adjusted expected returns. We are always looking for opportunities to sell stocks at or near our estimate of value and reinvest those funds in stocks selling well below our value estimate. Large market moves often create more pricing variations one stock to the next, so we tend to be more active after bigger market moves.
Oakmark.com 3
Oakmark Fund March 31, 2016
Summary Information
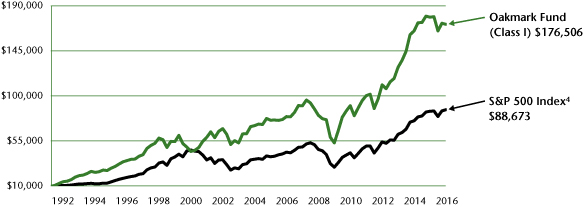
VALUE OF A $10,000 INVESTMENT
Since Inception - 08/05/91 (Unaudited)
PERFORMANCE
| | | | | Average Annual Total Returns (as of 03/31/16) | | | |
(Unaudited) | | Total Return
Last 3 Months | | 1-year | | 3-year | | 5-year | | 10-year | | Since
Inception | | Inception
Date | |
Oakmark Fund (Class I) | | | -0.62 | % | | | -4.00 | % | | | 10.07 | % | | | 11.35 | % | | | 8.02 | % | | | 12.35 | % | | 08/05/91 | |
S&P 500 Index | | | 1.35 | % | | | 1.78 | % | | | 11.82 | % | | | 11.58 | % | | | 7.01 | % | | | 9.26 | % | | | |
Dow Jones Industrial Average5 | | | 2.20 | % | | | 2.08 | % | | | 9.29 | % | | | 10.27 | % | | | 7.54 | % | | | 10.06 | % | | | |
Lipper Large Cap Value Funds Index6 | | | 0.84 | % | | | -2.78 | % | | | 8.90 | % | | | 9.00 | % | | | 5.34 | % | | | 8.45 | % | | | |
Oakmark Fund (Class II) | | | -0.73 | % | | | -4.34 | % | | | 9.71 | % | | | 10.99 | % | | | 7.68 | % | | | 7.13 | % | | 04/05/01 | |
The graph and table above do not reflect the deduction of taxes that a shareholder would pay on Fund distributions or the redemption of Fund shares.
Past performance is no guarantee of future results. The performance data quoted represents past performance. Current performance may be lower or higher than the performance data quoted. Total return includes change in share prices and, in each case, includes reinvestment of dividends and capital gain distributions. The investment return and principal value vary so that an investor's shares when redeemed may be worth more or less than the original cost. To obtain the most recent month-end performance, please visit Oakmark.com.
TOP TEN EQUITY HOLDINGS7 | | % of Net Assets | |
General Electric Co. | | | 3.0 | | |
Bank of America Corp. | | | 3.0 | | |
Citigroup, Inc. | | | 2.6 | | |
MasterCard, Inc., Class A | | | 2.6 | | |
Alphabet Inc., Class C | | | 2.5 | | |
Apache Corp. | | | 2.5 | | |
American International Group, Inc. | | | 2.5 | | |
Visa, Inc., Class A | | | 2.5 | | |
JPMorgan Chase & Co. | | | 2.4 | | |
Intel Corp. | | | 2.4 | | |
FUND STATISTICS | |
Ticker | | OAKMX | |
Inception | | 08/05/1991 | |
Number of Equity Holdings | | 51 | |
Net Assets | | $15.6 billion | |
Benchmark | | S&P 500 Index | |
Weighted Average Market Cap | | $116.7 billion | |
Median Market Cap | | $44.6 billion | |
Portfolio Turnover (for the 6-months ended 03/31/16) | | 14% | |
Expense Ratio - Class I (as of 09/30/15) | | 0.85% | |
SECTOR ALLOCATION | | % of Net Assets | |
Financials | | | 29.7 | | |
Information Technology | | | 27.0 | | |
Industrials | | | 11.0 | | |
Consumer Discretionary | | | 10.6 | | |
Energy | | | 6.1 | | |
Health Care | | | 4.7 | | |
Consumer Staples | | | 4.6 | | |
Materials | | | 1.6 | | |
Short-Term Investments and Other | | | 4.7 | | |
4 OAKMARK FUNDS
Oakmark Fund March 31, 2016
Portfolio Manager Commentary


William C. Nygren, CFA
Portfolio Manager
oakmx@oakmark.com
Kevin Grant, CFA
Portfolio Manager
oakmx@oakmark.com
The Oakmark Fund declined 1% in the first quarter of 2016, and it lagged behind the 1% gain for the S&P 5004. While the broader market increased only modestly from the first day of the quarter to the last, a closer look shows heightened intra-quarter volatility, with a 10% decline during the first half of the quarter followed by a swift recovery during the second half. Not surprisingly, oil prices followed a similar pattern, and the Fund's energy stocks increased from their early quarter lows. Interest rates remained at decades-low levels during the quarter, fueling "lower for longer" concerns, which along with worries about energy exposure added further pressure to the Fund's financial stocks. At Oakmark, we remain focused on assessing the long-term underlying value of businesses, which we believe are much less volatile than stock prices. As such, the financial sector's pronounced weakness has made the segment more attractive to us, and despite recent share price declines, financial companies still represent almost one-third of the Fund's equity holdings.
Our biggest contributing sectors for the first quarter were industrials and information technology, while Whirlpool and Cummins were the top individual contributors. The Fund's worst contributing sectors for the quarter were financials and materials, and our worst contributing securities were Bank of America and Citigroup.
There were no new additions to the portfolio during the first quarter, and we eliminated positions in General Mills, American Express, Union Pacific and Chesapeake Energy. General Mills has provided favorable returns since we added the stock in early 2014, and we sold our position as the share price approached our estimate of intrinsic value. When a business doesn't meet our expectations, we reduce our intrinsic value estimate accordingly, and the remaining three eliminations fall into that category. Selling our positions in American Express, Union Pacific and Chesapeake Energy allowed us to take tax losses while reinvesting proceeds into businesses in which we have more long-term confidence. Specifically, Chesapeake Energy has been a poor performer as oil prices have dropped from over $100 per barrel to less than $40 per barrel. Therefore, we swapped our Chesapeake holdings for other energy holdings that are also undervalued based on expected cost-cutting and higher commodity prices, but have what we believe are stronger balance sheets.
Oakmark.com 5
Oakmark Fund March 31, 2016 (Unaudited)
Schedule of Investments (in thousands)
| | | Shares | | Value | |
COMMON STOCKS - 95.3% | |
FINANCIALS - 29.7% | |
DIVERSIFIED FINANCIALS - 11.9% | |
State Street Corp.
Asset Management & Custody Banks | | | 5,955 | | | $ | 348,487 | | |
Capital One Financial Corp.
Consumer Finance | | | 4,713 | | | | 326,644 | | |
Ally Financial, Inc. (a)
Consumer Finance | | | 15,674 | | | | 293,417 | | |
The Goldman Sachs Group, Inc.
Investment Banking & Brokerage | | | 1,705 | | | | 267,651 | | |
Bank of New York Mellon Corp.
Asset Management & Custody Banks | | | 6,320 | | | | 232,752 | | |
Franklin Resources, Inc.
Asset Management & Custody Banks | | | 5,139 | | | | 200,659 | | |
T Rowe Price Group, Inc.
Asset Management & Custody Banks | | | 2,447 | | | | 179,741 | | |
| | | | | | 1,849,351 | | |
BANKS - 9.7% | |
Bank of America Corp.
Diversified Banks | | | 34,800 | | | | 470,496 | | |
Citigroup, Inc.
Diversified Banks | | | 9,730 | | | | 406,227 | | |
JPMorgan Chase & Co.
Diversified Banks | | | 6,390 | | | | 378,416 | | |
Wells Fargo & Co.
Diversified Banks | | | 5,170 | | | | 250,021 | | |
| | | | | | 1,505,160 | | |
INSURANCE - 8.1% | |
American International Group, Inc.
Multi-line Insurance | | | 7,155 | | | | 386,728 | | |
Aflac, Inc.
Life & Health Insurance | | | 5,520 | | | | 348,533 | | |
Aon PLC
Insurance Brokers | | | 3,020 | | | | 315,439 | | |
Principal Financial Group, Inc.
Life & Health Insurance | | | 5,489 | | | | 216,553 | | |
| | | | | | 1,267,253 | | |
| | | | | | 4,621,764 | | |
| | | Shares | | Value | |
INFORMATION TECHNOLOGY - 27.0% | |
SOFTWARE & SERVICES - 15.3% | |
MasterCard, Inc., Class A
Data Processing & Outsourced Services | | | 4,250 | | | $ | 401,625 | | |
Alphabet, Inc., Class C (a)
Internet Software & Services | | | 524 | | | | 389,981 | | |
Visa, Inc., Class A
Data Processing & Outsourced Services | | | 5,010 | | | | 383,165 | | |
Oracle Corp.
Systems Software | | | 8,945 | | | | 365,940 | | |
Automatic Data Processing, Inc.
Data Processing & Outsourced Services | | | 4,000 | | | | 358,840 | | |
Microsoft Corp.
Systems Software | | | 6,300 | | | | 347,949 | | |
Alphabet, Inc., Class A (a)
Internet Software & Services | | | 182 | | | | 138,541 | | |
| | | | | | 2,386,041 | | |
SEMICONDUCTORS & SEMICONDUCTOR EQUIPMENT - 7.5% | |
Intel Corp.
Semiconductors | | | 11,580 | | | | 374,613 | | |
Texas Instruments, Inc.
Semiconductors | | | 6,140 | | | | 352,559 | | |
QUALCOMM, Inc.
Semiconductors | | | 4,745 | | | | 242,659 | | |
Applied Materials, Inc.
Semiconductor Equipment | | | 9,060 | | | | 191,891 | | |
| | | | | | 1,161,722 | | |
TECHNOLOGY HARDWARE & EQUIPMENT - 4.2% | |
Apple, Inc.
Technology Hardware, Storage & Peripherals | | | 3,247 | | | | 353,891 | | |
TE Connectivity, Ltd.
Electronic Manufacturing Services | | | 4,936 | | | | 305,615 | | |
| | | | | | 659,506 | | |
| | | | | | 4,207,269 | | |
INDUSTRIALS - 11.0% | |
CAPITAL GOODS - 8.9% | |
General Electric Co.
Industrial Conglomerates | | | 14,900 | | | | 473,671 | | |
Caterpillar, Inc.
Construction Machinery & Heavy Trucks | | | 4,200 | | | | 321,468 | | |
Cummins, Inc.
Construction Machinery & Heavy Trucks | | | 2,900 | | | | 318,826 | | |
Parker-Hannifin Corp.
Industrial Machinery | | | 2,439 | | | | 270,953 | | |
| | | | | | 1,384,918 | | |
TRANSPORTATION - 2.1% | |
FedEx Corp.
Air Freight & Logistics | | | 2,000 | | | | 325,440 | | |
| | | | | | 1,710,358 | | |
See accompanying Notes to Financial Statements.
6 OAKMARK FUNDS
Oakmark Fund March 31, 2016 (Unaudited)
Schedule of Investments (in thousands) (continued)
| | | Shares | | Value | |
COMMON STOCKS - 95.3% (continued) | |
CONSUMER DISCRETIONARY - 10.6% | |
AUTOMOBILES & COMPONENTS - 3.8% | |
General Motors Co.
Automobile Manufacturers | | | 7,650 | | | $ | 240,439 | | |
Fiat Chrysler Automobiles N.V.
Automobile Manufacturers | | | 24,400 | | | | 196,664 | | |
Harley-Davidson, Inc.
Motorcycle Manufacturers | | | 2,902 | | | | 148,960 | | |
| | | | | | 586,063 | | |
MEDIA - 2.7% | |
News Corp., Class A
Publishing | | | 19,104 | | | | 243,959 | | |
Comcast Corp., Class A
Cable & Satellite | | | 2,944 | | | | 179,832 | | |
| | | | | | 423,791 | | |
CONSUMER DURABLES & APPAREL - 2.2% | |
Whirlpool Corp.
Household Appliances | | | 1,950 | | | | 351,663 | | |
RETAILING - 1.9% | |
Liberty Interactive Corp. QVC Group,
Class A (a)
Catalog Retail | | | 11,691 | | | | 295,196 | | |
| | | | | | 1,656,713 | | |
ENERGY - 6.1% | |
Apache Corp.
Oil & Gas Exploration & Production | | | 7,940 | | | | 387,546 | | |
Anadarko Petroleum Corp.
Oil & Gas Exploration & Production | | | 5,100 | | | | 237,507 | | |
Halliburton Co.
Oil & Gas Equipment & Services | | | 6,601 | | | | 235,787 | | |
National Oilwell Varco, Inc.
Oil & Gas Equipment & Services | | | 3,102 | | | | 96,457 | | |
| | | | | | 957,297 | | |
HEALTH CARE - 4.7% | |
HEALTH CARE EQUIPMENT & SERVICES - 3.3% | |
UnitedHealth Group, Inc.
Managed Health Care | | | 2,520 | | | | 324,828 | | |
Medtronic PLC
Health Care Equipment | | | 2,490 | | | | 186,750 | | |
| | | | | | 511,578 | | |
PHARMACEUTICALS, BIOTECHNOLOGY & LIFE SCIENCES - 1.4% | |
Sanofi (b)
Pharmaceuticals | | | 5,470 | | | | 219,675 | | |
| | | | | | 731,253 | | |
| | | Shares | | Value | |
CONSUMER STAPLES - 4.6% | |
FOOD, BEVERAGE & TOBACCO - 3.2% | |
Nestle SA (b)
Packaged Foods & Meats | | | 3,440 | | | $ | 256,658 | | |
Diageo PLC (b)
Distillers & Vintners | | | 2,250 | | | | 242,708 | | |
| | | | | | 499,366 | | |
HOUSEHOLD & PERSONAL PRODUCTS - 1.4% | |
Unilever PLC (b)
Personal Products | | | 4,763 | | | | 215,192 | | |
| | | | | | 714,558 | | |
MATERIALS - 1.6% | |
Monsanto Co.
Fertilizers & Agricultural Chemicals | | | 2,900 | | | | 254,446 | | |
TOTAL COMMON STOCKS - 95.3%
(COST $11,124,765) | | | | | 14,853,658 | | |
| | | Par Value | | Value | |
SHORT TERM INVESTMENTS - 3.8% | |
U.S. GOVERNMENT BILLS - 2.6% | |
United States Treasury Bills,
0.15% - 0.25%,
due 04/07/16 - 04/28/16 (c)
(Cost $399,969) | | $ | 400,000 | | | | 399,969 | | |
REPURCHASE AGREEMENT - 1.2% | |
Fixed Income Clearing Corp. Repurchase
Agreement, 0.10% dated 03/31/16 due
04/01/16, repurchase price $194,659,
collateralized by a United States Treasury
Note, 1.875%, due 10/31/22, value plus
accrued interest of $198,554
(Cost: $194,659) | | | 194,659 | | | | 194,659 | | |
TOTAL SHORT TERM INVESTMENTS - 3.8%
(COST $594,628) | | | | | 594,628 | | |
TOTAL INVESTMENTS - 99.1%
(COST $11,719,393) | | | | | 15,448,286 | | |
Foreign Currencies (Cost $0) - 0.0% (d) | | | | | 0 | (e) | |
Other Assets In Excess of Liabilities - 0.9% | | | | | 139,645 | | |
TOTAL NET ASSETS - 100.0% | | | | $ | 15,587,931 | | |
(a) Non-income producing security
(b) Sponsored American Depositary Receipt
(c) The rate shown represents the annualized yield at the time of purchase; not a coupon rate.
(d) Amount rounds to less than 0.1%.
(e) Amount rounds to less than $1,000.
See accompanying Notes to Financial Statements.
Oakmark.com 7
Oakmark Select Fund March 31, 2016
Summary Information
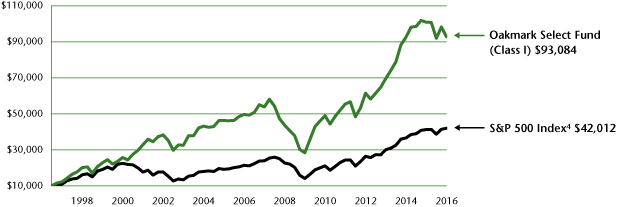
VALUE OF A $10,000 INVESTMENT
Since Inception - 11/01/96 (Unaudited)
PERFORMANCE
| | | | | Average Annual Total Returns (as of 03/31/16) | | | |
(Unaudited) | | Total Return
Last 3 Months | | 1-year | | 3-year | | 5-year | | 10-year | | Since
Inception | | Inception
Date | |
Oakmark Select Fund (Class I) | | | -5.56 | % | | | -8.04 | % | | | 10.09 | % | | | 10.86 | % | | | 6.46 | % | | | 12.18 | % | | 11/01/96 | |
S&P 500 Index | | | 1.35 | % | | | 1.78 | % | | | 11.82 | % | | | 11.58 | % | | | 7.01 | % | | | 7.67 | % | | | |
Lipper Multi-Cap Value Funds Index8 | | | 1.08 | % | | | -4.69 | % | | | 8.36 | % | | | 8.48 | % | | | 4.81 | % | | | 7.12 | % | | | |
Oakmark Select Fund (Class II) | | | -5.65 | % | | | -8.36 | % | | | 9.74 | % | | | 10.51 | % | | | 6.16 | % | | | 8.51 | % | | 12/31/99 | |
The graph and table do not reflect the deduction of taxes that a shareholder would pay on Fund distributions or the redemption of Fund shares.
Past performance is no guarantee of future results. The performance data quoted represents past performance. Current performance may be lower or higher than the performance data quoted. Total return includes change in share prices and, in each case, includes reinvestment of dividends and capital gain distributions. The investment return and principal value vary so that an investor's shares when redeemed may be worth more or less than the original cost. To obtain the most recent month-end performance, please visit Oakmark.com.
TOP TEN EQUITY HOLDINGS7 | | % of Net Assets | |
General Electric Co. | | 8.5 | |
Alphabet Inc., Class C | | 8.4 | |
TE Connectivity, Ltd. | | 6.1 | |
American International Group, Inc. | | 6.1 | |
JPMorgan Chase & Co. | | 5.6 | |
MasterCard, Inc., Class A | | 5.4 | |
CBRE Group, Inc. Class A | | 5.3 | |
Bank of America Corp. | | 5.2 | |
Citigroup, Inc. | | 5.2 | |
FNF Group | | 5.0 | |
FUND STATISTICS | |
Ticker | | OAKLX | |
Inception | | 11/01/96 | |
Number of Equity Holdings | | 19 | |
Net Assets | | $5.3 billion | |
Benchmark | | S&P 500 Index | |
Weighted Average Market Cap | | $136.5 billion | |
Median Market Cap | | $38.6 billion | |
Portfolio Turnover (for the 6-months ended 03/31/16) | | 9% | |
Expense Ratio - Class I (as of 09/30/15) | | 0.95% | |
SECTOR ALLOCATION | | % of Net Assets | |
Equity Investments | |
Financials | | | 36.2 | | |
Information Technology | | | 28.8 | | |
Industrials | | | 8.5 | | |
Consumer Discretionary | | | 5.5 | | |
Energy | | | 5.3 | | |
Utilities | | | 3.7 | | |
Materials | | | 3.3 | | |
Total Equity Investments | | | 91.3 | | |
Preferred Stock | | | 0.1 | | |
Fixed Income Investments | |
Convertible Bonds | | | 2.9 | | |
Corporate Bonds | | | 1.6 | | |
Total Fixed Income Investments | | | 4.5 | | |
Short-Term Investments and Other | | | 4.1 | | |
8 OAKMARK FUNDS
Oakmark Select Fund March 31, 2016
Portfolio Manager Commentary


William C. Nygren, CFA
Portfolio Manager
oaklx@oakmark.com
Anthony P. Coniaris, CFA
Portfolio Manager
oaklx@oakmark.com
Win Murray
Portfolio Manager
oaklx@oakmark.com
For the quarter, the Oakmark Select Fund declined 6%, compared to a 1% gain in the S&P 500 Index4. Our financial sector holdings accounted for over 80% of the decline in the Fund this quarter. While we are disappointed with this outcome, we remain confident in our financial holdings and the same process that has delivered success since the Fund's inception.
The three largest detractors from performance were Bank of America (-19%), Citigroup (-19%) and American International Group (-12%). Concerns about the economy and lower near-term expectations for interest rates have pressured financial stock prices broadly, and our holdings were not immune. Importantly, our values already reflect normalized credit losses and relatively minor interest rate increases over the next two years. While stresses in the energy and mining sectors will likely lead to some related credit losses for the banks, we believe the impact to value will prove de minimis as exposures are relatively small across our holdings. Meanwhile, operational performance and capital allocation are tracking with our expectations. Therefore, we view the lower share prices as merely increasing the discount to value at which these already cheap financials were trading, and we remain very confident in these holdings. The management and directors of Bank of America, Citigroup and JP Morgan seem to agree as they personally bought an aggregate $31.5 million of their companies' stock during the first quarter.
Our largest contributors to performance were Oracle (+12%), Apache (+11%) and General Electric (+3%). Oracle has been managing its customers' transition to the cloud largely as we have expected. We believe Apache has the balance sheet and asset quality to survive this downturn in oil and gas prices, and we continue to like what the new management team is doing to preserve and grow per share value. GE has been a welcome port in the recent market storm as it has benefitted from company-specific improvements in margins and capital allocation, and it has enjoyed well-deserved multiple expansion from its reduced dependence on earnings from GE Capital.
While there were no new companies purchased in the quarter, recent volatility in the equity and fixed income markets allowed us to purchase securities within the capital structure of two existing holdings in a way that maintained upside to these undervalued companies and added downside protection, while also providing a tax benefit. In the case of Chesapeake Energy, we purchased bonds at prices that offered similar upside to the equity, despite higher seniority in the capital structure, while capturing a tax loss on the sale of equity. Similarly, we have increased our position in Fiat Chrysler mandatory convertible bonds at prices that preserved the upside of the equity with the added benefit of downside protection through a unique conversion feature, purchased at minimal additional cost, while capturing a tax loss as we sold a corresponding dollar amount of Fiat Chrysler equity. In January, we also sold Ferrari shares upon
distribution from Fiat Chrysler because the shares were near our estimate of intrinsic value. We used the proceeds to purchase a like dollar amount of Fiat Chrysler shares, which were selling at a much larger discount to our estimate of value.
Thank you for your continued investment in the Fund.
Oakmark.com 9
Oakmark Select Fund March 31, 2016 (Unaudited)
Schedule of Investments (in thousands)
| | | Shares | | Value | |
COMMON STOCKS - 91.3% | |
FINANCIALS - 36.2% | |
BANKS - 15.9% | |
JPMorgan Chase & Co.
Diversified Banks | | | 5,001 | | | $ | 296,159 | | |
Bank of America Corp.
Diversified Banks | | | 20,479 | | | | 276,871 | | |
Citigroup, Inc.
Diversified Banks | | | 6,577 | | | | 274,590 | | |
| | | | | | 847,620 | | |
INSURANCE - 11.1% | |
American International Group, Inc.
Multi-line Insurance | | | 5,980 | | | | 323,230 | | |
FNF Group
Property & Casualty Insurance | | | 7,821 | | | | 265,139 | | |
| | | | | | 588,369 | | |
REAL ESTATE - 5.3% | |
CBRE Group, Inc., Class A (a)
Real Estate Services | | | 9,814 | | | | 282,839 | | |
DIVERSIFIED FINANCIALS - 3.9% | |
Capital One Financial Corp.
Consumer Finance | | | 3,011 | | | | 208,692 | | |
| | | | | | 1,927,520 | | |
INFORMATION TECHNOLOGY - 28.8% | |
SOFTWARE & SERVICES - 18.8% | |
Alphabet, Inc., Class C (a)
Internet Software & Services | | | 604 | | | | 449,689 | | |
MasterCard, Inc., Class A
Data Processing & Outsourced Services | | | 3,049 | | | | 288,131 | | |
Oracle Corp.
Systems Software | | | 6,377 | | | | 260,883 | | |
| | | | | | 998,703 | | |
TECHNOLOGY HARDWARE & EQUIPMENT - 6.1% | |
TE Connectivity, Ltd.
Electronic Manufacturing Services | | | 5,273 | | | | 326,500 | | |
SEMICONDUCTORS & SEMICONDUCTOR EQUIPMENT - 3.9% | |
Intel Corp.
Semiconductors | | | 6,447 | | | | 208,560 | | |
| | | | | | 1,533,763 | | |
INDUSTRIALS - 8.5% | |
CAPITAL GOODS - 8.5% | |
General Electric Co.
Industrial Conglomerates | | | 14,238 | | | | 452,626 | | |
CONSUMER DISCRETIONARY - 5.5% | |
RETAILING - 4.4% | |
Liberty Interactive Corp. QVC Group, Class A (a)
Catalog Retail | | | 9,214 | | | | 232,650 | | |
| | | Shares | | Value | |
AUTOMOBILES & COMPONENTS - 1.1% | |
Fiat Chrysler Automobiles N.V.
Automobile Manufacturers | | | 7,348 | | | $ | 59,229 | | |
| | | | | | 291,879 | | |
ENERGY - 5.3% | |
Apache Corp.
Oil & Gas Exploration & Production | | | 5,251 | | | | 256,302 | | |
Chesapeake Energy Corp.
Oil & Gas Exploration & Production | | | 6,360 | | | | 26,203 | | |
| | | | | | 282,505 | | |
UTILITIES - 3.7% | |
Calpine Corp. (a)
Independent Power Producers & Energy Traders | | | 13,004 | | | | 197,277 | | |
MATERIALS - 3.3% | |
Monsanto Co.
Fertilizers & Agricultural Chemicals | | | 1,972 | | | | 173,023 | | |
TOTAL COMMON STOCKS - 91.3%
(COST $3,581,189) | | | | | 4,858,593 | | |
PREFERRED STOCKS - 0.1% | |
ENERGY - 0.1% | |
Chesapeake Energy Corp., 5.75%
Oil & Gas Exploration & Production | | | 44 | | | | 7,596 | | |
TOTAL PREFERRED STOCKS - 0.1%
(COST $8,311) | | | | | 7,596 | | |
| | | Par Value | | Value | |
FIXED INCOME - 4.5% | |
CONVERTIBLE BOND - 2.9% | |
Fiat Chrysler Automobiles N.V.,
7.875%, due 12/15/16
(Cost $155,149) | | $ | 215,779 | | | | 153,055 | | |
CORPORATE BONDS - 1.6% | |
Chesapeake Energy Corp., 144A,
8.00%, due 12/15/22 (b)
(Cost $78,872) | | | 175,000 | | | | 85,750 | | |
TOTAL FIXED INCOME - 4.5%
(COST $234,021) | | | | | 238,805 | | |
See accompanying Notes to Financial Statements.
10 OAKMARK FUNDS
Oakmark Select Fund March 31, 2016 (Unaudited)
Schedule of Investments (in thousands) (continued)
| | | Par Value | | Value | |
SHORT TERM INVESTMENTS - 4.0% | |
REPURCHASE AGREEMENT - 4.0% | |
Fixed Income Clearing Corp. Repurchase
Agreement, 0.10% dated 03/31/16 due
04/01/16, repurchase price $211,282,
collateralized by a United States Treasury
Note, 2.375%, due 08/15/24, value plus
accrued interest of $215,508
(Cost: $211,282) | | $ | 211,282 | | | $ | 211,282 | | |
TOTAL SHORT TERM INVESTMENTS - 4.0%
(COST $211,282) | | | | | 211,282 | | |
TOTAL INVESTMENTS - 99.9%
(COST $4,034,803) | | | | | 5,316,276 | | |
Other Assets In Excess of Liabilities - 0.1% | | | | | 7,390 | | |
TOTAL NET ASSETS - 100.0% | | | | $ | 5,323,666 | | |
(a) Non-income producing security
(b) See Note 1 in the Notes to Financial Statements regarding restricted securities. These securities may be resold subject to restrictions on resale under federal securities law.
See accompanying Notes to Financial Statements.
Oakmark.com 11
Oakmark Equity and Income Fund March 31, 2016
Summary Information
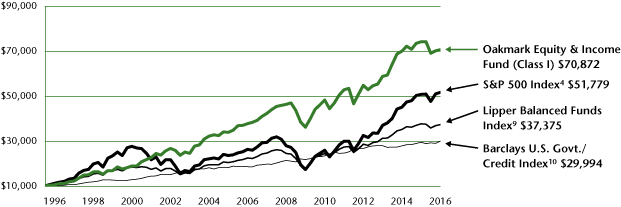
VALUE OF A $10,000 INVESTMENT
Since Inception - 11/01/95 (Unaudited)
PERFORMANCE
| | | | | Average Annual Total Returns (as of 03/31/16) | | | |
(Unaudited) | | Total Return
Last 3 Months | | 1-year | | 3-year | | 5-year | | 10-year | | Since
Inception | | Inception
Date | |
Oakmark Equity and Income Fund (Class I) | | | 0.77 | % | | | -4.73 | % | | | 6.35 | % | | | 6.01 | % | | | 6.49 | % | | | 10.07 | % | | 11/01/95 | |
Lipper Balanced Funds Index | | | 1.29 | % | | | -0.89 | % | | | 6.09 | % | | | 6.44 | % | | | 5.23 | % | | | 6.67 | % | | | |
S&P 500 Index | | | 1.35 | % | | | 1.78 | % | | | 11.82 | % | | | 11.58 | % | | | 7.01 | % | | | 8.39 | % | | | |
Barclays U.S. Govt./Credit Index | | | 3.47 | % | | | 1.75 | % | | | 2.42 | % | | | 4.04 | % | | | 4.93 | % | | | 5.53 | % | | | |
Oakmark Equity and Income Fund (Class II) | | | 0.67 | % | | | -5.04 | % | | | 6.00 | % | | | 5.67 | % | | | 6.14 | % | | | 8.23 | % | | 07/12/00 | |
The graph and table above do not reflect the deduction of taxes that a shareholder would pay on Fund distributions or the redemption of Fund shares.
Past performance is no guarantee of future results. The performance data quoted represents past performance. Current performance may be lower or higher than the performance data quoted. Total return includes change in share prices and, in each case, includes reinvestment of dividends and capital gain distributions. The investment return and principal value vary so that an investor's shares when redeemed may be worth more or less than the original cost. To obtain the most recent month-end performance, please visit Oakmark.com.
TOP TEN EQUITY HOLDINGS7 | | % of Net Assets | |
General Motors Co. | | | 4.3 | | |
Oracle Corp. | | | 4.1 | | |
Bank of America Corp. | | | 3.8 | | |
Nestle ADR | | | 3.3 | | |
CVS Health Corp. | | | 3.0 | | |
TE Connectivity, Ltd. | | | 2.8 | | |
Foot Locker, Inc. | | | 2.4 | | |
Dover Corp. | | | 2.4 | | |
Philip Morris International, Inc. | | | 2.1 | | |
MasterCard, Inc., Class A | | | 2.1 | | |
FUND STATISTICS | |
Ticker | | OAKBX | |
Inception | | 11/01/95 | |
Number of Equity Holdings | | 46 | |
Net Assets | | $17.0 billion | |
Benchmark | | Lipper Balanced Funds Index | |
Weighted Average Market Cap | | $72.2 billion | |
Median Market Cap | | $13.3 billion | |
Portfolio Turnover (for the 6-months ended 03/31/16) | | 12% | |
Expense Ratio - Class I (as of 09/30/15) | | 0.75% | |
SECTOR ALLOCATION | | % of Net Assets | |
Equity Investments | |
Financials | | | 18.3 | | |
Consumer Discretionary | | | 11.2 | | |
Consumer Staples | | | 10.0 | | |
Industrials | | | 10.0 | | |
Information Technology | | | 8.9 | | |
Energy | | | 2.2 | | |
Health Care | | | 1.9 | | |
Materials | | | 0.9 | | |
Total Equity Investments | | | 63.4 | | |
Fixed Income Investments | |
Corporate Bonds | | | 11.0 | | |
Government and Agency Securities | | | 9.1 | | |
Asset Backed Securities | | | 0.1 | | |
Total Fixed Income Investments | | | 20.2 | | |
Short-Term Investments and Other | | | 16.4 | | |
12 OAKMARK FUNDS
Oakmark Equity and Income Fund March 31, 2016
Portfolio Manager Commentary


Clyde S. McGregor, CFA
Portfolio Manager
oakbx@oakmark.com
M. Colin Hudson, CFA
Portfolio Manager
oakbx@oakmark.com
Matthew A. Logan, CFA
Portfolio Manager
oakbx@oakmark.com
Edward J. Wojciechowski, CFA
Portfolio Manager
oakbx@oakmark.com
Rocky Markets, Steady Strategy
The S&P 5004 gained 1% this quarter, a modest increase by historical standards but one few are complaining about given the unusually rough start to the year. Within the first four trading days, the index was down 5% and 2016 took the award for worst-ever start to a year. And it only got worse. By the middle of February, the market had fallen by nearly 11%, driven by fears of a slowing global economy, especially relating to China. If this all sounds familiar, it's because nearly the same thing happened in August 2015: The market plunged 11% due to broadly similar concerns.
We are pleased that the market's rebound throughout the second half of the quarter lifted the Fund to a 1% return for the quarter, and also that the market's earlier decline allowed us to establish positions in four companies at prices that were on average 23% lower than at the start of the year. Investors' occasional manifestations of fear—and greed—often provide us with unusually good opportunities to carry out our disciplined, value-based investment strategy. Typically, that means that we venture toward whatever is out of favor and away from what is in favor. So while the world was fretting about a potential U.S. recession earlier this year, we added four economically sensitive businesses to the portfolio: Citigroup, Comerica, State Street and Jones Lang LaSalle.
It is fair to wonder how economically sensitive businesses fit into a conservative balanced fund. We believe two factors can transform volatile businesses into conservative investments. The first is price. If purchased at a low enough price in relation to estimated value, a cyclical business—like any other—can offer a margin of safety large enough to cushion the investment from many unforeseen negative developments. The second is time. While in the short term the economy—and therefore the earnings of economically sensitive businesses—might be unpredictable, over the long term growth can be more predictable (and so too are the earnings of economically sensitive businesses). The combination of buying at a sufficient discount to value and having a long time horizon—key elements of our overall investment strategy—makes us comfortable investing in businesses that may have volatile year-to-year results.
The fixed income market also presented us with compelling opportunities this quarter. A broad flight to safety caused corporate credit spreads to briefly widen to levels not seen since the financial crisis, which gave us the opportunity to increase our corporate bond portfolio by over 20% during the quarter. We will continue to look for attractive opportunities to increase our fixed income portfolio, but will proceed cautiously as corporate
credit spreads need to be wide enough to compensate us for the rise in treasury yields we expect over time.
Though it may be de rigueur for investment managers to proffer macroeconomic prognostications, we neither claim to know, nor do we make an effort to know, how the economy will perform this year or next. But we have great confidence that over the long run, the economy will continue to grow and thus serve as a tailwind to the companies in the Fund. As Warren Buffett said, since 1776 it has never paid to bet against the U.S. And that generally applies to the global economy as well. Inevitably, however, there will be periods when growth slows and even reverses. Such times aren't pleasant, but they don't change our confidence in the ultimate direction of the economy. Seven years ago, this long-term perspective enabled us to confidently execute our investment strategy during the worst economic crisis of our lifetimes, and it continues to serve us well today.
Quarter Review
The Equity and Income Fund returned 1% in the quarter, which was in line with the Lipper Balanced Fund Index9, the Fund's performance benchmark. For the trailing year, the Fund had a loss of 5% versus a loss of 1% for the Lipper Index. Since the Fund's inception in 1995, the annualized compound rate of return is 10%, compared to the Lipper Index return of 7% over the same time period.
Oracle, Philip Morris International, Glencore, Kate Spade and CVS Health led the list of contributors for the quarter. The largest detractors were Bank of America, General Motors, Borg Warner, Goldman Sachs and TD Ameritrade. Financials in general had a difficult quarter, but we remain confident that these stocks are undervalued.
Transaction Activity
As mentioned above, we added four companies to the portfolio. While three of these businesses are banks, each faces different market concerns: emerging market exposure for Citigroup, energy lending for Comerica, and interest rate and market sensitivity for State Street. The fourth addition, commercial real estate services provider Jones Lang LaSalle, is outside of the banking industry, but is also economically sensitive. A summary of each addition is provided below:
Citigroup: We believe that universal banks are significantly undervalued relative to their normalized earnings power. Citigroup's global franchise gives it a unique advantage as the company has more than twice as many country banking licenses and direct local payment network connections as its closest
Oakmark.com 13
Oakmark Equity and Income Fund March 31, 2016
Portfolio Manager Commentary (continued)
competitor. This unique global reach is an attractive asset that is virtually impossible to replicate in today's regulatory environment, and we believe it makes Citigroup one of the only viable choices for multinational corporations looking for a consolidated banking relationship. We calculate that Citi has meaningful excess capital, which—combined with its significant deferred tax assets—should give its management team various options to increase shareholder value.
Comerica: Comerica is a well-capitalized, middle-market regional bank focused primarily on commercial lending activities. The bank's most distinguishing characteristics are its especially asset-sensitive balance sheet and its low cost deposit base, which we believe will give it pronounced earnings leverage should interest rates eventually rise as we expect. Comerica's exposure to Texas—and by extension, the energy market—has weighed heavily on the company's share price. We have confidence that any credit losses here will be manageable given that only a small portion of the company's overall loan portfolio consists of energy exposure. Plus, the management team has a strong underwriting track record. Trading at a meaningful discount to tangible book value, peer valuations and our assessment of private market value, we believe Comerica is an attractive investment opportunity.
State Street: State Street is one of the world's largest trust banks and asset managers. As a trust bank, the company provides critical back office services to owners of financial assets for which it receives fees. In the process of providing these services, State Street also holds client deposits, which it invests. The resulting spread income significantly drives State Street's earnings. We believe State Street will continue to grow with global financial assets and along the way is returning the vast majority of its earnings to shareholders in the form of dividends and share buybacks. We believe State Street's current valuation is too low for this high-return, growing business.
Jones Lang LaSalle: Jones Lang LaSalle is one of the world's largest commercial real estate services providers. Its scale, along with its product breadth, allows the company to provide differentiated services to large corporate customers, which are increasingly outsourcing real estate management needs. Smaller competitors have difficulty matching this value proposition, giving Jones Lang LaSalle increased market share in what remains a fragmented industry. While commercial real estate markets are inevitably cyclical, an increasing percentage of its revenue comes from recurring sources, and this should dampen the impact of cyclical market swings. We believe we are buying this high-quality, quickly growing franchise at a discount.
The Fund exited eight positions in the quarter. Broadridge and Bruker were both long-tenured holdings with results that validated our investment cases. We thank the management teams of both companies for their contribution to the Fund's success. Another company we exited that contributed to Fund returns was Precision Castparts, which was acquired by Berkshire Hathaway. As mentioned in the past, we seek to minimize taxable events by swapping holdings from loss positions into other holdings that offer similar exposures. This is the approach we took in selling Oceaneering, Rowan, Southern Copper and T. Rowe Price. The final elimination was Knowles, which was a small position received as a spin off from Dover and did not play out as we expected.
As always, we thank our shareholders for entrusting their assets to the Fund and welcome your questions and comments.
14 OAKMARK FUNDS
Oakmark Equity and Income Fund March 31, 2016 (Unaudited)
Schedule of Investments (in thousands)
| | | Shares | | Value | |
COMMON STOCKS - 63.4% | |
FINANCIALS - 18.3% | |
BANKS - 7.2% | |
Bank of America Corp.
Diversified Banks | | | 47,925 | | | $ | 647,939 | | |
U.S. Bancorp
Diversified Banks | | | 5,269 | | | | 213,889 | | |
Wells Fargo & Co.
Diversified Banks | | | 3,705 | | | | 179,183 | | |
Comerica, Inc.
Diversified Banks | | | 2,460 | | | | 93,160 | | |
Citigroup, Inc.
Diversified Banks | | | 2,016 | | | | 84,185 | | |
| | | | | | 1,218,356 | | |
DIVERSIFIED FINANCIALS - 5.7% | |
TD Ameritrade Holding Corp.
Investment Banking & Brokerage | | | 9,880 | | | | 311,519 | | |
The Goldman Sachs Group, Inc.
Investment Banking & Brokerage | | | 1,568 | | | | 246,176 | | |
Bank of New York Mellon Corp.
Asset Management & Custody Banks | | | 5,340 | | | | 196,689 | | |
Ally Financial, Inc. (a)
Consumer Finance | | | 6,540 | | | | 122,431 | | |
State Street Corp.
Asset Management & Custody Banks | | | 1,551 | | | | 90,776 | | |
| | | | | | 967,591 | | |
INSURANCE - 4.3% | |
FNF Group
Property & Casualty Insurance | | | 7,689 | | | | 260,667 | | |
Principal Financial Group, Inc.
Life & Health Insurance | | | 6,304 | | | | 248,685 | | |
Reinsurance Group of America, Inc.
Reinsurance | | | 2,402 | | | | 231,202 | | |
| | | | | | 740,554 | | |
REAL ESTATE - 1.1% | |
The Howard Hughes Corp. (a)
Real Estate Development | | | 732 | | | | 77,559 | | |
Jones Lang LaSalle, Inc.
Real Estate Services | | | 490 | | | | 57,489 | | |
Gaming and Leisure Properties, Inc.
Specialized REIT's | | | 1,833 | | | | 56,664 | | |
| | | | | | 191,712 | | |
| | | | | | 3,118,213 | | |
CONSUMER DISCRETIONARY - 11.2% | |
AUTOMOBILES & COMPONENTS - 6.8% | |
General Motors Co.
Automobile Manufacturers | | | 23,094 | | | | 725,856 | | |
BorgWarner, Inc.
Auto Parts & Equipment | | | 7,718 | | | | 296,383 | | |
Lear Corp.
Auto Parts & Equipment | | | 1,316 | | | | 146,348 | | |
| | | | | | 1,168,587 | | |
| | | Shares | | Value | |
RETAILING - 3.2% | |
Foot Locker, Inc.
Apparel Retail | | | 6,369 | | | $ | 410,801 | | |
HSN, Inc.
Catalog Retail | | | 2,491 | | | | 130,317 | | |
| | | | | | 541,118 | | |
CONSUMER DURABLES & APPAREL - 1.2% | |
Kate Spade & Co. (a)
Apparel, Accessories & Luxury Goods | | | 5,165 | | | | 131,818 | | |
Carter's, Inc.
Apparel, Accessories & Luxury Goods | | | 664 | | | | 70,004 | | |
| | | | | | 201,822 | | |
| | | | | | 1,911,527 | | |
CONSUMER STAPLES - 10.0% | |
FOOD, BEVERAGE & TOBACCO - 7.0% | |
Nestle SA (b)
Packaged Foods & Meats | | | 7,520 | | | | 561,090 | | |
Philip Morris International, Inc.
Tobacco | | | 3,678 | | | | 360,858 | | |
Diageo PLC (b)
Distillers & Vintners | | | 2,441 | | | | 263,359 | | |
| | | | | | 1,185,307 | | |
FOOD & STAPLES RETAILING - 3.0% | |
CVS Health Corp.
Drug Retail | | | 4,993 | | | | 517,877 | | |
| | | | | | 1,703,184 | | |
INDUSTRIALS - 10.0% | |
CAPITAL GOODS - 8.3% | |
Dover Corp.
Industrial Machinery | | | 6,366 | | | | 409,509 | | |
Flowserve Corp. (c)
Industrial Machinery | | | 5,765 | | | | 256,013 | | |
Rockwell Automation, Inc.
Electrical Components & Equipment | | | 2,145 | | | | 243,994 | | |
Parker-Hannifin Corp.
Industrial Machinery | | | 1,237 | | | | 137,461 | | |
Oshkosh Corp.
Construction Machinery & Heavy Trucks | | | 2,435 | | | | 99,502 | | |
Manitowoc Foodservice, Inc. (a)
Industrial Machinery | | | 6,243 | | | | 92,019 | | |
General Electric Co.
Industrial Conglomerates | | | 2,820 | | | | 89,645 | | |
WESCO International, Inc. (a)
Trading Companies & Distributors | | | 682 | | | | 37,263 | | |
The Manitowoc Co., Inc.
Construction Machinery & Heavy Trucks | | | 6,243 | | | | 27,032 | | |
Blount International, Inc. (a)
Industrial Machinery | | | 1,913 | | | | 19,096 | | |
| | | | | | 1,411,534 | | |
See accompanying Notes to Financial Statements.
Oakmark.com 15
Oakmark Equity and Income Fund March 31, 2016 (Unaudited)
Schedule of Investments (in thousands) (continued)
| | | Shares | | Value | |
COMMON STOCKS - 63.4% (continued) | |
INDUSTRIALS - 10.0% (continued) | |
TRANSPORTATION - 1.4% | |
Union Pacific Corp.
Railroads | | | 3,086 | | | $ | 245,507 | | |
COMMERCIAL & PROFESSIONAL SERVICES - 0.3% | |
Herman Miller, Inc.
Office Services & Supplies | | | 1,350 | | | | 41,698 | | |
| | | | | | 1,698,739 | | |
INFORMATION TECHNOLOGY - 8.9% | |
SOFTWARE & SERVICES - 6.1% | |
Oracle Corp.
Systems Software | | | 16,842 | | | | 689,006 | | |
MasterCard, Inc., Class A
Data Processing & Outsourced Services | | | 3,703 | | | | 349,894 | | |
| | | | | | 1,038,900 | | |
TECHNOLOGY HARDWARE & EQUIPMENT - 2.8% | |
TE Connectivity, Ltd.
Electronic Manufacturing Services | | | 7,641 | | | | 473,131 | | |
| | | | | | 1,512,031 | | |
ENERGY - 2.2% | |
Baker Hughes, Inc.
Oil & Gas Equipment & Services | | | 5,680 | | | | 248,963 | | |
National Oilwell Varco, Inc.
Oil & Gas Equipment & Services | | | 3,700 | | | | 115,057 | | |
| | | | | | 364,020 | | |
HEALTH CARE - 1.9% | |
HEALTH CARE EQUIPMENT & SERVICES - 1.9% | |
UnitedHealth Group, Inc.
Managed Health Care | | | 2,445 | | | | 315,165 | | |
MATERIALS - 0.9% | |
Glencore PLC
Diversified Metals & Mining | | | 69,767 | | | | 157,620 | | |
TOTAL COMMON STOCKS - 63.4%
(COST $7,611,816) | | | | | 10,780,499 | | |
| | | Par Value | | Value | |
FIXED INCOME - 20.2% | |
CORPORATE BONDS - 11.0% | |
Kinetic Concepts, Inc.,
10.50%, due 11/01/18 | | $ | 47,940 | | | | 48,060 | | |
JPMorgan Chase & Co.,
3.15%, due 07/05/16 | | | 44,592 | | | | 44,873 | | |
General Motors Co.,
4.875%, due 10/02/23 | | | 41,400 | | | | 43,383 | | |
Omega Healthcare Investors, Inc.,
5.875%, due 03/15/24 | | | 39,292 | | | | 40,689 | | |
Express Scripts Holding Co.,
2.65%, due 02/15/17 | | | 39,310 | | | | 39,823 | | |
| | | Par Value | | Value | |
Zimmer Biomet Holdings, Inc.,
1.45%, due 04/01/17 | | $ | 37,671 | | | $ | 37,658 | | |
The William Carter Co.,
5.25%, due 08/15/21 | | | 35,137 | | | | 36,103 | | |
CVS Health Corp.,
4.00%, due 12/05/23 | | | 29,325 | | | | 32,327 | | |
Omnicom Group, Inc.,
3.625%, due 05/01/22 | | | 30,425 | | | | 31,938 | | |
1011778 BC ULC / New Red
Finance, Inc., 144A,
6.00%, due 04/01/22 (d) | | | 29,500 | | | | 30,680 | | |
Bank of America Corp.,
5.625%, due 10/14/16 | | | 29,855 | | | | 30,567 | | |
Live Nation Entertainment, Inc., 144A,
7.00%, due 09/01/20 (d) | | | 28,930 | | | | 30,304 | | |
General Motors Co.,
3.50%, due 10/02/18 | | | 29,525 | | | | 30,223 | | |
Toyota Motor Credit Corp.,
1.45%, due 01/12/18 | | | 29,495 | | | | 29,645 | | |
Credit Suisse Group AG, 144A,
7.50% (d) (e) (f) | | | 30,000 | | | | 29,505 | | |
Expedia, Inc., 144A,
5.00%, due 02/15/26 (d) | | | 28,360 | | | | 28,403 | | |
Activision Blizzard, Inc., 144A,
5.625%, due 09/15/21 (d) | | | 26,745 | | | | 28,116 | | |
Anadarko Petroleum Corp.,
5.95%, due 09/15/16 | | | 25,736 | | | | 26,183 | | |
CBRE Services, Inc.,
5.00%, due 03/15/23 | | | 25,239 | | | | 25,812 | | |
E*TRADE Financial Corp.,
5.375%, due 11/15/22 | | | 24,308 | | | | 25,675 | | |
Boston Scientific Corp.,
5.125%, due 01/12/17 | | | 24,913 | | | | 25,613 | | |
Credit Suisse Group Funding
Guernsey, Ltd., 144A,
3.125%, due 12/10/20 (d) | | | 25,000 | | | | 24,862 | | |
Credit Suisse New York,
1.75%, due 01/29/18 | | | 24,700 | | | | 24,744 | | |
Weyerhaeuser Co. REIT,
6.95%, due 08/01/17 | | | 22,722 | | | | 24,120 | | |
Penn National Gaming, Inc.,
5.875%, due 11/01/21 | | | 23,704 | | | | 23,585 | | |
Anthem, Inc.,
5.875%, due 06/15/17 | | | 22,388 | | | | 23,546 | | |
Anthem, Inc.,
2.375%, due 02/15/17 | | | 22,690 | | | | 22,872 | | |
Whirlpool Corp.,
7.75%, due 07/15/16 | | | 22,256 | | | | 22,652 | | |
Pentair Finance SA,
2.90%, due 09/15/18 | | | 21,630 | | | | 21,692 | | |
Thermo Fisher Scientific, Inc.,
2.25%, due 08/15/16 | | | 21,438 | | | | 21,555 | | |
Delphi Corp.,
5.00%, due 02/15/23 | | | 20,277 | | | | 21,342 | | |
Bank of America Corp.,
3.75%, due 07/12/16 | | | 20,295 | | | | 20,443 | | |
Centene Corp.,
4.75%, due 05/15/22 | | | 20,084 | | | | 20,285 | | |
Electronic Arts, Inc.,
4.80%, due 03/01/26 | | | 19,655 | | | | 20,208 | | |
See accompanying Notes to Financial Statements.
16 OAKMARK FUNDS
Oakmark Equity and Income Fund March 31, 2016 (Unaudited)
Schedule of Investments (in thousands) (continued)
| | | Par Value | | Value | |
FIXED INCOME - 20.2% (continued) | |
CORPORATE BONDS - 11.0% (continued) | |
American International Group, Inc.,
3.30%, due 03/01/21 | | $ | 19,650 | | | $ | 20,090 | | |
CBRE Services, Inc.,
4.875%, due 03/01/26 | | | 19,665 | | | | 19,795 | | |
JPMorgan Chase Bank NA,
1.032%, due 06/14/17 (e) | | | 19,750 | | | | 19,753 | | |
JPMorgan Chase & Co.,
1.70%, due 03/01/18 | | | 19,665 | | | | 19,743 | | |
Lam Research Corp.,
2.75%, due 03/15/20 | | | 19,660 | | | | 19,326 | | |
AT&T, Inc.,
5.00%, due 03/01/21 | | | 16,710 | | | | 18,632 | | |
McGraw Hill Financial, Inc.,
4.00%, due 06/15/25 | | | 17,150 | | | | 17,869 | | |
Dollar General Corp.,
4.125%, due 07/15/17 | | | 17,095 | | | | 17,647 | | |
Aon Corp.,
5.00%, due 09/30/20 | | | 14,745 | | | | 16,309 | | |
Scientific Games International, Inc.,
10.00%, due 12/01/22 | | | 19,665 | | | | 15,929 | | |
Ventas Realty LP / Ventas Capital Corp. REIT,
2.00%, due 02/15/18 | | | 15,876 | | | | 15,896 | | |
CBRE Services, Inc.,
5.25%, due 03/15/25 | | | 14,975 | | | | 15,440 | | |
Electronic Arts, Inc.,
3.70%, due 03/01/21 | | | 14,740 | | | | 15,323 | | |
International Game Technology PLC, 144A,
6.25%, due 02/15/22 (d) | | | 14,800 | | | | 15,056 | | |
Schlumberger Holdings Corp., 144A,
2.35%, due 12/21/18 (d) | | | 14,740 | | | | 14,837 | | |
Mead Johnson Nutrition Co.,
4.125%, due 11/15/25 | | | 13,955 | | | | 14,817 | | |
Zayo Group LLC / Zayo Capital, Inc.,
6.00%, due 04/01/23 | | | 14,745 | | | | 14,717 | | |
International Game Technology PLC, 144A,
6.50%, due 02/15/25 (d) | | | 14,800 | | | | 14,652 | | |
Activision Blizzard, Inc., 144A,
6.125%, due 09/15/23 (d) | | | 13,615 | | | | 14,602 | | |
Medtronic, Inc.,
3.15%, due 03/15/22 | | | 13,228 | | | | 14,030 | | |
Royal Caribbean Cruises, Ltd.,
7.25%, due 06/15/16 | | | 13,777 | | | | 13,912 | | |
Valeant Pharmaceuticals
International, Inc., 144A,
5.625%, due 12/01/21 (d) | | | 16,370 | | | | 12,891 | | |
Kinetic Concepts, Inc.,
12.50%, due 11/01/19 | | | 14,360 | | | | 12,502 | | |
GLP Capital, LP / GLP Financing II, Inc.,
5.375%, due 11/01/23 | | | 12,000 | | | | 12,000 | | |
BorgWarner, Inc.,
4.625%, due 09/15/20 | | | 10,810 | | | | 11,718 | | |
GLP Capital, LP / GLP Financing II, Inc.,
4.875%, due 11/01/20 | | | 10,000 | | | | 10,400 | | |
Six Flags Entertainment Corp., 144A,
5.25%, due 01/15/21 (d) | | | 9,970 | | | | 10,244 | | |
Tyco Electronics Group SA,
3.70%, due 02/15/26 | | | 9,830 | | | | 10,172 | | |
International Game Technology PLC, 144A,
5.625%, due 02/15/20 (d) | | | 9,800 | | | | 10,168 | | |
| | | Par Value | | Value | |
Schlumberger Holdings Corp., 144A,
4.00%, due 12/21/25 (d) | | $ | 9,830 | | | $ | 10,149 | | |
Omega Healthcare Investors, Inc. REIT,
5.25%, due 01/15/26 | | | 9,835 | | | | 10,029 | | |
CNO Financial Group, Inc.,
4.50%, due 05/30/20 | | | 9,830 | | | | 10,027 | | |
Kraft Heinz Foods Co., 144A,
2.00%, due 07/02/18 (d) | | | 9,830 | | | | 9,921 | | |
Kellogg Co.,
4.45%, due 05/30/16 | | | 9,835 | | | | 9,892 | | |
Chevron Corp.,
1.365%, due 03/02/18 | | | 9,835 | | | | 9,870 | | |
Howard Hughes Corp., 144A,
6.875%, due 10/01/21 (d) | | | 10,000 | | | | 9,850 | | |
National Oilwell Varco, Inc.,
1.35%, due 12/01/17 | | | 9,844 | | | | 9,629 | | |
Ally Financial, Inc.,
5.50%, due 02/15/17 | | | 9,365 | | | | 9,537 | | |
Sirius XM Radio, Inc., 144A,
5.25%, due 08/15/22 (d) | | | 8,895 | | | | 9,362 | | |
Tempur Sealy International, Inc.,
6.875%, due 12/15/20 | | | 8,819 | | | | 9,304 | | |
USG Corp.,
6.30%, due 11/15/16 | | | 8,871 | | | | 9,093 | | |
Health Net, Inc.,
6.375%, due 06/01/17 | | | 8,680 | | | | 9,081 | | |
Glencore Funding LLC, 144A,
1.70%, due 05/27/16 (d) | | | 8,060 | | | | 8,032 | | |
CVS Health Corp., 144A,
5.00%, due 12/01/24 (d) | | | 6,880 | | | | 7,887 | | |
E*TRADE Financial Corp.,
4.625%, due 09/15/23 | | | 7,865 | | | | 7,845 | | |
CVS Health Corp., 144A,
4.75%, due 12/01/22 (d) | | | 6,880 | | | | 7,720 | | |
Actavis Funding SCS,
1.30%, due 06/15/17 | | | 7,727 | | | | 7,700 | | |
L-3 Communications Corp.,
1.50%, due 05/28/17 | | | 7,274 | | | | 7,249 | | |
Mead Johnson Nutrition Co.,
3.00%, due 11/15/20 | | | 6,885 | | | | 7,075 | | |
Scientific Games International, Inc., 144A,
7.00%, due 01/01/22 (d) | | | 6,885 | | | | 7,023 | | |
Level 3 Financing, Inc.,
5.375%, due 05/01/25 | | | 6,895 | | | | 6,981 | | |
Stanley Black & Decker, Inc.,
2.451%, due 11/17/18 | | | 6,875 | | | | 6,981 | | |
Level 3 Financing, Inc.,
5.125%, due 05/01/23 | | | 6,895 | | | | 6,973 | | |
Kraft Heinz Foods Co., 144A,
4.875%, due 02/15/25 (d) | | | 6,260 | | | | 6,896 | | |
Omnicom Group, Inc.,
5.90%, due 04/15/16 | | | 6,862 | | | | 6,871 | | |
Concho Resources, Inc.,
5.50%, due 10/01/22 | | | 6,980 | | | | 6,858 | | |
Whirlpool Corp.,
6.50%, due 06/15/16 | | | 6,610 | | | | 6,673 | | |
Credit Suisse Group AG, 144A,
6.25% (d) (e) (f) | | | 7,000 | | | | 6,428 | | |
Zayo Group LLC / Zayo Capital, Inc.,
10.125%, due 07/01/20 | | | 5,995 | | | | 6,415 | | |
See accompanying Notes to Financial Statements.
Oakmark.com 17
Oakmark Equity and Income Fund March 31, 2016 (Unaudited)
Schedule of Investments (in thousands) (continued)
| | | Par Value | | Value | |
FIXED INCOME - 20.2% (continued) | |
CORPORATE BONDS - 11.0% (continued) | |
CNO Financial Group, Inc.,
5.25%, due 05/30/25 | | $ | 5,895 | | | $ | 6,028 | | |
Yum! Brands, Inc.,
3.875%, due 11/01/23 | | | 6,329 | | | | 5,854 | | |
Glencore Finance Canada, Ltd., 144A,
3.60%, due 01/15/17 (d) | | | 5,590 | | | | 5,595 | | |
Quest Diagnostics, Inc.,
4.70%, due 04/01/21 | | | 5,128 | | | | 5,570 | | |
Ally Financial, Inc.,
2.75%, due 01/30/17 | | | 5,500 | | | | 5,473 | | |
The Sun Products Corp., 144A,
7.75%, due 03/15/21 (d) | | | 5,895 | | | | 5,423 | | |
Manitowoc Foodservice, Inc., 144A,
9.50%, due 02/15/24 (d) | | | 4,915 | | | | 5,357 | | |
Serta Simmons Bedding LLC, 144A,
8.125%, due 10/01/20 (d) | | | 4,990 | | | | 5,177 | | |
Bank of America Corp.,
4.45%, due 03/03/26 | | | 5,000 | | | | 5,151 | | |
GLP Capital, LP / GLP Financing II, Inc.,
4.375%, due 11/01/18 | | | 5,000 | | | | 5,138 | | |
ConocoPhillips Co.,
4.20%, due 03/15/21 | | | 4,915 | | | | 5,133 | | |
Foot Locker, Inc.,
8.50%, due 01/15/22 | | | 4,340 | | | | 5,121 | | |
Oceaneering International, Inc.,
4.65%, due 11/15/24 | | | 5,895 | | | | 5,077 | | |
Express Scripts Holding Co.,
3.30%, due 02/25/21 | | | 4,915 | | | | 5,038 | | |
Omnicom Group, Inc.,
3.60%, due 04/15/26 | | | 4,915 | | | | 5,035 | | |
Bank of America Corp.,
3.875%, due 03/22/17 | | | 4,915 | | | | 5,029 | | |
Capital One NA,
2.35%, due 08/17/18 | | | 5,000 | | | | 5,026 | | |
Berkshire Hathaway, Inc.,
2.75%, due 03/15/23 | | | 4,915 | | | | 5,013 | | |
The Goldman Sachs Group, Inc.,
1.288%, due 05/22/17 (e) | | | 5,000 | | | | 4,996 | | |
Penske Truck Leasing Co., LP/PTL
Finance Corp., 144A,
3.75%, due 05/11/17 (d) | | | 4,920 | | | | 4,996 | | |
General Motors Financial Co., Inc.,
3.10%, due 01/15/19 | | | 4,915 | | | | 4,974 | | |
American Express Credit Corp.,
1.875%, due 11/05/18 | | | 4,915 | | | | 4,945 | | |
Schlumberger Holdings Corp., 144A,
1.90%, due 12/21/17 (d) | | | 4,915 | | | | 4,903 | | |
MSCI, Inc., 144A,
5.25%, due 11/15/24 (d) | | | 4,645 | | | | 4,796 | | |
Scripps Networks Interactive, Inc.,
2.80%, due 06/15/20 | | | 3,930 | | | | 3,937 | | |
Zimmer Biomet Holdings, Inc.,
3.15%, due 04/01/22 | | | 3,810 | | | | 3,867 | | |
Omnicom Group, Inc.,
6.25%, due 07/15/19 | | | 2,950 | | | | 3,341 | | |
Dollar Tree, Inc., 144A,
5.75%, due 03/01/23 (d) | | | 2,950 | | | | 3,127 | | |
MSCI, Inc., 144A,
5.75%, due 08/15/25 (d) | | | 2,950 | | | | 3,105 | | |
| | | Par Value | | Value | |
The Manitowoc Co., Inc., 144A,
12.75%, due 08/15/21 (d) | | $ | 2,950 | | | $ | 3,024 | | |
American Express Credit Corp.,
2.60%, due 09/14/20 | | | 2,945 | | | | 3,016 | | |
eBay, Inc.,
2.50%, due 03/09/18 | | | 2,945 | | | | 2,993 | | |
Medtronic, Inc.,
1.50%, due 03/15/18 | | | 2,950 | | | | 2,975 | | |
CVS Health Corp.,
2.25%, due 08/12/19 | | | 2,884 | | | | 2,956 | | |
Ultra Petroleum Corp., 144A,
5.75%, due 12/15/18 (d) | | | 37,809 | | | | 2,647 | | |
Universal Health Services, Inc., 144A,
4.75%, due 08/01/22 (d) | | | 2,530 | | | | 2,574 | | |
Fidelity National Financial, Inc.,
6.60%, due 05/15/17 | | | 2,455 | | | | 2,567 | | |
The Goldman Sachs Group, Inc.,
5.625%, due 01/15/17 | | | 2,095 | | | | 2,161 | | |
McGraw Hill Financial, Inc.,
4.40%, due 02/15/26 | | | 1,970 | | | | 2,153 | | |
McGraw Hill Financial, Inc.,
3.30%, due 08/14/20 | | | 1,970 | | | | 2,038 | | |
Apple, Inc.,
2.85%, due 02/23/23 | | | 1,965 | | | | 2,037 | | |
Live Nation Entertainment, Inc., 144A,
5.375%, due 06/15/22 (d) | | | 2,000 | | | | 2,035 | | |
McGraw Hill Financial, Inc.,
2.50%, due 08/15/18 | | | 1,970 | | | | 1,996 | | |
Ecolab, Inc.,
3.00%, due 12/08/16 | | | 1,970 | | | | 1,994 | | |
Zimmer Biomet Holdings, Inc.,
2.00%, due 04/01/18 | | | 1,815 | | | | 1,819 | | |
Glencore Canada Corp.,
5.50%, due 06/15/17 | | | 1,720 | | | | 1,737 | | |
Valeant Pharmaceuticals
International, Inc., 144A,
6.75%, due 08/15/21 (d) | | | 1,960 | | | | 1,597 | | |
Tyco Electronics Group SA,
6.55%, due 10/01/17 | | | 1,385 | | | | 1,480 | | |
Ultra Petroleum Corp., 144A,
6.125%, due 10/01/24 (d) | | | 19,665 | | | | 1,475 | | |
Cameron International Corp.,
6.375%, due 07/15/18 | | | 980 | | | | 1,082 | | |
Post Holdings, Inc.,
7.375%, due 02/15/22 | | | 1,000 | | | | 1,058 | | |
Post Holdings, Inc., 144A,
6.75%, due 12/01/21 (d) | | | 1,000 | | | | 1,054 | | |
Dollar Tree, Inc., 144A,
5.25%, due 03/01/20 (d) | | | 1,000 | | | | 1,046 | | |
The Goldman Sachs Group, Inc.,
2.875%, due 02/25/21 | | | 1,000 | | | | 1,018 | | |
Level 3 Financing, Inc., 144A,
5.375%, due 01/15/24 (d) | | | 1,000 | | | | 1,013 | | |
HCA, Inc.,
3.75%, due 03/15/19 | | | 980 | | | | 1,004 | | |
The Goldman Sachs Group, Inc.,
2.55%, due 10/23/19 | | | 980 | | | | 995 | | |
Ventas Realty, LP REIT,
3.50%, due 02/01/25 | | | 1,000 | | | | 983 | | |
Tribune Media Co., 144A,
5.875%, due 07/15/22 (d) | | | 1,000 | | | | 977 | | |
See accompanying Notes to Financial Statements.
18 OAKMARK FUNDS
Oakmark Equity and Income Fund March 31, 2016 (Unaudited)
Schedule of Investments (in thousands) (continued)
| | | Par Value | | Value | |
FIXED INCOME - 20.2% (continued) | |
CORPORATE BONDS - 11.0% (continued) | |
Post Holdings, Inc., 144A,
7.75%, due 03/15/24 (d) | | $ | 500 | | | $ | 549 | | |
Valeant Pharmaceuticals
International, Inc., 144A,
5.875%, due 05/15/23 (d) | | | 500 | | | | 392 | | |
Valeant Pharmaceuticals
International, Inc., 144A,
6.125%, due 04/15/25 (d) | | | 250 | | | | 193 | | |
Total Corporate Bonds
(Cost $1,910,118) | | | | | 1,872,170 | | |
GOVERNMENT AND AGENCY SECURITIES - 9.1% | |
U.S. GOVERNMENT NOTES - 8.9% | |
1.25%, due 07/15/20, Inflation Indexed | | | 456,030 | | | | 490,220 | | |
1.375%, due 07/15/18, Inflation Indexed | | | 412,523 | | | | 435,227 | | |
2.125%, due 01/15/19, Inflation Indexed | | | 220,000 | | | | 237,500 | | |
1.00%, due 09/30/16 | | | 199,380 | | | | 199,941 | | |
1.25%, due 11/30/18 | | | 73,725 | | | | 74,546 | | |
2.125%, due 01/31/21 | | | 24,570 | | | | 25,620 | | |
1.75%, due 10/31/20 | | | 24,570 | | | | 25,174 | | |
0.75%, due 06/30/17 | | | 24,585 | | | | 24,608 | | |
| | | | | | 1,512,836 | | |
U.S. GOVERNMENT AGENCIES - 0.2% | |
Federal National Mortgage Association,
1.25%, due 09/27/18 | | | 24,680 | | | | 24,887 | | |
Federal National Mortgage Association,
1.25%, due 01/30/20 | | | 9,525 | | | | 9,520 | | |
| | | | | | 34,407 | | |
Total Government and Agency Securities
(Cost $1,478,398) | | | | | 1,547,243 | | |
ASSET BACKED SECURITIES - 0.1% | |
Cabela's Master Credit Card Trust, 144A,
0.986%, due 10/15/19 (d) (e)
(Cost $11,450) | | | 11,450 | | | | 11,452 | | |
TOTAL FIXED INCOME - 20.2%
(COST $3,399,966) | | | | | 3,430,865 | | |
SHORT TERM INVESTMENTS - 16.2% | |
COMMERCIAL PAPER - 10.3% | |
MetLife Short Term Funding LLC, 144A,
0.40% - 0.49%,
due 04/01/16 - 05/03/16 (d) (g) | | | 500,000 | | | | 499,906 | | |
Chevron Corp., 144A,
0.38% - 0.41%,
due 04/04/16 - 06/01/16 (d) (g) | | | 300,000 | | | | 299,923 | | |
BMW US Capital LLC, 144A,
0.37% - 0.41%,
due 04/04/16 - 04/27/16 (d) (g) | | | 240,100 | | | | 240,065 | | |
Anthem, Inc., 144A,
0.75% - 0.85%,
due 04/04/16 - 05/09/16 (d) (g) | | | 162,000 | | | | 161,929 | | |
Toyota Motor Credit Corp.,
0.34% - 0.42%,
due 04/21/16 - 04/28/16 (g) | | | 150,000 | | | | 149,964 | | |
| | | Par Value | | Value | |
Schlumberger Holdings Corp., 144A,
0.81% - 0.86%,
due 04/05/16 - 05/16/16 (d) (g) | | $ | 150,000 | | | $ | 149,944 | | |
J.P. Morgan Securities LLC, 144A,
0.51% - 0.53%,
due 05/02/16 - 05/04/16 (d) (g) | | | 100,000 | | | | 99,954 | | |
Kellogg Co., 144A,
0.64%,
due 04/11/16 - 04/12/16 (d) (g) | | | 75,000 | | | | 74,986 | | |
John Deere Capital Co., 144A,
0.39%, due 04/13/16 (d) (g) | | | 50,000 | | | | 49,994 | | |
American Honda Finance Corp.,
0.37%, due 04/22/16 (g) | | | 25,000 | | | | 24,995 | | |
Total Commercial Paper
(Cost $1,751,661) | | | | | 1,751,660 | | |
CORPORATE BONDS - 2.3% | |
Bank of America Corp.,
6.50%, due 08/01/16 | | | 46,006 | | | | 46,825 | | |
Capital One Financial Corp.,
6.15%, due 09/01/16 | | | 39,398 | | | | 40,198 | | |
Aon Corp.,
3.125%, due 05/27/16 | | | 36,975 | | | | 37,098 | | |
Citigroup, Inc.,
1.30%, due 04/01/16 | | | 35,713 | | | | 35,713 | | |
HCP, Inc. REIT,
6.30%, due 09/15/16 | | | 29,485 | | | | 30,085 | | |
Yum! Brands, Inc.,
6.25%, due 04/15/16 | | | 29,125 | | | | 29,180 | | |
Universal Health Services, Inc.,
7.125%, due 06/30/16 | | | 27,444 | | | | 27,772 | | |
Macy's Retail Holdings, Inc.,
5.90%, due 12/01/16 | | | 26,108 | | | | 26,906 | | |
Cabot Corp.,
5.00%, due 10/01/16 | | | 18,930 | | | | 19,232 | | |
ConocoPhillips Canada Funding Co. I,
5.625%, due 10/15/16 | | | 13,365 | | | | 13,676 | | |
L-3 Communications Corp.,
3.95%, due 11/15/16 | | | 13,000 | | | | 13,169 | | |
Comerica Bank,
5.75%, due 11/21/16 | | | 12,750 | | | | 13,084 | | |
Avnet, Inc.,
6.625%, due 09/15/16 | | | 11,936 | | | | 12,210 | | |
Thermo Fisher Scientific, Inc.,
1.30%, due 02/01/17 | | | 11,511 | | | | 11,503 | | |
Bank of America Corp.,
6.05%, due 05/16/16 | | | 7,890 | | | | 7,936 | | |
Wm Wrigley Jr Co., 144A,
1.40%, due 10/21/16 (d) | | | 6,885 | | | | 6,899 | | |
Cameron International Corp.,
1.15%, due 12/15/16 | | | 6,875 | | | | 6,872 | | |
Schlumberger Investment SA, 144A,
1.95%, due 09/14/16 (d) | | | 4,425 | | | | 4,437 | | |
Capital One Financial Corp.,
3.15%, due 07/15/16 | | | 3,513 | | | | 3,533 | | |
The Bank of New York Mellon Corp.,
2.30%, due 07/28/16 | | | 2,945 | | | | 2,960 | | |
Philip Morris International, Inc.,
2.50%, due 05/16/16 | | | 1,350 | | | | 1,353 | | |
Total Corporate Bonds
(Cost $390,531) | | | | | 390,641 | | |
See accompanying Notes to Financial Statements.
Oakmark.com 19
Oakmark Equity and Income Fund March 31, 2016 (Unaudited)
Schedule of Investments (in thousands) (continued)
| | | Par Value | | Value | |
SHORT TERM INVESTMENTS - 16.2% (continued) | |
REPURCHASE AGREEMENT - 2.0% | |
Fixed Income Clearing Corp. Repurchase
Agreement, 0.10% dated 03/31/16 due
04/01/16, repurchase price $354,624,
collateralized by a United States Treasury
Note, 2.750%, due 02/15/24, value plus
accrued interest of $361,718
(Cost: $354,623) | | $ | 354,623 | | | $ | 354,623 | | |
U.S. GOVERNMENT BILLS - 1.6% | |
United States Treasury Bills,
0.22% - 0.30%,
due 04/14/16 - 06/09/16 (g)
(Cost $272,345) | | | 272,430 | | | | 272,372 | | |
TOTAL SHORT TERM INVESTMENTS - 16.2%
(COST $2,769,160) | | | | | 2,769,296 | | |
TOTAL INVESTMENTS - 99.8%
(COST $13,780,942) | | | | | 16,980,660 | | |
Foreign Currencies (Cost $0) - 0.0% (h) | | | | | 0 | (i) | |
Other Assets In Excess of Liabilities - 0.2% | | | | | 26,690 | | |
NET ASSETS - 100.0% | | | | $ | 17,007,350 | | |
(a) Non-income producing security
(b) Sponsored American Depositary Receipt
(c) See Note 5 in the Notes to Financial Statements regarding investments in affiliated issuers.
(d) See Note 1 in the Notes to Financial Statements regarding restricted securities. These securities may be resold subject to restrictions on resale under federal securities law.
(e) Floating Rate Note. Rate shown is as of March 31, 2016.
(f) Security is perpetual and has no stated maturity date.
(g) The rate shown represents the annualized yield at the time of purchase; not a coupon rate.
(h) Amount rounds to less than 0.1%.
(i) Amount rounds to less than $1,000.
Abbreviations:
REIT: Real Estate Investment Trust
See accompanying Notes to Financial Statements.
20 OAKMARK FUNDS

This page intentionally left blank.
Oakmark.com 21
Oakmark Global Fund March 31, 2016
Summary Information
VALUE OF A $10,000 INVESTMENT
Since Inception - 08/04/99 (Unaudited)

PERFORMANCE
| | | | | Average Annual Total Returns (as of 03/31/16) | | | |
(Unaudited) | | Total Return
Last 3 Months | | 1-year | | 3-year | | 5-year | | 10-year | | Since
Inception | | Inception
Date | |
Oakmark Global Fund (Class I) | | | -7.27 | % | | | -13.17 | % | | | 4.38 | % | | | 5.04 | % | | | 4.95 | % | | | 9.59 | % | | 08/04/99 | |
MSCI World Index | | | -0.35 | % | | | -3.45 | % | | | 6.82 | % | | | 6.51 | % | | | 4.27 | % | | | 3.69 | % | | | |
Lipper Global Funds Index12 | | | -1.01 | % | | | -5.05 | % | | | 6.05 | % | | | 4.92 | % | | | 3.98 | % | | | 4.44 | % | | | |
Oakmark Global Fund (Class II) | | | -7.34 | % | | | -13.51 | % | | | 4.00 | % | | | 4.66 | % | | | 4.57 | % | | | 9.65 | % | | 10/10/01 | |
The graph and table do not reflect the deduction of taxes that a shareholder would pay on Fund distributions or the redemption of Fund shares.
Past performance is no guarantee of future results. The performance data quoted represents past performance. Current performance may be lower or higher than the performance data quoted. Total return includes change in share prices and, in each case, includes reinvestment of dividends and capital gain distributions. The investment return and principal value vary so that an investor's shares when redeemed may be worth more or less than the original cost. To obtain the most recent month-end performance, please visit Oakmark.com.
TOP TEN EQUITY HOLDINGS7 | | % of Net Assets | |
Credit Suisse Group | | | 5.0 | | |
TE Connectivity, Ltd. | | | 4.4 | | |
General Motors Co. | | | 4.3 | | |
Julius Baer Group, Ltd. | | | 4.1 | | |
| CNH Industrial NV | | | 4.0 | | |
Alphabet Inc., Class C | | | 4.0 | | |
BNP Paribas SA | | | 3.9 | | |
LafargeHolcim, Ltd. | | | 3.8 | | |
Daimler AG | | | 3.7 | | |
Bank of America Corp. | | | 3.6 | | |
FUND STATISTICS | |
Ticker | | OAKGX | |
Inception | | 08/04/99 | |
Number of Equity Holdings | | 37 | |
Net Assets | | $2.7 billion | |
Benchmark | | MSCI World Index | |
Weighted Average Market Cap | | $72.5 billion | |
Median Market Cap | | $26.6 billion | |
Portfolio Turnover (for the 6-months ended 03/31/16) | | 15% | |
Expense Ratio - Class I (as of 09/30/15) | | 1.12% | |
SECTOR ALLOCATION | | % of Net Assets | |
Information Technology | | | 26.0 | | |
Financials | | | 25.8 | | |
Consumer Discretionary | | | 20.0 | | |
Industrials | | | 12.7 | | |
Materials | | | 7.2 | | |
Health Care | | | 3.2 | | |
Consumer Staples | | | 1.6 | | |
Energy | | | 1.5 | | |
Short-Term Investments and Other | | | 2.0 | | |
GEOGRAPHIC ALLOCATION | |
| | | % of Equity | |
Europe | | | 41.8 | | |
Switzerland | | | 20.2 | | |
Germany* | | | 8.9 | | |
U.K. | | | 7.2 | | |
France* | | | 3.9 | | |
Netherlands* | | | 1.6 | | |
North America | | | 38.7 | | |
United States | | | 38.7 | | |
| | | % of Equity | |
Asia | | | 14.8 | | |
Japan | | | 10.3 | | |
South Korea | | | 2.4 | | |
China | | | 2.1 | | |
Australasia | | | 3.4 | | |
Australia | | | 3.4 | | |
Latin America | | | 1.3 | | |
Mexico | | | 1.3 | | |
* Euro currency countries comprise 14.4% of equity investments
22 OAKMARK FUNDS
Oakmark Global Fund March 31, 2016
Portfolio Manager Commentary


Clyde S. McGregor, CFA
Portfolio Manager
oakgx@oakmark.com
Robert A. Taylor, CFA
Portfolio Manager
oakgx@oakmark.com
A Volatile Quarter
Although it was not particularly pleasant, the March quarter was certainly interesting. Global stocks began the year with a decline in excess of 10%, which was the worst start ever for a calendar year. The remainder of the quarter saw an uneven price recovery as investors strained to understand economic trends. A 50% rebound in the price of oil during the quarter seemed to boost investor confidence. In addition, central banks in many countries intensified their stimulation efforts. The impact of this monetary stimulation, however, remains unclear at best. One definitive outcome is negative interest rates, a heretofore almost unimaginable concept, but one that is now commonplace across European financial markets. We are uncertain if negative rates are prompting much economic activity, but it is clear to us that they are crimping banking industry profitability. Investors have also been forced to grapple with political dysfunction in some countries and increasing political populism in others. And although markets seem increasingly inured to the reality of frequent terrorism events, they contribute to a high level of investor insecurity as evidenced by the minimal returns to international markets since mid-2011.
The Oakmark Global Fund had a disappointing quarter, much of which was attributable to the Fund's significant commitment to financial industry stocks. (We discuss this in more detail below.) The Fund lost 7% in the quarter, which compares to the MSCI World Index11 which remained unchanged and the Lipper Global Fund Index's12 loss of 1%. Since inception in 1999, the Fund has achieved a compound annual rate of return of 10%, which compares to 4% for both the MSCI World Index and the Lipper Global Fund Index.
Issuers domiciled in the United Kingdom, the Netherlands and South Korea contributed most to the Fund's return in the quarter, while issuers domiciled in Switzerland, the U.S. and Japan were significant detractors. The five largest contributors to the Fund's return in the quarter were Oracle (U.S.), Itron (U.S.), Smiths Group (U.K.), Philips (Netherlands) and Samsung Electronics (Korea). The Fund holdings that detracted most were Credit Suisse (Switzerland), Bank of America (U.S.), Citigroup (U.S.), Toyota Motor (Japan), Incitec Pivot (Australia) and Julius Baer Group (Switzerland). Again, notice that four of the bottom six largest detractors from return were all financial institutions.
Fears of harsher regulations, minimal or negative interest rates hurting near-term profitability, and the risk of credit losses on loans to the oil industry have weighed on the share prices of the Fund's financial holdings, and nearly all declined more than 10% in the quarter. Since the financial industry was the Fund's largest sector weighting at the beginning of the quarter, it is not surprising that our absolute performance for the period was poor.
The regulatory headwind for financials has been in place for some time and has already caused us to lower our estimate of
normal returns, and thus, the multiples we are willing to pay for the financials we own. While we do not expect the regulatory environment to improve, it is nice to see signs that things are not getting worse. An example of this was the lower-than-expected leverage ratio minimums set by the Basel Committee late last year. Regardless, the balance sheets of our financial holdings have improved over the past few years and meet regulatory minimums.
Quantitative easing in many countries, along with the lack of rate increases by the Fed, has caused rates to stay lower for longer than even we expected. Having said that, the possibility of rates staying below or near zero forever does not coincide with long-term credit cycles, nor do we believe the current level of inflation or growth will persist and warrant easy money into perpetuity. As rates normalize, spreads between financial industry liabilities and assets will widen, and profitability should materially increase.
Although oil prices have improved, they remain far below levels of even one year ago, and this has caused financial distress for many oil-related businesses. If oil prices stay low, there is a chance to see defaults and/or bankruptcies that would hurt the financial industry in general and our financial holdings specifically. However, when we compare our holdings' direct exposure to oil loans with their overall loan portfolios, we believe that any losses from oil loans would primarily affect their income statements (i.e., reduce their earnings) rather than their capital or balance sheets. Since all of our financial holdings have ample capital, we do not believe that low oil prices will significantly hurt their business values.
Lastly, Credit Suisse detracted the most from the Fund's performance, reducing the Fund's return by 2%. One-off expenses related to litigation, pension true-up charges and write-downs on certain credit assets were negative surprises. However, these disappointing results have caused the management team to accelerate the restructuring and reduction of non-core investment banking lines of business. Though these changes may cause short-term pains, we view these actions as positive. They are in line with new CEO Tidjane Thiam's strategy to emphasize the company's wealth management business, which has very good secular growth trends, is fee based and requires little capital.
Portfolio Activity
As noted above, international stock indexes have stalled over the past five years while U.S. indexes have continued their choppy advance. In addition to a strong dollar, these results also reflect the fact that the U.S. economy has outperformed other developed nations over this period. We have responded to this disparate market action by gradually shifting Fund assets from U.S. to international investments; this was also true in the March quarter, as we reduced the U.S. allocation to 39%. The
Oakmark.com 23
Oakmark Global Fund March 31, 2016
Portfolio Manager Commentary (continued)
Fund's commitment to Switzerland remains the largest overweighting relative to the MSCI World Index. Of course, our country weights reflect our search for the best available values in individual securities rather than our beliefs about particular countries.
We eliminated three holdings in the quarter, two domestic and one international. The three eliminations were all small positions in the Fund. We sold Kuehne + Nagel (Switzerland) as it approached its sell target in order to raise cash to purchase more attractive issues. We sold Chesapeake Energy (U.S.) and Oceaneering International (U.S.) shares as we reoriented the Fund's energy allocation. Centene's acquisition of Health Net also became effective in March, and the Fund received a mix of cash and Centene shares as payment. We salute Health Net's management for their successful completion of this transaction.
CarMax was our one new purchase in the Fund. CarMax is the largest retailer of used cars in the U.S., but the company's market penetration is still quite low. Nevertheless, CarMax already enjoys significant scale advantages in data collection and optimization. The company's focus on data analysis provides ever-increasing advantages in inventory management and pricing. This helps CarMax to achieve industry-leading inventory turnover, which results in high returns on invested capital. We believe that the company's growth potential is substantial, particularly given what we perceive to be weak competition.
Currency Hedges
We continue to believe some global currencies are overvalued versus the U.S. dollar. We maintained our defensive currency hedges and ended the quarter with 26% of the Swiss franc and 10% of the Australian dollar hedged.
Thank you for being our partners in the Oakmark Global Fund. Please feel free to contact us with your questions or comments.
24 OAKMARK FUNDS
Oakmark Global Fund March 31, 2016 (Unaudited)
Schedule of Investments (in thousands)
| | | Shares | | Value | |
COMMON STOCKS - 98.0% | |
INFORMATION TECHNOLOGY - 26.0% | |
SOFTWARE & SERVICES - 12.6% | |
Alphabet, Inc., Class C (United States) (a)
Internet Software & Services | | | 146 | | | $ | 108,423 | | |
MasterCard, Inc., Class A (United States)
Data Processing & Outsourced Services | | | 983 | | | | 92,893 | | |
Oracle Corp. (United States)
Systems Software | | | 2,048 | | | | 83,788 | | |
Baidu, Inc. (China) (a) (b)
Internet Software & Services | | | 291 | | | | 55,470 | | |
| | | | | | 340,574 | | |
TECHNOLOGY HARDWARE & EQUIPMENT - 11.9% | |
TE Connectivity, Ltd. (Switzerland)
Electronic Manufacturing Services | | | 1,901 | | | | 117,691 | | |
Samsung Electronics Co., Ltd. (South Korea)
Technology Hardware, Storage & Peripherals | | | 55 | | | | 63,667 | | |
OMRON Corp. (Japan)
Electronic Components | | | 2,081 | | | | 61,940 | | |
Hirose Electric Co., Ltd. (Japan)
Electronic Components | | | 370 | | | | 40,843 | | |
Itron, Inc. (United States) (a)
Electronic Equipment & Instruments | | | 864 | | | | 36,063 | | |
| | | | | | 320,204 | | |
SEMICONDUCTORS & SEMICONDUCTOR EQUIPMENT - 1.5% | |
Intel Corp. (United States)
Semiconductors | | | 1,264 | | | | 40,893 | | |
| | | | | | 701,671 | | |
FINANCIALS - 25.8% | |
DIVERSIFIED FINANCIALS - 12.1% | |
Credit Suisse Group AG (Switzerland)
Diversified Capital Markets | | | 9,440 | | | | 133,618 | | |
Julius Baer Group, Ltd. (Switzerland)
Asset Management & Custody Banks | | | 2,587 | | | | 111,098 | | |
Daiwa Securities Group, Inc. (Japan)
Investment Banking & Brokerage | | | 13,334 | | | | 82,022 | | |
| | | | | | 326,738 | | |
BANKS - 10.5% | |
BNP Paribas SA (France)
Diversified Banks | | | 2,061 | | | | 103,708 | | |
Bank of America Corp. (United States)
Diversified Banks | | | 7,143 | | | | 96,567 | | |
Citigroup, Inc. (United States)
Diversified Banks | | | 1,949 | | | | 81,375 | | |
| | | | | | 281,650 | | |
INSURANCE - 3.2% | |
Allianz SE (Germany)
Multi-line Insurance | | | 528 | | | | 85,886 | | |
| | | | | | 694,274 | | |
| | | Shares | | Value | |
CONSUMER DISCRETIONARY - 20.0% | |
AUTOMOBILES & COMPONENTS - 11.2% | |
General Motors Co. (United States)
Automobile Manufacturers | | | 3,657 | | | $ | 114,927 | | |
Daimler AG (Germany)
Automobile Manufacturers | | | 1,305 | | | | 100,065 | | |
Toyota Motor Corp. (Japan)
Automobile Manufacturers | | | 1,620 | | | | 85,680 | | |
| | | | | | 300,672 | | |
MEDIA - 5.9% | |
The Interpublic Group of Cos., Inc.
(United States)
Advertising | | | 3,928 | | | | 90,149 | | |
Live Nation Entertainment, Inc.
(United States) (a)
Movies & Entertainment | | | 1,574 | | | | 35,108 | | |
Grupo Televisa SAB (Mexico) (b)
Broadcasting | | | 1,263 | | | | 34,694 | | |
| | | | | | 159,951 | | |
CONSUMER DURABLES & APPAREL - 2.5% | |
Cie Financiere Richemont SA (Switzerland)
Apparel, Accessories & Luxury Goods | | | 1,025 | | | | 67,763 | | |
RETAILING - 0.4% | |
CarMax, Inc. (United States) (a)
Automotive Retail | | | 196 | | | | 10,037 | | |
| | | | | | 538,423 | | |
INDUSTRIALS - 12.7% | |
CAPITAL GOODS - 10.5% | |
CNH Industrial N.V. (United Kingdom)
Agricultural & Farm Machinery | | | 16,007 | | | | 108,831 | | |
MTU Aero Engines AG (Germany)
Aerospace & Defense | | | 520 | | | | 49,846 | | |
USG Corp. (United States) (a)
Building Products | | | 1,846 | | | | 45,809 | | |
Koninklijke Philips N.V. (Netherlands)
Industrial Conglomerates | | | 1,449 | | | | 41,287 | | |
Smiths Group PLC (United Kingdom)
Industrial Conglomerates | | | 2,395 | | | | 37,010 | | |
| | | | | | 282,783 | | |
TRANSPORTATION - 2.2% | |
Union Pacific Corp. (United States)
Railroads | | | 741 | | | | 58,962 | | |
| | | | | | 341,745 | | |
MATERIALS - 7.2% | |
LafargeHolcim, Ltd. (Switzerland)
Construction Materials | | | 2,202 | | | | 103,577 | | |
Incitec Pivot, Ltd. (Australia)
Diversified Chemicals | | | 36,545 | | | | 89,362 | | |
| | | | | | 192,939 | | |
See accompanying Notes to Financial Statements.
Oakmark.com 25
Oakmark Global Fund March 31, 2016 (Unaudited)
Schedule of Investments (in thousands) (continued)
| | | Shares | | Value | |
COMMON STOCKS - 98.0% (continued) | |
HEALTH CARE - 3.2% | |
HEALTH CARE EQUIPMENT & SERVICES - 3.2% | |
Tenet Healthcare Corp. (United States) (a)
Health Care Facilities | | | 1,879 | | | $ | 54,356 | | |
Centene Corp. (United States) (a)
Managed Health Care | | | 511 | | | | 31,450 | | |
| | | | | | 85,806 | | |
CONSUMER STAPLES - 1.6% | |
FOOD, BEVERAGE & TOBACCO - 1.6% | |
Diageo PLC (United Kingdom)
Distillers & Vintners | | | 1,641 | | | | 44,353 | | |
ENERGY - 1.5% | |
National Oilwell Varco, Inc. (United States)
Oil & Gas Equipment & Services | | | 1,315 | | | | 40,881 | | |
TOTAL COMMON STOCKS - 98.0%
(COST $2,468,986) | | | | | 2,640,092 | | |
| | | Par Value | | Value | |
SHORT TERM INVESTMENT - 2.2% | |
REPURCHASE AGREEMENT - 2.2% | |
Fixed Income Clearing Corp. Repurchase
Agreement, 0.10% dated 03/31/16 due
04/01/16, repurchase price $58,139,
collateralized by a United States
Treasury Note, 2.375%, due 08/15/24,
value plus accrued interest of
$59,305 (Cost: $58,139) | | $ | 58,139 | | | | 58,139 | | |
TOTAL SHORT TERM INVESTMENTS - 2.2%
(COST $58,139) | | | | | 58,139 | | |
TOTAL INVESTMENTS - 100.2%
(COST $2,527,125) | | | | | 2,698,231 | | |
Foreign Currencies (Cost $0) - 0.0% (c) | | | | | 0 | (d) | |
Liabilities In Excess of Other Assets - (0.2)% | | | | | (4,534 | ) | |
TOTAL NET ASSETS - 100.0% | | | | $ | 2,693,697 | | |
(a) Non-income producing security
(b) Sponsored American Depositary Receipt
(c) Amount rounds to less than 0.1%.
(d) Amount rounds to less than $1,000.
See accompanying Notes to Financial Statements.
26 OAKMARK FUNDS

This page intentionally left blank.
Oakmark.com 27
Oakmark Global Select Fund March 31, 2016
Summary Information
VALUE OF A $10,000 INVESTMENT
Since Inception - 10/02/06 (Unaudited)
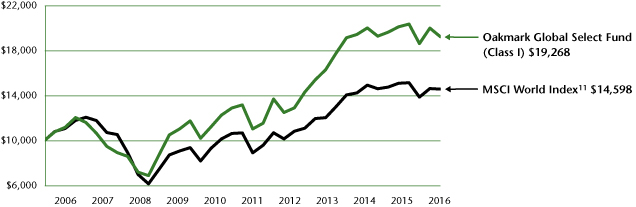
PERFORMANCE
| | | Average Annual Total Returns (as of 03/31/16) | | | |
(Unaudited) | | Total Return
Last 3 Months | | 1-year | | 3-year | | 5-year | | Since
Inception | | Inception
Date | |
Oakmark Global Select Fund (Class I) | | | -3.82 | % | | | -4.36 | % | | | 7.71 | % | | | 8.33 | % | | | 7.15 | % | | 10/02/06 | |
MSCI World Index | | | -0.35 | % | | | -3.45 | % | | | 6.82 | % | | | 6.51 | % | | | 4.07 | % | | | |
Lipper Global Funds Index12 | | | -1.01 | % | | | -5.05 | % | | | 6.05 | % | | | 4.92 | % | | | 3.90 | % | | | |
The graph and table do not reflect the deduction of taxes that a shareholder would pay on Fund distributions or the redemption of Fund shares.
Past performance is no guarantee of future results. The performance data quoted represents past performance. Current performance may be lower or higher than the performance data quoted. Total return includes change in share prices and, in each case, includes reinvestment of dividends and capital gain distributions. The investment return and principal value vary so that an investor's shares when redeemed may be worth more or less than the original cost. To obtain the most recent month-end performance, please visit Oakmark.com.
TOP TEN EQUITY HOLDINGS7 | | % of Net Assets | |
Alphabet Inc., Class C | | | 8.0 | | |
General Electric Co. | | | 6.7 | | |
LafargeHolcim, Ltd. | | | 5.5 | | |
Daimler AG | | | 5.3 | | |
Samsung Electronics Co., Ltd. | | | 5.2 | | |
American International Group, Inc. | | | 5.1 | | |
Credit Suisse Group | | | 5.0 | | |
JPMorgan Chase & Co. | | | 4.9 | | |
MasterCard, Inc., Class A | | | 4.9 | | |
Apache Corp. | | | 4.8 | | |
FUND STATISTICS | |
Ticker | | OAKWX | |
Inception | | 10/02/06 | |
Number of Equity Holdings | | 20 | |
Net Assets | | $2.1 billion | |
Benchmark | | MSCI World Index | |
Weighted Average Market Cap | | $123.6 billion | |
Median Market Cap | | $54.0 billion | |
Portfolio Turnover (for the 6-months ended 03/31/16) | | 7% | |
Expense Ratio - Class I (as of 09/30/15) | | 1.13% | |
SECTOR ALLOCATION | | % of Net Assets | |
Information Technology | | | 27.6 | | |
Financials | | | 23.8 | | |
Consumer Discretionary | | | 14.6 | | |
Industrials | | | 13.8 | | |
Consumer Staples | | | 6.6 | | |
Materials | | | 5.5 | | |
Energy | | | 4.8 | | |
Short-Term Investments and Other | | | 3.3 | | |
GEOGRAPHIC ALLOCATION | |
| | | % of Equity | |
Europe | | | 45.2 | | |
Switzerland | | | 23.6 | | |
U.K. | | | 8.2 | | |
France* | | | 7.9 | | |
Germany* | | | 5.5 | | |
North America | | | 45.1 | | |
United States | | | 45.1 | | |
| | | % of Equity | |
Asia | | | 9.7 | | |
South Korea | | | 5.3 | | |
Japan | | | 4.4 | | |
* Euro currency countries comprise 13.4% of equity investments
28 OAKMARK FUNDS
Oakmark Global Select Fund March 31, 2016
Portfolio Manager Commentary


William C. Nygren, CFA
Portfolio Manager
oakwx@oakmark.com
David G. Herro, CFA
Portfolio Manager
oakwx@oakmark.com
The Oakmark Global Select Fund declined 4% for the quarter ended March 31, 2016, underperforming the MSCI World Index11, which was flat for the quarter. The Fund has returned an average of 7% per year since its inception in October 2006, outperforming the MSCI World Index's annualized gain of 4% over the same period.
The largest contributor to performance for the quarter was Oracle (U.S.), which returned 12%. Shares reacted positively to stronger-than-expected fiscal third quarter results from the cloud-based business. We believe Oracle's successful transition to the cloud indicates that the company is on the right track. Management also recently announced a $10 billion increase to Oracle's existing share repurchase program. Even though its stock has enjoyed recent price increases, we believe Oracle remains undervalued relative to its normalized earnings power.
Credit Suisse (Switzerland) was the largest detractor for the quarter, declining by 34%. Although CEO Tidjane Thiam warned that fourth-quarter earnings would be weak, some one-off expenses related to litigation, pension true-up charges and write-downs on certain credit assets were negative surprises during the period. However, this has caused the management team to accelerate the restructuring and reduction of non-core investment banking lines of businesses. The goal is to emphasize the wealth management business that has very good secular growth trends, is fee based and requires little capital. We believe Credit Suisse's capital position remains solid with a Tier 1 capital ratio of 11.4% as of year-end, which is in excess of regulators' 10% requirement. Despite some near-term challenges, we continue to believe that over time shareholders will benefit from CEO Thiam's initiatives to correct some legacy missteps, grow the business and reduce costs.
We did not add or remove any names from the Fund during the quarter. Geographically, 45% of the Fund's holdings were invested in U.S.-domiciled companies as of quarter end while approximately 45% were allocated to equities in Europe, 5% in South Korea and 5% in Japan.
We continue to believe some global currencies are overvalued relative to the U.S. dollar. As a result, we defensively hedged a portion of the Fund's currency exposure. Approximately 26% of the Swiss franc exposure was hedged at quarter end.
We would like to thank our shareholders for continuing to support us and our value investing philosophy.
Oakmark.com 29
Oakmark Global Select Fund March 31, 2016 (Unaudited)
Schedule of Investments (in thousands)
| | | Shares | | Value | |
COMMON STOCKS - 96.7% | |
INFORMATION TECHNOLOGY - 27.6% | |
SOFTWARE & SERVICES - 17.6% | |
Alphabet, Inc., Class C (United States) (a)
Internet Software & Services | | | 228 | | | $ | 170,128 | | |
MasterCard, Inc., Class A (United States)
Data Processing & Outsourced Services | | | 1,100 | | | | 103,950 | | |
Oracle Corp. (United States)
Systems Software | | | 2,450 | | | | 100,230 | | |
| | | | | | 374,308 | | |
TECHNOLOGY HARDWARE & EQUIPMENT - 10.0% | |
Samsung Electronics Co., Ltd. (South Korea)
Technology Hardware, Storage & Peripherals | | | 96 | | | | 109,764 | | |
TE Connectivity, Ltd. (Switzerland)
Electronic Manufacturing Services | | | 1,654 | | | | 102,409 | | |
| | | | | | 212,173 | | |
| | | | | | 586,481 | | |
FINANCIALS - 23.8% | |
BANKS - 9.4% | |
JPMorgan Chase & Co. (United States)
Diversified Banks | | | 1,762 | | | | 104,346 | | |
Bank of America Corp. (United States)
Diversified Banks | | | 7,037 | | | | 95,140 | | |
| | | | | | 199,486 | | |
DIVERSIFIED FINANCIALS - 9.2% | |
Credit Suisse Group AG (Switzerland)
Diversified Capital Markets | | | 7,516 | | | | 106,388 | | |
Daiwa Securities Group, Inc. (Japan)
Investment Banking & Brokerage | | | 14,601 | | | | 89,815 | | |
| | | | | | 196,203 | | |
INSURANCE - 5.2% | |
American International Group, Inc.
(United States)
Multi-line Insurance | | | 2,022 | | | | 109,289 | | |
| | | | | | 504,978 | | |
CONSUMER DISCRETIONARY - 14.6% | |
CONSUMER DURABLES & APPAREL - 9.3% | |
Kering (France)
Apparel, Accessories & Luxury Goods | | | 562 | | | | 100,537 | | |
Cie Financiere Richemont SA (Switzerland)
Apparel, Accessories & Luxury Goods | | | 1,454 | | | | 96,063 | | |
| | | | | | 196,600 | | |
AUTOMOBILES & COMPONENTS - 5.3% | |
Daimler AG (Germany)
Automobile Manufacturers | | | 1,470 | | | | 112,683 | | |
| | | | | | 309,283 | | |
| | | Shares | | Value | |
INDUSTRIALS - 13.8% | |
CAPITAL GOODS - 10.8% | |
General Electric Co. (United States)
Industrial Conglomerates | | | 4,450 | | | $ | 141,466 | | |
CNH Industrial N.V. (United Kingdom)
Agricultural & Farm Machinery | | | 13,078 | | | | 88,913 | | |
| | | | | | 230,379 | | |
TRANSPORTATION - 3.0% | |
Kuehne + Nagel International AG (Switzerland)
Marine | | | 450 | | | | 63,960 | | |
| | | | | | 294,339 | | |
CONSUMER STAPLES - 6.6% | |
FOOD, BEVERAGE & TOBACCO - 6.6% | |
Diageo PLC (United Kingdom)
Distillers & Vintners | | | 2,923 | | | | 78,988 | | |
Danone SA (France)
Packaged Foods & Meats | | | 873 | | | | 62,124 | | |
| | | | | | 141,112 | | |
MATERIALS - 5.5% | |
LafargeHolcim, Ltd. (Switzerland)
Construction Materials | | | 2,466 | | | | 115,991 | | |
ENERGY - 4.8% | |
Apache Corp. (United States)
Oil & Gas Exploration & Production | | | 2,100 | | | | 102,501 | | |
TOTAL COMMON STOCKS - 96.7%
(COST $2,016,174) | | | | | 2,054,685 | | |
| | | Par Value | | Value | |
SHORT TERM INVESTMENTS - 3.2% | |
REPURCHASE AGREEMENT - 3.2% | |
Fixed Income Clearing Corp. Repurchase
Agreement, 0.10% dated 03/31/16 due
04/01/16, repurchase price $67,942,
collateralized by a Federal Home Loan
Bank Bond, 2.500%, due 02/09/24,
value plus accrued interest of $18,220,
by United States Treasury Notes,
1.875% - 2.750%, due 10/31/22 -
02/15/24, aggregate value plus
accrued interest of $51,082
(Cost: $67,942) | | $ | 67,942 | | | | 67,942 | | |
TOTAL SHORT TERM INVESTMENTS - 3.2%
(COST $67,942) | | | | | 67,942 | | |
TOTAL INVESTMENTS - 99.9%
(COST $2,084,116) | | | | | 2,122,627 | | |
Foreign Currencies (Cost $ 0) - 0.0% (b) | | | | | 0 | (c) | |
Other Assets In Excess of Liabilities - 0.1% | | | | | 2,902 | | |
TOTAL NET ASSETS - 100.0% | | | | $ | 2,125,529 | | |
(a) Non-income producing security
(b) Amount rounds to less than 0.1%.
(c) Amount rounds to less than $1,000.
See accompanying Notes to Financial Statements.
30 OAKMARK FUNDS

This page intentionally left blank.
Oakmark.com 31
Oakmark International Fund March 31, 2016
Summary Information
VALUE OF A $10,000 INVESTMENT
Since Inception - 09/30/92 (Unaudited)
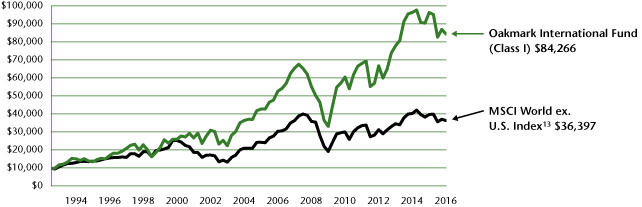
PERFORMANCE
| | | | | Average Annual Total Returns (as of 03/31/16) | | | |
(Unaudited) | | Total Return
Last 3 Months | | 1-year | | 3-year | | 5-year | | 10-year | | Since
Inception | | Inception
Date | |
Oakmark International Fund (Class I) | | | -2.95 | % | | | -12.37 | % | | | 2.72 | % | | | 4.40 | % | | | 4.82 | % | | | 9.49 | % | | 09/30/92 | |
MSCI World ex U.S. Index | | | -1.95 | % | | | -8.44 | % | | | 1.69 | % | | | 1.62 | % | | | 1.80 | % | | | 5.65 | % | | | |
MSCI EAFE Index14 | | | -3.01 | % | | | -8.27 | % | | | 2.23 | % | | | 2.29 | % | | | 1.80 | % | | | 5.50 | % | | | |
Lipper International Funds Index15 | | | -1.58 | % | | | -7.58 | % | | | 2.77 | % | | | 2.24 | % | | | 2.49 | % | | | 6.55 | % | | | |
Oakmark International Fund (Class II) | | | -3.02 | % | | | -12.69 | % | | | 2.34 | % | | | 4.01 | % | | | 4.47 | % | | | 7.44 | % | | 11/04/99 | |
The graph and table above do not reflect the deduction of taxes that a shareholder would pay on Fund distributions or the redemption of Fund shares.
Past performance is no guarantee of future results. The performance data quoted represents past performance. Current performance may be lower or higher than the performance data quoted. Total return includes change in share prices and, in each case, includes reinvestment of dividends and capital gain distributions. The investment return and principal value vary so that an investor's shares when redeemed may be worth more or less than the original cost. To obtain the most recent month-end performance, please visit Oakmark.com.
TOP TEN EQUITY HOLDINGS7 | | % of Net Assets | |
Glencore PLC | | | 4.7 | | |
Credit Suisse Group | | | 4.2 | | |
BNP Paribas SA | | | 3.7 | | |
Nomura Holdings, Inc. | | | 3.3 | | |
Daimler AG | | | 3.2 | | |
LafargeHolcim, Ltd. | | | 3.1 | | |
Honda Motor Co., Ltd. | | | 3.0 | | |
Bayerische Motoren Werke (BMW) AG | | | 2.8 | | |
Allianz SE | | | 2.7 | | |
Toyota Motor Corp. | | | 2.6 | | |
FUND STATISTICS | |
Ticker | | OAKIX | |
Inception | | 09/30/92 | |
Number of Equity Holdings | | 57 | |
Net Assets | | $26.0 billion | |
Benchmark | | MSCI World ex U.S. Index | |
Weighted Average Market Cap | | $38.5 billion | |
Median Market Cap | | $17.2 billion | |
Portfolio Turnover (for the 6-months ended 03/31/16) | | 25% | |
Expense Ratio - Class I (as of 09/30/15) | | 0.95% | |
SECTOR ALLOCATION | | % of Net Assets | |
Financials | | | 30.5 | | |
Consumer Discretionary | | | 26.5 | | |
Industrials | | | 19.3 | | |
Materials | | | 9.7 | | |
Information Technology | | | 7.1 | | |
Consumer Staples | | | 3.1 | | |
Short-Term Investments and Other | | | 3.8 | | |
GEOGRAPHIC ALLOCATION | |
| | | % of Equity | |
Europe | | | 67.9 | | |
Switzerland | | | 17.5 | | |
U.K. | | | 13.8 | | |
France* | | | 13.0 | | |
Germany* | | | 9.0 | | |
Italy* | | | 6.0 | | |
Sweden | | | 4.5 | | |
Netherlands* | | | 2.6 | | |
Ireland* | | | 1.5 | | |
Asia | | | 25.7 | | |
Japan | | | 17.9 | | |
South Korea | | | 2.2 | | |
Indonesia | | | 2.1 | | |
| | | % of Equity | |
Asia (cont'd) | | | 25.7 | | |
China | | | 1.6 | | |
Hong Kong | | | 1.5 | | |
Taiwan | | | 0.4 | | |
Australasia | | | 3.0 | | |
Australia | | | 3.0 | | |
North America | | | 1.7 | | |
United States | | | 1.7 | | |
Latin America | | | 1.4 | | |
Mexico | | | 1.4 | | |
Middle East | | | 0.3 | | |
Israel | | | 0.3 | | |
* Euro currency countries comprise 32.1% of equity investments
32 OAKMARK FUNDS
Oakmark International Fund March 31, 2016
Portfolio Manager Commentary


David G. Herro, CFA
Portfolio Manager
oakix@oakmark.com
Robert A. Taylor, CFA
Portfolio Manager
oakix@oakmark.com
The Oakmark International Fund declined 3% for the quarter ended March 31, 2016, underperforming the MSCI World ex U.S. Index13, which declined 2% over the same period. Most importantly, the Fund has returned an average of 9% per year since its inception in September 1992, outperforming the MSCI World ex U.S. Index, which has averaged 6% per year over the same period.
Glencore (Switzerland), one of the world's largest commodities and trading companies, was the top contributor for the quarter, returning 70%. Concerns about weaker-than-expected demand for copper in China drove the price of commodities lower last year and negatively impacted Glencore's share price. The market overreacted to the weaker demand, and we used the opportunity to buy shares at what we believed to be attractive prices. Glencore has taken action to counter the negative market impact. During the quarter, investors reacted positively to news that the company delivered on recent guidance for fiscal 2015, as well as to management's aggressive and well-specified plan to deleverage the company's balance sheet. Management has indicated that the debt restructuring plan and asset sales are progressing as expected. Despite the continued weak commodity prices, Glencore should still be able to generate $3 billion in free cash flow in fiscal 2016, which will aid in debt reduction. Additionally, management noted that they are seeing stronger demand for commodities across China than many were expecting. We believe that the prices for Glencore's primary commodity exposures are low relative to fundamental value and will rebound over time. As a result, our investment thesis remains intact.
Credit Suisse (Switzerland) was the largest detractor for the quarter, declining by 34%. Although CEO Tidjane Thiam warned that fourth-quarter earnings would be weak, some one-off expenses related to litigation, pension true-up charges and write-downs on certain credit assets were negative surprises during the period. However, this has caused the management team to accelerate the restructuring and reduction of non-core investment banking lines of businesses. The goal is to emphasize the wealth management business that has very good secular growth trends, is fee based and requires little capital. We believe Credit Suisse's capital position remains solid with a Tier 1 capital ratio of 11.4% as of year-end, which is in excess of regulators' 10% requirement. Despite some near-term challenges, we continue to believe that over time shareholders will benefit from CEO Thiam's initiatives to correct some legacy missteps, grow the business and reduce costs.
During the quarter we sold our positions in GlaxoSmithKline (U.K.), Olympus (Japan), Schindler Holding (Switzerland), Secom (Japan) and Swedish Match (Sweden) as they approached or hit our estimate of intrinsic value. We purchased two new names during the quarter: ASML Holding (the Netherlands), one of the world's largest providers of semiconductor
lithography capital equipment; and Taiwan Semiconductor (Taiwan), the market leader with greater than 50% market share in the semiconductor foundry business.
Geographically, we ended the quarter with 68% of our holdings in Europe, 18% in Japan and 3% in Australia. The remaining positions are in South Korea, Indonesia, the U.S., China, Hong Kong, Mexico, Taiwan and Israel.
We continue to believe some global currencies are overvalued versus the U.S. dollar. We maintained our defensive currency hedges and ended the quarter with approximately 26% of the Swiss franc and 11% of the Australian dollar hedged.
We would like to thank you for your continued support.
Oakmark.com 33
Oakmark International Fund March 31, 2016 (Unaudited)
Schedule of Investments (in thousands)
| | | Shares | | Value | |
COMMON STOCKS - 96.2% | |
FINANCIALS - 30.5% | |
DIVERSIFIED FINANCIALS - 12.6% | |
Credit Suisse Group AG (Switzerland)
Diversified Capital Markets | | | 77,319 | | | $ | 1,094,393 | | |
Nomura Holdings, Inc. (Japan) (b)
Investment Banking & Brokerage | | | 191,072 | | | | 853,792 | | |
Daiwa Securities Group, Inc. (Japan)
Investment Banking & Brokerage | | | 87,280 | | | | 536,887 | | |
EXOR SpA (Italy) (b)
Multi-Sector Holdings | | | 13,711 | | | | 491,451 | | |
Schroders PLC (United Kingdom)
Asset Management & Custody Banks | | | 7,853 | | | | 302,603 | | |
Schroders PLC, Non-Voting (United Kingdom)
Asset Management & Custody Banks | | | 31 | | | | 911 | | |
| | | | | | 3,280,037 | | |
BANKS - 12.3% | |
BNP Paribas SA (France)
Diversified Banks | | | 19,216 | | | | 967,113 | | |
Sumitomo Mitsui Financial Group, Inc. (Japan)
Diversified Banks | | | 20,134 | | | | 610,398 | | |
Intesa Sanpaolo SpA (Italy)
Diversified Banks | | | 198,816 | | | | 550,651 | | |
Bank Mandiri Persero Tbk PT (Indonesia)
Diversified Banks | | | 688,476 | | | | 534,789 | | |
Lloyds Banking Group PLC (United Kingdom)
Diversified Banks | | | 546,117 | | | | 533,521 | | |
| | | | | | 3,196,472 | | |
INSURANCE - 5.6% | |
Allianz SE (Germany)
Multi-line Insurance | | | 4,253 | | | | 691,870 | | |
Willis Towers Watson PLC (United States)
Insurance Brokers | | | 3,701 | | | | 439,211 | | |
AMP, Ltd. (Australia)
Life & Health Insurance | | | 73,086 | | | | 324,380 | | |
| | | | | | 1,455,461 | | |
| | | | | | 7,931,970 | | |
CONSUMER DISCRETIONARY - 26.5% | |
AUTOMOBILES & COMPONENTS - 12.9% | |
Daimler AG (Germany)
Automobile Manufacturers | | | 10,976 | | | | 841,439 | | |
Honda Motor Co., Ltd. (Japan)
Automobile Manufacturers | | | 28,743 | | | | 788,148 | | |
Bayerische Motoren Werke AG (Germany)
Automobile Manufacturers | | | 7,969 | | | | 731,745 | | |
Toyota Motor Corp. (Japan)
Automobile Manufacturers | | | 12,619 | | | | 667,336 | | |
Valeo SA (France)
Auto Parts & Equipment | | | 2,044 | | | | 318,147 | | |
| | | | | | 3,346,815 | | |
| | | Shares | | Value | |
CONSUMER DURABLES & APPAREL - 9.3% | |
Cie Financiere Richemont SA (Switzerland)
Apparel, Accessories & Luxury Goods | | | 8,572 | | | $ | 566,511 | | |
Kering (France)
Apparel, Accessories & Luxury Goods | | | 2,709 | | | | 484,238 | | |
Prada SpA (Italy) (b)
Apparel, Accessories & Luxury Goods | | | 135,617 | | | | 465,904 | | |
Swatch Group AG, Bearer Shares (Switzerland)
Apparel, Accessories & Luxury Goods | | | 1,136 | | | | 393,602 | | |
LVMH Moet Hennessy Louis Vuitton SA (France)
Apparel, Accessories & Luxury Goods | | | 1,734 | | | | 296,881 | | |
Burberry Group PLC (United Kingdom)
Apparel, Accessories & Luxury Goods | | | 10,403 | | | | 203,953 | | |
| | | | | | 2,411,089 | | |
MEDIA - 1.5% | |
Grupo Televisa SAB (Mexico) (c)
Broadcasting | | | 12,612 | | | | 346,317 | | |
WPP PLC (United Kingdom)
Advertising | | | 2,284 | | | | 53,361 | | |
| | | | | | 399,678 | | |
RETAILING - 1.4% | |
Hennes & Mauritz AB (H&M) - Class B
(Sweden)
Apparel Retail | | | 11,113 | | | | 370,565 | | |
CONSUMER SERVICES - 1.4% | |
Melco Crown Entertainment, Ltd.
(Hong Kong) (b) (c)
Casinos & Gaming | | | 21,919 | | | | 361,880 | | |
| | | | | | 6,890,027 | | |
INDUSTRIALS - 19.3% | |
CAPITAL GOODS - 14.2% | |
CNH Industrial N.V. (United Kingdom) (b)
Agricultural & Farm Machinery | | | 93,721 | | | | 637,203 | | |
Komatsu, Ltd. (Japan)
Construction Machinery & Heavy Trucks | | | 28,852 | | | | 491,177 | | |
SKF AB (Sweden) (b)
Industrial Machinery | | | 24,358 | | | | 439,857 | | |
Ashtead Group PLC (United Kingdom) (b)
Trading Companies & Distributors | | | 34,048 | | | | 422,507 | | |
Smiths Group PLC (United Kingdom) (b)
Industrial Conglomerates | | | 22,771 | | | | 351,903 | | |
Koninklijke Philips N.V. (Netherlands)
Industrial Conglomerates | | | 12,138 | | | | 345,766 | | |
Safran SA (France)
Aerospace & Defense | | | 4,664 | | | | 326,257 | | |
Atlas Copco AB, Series B (Sweden)
Industrial Machinery | | | 13,421 | | | | 316,425 | | |
Meggitt PLC (United Kingdom) (b)
Aerospace & Defense | | | 39,371 | | | | 229,916 | | |
Wolseley PLC (United Kingdom)
Trading Companies & Distributors | | | 2,333 | | | | 132,004 | | |
| | | | | | 3,693,015 | | |
See accompanying Notes to Financial Statements.
34 OAKMARK FUNDS
Oakmark International Fund March 31, 2016 (Unaudited)
Schedule of Investments (in thousands) (continued)
| | | Shares | | Value | |
COMMON STOCKS - 96.2% (continued) | |
INDUSTRIALS - 19.3% (continued) | |
COMMERCIAL & PROFESSIONAL SERVICES - 4.1% | |
Bureau Veritas SA (France) (b)
Research & Consulting Services | | | 20,504 | | | $ | 456,718 | | |
Experian PLC (Ireland)
Research & Consulting Services | | | 20,397 | | | | 364,726 | | |
G4S PLC (United Kingdom) (b)
Security & Alarm Services | | | 90,311 | | | | 247,225 | | |
| | | | | | 1,068,669 | | |
TRANSPORTATION - 1.0% | |
Kuehne + Nagel International AG
(Switzerland)
Marine | | | 1,803 | | | | 256,283 | | |
| | | | | | 5,017,967 | | |
MATERIALS - 9.7% | |
Glencore PLC (Switzerland)
Diversified Metals & Mining | | | 541,207 | | | | 1,222,706 | | |
LafargeHolcim, Ltd. (Switzerland)
Construction Materials | | | 16,911 | | | | 795,462 | | |
Orica, Ltd. (Australia) (b)
Commodity Chemicals | | | 35,886 | | | | 422,810 | | |
Akzo Nobel NV (Netherlands)
Specialty Chemicals | | | 1,419 | | | | 96,719 | | |
| | | | | | 2,537,697 | | |
INFORMATION TECHNOLOGY - 7.1% | |
TECHNOLOGY HARDWARE & EQUIPMENT - 4.2% | |
Samsung Electronics Co., Ltd. (South Korea)
Technology Hardware, Storage & Peripherals | | | 489 | | | | 560,508 | | |
OMRON Corp. (Japan) (b)
Electronic Components | | | 17,817 | | | | 530,336 | | |
| | | | | | 1,090,844 | | |
SOFTWARE & SERVICES - 1.8% | |
Baidu, Inc. (China) (a) (c)
Internet Software & Services | | | 2,070 | | | | 395,045 | | |
Check Point Software Technologies, Ltd.
(Israel) (a)
Systems Software | | | 734 | | | | 64,159 | | |
| | | | | | 459,204 | | |
SEMICONDUCTORS & SEMICONDUCTOR EQUIPMENT - 1.1% | |
ASML Holding NV (Netherlands)
Semiconductor Equipment | | | 1,986 | | | | 201,782 | | |
Taiwan Semiconductor Manufacturing Co., Ltd.
(Taiwan)
Semiconductors | | | 18,725 | | | | 94,253 | | |
| | | | | | 296,035 | | |
| | | | | | 1,846,083 | | |
| | | Shares | | Value | |
CONSUMER STAPLES - 3.1% | |
FOOD, BEVERAGE & TOBACCO - 3.1% | |
Diageo PLC (United Kingdom)
Distillers & Vintners | | | 12,819 | | | $ | 346,419 | | |
Danone SA (France)
Packaged Foods & Meats | | | 3,413 | | | | 242,758 | | |
Pernod Ricard SA (France)
Distillers & Vintners | | | 1,473 | | | | 164,216 | | |
Nestle SA (Switzerland)
Packaged Foods & Meats | | | 667 | | | | 49,809 | | |
| | | | | | 803,202 | | |
TOTAL COMMON STOCKS - 96.2%
(COST $26,960,954) | | | | | 25,026,946 | | |
| | | Par Value | | Value | |
SHORT TERM INVESTMENTS - 3.1% | |
GOVERNMENT AND AGENCY SECURITIES - 1.0% | |
United States Treasury Floating Rate Note,
0.369%, due 04/30/16 (d)
(Cost $250,000) | | $ | 250,000 | | | | 250,008 | | |
Total Government and Agency Securities
(Cost $250,000) | | | | | 250,008 | | |
COMMERCIAL PAPER - 0.9% | |
J.P. Morgan Securities LLC, 144A,
0.00% - 0.01%, due 04/15/16 -
06/07/16 (e) (f) | | | 200,000 | | | | 199,871 | | |
J.P. Morgan Securities LLC,
0.01%, due 09/15/16 (e) | | | 50,000 | | | | 49,839 | | |
Total Commercial Paper
(Cost $249,650) | | | | | 249,710 | | |
REPURCHASE AGREEMENT - 0.8% | |
Fixed Income Clearing Corp. Repurchase
Agreement, 0.10% dated 03/31/16 due
04/01/16, repurchase price $205,061,
collateralized by a United States Treasury
Note, 1.875%, due 10/31/22, value plus
accrued interest of $209,165
(Cost: $205,061) | | | 205,061 | | | | 205,061 | | |
U.S. GOVERNMENT BILLS - 0.4% | |
United States Treasury Bill,
0.00%, due 06/30/16 (e)
(Cost $99,947) | | | 100,000 | | | | 99,947 | | |
TOTAL SHORT TERM INVESTMENTS - 3.1%
(COST $804,658) | | | | | 804,726 | | |
TOTAL INVESTMENTS - 99.3%
(COST $27,765,612) | | | | | 25,831,672 | | |
Foreign Currencies (Cost $2) - 0.0% (g) | | | | | 2 | | |
Other Assets In Excess of Liabilities - 0.7% | | | | | 188,721 | | |
TOTAL NET ASSETS - 100.0% | | | | $ | 26,020,395 | | |
See accompanying Notes to Financial Statements.
Oakmark.com 35
Oakmark International Fund March 31, 2016 (Unaudited)
Schedule of Investments (in thousands) (continued)
(a) Non-income producing security
(b) See Note 5 in the Notes to Financial Statements regarding investments in affiliated issuers.
(c) Sponsored American Depositary Receipt
(d) Floating Rate Note. Rate shown is as of March 31, 2016.
(e) The rate shown represents the annualized yield at the time of purchase; not a coupon rate.
(f) See Note 1 in the Notes to Financial Statements regarding restricted securities. These securities may be resold subject to restrictions on resale under federal securities law.
(g) Amount rounds to less than 0.1%.
See accompanying Notes to Financial Statements.
36 OAKMARK FUNDS

This page intentionally left blank.
Oakmark.com 37
Oakmark International Small Cap Fund March 31, 2016
Summary Information
VALUE OF A $10,000 INVESTMENT
Since 03/31/06 (Unaudited)

PERFORMANCE
| | | | | Average Annual Total Returns (as of 03/31/16) | | | |
(Unaudited) | | Total Return
Last 3 Months | | 1-year | | 3-year | | 5-year | | 10-year | | Since
Inception | | Inception
Date | |
Oakmark International Small Cap Fund (Class I) | | | -1.13 | % | | | -8.79 | % | | | 3.50 | % | | | 2.61 | % | | | 3.55 | % | | | 9.16 | % | | 11/01/95 | |
MSCI World ex U.S. Small Cap Index | | | 0.60 | % | | | 1.99 | % | | | 5.55 | % | | | 3.84 | % | | | 3.09 | % | | | N/A | | | | |
MSCI World ex U.S. Index | | | -1.95 | % | | | -8.44 | % | | | 1.69 | % | | | 1.62 | % | | | 1.80 | % | | | 4.74 | % | | | |
Lipper International Small Cap Funds Index17 | | | -0.42 | % | | | 0.10 | % | | | 5.92 | % | | | 5.11 | % | | | 4.35 | % | | | N/A | | | | |
Oakmark International Small Cap Fund (Class II) | | | -1.20 | % | | | -8.91 | % | | | 3.19 | % | | | 2.31 | % | | | 3.30 | % | | | 9.25 | % | | 01/08/01 | |
The graph and table do not reflect the deduction of taxes that a shareholder would pay on Fund distributions or the redemption of Fund shares.
Past performance is no guarantee of future results. The performance data quoted represents past performance. Current performance may be lower or higher than the performance data quoted. Total return includes change in share prices and, in each case, includes reinvestment of dividends and capital gain distributions. The investment return and principal value vary so that an investor's shares when redeemed may be worth more or less than the original cost. The performance of the Fund does not reflect the 2% redemption fee imposed on shares redeemed within 90 days of purchase. To obtain the most recent month-end performance, please visit Oakmark.com.
TOP TEN EQUITY HOLDINGS7 | | % of Net Assets | |
Julius Baer Group, Ltd. | | | 4.0 | | |
BNK Financial Group, Inc. | | | 3.7 | | |
Incitec Pivot, Ltd. | | | 3.7 | | |
Konecranes Plc | | | 3.1 | | |
Atea ASA | | | 2.9 | | |
Melco International Development, Ltd. | | | 2.8 | | |
MTU Aero Engines AG | | | 2.7 | | |
Panalpina Welttransport Holding AG | | | 2.6 | | |
Countrywide PLC | | | 2.5 | | |
Metso OYJ | | | 2.4 | | |
FUND STATISTICS | |
Ticker | | OAKEX | |
Inception | | 11/01/95 | |
Number of Equity Holdings | | 60 | |
Net Assets | | $2.6 billion | |
Benchmark | | MSCI World ex U.S. Small Cap Index | |
Weighted Average Market Cap | | $2.9 billion | |
Median Market Cap | | $1.8 billion | |
Portfolio Turnover (for the 6-months ended 03/31/16) | | 22% | |
Expense Ratio — Class I (as of 09/30/15) | | 1.35% | |
SECTOR ALLOCATION | | % of Net Assets | |
Industrials | | | 43.5 | | |
Financials | | | 22.2 | | |
Information Technology | | | 8.5 | | |
Consumer Discretionary | | | 8.3 | | |
Materials | | | 6.9 | | |
Health Care | | | 4.4 | | |
Consumer Staples | | | 2.5 | | |
Short-Term Investments and Other | | | 3.7 | | |
GEOGRAPHIC ALLOCATION | |
| | | % of Equity | |
Europe | | | 61.0 | | |
U.K. | | | 19.6 | | |
Switzerland | | | 13.5 | | |
Finland* | | | 7.2 | | |
Italy* | | | 5.3 | | |
Norway | | | 3.0 | | |
Germany* | | | 2.8 | | |
Spain* | | | 2.4 | | |
Netherlands* | | | 2.2 | | |
France* | | | 2.2 | | |
Greece* | | | 1.5 | | |
Denmark | | | 1.3 | | |
Asia | | | 19.6 | | |
Japan | | | 8.4 | | |
| | | % of Equity | |
Asia (cont'd) | | | 19.6 | | |
South Korea | | | 6.3 | | |
Hong Kong | | | 3.7 | | |
China | | | 1.2 | | |
Australasia | | | 11.7 | | |
Australia | | | 9.2 | | |
New Zealand | | | 2.5 | | |
North America | | | 5.9 | | |
Canada | | | 4.6 | | |
United States | | | 1.3 | | |
Latin America | | | 1.7 | | |
Brazil | | | 1.7 | | |
Middle East | | | 0.1 | | |
Israel | | | 0.1 | | |
* Euro currency countries comprise 23.6% of equity investments
38 OAKMARK FUNDS
Oakmark International Small Cap Fund March 31, 2016
Portfolio Manager Commentary


David G. Herro, CFA
Portfolio Manager
oakex@oakmark.com
Michael L. Manelli, CFA
Portfolio Manager
oakex@oakmark.com
The Oakmark International Small Cap Fund declined 1% for the quarter ended March 31, 2016, underperforming the MSCI World ex U.S. Small Cap Index16, which returned 1% for the same period. Since the Fund's inception in November 1995, it has returned an average of 9% per year.
The top-performing stock for the quarter was Primary Health Care. Primary operates more than 70 health care clinics in Australia and is also one of the largest providers of pathology and diagnostic imaging services in the country. During the quarter, Primary reported its fiscal year 2016 first-half earnings, which met analysts' outlook for the reporting period and showed that the company's medical centers business demonstrated stronger growth and margin development despite a lower number of doctors for the year and fee index freezes. On a recent trip to Australia, we met with CEO Peter Gregg and CFO Malcolm Ashcroft, and we continue to believe that management at the company has improved significantly. We believe the company is taking necessary actions including moving to a more sustainable doctor recruitment model, increasing the level of talent within the organization and reducing financial leverage. Furthermore, we like that management is focused on recycling capital from non-core assets, such as the recent sale of the company's software business for general practitioners in order to fund organic growth and improve returns on capital in the company's core medical center, pathology and imaging businesses.
The Fund's largest detractor for the quarter was a Swiss private bank holding company, EFG International. During the quarter, EFG International announced a proposed acquisition of one of the oldest private Swiss banks, BSI. BSI's assets under management are similar in size to EFG's and the combined entity would become the fifth-largest private bank in Switzerland. Due to the size of the deal, EFG will need to issue equity to finance the transaction; this news hurt EFG's share price during the quarter. However, in our view, the longer-term synergy opportunities are significant and if the merger is executed properly, we believe that the combined entity's earnings power should be materially higher than EFG as a stand-alone entity.
We initiated five new positions in the Fund this quarter: Aberdeen Asset Management, Azimut Holding, Ferrari, Interpump Group and Regus. Aberdeen Asset Management is based in the U.K. and is one of the world's largest asset management firms, with operations in over 20 countries. Azimut Holding is an Italy-based investment management company that offers asset management and financial services products to private and institutional clients. Ferrari is an Italian luxury sports car manufacturer. Interpump is an Italian manufacturer and marketer of high-pressure pumps, hydraulics and cleaning equipment that provides products to clients in over 60 countries. Lastly, based in the U.K., Regus is a global flexible workplace provider that serves more than two million customers in 2,600 locations across 900 cities in 106 countries. We eliminated our
positions in Fugro (Netherlands), MLP (Germany), Treasury Wine Estates (Australia) and Schoeller-Bleckmann Oilfield Equipment (Austria) during the quarter.
Geographically, we ended the quarter with 20% of our holdings in Asia, 61% in Europe and 12% in Australasia. The remaining positions are in North America (Canada and the U.S.), Latin America (Brazil) and the Middle East (Israel).
We still maintain hedge positions on two of the Fund's currency exposures, and as of the quarter end, 11% of the Australian dollar and 26% of the Swiss franc exposures were hedged.
Thank you for your continued confidence and support.
Oakmark.com 39
Oakmark International Small Cap Fund March 31, 2016 (Unaudited)
Schedule of Investments (in thousands)
| | | Shares | | Value | |
COMMON STOCKS - 96.3% | |
INDUSTRIALS - 43.5% | |
CAPITAL GOODS - 22.4% | |
Konecranes OYJ (Finland) (b)
Industrial Machinery | | | 3,381 | | | $ | 80,713 | | |
MTU Aero Engines AG (Germany)
Aerospace & Defense | | | 727 | | | | 69,700 | | |
Metso OYJ (Finland)
Industrial Machinery | | | 2,631 | | | | 62,785 | | |
Sulzer AG (Switzerland) (c)
Industrial Machinery | | | 546 | | | | 54,195 | | |
Bucher Industries AG (Switzerland)
Construction Machinery & Heavy Trucks | | | 220 | | | | 53,499 | | |
Saft Groupe SA (France) (b)
Electrical Components & Equipment | | | 1,661 | | | | 50,254 | | |
Morgan Advanced Materials PLC
(United Kingdom) (b)
Industrial Machinery | | | 14,723 | | | | 48,044 | | |
Travis Perkins PLC (United Kingdom)
Trading Companies & Distributors | | | 1,552 | | | | 40,730 | | |
Finning International, Inc. (Canada)
Trading Companies & Distributors | | | 2,643 | | | | 38,808 | | |
Outotec OYJ (Finland) (b) (c)
Construction & Engineering | | | 9,337 | | | | 35,252 | | |
Prysmian SpA (Italy)
Electrical Components & Equipment | | | 794 | | | | 17,993 | | |
Wajax Corp. (Canada) (b)
Trading Companies & Distributors | | | 1,162 | | | | 15,629 | | |
Melrose Industries PLC (United Kingdom)
Industrial Machinery | | | 1,552 | | | | 7,946 | | |
Interpump Group SpA (Italy)
Industrial Machinery | | | 181 | | | | 2,641 | | |
| | | | | | 578,189 | | |
| | | Shares | | Value | |
COMMERCIAL & PROFESSIONAL SERVICES - 14.8% | |
Applus Services SA (Spain) (b)
Research & Consulting Services | | | 6,645 | | | $ | 58,974 | | |
ALS, Ltd. (Australia)
Research & Consulting Services | | | 18,961 | | | | 57,993 | | |
Michael Page International PLC
(United Kingdom)
Human Resource & Employment Services | | | 9,321 | | | | 57,135 | | |
Mitie Group PLC (United Kingdom)
Environmental & Facilities Services | | | 12,781 | | | | 47,177 | | |
Regus PLC (United Kingdom)
Office Services & Supplies | | | 9,171 | | | | 41,713 | | |
SThree PLC (United Kingdom)
Human Resource & Employment Services | | | 6,359 | | | | 28,656 | | |
Randstad Holding N.V. (Netherlands)
Human Resource & Employment Services | | | 505 | | | | 27,996 | | |
Brunel International N.V. (Netherlands)
Human Resource & Employment Services | | | 1,326 | | | | 27,928 | | |
Cleanaway Waste Management, Ltd.
(Australia)
Environmental & Facilities Services | | | 27,278 | | | | 16,101 | | |
gategroup Holding AG (Switzerland)
Diversified Support Services | | | 259 | | | | 11,600 | | |
Dorma+Kaba Holding AG (Switzerland)
Security & Alarm Services | | | 11 | | | | 7,230 | | |
| | | | | | 382,503 | | |
TRANSPORTATION - 6.3% | |
Panalpina Welttransport Holding AG
(Switzerland)
Air Freight & Logistics | | | 596 | | | | 66,597 | | |
BBA Aviation PLC (United Kingdom)
Airport Services | | | 13,153 | | | | 37,858 | | |
DSV AS (Denmark)
Trucking | | | 785 | | | | 32,670 | | |
Freightways, Ltd. (New Zealand)
Air Freight & Logistics | | | 6,201 | | | | 27,215 | | |
| | | | | | 164,340 | | |
| | | | | | 1,125,032 | | |
FINANCIALS - 22.2% | |
DIVERSIFIED FINANCIALS - 12.0% | |
Julius Baer Group, Ltd. (Switzerland)
Asset Management & Custody Banks | | | 2,396 | | | | 102,899 | | |
Element Financial Corp. (Canada)
Specialized Finance | | | 5,501 | | | | 59,301 | | |
Azimut Holding SPA (Italy)
Asset Management & Custody Banks | | | 2,554 | | | | 58,846 | | |
EFG International AG (Switzerland)
Asset Management & Custody Banks | | | 7,007 | | | | 40,079 | | |
Aberdeen Asset Management PLC
(United Kingdom)
Asset Management & Custody Banks | | | 7,207 | | | | 28,715 | | |
Ichiyoshi Securities Co., Ltd. (Japan) (b)
Investment Banking & Brokerage | | | 2,221 | | | | 18,925 | | |
| | | | | | 308,765 | | |
See accompanying Notes to Financial Statements.
40 OAKMARK FUNDS
Oakmark International Small Cap Fund March 31, 2016 (Unaudited)
Schedule of Investments (in thousands) (continued)
| | | Shares | | Value | |
COMMON STOCKS - 96.3% (continued) | |
FINANCIALS - 22.2% (continued) | |
BANKS - 6.1% | |
BNK Financial Group, Inc. (South Korea)
Regional Banks | | | 11,323 | | | $ | 96,044 | | |
DGB Financial Group, Inc. (South Korea)
Regional Banks | | | 7,909 | | | | 61,548 | | |
| | | | | | 157,592 | | |
REAL ESTATE - 4.1% | |
Countrywide PLC (United Kingdom) (b)
Real Estate Services | | | 11,568 | | | | 64,066 | | |
LSL Property Services PLC
(United Kingdom) (b)
Real Estate Services | | | 10,416 | | | | 43,009 | | |
| | | | | | 107,075 | | |
| | | | | | 573,432 | | |
INFORMATION TECHNOLOGY - 8.5% | |
SOFTWARE & SERVICES - 4.7% | |
Atea ASA (Norway) (b)
IT Consulting & Other Services | | | 7,741 | | | | 73,902 | | |
Totvs SA (Brazil)
Systems Software | | | 5,591 | | | | 42,291 | | |
Altran Technologies SA (France)
IT Consulting & Other Services | | | 280 | | | | 3,881 | | |
| | | | | | 120,074 | | |
TECHNOLOGY HARDWARE & EQUIPMENT - 3.8% | |
Hirose Electric Co., Ltd. (Japan)
Electronic Components | | | 489 | | | | 53,887 | | |
Premier Farnell PLC (United Kingdom) (b)
Technology Distributors | | | 20,168 | | | | 32,660 | | |
Electrocomponents PLC (United Kingdom)
Technology Distributors | | | 2,816 | | | | 9,764 | | |
Orbotech, Ltd. (Israel) (a)
Electronic Equipment & Instruments | | | 107 | | | | 2,536 | | |
| | | | | | 98,847 | | |
| | | | | | 218,921 | | |
CONSUMER DISCRETIONARY - 8.3% | |
CONSUMER SERVICES - 2.8% | |
Melco International Development, Ltd.
(Hong Kong)
Casinos & Gaming | | | 52,467 | | | | 73,181 | | |
MEDIA - 2.8% | |
Hakuhodo DY Holdings, Inc. (Japan)
Advertising | | | 3,213 | | | | 36,404 | | |
SKY Network Television, Ltd. (New Zealand)
Cable & Satellite | | | 10,510 | | | | 36,178 | | |
| | | | | | 72,582 | | |
| | | Shares | | Value | |
RETAILING - 1.9% | |
China ZhengTong Auto Services Holdings, Ltd.
(China)
Automotive Retail | | | 74,036 | | | $ | 28,441 | | |
Hengdeli Holdings, Ltd. (Hong Kong)
Specialty Stores | | | 232,369 | | | | 19,171 | | |
| | | | | | 47,612 | | |
AUTOMOBILES & COMPONENTS - 0.8% | |
Ferrari N.V. (Italy) (a)
Automobile Manufacturers | | | 511 | | | | 21,207 | | |
| | | | | | 214,582 | | |
MATERIALS - 6.9% | |
Incitec Pivot, Ltd. (Australia)
Diversified Chemicals | | | 38,694 | | | | 94,619 | | |
Kansai Paint Co., Ltd. (Japan)
Specialty Chemicals | | | 2,884 | | | | 46,322 | | |
Titan Cement Co. SA (Greece)
Construction Materials | | | 1,726 | | | | 37,104 | | |
| | | | | | 178,045 | | |
HEALTH CARE - 4.4% | |
HEALTH CARE EQUIPMENT & SERVICES - 3.1% | |
Primary Health Care, Ltd. (Australia) (b)
Health Care Services | | | 20,943 | | | | 60,202 | | |
Amplifon S.p.A. (Italy)
Health Care Distributors | | | 2,368 | | | | 20,534 | | |
| | | | | | 80,736 | | |
PHARMACEUTICALS, BIOTECHNOLOGY & LIFE SCIENCES - 1.3% | |
QIAGEN N.V. (United States) (a)
Life Sciences Tools & Services | | | 1,451 | | | | 32,420 | | |
| | | | | | 113,156 | | |
CONSUMER STAPLES - 2.5% | |
FOOD & STAPLES RETAILING - 2.1% | |
Sugi Holdings Co., Ltd. (Japan)
Drug Retail | | | 1,006 | | | | 53,074 | | |
FOOD, BEVERAGE & TOBACCO - 0.4% | |
Davide Campari-Milano SPA (Italy)
Distillers & Vintners | | | 1,122 | | | | 11,215 | | |
| | | | | | 64,289 | | |
TOTAL COMMON STOCKS - 96.3%
(COST $2,775,784) | | | | | 2,487,457 | | |
See accompanying Notes to Financial Statements.
Oakmark.com 41
Oakmark International Small Cap Fund March 31, 2016 (Unaudited)
Schedule of Investments (in thousands) (continued)
| | | Par Value | | Value | |
SHORT TERM INVESTMENTS - 2.9% | |
REPURCHASE AGREEMENT - 2.9% | |
Fixed Income Clearing Corp. Repurchase
Agreement, 0.10% dated 03/31/16 due
04/01/16, repurchase price $76,276,
collateralized by a Federal Farm Credit
Bank Bond, 2.625%, due 07/16/24,
value plus accrued interest of $22,613,
by United States Treasury Notes,
2.375% - 2.750%, due 02/15/24 -
08/15/24, aggregate value plus
accrued interest of $55,194
(Cost: $76,276) | | $ | 76,276 | | | $ | 76,276 | | |
TOTAL SHORT TERM INVESTMENTS - 2.9%
(COST $76,276) | | | | | 76,276 | | |
TOTAL INVESTMENTS - 99.2%
(COST $2,852,060) | | | | | 2,563,733 | | |
Foreign Currencies (Cost $9) - 0.0% (d) | | | | | 9 | | |
Other Assets In Excess of Liabilities - 0.8% | | | | | 19,823 | | |
TOTAL NET ASSETS - 100.0% | | | | $ | 2,583,565 | | |
(a) Non-income producing security
(b) See Note 5 in the Notes to Financial Statements regarding investments in affiliated issuers.
(c) A portion of the security out on loan.
(d) Amount rounds to less than 0.1%.
See accompanying Notes to Financial Statements.
42 OAKMARK FUNDS

This page intentionally left blank.
Oakmark.com 43
Oakmark Funds
Statements of Assets and Liabilities—March 31, 2016 (Unaudited)
(in thousands except per share amounts)
| | | Oakmark
Fund | | Oakmark
Select
Fund | | Oakmark
Equity and
Income Fund | | Oakmark
Global
Fund | |
Assets | |
Investments in unaffiliated securities, at value (a) | | $ | 15,448,286 | | | $ | 5,316,276 | | | $ | 16,980,660 | | | $ | 2,698,231 | | |
Investments in affiliated securities, at value (b) | | | 0 | | | | 0 | | | | 0 | | | | 0 | | |
Foreign currency, at value (c) | | | 0 | (d) | | | 0 | | | | 0 | (d) | | | 0 | (d) | |
Receivable for: | |
Securities sold | | | 137,203 | | | | 0 | | | | 12,044 | | | | 4,536 | | |
Fund shares sold | | | 13,714 | | | | 3,299 | | | | 12,030 | | | | 1,200 | | |
Dividends and interest from unaffiliated securities (Net of foreign tax withheld) | | | 15,056 | | | | 12,373 | | | | 42,391 | | | | 5,001 | | |
Dividends and interest from affiliated securities (Net of foreign tax withheld) | | | 0 | | | | 0 | | | | 1,095 | | | | 0 | | |
Tax reclaim from unaffiliated securities | | | 2,482 | | | | 0 | | | | 10,668 | | | | 2,723 | | |
Tax reclaim from affiliated securities | | | 0 | | | | 0 | | | | 0 | | | | 0 | | |
Total receivables | | | 168,455 | | | | 15,672 | | | | 78,228 | | | | 13,460 | | |
Other assets | | | 87 | | | | 51 | | | | 91 | | | | 43 | | |
Total assets | | $ | 15,616,828 | | | $ | 5,331,999 | | | $ | 17,058,979 | | | $ | 2,711,734 | | |
Liabilities and Net Assets | |
Payable for: | |
Securities purchased | | $ | 0 | | | $ | 0 | | | $ | 13,492 | | | $ | 9,617 | | |
Fund shares redeemed | | | 22,637 | | | | 5,809 | | | | 31,611 | | | | 3,663 | | |
Forward foreign currency contracts | | | 0 | | | | 0 | | | | 0 | | | | 3,152 | | |
Investment advisory fee | | | 1,178 | | | | 464 | | | | 1,203 | | | | 269 | | |
Other shareholder servicing fees | | | 2,601 | | | | 639 | | | | 2,942 | | | | 471 | | |
Transfer and dividend disbursing agent fees | | | 375 | | | | 170 | | | | 195 | | | | 140 | | |
Trustee fees | | | 5 | | | | 8 | | | | 15 | | | | 7 | | |
Deferred trustee compensation | | | 1,037 | | | | 913 | | | | 893 | | | | 433 | | |
Other | | | 1,064 | | | | 330 | | | | 1,278 | | | | 285 | | |
Total liabilities | | | 28,897 | | | | 8,333 | | | | 51,629 | | | | 18,037 | | |
Net assets applicable to Fund shares outstanding | | $ | 15,587,931 | | | $ | 5,323,666 | | | $ | 17,007,350 | | | $ | 2,693,697 | | |
Analysis of Net Assets | |
Paid in capital | | $ | 11,939,962 | | | $ | 4,055,023 | | | $ | 13,405,071 | | | $ | 2,523,000 | | |
Accumulated undistributed net realized gain (loss) on investments, forward
contracts, written options and foreign currency transactions | | | (125,343 | ) | | | (37,093 | ) | | | 354,346 | | | | 10,445 | | |
Net unrealized appreciation (depreciation) on investments, forward
contracts, written options and foreign currency translation | | | 3,728,893 | | | | 1,281,473 | | | | 3,199,718 | | | | 167,919 | | |
Accumulated undistributed net investment income
(Distributions in excess of net investment income) | | | 44,419 | | | | 24,263 | | | | 48,215 | | | | (7,667 | ) | |
Net assets applicable to Fund shares outstanding | | $ | 15,587,931 | | | $ | 5,323,666 | | | $ | 17,007,350 | | | $ | 2,693,697 | | |
Price of Shares | |
Net asset value, offering and redemption price per share: Class I | | $ | 62.47 | | | $ | 37.03 | | | $ | 28.79 | | | $ | 25.14 | | |
Class I—Net assets | | $ | 15,399,844 | | | $ | 5,287,253 | | | $ | 16,222,559 | | | $ | 2,664,968 | | |
Class I—Shares outstanding (Unlimited shares authorized) | | | 246,532 | | | | 142,787 | | | | 563,445 | | | | 106,024 | | |
Net asset value, offering and redemption price per share: Class II | | $ | 62.23 | (e) | | $ | 36.59 | (e) | | $ | 28.63 | | | $ | 24.50 | (e) | |
Class II—Net assets | | $ | 188,087 | | | $ | 36,413 | | | $ | 784,791 | | | $ | 28,729 | | |
Class II—Shares outstanding (Unlimited shares authorized) | | | 3,022 | | | | 995 | | | | 27,411 | | | | 1,173 | | |
| (a) Identified cost of investments in unaffiliated securities | | $ | 11,719,393 | | | $ | 4,034,803 | | | $ | 13,780,942 | | | $ | 2,527,125 | | |
| (b) Identified cost of investments in affiliated securities | | | 0 | | | | 0 | | | | 0 | | | | 0 | | |
| (c) Identified cost of foreign currency | | | 0 | (d) | | | 0 | | | | 0 | (d) | | | 0 | (d) | |
| (d) Amount rounds to less than $1,000. | | | | | | | | | | | | | | | | | |
| (e) Net assets have been rounded for presentation purposes. The net asset value per share shown is as reported on March 31, 2016. | | | | | | | | | | | | | | | | | |
See accompanying Notes to Financial Statements.
44 OAKMARK FUNDS
| | | Oakmark
Global Select
Fund | | Oakmark
International
Fund | | Oakmark
International
Small Cap Fund | |
Assets | |
Investments in unaffiliated securities, at value (a) | | $ | 2,122,627 | | | $ | 20,282,050 | | | $ | 2,042,305 | | |
Investments in affiliated securities, at value (b) | | | 0 | | | | 5,549,622 | | | | 521,428 | | |
Foreign currency, at value (c) | | | 0 | (d) | | | 2 | | | | 9 | | |
Receivable for: | |
Securities sold | | | 8,584 | | | | 122,306 | | | | 8,070 | | |
Fund shares sold | | | 3,555 | | | | 50,991 | | | | 9,620 | | |
Dividends and interest from unaffiliated securities (Net of foreign tax withheld) | | | 3,881 | | | | 81,689 | | | | 7,229 | | |
Dividends and interest from affiliated securities (Net of foreign tax withheld) | | | 0 | | | | 22,115 | | | | 6,917 | | |
Tax reclaim from unaffiliated securities | | | 2,226 | | | | 39,448 | | | | 2,776 | | |
Tax reclaim from affiliated securities | | | 0 | | | | 1,584 | | | | 0 | | |
Total receivables | | | 18,246 | | | | 318,133 | | | | 34,612 | | |
Other assets | | | 40 | | | | 118 | | | | 43 | | |
Total assets | | $ | 2,140,913 | | | $ | 26,149,925 | | | $ | 2,598,397 | | |
Liabilities and Net Assets | |
Payable for: | |
Securities purchased | | $ | 5,113 | | | $ | 61,705 | | | $ | 0 | | |
Fund shares redeemed | | | 6,792 | | | | 33,371 | | | | 9,498 | | |
Forward foreign currency contracts | | | 2,702 | | | | 24,507 | | | | 3,110 | | |
Investment advisory fee | | | 215 | | | | 2,161 | | | | 291 | | |
Other shareholder servicing fees | | | 268 | | | | 5,164 | | | | 844 | | |
Transfer and dividend disbursing agent fees | | | 62 | | | | 502 | | | | 162 | | |
Trustee fees | | | 6 | | | | 21 | | | | 7 | | |
Deferred trustee compensation | | | 14 | | | | 720 | | | | 414 | | |
Other | | | 212 | | | | 1,379 | | | | 506 | | |
Total liabilities | | | 15,384 | | | | 129,530 | | | | 14,832 | | |
Net assets applicable to Fund shares outstanding | | $ | 2,125,529 | | | $ | 26,020,395 | | | $ | 2,583,565 | | |
Analysis of Net Assets | |
Paid in capital | | $ | 2,084,124 | | | $ | 28,419,661 | | | $ | 2,837,082 | | |
Accumulated undistributed net realized gain (loss) on investments, forward
contracts, written options and foreign currency transactions | | | 3,173 | | | | (494,240 | ) | | | 18,612 | | |
Net unrealized appreciation (depreciation) on investments, forward
contracts, written options and foreign currency translation | | | 35,771 | | | | (1,958,545 | ) | | | (291,300 | ) | |
Accumulated undistributed net investment income
(Distributions in excess of net investment income) | | | 2,461 | | | | 53,519 | | | | 19,171 | | |
Net assets applicable to Fund shares outstanding | | $ | 2,125,529 | | | $ | 26,020,395 | | | $ | 2,583,565 | | |
Price of Shares | |
Net asset value, offering and redemption price per share: Class I | | $ | 14.86 | | | $ | 20.73 | | | $ | 14.01 | | |
Class I—Net assets | | $ | 2,125,529 | | | $ | 25,454,631 | | | $ | 2,581,900 | | |
Class I—Shares outstanding (Unlimited shares authorized) | | | 143,029 | | | | 1,227,646 | | | | 184,261 | | |
Net asset value, offering and redemption price per share: Class II | | $ | 0 | | | $ | 20.84 | | | $ | 13.95 | (e) | |
Class II—Net assets | | $ | 0 | | | $ | 565,764 | | | $ | 1,665 | | |
Class II—Shares outstanding (Unlimited shares authorized) | | | 0 | | | | 27,147 | | | | 119 | | |
| (a) Identified cost of investments in unaffiliated securities | | $ | 2,084,116 | | | $ | 20,119,388 | | | $ | 2,215,566 | | |
| (b) Identified cost of investments in affiliated securities | | | 0 | | | | 7,646,224 | | | | 636,494 | | |
| (c) Identified cost of foreign currency | | | 0 | (d) | | | 2 | | | | 9 | | |
| (d) Amount rounds to less than $1,000. | | | | | | | | | | | | | |
| (e) Net assets have been rounded for presentation purposes. The net asset value per share shown is as reported on March 31, 2016. | | | | | | | | | | | |
Oakmark.com 45
Oakmark Funds
Statements of Operations—March 31, 2016 (Unaudited)
(in thousands)
| | | Oakmark
Fund | | Oakmark
Select
Fund | | Oakmark
Equity and
Income Fund | | Oakmark
Global
Fund | |
Investment Income: | |
Dividends from unaffiliated securities | | $ | 159,935 | | | $ | 37,315 | | | $ | 106,424 | | | $ | 18,965 | | |
Dividends from affiliated securities | | | 0 | | | | 0 | | | | 2,416 | | | | 0 | | |
Interest income from unaffiliated securities | | | 535 | | | | 17,130 | | | | 42,751 | | | | 11 | | |
Security lending income | | | 0 | | | | 6,420 | | | | 0 | | | | 0 | | |
Foreign taxes withheld | | | (45 | ) | | | (35 | ) | | | 0 | | | | (495 | ) | |
Total investment income | | | 160,425 | | | | 60,830 | | | | 151,591 | | | | 18,481 | | |
Expenses: | |
Investment advisory fee | | | 60,989 | | | | 23,972 | | | | 59,439 | | | | 14,510 | | |
Transfer and dividend disbursing agent fees | | | 628 | | | | 283 | | | | 408 | | | | 176 | | |
Other shareholder servicing fees | | | 9,087 | | | | 1,925 | | | | 7,228 | | | | 1,456 | | |
Service fee—Class II | | | 249 | | | | 50 | | | | 1,119 | | | | 37 | | |
Reports to shareholders | | | 645 | | | | 156 | | | | 347 | | | | 113 | | |
Custody and accounting fees | | | 236 | | | | 115 | | | | 263 | | | | 217 | | |
Registration and blue sky expenses | | | 117 | | | | 20 | | | | 19 | | | | 17 | | |
Trustees fees | | | 161 | | | | 105 | | | | 173 | | | | 83 | | |
Legal fees | | | 88 | | | | 54 | | | | 92 | | | | 44 | | |
Audit and tax services fees | | | 27 | | | | 14 | | | | 27 | | | | 11 | | |
Dividends on securities sold short | | | 0 | | | | 0 | | | | 0 | | | | 0 | | |
Other | | | 336 | | | | 229 | | | | 340 | | | | 184 | | |
Total expenses | | | 72,563 | | | | 26,923 | | | | 69,455 | | | | 16,848 | | |
Net Investment Income | | $ | 87,862 | | | $ | 33,907 | | | $ | 82,136 | | | $ | 1,633 | | |
Net realized and unrealized gain (loss): | |
Net realized gain (loss) on: | |
Unaffiliated investments | | | (138,809 | ) | | | (37,703 | ) | | | 380,877 | | | | 19,149 | | |
Affiliated investments | | | 0 | | | | 0 | | | | (26,482 | ) | | | 0 | | |
Forward foreign currency contracts | | | 0 | | | | 0 | | | | 0 | | | | 3,753 | | |
Foreign currency transactions | | | 0 | | | | 0 | | | | 6 | | | | 231 | | |
Written options | | | 16,395 | | | | 33,488 | | | | 0 | | | | 0 | | |
Net realized gain (loss) | | | (122,414 | ) | | | (4,215 | ) | | | 354,401 | | | | 23,133 | | |
Net change in unrealized appreciation (depreciation) on: | |
Unaffiliated investments | | | 580,383 | | | | 25,821 | | | | (45,464 | ) | | | (72,291 | ) | |
Affiliated investments | | | 0 | | | | 0 | | | | 0 | | | | 0 | | |
Forward foreign currency contracts | | | 0 | | | | 0 | | | | 0 | | | | (4,916 | ) | |
Foreign currency translation | | | 0 | | | | 0 | | | | 0 | | | | 167 | | |
Written options | | | 0 | | | | (5,002 | ) | | | 0 | | | | 0 | | |
Net change in unrealized appreciation (depreciation) | | | 580,383 | | | | 20,819 | | | | (45,464 | ) | | | (77,040 | ) | |
Net realized and unrealized gain (loss) | | | 457,969 | | | | 16,604 | | | | 308,937 | | | | (53,907 | ) | |
Net increase (decrease) in net assets resulting from operations | | $ | 545,831 | | | $ | 50,511 | | | $ | 391,073 | | | $ | (52,274 | ) | |
See accompanying Notes to Financial Statements.
46 OAKMARK FUNDS
| | | Oakmark
Global Select
Fund | | Oakmark
International
Fund | | Oakmark
International
Small Cap Fund | |
Investment Income: | |
Dividends from unaffiliated securities | | $ | 13,352 | | | $ | 129,223 | | | $ | 53,032 | | |
Dividends from affiliated securities | | | 0 | | | | 63,988 | | | | 12,713 | | |
Interest income from unaffiliated securities | | | 26 | | | | 1,185 | | | | 30 | | |
Security lending income | | | 48 | | | | 932 | | | | 182 | | |
Foreign taxes withheld | | | (589 | ) | | | (12,882 | ) | | | (2,513 | ) | |
Total investment income | | | 12,837 | | | | 182,446 | | | | 63,444 | | |
Expenses: | |
Investment advisory fee | | | 10,781 | | | | 110,078 | | | | 15,182 | | |
Transfer and dividend disbursing agent fees | | | 65 | | | | 664 | | | | 129 | | |
Other shareholder servicing fees | | | 877 | | | | 15,170 | | | | 2,592 | | |
Service fee—Class II | | | 0 | | | | 728 | | | | 3 | | |
Reports to shareholders | | | 77 | | | | 805 | | | | 257 | | |
Custody and accounting fees | | | 154 | | | | 2,128 | | | | 384 | | |
Registration and blue sky expenses | | | 98 | | | | 325 | | | | 40 | | |
Trustees fees | | | 71 | | | | 220 | | | | 82 | | |
Legal fees | | | 42 | | | | 130 | | | | 44 | | |
Audit and tax services fees | | | 10 | | | | 37 | | | | 9 | | |
Dividends on securities sold short | | | 50 | | | | 0 | | | | 0 | | |
Other | | | 180 | | | | 437 | | | | 180 | | |
Total expenses | | | 12,405 | | | | 130,722 | | | | 18,902 | | |
Net Investment Income | | $ | 432 | | | $ | 51,724 | | | $ | 44,542 | | |
Net realized and unrealized gain (loss): | |
Net realized gain (loss) on: | |
Unaffiliated investments | | | 10,746 | | | | (201,124 | ) | | | 44,405 | | |
Affiliated investments | | | 0 | | | | (40,318 | ) | | | (13,704 | ) | |
Forward foreign currency contracts | | | 2,145 | | | | 25,516 | | | | 4,590 | | |
Foreign currency transactions | | | 309 | | | | (515 | ) | | | (921 | ) | |
Written options | | | 0 | | | | 0 | | | | 0 | | |
Net realized gain (loss) | | | 13,200 | | | | (216,441 | ) | | | 34,370 | | |
Net change in unrealized appreciation (depreciation) on: | |
Unaffiliated investments | | | 49,620 | | | | 1,252,886 | | | | (14,006 | ) | |
Affiliated investments | | | 0 | | | | (432,500 | ) | | | (43,460 | ) | |
Forward foreign currency contracts | | | (3,100 | ) | | | (39,669 | ) | | | (7,499 | ) | |
Foreign currency translation | | | 137 | | | | 2,720 | | | | 363 | | |
Written options | | | 0 | | | | 0 | | | | 0 | | |
Net change in unrealized appreciation (depreciation) | | | 46,657 | | | | 783,437 | | | | (64,602 | ) | |
Net realized and unrealized gain (loss) | | | 59,857 | | | | 566,996 | | | | (30,232 | ) | |
Net increase (decrease) in net assets resulting from operations | | $ | 60,289 | | | $ | 618,720 | | | $ | 14,310 | | |
Oakmark.com 47
Oakmark Funds
Statements of Changes in Net Assets
(in thousands)
| | | Oakmark Fund | |
| | | Six Months Ended
March 31, 2016
(Unaudited) | | Year Ended
September 30, 2015 | |
From Operations: | |
Net investment income | | $ | 87,862 | | | $ | 162,347 | | |
Net realized gain (loss) | | | (122,414 | ) | | | 92,078 | | |
Net change in unrealized appreciation (depreciation) | | | 580,383 | | | | (1,118,691 | ) | |
Net increase (decrease) in net assets from operations | | | 545,831 | | | | (864,266 | ) | |
Distributions to shareholders from: | |
Net investment income—Class I | | | (159,195 | ) | | | (105,542 | ) | |
Net investment income—Class II | | | (1,174 | ) | | | (827 | ) | |
Net realized gain—Class I | | | (79,584 | ) | | | (1,026,183 | ) | |
Net realized gain—Class II | | | (942 | ) | | | (12,168 | ) | |
Total distributions to shareholders | | | (240,895 | ) | | | (1,144,720 | ) | |
From Fund share transactions: | |
Proceeds from shares sold—Class I | | | 1,537,740 | | | | 4,657,970 | | |
Proceeds from shares sold—Class II | | | 16,249 | | | | 107,384 | | |
Reinvestment of distributions—Class I | | | 225,431 | | | | 1,034,574 | | |
Reinvestment of distributions—Class II | | | 1,424 | | | | 9,135 | | |
Payment for shares redeemed—Class I | | | (3,107,931 | ) | | | (3,751,484 | ) | |
Payment for shares redeemed—Class II | | | (29,306 | ) | | | (69,304 | ) | |
Net increase (decrease) in net assets from Fund share transactions | | | (1,356,393 | ) | | | 1,988,275 | | |
Total decrease in net assets | | | (1,051,457 | ) | | | (20,711 | ) | |
Net assets: | |
Beginning of period | | | 16,639,388 | | | | 16,660,099 | | |
End of period | | $ | 15,587,931 | | | $ | 16,639,388 | | |
Accumulated undistributed net investment income | | $ | 44,419 | | | $ | 130,361 | | |
Fund Share Transactions—Class I: | |
Shares sold | | | 25,024 | | | | 69,969 | | |
Shares issued in reinvestment of dividends | | | 3,589 | | | | 15,652 | | |
Less shares redeemed | | | (52,000 | ) | | | (56,579 | ) | |
Net increase (decrease) in shares outstanding | | | (23,387 | ) | | | 29,042 | | |
Fund Share Transactions—Class II: | |
Shares sold | | | 266 | | | | 1,609 | | |
Shares issued in reinvestment of dividends | | | 23 | | | | 139 | | |
Less shares redeemed | | | (476 | ) | | | (1,042 | ) | |
Net increase (decrease) in shares outstanding | | | (187 | ) | | | 706 | | |
See accompanying Notes to Financial Statements.
48 OAKMARK FUNDS
Oakmark Funds
Statements of Changes in Net Assets (continued)
(in thousands)
| | | Oakmark Select Fund | |
| | | Six Months Ended
March 31, 2016
(Unaudited) | | Year Ended
September 30, 2015 | |
From Operations: | |
Net investment income | | $ | 33,907 | | | $ | 12,852 | | |
Net realized gain (loss) | | | (4,215 | ) | | | (23,570 | ) | |
Net change in unrealized appreciation (depreciation) | | | 20,819 | | | | (373,571 | ) | |
Net increase (decrease) in net assets from operations | | | 50,511 | | | | (384,289 | ) | |
Distributions to shareholders from: | |
Net investment income—Class I | | | (17,524 | ) | | | 0 | | |
Net realized gain—Class I | | | 0 | | | | (787,839 | ) | |
Net realized gain—Class II | | | 0 | | | | (3,842 | ) | |
Total distributions to shareholders | | | (17,524 | ) | | | (791,681 | ) | |
From Fund share transactions: | |
Proceeds from shares sold—Class I | | | 467,280 | | | | 1,987,726 | | |
Proceeds from shares sold—Class II | | | 3,893 | | | | 30,881 | | |
Reinvestment of distributions—Class I | | | 15,156 | | | | 691,226 | | |
Reinvestment of distributions—Class II | | | 0 | | | | 2,566 | | |
Payment for shares redeemed—Class I | | | (727,095 | ) | | | (2,249,473 | ) | |
Payment for shares redeemed—Class II | | | (4,615 | ) | | | (14,140 | ) | |
Net increase (decrease) in net assets from Fund share transactions | | | (245,381 | ) | | | 448,786 | | |
Total decrease in net assets | | | (212,394 | ) | | | (727,184 | ) | |
Net assets: | |
Beginning of period | | | 5,536,060 | | | | 6,263,244 | | |
End of period | | $ | 5,323,666 | | | $ | 5,536,060 | | |
Accumulated undistributed net investment income | | $ | 24,263 | | | $ | 8,479 | | |
Fund Share Transactions—Class I: | |
Shares sold | | | 12,578 | | | | 47,737 | | |
Shares issued in reinvestment of dividends | | | 391 | | | | 17,067 | | |
Less shares redeemed | | | (19,641 | ) | | | (54,887 | ) | |
Net increase (decrease) in shares outstanding | | | (6,672 | ) | | | 9,917 | | |
Fund Share Transactions—Class II: | |
Shares sold | | | 107 | | | | 748 | | |
Shares issued in reinvestment of dividends | | | 0 | | | | 64 | | |
Less shares redeemed | | | (125 | ) | | | (350 | ) | |
Net increase (decrease) in shares outstanding | | | (18 | ) | | | 462 | | |
See accompanying Notes to Financial Statements.
Oakmark.com 49
Oakmark Funds
Statements of Changes in Net Assets (continued)
(in thousands)
| | | Oakmark Equity and Income Fund | |
| | | Six Months Ended
March 31, 2016
(Unaudited) | | Year Ended
September 30, 2015 | |
From Operations: | |
Net investment income | | $ | 82,136 | | | $ | 212,700 | | |
Net realized gain (loss) | | | 354,401 | | | | 987,379 | | |
Net change in unrealized appreciation (depreciation) | | | (45,464 | ) | | | (1,604,477 | ) | |
Net increase (decrease) in net assets from operations | | | 391,073 | | | | (404,398 | ) | |
Distributions to shareholders from: | |
Net investment income—Class I | | | (188,045 | ) | | | (153,860 | ) | |
Net investment income—Class II | | | (5,787 | ) | | | (5,380 | ) | |
Net realized gain—Class I | | | (852,456 | ) | | | (1,552,733 | ) | |
Net realized gain—Class II | | | (42,531 | ) | | | (92,069 | ) | |
Total distributions to shareholders | | | (1,088,819 | ) | | | (1,804,042 | ) | |
From Fund share transactions: | |
Proceeds from shares sold—Class I | | | 842,078 | | | | 2,240,208 | | |
Proceeds from shares sold—Class II | | | 62,663 | | | | 189,738 | | |
Reinvestment of distributions—Class I | | | 979,326 | | | | 1,604,153 | | |
Reinvestment of distributions—Class II | | | 42,857 | | | | 86,561 | | |
Payment for shares redeemed—Class I | | | (2,216,350 | ) | | | (3,859,786 | ) | |
Payment for shares redeemed—Class II | | | (191,738 | ) | | | (416,085 | ) | |
Net decrease in net assets from Fund share transactions | | | (481,164 | ) | | | (155,211 | ) | |
Total decrease in net assets | | | (1,178,910 | ) | | | (2,363,651 | ) | |
Net assets: | |
Beginning of period | | | 18,186,260 | | | | 20,549,911 | | |
End of period | | $ | 17,007,350 | | | $ | 18,186,260 | | |
Accumulated undistributed net investment income | | $ | 48,215 | | | $ | 180,013 | | |
Fund Share Transactions—Class I: | |
Shares sold | | | 29,213 | | | | 69,270 | | |
Shares issued in reinvestment of dividends | | | 34,435 | | | | 50,461 | | |
Less shares redeemed | | | (76,696 | ) | | | (119,604 | ) | |
Net increase (decrease) in shares outstanding | | | (13,048 | ) | | | 127 | | |
Fund Share Transactions—Class II: | |
Shares sold | | | 2,193 | | | | 5,891 | | |
Shares issued in reinvestment of dividends | | | 1,514 | | | | 2,737 | | |
Less shares redeemed | | | (6,573 | ) | | | (12,991 | ) | |
Net decrease in shares outstanding | | | (2,866 | ) | | | (4,363 | ) | |
See accompanying Notes to Financial Statements.
50 OAKMARK FUNDS
Oakmark Funds
Statements of Changes in Net Assets (continued)
(in thousands)
| | | Oakmark Global Fund | |
| | | Six Months Ended
March 31, 2016
(Unaudited) | | Year Ended
September 30, 2015 | |
From Operations: | |
Net investment income | | $ | 1,633 | | | $ | 29,883 | | |
Net realized gain (loss) | | | 23,133 | | | | 136,813 | | |
Net change in unrealized appreciation (depreciation) | | | (77,040 | ) | | | (387,077 | ) | |
Net decrease in net assets from operations | | | (52,274 | ) | | | (220,381 | ) | |
Distributions to shareholders from: | |
Net investment income—Class I | | | (33,772 | ) | | | (40,156 | ) | |
Net investment income—Class II | | | (216 | ) | | | (322 | ) | |
Net realized gain—Class I | | | (51,276 | ) | | | (197,597 | ) | |
Net realized gain—Class II | | | (556 | ) | | | (2,331 | ) | |
Total distributions to shareholders | | | (85,820 | ) | | | (240,406 | ) | |
From Fund share transactions: | |
Proceeds from shares sold—Class I | | | 172,897 | | | | 426,324 | | |
Proceeds from shares sold—Class II | | | 2,393 | | | | 7,343 | | |
Reinvestment of distributions—Class I | | | 79,111 | | | | 222,510 | | |
Reinvestment of distributions—Class II | | | 685 | | | | 2,373 | | |
Payment for shares redeemed—Class I | | | (400,986 | ) | | | (746,089 | ) | |
Payment for shares redeemed—Class II | | | (5,357 | ) | | | (14,209 | ) | |
Net decrease in net assets from Fund share transactions | | | (151,257 | ) | | | (101,748 | ) | |
Total decrease in net assets | | | (289,351 | ) | | | (562,535 | ) | |
Net assets: | |
Beginning of period | | | 2,983,048 | | | | 3,545,583 | | |
End of period | | $ | 2,693,697 | | | $ | 2,983,048 | | |
Accumulated undistributed net investment income (loss) | | $ | (7,667 | ) | | $ | 17,621 | | |
Fund Share Transactions—Class I: | |
Shares sold | | | 6,748 | | | | 14,543 | | |
Shares issued in reinvestment of dividends | | | 2,932 | | | | 7,626 | | |
Less shares redeemed | | | (15,664 | ) | | | (25,634 | ) | |
Net decrease in shares outstanding | | | (5,984 | ) | | | (3,465 | ) | |
Fund Share Transactions—Class II: | |
Shares sold | | | 97 | | | | 255 | | |
Shares issued in reinvestment of dividends | | | 26 | | | | 83 | | |
Less shares redeemed | | | (209 | ) | | | (492 | ) | |
Net decrease in shares outstanding | | | (86 | ) | | | (154 | ) | |
See accompanying Notes to Financial Statements.
Oakmark.com 51
Oakmark Funds
Statements of Changes in Net Assets (continued)
(in thousands)
| | | Oakmark Global Select Fund | |
| | | Six Months Ended
March 31, 2016
(Unaudited) | | Year Ended
September 30, 2015 | |
From Operations: | |
Net investment income | | $ | 432 | | | $ | 14,407 | | |
Net realized gain (loss) | | | 13,200 | | | | 148,153 | | |
Net change in unrealized appreciation (depreciation) | | | 46,657 | | | | (246,659 | ) | |
Net increase (decrease) in net assets from operations | | | 60,289 | | | | (84,099 | ) | |
Distributions to shareholders from: | |
Net investment income—Class I | | | (17,056 | ) | | | (16,577 | ) | |
Net realized gain—Class I | | | (100,960 | ) | | | (90,353 | ) | |
Total distributions to shareholders | | | (118,016 | ) | | | (106,930 | ) | |
From Fund share transactions: | |
Proceeds from shares sold—Class I | | | 427,341 | | | | 722,485 | | |
Reinvestment of distributions—Class I | | | 105,014 | | | | 89,569 | | |
Payment for shares redeemed—Class I | | | (382,494 | ) | | | (524,922 | ) | |
Net increase in net assets from Fund share transactions | | | 149,861 | | | | 287,132 | | |
Total increase in net assets | | | 92,134 | | | | 96,103 | | |
Net assets: | |
Beginning of period | | | 2,033,395 | | | | 1,937,292 | | |
End of period | | $ | 2,125,529 | | | $ | 2,033,395 | | |
Accumulated undistributed net investment income | | $ | 2,461 | | | $ | 15,107 | | |
Fund Share Transactions—Class I: | |
Shares sold | | | 27,960 | | | | 43,998 | | |
Shares issued in reinvestment of dividends | | | 6,815 | | | | 5,588 | | |
Less shares redeemed | | | (25,607 | ) | | | (32,188 | ) | |
Net increase in shares outstanding | | | 9,168 | | | | 17,398 | | |
See accompanying Notes to Financial Statements.
52 OAKMARK FUNDS
Oakmark Funds
Statements of Changes in Net Assets (continued)
(in thousands)
| | | Oakmark International Fund | |
| | | Six Months Ended
March 31, 2016
(Unaudited) | | Year Ended
September 30, 2015 | |
From Operations: | |
Net investment income | | $ | 51,724 | | | $ | 528,081 | | |
Net realized gain (loss) | | | (216,441 | ) | | | 1,052,652 | | |
Net change in unrealized appreciation (depreciation) | | | 783,437 | | | | (4,335,228 | ) | |
Net increase (decrease) in net assets from operations | | | 618,720 | | | | (2,754,495 | ) | |
Distributions to shareholders from: | |
Net investment income—Class I | | | (585,096 | ) | | | (571,149 | ) | |
Net investment income—Class II | | | (10,674 | ) | | | (9,359 | ) | |
Net realized gain—Class I | | | (688,352 | ) | | | (1,205,922 | ) | |
Net realized gain—Class II | | | (15,185 | ) | | | (24,101 | ) | |
Total distributions to shareholders | | | (1,299,307 | ) | | | (1,810,531 | ) | |
From Fund share transactions: | |
Proceeds from shares sold—Class I | | | 4,557,477 | | | | 8,287,329 | | |
Proceeds from shares sold—Class II | | | 102,785 | | | | 292,692 | | |
Reinvestment of distributions—Class I | | | 1,064,599 | | | | 1,429,773 | | |
Reinvestment of distributions—Class II | | | 16,780 | | | | 21,706 | | |
Payment for shares redeemed—Class I | | | (5,418,085 | ) | | | (9,090,166 | ) | |
Payment for shares redeemed—Class II | | | (96,826 | ) | | | (200,572 | ) | |
Net increase in net assets from Fund share transactions | | | 226,730 | | | | 740,762 | | |
Total decrease in net assets | | | (453,857 | ) | | | (3,824,264 | ) | |
Net assets: | |
Beginning of period | | | 26,474,252 | | | | 30,298,516 | | |
End of period | | $ | 26,020,395 | | | $ | 26,474,252 | | |
Accumulated undistributed net investment income | | $ | 53,519 | | | $ | 655,480 | | |
Fund Share Transactions—Class I: | |
Shares sold | | | 221,372 | | | | 341,575 | | |
Shares issued in reinvestment of dividends | | | 50,146 | | | | 60,636 | | |
Less shares redeemed | | | (258,213 | ) | | | (377,963 | ) | |
Net increase in shares outstanding | | | 13,305 | | | | 24,248 | | |
Fund Share Transactions—Class II: | |
Shares sold | | | 4,839 | | | | 11,962 | | |
Shares issued in reinvestment of dividends | | | 786 | | | | 915 | | |
Less shares redeemed | | | (4,602 | ) | | | (8,249 | ) | |
Net increase in shares outstanding | | | 1,023 | | | | 4,628 | | |
See accompanying Notes to Financial Statements.
Oakmark.com 53
Oakmark Funds
Statements of Changes in Net Assets (continued)
(in thousands)
| | | Oakmark International Small Cap Fund | |
| | | Six Months Ended
March 31, 2016
(Unaudited) | | Year Ended
September 30, 2015 | |
From Operations: | |
Net investment income | | $ | 44,542 | | | $ | 36,470 | | |
Net realized gain (loss) | | | 34,370 | | | | 126,323 | | |
Net change in unrealized appreciation (depreciation) | | | (64,602 | ) | | | (275,003 | ) | |
Net increase (decrease) in net assets from operations | | | 14,310 | | | | (112,210 | ) | |
Distributions to shareholders from: | |
Net investment income—Class I | | | (68,535 | ) | | | (47,555 | ) | |
Net investment income—Class II | | | (38 | ) | | | (37 | ) | |
Net realized gain—Class I | | | (67,833 | ) | | | (166,420 | ) | |
Net realized gain—Class II | | | (44 | ) | | | (172 | ) | |
Total distributions to shareholders | | | (136,450 | ) | | | (214,184 | ) | |
From Fund share transactions: | |
Proceeds from shares sold—Class I | | | 337,505 | | | | 1,078,421 | | |
Proceeds from shares sold—Class II | | | 156 | | | | 744 | | |
Reinvestment of distributions—Class I | | | 123,630 | | | | 188,923 | | |
Reinvestment of distributions—Class II | | | 48 | | | | 86 | | |
Payment for shares redeemed—Class I | | | (609,338 | ) | | | (999,898 | ) | |
Payment for shares redeemed—Class II | | | (400 | ) | | | (1,892 | ) | |
Redemption fees—Class I | | | 214 | | | | 652 | | |
Redemption fees—Class II | | | 0 | (a) | | | 1 | | |
Net increase (decrease) in net assets from Fund share transactions | | | (148,185 | ) | | | 267,037 | | |
Total decrease in net assets | | | (270,325 | ) | | | (59,357 | ) | |
Net assets: | |
Beginning of period | | | 2,853,890 | | | | 2,913,247 | | |
End of period | | $ | 2,583,565 | | | $ | 2,853,890 | | |
Accumulated undistributed net investment income | | $ | 19,171 | | | $ | 41,384 | | |
Fund Share Transactions—Class I: | |
Shares sold | | | 24,400 | | | | 68,068 | | |
Shares issued in reinvestment of dividends | | | 8,875 | | | | 12,799 | | |
Less shares redeemed | | | (44,014 | ) | | | (63,512 | ) | |
Net increase (decrease) in shares outstanding | | | (10,739 | ) | | | 17,355 | | |
Fund Share Transactions—Class II: | |
Shares sold | | | 11 | | | | 47 | | |
Shares issued in reinvestment of dividends | | | 3 | | | | 6 | | |
Less shares redeemed | | | (28 | ) | | | (121 | ) | |
Net decrease in shares outstanding | | | (14 | ) | | | (68 | ) | |
(a) Amount rounds to less than $1,000.
See accompanying Notes to Financial Statements.
54 OAKMARK FUNDS
Oakmark Funds
Notes to Financial Statements
1. SIGNIFICANT ACCOUNTING POLICIES
Organization
The following are the significant accounting policies of Oakmark Fund ("Oakmark"), Oakmark Select Fund ("Select"), Oakmark Equity and Income Fund ("Equity and Income"), Oakmark Global Fund ("Global"), Oakmark Global Select Fund ("Global Select"), Oakmark International Fund ("International"), and Oakmark International Small Cap Fund ("Int'l Small Cap"), collectively referred to as the "Funds," each a series of Harris Associates Investment Trust (the "Trust"), a Massachusetts business trust, organized on February 1, 1991, which is registered as an open-end management investment company under the Investment Company Act of 1940, as amended (the "1940 Act") and accordingly follows the investment company accounting and reporting guidance of the Financial Accounting Standards Board ("FASB") Accounting Standards Codification Topic 946 Financial Services—Investment Companies. Each Fund, other than Select and Global Select, is diversified in accordance with the 1940 Act. The following policies are in conformity with accounting principles generally accepted in the United States of America ("GAAP"). The presentation of financial statements in conformity with GAAP requires management to make estimates and assumptions that affect the reported amounts of assets and liabilities at the date of the financial statements and the reported amounts of revenues and expenses during the reporting period. Actual results could differ from those estimates and assumptions.
Class disclosure
Each Fund offers two classes of shares: Class I Shares and Class II Shares. Class I Shares are offered to the general public. Class II Shares are offered to certain retirement plans such as 401(k) and profit sharing plans. Class II Shares pay a service fee at the annual rate of up to 0.25% of average net assets of Class II Shares of the Funds. This service fee is paid to a third-party administrator for performing the services associated with the administration of such retirement plans. Class I Shares do not have such an associated service fee. Global Select had no outstanding Class II shares during the six-month period ended March 31, 2016.
Income, realized and unrealized capital gains and losses, and expenses of the Funds not directly attributable to a specific class of shares are allocated to each class pro rata based on the relative net assets of each class. Transfer and dividend disbursing agent fees and other shareholder servicing fees are specific to each class.
Redemption fees
Int'l Small Cap imposes a short-term trading fee on redemptions of shares held for 90 days or less to help offset two types of costs to the Fund caused by abusive trading: portfolio transaction and market impact costs associated with erratic redemption activity and administrative costs associated with processing redemptions. The fee is paid to the Fund and is 2% of the redemption value and is deducted from either the redemption proceeds or from the balance in the account. The "first-in, first-out" ("FIFO") method is used to determine the holding period. The Fund may approve the waiver of redemption fees on certain types of accounts held through intermediaries, pursuant to the Fund's policies and procedures. Redemption fees collected by the Fund, if any, are included in the Statements of Changes in Net Assets.
Security valuation
The Funds' share prices or net asset values ("NAVs") are calculated as of the close of regular session trading (usually 4:00 pm Eastern time) on the New York Stock Exchange ("NYSE") on any day on which the NYSE is open for trading. Equity securities principally traded on securities exchanges in the United States and over-the-counter securities are valued at the last sales price or the official closing price on the day of valuation, or lacking any reported sales that day, at the most recent bid quotation. Securities traded on the NASDAQ National Market System are valued at the NASDAQ Official Closing Price ("NOCP"), or lacking an NOCP, at the most recent bid quotation on the NASDAQ National Market System. Equity securities principally traded on securities exchanges outside the United States are valued, depending on local convention or regulation, at the last sales price, the last bid or asked price, the mean between the last bid and asked prices, or the official closing price, or are based on a pricing composite as of the close of the regular trading hours on the appropriate exchange or other designated time. Each long-term debt instrument is valued at the latest bid quotation or an evaluated price provided by an independent pricing service. The pricing service may use standard inputs such as benchmark yields, reported trades, broker/dealer quotes, issuer spreads, two-sided markets, benchmark securities, bids, offers, and reference data including market research publications. For certain security types additional inputs may be used or some of the standard inputs may not be applicable. Additionally, the pricing service monitors market indicators and industry and economic events, which may serve as a trigger to gather and possibly use additional market data. Each short-term debt instrument (i.e., debt instruments whose maturities or expiration dates at the time of acquisition are one year or less) or money market instrument maturing in 61 days or more from the date of valuation is valued at the latest bid quotation or an evaluated price provided by an independent pricing service. Each short-term instrument maturing in 60 days or less from the date of valuation is valued at amortized cost, which approximates market value. Options are valued at the last reported sales price on the day of valuation or, lacking any reported sale price on the valuation date, at the mean of the most recent bid and asked quotations or, if the mean is not available, at the most recent bid quotation.
Securities for which quotations are not readily available or securities that may have been affected by a significant event occurring between the close of a foreign market and the close of the NYSE are valued at fair value, determined by or under the direction of the pricing committee authorized by the Board of Trustees. A significant event may include the performance of U.S. markets since the close of foreign markets. The Funds may use a systematic fair valuation model provided by an independent pricing service to value foreign securities in order to adjust local closing prices for information or events that may occur between the close of certain foreign exchanges and the close of the NYSE.
Oakmark.com 55
Oakmark Funds
Notes to Financial Statements (continued)
Fair value measurement
Various inputs are used in determining the value of each Fund's investments. These inputs are prioritized into three broad levels as follows:
Level 1—quoted prices in active markets for identical securities
Level 2—other significant observable inputs (including quoted prices for similar investments, interest rates, prepayment speeds, credit risk, and others)
Level 3—significant unobservable inputs (including the Adviser's own assumptions in determining the fair value of investments)
Observable inputs are those based on market data obtained from independent sources, and unobservable inputs reflect the Adviser's own assumptions based on the best information available. The input levels are not necessarily an indication of risk or liquidity associated with investing in those securities.
The Funds recognize transfers between level 1 and level 2 at the end of the reporting cycle. At March 31, 2016, there were no transfers between levels.
The following is a summary of the inputs used as of March 31, 2016 in valuing each Fund's assets and liabilities. Except for the industries or investment types separately stated below, the total amounts for common stocks, fixed-income and short-term investments in the table below are presented by industry or investment type in each Fund's Schedule of Investments. Information on forward foreign currency contracts is presented by contract in the notes following the below summary:
(in thousands) | | Quoted Prices
in Active
Markets for
Identical
Assets
(Level 1) | | Other
Significant
Observable
Inputs
(Level 2) | | Significant
Unobservable
Inputs
(Level 3) | |
Oakmark | | | | | | | | | | | | | |
Common Stocks | | $ | 14,853,658 | | | $ | 0 | | | $ | 0 | | |
Short Term Investments | | | 0 | | | | 594,628 | | | | 0 | | |
Total | | $ | 14,853,658 | | | $ | 594,628 | | | $ | 0 | | |
Select | | | | | | | | | | | | | |
Common Stocks | | $ | 4,858,593 | | | $ | 0 | | | $ | 0 | | |
Preferred Stocks | | | 7,596 | | | | 0 | | | | 0 | | |
Convertible Bond | | | 0 | | | | 153,055 | | | | 0 | | |
Corporate Bonds | | | 0 | | | | 85,750 | | | | 0 | | |
Short Term Investments | | | 0 | | | | 211,282 | | | | 0 | | |
Total | | $ | 4,866,189 | | | $ | 450,087 | | | $ | 0 | | |
Equity and Income | | | | | | | | | | | | | |
Common Stocks | | $ | 10,780,499 | | | $ | 0 | | | $ | 0 | | |
Government and Agency Securities | | | 0 | | | | 1,547,243 | | | | 0 | | |
Corporate Bonds | | | 0 | | | | 1,872,170 | | | | 0 | | |
Asset Backed Securities | | | 0 | | | | 11,452 | | | | 0 | | |
Short Term Investments | | | 0 | | | | 2,769,296 | | | | 0 | | |
Total | | $ | 10,780,499 | | | $ | 6,200,161 | | | $ | 0 | | |
Global | | | | | | | | | | | | | |
Common Stocks | | $ | 2,640,092 | | | $ | 0 | | | $ | 0 | | |
Short Term Investments | | | 0 | | | | 58,139 | | | | 0 | | |
Forward Foreign Currency Contracts - Liabilities | | | 0 | | | | (3,152 | ) | | | 0 | | |
Total | | $ | 2,640,092 | | | $ | 54,987 | | | $ | 0 | | |
Global Select | | | | | | | | | | | | | |
Common Stocks | | $ | 2,054,685 | | | $ | 0 | | | $ | 0 | | |
Short Term Investments | | | 0 | | | | 67,942 | | | | 0 | | |
Forward Foreign Currency Contracts - Assets | | | 0 | | | | 0 | | | | 0 | | |
Forward Foreign Currency Contracts - Liabilities | | | 0 | | | | (2,702 | ) | | | 0 | | |
Total | | $ | 2,054,685 | | | $ | 65,240 | | | $ | 0 | | |
56 OAKMARK FUNDS
Oakmark Funds
Notes to Financial Statements (continued)
(in thousands) | | Quoted Prices
in Active
Markets for
Identical
Assets
(Level 1) | | Other
Significant
Observable
Inputs
(Level 2) | | Significant
Unobservable
Inputs
(Level 3) | |
International | | | | | | | | | | | | | |
Common Stocks | | $ | 25,026,946 | | | $ | 0 | | | $ | 0 | | |
Short Term Investments | | | 0 | | | | 804,726 | | | | 0 | | |
Forward Foreign Currency Contracts - Liabilities | | | 0 | | | | (24,507 | ) | | | 0 | | |
Total | | $ | 25,026,946 | | | $ | 780,219 | | | $ | 0 | | |
Int'l Small Cap | | | | | | | | | | | | | |
Common Stocks | | $ | 2,487,457 | | | $ | 0 | | | $ | 0 | | |
Short Term Investments | | | 0 | | | | 76,276 | | | | 0 | | |
Forward Foreign Currency Contracts - Liabilities | | | 0 | | | | (3,110 | ) | | | 0 | | |
Total | | $ | 2,487,457 | | | $ | 73,166 | | | $ | 0 | | |
Offsetting assets and liabilities
Accounting Standards Codification 210 requires entities to disclose gross and net information about instruments and transactions eligible for offset on the Statement of Assets and Liabilities, and disclose instruments and transactions subject to master netting or similar agreements. This disclosure is limited to derivative instruments, repurchase and reverse repurchase agreements, and securities borrowing and lending transactions.
At March 31, 2016, certain Funds held open forward foreign currency contracts that were subject to a foreign exchange settlement and netting agreement with the same counterparty. The agreement includes provisions for general obligations, representations and certain events of default or termination. The agreement includes provisions for netting arrangements that may reduce credit risk and counterparty risk associated with relevant transactions, in the event a counterparty fails to meet its obligations. The net recognized assets or liabilities related to open forward foreign currency contracts are presented in the Statements of Assets and Liabilities. The gross recognized assets (appreciation) and liabilities (depreciation) by contract are presented in the table included in the Forward foreign currency contracts section of Note 1 to Financial Statements.
At March 31, 2016, each Fund held investments in repurchase agreements. The gross value of these investments and the value of the related collateral are presented in each Fund's Schedule of Investments. The value of the related collateral for each Fund exceeded the value of the repurchase agreements held at period end.
The value of the securities on loan and the value of the related collateral as of period end, if any, are included in the Securities lending section of Note 1 to Financial Statements.
Foreign currency translations
Certain Funds invest in foreign securities, which may involve a number of risk factors and special considerations not present with investments in securities of U.S. corporations. Values of investments and other assets and liabilities denominated in foreign currencies are translated into U.S. dollars at current exchange rates obtained by a recognized bank, dealer, or independent pricing service on the day of valuation. Purchases and sales of investments and dividend and interest income are converted at the prevailing rate of exchange on the respective dates of such transactions.
The Funds do not isolate that portion of the results of operations resulting from changes in foreign exchange rates on investments from the fluctuations arising from changes in market prices of securities held. Such fluctuations are included in net realized gain (loss) on investments and net change in unrealized appreciation (depreciation) on investments in the Statements of Operations. Net realized gains and losses on foreign currency transactions arising from the sale of foreign currencies, currency gains or losses realized between the trade and settlement dates on securities transactions and the difference between the amounts of dividends, interest and tax reclaims recorded and the U.S. dollar equivalent of the amounts actually received or paid are included in net realized gain (loss) on foreign currency transactions in the Statements of Operations. Unrealized gains and losses arising from changes in the fair value of assets and liabilities, other than investments in securities, resulting from changes in exchange rates are included in net change in unrealized appreciation (depreciation) on foreign currency translation in the Statements of Operations.
Forward foreign currency contracts
Forward foreign currency contracts are agreements to exchange one currency for another at a future date and at a specified price. The Funds' transactions in forward foreign currency contracts are limited to transaction and portfolio hedging. The contractual amounts of forward foreign currency contracts do not necessarily represent the amounts potentially subject to risk. The measurement of the risks associated with these instruments is meaningful only when all related and offsetting transactions are considered and could exceed the net unrealized value shown in the tables below. Risks arise from the possible inability of counterparties to meet the terms of their contracts and from movements in currency values. Forward foreign currency contracts are valued at the current day's interpolated foreign exchange rates. Unrealized gain or loss on the contracts as measured by the difference between
Oakmark.com 57
Oakmark Funds
Notes to Financial Statements (continued)
the forward foreign exchange rates at the dates of entry into the contracts and the forward rates at the end of the period is included in the Statements of Assets and Liabilities. Realized gains and losses and the net change in unrealized appreciation (depreciation) on forward foreign currency contracts for the period are included in the Statements of Operations.
At March 31, 2016, Global, Global Select, International, and Int'l Small Cap held forward foreign currency contracts, which are considered derivative instruments, each of whose counterparty is State Street Bank and Trust Company ("State Street"), as follows (in thousands):
Global
| | | Local
Contract
Amount | | Settlement
Date | | Valuation at
3/31/16 | | Unrealized
Appreciation/
(Depreciation) | |
Foreign Currency Sold: | | | | | | | | | | | | | |
Australian Dollar | | | 11,804 | | | 12/21/16 | | $ | 8,944 | | | $ | (259 | ) | |
Swiss Franc | | | 102,274 | | | 09/21/16 | | | 107,271 | | | | (2,893 | ) | |
| | | | | | | $ | 116,215 | | | $ | (3,152 | ) | |
During the period ended March 31, 2016 the notional value of forward foreign currency contracts opened for Global were $113,063 and the notional value of settled contracts was $130,890 (in thousands).
Global Select
| | | Local
Contract
Amount | | Settlement
Date | | Valuation at
3/31/16 | | Unrealized
Appreciation/
(Depreciation) | |
Foreign Currency Sold: | | | | | | | | | |
Swiss Franc | | | 95,538 | | | 09/21/16 | | $ | 100,206 | | | $ | (2,702 | ) | |
| | | | | | | $ | 100,206 | | | $ | (2,702 | ) | |
During the period ended March 31, 2016 the notional value of forward foreign currency contracts opened for Global Select were $97,504 and the notional value of settled contracts was $81,746 (in thousands).
International
| | | Local
Contract
Amount | | Settlement
Date | | Valuation at
3/31/16 | | Unrealized
Appreciation/
(Depreciation) | |
Foreign Currency Sold: | | | | | | | | | | | | | |
Australian Dollar | | | 104,415 | | | 12/21/16 | | $ | 79,119 | | | $ | (2,295 | ) | |
Swiss Franc | | | 785,295 | | | 09/21/16 | | | 823,664 | | | | (22,212 | ) | |
| | | | | | | $ | 902,783 | | | $ | (24,507 | ) | |
During the period ended March 31, 2016 the notional value of forward foreign currency contracts opened for International were $878,277 and the notional value of settled contracts was $814,074 (in thousands).
Int'l Small Cap
| | | Local
Contract
Amount | | Settlement
Date | | Valuation at
3/31/16 | | Unrealized
Appreciation/
(Depreciation) | |
Foreign Currency Sold: | | | | | | | | | | | | | |
Australian Dollar | | | 32,220 | | | 12/21/16 | | $ | 24,414 | | | $ | (708 | ) | |
Swiss Franc | | | 84,909 | | | 09/21/16 | | | 89,058 | | | | (2,402 | ) | |
| | | | | | | $ | 113,472 | | | $ | (3,110 | ) | |
During the period ended March 31, 2016 the notional value of forward foreign currency contracts opened for Int'l Small Cap were $110,362 and the notional value of settled contracts was $132,379 (in thousands).
58 OAKMARK FUNDS
Oakmark Funds
Notes to Financial Statements (continued)
Security transactions and investment income
Security transactions are accounted for on the trade date (date the order to buy or sell is executed), and dividend income is recorded on the ex-dividend date, except that certain dividends from foreign securities are recorded as soon as the information becomes available after the ex-dividend date. Interest income and expenses are recorded on an accrual basis. Discount is accreted and premium is amortized on long-term fixed income securities using the yield-to-maturity method. Withholding taxes and tax reclaims on foreign dividends have been provided for in accordance with the Funds' understanding of the applicable country's tax rules and rates. Net realized gains and losses on investments are determined by the specific identification method.
Short sales
Each Fund may sell a security it does not own in anticipation of a decline in the fair value of that security. When a Fund sells a security short, it must borrow the security sold short and deliver it to the broker-dealer through which it made the short sale. A gain, limited to the price at which the Fund sold the security short, or loss, unlimited in size, will be recognized upon the termination of the short sale. Each Fund may sell shares of when-issued securities. Typically, a Fund sells when-issued securities when a company announces a spin-off or re-organization, and the post-spin-off or post-re-organization shares begin trading on a when-issued basis prior to the effective date of the corporate action. A sale of a when-issued security is treated as a short sale for accounting purposes. After the effective date, when shares of the new company are received, any shares sold on a when-issued basis will be delivered to the counterparty. At March 31, 2016 none of the Funds had short sales.
When-issued or delayed-delivery securities
Each Fund may purchase securities on a when-issued or delayed-delivery basis. Although the payment and interest terms of these securities are established at the time a Fund enters into the commitment, the securities may be delivered and paid for a month or more after the date of purchase, when their value may have changed. A Fund makes such commitments only with the intention of actually acquiring the securities, but may sell the securities before the settlement date if the Adviser deems it advisable for investment reasons. At March 31, 2016 none of the Funds held when-issued securities.
Accounting for options
When a Fund writes an option, the premium received by the Fund is recorded as a liability and is subsequently adjusted to the current fair value of the option written. Premiums received from writing options that expire are recorded by the Fund on the expiration date as realized gains from option transactions. The difference between the premium and the amount paid on effecting a closing purchase transaction, including brokerage commissions, is also treated as a realized gain, or if the premium is less than the amount paid for the closing purchase transaction, as a realized loss. If a call option is exercised, the premium is added to the proceeds from the sale of the underlying security or currency in determining whether the Fund has realized a gain or a loss. If a put option is exercised, the premium reduces the cost basis of the security or currency purchased by the Fund. In writing an option, the Fund bears the market risk of an unfavorable change in the price of the security or currency underlying the written option. As the writer of a covered call option on a security, a Fund foregoes, during the option's life, the opportunity to profit from increases in the market value of the security covering the call option above the sum of the premium and the exercise price of the call. Exercise of an option written by the Fund could result in the Fund selling or buying a security or currency at a price different from the current fair value. Options written by the Fund do not give rise to counterparty credit risk, as they obligate the Fund, not its counterparties, to perform.
When a Fund purchases an option, the premium paid by the Fund is recorded as an asset and is subsequently adjusted to the current fair value of the option purchased. Purchasing call options tends to increase the Fund's exposure to the underlying instrument. Purchasing put options tends to decrease the Fund's exposure to the underlying instrument. Premiums paid for purchasing options that expire are treated as realized losses. Premiums paid for purchasing options that are exercised or closed are added to the amounts paid or offset against the proceeds on the underlying security to determine the realized gain or loss. The risks associated with purchasing put and call options are potential loss of the premium paid and, in the instances of OTC derivatives, the failure of the counterparty to honor its obligation under the contract.
Oakmark and Select wrote put options during the period ended March 31, 2016, as follows (in thousands):
Oakmark
| | | Number of
Contracts | | Premiums | |
Options outstanding at September 30, 2015 | | | 0 | | | $ | 0 | | |
Options written | | | 6 | | | | 16,395 | | |
Options exercised | | | (6 | ) | | | (16,395 | ) | |
Options outstanding at March 31, 2016 | | | 0 | | | $ | 0 | | |
Oakmark.com 59
Oakmark Funds
Notes to Financial Statements (continued)
Select
| | | Number of
Contracts | | Premiums | |
Options outstanding at September 30, 2015 | | | 51 | | | $ | 12,393 | | |
Options written | | | 55 | | | | 28,057 | | |
Options expired | | | (51 | ) | | | (13,155 | ) | |
Options bought back | | | (51 | ) | | | (12,393 | ) | |
Options exercised | | | (4 | ) | | | (14,902 | ) | |
Options outstanding at March 31, 2016 | | | 0 | | | $ | 0 | | |
Credit facility
The Trust has a $300 million committed unsecured line of credit and a $200 million uncommitted unsecured discretionary demand line of credit (the "Facility") with State Street. Borrowings under the facility bear interest at 1.25% above the greater of the Federal Funds Effective Rate or LIBOR, as defined in the credit agreement. To maintain the Facility, an annualized commitment fee of 0.18% on the unused committed portion is charged to the Trust. Fees and interest expense, if any, related to the Facility are included in other expenses in the Statements of Operations. There were no borrowings under the Facility during the period ended March 31, 2016.
Expense offset arrangement
State Street serves as custodian of the Funds. State Street's fee may be reduced by credits that are an earnings allowance calculated on the average daily cash balances each Fund maintains with State Street. Credit balances used to reduce the Funds' custodian fees, if any, are reported as a reduction of total expenses in the Statements of Operations. During the period ended March 31, 2016 none of the Funds received an expense offset credit.
Repurchase agreements
Each Fund may invest in repurchase agreements, which are short-term investments whereby the Fund acquires ownership of a debt security and the seller agrees to repurchase the security at a future date at a specified price.
The Funds' custodian receives delivery of the underlying securities collateralizing repurchase agreements. It is the Funds' policy that the value of the collateral be at least equal to 102% of the repurchase price, including interest. Harris Associates L.P. (the "Adviser") is responsible for determining that the value of the collateral is at all times at least equal to 102% of the repurchase price, including interest. Repurchase agreements could involve certain risks in the event of default or insolvency of the counterparty, including possible delays or restrictions upon a Fund's ability to dispose of the underlying securities. At March 31, 2016 all of the Funds held repurchase agreements.
Security lending
Each Fund, except Oakmark, may lend its portfolio securities to broker-dealers and banks. Any such loan must be continuously secured by collateral in cash, cash equivalents or U.S. Treasuries maintained on a current basis in an amount at least equal to the fair value of the securities loaned by the Fund. Collateral is marked to market and monitored daily. The Fund continues to receive the equivalent of the interest or dividends paid by the issuer on the securities loaned and also receives an additional return that may be in the form of a fixed fee or a percentage of the earnings on the collateral. The Fund has the right to call the loan and attempt to obtain the securities loaned at any time on notice of not more than five business days. In the event of bankruptcy or other default of the borrower, the Fund could experience delays in liquidating the loan collateral or recovering the loaned securities and incur expenses related to enforcing its rights. In addition, there could be a decline in the value of the collateral or in the fair value of the securities loaned while the Fund seeks to enforce its rights thereto, and the Fund could experience subnormal levels of income or lack of access to income during that period.
At March 31, 2016 Int'l Small Cap had securities on loan with a value of $23,847,073 and held as collateral for the loans U.S. Treasury securities with a value of $24,943,759.
Restricted securities
Each Fund may invest in restricted securities, which generally are considered illiquid, but such illiquid securities may not comprise more than 15% of the value of a Fund's net assets at the time of investment. The following investments, the sales of which are subject to restrictions on resale under federal securities laws, have been valued in good faith according to the securities valuation procedures established by the Board of Trustees (as stated in the Security valuation section) since their acquisition dates.
At March 31, 2016 Select, Equity and Income and International held the following restricted securities:
Select
Par Value
(000) | | Security
Name | | Acquisition
Date | | Cost
(000) | | Value
(000) | | Percentage of
Net Assets | |
$ | 175,000 | | | Chesapeake Energy Corp. | | 01/13/16 - 03/03/16 | | $ | 78,872 | | | $ | 85,750 | | | | 1.61 | % | |
| | | | | | | | | $ | 85,750 | | | | 1.61 | % | |
60 OAKMARK FUNDS
Oakmark Funds
Notes to Financial Statements (continued)
Equity and Income
Par Value
(000) | | Security
Name | | Acquisition
Date | | Cost
(000) | | Value
(000) | | Percentage of
Net Assets | |
$ | 29,500 | | | 1011778 BC ULC / New Red Finance, Inc. | | 09/24/14 | | $ | 29,500 | | | $ | 30,680 | | | | 0.18 | % | |
| | 40,360 | | | Activision Blizzard, Inc. | | 09/12/13 - 11/13/15 | | | 42,269 | | | | 42,718 | | | | 0.25 | % | |
| | 162,000 | | | Anthem, Inc. | | 02/12/16 - 03/14/16 | | | 161,929 | | | | 161,929 | | | | 0.95 | % | |
| | 240,100 | | | BMW US Capital LLC | | 03/07/16 - 03/28/16 | | | 240,065 | | | | 240,065 | | | | 1.40 | % | |
| | 13,760 | | | CVS Health Corp. | | 10/05/15 | | | 14,853 | | | | 15,607 | | | | 0.09 | % | |
| | 11,450 | | | Cabela's Master Credit Card Trust | | 10/20/11 | | | 11,450 | | | | 11,452 | | | | 0.07 | % | |
| | 300,000 | | | Chevron Corp. | | 02/24/16 - 03/31/16 | | | 299,924 | | | | 299,923 | | | | 1.76 | % | |
| | 37,000 | | | Credit Suisse Group AG | | 12/04/13 - 06/11/14 | | | 37,000 | | | | 35,933 | | | | 0.21 | % | |
| | 25,000 | | | Credit Suisse Group Funding Guernsey, Ltd. | | 12/07/15 | | | 24,956 | | | | 24,862 | | | | 0.15 | % | |
| | 3,950 | | | Dollar Tree, Inc. | | 02/06/15 | | | 3,950 | | | | 4,173 | | | | 0.02 | % | |
| | 28,360 | | | Expedia, Inc. | | 12/01/15 - 02/05/16 | | | 27,895 | | | | 28,403 | | | | 0.17 | % | |
| | 5,590 | | | Glencore Finance Canada, Ltd. | | 06/01/15 - 06/02/15 | | | 5,672 | | | | 5,595 | | | | 0.03 | % | |
| | 8,060 | | | Glencore Funding LLC | | 01/15/15 | | | 8,061 | | | | 8,032 | | | | 0.05 | % | |
| | 10,000 | | | Howard Hughes Corp. | | 09/27/13 | | | 10,000 | | | | 9,850 | | | | 0.06 | % | |
| | 39,400 | | | International Game Technology PLC | | 02/09/15 | | | 39,400 | | | | 39,876 | | | | 0.23 | % | |
| | 100,000 | | | J.P. Morgan Securities LLC | | 11/02/15 - 11/04/15 | | | 99,954 | | | | 99,954 | | | | 0.59 | % | |
| | 50,000 | | | John Deere Capital Co. | | 03/23/16 | | | 49,994 | | | | 49,994 | | | | 0.29 | % | |
| | 75,000 | | | Kellogg Co. | | 03/14/16 - 03/15/16 | | | 74,986 | | | | 74,986 | | | | 0.44 | % | |
| | 16,090 | | | Kraft Heinz Foods Co. | | 02/17/16 - 02/23/16 | | | 16,552 | | | | 16,817 | | | | 0.10 | % | |
| | 1,000 | | | Level 3 Financing, Inc. | | 10/29/15 | | | 1,000 | | | | 1,013 | | | | 0.01 | % | |
| | 30,930 | | | Live Nation Entertainment, Inc. | | 08/15/12 - 01/22/15 | | | 32,084 | | | | 32,339 | | | | 0.19 | % | |
| | 7,595 | | | MSCI, Inc. | | 08/10/15 - 01/14/16 | | | 7,629 | | | | 7,901 | | | | 0.05 | % | |
| | 4,915 | | | Manitowoc Foodservice, Inc. | | 02/05/16 | | | 4,915 | | | | 5,357 | | | | 0.03 | % | |
| | 500,000 | | | MetLife Short Term Funding LLC | | 02/03/16 - 03/29/16 | | | 499,906 | | | | 499,906 | | | | 2.94 | % | |
| | 4,920 | | | Penske Truck Leasing Co., LP /
PTL Finance Corp. | | 06/16/15 | | | 5,029 | | | | 4,996 | | | | 0.03 | % | |
| | 1,500 | | | Post Holdings, Inc. | | 03/12/14 - 08/12/15 | | | 1,545 | | | | 1,603 | | | | 0.01 | % | |
| | 179,485 | | | Schlumberger Holdings Corp. | | 12/10/15 - 03/23/16 | | | 179,420 | | | | 179,833 | | | | 1.06 | % | |
| | 4,425 | | | Schlumberger Investment SA | | 12/16/15 - 01/26/16 | | | 4,435 | | | | 4,437 | | | | 0.03 | % | |
| | 6,885 | | | Scientific Games International, Inc. | | 11/14/14 | | | 6,885 | | | | 7,023 | | | | 0.04 | % | |
| | 4,990 | | | Serta Simmons Bedding LLC | | 09/26/12 - 09/27/12 | | | 4,973 | | | | 5,177 | | | | 0.03 | % | |
| | 8,895 | | | Sirius XM Radio, Inc. | | 03/04/15 - 03/26/15 | | | 9,391 | | | | 9,362 | | | | 0.06 | % | |
| | 9,970 | | | Six Flags Entertainment Corp. | | 12/11/12 | | | 9,990 | | | | 10,244 | | | | 0.06 | % | |
| | 2,950 | | | The Manitowoc Co., Inc. | | 02/08/16 | | | 2,815 | | | | 3,024 | | | | 0.02 | % | |
| | 5,895 | | | The Sun Products Corp. | | 11/16/15 | | | 5,253 | | | | 5,423 | | | | 0.03 | % | |
| | 1,000 | | | Tribune Media Co. | | 06/17/15 | | | 1,000 | | | | 977 | | | | 0.01 | % | |
| | 57,474 | | | Ultra Petroleum Corp. | | 04/11/14 - 10/28/14 | | | 58,349 | | | | 4,122 | | | | 0.02 | % | |
| | 2,530 | | | Universal Health Services, Inc. | | 01/14/16 - 01/19/16 | | | 2,544 | | | | 2,574 | | | | 0.02 | % | |
| | 19,080 | | | Valeant Pharmaceuticals International, Inc. | | 03/13/15 - 04/23/15 | | | 19,340 | | | | 15,073 | | | | 0.09 | % | |
| | 6,885 | | | Wm Wrigley Jr Co. | | 01/19/16 | | | 6,889 | | | | 6,899 | | | | 0.04 | % | |
| | | | | | | | | $ | 2,008,132 | | | | 11.81 | % | |
International
Par Value
(000) | | Security
Name | | Acquisition
Date | | Cost
(000) | | Value
(000) | | Percentage of
Net Assets | |
$ | 200,000 | | | J.P. Morgan Securities LLC | | 10/14/15 - 12/08/15 | | $ | 199,843 | | | $ | 199,871 | | | | 0.77 | % | |
| | | | | | | | | $ | 199,871 | | | | 0.77 | % | |
Oakmark.com 61
Oakmark Funds
Notes to Financial Statements (continued)
Federal income taxes
It is each Fund's policy to comply with the requirements of the Internal Revenue Code applicable to regulated investment companies and to distribute substantially all of its net taxable income, including any net realized gains on investments, to its shareholders. Therefore, no federal income tax provision is required. There is no material liability for unrecognized tax benefits in the accompanying financial statements. Generally, each of the tax years in the four-year period ended September 30, 2014 remains subject to examination by taxing authorities.
2. TRANSACTIONS WITH AFFILIATES
Each Fund has an investment advisory agreement with the Adviser. For management services and facilities furnished, the Adviser receives from each Fund a monthly fee based on that Fund's net assets at the end of the preceding month. Annual fee rates are as follows:
Fund | | Advisory Fees | |
Oakmark
| | 1.00% up to $2 billion;
0.90% on the next $1 billion;
0.80% on the next $2 billion;
0.75% on the next $2.5 billion;
0.675% on the next $2.5 billion;
0.625% on the next $2.5 billion;
0.620% on the next $12.5 billion;
0.615% on the next $10.0 billion; and
0.610% over $35.0 billion | |
Select
| | 1.00% up to $1 billion;
0.95% on the next $500 million;
0.90% on the next $500 million;
0.85% on the next $500 million;
0.80% on the next $2.5 billion;
0.75% on the next $5 billion; and
0.725% over $10 billion | |
Equity and Income
| | 0.75% up to $5 billion;
0.70% on the next $2.5 billion;
0.675% on the next $2.5 billion;
0.65% on the next $2.5 billion;
0.60% on the next $3.5 billion;
0.585% on the next $5 billion;
0.5775% on the next $7 billion; and
0.5725% over $28 billion | |
Fund | | Advisory Fees | |
Global
| | 1.00% up to $2 billion;
0.95% on the next $2 billion;
0.90% on the next $4 billion; and
0.875% over $8 billion | |
Global Select
| | 1.00% up to $2 billion;
0.95% on the next $1 billion;
0.875% on the next $4 billion; and
0.85% over $7 billion | |
International
| | 1.00% up to $2 billion;
0.95% on the next $1 billion;
0.85% on the next $2 billion;
0.825% on the next $2.5 billion;
0.815% on the next $3.5 billion;
0.805% on the next $5.5 billion;
0.80% on the next $6.5 billion;
0.795% on the next $7 billion;
0.790% on the next $5 billion; and
0.785% over $35 billion | |
Int'l Small Cap
| | 1.25% up to $500 million;
1.10% on the next $1 billion;
1.05% on the next $2 billion;
1.025% on the next $1.5 billion; and
1.00% over $5 billion | |
The Adviser is contractually obligated through January 31, 2017 to reimburse each Fund Class to the extent, but only to the extent, that its annualized expenses (excluding taxes, interest, all commissions and other normal charges incident to the purchase and sale of portfolio securities, and extraordinary charges such as litigation costs, but including fees paid to the Adviser) exceed the percent set forth below of average daily net assets of each Fund Class.
Fund | | Class I | | Class II | |
Oakmark | | | 1.50 | % | | | 1.75 | % | |
Select | | | 1.50 | | | | 1.75 | | |
Equity and Income | | | 1.00 | | | | 1.25 | | |
Global | | | 1.75 | | | | 2.00 | | |
Global Select | | | 1.75 | | | | 2.00 | | |
International | | | 2.00 | | | | 2.25 | | |
Int'l Small Cap | | | 2.00 | | | | 2.25 | | |
The Adviser is entitled to recoup from any Fund Class, in any fiscal year through September 30, 2019, amounts reimbursed to that Fund Class, except to the extent that the Fund Class already has paid such recoupment to the Adviser or such recoupment would cause the annual ordinary operating expenses of a Fund Class for that fiscal year to exceed the applicable limit stated above. As of March 31, 2016, there were no amounts subject to recoupment.
The Adviser and the Funds have entered into agreements with financial intermediaries to provide recordkeeping, processing, shareholder communications and other services to customers of the intermediaries and have agreed to compensate the intermediaries for providing those services. Certain of those services would be provided by the Funds if the shares of those customers were registered directly with the Funds' transfer agent. Accordingly, the Funds pay a portion of the intermediary fees pursuant to an
62 OAKMARK FUNDS
Oakmark Funds
Notes to Financial Statements (continued)
agreement with the Adviser that calls for each Fund to pay a portion of the intermediary fees attributable to shares of the Fund held by the intermediary (which generally are a percentage of value of the shares held) not exceeding the lesser of 75% of the fees charged by the intermediary or what the Fund would have paid its transfer agent had each customer's shares been registered directly with the transfer agent instead of held through the intermediary. The Adviser pays the remainder of the fees. The fees incurred by the Funds are reflected as other shareholder servicing fees in the Statements of Operations.
The Independent Trustees of the Trust may participate in the Trust's Deferred Compensation Plan for Independent Trustees. Participants in the plan may elect to defer all or a portion of their compensation. Amounts deferred are retained by the Trust and represent an unfunded obligation of the Trust. The value of a participant's deferral account is determined by reference to the change in value of Class I shares of one or more of the Funds or a money market fund as specified by the participant. Benefits would be payable after a stated number of years or retirement from the Board of Trustees. The accrued obligations of the Funds under the plan are reflected as deferred Trustee compensation in the Statements of Assets and Liabilities. The change in the accrued obligations for the period is included in Trustees fees in the Statements of Operations. The Trust pays the compensation of the Trustees other than those affiliated with the Adviser and all expenses incurred in connection with their services to the Trust. The Trust does not provide any pension or retirement benefits to its Trustees.
The Funds reimburse the Adviser for a portion of the compensation paid to the Funds' Chief Compliance Officer ("CCO"). The CCO expenses incurred by the Funds are included in other expenses in the Statements of Operations.
3. FEDERAL INCOME TAXES
At March 31, 2016 the cost of investments for federal income tax purposes and related composition of unrealized gains and losses for each Fund were as follows (in thousands):
Fund | | Cost of Investments
for Federal Income
Tax Purposes | | Gross Unrealized
Appreciation | | Gross Unrealized
(Depreciation) | | Net Unrealized
Appreciation
(Depreciation) | |
Oakmark | | $ | 11,759,804 | | | $ | 3,964,878 | | | $ | (276,396 | ) | | $ | 3,688,482 | | |
Select | | | 4,059,332 | | | | 1,359,964 | | | | (103,020 | ) | | | 1,256,944 | | |
Equity and Income | | | 13,780,942 | | | | 3,386,118 | | | | (186,400 | ) | | | 3,199,718 | | |
Global | | | 2,540,908 | | | | 394,374 | | | | (237,051 | ) | | | 157,323 | | |
Global Select | | | 2,089,754 | | | | 194,164 | | | | (161,291 | ) | | | 32,873 | | |
International | | | 28,066,655 | | | | 1,542,312 | | | | (3,777,295 | ) | | | (2,234,983 | ) | |
Int'l Small Cap | | | 2,872,202 | | | | 179,455 | | | | (487,924 | ) | | | (308,469 | ) | |
At March 31, 2016 Oakmark, Select and International had post October capital loss deferrals of $84,931, $12,564 and $120,777, respectively (in thousands).
During the six-month period ended March 31, 2016 as permitted under federal income tax regulations, Global Select elected to defer $214 of late year ordinary losses (in thousands).
During the six-month period ended March 31, 2016 International incurred short term unlimited losses of $72,420 (in thousands).
At March 31, 2016 the components of distributable earnings on a tax basis (excluding unrealized appreciation (depreciation)) were as follows (in thousands):
| | | Undistributed
Ordinary Income | | Undistributed Long-
Term Gain | | Total Distributable
Earnings | |
Oakmark | | $ | 45,438 | | | $ | 0 | | | $ | 45,438 | | |
Select | | | 25,138 | | | | 0 | | | | 25,138 | | |
Equity and Income | | | 49,099 | | | | 354,346 | | | | 403,445 | | |
Global | | | 14 | | | | 13,825 | | | | 13,839 | | |
Global Select | | | 0 | | | | 8,811 | | | | 8,811 | | |
International | | | 29,634 | | | | 0 | | | | 29,634 | | |
Int'l Small Cap | | | 27,954 | | | | 27,259 | | | | 55,213 | | |
Oakmark.com 63
Oakmark Funds
Notes to Financial Statements (continued)
During the six-month period ended March 31, 2016 and the year ended September 30, 2015, the tax character of distributions paid was as follows (in thousands):
| | | Period Ended
March 31, 2016 | | Year Ended
September 30, 2015 | |
Fund | | Distributions Paid
from Ordinary
Income | | Distributions Paid
from Long-Term
Capital Gain | | Distributions Paid
from Ordinary
Income | | Distributions Paid
from Long-Term
Capital Gain | |
Oakmark | | $ | 160,387 | | | $ | 80,508 | | | $ | 106,369 | | | $ | 1,038,351 | | |
Select | | | 17,524 | | | | 0 | | | | 0 | | | | 791,681 | | |
Equity and Income | | | 193,832 | | | | 894,987 | | | | 179,672 | | | | 1,624,370 | | |
Global | | | 29,001 | | | | 56,818 | | | | 60,218 | | | | 180,188 | | |
Global Select | | | 14,152 | | | | 103,864 | | | | 43,739 | | | | 63,191 | | |
International | | | 595,881 | | | | 703,426 | | | | 751,912 | | | | 1,058,619 | | |
Int'l Small Cap | | | 68,573 | | | | 67,877 | | | | 47,592 | | | | 166,592 | | |
On March 31, 2016, the Funds had temporary book/tax differences in undistributed earnings that were primarily attributable to trustee deferred compensation expenses, passive foreign investment companies, foreign currency contracts and deferrals of capital losses on wash sales. Temporary differences will reverse over time. The Funds have permanent differences in book/tax undistributed earnings primarily attributable to currency gains and losses, equalization debits, passive foreign investment companies, and distribution re-designations. Permanent differences have been recorded in their respective component of the Analysis of Net Assets.
4. INVESTMENT TRANSACTIONS
For the six-month period ended March 31, 2016, transactions in investment securities (excluding short-term and U.S. Government securities) were as follows (in thousands):
| | | Oakmark | | Select | | Equity and
Income | | Global | | Global
Select | | International | | Int'l
Small Cap | |
Purchases | | $ | 2,190,095 | | | $ | 495,813 | | | $ | 1,584,967 | | | $ | 435,058 | | | $ | 226,313 | | | $ | 6,212,334 | | | $ | 572,755 | | |
Proceeds from sales | | | 3,773,276 | | | | 615,352 | | | | 1,858,157 | | | | 649,138 | | | | 132,791 | | | | 7,156,629 | | | | 746,361 | | |
Purchases at cost and proceeds from sales (in thousands) of long-term U.S. Government securities for the six-month period ended March 31, 2016 were $123,318 and $86,379, respectively, for Equity and Income.
5. INVESTMENTS IN AFFILIATED ISSUERS
Each of the companies listed below was considered to be an affiliate of a Fund because that Fund owned 5% or more of the company's voting securities during all or part of the six-month period ended March 31, 2016. Purchase and sale transactions and dividend and interest income earned during the period on these securities are set forth below (in thousands):
Schedule of Transactions with Affiliated Issuers
Equity and Income
Affiliates | | Shares /
Par Value | | Purchases
(Cost) | | Sales
(Proceeds) | | Dividend
Income | | Interest
Income | | Value
September 30,
2015 | | Value
March 31,
2016 | |
Flowserve Corp. (a) | | | 5,765 | | | $ | 0 | | | $ | 66,217 | | | $ | 2,416 | | | $ | 0 | | | $ | 301,877 | | | $ | 256,013 | | |
TOTALS | | | | $ | 0 | | | $ | 66,217 | | | $ | 2,416 | | | $ | 0 | | | $ | 301,877 | | | $ | 256,013 | | |
64 OAKMARK FUNDS
Oakmark Funds
Notes to Financial Statements (continued)
Schedule of Transactions with Affiliated Issuers
International
Affiliates | | Shares /
Par Value | | Purchases
(Cost) | | Sales
(Proceeds) | | Dividend
Income | | Value
September 30,
2015 | | Value
March 31,
2016 | |
Ashtead Group PLC | | | 34,048 | | | $ | 353,713 | | | $ | 0 | | | $ | 790 | | | $ | 108,338 | | | $ | 422,507 | | |
Bureau Veritas SA | | | 20,504 | | | | 198,927 | | | | 80,625 | | | | 0 | | | | 314,504 | | | | 456,718 | | |
CNH Industrial N.V. | | | 93,721 | | | | 0 | | | | 0 | | | | 0 | | | | 610,015 | | | | 637,203 | | |
EXOR SPA | | | 13,711 | | | | 76,249 | | | | 0 | | | | 0 | | | | 521,020 | | | | 491,451 | | |
G4S PLC | | | 90,311 | | | | 239,484 | | | | 0 | | | | 0 | | | | 59,200 | | | | 247,225 | | |
Meggitt PLC | | | 39,371 | | | | 14,725 | | | | 18,253 | | | | 5,457 | | | | 287,812 | | | | 229,916 | | |
Melco Crown Entertainment Ltd. (a) | | | 21,919 | | | | 47,482 | | | | 125,114 | | | | 17,086 | | | | 366,900 | | | | 361,880 | | |
Nomura Holdings, Inc. | | | 191,072 | | | | 227,361 | | | | 0 | | | | 7,203 | | | | 847,332 | | | | 853,792 | | |
OMRON Corp. | | | 17,817 | | | | 114,418 | | | | 0 | | | | 5,339 | | | | 434,181 | | | | 530,336 | | |
Orica, Ltd. | | | 35,886 | | | | 28,118 | | | | 0 | (b) | | | 14,019 | | | | 352,775 | | | | 422,810 | | |
Prada SPA | | | 135,617 | | | | 23,153 | | | | 0 | | | | 0 | | | | 489,101 | | | | 465,904 | | |
| SKF AB | | | 24,358 | | | | 0 | | | | 0 | | | | 0 | | | | 447,292 | | | | 439,857 | | |
Smiths Group PLC | | | 22,771 | | | | 0 | | | | 0 | | | | 14,094 | | | | 346,190 | | | | 351,903 | | |
TOTALS | | | | $ | 1,323,630 | | | $ | 223,992 | | | $ | 63,988 | | | $ | 5,184,660 | | | $ | 5,911,502 | | |
Schedule of Transactions with Affiliated Issuers
Int'l Small Cap
Affiliates | | Shares /
Par Value | | Purchases
(Cost) | | Sales
(Proceeds) | | Dividend
Income | | Value
September 30,
2015 | | Value
March 31,
2016 | |
Applus Services SA | | | 6,645 | | | $ | 15,419 | | | $ | 0 | | | $ | 0 | | | $ | 48,270 | | | $ | 58,974 | | |
Atea ASA | | | 7,741 | | | | 0 | | | | 0 | | | | 3,110 | | | | 71,149 | | | | 73,902 | | |
Countrywide PLC | | | 11,568 | | | | 26,857 | | | | 0 | | | | 1,636 | | | | 52,838 | | | | 64,066 | | |
Ichiyoshi Securities Co., Ltd. | | | 2,221 | | | | 0 | | | | 0 | | | | 528 | | | | 19,125 | | | | 18,925 | | |
Konecranes OYJ | | | 3,381 | | | | 2,845 | | | | 0 | | | | 3,963 | | | | 81,679 | | | | 80,713 | | |
LSL Property Services PLC | | | 10,416 | | | | 0 | | | | 0 | | | | 1,267 | | | | 53,966 | | | | 43,009 | | |
Morgan Advanced Materials PLC | | | 14,723 | | | | 10,861 | | | | 1,330 | | | | 788 | | | | 52,288 | | | | 48,044 | | |
Outotec OYJ | | | 9,337 | | | | 0 | | | | 0 | | | | 0 | | | | 34,491 | | | | 35,251 | | |
Premier Farnell PLC | | | 20,168 | | | | 0 | | | | 8,166 | | | | 0 | | | | 39,762 | | | | 32,660 | | |
Primary Health Care Ltd. (a) | | | 20,943 | | | | 17,891 | | | | 22,872 | | | | 990 | | | | 59,081 | | | | 60,202 | | |
Saft Groupe SA | | | 1,661 | | | | 3,827 | | | | 0 | | | | 0 | | | | 49,634 | | | | 50,254 | | |
Wajax Corp. | | | 1,162 | | | | 2,970 | | | | 0 | | | | 431 | | | | 15,772 | | | | 15,629 | | |
TOTALS | | | | $ | 80,670 | | | $ | 32,368 | | | $ | 12,713 | | | $ | 578,055 | | | $ | 581,629 | | |
(a) Due to transactions during the six-month period ended March 31, 2016, the company is no longer an affiliate.
(b) Amount rounds to less than $1,000.
6. SUBSEQUENT EVENTS
Management has evaluated the possibility of subsequent events existing in the Funds' financial statements. Management has determined that there are no material events that would require adjustment or disclosure in the Funds' financial statements through the date of the publication of this report.
Oakmark.com 65
Financial Highlights–Class I
For a share outstanding throughout each period
| | | Six Months Ended
March 31, 2016 | | Year Ended September 30 | |
| | | (Unaudited) | | 2015 | | 2014 | | 2013 | | 2012 | | 2011 | |
Net Asset Value, Beginning of Period | | $ | 60.93 | | | $ | 68.46 | | | $ | 59.73 | | | $ | 48.97 | | | $ | 37.87 | | | $ | 38.36 | | |
Income From Investment Operations: | |
Net Investment Income | | | 0.35 | | | | 0.59 | | | | 0.43 | | | | 0.42 | (a) | | | 0.36 | (a) | | | 0.34 | (a) | |
Net Gain (Loss) on Investments
(both realized and unrealized) | | | 2.09 | | | | (3.57 | ) | | | 11.22 | | | | 12.22 | | | | 11.09 | | | | (0.58 | ) | |
Total From Investment Operations | | | 2.44 | | | | (2.98 | ) | | | 11.65 | | | | 12.64 | | | | 11.45 | | | | (0.24 | ) | |
Less Distributions: | |
From Net Investment Income | | | (0.60 | ) | | | (0.42 | ) | | | (0.32 | ) | | | (0.38 | ) | | | (0.35 | ) | | | (0.25 | ) | |
From Capital Gains | | | (0.30 | ) | | | (4.13 | ) | | | (2.60 | ) | | | (1.50 | ) | | | 0.00 | | | | 0.00 | | |
Total Distributions | | | (0.90 | ) | | | (4.55 | ) | | | (2.92 | ) | | | (1.88 | ) | | | (0.35 | ) | | | (0.25 | ) | |
Redemption Fees | | | 0.00 | | | | 0.00 | | | | 0.00 | | | | 0.00 | | | | 0.00 | (b) | | | 0.00 | (b) | |
Net Asset Value, End of Period | | $ | 62.47 | | | $ | 60.93 | | | $ | 68.46 | | | $ | 59.73 | | | $ | 48.97 | | | $ | 37.87 | | |
Total Return | | | 3.99 | % | | | -4.87 | % | | | 20.01 | % | | | 26.75 | % | | | 30.43 | % | | | -0.67 | % | |
Ratios/Supplemental Data: | |
Net Assets, End of Period ($million) | | $ | 15,399.8 | | | $ | 16,445.0 | | | $ | 16,489.4 | | | $ | 10,409.0 | | | $ | 6,738.7 | | | $ | 4,512.5 | | |
Ratio of Expenses to Average Net Assets | | | 0.88 | %† | | | 0.85 | %(c) | | | 0.87 | % | | | 0.95 | % | | | 1.03 | % | | | 1.04 | % | |
Ratio of Net Investment Income to
Average Net Assets | | | 1.07 | %† | | | 0.92 | % | | | 0.76 | % | | | 0.78 | % | | | 0.81 | % | | | 0.82 | % | |
Portfolio Turnover Rate | | | 14 | % | | | 33 | % | | | 25 | % | | | 19 | % | | | 27 | % | | | 18 | % | |
Financial Highlights–Class II
For a share outstanding throughout each period
| | | Six Months Ended
March 31, 2016 | | Year Ended September 30 | |
| | | (Unaudited) | | 2015 | | 2014 | | 2013 | | 2012 | | 2011 | |
Net Asset Value, Beginning of Period | | $ | 60.59 | | | $ | 68.18 | | | $ | 59.58 | | | $ | 48.89 | | | $ | 37.78 | | | $ | 38.32 | | |
Income From Investment Operations: | |
Net Investment Income | | | 0.23 | | | | 0.38 | (a) | | | 0.23 | | | | 0.27 | (a) | | | 0.24 | (a) | | | 0.19 | (a) | |
Net Gain (Loss) on Investments
(both realized and unrealized) | | | 2.08 | | | | (3.56 | ) | | | 11.19 | | | | 12.20 | | | | 11.09 | | | | (0.59 | ) | |
Total From Investment Operations | | | 2.31 | | | | (3.18 | ) | | | 11.42 | | | | 12.47 | | | | 11.33 | | | | (0.40 | ) | |
Less Distributions: | |
From Net Investment Income | | | (0.37 | ) | | | (0.28 | ) | | | (0.22 | ) | | | (0.28 | ) | | | (0.22 | ) | | | (0.14 | ) | |
From Capital Gains | | | (0.30 | ) | | | (4.13 | ) | | | (2.60 | ) | | | (1.50 | ) | | | 0.00 | | | | 0.00 | | |
Total Distributions | | | (0.67 | ) | | | (4.41 | ) | | | (2.82 | ) | | | (1.78 | ) | | | (0.22 | ) | | | (0.14 | ) | |
Redemption Fees | | | 0.00 | | | | 0.00 | | | | 0.00 | | | | 0.00 | | | | 0.00 | (b) | | | 0.00 | (b) | |
Net Asset Value, End of Period | | $ | 62.23 | | | $ | 60.59 | | | $ | 68.18 | | | $ | 59.58 | | | $ | 48.89 | | | $ | 37.78 | | |
Total Return | | | 3.81 | % | | | -5.19 | % | | | 19.64 | % | | | 26.41 | % | | | 30.11 | % | | | -1.07 | % | |
Ratios/Supplemental Data: | |
Net Assets, End of Period ($million) | | $ | 188.1 | | | $ | 194.4 | | | $ | 170.7 | | | $ | 93.8 | | | $ | 36.1 | | | $ | 24.7 | | |
Ratio of Expenses to Average Net Assets | | | 1.21 | %† | | | 1.19 | %(c) | | | 1.18 | % | | | 1.23 | % | | | 1.30 | % | | | 1.45 | % | |
Ratio of Net Investment Income to
Average Net Assets | | | 0.74 | %† | | | 0.57 | % | | | 0.45 | % | | | 0.49 | % | | | 0.54 | % | | | 0.44 | % | |
Portfolio Turnover Rate | | | 14 | % | | | 33 | % | | | 25 | % | | | 19 | % | | | 27 | % | | | 18 | % | |
† Data has been annualized.
(a) Computed using average shares outstanding throughout the period.
(b) Amount rounds to less than $0.01 per share.
(c) Includes interest expense that amounts to less than 0.01%.
66 OAKMARK FUNDS
Financial Highlights–Class I
For a share outstanding throughout each period
| | | Six Months Ended
March 31, 2016 | | Year Ended September 30 | |
| | | (Unaudited) | | 2015 | | 2014 | | 2013 | | 2012 | | 2011 | |
Net Asset Value, Beginning of Period | | $ | 36.79 | | | $ | 44.71 | | | $ | 37.74 | | | $ | 32.33 | | | $ | 25.50 | | | $ | 25.64 | | |
Income From Investment Operations: | |
Net Investment Income (Loss) | | | 0.24 | | | | 0.08 | (a) | | | (0.00 | )(b) | | | 0.04 | | | | 0.04 | | | | 0.04 | (a) | |
Net Gain (Loss) on Investments
(both realized and unrealized) | | | 0.12 | | | | (2.60 | ) | | | 9.14 | | | | 8.40 | | | | 6.85 | | | | (0.12 | ) | |
Total From Investment Operations | | | 0.36 | | | | (2.52 | ) | | | 9.14 | | | | 8.44 | | | | 6.89 | | | | (0.08 | ) | |
Less Distributions: | |
From Net Investment Income | | | (0.12 | ) | | | 0.00 | | | | (0.04 | ) | | | (0.03 | ) | | | (0.06 | ) | | | (0.06 | ) | |
From Capital Gains | | | 0.00 | | | | (5.40 | ) | | | (2.13 | ) | | | (3.00 | ) | | | 0.00 | | | | 0.00 | | |
Total Distributions | | | (0.12 | ) | | | (5.40 | ) | | | (2.17 | ) | | | (3.03 | ) | | | (0.06 | ) | | | (0.06 | ) | |
Redemption Fees | | | 0.00 | | | | 0.00 | | | | 0.00 | | | | 0.00 | | | | 0.00 | (b) | | | 0.00 | (b) | |
Net Asset Value, End of Period | | $ | 37.03 | | | $ | 36.79 | | | $ | 44.71 | | | $ | 37.74 | | | $ | 32.33 | | | $ | 25.50 | | |
Total Return | | | 0.96 | % | | | -6.75 | % | | | 25.03 | % | | | 28.40 | % | | | 27.05 | % | | | -0.34 | % | |
Ratios/Supplemental Data: | |
Net Assets, End of Period ($million) | | $ | 5,287.3 | | | $ | 5,499.3 | | | $ | 6,238.8 | | | $ | 3,944.6 | | | $ | 3,029.5 | | | $ | 2,266.7 | | |
Ratio of Expenses to Average Net Assets | | | 0.97 | %† | | | 0.95 | % | | | 0.95 | % | | | 1.01 | % | | | 1.05 | % | | | 1.07 | % | |
Ratio of Net Investment Income (Loss) to
Average Net Assets | | | 1.23 | %† | | | 0.20 | % | | | (0.03 | )% | | | 0.11 | % | | | 0.11 | % | | | 0.15 | % | |
Portfolio Turnover Rate | | | 9 | % | | | 46 | % | | | 37 | % | | | 24 | % | | | 32 | % | | | 16 | % | |
Financial Highlights–Class II
For a share outstanding throughout each period
| | | Six Months Ended
March 31, 2016 | | Year Ended September 30 | |
| | | (Unaudited) | | 2015 | | 2014 | | 2013 | | 2012 | | 2011 | |
Net Asset Value, Beginning of Period | | $ | 36.31 | | | $ | 44.32 | | | $ | 37.50 | | | $ | 32.21 | | | $ | 25.43 | | | $ | 25.59 | | |
Income From Investment Operations: | |
Net Investment Income (Loss) | | | 0.16 | (a) | | | (0.05 | )(a) | | | (0.18 | ) | | | (0.11 | ) | | | (0.06 | )(a) | | | (0.05 | )(a) | |
Net Gain (Loss) on Investments
(both realized and unrealized) | | | 0.12 | | | | (2.56 | ) | | | 9.13 | | | | 8.40 | | | | 6.84 | | | | (0.11 | ) | |
Total From Investment Operations | | | 0.28 | | | | (2.61 | ) | | | 8.95 | | | | 8.29 | | | | 6.78 | | | | (0.16 | ) | |
Less Distributions: | |
From Capital Gains | | | 0.00 | | | | (5.40 | ) | | | (2.13 | ) | | | (3.00 | ) | | | 0.00 | | | | 0.00 | | |
Total Distributions | | | 0.00 | | | | (5.40 | ) | | | (2.13 | ) | | | (3.00 | ) | | | 0.00 | | | | 0.00 | | |
Redemption Fees | | | 0.00 | | | | 0.00 | | | | 0.00 | | | | 0.00 | | | | 0.00 | (b) | | | 0.00 | (b) | |
Net Asset Value, End of Period | | $ | 36.59 | | | $ | 36.31 | | | $ | 44.32 | | | $ | 37.50 | | | $ | 32.21 | | | $ | 25.43 | | |
Total Return | | | 0.77 | % | | | -7.04 | % | | | 24.66 | % | | | 27.99 | % | | | 26.66 | % | | | -0.63 | % | |
Ratios/Supplemental Data: | |
Net Assets, End of Period ($million) | | $ | 36.4 | | | $ | 36.8 | | | $ | 24.4 | | | $ | 15.0 | | | $ | 11.8 | | | $ | 8.0 | | |
Ratio of Expenses to Average Net Assets | | | 1.33 | %† | | | 1.27 | % | | | 1.23 | % | | | 1.33 | % | | | 1.36 | % | | | 1.38 | % | |
Ratio of Net Investment Income (Loss) to
Average Net Assets | | | 0.87 | %† | | | (0.12 | )% | | | (0.30 | )% | | | (0.21 | )% | | | (0.21 | )% | | | (0.16 | )% | |
Portfolio Turnover Rate | | | 9 | % | | | 46 | % | | | 37 | % | | | 24 | % | | | 32 | % | | | 16 | % | |
† Data has been annualized.
(a) Computed using average shares outstanding throughout the period.
(b) Amount rounds to less than $0.01 per share.
Oakmark.com 67
Oakmark Equity and Income Fund
Financial Highlights–Class I
For a share outstanding throughout each period
| | | Six Months Ended
March 31, 2016 | | Year Ended September 30 | |
| | | (Unaudited) | | 2015 | | 2014 | | 2013 | | 2012 | | 2011 | |
Net Asset Value, Beginning of Period | | $ | 29.98 | | | $ | 33.65 | | | $ | 33.06 | | | $ | 29.09 | | | $ | 25.62 | | | $ | 26.03 | | |
Income From Investment Operations: | |
Net Investment Income | | | 0.15 | | | | 0.36 | | | | 0.29 | | | | 0.28 | | | | 0.25 | | | | 0.26 | | |
Net Gain (Loss) on Investments
(both realized and unrealized) | | | 0.53 | | | | (1.04 | ) | | | 3.02 | | | | 4.68 | | | | 4.07 | | | | (0.45 | ) | |
Total From Investment Operations | | | 0.68 | | | | (0.68 | ) | | | 3.31 | | | | 4.96 | | | | 4.32 | | | | (0.19 | ) | |
Less Distributions: | |
From Net Investment Income | | | (0.34 | ) | | | (0.27 | ) | | | (0.17 | ) | | | (0.27 | ) | | | (0.38 | ) | | | (0.22 | ) | |
From Capital Gains | | | (1.53 | ) | | | (2.72 | ) | | | (2.55 | ) | | | (0.72 | ) | | | (0.47 | ) | | | 0.00 | | |
Total Distributions | | | (1.87 | ) | | | (2.99 | ) | | | (2.72 | ) | | | (0.99 | ) | | | (0.85 | ) | | | (0.22 | ) | |
Net Asset Value, End of Period | | $ | 28.79 | | | $ | 29.98 | | | $ | 33.65 | | | $ | 33.06 | | | $ | 29.09 | | | $ | 25.62 | | |
Total Return | | | 2.33 | % | | | -2.53 | % | | | 10.39 | % | | | 17.63 | % | | | 17.19 | % | | | -0.77 | % | |
Ratios/Supplemental Data: | |
Net Assets, End of Period ($million) | | $ | 16,222.6 | | | $ | 17,285.5 | | | $ | 19,392.7 | | | $ | 18,222.5 | | | $ | 17,889.0 | | | $ | 16,441.0 | | |
Ratio of Expenses to Average Net Assets | | | 0.78 | %† | | | 0.75 | % | | | 0.74 | % | | | 0.77 | % | | | 0.78 | % | | | 0.77 | % | |
Ratio of Net Investment Income to
Average Net Assets | | | 0.95 | %† | | | 1.06 | % | | | 0.85 | % | | | 0.89 | % | | | 0.84 | % | | | 0.93 | % | |
Portfolio Turnover Rate | | | 12 | % | | | 25 | % | | | 18 | % | | | 25 | %(b) | | | 29 | % | | | 47 | % | |
Financial Highlights–Class II
For a share outstanding throughout each period
| | | Six Months Ended
March 31, 2016 | | Year Ended September 30 | |
| | | (Unaudited) | | 2015 | | 2014 | | 2013 | | 2012 | | 2011 | |
Net Asset Value, Beginning of Period | | $ | 29.75 | | | $ | 33.41 | | | $ | 32.83 | | | $ | 28.90 | | | $ | 25.45 | | | $ | 25.85 | | |
Income From Investment Operations: | |
Net Investment Income | | | 0.09 | (a) | | | 0.25 | | | | 0.18 | (a) | | | 0.17 | | | | 0.15 | | | | 0.17 | | |
Net Gain (Loss) on Investments
(both realized and unrealized) | | | 0.53 | | | | (1.03 | ) | | | 3.00 | | | | 4.66 | | | | 4.05 | | | | (0.43 | ) | |
Total From Investment Operations | | | 0.62 | | | | (0.78 | ) | | | 3.18 | | | | 4.83 | | | | 4.20 | | | | (0.26 | ) | |
Less Distributions: | |
From Net Investment Income | | | (0.21 | ) | | | (0.16 | ) | | | (0.05 | ) | | | (0.18 | ) | | | (0.28 | ) | | | (0.14 | ) | |
From Capital Gains | | | (1.53 | ) | | | (2.72 | ) | | | (2.55 | ) | | | (0.72 | ) | | | (0.47 | ) | | | 0.00 | | |
Total Distributions | | | (1.74 | ) | | | (2.88 | ) | | | (2.60 | ) | | | (0.90 | ) | | | (0.75 | ) | | | (0.14 | ) | |
Net Asset Value, End of Period | | $ | 28.63 | | | $ | 29.75 | | | $ | 33.41 | | | $ | 32.83 | | | $ | 28.90 | | | $ | 25.45 | | |
Total Return | | | 2.14 | % | | | -2.84 | % | | | 10.04 | % | | | 17.23 | % | | | 16.82 | % | | | -1.04 | % | |
Ratios/Supplemental Data: | |
Net Assets, End of Period ($million) | | $ | 784.8 | | | $ | 900.7 | | | $ | 1,157.2 | | | $ | 1,211.4 | | | $ | 1,288.0 | | | $ | 1,212.2 | | |
Ratio of Expenses to Average Net Assets | | | 1.13 | %† | | | 1.09 | % | | | 1.05 | % | | | 1.10 | % | | | 1.09 | % | | | 1.09 | % | |
Ratio of Net Investment Income to
Average Net Assets | | | 0.59 | %† | | | 0.71 | % | | | 0.54 | % | | | 0.56 | % | | | 0.53 | % | | | 0.61 | % | |
Portfolio Turnover Rate | | | 12 | % | | | 25 | % | | | 18 | % | | | 25 | %(b) | | | 29 | % | | | 47 | % | |
† Data has been annualized.
(a) Computed using average shares outstanding throughout the period.
(b) The ratio excludes in-kind transactions.
68 OAKMARK FUNDS
Financial Highlights–Class I
For a share outstanding throughout each period
| | | Six Months Ended
March 31, 2016 | | Year Ended September 30 | |
| | | (Unaudited) | | 2015 | | 2014 | | 2013 | | 2012 | | 2011 | |
Net Asset Value, Beginning of Period | | $ | 26.34 | | | $ | 30.34 | | | $ | 29.70 | | | $ | 21.63 | | | $ | 18.81 | | | $ | 20.39 | | |
Income From Investment Operations: | |
Net Investment Income | | | 0.02 | | | | 0.25 | (a) | | | 0.23 | (a) | | | 0.21 | | | | 0.20 | | | | 0.16 | (a) | |
Net Gain (Loss) on Investments
(both realized and unrealized) | | | (0.44 | ) | | | (2.16 | ) | | | 1.71 | | | | 8.23 | | | | 2.62 | | | | (1.65 | ) | |
Total From Investment Operations | | | (0.42 | ) | | | (1.91 | ) | | | 1.94 | | | | 8.44 | | | | 2.82 | | | | (1.49 | ) | |
Less Distributions: | |
From Net Investment Income | | | (0.31 | ) | | | (0.35 | ) | | | (0.75 | ) | | | (0.37 | ) | | | 0.00 | | | | (0.09 | ) | |
From Capital Gains | | | (0.47 | ) | | | (1.74 | ) | | | (0.55 | ) | | | 0.00 | | | | 0.00 | | | | 0.00 | | |
Total Distributions | | | (0.78 | ) | | | (2.09 | ) | | | (1.30 | ) | | | (0.37 | ) | | | 0.00 | | | | (0.09 | ) | |
Redemption Fees | | | 0.00 | | | | 0.00 | | | | 0.00 | | | | 0.00 | (b) | | | 0.00 | (b) | | | 0.00 | (b) | |
Net Asset Value, End of Period | | $ | 25.14 | | | $ | 26.34 | | | $ | 30.34 | | | $ | 29.70 | | | $ | 21.63 | | | $ | 18.81 | | |
Total Return | | | -1.84 | % | | | -6.92 | % | | | 6.70 | % | | | 39.55 | % | | | 14.99 | % | | | -7.38 | % | |
Ratios/Supplemental Data: | |
Net Assets, End of Period ($million) | | $ | 2,665.0 | | | $ | 2,950.8 | | | $ | 3,503.8 | | | $ | 2,880.4 | | | $ | 2,062.8 | | �� | $ | 1,816.9 | | |
Ratio of Expenses to Average Net Assets | | | 1.15 | %† | | | 1.12 | % | | | 1.11 | % | | | 1.13 | % | | | 1.16 | % | | | 1.16 | % | |
Ratio of Net Investment Income to
Average Net Assets | | | 0.12 | %† | | | 0.86 | % | | | 0.76 | % | | | 0.75 | % | | | 0.91 | % | | | 0.70 | % | |
Portfolio Turnover Rate | | | 15 | % | | | 36 | % | | | 31 | % | | | 45 | %(c) | | | 26 | % | | | 29 | %(c) | |
Financial Highlights–Class II
For a share outstanding throughout each period
| | | Six Months Ended
March 31, 2016 | | Year Ended September 30 | |
| | | (Unaudited) | | 2015 | | 2014 | | 2013 | | 2012 | | 2011 | |
Net Asset Value, Beginning of Period | | $ | 25.62 | | | $ | 29.57 | | | $ | 28.98 | | | $ | 21.11 | | | $ | 18.42 | | | $ | 19.97 | | |
Income From Investment Operations: | |
Net Investment Income (Loss) | | | (0.03 | )(a) | | | 0.13 | (a) | | | 0.13 | (a) | | | 0.03 | | | | 0.11 | (a) | | | 0.06 | (a) | |
Net Gain (Loss) on Investments
(both realized and unrealized) | | | (0.44 | ) | | | (2.10 | ) | | | 1.67 | | | | 8.14 | | | | 2.58 | | | | (1.61 | ) | |
Total From Investment Operations | | | (0.47 | ) | | | (1.97 | ) | | | 1.80 | | | | 8.17 | | | | 2.69 | | | | (1.55 | ) | |
Less Distributions: | |
From Net Investment Income | | | (0.18 | ) | | | (0.24 | ) | | | (0.66 | ) | | | (0.30 | ) | | | 0.00 | | | | 0.00 | (b) | |
From Capital Gains | | | (0.47 | ) | | | (1.74 | ) | | | (0.55 | ) | | | 0.00 | | | | 0.00 | | | | 0.00 | | |
Total Distributions | | | (0.65 | ) | | | (1.98 | ) | | | (1.21 | ) | | | (0.30 | ) | | | 0.00 | | | | 0.00 | (b) | |
Redemption Fees | | | 0.00 | | | | 0.00 | | | | 0.00 | | | | 0.00 | (b) | | | 0.00 | (b) | | | 0.00 | (b) | |
Net Asset Value, End of Period | | $ | 24.50 | | | $ | 25.62 | | | $ | 29.57 | | | $ | 28.98 | | | $ | 21.11 | | | $ | 18.42 | | |
Total Return | | | -2.00 | % | | | -7.33 | % | | | 6.35 | % | | | 39.11 | % | | | 14.60 | % | | | -7.75 | % | |
Ratios/Supplemental Data: | |
Net Assets, End of Period ($million) | | $ | 28.7 | | | $ | 32.3 | | | $ | 41.8 | | | $ | 38.9 | | | $ | 33.1 | | | $ | 36.6 | | |
Ratio of Expenses to Average Net Assets | | | 1.50 | %† | | | 1.52 | % | | | 1.45 | % | | | 1.48 | % | | | 1.50 | % | | | 1.55 | % | |
Ratio of Net Investment Income (Loss) to
Average Net Assets | | | (0.23 | )%† | | | 0.46 | % | | | 0.42 | % | | | 0.40 | % | | | 0.55 | % | | | 0.27 | % | |
Portfolio Turnover Rate | | | 15 | % | | | 36 | % | | | 31 | % | | | 45 | %(c) | | | 26 | % | | | 29 | %(c) | |
† Data has been annualized.
(a) Computed using average shares outstanding throughout the period.
(b) Amount rounds to less than $0.01 per share.
(c) The ratio excludes in-kind transactions.
Oakmark.com 69
Oakmark Global Select Fund
Financial Highlights–Class I
For a share outstanding throughout each period
| | | Six Months Ended
March 31, 2016 | | Year Ended September 30 | |
| | | (Unaudited) | | 2015 | | 2014 | | 2013 | | 2012 | | 2011 | |
Net Asset Value, Beginning of Period | | $ | 15.19 | | | $ | 16.63 | | | $ | 15.71 | | | $ | 11.65 | | | $ | 9.96 | | | $ | 10.15 | | |
Income From Investment Operations: | |
Net Investment Income | | | 0.00 | (a) | | | 0.12 | | | | 0.12 | | | | 0.14 | | | | 0.09 | | | | 0.02 | | |
Net Gain (Loss) on Investments
(both realized and unrealized) | | | 0.54 | | | | (0.65 | ) | | | 1.21 | | | | 4.18 | | | | 1.60 | | | | (0.19 | ) | |
Total From Investment Operations | | | 0.54 | | | | (0.53 | ) | | | 1.33 | | | | 4.32 | | | | 1.69 | | | | (0.17 | ) | |
Less Distributions: | |
From Net Investment Income | | | (0.13 | ) | | | (0.14 | ) | | | (0.14 | ) | | | (0.16 | ) | | | 0.00 | | | | (0.02 | ) | |
From Capital Gains | | | (0.74 | ) | | | (0.77 | ) | | | (0.27 | ) | | | (0.10 | ) | | | 0.00 | | | | 0.00 | | |
Total Distributions | | | (0.87 | ) | | | (0.91 | ) | | | (0.41 | ) | | | (0.26 | ) | | | 0.00 | | | | (0.02 | ) | |
Redemption Fees | | | 0.00 | | | | 0.00 | | | | 0.00 | | | | 0.00 | | | | 0.00 | (a) | | | 0.00 | (a) | |
Net Asset Value, End of Period | | $ | 14.86 | | | $ | 15.19 | | | $ | 16.63 | | | $ | 15.71 | | | $ | 11.65 | | | $ | 9.96 | | |
Total Return | | | 3.32 | % | | | -3.44 | % | | | 8.52 | % | | | 37.69 | % | | | 16.97 | % | | | -1.65 | % | |
Ratios/Supplemental Data: | |
Net Assets, End of Period ($million) | | $ | 2,125.5 | | | $ | 2,033.4 | | | $ | 1,937.3 | | | $ | 1,159.8 | | | $ | 555.8 | | | $ | 422.0 | | |
Ratio of Expenses to Average Net Assets | | | 1.15 | %† | | | 1.13 | % | | | 1.13 | % | | | 1.15 | % | | | 1.23 | % | | | 1.24 | % | |
Ratio of Net Investment Income to
Average Net Assets | | | 0.04 | %† | | | 0.70 | % | | | 0.92 | % | | | 1.01 | % | | | 0.72 | % | | | 0.33 | % | |
Portfolio Turnover Rate | | | 7 | % | | | 48 | % | | | 24 | % | | | 36 | % | | | 36 | % | | | 49 | % | |
† Data has been annualized.
(a) Amount rounds to less than $0.01 per share.
70 OAKMARK FUNDS
Oakmark International Fund
Financial Highlights–Class I
For a share outstanding throughout each period
| | | Six Months Ended
March 31, 2016 | | Year Ended September 30 | |
| | | (Unaudited) | | 2015 | | 2014 | | 2013 | | 2012 | | 2011 | |
Net Asset Value, Beginning of Period | | $ | 21.34 | | | $ | 25.01 | | | $ | 25.89 | | | $ | 18.79 | | | $ | 16.13 | | | $ | 18.18 | | |
Income From Investment Operations: | |
Net Investment Income | | | 0.04 | (a) | | | 0.46 | | | | 0.46 | (a) | | | 0.28 | | | | 0.34 | (a) | | | 0.31 | (a) | |
Net Gain (Loss) on Investments
(both realized and unrealized) | | | 0.43 | | | | (2.55 | ) | | | (0.61 | ) | | | 7.26 | | | | 2.45 | | | | (2.20 | ) | |
Total From Investment Operations | | | 0.47 | | | | (2.09 | ) | | | (0.15 | ) | | | 7.54 | | | | 2.79 | | | | (1.89 | ) | |
Less Distributions: | |
From Net Investment Income | | | (0.50 | ) | | | (0.51 | ) | | | (0.44 | ) | | | (0.44 | ) | | | (0.13 | ) | | | (0.16 | ) | |
From Capital Gains | | | (0.58 | ) | | | (1.07 | ) | | | (0.29 | ) | | | 0.00 | | | | 0.00 | | | | 0.00 | | |
Total Distributions | | | (1.08 | ) | | | (1.58 | ) | | | (0.73 | ) | | | (0.44 | ) | | | (0.13 | ) | | | (0.16 | ) | |
Redemption Fees | | | 0.00 | | | | 0.00 | | | | 0.00 | | | | 0.00 | | | | 0.00 | (b) | | | 0.00 | (b) | |
Net Asset Value, End of Period | | $ | 20.73 | | | $ | 21.34 | | | $ | 25.01 | | | $ | 25.89 | | | $ | 18.79 | | | $ | 16.13 | | |
Total Return | | | 2.09 | % | | | -8.98 | % | | | -0.64 | % | | | 40.79 | % | | | 17.40 | % | | | -10.54 | % | |
Ratios/Supplemental Data: | |
Net Assets, End of Period ($million) | | $ | 25,454.6 | | | $ | 25,915.2 | | | $ | 29,759.6 | | | $ | 23,886.0 | | | $ | 8,993.6 | | | $ | 6,920.8 | | |
Ratio of Expenses to Average Net Assets | | | 0.98 | %† | | | 0.95 | % | | | 0.95 | % | | | 0.98 | % | | | 1.06 | % | | | 1.06 | % | |
Ratio of Net Investment Income to
Average Net Assets | | | 0.40 | %† | | | 1.81 | % | | | 1.76 | % | | | 1.58 | % | | | 1.90 | % | | | 1.63 | % | |
Portfolio Turnover Rate | | | 25 | % | | | 48 | % | | | 39 | %(c) | | | 37 | %(c) | | | 38 | % | | | 45 | % | |
Financial Highlights–Class II
For a share outstanding throughout each period
| | | Six Months Ended
March 31, 2016 | | Year Ended September 30 | |
| | | (Unaudited) | | 2015 | | 2014 | | 2013 | | 2012 | | 2011 | |
Net Asset Value, Beginning of Period | | $ | 21.40 | | | $ | 25.07 | | | $ | 25.98 | | | $ | 18.86 | | | $ | 16.18 | | | $ | 18.25 | | |
Income From Investment Operations: | |
Net Investment Income | | | 0.00 | (b) | | | 0.36 | (a) | | | 0.37 | (a) | | | 0.27 | (a) | | | 0.27 | | | | 0.24 | (a) | |
Net Gain (Loss) on Investments
(both realized and unrealized) | | | 0.43 | | | | (2.55 | ) | | | (0.63 | ) | | | 7.23 | | | | 2.47 | | | | (2.20 | ) | |
Total From Investment Operations | | | 0.43 | | | | (2.19 | ) | | | (0.26 | ) | | | 7.50 | | | | 2.74 | | | | (1.96 | ) | |
Less Distributions: | |
From Net Investment Income | | | (0.41 | ) | | | (0.41 | ) | | | (0.36 | ) | | | (0.38 | ) | | | (0.06 | ) | | | (0.11 | ) | |
From Capital Gains | | | (0.58 | ) | | | (1.07 | ) | | | (0.29 | ) | | | 0.00 | | | | 0.00 | | | | 0.00 | | |
Total Distributions | | | (0.99 | ) | | | (1.48 | ) | | | (0.65 | ) | | | (0.38 | ) | | | (0.06 | ) | | | (0.11 | ) | |
Redemption Fees | | | 0.00 | | | | 0.00 | | | | 0.00 | | | | 0.00 | | | | 0.00 | (b) | | | 0.00 | (b) | |
Net Asset Value, End of Period | | $ | 20.84 | | | $ | 21.40 | | | $ | 25.07 | | | $ | 25.98 | | | $ | 18.86 | | | $ | 16.18 | | |
Total Return | | | 1.92 | % | | | -9.31 | % | | | -1.04 | % | | | 40.31 | % | | | 16.99 | % | | | -10.85 | % | |
Ratios/Supplemental Data: | |
Net Assets, End of Period ($million) | | $ | 565.8 | | | $ | 559.1 | | | $ | 538.9 | | | $ | 386.9 | | | $ | 241.4 | | | $ | 204.0 | | |
Ratio of Expenses to Average Net Assets | | | 1.34 | %† | | | 1.33 | % | | | 1.33 | % | | | 1.34 | % | | | 1.39 | % | | | 1.45 | % | |
Ratio of Net Investment Income to
Average Net Assets | | | 0.05 | %† | | | 1.48 | % | | | 1.40 | % | | | 1.20 | % | | | 1.55 | % | | | 1.26 | % | |
Portfolio Turnover Rate | | | 25 | % | | | 48 | % | | | 39 | %(c) | | | 37 | %(c) | | | 38 | % | | | 45 | % | |
† Data has been annualized.
(a) Computed using average shares outstanding throughout the period.
(b) Amount rounds to less than $0.01 per share.
(c) The ratio excludes in-kind transactions.
Oakmark.com 71
Oakmark International Small Cap Fund
Financial Highlights–Class I
For a share outstanding throughout each period
| | | Six Months Ended
March 31, 2016 | | Year Ended September 30 | |
| | | (Unaudited) | | 2015 | | 2014 | | 2013 | | 2012 | | 2011 | |
Net Asset Value, Beginning of Period | | $ | 14.63 | | | $ | 16.38 | | | $ | 17.29 | | | $ | 13.06 | | | $ | 11.56 | | | $ | 13.02 | | |
Income From Investment Operations: | |
Net Investment Income | | | 0.23 | (a) | | | 0.19 | (a) | | | 0.17 | | | | 0.18 | | | | 0.20 | | | | 0.15 | (a) | |
Net Gain (Loss) on Investments
(both realized and unrealized) | | | (0.13 | ) | | | (0.78 | ) | | | (0.53 | ) | | | 4.26 | | | | 1.32 | | | | (1.53 | ) | |
Total From Investment Operations | | | 0.10 | | | | (0.59 | ) | | | (0.36 | ) | | | 4.44 | | | | 1.52 | | | | (1.38 | ) | |
Less Distributions: | |
From Net Investment Income | | | (0.36 | ) | | | (0.26 | ) | | | (0.55 | ) | | | (0.21 | ) | | | (0.02 | ) | | | (0.08 | ) | |
From Capital Gains | | | (0.36 | ) | | | (0.90 | ) | | | 0.00 | | | | 0.00 | | | | 0.00 | (b) | | | 0.00 | | |
Total Distributions | | | (0.72 | ) | | | (1.16 | ) | | | (0.55 | ) | | | (0.21 | ) | | | (0.02 | ) | | | (0.08 | ) | |
Redemption Fees | | | 0.00 | (b) | | | 0.00 | (b) | | | 0.00 | (b) | | | 0.00 | (b) | | | 0.00 | (b) | | | 0.00 | (b) | |
Net Asset Value, End of Period | | $ | 14.01 | | | $ | 14.63 | | | $ | 16.38 | | | $ | 17.29 | | | $ | 13.06 | | | $ | 11.56 | | |
Total Return | | | 0.69 | % | | | -3.70 | % | | | -2.14 | % | | | 34.42 | % | | | 13.15 | % | | | -10.72 | % | |
Ratios/Supplemental Data: | |
Net Assets, End of Period ($million) | | $ | 2,581.9 | | | $ | 2,852.0 | | | $ | 2,910.0 | | | $ | 2,254.1 | | | $ | 1,525.8 | | | $ | 1,328.4 | | |
Ratio of Expenses to Average Net Assets | | | 1.39 | %† | | | 1.35 | % | | | 1.31 | % | | | 1.35 | % | | | 1.41 | % | | | 1.38 | % | |
Ratio of Net Investment Income to
Average Net Assets | | | 3.27 | %† | | | 1.18 | % | | | 1.07 | % | | | 1.23 | % | | | 1.54 | % | | | 1.10 | % | |
Portfolio Turnover Rate | | | 22 | % | | | 46 | % | | | 38 | % | | | 50 | % | | | 33 | % | | | 46 | % | |
Financial Highlights–Class II
For a share outstanding throughout each period
| | | Six Months Ended
March 31, 2016 | | Year Ended September 30 | |
| | | (Unaudited) | | 2015 | | 2014 | | 2013 | | 2012 | | 2011 | |
Net Asset Value, Beginning of Period | | $ | 14.53 | | | $ | 16.26 | | | $ | 17.17 | | | $ | 12.98 | | | $ | 11.50 | | | $ | 12.97 | | |
Income From Investment Operations: | |
Net Investment Income | | | 0.21 | (a) | | | 0.13 | (a) | | | 0.14 | | | | 0.13 | (a) | | | 0.17 | (a) | | | 0.12 | (a) | |
Net Gain (Loss) on Investments
(both realized and unrealized) | | | (0.12 | ) | | | (0.77 | ) | | | (0.54 | ) | | | 4.24 | | | | 1.31 | | | | (1.55 | ) | |
Total From Investment Operations | | | 0.09 | | | | (0.64 | ) | | | (0.40 | ) | | | 4.37 | | | | 1.48 | | | | (1.43 | ) | |
Less Distributions: | |
From Net Investment Income | | | (0.31 | ) | | | (0.19 | ) | | | (0.51 | ) | | | (0.18 | ) | | | 0.00 | | | | (0.04 | ) | |
From Capital Gains | | | (0.36 | ) | | | (0.90 | ) | | | 0.00 | | | | 0.00 | | | | 0.00 | (b) | | | 0.00 | | |
Total Distributions | | | (0.67 | ) | | | (1.09 | ) | | | (0.51 | ) | | | (0.18 | ) | | | 0.00 | (b) | | | (0.04 | ) | |
Redemption Fees | | | 0.00 | (b) | | | 0.00 | (b) | | | 0.00 | (b) | | | 0.00 | (b) | | | 0.00 | (b) | | | 0.00 | (b) | |
Net Asset Value, End of Period | | $ | 13.95 | | | $ | 14.53 | | | $ | 16.26 | | | $ | 17.17 | | | $ | 12.98 | | | $ | 11.50 | | |
Total Return | | | 0.62 | % | | | -4.00 | % | | | -2.42 | % | | | 34.04 | % | | | 12.90 | % | | | -11.09 | % | |
Ratios/Supplemental Data: | |
Net Assets, End of Period ($million) | | $ | 1.7 | | | $ | 1.9 | | | $ | 3.3 | | | $ | 3.5 | | | $ | 2.6 | | | $ | 1.9 | | |
Ratio of Expenses to Average Net Assets | | | 1.71 | %† | | | 1.62 | % | | | 1.62 | % | | | 1.64 | % | | | 1.69 | % | | | 1.72 | % | |
Ratio of Net Investment Income to
Average Net Assets | | | 3.00 | %† | | | 0.85 | % | | | 0.70 | % | | | 0.90 | % | | | 1.34 | % | | | 0.85 | % | |
Portfolio Turnover Rate | | | 22 | % | | | 46 | % | | | 38 | % | | | 50 | % | | | 33 | % | | | 46 | % | |
† Data has been annualized.
(a) Computed using average shares outstanding throughout the period.
(b) Amount rounds to less than $0.01 per share.
72 OAKMARK FUNDS
The Oakmark Funds Disclosure Regarding The Board Of Trustees' October 2015 Approval Of Investment Advisory Contracts As Approved April 27, 2016
Each year, the Board of Trustees (the "Board") of the Oakmark Funds (the "Funds"), including a majority of the Trustees who are not "interested persons" of Harris Associates L.P., the Funds' investment adviser (the "Adviser") or the Funds ("Independent Trustees"), is required by the Investment Company Act of 1940 (the "1940 Act") to determine whether to continue each Fund's investment advisory agreement (each, an "Agreement," and collectively, the "Agreements") with the Adviser. At a meeting held on October 21, 2015, the Board, including all of the Independent Trustees, upon recommendation of the Board's Committee on Contracts (the "Committee"), determined that the continuation of the Agreement for each Fund was in the best interest of the Fund and its shareholders, and approved the continuation of the Agreements through October 31, 2016.
In evaluating the Agreements with respect to each Fund, the Board, including the Independent Trustees, reviewed materials provided by the Adviser in response to questions submitted by the Independent Trustees and counsel that is experienced in Investment Company Act of 1940 matters and that is independent of the Adviser ("Independent Counsel"), and met with senior representatives of the Adviser regarding its personnel, operations and financial condition as they relate to the Funds. In addition, the Board retained an independent data provider to provide performance and expense information for each Fund and for comparable funds.
The Committee leads the Board in its evaluation of the Agreements. The Committee is comprised entirely of Independent Trustees, and more than 75% of the Board is comprised of Independent Trustees. During the last year, the Committee and the Board met multiple times to consider the Agreements. In connection with its deliberations, the Board also considered a broad range of information relevant to the annual contract review that is provided to the Board (including its various standing committees) at meetings throughout the year, including investment performance reports and related portfolio information for each Fund, as well as periodic reports on, among other matters, pricing and valuation; brokerage and execution; compliance; and shareholder and other services provided by the Adviser and its affiliates.
Throughout the process, the Independent Trustees were advised by Independent Counsel and received from Independent Counsel a memorandum discussing the legal standards for their consideration of the proposed continuation of the Agreements. During the course of the year and during their deliberations regarding the annual contract review, the Committee and the Independent Trustees met with Independent Counsel separately from representatives of the Adviser.
In connection with their consideration of each Agreement, the Committee and the Board considered, among other things: (i) the nature, quality and extent of the Adviser's services, (ii) the investment performance of each Fund, as well as performance information for an appropriate market index and a peer group of other mutual funds, (iii) the fees and other expenses paid by each Fund, as well as fee and expense information for comparable funds and separate accounts managed by the Adviser, (iv) the profitability of the Adviser and its affiliates from their relationship with each Fund, (v) whether economies of scale may be realized as the Funds grow and whether fee levels reflect such potential economies of scale for the benefit of each Fund's shareholders, and (vi) other benefits to the Adviser that result from its relationship with each Fund.
Below is a summary of the principal information considered by the Board regarding various factors. In their deliberations, the Independent Trustees did not identify any single factor that was paramount or determinative, and each Independent Trustee may have weighed the information differently. The Board focused on the overall costs and benefits of the Agreements to each Fund and, through the Funds, their shareholders.
1. Nature, Extent and Quality of Services
The Board's consideration of the nature, extent and quality of the Adviser's services to the Funds took into account the knowledge the Board gained during meetings with the Adviser throughout the year. In addition, the Board considered: the Adviser's long-term history of care and conscientiousness in the management of the Funds; the consistency of its investment approach; the qualifications, experience, and capabilities of, and the resources available to, the Adviser's investment and other personnel responsible for managing the Funds; the Adviser's performance as administrator of the Funds; and the Adviser's compliance program. The Board also reviewed the Adviser's resources and key personnel involved in providing investment management services to the Funds, including the time that investment personnel devoted to each Fund and the investment results produced as a result of the Adviser's in-house research. The Board also noted the significant personal investments that the Adviser's personnel have made in the Funds, which serve to further align the interests of the Adviser and its personnel with those of the Funds' shareholders.
2. Investment Performance of the Funds
The Board considered each Fund's investment performance over various time periods, and the performance of a group of comparable funds pursuing broadly similar strategies (the Fund's "Performance Universe") selected by Broadridge Financial Solutions, Inc. ("Broadridge"). Because the Committee commenced its review in June, the performance periods considered by the Board were those ended on April 30, 2015. Where available, the Board considered one-, three-, five-, and ten-year performance. The Board also considered updated performance information at its October meeting at which the Agreements were approved.
Further detail considered by the Board regarding the investment performance of each Fund is set forth below:
Oakmark Fund. The Board considered that the Oakmark Fund outperformed the median annualized returns of its respective Performance Universe during the three-, five- and ten-year periods ending April 30, 2015, but underperformed the median annualized return of its respective Performance Universe during the one-year period ending April 30, 2015.
Oakmark Select Fund. The Board considered that the Oakmark Select Fund outperformed the median annualized returns of its respective Performance Universe during the one-, three-, five-, and ten-year periods ending April 30, 2015.
Oakmark Equity and Income Fund. The Board considered that the Oakmark Equity and Income Fund outperformed the median annualized returns of its respective Performance Universe during the one-, three-, five-, and ten-year periods ending April 30, 2015.
Oakmark.com 73
Oakmark Global Fund. The Board considered that the Oakmark Global Fund outperformed the median annualized returns of its respective Performance Universe during the three-, five-, and ten-year periods ending April 30, 2015, but underperformed the median annualized returns of its respective Performance Universe during the one-year period ending April 30, 2015.
Oakmark Global Select Fund. Noting that the Oakmark Global Select Fund commenced operations in October 2006, the Board considered that the Fund outperformed the median annualized returns of its Performance Universe during all periods presented.
Oakmark International Fund. The Board considered that the Oakmark International Fund outperformed the median annualized returns of its respective Performance Universe during the three-, five- and ten-year periods ending April 30, 2015, but underperformed the median annualized return of its respective Performance Universe during the one-year period ending April 30, 2015.
Oakmark International Small Cap Fund. The Board considered that the Oakmark International Small Cap Fund outperformed the median annualized return of its respective Performance Universe during the one-, five-, and ten-year period ending April 30, 2015, and underperformed the median annualized returns of its respective Performance Universe during the three-year period ending April 30, 2015.
In addition to comparing each Fund's performance to that of its Performance Universe, the Board also considered each Fund's performance compared to that of its benchmark and other comparative data provided by Broadridge, including each Fund's total return and performance relative to risk. In the case of those Funds that had underperformed their Performance Universe, the Board noted that performance, especially short-term performance, is only one of the factors that it deems relevant to its consideration of a Fund's Agreements.
3. Costs of Services Provided and Profits Realized by the Adviser
Using information provided by Broadridge, the Board evaluated each Fund's advisory fee compared to the advisory fee for other mutual funds comparable in size, character and investment strategy (the "Expense Group"), and each Fund's expense ratio compared to that of the Expense Group.
The Board also reviewed the Adviser's advisory fees for comparable institutional separate account clients and subadvised funds (for which the Adviser provides portfolio management services only). The Board considered the appropriateness and reasonableness of any differences between the fees charged to a Fund and any such comparable funds and/or separate accounts, including any breakpoints, and noted the Adviser's explanation that, although in most instances, the fees paid by those other clients were lower than the fees paid by the Funds, the differences reflected the Adviser's significantly greater level of responsibilities and broader scope of services regarding the Funds, and the more extensive regulatory obligations and risks associated with managing the Funds.
The Board also considered the Adviser's costs in serving as the Fund's investment adviser and manager, including costs associated with technology, infrastructure and compliance necessary to manage the Funds. The Board reviewed the Adviser's methodology for allocating costs among the Adviser's lines of business and among the Funds. The Board also considered information regarding the structure of the Adviser's compensation program for portfolio managers, analysts and certain other employees and the relationship of such compensation to the Adviser's ability to attract and retain quality personnel. The Board also considered fall-out benefits received by the Adviser or its affiliates from their relationship with each Fund. Finally, the Board considered the Adviser's profitability analysis, as well as an Investment Management Industry Profitability Analysis prepared by Broadridge. The Board examined the pre-tax profits realized by the Adviser and its affiliates from their relationship with each Fund, as presented in the profitability analyses, as well as the financial condition of the Adviser.
Further detail considered by the Board regarding the management fee rate and expense ratio of each Fund is set forth below:
Oakmark Select Fund, Oakmark Global Fund, Oakmark Global Select Fund and Oakmark International Small Cap Fund. The Board considered that each Fund's management fee rate and total expense ratio are higher than the respective medians of each Fund's Expense Group.
Oakmark Fund and Oakmark Equity and Income Fund. The Board considered that each Fund's management fee rate is higher than the median of the Fund's Expense Group. The Board noted, however, that each Fund's total expense ratio, which reflects the total fees paid by an investor, is lower than the median of each Fund's Expense Group. The Board also considered its negotiation with the Adviser, the result of which was the Adviser's agreement to add additional breakpoints to its investment advisory agreement with the Oakmark Fund to reduce the Adviser's fees at levels that would come into effect as fund assets continue to grow.
Oakmark International Fund. The Board considered that the Fund's management fee and total expense ratio are lower than the respective medians of the Fund's Expense Group.
4. Economies of Scale and Fee Levels Reflecting Those Economies
The Board considered whether each Fund's management fee structure reflects any potential economies of scale that may be realized by the Adviser for the benefit of each Fund's shareholders. The Board reviewed each Agreement, which includes breakpoints that decrease the management fee rate as Fund assets increase. The Board also considered that after negotiations with the Adviser, the Adviser agreed to additional breakpoints for the Oakmark Fund to reduce the Adviser's fees at levels that would come into effect as fund assets continue to grow.
5. Other Benefits Derived from the Relationship with the Funds
The Board also considered other benefits that accrue to the Adviser and its affiliates from their relationship with the Funds. The Board noted that an affiliate of the Adviser serves as the Funds' distributor, without compensation, pursuant to a written agreement the Board evaluates annually.
74 OAKMARK FUNDS
The Board also considered the Adviser's use of a portion of the commissions paid by the Funds on their portfolio brokerage transactions to obtain research products and services benefiting the Funds and/or other clients of the Adviser, and considered the Adviser's assertion that its use of "soft" commission dollars to obtain research products and services was consistent with regulatory requirements.
6. Conclusion
After full consideration of the above factors, as well as other factors that were instructive in evaluating the Agreements, the Board, including all of the Independent Trustees, concluded that approval of the continuation of each Agreement was in the best interests of the respective Fund and its shareholders. In reaching this determination, the Board considered that the nature, extent and quality of the services provided by the Adviser to each Fund were appropriate and consistent with the Fund's Agreement and that each Fund was likely to continue to benefit from services provided under its Agreement with the Adviser; that the Adviser was delivering performance for each Fund that was consistent with the long-term investment strategies being pursued by the Fund, and that the Fund and its shareholders were benefiting from the Adviser's investment management of the Fund; that the management fees paid by each Fund to the Adviser were reasonable in light of the services provided; that the breakpoints in the fee schedule for each Fund allow shareholders to benefit from potential economies of scale that may be achieved by the Adviser; that the profitability of the Adviser's relationship with the Funds appeared to be reasonable in relation to the services performed; and that the benefits accruing to the Adviser and its affiliates by virtue of their relationship with the Funds were reasonable in light of the costs of providing the investment advisory and other services and the benefits accruing to each Fund. The Board's conclusions are based in part on its consideration of materials prepared in connection with the approval or continuance of the Agreements in prior years and on the Board's ongoing regular review of Fund performance and operations throughout the year, in addition to material prepared specifically for the most recent annual review of the Agreements.
Oakmark.com 75
Disclosures and Endnotes
Reporting to Shareholders. The Funds reduce the number of duplicate prospectuses, annual and semi-annual reports your household receives by sending only one copy of each to those addresses shared by two or more accounts. Call the Funds at 1-800-OAKMARK to request individual copies of these documents. The Funds will begin sending individual copies thirty days after receiving your request.
Before investing in any Oakmark Fund, you should carefully consider the Fund's investment objectives, risks, management fees and other expenses. This and other important information is contained in the Funds' prospectus and a Fund's summary prospectus. Please read the prospectus and summary prospectus carefully before investing. For more information, please visit Oakmark.com or call 1-800-OAKMARK (625-6275).
The discussion of the Funds' investments and investment strategy (including current investment themes, the portfolio managers' research and investment process, and portfolio characteristics) represents the Funds' investments and the views of the portfolio managers and Harris Associates L.P., the Funds' investment adviser, at the time of this report, and are subject to change without notice.
All Oakmark Funds: Investing in value stocks presents the risk that value stocks may fall out of favor with investors and underperform growth stocks during given periods.
Oakmark, Oakmark Equity and Income, Oakmark Global, Oakmark International and Oakmark International Small Cap Funds: The Funds' portfolios tend to be invested in a relatively small number of stocks. As a result, the appreciation or depreciation of any one security held will have a greater impact on the Funds' net asset value than it would if the Funds invest in a larger number of securities. Although that strategy has the potential to generate attractive returns over time, it also increases the Funds' volatility.
Oakmark Select Fund: The stocks of medium-sized companies tend to be more volatile than those of large companies and have underperformed the stocks of small and large companies during some periods.
Because the Oakmark Select and Oakmark Global Select Funds are non-diversified, the performance of each holding will have a greater impact on the Funds' total return, and may make the Fund's returns more volatile than a more diversified fund.
Oakmark Global, Oakmark Global Select, Oakmark International and Oakmark International Small Cap Funds: Investing in foreign securities presents risks which in some ways may be greater than U.S. investments. Those risks include: currency fluctuation; different regulation, accounting standards, trading practices and levels of available information; generally higher transaction costs; and political risks.
The percentages of hedge exposure for each foreign currency are calculated by dividing the market value of all same-currency forward contracts by the market value of the underlying equity exposure to that currency.
The Oakmark Equity and Income Fund invests in medium- and lower-quality debt securities that have higher yield potential but present greater investment and credit risk than higher-quality securities. These risks may result in greater share price volatility. Harris Associates L.P., the Fund's adviser, contractually agreed to limit Oakmark Equity and Income Fund's annual expenses to 1% of its average net assets through January 31, 2002. Absent this expense limitation, the Fund's total return would have been lower.
Oakmark International Small Cap Fund: The stocks of smaller companies often involve more risk than the stocks of larger companies. Stocks of small companies tend to be more volatile and have a smaller public market than stocks of larger companies. Small companies may have a shorter history of operations than larger companies, may not have as great an ability to raise additional capital and may have a less diversified product line, making them more susceptible to market pressure.
Endnotes:
1. The Price-Earnings Ratio ("P/E") is the most common measure of the expensiveness of a stock.
2. EBITDA refers to Earnings Before the deduction of payments for Interest, Taxes, Depreciation and Amortization which is a measure of operating income.
3. The Price-Sales Ratio ("P/S") is calculated by dividing the company's market cap by the revenue in the most recent year; or, equivalently, divide the per-share stock price by the per-share revenue.
4. The S&P 500 Total Return Index is a market capitalization-weighted index of 500 large-capitalization stocks commonly used to represent the U.S. equity market. All returns reflect reinvested dividends and capital gains distributions. This index is unmanaged and investors cannot invest directly in this index.
5. The Dow Jones Industrial Average is an index that includes only 30 U.S. blue-chip companies. This index is unmanaged and investors cannot invest directly in this index.
6. The Lipper Large Cap Value Funds Index is an equally-weighted index of the largest 30 funds within the large cap value funds investment objective as defined by Lipper Inc. The index is adjusted for the reinvestment of capital gains and income dividends. This index is unmanaged and investors cannot invest directly in this index.
7. Portfolio holdings are subject to change without notice and are not intended as recommendations of individual stocks.
8. The Lipper Multi-Cap Value Funds Index tracks the results of the 30 largest mutual funds in the Lipper Multi-Cap Value Funds category. This index is unmanaged and investors cannot invest directly in this index.
9. The Lipper Balanced Funds Index measures the performance of the 30 largest U.S. balanced funds tracked by Lipper. This index is unmanaged and investors cannot invest directly in this index.
10. The Barclays U.S. Government / Credit Index is a benchmark index made up of the Barclays U.S. Government and U.S. Corporate Bond indices, including U.S. government Treasury and agency securities as well as corporate and Yankee bonds. This index is unmanaged and investors cannot invest directly in this index.
11. The MSCI World Index (Net) is a free float-adjusted market capitalization weighted index that is designed to measure the global equity market performance of developed markets. This benchmark calculates reinvested dividends net of withholding taxes using Luxembourg tax rates. This index is unmanaged and investors cannot invest directly in this index.
12. The Lipper Global Funds Index measures the performance of the 30 largest mutual funds that invest in securities
76 OAKMARK FUNDS
Disclosures and Endnotes (continued)
throughout the world. This index is unmanaged and investors cannot invest directly in this index.
13. The MSCI World ex U.S. Index (Net) is a free float-adjusted market capitalization index that is designed to measure international developed market equity performance, excluding the U.S. This benchmark calculates reinvested dividends net of withholding taxes using Luxembourg tax rates. This index is unmanaged and investors cannot invest directly in this index.
14. The MSCI EAFE (Europe, Australasia, Far East) Index (Net) is a free float-adjusted market capitalization index that is designed to measure the international equity market performance of developed markets, excluding the U.S. & Canada. This benchmark calculates reinvested dividends net of withholding taxes using Luxembourg tax rates. This index is unmanaged and investors cannot invest directly in this index.
15. The Lipper International Funds Index reflects the net asset value weighted total return of the 30 largest international equity funds. This index is unmanaged and investors cannot invest directly in this index.
16. The MSCI World ex U.S. Small Cap Index (Net) is a free float-adjusted market capitalization index that is designed to measure global developed market equity performance, excluding the U.S. The MSCI Small Cap Indices target 40% of the eligible Small Cap universe within each industry group, within each country. MSCI defines the Small Cap universe as all listed securities that have a market capitalization in the range of USD200-1,500 million. This benchmark calculates reinvested dividends net of withholding taxes using Luxembourg tax rates. This index is unmanaged and investors cannot invest directly in this index.
17. The Lipper International Small Cap Funds Index measures the performance of the 10 largest international small-cap funds tracked by Lipper. This index is unmanaged and investors cannot invest directly in this index.
OAKMARK, OAKMARK FUNDS, OAKMARK INTERNATIONAL, and OAKMARK and tree design are trademarks owned or registered by Harris Associates L.P. in the U.S. and/or other countries.
Oakmark.com 77
Oakmark Funds
Trustees and Officers
Trustees
Allan J. Reich—Chair
Thomas H. Hayden
Christine M. Maki
Laurence C. Morse, Ph. D.
Steven S. Rogers
Kristi L. Rowsell
Burton W. Ruder*
Peter S. Voss
Officers
Kristi L. Rowsell—President and Principal Executive Officer
Robert M. Levy—Executive Vice President
Judson H. Brooks—Vice President
Anthony P. Coniaris—Vice President
Richard J. Gorman—Vice President, Chief Compliance
Officer, Anti-Money Laundering Officer and Assistant Secretary
Kevin G. Grant—Vice President
Heidi W. Hardin—Vice President, Secretary and Chief Legal Officer†
Thomas E. Herman—Principal Financial Officer‡
David G. Herro—Vice President
M. Colin Hudson—Vice President
John J. Kane—Principal Financial Officer#, Treasurer
Chris W. Keller—Vice President
Matthew A. Logan—Vice President‡
Michael L. Manelli—Vice President
Clyde S. McGregor—Vice President
Ian J. McPheron—Vice President
Thomas W. Murray—Vice President
Michael J. Neary—Vice President
William C. Nygren—Vice President
Vineeta D. Raketich—Vice President
Janet L. Reali—Vice President, Secretary and Chief Legal Officer^
Robert A. Taylor—Vice President
Andrew J. Tedeschi—Assistant Treasurer
Edward J. Wojciechowski—Vice President
* Mr. Ruder retired from the Board of Trustees effective December 31, 2015.
† Ms. Hardin assumed her duties effective January 1, 2016.
‡ Messrs. Herman and Logan are no longer officers of the Trust as of February 9, 2016 and May 15, 2016, respectively.
# Mr. Kane assumed his duties effective February 8, 2016.
^ Ms. Reali retired effective December 31, 2015.
Other Information
Investment Adviser
Harris Associates L.P.
111 S. Wacker Drive
Chicago, Illinois 60606-4319
Transfer Agent
Boston Financial Data Services, Inc.
Quincy, Massachusetts
Legal Counsel
K&L Gates LLP
Washington, D.C.
Independent Registered Public Accounting Firm
Deloitte & Touche LLP
Chicago, Illinois
Contact Us
Please call 1-800-OAKMARK
(1-800-625-6275)
or 617-483-8327
Website
Oakmark.com
Twitter
@HarrisOakmark
To obtain a prospectus, an application or periodic reports, access our website at Oakmark.com, or call 1-800-OAKMARK (625-6275) or (617) 483-8327.
Each Fund will file its complete schedule of portfolio holdings with the Securities and Exchange Commission ("SEC") for the first and third quarters of each fiscal year on Form N-Q. The Funds' Form N-Qs are available on the SEC's website at www.sec.gov. The Funds' Form N-Qs may be reviewed and copied at the SEC's Public Reference Room in Washington, DC, and information on the operation of the Public Reference Room may be obtained by calling 1-800-SEC-0330.
A description of the policies and procedures the Funds use to determine how to vote proxies relating to portfolio securities is available without charge, upon request, by calling toll-free 1-800-625-6275; on the Funds' website at Oakmark.com; and on the SEC's website at www.sec.gov.
No later than August 31 of each year, information regarding how the Adviser, on behalf of the Funds, voted proxies relating to the Funds' portfolio securities for the twelve months ended the preceding June 30 will be available through a link on the Funds' website at Oakmark.com and on the SEC's website at www.sec.gov.
This report is submitted for the general information of the shareholders of the Funds. The report is not authorized for distribution to prospective investors in the Funds unless it is accompanied or preceded by a currently effective prospectus of the Funds.
No sales charge to the shareholder or to the new investor is made in offering the shares of the Funds; however, a shareholder of the Oakmark International Small Cap Fund may incur a 2% redemption fee on an exchange or redemption of Class I Shares and Class II Shares held for 90 days or less.
78 OAKMARK FUNDS

This page intentionally left blank.
Oakmark.com

This page intentionally left blank.
OAKMARK FUNDS

This page intentionally left blank.
Oakmark.com


Item 2. Code of Ethics.
Not required in this filing.
Item 3. Audit Committee Financial Expert.
Not required in this filing.
Item 4. Principal Accountant Fees and Services.
Not required in this filing.
Item 5. Audit Committee of Listed Registrants.
Not required in this filing.
Item 6. Investments.
(a) The Schedule of Investments in securities of unaffiliated issuers is included as part of the semi-annual report to shareholders filed under Item 1 of this Form.
(b) No disclosures are required by this Item 6(b).
Item 7. Disclosure of Proxy Voting Policies and Procedures for Closed-End Management Investment Companies.
Not applicable.
Item 8. Portfolio Managers of Closed-End Management Investment Companies.
Not applicable.
Item 9. Purchases of Equity Securities by Closed-End Management Investment Company and Affiliated Purchasers.
Not applicable.
Item 10. Submission of Matters to a Vote of Security Holders.
During the period covered by this report, no amendments were made to the procedures adopted in fiscal year 2007.
Item 11. Controls and Procedures.
(a) Based on an evaluation of the disclosure controls and procedures (as defined in Rule
30a-3(c) under the Investment Company Act of 1940, the “Disclosure Controls”), the Disclosure Controls are effectively designed to ensure that information required to be disclosed by the Registrant in this report is recorded, processed, summarized and reported within 90 days prior to the filing of this report, including ensuring that information required to be disclosed in this report is accumulated and communicated to the Registrant’s management, including the Registrant’s principal executive officer and principal financial officer, as appropriate to allow timely decisions regarding required disclosure.
(b) There were no changes in the Registrant’s internal controls over financial reporting (as defined in Rule 30a-3(d) under the Investment Company Act of 1940) that occurred during the Registrant’s second fiscal quarter of the time period covered by this report that has materially affected, or is reasonably likely to materially affect, the Registrant’s internal control over financial reporting.
Item 12. Exhibits.
(a) | (1) | Not required in this filing. |
| | |
| (2) | Certifications of Kristi L. Rowsell, Principal Executive Officer, and John J. Kane, Principal Financial Officer, pursuant to Rule 30a-2(a) under the Investment Company Act of 1940 (17 CFR 270.30a-2(a)), attached hereto as Exhibits (a)(2)(i) and (a)(2)(ii). |
| | |
| (3) | Not applicable. |
| | |
(b) | | Certifications of Kristi L. Rowsell, Principal Executive Officer and John J. Kane, Principal Financial Officer, pursuant to Section 906 of the Sarbanes-Oxley Act of 2002, attached hereto as Exhibit (b). |
SIGNATURES
Pursuant to the requirements of the Securities Exchange Act of 1934 and the Investment Company Act of 1940, the Registrant has duly caused this report to be signed on its behalf by the undersigned, thereunto duly authorized.
Harris Associates Investment Trust
| | |
By: | /s/ Kristi L. Rowsell | |
| Kristi L. Rowsell | |
| Principal Executive Officer | |
Date: | May 27, 2016 | |
| | |
| | |
Pursuant to the requirements of the Securities Exchange Act of 1934 and the Investment Company Act of 1940, this report has been signed below by the following persons on behalf of the Registrant and in the capacities and on the dates indicated. |
| | |
| | |
By: | /s/ Kristi L. Rowsell | |
| Kristi L. Rowsell | |
| Principal Executive Officer | |
Date: | May 27, 2016 | |
| | |
| | |
By: | /s/ John J. Kane | |
| John J. Kane | |
| Principal Financial Officer | |
Date: | May 27, 2016 | |