UNITED STATES
SECURITIES AND EXCHANGE COMMISSION
Washington, D.C. 20549
FORM N-CSR
CERTIFIED SHAREHOLDER REPORT OF REGISTERED
MANAGEMENT INVESTMENT COMPANIES
Investment Company Act file number | 811-06279 |
|
Harris Associates Investment Trust |
(Exact name of registrant as specified in charter) |
|
111 South Wacker Drive, Suite 4600 Chicago, Illinois | | 60606-4319 |
(Address of principal executive offices) | | (Zip code) |
|
Kristi L. Rowsell Harris Associates L.P. 111 South Wacker Drive, #4600 Chicago, Illinois 60606 | Alan P. Goldberg K&L Gates LLP Three First National Plaza, #3100 Chicago, Illinois 60602 |
(Name and address of agents for service) |
|
Registrant’s telephone number, including area code: | (312) 646-3600 | |
|
Date of fiscal year end: | 9/30/15 | |
|
Date of reporting period: | 3/31/15 | |
| | | | | | | | | |
Item 1. Reports to Shareholders.

OAKMARK FUNDS
SEMI-ANNUAL REPORT | MARCH 31, 2015
OAKMARK FUND
OAKMARK SELECT FUND
OAKMARK EQUITY AND INCOME FUND
OAKMARK GLOBAL FUND
OAKMARK GLOBAL SELECT FUND
OAKMARK INTERNATIONAL FUND
OAKMARK INTERNATIONAL SMALL CAP FUND
Oakmark Funds
2015 Semi-Annual Report
TABLE OF CONTENTS
Fund Expenses | | | 1 | | |
Commentary on Oakmark and Oakmark Select Funds | | | 2 | | |
Oakmark Fund (OAKMX) | |
Summary Information | | | 4 | | |
Portfolio Manager Commentary | | | 5 | | |
Schedule of Investments | | | 6 | | |
Oakmark Select Fund (OAKLX) | |
Summary Information | | | 8 | | |
Portfolio Manager Commentary | | | 9 | | |
Schedule of Investments | | | 10 | | |
Oakmark Equity and Income Fund (OAKBX) | |
Summary Information | | | 12 | | |
Portfolio Manager Commentary | | | 13 | | |
Schedule of Investments | | | 15 | | |
Oakmark Global Fund (OAKGX) | |
Summary Information | | | 20 | | |
Portfolio Manager Commentary | | | 21 | | |
Schedule of Investments | | | 23 | | |
Oakmark Global Select Fund (OAKWX) | |
Summary Information | | | 26 | | |
Portfolio Manager Commentary | | | 27 | | |
Schedule of Investments | | | 28 | | |
Oakmark International Fund (OAKIX) | |
Summary Information | | | 30 | | |
Portfolio Manager Commentary | | | 31 | | |
Schedule of Investments | | | 32 | | |
Oakmark International Small Cap Fund (OAKEX) | |
Summary Information | | | 34 | | |
Portfolio Manager Commentary | | | 35 | | |
Schedule of Investments | | | 36 | | |
Financial Statements | |
Statements of Assets and Liabilities | | | 38 | | |
Statements of Operations | | | 40 | | |
Statements of Changes in Net Assets | | | 42 | | |
Notes to Financial Statements | | | 49 | | |
Financial Highlights | | | 65 | | |
Disclosure Regarding Investment Advisory
Contract Approval | | | 72 | | |
Disclosures and Endnotes | | | 74 | | |
Trustees and Officers | | | 75 | | |
FORWARD-LOOKING STATEMENT DISCLOSURE
One of our most important responsibilities as mutual fund managers is to communicate with shareholders in an open and direct manner. Some of our comments in our letters to shareholders are based on current management expectations and are considered "forward-looking statements". Actual future results, however, may prove to be different from our expectations. You can identify forward-looking statements by words such as "estimate", "may", "will", "expect", "believe",
"plan" and other similar terms. We cannot promise future returns. Our opinions are a reflection of our best judgment at the time this report is compiled, and we disclaim any obligation to update or alter forward-looking statements as a result of new information, future events, or otherwise.
OAKMARK FUNDS
Fund Expenses (Unaudited)
A shareholder of each Fund incurs ongoing costs, including investment advisory fees, transfer agent fees and other Fund expenses. The examples below are intended to help shareholders understand the ongoing costs (in dollars) of investing in each Fund and to compare these costs with the ongoing costs of investing in other funds.
The following table provides information about actual account values and actual Fund expenses as well as hypothetical account values and hypothetical fund expenses for shares of each Fund.
ACTUAL EXPENSES
The following table shows the expenses a shareholder would have paid on a $1,000 investment in each Fund from October 1, 2014 to March 31, 2015, as well as how much a $1,000 investment would be worth at the close of the period, assuming actual Fund returns and expenses. A shareholder can estimate expenses incurred for the period by dividing the account value at March 31, 2015, by $1,000 and multiplying the result by the number in the "Actual—Expenses Paid During Period" column shown below.
Shares of Oakmark International Small Cap Fund, invested for 90 days or less, may be charged a 2% redemption fee upon redemption. Please consult the Funds' prospectus at oakmark.com for more information.
HYPOTHETICAL EXAMPLE FOR COMPARISON PURPOSES
The following table provides information about hypothetical account values and hypothetical expenses for shares of each Fund based on actual expense ratios and an assumed rate of return of 5% per year before expenses, which are not the Funds' actual returns. The hypothetical account values and expenses may not be used to estimate the actual ending account balances or actual expenses shareholders paid for the period. Shareholders may use this information to compare the ongoing costs of investing in a Fund and other funds. To do so, compare this 5% hypothetical example with the 5% hypothetical examples that appear in the shareholder reports of the other funds.
Please note that the expenses shown in the table are meant to highlight your ongoing costs only and do not reflect any transaction costs, such as redemption fees. Therefore, the "Hypothetical—Expenses Paid During Period" column of the table is useful in comparing ongoing costs only and will not help you determine the relative total costs of owning different funds. If these transaction costs were included, the total costs would have been higher.
| | | | | ACTUAL | | HYPOTHETICAL
(5% annual return
before expenses) | | | |
| | | Beginning
Account Value
(10/1/14) | | Ending
Account Value
(3/31/15) | | Expenses
Paid During
Period* | | Ending
Account Value
(3/31/15) | | Expenses
Paid During
Period* | | Annualized
Expense
Ratio | |
Oakmark Fund | |
Class I | | $ | 1,000.00 | | | $ | 1,030.50 | | | $ | 4.30 | | | $ | 1,020.69 | | | $ | 4.28 | | | | 0.85 | % | |
Class II | | $ | 1,000.00 | | | $ | 1,028.80 | | | $ | 6.07 | | | $ | 1,018.95 | | | $ | 6.04 | | | | 1.20 | % | |
Oakmark Select Fund | |
Class I | | $ | 1,000.00 | | | $ | 1,023.80 | | | $ | 4.79 | | | $ | 1,020.19 | | | $ | 4.78 | | | | 0.95 | % | |
Class II | | $ | 1,000.00 | | | $ | 1,022.30 | | | $ | 6.30 | | | $ | 1,018.70 | | | $ | 6.29 | | | | 1.25 | % | |
Oakmark Equity and Income Fund | |
Class I | | $ | 1,000.00 | | | $ | 1,046.90 | | | $ | 3.83 | | | $ | 1,021.19 | | | $ | 3.78 | | | | 0.75 | % | |
Class II | | $ | 1,000.00 | | | $ | 1,045.00 | | | $ | 5.51 | | | $ | 1,019.55 | | | $ | 5.44 | | | | 1.08 | % | |
Oakmark Global Fund | |
Class I | | $ | 1,000.00 | | | $ | 1,052.40 | | | $ | 5.73 | | | $ | 1,019.35 | | | $ | 5.64 | | | | 1.12 | % | |
Class II | | $ | 1,000.00 | | | $ | 1,050.10 | | | $ | 7.72 | | | $ | 1,017.40 | | | $ | 7.59 | | | | 1.51 | % | |
Oakmark Global Select Fund | |
Class I | | $ | 1,000.00 | | | $ | 1,043.10 | | | $ | 5.81 | | | $ | 1,019.25 | | | $ | 5.74 | | | | 1.14 | % | |
Oakmark International Fund | |
Class I | | $ | 1,000.00 | | | $ | 1,060.30 | | | $ | 4.88 | | | $ | 1,020.19 | | | $ | 4.78 | | | | 0.95 | % | |
Class II | | $ | 1,000.00 | | | $ | 1,058.70 | | | $ | 6.78 | | | $ | 1,018.35 | | | $ | 6.64 | | | | 1.32 | % | |
Oakmark International Small Cap Fund | |
Class I | | $ | 1,000.00 | | | $ | 1,063.10 | | | $ | 6.94 | | | $ | 1,018.20 | | | $ | 6.79 | | | | 1.35 | % | |
Class II | | $ | 1,000.00 | | | $ | 1,060.50 | | | $ | 8.89 | | | $ | 1,016.31 | | | $ | 8.70 | | | | 1.73 | % | |
* Expenses for each share class are equal to the annualized expense ratio, multiplied by the average account value over the period, multiplied by the number of days in the most recent half-year divided by 365 (to reflect one-half year period)
oakmark.com 1
Oakmark and Oakmark Select Funds March 31, 2015
Portfolio Manager Commentary

William C. Nygren, CFA
Portfolio Manager
oakmx@oakmark.com
At Oakmark, we are long-term investors. We attempt to identify growing businesses that are managed to benefit their shareholders. We will purchase stock in those businesses only when priced substantially below our estimate of intrinsic value. After purchase, we patiently wait for the gap between stock price and intrinsic value to close.
"Wall Street never changes, because human nature never changes."
-Jesse Livermore
Indexing is on a winning streak
Active managers had an unusually tough year in 2014. Only 10% of equity mutual funds outperformed the S&P 5001. There was blame assigned to the usual suspects—fund expenses, trading costs, and cash that earned next to nothing. Additionally last year, stocks of global companies headquartered outside the U.S. (think Nestle, Diageo and Unilever), yet owned in many mutual funds, performed much worse than their U.S.-based peers in the S&P 500. Also, some of the largest companies, like Apple and Microsoft, performed very well. Many mutual funds base their position sizes on perceived attractiveness rather than on capitalization, as the S&P 500 does. So even if a mutual fund owned these stocks, as Oakmark did, they likely added more to the performance of the S&P 500 than to the mutual fund's portfolio. All-in-all, the average equity mutual fund returned only 8% last year while the S&P 500 returned 14%. And unfortunately, the Oakmark Fund wasn't in the 10% of funds that performed better than the market.
For most mutual funds, performance wasn't disappointing just in 2014. As investors looked back at three-year performance, the average fund trailed the S&P 500 by seven percentage points, and over a five-year period, that gap increases to nine percentage points. Predictably, this has led many investors to question the rationale for active management, and they have increasingly shifted to index funds. So where does that leave Oakmark, whose Funds are not only active, but are quite concentrated compared to its peers?
For starters, we don't see anything wrong with passive strategies, such as owning index funds. We expect the global economy to achieve good long-term performance, and therefore we expect equities to continue delivering higher long-term returns than most other asset categories. At the same time, we don't see any reason that the investing environment we face today is materially different than what we've faced throughout our history, and our Funds' historical returns speak for themselves.
Why that won't change
How should we define success for active managers? A March article in The New York Times, titled "How Many Mutual Funds Routinely Rout the Market? Zero" defined success as having a top quartile return in each year since the market bottom in March 20092. By that standard, each of the 2,862 mutual funds they studied failed. Though predictable annual outperformance would be the holy grail, is that really the hurdle for claiming an active manager has failed?
Academics believe that risk and return correlate nearly perfectly. In their world, the only way to earn a return greater than the market is to take more risk, and likewise, the consequence of taking less risk than the market is earning a lower return. Were that the case, the only logical conclusion would be to own an index fund and use cash or debt to adjust the risk level to personal preferences. Success in this world—or proving the academics wrong—would be achieving a long-term return higher than the market without taking increased risk—or achieving the market return while reducing risk. What matters is the cumulative long-term return and the risk taken to achieve it, not the ranking in successive annual performance scorecards.
If you summed up the holdings of all active investors (both individual and professional), you'd end up owning the entire market portfolio. So no matter how each investor structures his or her portfolio, the average of active investors will be market performance. This means that net performance, after expenses, has to be worse than the market. That's just the unpleasant fact. No way around it—summing up all the results, as a class, active managers are destined to fail. That's why Vanguard's John Bogle preaches that most investors would be better off not trying to beat the market and instead should just purchase index funds.
Why Oakmark expects to keep winning
The only way investor A can succeed is to trade with investor B, who willingly takes the losing side. Think about that when you evaluate different managers—to succeed, they need to get investors to take the other side of their trades. When a manager says, "We buy growth at a reasonable price," does that mean the investors they sell to are saying, "We buy growth at an unreasonable price"?
At the beginning of each Oakmark commentary is the following statement: "At Oakmark, we are long-term investors. We attempt to identify growing businesses that are managed to benefit their shareholders. We will purchase stock in those businesses only when priced substantially below our estimate of intrinsic value. After purchase, we patiently wait for the gap between stock price and intrinsic value to close."
Are we dependent on finding investors who want to own shrinking businesses managed to the detriment of their shareholders? Of course not. We are generally purchasing stock from investors who appear to have overreacted to negative news that we believe will have little impact on long-term business value. Or if the other investors do share our assessment, they aren't prepared to wait for the stock price to reflect it. Purchasing from a fearful seller at a reduced price allows us the opportunity to earn a higher return and to also reduce our risk. To believe we have a chance to succeed, you must believe that other investors are impatient or emotional. I believe there is a tremendous amount of evidence that throughout history many—if not
2 OAKMARK FUNDS
Oakmark and Oakmark Select Funds March 31, 2015
Portfolio Manager Commentary (continued)
most—investors act emotionally or impatiently. In fact, I'd go so far as to say that's just human nature. In effect, then, our investment approach capitalizes on other investors not being able to suppress human nature. That's why I believe our historical success can be sustained.
As an aside, one might ask why I have such confidence in our long-term prospects when the Oakmark Fund has gained less than the S&P 500 in the past year. The biggest causes of our underperformance have been our heavy ownership of financials, especially banks, which have trailed the S&P 500, and our underweighting of healthcare stocks, many of which have exceeded our estimates of their intrinsic value. To anyone who has followed us, it should come as no surprise that we were early in selling a very strong sector and then used that capital to add to a less popular sector. That's the same thing we've been doing for more than twenty years. And we know from experience, it often doesn't start working immediately.
Why Oakmark concentrates
If you agree that stocks are likely to achieve good long-term returns and that a disciplined investor has the opportunity to outperform, then why concentrate? Again, the academics highlight diversification as a "free good" of which more is always better. That is the logical conclusion stemming from their belief that there is no way to select stocks, adjusting for risk, that will outperform the market. If stock selection can't add value, then concentrating into a smaller number of holdings won't increase expected return, but it will increase risk. And that's bad. Even among active managers, you can see how the "more is better" view of diversification has influenced portfolio construction: the average equity mutual fund holds 121 stocks.
Shortly after I started managing Oakmark Select, I was on a panel of investors discussing portfolio concentration. The manager seated next to me spoke glowingly of his process, which produced a portfolio that was invested in hundreds of stocks, and proudly stated, "This ensures that no single mistake can meaningfully hurt the portfolio." My response was not well-received: "If mistakes don't matter, doesn't that mean successes don't matter either?" (I've since learned that—despite the moderator's encouragement to speak up—investment panel decorum is to sit silently when others spout nonsense.) Active managers who widely diversify across hundreds of stocks have almost no chance of outperforming the market after deducting their fees and expenses. They are "closet indexing" with the goal of not underperforming by enough to get fired.
Our starting point is very different at Oakmark. We believe our disciplined long-term approach allows us to add value via stock selection. And since we believe that, we quickly get to the point that any benefit from reducing risk by adding more stocks to our portfolio is outweighed by the return lost from diluting our best ideas. We are trying to maximize our probability of outperforming by a meaningful amount. That's a very different goal than closet indexers have. That's why our Funds range from a low of 20 stocks to a high of about 60. Our most diversified portfolios have only half the positions of our average competitor.
Why over diversifying is a problem
Many well-intentioned mutual fund investors collect mutual funds for a hobby. They find an attractive fund and add it to their existing portfolio of funds. Eventually they own dozens of funds, each designed to have enough diversification to protect
an investor who puts all their equity assets in that one fund. Adding together all the funds they own, these investors often end up with a portfolio that doesn't look much different than the market, yet they are paying active management fees on the entire portfolio. The math suggests their likelihood of outperforming the market after fees becomes de minimis.
We realize that most Oakmark shareholders use our Funds for just part of their mutual fund portfolio. Since our investors are already taking steps to diversify their assets, we believe it is counterproductive if our portfolios are also heavily diversified. By concentrating our assets in our best ideas we are restoring our shareholders' opportunity to outperform.
We have great respect for the index funds we compete with. And we don't begrudge John Bogle's evangelic zeal for these products. In fact, he's probably right when he says that many investors won't put in the effort to identify attractive funds, and of those that do, many won't have the courage to stick with them when they encounter inevitable difficult times. So they really would be better off just buying index funds. But, for the disciplined investor who is willing to put in the effort—and who doesn't panic when times are tough—there is still as much opportunity as there has ever been for active management to add value. Human nature doesn't change.
oakmark.com 3
Oakmark Fund March 31, 2015
Summary Information
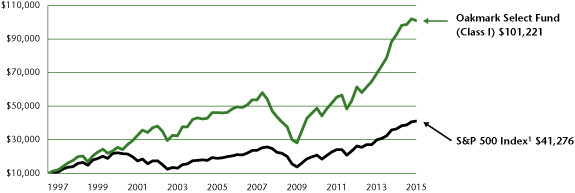
VALUE OF A $10,000 INVESTMENT
Since Inception - 08/05/91 (Unaudited)

PERFORMANCE
| | | | Average Annual Total Returns (as of 03/31/15) | |
| (Unaudited) | | Total Return
Last 3 Months | | 1-year | | 3-year | | 5-year | | 10-year | | Since
Inception
(08/05/91) | |
Oakmark Fund (Class I) | | | -0.57 | % | | | 8.37 | % | | | 17.18 | % | | | 14.64 | % | | | 8.96 | % | | | 13.10 | % | |
S&P 500 Index | | | 0.95 | % | | | 12.73 | % | | | 16.11 | % | | | 14.47 | % | | | 8.01 | % | | | 9.58 | % | |
Dow Jones Industrial Average3 | | | 0.33 | % | | | 10.57 | % | | | 13.18 | % | | | 13.23 | % | | | 8.17 | % | | | 10.41 | % | |
Lipper Large Cap Value Funds Index4 | | | -0.07 | % | | | 8.43 | % | | | 15.29 | % | | | 12.36 | % | | | 6.83 | % | | | 8.95 | % | |
The graph and table above do not reflect the deduction of taxes that a shareholder would pay on Fund distributions or the redemption of Fund shares.
Past performance is no guarantee of future results. The performance data quoted represents past performance. Current performance may be lower or higher than the performance data quoted. Total return includes change in share prices and, in each case, includes reinvestment of dividends and capital gain distributions. The investment return and principal value vary so that an investor's shares when redeemed may be worth more or less than the original cost. To obtain the most recent month-end performance, please visit oakmark.com.
TOP TEN EQUITY HOLDINGS5 | | % of Net Assets | |
Bank Of America Corp. | | | 3.0 | | |
Apache Corp. | | | 2.8 | | |
Amazon, Inc. | | | 2.5 | | |
MasterCard, Inc., Class A | | | 2.4 | | |
Google, Inc., Class A | | | 2.3 | | |
Citigroup, Inc. | | | 2.3 | | |
Oracle Corp. | | | 2.3 | | |
American International Group, Inc. | | | 2.2 | | |
Visa, Inc., Class A | | | 2.1 | | |
JPMorgan Chase & Co. | | | 2.1 | | |
FUND STATISTICS | |
Ticker | | OAKMX | |
Inception | | 08/05/91 | |
Number of Equity Holdings | | 58 | |
Net Assets | | $18.1 billion | |
Benchmark | | S&P 500 Index | |
Weighted Average Market Cap | | $111.4 billion | |
Median Market Cap | | $51.5 billion | |
Portfolio Turnover (for the 6-months ended 03/31/15) | | 12% | |
Expense Ratio - Class I (as of 09/30/14) | | 0.87% | |
SECTOR ALLOCATION | | % of Net Assets | |
Financials | | | 25.3 | | |
Information Technology | | | 24.0 | | |
Consumer Discretionary | | | 13.6 | | |
Industrials | | | 10.2 | | |
Energy | | | 6.0 | | |
Consumer Staples | | | 6.0 | | |
Health Care | | | 5.5 | | |
Materials | | | 2.4 | | |
Short-Term Investments and Other | | | 7.0 | | |
4 OAKMARK FUNDS
Oakmark Fund March 31, 2015
Portfolio Manager Commentary


William C. Nygren, CFA
Portfolio Manager
oakmx@oakmark.com
Kevin Grant, CFA
Portfolio Manager
oakmx@oakmark.com
The Oakmark Fund declined 1% in the first quarter of 2015, and it lagged behind the 1% gain for the S&P 5001. Falling oil prices and the strengthening U.S. dollar captured investor attention and brought heightened volatility to company earnings and stock prices during the first quarter. With interest rates near multi-year lows, however, we feel that equities remain the most attractive asset class. We remain confident in the Oakmark Fund's long-term prospects, and our confidence is supported by the fact that a substantial portion of the recent underperformance has been driven by weakness in the financials sector, which is among the highest potential return sectors of the Fund.
The sectors that contributed the most to performance were consumer discretionary and healthcare, driven largely by Amazon and UnitedHealth Group, respectively. Amazon was up 20% after reporting stronger than expected revenue growth in the fourth quarter, and the company continues to invest heavily to support high-return future growth. UnitedHealth Group was up 17% due to strong fourth quarter results and continued momentum as concerns about healthcare reform wane. Our weakest sectors were financials and energy, and Bank of America and Chesapeake Energy were the worst performing securities. Despite the near-term weakness, we feel the financials and energy sectors remain undervalued, and the Oakmark Fund added to several positions in these sectors during the quarter.
We also initiated new positions in Caterpillar Inc. and Precision Castparts Corp., as discussed below. We eliminated the position in Walmart because its share price appreciated toward our estimate of intrinsic value. We also eliminated most of our position in Home Depot, which has performed well for several years and also reached our estimate of intrinsic value. We would like to commend Home Depot's former CEO Frank Blake and the entire Home Depot management team for their strong focus on maximizing returns and growing per-share value. Consistent with the message delivered in Bill Nygren's fourth quarter commentary, which discussed the Fund's desire to minimize tax consequences of our sales, we have maintained a small position in Home Depot shares that we have owned for less than one year. The Fund also captured a loss on some Halliburton shares when initiating a position in Baker Hughes, which Halliburton announced it plans to acquire.
Caterpillar Inc. (CAT-$81)
Caterpillar is the world's largest provider of construction equipment, diesel engines and industrial gas turbines. Caterpillar's products earn high marks, as do the quality and scope of its dealer network, but the company has considerable exposure to the highly cyclical and currently depressed oil and gas and mining segments. With substantial pressure from weak energy spending and the negative impact of the strong U.S. dollar,
Caterpillar's 2015 earnings will likely be down considerably from 2014 and toward the bottom end of their cyclical range. We prefer to value cyclical businesses on their earnings potential throughout the cycle, and we think that Caterpillar's mid-cycle earnings will be considerably higher than current levels. With the Caterpillar share price falling to multi-year lows, the business is now attractively valued at just 10x our forecast of mid-cycle earnings. When we combine this attractive valuation with a 3.4% dividend yield and a strong balance sheet, we find Caterpillar to be a compelling investment.
Precision Castparts Corp. (PCP-$212)
Precision Castparts Corp. (PCP) is a manufacturer of complex metal components and products, including castings, forgings, fasteners and aerostructures for aerospace, power generation and general industrial applications. Precision Castparts enjoys what we believe is an outstanding corporate culture and is led by a long-tenured CEO who is known for aggressively pursuing operating efficiencies. For many years, the company's stock traded at a significant premium to other aerospace and industrial peers, but recent weakness has brought the share price to attractive levels relative to these industry groups and the S&P 500. We believe the current valuation of less than 15x earnings is overly punitive, considering PCP's organic growth prospects and the company's ability to add value through acquisitions. PCP is providing more components on key new airplanes, which should allow the company to outgrow its end markets. In addition, management projects $4 billion-$6 billion of acquisition opportunities over the next couple of years with return characteristics similar to its existing business. Finally, the company's unique technical and process capabilities, coupled with its efficiently run operations, should allow it to continue to generate above-average margins. We are pleased to have the opportunity to add shares of what we consider a best-in-class company at a price that implies it is only average.
oakmark.com 5
Oakmark Fund March 31, 2015 (Unaudited)
Schedule of Investments (in thousands)
| | | Shares | | Value | |
COMMON STOCKS - 93.0% | |
FINANCIALS - 25.3% | |
DIVERSIFIED FINANCIALS - 9.4% | |
The Goldman Sachs Group, Inc.
Investment Banking & Brokerage | | | 1,740 | | | $ | 327,068 | | |
Capital One Financial Corp.
Consumer Finance | | | 4,113 | | | | 324,171 | | |
State Street Corp.
Asset Management & Custody Banks | | | 4,380 | | | | 322,061 | | |
Franklin Resources, Inc.
Asset Management & Custody Banks | | | 5,430 | | | | 278,668 | | |
Bank of New York Mellon Corp.
Asset Management & Custody Banks | | | 6,450 | | | | 259,533 | | |
T Rowe Price Group, Inc.
Asset Management & Custody Banks | | | 2,350 | | | | 190,303 | | |
| | | | | | 1,701,804 | | |
BANKS - 8.9% | |
Bank of America Corp.
Diversified Banks | | | 35,000 | | | | 538,650 | | |
Citigroup, Inc.
Diversified Banks | | | 8,130 | | | | 418,858 | | |
JPMorgan Chase & Co.
Diversified Banks | | | 6,140 | | | | 371,961 | | |
Wells Fargo & Co.
Diversified Banks | | | 5,290 | | | | 287,776 | | |
| | | | | | 1,617,245 | | |
INSURANCE - 7.0% | |
American International Group, Inc.
Multi-line Insurance | | | 7,305 | | | | 400,241 | | |
Aflac, Inc.
Life & Health Insurance | | | 5,070 | | | | 324,531 | | |
Aon PLC (b)
Insurance Brokers | | | 3,080 | | | | 296,049 | | |
Principal Financial Group, Inc.
Life & Health Insurance | | | 4,609 | | | | 236,780 | | |
| | | | | | 1,257,601 | | |
| | | | | | 4,576,650 | | |
INFORMATION TECHNOLOGY - 24.0% | |
SOFTWARE & SERVICES - 13.7% | |
MasterCard, Inc., Class A
Data Processing & Outsourced Services | | | 5,050 | | | | 436,269 | | |
Google, Inc., Class A (a)
Internet Software & Services | | | 762 | | | | 422,458 | | |
Oracle Corp.
Systems Software | | | 9,445 | | | | 407,552 | | |
Visa, Inc., Class A
Data Processing & Outsourced Services | | | 5,880 | | | | 384,611 | | |
Automatic Data Processing, Inc.
Data Processing & Outsourced Services | | | 4,220 | | | | 361,401 | | |
Microsoft Corp.
Systems Software | | | 6,650 | | | | 270,356 | | |
Accenture PLC, Class A (b)
IT Consulting & Other Services | | | 2,100 | | | | 196,749 | | |
| | | | | | 2,479,396 | | |
| | | Shares | �� | Value | |
TECHNOLOGY HARDWARE & EQUIPMENT - 5.6% | |
TE Connectivity, Ltd. (b)
Electronic Manufacturing Services | | | 5,036 | | | $ | 360,653 | | |
Apple, Inc.
Technology Hardware, Storage & Peripherals | | | 2,883 | | | | 358,732 | | |
QUALCOMM, Inc.
Communications Equipment | | | 4,245 | | | | 294,348 | | |
| | | | | | 1,013,733 | | |
SEMICONDUCTORS & SEMICONDUCTOR EQUIPMENT - 4.7% | |
Intel Corp.
Semiconductors | | | 11,580 | | | | 362,107 | | |
Texas Instruments, Inc.
Semiconductors | | | 5,565 | | | | 318,234 | | |
Applied Materials, Inc.
Semiconductor Equipment | | | 7,260 | | | | 163,786 | | |
| | | | | | 844,127 | | |
| | | | | | 4,337,256 | | |
CONSUMER DISCRETIONARY - 13.6% | |
RETAILING - 4.7% | |
Amazon.com, Inc. (a)
Internet Retail | | | 1,219 | | | | 453,590 | | |
Liberty Interactive Corp., Class A (a)
Catalog Retail | | | 10,891 | | | | 317,905 | | |
The Home Depot, Inc.
Home Improvement Retail | | | 665 | | | | 75,551 | | |
| | | | | | 847,046 | | |
MEDIA - 4.5% | |
News Corp., Class A (a)
Publishing | | | 19,373 | | | | 310,166 | | |
Omnicom Group, Inc.
Advertising | | | 3,691 | | | | 287,844 | | |
Comcast Corp., Class A
Cable & Satellite | | | 3,940 | | | | 220,896 | | |
| | | | | | 818,906 | | |
AUTOMOBILES & COMPONENTS - 2.0% | |
General Motors Co.
Automobile Manufacturers | | | 7,850 | | | | 294,375 | | |
Harley-Davidson, Inc.
Motorcycle Manufacturers | | | 1,102 | | | | 66,936 | | |
| | | | | | 361,311 | | |
CONSUMER DURABLES & APPAREL - 1.2% | |
Whirlpool Corp.
Household Appliances | | | 1,100 | | | | 222,266 | | |
CONSUMER SERVICES - 1.2% | |
Las Vegas Sands Corp.
Casinos & Gaming | | | 3,800 | | | | 209,152 | | |
| | | | | | 2,458,681 | | |
See accompanying Notes to Financial Statements.
6 OAKMARK FUNDS
Oakmark Fund March 31, 2015 (Unaudited)
Schedule of Investments (in thousands) (continued)
| | | Shares | | Value | |
COMMON STOCKS - 93.0% (continued) | |
INDUSTRIALS - 10.2% | |
CAPITAL GOODS - 7.3% | |
General Electric Co.
Industrial Conglomerates | | | 14,500 | | | $ | 359,745 | | |
Illinois Tool Works, Inc.
Industrial Machinery | | | 3,115 | | | | 302,591 | | |
Parker-Hannifin Corp.
Industrial Machinery | | | 1,925 | | | | 228,651 | | |
Caterpillar, Inc.
Construction Machinery & Heavy Trucks | | | 2,730 | | | | 218,442 | | |
Precision Castparts Corp.
Aerospace & Defense | | | 1,000 | | | | 210,000 | | |
| | | | | | 1,319,429 | | |
TRANSPORTATION - 2.9% | |
FedEx Corp.
Air Freight & Logistics | | | 2,000 | | | | 330,900 | | |
Union Pacific Corp.
Railroads | | | 1,750 | | | | 189,543 | | |
| | | | | | 520,443 | | |
| | | | | | 1,839,872 | | |
ENERGY - 6.0% | |
Apache Corp.
Oil & Gas Exploration & Production | | | 8,275 | | | | 499,231 | | |
Halliburton Co.
Oil & Gas Equipment & Services | | | 4,500 | | | | 197,460 | | |
Chesapeake Energy Corp.
Oil & Gas Exploration & Production | | | 12,000 | | | | 169,920 | | |
National Oilwell Varco, Inc.
Oil & Gas Equipment & Services | | | 3,040 | | | | 151,969 | | |
Baker Hughes, Inc.
Oil & Gas Equipment & Services | | | 1,150 | | | | 73,117 | | |
| | | | | | 1,091,697 | | |
CONSUMER STAPLES - 6.0% | |
FOOD, BEVERAGE & TOBACCO - 6.0% | |
General Mills, Inc.
Packaged Foods & Meats | | | 5,820 | | | | 329,412 | | |
Nestle SA (b) (c)
Packaged Foods & Meats | | | 3,540 | | | | 266,281 | | |
Diageo PLC (b) (c)
Distillers & Vintners | | | 2,250 | | | | 248,783 | | |
Unilever PLC (b) (c)
Packaged Foods & Meats | | | 5,613 | | | | 234,118 | | |
| | | | | | 1,078,594 | | |
HEALTH CARE - 5.5% | |
HEALTH CARE EQUIPMENT & SERVICES - 3.9% | |
Medtronic PLC (b)
Health Care Equipment | | | 4,690 | | | | 365,773 | | |
UnitedHealth Group, Inc.
Managed Health Care | | | 2,890 | | | | 341,858 | | |
| | | | | | 707,631 | | |
| | | Shares | | Value | |
PHARMACEUTICALS, BIOTECHNOLOGY & LIFE SCIENCES - 1.6% | |
Sanofi (b) (c)
Pharmaceuticals | | | 5,670 | | | $ | 280,325 | | |
| | | | | | 987,956 | | |
MATERIALS - 2.4% | |
Monsanto Co.
Fertilizers & Agricultural Chemicals | | | 2,450 | | | | 275,723 | | |
Glencore PLC (b)
Diversified Metals & Mining | | | 38,040 | | | | 161,330 | | |
| | | | | | 437,053 | | |
TOTAL COMMON STOCKS - 93.0%
(COST $12,497,636) | | | | | 16,807,759 | | |
| | | Par Value | | Value | |
SHORT TERM INVESTMENTS - 7.0% | |
REPURCHASE AGREEMENT - 3.6% | |
Fixed Income Clearing Corp. Repurchase
Agreement, 0.01% dated 03/31/15 due
04/01/15, repurchase price $654,132,
collateralized by a Federal National
Mortgage Association Bond, 2.635%,
due 09/13/23, value plus accrued
interest of $100,925, by United States
Treasury Notes, 1.750% - 2.000%,
due 10/31/21 - 05/15/23, aggregate
value plus accrued interest of $566,291
(Cost: $654,132) | | $ | 654,132 | | | | 654,132 | | |
U.S. GOVERNMENT BILLS - 2.0% | |
United States Treasury Bills,
0.05% - 0.11%, due 04/30/15 - 09/10/15 (d)
(Cost $349,943) | | | 350,000 | | | | 349,948 | | |
GOVERNMENT AND AGENCY SECURITIES - 1.4% | |
United States Treasury Floating Rate Note,
0.104%, due 04/30/16 (e)
(Cost $250,000) | | | 250,000 | | | | 250,021 | | |
TOTAL SHORT TERM INVESTMENTS - 7.0%
(COST $1,254,075) | | | | | 1,254,101 | | |
TOTAL INVESTMENTS - 100.0%
(COST $13,751,711) | | | | | 18,061,860 | | |
Other Assets In Excess of Liabilities - 0.0% (f) | | | | | 8,842 | | |
TOTAL NET ASSETS - 100.0% | | | | $ | 18,070,702 | | |
(a) Non-income producing security
(b) Foreign domiciled corporation
(c) Sponsored American Depositary Receipt
(d) The rate shown represents the annualized yield at the time of purchase; not a coupon rate.
(e) Floating Rate Note. Rate shown is as of March 31, 2015.
(f) Amount rounds to less than 0.1%.
See accompanying Notes to Financial Statements.
oakmark.com 7
Oakmark Select Fund March 31, 2015
Summary Information
VALUE OF A $10,000 INVESTMENT
Since Inception - 11/01/96 (Unaudited)
PERFORMANCE
| | | | Average Annual Total Returns (as of 03/31/15) | |
| (Unaudited) | | Total Return
Last 3 Months | | 1-year | | 3-year | | 5-year | | 10-year | | Since
Inception
(11/01/96) | |
Oakmark Select Fund (Class I) | | | -0.98 | % | | | 8.98 | % | | | 18.00 | % | | | 15.62 | % | | | 8.13 | % | | | 13.40 | % | |
S&P 500 Index | | | 0.95 | % | | | 12.73 | % | | | 16.11 | % | | | 14.47 | % | | | 8.01 | % | | | 8.00 | % | |
Lipper Multi-Cap Value Funds Index6 | | | 1.25 | % | | | 8.59 | % | | | 15.81 | % | | | 12.70 | % | | | 6.61 | % | | | 7.81 | % | |
The graph and table do not reflect the deduction of taxes that a shareholder would pay on Fund distributions or the redemption of Fund shares.
Past performance is no guarantee of future results. The performance data quoted represents past performance. Current performance may be lower or higher than the performance data quoted. Total return includes change in share prices and, in each case, includes reinvestment of dividends and capital gain distributions. The investment return and principal value vary so that an investor's shares when redeemed may be worth more or less than the original cost. To obtain the most recent month-end performance, please visit oakmark.com.
TOP TEN EQUITY HOLDINGS5 | | % of Net Assets | |
MasterCard, Inc., Class A | | | 7.6 | | |
TE Connectivity, Ltd. | | | 6.0 | | |
Google, Inc., Class A | | | 5.6 | | |
American International Group, Inc. | | | 5.5 | | |
Apache Corp. | | | 5.5 | | |
CBRE Group, Inc. | | | 5.4 | | |
Amazon, Inc. | | | 5.3 | | |
Citigroup, Inc. | | | 5.2 | | |
Bank Of America Corp. | | | 5.0 | | |
JPMorgan Chase & Co. | | | 4.9 | | |
FUND STATISTICS | |
Ticker | | OAKLX | |
Inception | | 11/01/96 | |
Number of Equity Holdings | | 20 | |
Net Assets | | $6.5 billion | |
Benchmark | | S&P 500 Index | |
Weighted Average Market Cap | | $110.4 billion | |
Median Market Cap | | $87.6 billion | |
Portfolio Turnover (for the 6-months ended 03/31/15) | | 15% | |
Expense Ratio - Class I (as of 09/30/14) | | 0.95% | |
SECTOR ALLOCATION | | % of Net Assets | |
Financials | | | 38.3 | | |
Information Technology | | | 27.2 | | |
Energy | | | 9.5 | | |
Consumer Discretionary | | | 9.4 | | |
Industrials | | | 4.0 | | |
Health Care | | | 3.9 | | |
Utilities | | | 3.5 | | |
Short-Term Investments and Other | | | 4.2 | | |
8 OAKMARK FUNDS
Oakmark Select Fund March 31, 2015
Portfolio Manager Commentary


William C. Nygren, CFA
Portfolio Manager
oaklx@oakmark.com
Anthony P. Coniaris, CFA
Portfolio Manager
oaklx@oakmark.com
Win Murray
Portfolio Manager
oaklx@oakmark.com
For the quarter, the Oakmark Select Fund declined 1%, compared to a 1% gain in the S&P 500 Index1. The negative impact of our energy holdings coupled with our relatively large position in financials overwhelmed what otherwise was strong stock selection across our consumer discretionary and technology investments. While we are disappointed with the outcome, we have been through periods like this before and remain steadfast in our commitment to the same investment process that has delivered success since the Fund's inception.
Chesapeake Energy (–27%), Bank of America (–14%) and Intel (–13%) detracted the most from our performance. Chesapeake issued disappointing cash flow guidance for 2015 due primarily to legacy contracts, signed under the prior management regime, to market oil and gas. While the result is disappointing, we believe that the impact from these contracts is both manageable and temporary. Aside from this issue, the business's underlying performance has been as good, or better, than we expected on relevant metrics like production growth and operating costs. The company also announced a substantial share repurchase authorization to take advantage of the large disconnect between the share price and intrinsic value. So, we remain confident that Chesapeake's new management team can right the ship operationally and greatly improve capital allocation. Although this quarter's stock performance might indicate otherwise, Bank of America continues to march toward our estimate of normalized earnings power, despite headwinds from low interest rates, while improving the quality of its balance sheet. For these reasons, we remain confident in Bank of America and all of our large bank holdings.
Amazon (+20%), TE Connectivity (14%) and CBRE Group (13%) contributed the most to performance. In the short time we have owned it, Amazon has grown its share of retail sales considerably, as we expected. A surprisingly profitable fourth quarter gave investors a glimpse of what margins could be should management decide to more aggressively pull back on their ambitious growth investments. As long as Amazon continues to grow its online retail moat, we welcome either outcome.
During the quarter we added one new position (General Electric) and eliminated another (FedEx) from the Fund. We have always admired General Electric's (GE) collection of businesses, but we have questioned management's focus on returns when making capital allocation decisions. However, the appointment of a new CFO in mid-2013 ushered in significant changes. Since then, GE has, in our view, acquired assets cheaply (Alstom) and sold assets at good prices (Synchrony and its appliances division). In 2015, the company plans to totally revamp its variable compensation plan for thousands of employees, emphasizing factors that drive return on invested capital, which should boost future results. We believe there is substantial opportunity to improve gross margins, and the stock trades for just under a market multiple on 2016 earnings and offers a generous dividend yield of 3.7%. Some investors may have a stale opinion of
GE after the past 15 years of persistent underperformance, but we believe it's a good investment at the current price.
We eliminated our position in FedEx due to price. Management's renewed focus on costs and smart capital allocation was properly rewarded with a higher multiple, so we were able to redeploy those assets into more undervalued companies, such as GE.
Thank you for your continued investment in the Fund.
oakmark.com 9
Oakmark Select Fund March 31, 2015 (Unaudited)
Schedule of Investments (in thousands)
| | | Shares | | Value | |
COMMON STOCKS - 95.8% | |
FINANCIALS - 38.3% | |
BANKS - 15.1% | |
Citigroup, Inc.
Diversified Banks | | | 6,577 | | | $ | 338,847 | | |
Bank of America Corp.
Diversified Banks | | | 20,979 | | | | 322,861 | | |
JPMorgan Chase & Co.
Diversified Banks | | | 5,230 | | | | 316,833 | | |
| | | | | | 978,541 | | |
INSURANCE - 10.1% | |
American International Group, Inc.
Multi-line Insurance | | | 6,545 | | | | 358,612 | | |
FNF Group
Property & Casualty Insurance | | | 7,901 | | | | 290,448 | | |
| | | | | | 649,060 | | |
DIVERSIFIED FINANCIALS - 7.7% | |
Franklin Resources, Inc.
Asset Management & Custody Banks | | | 5,010 | | | | 257,113 | | |
Capital One Financial Corp.
Consumer Finance | | | 3,050 | | | | 240,401 | | |
| | | | | | 497,514 | | |
REAL ESTATE - 5.4% | |
CBRE Group, Inc., Class A (a)
Real Estate Services | | | 8,964 | | | | 346,996 | | |
| | | | | | 2,472,111 | | |
INFORMATION TECHNOLOGY - 27.2% | |
SOFTWARE & SERVICES - 18.1% | |
MasterCard, Inc., Class A
Data Processing & Outsourced Services | | | 5,720 | | | | 494,151 | | |
Google, Inc., Class A (a)
Internet Software & Services | | | 653 | | | | 362,219 | | |
Oracle Corp.
Systems Software | | | 7,240 | | | | 312,406 | | |
| | | | | | 1,168,776 | | |
TECHNOLOGY HARDWARE & EQUIPMENT - 6.0% | |
TE Connectivity, Ltd. (b)
Electronic Manufacturing Services | | | 5,394 | | | | 386,314 | | |
SEMICONDUCTORS & SEMICONDUCTOR EQUIPMENT - 3.1% | |
Intel Corp.
Semiconductors | | | 6,447 | | | | 201,597 | | |
| | | | | | 1,756,687 | | |
ENERGY - 9.5% | |
Apache Corp.
Oil & Gas Exploration & Production | | | 5,860 | | | | 353,534 | | |
Chesapeake Energy Corp.
Oil & Gas Exploration & Production | | | 18,500 | | | | 261,960 | | |
| | | | | | 615,494 | | |
| | | Shares | | Value | |
CONSUMER DISCRETIONARY - 9.4% | |
RETAILING - 9.4% | |
Amazon.com, Inc. (a)
Internet Retail | | | 917 | | | $ | 341,216 | | |
Liberty Interactive Corp., Class A (a)
Catalog Retail | | | 9,214 | | | | 268,953 | | |
| | | | | | 610,169 | | |
INDUSTRIALS - 4.0% | |
CAPITAL GOODS - 4.0% | |
General Electric Co.
Industrial Conglomerates | | | 10,500 | | | | 260,505 | | |
HEALTH CARE - 3.9% | |
HEALTH CARE EQUIPMENT & SERVICES - 3.9% | |
Medtronic PLC (b)
Health Care Equipment | | | 3,200 | | | | 249,568 | | |
UTILITIES - 3.5% | |
Calpine Corp. (a)
Independent Power Producers & Energy Traders | | | 10,004 | | | | 228,801 | | |
TOTAL COMMON STOCKS - 95.8%
(COST $4,854,551) | | | | | 6,193,335 | | |
| | | Par Value | | Value | |
SHORT TERM INVESTMENTS - 4.3% | |
REPURCHASE AGREEMENT - 4.3% | |
Fixed Income Clearing Corp. Repurchase
Agreement, 0.01% dated 03/31/15 due
04/01/15, repurchase price $275,237,
collateralized by United States
Treasury Notes, 2.000% - 2.125%,
due 09/30/21- 10/31/21, aggregate
value plus accrued interest of
$280,745 (Cost: $275,237) | | $ | 275,237 | | | | 275,237 | | |
TOTAL SHORT TERM INVESTMENTS - 4.3%
(COST $275,237) | | | | | 275,237 | | |
TOTAL INVESTMENTS - 100.1%
(COST $5,129,788) | | | | | 6,468,572 | | |
Liabilities In Excess of Other Assets - (0.1)% | | | | | (4,292 | ) | |
TOTAL NET ASSETS - 100.0% | | | | $ | 6,464,280 | | |
(a) Non-income producing security
(b) Foreign domiciled corporation
See accompanying Notes to Financial Statements.
10 OAKMARK FUNDS

This page intentionally left blank.
oakmark.com 11
Oakmark Equity and Income Fund March 31, 2015
Summary Information
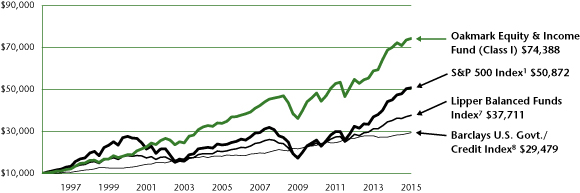
VALUE OF A $10,000 INVESTMENT
Since Inception - 11/01/95 (Unaudited)
PERFORMANCE
| | | | Average Annual Total Returns (as of 03/31/15) | |
| (Unaudited) | | Total Return
Last 3 Months | | 1-year | | 3-year | | 5-year | | 10-year | | Since
Inception
(11/01/95) | |
Oakmark Equity and Income Fund (Class I) | | | 0.91 | % | | | 6.02 | % | | | 10.65 | % | | | 9.00 | % | | | 8.18 | % | | | 10.89 | % | |
Lipper Balanced Funds Index | | | 1.78 | % | | | 7.17 | % | | | 9.64 | % | | | 9.07 | % | | | 6.34 | % | | | 7.08 | % | |
S&P 500 Index | | | 0.95 | % | | | 12.73 | % | | | 16.11 | % | | | 14.47 | % | | | 8.01 | % | | | 8.74 | % | |
Barclays U.S. Govt./Credit Index | | | 1.84 | % | | | 5.86 | % | | | 3.35 | % | | | 4.75 | % | | | 4.96 | % | | | 5.73 | % | |
The graph and table above do not reflect the deduction of taxes that a shareholder would pay on Fund distributions or the redemption of Fund shares.
Past performance is no guarantee of future results. The performance data quoted represents past performance. Current performance may be lower or higher than the performance data quoted. Total return includes change in share prices and, in each case, includes reinvestment of dividends and capital gain distributions. The investment return and principal value vary so that an investor's shares when redeemed may be worth more or less than the original cost. To obtain the most recent month-end performance, please visit oakmark.com.
TOP TEN EQUITY HOLDINGS5 | | % of Net Assets | |
Oracle Corp. | | | 3.7 | | |
General Motors Co. | | | 3.5 | | |
Bank Of America Corp. | | | 3.3 | | |
Nestle ADR | | | 3.1 | | |
TE Connectivity, Ltd. | | | 2.8 | | |
CVS Health Corp. | | | 2.6 | | |
Dover Corp. | | | 2.6 | | |
UnitedHealth Group, Inc. | | | 2.3 | | |
Foot Locker, Inc. | | | 2.2 | | |
Diageo ADR | | | 2.2 | | |
FUND STATISTICS | |
Ticker | | OAKBX | |
Inception | | 11/01/95 | |
Number of Equity Holdings | | 47 | |
Net Assets | | $20.7 billion | |
Benchmark | | Lipper Balanced Funds Index | |
Weighted Average Market Cap | | $71.4 billion | |
Median Market Cap | | $17.7 billion | |
Portfolio Turnover (for the 6-months ended 03/31/15) | | 13% | |
Expense Ratio - Class I (as of 09/30/14) | | 0.74% | |
SECTOR ALLOCATION | | % of Net Assets | |
Equity Investments | | | |
Financials | | | 14.4 | | |
Consumer Discretionary | | | 10.6 | | |
Industrials | | | 10.1 | | |
Consumer Staples | | | 9.8 | | |
Information Technology | | | 9.8 | | |
Health Care | | | 4.0 | | |
Energy | | | 3.6 | | |
Materials | | | 1.3 | | |
Total Equity Investments | | | 63.6 | | |
Fixed Income Investments | | | |
Government and Agency Securities | | | 8.1 | | |
Corporate Bonds | | | 5.9 | | |
Asset Backed Securities | | | 0.1 | | |
Total Fixed Income Investments | | | 14.1 | | |
Short-Term Investments and Other | | | 22.3 | | |
12 OAKMARK FUNDS
Oakmark Equity and Income Fund March 31, 2015
Portfolio Manager Commentary


Clyde S. McGregor, CFA
Portfolio Manager
oakbx@oakmark.com
M. Colin Hudson, CFA
Portfolio Manager
oakbx@oakmark.com
Matthew A. Logan, CFA
Portfolio Manager
oakbx@oakmark.com
Edward J. Wojciechowski, CFA
Portfolio Manager
oakbx@oakmark.com
Quarter Review
U.S. stocks showed little direction in the March quarter. In fact, in the second half of the quarter the market went 28 trading sessions without gains on back-to-back days, and this tied the record for that somewhat irrelevant statistic. The return for the Equity and Income Fund in the quarter was 1% while the Lipper Balanced Fund Index7, the Fund's performance benchmark, returned 2%. Our decision to keep the Fund's fixed income duration very short contributed to the Fund's shortfall versus the benchmark. For the fiscal year's six months, the Fund returned 5%, and the Lipper Balanced Funds Index return was 4%. The annualized compound rate of return since the Fund's inception in 1995 is 11% while the corresponding return to the Lipper Index is 7%.
Top contributors for the quarter were UnitedHealth Group, TE Connectivity, General Motors, Lear and Foot Locker. Bank of America, National Oilwell Varco, Union Pacific, Oracle and Glencore detracted most from return. For the first six months of the Fund's fiscal year, UnitedHealth Group, CVS Health, TE Connectivity, General Motors and Lear led the contributor list while National Oilwell Varco, Glencore, Bank of America, Dover and Ultra Petroleum detracted. Weak commodity prices have helped to pull down the shares of four of the five detractors.
Activist or Acquisition?
In the recent period, companies that have attracted activist attention as well as those that have announced significant acquisitions have both tended to outperform. This is a curious outcome for a couple of reasons. First, throughout our careers, we had grown accustomed to seeing the price of an acquirer drop following the announcement of a deal because investors often perceive acquisitions as diluting a company's value. Not only is it strange that acquiring companies now enjoy price lifts when they announce deals (e.g., UnitedHealth on the announcement of its deal to purchase Catamaran), but it's odder still that it comes at a time when activism is also causing prices to rise. Activists often agitate for the exact opposite of acquisitions: either an outright sale of the targeted company or divestment of business units, believing such actions can "unlock" value.
In a diversified portfolio of equities, like the equity portion of Equity and Income Fund, it is almost to be expected that there will be Fund holdings that demonstrate these factors. Two of the Fund's automotive industry holdings (General Motors and Lear) have attracted activists, and Bank of New York Mellon has added a representative of an activist firm to its board. General Motors recently responded to an activist group with a plan to return cash to shareholders through share repurchase, and Lear
had previously undertaken this action. Fund holdings have been less busy on the acquisition front, with the aforementioned UnitedHealth deal as the only recent example.
Obviously we like it when prevailing market currents carry along our holdings, but we worry that in an otherwise dull period investors are overreaching for investable concepts. Although the market's previously negative reactions to acquisition announcements was probably too extreme, today's judgment that acquisitions will almost always produce enhanced profitability seems too generous. Concerning activist investors, we welcome work that brings price and value together without impairing future value growth. Our job is to discriminate between activists who look to enhance long-term business value and those who seek merely to extract short-term profits.
Transaction Activity
During the quarter, the Fund initiated two new equity positions while eliminating three. The net effect of these transactions was to decrease the equity allocation by 1% with proceeds used to increase the corporate bond allocation.
We purchased shares of T. Rowe Price Group, the investment management company. As a significant player in our business, we have long admired T. Rowe but only recently perceived the share price to offer opportunity. Key to the franchise is the company's investment culture, which has sustainably generated commendable investment performance and enabled T. Rowe to establish a strong position in the defined contribution/401(k) market. In our view, the company has a solid balance sheet with over $3 billion in cash and investments with no debt. We also like that management has demonstrated good stewardship of capital through opportunistic share repurchases (i.e., during periods when the share price was weak and trading at a discount to our estimate of intrinsic value).
Our second new purchase was Precision Castparts Corp. (PCP), a manufacturer of complex metal components and products for aerospace, power generation, and general industrial applications. PCP's long-tenured CEO has helped to develop what we believe is an outstanding corporate culture that relentlessly pursues operating efficiencies. For many years, the company's stock traded at a significant premium to aerospace and industrial companies, but recent underperformance has caused it to sell at a discounted valuation. We believe the current valuation does not adequately reflect PCP's organic growth prospects and its ability to add value through acquisitions. PCP's unique technical and process capabilities coupled with its efficiently run operations should allow this best-in-class company to continue generating above-average margins.
oakmark.com 13
Oakmark Equity and Income Fund March 31, 2015
Portfolio Manager Commentary (continued)
Stock eliminations during the quarter were FedEx, Illinois Tool Works and Scripps Networks Interactive. We purchased shares of the first two companies in 2012, and both contributed to the Fund's returns. Scripps also contributed, but over a much longer 10-year holding period. During that time, which includes the financial crisis, much has happened at Scripps, including a corporate name change and several diversifying acquisitions. Through it all, the strength of the core cable television channel franchises was sufficient to grow shareholder value. With a rapidly changing media environment, however, we have begun to question if the increasing fragmentation of media viewership will limit future growth opportunities in this sector.
The Most Hated Rally in History
A Financial Times article on March 2 examined the post-financial crisis bull market and contained the phrase we have used to title this section9. The article discusses a theme we have often stated, "...that many investors have simply not believed in a stock market rally fueled by central banks' easy money policies." Or, according to Nicholas Colas, chief market strategist of Convergex, "There is a belief that the market rally has...not [been supported] by organic growth and rising revenues." The article also describes the difficulty investors have had in distinguishing themselves in this rally. The article notes that according to Standard & Poor's, dispersion among stocks reached a historic low in 2014, meaning that stocks have moved in tandem to an unprecedented degree.
We, too, would prefer an environment where market returns derive from economic improvement rather than cost cutting and financial engineering. But that is not the environment in which we currently operate. As one of Harris Associates' early partners often said, "The hardest time to invest is always right now," and it feels that way to us today. Though we do not love the investing landscape, the possibility of identifying attractive new opportunities remains. Our analyst teams, both domestic and international, continue to search the globe for mispriced securities. The search may or may not be harder today than at other times, but the challenge still inspires us. The late Herb Stein quipped, "If something cannot go on forever, it will stop," and, unfortunately, for quite some time we have felt that way about the Federal Reserve's suppression of short-term interest rates. We do not have any idea when the present unusual environment will evolve into something different, but however it evolves, we believe that our fundamental, value-based approach will produce the returns that our investors seek.
As always, we thank our shareholders for entrusting their assets to the Fund and welcome your questions and comments.
14 OAKMARK FUNDS
Oakmark Equity and Income Fund March 31, 2015 (Unaudited)
Schedule of Investments (in thousands)
| | | Shares | | Value | |
COMMON STOCKS - 63.6% | |
FINANCIALS - 14.4% | |
BANKS - 5.4% | |
Bank of America Corp.
Diversified Banks | | | 44,733 | | | $ | 688,438 | | |
Wells Fargo & Co.
Diversified Banks | | | 4,326 | | | | 235,334 | | |
U.S. Bancorp
Diversified Banks | | | 4,461 | | | | 194,805 | | |
| | | | | | 1,118,577 | | |
DIVERSIFIED FINANCIALS - 4.7% | |
TD Ameritrade Holding Corp.
Investment Banking & Brokerage | | | 12,006 | | | | 447,358 | | |
The Goldman Sachs Group, Inc.
Investment Banking & Brokerage | | | 1,208 | | | | 227,068 | | |
Bank of New York Mellon Corp.
Asset Management & Custody Banks | | | 5,340 | | | | 214,900 | | |
T Rowe Price Group, Inc.
Asset Management & Custody Banks | | | 608 | | | | 49,273 | | |
FNFV Group (a)
Multi-Sector Holdings | | | 2,202 | | | | 31,052 | | |
| | | | | | 969,651 | | |
INSURANCE - 4.3% | |
FNF Group
Property & Casualty Insurance | | | 7,689 | | | | 282,658 | | |
Principal Financial Group, Inc.
Life & Health Insurance | | | 5,061 | | | | 259,999 | | |
Reinsurance Group of America, Inc.
Reinsurance | | | 2,402 | | | | 223,852 | | |
Aflac, Inc.
Life & Health Insurance | | | 2,077 | | | | 132,936 | | |
| | | | | | 899,445 | | |
| | | | | | 2,987,673 | | |
CONSUMER DISCRETIONARY - 10.6% | |
AUTOMOBILES & COMPONENTS - 7.1% | |
General Motors Co.
Automobile Manufacturers | | | 19,469 | | | | 730,072 | | |
Lear Corp.
Auto Parts & Equipment | | | 3,387 | | | | 375,300 | | |
BorgWarner, Inc.
Auto Parts & Equipment | | | 5,699 | | | | 344,657 | | |
Remy International, Inc.
Auto Parts & Equipment | | | 394 | | | | 8,745 | | |
| | | | | | 1,458,774 | | |
RETAILING - 3.1% | |
Foot Locker, Inc. (b)
Apparel Retail | | | 7,348 | | | | 462,943 | | |
HSN, Inc.
Catalog Retail | | | 2,608 | | | | 177,974 | | |
| | | | | | 640,917 | | |
| | | Shares | | Value | |
CONSUMER DURABLES & APPAREL - 0.4% | |
Carter's, Inc.
Apparel, Accessories & Luxury Goods | | | 936 | | | $ | 86,506 | | |
| | | | | | 2,186,197 | | |
INDUSTRIALS - 10.1% | |
CAPITAL GOODS - 8.0% | |
Dover Corp.
Industrial Machinery | | | 7,713 | | | | 533,129 | | |
Flowserve Corp.
Industrial Machinery | | | 6,678 | | | | 377,229 | | |
Rockwell Automation, Inc.
Electrical Components & Equipment | | | 2,145 | | | | 248,799 | | |
Parker-Hannifin Corp.
Industrial Machinery | | | 1,638 | | | | 194,556 | | |
Precision Castparts Corp.
Aerospace & Defense | | | 794 | | | | 166,740 | | |
WESCO International, Inc. (a)
Trading Companies & Distributors | | | 1,522 | | | | 106,376 | | |
Blount International, Inc. (a)
Industrial Machinery | | | 2,263 | | | | 29,153 | | |
| | | | | | 1,655,982 | | |
TRANSPORTATION - 1.9% | |
Union Pacific Corp.
Railroads | | | 3,414 | | | | 369,759 | | |
Atlas Air Worldwide Holdings, Inc. (a)
Air Freight & Logistics | | | 647 | | | | 27,843 | | |
| | | | | | 397,602 | | |
COMMERCIAL & PROFESSIONAL SERVICES - 0.2% | |
Herman Miller, Inc.
Office Services & Supplies | | | 1,402 | | | | 38,908 | | |
| | | | | | 2,092,492 | | |
CONSUMER STAPLES - 9.8% | |
FOOD, BEVERAGE & TOBACCO - 7.2% | |
Nestle SA (c) (d)
Packaged Foods & Meats | | | 8,627 | | | | 648,958 | | |
Diageo PLC (c) (d)
Distillers & Vintners | | | 4,182 | | | | 462,393 | | |
Philip Morris International, Inc.
Tobacco | | | 5,060 | | | | 381,177 | | |
| | | | | | 1,492,528 | | |
FOOD & STAPLES RETAILING - 2.6% | |
CVS Health Corp.
Drug Retail | | | 5,285 | | | | 545,481 | | |
| | | | | | 2,038,009 | | |
See accompanying Notes to Financial Statements.
oakmark.com 15
Oakmark Equity and Income Fund March 31, 2015 (Unaudited)
Schedule of Investments (in thousands) (continued)
| | | Shares | | Value | |
COMMON STOCKS - 63.6% (continued) | |
INFORMATION TECHNOLOGY - 9.8% | |
SOFTWARE & SERVICES - 6.7% | |
Oracle Corp.
Systems Software | | | 17,795 | | | $ | 767,854 | | |
MasterCard, Inc., Class A
Data Processing & Outsourced Services | | | 4,832 | | | | 417,470 | | |
Broadridge Financial Solutions, Inc.
Data Processing & Outsourced Services | | | 3,578 | | | | 196,798 | | |
| | | | | | 1,382,122 | | |
TECHNOLOGY HARDWARE & EQUIPMENT - 3.1% | |
TE Connectivity, Ltd. (d)
Electronic Manufacturing Services | | | 8,052 | | | | 576,706 | | |
Knowles Corp. (a)
Electronic Components | | | 3,155 | | | | 60,805 | | |
| | | | | | 637,511 | | |
| | | | | | 2,019,633 | | |
HEALTH CARE - 4.0% | |
HEALTH CARE EQUIPMENT & SERVICES - 3.6% | |
UnitedHealth Group, Inc.
Managed Health Care | | | 4,090 | | | | 483,856 | | |
Omnicare, Inc.
Health Care Services | | | 3,406 | | | | 262,455 | | |
| | | | | | 746,311 | | |
PHARMACEUTICALS, BIOTECHNOLOGY & LIFE SCIENCES - 0.4% | |
Bruker Corp. (a)
Life Sciences Tools & Services | | | 4,814 | | | | 88,909 | | |
| | | | | | 835,220 | | |
ENERGY - 3.6% | |
National Oilwell Varco, Inc.
Oil & Gas Equipment & Services | | | 6,662 | | | | 333,046 | | |
Baker Hughes, Inc.
Oil & Gas Equipment & Services | | | 4,604 | | | | 292,737 | | |
Ultra Petroleum Corp. (a)
Oil & Gas Exploration & Production | | | 6,105 | | | | 95,413 | | |
Rowan Cos. PLC
Oil & Gas Drilling | | | 1,624 | | | | 28,755 | | |
| | | | | | 749,951 | | |
MATERIALS - 1.3% | |
Glencore PLC (d)
Diversified Metals & Mining | | | 60,533 | | | | 256,724 | | |
Southern Copper Corp.
Diversified Metals & Mining | | | 693 | | | | 20,225 | | |
| | | | | | 276,949 | | |
TOTAL COMMON STOCKS - 63.6%
(COST $8,545,988) | | | | | 13,186,124 | | |
| | | Par Value | | Value | |
FIXED INCOME - 14.1% | |
GOVERNMENT AND AGENCY SECURITIES - 8.1% | |
U.S. GOVERNMENT NOTES - 7.6% | |
1.25%, due 07/15/20, Inflation Indexed | | $ | 534,234 | | | $ | 579,101 | | |
1.375%, due 07/15/18, Inflation Indexed | | | 513,630 | | | | 549,664 | | |
2.125%, due 01/15/19, Inflation Indexed | | | 217,065 | | | | 238,958 | | |
1.00%, due 09/30/16 | | | 199,380 | | | | 201,093 | | |
| | | | | | 1,568,816 | | |
U.S. GOVERNMENT AGENCIES - 0.5% | |
Federal Home Loan Bank,
1.65%, due 07/18/19 | | | 29,550 | | | | 29,570 | | |
Federal National Mortgage Association,
1.25%, due 09/27/18 | | | 24,680 | | | | 24,711 | | |
Federal Home Loan Bank,
1.25%, due 02/27/18 | | | 24,585 | | | | 24,624 | | |
Federal Home Loan Mortgage Corp.,
1.40%, due 01/08/18 | | | 19,665 | | | | 19,669 | | |
Federal National Mortgage Association,
1.25%, due 01/30/20 | | | 9,525 | | | | 9,514 | | |
Federal Home Loan Bank,
1.00%, due 04/15/20 | | | 6,500 | | | | 6,502 | | |
| | | | | | 114,590 | | |
Total Government and Agency Securities
(Cost $1,588,958) | | | | | 1,683,406 | | |
CORPORATE BONDS - 5.9% | |
Kinetic Concepts, Inc.,
10.50%, due 11/01/18 | | | 47,940 | | | | 51,895 | | |
JPMorgan Chase & Co.,
3.15%, due 07/05/16 | | | 44,592 | | | | 45,749 | | |
General Motors Co.,
4.875%, due 10/02/23 | | | 41,400 | | | | 44,824 | | |
Mondelez International, Inc.,
4.125%, due 02/09/16 | | | 43,567 | | | | 44,741 | | |
The Manitowoc Co., Inc.,
8.50%, due 11/01/20 | | | 35,655 | | | | 38,151 | | |
The William Carter Co.,
5.25%, due 08/15/21 | | | 35,137 | | | | 36,367 | | |
Ultra Petroleum Corp., 144A,
5.75%, due 12/15/18 (e) | | | 37,809 | | | | 34,123 | | |
Credit Suisse Group AG, 144A,
7.50% (d) (e) (f) (g) | | | 30,000 | | | | 32,212 | | |
Omnicom Group, Inc.,
3.625%, due 05/01/22 | | | 30,425 | | | | 31,906 | | |
CVS Health Corp.,
4.00%, due 12/05/23 | | | 29,325 | | | | 31,788 | | |
Live Nation Entertainment, Inc., 144A,
7.00%, due 09/01/20 (e) | | | 28,930 | | | | 30,810 | | |
1011778 BC ULC / New Red
Finance Inc., 144A,
6.00%, due 04/01/22 (d) (e) | | | 29,500 | | | | 30,532 | | |
General Motors Co.,
3.50%, due 10/02/18 | | | 29,525 | | | | 30,250 | | |
Toyota Motor Credit Corp.,
1.45%, due 01/12/18 | | | 29,495 | | | | 29,684 | | |
CNO Financial Group, Inc., 144A,
6.375%, due 10/01/20 (e) | | | 26,060 | | | | 27,493 | | |
See accompanying Notes to Financial Statements.
16 OAKMARK FUNDS
Oakmark Equity and Income Fund March 31, 2015 (Unaudited)
Schedule of Investments (in thousands) (continued)
| | | Par Value | | Value | |
FIXED INCOME - 14.1% (continued) | |
CORPORATE BONDS - 5.9% (continued) | |
Credit Suisse New York,
1.75%, due 01/29/18 (d) | | $ | 24,700 | | | $ | 24,775 | | |
Penn National Gaming, Inc.,
5.875%, due 11/01/21 | | | 23,704 | | | | 23,526 | | |
Glencore Canada Corp.,
6.00%, due 10/15/15 (d) | | | 21,915 | | | | 22,474 | | |
Activision Blizzard, Inc., 144A,
5.625%, due 09/15/21 (e) | | | 20,965 | | | | 22,328 | | |
Lam Research Corp.,
2.75%, due 03/15/20 | | | 19,660 | | | | 19,770 | | |
JPMorgan Chase & Co.,
1.70%, due 03/01/18 | | | 19,665 | | | | 19,744 | | |
DIRECTV Holdings LLC / DIRECTV Financing Co., Inc.,
5.00%, due 03/01/21 | | | 16,710 | | | | 18,599 | | |
Scientific Games International, Inc., 144A,
10.00%, due 12/01/22 (e) | | | 19,665 | | | | 18,387 | | |
Dollar General Corp.,
4.125%, due 07/15/17 | | | 17,095 | | | | 17,982 | | |
Ultra Petroleum Corp., 144A,
6.125%, due 10/01/24 (e) | | | 19,665 | | | | 16,863 | | |
Valeant Pharmaceuticals International Inc, 144A,
5.625%, due 12/01/21 (d) (e) | | | 16,370 | | | | 16,616 | | |
Aon Corp.,
5.00%, due 09/30/20 | | | 14,745 | | | | 16,603 | | |
Anthem, Inc.,
5.875%, due 06/15/17 | | | 15,150 | | | | 16,572 | | |
Kinetic Concepts, Inc.,
12.50%, due 11/01/19 | | | 14,360 | | | | 15,688 | | |
Medtronic Inc., 144A,
3.15%, due 03/15/22 (d) (e) | | | 14,750 | | | | 15,316 | | |
Activision Blizzard, Inc., 144A,
6.125%, due 09/15/23 (e) | | | 13,615 | | | | 14,840 | | |
Zayo Group LLC / Zayo Capital Inc, 144A,
6.00%, due 04/01/23 (e) | | | 14,745 | | | | 14,819 | | |
Zimmer Holdings, Inc.,
1.45%, due 04/01/17 | | | 14,750 | | | | 14,779 | | |
Cleopatra Finance Ltd, 144A,
6.25%, due 02/15/22 (d) (e) | | | 14,800 | | | | 14,467 | | |
Cleopatra Finance Ltd, 144A,
6.50%, due 02/15/25 (d) (e) | | | 14,800 | | | | 14,282 | | |
Royal Caribbean Cruises, Ltd.,
7.25%, due 06/15/16 | | | 12,688 | | | | 13,481 | | |
Omega Healthcare Investors, Inc.,
5.875%, due 03/15/24 | | | 12,390 | | | | 13,195 | | |
GLP Capital, LP / GLP Financing II, Inc.,
5.375%, due 11/01/23 | | | 12,000 | | | | 12,405 | | |
BorgWarner, Inc.,
4.625%, due 09/15/20 | | | 10,810 | | | | 11,934 | | |
Bank of America Corp.,
5.25%, due 12/01/15 | | | 10,778 | | | | 11,068 | | |
Howard Hughes Corp., 144A,
6.875%, due 10/01/21 (e) | | | 10,000 | | | | 10,475 | | |
Omega Healthcare Investors, Inc.,
6.75%, due 10/15/22 | | | 9,865 | | | | 10,420 | | |
GLP Capital, LP / GLP Financing II, Inc.,
4.875%, due 11/01/20 | | | 10,000 | | | | 10,250 | | |
Six Flags Entertainment Corp., 144A,
5.25%, due 01/15/21 (e) | | | 9,970 | | | | 10,244 | | |
| | | Par Value | | Value | |
Kellogg Co.,
4.45%, due 05/30/16 | | $ | 9,835 | | | $ | 10,243 | | |
Valeant Pharmaceuticals International, 144A,
6.375%, due 10/15/20 (e) | | | 9,805 | | | | 10,185 | | |
Chevron Corp.,
1.365%, due 03/02/18 | | | 9,835 | | | | 9,883 | | |
Cleopatra Finance Ltd, 144A,
5.625%, due 02/15/20 (d) (e) | | | 9,800 | | | | 9,575 | | |
Tempur Sealy International, Inc.,
6.875%, due 12/15/20 | | | 8,819 | | | | 9,414 | | |
Sirius XM Radio Inc, 144A,
5.25%, due 08/15/22 (e) | | | 8,895 | | | | 9,384 | | |
Health Net, Inc.,
6.375%, due 06/01/17 | | | 8,680 | | | | 9,266 | | |
Glencore Funding LLC, 144A,
1.70%, due 05/27/16 (e) | | | 8,060 | | | | 8,094 | | |
E*TRADE Financial Corp.,
4.625%, due 09/15/23 | | | 7,865 | | | | 8,003 | | |
Quiksilver, Inc. / QS Wholesale, Inc., 144A,
7.875%, due 08/01/18 (e) | | | 8,630 | | | | 7,810 | | |
Quiksilver, Inc. / QS Wholesale, Inc.,
10.00%, due 08/01/20 | | | 10,810 | | | | 7,648 | | |
Omnicare, Inc.,
5.00%, due 12/01/24 | | | 6,880 | | | | 7,190 | | |
Omnicare, Inc.,
4.75%, due 12/01/22 | | | 6,880 | | | | 7,104 | | |
Whirlpool Corp.,
6.50%, due 06/15/16 | | | 6,610 | | | | 7,043 | | |
Scientific Games International, Inc., 144A,
7.00%, due 01/01/22 (e) | | | 6,885 | | | | 7,040 | | |
Concho Resources, Inc.,
5.50%, due 10/01/22 | | | 6,980 | | | | 7,032 | | |
Thermo Fisher Scientific, Inc.,
3.20%, due 03/01/16 | | | 6,839 | | | | 6,978 | | |
Credit Suisse Group AG, 144A,
6.25% (d) (e) (f) (g) | | | 7,000 | | | | 6,877 | | |
Quest Diagnostics, Inc.,
4.70%, due 04/01/21 | | | 5,128 | | | | 5,655 | | |
Bank of America Corp.,
5.625%, due 10/14/16 | | | 5,285 | | | | 5,627 | | |
Anadarko Petroleum Corp.,
5.95%, due 09/15/16 | | | 5,005 | | | | 5,339 | | |
CBRE Services, Inc.,
5.25%, due 03/15/25 | | | 4,915 | | | | 5,284 | | |
Serta Simmons Holdings LLC, 144A,
8.125%, due 10/01/20 (e) | | | 4,990 | | | | 5,252 | | |
E*TRADE Financial Corp.,
5.375%, due 11/15/22 | | | 4,910 | | | | 5,180 | | |
Foot Locker, Inc.,
8.50%, due 01/15/22 (b) | | | 4,340 | | | | 5,143 | | |
GLP Capital, LP / GLP Financing II, Inc.,
4.375%, due 11/01/18 | | | 5,000 | | | | 5,137 | | |
Scotiabank Peru SA, 144A,
4.50%, due 12/13/27 (d) (e) (f) | | | 5,000 | | | | 4,987 | | |
Zayo Group LLC / Zayo Capital, Inc.,
10.125%, due 07/01/20 | | | 3,445 | | | | 3,901 | | |
Omnicom Group, Inc.,
6.25%, due 07/15/19 | | | 2,950 | | | | 3,430 | | |
Family Tree Escrow LLC, 144A,
5.75%, due 03/01/23 (e) | | | 2,950 | | | | 3,105 | | |
Medtronic Inc., 144A,
1.50%, due 03/15/18 (d) (e) | | | 2,950 | | | | 2,963 | | |
See accompanying Notes to Financial Statements.
oakmark.com 17
Oakmark Equity and Income Fund March 31, 2015 (Unaudited)
Schedule of Investments (in thousands) (continued)
| | | Par Value | | Value | |
FIXED INCOME - 14.1% (continued) | |
CORPORATE BONDS - 5.9% (continued) | |
CVS Health Corp.,
2.25%, due 08/12/19 | | $ | 2,884 | | | $ | 2,929 | | |
Boston Scientific Corp.,
5.125%, due 01/12/17 | | | 2,546 | | | | 2,704 | | |
The Goldman Sachs Group, Inc.,
5.625%, due 01/15/17 | | | 2,095 | | | | 2,246 | | |
Live Nation Entertainment, Inc., 144A,
5.375%, due 06/15/22 (e) | | | 2,000 | | | | 2,040 | | |
Tyco Electronics Group SA,
6.55%, due 10/01/17 (d) | | | 1,385 | | | | 1,553 | | |
Family Tree Escrow LLC, 144A,
5.25%, due 03/01/20 (e) | | | 1,000 | | | | 1,048 | | |
Centene Corp.,
4.75%, due 05/15/22 | | | 1,000 | | | | 1,038 | | |
Post Holdings, Inc.,
7.375%, due 02/15/22 | | | 1,000 | | | | 1,035 | | |
Post Holdings, Inc., 144A,
6.75%, due 12/01/21 (e) | | | 1,000 | | | | 1,010 | | |
Ventas Realty, LP REIT,
3.50%, due 02/01/25 | | | 1,000 | | | | 1,004 | | |
The Goldman Sachs Group, Inc.,
2.55%, due 10/23/19 | | | 980 | | | | 994 | | |
VRX Escrow Corp, 144A,
5.875%, due 05/15/23 (d) (e) | | | 500 | | | | 513 | | |
VRX Escrow Corp, 144A,
5.375%, due 03/15/20 (d) (e) | | | 500 | | | | 504 | | |
Hologic, Inc.,
6.25%, due 08/01/20 | | | 250 | | | | 259 | | |
VRX Escrow Corp, 144A,
6.125%, due 04/15/25 (d) (e) | | | 250 | | | | 259 | | |
Total Corporate Bonds
(Cost $1,218,067) | | | | | 1,231,335 | | |
ASSET BACKED SECURITIES - 0.1% | |
Cabela's Master Credit Card Trust, 144A,
0.725%, due 10/15/19 (e) (f)
(Cost $11,450) | | | 11,450 | | | | 11,486 | | |
TOTAL FIXED INCOME - 14.1%
(COST $2,818,475) | | | | | 2,926,227 | | |
SHORT TERM INVESTMENTS - 22.2% | |
COMMERCIAL PAPER - 17.8% | |
Toyota Motor Credit Corp.,
0.08% - 0.17%,
due 04/14/15 - 06/23/15 (h) | | | 1,050,000 | | | | 1,049,854 | | |
MetLife Short Term Funding LLC, 144A,
0.11% - 0.15%,
due 04/01/15 - 05/28/15 (e) (h) | | | 500,076 | | | | 500,025 | | |
Philip Morris International, Inc., 144A,
0.07% - 0.13%,
due 04/20/15 - 05/26/15 (e) (h) | | | 442,924 | | | | 442,883 | | |
BMW US Capital LLC, 144A,
0.10% - 0.13%,
due 04/01/15 - 05/04/15 (e) (h) | | | 343,000 | | | | 342,979 | | |
American Honda Finance Corp.,
0.09% - 0.15%,
due 04/08/15 - 06/23/15 (h) | | | 257,000 | | | | 256,970 | | |
| | | Par Value | | Value | |
General Mills, Inc., 144A,
0.31% - 0.54%,
due 04/06/15 - 05/22/15 (e) (h) | | $ | 225,100 | | | $ | 225,045 | | |
State Street Corp.,
0.18%, due 05/11/15 - 06/17/15 (h) | | | 225,000 | | | | 224,930 | | |
Kellogg Co., 144A,
0.35% - 0.49%,
due 04/01/15 - 04/21/15 (e) (h) | | | 176,650 | | | | 176,622 | | |
Walgreens Boots,
0.50% - 0.56%,
due 04/08/15 - 04/17/15 (h) | | | 145,000 | | | | 144,978 | | |
Anthem, Inc., 144A,
0.30% - 0.38%,
due 04/01/15 - 04/15/15 (e) (h) | | | 125,000 | | | | 124,991 | | |
John Deere Capital Co., 144A,
0.11%, due 04/13/15 - 05/08/15 (e) (h) | | | 100,000 | | | | 99,993 | | |
J.P. Morgan Securities LLC,
0.21%, due 04/06/15 (h) | | | 50,000 | | | | 49,999 | | |
BP Capital Markets PLC, 144A,
0.60% - 0.63%,
due 10/16/15 - 11/02/15 (d) (e) (h) | | | 40,750 | | | | 40,643 | | |
Total Commercial Paper
(Cost $3,679,879) | | | | | 3,679,912 | | |
REPURCHASE AGREEMENT - 2.6% | |
Fixed Income Clearing Corp. Repurchase
Agreement, 0.01% dated 03/31/15 due
04/01/15, repurchase price $542,290,
collateralized by a United States Treasury
Note, 2.000%, due 10/31/21, value plus
accrued interest of $553,138
(Cost: $542,289) | | | 542,289 | | | | 542,289 | | |
CORPORATE BONDS - 1.8% | |
Kraft Foods Group, Inc.,
1.625%, due 06/04/15 | | | 39,971 | | | | 40,038 | | |
Bank of America Corp.,
4.50%, due 04/01/15 | | | 37,334 | | | | 37,334 | | |
ConAgra Foods, Inc.,
1.30%, due 01/25/16 | | | 33,563 | | | | 33,651 | | |
Capital One Financial Corp.,
5.50%, due 06/01/15 | | | 29,743 | | | | 29,977 | | |
American International Group, Inc.,
5.05%, due 10/01/15 | | | 25,655 | | | | 26,200 | | |
Amazon.com, Inc.,
0.65%, due 11/27/15 | | | 23,671 | | | | 23,696 | | |
Ford Motor Credit Co. LLC,
5.625%, due 09/15/15 | | | 22,850 | | | | 23,328 | | |
Thermo Fisher Scientific, Inc.,
3.20%, due 05/01/15 | | | 21,361 | | | | 21,409 | | |
The Goldman Sachs Group, Inc.,
1.60%, due 11/23/15 | | | 19,660 | | | | 19,774 | | |
JPMorgan Chase & Co.,
1.10%, due 10/15/15 | | | 18,438 | | | | 18,485 | | |
Willis North America, Inc.,
5.625%, due 07/15/15 | | | 14,005 | | | | 14,180 | | |
JPMorgan Chase & Co.,
5.15%, due 10/01/15 | | | 13,323 | | | | 13,599 | | |
AbbVie, Inc.,
1.20%, due 11/06/15 | | | 12,300 | | | | 12,318 | | |
SunTrust Bank,
0.553%, due 08/24/15 (f) | | | 11,470 | | | | 11,466 | | |
See accompanying Notes to Financial Statements.
18 OAKMARK FUNDS
Oakmark Equity and Income Fund March 31, 2015 (Unaudited)
Schedule of Investments (in thousands) (continued)
| | | Par Value | | Value | |
SHORT TERM INVESTMENTS - 22.2% (continued) | |
CORPORATE BONDS - 1.8% (continued) | |
The Goldman Sachs Group, Inc.,
3.30%, due 05/03/15 | | $ | 10,665 | | | $ | 10,692 | | |
Morgan Stanley,
1.75%, due 02/25/16 | | | 9,830 | | | | 9,894 | | |
Citigroup, Inc.,
4.875%, due 05/15/15 | | | 8,255 | | | | 8,290 | | |
Covidien International Finance SA,
2.80%, due 06/15/15 (d) | | | 8,240 | | | | 8,278 | | |
Capital One Financial Corp.,
1.00%, due 11/06/15 | | | 4,150 | | | | 4,155 | | |
Royal Caribbean Cruises, Ltd.,
11.875%, due 07/15/15 (d) | | | 2,950 | | | | 3,031 | | |
Citigroup, Inc.,
4.875%, due 05/07/15 | | | 2,160 | | | | 2,169 | | |
Bank of America Corp.,
7.75%, due 08/15/15 | | | 1,720 | | | | 1,762 | | |
Total Corporate Bonds (Cost $373,792) | | | | | 373,726 | | |
TOTAL SHORT TERM INVESTMENTS - 22.2%
(COST $4,595,960) | | | | | 4,595,927 | | |
TOTAL INVESTMENTS - 99.9%
(COST $15,960,423) | | | | | 20,708,278 | | |
Other Assets In Excess of Liabilities - 0.1% | | | | | 24,371 | | |
NET ASSETS - 100.0% | | | | $ | 20,732,649 | | |
(a) Non-income producing security
(b) See Note 5 in the Notes to Financial Statements regarding investments in affiliated issuers.
(c) Sponsored American Depositary Receipt
(d) Foreign domiciled corporation
(e) See Note 1 in the Notes to Financial Statements regarding restricted securities. These securities may be resold subject to restrictions on resale under federal securities law.
(f) Floating Rate Note. Rate shown is as of March 31, 2015.
(g) Security is perpetual and has no stated maturity date.
(h) The rate shown represents the annualized yield at the time of purchase; not a coupon rate.
See accompanying Notes to Financial Statements.
oakmark.com 19
Oakmark Global Fund March 31, 2015
Summary Information
VALUE OF A $10,000 INVESTMENT
Since Inception - 08/04/99 (Unaudited)
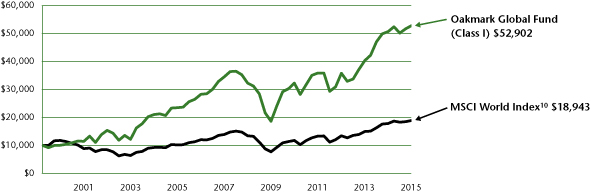
PERFORMANCE
| | | | Average Annual Total Returns (as of 03/31/15) | |
| (Unaudited) | | Total Return
Last 3 Months | | 1-year | | 3-year | | 5-year | | 10-year | | Since
Inception
(08/04/99) | |
Oakmark Global Fund (Class I) | | | 2.13 | % | | | 4.14 | % | | | 13.81 | % | | | 10.35 | % | | | 8.43 | % | | | 11.23 | % | |
MSCI World Index | | | 2.31 | % | | | 6.03 | % | | | 12.19 | % | | | 10.01 | % | | | 6.39 | % | | | 4.17 | % | |
Lipper Global Funds Index11 | | | 3.06 | % | | | 5.20 | % | | | 11.54 | % | | | 9.05 | % | | | 6.52 | % | | | 5.08 | % | |
The graph and table do not reflect the deduction of taxes that a shareholder would pay on Fund distributions or the redemption of Fund shares.
Past performance is no guarantee of future results. The performance data quoted represents past performance. Current performance may be lower or higher than the performance data quoted. Total return includes change in share prices and, in each case, includes reinvestment of dividends and capital gain distributions. The investment return and principal value vary so that an investor's shares when redeemed may be worth more or less than the original cost. To obtain the most recent month-end performance, please visit oakmark.com.
TOP TEN EQUITY HOLDINGS5 | | % of Net Assets | |
Credit Suisse Group AG | | | 5.8 | | |
Julius Baer Group, Ltd. | | | 4.7 | | |
TE Connectivity, Ltd. | | | 4.3 | | |
BNP Paribas SA | | | 3.9 | | |
General Motors Co. | | | 3.8 | | |
CNH Industrial N.V. | | | 3.5 | | |
The Interpublic Group of Cos., Inc. | | | 3.4 | | |
Bank Of America Corp. | | | 3.3 | | |
MasterCard, Inc., Class A | | | 3.3 | | |
Richemont SA | | | 3.2 | | |
FUND STATISTICS | |
Ticker | | OAKGX | |
Inception | | 08/04/99 | |
Number of Equity Holdings | | 41 | |
Net Assets | | $3.6 billion | |
Benchmark | | MSCI World Index | |
Weighted Average Market Cap | | $72.1 billion | |
Median Market Cap | | $27.7 billion | |
Portfolio Turnover (for the 6-months ended 03/31/15) | | 19% | |
Expense Ratio - Class I (as of 09/30/14) | | 1.11% | |
SECTOR ALLOCATION | | % of Net Assets | |
Financials | | | 27.6 | | |
Information Technology | | | 23.4 | | |
Consumer Discretionary | | | 16.6 | | |
Industrials | | | 12.4 | | |
Consumer Staples | | | 5.2 | | |
Health Care | | | 5.2 | | |
Materials | | | 4.7 | | |
Energy | | | 4.0 | | |
Short-Term Investments and Other | | | 0.9 | | |
GEOGRAPHIC ALLOCATION | |
| | % of Equity | |
Europe | | | 43.5 | | |
Switzerland | | | 22.6 | | |
Netherlands* | | | 6.8 | | |
France* | | | 5.6 | | |
U.K. | | | 4.4 | | |
Germany* | | | 4.1 | | |
North America | | | 43.1 | | |
United States | | | 43.1 | | |
| | % of Equity | |
Asia | | | 10.3 | | |
Japan | | | 7.8 | | |
South Korea | | | 2.5 | | |
Australasia | | | 3.1 | | |
Australia | | | 3.1 | | |
* Euro currency countries comprise 16.5% of equity investments
20 OAKMARK FUNDS
Oakmark Global Fund March 31, 2015
Portfolio Manager Commentary


Clyde S. McGregor, CFA
Portfolio Manager
oakgx@oakmark.com
Robert A. Taylor, CFA
Portfolio Manager
oakgx@oakmark.com
The Divergences Reverse
In the March quarter the Oakmark Global Fund gained 2%, the same as the MSCI World Index10 return in the period and less than the Lipper Global Funds Index's11 gain of 3%. For the first six months of the Fund's fiscal year the Fund returned 5%, compared to 3% for the MSCI World Index and 4% for the Lipper Global Funds Index. Since inception in 1999, the Fund has achieved a compound annual rate of return of 11%, which compares to 4% for the MSCI World Index and 5% for the Lipper Global Funds Index.
For the past few quarters, we have written about the strong performance of U.S. equities relative to the rest of the world. The first calendar quarter broke this trend. Most developed markets outperformed the U.S., and this was also true within the Global Fund. European equities in particular benefited from the European Central Bank's initiation of a larger than expected quantitative easing program. The countries that contributed most to the Fund's return were Switzerland, Japan, Australia and Germany, and both Australia and Germany had to overcome significant currency headwinds. Switzerland made headlines in the quarter when its central bank allowed the franc to float freely, but the effect, though initially substantial versus the euro, proved to be modest over the quarter relative to the dollar. The only countries to produce negative March quarter returns in the Fund were the U.S. and the U.K. The individual holdings that contributed most to return were TE Connectivity (Switzerland), Incitec Pivot (Australia), Daimler (Germany), Julius Baer (Switzerland) and Credit Suisse (Switzerland). Fund holdings that detracted most from return were National Oilwell Varco (U.S.), Bank of America (U.S.), Intel (U.S.), Chesapeake Energy (U.S.) and Richemont (Switzerland).
For the fiscal year that began October 1, the countries that contributed the most to the Fund's return were Switzerland, the U.S. and Australia, and the detractors from return were the Netherlands, France and the U.K. The five largest contributors to Fund return in the period were TE Connectivity, Incitec Pivot, Health Net (U.S.), Interpublic Group (U.S.) and Daimler. The Fund holdings that detracted most were National Oilwell Varco, Tenet Healthcare (U.S.), Chesapeake Energy, Bank of America and Philips (Netherlands).
Energy industry holdings have impaired Fund returns for the past two quarters. Given the difficult fundamental environment for this industry, it is fortunate that the Fund's energy allocation is only 4%. Since we are value investors who are always interested in companies with deflated share prices, it is natural that clients have frequently asked if we are planning to increase the Fund's energy commitment. The answer is that we do not have such plans, but we are actively researching the industry in order to uncover the most attractive opportunities. The volatility of commodity prices makes it challenging to understand the true business value of companies in extractive industries. To
that end, we focus on developing valuation techniques that are not completely dependent on commodity price forecasts.
Credit Suisse
Credit Suisse, the Fund's largest holding, had a volatile quarter due to recent news, but it ended the quarter with a gain of 6.5% in U.S. dollar terms over the period. The stock fell around 20% during January because of concerns that potential new capital requirements could require that the company raise additional equity. The company reported strong results in early February that helped allay the capital concerns, as did the rumors that any new capital requirements, if passed at all by the regulator, wouldn't be implemented until late 2015/early 2016, which would give Credit Suisse ample time to build capital. We view Credit Suisse's balance sheet and free cash flow generation as more than adequate to meet capital requirement deadlines set for 2019 and beyond.
Recently Credit Suisse announced that Brady Dougan will step down as CEO by the end of June and that Tidjane Thiam, the current CEO of Prudential PLC, will take his place. Brady's eight-year tenure during the financial crisis was one of the longest of any CEO of a major financial company, highlighting his ability to navigate through the crisis. His plan to grow the wealth management business while reducing capital from the investment bank is one that should build per share value at Credit Suisse. Tidjane is supportive of this transition as well. He appears to be smart, returns driven, politically savvy and a proven leader who has experience in Asian markets and the wealth management business. While it's still early, we view these changes positively.
Portfolio Activity
Our trading activity in the quarter produced one new international holding and one U.S. elimination. Combined with the divergence in regional investment return, the net effect was to increase the international allocation in the Fund by 3% versus the U.S. As always, we do not target specific country weights but construct the portfolio from the bottom up. It is usually the case, however, that the change in weights over time reflects our general perception of where value is most available.
We initiated a position in Allianz (Germany) at around 1x forward NAV, 10x earnings and a 5% dividend yield. About one-half of Allianz's business value comes from its property and casualty business, which has strong market share in Germany and Italy and generates high teens/low twenties returns on equity. About one-quarter of its business value comes from its life insurance business—an average business, in our view, with adequate returns and growth. The remainder of the company is the asset management business, namely PIMCO. The company has experienced outflows worth over $200 billion since PIMCO co-founder, Bill Gross, left in late September. In recent months, though, outflows have diminished to what we believe is a
oakmark.com 21
Oakmark Global Fund March 31, 2015
Portfolio Manager Commentary (continued)
manageable level, new management has been installed, morale has improved and returns at the flagship PIMCO Total Return Fund through February 2015 have outperformed its benchmark and peers since Gross's departure. While our assessment of Allianz's fair value dropped right after Gross left, it now exceeds our previous value estimate due to better than expected fund flows, the company's cost saving measures and a weaker euro. With what we consider a good management team and a solid balance sheet, Allianz is an attractive investment.
The only portfolio elimination was FedEx. We owned FedEx shares in the Fund for three years and eliminated the holding as the stock neared our sell target. Our buy/sell discipline is to establish buy/sell targets based on our estimate of intrinsic value. That estimate itself evolves with the passage of time as we incorporate new information. As a stock approaches its sell target, we usually reduce our position so we can purchase issues that we believe are more undervalued. Of course, not all of our investments end up fitting this model, but FedEx did. We would happily return to the stock should it again sell at a substantial discount to our value estimate.
Currency Hedges
While the U.S. dollar has appreciated against many global currencies, we still believe the Swiss franc and Australian dollar are overvalued. As a result, we defensively hedge a portion of the Fund's exposure. Approximately 33% of the Swiss franc and 18% of the Australian dollar were hedged at quarter-end.
Thank you for being our partners in the Oakmark Global Fund. Please feel free to contact us with your questions or comments.
22 OAKMARK FUNDS
Oakmark Global Fund March 31, 2015 (Unaudited)
Schedule of Investments (in thousands)
| | | Shares | | Value | |
COMMON STOCKS - 99.1% | |
FINANCIALS - 27.6% | |
DIVERSIFIED FINANCIALS - 15.8% | |
Credit Suisse Group AG (Switzerland)
Diversified Capital Markets | | | 7,724 | | | $ | 208,075 | | |
Julius Baer Group, Ltd. (Switzerland)
Asset Management & Custody Banks | | | 3,324 | | | | 166,797 | | |
Daiwa Securities Group, Inc. (Japan)
Investment Banking & Brokerage | | | 12,861 | | | | 101,442 | | |
Franklin Resources, Inc. (United States)
Asset Management & Custody Banks | | | 1,697 | | | | 87,069 | | |
| | | | | | 563,383 | | |
BANKS - 10.3% | |
BNP Paribas SA (France)
Diversified Banks | | | 2,304 | | | | 140,158 | | |
Bank of America Corp. (United States)
Diversified Banks | | | 7,725 | | | | 118,892 | | |
Citigroup, Inc. (United States)
Diversified Banks | | | 2,064 | | | | 106,337 | | |
| | | | | | 365,387 | | |
INSURANCE - 1.5% | |
Allianz SE (Germany)
Multi-line Insurance | | | 302 | | | | 52,609 | | |
| | | | | | 981,379 | | |
INFORMATION TECHNOLOGY - 23.4% | |
TECHNOLOGY HARDWARE & EQUIPMENT - 9.9% | |
TE Connectivity, Ltd. (Switzerland)
Electronic Manufacturing Services | | | 2,143 | | | | 153,482 | | |
Samsung Electronics Co., Ltd. (South Korea)
Technology Hardware, Storage & Peripherals | | | 69 | | | | 89,204 | | |
Hirose Electric Co., Ltd. (Japan)
Electronic Components | | | 579 | | | | 75,085 | | |
Itron, Inc. (United States) (a)
Electronic Equipment & Instruments | | | 904 | | | | 32,998 | | |
| | | | | | 350,769 | | |
SOFTWARE & SERVICES - 9.1% | |
MasterCard, Inc., Class A (United States)
Data Processing & Outsourced Services | | | 1,342 | | | | 115,910 | | |
Oracle Corp. (United States)
Systems Software | | | 2,523 | | | | 108,880 | | |
Google, Inc., Class C (United States) (a)
Internet Software & Services | | | 184 | | | | 100,613 | | |
| | | | | | 325,403 | | |
SEMICONDUCTORS & SEMICONDUCTOR EQUIPMENT - 4.4% | |
Applied Materials, Inc. (United States)
Semiconductor Equipment | | | 3,658 | | | | 82,529 | | |
Intel Corp. (United States)
Semiconductors | | | 2,396 | | | | 74,907 | | |
| | | | | | 157,436 | | |
| | | | | | 833,608 | | |
| | | Shares | | Value | |
CONSUMER DISCRETIONARY - 16.6% | |
AUTOMOBILES & COMPONENTS - 8.7% | |
General Motors Co. (United States)
Automobile Manufacturers | | | 3,563 | | | $ | 133,594 | | |
Toyota Motor Corp. (Japan)
Automobile Manufacturers | | | 1,395 | | | | 97,533 | | |
Daimler AG (Germany) (b)
Automobile Manufacturers | | | 823 | | | | 79,395 | | |
| | | | | | 310,522 | | |
MEDIA - 4.7% | |
The Interpublic Group of Cos., Inc.
(United States)
Advertising | | | 5,521 | | | | 122,131 | | |
Live Nation Entertainment, Inc.
(United States) (a)
Movies & Entertainment | | | 1,688 | | | | 42,594 | | |
| | | | | | 164,725 | | |
CONSUMER DURABLES & APPAREL - 3.2% | |
Cie Financiere Richemont SA (Switzerland)
Apparel, Accessories & Luxury Goods | | | 1,414 | | | | 113,921 | | |
| | | | | | 589,168 | | |
INDUSTRIALS - 12.4% | |
CAPITAL GOODS - 7.6% | |
CNH Industrial N.V. (Netherlands)
Agricultural & Farm Machinery | | | 15,375 | | | | 125,971 | | |
Koninklijke Philips NV (Netherlands)
Industrial Conglomerates | | | 2,501 | | | | 71,051 | | |
Smiths Group PLC (UK)
Industrial Conglomerates | | | 2,395 | | | | 39,717 | | |
Travis Perkins PLC (UK)
Trading Companies & Distributors | | | 782 | | | | 22,624 | | |
Rheinmetall AG (Germany)
Industrial Conglomerates | | | 256 | | | | 12,386 | | |
| | | | | | 271,749 | | |
TRANSPORTATION - 4.2% | |
Union Pacific Corp. (United States)
Railroads | | | 1,015 | | | | 109,956 | | |
Kuehne + Nagel International AG (Switzerland)
Marine | | | 253 | | | | 37,634 | | |
| | | | | | 147,590 | | |
COMMERCIAL & PROFESSIONAL SERVICES - 0.6% | |
Adecco SA (Switzerland)
Human Resource & Employment Services | | | 261 | | | | 21,713 | | |
| | | | | | 441,052 | | |
See accompanying Notes to Financial Statements.
oakmark.com 23
Oakmark Global Fund March 31, 2015 (Unaudited)
Schedule of Investments (in thousands) (continued)
| | | Shares | | Value | |
Common Stocks - 99.1% (continued) | |
CONSUMER STAPLES - 5.2% | |
FOOD, BEVERAGE & TOBACCO - 5.2% | |
Diageo PLC (UK)
Distillers & Vintners | | | 3,359 | | | $ | 92,657 | | |
Danone SA (France)
Packaged Foods & Meats | | | 859 | | | | 57,828 | | |
Nestle SA (Switzerland)
Packaged Foods & Meats | | | 463 | | | | 34,948 | | |
| | | | | | 185,433 | | |
HEALTH CARE - 5.2% | |
HEALTH CARE EQUIPMENT & SERVICES - 5.2% | |
Health Net, Inc. (United States) (a)
Managed Health Care | | | 1,786 | | | | 108,023 | | |
Tenet Healthcare Corp. (United States) (a)
Health Care Facilities | | | 1,547 | | | | 76,596 | | |
| | | | | | 184,619 | | |
MATERIALS - 4.7% | |
Incitec Pivot, Ltd. (Australia)
Diversified Chemicals | | | 34,715 | | | | 107,614 | | |
Holcim, Ltd. (Switzerland)
Construction Materials | | | 816 | | | | 60,973 | | |
| | | | | | 168,587 | | |
ENERGY - 4.0% | |
National Oilwell Varco, Inc. (United States)
Oil & Gas Equipment & Services | | | 1,210 | | | | 60,493 | | |
Fugro NV (Netherlands)
Oil & Gas Equipment & Services | | | 1,569 | | | | 42,138 | | |
Chesapeake Energy Corp. (United States)
Oil & Gas Exploration & Production | | | 2,756 | | | | 39,022 | | |
| | | | | | 141,653 | | |
TOTAL COMMON STOCKS - 99.1%
(COST $2,907,427) | | | | | 3,525,499 | | |
| | | Par Value | | Value | |
SHORT TERM INVESTMENT - 0.2% | |
REPURCHASE AGREEMENT - 0.2% | |
Fixed Income Clearing Corp. Repurchase
Agreement, 0.01% dated 03/31/15 due
04/01/15, repurchase price $6,660,
collateralized by a United States Treasury
Note, 2.125%, due 06/30/21, value plus
accrued interest of $6,797 (Cost: $6,660) | | $ | 6,660 | | | $ | 6,660 | | |
TOTAL SHORT TERM INVESTMENTS - 0.2%
(COST $6,660) | | | | | 6,660 | | |
TOTAL INVESTMENTS - 99.3%
(COST $2,914,087) | | | | | 3,532,159 | | |
Foreign Currencies (Cost $0) - 0.0% (c) | | | | | 0 | (d) | |
Other Assets In Excess of Liabilities - 0.7% | | | | | 26,035 | | |
TOTAL NET ASSETS - 100.0% | | | | $ | 3,558,194 | | |
(a) Non-income producing security
(b) A portion of the security out on loan.
(c) Amount rounds to less than 0.1%.
(d) Amount rounds to less than $1,000.
See accompanying Notes to Financial Statements.
24 OAKMARK FUNDS

This page intentionally left blank.
oakmark.com 25
Oakmark Global Select Fund March 31, 2015
Summary Information
VALUE OF A $10,000 INVESTMENT
Since Inception - 10/02/06 (Unaudited)

PERFORMANCE
| | | | Average Annual Total Returns (as of 03/31/15) | |
| (Unaudited) | | Total Return
Last 3 Months | | 1-year | | 3-year | | 5-year | | Since
Inception
(10/02/06) | |
Oakmark Global Select Fund (Class I) | | | 2.43 | % | | | 3.50 | % | | | 13.68 | % | | | 11.35 | % | | | 8.60 | % | |
MSCI World Index | | | 2.31 | % | | | 6.03 | % | | | 12.19 | % | | | 10.01 | % | | | 4.99 | % | |
Lipper Global Funds Index11 | | | 3.06 | % | | | 5.20 | % | | | 11.54 | % | | | 9.05 | % | | | 5.01 | % | |
The graph and table do not reflect the deduction of taxes that a shareholder would pay on Fund distributions or the redemption of Fund shares.
Past performance is no guarantee of future results. The performance data quoted represents past performance. Current performance may be lower or higher than the performance data quoted. Total return includes change in share prices and, in each case, includes reinvestment of dividends and capital gain distributions. The investment return and principal value vary so that an investor's shares when redeemed may be worth more or less than the original cost. To obtain the most recent month-end performance, please visit oakmark.com.
TOP TEN EQUITY HOLDINGS5 | | % of Net Assets | |
Credit Suisse Group AG | | | 6.0 | | |
Amazon, Inc. | | | 5.8 | | |
TE Connectivity, Ltd. | | | 5.5 | | |
CNH Industrial N.V. | | | 5.3 | | |
Google, Inc., Class A | | | 5.2 | | |
Daiwa Securities Group, Inc. | | | 5.2 | | |
JPMorgan Chase & Co. | | | 5.1 | | |
American International Group, Inc. | | | 4.9 | | |
Bank Of America Corp. | | | 4.7 | | |
Richemont SA | | | 4.7 | | |
FUND STATISTICS | |
Ticker | | OAKWX | |
Inception | | 10/02/06 | |
Number of Equity Holdings | | 20 | |
Net Assets | | $2.0 billion | |
Benchmark | | MSCI World Index | |
Weighted Average Market Cap | | $99.6 billion | |
Median Market Cap | | $56.4 billion | |
Portfolio Turnover (for the 6-months ended 03/31/15) | | 31% | |
Expense Ratio - Class I (as of 09/30/14) | | 1.13% | |
SECTOR ALLOCATION | | % of Net Assets | |
Financials | | | 25.9 | | |
Information Technology | | | 24.4 | | |
Consumer Discretionary | | | 19.1 | | |
Industrials | | | 9.4 | | |
Consumer Staples | | | 8.2 | | |
Energy | | | 4.5 | | |
Materials | | | 3.9 | | |
Short-Term Investments and Other | | | 4.6 | | |
GEOGRAPHIC ALLOCATION | |
| | % of Equity | |
Europe | | | 48.5 | | |
Switzerland | | | 25.3 | | |
France* | | | 8.0 | | |
Netherlands* | | | 5.5 | | |
U.K. | | | 4.9 | | |
Germany* | | | 4.8 | | |
North America | | | 41.3 | | |
United States | | | 41.3 | | |
| | % of Equity | |
Asia | | | 10.2 | | |
Japan | | | 5.5 | | |
South Korea | | | 4.7 | | |
* Euro currency countries comprise 18.3% of equity investments
26 OAKMARK FUNDS
Oakmark Global Select Fund March 31, 2015
Portfolio Manager Commentary


William C. Nygren, CFA
Portfolio Manager
oakwx@oakmark.com
David G. Herro, CFA
Portfolio Manager
oakwx@oakmark.com
The Oakmark Global Select Fund returned 2% for the quarter ended March 31, 2015, in line with the MSCI World Index10. More importantly, the Fund has returned an average of 9% per year since inception, outperforming the MSCI World Index, which has averaged 5% per year over the same period.
The largest contributor to performance for the quarter was Amazon (U.S.), which returned 20% due to a positive fourth-quarter earnings report. Revenues increased nearly 15%, and gross margins improved 300 basis points year-over-year, as a continued shift in business mix proved to be beneficial. Investors also appreciated that earnings were better than expected, and they reacted favorably to management's plan to disclose detailed segment profitability information going forward. Overall, we believe Amazon continues to improve its operating metrics and is currently trading at a discount to the company's true worth.
Another large contributor for the quarter was TE Connectivity (Switzerland), a leading electronics manufacturer, which returned 14%. TE Connectivity's share price rose during the quarter following news of a deal to sell its telecom, enterprise and wireless businesses to CommScope. The company also released a positive first-quarter earnings report with earnings per share and gross margin results that exceeded market expectations. In addition, TE Connectivity announced that it would use proceeds from the CommScope deal to execute additional share repurchases, a move that adds to our confidence in management's commitment to maximizing shareholder returns.
The largest detractor for the quarter was Bank of America (U.S.), which fell 14%. Bank of America's shares were pressured by a host of factors this quarter—including the decline in interest rates—but investors were likely most disappointed by regulatory developments. First, regulators informed the company that it may need to modify its capital models in a way that could lower capital ratios. Second, the company received only "conditional" permission from the Federal Reserve to return capital to shareholders this year, as it must address "deficiencies" in its capital planning process. We believe investors' reactions to these issues were less about the actual impact to value and more about Bank of America's ability to return capital to shareholders over the next year or two. We continue to believe that Bank of America is significantly undervalued relative to its normalized earning power and believe management is committed to enhancing shareholder value.
Richemont (Switzerland), the world's second-largest luxury goods company, was the quarter's biggest detractor, falling 10%. Richemont's stock price fell after its fiscal nine-month sales update, which indicated a slow third quarter. Thus, even though the company's organic sales grew 2% for the full period, they still fell short of our forecast. Sales declined most in Hong Kong/Macau and in the company's specialty watch unit, both of which generate margins greater than the group's average.
Even so, sales in Europe and the Americas increased 9% and 7%, respectively, which we see as encouraging. We expect Richemont's near-term results will be negatively impacted by the stronger Swiss franc, as most of its watch manufacturing costs are denominated in francs while much of its revenues are not. However, the company's brands have pricing power, and management has already announced mid-single-digit price increases in Europe. Moves like these should offset some of the currency exchange rate volatility. While Richemont is facing some short-term headwinds, we believe the long-term growth prospects remain intact.
Geographically, we ended the quarter with our European holdings at 49% and Japanese and South Korean holdings at 5% each. The remainder of the Fund's investments, excluding cash, is in North America.
During the quarter we sold our position in Medtronic (U.S.) as it approached our estimate of intrinsic value. We purchased one new name during the quarter: Holcim (Switzerland), one of the world's largest cement makers.
While the U.S. dollar appreciated versus many foreign currencies during the quarter, we continued to believe some currencies are overvalued. As of quarter end, approximately 25% of the Swiss franc exposure was hedged.
We thank you, our shareholders, for your continued support and confidence.
oakmark.com 27
Oakmark Global Select Fund March 31, 2015 (Unaudited)
Schedule of Investments (in thousands)
| | | Shares | | Value | |
COMMON STOCKS - 95.4% | |
FINANCIALS - 25.9% | |
DIVERSIFIED FINANCIALS - 11.2% | |
Credit Suisse Group AG (Switzerland)
Diversified Capital Markets | | | 4,517 | | | $ | 121,676 | | |
Daiwa Securities Group, Inc. (Japan)
Investment Banking & Brokerage | | | 13,448 | | | | 106,072 | | |
| | | | | | 227,748 | | |
BANKS - 9.8% | |
JPMorgan Chase & Co. (United States)
Diversified Banks | | | 1,722 | | | | 104,319 | | |
Bank of America Corp. (United States)
Diversified Banks | | | 6,237 | | | | 95,987 | | |
| | | | | | 200,306 | | |
INSURANCE - 4.9% | |
American International Group, Inc.
(United States)
Multi-line Insurance | | | 1,822 | | | | 99,828 | | |
| | | | | | 527,882 | | |
INFORMATION TECHNOLOGY - 24.4% | |
SOFTWARE & SERVICES - 14.4% | |
Google, Inc., Class A (United States) (a)
Internet Software & Services | | | 192 | | | | 106,225 | | |
MasterCard, Inc., Class A (United States)
Data Processing & Outsourced Services | | | 1,100 | | | | 95,029 | | |
Oracle Corp. (United States)
Systems Software | | | 2,150 | | | | 92,773 | | |
| | | | | | 294,027 | | |
TECHNOLOGY HARDWARE & EQUIPMENT - 10.0% | |
TE Connectivity, Ltd. (Switzerland)
Electronic Manufacturing Services | | | 1,554 | | | | 111,290 | | |
Samsung Electronics Co., Ltd. (South Korea)
Technology Hardware, Storage & Peripherals | | | 70 | | | | 91,406 | | |
| | | | | | 202,696 | | |
| | | | | | 496,723 | | |
CONSUMER DISCRETIONARY - 19.1% | |
CONSUMER DURABLES & APPAREL - 8.7% | |
Cie Financiere Richemont SA (Switzerland)
Apparel, Accessories & Luxury Goods | | | 1,183 | | | | 95,333 | | |
Kering SA (France)
Apparel, Accessories & Luxury Goods | | | 419 | | | | 81,965 | | |
| | | | | | 177,298 | | |
RETAILING - 5.8% | |
Amazon.com, Inc. (United States) (a)
Internet Retail | | | 319 | | | | 118,700 | | |
AUTOMOBILES & COMPONENTS - 4.6% | |
Daimler AG (Germany) (b)
Automobile Manufacturers | | | 971 | | | | 93,665 | | |
| | | | | | 389,663 | | |
| | | Shares | | Value | |
INDUSTRIALS - 9.4% | |
CAPITAL GOODS - 5.3% | |
CNH Industrial N.V. (Netherlands)
Agricultural & Farm Machinery | | | 13,078 | | | $ | 107,149 | | |
TRANSPORTATION - 4.1% | |
Kuehne + Nagel International AG
(Switzerland)
Marine | | | 565 | | | | 83,937 | | |
| | | | | | 191,086 | | |
CONSUMER STAPLES - 8.2% | |
FOOD, BEVERAGE & TOBACCO - 8.2% | |
Diageo PLC (UK)
Distillers & Vintners | | | 3,433 | | | | 94,692 | | |
Danone SA (France)
Packaged Foods & Meats | | | 1,084 | | | | 72,985 | | |
| | | | | | 167,677 | | |
ENERGY - 4.5% | |
Apache Corp. (United States)
Oil & Gas Exploration & Production | | | 1,500 | | | | 90,495 | | |
MATERIALS - 3.9% | |
Holcim, Ltd. (Switzerland)
Construction Materials | | | 1,069 | | | | 79,939 | | |
TOTAL COMMON STOCKS - 95.4%
(COST $1,783,023) | | | | | 1,943,465 | | |
| | | Par Value | | Value | |
SHORT TERM INVESTMENTS - 4.1% | |
REPURCHASE AGREEMENT - 4.1% | |
Fixed Income Clearing Corp. Repurchase
Agreement, 0.01% dated 03/31/15 due
04/01/15, repurchase price $84,381,
collateralized by a Federal Home Loan
Bank Bond, 2.500%, due 02/09/24,
value plus accrued interest of $16,766,
by a Federal National Mortgage
Association Bond, 2.635%, due
09/13/23, value plus accrued interest
of $49,075, by a United States Treasury
Note, 2.500%, due 05/15/24, value
plus accrued interest of $20,230
(Cost: $84,381) | | $ | 84,381 | | | | 84,381 | | |
TOTAL SHORT TERM INVESTMENTS - 4.1%
(COST $84,381) | | | | | 84,381 | | |
TOTAL INVESTMENTS - 99.5%
(COST $1,867,404) | | | | | 2,027,846 | | |
Other Assets In Excess of Liabilities - 0.5% | | | | | 9,616 | | |
TOTAL NET ASSETS - 100.0% | | | | $ | 2,037,462 | | |
(a) Non-income producing security
(b) A portion of the security out on loan.
See accompanying Notes to Financial Statements.
28 OAKMARK FUNDS

This page intentionally left blank.
oakmark.com 29
Oakmark International Fund March 31, 2015
Summary Information
VALUE OF A $10,000 INVESTMENT
Since Inception - 09/30/92 (Unaudited)
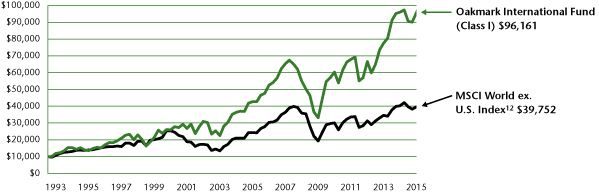
PERFORMANCE
| | | | Average Annual Total Returns (as of 03/31/15) | |
| (Unaudited) | | Total Return
Last 3 Months | | 1-year | | 3-year | | 5-year | | 10-year | | Since
Inception
(09/30/92) | |
Oakmark International Fund (Class I) | | | 6.51 | % | | | -0.05 | % | | | 12.97 | % | | | 9.73 | % | | | 8.44 | % | | | 10.58 | % | |
MSCI World ex U.S. Index | | | 3.83 | % | | | -1.39 | % | | | 8.24 | % | | | 5.72 | % | | | 5.03 | % | | | 6.33 | % | |
MSCI EAFE Index13 | | | 4.88 | % | | | -0.92 | % | | | 9.02 | % | | | 6.16 | % | | | 4.95 | % | | | 6.16 | % | |
Lipper International Funds Index14 | | | 5.07 | % | | | 0.19 | % | | | 9.06 | % | | | 6.35 | % | | | 5.82 | % | | | 7.23 | % | |
The graph and table above do not reflect the deduction of taxes that a shareholder would pay on Fund distributions or the redemption of Fund shares.
Past performance is no guarantee of future results. The performance data quoted represents past performance. Current performance may be lower or higher than the performance data quoted. Total return includes change in share prices and, in each case, includes reinvestment of dividends and capital gain distributions. The investment return and principal value vary so that an investor's shares when redeemed may be worth more or less than the original cost. To obtain the most recent month-end performance, please visit oakmark.com.
TOP TEN EQUITY HOLDINGS5 | | % of Net Assets | |
Credit Suisse Group AG | | | 5.8 | | |
BNP Paribas SA | | | 4.2 | | |
Allianz SE | | | 3.7 | | |
Honda Motor Co., Ltd. | | | 3.5 | | |
Toyota Motor Corp. | | | 3.5 | | |
Richemont SA | | | 3.4 | | |
Diageo PLC | | | 3.1 | | |
Samsung Electronics Co., Ltd. | | | 3.1 | | |
Intesa Sanpaolo SPA | | | 3.0 | | |
Bayerische Motoren Werke (BMW) AG | | | 2.9 | | |
FUND STATISTICS | |
Ticker | | OAKIX | |
Inception | | 09/30/92 | |
Number of Equity Holdings | | 55 | |
Net Assets | | $29.6 billion | |
Benchmark | | MSCI World ex U.S. Index | |
Weighted Average Market Cap | | $56.6 billion | |
Median Market Cap | | $18.3 billion | |
Portfolio Turnover (for the 6-months ended 03/31/15) | | 15% | |
Expense Ratio - Class I (as of 09/30/14) | | 0.95% | |
SECTOR ALLOCATION | | % of Net Assets | |
Financials | | | 28.5 | | |
Consumer Discretionary | | | 26.2 | | |
Industrials | | | 20.2 | | |
Consumer Staples | | | 8.9 | | |
Materials | | | 4.9 | | |
Information Technology | | | 4.2 | | |
Health Care | | | 1.9 | | |
Short-Term Investments and Other | | | 5.2 | | |
GEOGRAPHIC ALLOCATION | |
| | % of Equity | |
Europe | | | 80.3 | | |
Switzerland | | | 19.2 | | |
U.K. | | | 16.6 | | |
France* | | | 14.3 | | |
Germany* | | | 11.4 | | |
Italy* | | | 6.3 | | |
Netherlands* | | | 6.2 | | |
Sweden | | | 3.9 | | |
Ireland* | | | 2.4 | | |
| | % of Equity | |
Asia | | | 15.8 | | |
Japan | | | 11.1 | | |
South Korea | | | 3.2 | | |
Hong Kong | | | 1.5 | | |
Australasia | | | 3.7 | | |
Australia | | | 3.7 | | |
Middle East | | | 0.2 | | |
Israel | | | 0.2 | | |
* Euro currency countries comprise 40.6% of equity investments
30 OAKMARK FUNDS
Oakmark International Fund March 31, 2015
Portfolio Manager Commentary


David G. Herro, CFA
Portfolio Manager
oakix@oakmark.com
Robert A. Taylor, CFA
Portfolio Manager
oakix@oakmark.com
The Oakmark International Fund returned 7% for the quarter ended March 31, 2015, outperforming the MSCI World ex U.S. Index12, which returned 4% over the same period. Most importantly, the Fund has returned an average of 11% per year since its inception in September 1992, outperforming the MSCI World ex U.S. Index, which has averaged 6% per year over the same period.
Intesa Sanpaolo, an Italian retail and commercial bank, was the top contributor for the quarter, returning 16%. Intesa's fiscal-year results showed core revenue growth of 7%. We found these results impressive for an Italian bank, given that Italian GDP hasn't been growing, there is low banking penetration and the household savings rate is high. We believe Intesa's performance reflects management's focus on growing fee-based businesses. Asset quality continues to improve with non-performing loan formation at its lowest level since 2011, down 22% year-over-year, and management expects it to fall even further in 2015. Intesa's balance sheet remains very strong with a leverage ratio around 7%, one of the best in Europe, and its liquidity far exceeds requirements. Management has also announced a dividend increase, which will return additional capital to shareholders in 2015. We believe Intesa has a strong position and will continue to provide value for our shareholders.
Another top contributor for the quarter was Daimler (Germany), the global auto manufacturer of the Mercedes brand, which returned 15%. Daimler reported full-year 2014 unit sales of 2.5 million vehicles (its best unit-sales year ever), which resulted in a 10% revenue increase and a 38% increase in underlying Industrial earnings. The company's largest division, Mercedes-Benz, continued its strong performance (14% revenue growth and 10% unit growth year-over-year along with improved margins), driven by strong performance in China, robust S-Class model sales and the launch of the new C-Class model. Overall, the results were as we expected, and management predicts these positive trends will continue in 2015.
Richemont (Switzerland), the world's second-largest luxury goods company, was the quarter's biggest detractor, falling 10%. Richemont's stock price fell after its fiscal nine-month sales update, which indicated a slow third quarter. Thus, even though the company's organic sales grew 2% for the full period, they still fell short of our forecast. Sales declined most in Hong Kong/Macau and in the company's specialty watch unit, both of which generate margins greater than the group's average. Even so, sales in Europe and the Americas increased 9% and 7%, respectively, which we see as encouraging. We expect Richemont's near-term results will be negatively impacted by the stronger Swiss franc, as most of its watch manufacturing costs are denominated in francs while much of its revenues are not. However, the company's brands have pricing power, and management has already announced mid-single-digit price increases in Europe. Moves like these should offset some of the
currency exchange rate volatility. While Richemont is facing some short-term headwinds, we believe the long-term growth prospects remain intact.
An additional detractor for the quarter was Melco Crown Entertainment (Hong Kong), which is a developer and owner of casino gaming and entertainment resort facilities in Asia. Casino revenues in Macau were weak due to China's anti-corruption campaign, difficult year-over-year comparisons and a weaker macro environment. Although we continue to monitor the market, we remain optimistic about Macau's long-term prospects, given low penetration of Chinese visitors, continued wealth creation of Chinese citizens and large infrastructure projects, which should help facilitate the growth of Macau.
During the quarter we sold our positions in Ahold (Netherlands), Canon (Japan), Continental (Germany) and Thomson Reuters (Canada) as they approached or hit our estimate of intrinsic value. We purchased two new names during the quarter: Komatsu (Japan), a global construction and mining equipment manufacturer; and adidas, a German-based athletic footwear, apparel and equipment company.
Geographically, we ended the quarter with 80% of our holdings in Europe, 11% in Japan and 4% in Australia. The remaining positions are in South Korea, Hong Kong and the Middle East (Israel).
While the U.S. dollar appreciated versus many foreign currencies during the quarter, we continue to believe some currencies are overvalued. As of quarter end, approximately 31% of the Swiss franc and 21% of the Australian dollar were hedged.
We would like to thank you for your continued support!
oakmark.com 31
Oakmark International Fund March 31, 2015 (Unaudited)
Schedule of Investments (in thousands)
| | | Shares | | Value | |
COMMON STOCKS - 94.8% | |
FINANCIALS - 28.5% | |
DIVERSIFIED FINANCIALS - 10.7% | |
Credit Suisse Group AG (Switzerland)
Diversified Capital Markets | | | 63,603 | | | $ | 1,713,446 | | |
Daiwa Securities Group, Inc. (Japan)
Investment Banking & Brokerage | | | 87,280 | | | | 688,430 | | |
Schroders PLC (UK)
Asset Management & Custody Banks | | | 10,493 | | | | 498,103 | | |
Exor SPA (Italy)
Multi-Sector Holdings | | | 6,306 | | | | 286,770 | | |
Schroders PLC, Non-Voting (UK)
Asset Management & Custody Banks | | | 31 | | | | 1,130 | | |
| | | | | | 3,187,879 | | |
BANKS - 10.0% | |
BNP Paribas SA (France)
Diversified Banks | | | 20,395 | | | | 1,240,558 | | |
Intesa Sanpaolo SPA (Italy)
Diversified Banks | | | 261,199 | | | | 889,185 | | |
Lloyds Banking Group PLC (UK) (a)
Diversified Banks | | | 712,382 | | | | 827,223 | | |
| | | | | | 2,956,966 | | |
INSURANCE - 7.8% | |
Allianz SE (Germany)
Multi-line Insurance | | | 6,372 | | | | 1,108,862 | | |
Willis Group Holdings PLC (UK) (b)
Insurance Brokers | | | 14,917 | | | | 718,707 | | |
AMP, Ltd. (Australia)
Life & Health Insurance | | | 96,775 | | | | 474,683 | | |
| | | | | | 2,302,252 | | |
| | | | | | 8,447,097 | | |
CONSUMER DISCRETIONARY - 26.2% | |
AUTOMOBILES & COMPONENTS - 12.8% | |
Honda Motor Co., Ltd. (Japan)
Automobile Manufacturers | | | 31,905 | | | | 1,038,272 | | |
Toyota Motor Corp. (Japan)
Automobile Manufacturers | | | 14,749 | | | | 1,030,920 | | |
Bayerische Motoren Werke (BMW) AG
(Germany)
Automobile Manufacturers | | | 6,896 | | | | 863,518 | | |
Daimler AG (Germany) (c)
Automobile Manufacturers | | | 8,917 | | | | 860,284 | | |
| | | | | | 3,792,994 | | |
| | | Shares | | Value | |
CONSUMER DURABLES & APPAREL - 10.1% | |
Cie Financiere Richemont SA (Switzerland)
Apparel, Accessories & Luxury Goods | | | 12,332 | | | $ | 993,632 | | |
Kering SA (France)
Apparel, Accessories & Luxury Goods | | | 3,690 | | | | 721,282 | | |
Prada SPA (Italy)
Apparel, Accessories & Luxury Goods | | | 100,394 | | | | 598,919 | | |
LVMH Moet Hennessy Louis Vuitton SE
(France)
Apparel, Accessories & Luxury Goods | | | 2,395 | | | | 422,776 | | |
Christian Dior SE (France)
Apparel, Accessories & Luxury Goods | | | 939 | | | | 177,360 | | |
adidas AG (Germany)
Apparel, Accessories & Luxury Goods | | | 1,052 | | | | 83,316 | | |
| | | | | | 2,997,285 | | |
MEDIA - 1.5% | |
WPP PLC (UK)
Advertising | | | 16,342 | | | | 371,150 | | |
Publicis Groupe SA (France)
Advertising | | | 920 | | | | 71,048 | | |
| | | | | | 442,198 | | |
CONSUMER SERVICES - 1.4% | |
Melco Crown Entertainment, Ltd.
(Hong Kong) (d)
Casinos & Gaming | | | 19,362 | | | | 415,509 | | |
RETAILING - 0.4% | |
Hennes & Mauritz AB (H&M) - Class B
(Sweden)
Apparel Retail | | | 3,386 | | | | 137,399 | | |
| | | | | | 7,785,385 | | |
INDUSTRIALS - 20.2% | |
CAPITAL GOODS - 13.4% | |
CNH Industrial N.V. (Netherlands) (b)
Agricultural & Farm Machinery | | | 93,721 | | | | 767,893 | | |
Koninklijke Philips NV (Netherlands)
Industrial Conglomerates | | | 25,029 | | | | 711,149 | | |
SKF AB (Sweden) (b) (c)
Industrial Machinery | | | 23,688 | | | | 612,829 | | |
Schindler Holding AG (Switzerland) (b)
Industrial Machinery | | | 2,282 | | | | 380,013 | | |
Smiths Group PLC (UK) (b)
Industrial Conglomerates | | | 22,771 | | | | 377,643 | | |
Safran SA (France)
Aerospace & Defense | | | 5,050 | | | | 352,951 | | |
Meggitt PLC (UK) (b)
Aerospace & Defense | | | 38,915 | | | | 316,627 | | |
Atlas Copco AB, Series B (Sweden)
Industrial Machinery | | | 8,905 | | | | 263,562 | | |
Wolseley PLC (UK)
Trading Companies & Distributors | | | 2,780 | | | | 164,670 | | |
Komatsu, Ltd. (Japan)
Construction Machinery & Heavy Trucks | | | 513 | | | | 10,109 | | |
| | | | | | 3,957,446 | | |
See accompanying Notes to Financial Statements.
32 OAKMARK FUNDS
Oakmark International Fund March 31, 2015 (Unaudited)
Schedule of Investments (in thousands) (continued)
| | | Shares | | Value | |
COMMON STOCKS - 94.8% (continued) | |
INDUSTRIALS - 20.2% (continued) | |
COMMERCIAL & PROFESSIONAL SERVICES - 4.8% | |
Experian PLC (Ireland)
Research & Consulting Services | | | 40,519 | | | $ | 671,376 | | |
Adecco SA (Switzerland)
Human Resource & Employment Services | | | 5,848 | | | | 487,467 | | |
Secom Co., Ltd. (Japan)
Security & Alarm Services | | | 1,992 | | | | 133,287 | | |
G4S PLC (UK)
Security & Alarm Services | | | 16,963 | | | | 74,432 | | |
Meitec Corp. (Japan) (b)
Research & Consulting Services | | | 2,006 | | | | 67,331 | | |
| | | | | | 1,433,893 | | |
TRANSPORTATION - 2.0% | |
Kuehne + Nagel International AG
(Switzerland)
Marine | | | 3,985 | | | | 592,512 | | |
| | | | | | 5,983,851 | | |
CONSUMER STAPLES - 8.9% | |
FOOD, BEVERAGE & TOBACCO - 8.9% | |
Diageo PLC (UK)
Distillers & Vintners | | | 32,864 | | | | 906,509 | | |
Danone SA (France)
Packaged Foods & Meats | | | 9,285 | | | | 625,175 | | |
Nestle SA (Switzerland)
Packaged Foods & Meats | | | 6,484 | | | | 489,712 | | |
Pernod Ricard SA (France)
Distillers & Vintners | | | 3,342 | | | | 395,799 | | |
Heineken Holdings NV (Netherlands)
Brewers | | | 1,922 | | | | 132,477 | | |
Swedish Match AB (Sweden)
Tobacco | | | 2,741 | | | | 80,724 | | |
| | | | | | 2,630,396 | | |
MATERIALS - 4.9% | |
Holcim, Ltd. (Switzerland)
Construction Materials | | | 9,980 | | | | 746,049 | | |
Orica, Ltd. (Australia) (b)
Commodity Chemicals | | | 37,166 | | | | 566,431 | | |
Akzo Nobel NV (Netherlands)
Specialty Chemicals | | | 1,805 | | | | 136,688 | | |
| | | | | | 1,449,168 | | |
INFORMATION TECHNOLOGY - 4.2% | |
TECHNOLOGY HARDWARE & EQUIPMENT - 3.1% | |
Samsung Electronics Co., Ltd. (South Korea)
Technology Hardware, Storage & Peripherals | | | 697 | | | | 904,728 | | |
| | | Shares | | Value | |
SOFTWARE & SERVICES - 1.1% | |
SAP SE (Germany)
Application Software | | | 3,876 | | | $ | 281,413 | | |
Check Point Software Technologies, Ltd.
(Israel) (a)
Systems Software | | | 651 | | | | 53,338 | | |
| | | | | | 334,751 | | |
| | | | | | 1,239,479 | | |
HEALTH CARE - 1.9% | |
PHARMACEUTICALS, BIOTECHNOLOGY & LIFE SCIENCES - 1.4% | |
GlaxoSmithKline PLC (UK)
Pharmaceuticals | | | 17,990 | | | | 412,571 | | |
HEALTH CARE EQUIPMENT & SERVICES - 0.5% | |
Olympus Corp. (Japan) (a)
Health Care Equipment | | | 3,809 | | | | 141,800 | | |
| | | | | | 554,371 | | |
TOTAL COMMON STOCKS - 94.8%
(COST $25,548,075) | | | | | 28,089,747 | | |
| | | Par Value | | Value | |
SHORT TERM INVESTMENTS - 4.3% | |
REPURCHASE AGREEMENT - 3.1% | |
Fixed Income Clearing Corp. Repurchase
Agreement, 0.01% dated 03/31/15 due
04/01/15, repurchase price $918,338,
collateralized by United States Treasury
Notes, 2.000% - 2.125%, due
06/30/21 - 09/30/21, aggregate value
plus accrued interest of $936,707
(Cost: $918,338) | | $ | 918,338 | | | | 918,338 | | |
GOVERNMENT AND AGENCY SECURITIES - 0.9% | |
United States Treasury Floating Rate Note,
0.089%, due 04/30/16 (e)
(Cost $250,000) | | | 250,000 | | | | 250,021 | | |
U.S. GOVERNMENT BILLS - 0.3% | |
United States Treasury Bill,
0.11%, due 09/10/15 (f)
(Cost $99,953) | | | 100,000 | | | | 99,958 | | |
TOTAL SHORT TERM INVESTMENTS - 4.3%
(COST $1,268,291) | | | | | 1,268,317 | | |
TOTAL INVESTMENTS - 99.1%
(COST $26,816,366) | | | | | 29,358,064 | | |
Foreign Currencies (Cost $3,890) - 0.0% (g) | | | | | 3,890 | | |
Other Assets In Excess of Liabilities - 0.9% | | | | | 276,919 | | |
TOTAL NET ASSETS - 100.0% | | | | $ | 29,638,873 | | |
(a) Non-income producing security
(b) See Note 5 in the Notes to Financial Statements regarding investments in affiliated issuers.
(c) A portion of the security out on loan.
(d) Sponsored American Depositary Receipt
(e) Floating Rate Note. Rate shown is as of March 31, 2015.
(f) The rate shown represents the annualized yield at the time of purchase; not a coupon rate.
(g) Amount rounds to less than 0.1%.
See accompanying Notes to Financial Statements.
oakmark.com 33
Oakmark International Small Cap Fund March 31, 2015
Summary Information
VALUE OF A $10,000 INVESTMENT
Since 03/31/05 (Unaudited)

PERFORMANCE
| | | | Average Annual Total Returns (as of 03/31/15) | |
| (Unaudited) | | Total Return
Last 3 Months | | 1-year | | 3-year | | 5-year | | 10-year | | Since
Inception
(11/01/95) | |
Oakmark International Small Cap Fund (Class I) | | | 9.20 | % | | | -1.46 | % | | | 8.34 | % | | | 7.98 | % | | | 7.18 | % | | | 10.17 | % | |
MSCI World ex U.S. Small Cap Index | | | 4.03 | % | | | -4.82 | % | | | 8.52 | % | | | 7.63 | % | | | 5.86 | % | | | N/A | | |
MSCI World ex U.S. Index12 | | | 3.83 | % | | | -1.39 | % | | | 8.24 | % | | | 5.72 | % | | | 5.03 | % | | | 5.46 | % | |
Lipper International Small Cap Funds Index16 | | | 5.18 | % | | | -2.96 | % | | | 10.52 | % | | | 9.31 | % | | | 7.53 | % | | | N/A | | |
The graph and table do not reflect the deduction of taxes that a shareholder would pay on Fund distributions or the redemption of Fund shares.
Past performance is no guarantee of future results. The performance data quoted represents past performance. Current performance may be lower or higher than the performance data quoted. Total return includes change in share prices and, in each case, includes reinvestment of dividends and capital gain distributions. The investment return and principal value vary so that an investor's shares when redeemed may be worth more or less than the original cost. The performance of the Fund does not reflect the 2% redemption fee imposed on shares redeemed within 90 days of purchase. To obtain the most recent month-end performance, please visit oakmark.com.
TOP TEN EQUITY HOLDINGS5 | | % of Net Assets | |
Julius Baer Group, Ltd. | | | 4.7 | | |
Incitec Pivot, Ltd. | | | 3.3 | | |
BS Financial Group, Inc. | | | 3.2 | | |
Panalpina Welttransport Holding AG | | | 3.0 | | |
Sulzer AG | | | 3.0 | | |
Hirose Electric Co., Ltd. | | | 3.0 | | |
Davide Campari-Milano S.p.A. | | | 2.8 | | |
Konecranes Plc | | | 2.8 | | |
MTU Aero Engines AG | | | 2.8 | | |
DGB Financial Group, Inc. | | | 2.7 | | |
FUND STATISTICS | |
Ticker | | OAKEX | |
Inception | | 11/01/95 | |
Number of Equity Holdings | | 59 | |
Net Assets | | $3.1 billion | |
Benchmark | | MSCI World ex U.S. Small Cap Index | |
Weighted Average Market Cap | | $3.1 billion | |
Median Market Cap | | $1.8 billion | |
Portfolio Turnover (for the 6-months ended 03/31/15) | | 23% | |
Expense Ratio - Class I (as of 09/30/14) | | 1.31% | |
SECTOR ALLOCATION | | % of Net Assets | |
Industrials | | | 38.0 | | |
Financials | | | 15.9 | | |
Information Technology | | | 15.7 | | |
Consumer Staples | | | 8.7 | | |
Consumer Discretionary | | | 6.6 | | |
Materials | | | 4.3 | | |
Health Care | | | 4.2 | | |
Energy | | | 0.8 | | |
Short-Term Investments and Other | | | 5.8 | | |
GEOGRAPHIC ALLOCATION | |
| | % of Equity | |
Europe | | | 64.4 | | |
Switzerland | | | 18.4 | | |
U.K. | | | 17.1 | | |
Italy* | | | 6.3 | | |
France* | | | 4.9 | | |
Germany* | | | 4.4 | | |
Finland* | | | 4.3 | | |
Netherlands* | | | 3.3 | | |
Norway | | | 2.7 | | |
Denmark | | | 1.4 | | |
Greece* | | | 0.9 | | |
Spain* | | | 0.7 | | |
| | % of Equity | |
Asia | | | 20.9 | | |
Japan | | | 10.8 | | |
South Korea | | | 6.3 | | |
Hong Kong | | | 3.5 | | |
China | | | 0.3 | | |
Australasia | | | 10.9 | | |
Australia | | | 10.3 | | |
New Zealand | | | 0.6 | | |
Latin America | | | 1.7 | | |
Brazil | | | 1.7 | | |
Middle East | | | 1.2 | | |
Israel | | | 1.2 | | |
North America | | | 0.9 | | |
Canada | | | 0.6 | | |
United States | | | 0.3 | | |
* Euro currency countries comprise 24.8% of equity investments
34 OAKMARK FUNDS
Oakmark International Small Cap Fund March 31, 2015
Portfolio Manager Commentary


David G. Herro, CFA
Portfolio Manager
oakex@oakmark.com
Michael L. Manelli, CFA
Portfolio Manager
oakex@oakmark.com
The Oakmark International Small Cap Fund returned 9% for the quarter ended March 31, 2015, outperforming the MSCI World ex U.S. Small Cap Index15, which returned 4% for the same period. Since the Fund's inception in November 1995, it has returned an average of 10% per year.
The top performing stock in the Fund this past quarter was Michael Page International, a U.K.-based professional recruitment firm. The Fund owns a number of other European staffing companies, including Randstad (Netherlands), Brunel (Netherlands) and SThree (U.K.), all of which were also strong contributors during the quarter. Even with high unemployment rates, staffing companies have maintained acceptable earnings due to strong demand and pricing despite market fears. Michael Page particularly benefited from improved sentiment in Europe and a growing sense that hiring activity will increase. Because of the company's high exposure to the more volatile permanent placement market, its earnings are especially sensitive to increased hiring trends. During 2014 Michael Page reported a respectable 15% year-over-year increase in EBIT. We expect the rate of EBIT growth to accelerate further in the coming years due to continued growth in hiring activity as well as Michael Page's productivity improvements, driven by a new IT system.
The Fund's largest detractor for the quarter was Melco International Development (Hong Kong), which is a developer and owner of casino gaming and entertainment resort facilities in Asia. Casino revenues in Macau were weak due to China's anti-corruption campaign, difficult year-over-year comparisons and a weaker macro environment. Although we continue to monitor the market, we remain optimistic about Macau's long-term prospects, given low penetration of Chinese visitors, continued wealth creation of Chinese citizens and large infrastructure projects, which should help facilitate the growth of Macau.
We added two new securities to the Fund during the quarter: China ZhengTong Auto Services, one of the five largest auto dealerships in China with 70 full-service dealerships and additional showrooms across the country, and Outotec, a Finland-based supplier of processing plants to the metals and minerals sector. During the quarter we sold Kansai Paint (Japan), Oracle Japan and Goodman Fielder (Australia) from the Fund.
Geographically, we ended the quarter with 64% of our holdings in Europe, 21% in Asia and 11% in Australasia. The remaining positions are in North America (Canada and the U.S.), Latin America (Brazil) and the Middle East (Israel).
At current U.S. dollar valuations we still maintain hedge positions on three of the Fund's currency exposures. As of the recent quarter end, the Fund's Australian dollar and Norwegian krone hedges decreased to 23% and 10%, respectively, and with the currency movement due to the unpegging of the Swiss franc to the euro in January 2015, our Swiss franc exposure increased slightly to 29%.
We thank you for your continued support.
oakmark.com 35
Oakmark International Small Cap Fund March 31, 2015 (Unaudited)
Schedule of Investments (in thousands)
| | | Shares | | Value | |
COMMON STOCKS - 94.2% | |
INDUSTRIALS - 38.0% | |
CAPITAL GOODS - 20.6% | |
Sulzer AG (Switzerland)
Industrial Machinery | | | 859 | | | $ | 94,536 | | |
Konecranes OYJ (Finland) (b)
Industrial Machinery | | | 2,737 | | | | 86,532 | | |
MTU Aero Engines AG (Germany)
Aerospace & Defense | | | 880 | | | | 86,399 | | |
Morgan Advanced Materials PLC (UK) (b)
Industrial Machinery | | | 13,849 | | | | 69,953 | | |
Bucher Industries AG (Switzerland)
Construction Machinery & Heavy Trucks | | | 287 | | | | 69,192 | | |
Saft Groupe SA (France) (b)
Electrical Components & Equipment | | | 1,596 | | | | 58,769 | | |
Travis Perkins PLC (UK)
Trading Companies & Distributors | | | 1,664 | | | | 48,122 | | |
Prysmian SpA (Italy)
Electrical Components & Equipment | | | 2,024 | | | | 41,769 | | |
Outotec OYJ (Finland) (c)
Construction & Engineering | | | 6,707 | | | | 41,110 | | |
Rheinmetall AG (Germany)
Industrial Conglomerates | | | 479 | | | | 23,160 | | |
Wajax Corp. (Canada) (b)
Trading Companies & Distributors | | | 860 | | | | 16,427 | | |
Interpump Group SpA (Italy)
Industrial Machinery | | | 591 | | | | 9,616 | | |
| | | | | | 645,585 | | |
COMMERCIAL & PROFESSIONAL SERVICES - 12.1% | |
Michael Page International PLC (UK)
Human Resource & Employment Services | | | 10,697 | | | | 82,752 | | |
Kaba Holding AG (Switzerland)
Security & Alarm Services | | | 111 | | | | 66,888 | | |
gategroup Holding AG (Switzerland) (b)
Diversified Support Services | | | 1,560 | | | | 52,736 | | |
Transpacific Industries Group, Ltd.
(Australia) (b)
Environmental & Facilities Services | | | 85,019 | | | | 51,480 | | |
Randstad Holding N.V. (Netherlands)
Human Resource & Employment Services | | | 745 | | | | 45,255 | | |
SThree PLC (UK) (b)
Human Resource & Employment Services | | | 6,359 | | | | 32,852 | | |
Brunel International N.V. (Netherlands)
Human Resource & Employment Services | | | 1,257 | | | | 24,066 | | |
Applus Services SA (Spain) (a)
Research & Consulting Services | | | 1,839 | | | | 20,703 | | |
| | | | | | 376,732 | | |
| | | Shares | | Value | |
TRANSPORTATION - 5.3% | |
Panalpina Welttransport Holding AG
(Switzerland)
Air Freight & Logistics | | | 649 | | | $ | 94,736 | | |
DSV AS (Denmark)
Trucking | | | 1,330 | | | | 41,385 | | |
Freightways, Ltd. (New Zealand)
Air Freight & Logistics | | | 3,784 | | | | 17,739 | | |
BBA Aviation PLC (UK)
Airport Services | | | 2,598 | | | | 12,970 | | |
| | | | | | 166,830 | | |
| | | | | | 1,189,147 | | |
FINANCIALS - 15.9% | |
BANKS - 5.9% | |
BS Financial Group, Inc. (South Korea)
Regional Banks | | | 7,341 | | | | 100,580 | | |
DGB Financial Group, Inc. (South Korea)
Regional Banks | | | 7,741 | | | | 84,422 | | |
| | | | | | 185,002 | | |
DIVERSIFIED FINANCIALS - 5.9% | |
Julius Baer Group, Ltd. (Switzerland)
Asset Management & Custody Banks | | | 2,943 | | | | 147,655 | | |
MLP AG (Germany)
Asset Management & Custody Banks | | | 4,568 | | | | 19,066 | | |
Ichiyoshi Securities Co., Ltd. (Japan)
Investment Banking & Brokerage | | | 1,585 | | | | 17,202 | | |
| | | | | | 183,923 | | |
REAL ESTATE - 4.1% | |
Countrywide PLC (UK)
Diversified Real Estate Activities | | | 9,844 | | | | 75,055 | | |
LSL Property Services PLC (UK) (b)
Real Estate Services | | | 10,416 | | | | 52,301 | | |
| | | | | | 127,356 | | |
| | | | | | 496,281 | | |
INFORMATION TECHNOLOGY - 15.7% | |
SOFTWARE & SERVICES - 7.9% | |
Atea ASA (Norway) (b)
IT Consulting & Other Services | | | 7,191 | | | | 81,005 | | |
Totvs SA (Brazil)
Systems Software | | | 4,511 | | | | 51,589 | | |
Alten, Ltd. (France)
IT Consulting & Other Services | | | 1,001 | | | | 45,981 | | |
Altran Technologies SA (France)
IT Consulting & Other Services | | | 3,817 | | | | 38,222 | | |
Capcom Co., Ltd. (Japan)
Home Entertainment Software | | | 1,603 | | | | 31,924 | | |
| | | | | | 248,721 | | |
See accompanying Notes to Financial Statements.
36 OAKMARK FUNDS
Oakmark International Small Cap Fund March 31, 2015 (Unaudited)
Schedule of Investments (in thousands) (continued)
| | | Shares | | Value | |
COMMON STOCKS - 94.2% (continued) | |
INFORMATION TECHNOLOGY - 15.7% (continued) | |
TECHNOLOGY HARDWARE & EQUIPMENT - 7.8% | |
Hirose Electric Co., Ltd. (Japan)
Electronic Components | | | 730 | | | $ | 94,526 | | |
Premier Farnell PLC (UK) (b)
Technology Distributors | | | 25,092 | | | | 68,860 | | |
Electrocomponents PLC (UK)
Technology Distributors | | | 12,682 | | | | 45,431 | | |
Orbotech, Ltd. (Israel) (a) (b)
Electronic Equipment & Instruments | | | 2,129 | | | | 34,134 | | |
| | | | | | 242,951 | | |
| | | | | | 491,672 | | |
CONSUMER STAPLES - 8.7% | |
FOOD, BEVERAGE & TOBACCO - 4.9% | |
Davide Campari-Milano SPA (Italy)
Distillers & Vintners | | | 12,440 | | | | 86,878 | | |
Treasury Wine Estates, Ltd. (Australia)
Distillers & Vintners | | | 17,348 | | | | 67,653 | | |
| | | | | | 154,531 | | |
FOOD & STAPLES RETAILING - 3.8% | |
Sugi Holdings Co., Ltd. (Japan)
Drug Retail | | | 1,670 | | | | 82,720 | | |
Sundrug Co., Ltd. (Japan)
Drug Retail | | | 684 | | | | 35,566 | | |
| | | | | | 118,286 | | |
| | | | | | 272,817 | | |
CONSUMER DISCRETIONARY - 6.6% | |
RETAILING - 2.6% | |
Hengdeli Holdings, Ltd. (Hong Kong) (b)
Specialty Stores | | | 245,477 | | | | 45,596 | | |
Carpetright PLC (UK) (a)
Home Improvement Retail | | | 2,595 | | | | 16,934 | | |
Myer Holdings, Ltd. (Australia)
Department Stores | | | 10,702 | | | | 11,045 | | |
China ZhengTong Auto Services
Holdings, Ltd. (China)
Automotive Retail | | | 20,178 | | | | 9,526 | | |
| | | | | | 83,101 | | |
CONSUMER SERVICES - 1.9% | |
Melco International Development, Ltd.
(Hong Kong)
Casinos & Gaming | | | 35,240 | | | | 59,364 | | |
MEDIA - 1.8% | |
Hakuhodo DY Holdings, Inc. (Japan)
Advertising | | | 2,986 | | | | 31,844 | | |
Asatsu-DK, Inc. (Japan)
Advertising | | | 860 | | | | 23,473 | | |
| | | | | | 55,317 | | |
| | | Shares | | Value | |
AUTOMOBILES & COMPONENTS - 0.3% | |
Autoliv, Inc. (United States)
Auto Parts & Equipment | | | 79 | | | $ | 9,292 | | |
| | | | | | 207,074 | | |
MATERIALS - 4.3% | |
Incitec Pivot, Ltd. (Australia)
Diversified Chemicals | | | 33,000 | | | | 102,297 | | |
Titan Cement Co. SA (Greece)
Construction Materials | | | 1,088 | | | | 25,010 | | |
Sika AG (Switzerland)
Specialty Chemicals | | | 2 | | | | 6,766 | | |
| | | | | | 134,073 | | |
HEALTH CARE - 4.2% | |
HEALTH CARE EQUIPMENT & SERVICES - 3.9% | |
Primary Health Care, Ltd. (Australia)
Health Care Services | | | 17,246 | | | | 72,244 | | |
Amplifon S.p.A. (Italy)
Health Care Distributors | | | 7,050 | | | | 48,021 | | |
| | | | | | 120,265 | | |
PHARMACEUTICALS, BIOTECHNOLOGY & LIFE SCIENCES - 0.3% | |
Tecan Group AG (Switzerland)
Life Sciences Tools & Services | | | 80 | | | | 10,504 | | |
| | | | | | 130,769 | | |
ENERGY - 0.8% | |
Fugro NV (Netherlands)
Oil & Gas Equipment & Services | | | 990 | | | | 26,580 | | |
TOTAL COMMON STOCKS - 94.2%
(COST $2,766,610) | | | | | 2,948,413 | | |
| | | Par Value | | Value | |
SHORT TERM INVESTMENTS - 4.4% | |
REPURCHASE AGREEMENT - 4.4% | |
Fixed Income Clearing Corp. Repurchase
Agreement, 0.01% dated 03/31/15 due
04/01/15, repurchase price $138,255,
collateralized by a United States Treasury
Note, 2.125% due 06/30/21, value
plus accrued interest of $141,024
(Cost: $138,255) | | $ | 138,255 | | | | 138,255 | | |
TOTAL SHORT TERM INVESTMENTS - 4.4%
(COST $138,255) | | | | | 138,255 | | |
TOTAL INVESTMENTS - 98.6%
(COST $2,904,865) | | | | | 3,086,668 | | |
Foreign Currencies (Cost $0) - 0.0% (d) | | | | | 0 | (e) | |
Other Assets In Excess of Liabilities - 1.4% | | | | | 44,084 | | |
TOTAL NET ASSETS - 100.0% | | | | $ | 3,130,752 | | |
(a) Non-income producing security
(b) See Note 5 in the Notes to Financial Statements regarding investments in affiliated issuers.
(c) A portion of the security out on loan.
(d) Amount rounds to less than 0.1%.
(e) Amount rounds to less than $1,000.
See accompanying Notes to Financial Statements.
oakmark.com 37
Oakmark Funds
Statements of Assets and Liabilities—March 31, 2015 (Unaudited)
(in thousands except per share amounts)
| | | Oakmark
Fund | | Oakmark
Select
Fund | | Oakmark
Equity and
Income Fund | | Oakmark
Global
Fund | |
Assets | |
Investments in unaffiliated securities, at value (a) | | $ | 18,061,860 | | | $ | 6,468,572 | | | $ | 20,240,192 | | | $ | 3,532,159 | | |
Investments in affiliated securities, at value (b) | | | 0 | | | | 0 | | | | 468,086 | | | | 0 | | |
Foreign currency, at value (c) | | | 0 | | | | 0 | | | | 0 | | | | 0 | (d) | |
Receivable for: | |
Securities sold | | | 12,104 | | | | 0 | | | | 28,289 | | | | 9,015 | | |
Fund shares sold | | | 35,596 | | | | 8,513 | | | | 16,967 | | | | 3,875 | | |
Dividends and interest from unaffiliated securities (Net of foreign tax withheld) | | | 17,409 | | | | 1,728 | | | | 41,522 | | | | 5,760 | | |
Dividends and interest from affiliated securities (Net of foreign tax withheld) | | | 0 | | | | 0 | | | | 78 | | | | 0 | | |
Forward foreign currency contracts | | | 0 | | | | 0 | | | | 0 | | | | 9,331 | | |
Tax reclaim from unaffiliated securities | | | 870 | | | | 0 | | | | 6,794 | | | | 1,721 | | |
Tax reclaim from affiliated securities | | | 0 | | | | 0 | | | | 0 | | | | 0 | | |
Total receivables | | | 65,979 | | | | 10,241 | | | | 93,650 | | | | 29,702 | | |
Other assets | | | 80 | | | | 50 | | | | 91 | | | | 43 | | |
Total assets | | $ | 18,127,919 | | | $ | 6,478,863 | | | $ | 20,802,019 | | | $ | 3,561,904 | | |
Liabilities and Net Assets | |
Payable for: | |
Securities purchased | | $ | 32,863 | | | $ | 0 | | | $ | 41,618 | | | $ | 0 | | |
Fund shares redeemed | | | 18,480 | | | | 12,037 | | | | 21,141 | | | | 2,201 | | |
Investment advisory fee | | | 715 | | | | 302 | | | | 748 | | | | 189 | | |
Other shareholder servicing fees | | | 2,807 | | | | 680 | | | | 3,089 | | | | 474 | | |
Transfer and dividend disbursing agent fees | | | 228 | | | | 99 | | | | 171 | | | | 99 | | |
Trustee fees | | | 2 | | | | 3 | | | | 3 | | | | 1 | | |
Deferred trustee compensation | | | 1,280 | | | | 1,127 | | | | 1,102 | | | | 534 | | |
Other | | | 842 | | | | 335 | | | | 1,498 | | | | 212 | | |
Total liabilities | | | 57,217 | | | | 14,583 | | | | 69,370 | | | | 3,710 | | |
Net assets applicable to Fund shares outstanding | | $ | 18,070,702 | | | $ | 6,464,280 | | | $ | 20,732,649 | | | $ | 3,558,194 | | |
Analysis of Net Assets | |
Paid in capital | | $ | 13,316,795 | | | $ | 4,684,789 | | | $ | 14,958,846 | | | $ | 2,843,305 | | |
Accumulated undistributed net realized gain (loss) on investments, forward
contracts, short sales and foreign currency transactions | | | 412,150 | | | | 441,494 | | | | 983,781 | | | | 112,325 | | |
Net unrealized appreciation on investments, forward contracts, short
sales and foreign currency translation | | | 4,310,149 | | | | 1,338,784 | | | | 4,747,855 | | | | 627,193 | | |
Accumulated undistributed net investment income
(Distributions in excess of net investment income) | | | 31,608 | | | | (787 | ) | | | 42,167 | | | | (24,629 | ) | |
Net assets applicable to Fund shares outstanding | | $ | 18,070,702 | | | $ | 6,464,280 | | | $ | 20,732,649 | | | $ | 3,558,194 | | |
Price of Shares | |
Net asset value, offering and redemption price per share: Class I | | $ | 66.00 | | | $ | 40.39 | | | $ | 32.20 | | | $ | 29.79 | | |
Class I—Net assets | | $ | 17,844,519 | | | $ | 6,425,137 | | | $ | 19,630,278 | | | $ | 3,518,832 | | |
Class I—Shares outstanding (Unlimited shares authorized) | | | 270,364 | | | | 159,096 | | | | 609,670 | | | | 118,116 | | |
Net asset value, offering and redemption price per share: Class II | | $ | 65.75 | | | $ | 39.93 | (e) | | $ | 32.00 | | | $ | 29.03 | | |
Class II—Net assets | | $ | 226,183 | | | $ | 39,143 | | | $ | 1,102,371 | | | $ | 39,362 | | |
Class II—Shares outstanding (Unlimited shares authorized) | | | 3,440 | | | | 980 | | | | 34,447 | | | | 1,356 | | |
| (a) Identified cost of investments in unaffiliated securities | | $ | 13,751,711 | | | $ | 5,129,788 | | | $ | 15,763,552 | | | $ | 2,914,087 | | |
| (b) Identified cost of investments in affiliated securities | | | 0 | | | | 0 | | | | 196,871 | | | | 0 | | |
| (c) Identified cost of foreign currency | | | 0 | | | | 0 | | | | 0 | | | | 0 | (d) | |
| (d) Amount rounds to less than $1,000. | | | | | | | | | | | | | | | | | |
| (e) Net assets have been rounded for presentation purposes. The net asset value per share is as reported on March 31, 2015. | | | | | | | | | | | | | | | | | |
See accompanying Notes to Financial Statements.
38 OAKMARK FUNDS
| | | Oakmark
Global Select
Fund | | Oakmark
International
Fund | | Oakmark
International
Small Cap Fund | |
Assets | |
Investments in unaffiliated securities, at value (a) | | $ | 2,027,846 | | | $ | 25,867,217 | | | $ | 2,592,508 | | |
Investments in affiliated securities, at value (b) | | | 0 | | | | 3,490,847 | | | | 494,160 | | |
Foreign currency, at value (c) | | | 0 | | | | 3,890 | | | | 0 | (d) | |
Receivable for: | |
Securities sold | | | 0 | | | | 82,350 | | | | 17,038 | | |
Fund shares sold | | | 5,665 | | | | 94,007 | | | | 10,778 | | |
Dividends and interest from unaffiliated securities (Net of foreign tax withheld) | | | 3,376 | | | | 77,910 | | | | 11,863 | | |
Dividends and interest from affiliated securities (Net of foreign tax withheld) | | | 0 | | | | 22,929 | | | | 1,784 | | |
Forward foreign currency contracts | | | 2,475 | | | | 90,784 | | | | 20,306 | | |
Tax reclaim from unaffiliated securities | | | 1,201 | | | | 24,968 | | | | 1,513 | | |
Tax reclaim from affiliated securities | | | 0 | | | | 1,918 | | | | 0 | | |
Total receivables | | | 12,717 | | | | 394,866 | | | | 63,282 | | |
Other assets | | | 39 | | | | 117 | | | | 41 | | |
Total assets | | $ | 2,040,602 | | | $ | 29,756,937 | | | $ | 3,149,991 | | |
Liabilities and Net Assets | |
Payable for: | |
Securities purchased | | $ | 0 | | | $ | 68,875 | | | $ | 10,541 | | |
Fund shares redeemed | | | 2,575 | | | | 40,024 | | | | 6,819 | | |
Investment advisory fee | | | 109 | | | | 1,304 | | | | 184 | | |
Other shareholder servicing fees | | | 227 | | | | 4,487 | | | | 841 | | |
Transfer and dividend disbursing agent fees | | | 42 | | | | 334 | | | | 92 | | |
Trustee fees | | | 1 | | | | 5 | | | | 2 | | |
Deferred trustee compensation | | | 17 | | | | 889 | | | | 511 | | |
Other | | | 169 | | | | 2,146 | | | | 249 | | |
Total liabilities | | | 3,140 | | | | 118,064 | | | | 19,239 | | |
Net assets applicable to Fund shares outstanding | | $ | 2,037,462 | | | $ | 29,638,873 | | | $ | 3,130,752 | | |
Analysis of Net Assets | |
Paid in capital | | $ | 1,761,670 | | | $ | 26,796,648 | | | $ | 2,951,081 | | |
Accumulated undistributed net realized gain (loss) on investments, forward
contracts, short sales and foreign currency transactions | | | 115,530 | | | | 57,784 | | | | (15,608 | ) | |
Net unrealized appreciation on investments, forward contracts, short
sales and foreign currency translation | | | 162,759 | | | | 2,629,384 | | | | 201,783 | | |
Accumulated undistributed net investment income
(Distributions in excess of net investment income) | | | (2,497 | ) | | | 155,057 | | | | (6,504 | ) | |
Net assets applicable to Fund shares outstanding | | $ | 2,037,462 | | | $ | 29,638,873 | | | $ | 3,130,752 | | |
Price of Shares | |
Net asset value, offering and redemption price per share: Class I | | $ | 16.41 | | | $ | 24.86 | | | $ | 16.15 | | |
Class I—Net assets | | $ | 2,037,462 | | | $ | 29,014,576 | | | $ | 3,128,224 | | |
Class I—Shares outstanding (Unlimited shares authorized) | | | 124,127 | | | | 1,166,991 | | | | 193,750 | | |
Net asset value, offering and redemption price per share: Class II | | $ | 0 | | | $ | 24.98 | | | $ | 16.05 | (e) | |
Class II—Net assets | | $ | 0 | | | $ | 624,297 | | | $ | 2,528 | | |
Class II—Shares outstanding (Unlimited shares authorized) | | | 0 | | | | 24,992 | | | | 157 | | |
| (a) Identified cost of investments in unaffiliated securities | | $ | 1,867,404 | | | $ | 23,032,947 | | | $ | 2,428,621 | | |
| (b) Identified cost of investments in affiliated securities | | | 0 | | | | 3,783,419 | | | | 476,244 | | |
| (c) Identified cost of foreign currency | | | 0 | | | | 3,890 | | | | 0 | (d) | |
| (d) Amount rounds to less than $1,000. | | | | | | | | | | | | | |
| (e) Net assets have been rounded for presentation purposes. The net asset value per share is as reported on March 31, 2015. | | | | | | | | | | | | | |
oakmark.com 39
Oakmark Funds
Statements of Operations—March 31, 2015 (Unaudited)
(in thousands)
| | | Oakmark
Fund | | Oakmark
Select
Fund | | Oakmark
Equity and
Income Fund | | Oakmark
Global
Fund | |
Investment Income: | |
Dividends from unaffiliated securities | | $ | 138,166 | | | $ | 34,667 | | | $ | 134,407 | | | $ | 21,556 | | |
Dividends from affiliated securities | | | 0 | | | | 0 | | | | 3,233 | | | | 0 | | |
Interest income from unaffiliated securities | | | 181 | | | | 8 | | | | 15,988 | | | | 1 | | |
Interest income from affiliated securities | | | 0 | | | | 0 | | | | 185 | | | | 0 | | |
Security lending income | | | 0 | | | | 0 | | | | 620 | | | | 1 | | |
Foreign taxes withheld | | | 0 | | | | 0 | | | | 0 | | | | (709 | ) | |
Total investment income | | | 138,347 | | | | 34,675 | | | | 154,433 | | | | 20,849 | | |
Expenses: | |
Investment advisory fee | | | 63,661 | | | | 27,745 | | | | 68,617 | | | | 17,305 | | |
Transfer and dividend disbursing agent fees | | | 699 | | | | 302 | | | | 407 | | | | 283 | | |
Other shareholder servicing fees | | | 8,374 | | | | 2,077 | | | | 7,439 | | | | 1,338 | | |
Service fee—Class II | | | 253 | | | | 40 | | | | 1,487 | | | | 54 | | |
Reports to shareholders | | | 491 | | | | 152 | | | | 322 | | | | 123 | | |
Custody and accounting fees | | | 243 | | | | 127 | | | | 297 | | | | 231 | | |
Registration and blue sky expenses | | | 363 | | | | 297 | | | | 283 | | | | 71 | | |
Trustees fees | | | 220 | | | | 155 | | | | 237 | | | | 110 | | |
Legal fees | | | 61 | | | | 42 | | | | 73 | | | | 35 | | |
Audit and tax services fees | | | 27 | | | | 15 | | | | 31 | | | | 15 | | |
Interest expense | | | 62 | | | | 0 | | | | 0 | | | | 0 | | |
Other | | | 198 | | | | 137 | | | | 230 | | | | 121 | | |
Total expenses | | | 74,652 | | | | 31,089 | | | | 79,423 | | | | 19,686 | | |
Net Investment Income (Loss) | | | 63,695 | | | | 3,586 | | | | 75,010 | | | | 1,163 | | |
Net realized and unrealized gain (loss): | |
Net realized gain (loss) on: | |
Unaffiliated investments | | | 408,929 | | | | 450,802 | | | | 981,586 | | | | 163,302 | | |
Affiliated investments | | | 0 | | | | 0 | | | | 0 | | | | 0 | | |
Securities sold short | | | 10,320 | | | | 0 | | | | 0 | | | | 0 | | |
Forward foreign currency contracts | | | 0 | | | | 0 | | | | 0 | | | | 20,172 | | |
Foreign currency transactions | | | 47 | | | | 0 | | | | (138 | ) | | | (304 | ) | |
Net realized gain | | | 419,296 | | | | 450,802 | | | | 981,448 | | | | 183,170 | | |
Net change in unrealized appreciation (depreciation) on: | |
Unaffiliated investments | | | 44,066 | | | | (295,441 | ) | | | (155,813 | ) | | | 4,858 | | |
Affiliated investments | | | 0 | | | | 0 | | | | 53,995 | | | | 0 | | |
Securities sold short | | | (1,121 | ) | | | 0 | | | | 0 | | | | 0 | | |
Forward foreign currency contracts | | | 0 | | | | 0 | | | | 0 | | | | (9,648 | ) | |
Foreign currency translation | | | 3 | | | | 0 | | | | 14 | | | | (53 | ) | |
Net change in unrealized appreciation (depreciation) | | | 42,948 | | | | (295,441 | ) | | | (101,804 | ) | | | (4,843 | ) | |
Net realized and unrealized gain | | | 462,244 | | | | 155,361 | | | | 879,644 | | | | 178,327 | | |
Net increase (decrease) in net assets resulting from operations | | $ | 525,939 | | | $ | 158,947 | | | $ | 954,654 | | | $ | 179,490 | | |
See accompanying Notes to Financial Statements.
40 OAKMARK FUNDS
| | | Oakmark
Global Select
Fund | | Oakmark
International
Fund | | Oakmark
International
Small Cap Fund | |
Investment Income: | |
Dividends from unaffiliated securities | | $ | 9,818 | | | $ | 204,727 | | | $ | 22,623 | | |
Dividends from affiliated securities | | | 0 | | | | 68,289 | | | | 9,738 | | |
Interest income from unaffiliated securities | | | 3 | | | | 266 | | | | 3 | | |
Interest income from affiliated securities | | | 0 | | | | 0 | | | | 0 | | |
Security lending income | | | 58 | | | | 6,367 | | | | 268 | | |
Foreign taxes withheld | | | (523 | ) | | | (21,187 | ) | | | (3,336 | ) | |
Total investment income | | | 9,356 | | | | 258,462 | | | | 29,296 | | |
Expenses: | |
Investment advisory fee | | | 9,854 | | | | 120,086 | | | | 16,458 | | |
Transfer and dividend disbursing agent fees | | | 124 | | | | 1,056 | | | | 325 | | |
Other shareholder servicing fees | | | 669 | | | | 12,395 | | | | 2,448 | | |
Service fee—Class II | | | 0 | | | | 714 | | | | 4 | | |
Reports to shareholders | | | 72 | | | | 726 | | | | 197 | | |
Custody and accounting fees | | | 135 | | | | 2,218 | | | | 389 | | |
Registration and blue sky expenses | | | 65 | | | | 94 | | | | 119 | | |
Trustees fees | | | 78 | | | | 268 | | | | 104 | | |
Legal fees | | | 31 | | | | 90 | | | | 33 | | |
Audit and tax services fees | | | 11 | | | | 45 | | | | 17 | | |
Interest expense | | | 0 | | | | 0 | | | | 0 | | |
Other | | | 110 | | | | 291 | | | | 118 | | |
Total expenses | | | 11,149 | | | | 137,983 | | | | 20,212 | | |
Net Investment Income (Loss) | | | (1,793 | ) | | | 120,479 | | | | 9,084 | | |
Net realized and unrealized gain (loss): | |
Net realized gain (loss) on: | |
Unaffiliated investments | | | 149,865 | | | | 231,993 | | | | 4,209 | | |
Affiliated investments | | | 0 | | | | (9,316 | ) | | | (6,872 | ) | |
Securities sold short | | | 0 | | | | 0 | | | | 0 | | |
Forward foreign currency contracts | | | 7,114 | | | | 259,724 | | | | 23,895 | | |
Foreign currency transactions | | | (92 | ) | | | (5,735 | ) | | | (577 | ) | |
Net realized gain | | | 156,887 | | | | 476,666 | | | | 20,655 | | |
Net change in unrealized appreciation (depreciation) on: | |
Unaffiliated investments | | | (69,873 | ) | | | 946,080 | | | | 140,949 | | |
Affiliated investments | | | 0 | | | | 217,750 | | | | 13,635 | | |
Securities sold short | | | 0 | | | | 0 | | | | 0 | | |
Forward foreign currency contracts | | | (3,063 | ) | | | (127,719 | ) | | | (1,058 | ) | |
Foreign currency translation | | | (78 | ) | | | 27 | | | | (48 | ) | |
Net change in unrealized appreciation (depreciation) | | | (73,014 | ) | | | 1,036,138 | | | | 153,478 | | |
Net realized and unrealized gain | | | 83,873 | | | | 1,512,804 | | | | 174,133 | | |
Net increase (decrease) in net assets resulting from operations | | $ | 82,080 | | | $ | 1,633,283 | | | $ | 183,217 | | |
oakmark.com 41
Oakmark Funds
Statements of Changes in Net Assets
(in thousands)
| | | Oakmark Fund | |
| | | Six Months Ended
March 31, 2015
(Unaudited) | | Year Ended
September 30, 2014 | |
From Operations: | |
Net investment income | | $ | 63,695 | | | $ | 102,858 | | |
Net realized gain (loss) | | | 419,296 | | | | 1,119,337 | | |
Net change in unrealized appreciation (depreciation) | | | 42,948 | | | | 1,047,395 | | |
Net increase in net assets from operations | | | 525,939 | | | | 2,269,590 | | |
Distributions to shareholders from: | |
Net investment income—Class I | | | (105,543 | ) | | | (58,384 | ) | |
Net investment income—Class II | | | (827 | ) | | | (403 | ) | |
Net realized gain—Class I | | | (1,026,183 | ) | | | (472,633 | ) | |
Net realized gain—Class II | | | (12,168 | ) | | | (4,832 | ) | |
Total distributions to shareholders | | | (1,144,721 | ) | | | (536,252 | ) | |
From Fund share transactions: | |
Proceeds from shares sold—Class I | | | 2,711,240 | | | | 6,000,989 | | |
Proceeds from shares sold—Class II | | | 81,963 | | | | 90,170 | | |
Reinvestment of distributions—Class I | | | 1,034,577 | | | | 485,481 | | |
Reinvestment of distributions—Class II | | | 9,135 | | | | 4,114 | | |
Payment for shares redeemed—Class I | | | (1,779,010 | ) | | | (2,123,132 | ) | |
Payment for shares redeemed—Class II | | | (28,520 | ) | | | (33,686 | ) | |
Net increase in net assets from Fund share transactions | | | 2,029,385 | | | | 4,423,936 | | |
Total increase in net assets | | | 1,410,603 | | | | 6,157,274 | | |
Net assets: | |
Beginning of period | | | 16,660,099 | | | | 10,502,825 | | |
End of period | | $ | 18,070,702 | | | $ | 16,660,099 | | |
Accumulated undistributed net investment income | | $ | 31,608 | | | $ | 81,552 | | |
Fund Share Transactions—Class I: | |
Shares sold | | | 40,423 | | | | 91,400 | | |
Shares issued in reinvestment of dividends | | | 15,652 | | | | 7,819 | | |
Less shares redeemed | | | (26,588 | ) | | | (32,622 | ) | |
Net increase in shares outstanding | | | 29,487 | | | | 66,597 | | |
Fund Share Transactions—Class II: | |
Shares sold | | | 1,226 | | | | 1,385 | | |
Shares issued in reinvestment of dividends | | | 139 | | | | 66 | | |
Less shares redeemed | | | (428 | ) | | | (522 | ) | |
Net increase in shares outstanding | | | 937 | | | | 929 | | |
See accompanying Notes to Financial Statements.
42 OAKMARK FUNDS
Oakmark Funds
Statements of Changes in Net Assets (continued)
(in thousands)
| | | Oakmark Select Fund | |
| | | Six Months Ended
March 31, 2015
(Unaudited) | | Year Ended
September 30, 2014 | |
From Operations: | |
Net investment income (loss) | | $ | 3,586 | | | $ | (1,330 | ) | |
Net realized gain (loss) | | | 450,802 | | | | 836,600 | | |
Net change in unrealized appreciation (depreciation) | | | (295,441 | ) | | | 189,509 | | |
Net increase in net assets from operations | | | 158,947 | | | | 1,024,779 | | |
Distributions to shareholders from: | |
Net investment income—Class I | | | 0 | | | | (4,243 | ) | |
Net realized gain—Class I | | | (787,839 | ) | | | (224,068 | ) | |
Net realized gain—Class II | | | (3,842 | ) | | | (788 | ) | |
Total distributions to shareholders | | | (791,681 | ) | | | (229,099 | ) | |
From Fund share transactions: | |
Proceeds from shares sold—Class I | | | 1,372,726 | | | | 1,984,637 | | |
Proceeds from shares sold—Class II | | | 20,139 | | | | 13,497 | | |
Reinvestment of distributions—Class I | | | 691,226 | | | | 198,994 | | |
Reinvestment of distributions—Class II | | | 2,566 | | | | 527 | | |
Payment for shares redeemed—Class I | | | (1,248,109 | ) | | | (682,216 | ) | |
Payment for shares redeemed—Class II | | | (4,778 | ) | | | (7,497 | ) | |
Net increase in net assets from Fund share transactions | | | 833,770 | | | | 1,507,942 | | |
Total increase in net assets | | | 201,036 | | | | 2,303,622 | | |
Net assets: | |
Beginning of period | | | 6,263,244 | | | | 3,959,622 | | |
End of period | | $ | 6,464,280 | | | $ | 6,263,244 | | |
Accumulated undistributed net investment loss | | $ | (787 | ) | | $ | (4,373 | ) | |
Fund Share Transactions—Class I: | |
Shares sold | | | 32,424 | | | | 46,187 | | |
Shares issued in reinvestment of dividends | | | 17,067 | | | | 5,088 | | |
Less shares redeemed | | | (29,937 | ) | | | (16,255 | ) | |
Net increase in shares outstanding | | | 19,554 | | | | 35,020 | | |
Fund Share Transactions—Class II: | |
Shares sold | | | 480 | | | | 317 | | |
Shares issued in reinvestment of dividends | | | 64 | | | | 13 | | |
Less shares redeemed | | | (115 | ) | | | (179 | ) | |
Net increase in shares outstanding | | | 429 | | | | 151 | | |
See accompanying Notes to Financial Statements.
oakmark.com 43
Oakmark Funds
Statements of Changes in Net Assets (continued)
(in thousands)
| | | Oakmark Equity and Income Fund | |
| | | Six Months Ended
March 31, 2015
(Unaudited) | | Year Ended
September 30, 2014 | |
From Operations: | |
Net investment income | | $ | 75,010 | | | $ | 170,881 | | |
Net realized gain (loss) | | | 981,448 | | | | 1,849,908 | | |
Net change in unrealized appreciation (depreciation) | | | (101,804 | ) | | | (34,603 | ) | |
Net increase in net assets from operations | | | 954,654 | | | | 1,986,186 | | |
Distributions to shareholders from: | |
Net investment income—Class I | | | (153,859 | ) | | | (90,716 | ) | |
Net investment income—Class II | | | (5,380 | ) | | | (1,788 | ) | |
Net realized gain—Class I | | | (1,552,733 | ) | | | (1,391,333 | ) | |
Net realized gain—Class II | | | (92,070 | ) | | | (91,024 | ) | |
Total distributions to shareholders | | | (1,804,042 | ) | | | (1,574,861 | ) | |
From Fund share transactions: | |
Proceeds from shares sold—Class I | | | 1,377,862 | | | | 2,772,647 | | |
Proceeds from shares sold—Class II | | | 111,039 | | | | 219,618 | | |
Reinvestment of distributions—Class I | | | 1,604,152 | | | | 1,394,591 | | |
Reinvestment of distributions—Class II | | | 86,561 | | | | 83,122 | | |
Payment for shares redeemed—Class I | | | (1,941,356 | ) | | | (3,384,039 | ) | |
Payment for shares redeemed—Class II | | | (206,132 | ) | | | (381,290 | ) | |
Net increase in net assets from Fund share transactions | | | 1,032,126 | | | | 704,649 | | |
Total increase in net assets | | | 182,738 | | | | 1,115,974 | | |
Net assets: | |
Beginning of period | | | 20,549,911 | | | | 19,433,937 | | |
End of period | | $ | 20,732,649 | | | $ | 20,549,911 | | |
Accumulated undistributed net investment income | | $ | 42,167 | | | $ | 140,535 | | |
Fund Share Transactions—Class I: | |
Shares sold | | | 42,254 | | | | 83,077 | | |
Shares issued in reinvestment of dividends | | | 50,461 | | | | 43,473 | | |
Less shares redeemed | | | (59,411 | ) | | | (101,356 | ) | |
Net increase in shares outstanding | | | 33,304 | | | | 25,194 | | |
Fund Share Transactions—Class II: | |
Shares sold | | | 3,413 | | | | 6,616 | | |
Shares issued in reinvestment of dividends | | | 2,738 | | | | 2,603 | | |
Less shares redeemed | | | (6,344 | ) | | | (11,481 | ) | |
Net decrease in shares outstanding | | | (193 | ) | | | (2,262 | ) | |
See accompanying Notes to Financial Statements.
44 OAKMARK FUNDS
Oakmark Funds
Statements of Changes in Net Assets (continued)
(in thousands)
| | | Oakmark Global Fund | |
| | | Six Months Ended
March 31, 2015
(Unaudited) | | Year Ended
September 30, 2014 | |
From Operations: | |
Net investment income | | $ | 1,163 | | | $ | 25,680 | | |
Net realized gain (loss) | | | 183,170 | | | | 210,668 | | |
Net change in unrealized appreciation (depreciation) | | | (4,843 | ) | | | (37,823 | ) | |
Net increase in net assets from operations | | | 179,490 | | | | 198,525 | | |
Distributions to shareholders from: | |
Net investment income—Class I | | | (40,156 | ) | | | (77,231 | ) | |
Net investment income—Class II | | | (322 | ) | | | (893 | ) | |
Net realized gain—Class I | | | (197,598 | ) | | | (56,046 | ) | |
Net realized gain—Class II | | | (2,331 | ) | | | (740 | ) | |
Total distributions to shareholders | | | (240,407 | ) | | | (134,910 | ) | |
From Fund share transactions: | |
Proceeds from shares sold—Class I | | | 265,477 | | | | 1,060,586 | | |
Proceeds from shares sold—Class II | | | 4,629 | | | | 11,571 | | |
Reinvestment of distributions—Class I | | | 222,510 | | | | 124,277 | | |
Reinvestment of distributions—Class II | | | 2,373 | | | | 1,513 | | |
Payment for shares redeemed—Class I | | | (412,766 | ) | | | (624,185 | ) | |
Payment for shares redeemed—Class II | | | (8,695 | ) | | | (11,107 | ) | |
Net increase in net assets from Fund share transactions | | | 73,528 | | | | 562,655 | | |
Total increase in net assets | | | 12,611 | | | | 626,270 | | |
Net assets: | |
Beginning of period | | | 3,545,583 | | | | 2,919,313 | | |
End of period | | $ | 3,558,194 | | | $ | 3,545,583 | | |
Accumulated undistributed net investment loss | | $ | (24,629 | ) | | $ | (4,281 | ) | |
Fund Share Transactions—Class I: | |
Shares sold | | | 9,039 | | | | 34,770 | | |
Shares issued in reinvestment of dividends | | | 7,626 | | | | 4,256 | | |
Less shares redeemed | | | (14,022 | ) | | | (20,531 | ) | |
Net increase in shares outstanding | | | 2,643 | | | | 18,495 | | |
Fund Share Transactions—Class II: | |
Shares sold | | | 161 | | | | 388 | | |
Shares issued in reinvestment of dividends | | | 83 | | | | 53 | | |
Less shares redeemed | | | (301 | ) | | | (370 | ) | |
Net increase (decrease) in shares outstanding | | | (57 | ) | | | 71 | | |
See accompanying Notes to Financial Statements.
oakmark.com 45
Oakmark Funds
Statements of Changes in Net Assets (continued)
(in thousands)
| | | Oakmark Global Select Fund | |
| | | Six Months Ended
March 31, 2015
(Unaudited) | | Year Ended
September 30, 2014 | |
From Operations: | |
Net investment income (loss) | | $ | (1,793 | ) | | $ | 15,445 | | |
Net realized gain (loss) | | | 156,887 | | | | 63,040 | | |
Net change in unrealized appreciation (depreciation) | | | (73,014 | ) | | | 29,932 | | |
Net increase in net assets from operations | | | 82,080 | | | | 108,417 | | |
Distributions to shareholders from: | |
Net investment income—Class I | | | (16,577 | ) | | | (11,545 | ) | |
Net realized gain—Class I | | | (90,353 | ) | | | (22,884 | ) | |
Total distributions to shareholders | | | (106,930 | ) | | | (34,429 | ) | |
From Fund share transactions: | |
Proceeds from shares sold—Class I | | | 360,451 | | | | 1,060,662 | | |
Reinvestment of distributions—Class I | | | 89,569 | | | | 28,754 | | |
Payment for shares redeemed—Class I | | | (325,000 | ) | | | (385,875 | ) | |
Net increase in net assets from Fund share transactions | | | 125,020 | | | | 703,541 | | |
Total increase in net assets | | | 100,170 | | | | 777,529 | | |
Net assets: | |
Beginning of period | | | 1,937,292 | | | | 1,159,763 | | |
End of period | | $ | 2,037,462 | | | $ | 1,937,292 | | |
Accumulated undistributed net investment income (loss) | | $ | (2,497 | ) | | $ | 10,749 | | |
Fund Share Transactions—Class I: | |
Shares sold | | | 22,123 | | | | 64,187 | | |
Shares issued in reinvestment of dividends | | | 5,588 | | | | 1,796 | | |
Less shares redeemed | | | (20,047 | ) | | | (23,327 | ) | |
Net increase in shares outstanding | | | 7,664 | | | | 42,656 | | |
See accompanying Notes to Financial Statements.
46 OAKMARK FUNDS
Oakmark Funds
Statements of Changes in Net Assets (continued)
(in thousands)
| | | Oakmark International Fund | |
| | | Six Months Ended
March 31, 2015
(Unaudited) | | Year Ended
September 30, 2014 | |
From Operations: | |
Net investment income | | $ | 120,479 | | | $ | 526,424 | | |
Net realized gain (loss) | | | 476,666 | | | | 1,542,589 | | |
Net change in unrealized appreciation (depreciation) | | | 1,036,138 | | | | (2,504,051 | ) | |
Net increase (decrease) in net assets from operations | | | 1,633,283 | | | | (435,038 | ) | |
Distributions to shareholders from: | |
Net investment income—Class I | | | (571,149 | ) | | | (443,291 | ) | |
Net investment income—Class II | | | (9,360 | ) | | | (6,083 | ) | |
Net realized gain—Class I | | | (1,205,921 | ) | | | (298,171 | ) | |
Net realized gain—Class II | | | (24,101 | ) | | | (4,929 | ) | |
Total distributions to shareholders | | | (1,810,531 | ) | | | (752,474 | ) | |
From Fund share transactions: | |
Proceeds from shares sold—Class I | | | 4,208,817 | | | | 11,426,097 | | |
Proceeds from shares sold—Class II | | | 165,447 | | | | 337,466 | | |
Reinvestment of distributions—Class I | | | 1,429,964 | | | | 596,808 | | |
Reinvestment of distributions—Class II | | | 21,705 | | | | 7,279 | | |
Payment for shares redeemed—Class I | | | (6,205,781 | ) | | | (4,983,536 | ) | |
Payment for shares redeemed—Class II | | | (102,547 | ) | | | (170,918 | ) | |
Net increase (decrease) in net assets from Fund share transactions | | | (482,395 | ) | | | 7,213,196 | | |
Total increase (decrease) in net assets | | | (659,643 | ) | | | 6,025,684 | | |
Net assets: | |
Beginning of period | | | 30,298,516 | | | | 24,272,832 | | |
End of period | | $ | 29,638,873 | | | $ | 30,298,516 | | |
Accumulated undistributed net investment income | | $ | 155,057 | | | $ | 417,622 | | |
Fund Share Transactions—Class I: | |
Shares sold | | | 173,914 | | | | 434,304 | | |
Shares issued in reinvestment of dividends | | | 60,643 | | | | 23,358 | | |
Less shares redeemed | | | (257,659 | ) | | | (190,202 | ) | |
Net increase (decrease) in shares outstanding | | | (23,102 | ) | | | 267,460 | | |
Fund Share Transactions—Class II: | |
Shares sold | | | 6,820 | | | | 12,777 | | |
Shares issued in reinvestment of dividends | | | 916 | | | | 283 | | |
Less shares redeemed | | | (4,240 | ) | | | (6,458 | ) | |
Net increase in shares outstanding | | | 3,496 | | | | 6,602 | | |
See accompanying Notes to Financial Statements.
oakmark.com 47
Oakmark Funds
Statements of Changes in Net Assets (continued)
(in thousands)
| | | Oakmark International Small Cap Fund | |
| | | Six Months Ended
March 31, 2015
(Unaudited) | | Year Ended
September 30, 2014 | |
From Operations: | |
Net investment income | | $ | 9,084 | | | $ | 29,622 | | |
Net realized gain (loss) | | | 20,655 | | | | 207,128 | | |
Net change in unrealized appreciation (depreciation) | | | 153,478 | | | | (330,279 | ) | |
Net increase (decrease) in net assets from operations | | | 183,217 | | | | (93,529 | ) | |
Distributions to shareholders from: | |
Net investment income—Class I | | | (47,556 | ) | | | (77,487 | ) | |
Net investment income—Class II | | | (37 | ) | | | (104 | ) | |
Net realized gain—Class I | | | (166,420 | ) | | | 0 | | |
Net realized gain—Class II | | | (172 | ) | | | 0 | | |
Total distributions to shareholders | | | (214,185 | ) | | | (77,591 | ) | |
From Fund share transactions: | |
Proceeds from shares sold—Class I | | | 738,285 | | | | 1,257,909 | | |
Proceeds from shares sold—Class II | | | 498 | | | | 1,578 | | |
Reinvestment of distributions—Class I | | | 188,923 | | | | 68,648 | | |
Reinvestment of distributions—Class II | | | 86 | | | | 38 | | |
Payment for shares redeemed—Class I | | | (678,591 | ) | | | (500,401 | ) | |
Payment for shares redeemed—Class II | | | (1,235 | ) | | | (1,631 | ) | |
Redemption fees—Class I | | | 506 | | | | 643 | | |
Redemption fees—Class II | | | 1 | | | | 1 | | |
Net increase in net assets from Fund share transactions | | | 248,473 | | | | 826,785 | | |
Total increase in net assets | | | 217,505 | | | | 655,665 | | |
Net assets: | |
Beginning of period | | | 2,913,247 | | | | 2,257,582 | | |
End of period | | $ | 3,130,752 | | | $ | 2,913,247 | | |
Accumulated undistributed net investment income (loss) | | $ | (6,504 | ) | | $ | 11,663 | | |
Fund Share Transactions—Class I: | |
Shares sold | | | 47,160 | | | | 71,954 | | |
Shares issued in reinvestment of dividends | | | 12,800 | | | | 4,096 | | |
Less shares redeemed | | | (43,855 | ) | | | (28,760 | ) | |
Net increase in shares outstanding | | | 16,105 | | | | 47,290 | | |
Fund Share Transactions—Class II: | |
Shares sold | | | 32 | | | | 91 | | |
Shares issued in reinvestment of dividends | | | 6 | | | �� | 2 | | |
Less shares redeemed | | | (82 | ) | | | (94 | ) | |
Net decrease in shares outstanding | | | (44 | ) | | | (1 | ) | |
See accompanying Notes to Financial Statements.
48 OAKMARK FUNDS
Oakmark Funds
Notes to Financial Statements
1. SIGNIFICANT ACCOUNTING POLICIES
Organization
The following are the significant accounting policies of Oakmark Fund ("Oakmark"), Oakmark Select Fund ("Select"), Oakmark Equity and Income Fund ("Equity and Income"), Oakmark Global Fund ("Global"), Oakmark Global Select Fund ("Global Select"), Oakmark International Fund ("International"), and Oakmark International Small Cap Fund ("Int'l Small Cap"), collectively referred to as the "Funds," each a series of Harris Associates Investment Trust (the "Trust"), a Massachusetts business trust, organized on February 1, 1991, which is registered as an open-end management investment company under the Investment Company Act of 1940, as amended (the "1940 Act") and accordingly follows the investment company accounting and reporting guidance of the Financial Accounting Standards Board (FASB) Accounting Standard Codification Topic 946 Financial Services—Investment Companies. Each Fund, other than Select and Global Select, is diversified in accordance with the 1940 Act. The following policies are in conformity with accounting principles generally accepted in the United States of America ("GAAP"). The presentation of financial statements in conformity with GAAP requires management to make estimates and assumptions that affect the reported amounts of assets and liabilities at the date of the financial statements and the reported amounts of revenues and expenses during the reporting period. Actual results could differ from those estimates and assumptions.
Class disclosure
Each Fund offers two classes of shares: Class I Shares and Class II Shares. Class I Shares are offered to the general public. Class II Shares are offered to certain retirement plans such as 401(k) and profit sharing plans. Class II Shares pay a service fee at the annual rate of up to 0.25% of average net assets of Class II Shares of the Funds. This service fee is paid to a third-party administrator for performing the services associated with the administration of such retirement plans. Class I Shares do not have such an associated service fee. Global Select had no outstanding Class II shares during the six-month period ended March 31, 2015.
Income, realized and unrealized capital gains and losses, and expenses of the Funds not directly attributable to a specific class of shares are allocated to each class pro rata based on the relative net assets of each class. Transfer and dividend disbursing agent fees and other shareholder servicing fees are specific to each class.
Redemption fees
Int'l Small Cap imposes a short-term trading fee on redemptions of shares held for 90 days or less to help offset two types of costs to the Fund caused by abusive trading: portfolio transaction and market impact costs associated with erratic redemption activity and administrative costs associated with processing redemptions. The fee is paid to the Fund and is 2% of the redemption value and is deducted from either the redemption proceeds or from the balance in the account. The "first-in, first-out" ("FIFO") method is used to determine the holding period. The Fund may approve the waiver of redemption fees on certain types of accounts held through intermediaries, pursuant to the Fund's policies and procedures. Redemption fees collected by the Fund, if any, are included in the Statements of Changes in Net Assets.
Security valuation
The Funds' share prices or net asset values ("NAVs") are calculated as of the close of regular session trading (usually 4:00 pm Eastern time) on the New York Stock Exchange ("NYSE") on any day on which the NYSE is open for trading. Equity securities principally traded on securities exchanges in the United States and over-the-counter securities are valued at the last sales price or the official closing price on the day of valuation, or lacking any reported sales that day, at the most recent bid quotation. Securities traded on the NASDAQ National Market are valued at the NASDAQ Official Closing Price ("NOCP"), or lacking an NOCP, at the most recent bid quotation on the NASDAQ National Market. Equity securities principally traded on securities exchanges outside the United States are valued, depending on local convention or regulation, at the last sales price, the last bid or asked price, the mean between the last bid and asked prices, or the official closing price, or are based on a pricing composite as of the close of the regular trading hours on the appropriate exchange or other designated time. Each long-term debt instrument is valued at the latest bid quotation or an evaluated price provided by an independent pricing service. The pricing service may use standard inputs such as benchmark yields, reported trades, broker/dealer quotes, issuer spreads, two-sided markets, benchmark securities, bids, offers, and reference data including market research publications. For certain security types additional inputs may be used or some of the standard inputs may not be applicable. Additionally, the pricing service monitors market indicators and industry and economic events, which may serve as a trigger to gather and possibly use additional market data. Each short-term debt instrument (i.e., debt instruments whose maturities or expiration dates at the time of acquisition are one year or less) or money market instrument maturing in 61 days or more from the date of valuation is valued at the latest bid quotation or an evaluated price provided by an independent pricing service. Each short-term instrument maturing in 60 days or less from the date of valuation is valued at amortized cost, which approximates market value. Options are valued at the last reported sales price on the day of valuation or, lacking any reported sale price on the valuation date, at the mean of the most recent bid and asked quotations or, if the mean is not available, at the most recent bid quotation.
Securities for which quotations are not readily available or securities that may have been affected by a significant event occurring between the close of a foreign market and the close of the NYSE are valued at fair value, determined by or under the direction of the pricing committee authorized by the Board of Trustees. A significant event may include the performance of U.S. markets since the close of foreign markets. The Funds may use a systematic fair valuation model provided by an independent pricing service to value foreign securities in order to adjust local closing prices for information or events that may occur between the close of certain foreign exchanges and the close of the NYSE.
oakmark.com 49
Oakmark Funds
Notes to Financial Statements (continued)
Fair value measurement
Various inputs are used in determining the value of each Fund's investments. These inputs are prioritized into three broad levels as follows:
Level 1—quoted prices in active markets for identical securities
Level 2—other significant observable inputs (including quoted prices for similar investments, interest rates, prepayment speeds, credit risk, and others)
Level 3—significant unobservable inputs (including the Adviser's own assumptions in determining the fair value of investments)
Observable inputs are those based on market data obtained from independent sources, and unobservable inputs reflect the Adviser's own assumptions based on the best information available. The input levels are not necessarily an indication of risk or liquidity associated with investing in those securities.
The following is a summary of the inputs used as of March 31, 2015 in valuing each Fund's assets and liabilities. Except for the industries or investment types separately stated below, the total amounts for common stocks, fixed-income and short-term investments in the table below are presented by industry or investment type in each Fund's Schedule of Investments. Information on forward foreign currency contracts is presented by contract in the notes following the below summary:
(in thousands) | | Quoted Prices
in Active
Markets for
Identical
Assets
(Level 1) | | Other
Significant
Observable
Inputs
(Level 2) | | Significant
Unobservable
Inputs
(Level 3) | |
Oakmark | | | | | | | | | | | | | |
Common Stocks | | $ | 16,807,759 | | | $ | 0 | | | $ | 0 | | |
Short Term Investments | | | 0 | | | | 1,254,101 | | | | 0 | | |
Total | | $ | 16,807,759 | | | $ | 1,254,101 | | | $ | 0 | | |
Select | | | | | | | | | | | | | |
Common Stocks | | $ | 6,193,335 | | | $ | 0 | | | $ | 0 | | |
Short Term Investments | | | 0 | | | | 275,237 | | | | 0 | | |
Total | | $ | 6,193,335 | | | $ | 275,237 | | | $ | 0 | | |
Equity and Income | | | | | | | | | | | | | |
Common Stocks | | $ | 13,186,124 | | | $ | 0 | | | $ | 0 | | |
Government and Agency Securities | | | 0 | | | | 1,683,406 | | | | 0 | | |
Corporate Bonds | | | 0 | | | | 1,231,335 | | | | 0 | | |
Asset Backed Securities | | | 0 | | | | 11,486 | | | | 0 | | |
Short Term Investments | | | 0 | | | | 4,595,927 | | | | 0 | | |
Total | | $ | 13,186,124 | | | $ | 7,522,154 | | | $ | 0 | | |
Global | | | | | | | | | | | | | |
Common Stocks | | $ | 3,525,499 | | | $ | 0 | | | $ | 0 | | |
Short Term Investments | | | 0 | | | | 6,660 | | | | 0 | | |
Forward Foreign Currency Contracts - Assets | | | 0 | | | | 10,474 | | | | 0 | | |
Forward Foreign Currency Contracts - Liabilities | | | 0 | | | | (1,143 | ) | | | 0 | | |
Total | | $ | 3,525,499 | | | $ | 15,991 | | | $ | 0 | | |
Global Select | | | | | | | | | | | | | |
Common Stocks | | $ | 1,943,465 | | | $ | 0 | | | $ | 0 | | |
Short Term Investments | | | 0 | | | | 84,381 | | | | 0 | | |
Forward Foreign Currency Contracts - Assets | | | 0 | | | | 2,498 | | | | 0 | | |
Forward Foreign Currency Contracts - Liabilities | | | 0 | | | | (23 | ) | | | 0 | | |
Total | | $ | 1,943,465 | | | $ | 86,856 | | | $ | 0 | | |
50 OAKMARK FUNDS
Oakmark Funds
Notes to Financial Statements (continued)
(in thousands) | | Quoted Prices
in Active
Markets for
Identical
Assets
(Level 1) | | Other
Significant
Observable
Inputs
(Level 2) | | Significant
Unobservable
Inputs
(Level 3) | |
International | | | | | | | | | | | | | |
Common Stocks | | $ | 28,089,747 | | | $ | 0 | | | $ | 0 | | |
Short Term Investments | | | 0 | | | | 1,268,317 | | | | 0 | | |
Forward Foreign Currency Contracts - Assets | | | 0 | | | | 108,398 | | | | 0 | | |
Forward Foreign Currency Contracts - Liabilities | | | 0 | | | | (17,614 | ) | | | 0 | | |
Total | | $ | 28,089,747 | | | $ | 1,359,101 | | | $ | 0 | | |
Int'l Small Cap | | | | | | | | | | | | | |
Common Stocks | | $ | 2,948,413 | | | $ | 0 | | | $ | 0 | | |
Short Term Investments | | | 0 | | | | 138,255 | | | | 0 | | |
Forward Foreign Currency Contracts - Assets | | | 0 | | | | 24,873 | | | | 0 | | |
Forward Foreign Currency Contracts - Liabilities | | | 0 | | | | (4,567 | ) | | | 0 | | |
Total | | $ | 2,948,413 | | | $ | 158,561 | | | $ | 0 | | |
Offsetting assets and liabilities
The Funds have adopted the new disclosure requirements under Accounting Standards Update No. 2011-11 "Disclosures about Offsetting Assets and Liabilities" ("ASU 2011-11"), issued by the Financial Accounting Standards Board. ASU 2011-11 requires entities to disclose gross and net information about instruments and transactions eligible for offset on the Statement of Assets and Liabilities, and disclose instruments and transactions subject to master netting or similar agreements. This disclosure is limited to derivative instruments, repurchase and reverse repurchase agreements, and securities borrowing and lending transactions.
At March 31, 2015 certain Funds held open forward foreign currency contracts that were subject to a foreign exchange settlement and netting agreement with the same counterparty. The agreement includes provisions for general obligations, representations and certain events of default or termination. The agreement includes provisions for netting arrangements that may reduce credit risk and counterparty risk associated with relevant transactions, in the event a counterparty fails to meet its obligations. The net recognized assets or liabilities related to open forward foreign currency contracts are presented in the Statements of Assets and Liabilities. The gross recognized assets (appreciation) and liabilities (depreciation) by contract are presented in the table included in the Forward foreign currency contracts section of Note 1 to Financial Statements.
At March 31, 2015 each Fund held investments in repurchase agreements. The gross value of these investments and the value of the related collateral are presented in each Fund's Schedule of Investments. The value of the related collateral for each Fund exceeded the value of the repurchase agreements held at period end.
The value of the securities on loan and the value of the related collateral as of period end, if any, are included in the Securities lending section of Note 1 to Financial Statements.
Foreign currency translations
Certain Funds invest in foreign securities, which may involve a number of risk factors and special considerations not present with investments in securities of U.S. corporations. Values of investments and other assets and liabilities denominated in foreign currencies are translated into U.S. dollars at current exchange rates obtained by a recognized bank, dealer, or independent pricing service on the day of valuation. Purchases and sales of investments and dividend and interest income are converted at the prevailing rate of exchange on the respective dates of such transactions.
The Funds do not isolate that portion of the results of operations resulting from changes in foreign exchange rates on investments from the fluctuations arising from changes in market prices of securities held. Such fluctuations are included in net realized gain (loss) on investments and net change in unrealized appreciation (depreciation) on investments in the Statements of Operations. Net realized gains and losses on foreign currency transactions arising from the sale of foreign currencies, currency gains or losses realized between the trade and settlement dates on securities transactions and the difference between the amounts of dividends, interest and tax reclaims recorded and the U.S. dollar equivalent of the amounts actually received or paid are included in net realized gain (loss) on foreign currency transactions in the Statements of Operations. Unrealized gains and losses arising from changes in the fair value of assets and liabilities, other than investments in securities, resulting from changes in exchange rates are included in net change in unrealized appreciation (depreciation) on foreign currency translation in the Statements of Operations.
Forward foreign currency contracts
Forward foreign currency contracts are agreements to exchange one currency for another at a future date and at a specified price. The Funds' transactions in forward foreign currency contracts are limited to transaction and portfolio hedging. The contractual amounts of forward foreign currency contracts do not necessarily represent the amounts potentially subject to risk. The measurement of the risks associated with these instruments is meaningful only when all related and offsetting transactions are considered
oakmark.com 51
Oakmark Funds
Notes to Financial Statements (continued)
and could exceed the net unrealized value shown in the tables below. Risks arise from the possible inability of counterparties to meet the terms of their contracts and from movements in currency values. Forward foreign currency contracts are valued at the current day's interpolated foreign exchange rates. Unrealized gain or loss on the contracts as measured by the difference between the forward foreign exchange rates at the dates of entry into the contracts and the forward rates at the end of the period is included in the Statements of Assets and Liabilities. Realized gains and losses and the net change in unrealized appreciation (depreciation) on forward foreign currency contracts for the period are included in the Statements of Operations.
At March 31, 2015 Global, Global Select, International, and Int'l Small Cap held forward foreign currency contracts, which are considered derivative instruments, each of whose counterparty is State Street Bank and Trust Company ("State Street"), as follows (in thousands):
Global
| | | Local
Contract
Amount | | Settlement
Date | | Valuation at
3/31/15 | | Unrealized
Appreciation/
(Depreciation) | |
Foreign Currency Bought: | | | | | | | | | | | | | | | |
Australian Dollar | | | 15,986 | | | 06/17/15 | | $ | 12,122 | | | $ | (1,089 | ) | |
| | | | | | | $ | 12,122 | | | $ | (1,089 | ) | |
Foreign Currency Sold: | | | | | | | | | | | | | | | |
Australian Dollar | | | 41,764 | | | 06/17/15 | | $ | 31,670 | | | $ | 5,661 | | |
Swiss Franc | | | 209,241 | | | 09/16/15 | | | 216,989 | | | | 4,759 | | |
| | | | | | | $ | 248,659 | | | $ | 10,420 | | |
During the period ended March 31, 2015 the notional value of forward foreign currency contracts opened for Global were $221,748 and the notional value of settled contracts was $184,751 (in thousands).
Global Select
| | | Local
Contract
Amount | | Settlement
Date | | Valuation at
3/31/15 | | Unrealized
Appreciation/
(Depreciation) | |
Foreign Currency Sold: | | | | | | | | | |
Swiss Franc | | | 93,448 | | | 09/16/15 | | $ | 96,908 | | | $ | 2,475 | | |
| | | | | | | $ | 96,908 | | | $ | 2,475 | | |
During the period ended March 31, 2015 the notional value of forward foreign currency contracts opened for Global Select were $123,928 and the notional value of settled contracts was $82,781 (in thousands).
International
| | | Local
Contract
Amount | | Settlement
Date | | Valuation at
3/31/15 | | Unrealized
Appreciation/
(Depreciation) | |
Foreign Currency Bought: | | | | | | | | | | | | | | | |
Australian Dollar | | | 246,364 | | | 06/17/15 | | $ | 186,822 | | | $ | (17,197 | ) | |
| | | | | | | $ | 186,822 | | | $ | (17,197 | ) | |
Foreign Currency Sold: | | | | | | | | | | | | | | | |
Australian Dollar | | | 534,002 | | | 06/17/15 | | $ | 404,944 | | | $ | 72,380 | | |
Swiss Franc | | | 1,601,700 | | | 09/16/15 | | | 1,661,009 | | | | 35,601 | | |
| | | | | | | $ | 2,065,953 | | | $ | 107,981 | | |
During the period ended March 31, 2015 the notional value of forward foreign currency contracts opened for International were $1,696,610 and the notional value of settled contracts was $2,166,467 (in thousands).
52 OAKMARK FUNDS
Oakmark Funds
Notes to Financial Statements (continued)
Int'l Small Cap
| | | Local
Contract
Amount | | Settlement
Date | | Valuation at
3/31/15 | | Unrealized
Appreciation/
(Depreciation) | |
Foreign Currency Bought: | | | | | | | | | | | | | | | |
Australian Dollar | | | 67,681 | | | 06/17/15 | | $ | 51,324 | | | $ | (4,429 | ) | |
| | | | | | | $ | 51,324 | | | $ | (4,429 | ) | |
Foreign Currency Sold: | | | | | | | | | | | | | | | |
Australian Dollar | | | 161,035 | | | 06/17/15 | | $ | 122,115 | | | $ | 21,540 | | |
Norwegian Krone | | | 66,514 | | | 12/16/15 | | | 8,224 | | | | (99 | ) | |
Swiss Franc | | | 151,885 | | | 09/16/15 | | | 157,509 | | | | 3,294 | | |
| | | | | | | $ | 287,848 | | | $ | 24,735 | | |
During the period ended March 31, 2015 the notional value of forward foreign currency contracts opened for Int'l Small Cap were $179,986 and the notional value of settled contracts was $231,616 (in thousands).
Security transactions and investment income
Security transactions are accounted for on the trade date (date the order to buy or sell is executed), and dividend income is recorded on the ex-dividend date, except that certain dividends from foreign securities are recorded as soon as the information becomes available after the ex-dividend date. Interest income and expenses are recorded on an accrual basis. Discount is accreted and premium is amortized on long-term fixed income securities using the yield-to-maturity method. Withholding taxes and tax reclaims on foreign dividends have been provided for in accordance with the Funds' understanding of the applicable country's tax rules and rates. Net realized gains and losses on investments are determined by the specific identification method.
Short sales
Each Fund may sell a security it does not own in anticipation of a decline in the fair value of that security. When a Fund sells a security short, it must borrow the security sold short and deliver it to the broker-dealer through which it made the short sale. A gain, limited to the price at which the Fund sold the security short, or loss, unlimited in size, will be recognized upon the termination of the short sale. Each Fund may sell shares of when-issued securities. Typically, a Fund sells when-issued securities when a company announces a spin-off or re-organization, and the post-spin-off or post-re-organization shares begin trading on a when-issued basis prior to the effective date of the corporate action. A sale of a when-issued security is treated as a short sale for accounting purposes. After the effective date, when shares of the new company are received, any shares sold on a when-issued basis will be delivered to the counterparty. At March 31, 2015 none of the Funds had short sales.
When-issued or delayed-delivery securities
Each Fund may purchase securities on a when-issued or delayed-delivery basis. Although the payment and interest terms of these securities are established at the time a Fund enters into the commitment, the securities may be delivered and paid for a month or more after the date of purchase, when their value may have changed. A Fund makes such commitments only with the intention of actually acquiring the securities, but may sell the securities before the settlement date if the Adviser deems it advisable for investment reasons. At March 31, 2015 none of the Funds held when-issued securities.
Accounting for options
When a Fund writes an option, the premium received by the Fund is recorded as a liability and is subsequently adjusted to the current fair value of the option written. Premiums received from writing options that expire are recorded by the Fund on the expiration date as realized gains from option transactions. The difference between the premium and the amount paid on effecting a closing purchase transaction, including brokerage commissions, is also treated as a realized gain, or if the premium is less than the amount paid for the closing purchase transaction, as a realized loss. If a call option is exercised, the premium is added to the proceeds from the sale of the underlying security or currency in determining whether the Fund has realized a gain or a loss. If a put option is exercised, the premium reduces the cost basis of the security or currency purchased by the Fund. In writing an option, the Fund bears the market risk of an unfavorable change in the price of the security or currency underlying the written option. As the writer of a covered call option on a security, a Fund foregoes, during the option's life, the opportunity to profit from increases in the market value of the security covering the call option above the sum of the premium and the exercise price of call. Exercise of an option written by the Fund could result in the Fund selling or buying a security or currency at a price different from the current fair value. Options written by the Fund do not give rise to counterparty credit risk, as they obligate the Fund, not its counterparties, to perform.
When a Fund purchases an option, the premium paid by the Fund is recorded as an asset and is subsequently adjusted to the current fair value of the option purchased. Purchasing call options tends to increase the Fund's exposure to the underlying instrument. Purchasing put options tends to decrease the Fund's exposure to the underlying instrument. Premiums paid for purchasing options that expire are treated as realized losses. Premiums paid for purchasing options that are exercised or closed are added to the amounts paid or offset against the proceeds on the underlying security to determine the realized gain or loss. The risks associated with purchasing put and call options are potential loss of the premium paid and, in the instances of OTC derivatives, the failure of the counterparty to honor its obligation under the contract.
oakmark.com 53
Oakmark Funds
Notes to Financial Statements (continued)
The Funds did not write or purchase options during the period ended March 31, 2015.
Committed line of credit
The Trust has an unsecured committed line of credit (the "Facility") with State Street in the amount of $500 million. Borrowings under that arrangement bear interest at 1.25% above the greater of the Federal Funds Effective Rate or LIBOR, as defined in the credit agreement. To maintain the Facility, an annualized commitment fee of 0.15% on the unused portion is charged to the Trust. Fees and interest expense, if any, related to the Facility are included in other expenses in the Statements of Operations. There were no borrowings under the Facility during the period ended March 31, 2015.
Expense offset arrangement
State Street serves as custodian of the Funds. State Street's fee may be reduced by credits that are an earnings allowance calculated on the average daily cash balances each Fund maintains with State Street. Credit balances used to reduce the Funds' custodian fees, if any, are reported as a reduction of total expenses in the Statements of Operations. During the period ended March 31, 2015 none of the Funds received an expense offset credit.
Repurchase agreements
Each Fund may invest in repurchase agreements, which are short-term investments whereby the Fund acquires ownership of a debt security and the seller agrees to repurchase the security at a future date at a specified price.
The Funds' custodian receives delivery of the underlying securities collateralizing repurchase agreements. It is the Funds' policy that the value of the collateral be at least equal to 102% of the repurchase price, including interest. Harris Associates L.P. (the "Adviser") is responsible for determining that the value of the collateral is at all times at least equal to 102% of the repurchase price, including interest. Repurchase agreements could involve certain risks in the event of default or insolvency of the counterparty, including possible delays or restrictions upon a Fund's ability to dispose of the underlying securities. At March 31, 2015 all of the Funds held repurchase agreements.
Security lending
Each Fund, except Oakmark, may lend its portfolio securities to broker-dealers and banks. Any such loan must be continuously secured by collateral in cash, cash equivalents or U.S. Treasuries maintained on a current basis in an amount at least equal to the fair value of the securities loaned by the Fund. Collateral is marked to market and monitored daily. The Fund continues to receive the equivalent of the interest or dividends paid by the issuer on the securities loaned and also receives an additional return that may be in the form of a fixed fee or a percentage of the earnings on the collateral. The Fund has the right to call the loan and attempt to obtain the securities loaned at any time on notice of not more than five business days. In the event of bankruptcy or other default of the borrower, the Fund could experience delays in liquidating the loan collateral or recovering the loaned securities and incur expenses related to enforcing its rights. In addition, there could be a decline in the value of the collateral or in the fair value of the securities loaned while the Fund seeks to enforce its rights thereto, and the Fund could experience subnormal levels of income or lack of access to income during that period.
At March 31, 2015 Global, Global Select, International and Int'l Small Cap had securities on loan with a value of $38,869,270, $45,855,253, $564,434,893 and $32,925,146, respectively, and held as collateral for the loans U.S. Treasury securities with a value of $40,916,472, $48,300,098, $594,789,349 and $34,674,762, respectively.
Restricted securities
Each Fund may invest in restricted securities, which generally are considered illiquid, but such illiquid securities may not comprise more than 15% of the value of a Fund's net assets at the time of investment. The following investments, the sales of which are subject to restrictions on resale under federal securities laws, have been valued in good faith according to the securities valuation procedures established by the Board of Trustees (as stated in the Security valuation section) since their acquisition dates.
At March 31, 2015 Equity and Income held the following restricted securities:
Equity and Income
Par Value
(000) | | Security
Name | | Acquisition
Date | | Carrying
Value | | Original
Cost | | Value
(000) | | Percentage of
Net Assets | |
$ | 29,500 | | | 1011778 BC ULC / New Red
Finance Inc., 144A,
6.00%, due 04/01/22 | | 09/24/14 | | $ | 103.5000 | | | $ | 100.0000 | | | $ | 30,532 | | | | 0.15 | % | |
| | 9,785 | | | Activision Blizzard, Inc., 144A,
5.625%, due 09/15/21 | | 04/15/14 | | | 106.5000 | | | | 106.6250 | | | | 10,421 | | | | 0.05 | % | |
| | 4,325 | | | Activision Blizzard, Inc., 144A,
5.625%, due 09/15/21 | | 04/14/14 | | | 106.5000 | | | | 106.6250 | | | | 4,606 | | | | 0.02 | % | |
| | 2,925 | | | Activision Blizzard, Inc., 144A,
5.625%, due 09/15/21 | | 01/31/14 | | | 106.5000 | | | | 103.7500 | | | | 3,115 | | | | 0.02 | % | |
| | 1,950 | | | Activision Blizzard, Inc., 144A,
5.625%, due 09/15/21 | | 01/31/14 | | | 106.5000 | | | | 103.7500 | | | | 2,077 | | | | 0.01 | % | |
| | 1,000 | | | Activision Blizzard, Inc., 144A,
5.625%, due 09/15/21 | | 09/12/13 | | | 106.5000 | | | | 100.0000 | | | | 1,065 | | | | 0.01 | % | |
54 OAKMARK FUNDS
Oakmark Funds
Notes to Financial Statements (continued)
Par Value
(000) | | Security
Name | | Acquisition
Date | | Carrying
Value | | Original
Cost | | Value
(000) | | Percentage of
Net Assets | |
$ | 980 | | | Activision Blizzard, Inc., 144A,
5.625%, due 09/15/21 | | 04/25/14 | | $ | 106.5000 | | | $ | 106.6250 | | | $ | 1,044 | | | | 0.01 | % | |
| | 2,695 | | | Activision Blizzard, Inc., 144A,
6.125%, due 09/15/23 | | 04/09/14 | | | 109.0000 | | | | 109.0000 | | | | 2,938 | | | | 0.01 | % | |
| | 2,505 | | | Activision Blizzard, Inc., 144A,
6.125%, due 09/15/23 | | 02/06/14 | | | 109.0000 | | | | 104.7500 | | | | 2,730 | | | | 0.01 | % | |
| | 2,000 | | | Activision Blizzard, Inc., 144A,
6.125%, due 09/15/23 | | 09/17/13 | | | 109.0000 | | | | 101.6250 | | | | 2,180 | | | | 0.01 | % | |
| | 1,970 | | | Activision Blizzard, Inc., 144A,
6.125%, due 09/15/23 | | 04/15/14 | | | 109.0000 | | | | 108.7500 | | | | 2,147 | | | | 0.01 | % | |
| | 1,970 | | | Activision Blizzard, Inc., 144A,
6.125%, due 09/15/23 | | 04/11/14 | | | 109.0000 | | | | 108.7500 | | | | 2,147 | | | | 0.01 | % | |
| | 1,000 | | | Activision Blizzard, Inc., 144A,
6.125%, due 09/15/23 | | 09/12/13 | | | 109.0000 | | | | 100.0000 | | | | 1,090 | | | | 0.01 | % | |
| | 980 | | | Activision Blizzard, Inc., 144A,
6.125%, due 09/15/23 | | 04/25/14 | | | 109.0000 | | | | 108.6250 | | | | 1,068 | | | | 0.01 | % | |
| | 495 | | | Activision Blizzard, Inc., 144A,
6.125%, due 09/15/23 | | 04/11/14 | | | 109.0000 | | | | 108.7500 | | | | 540 | | | | 0.00 | %* | |
| | 50,000 | | | Anthem, Inc., 144A,
0.38%, due 04/07/15 | | 02/13/15 | | | 99.9938 | | | | 99.9455 | | | | 49,997 | | | | 0.24 | % | |
| | 25,000 | | | Anthem, Inc., 144A,
0.30%, due 04/01/15 | | 03/31/15 | | | 100.0000 | | | | 99.9992 | | | | 25,000 | | | | 0.12 | % | |
| | 25,000 | | | Anthem, Inc., 144A,
0.36%, due 04/14/15 | | 02/17/15 | | | 99.9874 | | | | 99.9456 | | | | 24,997 | | | | 0.12 | % | |
| | 25,000 | | | Anthem, Inc., 144A,
0.36%, due 04/15/15 | | 02/18/15 | | | 99.9864 | | | | 99.9456 | | | | 24,997 | | | | 0.12 | % | |
| | 50,000 | | | BMW US Capital LLC, 144A,
0.10%, due 04/28/15 | | 03/26/15 | | | 99.9925 | | | | 99.9908 | | | | 49,996 | | | | 0.24 | % | |
| | 44,000 | | | BMW US Capital LLC, 144A,
0.10%, due 04/29/15 | | 03/31/15 | | | 99.9922 | | | | 99.9919 | | | | 43,997 | | | | 0.21 | % | |
| | 38,000 | | | BMW US Capital LLC, 144A,
0.13%, due 04/20/15 | | 02/19/15 | | | 99.9931 | | | | 99.9784 | | | | 37,997 | | | | 0.18 | % | |
| | 35,000 | | | BMW US Capital LLC, 144A,
0.13%, due 04/09/15 | | 02/11/15 | | | 99.9971 | | | | 99.9794 | | | | 34,999 | | | | 0.17 | % | |
| | 35,000 | | | BMW US Capital LLC, 144A,
0.12%, due 04/29/15 | | 03/20/15 | | | 99.9907 | | | | 99.9877 | | | | 34,997 | | | | 0.17 | % | |
| | 33,000 | | | BMW US Capital LLC, 144A,
0.12%, due 04/23/15 | | 03/20/15 | | | 99.9927 | | | | 99.9897 | | | | 32,998 | | | | 0.16 | % | |
| | 30,000 | | | BMW US Capital LLC, 144A,
0.10%, due 04/30/15 | | 03/27/15 | | | 99.9919 | | | | 99.9914 | | | | 29,998 | | | | 0.14 | % | |
| | 26,000 | | | BMW US Capital LLC, 144A,
0.12%, due 04/01/15 | | 02/12/15 | | | 100.0000 | | | | 99.9840 | | | | 26,000 | | | | 0.13 | % | |
| | 24,000 | | | BMW US Capital LLC, 144A,
0.12%, due 04/17/15 | | 03/11/15 | | | 99.9947 | | | | 99.9877 | | | | 23,999 | | | | 0.12 | % | |
| | 23,000 | | | BMW US Capital LLC, 144A,
0.12%, due 04/10/15 | | 03/11/15 | | | 99.9970 | | | | 99.9900 | | | | 22,999 | | | | 0.11 | % | |
| | 5,000 | | | BMW US Capital LLC, 144A,
0.13%, due 05/04/15 | | 03/04/15 | | | 99.9881 | | | | 99.9780 | | | | 4,999 | | | | 0.02 | % | |
| | 26,250 | | | BP Capital Markets PLC, 144A,
0.60%, due 10/16/15 | | 02/05/15 | | | 99.7513 | | | | 99.5854 | | | | 26,185 | | | | 0.13 | % | |
| | 14,500 | | | BP Capital Markets PLC, 144A,
0.63%, due 11/02/15 | | 02/11/15 | | | 99.7132 | | | | 99.5453 | | | | 14,458 | | | | 0.07 | % | |
| | 11,450 | | | Cabela's Master Credit Card Trust, 144A,
0.725%, due 10/15/19 | | 10/20/11 | | | 100.3115 | | | | 100.0000 | | | | 11,486 | | | | 0.06 | % | |
| | 14,800 | | | Cleopatra Finance Ltd, 144A,
6.25%, due 02/15/22 | | 02/09/15 | | | 97.7500 | | | | 100.0000 | | | | 14,467 | | | | 0.07 | % | |
| | 14,800 | | | Cleopatra Finance Ltd, 144A,
6.50%, due 02/15/25 | | 02/09/15 | | | 96.5000 | | | | 100.0000 | | | | 14,282 | | | | 0.07 | % | |
| | 9,800 | | | Cleopatra Finance Ltd, 144A,
5.625%, due 02/15/20 | | 02/09/15 | | | 97.7000 | | | | 100.0000 | | | | 9,575 | | | | 0.05 | % | |
oakmark.com 55
Oakmark Funds
Notes to Financial Statements (continued)
Par Value
(000) | | Security
Name | | Acquisition
Date | | Carrying
Value | | Original
Cost | | Value
(000) | | Percentage of
Net Assets | |
$ | 12,774 | | | CNO Financial Group, Inc., 144A,
6.375%, due 10/01/20 | | 09/24/14 | | $ | 105.5000 | | | $ | 106.7500 | | | $ | 13,476 | | | | 0.06 | % | |
| | 4,920 | | | CNO Financial Group, Inc., 144A,
6.375%, due 10/01/20 | | 03/27/15 | | | 105.5000 | | | | 106.1115 | | | | 5,190 | | | | 0.03 | % | |
| | 2,940 | | | CNO Financial Group, Inc., 144A,
6.375%, due 10/01/20 | | 07/30/14 | | | 105.5000 | | | | 107.6250 | | | | 3,102 | | | | 0.01 | % | |
| | 2,140 | | | CNO Financial Group, Inc., 144A,
6.375%, due 10/01/20 | | 01/21/15 | | | 105.5000 | | | | 106.2500 | | | | 2,258 | | | | 0.01 | % | |
| | 1,075 | | | CNO Financial Group, Inc., 144A,
6.375%, due 10/01/20 | | 07/21/14 | | | 105.5000 | | | | 107.7500 | | | | 1,134 | | | | 0.01 | % | |
| | 981 | | | CNO Financial Group, Inc., 144A,
6.375%, due 10/01/20 | | 07/31/14 | | | 105.5000 | | | | 107.2500 | | | | 1,035 | | | | 0.00 | %* | |
| | 980 | | | CNO Financial Group, Inc., 144A,
6.375%, due 10/01/20 | | 04/30/14 | | | 105.5000 | | | | 108.5000 | | | | 1,034 | | | | 0.00 | %* | |
| | 250 | | | CNO Financial Group, Inc., 144A,
6.375%, due 10/01/20 | | 09/20/12 | | | 105.5000 | | | | 100.0000 | | | | 264 | | | | 0.00 | %* | |
| | 30,000 | | | Credit Suisse Group AG, 144A,
7.50%** | | 12/04/13 | | | 107.3750 | | | | 100.0000 | | | | 32,212 | | | | 0.16 | % | |
| | 7,000 | | | Credit Suisse Group AG, 144A,
6.25%** | | 06/11/14 | | | 98.2500 | | | | 100.0000 | | | | 6,877 | | | | 0.03 | % | |
| | 2,950 | | | Family Tree Escrow LLC, 144A,
5.75%, due 03/01/23 | | 02/06/15 | | | 105.2500 | | | | 100.0000 | | | | 3,105 | | | | 0.01 | % | |
| | 1,000 | | | Family Tree Escrow LLC, 144A,
5.25%, due 03/01/20 | | 02/06/15 | | | 104.7500 | | | | 100.0000 | | | | 1,048 | | | | 0.01 | % | |
| | 25,000 | | | General Mills, Inc., 144A,
0.34%, due 04/09/15 | | 02/27/15 | | | 99.9924 | | | | 99.9613 | | | | 24,998 | | | | 0.12 | % | |
| | 20,000 | | | General Mills, Inc., 144A,
0.32%, due 04/08/15 | | 02/25/15 | | | 99.9938 | | | | 99.9627 | | | | 19,999 | | | | 0.10 | % | |
| | 20,000 | | | General Mills, Inc., 144A,
0.43%, due 04/17/15 | | 03/11/15 | | | 99.9813 | | | | 99.9568 | | | | 19,996 | | | | 0.10 | % | |
| | 20,000 | | | General Mills, Inc., 144A,
0.51%, due 05/14/15 | | 03/20/15 | | | 99.9403 | | | | 99.9236 | | | | 19,988 | | | | 0.10 | % | |
| | 15,100 | | | General Mills, Inc., 144A,
0.32%, due 04/06/15 | | 02/20/15 | | | 99.9956 | | | | 99.9600 | | | | 15,099 | | | | 0.07 | % | |
| | 15,000 | | | General Mills, Inc., 144A,
0.31%, due 04/06/15 | | 02/09/15 | | | 99.9957 | | | | 99.9518 | | | | 14,999 | | | | 0.07 | % | |
| | 15,000 | | | General Mills, Inc., 144A,
0.34%, due 04/07/15 | | 03/04/15 | | | 99.9943 | | | | 99.9679 | | | | 14,999 | | | | 0.07 | % | |
| | 15,000 | | | General Mills, Inc., 144A,
0.33%, due 04/10/15 | | 02/09/15 | | | 99.9918 | | | | 99.9450 | | | | 14,999 | | | | 0.07 | % | |
| | 15,000 | | | General Mills, Inc., 144A,
0.33%, due 04/13/15 | | 02/19/15 | | | 99.9890 | | | | 99.9514 | | | | 14,998 | | | | 0.07 | % | |
| | 15,000 | | | General Mills, Inc., 144A,
0.54%, due 05/22/15 | | 03/24/15 | | | 99.9249 | | | | 99.9131 | | | | 14,989 | | | | 0.07 | % | |
| | 13,000 | | | General Mills, Inc., 144A,
0.33%, due 04/14/15 | | 02/18/15 | | | 99.9881 | | | | 99.9496 | | | | 12,998 | | | | 0.06 | % | |
| | 10,000 | | | General Mills, Inc., 144A,
0.54%, due 05/22/15 | | 03/26/15 | | | 99.9249 | | | | 99.9161 | | | | 9,992 | | | | 0.05 | % | |
| | 9,000 | | | General Mills, Inc., 144A,
0.32%, due 04/07/15 | | 02/27/15 | | | 99.9947 | | | | 99.9653 | | | | 8,999 | | | | 0.04 | % | |
| | 5,000 | | | General Mills, Inc., 144A,
0.51%, due 04/21/15 | | 03/20/15 | | | 99.9722 | | | | 99.9556 | | | | 4,999 | | | | 0.02 | % | |
| | 5,000 | | | General Mills, Inc., 144A,
0.51%, due 05/19/15 | | 03/24/15 | | | 99.9333 | | | | 99.9222 | | | | 4,997 | | | | 0.02 | % | |
| | 5,000 | | | General Mills, Inc., 144A,
0.54%, due 05/22/15 | | 03/25/15 | | | 99.9249 | | | | 99.9146 | | | | 4,996 | | | | 0.02 | % | |
| | 3,000 | | | General Mills, Inc., 144A,
0.32%, due 04/08/15 | | 02/25/15 | | | 99.9938 | | | | 99.9627 | | | | 3,000 | | | | 0.01 | % | |
| | 8,060 | | | Glencore Funding LLC, 144A,
1.70%, due 05/27/16 | | 01/15/15 | | | 100.4174 | | | | 100.0790 | | | | 8,094 | | | | 0.04 | % | |
56 OAKMARK FUNDS
Oakmark Funds
Notes to Financial Statements (continued)
Par Value
(000) | | Security
Name | | Acquisition
Date | | Carrying
Value | | Original
Cost | | Value
(000) | | Percentage of
Net Assets | |
$ | 10,000 | | | Howard Hughes Corp., 144A,
6.875%, due 10/01/21 | | 09/27/13 | | $ | 104.7500 | | | $ | 100.0000 | | | $ | 10,475 | | | | 0.05 | % | |
| | 50,000 | | | John Deere Capital Co., 144A,
0.11%, due 04/16/15 | | 02/24/15 | | | 99.9954 | | | | 99.9844 | | | | 49,998 | | | | 0.24 | % | |
| | 40,000 | | | John Deere Capital Co., 144A,
0.11%, due 05/08/15 | | 03/25/15 | | | 99.9887 | | | | 99.9866 | | | | 39,995 | | | | 0.19 | % | |
| | 10,000 | | | John Deere Capital Co., 144A,
0.11%, due 04/13/15 | | 02/24/15 | | | 99.9963 | | | | 99.9853 | | | | 10,000 | | | | 0.05 | % | |
| | 50,000 | | | Kellogg Co., 144A,
0.42%, due 04/13/15 | | 03/13/15 | | | 99.9863 | | | | 99.9681 | | | | 49,993 | | | | 0.24 | % | |
| | 35,000 | | | Kellogg Co., 144A,
0.48%, due 04/17/15 | | 03/27/15 | | | 99.9791 | | | | 99.9726 | | | | 34,993 | | | | 0.17 | % | |
| | 30,000 | | | Kellogg Co., 144A,
0.49%, due 04/14/15 | | 03/24/15 | | | 99.9827 | | | | 99.9720 | | | | 29,995 | | | | 0.14 | % | |
| | 25,000 | | | Kellogg Co., 144A,
0.48%, due 04/08/15 | | 03/25/15 | | | 99.9909 | | | | 99.9817 | | | | 24,998 | | | | 0.12 | % | |
| | 10,000 | | | Kellogg Co., 144A,
0.41%, due 04/10/15 | | 03/13/15 | | | 99.9900 | | | | 99.9722 | | | | 9,999 | | | | 0.05 | % | |
| | 10,000 | | | Kellogg Co., 144A,
0.46%, due 04/20/15 | | 03/30/15 | | | 99.9763 | | | | 99.9738 | | | | 9,997 | | | | 0.05 | % | |
| | 10,000 | | | Kellogg Co., 144A,
0.48%, due 04/21/15 | | 03/31/15 | | | 99.9739 | | | | 99.9726 | | | | 9,997 | | | | 0.05 | % | |
| | 5,000 | | | Kellogg Co., 144A,
0.35%, due 04/01/15 | | 02/26/15 | | | 100.0000 | | | | 99.9669 | | | | 5,000 | | | | 0.02 | % | |
| | 1,650 | | | Kellogg Co., 144A,
0.48%, due 04/17/15 | | 03/30/15 | | | 99.9791 | | | | 99.9765 | | | | 1,650 | | | | 0.01 | % | |
| | 12,509 | | | Live Nation Entertainment, Inc., 144A,
7.00%, due 09/01/20 | | 09/09/14 | | | 106.5000 | | | | 107.5000 | | | | 13,322 | �� | | | 0.07 | % | |
| | 9,605 | | | Live Nation Entertainment, Inc., 144A,
7.00%, due 09/01/20 | | 08/15/12 | | | 106.5000 | | | | 100.0000 | | | | 10,229 | | | | 0.05 | % | |
| | 5,076 | | | Live Nation Entertainment, Inc., 144A,
7.00%, due 09/01/20 | | 05/16/14 | | | 106.5000 | | | | 109.1250 | | | | 5,406 | | | | 0.03 | % | |
| | 830 | | | Live Nation Entertainment, Inc., 144A,
7.00%, due 09/01/20 | | 01/22/15 | | | 106.5000 | | | | 106.5000 | | | | 884 | | | | 0.00 | %* | |
| | 600 | | | Live Nation Entertainment, Inc., 144A,
7.00%, due 09/01/20 | | 10/24/14 | | | 106.5000 | | | | 106.5000 | | | | 639 | | | | 0.00 | %* | |
| | 310 | | | Live Nation Entertainment, Inc., 144A,
7.00%, due 09/01/20 | | 10/30/14 | | | 106.5000 | | | | 106.5000 | | | | 330 | | | | 0.00 | %* | |
| | 2,000 | | | Live Nation Entertainment, Inc., 144A,
5.375%, due 06/15/22 | | 05/19/14 | | | 102.0000 | | | | 100.0000 | | | | 2,040 | | | | 0.01 | % | |
| | 14,750 | | | Medtronic Inc., 144A,
3.15%, due 3/15/22 | | 12/01/14 | | | 103.8364 | | | | 99.7910 | | | | 15,316 | | | | 0.07 | % | |
| | 2,950 | | | Medtronic Inc., 144A,
1.50%, due 3/15/18 | | 12/01/14 | | | 100.4344 | | | | 99.7120 | | | | 2,963 | | | | 0.02 | % | |
| | 50,000 | | | MetLife Short Term Funding LLC, 144A,
0.13%, due 05/12/15 | | 03/13/15 | | | 99.9852 | | | | 99.9794 | | | | 49,992 | | | | 0.24 | % | |
| | 50,000 | | | MetLife Short Term Funding LLC, 144A,
0.12%, due 05/13/15 | | 03/30/15 | | | 99.9860 | | | | 99.9857 | | | | 49,993 | | | | 0.24 | % | |
| | 41,000 | | | MetLife Short Term Funding LLC, 144A,
0.12%, due 05/19/15 | | 03/30/15 | | | 99.9840 | | | | 99.9837 | | | | 40,993 | | | | 0.20 | % | |
| | 33,000 | | | MetLife Short Term Funding LLC, 144A,
0.14%, due 04/07/15 | | 01/22/15 | | | 99.9977 | | | | 99.9708 | | | | 32,999 | | | | 0.16 | % | |
| | 30,000 | | | MetLife Short Term Funding LLC, 144A,
0.11%, due 04/08/15 | | 03/06/15 | | | 99.9979 | | | | 99.9899 | | | | 29,999 | | | | 0.15 | % | |
| | 30,000 | | | MetLife Short Term Funding LLC, 144A,
0.12%, due 04/16/15 | | 03/10/15 | | | 99.9950 | | | | 99.9877 | | | | 29,999 | | | | 0.15 | % | |
| | 30,000 | | | MetLife Short Term Funding LLC, 144A,
0.15%, due 04/28/15 | | 02/10/15 | | | 99.9888 | | | | 99.9679 | | | | 29,997 | | | | 0.15 | % | |
| | 30,000 | | | MetLife Short Term Funding LLC, 144A,
0.14%, due 05/28/15 | | 03/13/15 | | | 99.9778 | | | | 99.9716 | | | | 29,993 | | | | 0.15 | % | |
oakmark.com 57
Oakmark Funds
Notes to Financial Statements (continued)
Par Value
(000) | | Security
Name | | Acquisition
Date | | Carrying
Value | | Original
Cost | | Value
(000) | | Percentage of
Net Assets | |
$ | 28,000 | | | MetLife Short Term Funding LLC, 144A,
0.13%, due 04/13/15 | | 02/09/15 | | $ | 99.9957 | | | $ | 99.9773 | | | $ | 27,999 | | | | 0.14 | % | |
| | 28,000 | | | MetLife Short Term Funding LLC, 144A,
0.12%, due 04/21/15 | | 03/03/15 | | | 99.9933 | | | | 99.9837 | | | | 27,998 | | | | 0.14 | % | |
| | 25,000 | | | MetLife Short Term Funding LLC, 144A,
0.12%, due 04/17/15 | | 03/11/15 | | | 99.9947 | | | | 99.9877 | | | | 24,999 | | | | 0.12 | % | |
| | 22,076 | | | MetLife Short Term Funding LLC, 144A,
0.13%, due 05/11/15 | | 03/10/15 | | | 99.9856 | | | | 99.9776 | | | | 22,073 | | | | 0.11 | % | |
| | 21,000 | | | MetLife Short Term Funding LLC, 144A,
0.12%, due 04/24/15 | | 03/04/15 | | | 99.9923 | | | | 99.9830 | | | | 20,998 | | | | 0.10 | % | |
| | 20,000 | | | MetLife Short Term Funding LLC, 144A,
0.14%, due 05/28/15 | | 03/13/15 | | | 99.9778 | | | | 99.9716 | | | | 19,996 | | | | 0.10 | % | |
| | 16,000 | | | MetLife Short Term Funding LLC, 144A,
0.12%, due 04/01/15 | | 02/19/15 | | | 100.0000 | | | | 99.9863 | | | | 16,000 | | | | 0.08 | % | |
| | 16,000 | | | MetLife Short Term Funding LLC, 144A,
0.12%, due 04/15/15 | | 02/24/15 | | | 99.9953 | | | | 99.9833 | | | | 15,999 | | | | 0.08 | % | |
| | 15,000 | | | MetLife Short Term Funding LLC, 144A,
0.11%, due 04/10/15 | | 02/27/15 | | | 99.9973 | | | | 99.9872 | | | | 15,000 | | | | 0.07 | % | |
| | 15,000 | | | MetLife Short Term Funding LLC, 144A,
0.12%, due 05/06/15 | | 03/27/15 | | | 99.9883 | | | | 99.9867 | | | | 14,998 | | | | 0.07 | % | |
| | 50,000 | | | Philip Morris International, Inc., 144A,
0.11%, due 04/27/15 | | 03/10/15 | | | 99.9921 | | | | 99.9853 | | | | 49,996 | | | | 0.24 | % | |
| | 50,000 | | | Philip Morris International, Inc., 144A,
0.11%, due 04/28/15 | | 03/06/15 | | | 99.9918 | | | | 99.9838 | | | | 49,996 | | | | 0.24 | % | |
| | 50,000 | | | Philip Morris International, Inc., 144A,
0.09%, due 05/04/15 | | 03/25/15 | | | 99.9918 | | | | 99.9900 | | | | 49,996 | | | | 0.24 | % | |
| | 50,000 | | | Philip Morris International, Inc., 144A,
0.08%, due 05/11/15 | | 03/26/15 | | | 99.9911 | | | | 99.9898 | | | | 49,995 | | | | 0.24 | % | |
| | 35,000 | | | Philip Morris International, Inc., 144A,
0.13%, due 05/14/15 | | 03/18/15 | | | 99.9845 | | | | 99.9794 | | | | 34,995 | | | | 0.17 | % | |
| | 33,924 | | | Philip Morris International, Inc., 144A,
0.10%, due 04/21/15 | | 03/16/15 | | | 99.9944 | | | | 99.9900 | | | | 33,922 | | | | 0.16 | % | |
| | 30,000 | | | Philip Morris International, Inc., 144A,
0.11%, due 04/24/15 | | 03/05/15 | | | 99.9930 | | | | 99.9847 | | | | 29,998 | | | | 0.15 | % | |
| | 25,000 | | | Philip Morris International, Inc., 144A,
0.11%, due 04/20/15 | | 03/04/15 | | | 99.9942 | | | | 99.9856 | | | | 24,999 | | | | 0.12 | % | |
| | 25,000 | | | Philip Morris International, Inc., 144A,
0.07%, due 04/22/15 | | 03/30/15 | | | 99.9959 | | | | 99.9955 | | | | 24,999 | | | | 0.12 | % | |
| | 25,000 | | | Philip Morris International, Inc., 144A,
0.12%, due 05/18/15 | | 03/04/15 | | | 99.9843 | | | | 99.9750 | | | | 24,996 | | | | 0.12 | % | |
| | 25,000 | | | Philip Morris International, Inc., 144A,
0.08%, due 05/19/15 | | 03/31/15 | | | 99.9893 | | | | 99.9891 | | | | 24,997 | | | | 0.12 | % | |
| | 15,000 | | | Philip Morris International, Inc., 144A,
0.13%, due 05/14/15 | | 03/17/15 | | | 99.9845 | | | | 99.9791 | | | | 14,998 | | | | 0.07 | % | |
| | 10,000 | | | Philip Morris International, Inc., 144A,
0.13%, due 05/18/15 | | 03/06/15 | | | 99.9830 | | | | 99.9736 | | | | 9,998 | | | | 0.05 | % | |
| | 10,000 | | | Philip Morris International, Inc., 144A,
0.13%, due 05/26/15 | | 03/06/15 | | | 99.9801 | | | | 99.9708 | | | | 9,998 | | | | 0.05 | % | |
| | 9,000 | | | Philip Morris International, Inc., 144A,
0.07%, due 04/22/15 | | 03/30/15 | | | 99.9959 | | | | 99.9955 | | | | 9,000 | | | | 0.04 | % | |
| | 1,000 | | | Post Holdings, Inc., 144A,
6.75%, due 12/01/21 | | 01/27/12 | | | 101.0000 | | | | 105.7500 | | | | 1,010 | | | | 0.00 | %* | |
| | 2,000 | | | Quiksilver, Inc. / QS Wholesale, Inc., 144A,
7.875%, due 08/01/18 | | 07/11/13 | | | 90.5000 | | | | 99.4830 | | | | 1,810 | | | | 0.01 | % | |
| | 1,945 | | | Quiksilver, Inc. / QS Wholesale, Inc., 144A,
7.875%, due 08/01/18 | | 04/10/14 | | | 90.5000 | | | | 109.0000 | | | | 1,760 | | | | 0.01 | % | |
| | 1,745 | | | Quiksilver, Inc. / QS Wholesale, Inc., 144A,
7.875%, due 08/01/18 | | 04/14/14 | | | 90.5000 | | | | 108.7500 | | | | 1,579 | | | | 0.01 | % | |
| | 980 | | | Quiksilver, Inc. / QS Wholesale, Inc., 144A,
7.875%, due 08/01/18 | | 04/15/14 | | | 90.5000 | | | | 108.7500 | | | | 887 | | | | 0.00 | %* | |
58 OAKMARK FUNDS
Oakmark Funds
Notes to Financial Statements (continued)
Par Value
(000) | | Security
Name | | Acquisition
Date | | Carrying
Value | | Original
Cost | | Value
(000) | | Percentage of
Net Assets | |
$ | 980 | | | Quiksilver, Inc. / QS Wholesale, Inc., 144A,
7.875%, due 08/01/18 | | 05/27/14 | | $ | 90.5000 | | | $ | 108.7500 | | | $ | 887 | | | | 0.00 | %* | |
| | 980 | | | Quiksilver, Inc. / QS Wholesale, Inc., 144A,
7.875%, due 08/01/18 | | 05/13/14 | | | 90.5000 | | | | 108.6250 | | | | 887 | | | | 0.00 | %* | |
| | 19,665 | | | Scientific Games International, Inc., 144A,
10.00%, due 12/01/22 | | 11/14/14 | | | 93.5000 | | | | 89.8908 | | | | 18,387 | | | | 0.09 | % | |
| | 6,885 | | | Scientific Games International, Inc., 144A,
7.00%, due 01/01/22 | | 11/14/14 | | | 102.2500 | | | | 100.0000 | | | | 7,040 | | | | 0.03 | % | |
| | 5,000 | | | Scotiabank Peru SA, 144A,
4.50%, due 12/13/27 | | 12/06/12 | | | 99.7500 | | | | 100.0000 | | | | 4,987 | | | | 0.03 | % | |
| | 2,725 | | | Serta Simmons Holdings LLC, 144A,
8.125%, due 10/01/20 | | 09/27/12 | | | 105.2500 | | | | 99.8750 | | | | 2,868 | | | | 0.01 | % | |
| | 2,265 | | | Serta Simmons Holdings LLC, 144A,
8.125%, due 10/01/20 | | 09/26/12 | | | 105.2500 | | | | 99.0000 | | | | 2,384 | | | | 0.01 | % | |
| | 3,665 | | | Sirius XM Radio Inc, 144A,
5.25%, due 08/15/22, | | 03/26/15 | | | 105.5000 | | | | 106.2500 | | | | 3,866 | | | | 0.02 | % | |
| | 2,775 | | | Sirius XM Radio Inc, 144A,
5.25%, due 08/15/22, | | 03/13/15 | | | 105.5000 | | | | 106.2500 | | | | 2,928 | | | | 0.02 | % | |
| | 2,455 | | | Sirius XM Radio Inc, 144A,
5.25%, due 08/15/22, | | 03/04/15 | | | 105.5000 | | | | 106.6250 | | | | 2,590 | | | | 0.01 | % | |
| | 6,820 | | | Six Flags Entertainment Corp., 144A,
5.25%, due 01/15/21 | | 12/11/12 | | | 102.7500 | | | | 100.0000 | | | | 7,007 | | | | 0.03 | % | |
| | 3,150 | | | Six Flags Entertainment Corp., 144A,
5.25%, due 01/15/21 | | 12/11/12 | | | 102.7500 | | | | 101.0000 | | | | 3,237 | | | | 0.02 | % | |
| | 7,385 | | | Ultra Petroleum Corp., 144A,
5.75%, due 12/15/18 | | 06/24/14 | | | 90.2500 | | | | 105.2500 | | | | 6,665 | | | | 0.03 | % | |
| | 6,505 | | | Ultra Petroleum Corp., 144A,
5.75%, due 12/15/18 | | 05/28/14 | | | 90.2500 | | | | 105.4000 | | | | 5,871 | | | | 0.03 | % | |
| | 5,000 | | | Ultra Petroleum Corp., 144A,
5.75%, due 12/15/18 | | 10/28/14 | | | 90.2500 | | | | 100.5000 | | | | 4,513 | | | | 0.02 | % | |
| | 4,952 | | | Ultra Petroleum Corp., 144A,
5.75%, due 12/15/18 | | 05/27/14 | | | 90.2500 | | | | 105.5000 | | | | 4,469 | | | | 0.02 | % | |
| | 3,969 | | | Ultra Petroleum Corp., 144A,
5.75%, due 12/15/18 | | 06/25/14 | | | 90.2500 | | | | 105.2500 | | | | 3,582 | | | | 0.02 | % | |
| | 3,920 | | | Ultra Petroleum Corp., 144A,
5.75%, due 12/15/18 | | 04/11/14 | | | 90.2500 | | | | 105.6250 | | | | 3,538 | | | | 0.02 | % | |
| | 2,375 | | | Ultra Petroleum Corp., 144A,
5.75%, due 12/15/18 | | 10/28/14 | | | 90.2500 | | | | 100.5000 | | | | 2,143 | | | | 0.01 | % | |
| | 1,993 | | | Ultra Petroleum Corp., 144A,
5.75%, due 12/15/18 | | 06/26/14 | | | 90.2500 | | | | 105.2500 | | | | 1,799 | | | | 0.01 | % | |
| | 975 | | | Ultra Petroleum Corp., 144A,
5.75%, due 12/15/18 | | 04/16/14 | | | 90.2500 | | | | 105.5000 | | | | 880 | | | | 0.00 | %* | |
| | 735 | | | Ultra Petroleum Corp., 144A,
5.75%, due 12/15/18 | | 04/23/14 | | | 90.2500 | | | | 105.5000 | | | | 663 | | | | 0.00 | %* | |
| | 11,796 | | | Ultra Petroleum Corp., 144A,
6.125%, due 10/01/24 | | 09/04/14 | | | 85.7500 | | | | 100.0000 | | | | 10,115 | | | | 0.05 | % | |
| | 3,145 | | | Ultra Petroleum Corp., 144A,
6.125%, due 10/01/24 | | 10/27/14 | | | 85.7500 | | | | 96.2500 | | | | 2,697 | | | | 0.01 | % | |
| | 2,949 | | | Ultra Petroleum Corp., 144A,
6.125%, due 10/01/24 | | 09/04/14 | | | 85.7500 | | | | 99.7500 | | | | 2,529 | | | | 0.01 | % | |
| | 1,775 | | | Ultra Petroleum Corp., 144A,
6.125%, due 10/01/24 | | 10/24/14 | | | 85.7500 | | | | 96.5000 | | | | 1,522 | | | | 0.01 | % | |
| | 4,905 | | | Valeant Pharmaceuticals
International Inc, 144A,
6.375%, due 10/15/20 | | 03/16/15 | | | 103.8750 | | | | 103.7500 | | | | 5,095 | | | | 0.02 | % | |
| | 4,900 | | | Valeant Pharmaceuticals
International Inc, 144A,
6.375%, due 10/15/20 | | 03/17/15 | | | 103.8750 | | | | 103.6250 | | | | 5,090 | | | | 0.03 | % | |
| | 9,830 | | | Valeant Pharmaceuticals
International Inc, 144A,
5.625%, due 12/01/21 | | 03/16/15 | | | 101.5000 | | | | 101.2500 | | | | 9,978 | | | | 0.05 | % | |
oakmark.com 59
Oakmark Funds
Notes to Financial Statements (continued)
Par Value
(000) | | Security
Name | | Acquisition
Date | | Carrying
Value | | Original
Cost | | Value
(000) | | Percentage of
Net Assets | |
$ | 3,590 | | | Valeant Pharmaceuticals
International Inc, 144A,
5.625%, due 12/01/21 | | 03/25/15 | | $ | 101.5000 | | | $ | 101.1250 | | | $ | 3,644 | | | | 0.02 | % | |
| | 2,950 | | | Valeant Pharmaceuticals
International Inc, 144A,
5.625%, due 12/01/21 | | 03/17/15 | | | 101.5000 | | | | 101.2500 | | | | 2,994 | | | | 0.02 | % | |
| | 500 | | | VRX Escrow Corp, 144A,
5.375%, due 03/15/20 | | 03/13/15 | | | 100.8750 | | | | 100.0000 | | | | 504 | | | | 0.00 | %* | |
| | 500 | | | VRX Escrow Corp, 144A,
5.875%, due 05/15/23 | | 03/13/15 | | | 102.5000 | | | | 100.0000 | | | | 513 | | | | 0.00 | %* | |
| | 250 | | | VRX Escrow Corp, 144A,
6.125%, due 04/15/25 | | 03/13/15 | | | 103.5000 | | | | 100.0000 | | | | 259 | | | | 0.00 | %* | |
| | 9,830 | | | Zayo Group LLC / Zayo Capital Inc, 144A,
6.00%, due 04/01/23 | | 01/20/15 | | | 100.5000 | | | | 100.0000 | | | | 9,879 | | | | 0.05 | % | |
| | 4,915 | | | Zayo Group LLC / Zayo Capital Inc, 144A,
6.00%, due 04/01/23 | | 01/20/15 | | | 100.5000 | | | | 99.7500 | | | | 4,940 | | | | 0.02 | % | |
| | | | | | | | | | | $ | 2,369,120 | | | | 11.43 | % | |
* Amount rounds to less than 0.01%
** Security is perpetual and has no stated maturity date.
Federal income taxes
It is each Fund's policy to comply with the requirements of the Internal Revenue Code applicable to regulated investment companies and to distribute substantially all of its net taxable income, including any net realized gains on investments, to its shareholders. Therefore, no federal income tax provision is required. There is no material liability for unrecognized tax benefits in the accompanying financial statements. Generally, each of the tax years in the four-year period ended September 30, 2014 remains subject to examination by taxing authorities.
Recently issued accounting pronouncement
In June 2014, The Financial Accounting Standards Board (FASB) issued ASU 2014-11 Transfers & Servicing (Topic 860): Repurchase-to-Maturity Transactions, Repurchase Financings, and Disclosures to improve the financial reporting of repurchase agreements and other similar transactions. The guidance includes expanded disclosure requirements for entities that enter into repurchase agreements or securities lending transactions. The guidance is effective for financial statements with fiscal years beginning on or after January 1, 2015, and interim periods within those fiscal years. Management is evaluating the impact, if any, of this guidance on the Funds' financial statement disclosures.
2. TRANSACTIONS WITH AFFILIATES
Each Fund has an investment advisory agreement with the Adviser. For management services and facilities furnished, the Adviser receives from each Fund a monthly fee based on that Fund's net assets at the end of the preceding month. Annual fee rates are as follows:
Fund | | Advisory Fees | |
Oakmark | | 1.00% up to $2 billion;
0.90% on the next $1 billion;
0.80% on the next $2 billion;
0.75% on the next $2.5 billion;
0.675% on the next $2.5 billion;
0.625% on the next $2.5 billion; and
0.620% over $12.5 billion | |
Select | | 1.00% up to $1 billion;
0.95% on the next $500 million;
0.90% on the next $500 million;
0.85% on the next $500 million;
0.80% on the next $2.5 billion;
0.75% on the next $5 billion; and
0.725% over $10 billion | |
Fund | | Advisory Fees | |
Equity and Income | | 0.75% up to $5 billion;
0.70% on the next $2.5 billion;
0.675% on the next $2.5 billion;
0.65% on the next $2.5 billion;
0.60% on the next $3.5 billion;
0.585% on the next $5 billion;
0.5775% on the next $7 billion; and
0.5725% over $28 billion | |
Global | | 1.00% up to $2 billion;
0.95% on the next $2 billion;
0.90% on the next $4 billion; and
0.875% over $8 billion | |
60 OAKMARK FUNDS
Oakmark Funds
Notes to Financial Statements (continued)
Fund | | Advisory Fees | |
Global Select | | 1.00% up to $2 billion;
0.95% on the next $1 billion;
0.875% on the next $4 billion; and
0.85% over $7 billion | |
International | | 1.00% up to $2 billion;
0.95% on the next $1 billion;
0.85% on the next $2 billion;
0.825% on the next $2.5 billion;
0.815% on the next $3.5 billion;
0.805% on the next $5.5 billion;
0.80% on the next $6.5 billion;
0.795% on the next $7 billion;
0.790% on the next $5 billion; and
0.785% over $35 billion | |
Fund | | Advisory Fees | |
Int'l Small Cap | | 1.25% up to $500 million;
1.10% on the next $1 billion;
1.05% on the next $2 billion;
1.025% on the next $1.5 billion; and
1.00% over $5 billion | |
The Adviser is contractually obligated through January 31, 2016 to reimburse each Fund Class to the extent, but only to the extent, that its annualized expenses (excluding taxes, interest, all commissions and other normal charges incident to the purchase and sale of portfolio securities, and extraordinary charges such as litigation costs, but including fees paid to the Adviser) exceed the percent set forth below of average daily net assets of each Fund Class.
Fund | | Class I | | Class II | |
Oakmark | | | 1.50 | % | | | 1.75 | % | |
Select | | | 1.50 | | | | 1.75 | | |
Equity and Income | | | 1.00 | | | | 1.25 | | |
Global | | | 1.75 | | | | 2.00 | | |
Global Select | | | 1.75 | | | | 2.00 | | |
International | | | 2.00 | | | | 2.25 | | |
Int'l Small Cap | | | 2.00 | | | | 2.25 | | |
The Adviser is entitled to recoup from any Fund Class, in any fiscal year through September 30, 2019, amounts reimbursed to that Fund Class, except to the extent that the Fund Class already has paid such recoupment to the Adviser or such recoupment would cause the annual ordinary operating expenses of a Fund Class for that fiscal year to exceed the applicable limit stated above. As of March 31, 2015 there were no amounts subject to recoupment.
The Adviser and the Funds have entered into agreements with financial intermediaries to provide recordkeeping, processing, shareholder communications and other services to customers of the intermediaries and have agreed to compensate the intermediaries for providing those services. Certain of those services would be provided by the Funds if the shares of those customers were registered directly with the Funds' transfer agent. Accordingly, the Funds pay a portion of the intermediary fees pursuant to an agreement with the Adviser that calls for each Fund to pay a portion of the intermediary fees attributable to shares of the Fund held by the intermediary (which generally are a percentage of value of the shares held) not exceeding the lesser of 75% of the fees charged by the intermediary or what the Fund would have paid its transfer agent had each customer's shares been registered directly with the transfer agent instead of held through the intermediary. The Adviser pays the remainder of the fees. The fees incurred by the Funds are reflected as other shareholder servicing fees in the Statements of Operations.
The Independent Trustees of the Trust may participate in the Trust's Deferred Compensation Plan for Independent Trustees. Participants in the plan may elect to defer all or a portion of their compensation. Amounts deferred are retained by the Trust and represent an unfunded obligation of the Trust. The value of a participant's deferral account is determined by reference to the change in value of Class I shares of one or more of the Funds or a money market fund as specified by the participant. Benefits would be payable after a stated number of years or retirement from the Board of Trustees. The accrued obligations of the Funds under the plan are reflected as deferred Trustee compensation in the Statements of Assets and Liabilities. The change in the accrued obligations for the period is included in Trustees fees in the Statements of Operations. The Trust pays the compensation of the Trustees other than those affiliated with the Adviser and all expenses incurred in connection with their services to the Trust. The Trust does not provide any pension or retirement benefits to its Trustees.
The Funds reimburse the Adviser for a portion of the compensation paid to the Funds' Chief Compliance Officer ("CCO"). The CCO expenses incurred by the Funds are included in other expenses in the Statements of Operations.
oakmark.com 61
Oakmark Funds
Notes to Financial Statements (continued)
3. FEDERAL INCOME TAXES
At March 31, 2015 the cost of investments for federal income tax purposes and related composition of unrealized gains and losses for each Fund were as follows (in thousands):
Fund | | Cost of Investments
for Federal Income
Tax Purposes | | Gross Unrealized
Appreciation | | Gross Unrealized
(Depreciation) | | Net Unrealized
Appreciation
(Depreciation) | |
Oakmark | | $ | 13,754,638 | | | $ | 4,591,204 | | | $ | (283,982 | ) | | $ | 4,307,222 | | |
Select | | | 5,129,789 | | | | 1,583,408 | | | | (244,625 | ) | | | 1,338,783 | | |
Equity and Income | | | 15,960,423 | | | | 4,964,223 | | | | (216,368 | ) | | | 4,747,855 | | |
Global | | | 2,932,262 | | | | 720,125 | | | | (120,228 | ) | | | 599,897 | | |
Global Select | | | 1,871,183 | | | | 215,606 | | | | (58,943 | ) | | | 156,663 | | |
International | | | 27,053,581 | | | | 3,113,091 | | | | (808,608 | ) | | | 2,304,483 | | |
Int'l Small Cap | | | 2,929,134 | | | | 347,943 | | | | (190,409 | ) | | | 157,534 | | |
During the six-month period ended March 31, 2015 Int'l Small Cap incurred short-term losses of $8,588,930 that do not expire.
At March 31, 2015 the components of distributable earnings on a tax basis (excluding unrealized appreciation (depreciation)) were as follows (in thousands):
| | | Undistributed
Ordinary Income | | Undistributed Long-
Term Gain | | Total Distributable
Earnings | |
Oakmark | | $ | 32,899 | | | $ | 415,079 | | | $ | 447,978 | | |
Select | | | 358 | | | | 441,494 | | | | 441,852 | | |
Equity and Income | | | 43,243 | | | | 983,782 | | | | 1,027,025 | | |
Global | | | 0 | | | | 115,769 | | | | 115,769 | | |
Global Select | | | 4,789 | | | | 114,528 | | | | 119,317 | | |
International | | | 541,716 | | | | 0 | | | | 541,716 | | |
Int'l Small Cap | | | 31,545 | | | | 0 | | | | 31,545 | | |
During the six-month period ended March 31, 2015 and the year ended September 30, 2014 the tax character of distributions paid was as follows (in thousands):
| | | Period Ended
March 31, 2015 | | Year Ended
September 30, 2014 | |
Fund | | Distributions Paid
from Ordinary
Income | | Distributions Paid
from Long-Term
Capital Gain | | Distributions Paid
from Ordinary
Income | | Distributions Paid
from Long-Term
Capital Gain | |
Oakmark | | $ | 106,370 | | | $ | 1,038,351 | | | $ | 73,945 | | | $ | 462,307 | | |
Select | | | 0 | | | | 791,681 | | | | 3,665 | | | | 225,434 | | |
Equity and Income | | | 179,672 | | | | 1,624,370 | | | | 92,504 | | | | 1,482,357 | | |
Global | | | 59,333 | | | | 181,074 | | | | 78,124 | | | | 56,786 | | |
Global Select | | | 43,739 | | | | 63,191 | | | | 11,545 | | | | 22,884 | | |
International | | | 752,019 | | | | 1,058,512 | | | | 449,374 | | | | 303,100 | | |
Int'l Small Cap | | | 47,609 | | | | 166,576 | | | | 77,591 | | | | 0 | | |
On March 31, 2015 the Funds had temporary book/tax differences in undistributed earnings that were primarily attributable to trustee deferred compensation expenses, passive foreign investment companies, foreign currency contracts and deferrals of capital losses on wash sales. Temporary differences will reverse over time. The Funds have permanent differences in book/tax undistributed earnings primarily attributable to currency gains and losses, equalization debits, passive foreign investment companies, and distribution re-designations. Permanent differences have been recorded in their respective component of the Analysis of Net Assets.
62 OAKMARK FUNDS
Oakmark Funds
Notes to Financial Statements (continued)
4. INVESTMENT TRANSACTIONS
For the six-month period ended March 31, 2015 transactions in investment securities (excluding short-term and U.S. Government securities) were as follows (in thousands):
| | | Oakmark | | Select | | Equity and
Income | | Global | | Global
Select | | International | | Int'l
Small Cap | |
Purchases | | $ | 2,763,054 | | | $ | 1,225,760 | | | $ | 1,995,373 | | | $ | 646,948 | | | $ | 590,876 | | | $ | 4,217,499 | | | $ | 666,871 | | |
Proceeds from sales | | | 1,917,706 | | | | 965,269 | | | | 2,446,840 | | | | 744,268 | | | | 601,329 | | | | 6,504,833 | | | | 671,089 | | |
Purchases at cost and proceeds from sales (in thousands) of long-term U.S. Government securities for the six-month period ended March 31, 2015 were $92,838 and $155,874, respectively, for Equity and Income.
5. INVESTMENT IN AFFILIATED ISSUERS
Each of the companies listed below was considered to be an affiliate of a Fund because that Fund owned 5% or more of the company's voting securities during all or part of the six-month period ended March 31, 2015. Purchase and sale transactions and dividend and interest income earned during the period on these securities are set forth below (in thousands):
Schedule of Transactions with Affiliated Issuers
Equity and Income
Affiliates | | Shares /
Par Value | | Purchases
(Cost) | | Sales
(Proceeds) | | Dividend
Income | | Interest
Income | | Value
September 30,
2014 | | Value
March 31,
2015 | |
Foot Locker, Inc. | | | 7,348 | | | $ | 0 | | | $ | 0 | | | $ | 3,233 | | | $ | 0 | | | $ | 408,933 | | | $ | 462,943 | | |
Foot Locker, Inc.,
8.50%, due 01/15/22 | | $ | 4,340 | | | | 0 | | | | 0 | | | | 0 | | | | 185 | | | | 5,208 | | | | 5,143 | | |
TOTALS | | | | $ | 0 | | | $ | 0 | | | $ | 3,233 | | | $ | 185 | | | $ | 414,141 | | | $ | 468,086 | | |
Schedule of Transactions with Affiliated Issuers
International
Affiliates | | Shares | | Purchases
(Cost) | | Sales
(Proceeds) | | Dividend
Income | | Value
September 30,
2014 | | Value
March 31,
2015 | |
CNH Industrial N.V. | | | 93,721 | | | $ | 0 | | | $ | 0 | | | $ | 0 | | | $ | 745,757 | | | $ | 767,893 | | |
Meggitt PLC (b) | | | 38,915 | | | | 44,368 | | | | 50,601 | | | | 5,734 | | | | 287,075 | | | | 316,627 | | |
Meitec Corp. | | | 2,006 | | | | 0 | | | | 7,414 | | | | 959 | | | | 67,554 | | | | 67,331 | | |
Orica, Ltd. | | | 37,166 | | | | 17,126 | | | | 0 | (d) | | | 17,126 | | | | 595,967 | | | | 566,431 | | |
| SKF AB | | | 23,688 | | | | 8,339 | | | | 50,438 | | | | 15,424 | | | | 530,017 | | | | 612,829 | | |
Schindler Holding AG | | | 2,282 | | | | 80,709 | | | | 37,481 | | | | 7,620 | | | | 263,015 | | | | 380,013 | | |
Smiths Group PLC | | | 22,771 | | | | 79,432 | | | | 0 | | | | 12,327 | | | | 368,742 | | | | 377,643 | | |
Willis Group Holdings PLC | | | 14,917 | | | | 0 | | | | 14,172 | | | | 9,099 | | | | 630,995 | | | | 718,707 | | |
TOTALS | | | | $ | 229,974 | | | $ | 160,106 | | | $ | 68,289 | | | $ | 3,489,122 | | | $ | 3,807,474 | | |
oakmark.com 63
Oakmark Funds
Notes to Financial Statements (continued)
Schedule of Transactions with Affiliated Issuers
Int'l Small Cap
Affiliates | | Shares | | Purchases
(Cost) | | Sales
(Proceeds) | | Dividend
Income | | Value
September 30,
2014 | | Value
March 31,
2015 | |
Atea ASA | | | 7,191 | | | $ | 2,538 | | | $ | 0 | | | $ | 3,183 | | | $ | 78,305 | | | $ | 81,005 | | |
gategroup Holding AG | | | 1,560 | | | | 0 | | | | 5,686 | | | | 0 | | | | 37,905 | | | | 52,736 | | |
Goodman Fielder, Ltd. (b) (c) | | | 0 | | | | 0 | | | | 52,147 | | | | 0 | | | | 54,252 | | | | 0 | | |
Hengdeli Holdings, Ltd. | | | 245,477 | | | | 1,719 | | | | 0 | | | | 0 | | | | 37,441 | | | | 45,596 | | |
Konecranes OYJ (b) | | | 2,737 | | | | 23,850 | | | | 34,840 | | | | 3,018 | | | | 80,203 | | | | 86,532 | | |
LSL Property Services PLC | | | 10,416 | | | | 0 | | | | 0 | | | | 1,283 | | | | 55,047 | | | | 52,301 | | |
Morgan Advanced Materials PLC (b) | | | 13,849 | | | | 10,593 | | | | 2,769 | | | | 896 | | | | 58,174 | | | | 69,953 | | |
Orbotech, Ltd. (a) | | | 2,129 | | | | 3,337 | | | | 0 | | | | 0 | | | | 29,954 | | | | 34,134 | | |
Premier Farnell PLC | | | 25,092 | | | | 8,454 | | | | 0 | | | | 0 | | | | 64,247 | | | | 68,860 | | |
SThree PLC | | | 6,359 | | | | 9,467 | | | | 0 | | | | 396 | | | | 26,038 | | | | 32,852 | | |
Saft Groupe SA | | | 1,596 | | | | 0 | | | | 0 | | | | 0 | | | | 54,315 | | | | 58,769 | | |
Transpacific Industries Group, Ltd. | | | 85,019 | | | | 22,235 | | | | 0 | | | | 469 | | | | 37,207 | | | | 51,480 | | |
Wajax Corp. | | | 860 | | | | 9,685 | | | | 0 | | | | 493 | | | | 12,941 | | | | 16,427 | | |
TOTALS | | | | $ | 91,878 | | | $ | 95,442 | | | $ | 9,738 | | | $ | 626,029 | | | $ | 650,645 | | |
(a) Non-income producing security.
(b) Due to transactions during the six-month period ended March 31, 2015, the company is no longer an affiliate.
(c) Position in issuer liquidated during the six-month period ended March 31, 2015.
(d) Amount rounds to less than $1,000.
6. SUBSEQUENT EVENTS
Management has evaluated the possibility of subsequent events existing in the Funds' financial statements. Management has determined that there are no material events that would require adjustment or disclosure in the Funds' financial statements through the date of the publication of this report.
64 OAKMARK FUNDS
Financial Highlights–Class I
For a share outstanding throughout each period
| | | Six Months Ended
March 31, 2015 | | Year Ended September 30 | |
| | | (Unaudited) | | 2014 | | 2013 | | 2012 | | 2011 | | 2010 | |
Net Asset Value, Beginning of Period | | $ | 68.46 | | | $ | 59.73 | | | $ | 48.97 | | | $ | 37.87 | | | $ | 38.36 | | | $ | 34.55 | | |
Income From Investment Operations: | |
Net Investment Income | | | 0.23 | | | | 0.43 | | | | 0.42 | (a) | | | 0.36 | (a) | | | 0.34 | (a) | | | 0.24 | | |
Net Gain (Loss) on Investments
(both realized and unrealized) | | | 1.86 | | | | 11.22 | | | | 12.22 | | | | 11.09 | | | | (0.58 | ) | | | 3.80 | | |
Total From Investment Operations | | | 2.09 | | | | 11.65 | | | | 12.64 | | | | 11.45 | | | | (0.24 | ) | | | 4.04 | | |
Less Distributions: | |
From Net Investment Income | | | (0.42 | ) | | | (0.32 | ) | | | (0.38 | ) | | | (0.35 | ) | | | (0.25 | ) | | | (0.23 | ) | |
From Capital Gains | | | (4.13 | ) | | | (2.60 | ) | | | (1.50 | ) | | | 0.00 | | | | 0.00 | | | | 0.00 | | |
Total Distributions | | | (4.55 | ) | | | (2.92 | ) | | | (1.88 | ) | | | (0.35 | ) | | | (0.25 | ) | | | (0.23 | ) | |
Redemption Fees | | | 0.00 | | | | 0.00 | | | | 0.00 | | | | 0.00 | (b) | | | 0.00 | (b) | | | 0.00 | (b) | |
Net Asset Value, End of Period | | $ | 66.00 | | | $ | 68.46 | | | $ | 59.73 | | | $ | 48.97 | | | $ | 37.87 | | | $ | 38.36 | | |
Total Return | | | 3.05 | % | | | 20.01 | % | | | 26.75 | % | | | 30.43 | % | | | -0.67 | % | | | 11.74 | % | |
Ratios/Supplemental Data: | |
Net Assets, End of Period ($million) | | $ | 17,844.5 | | | $ | 16,489.4 | | | $ | 10,409.0 | | | $ | 6,738.7 | | | $ | 4,512.5 | | | $ | 3,419.3 | | |
Ratio of Expenses to Average Net Assets | | | 0.85 | %†(c) | | | 0.87 | %(c) | | | 0.95 | % | | | 1.03 | % | | | 1.04 | % | | | 1.11 | % | |
Ratio of Net Investment Income to
Average Net Assets | | | 0.73 | %† | | | 0.76 | % | | | 0.78 | % | | | 0.81 | % | | | 0.82 | % | | | 0.65 | % | |
Portfolio Turnover Rate | | | 12 | % | | | 25 | % | | | 19 | % | | | 27 | % | | | 18 | % | | | 24 | % | |
Financial Highlights–Class II
For a share outstanding throughout each period
| | | Six Months Ended
March 31, 2015 | | Year Ended September 30 | |
| | | (Unaudited) | | 2014 | | 2013 | | 2012 | | 2011 | | 2010 | |
Net Asset Value, Beginning of Period | | $ | 68.18 | | | $ | 59.58 | | | $ | 48.89 | | | $ | 37.78 | | | $ | 38.32 | | | $ | 34.56 | | |
Income From Investment Operations: | |
Net Investment Income | | | 0.11 | | | | 0.23 | | | | 0.27 | (a) | | | 0.24 | (a) | | | 0.19 | (a) | | | 0.13 | | |
Net Gain (Loss) on Investments
(both realized and unrealized) | | | 1.87 | | | | 11.19 | | | | 12.20 | | | | 11.09 | | | | (0.59 | ) | | | 3.79 | | |
Total From Investment Operations | | | 1.98 | | | | 11.42 | | | | 12.47 | | | | 11.33 | | | | (0.40 | ) | | | 3.92 | | |
Less Distributions: | |
From Net Investment Income | | | (0.28 | ) | | | (0.22 | ) | | | (0.28 | ) | | | (0.22 | ) | | | (0.14 | ) | | | (0.16 | ) | |
From Capital Gains | | | (4.13 | ) | | | (2.60 | ) | | | (1.50 | ) | | | 0.00 | | | | 0.00 | | | | 0.00 | | |
Total Distributions | | | (4.41 | ) | | | (2.82 | ) | | | (1.78 | ) | | | (0.22 | ) | | | (0.14 | ) | | | (0.16 | ) | |
Redemption Fees | | | 0.00 | | | | 0.00 | | | | 0.00 | | | | 0.00 | (b) | | | 0.00 | (b) | | | 0.00 | (b) | |
Net Asset Value, End of Period | | $ | 65.75 | | | $ | 68.18 | | | $ | 59.58 | | | $ | 48.89 | | | $ | 37.78 | | | $ | 38.32 | | |
Total Return | | | 2.88 | % | | | 19.64 | % | | | 26.41 | % | | | 30.11 | % | | | -1.07 | % | | | 11.37 | % | |
Ratios/Supplemental Data: | |
Net Assets, End of Period ($million) | | $ | 226.2 | | | $ | 170.7 | | | $ | 93.8 | | | $ | 36.1 | | | $ | 24.7 | | | $ | 9.0 | | |
Ratio of Expenses to Average Net Assets | | | 1.20 | %†(c) | | | 1.18 | %(c) | | | 1.23 | % | | | 1.30 | % | | | 1.45 | % | | | 1.42 | % | |
Ratio of Net Investment Income to
Average Net Assets | | | 0.38 | %† | | | 0.45 | % | | | 0.49 | % | | | 0.54 | % | | | 0.44 | % | | | 0.34 | % | |
Portfolio Turnover Rate | | | 12 | % | | | 25 | % | | | 19 | % | | | 27 | % | | | 18 | % | | | 24 | % | |
† Data has been annualized.
(a) Computed using average shares outstanding throughout the period.
(b) Amount rounds to less than $0.01 per share.
(c) Includes interest expense that amounts to less than 0.01%.
oakmark.com 65
Financial Highlights–Class I
For a share outstanding throughout each period
| | | Six Months Ended
March 31, 2015 | | Year Ended September 30 | |
| | | (Unaudited) | | 2014 | | 2013 | | 2012 | | 2011 | | 2010 | |
Net Asset Value, Beginning of Period | | $ | 44.71 | | | $ | 37.74 | | | $ | 32.33 | | | $ | 25.50 | | | $ | 25.64 | | | $ | 22.68 | | |
Income From Investment Operations: | |
Net Investment Income (Loss) | | | 0.03 | | | | (0.00 | )(b) | | | 0.04 | | | | 0.04 | | | | 0.04 | (a) | | | 0.06 | (a) | |
Net Gain (Loss) on Investments
(both realized and unrealized) | | | 1.05 | | | | 9.14 | | | | 8.40 | | | | 6.85 | | | | (0.12 | ) | | | 2.97 | | |
Total From Investment Operations | | | 1.08 | | | | 9.14 | | | | 8.44 | | | | 6.89 | | | | (0.08 | ) | | | 3.03 | | |
Less Distributions: | |
From Net Investment Income | | | 0.00 | | | | (0.04 | ) | | | (0.03 | ) | | | (0.06 | ) | | | (0.06 | ) | | | (0.07 | ) | |
From Capital Gains | | | (5.40 | ) | | | (2.13 | ) | | | (3.00 | ) | | | 0.00 | | | | 0.00 | | | | 0.00 | | |
Total Distributions | | | (5.40 | ) | | | (2.17 | ) | | | (3.03 | ) | | | (0.06 | ) | | | (0.06 | ) | | | (0.07 | ) | |
Redemption Fees | | | 0.00 | | | | 0.00 | | | | 0.00 | | | | 0.00 | (b) | | | 0.00 | (b) | | | 0.00 | (b) | |
Net Asset Value, End of Period | | $ | 40.39 | | | $ | 44.71 | | | $ | 37.74 | | | $ | 32.33 | | | $ | 25.50 | | | $ | 25.64 | | |
Total Return | | | 2.38 | % | | | 25.03 | % | | | 28.40 | % | | | 27.05 | % | | | -0.34 | % | | | 13.39 | % | |
Ratios/Supplemental Data: | |
Net Assets, End of Period ($million) | | $ | 6,425.1 | | | $ | 6,238.8 | | | $ | 3,944.6 | | | $ | 3,029.5 | | | $ | 2,266.7 | | | $ | 2,407.8 | | |
Ratio of Expenses to Average Net Assets | | | 0.95 | %† | | | 0.95 | %(c) | | | 1.01 | % | | | 1.05 | % | | | 1.07 | % | | | 1.08 | % | |
Ratio of Net Investment Income (Loss) to
Average Net Assets | | | 0.11 | %† | | | (0.03 | )% | | | 0.11 | % | | | 0.11 | % | | | 0.15 | % | | | 0.22 | % | |
Portfolio Turnover Rate | | | 15 | % | | | 37 | % | | | 24 | % | | | 32 | % | | | 16 | % | | | 25 | % | |
Financial Highlights–Class II
For a share outstanding throughout each period
| | | Six Months Ended
March 31, 2015 | | Year Ended September 30 | |
| | | (Unaudited) | | 2014 | | 2013 | | 2012 | | 2011 | | 2010 | |
Net Asset Value, Beginning of Period | | $ | 44.32 | | | $ | 37.50 | | | $ | 32.21 | | | $ | 25.43 | | | $ | 25.59 | | | $ | 22.70 | | |
Income From Investment Operations: | |
Net Investment Loss | | | (0.04 | )(a) | | | (0.18 | ) | | | (0.11 | ) | | | (0.06 | )(a) | | | (0.05 | )(a) | | | (0.02 | )(a) | |
Net Gain (Loss) on Investments
(both realized and unrealized) | | | 1.05 | | | | 9.13 | | | | 8.40 | | | | 6.84 | | | | (0.11 | ) | | | 2.97 | | |
Total From Investment Operations | | | 1.01 | | | | 8.95 | | | | 8.29 | | | | 6.78 | | | | (0.16 | ) | | | 2.95 | | |
Less Distributions: | |
From Net Investment Income | | | 0.00 | | | | 0.00 | | | | 0.00 | | | | 0.00 | | | | 0.00 | | | | (0.06 | ) | |
From Capital Gains | | | (5.40 | ) | | | (2.13 | ) | | | (3.00 | ) | | | 0.00 | | | | 0.00 | | | | 0.00 | | |
Total Distributions | | | (5.40 | ) | | | (2.13 | ) | | | (3.00 | ) | | | 0.00 | | | | 0.00 | | | | (0.06 | ) | |
Redemption Fees | | | 0.00 | | | | 0.00 | | | | 0.00 | | | | 0.00 | (b) | | | 0.00 | (b) | | | 0.00 | (b) | |
Net Asset Value, End of Period | | $ | 39.93 | | | $ | 44.32 | | | $ | 37.50 | | | $ | 32.21 | | | $ | 25.43 | | | $ | 25.59 | | |
Total Return | | | 2.23 | % | | | 24.66 | % | | | 27.99 | % | | | 26.66 | % | | | -0.63 | % | | | 12.99 | % | |
Ratios/Supplemental Data: | |
Net Assets, End of Period ($million) | | $ | 39.1 | | | $ | 24.4 | | | $ | 15.0 | | | $ | 11.8 | | | $ | 8.0 | | | $ | 8.3 | | |
Ratio of Expenses to Average Net Assets | | | 1.25 | %† | | | 1.23 | %(c) | | | 1.33 | % | | | 1.36 | % | | | 1.38 | % | | | 1.39 | % | |
Ratio of Net Investment Income (Loss) to
Average Net Assets | | | (0.20 | )%† | | | (0.30 | )% | | | (0.21 | )% | | | (0.21 | )% | | | (0.16 | )% | | | (0.08 | )% | |
Portfolio Turnover Rate | | | 15 | % | | | 37 | % | | | 24 | % | | | 32 | % | | | 16 | % | | | 25 | % | |
† Data has been annualized.
(a) Computed using average shares outstanding throughout the period.
(b) Amount rounds to less than $0.01 per share.
(c) Includes interest expense that amounts to less than 0.01%.
66 OAKMARK FUNDS
Oakmark Equity and Income Fund
Financial Highlights–Class I
For a share outstanding throughout each period
| | | Six Months Ended
March 31, 2015 | | Year Ended September 30 | |
| | | (Unaudited) | | 2014 | | 2013 | | 2012 | | 2011 | | 2010 | |
Net Asset Value, Beginning of Period | | $ | 33.65 | | | $ | 33.06 | | | $ | 29.09 | | | $ | 25.62 | | | $ | 26.03 | | | $ | 24.72 | | |
Income From Investment Operations: | |
Net Investment Income | | | 0.12 | | | | 0.29 | | | | 0.28 | | | | 0.25 | | | | 0.26 | | | | 0.27 | (a) | |
Net Gain (Loss) on Investments
(both realized and unrealized) | | | 1.42 | | | | 3.02 | | | | 4.68 | | | | 4.07 | | | | (0.45 | ) | | | 1.33 | | |
Total From Investment Operations | | | 1.54 | | | | 3.31 | | | | 4.96 | | | | 4.32 | | | | (0.19 | ) | | | 1.60 | | |
Less Distributions: | |
From Net Investment Income | | | (0.27 | ) | | | (0.17 | ) | | | (0.27 | ) | | | (0.38 | ) | | | (0.22 | ) | | | (0.29 | ) | |
From Capital Gains | | | (2.72 | ) | | | (2.55 | ) | | | (0.72 | ) | | | (0.47 | ) | | | 0.00 | | | | 0.00 | | |
Total Distributions | | | (2.99 | ) | | | (2.72 | ) | | | (0.99 | ) | | | (0.85 | ) | | | (0.22 | ) | | | (0.29 | ) | |
Net Asset Value, End of Period | | $ | 32.20 | | | $ | 33.65 | | | $ | 33.06 | | | $ | 29.09 | | | $ | 25.62 | | | $ | 26.03 | | |
Total Return | | | 4.69 | % | | | 10.39 | % | | | 17.63 | % | | | 17.19 | % | | | -0.77 | % | | | 6.52 | % | |
Ratios/Supplemental Data: | |
Net Assets, End of Period ($million) | | $ | 19,630.3 | | | $ | 19,392.7 | | | $ | 18,222.5 | | | $ | 17,889.0 | | | $ | 16,441.0 | | | $ | 16,993.7 | | |
Ratio of Expenses to Average Net Assets | | | 0.75 | %† | | | 0.74 | % | | | 0.77 | % | | | 0.78 | % | | | 0.77 | % | | | 0.79 | % | |
Ratio of Net Investment Income to
Average Net Assets | | | 0.74 | %† | | | 0.85 | % | | | 0.89 | % | | | 0.84 | % | | | 0.93 | % | | | 1.04 | % | |
Portfolio Turnover Rate | | | 13 | % | | | 18 | % | | | 25 | %(b) | | | 29 | % | | | 47 | % | | | 91 | % | |
Financial Highlights–Class II
For a share outstanding throughout each period
| | | Six Months Ended
March 31, 2015 | | Year Ended September 30 | |
| | | (Unaudited) | | 2014 | | 2013 | | 2012 | | 2011 | | 2010 | |
Net Asset Value, Beginning of Period | | $ | 33.41 | | | $ | 32.83 | | | $ | 28.90 | | | $ | 25.45 | | | $ | 25.85 | | | $ | 24.57 | | |
Income From Investment Operations: | |
Net Investment Income | | | 0.07 | | | | 0.18 | (a) | | | 0.17 | | | | 0.15 | | | | 0.17 | | | | 0.18 | | |
Net Gain (Loss) on Investments
(both realized and unrealized) | | | 1.40 | | | | 3.00 | | | | 4.66 | | | | 4.05 | | | | (0.43 | ) | | | 1.33 | | |
Total From Investment Operations | | | 1.47 | | | | 3.18 | | | | 4.83 | | | | 4.20 | | | | (0.26 | ) | | | 1.51 | | |
Less Distributions: | |
From Net Investment Income | | | (0.16 | ) | | | (0.05 | ) | | | (0.18 | ) | | | (0.28 | ) | | | (0.14 | ) | | | (0.23 | ) | |
From Capital Gains | | | (2.72 | ) | | | (2.55 | ) | | | (0.72 | ) | | | (0.47 | ) | | | 0.00 | | | | 0.00 | | |
Total Distributions | | | (2.88 | ) | | | (2.60 | ) | | | (0.90 | ) | | | (0.75 | ) | | | (0.14 | ) | | | (0.23 | ) | |
Net Asset Value, End of Period | | $ | 32.00 | | | $ | 33.41 | | | $ | 32.83 | | | $ | 28.90 | | | $ | 25.45 | | | $ | 25.85 | | |
Total Return | | | 4.50 | % | | | 10.04 | % | | | 17.23 | % | | | 16.82 | % | | | -1.04 | % | | | 6.17 | % | |
Ratios/Supplemental Data: | |
Net Assets, End of Period ($million) | | $ | 1,102.4 | | | $ | 1,157.2 | | | $ | 1,211.4 | | | $ | 1,288.0 | | | $ | 1,212.2 | | | $ | 1,270.1 | | |
Ratio of Expenses to Average Net Assets | | | 1.08 | %† | | | 1.05 | % | | | 1.10 | % | | | 1.09 | % | | | 1.09 | % | | | 1.12 | % | |
Ratio of Net Investment Income to
Average Net Assets | | | 0.40 | %† | | | 0.54 | % | | | 0.56 | % | | | 0.53 | % | | | 0.61 | % | | | 0.71 | % | |
Portfolio Turnover Rate | | | 13 | % | | | 18 | % | | | 25 | %(b) | | | 29 | % | | | 47 | % | | | 91 | % | |
† Data has been annualized.
(a) Computed using average shares outstanding throughout the period.
(b) The ratio excludes in-kind transactions.
oakmark.com 67
Financial Highlights–Class I
For a share outstanding throughout each period
| | | Six Months Ended
March 31, 2015 | | Year Ended September 30 | |
| | | (Unaudited) | | 2014 | | 2013 | | 2012 | | 2011 | | 2010 | |
Net Asset Value, Beginning of Period | | $ | 30.34 | | | $ | 29.70 | | | $ | 21.63 | | | $ | 18.81 | | | $ | 20.39 | | | $ | 18.94 | | |
Income From Investment Operations: | |
Net Investment Income | | | 0.02 | | | | 0.23 | (a) | | | 0.21 | | | | 0.20 | | | | 0.16 | (a) | | | 0.10 | | |
Net Gain (Loss) on Investments
(both realized and unrealized) | | | 1.52 | | | | 1.71 | | | | 8.23 | | | | 2.62 | | | | (1.65 | ) | | | 1.49 | | |
Total From Investment Operations | | | 1.54 | | | | 1.94 | | | | 8.44 | | | | 2.82 | | | | (1.49 | ) | | | 1.59 | | |
Less Distributions: | |
From Net Investment Income | | | (0.35 | ) | | | (0.75 | ) | | | (0.37 | ) | | | 0.00 | | | | (0.09 | ) | | | (0.14 | ) | |
From Capital Gains | | | (1.74 | ) | | | (0.55 | ) | | | 0.00 | | | | 0.00 | | | | 0.00 | | | | 0.00 | | |
Total Distributions | | | (2.09 | ) | | | (1.30 | ) | | | (0.37 | ) | | | 0.00 | | | | (0.09 | ) | | | (0.14 | ) | |
Redemption Fees | | | 0.00 | | | | 0.00 | | | | 0.00 | (b) | | | 0.00 | (b) | | | 0.00 | (b) | | | 0.00 | (b) | |
Net Asset Value, End of Period | | $ | 29.79 | | | $ | 30.34 | | | $ | 29.70 | | | $ | 21.63 | | | $ | 18.81 | | | $ | 20.39 | | |
Total Return | | | 5.24 | % | | | 6.70 | % | | | 39.55 | % | | | 14.99 | % | | | -7.38 | % | | | 8.43 | % | |
Ratios/Supplemental Data: | |
Net Assets, End of Period ($million) | | $ | 3,518.8 | | | $ | 3,503.8 | | | $ | 2,880.4 | | | $ | 2,062.8 | | | $ | 1,816.9 | | | $ | 2,031.8 | | |
Ratio of Expenses to Average Net Assets | | | 1.12 | %† | | | 1.11 | % | | | 1.13 | % | | | 1.16 | % | | | 1.16 | % | | | 1.15 | % | |
Ratio of Net Investment Income to
Average Net Assets | | | 0.07 | %† | | | 0.76 | % | | | 0.75 | % | | | 0.91 | % | | | 0.70 | % | | | 0.53 | % | |
Portfolio Turnover Rate | | | 19 | % | | | 31 | % | | | 45 | %(c) | | | 26 | % | | | 29 | %(c) | | | 37 | % | |
Financial Highlights–Class II
For a share outstanding throughout each period
| | | Six Months Ended
March 31, 2015 | | Year Ended September 30 | |
| | | (Unaudited) | | 2014 | | 2013 | | 2012 | | 2011 | | 2010 | |
Net Asset Value, Beginning of Period | | $ | 29.57 | | | $ | 28.98 | | | $ | 21.11 | | | $ | 18.42 | | | $ | 19.97 | | | $ | 18.58 | | |
Income From Investment Operations: | |
Net Investment Income (Loss) | | | (0.07 | ) | | | 0.13 | (a) | | | 0.03 | | | | 0.11 | (a) | | | 0.06 | (a) | | | 0.00 | (a) | |
Net Gain (Loss) on Investments
(both realized and unrealized) | | | 1.51 | | | | 1.67 | | | | 8.14 | | | | 2.58 | | | | (1.61 | ) | | | 1.48 | | |
Total From Investment Operations | | | 1.44 | | | | 1.80 | | | | 8.17 | | | | 2.69 | | | | (1.55 | ) | | | 1.48 | | |
Less Distributions: | |
From Net Investment Income | | | (0.24 | ) | | | (0.66 | ) | | | (0.30 | ) | | | 0.00 | | | | 0.00 | (b) | | | (0.09 | ) | |
From Capital Gains | | | (1.74 | ) | | | (0.55 | ) | | | 0.00 | | | | 0.00 | | | | 0.00 | | | | 0.00 | | |
Total Distributions | | | (1.98 | ) | | | (1.21 | ) | | | (0.30 | ) | | | 0.00 | | | | 0.00 | (b) | | | (0.09 | ) | |
Redemption Fees | | | 0.00 | | | | 0.00 | | | | 0.00 | (b) | | | 0.00 | (b) | | | 0.00 | (b) | | | 0.00 | (b) | |
Net Asset Value, End of Period | | $ | 29.03 | | | $ | 29.57 | | | $ | 28.98 | | | $ | 21.11 | | | $ | 18.42 | | | $ | 19.97 | | |
Total Return | | | 5.01 | % | | | 6.35 | % | | | 39.11 | % | | | 14.60 | % | | | -7.75 | % | | | 8.02 | % | |
Ratios/Supplemental Data: | |
Net Assets, End of Period ($million) | | $ | 39.4 | | | $ | 41.8 | | | $ | 38.9 | | | $ | 33.1 | | | $ | 36.6 | | | $ | 50.5 | | |
Ratio of Expenses to Average Net Assets | | | 1.51 | %† | | | 1.45 | % | | | 1.48 | % | | | 1.50 | % | | | 1.55 | % | | | 1.54 | % | |
Ratio of Net Investment Income (Loss) to
Average Net Assets | | | (0.33 | )%† | | | 0.42 | % | | | 0.40 | % | | | 0.55 | % | | | 0.27 | % | | | 0.09 | % | |
Portfolio Turnover Rate | | | 19 | % | | | 31 | % | | | 45 | %(c) | | | 26 | % | | | 29 | %(c) | | | 37 | % | |
† Data has been annualized.
(a) Computed using average shares outstanding throughout the period.
(b) Amount rounds to less than $0.01 per share.
(c) The ratio excludes in-kind transactions.
68 OAKMARK FUNDS
Oakmark Global Select Fund
Financial Highlights–Class I
For a share outstanding throughout each period
| | | Six Months Ended
March 31, 2015 | | Year Ended September 30 | |
| | | (Unaudited) | | 2014 | | 2013 | | 2012 | | 2011 | | 2010 | |
Net Asset Value, Beginning of Period | | $ | 16.63 | | | $ | 15.71 | | | $ | 11.65 | | | $ | 9.96 | | | $ | 10.15 | | | $ | 9.54 | | |
Income From Investment Operations: | |
Net Investment Income (Loss) | | | (0.01 | ) | | | 0.12 | | | | 0.14 | | | | 0.09 | | | | 0.02 | | | | 0.04 | | |
Net Gain (Loss) on Investments
(both realized and unrealized) | | | 0.70 | | | | 1.21 | | | | 4.18 | | | | 1.60 | | | | (0.19 | ) | | | 0.61 | | |
Total From Investment Operations | | | 0.69 | | | | 1.33 | | | | 4.32 | | | | 1.69 | | | | (0.17 | ) | | | 0.65 | | |
Less Distributions: | |
From Net Investment Income | | | (0.14 | ) | | | (0.14 | ) | | | (0.16 | ) | | | 0.00 | | | | (0.02 | ) | | | (0.04 | ) | |
From Capital Gains | | | (0.77 | ) | | | (0.27 | ) | | | (0.10 | ) | | | 0.00 | | | | 0.00 | | | | 0.00 | | |
Total Distributions | | | (0.91 | ) | | | (0.41 | ) | | | (0.26 | ) | | | 0.00 | | | | (0.02 | ) | | | (0.04 | ) | |
Redemption Fees | | | 0.00 | | | | 0.00 | | | | 0.00 | | | | 0.00 | (a) | | | 0.00 | (a) | | | 0.00 | (a) | |
Net Asset Value, End of Period | | $ | 16.41 | | | $ | 16.63 | | | $ | 15.71 | | | $ | 11.65 | | | $ | 9.96 | | | $ | 10.15 | | |
Total Return | | | 4.31 | % | | | 8.52 | % | | | 37.69 | % | | | 16.97 | % | | | -1.65 | % | | | 6.81 | % | |
Ratios/Supplemental Data: | |
Net Assets, End of Period ($million) | | $ | 2,037.5 | | | $ | 1,937.3 | | | $ | 1,159.8 | | | $ | 555.8 | | | $ | 422.0 | | | $ | 329.9 | | |
Ratio of Expenses to Average Net Assets | | | 1.14 | %† | | | 1.13 | % | | | 1.15 | % | | | 1.23 | % | | | 1.24 | % | | | 1.29 | % | |
Ratio of Net Investment Income (Loss) to
Average Net Assets | | | (0.18 | )%† | | | 0.92 | % | | | 1.01 | % | | | 0.72 | % | | | 0.33 | % | | | 0.40 | % | |
Portfolio Turnover Rate | | | 31 | % | | | 24 | % | | | 36 | % | | | 36 | % | | | 49 | % | | | 50 | % | |
† Data has been annualized.
(a) Amount rounds to less than $0.01 per share.
oakmark.com 69
Oakmark International Fund
Financial Highlights–Class I
For a share outstanding throughout each period
| | | Six Months Ended
March 31, 2015 | | Year Ended September 30 | |
| | | (Unaudited) | | 2014 | | 2013 | | 2012 | | 2011 | | 2010 | |
Net Asset Value, Beginning of Period | | $ | 25.01 | | | $ | 25.89 | | | $ | 18.79 | | | $ | 16.13 | | | $ | 18.18 | | | $ | 16.25 | | |
Income From Investment Operations: | |
Net Investment Income | | | 0.10 | (a) | | | 0.46 | (a) | | | 0.28 | | | | 0.34 | (a) | | | 0.31 | (a) | | | 0.20 | (a) | |
Net Gain (Loss) on Investments
(both realized and unrealized) | | | 1.33 | | | | (0.61 | ) | | | 7.26 | | | | 2.45 | | | | (2.20 | ) | | | 1.85 | | |
Total From Investment Operations | | | 1.43 | | | | (0.15 | ) | | | 7.54 | | | | 2.79 | | | | (1.89 | ) | | | 2.05 | | |
Less Distributions: | |
From Net Investment Income | | | (0.51 | ) | | | (0.44 | ) | | | (0.44 | ) | | | (0.13 | ) | | | (0.16 | ) | | | (0.12 | ) | |
From Capital Gains | | | (1.07 | ) | | | (0.29 | ) | | | 0.00 | | | | 0.00 | | | | 0.00 | | | | 0.00 | | |
Total Distributions | | | (1.58 | ) | | | (0.73 | ) | | | (0.44 | ) | | | (0.13 | ) | | | (0.16 | ) | | | (0.12 | ) | |
Redemption Fees | | | 0.00 | | | | 0.00 | | | | 0.00 | | | | 0.00 | (b) | | | 0.00 | (b) | | | 0.00 | (b) | |
Net Asset Value, End of Period | | $ | 24.86 | | | $ | 25.01 | | | $ | 25.89 | | | $ | 18.79 | | | $ | 16.13 | | | $ | 18.18 | | |
Total Return | | | 6.03 | % | | | -0.64 | % | | | 40.79 | % | | | 17.40 | % | | | -10.54 | % | | | 12.67 | % | |
Ratios/Supplemental Data: | |
Net Assets, End of Period ($million) | | $ | 29,014.6 | | | $ | 29,759.6 | | | $ | 23,886.0 | | | $ | 8,993.6 | | | $ | 6,920.8 | | | $ | 5,707.4 | | |
Ratio of Expenses to Average Net Assets | | | 0.95 | %† | | | 0.95 | % | | | 0.98 | % | | | 1.06 | % | | | 1.06 | % | | | 1.08 | % | |
Ratio of Net Investment Income to
Average Net Assets | | | 0.85 | %† | | | 1.76 | % | | | 1.58 | % | | | 1.90 | % | | | 1.63 | % | | | 1.21 | % | |
Portfolio Turnover Rate | | | 15 | % | | | 39 | %(c) | | | 37 | %(c) | | | 38 | % | | | 45 | % | | | 51 | % | |
Financial Highlights–Class II
For a share outstanding throughout each period
| | | Six Months Ended
March 31, 2015 | | Year Ended September 30 | |
| | | (Unaudited) | | 2014 | | 2013 | | 2012 | | 2011 | | 2010 | |
Net Asset Value, Beginning of Period | | $ | 25.07 | | | $ | 25.98 | | | $ | 18.86 | | | $ | 16.18 | | | $ | 18.25 | | | $ | 16.38 | | |
Income From Investment Operations: | |
Net Investment Income | | | 0.06 | (a) | | | 0.37 | (a) | | | 0.27 | (a) | | | 0.27 | | | | 0.24 | (a) | | | 0.14 | (a) | |
Net Gain (Loss) on Investments
(both realized and unrealized) | | | 1.33 | | | | (0.63 | ) | | | 7.23 | | | | 2.47 | | | | (2.20 | ) | | | 1.86 | | |
Total From Investment Operations | | | 1.39 | | | | (0.26 | ) | | | 7.50 | | | | 2.74 | | | | (1.96 | ) | | | 2.00 | | |
Less Distributions: | |
From Net Investment Income | | | (0.41 | ) | | | (0.36 | ) | | | (0.38 | ) | | | (0.06 | ) | | | (0.11 | ) | | | (0.13 | ) | |
From Capital Gains | | | (1.07 | ) | | | (0.29 | ) | | | 0.00 | | | | 0.00 | | | | 0.00 | | | | 0.00 | | |
Total Distributions | | | (1.48 | ) | | | (0.65 | ) | | | (0.38 | ) | | | (0.06 | ) | | | (0.11 | ) | | | (0.13 | ) | |
Redemption Fees | | | 0.00 | | | | 0.00 | | | | 0.00 | | | | 0.00 | (b) | | | 0.00 | (b) | | | 0.00 | (b) | |
Net Asset Value, End of Period | | $ | 24.98 | | | $ | 25.07 | | | $ | 25.98 | | | $ | 18.86 | | | $ | 16.18 | | | $ | 18.25 | | |
Total Return | | | 5.87 | % | | | -1.04 | % | | | 40.31 | % | | | 16.99 | % | | | -10.85 | % | | | 12.26 | % | |
Ratios/Supplemental Data: | |
Net Assets, End of Period ($million) | | $ | 624.3 | | | $ | 538.9 | | | $ | 386.9 | | | $ | 241.4 | | | $ | 204.0 | | | $ | 146.0 | | |
Ratio of Expenses to Average Net Assets | | | 1.32 | %† | | | 1.33 | % | | | 1.34 | % | | | 1.39 | % | | | 1.45 | % | | | 1.45 | % | |
Ratio of Net Investment Income to
Average Net Assets | | | 0.50 | %† | | | 1.40 | % | | | 1.20 | % | | | 1.55 | % | | | 1.26 | % | | | 0.83 | % | |
Portfolio Turnover Rate | | | 15 | % | | | 39 | %(c) | | | 37 | %(c) | | | 38 | % | | | 45 | % | | | 51 | % | |
† Data has been annualized.
(a) Computed using average shares outstanding throughout the period.
(b) Amount rounds to less than $0.01 per share.
(c) The ratio excludes in-kind transactions.
70 OAKMARK FUNDS
Oakmark International Small Cap Fund
Financial Highlights–Class I
For a share outstanding throughout each period
| | | Six Months Ended
March 31, 2015 | | Year Ended September 30 | |
| | | (Unaudited) | | 2014 | | 2013 | | 2012 | | 2011 | | 2010 | |
Net Asset Value, Beginning of Period | | $ | 16.38 | | | $ | 17.29 | | | $ | 13.06 | | | $ | 11.56 | | | $ | 13.02 | | | $ | 11.51 | | |
Income From Investment Operations: | |
Net Investment Income | | | 0.06 | | | | 0.17 | | | | 0.18 | | | | 0.20 | | | | 0.15 | (a) | | | 0.12 | (a) | |
Net Gain (Loss) on Investments
(both realized and unrealized) | | | 0.87 | | | | (0.53 | ) | | | 4.26 | | | | 1.32 | | | | (1.53 | ) | | | 1.55 | | |
Total From Investment Operations | | | 0.93 | | | | (0.36 | ) | | | 4.44 | | | | 1.52 | | | | (1.38 | ) | | | 1.67 | | |
Less Distributions: | |
From Net Investment Income | | | (0.26 | ) | | | (0.55 | ) | | | (0.21 | ) | | | (0.02 | ) | | | (0.08 | ) | | | (0.16 | ) | |
From Capital Gains | | | (0.90 | ) | | | 0.00 | | | | 0.00 | | | | 0.00 | (b) | | | 0.00 | | | | 0.00 | | |
Total Distributions | | | (1.16 | ) | | | (0.55 | ) | | | (0.21 | ) | | | (0.02 | ) | | | (0.08 | ) | | | (0.16 | ) | |
Redemption Fees | | | 0.00 | (b) | | | 0.00 | (b) | | | 0.00 | (b) | | | 0.00 | (b) | | | 0.00 | (b) | | | 0.00 | (b) | |
Net Asset Value, End of Period | | $ | 16.15 | | | $ | 16.38 | | | $ | 17.29 | | | $ | 13.06 | | | $ | 11.56 | | | $ | 13.02 | | |
Total Return | | | 6.31 | % | | | -2.14 | % | | | 34.42 | % | | | 13.15 | % | | | -10.72 | % | | | 14.70 | % | |
Ratios/Supplemental Data: | |
Net Assets, End of Period ($million) | | $ | 3,128.2 | | | $ | 2,910.0 | | | $ | 2,254.1 | | | $ | 1,525.8 | | | $ | 1,328.4 | | | $ | 1,217.2 | | |
Ratio of Expenses to Average Net Assets | | | 1.35 | %† | | | 1.31 | % | | | 1.35 | % | | | 1.41 | % | | | 1.38 | % | | | 1.38 | % | |
Ratio of Net Investment Income to
Average Net Assets | | | 0.61 | %† | | | 1.07 | % | | | 1.23 | % | | | 1.54 | % | | | 1.10 | % | | | 1.02 | % | |
Portfolio Turnover Rate | | | 23 | % | | | 38 | % | | | 50 | % | | | 33 | % | | | 46 | % | | | 54 | % | |
Financial Highlights–Class II
For a share outstanding throughout each period
| | | Six Months Ended
March 31, 2015 | | Year Ended September 30 | |
| | | (Unaudited) | | 2014 | | 2013 | | 2012 | | 2011 | | 2010 | |
Net Asset Value, Beginning of Period | | $ | 16.26 | | | $ | 17.17 | | | $ | 12.98 | | | $ | 11.50 | | | $ | 12.97 | | | $ | 11.50 | | |
Income From Investment Operations: | |
Net Investment Income | | | 0.01 | (a) | | | 0.14 | | | | 0.13 | (a) | | | 0.17 | (a) | | | 0.12 | (a) | | | 0.09 | (a) | |
Net Gain (Loss) on Investments
(both realized and unrealized) | | | 0.87 | | | | (0.54 | ) | | | 4.24 | | | | 1.31 | | | | (1.55 | ) | | | 1.54 | | |
Total From Investment Operations | | | 0.88 | | | | (0.40 | ) | | | 4.37 | | | | 1.48 | | | | (1.43 | ) | | | 1.63 | | |
Less Distributions: | |
From Net Investment Income | | | (0.19 | ) | | | (0.51 | ) | | | (0.18 | ) | | | 0.00 | | | | (0.04 | ) | | | (0.16 | ) | |
From Capital Gains | | | (0.90 | ) | | | 0.00 | | | | 0.00 | | | | 0.00 | (b) | | | 0.00 | | | | 0.00 | | |
Total Distributions | | | (1.09 | ) | | | (0.51 | ) | | | (0.18 | ) | | | 0.00 | (b) | | | (0.04 | ) | | | (0.16 | ) | |
Redemption Fees | | | 0.00 | (b) | | | 0.00 | (b) | | | 0.00 | (b) | | | 0.00 | (b) | | | 0.00 | (b) | | | 0.00 | (b) | |
Net Asset Value, End of Period | | $ | 16.05 | | | $ | 16.26 | | | $ | 17.17 | | | $ | 12.98 | | | $ | 11.50 | | | $ | 12.97 | | |
Total Return | | | 6.05 | % | | | -2.42 | % | | | 34.04 | % | | | 12.90 | % | | | -11.09 | % | | | 14.30 | % | |
Ratios/Supplemental Data: | |
Net Assets, End of Period ($million) | | $ | 2.5 | | | $ | 3.3 | | | $ | 3.5 | | | $ | 2.6 | | | $ | 1.9 | | | $ | 1.4 | | |
Ratio of Expenses to Average Net Assets | | | 1.73 | %† | | | 1.62 | % | | | 1.64 | % | | | 1.69 | % | | | 1.72 | % | | | 1.72 | % | |
Ratio of Net Investment Income to
Average Net Assets | | | 0.15 | %† | | | 0.70 | % | | | 0.90 | % | | | 1.34 | % | | | 0.85 | % | | | 0.74 | % | |
Portfolio Turnover Rate | | | 23 | % | | | 38 | % | | | 50 | % | | | 33 | % | | | 46 | % | | | 54 | % | |
† Data has been annualized.
(a) Computed using average shares outstanding throughout the period.
(b) Amount rounds to less than $0.01 per share.
oakmark.com 71
The Oakmark Funds Disclosure Regarding The Board Of Trustees' October 2014 Approval of Investment Advisory Contracts As Approved April 15, 2015
Each year, the Board of Trustees of the Oakmark Funds (the "Board"), including a majority of the independent Trustees, is required by the Investment Company Act of 1940 (the "1940 Act") to determine whether to continue each Fund's investment advisory agreement (each an "Agreement") with the Fund's investment adviser (the "Adviser"). The Board requests and receives from the Adviser a broad range of materials and information that are relevant to the Trustees' consideration of the Agreements, both throughout the year and especially in connection with its annual review of the Agreements. In addition, the Board retains an independent data provider to provide performance and expense information for each Fund and for comparable funds.
The Board's committee on contracts (the "Committee") leads the Board in its evaluation of the Agreements. The Committee is comprised entirely of trustees who are not "interested persons" of the Funds as defined in the 1940 Act ("Independent Trustees"), and more than 75% of the Board is comprised of Independent Trustees. During the last year, the Committee and the Board met numerous times to consider the Agreements. At each of those meetings, the Committee and the Board were advised by, and met in executive session with, their experienced independent legal counsel.
In connection with their consideration of each Agreement, the Committee and the Board considered, among other things: (i) the nature, quality and extent of the Adviser's services, (ii) the investment performance of each Fund, as well as performance information for comparable funds, (iii) the fees and other expenses paid by each Fund, as well as fee and expense information for comparable funds and separate accounts managed by the Adviser, (iv) the profitability of the Adviser and its affiliates from their relationship with each Fund, (v) whether economies of scale may be realized as the Funds grow and whether fee levels share with Fund investors economies of scale and (vi) other benefits to the Adviser from its relationship with each Fund.
At a meeting held on October 15, 2014, the Board, including all of the Independent Trustees, upon recommendation of the Committee, determined that the continuation of the Agreement for each Fund was in the best interest of the Fund and its shareholders, and approved the continuation of the Agreements through October 31, 2015. Below is a summary of the principal information considered by the Board as well as the Board's conclusions regarding various factors. In their deliberations, the Independent Trustees did not identify any single factor that was paramount or determinative, and each Independent Trustee may have weighed the information differently.
1. Nature, Extent and Quality of Services
The Board's consideration of the nature, extent and quality of the Adviser's services to the Funds took into account the knowledge the Board gained during meetings with the Adviser throughout the year. In addition, the Board considered: the Adviser's long-term history of care and conscientiousness in the management of the Funds; the consistency of its investment approach; the background and experience of the Adviser's investment personnel responsible for managing the Funds; the Adviser's performance as administrator of the Funds; the Adviser's comprehensive compliance program; and the favorable recognition of the Adviser and the Funds in the media and in industry publications. The Board also reviewed the Adviser's resources and key personnel involved in providing investment management services to the Funds, including the time that investment personnel devoted to each Fund and the investment results produced as a result of the Adviser's in-house research. The Board also noted the significant personal investments that the Adviser's personnel have made in the Funds, which serve to further align the interests of the Adviser and its personnel with those of the Funds' shareholders. The Board concluded that the nature, extent and quality of the services provided by the Adviser to each Fund were appropriate and consistent with the Fund's Agreement and that each Fund was likely to continue to benefit from services provided under its Agreement with the Adviser.
2. Investment Performance of the Funds
The Board considered each Fund's investment performance over various time periods, including how the Fund performed compared to the performance of a group of comparable funds (the Fund's "Performance Universe") selected by Lipper, Inc. ("Lipper"). Among the performance periods considered by the Board were those ended on April 30, 2014. Where available, the Board considered one-, three-, five- and ten-year performance.
Further detail considered by the Board regarding the investment performance of each Fund is set forth below:
Oakmark Fund, Oakmark Select Fund, Oakmark Equity and Income Fund, Oakmark Global Fund, Oakmark International Fund and Oakmark International Small Cap Fund. The Board considered that each Fund outperformed the median annualized returns of its respective Performance Universe during all periods presented.
Oakmark Global Select Fund. Noting that the Fund commenced operations in October 2006, the Board considered that the Fund outperformed the median annualized returns of its Performance Universe during all periods presented.
In addition to comparing each Fund's performance to that of its Performance Universe, the Board also considered each Fund's performance compared to that of its benchmark and other comparative data provided by Lipper, including each Fund's total return and performance relative to risk. After considering all of this information, the Board concluded that the Adviser was delivering performance for each Fund that was consistent with the long-term investment strategies being pursued by the Fund, and that the Fund and its shareholders were benefiting from the Adviser's investment management of the Fund.
3. Costs of Services Provided and Profits Realized by the Adviser
Using information provided by Lipper, the Board evaluated each Fund's advisory fee compared to the advisory fee for other mutual funds comparable in size, character and investment strategy (the "Expense Group"), and each Fund's expense ratio compared to that of the Expense Group.
72 OAKMARK FUNDS
The Board also reviewed the Adviser's advisory fees for comparable institutional separate account clients and subadvised funds (for which the Adviser provides portfolio management services only). The Board noted the Adviser's explanation that, although in most instances, the fees paid by those other clients were lower than the fees paid by the Funds, the differences reflected the Adviser's significantly greater level of responsibilities and broader scope of services regarding the Funds, and the more extensive regulatory obligations and risks associated with managing the Funds.
The Board also considered the Adviser's costs in serving as the Fund's investment adviser and manager, including costs associated with technology, infrastructure and compliance necessary to manage the Funds. The Board reviewed the Adviser's methodology for allocating costs among the Adviser's lines of business and among the Funds. The Board also considered information regarding the structure of the Adviser's compensation program for portfolio managers, analysts and certain other employees and the relationship of such compensation to the Adviser's ability to attract and retain quality personnel. Finally, the Board considered the Adviser's profitability analysis, as well as an Investment Management Industry Profitability Analysis prepared by Lipper. The Board examined the pre-tax profits realized by the Adviser and its affiliates from their relationship with each Fund, as presented in the profitability analyses, as well as the financial condition of the Adviser.
Further detail considered by the Board regarding the management fee rate and expense ratio of each Fund is set forth below:
Oakmark Fund, Oakmark Select Fund, Oakmark Global Select Fund and Oakmark International Small Cap Fund. The Board considered that each Fund's management fee rate and total expense ratio are higher than the respective medians of each Fund's Expense Group. The Board, in its consideration of expenses, took into account its review of each Fund's performance.
Oakmark Equity and Income Fund and Oakmark Global Fund. The Board considered that each Fund's management fee rate is higher than the median of the Fund's Expense Group. The Board noted, however, that each Fund's total expense ratio, which reflects the total fees paid by an investor, is lower than the median of each Fund's Expense Group.
Oakmark International Fund. The Board considered that the Fund's management fee and total expense ratio are lower than the respective medians of the Fund's Expense Group. The Board also considered its negotiation with the Adviser, the results of which was the Adviser's agreement to add additional breakpoints to its contract to reduce the Adviser's fees to 0.790% on assets from $30 billion to $35 billion and 0.785% for assets over $35 billion.
After its review of all the matters addressed, including those outlined above, the Board concluded that the management fees paid by each Fund to the Adviser were reasonable in light of the services provided, and that the profitability of the Adviser's relationship with the Funds appeared to be reasonable in relation to the services performed.
4. Economies of Scale and Fee Levels Reflecting Those Economies
The Board considered whether each Fund's management fee structure provides for a sharing with shareholders of potential economies of scale that may be realized by the Adviser. The Board reviewed each Agreement, which includes breakpoints that decrease the management fee rate as Fund's assets increase. The Board also considered that after negotiations with the Adviser, the Adviser agreed to additional breakpoints for the Oakmark International Fund to reduce the Adviser's fees to 0.790% on assets from $30 billion to $35 billion and 0.785% for assets over $35 billion. The Board concluded that the breakpoints in the fee schedule for each Fund allow shareholders to benefit from potential economies of scale that may be achieved by the Adviser.
5. Other Benefits Derived from the Relationship with the Funds
The Board also considered other benefits that accrue to the Adviser and its affiliates from their relationship with the Funds. The Board noted that an affiliate of the Adviser serves as the Funds' distributor, without compensation, pursuant to a written agreement the Board evaluates annually.
The Board also considered the Adviser's use of a portion of the commissions paid by the Funds on their portfolio brokerage transactions to obtain research products and services benefiting the Funds and/or other clients of the Adviser and considered the Adviser's assertion that its use of "soft" commission dollars to obtain research products and services was consistent with regulatory requirements.
After full consideration of the above factors, as well as other factors that were instructive in evaluating the Agreements, the Board, including all of the Independent Trustees, concluded that approval of the continuation of each Agreement was in the best interests of the Fund and its shareholders. On October 15, 2014, the Board continued each Agreement.
oakmark.com 73
Disclosures and Endnotes
Reporting to Shareholders. The Funds reduce the number of duplicate prospectuses, annual and semi-annual reports your household receives by sending only one copy of each to those addresses shared by two or more accounts. Call the Funds at 1-800-OAKMARK to request individual copies of these documents. The Funds will begin sending individual copies thirty days after receiving your request.
Before investing in any Oakmark Fund, you should carefully consider the Fund's investment objectives, risks, management fees and other expenses. This and other important information is contained in the Funds' prospectus and a Fund's summary prospectus. Please read the prospectus and summary prospectus carefully before investing. For more information, please visit oakmark.com or call 1-800-OAKMARK (625-6275).
The discussion of the Funds' investments and investment strategy (including current investment themes, the portfolio managers' research and investment process, and portfolio characteristics) represents the Funds' investments and the views of the portfolio managers and Harris Associates L.P., the Funds' investment adviser, at the time of this report, and are subject to change without notice.
Endnotes:
1. The S&P 500 Total Return Index is a market capitalization-weighted index of 500 large-capitalization stocks commonly used to represent the U.S. equity market. All returns reflect reinvested dividends and capital gains distributions. This index is unmanaged and investors cannot invest directly in this index.
2. "How Many Mutual Funds Routinely Rout the Market? Zero," The New York Times http://nyti.ms/1ACOJEG, March 14, 2015
3. The Dow Jones Industrial Average is an index that includes only 30 U.S. blue-chip companies. This index is unmanaged and investors cannot invest directly in this index.
4. The Lipper Large Cap Value Funds Index is an equally-weighted index of the largest 30 funds within the large cap value funds investment objective as defined by Lipper Inc. The index is adjusted for the reinvestment of capital gains and income dividends. This index is unmanaged and investors cannot invest directly in this index.
5. Portfolio holdings are subject to change without notice and are not intended as recommendations of individual stocks.
6. The Lipper Multi-Cap Value Funds Index tracks the results of the 30 largest mutual funds in the Lipper Multi-Cap Value Funds category. This index is unmanaged and investors cannot invest directly in this index.
7. The Lipper Balanced Funds Index measures the performance of the 30 largest U.S. balanced funds tracked by Lipper. This index is unmanaged and investors cannot invest directly in this index.
8. The Barclays U.S. Government / Credit Index is a benchmark index made up of the Barclays U.S. Government and U.S. Corporate Bond indices, including U.S. government Treasury and agency securities as well as corporate and Yankee bonds. This index is unmanaged and investors cannot invest directly in this index.
9. "Investment: Loser's game" http://www.ft.com/intl/cms/s/0/f15a1f9c-876c-11e4-8c9100144feabdc0.html#axzz3NyZQAYsX
Financial Times; December 21, 2014.
10. The MSCI World Index (Net) is a free float-adjusted market capitalization weighted index that is designed to measure the global equity market performance of developed markets. This benchmark calculates reinvested dividends net of withholding taxes using Luxembourg tax rates. This index is unmanaged and investors cannot invest directly in this index.
11. The Lipper Global Funds Index measures the performance of the 30 largest mutual funds that invest in securities throughout the world. This index is unmanaged and investors cannot invest directly in this index.
12. The MSCI World ex U.S. Index (Net) is a free float-adjusted market capitalization index that is designed to measure international developed market equity performance, excluding the U.S. This benchmark calculates reinvested dividends net of withholding taxes using Luxembourg tax rates. This index is unmanaged and investors cannot invest directly in this index.
13. The MSCI EAFE (Europe, Australasia, Far East) Index (Net) is a free float-adjusted market capitalization index that is designed to measure the international equity market performance of developed markets, excluding the U.S. & Canada. This benchmark calculates reinvested dividends net of withholding taxes using Luxembourg tax rates. This index is unmanaged and investors cannot invest directly in this index.
14. The Lipper International Funds Index reflects the net asset value weighted total return of the 30 largest international equity funds. This index is unmanaged and investors cannot invest directly in this index.
15. The MSCI World ex U.S. Small Cap Index (Net) is a free float-adjusted market capitalization index that is designed to measure global developed market equity performance, excluding the U.S. The MSCI Small Cap Indices target 40% of the eligible Small Cap universe within each industry group, within each country. MSCI defines the Small Cap universe as all listed securities that have a market capitalization in the range of USD200-1,500 million. This benchmark calculates reinvested dividends net of withholding taxes using Luxembourg tax rates. This index is unmanaged and investors cannot invest directly in this index.
16. The Lipper International Small Cap Funds Index measures the performance of the 10 largest international small-cap funds tracked by Lipper. This index is unmanaged and investors cannot invest directly in this index.
OAKMARK, OAKMARK FUNDS, OAKMARK INTERNATIONAL, and OAKMARK and tree design are trademarks owned or registered by Harris Associates L.P. in the U.S. and/or other countries.
74 OAKMARK FUNDS
Oakmark Funds
Trustees and Officers
Trustees
Allan J. Reich—Chairman
Michael J. Friduss*
Thomas H. Hayden
Christine M. Maki
Laurence C. Morse, Ph. D.
Steven S. Rogers
Kristi L. Rowsell
Burton W. Ruder
Peter S. Voss
Officers
Kristi L. Rowsell—President and Principal Executive Officer
Robert M. Levy—Executive Vice President
Judson H. Brooks—Vice President
Anthony P. Coniaris—Vice President
Richard J. Gorman—Vice President, Chief Compliance
Officer, Anti-Money Laundering Officer and Assistant Secretary
Kevin G. Grant—Vice President
Thomas E. Herman—Principal Financial Officer
David G. Herro—Vice President
M. Colin Hudson—Vice President
John J. Kane—Treasurer
Matthew A. Logan—Vice President
Michael L. Manelli—Vice President
Clyde S. McGregor—Vice President
Thomas W. Murray—Vice President
Michael J. Neary—Vice President
William C. Nygren—Vice President
Vineeta D. Raketich—Vice President
Janet L. Reali—Vice President, Secretary and Chief Legal Officer
Robert A. Taylor—Vice President
Andrew J. Tedeschi—Assistant Treasurer
Edward J. Wojciechowski—Vice President
* Mr. Friduss retired from the Board of Trustees effective December 31, 2014.
Other Information
Investment Adviser
Harris Associates L.P.
111 S. Wacker Drive
Chicago, Illinois 60606-4319
Transfer Agent
Boston Financial Data Services, Inc.
Quincy, Massachusetts
Legal Counsel
K&L Gates LLP
Chicago, Illinois
Independent Registered Public Accounting Firm
Deloitte & Touche LLP
Chicago, Illinois
Contact Us
Please call 1-800-OAKMARK
(1-800-625-6275)
or 617-483-8327
Website
oakmark.com
To obtain a prospectus, an application or periodic reports, access our website at oakmark.com, or call 1-800-OAKMARK (625-6275) or (617) 483-8327.
Each Fund will file its complete schedule of portfolio holdings with the Securities and Exchange Commission ("SEC") for the first and third quarters of each fiscal year on Form N-Q. The Funds' Form N-Qs are available on the SEC's website at www.sec.gov. The Funds' Form N-Qs may be reviewed and copied at the SEC's Public Reference Room in Washington, DC, and information on the operation of the Public Reference Room may be obtained by calling 1-800-SEC-0330.
A description of the policies and procedures the Funds use to determine how to vote proxies relating to portfolio securities is available without charge, upon request, by calling toll-free 1-800-625-6275; on the Funds' website at oakmark.com; and on the SEC's website at www.sec.gov.
No later than August 31 of each year, information regarding how the Adviser, on behalf of the Funds, voted proxies relating to the Funds' portfolio securities for the twelve months ended the preceding June 30 will be available through a link on the Funds' website at oakmark.com and on the SEC's website at www.sec.gov.
This report is submitted for the general information of the shareholders of the Funds. The report is not authorized for distribution to prospective investors in the Funds unless it is accompanied or preceded by a currently effective prospectus of the Funds.
No sales charge to the shareholder or to the new investor is made in offering the shares of the Funds; however, a shareholder of the Oakmark International Small Cap Fund may incur a 2% redemption fee on an exchange or redemption of Class I Shares and Class II Shares held for 90 days or less.
oakmark.com 75

This page intentionally left blank.
OAKMARK FUNDS


THE VALUE OF A $10,000 INVESTMENT IN OAKMARK FUND FROM ITS
INCEPTION (04/05/01) TO PRESENT (03/31/15) AS COMPARED TO THE
STANDARD & POOR'S 500 INDEX (UNAUDITED)
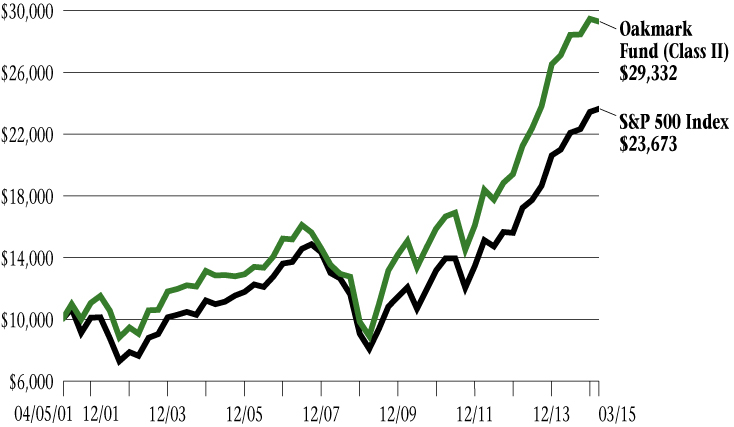
Average Annual Total Returns
(as of 03/31/15)
| (Unaudited) | | 1-year | | 5-year | | 10-year | | Since
Inception
(04/05/01) | |
Oakmark Fund (Class II) | | | 8.03 | % | | | 14.28 | % | | | 8.63 | % | | | 8.00 | % | |
S&P 500 Index | | | 12.73 | % | | | 14.47 | % | | | 8.01 | % | | | 6.36 | % | |
The graph and table do not reflect the deduction of taxes that a shareholder would pay on fund distributions or the redemption of fund shares.
The expense ratio for Class II shares as of 09/30/14 was 1.18%.
The performance data quoted represents past performance. Past performance does not guarantee future results. The investment return and principal value will fluctuate so that an investor's shares, when redeemed, may be worth more or less than their original cost. Current performance may be lower or higher than the performance data quoted. Average annual total return measures annualized change, while total return measures aggregate change. To obtain the most recent month-end performance data, visit oakmark.com.
The S&P 500 Total Return Index is a broad market-weighted average of U.S. blue-chip companies. This index is unmanaged and investors cannot invest directly in this index.
Harris Associates Securities L.P., member FINRA, May 2015
OAKMARK SELECT FUND CLASS II
THE VALUE OF A $10,000 INVESTMENT IN OAKMARK SELECT FUND FROM ITS
INCEPTION (12/31/99) TO PRESENT (03/31/15) AS COMPARED TO THE
STANDARD & POOR'S 500 INDEX (UNAUDITED)
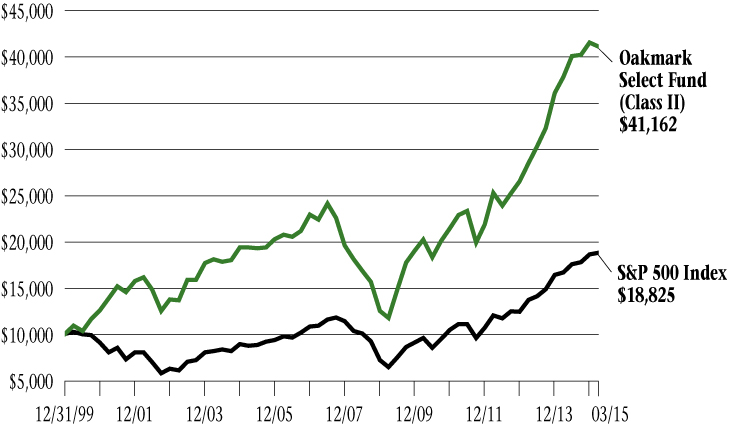
Average Annual Total Returns
(as of 03/31/15)
| (Unaudited) | |
1-year | |
5-year | |
10-year | | Since
Inception
(12/31/99) | |
Oakmark Select Fund (Class II) | | | 8.68 | % | | | 15.26 | % | | | 7.82 | % | | | 9.72 | % | |
S&P 500 Index | | | 12.73 | % | | | 14.47 | % | | | 8.01 | % | | | 4.24 | % | |
The graph and table do not reflect the deduction of taxes that a shareholder would pay on fund distributions or the redemption of fund shares.
The expense ratio for Class II shares as of 09/30/14 was 1.23%.
The performance data quoted represents past performance. Past performance does not guarantee future results. The investment return and principal value will fluctuate so that an investor's shares, when redeemed, may be worth more or less than their original cost. Current performance may be lower or higher than the performance data quoted. Average annual total return measures annualized change, while total return measures aggregate change. To obtain the most recent month-end performance data, visit oakmark.com.
The S&P 500 Total Return Index is a broad market-weighted average of U.S. blue-chip companies. This index is unmanaged and investors cannot invest directly in this index.
Harris Associates Securities L.P., member FINRA, May 2015
OAKMARK EQUITY AND INCOME FUND CLASS II
THE VALUE OF A $10,000 INVESTMENT IN OAKMARK EQUITY AND INCOME
FUND FROM ITS INCEPTION (07/12/00) TO PRESENT (03/31/15) AS COMPARED TO
THE LIPPER BALANCED FUND INDEX (UNAUDITED)
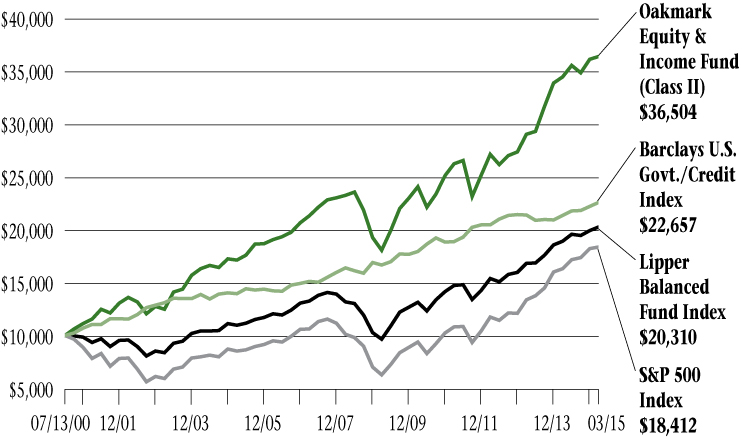
Average Annual Total Returns
(as of 03/31/15)
| (Unaudited) | | 1-year | | 5-year | | 10-year | | Since
Inception
(07/13/00) | |
Oakmark Equity & Income Fund
(Class II) | | | 5.67 | % | | | 8.65 | % | | | 7.83 | % | | | 9.20 | % | |
Lipper Balanced Fund Index | | | 7.17 | % | | | 9.07 | % | | | 6.34 | % | | | 4.93 | % | |
S&P 500 Index | | | 12.73 | % | | | 14.47 | % | | | 8.01 | % | | | 4.23 | % | |
Barclays U.S. Govt./Credit Index | | | 5.86 | % | | | 4.75 | % | | | 4.96 | % | | | 5.71 | % | |
The graph and table do not reflect the deduction of taxes that a shareholder would pay on fund distributions or the redemption of fund shares.
The expense ratio for Class II shares as of 09/30/14 was 1.05%.
The performance data quoted represents past performance. Past performance does not guarantee future results. The investment return and principal value will fluctuate so that an investor's shares, when redeemed, may be worth more or less than their original cost. Current performance may be lower or higher than the performance data quoted. Average annual total return measures annualized change, while total return measures aggregate change. To obtain the most recent month-end performance data, visit oakmark.com.
The Lipper Balanced Fund Index measures the performance of the 30 largest U.S. balanced funds tracked by Lipper. This index is unmanaged and investors cannot invest directly in this index.
Harris Associates Securities L.P., member FINRA, May 2015
OAKMARK GLOBAL FUND CLASS II
THE VALUE OF A $10,000 INVESTMENT IN OAKMARK GLOBAL FUND
FROM ITS INCEPTION (10/10/01) TO PRESENT (03/31/15) AS COMPARED TO THE
MSCI WORLD INDEX (UNAUDITED)

Average Annual Total Returns
(as of 03/31/15)
| (Unaudited) | | 1-year | | 5-year | | 10-year | | Since
Inception
(10/10/01) | |
Oakmark Global Fund (Class II) | | | 3.74 | % | | | 9.94 | % | | | 8.05 | % | | | 11.60 | % | |
MSCI World Index | | | 6.03 | % | | | 10.01 | % | | | 6.39 | % | | | 6.58 | % | |
The graph and table do not reflect the deduction of taxes that a shareholder would pay on fund distributions or the redemption of fund shares.
The expense ratio for Class II shares as of 09/30/14 was 1.45%.
The performance data quoted represents past performance. Past performance does not guarantee future results. The investment return and principal value will fluctuate so that an investor's shares, when redeemed, may be worth more or less than their original cost. Current performance may be lower or higher than the performance data quoted. Average annual total return measures annualized change, while total return measures aggregate change. To obtain the most recent month-end performance data, visit oakmark.com.
The MSCI World Index (Net) is a free float-adjusted market capitalization weighted index that is designed to measure the global equity market performance of developed markets. This benchmark calculates reinvested dividends net of withholding taxes using Luxembourg tax rates. This index is unmanaged and investors cannot invest directly in this index.
Harris Associates Securities L.P., member FINRA, May 2015
OAKMARK INTERNATIONAL FUND CLASS II
THE VALUE OF A $10,000 INVESTMENT IN OAKMARK INTERNATIONAL FUND
FROM ITS INCEPTION (11/04/99) TO PRESENT (03/31/15) AS COMPARED TO THE
MSCI WORLD EX U.S. INDEX (UNAUDITED)
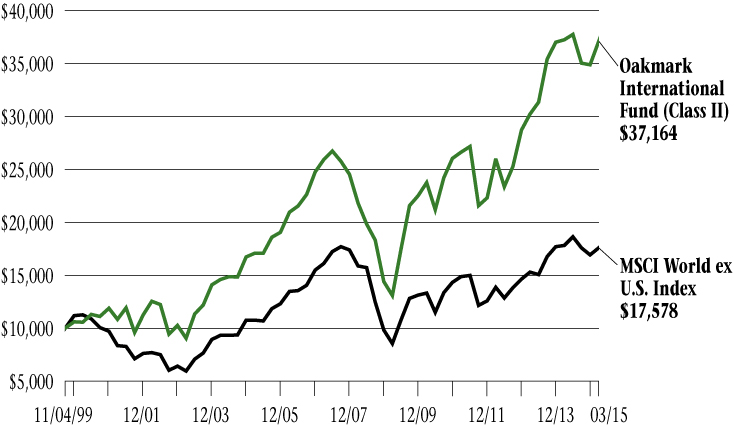
Average Annual Total Returns
(as of 03/31/15)
(Unaudited) | | 1-year | | 5-year | | 10-year | | Since
Inception
(11/04/99) | |
Oakmark International Fund (Class II) | | | -0.41 | % | | | 9.34 | % | | | 8.08 | % | | | 8.90 | % | |
MSCI World ex U.S. Index | | | -1.39 | % | | | 5.72 | % | | | 5.03 | % | | | 3.73 | % | |
The graph and table do not reflect the deduction of taxes that a shareholder would pay on fund distributions or the redemption of fund shares.
The expense ratio for Class II shares as of 09/30/14 was 1.33%.
The performance data quoted represents past performance. Past performance does not guarantee future results. The investment return and principal value will fluctuate so that an investor's shares, when redeemed, may be worth more or less than their original cost. Current performance may be lower or higher than the performance data quoted. Average annual total return measures annualized change, while total return measures aggregate change. To obtain the most recent month-end performance data, visit oakmark.com.
The MSCI World ex U.S. Index (Net) is a free float-adjusted market capitalization index that is designed to measure international developed market equity performance, excluding the U.S. This benchmark calculates reinvested dividends net of withholding taxes using Luxembourg tax rates. This index is unmanaged and investors cannot invest directly in this index.
Harris Associates Securities L.P., member FINRA, May 2015
OAKMARK INTERNATIONAL
SMALL CAP FUND CLASS II
THE VALUE OF A $10,000 INVESTMENT IN OAKMARK INTERNATIONAL SMALL CAP FUND FROM ITS INCEPTION (01/08/01) TO PRESENT (03/31/15) AS COMPARED TO THE MSCI WORLD EX U.S. SMALL CAP INDEX (UNAUDITED)
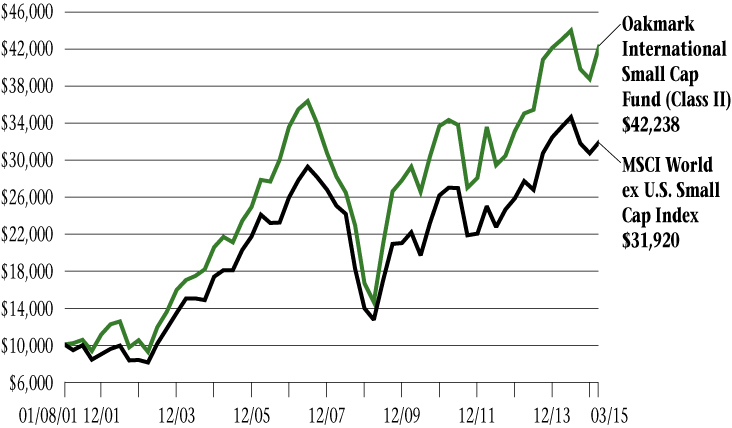
Average Annual Total Returns
(as of 03/31/15)
| (Unaudited) | | 1-year | | 5-year | | 10-year | | Since
Inception
(01/8/01) | |
Oakmark International Small Cap Fund
(Class II) | | | -1.80 | % | | | 7.63 | % | | | 6.92 | % | | | 10.66 | % | |
MSCI World ex U.S. Small Cap Index | | | -4.82 | % | | | 7.63 | % | | | 5.86 | % | | | 8.50 | % | |
The graph and table do not reflect the deduction of taxes that a shareholder would pay on fund distributions or the redemption of fund shares.
The expense ratio for Class II shares as of 09/30/14 was 1.62%.
The performance data quoted represents past performance. The above performance information does not reflect the imposition of a 2% redemption fee on shares held for 90 days or less. If reflected, the fee would reduce the performance quoted. Past performance does not guarantee future results. The investment return and principal value will fluctuate so that an investor's shares, when redeemed, may be worth more or less than their original cost. Current performance may be lower or higher than the performance data quoted. Average annual total return measures annualized change, while total return measures aggregate change. To obtain the most recent month-end performance data, visit oakmark.com.
The MSCI World ex U.S. Small Cap Index (Net) is a free float-adjusted market capitalization index that is designed to measure global developed market equity performance, excluding the U.S. The MSCI Small Cap Indices target 40% of the eligible Small Cap universe within each industry group, within each country. MSCI defines the Small Cap universe as all listed securities that have a market capitalization in the range of USD200-1,500 million. This benchmark calculates reinvested dividends net of withholding taxes using Luxembourg tax rates. This index is unmanaged and investors cannot invest directly in this index.
Harris Associates Securities L.P., member FINRA, May 2015
Item 2. Code of Ethics.
Not required in this filing.
Item 3. Audit Committee Financial Expert.
Not required in this filing.
Item 4. Principal Accountant Fees and Services.
Not required in this filing.
Item 5. Audit Committee of Listed Registrants.
Not required in this filing.
Item 6. Investments.
(a) The Schedule of Investments in securities of unaffiliated issuers is included as part of the semi-annual report to shareholders filed under Item 1 of this Form.
(b) No disclosures are required by this Item 6(b).
Item 7. Disclosure of Proxy Voting Policies and Procedures for Closed-End Management Investment Companies.
Not applicable.
Item 8. Portfolio Managers of Closed-End Management Investment Companies.
Not applicable.
Item 9. Purchases of Equity Securities by Closed-End Management Investment Company and Affiliated Purchasers.
Not applicable.
Item 10. Submission of Matters to a Vote of Security Holders.
During the period covered by this report, no amendments were made to the procedures adopted in fiscal year 2007.
Item 11. Controls and Procedures.
(a) Based on an evaluation of the disclosure controls and procedures (as defined in Rule
30a-3(c) under the Investment Company Act of 1940, the “Disclosure Controls”), the Disclosure Controls are effectively designed to ensure that information required to be disclosed by the Registrant in this report is recorded, processed, summarized and reported within 90 days prior to the filing of this report, including ensuring that information required to be disclosed in this report is accumulated and communicated to the Registrant’s management, including the Registrant’s principal executive officer and principal financial officer, as appropriate to allow timely decisions regarding required disclosure.
(b) There were no changes in the Registrant’s internal controls over financial reporting (as defined in Rule 30a-3(d) under the Investment Company Act of 1940) that occurred during the Registrant’s second fiscal quarter of the time period covered by this report that has materially affected, or is reasonably likely to materially affect, the Registrant’s internal control over financial reporting.
Item 12. Exhibits.
(a) | (1) | | Not required in this filing. |
| | | |
| (2) | | Certifications of Kristi L. Rowsell, Principal Executive Officer, and Thomas E. Herman, Principal Financial Officer, pursuant to Rule 30a-2(a) under the Investment Company Act of 1940 (17 CFR 270.30a-2(a)), attached hereto as Exhibits (a)(2)(i) and (a)(2)(ii). |
| | | |
| (3) | | Not applicable. |
| | | |
(b) | | | Certifications of Kristi L. Rowsell, Principal Executive Officer and Thomas E. Herman, Principal Financial Officer, pursuant to Section 906 of the Sarbanes-Oxley Act of 2002, attached hereto as Exhibit (b). |
SIGNATURES
Pursuant to the requirements of the Securities Exchange Act of 1934 and the Investment Company Act of 1940, the Registrant has duly caused this report to be signed on its behalf by the undersigned, thereunto duly authorized.
Harris Associates Investment Trust
By: | /s/ Kristi L. Rowsell | |
| Kristi L. Rowsell | |
| Principal Executive Officer | |
Date: | May 27, 2015 | |
Pursuant to the requirements of the Securities Exchange Act of 1934 and the Investment Company Act of 1940, this report has been signed below by the following persons on behalf of the Registrant and in the capacities and on the dates indicated.
By: | /s/ Kristi L. Rowsell | |
| Kristi L. Rowsell | |
| Principal Executive Officer | |
Date: | May 27, 2015 | |
| | |
| | |
By: | /s/ Thomas E. Herman | |
| Thomas E. Herman | |
| Principal Financial Officer | |
Date: | May 27, 2015 | |