UNITED STATES
SECURITIES AND EXCHANGE COMMISSION
Washington, D.C. 20549
FORM N-CSR
CERTIFIED SHAREHOLDER REPORT OF REGISTERED
MANAGEMENT INVESTMENT COMPANIES
Investment Company Act file number | 811-06279 |
|
Harris Associates Investment Trust |
(Exact name of registrant as specified in charter) |
|
Two North La Salle Street, Suite 500 Chicago, Illinois | | 60602-3790 |
(Address of principal executive offices) | | (Zip code) |
|
Kristi L. Rowsell Harris Associates L.P. Two North La Salle Street, #500 Chicago, Illinois 60602 | Paulita A. Pike K&L Gates LLP Three First National Plaza, #3100 Chicago, Illinois 60602 |
(Name and address of agent for service) |
|
Registrant’s telephone number, including area code: | (312) 621-0600 | |
|
Date of fiscal year end: | 9/30/12 | |
|
Date of reporting period: | 3/31/12 | |
| | | | | | | | | |
Item 1. Reports to Shareholders.
SEMI-ANNUAL REPORT
MARCH 31, 2012
oakmark.com

Advised by Harris Associates L.P.
THE OAKMARK FUNDS
2012 Semi-Annual Report
| President's Letter | | | 1 | | |
|
| Summary Information | | | 2 | | |
|
| Fund Expenses | | | 4 | | |
|
| Commentary on Oakmark and Oakmark Select Funds | | | 6 | | |
|
| Oakmark Fund | |
|
| Letter from the Portfolio Managers | | | 8 | | |
|
| Schedule of Investments | | | 10 | | |
|
| Oakmark Select Fund | |
|
| Letter from the Portfolio Managers | | | 14 | | |
|
| Schedule of Investments | | | 16 | | |
|
| Oakmark Equity and Income Fund | |
|
| Letter from the Portfolio Manager | | | 18 | | |
|
| Schedule of Investments | | | 21 | | |
|
| Oakmark Global Fund | |
|
| Letter from the Portfolio Managers | | | 28 | | |
|
| Global Diversification Chart | | | 31 | | |
|
| Schedule of Investments | | | 32 | | |
|
| Oakmark Global Select Fund | |
|
| Letter from the Portfolio Managers | | | 36 | | |
|
| Global Diversification Chart | | | 38 | | |
|
| Schedule of Investments | | | 39 | | |
|
| Oakmark International Fund | |
|
| Letter from the Portfolio Managers | | | 42 | | |
|
| Global Diversification Chart | | | 44 | | |
|
| Schedule of Investments | | | 45 | | |
|
| Oakmark International Small Cap Fund | |
|
| Letter from the Portfolio Managers | | | 50 | | |
|
| Global Diversification Chart | | | 52 | | |
|
| Schedule of Investments | | | 53 | | |
|
| Financial Statements | |
|
| Statements of Assets and Liabilities | | | 60 | | |
|
| Statements of Operations | | | 62 | | |
|
| Statements of Changes in Net Assets | | | 64 | | |
|
| Notes to Financial Statements | | | 71 | | |
|
| Financial Highlights | | | 83 | | |
|
| Disclosure Regarding Investment Advisory Contract Approval | | | 90 | | |
|
| Oakmark Glossary | | | 95 | | |
|
| Trustees and Officers | | | 96 | | |
|
FORWARD-LOOKING STATEMENT DISCLOSURE
One of our most important responsibilities as mutual fund managers is to communicate with shareholders in an open and direct manner. Some of our comments in our letters to shareholders are based on current management expectations and are considered "forward-looking statements". Actual future results, however, may prove to be different from our expectations. You can identify forward-looking statements by words such as "estimate", "may", "will", "expect", "believe", "plan" and other similar terms. We cannot promise future returns. Our opinions are a reflection of our best judgment at the time this report is compiled, and we disclaim any obligation to update or alter forward-looking statements as a result of new information, future events, or otherwise.
President's Letter
Dear Fellow Shareholders,
The Oakmark Funds posted strong gains during the first quarter of 2012. Each Fund matched or exceeded its benchmark performance, most by a sizable margin, even as many of the major stock indices have broken through their multi-year highs. (Go to oakmark.com/performance to view Oakmark Funds' performance.) It is gratifying to see what appears to be an improving market environment.
Several positive economic trends may be taking shape in the United States. During the fourth quarter, gross domestic product grew at an annual rate of 3%, an improvement from the past several quarters. The labor market is beginning to strengthen, as evidenced by declining unemployment claims. In fact, a Business Roundtable survey of 128 CEOs indicated that over 40% plan to add staff in the U.S. over the next six months. Household financial obligations fell to a 28-year low in the fourth quarter, and household disposable income is slowly growing. This should help spur the economic growth we need to sustain a gradual economic recovery.
Even with this more positive backdrop, however, many mutual fund investors have remained on the sidelines when it comes to the equity markets. Investment Company Institute data show that investors continued to redeem heavily from equity strategies in order to purchase bonds this past quarter, extending a multi-year trend. We see a great disparity between the long-term needs of investors, who seek to grow their wealth to meet future obligations, and the potential outcomes for this conservative allocation decision over time. For many quarters, our letters have indicated that we see far more long-term opportunities in the stock market than we do in bonds, and we hope very much that you have followed our advice to allocate your investments with this in mind. If so, you have been participating in a nice rally that may put you ahead of your peers.
We understand this decision on how and where to invest may invoke anxiety due to the financial crises of the past decade and the consequent market volatility. However, as value investors, we believe that by remaining disciplined and focusing unemotionally on intrinsic business values, investors can use market volatility to their advantage. In a number of instances, negative macroeconomic factors tarred entire industries or geographic regions, but these factors didn't necessarily impair the individual companies in which we invest. Even with the higher prices of stocks today, we are encouraged by market prospects, as evidenced by strong company balance sheets, positive free cash flow and successful efforts to build shareholder value. We believe our long-term track record reflects the consistent application of our investment discipline. When we look at recovery in the markets, and more notably at performance of The Oakmark Funds over the past six months, we believe our investors have been well-served.
If your household is feeling better off, as we hope it is, this could be a time to consider re-dedicating your efforts to saving and building wealth. Such an effort involves steady investing over time and throughout all market cycles. Keeping your spending level moderate and establishing a regular pattern of savings—essentially paying yourself first—are your best strategies for creating that nest egg. If you get a raise or a tax refund, consider adding all or part of it to your 401(k) or your Individual Retirement Account. The 2011 IRA season is still open a short while longer, and you can contribute for 2012 anytime through next April 15. Consider establishing monthly automated purchases from your bank account to your Oakmark Funds. Make regular savings part of your routine, a "financial housekeeping" discipline that makes your money work for you. After all, it's your money and your future.
We appreciate your continued confidence in The Oakmark Funds. If you have comments and questions, you can reach us at ContactOakmark@oakmark.com.
Kristi L. Rowsell
President of The Oakmark Funds
President of Harris Associates L.P.
March 31, 2012

1
THE OAKMARK FUNDS
Summary Information (Unaudited)
Performance for Period
Ended March 31, 20121 | | Oakmark
Fund—Class I
(OAKMX) | | Oakmark
Select Fund—Class I
(OAKLX) | | Oakmark
Equity and Income
Fund—Class I
(OAKBX) | | Oakmark
Global Fund—Class I
(OAKGX) | |
| | 3 Months* | | | | 14.44 | % | | | 15.58 | % | | | 7.91 | % | | | 15.76 | % | |
| | 1 Year | | | | 10.81 | % | | | 10.84 | % | | | 3.74 | % | | | -0.09 | % | |
Average Annual Total
Return for: | | | | | | | | | | | | | | | | | |
| | 3 Year | | | | 27.92 | % | | | 29.56 | % | | | 14.89 | % | | | 24.35 | % | |
| | 5 Year | | | | 4.26 | % | | | 2.69 | % | | | 5.32 | % | | | 0.76 | % | |
| | 10 Year | | | | 5.14 | % | | | 4.87 | % | | | 7.47 | % | | | 8.84 | % | |
| | Since inception | | | | 12.52%
(8/5/91) | | | | 12.52%
(11/1/96) | | | | 10.94%
(11/1/95) | | | | 10.62%
(8/4/99) | | |
| Top Five Equity
Holdings as of
March 31, 20122
Company and % of Total
Net Assets | | | Capital One
Financial Corp. 2.7%
JP Morgan
Chase & Co. 2.7%
Comcast Corp.,
Class A 2.6%
Apple, Inc. 2.5%
Intel Corp. 2.4% | | Discovery
Communications,
Inc., Class C 8.4%
TE Connectivity,
Ltd. 6.0%
Liberty Interactive
Corp., Class A 5.9%
Comcast Corp.,
Class A 5.1%
Capital One
Financial Corp. 5.0% | | Nestle SA 3.4%
UnitedHealth Group,
Inc. 3.3%
Cenovus Energy,
Inc. 3.3%
Diageo PLC 3.2%
General Dynamics
Corp. 3.0% | | Oracle Corp. 4.5%
Snap-on, Inc. 4.2%
Square Enix Holdings
Co., Ltd. 4.1%
Laboratory Corp. of
America Holdings 3.9%
MasterCard, Inc.,
Class A 3.8% | |
| Sector
Allocation as of
March 31, 2012
Sector and % of
Long-Term Investments at Fair Value | | | Consumer
Discretionary 26.2%
Information
Technology 25.5%
Financials 19.4%
Industrials 10.9%
Health Care 7.2%
Consumer Staples 5.9%
Energy 4.9% | | Consumer
Discretionary 38.5%
Information
Technology 30.2%
Financials 10.6%
Energy 8.3%
Health Care 4.5%
Industrials 4.2%
Utilities 3.7% | | U.S. Government
Securities 21.4%
Health Care 17.1%
Industrials 14.8%
Consumer Staples 14.1%
Energy 12.6%
Information
Technology 8.4%
Consumer
Discretionary 8.6%
Materials 1.4%
Foreign Government
Securities 1.0%
Financials 0.6% | | Information
Technology 35.7%
Industrials 21.5%
Financials 12.4%
Consumer
Discretionary 11.9%
Health Care 7.5%
Materials 4.6%
Energy 3.4%
Consumer Staples 3.0% | |
Past performance is no guarantee of future results. The performance data quoted represents past performance. Current performance may be lower or higher than the performance data quoted. The investment return and principal value vary so that an investor's shares when redeemed may be worth more or less than the original cost. The performance of the Funds does not reflect the 2% redemption fee imposed on shares redeemed within 90 days of purchase with the exception of the Oakmark Fund, Oakmark Select Fund and Oakmark Equity and Income Fund which do not impose a redemption fee. To obtain the most recent month-end performance data, visit oakmark.com.
* Not annualized
THE OAKMARK FUNDS
2
Performance for Period
Ended March 31, 20121 | | Oakmark
Global Select
Fund—Class I
(OAKWX) | | Oakmark
International
Fund—Class I
(OAKIX) | | Oakmark
International
Small Cap Fund—Class I
(OAKEX) | |
| | 3 Months* | | | | 18.62 | % | | | 16.80 | % | | | 19.77 | % | |
| | 1 Year | | | | 6.19 | % | | | -1.86 | % | | | -1.97 | % | |
Average Annual Total
Return for: | | | | | | | | | | | | | |
| | 3 Year | | | | 25.78 | % | | | 26.21 | % | | | 32.46 | % | |
| | 5 Year | | | | 4.15 | % | | | 0.38 | % | | | -0.85 | % | |
| | 10 Year | | | | N/A | | | | 7.96 | % | | | 10.87 | % | |
| | Since inception | | | | 5.92%
(10/2/06) | | | | 10.22%
(9/30/92) | | | | 10.51%
(11/1/95) | | |
| Top Five Equity
Holdings as of
March 31, 20122
Company and % of Total
Net Assets | | | Toyota Motor Corp. 6.3%
Adecco SA 5.4%
Comcast Corp.,
Class A 5.3%
ROHM Co., Ltd. 5.2%
Credit Suisse Group 5.2% | | Credit Suisse Group 4.2%
Toyota Motor Corp. 3.4%
Daiwa Securities
Group, Inc. 3.4%
Daimler AG 3.4%
Adecco SA 3.1% | | Julius Baer Group,
Ltd. 3.7%
Hirose Electric Co.,
Ltd. 3.2%
Atea ASA 3.1%
Sugi Holdings
Co., Ltd. 2.9%
LSL Property
Services PLC 2.8% | |
| Sector
Allocation as of
March 31, 2012
Sector and % of
Long-Term Investments at Fair Value | | | Information
Technology 35.0%
Consumer
Discretionary 22.2%
Financials 16.3%
Industrials 10.4%
Consumer Staples 7.3%
Health Care 4.6%
Energy 4.2% | | Financials 27.0%
Consumer
Discretionary 20.3%
Industrials 19.0%
Materials 10.9%
Information
Technology 10.4%
Consumer Staples 9.6%
Health Care 2.8% | | Industrials 26.7%
Information
Technology 20.3%
Consumer
Discretionary 17.9%
Financials 13.0%
Materials 10.6%
Consumer Staples 9.4%
Health Care 2.0%
Energy 0.1% | |
As of 9/30/11, the expense ratio for Class I shares was 1.04% for Oakmark Fund, 1.07% for Oakmark Select Fund, 0.77% for Oakmark Equity and Income Fund, 1.16% for Oakmark Global Fund, 1.24% for Oakmark Global Select Fund, 1.06% for Oakmark International Fund and 1.38% for Oakmark International Small Cap Fund.
THE OAKMARK FUNDS
3
FUND EXPENSES (Unaudited)
A shareholder of each Fund incurs ongoing costs, including investment advisory fees, transfer agent fees and other fund expenses. The examples below are intended to help shareholders understand the ongoing costs (in dollars) of investing in each Fund and to compare these costs with the ongoing costs of investing in other funds. Shares of all Funds, other than Oakmark Fund, Oakmark Select Fund and Oakmark Equity and Income Fund, invested for 90 days or less may be charged a 2% redemption fee, which is not included in ongoing costs. Please consult the Funds' prospectus at oakmark.com for more information.
Actual Expenses
The following table provides information about actual account values and actual fund expenses for Class I Shares of each Fund. The table shows the expenses a Class I shareholder would have paid on a $1,000 investment in each Fund from October 1, 2011 to March 31, 2012, as well as how much a $1,000 investment would be worth at the close of the period, assuming actual fund returns and expenses. A Class I shareholder can estimate expenses incurred for the period by dividing the account value at March 31, 2012, by $1,000 and multiplying the result by the number in the Expenses Paid During Period row as shown below.
| | | Oakmark Fund | | Oakmark Select Fund | | Oakmark Equity and Income Fund | | Oakmark Global Fund | | Oakmark Global Select Fund | | Oakmark International Fund | | Oakmark International Small Cap Fund | |
Beginning
Account
Value | | $ | 1,000.00 | | | $ | 1,000.00 | | | $ | 1,000.00 | | | $ | 1,000.00 | | | $ | 1,000.00 | | | $ | 1,000.00 | | | $ | 1,000.00 | | |
Ending
Account
Value | | $ | 1,270.80 | | | $ | 1,270.90 | | | $ | 1,175.90 | | | $ | 1,222.20 | | | $ | 1,241.00 | | | $ | 1,207.80 | | | $ | 1,244.10 | | |
Expenses
Paid
During
Period* | | $ | 5.90 | | | $ | 5.96 | | | $ | 4.24 | | | $ | 6.44 | | | $ | 6.84 | | | $ | 5.80 | | | $ | 7.85 | | |
Annualized
Expense
Ratio | | | 1.04 | % | | | 1.05 | % | | | 0.78 | % | | | 1.16 | % | | | 1.22 | % | | | 1.05 | % | | | 1.40 | % | |
* Expenses are equal to each Fund's annualized expense ratio for Class I Shares, multiplied by the average account value over the period, multiplied by the number of days in the most recent fiscal half-year divided by 366 (to reflect the one-half year period).
THE OAKMARK FUNDS
4
Hypothetical Example for Comparison Purposes
The following table provides information about hypothetical account values and hypothetical expenses for Class I Shares of each Fund based on actual expense ratios and an assumed rate of return of 5% per year before expenses, which are not the Funds' actual returns. The hypothetical account values and expenses may not be used to estimate the actual ending account balances or expenses shareholders paid for the period. Shareholders may use this information to compare the ongoing costs of investing in a Fund and other funds. To do so, compare this 5% hypothetical example with the 5% hypothetical examples that appear in the shareholder reports of the other funds.
Please note that the expenses shown in the table are meant to highlight your ongoing costs only and do not reflect any transaction costs, such as redemption fees. Therefore, the third line of the table is useful in comparing ongoing costs only and will not help you determine the relative total costs of owning different funds. In addition, if these transaction costs were included, the total costs would have been higher.
| | | Oakmark Fund | | Oakmark Select Fund | | Oakmark Equity and Income Fund | | Oakmark Global Fund | | Oakmark Global Select Fund | | Oakmark International Fund | | Oakmark International Small Cap Fund | |
Beginning
Account
Value | | $ | 1,000.00 | | | $ | 1,000.00 | | | $ | 1,000.00 | | | $ | 1,000.00 | | | $ | 1,000.00 | | | $ | 1,000.00 | | | $ | 1,000.00 | | |
Ending
Account
Value | | $ | 1,019.80 | | | $ | 1,019.75 | | | $ | 1,021.10 | | | $ | 1,019.20 | | | $ | 1,018.90 | | | $ | 1,019.75 | | | $ | 1,018.00 | | |
Expenses
Paid
During
Period* | | $ | 5.25 | | | $ | 5.30 | | | $ | 3.94 | | | $ | 5.86 | | | $ | 6.16 | | | $ | 5.30 | | | $ | 7.06 | | |
Annualized
Expense
Ratio | | | 1.04 | % | | | 1.05 | % | | | 0.78 | % | | | 1.16 | % | | | 1.22 | % | | | 1.05 | % | | | 1.40 | % | |
* Expenses are equal to each Fund's annualized expense ratio for Class I Shares, multiplied by the average account value over the period, multiplied by the number of days in the most recent fiscal half-year divided by 366 (to reflect the one-half year period).
THE OAKMARK FUNDS
5
OAKMARK AND OAKMARK SELECT FUNDS
At Oakmark, we are long-term investors. We attempt to identify growing businesses that are managed to benefit their shareholders. We will purchase stock in those businesses only when priced substantially below our estimate of intrinsic value. After purchase, as long as intrinsic value growth meets our expectations, we patiently wait for the gap between stock price and intrinsic value to close.
 "Investing is forgoing consumption now in order to have the ability to consume more at a later date."
Warren Buffett,
Berkshire Hathaway 2011
Annual Report to Shareholders
2012 is off to a great start for stock market investors. The S&P 5003 was up 13% for the quarter. In just one quarter the S&P 500 returned more than a seven-year U.S. government bond would have returned over its entire lifetime.
In our letters last year, we said that we believed stocks were priced to offer better returns than bonds. We urged investors to restore balance to their portfolios. Bonds had outperformed stocks by so much that unless investors rebalanced their allocations, bonds became a higher percentage of their portfolios. To bring portfolios back to asset allocation targets, most investors needed to sell bonds in order to purchase equities.
But throughout the year, bonds kept going up while stocks moved sideways, and investors kept selling their stocks to buy more bonds. Finally, in the past quarter, bonds declined while equities rose, reversing most of last year's divergence (though interestingly, industry data continues to show redemptions in equity mutual funds and inflows in bond and hybrid funds). Now some investors are asking if we think it is too late to invest in stocks. We don't think so.
We've previously written that corporate balance sheets are now unusually strong and that an unusually small percentage of corporate earnings are being paid out in dividends. We believe that excess liquidity and excess cash flow will lead to more dividend increases, more share repurchases and more acquisitions. Some of you have asked how soon we think that might happen. The answer is that it is already happening.
Since most of our companies are on a December fiscal year and report full-year results during the March quarter, this is a good time to look at what happened during 2011. I'll use the Oakmark Fund portfolio of 56 companies for this analysis. (For those of you who are more interested in the Oakmark Select Fund, the conclusions would be similar for that portfolio.)
For starters, 42 of our holdings, about 75%, increased their dividend last year. For those that paid a dividend in 2010, the median increase for 2011 was more than 11%. Not too shabby for what is being termed a no-growth economy. And remember that even before the dividend increases, stocks were yielding more than bonds.
In 2011, 47 of our 56 companies, 84% of our holdings, reduced their outstanding shares. One of my favorite managers, John Malone of Liberty Interactive and Discovery Communications, likes to remind investors that business value per share is a ratio: the company's total value is the numerator and the number of shares is the denominator. As Malone says, sometimes it is easier to grow that ratio by shrinking.
For our companies that reduced their outstanding shares, the median share reduction was just over 3% in 2011. Although that might not sound like much, if a business grows its earnings by 4% while shrinking its shares by 3%, EPS will grow at a 7% rate. That is a point that I believe is missed by many who argue that earnings growth will be disappointing.
Our biggest share repurchasers retired a lot more than 3% of their shares. Northrop Grumman reduced its shares by 13%, DirecTV by 14%, and our largest repurchaser, Kohl's, reduced its share base by 18%. For these companies, the share repurchase was almost as meaningful as a large acquisition. But unlike an acquisition, they didn't have to pay a control premium, didn't face integration hurdles, and won't be surprised after they get to know the businesses. They each acquired the business they already know best.
Though we are often skeptical of the economics of large acquisitions, small add-on acquisitions often boost business value. In 2011, 40 of our 56 companies, just over 70%, were net acquirers of businesses (meaning the cost of their acquisitions exceeded any proceeds from divestitures). In most of these cases, the acquirer was able to pay what looked like a high multiple of current earnings, but that multiple will soon decrease substantially due to improved economies of scale. When a management believes that it is acquiring a business at a larger discount to value than its own stock sells at, we are happy to see our capital spent on acquisitions.
OAKMARK AND OAKMARK SELECT FUNDS
6
A year ago, we wrote about corporate balance sheets having less net debt (debt minus cash) than at any time in the past 20 years. Despite such a strong starting point, last year 27 of our 56 companies ended the year with even less net debt. With interest rates so low, strengthening the balance sheet produces very little incremental earnings. Cash that earns 1% after tax would have to be valued at 100x earnings to fully reflect its value. With the stock market trading at just over 13x expected earnings, it seems that cash today is an unusually hidden asset.
Finally, most of our companies haven't been putting all of their eggs in just one basket. Twelve of our companies, just over 20% of our holdings, used their cash flow to achieve all four goals: they increased the dividend, reduced the share count, made an acquisition and still ended the year with a stronger balance sheet. Thirty-seven of them, about two-thirds, accomplished three of the four goals.
We expect these uses of cash will continue to drive value growth for our companies in 2012 and beyond. Consensus forecasts for S&P dividends in 2012 amount to only 28% of expected 2012 earnings, and that assumes a 9% increase in S&P dividends from 2011. That leaves 72% of earnings to fund incremental growth. Some of these earnings will be needed to support organic growth, but barring a strong economy, companies will still have plenty of capital for continued share repurchases and acquisitions. With acquisitions adding to the earnings numerator and repurchases reducing the denominator, EPS4 growth could be surprisingly strong even if the economy isn't.
As investors compare stocks and bonds, we believe the choice is clear. Bonds are near historically low yields, yet stocks remain priced slightly below their long-term average P/E5 multiple. Stocks currently yield more than intermediate-term bonds and are expected to continue to increase their dividends. Stocks also provide some hedge against higher inflation. When inflation increases, corporate earnings growth typically accelerates. Bonds are fully exposed since neither their principal nor their interest increases to offset inflation. When one thinks about which investment is likely to achieve Buffett's goal of allowing an investor to consume more in the future, we think equities remain the easy choice.
William C. Nygren, CFA
Portfolio Manager
oakmx@oakmark.com
oaklx@oakmark.com
March 31, 2012
OAKMARK AND OAKMARK SELECT FUNDS
7
OAKMARK FUND
Report from Bill Nygren and Kevin Grant, Portfolio Managers


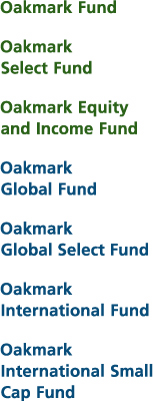
THE VALUE OF A $10,000 INVESTMENT IN OAKMARK FUND FROM ITS INCEPTION (8/5/91) TO PRESENT (3/31/12) AS COMPARED TO THE STANDARD & POOR'S 500 INDEX3 (UNAUDITED)
| | | | | Average Annual Total Returns
(as of 3/31/12) | |
| (Unaudited) | | Total Return
Last 3 Months* | | 1-year | | 5-year | | 10-year | | Since
Inception
(8/5/91) | |
| Oakmark Fund (Class I) | | | 14.44 | % | | | 10.81 | % | | | 4.26 | % | | | 5.14 | % | | | 12.52 | % | |
| S&P 500 Index | | | 12.59 | % | | | 8.54 | % | | | 2.01 | % | | | 4.12 | % | | | 8.67 | % | |
| Dow Jones Average6 | | | 8.84 | % | | | 10.18 | % | | | 4.18 | % | | | 5.02 | % | | | 10.01 | % | |
Lipper Large-Cap
Value Index7 | | | 11.75 | % | | | 3.28 | % | | | -0.22 | % | | | 3.53 | % | | | 8.06 | % | |
The graph and table do not reflect the deduction of taxes that a shareholder would pay on Fund distributions or the redemption of Fund shares.
The expense ratio for Class I shares as of 9/30/11 was 1.04%.
Past performance is no guarantee of future results. The performance data quoted represents past performance. Current performance may be lower or higher than the performance data quoted. The investment return and principal value vary so that an investor's shares when redeemed may be worth more or less than the original cost. To obtain the most recent month-end performance data, visit oakmark.com.
* Not annualized
The Oakmark Fund gained 14% in the past quarter. In addition to being an unusually good absolute return, that gain also exceeded the 13% return for the S&P 500. For the first six months of the Fund's fiscal year, the Fund gained 27%, and the S&P 500 gained 26%. Though such gains are not sustainable, for the reasons discussed in the preceding Commentary on the Oakmark and Oakmark Select Funds, we continue to believe stocks are attractively priced, especially relative to bonds.
Our best performing stock for the quarter was Bank of America, up 72%. Last year was difficult for bank stocks, especially Bank of America, but much of that reversed in the past quarter as banks now appear adequately capitalized and many are able to return more capital to shareholders. Our other strong-performing banks included JPMorgan Chase, up 39%; Capital One, up 32%; and Wells Fargo, up 25%. Despite the price increases, they all remain undervalued in our view. Apple, which increased by 48%, contributed the most to the Fund because it started the year with a higher weighting. We are pleased that Apple, like our bank stocks, will begin returning capital through both a dividend and share repurchases, and we believe the stock remains attractively priced. Largely due to the strong market, no stocks in the portfolio declined by more than 5%.
During the quarter, we eliminated three positions: Corning, Fortune Home and Security, and Western Union. Fortune Home came to the Fund as a spinoff. We kept our shares, even though the business is smaller than we would normally purchase, because we believed it was undervalued. The stock subsequently performed well and was sold. Western Union and Corning both underperformed our fundamental expectations, and because we could no longer see a clear path for these businesses to reach our long-term targets, we opted for other opportunities. We added three new positions during the quarter: Parker Hannifin, Franklin Resources and Goldman Sachs. A brief explanation of our attraction to Franklin and Goldman can be found on our website.
Parker Hannifin (PH - $85)
Parker Hannifin is the world's leading producer of motion and control technologies. Its business is diversified across industries (machinery, trucks
OAKMARK FUND
8
and aircraft) and geographies (earnings outside the U.S. account for over half of its total earnings). Priced at just over 11x expected 2012 earnings (plus goodwill amortization), Parker is valued like other highly cyclical businesses. However, the overwhelming majority of Parker's profits come from its replacement parts business. This business is more profitable and more stable than the company's original equipment business, and its branded Parker stores give it a large footprint and durable competitive advantage. Therefore, we think it should be valued at a much higher multiple than more cyclical companies. We are impressed with management's track record as excellent operators and we like the way the company spends shareholder capital. On a recent conference call, the CEO explained a $700 million share repurchase as follows: "The reason that I made the biggest acquisition in the history of the company this last month was because the company is so cheap." We wish more managements thought about share repurchases this way.
William C. Nygren, CFA
Portfolio Manager
oakmx@oakmark.com | | Kevin G. Grant, CFA
Portfolio Manager
oakmx@oakmark.com | |
|
March 31, 2012
OAKMARK FUND
9
OAKMARK FUND
Schedule of Investments—March 31, 2012 (Unaudited)
| Name | | Shares Held | | Value | |
| Common Stocks—94.7% | |
| Advertising—2.2% | |
| Omnicom Group, Inc. | | | 2,576,254 | | | $ | 130,487,265 | | |
| Aerospace & Defense—2.6% | |
| Northrop Grumman Corp. | | | 1,330,000 | | | | 81,236,400 | | |
| The Boeing Co. | | | 978,000 | | | | 72,733,860 | | |
| | | | 153,970,260 | | |
| Air Freight & Logistics—2.1% | |
| FedEx Corp. | | | 1,355,000 | | | | 124,605,800 | | |
| Asset Management & Custody Banks—4.3% | |
| State Street Corp. | | | 2,390,000 | | | | 108,745,000 | | |
| Bank of New York Mellon Corp. | | | 3,309,630 | | | | 79,861,372 | | |
| Franklin Resources, Inc. | | | 535,000 | | | | 66,356,050 | | |
| | | | 254,962,422 | | |
| Auto Parts & Equipment—0.4% | |
| Delphi Automotive PLC (a) (b) | | | 816,906 | | | | 25,814,229 | | |
| Broadcasting—2.1% | |
| Discovery Communications, Inc., Class C (a) | | | 2,660,140 | | | | 124,707,363 | | |
| Cable & Satellite—4.3% | |
| Comcast Corp., Class A | | | 5,190,000 | | | | 153,156,900 | | |
| DIRECTV, Class A (a) | | | 2,064,155 | | | | 101,845,408 | | |
| | | | 255,002,308 | | |
| Catalog Retail—2.0% | |
| Liberty Interactive Corp., Class A (a) | | | 6,205,000 | | | | 118,453,450 | | |
| Communications Equipment—1.0% | |
| Cisco Systems, Inc. | | | 2,950,000 | | | | 62,392,500 | | |
| Computer & Electronics Retail—1.1% | |
| Best Buy Co., Inc. | | | 2,890,000 | | | | 68,435,200 | | |
| Computer Hardware—4.4% | |
| Apple, Inc. (a) | | | 250,000 | | | | 149,867,500 | | |
| Dell, Inc. (a) | | | 6,680,000 | | | | 110,888,000 | | |
| | | | 260,755,500 | | |
| Consumer Finance—2.7% | |
| Capital One Financial Corp. | | | 2,879,800 | | | | 160,520,052 | | |
OAKMARK FUND
10
OAKMARK FUND
Schedule of Investments—March 31, 2012 (Unaudited) cont.
| Name | | Shares Held | | Value | |
| Common Stocks—94.7% (cont.) | |
| Data Processing & Outsourced Services—3.4% | |
| MasterCard, Inc., Class A | | | 299,000 | | | $ | 125,741,460 | | |
| Automatic Data Processing, Inc. | | | 1,375,000 | | | | 75,886,250 | | |
| | | | 201,627,710 | | |
| Department Stores—1.5% | |
| Kohl's Corp. | | | 1,741,900 | | | | 87,147,257 | | |
| Distillers & Vintners—1.6% | |
| Diageo PLC (c) | | | 1,010,000 | | | | 97,465,000 | | |
| Diversified Banks—2.3% | |
| Wells Fargo & Co. | | | 3,965,000 | | | | 135,365,100 | | |
| Electronic Manufacturing Services—2.3% | |
| TE Connectivity, Ltd. (b) | | | 3,735,644 | | | | 137,284,917 | | |
| Health Care Equipment—4.9% | |
| Medtronic, Inc. | | | 3,070,000 | | | | 120,313,300 | | |
| Covidien PLC (b) | | | 1,985,000 | | | | 108,539,800 | | |
| Baxter International, Inc. | | | 1,103,000 | | | | 65,937,340 | | |
| | | | 294,790,440 | | |
| Home Improvement Retail—2.2% | |
| The Home Depot, Inc. | | | 2,556,500 | | | | 128,617,515 | | |
| Hypermarkets & Super Centers—1.5% | |
| Wal-Mart Stores, Inc. | | | 1,415,000 | | | | 86,598,000 | | |
| Industrial Conglomerates—2.7% | |
| 3M Co. | | | 1,073,000 | | | | 95,722,330 | | |
| Tyco International, Ltd. (b) | | | 1,150,000 | | | | 64,607,000 | | |
| | | | 160,329,330 | | |
| Industrial Machinery—3.0% | |
| Illinois Tool Works, Inc. | | | 1,985,000 | | | | 113,383,200 | | |
| Parker Hannifin Corp. | | | 780,000 | | | | 65,949,000 | | |
| | | | 179,332,200 | | |
| Integrated Oil & Gas—3.6% | |
| Exxon Mobil Corp. | | | 1,345,000 | | | | 116,651,850 | | |
| Cenovus Energy, Inc. (b) | | | 2,750,000 | | | | 98,835,000 | | |
| | | | 215,486,850 | | |
| Internet Software & Services—3.2% | |
| eBay, Inc. (a) | | | 3,500,000 | | | | 129,115,000 | | |
| Google, Inc., Class A (a) | | | 100,000 | | | | 64,124,000 | | |
| | | | 193,239,000 | | |
OAKMARK FUND
11
OAKMARK FUND
Schedule of Investments—March 31, 2012 (Unaudited) cont.
| Name | | Shares Held | | Value | |
| Common Stocks—94.7% (cont.) | |
| Investment Banking & Brokerage—1.1% | |
| The Goldman Sachs Group, Inc. | | | 530,000 | | | $ | 65,916,100 | | |
| Life & Health Insurance—1.8% | |
| Aflac, Inc. | | | 2,400,000 | | | | 110,376,000 | | |
| Motorcycle Manufacturers—1.2% | |
| Harley-Davidson, Inc. | | | 1,452,000 | | | | 71,264,160 | | |
| Movies & Entertainment—5.3% | |
| Time Warner, Inc. | | | 3,392,566 | | | | 128,069,366 | | |
| Viacom, Inc., Class B | | | 2,029,745 | | | | 96,331,698 | | |
| The Walt Disney Co. | | | 2,056,300 | | | | 90,024,814 | | |
| | | | 314,425,878 | | |
| Oil & Gas Exploration & Production—1.1% | |
| Encana Corp. (b) | | | 3,289,700 | | | | 64,642,605 | | |
| Other Diversified Financial Services—4.5% | |
| JPMorgan Chase & Co. | | | 3,455,000 | | | | 158,860,900 | | |
| Bank of America Corp. | | | 11,700,000 | | | | 111,969,000 | | |
| | | | 270,829,900 | | |
| Packaged Foods & Meats—2.5% | |
| Unilever PLC (c) | | | 3,430,000 | | | | 113,361,500 | | |
| H.J. Heinz Co. | | | 650,000 | | | | 34,807,500 | | |
| | | | 148,169,000 | | |
| Pharmaceuticals—1.9% | |
| Merck & Co., Inc. | | | 2,886,535 | | | | 110,842,944 | | |
| Property & Casualty Insurance—1.6% | |
| Allstate Corp. | | | 2,990,000 | | | | 98,430,800 | | |
| Restaurants—1.1% | |
| McDonald's Corp. | | | 699,000 | | | | 68,571,900 | | |
| Semiconductor Equipment—1.4% | |
| Applied Materials, Inc. | | | 6,810,000 | | | | 84,716,400 | | |
| Semiconductors—4.3% | |
| Intel Corp. | | | 5,045,000 | | | | 141,814,950 | | |
| Texas Instruments, Inc. | | | 3,495,000 | | | | 117,466,950 | | |
| | | | 259,281,900 | | |
| Specialized Consumer Services—1.4% | |
| H&R Block, Inc. | | | 5,228,600 | | | | 86,115,042 | | |
OAKMARK FUND
12
OAKMARK FUND
Schedule of Investments—March 31, 2012 (Unaudited) cont.
| Name | | Shares Held/
Par Value | | Value | |
| Common Stocks—94.7% (cont.) | |
| Systems Software—4.1% | |
| Microsoft Corp. | | | 3,870,000 | | | $ | 124,807,500 | | |
| Oracle Corp. | | | 4,050,000 | | | | 118,098,000 | | |
| | | | 242,905,500 | | |
| Total Common Stocks (Cost: $3,843,292,086) | | | | $ | 5,653,877,797 | | |
| Short Term Investment—5.3% | |
| Repurchase Agreement—5.3% | |
Fixed Income Clearing Corp. Repurchase
Agreement, 0.01% dated 3/30/2012 due 4/2/2012,
repurchase price $317,583,491, collateralized by
Federal Home Loan Bank Bonds, with rates of 0.500%,
with maturities from 2/28/2014 - 3/12/2014, and with
an aggregate fair value plus accrued interest of
$195,380,000, and by a United States Treasury Note,
with a rate of 1.875%, with a maturity of 2/28/2014
and with a fair value plus accrued interest
of $128,555,921 (Cost: $317,583,226) | | $ | 317,583,226 | | | $ | 317,583,226 | | |
| Total Short Term Investment (Cost: $317,583,226) | | | | $ | 317,583,226 | | |
| Total Investments (Cost: $4,160,875,312)—100.0% | | | | | 5,971,461,023 | | |
| Other Assets In Excess of Liabilities—0.0% (d) | | | | | 2,419,873 | | |
| Total Net Assets—100% | | | | $ | 5,973,880,896 | | |
(a) Non-income producing security
(b) Foreign domiciled corporation
(c) Sponsored American Depositary Receipt
(d) Amount rounds to less than 0.1%.
See accompanying Notes to Financial Statements.
OAKMARK FUND
13
OAKMARK SELECT FUND
Report from Bill Nygren and Henry Berghoef, Portfolio Managers


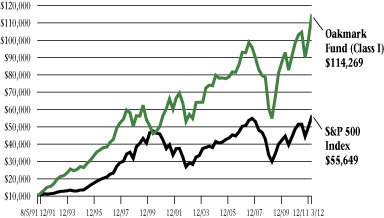
THE VALUE OF A $10,000 INVESTMENT IN OAKMARK SELECT FUND FROM ITS INCEPTION (11/1/96) TO PRESENT (3/31/12) AS COMPARED TO THE STANDARD & POOR'S 500 INDEX3 (UNAUDITED)
| | | | | Average Annual Total Returns
(as of 3/31/12) | |
| (Unaudited) | | Total Return
Last 3 Months* | | 1-year | | 5-year | | 10-year | | Since
Inception
(11/1/96) | |
Oakmark Select Fund
(Class I) | | | 15.58 | % | | | 10.84 | % | | | 2.69 | % | | | 4.87 | % | | | 12.52 | % | |
| S&P 500 Index | | | 12.59 | % | | | 8.54 | % | | | 2.01 | % | | | 4.12 | % | | | 6.49 | % | |
Lipper Multi-Cap
Value Index8 | | | 13.19 | % | | | 1.47 | % | | | -0.75 | % | | | 4.03 | % | | | 6.31 | % | |
The graph and table do not reflect the deduction of taxes that a shareholder would pay on Fund distributions or the redemption of Fund shares.
The expense ratio for Class I shares as of 9/30/11 was 1.07%.
Past performance is no guarantee of future results. The performance data quoted represents past performance. Current performance may be lower or higher than the performance data quoted. The investment return and principal value vary so that an investor's shares when redeemed may be worth more or less than the original cost. To obtain the most recent month-end performance data, visit oakmark.com.
* Not annualized
The Oakmark Select Fund gained 16% for the past quarter, compared to a 13% gain for the S&P 500. During the first half of our fiscal year, the Fund increased 27%, compared to 26% for the S&P 500. Stocks have enjoyed an amazing six months, producing impressive, but unsustainable, returns. However, for the reasons discussed in the preceding Commentary on the Oakmark and Oakmark Select Funds, we continue to believe that equities remain attractively priced.
Our largest holding, Discovery Communications, gained 24% during the quarter. Though we had other holdings that had larger gains, because of Discovery's weighting in the portfolio, it contributed the most to our performance. We have written before about Discovery making most of its money from just a couple of its cable networks. Like almost everyone else, we were excited about the prospects for its new Oprah Winfrey Network (OWN). But a funny thing happened: While OWN struggled, little-known "ID: Investigation Discovery" became a big ratings success and, by some measures, it is now a Top 20 cable network. So if your Saturday night TV hasn't included "Who the (Bleep) Did I Marry?" or "Scorned: Love Kills," you should tune in. But be forewarned: it's addictive.
It was also a very good quarter for our financial sector holdings. JPMorgan Chase gained 39% and Capital One gained 32%. Both companies performed extremely well on their stress tests. JPMorgan announced an acceleration of its share repurchases, and Capital One increased its earnings power via acquisitions. Our single largest gainer was last quarter's newcomer, TRW Holdings, up 42%. We believed the market overreacted to cyclical concerns surrounding TRW, as the company's share price fell by more than 50% from July to December. The stock's recent improvement offsets some of that overreaction. We believe that TRW, as well as our other strong performers, remains undervalued.
The only decliner during the quarter was Newfield Exploration, down 8%. When we bought Newfield, it was primarily a natural gas company. Recently, however, much of its drilling activity has been oriented toward oil and natural gas liquids, whose values correlate more with oil prices. With oil prices staying high and natural gas prices collapsing, Newfield has further slowed its natural gas drilling to accelerate its development of liquids. The resulting slowing of near-term production growth has frustrated many investors. We believe Newfield management is taking the proper
OAKMARK SELECT FUND
14
steps to maximize its long-term value and believe the stock merits retention in the portfolio.
During the quarter we neither initiated nor eliminated any positions.
We are pleased to report that in the past quarter, for the first time in several years, the Fund's NAV exceeded its previous high water mark. We are aware that the past few years have been quite the roller coaster ride. That's why we are especially pleased that so many investors remained with us throughout that period. We are always excited to see our shareholders rewarded for their patience.
William C. Nygren, CFA
Portfolio Manager
oaklx@oakmark.com | | Henry R. Berghoef, CFA
Portfolio Manager
oaklx@oakmark.com | |
|
March 31, 2012
OAKMARK SELECT FUND
15
OAKMARK SELECT FUND
Schedule of Investments—March 31, 2012 (Unaudited)
| Name | | Shares Held | | Value | |
| Common Stocks—94.6% | |
| Air Freight & Logistics—4.0% | |
| FedEx Corp. | | | 1,350,000 | | | $ | 124,146,000 | | |
| Auto Parts & Equipment—4.8% | |
| TRW Automotive Holdings Corp. (a) | | | 3,200,000 | | | | 148,640,000 | | |
| Broadcasting—8.4% | |
| Discovery Communications, Inc., Class C (a) | | | 5,609,500 | | | | 262,973,360 | | |
| Cable & Satellite—9.3% | |
| Comcast Corp., Class A | | | 5,350,000 | | | | 157,878,500 | | |
| DIRECTV, Class A (a) | | | 2,647,949 | | | | 130,649,804 | | |
| | | | 288,528,304 | | |
| Catalog Retail—5.9% | |
| Liberty Interactive Corp., Class A (a) | | | 9,700,000 | | | | 185,173,000 | | |
| Computer Hardware—4.4% | |
| Dell, Inc. (a) | | | 8,213,000 | | | | 136,335,800 | | |
| Consumer Finance—5.0% | |
| Capital One Financial Corp. | | | 2,800,000 | | | | 156,072,000 | | |
| Data Processing & Outsourced Services—4.6% | |
| MasterCard, Inc., Class A | | | 340,000 | | | | 142,983,600 | | |
| Electronic Manufacturing Services—5.9% | |
| TE Connectivity, Ltd. (b) | | | 5,043,938 | | | | 185,364,721 | | |
| Health Care Equipment—4.3% | |
| Medtronic, Inc. | | | 3,400,000 | | | | 133,246,000 | | |
| Independent Power Producers & Energy Traders—3.5% | |
| Calpine Corp. (a) | | | 6,254,404 | | | | 107,638,293 | | |
| Integrated Oil & Gas—4.2% | |
| Cenovus Energy, Inc. (b) | | | 3,634,800 | | | | 130,634,712 | | |
| Internet Software & Services—4.3% | |
| eBay, Inc. (a) | | | 3,600,000 | | | | 132,804,000 | | |
| Movies & Entertainment—4.3% | |
| Time Warner, Inc. | | | 3,560,666 | | | | 134,415,142 | | |
OAKMARK SELECT FUND
16
OAKMARK SELECT FUND
Schedule of Investments—March 31, 2012 (Unaudited) cont.
| Name | | Shares Held/
Par Value | | Value | |
| Common Stocks—94.6% (cont.) | |
| Oil & Gas Exploration & Production—3.7% | |
| Newfield Exploration Co. (a) | | | 3,319,534 | | | $ | 115,121,439 | | |
| Other Diversified Financial Services—5.0% | |
| JPMorgan Chase & Co. | | | 3,384,000 | | | | 155,596,320 | | |
| Semiconductors—9.3% | |
| Intel Corp. | | | 5,497,000 | | | | 154,520,670 | | |
| Texas Instruments, Inc. | | | 4,050,000 | | | | 136,120,500 | | |
| | | | 290,641,170 | | |
| Specialized Consumer Services—3.7% | |
| H&R Block, Inc. | | | 7,069,600 | | | | 116,436,312 | | |
| Total Common Stocks (Cost: $1,853,563,342) | | | | $ | 2,946,750,173 | | |
| Short Term Investment—6.1% | |
| Repurchase Agreement—6.1% | |
Fixed Income Clearing Corp. Repurchase
Agreement, 0.01% dated 3/30/2012 due 4/2/2012,
repurchase price $188,483,640, collateralized by
a Federal Home Loan Bank Bond, with
a rate of 0.500%, with a maturity of 3/12/2014,
and with a fair value plus accrued interest
of $4,620,000, and by a United States Treasury Note,
with a rate of 1.250%, with a maturity of 3/15/2014,
and with a fair value plus accrued interest
of $187,635,753 (Cost: $188,483,482) | | $ | 188,483,482 | | | $ | 188,483,482 | | |
| Total Short Term Investment (Cost: $188,483,482) | | | | $ | 188,483,482 | | |
| Total Investments (Cost: $2,042,046,824)—100.7% | | | | | 3,135,233,655 | | |
| Liabilities In Excess of Other Assets—(0.7)% | | | | | (20,490,620 | ) | |
| Total Net Assets—100% | | | | $ | 3,114,743,035 | | |
(a) Non-income producing security
(b) Foreign domiciled corporation
See accompanying Notes to Financial Statements.
OAKMARK SELECT FUND
17
OAKMARK EQUITY AND INCOME FUND
Report from Clyde S. McGregor, Portfolio Manager

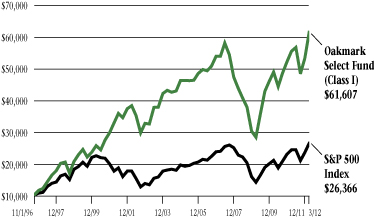
THE VALUE OF A $10,000 INVESTMENT IN OAKMARK EQUITY AND INCOME FUND FROM ITS INCEPTION (11/1/95) TO PRESENT (3/31/12) AS COMPARED TO THE LIPPER BALANCED FUND INDEX9 (UNAUDITED)
| | | | | Average Annual Total Returns
(as of 3/31/12) | |
| (Unaudited) | | Total Return
Last 3 Months* | | 1-year | | 5-year | | 10-year | | Since
Inception
(11/1/95) | |
Oakmark Equity &
Income Fund (Class I) | | | 7.91 | % | | | 3.74 | % | | | 5.32 | % | | | 7.47 | % | | | 10.94 | % | |
Lipper Balanced
Fund Index | | | 7.88 | % | | | 4.60 | % | | | 3.04 | % | | | 4.86 | % | | | 6.62 | % | |
| S&P 500 Index3 | | | 12.59 | % | | | 8.54 | % | | | 2.01 | % | | | 4.12 | % | | | 7.45 | % | |
Barclays Capital U.S. Govt./
Credit Bond Index10 | | | 0.08 | % | | | 8.53 | % | | | 6.26 | % | | | 5.91 | % | | | 6.17 | % | |
The graph and table do not reflect the deduction of taxes that a shareholder would pay on Fund distributions or the redemption of Fund shares.
The expense ratio for Class I shares as of 9/30/11 was 0.77%.
Past performance is no guarantee of future results. The performance data quoted represents past performance. Current performance may be lower or higher than the performance data quoted. The investment return and principal value vary so that an investor's shares when redeemed may be worth more or less than the original cost. To obtain the most recent month-end performance data, visit oakmark.com.
* Not annualized
Quarter Review
Continuing the December quarter's rally, stock prices moved substantially higher in the first calendar quarter while fixed-income investments generated modest returns. The result for the Equity and Income Fund in the quarter was an 8% gain, which matches the 8% for the Lipper Balanced Fund Index, the Fund's performance benchmark. For the first six months of the Fund's fiscal year, the Fund returned 18%, while the Lipper Index returned 15%. The annualized compound rate of return since the Fund's inception in 1995 is 11%, while the corresponding return to the Lipper Index is 7%.
UnitedHealth Group, TJX, Cenovus Energy, Texas Instruments and Diageo led the list of contributors to the Fund's quarterly return. The largest detractors were Patterson-UTI Energy, Ultra Petroleum, Range Resources, PharMerica and Walter Energy. All of the detractors are energy or natural resource companies with the exception of PharMerica, which declined after Fund holding Omnicare withdrew its offer to purchase the company. Detractors from return for the fiscal six months were Ultra Petroleum, Patterson-UTI Energy, Boston Scientific, PharMerica and Hospira. The largest contributors were Philip Morris International, Flowserve, General Dynamics, Diageo and UnitedHealth.
Aside from Omnicare ending its effort to purchase PharMerica, the Fund's only merger/acquisition activity in the quarter involved long-term holding Pentair, the stock which enjoyed the Fund's largest percentage price increase in the period. This well-managed smaller industrial concern announced a deal in late March to merge with the fluid-handling operations of Tyco International. In 2011, Tyco, which is held in the Oakmark Fund, announced a plan to divide into three parts, and Pentair's management spied an opportunity to increase its scale in its most important business line. The transaction itself is complicated, but the resulting merger of equals will use the Pentair name and have its legal domicile in Switzerland.
During the quarter, shareholders expressed concern to me about the increased volatility in the Fund's daily share price. I discussed volatility at length in our September 30 shareholder letter, but I will review that discussion here. The mathematics of security pricing demands that volatility be a function of interest rates. As interest rates decline, the prices of securities become more sensitive to market-moving news. Interest rates are extraordinarily low today, so higher volatility can be expected. I have worked to reduce potential
OAKMARK EQUITY AND INCOME FUND
18
volatility by keeping the average maturity structure of the Fund's fixed-income allocation very short. But increasing the equity allocation has increased the potential for price volatility, as equities are very long duration assets. Although no one desires more short-term volatility in the Fund's price, I believe that increased short-term volatility is necessary so that the Fund may meet its shareholders' needs over the long term.
Transaction Activity
Based on the number of names purchased or sold as described below, it may appear that there were drastic changes to the portfolio in the quarter. The changes expressed in dollars, however, are far more modest. This outcome is not precisely what I had in mind, as the prices of several new equity purchases exceeded our buy price limits before we came close to our targeted share amount. One unusual characteristic of the recent stock market rally has been its tepid trading level. Establishing sizable new equity positions in a low-volume bull market has proven to be difficult. One outcome is that the Fund's equity holdings count has grown to 53. I do not target a specific holdings number. As I have often written, I do not mind small positions in the portfolio as long as they have the appropriate valuation attributes. In the March quarter, the smallest equity holding had the fourth-greatest percentage increase in share price. Yes, it might have been better if our original buy price limit had been higher so that we might have accumulated more shares in the Fund, but by owning any shares at all, the Fund benefited. The sum of this purchase/sale activity and positive market action was to increase the equity allocation to nearly 70% from 66%.
On the fixed-income side, the allocation to corporate bonds more than doubled, growing their allocation only to 1% of the portfolio. Many new shareholders often ask why the Fund does not have a significant weighting in corporates, so I beg long-time owners' indulgence to discuss this once again. As you probably expect, the reason derives from our value-investing philosophy. For most of the past 25 years, Harris Associates has found that investment-grade corporate debt offers insufficient incremental yield over Treasurys to compensate for the additional risk that such debt entails. These risks include, but are not limited to, economic/business risks, inadequate liquidity, and the possibility that the company will engage in a corporate transaction that will result in a downgrade (e.g., a leveraged buyout or a substantial acquisition). In our opinion, when it comes to corporate debt, the deck is stacked in the issuer's favor. As evidence, the rating services' ratio of upgrades to downgrades for investment-grade debt is skewed toward downgrades. Today the hunger for yield compounds the problem. Mutual funds specializing in corporate debt continue to grow in size, and their demand to accumulate holdings is generally not governed by value considerations. The Harris Associates fixed-income team and I are working hard to build up the allocation to corporates in the Fund, but current market conditions, combined with our value discipline, slow this process. The net of our fixed-income activity in the quarter was to keep the overall portfolio fixed-income allocation and duration virtually unchanged.
We initiated eight new equity holdings in the quarter. Beginning in alphabetical order, eBay is well-known for its auction websites, but the company's crown jewel may be Paypal, which it purchased in 2002. As value investors, we always prefer investment opportunities that are propelled by natural economic momentum, and that is certainly the case with eBay. E-commerce appears likely to grow at above-average rates, and eBay should participate in this growth. The Paypal division also benefits from growth in e-commerce, and new payment technologies at physical retailers, especially those involving smart phones, may give Paypal another boost. We had the opportunity to purchase shares at a good price when the company announced a management change. As with most of our March quarter opportunities, however, the best price opportunity did not last for long.
As the portfolio's equity allocation has increased, I have paid attention to income generation by seeking issues that we believe have attractive and growing dividends. Illinois Tool Works (ITW), Northrop Grumman, Republic Services and Staples were four such names added in the March quarter. Investors have long lauded ITW for its management, which relentlessly employs the 80/20 rule to focus on businesses that are adding the most value to the entire enterprise. While ITW is somewhat cyclical and has exposure to housing and weaker European economies, we believe that its broad diversification and dominant market shares in niche product lines will enable the company to continue to grow per-share value while returning cash to shareholders. Northrop Grumman attracted us with its shipyard business spinoff. Operational performance at the remainder of the company has been strong, and the balance sheet is cash-rich. We expect the company to undertake significant share repurchases. Republic Services is the second-largest company in the waste collection and disposal industry. The company benefits from its industry's high barriers to entry. We anticipate that improved U.S. industrial activity will increase Republic's profits. Staples is best known for its retail stores, but the company is also the second-largest Internet reseller. We believe that the stock's valuation is more appropriate for a troubled office-supply retailer than a well-managed company that is evolving with the economy while returning cash to shareholders.
OAKMARK EQUITY AND INCOME FUND
19
Other purchases in the quarter were Lear, Parker Hannifin and TD Ameritrade. We last owned Lear in the Equity and Income Fund in 2000. Since then, the company has gone through reorganization and has re-emerged with a strong balance sheet and new senior management. Having suffered terrible times in the Great Recession, the auto parts industry, in our opinion, is now well-positioned to benefit from increasing automobile demand in emerging markets, as well as a cyclical rebound in demand in the U.S., and we expect Lear will participate in this rebound. Parker Hannifin is a diversified manufacturer of motion and control technologies primarily used in machinery and vehicles. The company has persistently improved its key financial characteristics, and management recently instituted an aggressive share repurchase program. TD Ameritrade has consistently gained share in the online brokerage market. Today's exceptionally low interest rates have depressed TD Ameritrade's earnings, providing us with what we deem a good investment opportunity. If short-term rates rebound to average levels, we expect the company's earnings will grow significantly.
As you might expect in a strong quarter for stocks, several issues attained their sell targets, and the Fund sold L-3 Communications, Martin Marietta Materials, Sara Lee and Tractor Supply. Tractor Supply has been a superb example of a strongly positioned company with a management team dedicated to per-share value growth. I hate to say goodbye to such a company—perhaps some day another value opportunity may arise in this name.
Clyde S. McGregor, CFA
Portfolio Manager
oakbx@oakmark.com | |
|
March 31, 2012
OAKMARK EQUITY AND INCOME FUND
20
OAKMARK EQUITY AND INCOME FUND
Schedule of Investments—March 31, 2012 (Unaudited)
| Name | | Shares Held | | Value | |
| Common Stocks—70.0% | |
| Aerospace & Defense—4.0% | |
| General Dynamics Corp. | | | 8,335,000 | | | $ | 611,622,300 | | |
| Northrop Grumman Corp. | | | 1,989,823 | | | | 121,538,389 | | |
| Teledyne Technologies, Inc. (a) | | | 1,097,314 | | | | 69,185,648 | | |
| | | | 802,346,337 | | |
| Apparel Retail—2.4% | |
| The TJX Cos., Inc. | | | 9,902,800 | | | | 393,240,188 | | |
| Foot Locker, Inc. | | | 3,000,000 | | | | 93,150,000 | | |
| | | | 486,390,188 | | |
| Apparel, Accessories & Luxury Goods—0.6% | |
| Carter's, Inc. (a) | | | 2,324,000 | | | | 115,665,480 | | |
| Auto Parts & Equipment—1.0% | |
| Lear Corp. | | | 4,437,454 | | | | 206,297,236 | | |
| Broadcasting—1.6% | |
| Scripps Networks Interactive, Inc., Class A | | | 6,500,000 | | | | 316,485,000 | | |
| Catalog Retail—0.2% | |
| HSN, Inc. | | | 1,036,796 | | | | 39,429,352 | | |
| Communications Equipment—0.3% | |
| Arris Group, Inc. (a) | | | 4,785,400 | | | | 54,075,020 | | |
| Consumer Finance—0.6% | |
| Staples, Inc. | | | 7,471,000 | | | | 120,880,780 | | |
| Data Processing & Outsourced Services—2.8% | |
| MasterCard, Inc., Class A | | | 959,358 | | | | 403,448,413 | | |
| Broadridge Financial Solutions, Inc. (b) | | | 6,900,000 | | | | 164,979,000 | | |
| | | | 568,427,413 | | |
| Distillers & Vintners—3.2% | |
| Diageo PLC (c) | | | 6,774,100 | | | | 653,700,650 | | |
| Diversified Metals & Mining—1.2% | |
| Walter Energy, Inc. (b) | | | 3,999,850 | | | | 236,831,119 | | |
| Drug Retail—1.3% | |
| CVS Caremark Corp. | | | 6,000,000 | | | | 268,800,000 | | |
| Electrical Components & Equipment—1.9% | |
| Rockwell Automation Inc. | | | 4,801,200 | | | | 382,655,640 | | |
OAKMARK EQUITY AND INCOME FUND
21
OAKMARK EQUITY AND INCOME FUND
Schedule of Investments—March 31, 2012 (Unaudited) cont.
| Name | | Shares Held | | Value | |
| Common Stocks—70.0% (cont.) | |
| Electronic Manufacturing Services—1.2% | |
| TE Connectivity, Ltd. (d) | | | 6,397,500 | | | $ | 235,108,125 | | |
| Environmental & Facilities Services—1.3% | |
| Republic Services, Inc. | | | 8,448,500 | | | | 258,186,160 | | |
| Health Care Distributors—0.1% | |
| PharMerica Corp. (a) (b) | | | 1,810,000 | | | | 22,498,300 | | |
| Health Care Equipment—4.9% | |
| Varian Medical Systems, Inc. (a) (b) | | | 5,700,000 | | | | 393,072,000 | | |
| CR Bard, Inc. | | | 2,777,241 | | | | 274,169,232 | | |
| Boston Scientific Corp. (a) | | | 41,132,000 | | | | 245,969,360 | | |
| Steris Corp. | | | 2,200,300 | | | | 69,573,486 | | |
| | | | 982,784,078 | | |
| Health Care Facilities—0.3% | |
| VCA Antech, Inc. (a) | | | 2,708,466 | | | | 62,863,496 | | |
| Health Care Services—5.1% | |
| Laboratory Corp. of America Holdings (a) | | | 4,935,000 | | | | 451,749,900 | | |
| Quest Diagnostics, Inc. | | | 6,595,000 | | | | 403,284,250 | | |
| Omnicare, Inc. | | | 5,154,500 | | | | 183,345,565 | | |
| | | | 1,038,379,715 | | |
| Home Furnishings—1.4% | |
| Mohawk Industries, Inc. (a) | | | 2,407,000 | | | | 160,089,570 | | |
| Leggett & Platt, Inc. | | | 5,061,738 | | | | 116,470,591 | | |
| | | | 276,560,161 | | |
| Industrial Machinery—6.4% | |
| Flowserve Corp. (b) | | | 3,639,184 | | | | 420,362,144 | | |
| Dover Corp. | | | 6,393,000 | | | | 402,375,420 | | |
| Pentair, Inc. | | | 4,200,000 | | | | 199,962,000 | | |
| Parker Hannifin Corp. | | | 1,664,585 | | | | 140,740,662 | | |
| Illinois Tool Works, Inc. | | | 1,638,600 | | | | 93,596,832 | | |
| Xylem, Inc. | | | 966,562 | | | | 26,822,095 | | |
| | | | 1,283,859,153 | | |
| Integrated Oil & Gas—3.3% | |
| Cenovus Energy, Inc. (d) | | | 18,316,600 | | | | 658,298,604 | | |
| Internet Software & Services—0.7% | |
| eBay, Inc. (a) | | | 3,730,513 | | | | 137,618,625 | | |
| Investment Banking & Brokerage—0.3% | |
| TD Ameritrade Holding Corp. | | | 2,897,500 | | | | 57,196,650 | | |
OAKMARK EQUITY AND INCOME FUND
22
OAKMARK EQUITY AND INCOME FUND
Schedule of Investments—March 31, 2012 (Unaudited) cont.
| Name | | Shares Held/
Par Value | | Value | |
| Common Stocks—70.0% (cont.) | |
| Managed Health Care—3.3% | |
| UnitedHealth Group, Inc. | | | 11,371,000 | | | $ | 670,206,740 | | |
| Office Services & Supplies—0.1% | |
| Mine Safety Appliances Co. | | | 319,925 | | | | 13,142,519 | | |
| Oil & Gas Drilling—0.6% | |
| Patterson-UTI Energy, Inc. | | | 7,489,201 | | | | 129,488,285 | | |
| Oil & Gas Exploration & Production—7.5% | |
| Apache Corp. | | | 5,028,960 | | | | 505,108,742 | | |
| Encana Corp. (d) | | | 16,572,600 | | | | 325,651,590 | | |
| Cimarex Energy Co. | | | 4,165,500 | | | | 314,370,285 | | |
| Concho Resources, Inc. (a) | | | 1,811,700 | | | | 184,938,336 | | |
| Range Resources Corp. | | | 2,480,000 | | | | 144,187,200 | | |
| Ultra Petroleum Corp. (a) | | | 2,099,000 | | | | 47,500,370 | | |
| | | | 1,521,756,523 | | |
| Packaged Foods & Meats—3.4% | |
| Nestle SA (c) (e) | | | 11,052,000 | | | | 695,413,944 | | |
| Pharmaceuticals—1.6% | |
| Hospira, Inc. (a) (b) | | | 8,640,500 | | | | 323,068,295 | | |
| Semiconductors—2.6% | |
| Texas Instruments, Inc. | | | 15,899,500 | | | | 534,382,195 | | |
| Soft Drinks—2.0% | |
| PepsiCo., Inc. | | | 6,207,000 | | | | 411,834,450 | | |
| Tobacco—2.8% | |
| Philip Morris International, Inc. | | | 6,506,000 | | | | 576,496,660 | | |
| Total Common Stocks (Cost: $10,446,276,994) | | | | $ | 14,141,126,893 | | |
| Fixed Income—21.5% | |
| Asset Backed Securities—0.1% | |
| Specialty Stores—0.1% | |
Cabela's Master Credit Card Trust, 144A, 0.792%,
due 10/15/2019, Series 2011-4A, Class A2 (f) (g) | | $ | 11,450,000 | | | $ | 11,450,000 | | |
OAKMARK EQUITY AND INCOME FUND
23
OAKMARK EQUITY AND INCOME FUND
Schedule of Investments—March 31, 2012 (Unaudited) cont.
| Name | | Par Value | | Value | |
| Fixed Income—21.5% (cont.) | |
| Corporate Bonds—0.9% | |
| Casinos & Gaming—0.0% (h) | |
| Penn National Gaming, Inc., 8.75%, due 8/15/2019 | | $ | 2,600,000 | | | $ | 2,918,500 | | |
| Catalog Retail—0.0% (h) | |
| HSN, Inc., 11.25%, due 8/1/2016 | | | 880,000 | | | | 954,809 | | |
| Health Care Equipment—0.3% | |
| Kinetic Concepts, Inc., 144A, 10.50%, due 11/1/2018 (g) | | | 48,080,000 | | | | 49,943,100 | | |
| Kinetic Concepts, Inc., 144A, 12.50%, due 11/1/2019 (g) | | | 12,480,000 | | | | 11,731,200 | | |
| | | | 61,674,300 | | |
| Movies & Entertainment—0.0% (h) | |
| Ticketmaster Entertainment LLC, 10.75%, due 8/1/2016 | | | 2,880,000 | | | | 3,099,600 | | |
| Oil & Gas Exploration & Production—0.1% | |
| Denbury Resources, Inc., 9.75%, due 3/1/2016 | | | 18,101,000 | | | | 19,865,848 | | |
| Concho Resources, Inc., 5.50%, due 10/1/2022 | | | 3,850,000 | | | | 3,792,250 | | |
| Encore Acquisition Co., 9.50%, due 5/1/2016 | | | 2,550,000 | | | | 2,805,000 | | |
| | | | 26,463,098 | | |
| Other Diversified Financial Services—0.3% | |
| SSIF Nevada, LP, 144A, 1.267%, due 4/14/2014 (f) (g) | | | 55,100,000 | | | | 54,679,807 | | |
| Packaged Foods & Meats—0.0% (h) | |
| Post Holdings, Inc., 144A, 7.375%, due 2/15/2022 (g) | | | 1,000,000 | | | | 1,047,500 | | |
| Paper Packaging—0.1% | |
| Sealed Air Corp., 144A, 5.625%, due 7/15/2013 (g) | | | 18,740,000 | | | | 19,338,649 | | |
| Property & Casualty Insurance—0.0% (h) | |
| OneBeacon US Holdings, Inc., 5.875%, due 5/15/2013 | | | 3,589,000 | | | | 3,693,569 | | |
| Semiconductor Equipment—0.1% | |
| ASML Holding NV, 5.75%, due 6/13/2017 | | EUR | 9,660,000 | | | | 14,382,925 | | |
| Total Corporate Bonds (Cost: $180,327,744) | | | | $ | 188,252,757 | | |
| Government and Agency Securities—20.5% | |
| Canadian Government Bonds—0.8% | |
| Canadian Government Bond, 1.50%, due 12/1/2012 | | CAD | 100,000,000 | | | $ | 100,551,406 | | |
Canadian Government Bond, 4.25%, due 12/1/2021,
Inflation Indexed | | CAD | 36,316,750 | | | | 51,450,762 | | |
| | | | 152,002,168 | | |
OAKMARK EQUITY AND INCOME FUND
24
OAKMARK EQUITY AND INCOME FUND
Schedule of Investments—March 31, 2012 (Unaudited) cont.
| Name | | Par Value | | Value | |
| Fixed Income—21.5% (cont.) | |
| Norwegian Government Bonds—0.1% | |
| Norwegian Government Bond, 6.50%, due 5/15/2013 | | NOK | 150,000,000 | | | $ | 27,748,189 | | |
| U.S. Government Agencies—0.2% | |
Federal National Mortgage Association,
3.97%, due 11/27/2019 | | $ | 32,000,000 | | | | 32,646,080 | | |
| U.S. Government Notes—19.4% | |
United States Treasury Note, 1.375%, due 7/15/2018,
Inflation Indexed | | | 525,490,000 | | | | 601,727,038 | | |
United States Treasury Note, 1.25%, due 7/15/2020,
Inflation Indexed | | | 519,595,000 | | | | 593,353,069 | | |
| United States Treasury Note, 2.875%, due 1/31/2013 | | | 483,005,000 | | | | 493,664,920 | | |
| United States Treasury Note, 0.125%, due 9/30/2013 | | | 300,000,000 | | | | 299,238,300 | | |
United States Treasury Note, 2.125%, due 1/15/2019,
Inflation Indexed | | | 211,116,000 | | | | 252,646,529 | | |
| United States Treasury Note, 0.625%, due 2/28/2013 | | | 200,000,000 | | | | 200,734,400 | | |
| United States Treasury Note, 1.00%, due 9/30/2016 | | | 200,000,000 | | | | 200,671,800 | | |
| United States Treasury Note, 0.125%, due 8/31/2013 | | | 200,000,000 | | | | 199,546,800 | | |
| United States Treasury Note, 1.125%, due 6/15/2013 | | | 175,000,000 | | | | 176,811,600 | | |
| United States Treasury Note, 1.00%, due 1/15/2014 | | | 100,000,000 | | | | 101,191,400 | | |
| United States Treasury Note, 1.375%, due 11/15/2012 | | | 100,000,000 | | | | 100,738,300 | | |
| United States Treasury Note, 1.125%, due 12/15/2012 | | | 100,000,000 | | | | 100,652,300 | | |
| United States Treasury Note, 1.375%, due 10/15/2012 | | | 100,000,000 | | | | 100,648,400 | | |
| United States Treasury Note, 1.375%, due 9/15/2012 | | | 100,000,000 | | | | 100,546,900 | | |
| United States Treasury Note, 1.50%, due 7/15/2012 | | | 100,000,000 | | | | 100,394,500 | | |
| United States Treasury Note, 1.375%, due 5/15/2012 | | | 100,000,000 | | | | 100,148,400 | | |
| United States Treasury Note, 0.625%, due 6/30/2012 | | | 100,000,000 | | | | 100,125,000 | | |
| United States Treasury Note, 0.375%, due 8/31/2012 | | | 100,000,000 | | | | 100,089,800 | | |
| | | | 3,922,929,456 | | |
Total Government and Agency Securities
(Cost: $3,940,697,067) | | | | $ | 4,135,325,893 | | |
| Total Fixed Income (Cost: $4,132,474,811) | | | | $ | 4,335,028,650 | | |
| Short Term Investments—9.0% | |
| Canadian Treasury Bills—4.4% | |
Canadian Treasury Bills, 0.80% - 1.39%,
due 4/12/2012 - 11/22/2012 (i)
(Cost: $905,980,623) | | CAD | 900,000,000 | | | $ | 899,302,221 | | |
OAKMARK EQUITY AND INCOME FUND
25
OAKMARK EQUITY AND INCOME FUND
Schedule of Investments—March 31, 2012 (Unaudited) cont.
| Name | | Par Value | | Value | |
| Short Term Investments—9.0% (cont.) | |
| Commercial Paper—1.8% | |
Wellpoint, Inc., 144A, 0.15% - 0.41%,
due 4/2/2012 - 6/1/2012 (g) (i) | | $ | 135,000,000 | | | $ | 134,982,309 | | |
Wal-Mart Stores, Inc., 144A, 0.07% - 0.12%,
due 4/19/2012 - 5/7/2012 (g) (i) | | | 85,000,000 | | | | 84,992,993 | | |
Toyota Motor Credit Corp., 0.14%,
due 4/17/2012 - 4/24/2012 (i) | | | 50,000,000 | | | | 49,995,237 | | |
| Pepsico, Inc., 144A, 0.07%, due 4/18/2012 - 5/1/2012 (g) (i) | | | 40,500,000 | | | | 40,498,194 | | |
| McDonald's Corp., 144A, 0.12%, due 4/16/2012 (g) (i) | | | 25,000,000 | | | | 24,998,465 | | |
| Medtronic, Inc., 144A, 0.10%, due 4/26/2012 (g) (i) | | | 13,865,000 | | | | 13,863,648 | | |
| BP Capital Markets PLC, 144A, 0.47%, due 6/5/2012 (g) (i) | | | 13,600,000 | | | | 13,597,166 | | |
| Total Commercial Paper (Cost: $362,918,796) | | | 362,928,012 | | |
| Repurchase Agreement—2.8% | |
Fixed Income Clearing Corp. Repurchase Agreement,
0.01% dated 3/30/2012 due 4/2/2012, repurchase price
$565,902,760, collateralized by Federal Home Loan Bank
Bonds, with rates from 0.210% - 0.360%, with maturities
from 4/17/2013 - 8/20/2013, and with an aggregate fair
value plus accrued interest of $281,690,869, and by United
States Treasury Notes, with rates from 0.750% - 1.375%,
with maturities from 5/15/2013 - 8/15/2013, and with an
aggregate fair value plus accrued interest of $295,533,530
(Cost: $565,902,288) | | $ | 565,902,288 | | | $ | 565,902,288 | | |
| Total Short Term Investments (Cost: $1,834,801,707) | | | | $ | 1,828,132,521 | | |
| Total Investments (Cost: $16,413,553,512)—100.5% | | | | | 20,304,288,064 | | |
| Liabilities In Excess of Other Assets—(0.5)% | | | | | (100,252,445 | ) | |
| Total Net Assets—100% | | | | $ | 20,204,035,619 | | |
OAKMARK EQUITY AND INCOME FUND
26
OAKMARK EQUITY AND INCOME FUND
Schedule of Investments—March 31, 2012 (Unaudited) cont.
(a) Non-income producing security
(b) See Note 5 in the Notes to the Financial Statements regarding investments in affiliated issuers.
(c) Sponsored American Depositary Receipt
(d) Foreign domiciled corporation
(e) Fair value is determined in good faith in accordance with procedures established by the Board of Trustees.
(f) Floating Rate Note. Rate shown is as of March 31, 2012.
(g) Security exempt from registration pursuant to Rule 144A under the Securities Act of 1933. These securities may be resold only in transactions exempt from registration, normally to qualified institutional buyers.
(h) Amount rounds to less than 0.1%.
(i) The rate shown represents the annualized yield at the time of purchase; not a coupon rate.
Key to abbreviations:
CAD: Canadian Dollar
EUR: Euro
NOK: Norwegian Krone
See accompanying Notes to Financial Statements.
OAKMARK EQUITY AND INCOME FUND
27
OAKMARK GLOBAL FUND
Report from Clyde S. McGregor and Robert A. Taylor, Portfolio Managers


THE VALUE OF A $10,000 INVESTMENT IN OAKMARK GLOBAL FUND FROM ITS INCEPTION (8/4/99) TO PRESENT (3/31/12) AS COMPARED TO THE MSCI WORLD INDEX11 (UNAUDITED)
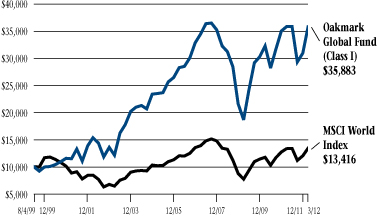
| | | | | Average Annual Total Returns | |
| | | | | (as of 3/31/12) | |
| (Unaudited) | | Total Return
Last 3 Months* | | 1-year | | 5-year | | 10-year | | Since
Inception
(8/4/99) | |
Oakmark Global
Fund (Class I) | | | 15.76 | % | | | -0.09 | % | | | 0.76 | % | | | 8.84 | % | | | 10.62 | % | |
| MSCI World Index | | | 11.56 | % | | | 0.56 | % | | | -0.70 | % | | | 4.72 | % | | | 2.35 | % | |
Lipper Global
Fund Index12 | | | 12.39 | % | | | -3.51 | % | | | -0.38 | % | | | 5.03 | % | | | 3.60 | % | |
The graph and table do not reflect the deduction of taxes that a shareholder would pay on Fund distributions or the redemption of Fund shares.
The expense ratio for Class I shares as of 9/30/11 was 1.16%.
Past performance is no guarantee of future results. The performance data quoted represents past performance. Current performance may be lower or higher than the performance data quoted. The investment return and principal value vary so that an investor's shares when redeemed may be worth more or less than the original cost. The performance of the Fund does not reflect the 2% redemption fee imposed on shares redeemed within 90 days of purchase. To obtain the most recent month-end performance data, visit oakmark.com.
* Not annualized
Quarter Review
World stock markets rallied strongly during the March quarter. In fact, the only country to experience a loss was Spain. The Oakmark Global Fund participated in the advance, gaining 16% in the quarter. The MSCI World Index return was 12%, and the Lipper Global Fund Index gained 12%. For the Fund's fiscal six months, the return was 22%. This compares to 20% for the MSCI World Index and 20% for the Lipper Global Fund Index. As always, we are most pleased to report the Fund's 11% compound annualized rate of return since inception, outperforming the MSCI World Index, which has averaged 2%, and the Lipper Global Fund Index, which has averaged 4% over the same time period.
The countries that generated the highest total returns for the Fund this quarter were Germany, Italy and Sweden, of which the latter two have small representations in the Fund. The highest contribution to the Fund's results came from the U.S., both because of return and its very large portfolio weight. The other two heavily weighted countries, Japan and Switzerland, also made significant contributions to return, and they were matched in contribution by lesser-weighted Germany, which experienced an exceptional outcome in the quarter. No countries produced losses in the Fund. Fiscal six-month country outcomes are similar to the quarter except for the Fund's Spanish representation, which produced a loss over that period.
The holdings that contributed most significantly to the Fund's quarterly return were Toyota Motor (Japan), Daiwa (Japan), Snap-on (U.S.), Daimler (Germany) and Rheinmetall (Germany). No holdings detracted from Fund performance this quarter. For the first six months of the Fund's fiscal year, the leading contributors were all from the U.S.: Snap-on, Equifax, MasterCard Class A, Intel and Discovery Communications Series C. The only two stocks to detract from return in the six months were Rohm (Japan) and Banco Santander (Spain).
Portfolio Activity
We initiated four new positions in the quarter and eliminated three. As it happens, all seven holdings were comparatively small weights in the portfolio. Beginning with the sales, Sara Lee neared our price target for the stock after the company announced its plan to divide into two parts. We thank the Sara Lee management team
OAKMARK GLOBAL FUND
28
for working hard to benefit its shareholders. We sold Covidien (Ireland) to fund another health-care industry purchase. We eliminated the small Meitec (Japan) holding because our assessment of value came down and made it relatively less attractive versus other names.
Our four new purchases were Cimarex Energy (U.S.), Health Net (U.S.), Kansai Paint (Japan) and Smiths Group (U.K.). Cimarex is an independent oil and gas exploration and production company with operations in three regions—the Midcontinent, Gulf Coast and Permian Basin. We perceived an investment opportunity in Cimarex's shares when the company reported quarterly production that disappointed investors. In our opinion, the production decline is occurring according to plan in short-lived Gulf Coast properties at the same time that production and reserves are growing in longer-lived Texas and Oklahoma fields. In our view, Cimarex is a very well-run company and, at our purchase price, the shares sold at a large discount to our asset value estimates and compared to its industry peers. The company has large undeveloped acreage holdings in attractive liquids-rich areas that should provide the foundation for substantial future production and reserve growth. In addition, cash flow is strong. Although oil and gas price volatility may have a short-term impact on Cimarex's stock price, we are confident that Cimarex's prospects for increasing shareholder value over the long term are excellent.
Health Net is a California managed-care company that we perceive to have an unusually strong market position. After a decade of spotty operational results, Health Net hired new actuarial talent from a competitor and has since been gaining market share with innovative tailored products. Management has shed non-core assets and has bought back the company's stock with the proceeds. The California market, which is primarily capitated, is often very difficult for large competitors to break into organically (i.e., without making an in-market acquisition), and this factor adds to Health Net's inherent appeal.
Kansai controls 30% of the decorative paint market in Japan and 50% of the auto paint industry. However, we believe the reason to get excited about Kansai paint is its strong deco and auto market positions in India and other southeastern Asian markets. In addition, the company recently acquired Freeworld, a dominant paint company in South Africa and other smaller African countries, for a very cheap price. Yuzo Kawamori, Kansai's president, is one of the more impressive Japanese managers we have met. He understands operational, as well as capital, returns and may be one of the only Japanese managers to refuse a company car. We are excited to be invested with this new partner.
Smiths Group is a U.K.-based conglomerate with five independent divisions. Of note is John Crane, which accounts for about one-third of its sales and profits. It is the world's leading provider of mechanical seals and sealing support systems used in pumps, compressors and other rotating equipment, holding roughly 30% of market share. With over 60% of its sales coming from the after-market, the business is very stable and earns very high returns. At the time we initiated the position, our assessment of this division alone accounted for almost 90% of Smiths Group's market cap. Also of note is the medical division, which generates over 35% of the company's profits. The management team has already received an offer for this division that equaled roughly two-thirds of Smiths Group's market cap at the time we initiated our position. CEO Philip Bowman rejected this offer as too low. Although it is too early to know what price he could get for the medical division, Bowman does have a strong track record of selling businesses for solid prices in the past, first Allied Domecq to Pernod Ricard and later Scottish Power to Iberdrola.
Why Global?
In the past few quarters, investors and investment industry consultants have indicated renewed interest in global investing. The Oakmark Global Fund portfolio managers certainly share this interest as we regularly add to our personal Fund holdings. But what is it that makes this kind of investing so alluring? To reduce the answer to one word: flexibility. In Oakmark Global, your managers may invest in any market that we believe offers the appropriate balance of return potential and risk control. The Fund is also "all-cap," which means that it can own shares of small companies like Live Nation or large companies, such as Nestle or Oracle. The Fund will invest in emerging markets when we find fairly priced stocks there. But aside from retaining minimum investments of 25% in both the U.S. and non-U.S. markets, the Fund is unconstrained. Today the Fund has 48% invested in U.S. equities, which is somewhat below the 53% weight in the MSCI World Index, the Fund's benchmark. Your managers pay little attention to this statistic. Rather, with every potential investment, we ask, "Would we be willing to own 100% of this company at this purchase price if we could never sell it again?" When we can answer this question with a definitive "yes," we believe that we have found a worthy opportunity for the Fund shareholders' hard-earned savings. Investing offers many routes to success, but we believe that Oakmark Global's flexibility is an important advantage.
OAKMARK GLOBAL FUND
29
Japan—A Year of Natural Disasters
March 11 marked the one-year anniversary of the earthquake and tsunami that devastated the Tohoku region of Japan. In addition to this natural disaster, heavy flooding in Thailand later in the year hurt many Japanese corporations with local Thai operations. Our thoughts go out to those touched by these tragic events.
When you couple these natural disasters with the fact that the Japanese yen hit post-WWII highs versus the dollar during the first quarter of 2012, it seems unsurprising that share prices (as measured by TOPIX)13 remain below pre-earthquake levels. What is surprising to us is that all of our Japanese holdings with direct and indirect exposure to these disasters have returned to 100% production capacity and are starting to see their profits improve.
As we have stated in the past, the value of any business is not based on one month, one quarter or one year. Instead, we believe the value of any business is based on its normal earnings power. Given all that has happened in 2011, it is hard to argue that corporate earnings in Japan are anywhere close to normal. 2012 is another story. This year's consensus earnings estimates for the TOPIX, per Bloomberg, are 33% higher than 2010 (a year largely unaffected by disasters). We too expect our Japanese holdings to have higher per-share earnings power in 2012 due to cost-cutting measures, sales growth in faster economies, repurchase of undervalued shares, and the movement of high-cost production in Japan to lower-cost countries. As such, we continue to find what we think is tremendous value in our Japanese holdings.
Hedge Discussion
We continue to believe that the U.S. dollar is undervalued relative to many global currencies. As of quarter-end, approximately 73% of the Fund's Australian dollar, 55% of the Japanese yen, 42% of the Swiss franc and 36% of the Swedish krona exposures were hedged. Our Japanese yen hedges decreased as the yen weakened versus the U.S. dollar. We no longer hedge the euro, as it has approached fair value relative to the U.S. dollar.
Thank you for being our partners in the Oakmark Global Fund. Please feel free to contact us with your questions or comments.
Clyde S. McGregor, CFA
Portfolio Manager
oakgx@oakmark.com | | Robert A. Taylor, CFA
Portfolio Manager
oakgx@oakmark.com | |
|
March 31, 2012
OAKMARK GLOBAL FUND
30
OAKMARK GLOBAL FUND
Global Diversification—March 31, 2012 (Unaudited)

OAKMARK GLOBAL FUND
31
OAKMARK GLOBAL FUND
Schedule of Investments—March 31, 2012 (Unaudited)
| Name | | Description | | Shares Held | | Value | |
| Common Stocks—97.4% | |
| Air Freight & Logistics—3.0% | |
FedEx Corp.
(United States) | | Package & Freight Delivery
Services | | | 754,600 | | | $ | 69,393,016 | | |
| Application Software—1.5% | |
| SAP AG (Germany) | | Develops Business Software | | | 502,500 | | | | 35,090,838 | | |
| Asset Management & Custody Banks—3.3% | |
Julius Baer Group, Ltd.
(Switzerland) | | Asset Management | | | 1,895,900 | | | | 76,533,285 | | |
| Automobile Manufacturers—6.5% | |
Toyota Motor Corp.
(Japan) | | Automobile Manufacturer | | | 1,918,300 | | | | 82,739,289 | | |
| Daimler AG (Germany) (b) | | Automobile Manufacturer | | | 1,136,600 | | | | 68,533,072 | | |
| | | | 151,272,361 | | |
| Broadcasting—3.2% | |
Discovery
Communications, Inc.,
Class C (United States) (a) | | Media Management &
Network Services | | | 1,585,385 | | | | 74,322,849 | | |
| Building Products—1.1% | |
Assa Abloy AB, Class B
(Sweden) | | Develops, Designs &
Manufactures Security Locks | | | 772,700 | | | | 24,270,241 | | |
| Construction & Farm Machinery & Heavy Trucks—0.9% | |
Fiat Industrial SPA
(Italy) (a) | | Branded Truck & Tractor
Manufacturer | | | 1,881,200 | | | | 20,071,646 | | |
| Data Processing & Outsourced Services—3.8% | |
MasterCard, Inc.,
Class A (United States) | | Transaction Processing Services | | | 208,700 | | | | 87,766,698 | | |
| Distillers & Vintners—1.5% | |
Diageo PLC
(United Kingdom) | | Beverages, Wines & Spirits
Manufacturer | | | 1,447,900 | | | | 34,796,660 | | |
| Diversified Banks—2.0% | |
Banco Santander SA
(Spain) | | Retail, Commercial & Private
Banking & Asset Management
Services | | | 5,939,032 | | | | 45,703,506 | | |
OAKMARK GLOBAL FUND
32
OAKMARK GLOBAL FUND
Schedule of Investments—March 31, 2012 (Unaudited) cont.
| Name | | Description | | Shares Held | | Value | |
| Common Stocks—97.4% (cont.) | |
| Diversified Capital Markets—3.1% | |
Credit Suisse Group
(Switzerland) | | Wealth Management &
Investment Banking | | | 2,502,200 | | | $ | 71,321,154 | | |
| Electronic Components—4.9% | |
Hirose Electric Co., Ltd.
(Japan) | | Develops & Sells Electronic
Equipment | | | 709,900 | | | | 74,532,210 | | |
| OMRON Corp. (Japan) | | Component, Equipment &
System Manufacturer | | | 1,789,600 | | | | 38,486,021 | | |
| | | | 113,018,231 | | |
| Electronic Manufacturing Services—2.8% | |
TE Connectivity, Ltd.
(Switzerland) | | Electronic Equipment,
Instruments & Components | | | 1,785,200 | | | | 65,606,100 | | |
| Fertilizers & Agricultural Chemicals—1.9% | |
Incitec Pivot, Ltd.
(Australia) | | Fertilizer Manufacturer &
Supplier | | | 13,213,200 | | | | 43,113,702 | | |
| Health Care Facilities—1.8% | |
Tenet Healthcare Corp.
(United States) (a) | | Hospitals & Health Care Facilities | | | 8,044,700 | | | | 42,717,357 | | |
| Health Care Services—3.9% | |
Laboratory Corp. of
America Holdings
(United States) (a) | | Medical Laboratory & Testing
Services | | | 980,700 | | | | 89,773,278 | | |
| Home Entertainment Software—4.1% | |
Square Enix Holdings
Co., Ltd. (Japan) | | Develops & Sells Entertainment
Software for Video Game
Consoles | | | 4,503,400 | | | | 94,562,151 | | |
| Human Resource & Employment Services—3.1% | |
| Adecco SA (Switzerland) | | Temporary Employment Services | | | 1,348,400 | | | | 70,653,949 | | |
| Industrial Conglomerates—3.4% | |
| Rheinmetall AG (Germany) | | Automotive Pump Manufacturer | | | 1,138,500 | | | | 67,410,125 | | |
Smiths Group PLC
(United Kingdom) | | Global Technology Company | | | 627,700 | | | | 10,562,151 | | |
| | | | 77,972,276 | | |
OAKMARK GLOBAL FUND
33
OAKMARK GLOBAL FUND
Schedule of Investments—March 31, 2012 (Unaudited) cont.
| Name | | Description | | Shares Held | | Value | |
| Common Stocks—97.4% (cont.) | |
| Industrial Machinery—4.2% | |
Snap-on, Inc.
(United States) | | Tool & Equipment Manufacturer | | | 1,576,600 | | | $ | 96,125,302 | | |
| Investment Banking & Brokerage—3.7% | |
Daiwa Securities
Group, Inc. (Japan) | | Stock Broker | | | 21,826,000 | | | | 86,228,126 | | |
| Managed Health Care—1.5% | |
Health Net, Inc.
(United States) (a) | | Health Care Benefit Manager | | | 890,600 | | | | 35,374,632 | | |
| Movies & Entertainment—1.8% | |
Live Nation
Entertainment, Inc.
(United States) (a) | | Live Events Producer, Operator, &
Promoter | | | 4,481,698 | | | | 42,127,961 | | |
| Office Electronics—2.6% | |
| Canon, Inc. (Japan) | | Computers & Information | | | 1,281,700 | | | | 60,546,660 | | |
| Oil & Gas Exploration & Production—3.3% | |
Apache Corp.
(United States) | | Oil & Natural Gas Exploration &
Production | | | 506,100 | | | | 50,832,684 | | |
Cimarex Energy Co.
(United States) | | Oil & Natural Gas Exploration &
Production | | | 334,071 | | | | 25,212,338 | | |
| | | | 76,045,022 | | |
| Packaged Foods & Meats—1.4% | |
| Nestle SA (Switzerland) | | Food & Beverage Manufacturer | | | 521,600 | | | | 32,820,295 | | |
| Railroads—1.9% | |
Union Pacific Corp.
(United States) | | Rail Transportation Provider | | | 408,100 | | | | 43,862,588 | | |
| Research & Consulting Services—3.6% | |
Equifax, Inc.
(United States) | | Information Management,
Transaction Processing, Direct
Marketing & Customer
Relationship Management | | | 1,855,400 | | | | 82,120,004 | | |
| Semiconductor Equipment—1.9% | |
Applied Materials, Inc.
(United States) | | Develops, Manufactures, Markets &
Services Semiconductor
Wafer Fabrication Equipment | | | 3,580,100 | | | | 44,536,444 | | |
OAKMARK GLOBAL FUND
34
OAKMARK GLOBAL FUND
Schedule of Investments—March 31, 2012 (Unaudited) cont.
| Name | | Description | | Shares Held/
Par Value | | Value | |
| Common Stocks—97.4% (cont.) | |
| Semiconductors—8.5% | |
| Intel Corp. (United States) | | Computer Component
Manufacturer & Designer | | | 2,558,200 | | | $ | 71,911,002 | | |
Texas Instruments, Inc.
(United States) | | Designs & Supplies Digital
Signal Processing, Analog
Technologies & Microcontroller
Semiconductors | | | 2,032,300 | | | | 68,305,603 | | |
| ROHM Co., Ltd. (Japan) | | Integrated Circuits &
Semiconductor Devices
Manufacturer | | | 1,157,200 | | | | 57,112,021 | | |
| | | | 197,328,626 | | |
| Specialty Chemicals—2.7% | |
International Flavors &
Fragrances, Inc.
(United States) | | Manufactures Flavors &
Fragrance Products | | | 809,300 | | | | 47,424,980 | | |
Kansai Paint Co., Ltd.
(Japan) | | Manufactures & Sells a Wide Range
of Paints & Related Products | | | 1,377,200 | | | | 13,893,464 | | |
| | | | 61,318,444 | | |
| Systems Software—4.5% | |
Oracle Corp.
(United States) | | Software Services | | | 3,598,100 | | | | 104,920,596 | | |
| Total Common Stocks (Cost: $1,927,723,048) | | | | | | $ | 2,251,313,998 | | |
| Short Term Investment—1.8% | |
| Repurchase Agreement—1.8% | |
Fixed Income Clearing Corp. Repurchase Agreement,
0.01% dated 3/30/2012 due 4/2/2012, repurchase
price $41,320,202, collateralized by a Federal Home Loan
Mortgage Corp. Bond, with a rate of 0.400%, with a
maturity of 2/27/2014, and with a fair value plus accrued
interest of $42,147,619 (Cost: $41,320,168) | | | | | | $ | 41,320,168 | | | $ | 41,320,168 | | |
| Total Short Term Investment (Cost: $41,320,168) | | | | | | | | $ | 41,320,168 | | |
| Total Investments (Cost: $1,969,043,216)—99.2% | | | | | | | | | 2,292,634,166 | | |
| Foreign Currencies (Cost: $834,813)—0.0% (c) | | | | | | | | | 830,022 | | |
| Other Assets In Excess of Liabilities—0.8% | | | | | | | | | 17,428,682 | | |
| Total Net Assets—100% | | | | | | $ | 2,310,892,870 | | |
(a) Non-income producing security
(b) A portion of the security out on loan.
(c) Amount rounds to less than 0.1%.
See accompanying Notes to Financial Statements.
OAKMARK GLOBAL FUND
35
OAKMARK GLOBAL SELECT FUND
Report from Bill Nygren and David Herro, Portfolio Managers


THE VALUE OF A $10,000 INVESTMENT IN OAKMARK GLOBAL SELECT FUND FROM ITS INCEPTION (10/2/06) TO PRESENT (3/31/12) AS COMPARED TO THE MSCI WORLD INDEX11 (UNAUDITED)
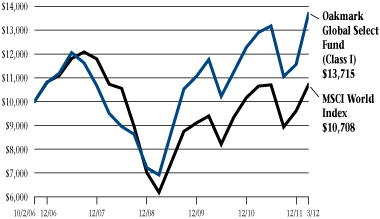
| | | Total Returns
(as of 3/31/12) | |
| (Unaudited) | | Last 3 Months* | | 1-year | | 5-year | | Average Annual
Total Return
Since Inception
(10/2/06) | |
Oakmark Global
Select Fund (Class I) | | | 18.62 | % | | | 6.19 | % | | | 4.15 | % | | | 5.92 | % | |
| MSCI World Index | | | 11.56 | % | | | 0.56 | % | | | -0.70 | % | | | 1.25 | % | |
| Lipper Global Fund Index12 | | | 12.39 | % | | | -3.51 | % | | | -0.38 | % | | | 1.60 | % | |
The graph and table do not reflect the deduction of taxes that a shareholder would pay on Fund distributions or the redemption of Fund shares.
The expense ratio for Class I shares as of 9/30/11 was 1.24%.
Past performance is no guarantee of future results. The performance data quoted represents past performance. Current performance may be lower or higher than the performance data quoted. The investment return and principal value vary so that an investor's shares when redeemed may be worth more or less than the original cost. The performance of the Fund does not reflect the 2% redemption fee imposed on shares redeemed within 90 days of purchase. To obtain the most recent month-end performance data, visit oakmark.com.
* Not annualized
The Oakmark Global Select Fund returned 19% for the quarter ended March 31, 2012, outperforming the MSCI World Index's return of 12%. During the first half of the fiscal year, the Fund returned 24%, compared to 20% for the MSCI World Index. More importantly, the Fund has returned an average of 6% per year since inception, outperforming the MSCI World Index, which has averaged 1% per year over the same period.
The largest contributor to the Fund's quarterly performance was Toyota Motor, a Japanese automotive manufacturer, which returned 31%. Results for Toyota's third fiscal quarter were better than expected, and management increased its full-year operating profit projections 35% above original estimates. Management expects to gain market share in the U.S. and is benefiting from a rebound in its Japanese business, where unit sales increased 39% over the same period last year. Toyota's fundamentals remain very strong, and we expect that a gradually improving economy will add to the company's rapidly growing business.
Another large contributor was Daimler AG, a global automotive manufacturer. Daimler's stock price advanced significantly during the quarter, reversing its declines over the past few quarters. Despite tremendous growth for Daimler's Mercedes Car Group, its largest division, the company's performance had lagged behind BMW and Audi. We believe Daimler is poised to rebound over the next couple of years because the company has several competitive advantages. Its new small-car models, which will be rolled out this year, should not only help Mercedes grow and regain competitive status, but should also boost profitability because these new models use the fixed costs of currently idle plants. Also, because the Mercedes brand is much later into its model cycle than BMW or Audi, Daimler plans to ramp up the number of launches in 2013. In February, Daimler released its full-year 2011 results, which included strong revenue numbers in all segments except for Daimler buses. By division, the best performance came from Daimler trucks, where revenue advanced 20%, followed by Mercedes-Benz vans (revenue up just over 17%) and Mercedes-Benz cars (revenue up almost 8%). The company's finance business also performed well and realized a return-on-equity increase of nearly 26% for the year. Additionally, free cash flow
OAKMARK GLOBAL SELECT FUND
36
remains strong. We remain excited about the future prospects for this high-quality company and believe the strong results achieved by both Toyota and Daimler may signal a resurgence in the auto manufacturing industry.
Capital One Financial, a U.S.-based financial services provider, also was a top contributor, returning 32% during the quarter. Capital One completed the acquisition of ING Direct and received approval to purchase HSBC's U.S. credit card business during the first quarter. Together, these two acquisitions are expected to add approximately $1.50 in per-share value and should propel Capital One's cash earnings per share to nearly $8.00 in 2013. These acquisitions, along with a strong balance sheet and a projected Basel III Tier 1 common ratio over 10% at the end of 2012, should allow management to start returning capital to shareholders in 2013. At 8x 2013 cash earnings per share, Capital One is, in our view, an attractive investment.
We are happy to report that there were no detractors from performance for the quarter.
Geographically, we ended the quarter with our European and Japanese holdings increasing slightly to 34% and 18%, respectively. The remainder of the Fund's investments, excluding cash, are in North America. We did not add or remove any names from the Fund during the quarter.
Due to the U.S. dollar's weakness relative to some global currencies, we currently hedge two underlying foreign currencies. At quarter-end, approximately 44% of the Fund's Japanese yen and 42% of the Swiss franc exposures were hedged. We no longer hedge the euro, as we believe it is approaching its fair value relative to the U.S. dollar.
We have built a Fund of what we feel are undervalued companies that trade at attractive prices and that are run by management teams who focus on building shareholder value. We believe that the Fund is well-positioned to generate favorable long-term results for our fellow shareholders. We thank you for your continued support and confidence.
William C. Nygren, CFA
Portfolio Manager
oakwx@oakmark.com | | David G. Herro, CFA
Portfolio Manager
oakwx@oakmark.com | |
|
March 31, 2012
OAKMARK GLOBAL SELECT FUND
37
OAKMARK GLOBAL SELECT FUND
Global Diversification—March 31, 2012 (Unaudited)

OAKMARK GLOBAL SELECT FUND
38
OAKMARK GLOBAL SELECT FUND
Schedule of Investments—March 31, 2012 (Unaudited)
| Name | | Description | | Shares Held | | Value | |
| Common Stocks—95.2% | |
| Air Freight & Logistics—4.6% | |
| FedEx Corp. (United States) | | Package & Freight Delivery Services | | | 270,000 | | | $ | 24,829,200 | | |
| Application Software—4.4% | |
| SAP AG (Germany) | | Develops Business Software | | | 343,600 | | | | 23,994,452 | | |
| Automobile Manufacturers—11.3% | |
Toyota Motor Corp.
(Japan) | | Automobile Manufacturer | | | 793,600 | | | | 34,229,213 | | |
| Daimler AG (Germany) (b) | | Automobile Manufacturer | | | 453,800 | | | | 27,362,580 | | |
| | | | 61,591,793 | | |
| Cable & Satellite—5.3% | |
Comcast Corp., Class A
(United States) | | Cable Communication Networks
Provider | | | 974,000 | | | | 28,742,740 | | |
| Catalog Retail—4.5% | |
Liberty Interactive
Corp., Class A
(United States) (a) | | Home & Internet Shopping
Online Travel | | | 1,280,000 | | | | 24,435,200 | | |
| Computer Hardware—4.7% | |
| Dell, Inc. (United States) (a) | | Technology Products & Services | | | 1,536,000 | | | | 25,497,600 | | |
| Consumer Finance—5.2% | |
Capital One Financial
Corp. (United States) | | Credit Card Products &
Services Provider | | | 505,000 | | | | 28,148,700 | | |
| Distillers & Vintners—3.7% | |
Diageo PLC
(United Kingdom) | | Beverages, Wines & Spirits
Manufacturer | | | 826,700 | | | | 19,867,669 | | |
| Diversified Capital Markets—5.2% | |
Credit Suisse Group
(Switzerland) | | Wealth Management &
Investment Banking | | | 991,500 | | | | 28,261,100 | | |
| Electronic Manufacturing Services—4.9% | |
TE Connectivity, Ltd.
(Switzerland) | | Electronic Equipment,
Instruments & Components | | | 723,900 | | | | 26,603,325 | | |
OAKMARK GLOBAL SELECT FUND
39
OAKMARK GLOBAL SELECT FUND
Schedule of Investments—March 31, 2012 (Unaudited) cont.
| Name | | Description | | Shares Held | | Value | |
| Common Stocks—95.2% (cont.) | |
| Health Care Equipment—4.3% | |
Medtronic, Inc.
(United States) | | Develops Therapeutic &
Diagnostic Medical Products | | | 602,000 | | | $ | 23,592,380 | | |
| Human Resource & Employment Services—5.3% | |
| Adecco SA (Switzerland) | | Temporary Employment Services | | | 554,600 | | | | 29,060,131 | | |
| Integrated Oil & Gas—4.0% | |
Cenovus Energy, Inc.
(Canada) | | Integrated Oil Company | | | 600,000 | | | | 21,564,000 | | |
| Internet Software & Services—4.8% | |
eBay, Inc.
(United States) (a) | | Online Trading Community &
Secure Online Payment Services | | | 705,000 | | | | 26,007,450 | | |
| Investment Banking & Brokerage—5.1% | |
Daiwa Securities
Group, Inc. (Japan) | | Stock Broker | | | 7,028,000 | | | | 27,765,567 | | |
| Packaged Foods & Meats—3.3% | |
| Nestle SA (Switzerland) | | Food & Beverage Manufacturer | | | 288,400 | | | | 18,146,804 | | |
| Semiconductors—14.6% | |
| ROHM Co., Ltd. (Japan) | | Integrated Circuits &
Semiconductor Devices
Manufacturer | | | 576,800 | | | | 28,467,174 | | |
| Intel Corp. (United States) | | Computer Component
Manufacturer & Designer | | | 937,000 | | | | 26,339,070 | | |
Texas Instruments, Inc.
(United States) | | Designs & Supplies Digital
Signal Processing, Analog
Technologies & Microcontroller
Semiconductors | | | 720,000 | | | | 24,199,200 | | |
| | | | 79,005,444 | | |
| Total Common Stocks (Cost: $453,742,636) | | | | | | $ | 517,113,555 | | |
OAKMARK GLOBAL SELECT FUND
40
OAKMARK GLOBAL SELECT FUND
Schedule of Investments—March 31, 2012 (Unaudited) cont.
| Name | | Par Value | | Value | |
| Short Term Investment—4.1% | |
| Repurchase Agreement—4.1% | �� |
Fixed Income Clearing Corp. Repurchase Agreement,
0.01% dated 3/30/2012 due 4/2/2012, repurchase
price $22,170,937, collateralized by a Federal Home
Loan Mortgage Corp. Bond, with a rate of 0.400%, with a
maturity of 2/27/2014, and with a fair value plus accrued
interest of $22,618,238 (Cost: $22,170,919) | | $ | 22,170,919 | | | $ | 22,170,919 | | |
| Total Short Term Investment (Cost: $22,170,919) | | | | $ | 22,170,919 | | |
| Total Investments (Cost: $475,913,555)—99.3% | | | | | 539,284,474 | | |
| Other Assets In Excess of Liabilities—0.7% | | | | | 3,593,645 | | |
| Total Net Assets—100% | | | | $ | 542,878,119 | | |
(a) Non-income producing security
(b) A portion of the security out on loan.
See accompanying Notes to Financial Statements.
OAKMARK GLOBAL SELECT FUND
41
OAKMARK INTERNATIONAL FUND
Report from David G. Herro and Robert A. Taylor, Portfolio Managers


THE VALUE OF A $10,000 INVESTMENT IN OAKMARK INTERNATIONAL FUND FROM ITS INCEPTION (9/30/92) TO PRESENT (3/31/12) AS COMPARED TO THE MSCI WORLD EX U.S. INDEX14 (UNAUDITED)

| | | | | Average Annual Total Returns
(as of 3/31/12) | |
| (Unaudited) | | Total Return
Last 3 Months* | | 1-year | | 5-year | | 10-year | | Since
Inception
(9/30/92) | |
Oakmark International
Fund (Class I) | | | 16.80 | % | | | -1.86 | % | | | 0.38 | % | | | 7.96 | % | | | 10.22 | % | |
| MSCI World ex U.S. Index | | | 10.37 | % | | | -6.67 | % | | | -2.95 | % | | | 6.12 | % | | | 6.03 | % | |
| MSCI EAFE Index15 | | | 10.86 | % | | | -5.77 | % | | | -3.51 | % | | | 5.70 | % | | | 5.73 | % | |
Lipper International
Fund Index16 | | | 12.56 | % | | | -6.81 | % | | | -2.13 | % | | | 6.29 | % | | | 6.95 | % | |
The graph and table do not reflect the deduction of taxes that a shareholder would pay on Fund distributions or the redemption of Fund shares.
The expense ratio for Class I shares as of 9/30/11 was 1.06%.
Past performance is no guarantee of future results. The performance data quoted represents past performance. Current performance may be lower or higher than the performance data quoted. The investment return and principal value vary so that an investor's shares when redeemed may be worth more or less than the original cost. The performance of the Fund does not reflect the 2% redemption fee imposed on shares redeemed within 90 days of purchase. To obtain the most recent month-end performance data, visit oakmark.com.
* Not annualized
The Oakmark International Fund returned 17% for the quarter ended March 31, 2012, outperforming the MSCI World ex U.S. Index, which returned 10% over the same period. For the first six months of the Fund's fiscal year, the Fund returned 21% which outperformed the MSCI World ex U.S. Index's 14% return. Since its inception in September 1992, the Fund has returned an average of 10% per year, outperforming the MSCI World ex U.S. Index, which has averaged 6% per year over the same period.
The top contributor to the Fund's quarterly performance was Daimler AG, a global automotive manufacturer, which returned 37%. Daimler's stock price advanced significantly during the quarter, reversing its declines over the past few quarters. Despite tremendous growth for Daimler's Mercedes Car Group, its largest division, the company's performance had lagged behind BMW and Audi. We believe Daimler is poised to rebound over the next couple of years because the company has several competitive advantages. Its new small-car models, which will be rolled out this year, will not only help Mercedes grow and regain competitive status, but should also boost profitability because these new models use the fixed costs of currently idle plants. Also, because the Mercedes brand is much later into its model cycle than BMW or Audi, Daimler plans to ramp up the number of launches in 2013. In February, Daimler released its full-year 2011 results, which included strong revenue numbers in all segments except for Daimler buses. By division, the best performance came from Daimler trucks, where revenue advanced 20%, followed by Mercedes-Benz vans (revenue up just over 17%) and Mercedes-Benz cars (revenue up almost 8%). The company's finance business also performed well and realized a return-on-equity increase of nearly 26% for the year. Additionally, free cash flow remains strong. We remain excited about the future prospects for this high-quality company and believe these strong results may signal a resurgence in the auto manufacturing industry.
Another large contributor to performance was Bank of Ireland, an Irish banking services provider. Ireland's challenging financial environment has depressed the price of Bank of Ireland, but shares rebounded in the first quarter, returning 55%. Bank of Ireland has deleveraged its balance sheet. During the quarter, management
OAKMARK INTERNATIONAL FUND
42
announced that it had disposed of €8.6 billion in assets at a discount to book value of only 7.1%, much lower than the anticipated 15% discount. Its liquidity position has improved and capital levels remain strong. Recent market consolidation has left Bank of Ireland as the only exchange-listed bank in the country not controlled by the government. The diminished banking system and reduced competition should generate higher profitability during more normal economic conditions. It will take time for the economic environment to improve in Ireland, but in our view, Bank of Ireland will emerge on top.
Very few stocks detracted from performance during the quarter. The largest detractor was Philips Electronics, a global electronics and medical systems manufacturer. Philips fell 4% because of disappointing fourth-quarter results caused by weak European markets that struggled amid the European debt crisis. Management also indicated that the first half of 2012 would be difficult because savings from restructuring efforts won't affect the company's lighting and health-care segments until the second half of the year. However, management stands behind its 2013 targets and implemented a new incentive plan that will vest only if the targets are achieved. We believe Philips will be a good long-term investment for our shareholders.
We sold BAE Systems from the Fund during the quarter and used the proceeds to purchase Smiths Group, a U.K.-based global technology company. Smiths delivers products and services for the threat and contraband detection, medical devices, energy, communication and engineered components markets worldwide.
Our geographical composition changed slightly over the past quarter. Our European holdings remained unchanged at approximately 72%, and our Pacific Rim exposure remained unchanged at approximately 26%. Our Latin America and North America (Canada) exposure remained the same at approximately 2%.
We continue to believe many global currencies are overvalued compared to the U.S. dollar, so we continue to defensively hedge the Fund's currency exposure. As of quarter-end, approximately 55% of the Australian dollar, 40% of the Japanese yen, 40% of the Swiss franc and 21% of the Swedish krona exposures were hedged.
As long-term value investors, we continue to focus on finding what we believe are attractive, undervalued foreign companies with management teams focused on building shareholder value. We thank you for your continued support.
David G. Herro, CFA
Portfolio Manager
oakix@oakmark.com | | Robert A. Taylor, CFA
Portfolio Manager
oakix@oakmark.com | |
|
March 31, 2012
OAKMARK INTERNATIONAL FUND
43
OAKMARK INTERNATIONAL FUND
Global Diversification—March 31, 2012 (Unaudited)

OAKMARK INTERNATIONAL FUND
44
OAKMARK INTERNATIONAL FUND
Schedule of Investments—March 31, 2012 (Unaudited)
| Name | | Description | | Shares Held | | Value | |
| Common Stocks—96.0% | |
| Advertising—2.3% | |
Publicis Groupe SA
(France) | | Advertising & Media Services | | | 3,659,500 | | | $ | 201,742,655 | | |
| Apparel, Accessories & Luxury Goods—1.6% | |
Cie Financiere
Richemont SA
(Switzerland) | | Manufacturer & Retailer of
Luxury Goods | | | 2,260,600 | | | | 141,741,398 | | |
| Application Software—2.1% | |
| SAP AG (Germany) | | Develops Business Software | | | 2,584,900 | | | | 180,510,065 | | |
| Asset Management & Custody Banks—2.5% | |
Schroders PLC
(United Kingdom) | | International Asset Management | | | 8,511,900 | | | | 215,113,717 | | |
| Automobile Manufacturers—9.4% | |
Toyota Motor Corp.
(Japan) | | Automobile Manufacturer | | | 6,841,000 | | | | 295,063,066 | | |
| Daimler AG (Germany) (b) | | Automobile Manufacturer | | | 4,843,200 | | | | 292,028,307 | | |
Honda Motor Co., Ltd.
(Japan) | | Automobile & Motorcycle
Manufacturer | | | 5,906,500 | | | | 224,428,446 | | |
| | | | 811,519,819 | | |
| Brewers—1.5% | |
Heineken Holdings NV
(Netherlands) | | Produces Beers, Spirits,
Wines & Soft Drinks | | | 2,851,900 | | | | 133,505,590 | | |
| Broadcasting—0.4% | |
Grupo Televisa SAB
(Mexico) (c) | | Television Production &
Broadcasting | | | 1,682,352 | | | | 35,463,980 | | |
| Building Products—2.7% | |
Assa Abloy AB, Class B
(Sweden) | | Develops, Designs &
Manufactures Security Locks | | | 5,832,000 | | | | 183,181,112 | | |
Geberit AG
(Switzerland) | | Building Products | | | 226,000 | | | | 47,293,010 | | |
| | | | 230,474,122 | | |
| Commodity Chemicals—1.4% | |
| Orica, Ltd. (Australia) | | Produces Industrial & Specialty
Chemicals | | | 4,262,200 | | | | 123,487,513 | | |
OAKMARK INTERNATIONAL FUND
45
OAKMARK INTERNATIONAL FUND
Schedule of Investments—March 31, 2012 (Unaudited) cont.
| Name | | Description | | Shares Held | | Value | |
| Common Stocks—96.0% (cont.) | |
| Construction & Farm Machinery & Heavy Trucks—1.1% | |
Fiat Industrial SPA
(Italy) (a) | | Branded Truck & Tractor
Manufacturer | | | 9,095,300 | | | $ | 97,043,188 | | |
| Construction Materials—1.5% | |
| Holcim, Ltd. (Switzerland) | | Produces & Markets Ready-Mixed
Concrete, Cement, Clinker &
Admixtures | | | 2,053,300 | | | | 133,975,152 | | |
| Department Stores—2.3% | |
| PPR (France) | | Retails Consumer & Household
Products | | | 1,172,900 | | | | 201,794,226 | | |
| Distillers & Vintners—2.3% | |
Diageo PLC
(United Kingdom) | | Beverages, Wines & Spirits
Manufacturer | | | 7,489,800 | | | | 179,998,632 | | |
Treasury Wine Estates, Ltd.
(Australia) | | International Marketing &
Distribution of Wine | | | 5,578,000 | | | | 23,689,676 | | |
| | | | 203,688,308 | | |
| Diversified Banks—13.1% | |
| BNP Paribas SA (France) | | Commercial Bank | | | 5,589,000 | | | | 265,177,735 | | |
Lloyds Banking Group PLC
(United Kingdom) (a) | | Banking & Financial Services
Provider | | | 450,205,700 | | | | 241,991,099 | | |
Banco Santander SA
(Spain) | | Retail, Commercial & Private
Banking & Asset Management
Services | | | 30,626,642 | | | | 235,685,701 | | |
| Intesa Sanpaolo SPA (Italy) | | Banking & Financial Services | | | 130,578,900 | | | | 234,061,678 | | |
Bank of Ireland
(Ireland) (a) | | Commercial Bank | | | 958,366,300 | | | | 158,493,428 | | |
| | | | 1,135,409,641 | | |
| Diversified Capital Markets—4.2% | |
Credit Suisse Group
(Switzerland) | | Wealth Management &
Investment Banking | | | 12,679,600 | | | | 361,411,441 | | |
| Diversified Chemicals—2.3% | |
Akzo Nobel NV
(Netherlands) | | Produces & Markets Chemicals,
Coatings & Paints | | | 3,437,500 | | | | 202,959,913 | | |
OAKMARK INTERNATIONAL FUND
46
OAKMARK INTERNATIONAL FUND
Schedule of Investments—March 31, 2012 (Unaudited) cont.
| Name | | Description | | Shares Held | | Value | |
| Common Stocks—96.0% (cont.) | |
| Electronic Components—2.4% | |
| OMRON Corp. (Japan) | | Component, Equipment &
System Manufacturer | | | 9,598,600 | | | $ | 206,421,505 | | |
| Food Retail—2.9% | |
Tesco PLC
(United Kingdom) | | Food Retailer | | | 27,545,900 | | | | 145,396,988 | | |
Koninklijke Ahold NV
(Netherlands) | | Retails Health & Beauty
Supplies, Prescriptions Drugs,
Wine & Liquor | | | 7,416,000 | | | | 102,764,546 | | |
| | | | 248,161,534 | | |
| Health Care Equipment—0.6% | |
| Olympus Corp. (Japan) (a) | | Optoelectronic Products
Manufacturer | | | 3,346,200 | | | | 54,739,094 | | |
| Human Resource & Employment Services—3.1% | |
| Adecco SA (Switzerland) | | Temporary Employment Services | | | 5,164,900 | | | | 270,632,292 | | |
| Industrial Conglomerates—3.8% | |
Koninklijke (Royal)
Philips Electronics NV
(Netherlands) | | Electronics Manufacturer | | | 12,533,100 | | | | 254,073,946 | | |
Smiths Group PLC
(United Kingdom) | | Global Technology Company | | | 4,289,855 | | | | 72,184,318 | | |
| | | | 326,258,264 | | |
| Industrial Machinery—0.1% | |
Atlas Copco AB, Series B
(Sweden) | | International Industrial
Equipment Manufacturer | | | 417,800 | | | | 9,005,454 | | |
| Investment Banking & Brokerage—3.4% | |
Daiwa Securities
Group, Inc. (Japan) | | Stock Broker | | | 74,153,000 | | | | 292,956,760 | | |
| Marine—2.3% | |
Kuehne + Nagel
International AG
(Switzerland) | | Sea, Land & Rail Freight
Transportation Businesses | | | 1,478,200 | | | | 199,942,639 | | |
| Multi-line Insurance—2.8% | |
| Allianz SE (Germany) | | Insurance, Banking &
Financial Services | | | 2,069,800 | | | | 246,981,179 | | |
OAKMARK INTERNATIONAL FUND
47
OAKMARK INTERNATIONAL FUND
Schedule of Investments—March 31, 2012 (Unaudited) cont.
| Name | | Description | | Shares Held | | Value | |
| Common Stocks—96.0% (cont.) | |
| Office Electronics—2.9% | |
| Canon, Inc. (Japan) | | Computers & Information | | | 5,368,500 | | | $ | 253,604,386 | | |
| Packaged Foods & Meats—2.5% | |
| Nestle SA (Switzerland) | | Food & Beverage Manufacturer | | | 2,911,000 | | | | 183,166,943 | | |
| Danone (France) | | Food Products | | | 513,100 | | | | 35,790,004 | | |
| | | | 218,956,947 | | |
| Paper Packaging—2.9% | |
| Amcor, Ltd. (Australia) | | Packaging & Related Services | | | 32,789,100 | | | | 252,696,476 | | |
| Pharmaceuticals—2.1% | |
| Novartis AG (Switzerland) | | Pharmaceuticals | | | 2,205,300 | | | | 122,052,496 | | |
Roche Holding AG
(Switzerland) | | Develops & Manufactures
Pharmaceutical & Diagnostic
Products | | | 166,300 | | | | 28,941,764 | | |
GlaxoSmithKline PLC
(United Kingdom) | | Pharmaceuticals | | | 1,223,900 | | | | 27,338,292 | | |
| | | | 178,332,552 | | |
| Publishing—2.4% | |
Thomson Reuters Corp.
(Canada) | | Electronic Information &
Solutions Company | | | 5,159,300 | | | | 149,174,607 | | |
Reed Elsevier PLC
(United Kingdom) | | Publisher & Information Provider | | | 6,215,300 | | | | 55,174,650 | | |
| | | | 204,349,257 | | |
| Research & Consulting Services—0.8% | |
| Meitec Corp. (Japan) (d) | | Software Engineering Services | | | 2,475,100 | | | | 49,908,685 | | |
Experian Group, Ltd.
(Ireland) | | Credit & Marketing Services | | | 1,426,001 | | | | 22,227,273 | | |
| | | | 72,135,958 | | |
| Security & Alarm Services—3.3% | |
| G4S PLC (United Kingdom) | | Security Services | | | 32,703,300 | | | | 142,541,915 | | |
| Secom Co., Ltd. (Japan) | | On-Line Centralized Security
Services, Home Security
Systems, & Home Medical
Services | | | 2,858,400 | | | | 139,863,719 | | |
| | | | 282,405,634 | | |
OAKMARK INTERNATIONAL FUND
48
OAKMARK INTERNATIONAL FUND
Schedule of Investments—March 31, 2012 (Unaudited) cont.
| Name | | Description | | Shares Held/
Par Value | | Value | |
| Common Stocks—96.0% (cont.) | |
| Semiconductors—2.6% | |
| ROHM Co., Ltd. (Japan) | | Integrated Circuits & Semiconductor
Devices Manufacturer | | | 4,521,400 | | | $ | 223,147,505 | | |
| Specialty Chemicals—2.2% | |
Givaudan SA
(Switzerland) | | Manufactures & Markets Fragrances | | | 202,600 | | | | 195,260,884 | | |
| Specialty Stores—1.1% | |
Signet Jewelers, Ltd.
(United Kingdom) | | Jewelry Retailer | | | 1,975,200 | | | | 93,387,456 | | |
| Trading Companies & Distributors—1.1% | |
Wolseley PLC
(United Kingdom) | | Distributes Building Materials &
Lumber Products | | | 2,404,900 | | | | 91,703,894 | | |
| Total Common Stocks (Cost: $7,666,079,328) | | | | | | $ | 8,330,920,398 | | |
| Short Term Investment—3.0% | |
| Repurchase Agreement—3.0% | |
Fixed Income Clearing Corp. Repurchase Agreement,
0.01% dated 3/30/2012 due 4/2/2012, repurchase
price $256,200,035, collateralized by a Federal Home
Loan Mortgage Corp. Bond, with a rate of 0.400%,
with a maturity of 2/27/2014, and with a fair value
plus accrued interest of $85,857,188, and by a United
States Treasury Note, with a rate of 1.875%, with a
maturity of 2/28/2014, and with a fair value plus
accrued interest of $175,468,424 (Cost: $256,199,821) | | | | $ | 256,199,821 | | | $ | 256,199,821 | | |
| Total Short Term Investment (Cost: $256,199,821) | | | | | | $ | 256,199,821 | | |
| Total Investments (Cost: $7,922,279,149)—99.0% | | | | | | | 8,587,120,219 | | |
| Foreign Currencies (Cost: $13,509,855)—0.2% | | | | | | | 13,510,124 | | |
| Other Assets In Excess of Liabilities—0.8% | | | | | | | 73,499,112 | | |
| Total Net Assets—100% | | | | | | $ | 8,674,129,455 | | |
(a) Non-income producing security
(b) A portion of security out on loan.
(c) Sponsored American Depositary Receipt
(d) See Note 5 in the Notes to the Financial Statements regarding investments in affiliated issuers.
See accompanying Notes to Financial Statements.
OAKMARK INTERNATIONAL FUND
49
OAKMARK INTERNATIONAL
SMALL CAP FUND
Report from David G. Herro and Michael L. Manelli, Portfolio Managers


THE VALUE OF A $10,000 INVESTMENT IN OAKMARK INTERNATIONAL SMALL CAP FUND FROM 3/31/02 TO PRESENT (3/31/12) AS COMPARED TO THE MSCI WORLD EX U.S. SMALL CAP INDEX17
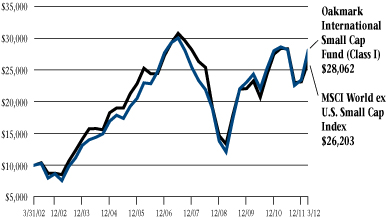
| | | | | Average Annual Total Returns
(as of 3/31/12) | |
| (Unaudited) | | Total Return
Last 3 Months* | | 1-year | | 5-year | | 10-year | | Since
Inception
(11/1/95) | |
Oakmark International
Small Cap Fund
(Class I) | | | 19.77 | % | | | -1.97 | % | | | -0.85 | % | | | 10.87 | % | | | 10.51 | % | |
MSCI World ex U.S.
Small Cap Index | | | 13.63 | % | | | -7.38 | % | | | -2.11 | % | | | 10.15 | % | | | N/A | | |
MSCI World ex U.S.
Index14 | | | 10.37 | % | | | -6.67 | % | | | -2.95 | % | | | 6.12 | % | | | 4.97 | % | |
Lipper International
Small Cap Index18 | | | 14.71 | % | | | -5.04 | % | | | -1.24 | % | | | 10.93 | % | | | N/A | | |
The graph and table do not reflect the deduction of taxes that a shareholder would pay on Fund distributions or the redemption of Fund shares.
The expense ratio for Class I shares as of 9/30/11 was 1.38%.
Past performance is no guarantee of future results. The performance data quoted represents past performance. Current performance may be lower or higher than the performance data quoted. The investment return and principal value vary so that an investor's shares when redeemed may be worth more or less than the original cost. The performance of the Fund does not reflect the 2% redemption fee imposed on shares redeemed within 90 days of purchase. To obtain the most recent month-end performance data, visit oakmark.com.
* Not annualized
The Oakmark International Small Cap Fund returned 20% for the quarter ended March 31, 2012, comparing favorably to the MSCI World ex U.S. Small Cap Index, which returned 14%. For the Fund's fiscal six months, the return was 24%. This compares to 14% for the MSCI World ex U.S. Small Cap Index. For the past 10 years, the Fund has earned an annualized rate of return of 11%, compared to the MSCI World ex U.S. Small Cap Index, which has returned 10% for the same period.
While international small-cap stocks had strong advances in the quarter, the number of attractive investment candidates did not decline. This quarter we added six new securities from across the globe to the Fund: Altran Technologies (France), Autoliv (a Swedish-American company), Takata (Japan), Treasury Wine Estates (Australia), Brunel International (Netherlands) and SThree (U.K.).
Of the new securities we purchased this quarter, Autoliv and Takata both manufacture car safety equipment. We believe that safety equipment providers make up one of the most attractive subsegments in the auto-supply arena because their growth comes from increased vehicle production, mandatory regulation, customer preference and content penetration in the emerging world. We were glad to have the opportunity to add two to the Fund this quarter.
Autoliv is the world's top manufacturer of car safety equipment and is benefiting from positive trends in the global auto industry. Autoliv has strong ties to both European and North American original equipment manufacturers, as well as to Japan's three largest automakers, and it is increasing its presence in emerging markets. Passive auto safety is an industry dominated by three major participants that together capture 76% of the total global market. Autoliv has 36% market share, followed by TRW Automotive (U.S.) and Takata, each with 20% share. Originally a textile maker, Takata is now one of the most diversified Japanese auto suppliers in terms of customer mix and geography. While the company sells to nearly all of the leading auto companies, over 50% of its sales are to non-Japanese original equipment manufacturers and 80% of its sales come from outside Japan. Emerging markets account for approximately 25% of sales. However, recent economic conditions, in addition to natural disasters that especially hurt the auto industry,
OAKMARK INTERNATIONAL SMALL CAP FUND
50
lowered Takata's stock price. We expect that the rebound in vehicle manufacturing will boost Takata's production and revenue growth, and we took advantage of the company's stock price dip to purchase shares of this high-quality company.
Altran is the largest engineering outsourcing firm in Europe. Its main client industries are aerospace, defense and telecommunications. A new management team recently took over at the company, which we believe will help Altran generate margins and returns more in line with its peers. Treasury Wine Estates was spun off from Fosters Group in 2011. The company operates vineyards and markets, and it distributes wine globally. Brunel International and SThree are both in the recruitment industry. Brunel supplies professional temporary staff for mostly engineering and IT sectors, and its primary markets are the Netherlands and Germany. Although SThree began as a dedicated IT recruiter, it now also specializes in the pharma, biotech, banking and finance sectors. SThree is active in both the permanent placement and temporary markets. We sold our positions in Exact Holding, Ansell and Wavin during the quarter.
The top-performing stock in the Fund this quarter was Australian food manufacturer Goodman Fielder. When Goodman's stock price declined in late 2011, it was the Fund's largest detractor for the year. However, it gained value through most of January, and in February, the stock price jumped due to the news that Wilmar International, the world's largest palm oil trader, bought a 10% stake in the company. We are watching the situation closely, as Wilmar is also evaluating whether to purchase more shares in Goodman Fielder, possibly acquiring all of Australia's biggest baking company.
Geographically, we ended the quarter with our European holdings decreasing slightly to 54%, and Pacific Rim holdings comprised 43% of the portfolio.
Because we believe the U.S. dollar remains weak relative to a number of other currencies, we continue to hedge some of the Fund's currency exposure. At the recent quarter-end, approximately 65% of the Fund's Australian dollar, 55% of the Norwegian krone, 40% of the Swiss franc, 35% of the Japanese yen and 20% of Swedish krona exposures were hedged.
We thank you for your continued confidence and support.
David G. Herro, CFA
Portfolio Manager
oakex@oakmark.com | | Michael L. Manelli, CFA
Portfolio Manager
oakex@oakmark.com | |
|
March 31, 2012
OAKMARK INTERNATIONAL SMALL CAP FUND
51
OAKMARK INTERNATIONAL SMALL CAP FUND
Global Diversification—March 31, 2012 (Unaudited)
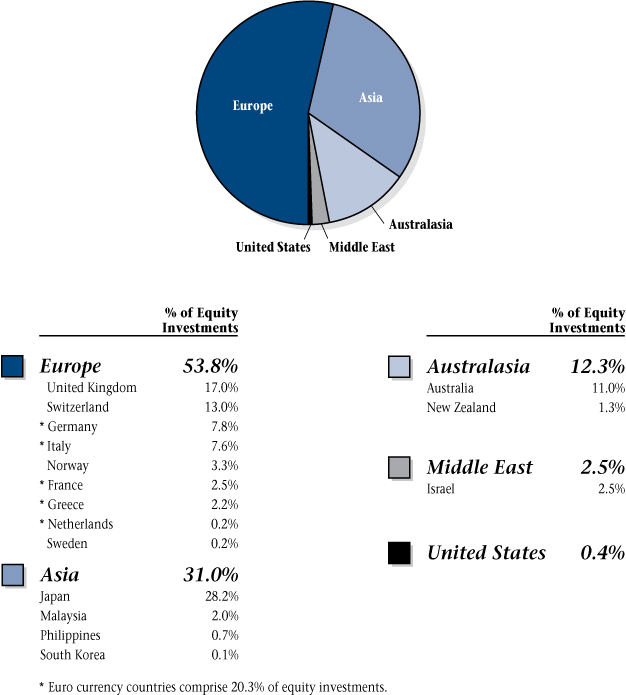
OAKMARK INTERNATIONAL SMALL CAP FUND
52
OAKMARK INTERNATIONAL SMALL CAP FUND
Schedule of Investments—March 31, 2012 (Unaudited)
| Name | | Description | | Shares Held | | Value | |
| Common Stocks—95.7% | |
| Advertising—1.3% | |
| Asatsu-DK, Inc. (Japan) | | Advertising Services Provider | | | 719,200 | | | $ | 20,671,461 | | |
| Air Freight & Logistics—1.2% | |
Freightways, Ltd.
(New Zealand) | | Express Package Services | | | 5,990,400 | | | | 19,374,518 | | |
| Airport Services—2.7% | |
BBA Aviation PLC
(United Kingdom) | | Flight Support & Aftermarket
Services & Systems Provider | | | 12,669,000 | | | | 43,365,126 | | |
| Asset Management & Custody Banks—8.7% | |
Julius Baer Group, Ltd.
(Switzerland) | | Asset Management | | | 1,469,000 | | | | 59,300,277 | | |
| MLP AG (Germany) | | Asset Management | | | 4,620,830 | | | | 41,044,244 | | |
| Azimut Holding SPA (Italy) | | Investment Management Services | | | 3,615,814 | | | | 39,278,528 | | |
| | | | 139,623,049 | | |
| Auto Parts & Equipment—5.5% | |
Toyota Industries Corp.
(Japan) | | Assembles Motor Vehicles &
Manufactures Automotive Parts | | | 1,255,600 | | | | 37,863,690 | | |
| Nifco, Inc. (Japan) | | Manufactures Synthetic Resinous
Fasteners & Plastic Components
For Automobiles & Home
Electronic Appliances | | | 938,600 | | | | 25,650,758 | | |
| Takata Corp. (Japan) | | Manufactures & Distributes
Automobile Parts & Safety
Equipment | | | 705,100 | | | | 18,783,925 | | |
Autoliv, Inc.
(United States) | | Develops & Manufactures
Automotive Safety Systems | | | 90,500 | | | | 6,068,025 | | |
| | | | 88,366,398 | | |
| Broadcasting—1.9% | |
Media Prima Berhad
(Malaysia) | | Film Producer & Sports Promoter | | | 35,158,400 | | | | 30,757,144 | | |
| Building Products—1.6% | |
Kaba Holding AG
(Switzerland) | | Provides Mechanical & Electronic
Security Systems | | | 68,200 | | | | 26,367,342 | | |
OAKMARK INTERNATIONAL SMALL CAP FUND
53
OAKMARK INTERNATIONAL SMALL CAP FUND
Schedule of Investments—March 31, 2012 (Unaudited) cont.
| Name | | Description | | Shares Held | | Value | |
| Common Stocks—95.7% (cont.) | |
| Computer Hardware—0.9% | |
Wincor Nixdorf AG
(Germany) | | Banking Machines & Cash
Registers Manufacturer | | | 307,500 | | | $ | 15,129,055 | | |
| Construction & Farm Machinery & Heavy Trucks—1.3% | |
Bucher Industries AG
(Switzerland) | | Manufactures Food Processing
Machinery, Vehicles, &
Hydraulic Components | | | 95,200 | | | | 20,174,765 | | |
| Construction Materials—1.9% | |
Titan Cement Co. SA
(Greece) | | Cement & Building Materials
Producer & Distributor | | | 1,602,500 | | | | 29,600,964 | | |
| Data Processing & Outsourced Services—0.9% | |
| TKC Corp. (Japan) | | Accounting, Tax & Law Database
Consulting Services | | | 657,300 | | | | 14,341,957 | | |
| Department Stores—2.6% | |
Myer Holdings, Ltd.
(Australia) | | Department Store Operator | | | 17,418,400 | | | | 42,220,257 | | |
| Distillers & Vintners—0.9% | |
Treasury Wine Estates, Ltd.
(Australia) | | International Marketing &
Distribution of Wine | | | 3,460,100 | | | | 14,694,989 | | |
| Diversified Support Services—2.7% | |
gategroup Holding AG
(Switzerland) (a) | | Airlines Service Provider | | | 1,192,282 | | | | 43,718,328 | | |
| Drug Retail—2.9% | |
Sugi Holdings Co., Ltd.
(Japan) | | Drug Store Operator | | | 1,533,600 | | | | 46,895,513 | | |
| Electrical Components & Equipment—2.3% | |
| Prysmian SpA (Italy) | | Develops, Designs, Produces,
Supplies & Installs Cable | | | 2,109,200 | | | | 37,075,858 | | |
| Electronic Components—3.2% | |
Hirose Electric Co., Ltd.
(Japan) | | Develops & Sells Electronic
Equipment | | | 491,200 | | | | 51,570,956 | | |
| Electronic Equipment & Instruments—2.4% | |
Orbotech, Ltd.
(Israel) (a) (b) | | Optical Inspection Systems | | | 3,337,600 | | | | 38,682,784 | | |
OAKMARK INTERNATIONAL SMALL CAP FUND
54
OAKMARK INTERNATIONAL SMALL CAP FUND
Schedule of Investments—March 31, 2012 (Unaudited) cont.
| Name | | Description | | Shares Held | | Value | |
| Common Stocks—95.7% (cont.) | |
| Fertilizers & Agricultural Chemicals—2.8% | |
Incitec Pivot, Ltd.
(Australia) | | Fertilizer Manufacturer & Supplier | | | 13,730,500 | | | $ | 44,801,614 | | |
| Food Retail—0.3% | |
| Lawson, Inc. (Japan) | | Convenience Store Operator | | | 81,900 | | | | 5,155,237 | | |
| Health Care Services—1.6% | |
Primary Health Care, Ltd.
(Australia) | | Health Care Service Provider | | | 8,614,500 | | | | 25,520,717 | | |
| Home Entertainment Software—2.8% | |
Square Enix Holdings
Co., Ltd. (Japan) | | Develops & Sells Entertainment
Software for Video Game
Consoles | | | 2,136,100 | | | | 44,853,713 | | |
| Home Furnishing Retail—0.3% | |
Fourlis Holdings SA
(Greece) (a) | | Home Furnishing Retail and
Wholesales Electric &
Electronic Appliances | | | 2,314,296 | | | | 4,228,609 | | |
| Home Improvement Retail—2.0% | |
Carpetright PLC
(United Kingdom) (a) | | Carpet Retailer | | | 2,917,700 | | | | 31,991,352 | | |
| Human Resource & Employment Services—3.4% | |
Pasona Group, Inc.
(Japan) (b) | | Placement Service Provider | | | 32,040 | | | | 28,141,935 | | |
Michael Page
International PLC
(United Kingdom) | | Recruitment Consultancy Services | | | 2,770,508 | | | | 21,270,865 | | |
SThree PLC
(United Kingdom) | | Communication & Technology
Staffing Services | | | 599,488 | | | | 3,217,048 | | |
Brunel International NV
(Netherlands) | | Recruitment, Temporary
Employment, Secondment &
Contracting Services | | | 27,167 | | | | 1,197,126 | | |
| | | | 53,826,974 | | |
| Industrial Conglomerates—2.6% | |
Rheinmetall AG
(Germany) | | Automotive Pump Manufacturer | | | 689,500 | | | | 40,825,017 | | |
OAKMARK INTERNATIONAL SMALL CAP FUND
55
OAKMARK INTERNATIONAL SMALL CAP FUND
Schedule of Investments—March 31, 2012 (Unaudited) cont.
| Name | | Description | | Shares Held | | Value | |
| Common Stocks—95.7% (cont.) | |
| Industrial Machinery—5.2% | |
Interpump Group SpA
(Italy) (b) | | Pump & Piston Manufacturer | | | 4,613,000 | | | $ | 39,344,320 | | |
| Duerr AG (Germany) | | Automotive Industry Machinery
Manufacturer | | | 366,400 | | | | 23,324,102 | | |
Burckhardt Compression
Holding AG
(Switzerland) | | Manufactures Reciprocating
Compressors | | | 73,837 | | | | 20,244,442 | | |
Interpump Group SpA,
Warrants (Italy) (a) (b) | | Pump & Piston Manufacturer | | | 848,916 | | | | 901,117 | | |
| | | | 83,813,981 | | |
| Investment Banking & Brokerage—0.9% | |
Ichiyoshi Securities
Co., Ltd. (Japan) | | Stock Broker | | | 2,057,800 | | | | 14,469,489 | | |
| IT Consulting & Other Services—5.3% | |
| Atea ASA (Norway) | | Management & IT Consulting
Services | | | 4,163,500 | | | | 50,263,949 | | |
| Alten, Ltd. (France) | | Consulting & Engineering Services | | | 778,700 | | | | 24,800,620 | | |
Altran Technologies SA
(France) (a) | | Engineering & Technology
Consulting Company | | | 1,697,400 | | | | 10,617,324 | | |
| | | | 85,681,893 | | |
| Life Sciences Tools & Services—0.3% | |
Tecan Group AG
(Switzerland) (a) | | Manufactures & Distributes
Laboratory Automation
Components & Systems | | | 66,900 | | | | 4,928,382 | | |
| Motorcycle Manufacturers—1.8% | |
Yamaha Motor Co., Ltd.
(Japan) | | Motorcycle Manufacturer | | | 2,121,200 | | | | 28,421,056 | | |
| Office Electronics—2.2% | |
Konica Minolta
Holdings, Inc. (Japan) | | Manufactures Photo Films for
Medical, Printing, Office &
General Use | | | 3,667,700 | | | | 32,037,539 | | |
| Neopost SA (France) | | Mailroom Equipment Supplier | | | 46,500 | | | | 2,990,461 | | |
| | | | 35,028,000 | | |
| Oil & Gas Equipment & Services—0.2% | |
| Fugro NV (Netherlands) | | Collector, Processor & Interpreter
of Geological Data | | | 35,500 | | | | 2,529,241 | | |
OAKMARK INTERNATIONAL SMALL CAP FUND
56
OAKMARK INTERNATIONAL SMALL CAP FUND
Schedule of Investments—March 31, 2012 (Unaudited) cont.
| Name | | Description | | Shares Held | | Value | |
| Common Stocks—95.7% (cont.) | |
| Packaged Foods & Meats—3.3% | |
Goodman Fielder, Ltd.
(Australia) | | Produces Food Products | | | 57,804,082 | | | $ | 41,314,676 | | |
Alaska Milk Corp.
(Philippines) | | Milk Producer | | | 20,090,000 | | | | 10,949,249 | | |
Binggrae Co., Ltd.
(South Korea) | | Dairy Products Manufacturer | | | 25,490 | | | | 1,273,319 | | |
| | | | 53,537,244 | | |
| Photographic Products—1.4% | |
Vitec Group PLC
(United Kingdom) (b) | | Photo Equipment & Supplies | | | 2,145,559 | | | | 23,113,332 | | |
| Real Estate Services—2.9% | |
LSL Property Services PLC
(United Kingdom) (b) | | Residential Property Service
Provider | | | 10,375,000 | | | | 45,635,762 | | |
| Research & Consulting Services—0.2% | |
| Cision AB (Sweden) (a) | | Business & Communication
Intelligence | | | 627,820 | | | | 3,416,294 | | |
| Soft Drinks—1.5% | |
Britvic PLC
(United Kingdom) | | Soft Drink Manufacturer &
Marketer | | | 3,975,000 | | | | 24,459,289 | | |
| Specialty Chemicals—5.5% | |
Kansai Paint Co., Ltd.
(Japan) | | Manufactures & Sells a Wide
Range of Paints & Related
Products | | | 3,760,100 | | | | 37,932,626 | | |
Taiyo Ink Manufacturing
Co., Ltd. (Japan) | | Manufactures & Sells Resist Inks | | | 970,700 | | | | 26,035,448 | | |
| Sika AG (Switzerland) | | Manufactures Construction Materials | | | 11,450 | | | | 24,784,868 | | |
| | | | 88,752,942 | | |
| Specialty Stores—0.3% | |
JJB Sports PLC
(United Kingdom) (a) (b) | | Sportswear & Sports Equipment
Retailer | | | 29,284,528 | | | | 4,684,063 | | |
JJB Sports PLC, Warrants
(United Kingdom) (a) (b) | | Sportswear & Sports Equipment
Retailer | | | 2,474,255 | | | | 0 | | |
| | | | 4,684,063 | | |
OAKMARK INTERNATIONAL SMALL CAP FUND
57
OAKMARK INTERNATIONAL SMALL CAP FUND
Schedule of Investments—March 31, 2012 (Unaudited) cont.
| Name | | Description | | Shares Held/
Par Value | | Value | |
| Common Stocks—95.7% (cont.) | |
| Technology Distributors—1.6% | |
Premier Farnell PLC
(United Kingdom) | | Distributes Electronic
Components & Equipment | | | 7,602,900 | | | $ | 26,097,175 | | |
| Trading Companies & Distributors—2.4% | |
Travis Perkins PLC
(United Kingdom) | | Markets & Distributes Products
to the UK Construction &
Building Trade Industry | | | 1,954,000 | | | | 33,723,334 | | |
Bunzl PLC
(United Kingdom) | | Outsourcing Solutions &
Service Oriented Distribution | | | 256,700 | | | | 4,122,343 | | |
| | | | 37,845,677 | | |
| Total Common Stocks (Cost: $1,451,905,919) | | | | | | $ | 1,536,247,517 | | |
| Short Term Investment—2.9% | |
| Repurchase Agreement—2.9% | |
Fixed Income Clearing Corp. Repurchase Agreement,
0.01% dated 3/30/2012 due 4/02/2012, repurchase
price $46,439,519 collateralized by a United States
Treasury Note, with a rate of 1.250%, with a
maturity of 3/15/2014, and with a fair value
plus accrued interest of $47,369,853 (Cost: $46,439,480) | | $ | 46,439,480 | | | $ | 46,439,480 | | |
| Total Short Term Investment (Cost: $46,439,480) | | | | $ | 46,439,480 | | |
| Total Investments (Cost: $1,498,345,399)—98.6% | | | | | 1,582,686,997 | | |
| Foreign Currencies (Cost: $562,485)—0.1% | | | | | 563,658 | | |
| Other Assets In Excess of Liabilities—1.3% | | | | | 21,660,349 | | |
| Total Net Assets—100% | | | | $ | 1,604,911,004 | | |
(a) Non-income producing security
(b) See Note 5 in the Notes to the Financial Statements regarding investments in affiliated issuers.
See accompanying Notes to Financial Statements.
OAKMARK INTERNATIONAL SMALL CAP FUND
58

(This page has been intentionally left blank.)
THE OAKMARK FUNDS
59
THE OAKMARK FUNDS
Statements of Assets and Liabilities—March 31, 2012 (Unaudited)
| | | | | Oakmark
Fund | | Oakmark
Select
Fund | | Oakmark
Equity and
Income Fund | |
| Assets | |
| Investments in unaffiliated securities, at value | | | (a) | | | $ | 5,971,461,023 | | | $ | 3,135,233,655 | | | $ | 18,743,477,206 | | |
| Investments in affiliated securities, at value | | | (b) | | | | 0 | | | | 0 | | | | 1,560,810,858 | | |
| Foreign currency, at value | | | (c) | | | | 0 | | | | 0 | | | | 0 | | |
| Receivable for: | |
| Securities sold | | | | | | | 6,157,691 | | | | 0 | | | | 0 | | |
| Fund shares sold | | | | | | | 21,720,946 | | | | 12,471,126 | | | | 26,756,798 | | |
| Dividends and interest from unaffiliated securities (Net of foreign tax withheld) | | | | | | | 8,603,418 | | | | 2,120,084 | | | | 41,255,692 | | |
| Dividends and interest from affiliated securities (Net of foreign tax withheld) | | | | | | | 0 | | | | 0 | | | | 2,414,106 | | |
| Forward foreign currency contracts | | | | | | | 0 | | | | 0 | | | | 0 | | |
| Tax reclaim from unaffiliated securities | | | | | | | 0 | | | | 0 | | | | 0 | | |
| Total receivables | | | | | | | 36,482,055 | | | | 14,591,210 | | | | 70,426,596 | | |
| Other assets | | | | | | | 48,722 | | | | 37,182 | | | | 115,413 | | |
| Total assets | | | | | | $ | 6,007,991,800 | | | $ | 3,149,862,047 | | | $ | 20,374,830,073 | | |
| Liabilities and Net Assets | |
| Payable for: | |
| Securities purchased | | | | | | $ | 24,064,863 | | | $ | 31,072,600 | | | $ | 86,200,174 | | |
| Fund shares redeemed | | | | | | | 7,699,701 | | | | 2,337,614 | | | | 77,716,730 | | |
| Investment advisory fee | | | | | | | 272,196 | | | | 139,366 | | | | 718,828 | | |
| Other shareholder servicing fees | | | | | | | 489,946 | | | | 271,334 | | | | 2,983,709 | | |
| Transfer and dividend disbursing agent fees | | | | | | | 199,364 | | | | 124,571 | | | | 270,371 | | |
| Trustee fees | | | | | | | 3,253 | | | | 4,358 | | | | 15,406 | | |
| Deferred trustee compensation | | | | | | | 982,229 | | | | 864,853 | | | | 845,812 | | |
| Other | | | | | | | 399,352 | | | | 304,316 | | | | 2,043,424 | | |
| Total liabilities | | | | | | | 34,110,904 | | | | 35,119,012 | | | | 170,794,454 | | |
| Net assets applicable to Fund shares outstanding | | | | | | $ | 5,973,880,896 | | | $ | 3,114,743,035 | | | $ | 20,204,035,619 | | |
| Analysis of Net Assets | |
| Paid in capital | | | | | | $ | 4,132,037,155 | | | $ | 1,983,602,003 | | | $ | 15,948,260,651 | | |
Accumulated undistributed net realized gain (loss) on investments, forward
contracts, short sales and foreign currency transactions | | | | | | | 21,729,049 | | | | 38,601,648 | | | | 341,557,689 | | |
Net unrealized appreciation on investments, forward contracts,
and foreign currency translation | | | | | | | 1,810,585,711 | | | | 1,093,182,727 | | | | 3,890,706,665 | | |
| Accumulated undistributed net investment income | | | | | | | 9,528,981 | | | | (643,343 | ) | | | 23,510,614 | | |
| Net assets applicable to Fund shares outstanding | | | | | | $ | 5,973,880,896 | | | $ | 3,114,743,035 | | | $ | 20,204,035,619 | | |
| Price of Shares | |
| Net asset value, offering and redemption price per share: Class I | | | | | | $ | 47.71 | | | $ | 32.34 | | | $ | 29.19 | | |
| Class I—Net assets | | | | | | $ | 5,946,861,306 | | | $ | 3,103,209,723 | | | $ | 18,839,058,597 | | |
| Class I—Shares outstanding (Unlimited shares authorized) | | | | | | | 124,651,254 | | | | 95,942,487 | | | | 645,493,931 | | |
| Net asset value, offering and redemption price per share: Class II | | | | | | $ | 47.70 | | | $ | 32.27 | | | $ | 29.03 | | |
| Class II—Net assets | | | | | | $ | 27,019,590 | | | $ | 11,533,312 | | | $ | 1,364,977,022 | | |
| Class II—Shares outstanding (Unlimited shares authorized) | | | | | | | 566,489 | | | | 357,346 | | | | 47,019,202 | | |
| (a) Identified cost of investments in unaffiliated securities | | | | | | $ | 4,160,875,312 | | | $ | 2,042,046,824 | | | $ | 15,247,634,211 | | |
| (b) Identified cost of investments in affiliated securities | | | | | | | 0 | | | | 0 | | | | 1,165,919,301 | | |
| (c) Identified cost of foreign currency | | | | | | | 0 | | | | 0 | | | | 0 | | |
THE OAKMARK FUNDS
60
| | | Oakmark
Global
Fund | | Oakmark
Global Select
Fund | | Oakmark
International
Fund | | Oakmark
International
Small Cap Fund | |
| Assets | |
| Investments in unaffiliated securities, at value | | $ | 2,292,634,166 | | | $ | 539,284,474 | | | $ | 8,537,211,534 | | | $ | 1,465,542,453 | | |
| Investments in affiliated securities, at value | | | 0 | | | | 0 | | | | 49,908,685 | | | | 117,144,544 | | |
| Foreign currency, at value | | | 830,022 | | | | 0 | | | | 13,510,124 | | | | 563,658 | | |
| Receivable for: | |
| Securities sold | | | 2,340,267 | | | | 0 | | | | 7,951,395 | | | | 2,460,915 | | |
| Fund shares sold | | | 1,768,307 | | | | 1,530,825 | | | | 24,464,602 | | | | 4,111,301 | | |
| Dividends and interest from unaffiliated securities (Net of foreign tax withheld) | | | 4,644,830 | | | | 930,513 | | | | 18,499,615 | | | | 5,947,406 | | |
| Dividends and interest from affiliated securities (Net of foreign tax withheld) | | | 0 | | | | 0 | | | | 865,942 | | | | 970,249 | | |
| Forward foreign currency contracts | | | 23,157,011 | | | | 3,315,085 | | | | 59,295,102 | | | | 13,510,794 | | |
| Tax reclaim from unaffiliated securities | | | 814,016 | | | | 175,968 | | | | 7,947,566 | | | | 896,628 | | |
| Total receivables | | | 32,724,431 | | | | 5,952,391 | | | | 119,024,222 | | | | 27,897,293 | | |
| Other assets | | | 35,058 | | | | 27,731 | | | | 61,280 | | | | 32,332 | | |
| Total assets | | $ | 2,326,223,677 | | | $ | 545,264,596 | | | $ | 8,719,715,845 | | | $ | 1,611,180,280 | | |
| Liabilities and Net Assets | |
| Payable for: | |
| Securities purchased | | $ | 10,387,833 | | | $ | 1,817,254 | | | $ | 31,253,269 | | | $ | 3,765,719 | | |
| Fund shares redeemed | | | 3,632,171 | | | | 340,077 | | | | 10,759,415 | | | | 1,323,064 | | |
| Investment advisory fee | | | 122,037 | | | | 27,774 | | | | 403,086 | | | | 96,078 | | |
| Other shareholder servicing fees | | | 323,804 | | | | 51,950 | | | | 1,125,213 | | | | 330,820 | | |
| Transfer and dividend disbursing agent fees | | | 60,832 | | | | 20,852 | | | | 185,818 | | | | 59,044 | | |
| Trustee fees | | | 6,823 | | | | 4,295 | | | | 8,551 | | | | 5,638 | | |
| Deferred trustee compensation | | | 409,881 | | | | 12,905 | | | | 682,215 | | | | 392,206 | | |
| Other | | | 387,426 | | | | 111,370 | | | | 1,168,823 | | | | 296,707 | | |
| Total liabilities | | | 15,330,807 | | | | 2,386,477 | | | | 45,586,390 | | | | 6,269,276 | | |
| Net assets applicable to Fund shares outstanding | | $ | 2,310,892,870 | | | $ | 542,878,119 | | | $ | 8,674,129,455 | | | $ | 1,604,911,004 | | |
| Analysis of Net Assets | |
| Paid in capital | | $ | 2,161,521,056 | | | $ | 504,305,256 | | | $ | 8,604,768,344 | | | $ | 1,579,813,887 | | |
Accumulated undistributed net realized gain (loss) on investments, forward
contracts, short sales and foreign currency transactions | | | (179,877,744 | ) | | | (25,901,064 | ) | | | (670,239,139 | ) | | | (64,441,884 | ) | |
Net unrealized appreciation on investments, forward contracts,
and foreign currency translation | | | 346,876,710 | | | | 66,713,541 | | | | 724,632,271 | | | | 97,879,423 | | |
| Accumulated undistributed net investment income | | | (17,627,152 | ) | | | (2,239,614 | ) | | | 14,967,979 | | | | (8,340,422 | ) | |
| Net assets applicable to Fund shares outstanding | | $ | 2,310,892,870 | | | $ | 542,878,119 | | | $ | 8,674,129,455 | | | $ | 1,604,911,004 | | |
| Price of Shares | |
| Net asset value, offering and redemption price per share: Class I | | $ | 22.99 | | | $ | 12.36 | | | $ | 19.33 | | | $ | 14.36 | | |
| Class I—Net assets | | $ | 2,271,852,142 | | | $ | 542,878,119 | | | $ | 8,428,322,978 | | | $ | 1,602,497,047 | | |
| Class I—Shares outstanding (Unlimited shares authorized) | | | 98,806,030 | | | | 43,936,780 | | | | 436,127,823 | | | | 111,613,513 | | |
| Net asset value, offering and redemption price per share: Class II | | $ | 22.47 | | | $ | 0 | | | $ | 19.43 | | | $ | 14.29 | | |
| Class II—Net assets | | $ | 39,040,728 | | | $ | 0 | | | $ | 245,806,477 | | | $ | 2,413,957 | | |
| Class II—Shares outstanding (Unlimited shares authorized) | | | 1,737,236 | | | | 0 | | | | 12,649,701 | | | | 168,939 | | |
| (a) Identified cost of investments in unaffiliated securities | | $ | 1,969,043,216 | | | $ | 475,913,555 | | | $ | 7,850,895,593 | | | $ | 1,322,598,955 | | |
| (b) Identified cost of investments in affiliated securities | | | 0 | | | | 0 | | | | 71,383,556 | | | | 175,746,444 | | |
| (c) Identified cost of foreign currency | | | 834,813 | | | | 0 | | | | 13,509,855 | | | | 562,485 | | |
See accompanying Notes to Financial Statements.
THE OAKMARK FUNDS
61
THE OAKMARK FUNDS
Statements of Operations—March 31, 2012 (Unaudited)
| | | Oakmark
Fund | | Oakmark
Select
Fund | | Oakmark
Equity and
Income Fund | | Oakmark
Global
Fund | |
| Investment Income: | |
| Dividends from unaffiliated securities | | $ | 51,424,222 | | | $ | 16,522,490 | | | $ | 88,277,627 | | | $ | 15,290,071 | | |
| Dividends from affiliated securities | | | 0 | | | | 0 | | | | 8,574,803 | | | | 0 | | |
| Interest income | | | 44,059 | | | | 19,703 | | | | 37,216,596 | | | | 4,173 | | |
| Security lending income | | | 0 | | | | 72,169 | | | | 625,660 | | | | 1,460 | | |
| Foreign taxes withheld | | | (357,832 | ) | | | (201,419 | ) | | | (1,746,301 | ) | | | (524,796 | ) | |
| Total investment income | | | 51,110,449 | | | | 16,412,943 | | | | 132,948,385 | | | | 14,770,908 | | |
| Expenses: | |
| Investment advisory fee | | | 23,014,431 | | | | 11,931,219 | | | | 63,453,580 | | | | 10,453,869 | | |
| Transfer and dividend disbursing agent fees | | | 566,330 | | | | 315,128 | | | | 687,875 | | | | 259,117 | | |
| Other shareholder servicing fees | | | 2,733,474 | | | | 859,614 | | | | 8,635,973 | | | | 893,921 | | |
| Service fee—Class II | | | 33,486 | | | | 10,530 | | | | 1,683,170 | | | | 49,186 | | |
| Reports to shareholders | | | 270,405 | | | | 126,157 | | | | 551,259 | | | | 118,773 | | |
| Custody and accounting fees | | | 181,277 | | | | 98,797 | | | | 814,194 | | | | 234,449 | | |
| Registration and blue sky expenses | | | 99,907 | | | | 28,032 | | | | 106,419 | | | | 80,001 | | |
| Trustees fees | | | 257,724 | | | | 216,492 | | | | 368,180 | | | | 139,072 | | |
| Legal fees | | | 28,370 | | | | 23,035 | | | | 72,517 | | | | 22,878 | | |
| Audit fees | | | 19,416 | | | | 11,593 | | | | 47,616 | | | | 12,411 | | |
| Other | | | 161,152 | | | | 133,746 | | | | 312,450 | | | | 120,255 | | |
| Total expenses | | | 27,365,972 | | | | 13,754,343 | | | | 76,733,233 | | | | 12,383,932 | | |
| Net Investment Income (Loss) | | | 23,744,477 | | | | 2,658,600 | | | | 56,215,152 | | | | 2,386,976 | | |
| Net realized and unrealized gain (loss): | |
| Net realized gain (loss) on: | |
| Unaffiliated investments | | | 65,200,149 | | | | 52,885,362 | | | | 629,924,218 | | | | 25,421,040 | | |
| Affiliated investments | | | 0 | | | | 0 | | | | (44,249,370 | ) | | | 0 | | |
| Securities sold short | | | 1,275,647 | | | | 0 | | | | 0 | | | | 0 | | |
| Forward foreign currency contracts | | | 0 | | | | 0 | | | | 0 | | | | 20,362,141 | | |
| Foreign currency transactions | | | (4,879 | ) | | | 176 | | | | (990,715 | ) | | | (137,622 | ) | |
| Net realized gain (loss) | | | 66,470,917 | | | | 52,885,538 | | | | 584,684,133 | | | | 45,645,559 | | |
| Net change in unrealized appreciation (depreciation) on: | |
| Unaffiliated investments | | | 1,154,005,912 | | | | 561,998,914 | | | | 1,968,031,563 | | | | 367,834,728 | | |
| Affiliated investments | | | 0 | | | | 0 | | | | 451,386,040 | | | | 0 | | |
| Securities sold short | | | (1,423,654 | ) | | | 0 | | | | 0 | | | | 0 | | |
| Forward foreign currency contracts | | | 0 | | | | 0 | | | | 0 | | | | (769,089 | ) | |
| Foreign currency translation | | | 21,706 | | | | 25,682 | | | | 562,287 | | | | (86,170 | ) | |
| Net change in unrealized appreciation (depreciation) | | | 1,152,603,964 | | | | 562,024,596 | | | | 2,419,979,890 | | | | 366,979,469 | | |
| Net realized and unrealized gain | | | 1,219,074,881 | | | | 614,910,134 | | | | 3,004,664,023 | | | | 412,625,028 | | |
| Net increase in net assets resulting from operations | | $ | 1,242,819,358 | | | $ | 617,568,734 | | | $ | 3,060,879,175 | | | $ | 415,012,004 | | |
THE OAKMARK FUNDS
62
| | | Oakmark
Global Select
Fund | | Oakmark
International
Fund | | Oakmark
International
Small Cap Fund | |
| Investment Income: | |
| Dividends from unaffiliated securities | | $ | 2,767,254 | | | $ | 56,682,204 | | | $ | 12,870,397 | | |
| Dividends from affiliated securities | | | 0 | | | | 864,102 | | | | 970,249 | | |
| Interest income | | | 3,083 | | | | 32,095 | | | | 8,017 | | |
| Security lending income | | | 562 | | | | 131,851 | | | | 54,961 | | |
| Foreign taxes withheld | | | (91,395 | ) | | | (2,499,058 | ) | | | (866,247 | ) | |
| Total investment income | | | 2,679,504 | | | | 55,211,194 | | | | 13,037,377 | | |
| Expenses: | |
| Investment advisory fee | | | 2,347,778 | | | | 33,966,328 | | | | 8,092,175 | | |
| Transfer and dividend disbursing agent fees | | | 83,863 | | | | 600,113 | | | | 165,520 | | |
| Other shareholder servicing fees | | | 196,275 | | | | 3,681,852 | | | | 999,661 | | |
| Service fee—Class II | | | 0 | | | | 242,957 | | | | 2,438 | | |
| Reports to shareholders | | | 31,654 | | | | 349,319 | | | | 111,169 | | |
| Custody and accounting fees | | | 52,745 | | | | 1,229,867 | | | | 289,799 | | |
| Registration and blue sky expenses | | | 38,257 | | | | 102,556 | | | | 38,627 | | |
| Trustees fees | | | 57,338 | | | | 234,452 | | | | 129,336 | | |
| Legal fees | | | 17,325 | | | | 38,858 | | | | 21,506 | | |
| Audit fees | | | 9,113 | | | | 26,519 | | | | 11,007 | | |
| Other | | | 91,132 | | | | 192,160 | | | | 99,227 | | |
| Total expenses | | | 2,925,480 | | | | 40,664,981 | | | | 9,960,465 | | |
| Net Investment Income (Loss) | | | (245,976 | ) | | | 14,546,213 | | | | 3,076,912 | | |
| Net realized and unrealized gain (loss): | |
| Net realized gain (loss) on: | |
| Unaffiliated investments | | | (2,774,619 | ) | | | (207,078,110 | ) | | | (56,264,182 | ) | |
| Affiliated investments | | | 0 | | | | 0 | | | | 1,170,479 | | |
| Securities sold short | | | 0 | | | | 0 | | | | 0 | | |
| Forward foreign currency contracts | | | 3,991,089 | | | | 145,348,191 | | | | 18,129,712 | | |
| Foreign currency transactions | | | (15,748 | ) | | | (929,165 | ) | | | 178,379 | | |
| Net realized gain (loss) | | | 1,200,722 | | | | (62,659,084 | ) | | | (36,785,612 | ) | |
| Net change in unrealized appreciation (depreciation) on: | |
| Unaffiliated investments | | | 100,603,325 | | | | 1,578,557,464 | | | | 363,223,416 | | |
| Affiliated investments | | | 0 | | | | 2,593,132 | | | | (3,193,613 | ) | |
| Securities sold short | | | 0 | | | | 0 | | | | 0 | | |
| Forward foreign currency contracts | | | (417,799 | ) | | | (84,149,660 | ) | | | (12,324,217 | ) | |
| Foreign currency translation | | | 13,598 | | | | 532,564 | | | | (24,512 | ) | |
| Net change in unrealized appreciation (depreciation) | | | 100,199,124 | | | | 1,497,533,500 | | | | 347,681,074 | | |
| Net realized and unrealized gain | | | 101,399,846 | | | | 1,434,874,416 | | | | 310,895,462 | | |
| Net increase in net assets resulting from operations | | $ | 101,153,870 | | | $ | 1,449,420,629 | | | $ | 313,972,374 | | |
See accompanying Notes to Financial Statements.
THE OAKMARK FUNDS
63
THE OAKMARK FUNDS
Statements of Changes in Net Assets
| | | Oakmark Fund | |
| | | Six Months Ended
March 31, 2012
(Unaudited) | | Year Ended
September 30, 2011 | |
| From Operations: | |
| Net investment income | | $ | 23,744,477 | | | $ | 33,665,427 | | |
| Net realized gain (loss) | | | 66,470,917 | | | | (36,454,236 | ) | |
| Net change in unrealized appreciation (depreciation) | | | 1,152,603,964 | | | | (186,383,531 | ) | |
| Net increase (decrease) in net assets from operations | | | 1,242,819,358 | | | | (189,172,340 | ) | |
| Distributions to shareholders from: | |
| Net investment income—Class I | | | (41,985,842 | ) | | | (22,582,755 | ) | |
| Net investment income—Class II | | | (144,579 | ) | | | (34,133 | ) | |
| Total distributions to shareholders | | | (42,130,421 | ) | | | (22,616,888 | ) | |
| From Fund share transactions: | |
| Proceeds from shares sold—Class I | | | 740,476,569 | | | | 1,965,177,995 | | |
| Proceeds from shares sold—Class II | | | 4,088,987 | | | | 24,073,316 | | |
| Reinvestment of distributions—Class I | | | 39,448,651 | | | | 21,103,478 | | |
| Reinvestment of distributions—Class II | | | 104,166 | | | | 26,751 | | |
| Payment for shares redeemed—Class I | | | (539,612,217 | ) | | | (684,172,073 | ) | |
| Payment for shares redeemed—Class II | | | (8,538,072 | ) | | | (5,799,257 | ) | |
| Redemption fees—Class I | | | 532 | | | | 256,830 | | |
| Redemption fees—Class II | | | 3 | | | | 1,135 | | |
Net increase in net assets from Fund
share transactions | | | 235,968,619 | | | | 1,320,668,175 | | |
| Total increase in net assets | | | 1,436,657,556 | | | | 1,108,878,947 | | |
| Net assets: | |
| Beginning of period | | | 4,537,223,340 | | | | 3,428,344,393 | | |
| End of period | | $ | 5,973,880,896 | | | $ | 4,537,223,340 | | |
| Accumulated undistributed net investment income | | $ | 9,528,981 | | | $ | 27,919,804 | | |
| Fund Share Transactions—Class I: | |
| Shares sold | | | 16,910,768 | | | | 46,047,779 | | |
| Shares issued in reinvestment of dividends | | | 976,210 | | | | 514,343 | | |
| Less shares redeemed | | | (12,405,856 | ) | | | (16,531,264 | ) | |
| Net increase in shares outstanding | | | 5,481,122 | | | | 30,030,858 | | |
| Fund Share Transactions—Class II: | |
| Shares sold | | | 96,669 | | | | 555,451 | | |
| Shares issued in reinvestment of dividends | | | 2,576 | | | | 651 | | |
| Less shares redeemed | | | (185,847 | ) | | | (138,452 | ) | |
| Net increase (decrease) in shares outstanding | | | (86,602 | ) | | | 417,650 | | |
THE OAKMARK FUNDS
64
| | | Oakmark Select Fund | |
| | | Six Months Ended
March 31, 2012
(Unaudited) | | Year Ended
September 30, 2011 | |
| From Operations: | |
| Net investment income | | $ | 2,658,600 | | | $ | 3,883,431 | | |
| Net realized gain (loss) | | | 52,885,538 | | | | (3,827,934 | ) | |
| Net change in unrealized appreciation (depreciation) | | | 562,024,596 | | | | 2,168,152 | | |
| Net increase in net assets from operations | | | 617,568,734 | | | | 2,223,649 | | |
| Distributions to shareholders from: | |
| Net investment income—Class I | | | (5,125,035 | ) | | | (5,174,394 | ) | |
| Total distributions to shareholders | | | (5,125,035 | ) | | | (5,174,394 | ) | |
| From Fund share transactions: | |
| Proceeds from shares sold—Class I | | | 420,007,242 | | | | 283,427,182 | | |
| Proceeds from shares sold—Class II | | | 3,390,159 | | | | 3,799,084 | | |
| Reinvestment of distributions—Class I | | | 4,977,786 | | | | 5,034,971 | | |
| Payment for shares redeemed—Class I | | | (198,643,911 | ) | | | (426,787,670 | ) | |
| Payment for shares redeemed—Class II | | | (2,160,364 | ) | | | (4,089,100 | ) | |
| Redemption fees—Class I | | | 34 | | | | 114,686 | | |
| Redemption fees—Class II | | | 0 | | | | 577 | | |
Net increase (decrease) in net assets from Fund
share transactions | | | 227,570,946 | | | | (138,500,270 | ) | |
| Total increase (decrease) in net assets | | | 840,014,645 | | | | (141,451,015 | ) | |
| Net assets: | |
| Beginning of period | | | 2,274,728,390 | | | | 2,416,179,405 | | |
| End of period | | $ | 3,114,743,035 | | | $ | 2,274,728,390 | | |
| Accumulated undistributed net investment income (loss) | | $ | (643,343 | ) | | $ | 1,822,916 | | |
| Fund Share Transactions—Class I: | |
| Shares sold | | | 13,712,834 | | | | 10,007,357 | | |
| Shares issued in reinvestment of dividends | | | 183,954 | | | | 184,906 | | |
| Less shares redeemed | | | (6,849,819 | ) | | | (15,219,170 | ) | |
| Net increase (decrease) in shares outstanding | | | 7,046,969 | | | | (5,026,907 | ) | |
| Fund Share Transactions—Class II: | |
| Shares sold | | | 114,047 | | | | 133,219 | | |
| Less shares redeemed | | | (70,511 | ) | | | (144,923 | ) | |
| Net increase (decrease) in shares outstanding | | | 43,536 | | | | (11,704 | ) | |
See accompanying Notes to Financial Statements.
THE OAKMARK FUNDS
65
THE OAKMARK FUNDS
Statements of Changes in Net Assets
| | | Oakmark
Equity and Income Fund | |
| | | Six Months Ended
March 31, 2012
(Unaudited) | | Year Ended
September 30, 2011 | |
| From Operations: | |
| Net investment income | | $ | 56,215,152 | | | $ | 177,519,055 | | |
| Net realized gain (loss) | | | 584,684,133 | | | | 469,074,786 | | |
| Net change in unrealized appreciation (depreciation) | | | 2,419,979,890 | | | | (761,486,341 | ) | |
| Net increase (decrease) in net assets from operations | | | 3,060,879,175 | | | | (114,892,500 | ) | |
| Distributions to shareholders from: | |
| Net investment income—Class I | | | (237,259,979 | ) | | | (145,543,160 | ) | |
| Net investment income—Class II | | | (13,395,743 | ) | | | (6,971,784 | ) | |
| Net realized gain—Class I | | | (297,451,431 | ) | | | 0 | | |
| Net realized gain—Class II | | | (22,216,064 | ) | | | 0 | | |
| Total distributions to shareholders | | | (570,323,217 | ) | | | (152,514,944 | ) | |
| From Fund share transactions: | |
| Proceeds from shares sold—Class I | | | 1,264,735,872 | | | | 2,961,969,525 | | |
| Proceeds from shares sold—Class II | | | 153,208,152 | | | | 393,186,367 | | |
| Reinvestment of distributions—Class I | | | 505,763,411 | | | | 137,137,940 | | |
| Reinvestment of distributions—Class II | | | 31,535,508 | | | | 6,154,812 | | |
| Payment for shares redeemed—Class I | | | (1,690,611,937 | ) | | | (3,401,767,587 | ) | |
| Payment for shares redeemed—Class II | | | (204,375,929 | ) | | | (439,919,905 | ) | |
Net increase (decrease) in net assets from Fund
share transactions | | | 60,255,077 | | | | (343,238,848 | ) | |
| Total increase (decrease) in net assets | | | 2,550,811,035 | | | | (610,646,292 | ) | |
| Net assets: | |
| Beginning of period | | | 17,653,224,584 | | | | 18,263,870,876 | | |
| End of period | | $ | 20,204,035,619 | | | $ | 17,653,224,584 | | |
| Accumulated undistributed net investment income | | $ | 23,510,614 | | | $ | 235,948,814 | | |
| Fund Share Transactions—Class I: | |
| Shares sold | | | 45,581,389 | | | | 105,750,543 | | |
| Shares issued in reinvestment of dividends | | | 19,186,776 | | | | 4,990,464 | | |
| Less shares redeemed | | | (60,891,817 | ) | | | (122,028,389 | ) | |
| Net increase (decrease) in shares outstanding | | | 3,876,348 | | | | (11,287,382 | ) | |
| Fund Share Transactions—Class II: | |
| Shares sold | | | 5,562,259 | | | | 14,107,601 | | |
| Shares issued in reinvestment of dividends | | | 1,201,353 | | | | 224,956 | | |
| Less shares redeemed | | | (7,379,995 | ) | | | (15,830,701 | ) | |
| Net decrease in shares outstanding | | | (616,383 | ) | | | (1,498,144 | ) | |
THE OAKMARK FUNDS
66
| | | Oakmark
Global Fund | |
| | | Six Months Ended
March 31, 2012
(Unaudited) | | Year Ended
September 30, 2011 | |
| From Operations: | |
| Net investment income | | $ | 2,386,976 | | | $ | 16,527,540 | | |
| Net realized gain (loss) | | | 45,645,559 | | | | 83,424,723 | | |
| Net change in unrealized appreciation (depreciation) | | | 366,979,469 | | | | (264,054,795 | ) | |
| Net increase (decrease) in net assets from operations | | | 415,012,004 | | | | (164,102,532 | ) | |
| Distributions to shareholders from: | |
| Net investment income—Class I | | | 0 | | | | (9,073,144 | ) | |
| Net investment income—Class II | | | 0 | | | | (7,416 | ) | |
| Total distributions to shareholders | | | 0 | | | | (9,080,560 | ) | |
| From Fund share transactions: | |
| Proceeds from shares sold—Class I | | | 296,345,350 | | | | 630,871,078 | | |
| Proceeds from shares sold—Class II | | | 2,534,928 | | | | 4,308,222 | | |
| Reinvestment of distributions—Class I | | | 0 | | | | 8,471,575 | | |
| Reinvestment of distributions—Class II | | | 0 | | | | 7,229 | | |
| Payment for shares redeemed—Class I | | | (249,198,374 | ) | | | (683,654,547 | ) | |
| Payment for shares redeemed—Class II | | | (7,516,477 | ) | | | (15,995,017 | ) | |
| Redemption fees—Class I | | | 237,564 | | | | 316,693 | | |
| Redemption fees—Class II | | | 4,516 | | | | 6,806 | | |
Net increase (decrease) in net assets from Fund
share transactions | | | 42,407,507 | | | | (55,667,961 | ) | |
| Total increase (decrease) in net assets | | | 457,419,511 | | | | (228,851,053 | ) | |
| Net assets: | |
| Beginning of period | | | 1,853,473,359 | | | | 2,082,324,412 | | |
| End of period | | $ | 2,310,892,870 | | | $ | 1,853,473,359 | | |
| Accumulated undistributed net investment loss | | $ | (17,627,152 | ) | | $ | (40,238,647 | ) | |
| Fund Share Transactions—Class I: | |
| Shares sold | | | 14,178,744 | | | | 28,497,901 | | |
| Shares issued in reinvestment of dividends | | | 0 | | | | 380,745 | | |
| Less shares redeemed | | | (11,948,867 | ) | | | (31,968,146 | ) | |
| Net increase (decrease) in shares outstanding | | | 2,229,877 | | | | (3,089,500 | ) | |
| Fund Share Transactions—Class II: | |
| Shares sold | | | 121,955 | | | | 196,953 | | |
| Shares issued in reinvestment of dividends | | | 0 | | | | 331 | | |
| Less shares redeemed | | | (372,119 | ) | | | (737,672 | ) | |
| Net decrease in shares outstanding | | | (250,164 | ) | | | (540,388 | ) | |
See accompanying Notes to Financial Statements.
THE OAKMARK FUNDS
67
THE OAKMARK FUNDS
Statements of Changes in Net Assets
| | | Oakmark
Global Select Fund | |
| | | Six Months Ended
March 31, 2012
(Unaudited) | | Year Ended
September 30, 2011 | |
| From Operations: | |
| Net investment income (loss) | | $ | (245,976 | ) | | $ | 1,408,335 | | |
| Net realized gain (loss) | | | 1,200,722 | | | | 10,732,985 | | |
| Net change in unrealized appreciation (depreciation) | | | 100,199,124 | | | | (40,606,088 | ) | |
| Net increase (decrease) in net assets from operations | | | 101,153,870 | | | | (28,464,768 | ) | |
| Distributions to shareholders from: | |
| Net investment income—Class I | | | 0 | | | | (809,546 | ) | |
| Total distributions to shareholders | | | 0 | | | | (809,546 | ) | |
| From Fund share transactions: | |
| Proceeds from shares sold—Class I | | | 105,311,980 | | | | 262,413,759 | | |
| Reinvestment of distributions—Class I | | | 0 | | | | 751,763 | | |
| Payment for shares redeemed—Class I | | | (85,784,126 | ) | | | (141,935,317 | ) | |
| Redemption fees—Class I | | | 149,706 | | | | 144,387 | | |
Net increase in net assets from Fund
share transactions | | | 19,677,560 | | | | 121,374,592 | | |
| Total increase in net assets | | | 120,831,430 | | | | 92,100,278 | | |
| Net assets: | |
| Beginning of period | | | 422,046,689 | | | | 329,946,411 | | |
| End of period | | $ | 542,878,119 | | | $ | 422,046,689 | | |
| Accumulated undistributed net investment loss | | $ | (2,239,614 | ) | | $ | (5,968,979 | ) | |
| Fund Share Transactions—Class I: | |
| Shares sold | | | 9,454,396 | | | | 22,858,820 | | |
| Shares issued in reinvestment of dividends | | | 0 | | | | 68,342 | | |
| Less shares redeemed | | | (7,890,701 | ) | | | (13,060,723 | ) | |
| Net increase in shares outstanding | | | 1,563,695 | | | | 9,866,439 | | |
THE OAKMARK FUNDS
68
| | | Oakmark
International Fund | |
| | | Six Months Ended
March 31, 2012
(Unaudited) | | Year Ended
September 30, 2011 | |
| From Operations: | |
| Net investment income | | $ | 14,546,213 | | | $ | 123,436,124 | | |
| Net realized gain (loss) | | | (62,659,084 | ) | | | 196,591,208 | | |
| Net change in unrealized appreciation (depreciation) | | | 1,497,533,500 | | | | (1,382,448,492 | ) | |
| Net increase (decrease) in net assets from operations | | | 1,449,420,629 | | | | (1,062,421,160 | ) | |
| Distributions to shareholders from: | |
| Net investment income—Class I | | | (52,873,986 | ) | | | (53,192,511 | ) | |
| Net investment income—Class II | | | (722,701 | ) | | | (937,788 | ) | |
| Total distributions to shareholders | | | (53,596,687 | ) | | | (54,130,299 | ) | |
| From Fund share transactions: | |
| Proceeds from shares sold—Class I | | | 1,217,067,734 | | | | 3,809,340,638 | | |
| Proceeds from shares sold—Class II | | | 56,316,687 | | | | 164,468,817 | | |
| Reinvestment of distributions—Class I | | | 47,135,476 | | | | 48,812,222 | | |
| Reinvestment of distributions—Class II | | | 431,711 | | | | 580,260 | | |
| Payment for shares redeemed—Class I | | | (1,111,674,013 | ) | | | (1,561,835,180 | ) | |
| Payment for shares redeemed—Class II | | | (56,478,960 | ) | | | (74,871,871 | ) | |
| Redemption fees—Class I | | | 730,832 | | | | 1,362,061 | | |
| Redemption fees—Class II | | | 21,656 | | | | 37,675 | | |
Net increase in net assets from Fund
share transactions | | | 153,551,123 | | | | 2,387,894,622 | | |
| Total increase in net assets | | | 1,549,375,065 | | | | 1,271,343,163 | | |
| Net assets: | |
| Beginning of period | | | 7,124,754,390 | | | | 5,853,411,227 | | |
| End of period | | $ | 8,674,129,455 | | | $ | 7,124,754,390 | | |
| Accumulated undistributed net investment income (loss) | | $ | 14,967,979 | | | $ | (90,383,158 | ) | |
| Fund Share Transactions—Class I: | |
| Shares sold | | | 68,663,074 | | | | 197,056,363 | | |
| Shares issued in reinvestment of dividends | | | 2,933,134 | | | | 2,534,383 | | |
| Less shares redeemed | | | (64,470,472 | ) | | | (84,545,042 | ) | |
| Net increase in shares outstanding | | | 7,125,736 | | | | 115,045,704 | | |
| Fund Share Transactions—Class II: | |
| Shares sold | | | 3,198,455 | | | | 8,494,854 | | |
| Shares issued in reinvestment of dividends | | | 26,698 | | | | 29,941 | | |
| Less shares redeemed | | | (3,182,125 | ) | | | (3,917,635 | ) | |
| Net increase in shares outstanding | | | 43,028 | | | | 4,607,160 | | |
See accompanying Notes to Financial Statements.
THE OAKMARK FUNDS
69
THE OAKMARK FUNDS
Statements of Changes in Net Assets
| | | Oakmark
International Small Cap Fund | |
| | | Six Months Ended
March 31, 2012
(Unaudited) | | Year Ended
September 30, 2011 | |
| From Operations: | |
| Net investment income | | $ | 3,076,912 | | | $ | 16,948,239 | | |
| Net realized gain (loss) | | | (36,785,612 | ) | | | 58,723,411 | | |
| Net change in unrealized appreciation (depreciation) | | | 347,681,074 | | | | (266,813,335 | ) | |
| Net increase (decrease) in net assets from operations | | | 313,972,374 | | | | (191,141,685 | ) | |
| Distributions to shareholders from: | |
| Net investment income—Class I | | | (1,698,070 | ) | | | (8,015,010 | ) | |
| Net investment income—Class II | | | 0 | | | | (4,287 | ) | |
| Net realized gain—Class I | | | (301,631 | ) | | | 0 | | |
| Net realized gain—Class II | | | (429 | ) | | | 0 | | |
| Total distributions to shareholders | | | (2,000,130 | ) | | | (8,019,297 | ) | |
| From Fund share transactions: | |
| Proceeds from shares sold—Class I | | | 187,774,849 | | | | 743,917,514 | | |
| Proceeds from shares sold—Class II | | | 504,890 | | | | 1,782,873 | | |
| Reinvestment of distributions—Class I | | | 1,827,192 | | | | 7,375,297 | | |
| Reinvestment of distributions—Class II | | | 148 | | | | 1,630 | | |
| Payment for shares redeemed—Class I | | | (227,160,280 | ) | | | (441,457,246 | ) | |
| Payment for shares redeemed—Class II | | | (440,044 | ) | | | (1,012,428 | ) | |
| Redemption fees—Class I | | | 122,184 | | | | 212,535 | | |
| Redemption fees—Class II | | | 174 | | | | 269 | | |
Net increase (decrease) in net assets from Fund
share transactions | | | (37,370,887 | ) | | | 310,820,444 | | |
| Total increase in net assets | | | 274,601,357 | | | | 111,659,462 | | |
| Net assets: | |
| Beginning of period | | | 1,330,309,647 | | | | 1,218,650,185 | | |
| End of period | | $ | 1,604,911,004 | | | $ | 1,330,309,647 | | |
| Accumulated undistributed net investment loss | | $ | (8,340,422 | ) | | $ | (28,027,026 | ) | |
| Fund Share Transactions—Class I: | |
| Shares sold | | | 14,716,192 | | | | 53,700,148 | | |
| Shares issued in reinvestment of dividends | | | 154,063 | | | | 528,317 | | |
| Less shares redeemed | | | (18,220,732 | ) | | | (32,752,861 | ) | |
| Net increase (decrease) in shares outstanding | | | (3,350,477 | ) | | | 21,475,604 | | |
| Fund Share Transactions—Class II: | |
| Shares sold | | | 39,258 | | | | 127,014 | | |
| Shares issued in reinvestment of dividends | | | 12 | | | | 117 | | |
| Less shares redeemed | | | (35,334 | ) | | | (72,669 | ) | |
| Net increase in shares outstanding | | | 3,936 | | | | 54,462 | | |
THE OAKMARK FUNDS
70
THE OAKMARK FUNDS
Notes to Financial Statements
1. SIGNIFICANT ACCOUNTING POLICIES
The following are the significant accounting policies of Oakmark Fund ("Oakmark"), Oakmark Select Fund ("Select"), Oakmark Equity and Income Fund ("Equity and Income"), Oakmark Global Fund ("Global"), Oakmark Global Select Fund ("Global Select"), Oakmark International Fund ("International"), and Oakmark International Small Cap Fund ("Int'l Small Cap"), collectively referred to as the "Funds," each a series of Harris Associates Investment Trust (the "Trust"), a Massachusetts business trust, organized on February 1, 1991, which is registered as an open-end management investment company under the Investment Company Act of 1940 (the "1940 Act"). Each Fund, other than Select and Global Select, is diversified in accordance with the 1940 Act. The following policies are in conformity with accounting principles generally accepted in the United States of America ("GAAP"). The presentation of financial statements in conformity with GAAP requires management to make estimates and assumptions that affect the reported amounts of assets and liabilities at the date of the financial statements and the reported amounts of revenues and expenses during the reporting period. Actual results could differ from those estimates and assumptions.
Class disclosure—
Each Fund offers two classes of shares: Class I Shares and Class II Shares. Class I Shares are offered to the general public. Class II Shares are offered to certain retirement plans such as 401(k) and profit sharing plans. Class II Shares pay a service fee at the annual rate of up to 0.25% of average net assets of Class II Shares of the Funds. This service fee is paid to a third-party administrator for performing the services associated with the administration of such retirement plans. Class I Shares do not have an associated service fee. Global Select had no outstanding Class II shares during the period ended March 31, 2012.
Income, realized and unrealized capital gains and losses, and expenses of the Funds not directly attributable to a specific class of shares are allocated to each class pro rata based on the relative net assets of each class. Transfer and dividend disbursing agent fees and other shareholder servicing fees are specific to each class.
Redemption fees—
Each Fund, other than Oakmark, Select, and Equity and Income, imposes a short-term trading fee on redemptions of shares held for 90 days or less to offset two types of costs to the Fund caused by short-term trading: portfolio transaction and market impact costs associated with erratic redemption activity and administrative costs associated with processing redemptions. The fee is 2% of the redemption value and is deducted from either the redemption proceeds or from the balance in the account. The "first-in, first-out" ("FIFO") method is used to determine the holding period. The Funds may approve the waiver of redemption fees on certain types of accounts held through intermediaries, pursuant to the Funds' policies and procedures.
Security valuation—
The Funds' share prices or net asset values ("NAVs") are calculated as of the close of regular session trading (usually 4:00 pm Eastern time) on the New York Stock Exchange ("NYSE") on any day on which the NYSE is open for trading. Equity securities principally traded on securities exchanges in the United States and over-the-counter securities are valued at the last sales price or the official closing price on the day of valuation, or lacking any reported sales that day, at the most recent bid quotation. Securities traded on the NASDAQ National Market are valued at the NASDAQ Official Closing Price ("NOCP"), or lacking an NOCP, at the most recent bid quotation on the NASDAQ National Market. Equity securities principally traded on securities exchanges outside the United States shall be valued, depending on local convention or regulation, at the last sales price, the last bid or asked price, the mean between the last bid and asked prices, or the official closing price, or shall be based on a pricing composite as of the close of the regular trading hours on the appropriate exchange or other designated time. Debt obligations and money market instruments maturing in more than 60 days from the date of purchase are valued at the latest bid quotation or at an evaluated price provided by an independent professional pricing service. The pricing service may use standard inputs such as benchmark yields, reported trades, broker/dealer quotes, issuer spreads, two-sided markets, benchmark securities, bids, offers, and reference data including market research publications. For certain security types additional inputs may be used or some of the standard inputs may not be applicable. Additionally, the pricing service monitors market indicators and industry and economic events, which may serve as a trigger to gather and possibly use additional market data. Debt obligations and money market instruments maturing in less than 61 days from the date of purchase are valued at amortized cost, which approximates fair value. Options are valued at the last reported sales price on the day of valuation or, lacking any reported sale price on the valuation date, at the mean of the most recent bid and asked quotations or, if the mean is not available, at the most recent bid quotation.
Securities for which quotations are not readily available or securities that may have been affected by a significant event occurring between the close of a foreign market and the close of the NYSE are valued at fair value, determined by or under the direction of the pricing committee authorized by the Board of Trustees. A significant event may include the performance of U.S. markets since the close of foreign markets. The Funds
THE OAKMARK FUNDS
71
THE OAKMARK FUNDS
Notes to Financial Statements (cont.)
may use a systematic fair valuation model provided by an independent professional pricing service to value foreign securities in order to adjust local closing prices for information or events that may occur between the close of certain foreign exchanges and the close of the NYSE. At March 31, 2012 Equity and Income held a security for which a market quotation was not readily available and which was valued by the pricing committee at a fair value determined in good faith in accordance with procedures established by the Board of Trustees.
Fair value measurement—
Various inputs are used in determining the value of each Fund's investments. These inputs are prioritized into three broad levels as follows:
Level 1—quoted prices in active markets for identical securities
Level 2—other significant observable inputs (including quoted prices for similar investments, interest rates, prepayment speeds, credit risk, and others)
Level 3—significant unobservable inputs (including the Funds' own assumptions in determining the fair value of investments)
Observable inputs are those based on market data obtained from independent sources, and unobservable inputs reflect the Funds' own assumptions based on the best information available. The input levels are not necessarily an indication of risk or liquidity associated with investing in those securities.
The Funds recognize transfers between level 1 and level 2 at the end of the reporting cycle. At the period ended March 31, 2012, there were transfers between level 2 and level 1 securities in the amount of $866,560,855, $190,029,923, $6,239,960,369 and $1,100,383,003 for Global, Global Select, International and Int'l Small Cap, respectively. The transfers were due to the fact that securities no longer were valued using a systematic fair valuation model due to the performance of the U.S. markets since the close of the foreign markets.
The following is a summary of the inputs used as of March 31, 2012 in valuing each Fund's assets and liabilities. Except for the industries or investment types separately stated below, the total amounts for common stocks, fixed-income and short-term investments in the table below are presented by industry or investment type in each Fund's Schedule of Investments. Information on forward foreign currency contracts is presented by contract in the notes following the below summary:
| | | Quoted Prices
in Active
Markets for
Identical
Assets
(Level 1) | | Other
Significant
Observable
Inputs
(Level 2) | | Significant
Unobservable
Inputs
(Level 3) | |
| Oakmark | | | | | | | | | | | | | |
| Common Stocks | | $ | 5,653,877,797 | | | $ | 0 | | | $ | 0 | | |
| Short Term Investments | | | 0 | | | | 317,583,226 | | | | 0 | | |
| Total | | $ | 5,653,877,797 | | | $ | 317,583,226 | | | $ | 0 | | |
| Select | | | | | | | | | | | | | |
| Common Stocks | | $ | 2,946,750,173 | | | $ | 0 | | | $ | 0 | | |
| Short Term Investments | | | 0 | | | | 188,483,482 | | | | 0 | | |
| Total | | $ | 2,946,750,173 | | | $ | 188,483,482 | | | $ | 0 | | |
| Equity and Income | | | | | | | | | | | | | |
| Common Stocks - Packaged Food & Meats | | $ | 0 | | | $ | 695,413,944 | | | $ | 0 | | |
| Common Stocks - All Other | | | 13,445,712,949 | | | | 0 | | | | 0 | | |
| Fixed Income | | | 0 | | | | 4,335,028,650 | | | | 0 | | |
| Short Term Investments | | | 0 | | | | 1,828,132,521 | | | | 0 | | |
| Total | | $ | 13,445,712,949 | | | $ | 6,858,575,115 | | | $ | 0 | | |
THE OAKMARK FUNDS
72
THE OAKMARK FUNDS
Notes to Financial Statements (cont.)
| | | Quoted Prices
in Active
Markets for
Identical
Assets
(Level 1) | | Other
Significant
Observable
Inputs
(Level 2) | | Significant
Unobservable
Inputs
(Level 3) | |
| Global | | | | | | | | | | | | | |
| Common Stocks | | $ | 2,251,313,998 | | | $ | 0 | | | $ | 0 | | |
| Short Term Investments | | | 0 | | | | 41,320,168 | | | | 0 | | |
| Forward Foreign Currency Contracts - Assets | | | 0 | | | | 28,823,382 | | | | 0 | | |
| Forward Foreign Currency Contracts - Liabilities | | | 0 | | | | (5,666,371 | ) | | | 0 | | |
| Total | | $ | 2,251,313,998 | | | $ | 64,477,179 | | | $ | 0 | | |
| Global Select | | | | | | | | | | | | | |
| Common Stocks | | $ | 517,113,555 | | | $ | 0 | | | $ | 0 | | |
| Short Term Investments | | | 0 | | | | 22,170,919 | | | | 0 | | |
| Forward Foreign Currency Contracts - Assets | | | 0 | | | | 4,843,264 | | | | 0 | | |
| Forward Foreign Currency Contracts - Liabilities | | | 0 | | | | (1,528,179 | ) | | | 0 | | |
| Total | | $ | 517,113,555 | | | $ | 25,486,004 | | | $ | 0 | | |
| International | | | | | | | | | | | | | |
| Common Stocks | | $ | 8,330,920,398 | | | $ | 0 | | | $ | 0 | | |
| Short Term Investments | | | 0 | | | | 256,199,821 | | | | 0 | | |
| Forward Foreign Currency Contracts - Assets | | | 0 | | | | 104,337,108 | | | | 0 | | |
| Forward Foreign Currency Contracts - Liabilities | | | 0 | | | | (45,042,006 | ) | | | 0 | | |
| Total | | $ | 8,330,920,398 | | | $ | 315,494,923 | | | $ | 0 | | |
| Int'l Small Cap | | | | | | | | | | | | | |
| Common Stocks | | $ | 1,535,346,400 | | | $ | 0 | | | $ | 0 | + | |
| Warrants | | | 901,117 | | | | 0 | | | | 0 | | |
| Short Term Investments | | | 0 | | | | 46,439,480 | | | | 0 | | |
| Forward Foreign Currency Contracts - Assets | | | 0 | | | | 27,258,066 | | | | 0 | | |
| Forward Foreign Currency Contracts - Liabilities | | | 0 | | | | (13,747,272 | ) | | | 0 | | |
| Total | | $ | 1,536,247,517 | | | $ | 59,950,274 | | | $ | 0 | | |
+ On September 30, 2011, Int'l Small Cap held a security classified as Level 3 within the Investment Banking and Brokerage category with a fair value of zero. During the period ended March 31, 2012, while still valued at zero, this security was disposed of, resulting in a realized loss of $24,294,661. The Funds had no other purchases or sales of Level 3 securities during the 6-month period ended March 31, 2012.
Foreign currency translations—
Certain Funds invest in foreign securities, which may involve a number of risk factors and special considerations not present with investments in securities of U.S. corporations. Values of investments and other assets and liabilities denominated in foreign currencies are translated into U.S. dollars at current exchange rates obtained by a recognized bank, dealer, or independent pricing service on the day of valuation. Purchases and sales of investments and dividend and interest income are converted at the prevailing rate of exchange on the respective dates of such transactions.
The Funds do not isolate that portion of the results of operations resulting from changes in foreign exchange rates on investments from the fluctuations arising from changes in market prices of securities held. Such fluctuations are included in net realized gain (loss) on investments and net change in unrealized appreciation (depreciation) on investments in the Statements of Operations. Net realized gains and losses on foreign currency transactions arising from the sale of foreign currencies, currency gains or losses realized between the trade and settlement dates on securities transactions and the difference between the amounts of dividends, interest, foreign withholding taxes and tax reclaims recorded and the U.S. dollar equivalent of the amounts actually received or paid are included in net realized gain (loss) on foreign currency transactions in the Statements of Operations. Unrealized gains and losses arising from changes in the fair value of assets and liabilities, other than investments in
THE OAKMARK FUNDS
73
THE OAKMARK FUNDS
Notes to Financial Statements (cont.)
securities, resulting from changes in exchange rates are included in net change in unrealized appreciation (depreciation) on foreign currency translation in the Statements of Operations.
Forward foreign currency contracts—
Forward foreign currency contracts are agreements to exchange one currency for another at a future date and at a specified price. The Funds' transactions in forward foreign currency contracts are limited to transaction and portfolio hedging. The contractual amounts of forward foreign currency contracts do not necessarily represent the amounts potentially subject to risk. The measurement of the risks associated with these instruments is meaningful only when all related and offsetting transactions are considered and could exceed the net unrealized value shown in the tables below. Risks arise from the possible inability of counterparties to meet the terms of their contracts and from movements in currency values. Forward foreign currency contracts are valued at the current day's interpolated foreign exchange rates. Unrealized gain or loss on the contracts as measured by the difference between the forward foreign exchange rates at the dates of entry into the contracts and the forward rates at the end of the period is included in the Statements of Assets and Liabilities. Realized gains and losses and the net change in unrealized appreciation (depreciation) on forward foreign currency contracts for the period are included in the Statements of Operations.
At March 31, 2012 Global, Global Select, International, and Int'l Small Cap held forward foreign currency contracts, which are considered derivative instruments under FASB ASC 815-10, each whose counterparty is State Street Corporation, as follows:
Oakmark Global Fund
| | | Contract
Amount | | Settlement
Date | | Valuation at
3/31/12 | | Unrealized
Appreciation/
(Depreciation) | |
| Foreign Currency Bought: | |
| Australian Dollar | | | 46,350,000 | | | 06/20/12 | | $ | 47,581,559 | | | $ | 2,903,091 | | |
| Japanese Yen | | | 2,180,000,000 | | | 09/19/12 | | | 26,388,942 | | | | (1,827,470 | ) | |
| | | | | | | $ | 73,970,501 | | | $ | 1,075,621 | | |
| Foreign Currency Sold: | |
| Australian Dollar | | | 76,900,000 | | | 06/20/12 | | $ | 78,943,299 | | | $ | (2,155,122 | ) | |
| Japanese Yen | | | 25,210,000,000 | | | 09/19/12 | | | 305,167,536 | | | | 25,920,291 | | |
| Swedish Krona | | | 58,500,000 | | | 09/19/12 | | | 8,785,620 | | | | (396,719 | ) | |
| Swiss Franc | | | 94,900,000 | | | 12/19/12 | | | 105,560,169 | | | | (1,287,060 | ) | |
| | | | | | | $ | 498,456,624 | | | $ | 22,081,390 | | |
During the period ended March 31, 2012 the proceeds from forward foreign currency contracts opened for Global were $112,662,011 and the cost to close contracts was $298,274,545.
Oakmark Global Select Fund
| | | Contract
Amount | | Settlement
Date | | Valuation at
3/31/12 | | Unrealized
Appreciation/
(Depreciation) | |
| Foreign Currency Bought: | |
| Japanese Yen | | | 1,390,000,000 | | | 09/19/12 | | $ | 16,825,977 | | | $ | (1,145,180 | ) | |
| | | | | | | $ | 16,825,977 | | | $ | (1,145,180 | ) | |
| Foreign Currency Sold: | |
| Japanese Yen | | | 4,690,000,000 | | | 09/19/12 | | $ | 56,772,540 | | | $ | 4,843,264 | | |
| Swiss Franc | | | 28,240,000 | | | 12/19/12 | | | 31,412,215 | | | | (382,999 | ) | |
| | | | | | | $ | 88,184,755 | | | $ | 4,460,265 | | |
During the period ended March 31, 2012 the proceeds from forward foreign currency contracts opened for Global Select were $31,029,216 and the cost to close contracts was $67,664,199.
THE OAKMARK FUNDS
74
THE OAKMARK FUNDS
Notes to Financial Statements (cont.)
Oakmark International Fund
| | | Contract
Amount | | Settlement
Date | | Valuation at
3/31/12 | | Unrealized
Appreciation/
(Depreciation) | |
| Foreign Currency Bought: | |
| Australian Dollar | | | 38,600,000 | | | 06/20/12 | | $ | 39,625,635 | | | $ | 3,778,793 | | |
| Japanese Yen | | | 38,800,000,000 | | | 09/19/12 | | | 469,674,748 | | | | (27,714,530 | ) | |
| | | | | | | $ | 509,300,383 | | | $ | (23,935,737 | ) | |
| Foreign Currency Sold: | |
| Australian Dollar | | | 256,700,000 | | | 06/20/12 | | $ | 263,520,739 | | | $ | (6,125,840 | ) | |
| Japanese Yen | | | 96,700,000,000 | | | 09/19/12 | | | 1,170,555,364 | | | | 99,426,770 | | |
| Swedish Krona | | | 265,000,000 | | | 09/19/12 | | | 39,798,108 | | | | (1,797,104 | ) | |
| Swiss Franc | | | 610,000,000 | | | 12/19/12 | | | 678,521,638 | | | | (8,272,987 | ) | |
| | | | | | | $ | 2,152,395,849 | | | $ | 83,230,839 | | |
During the period ended March 31, 2012 the proceeds from forward foreign currency contracts opened for International were $739,870,354 and the cost to close contracts was $2,174,646,821.
Oakmark Int'l Small Cap Fund
| | | Contract
Amount | | Settlement
Date | | Valuation at
3/31/12 | | Unrealized
Appreciation/
(Depreciation) | |
| Foreign Currency Bought: | |
| Australian Dollar | | | 70,200,000 | | | 06/20/12 | | $ | 72,065,274 | | | $ | 4,753,954 | | |
| Japanese Yen | | | 8,730,000,000 | | | 09/19/12 | | | 105,676,818 | | | | (6,490,579 | ) | |
| | | | | | | $ | 177,742,092 | | | $ | (1,736,625 | ) | |
| Foreign Currency Sold: | |
| Australian Dollar | | | 176,400,000 | | | 06/20/12 | | $ | 181,087,099 | | | $ | (4,452,775 | ) | |
| Japanese Yen | | | 21,415,000,000 | | | 09/19/12 | | | 259,228,988 | | | | 22,001,204 | | |
| Norwegian Krona | | | 157,500,000 | | | 09/19/12 | | | 27,475,489 | | | | (1,293,127 | ) | |
| Swedish Krona | | | 4,630,000 | | | 09/19/12 | | | 695,340 | | | | (31,399 | ) | |
| Swiss Franc | | | 72,000,000 | | | 12/19/12 | | | 80,087,800 | | | | (976,484 | ) | |
| | | | | | | $ | 548,574,716 | | | $ | 15,247,419 | | |
During the period ended March 31, 2012 the proceeds from forward foreign currency contracts opened for Int'l Small Cap were $120,011,265 and the cost to close contracts was $381,773,743.
Security transactions and investment income—
Security transactions are accounted for on the trade date (date the order to buy or sell is executed), and dividend income is recorded on the ex-dividend date. Interest income and expenses are recorded on an accrual basis. Bond discount is accreted and premium is amortized over the expected life of each applicable security using the yield to maturity method. Withholding taxes and tax reclaims on foreign dividends have been provided for in accordance with the Funds' understanding of the applicable country's tax rules and rates. Net realized gains and losses on investments are determined by the specific identification method.
THE OAKMARK FUNDS
75
THE OAKMARK FUNDS
Notes to Financial Statements (cont.)
Short sales—
Each Fund may sell a security it does not own in anticipation of a decline in the fair value of that security. When a Fund sells a security short, it must borrow the security sold short and deliver it to the broker-dealer through which it made the short sale. A gain, limited to the price at which the Fund sold the security short, or loss, unlimited in size, will be recognized upon the termination of the short sale. At March 31, 2012, none of the Funds had short sales.
When-issued or delayed-delivery securities—
Each Fund may purchase securities on a when-issued or delayed-delivery basis. Although the payment and interest terms of these securities are established at the time a Fund enters into the commitment, the securities may be delivered and paid for a month or more after the date of purchase, when their value may have changed. A Fund makes such commitments only with the intention of actually acquiring the securities, but may sell the securities before settlement date if the Adviser deems it advisable for investment reasons.
Accounting for options—
When a Fund writes an option, the premium received by the Fund is recorded as a liability and is subsequently adjusted to the current fair value of the option written. Premiums received from writing options that expire are recorded by the Fund on the expiration date as realized gains from option transactions. The difference between the premium and the amount paid on effecting a closing purchase transaction, including brokerage commissions, is also treated as a realized gain, or if the premium is less than the amount paid for the closing purchase transaction, as a realized loss. If a call option is exercised, the premium is added to the proceeds from the sale of the underlying security or currency in determining whether the Fund has realized a gain or a loss. If a put option is exercised, the premium reduces the cost basis of the security or currency purchased by the Fund. In writing an option, the Fund bears the market risk of an unfavorable change in the price of the security or currency underlying the written option. Exercise of an option written by the Fund could result in the Fund selling or buying a security or currency at a price different from the current fair value. Options written by the Fund do not give rise to counterparty credit risk, as they obligate the Fund, not its counterparties, to perform.
When a Fund purchases an option, the premium paid by the Fund is recorded as an asset and is subsequently adjusted to the current fair value of the option purchased. Purchasing call options tends to increase the Fund's exposure to the underlying instrument. Purchasing put options tends to decrease the Fund's exposure to the underlying instrument. Premiums paid for purchasing options that expire are treated as realized losses. Premiums paid for purchasing options that are exercised or closed are added to the amounts paid or offset against the proceeds on the underlying security to determine the realized gain or loss. The risks associated with purchasing put and call options are potential loss of the premium paid and, in the instances of OTC derivatives, the failure of the counterparty to honor its obligation under the contract.
The Funds did not write or purchase options during the period ended March 31, 2012.
Committed line of credit—
The Trust has an unsecured committed line of credit (the "Facility") with State Street Bank and Trust Company ("State Street") in the amount of $500 million. Borrowings under that arrangement bear interest at 1.25% above the greater of the Federal Funds Effective Rate or LIBOR, as defined in the credit agreement. To maintain the Facility, an annualized commitment fee of 0.10% on the unused portion is charged to the Trust. Fees and interest expense, if any, related to the Facility are included in other expenses in the Statements of Operations. There were no borrowings under the Facility during the six months ended March 31, 2012.
Expense offset arrangement—
State Street serves as custodian of the Funds. State Street's fee may be reduced by credits that are an earnings allowance calculated on the average daily cash balances each Fund maintains with State Street. Credit balances used to reduce the Funds' custodian fees, if any, are reported as a reduction of total expenses in the Statements of Operations. During the period ended March 31, 2012, none of the Funds received an expense offset credit.
Repurchase agreements—
Each Fund may invest in repurchase agreements, which are short-term investments whereby the Fund acquires ownership of a debt security and the seller agrees to repurchase the security at a future date at a specified price.
THE OAKMARK FUNDS
76
THE OAKMARK FUNDS
Notes to Financial Statements (cont.)
The Funds' custodian receives delivery of the underlying securities collateralizing repurchase agreements. It is the Funds' policy that the value of the collateral be at least equal to 102% of the repurchase price, including interest. Harris Associates L.P. (the "Adviser") is responsible for determining that the value of the collateral is at all times at least equal to 102% of the repurchase price, including interest. Repurchase agreements could involve certain risks in the event of default or insolvency of the counterparty, including possible delays or restrictions upon a Fund's ability to dispose of the underlying securities.
Security lending—
Each Fund, except Oakmark, may lend its portfolio securities to broker-dealers and banks. Any such loan must be continuously secured by collateral in cash, cash equivalents or U.S. Treasuries maintained on a current basis in an amount at least equal to the fair value of the securities loaned by the Fund. Collateral is marked to market and monitored daily. The Fund continues to receive the equivalent of the interest or dividends paid by the issuer on the securities loaned and also receives an additional return that may be in the form of a fixed fee or a percentage of the earnings on the collateral. The Fund has the right to call the loan and attempt to obtain the securities loaned at any time on notice of not more than five business days. In the event of bankruptcy or other default of the borrower, the Fund could experience delays in liquidating the loan collateral or recovering the loaned securities and incur expenses related to enforcing its rights. In addition, there could be a decline in the value of the collateral or in the fair value of the securities loaned while the Fund seeks to enforce its rights thereto, and the Fund could experience subnormal levels of income or lack of access to income during that period.
At March 31, 2012, Global, Global Select and International had securities on loan with a value of $64,440,685, $25,728,168, and $223,046,985 respectively, and held as collateral for the loans U.S. Treasury securities with a value of $67,666,913, $27,016,072 and $234,211,271 respectively.
Restricted securities—
The following investments, the sales of which are restricted to qualified institutional buyers, have been valued according to the securities valuation procedures for debt obligations and money market instruments (as stated in the Security valuation section) since their acquisition dates. These securities are priced using market quotations or at amortized cost, and there are no unrestricted securities with the same maturity dates and yields for the issuer.
At March 31, 2012, Equity and Income held the following restricted securities:
| Par | | Security
Name | | Acquisition
Date | | Carrying
Value | | Cost | | Value | | Percentage of
Net Assets | |
| $ | 13,600,000 | | | BP Capital Markets PLC, 144A,
0.47%, due 6/5/2012 | | 1/30/2012 | | $ | 99.9792 | | | $ | 99.8390 | | | $ | 13,597,166 | | | | 0.07 | % | |
| | 11,450,000 | | | Cabela's Master Credit Card
Trust, 144A, 0.792%, due
10/15/2019, Series 2011-4A,
Class A2 | | 10/20/2011 | | | 100.0000 | | | | 100.0000 | | | | 11,450,000 | | | | 0.06 | % | |
| | 48,080,000 | | | Kinectic Concepts, Inc., 144A
10.50% due 11/1/2018 | | 10/25/2011 | | | 103.8750 | | | | 98.1980 | | | | 49,943,100 | | | | 0.25 | % | |
| | 9,600,000 | | | Kinectic Concepts, Inc., 144A
12.50% due 11/1/2019 | | 2/9/2012 | | | 94.0000 | | | | 98.7500 | | | | 9,024,000 | | | | 0.04 | % | |
| | 2,880,000 | | | Kinectic Concepts, Inc., 144A
12.50% due 11/1/2019 | | 2/14/2012 | | | 94.0000 | | | | 95.0000 | | | | 2,707,200 | | | | 0.01 | % | |
| | 25,000,000 | | | McDonald's Corp., 144A,
0.12%, due 4/16/2012 | | 2/15/2012 | | | 99.9939 | | | | 99.9797 | | | | 24,998,465 | | | | 0.12 | % | |
| | 13,865,000 | | | Medtronic, Inc., 144A,
0.10%, due 4/26/2012 | | 2/23/2012 | | | 99.9903 | | | | 99.9825 | | | | 13,863,648 | | | | 0.07 | % | |
| | 22,000,000 | | | PepsiCo., Inc., 144A,
0.07%, due 4/18/2012 | | 3/29/2012 | | | 99.9967 | | | | 99.9961 | | | | 21,999,273 | | | | 0.11 | % | |
| | 18,500,000 | | | PepsiCo., Inc., 144A,
0.07%, due 5/1/2012 | | 3/30/2012 | | | 99.9942 | | | | 99.9938 | | | | 18,498,921 | | | | 0.09 | % | |
| | 1,000,000 | | | Post Holdings, Inc., 144A,
7.375%, due 2/15/2022 | | 1/27/2012 | | | 104.7500 | | | | 100.0000 | | | | 1,047,500 | | | | 0.01 | % | |
THE OAKMARK FUNDS
77
THE OAKMARK FUNDS
Notes to Financial Statements (cont.)
| Par | | Security
Name | | Acquisition
Date | | Carrying
Value | | Cost | | Value | | Percentage of
Net Assets | |
| $ | 11,700,000 | | | Sealed Air Corp., 144A,
5.625%, due 7/15/2013 | | 4/6/2004 | | $ | 103.1945 | | | $ | 103.31 | | | $ | 12,073,756 | | | | 0.06 | % | |
| | 3,740,000 | | | Sealed Air Corp., 144A,
5.625%, due 7/15/2013 | | 8/20/2003 | | | 103.1945 | | | | 96.41 | | | | 3,859,474 | | | | 0.02 | % | |
| | 3,000,000 | | | Sealed Air Corp., 144A,
5.625%, due 7/15/2013 | | 6/27/2003 | | | 103.1945 | | | | 100.68 | | | | 3,095,835 | | | | 0.02 | % | |
| | 300,000 | | | Sealed Air Corp., 144A,
5.625%, due 7/15/2013 | | 8/21/2003 | | | 103.1945 | | | | 96.79 | | | | 309,584 | | | | 0.00 | %* | |
| | 25,110,000 | | | SSIF Nevada, LP, 144A,
1.267%, due 4/14/2014 | | 1/12/2012 | | | 99.2374 | | | | 98.8880 | | | | 24,918,511 | | | | 0.12 | % | |
| | 9,620,000 | | | SSIF Nevada, LP, 144A,
1.267%, due 4/14/2014 | | 1/20/2012 | | | 99.2374 | | | | 98.9060 | | | | 9,546,638 | | | | 0.05 | % | |
| | 9,520,000 | | | SSIF Nevada, LP, 144A,
1.267%, due 4/14/2014 | | 1/9/2012 | | | 99.2374 | | | | 98.8580 | | | | 9,447,400 | | | | 0.05 | % | |
| | 5,750,000 | | | SSIF Nevada, LP, 144A,
1.267%, due 4/14/2014 | | 1/18/2012 | | | 99.2374 | | | | 98.9020 | | | | 5,706,151 | | | | 0.03 | % | |
| | 5,100,000 | | | SSIF Nevada, LP, 144A,
1.267%, due 4/14/2014 | | 1/5/2012 | | | 99.2374 | | | | 98.7660 | | | | 5,061,107 | | | | 0.03 | % | |
| | 35,000,000 | | | Wal-Mart Stores, Inc., 144A,
0.12%, due 4/30/2012 | | 3/19/2012 | | | 99.9867 | | | | 99.9860 | | | | 34,995,333 | | | | 0.17 | % | |
| | 25,000,000 | | | Wal-Mart Stores, Inc., 144A,
0.70%, due 4/19/2012 | | 3/29/2012 | | | 99.9971 | | | | 99.9959 | | | | 24,999,270 | | | | 0.12 | % | |
| | 25,000,000 | | | Wal-Mart Stores, Inc., 144A,
0.08%, due 5/7/2012 | | 3/30/2012 | | | 99.9936 | | | | 99.9916 | | | | 24,998,390 | | | | 0.12 | % | |
| | 40,000,000 | | | Wellpoint, Inc., 144A,
0.15%, due 4/2/2012 | | 3/30/2012 | | | 99.9996 | | | | 99.9988 | | | | 39,999,833 | | | | 0.20 | % | |
| | 20,000,000 | | | Wellpoint, Inc., 144A,
0.19%, due 4/10/2012 | | 3/6/2012 | | | 99.9953 | | | | 99.9815 | | | | 19,999,050 | | | | 0.10 | % | |
| | 20,000,000 | | | Wellpoint, Inc., 144A,
0.32%, due 6/1/2012 | | 3/2/2012 | | | 99.9559 | | | | 99.9191 | | | | 19,991,180 | | | | 0.10 | % | |
| | 15,000,000 | | | Wellpoint, Inc., 144A,
0.41%, due 4/3/2012 | | 12/19/2011 | | | 99.9974 | | | | 99.8822 | | | | 14,999,616 | | | | 0.07 | % | |
| | 10,000,000 | | | Wellpoint, Inc., 144A,
0.15%, due 4/2/2012 | | 3/19/2012 | | | 99.9992 | | | | 99.9891 | | | | 9,999,922 | | | | 0.05 | % | |
| | 10,000,000 | | | Wellpoint, Inc., 144A,
0.24%, due 4/5/2012 | | 2/6/2012 | | | 99.9973 | | | | 99.9607 | | | | 9,999,733 | | | | 0.05 | % | |
| | 10,000,000 | | | Wellpoint, Inc., 144A,
0.37%, due 5/14/2012 | | 2/6/2012 | | | 99.9688 | | | | 99.9020 | | | | 9,996,875 | | | | 0.05 | % | |
| | 10,000,000 | | | Wellpoint, Inc., 144A,
0.26%, due 5/25/2012 | | 3/29/2012 | | | 99.9610 | | | | 99.9588 | | | | 9,996,100 | | | | 0.05 | % | |
| | | | | | | | | | | | | $ | 461,123,031 | | | | 2.29 | % | |
* Amount rounds to less than 0.01%
Federal income taxes—
It is each Fund's policy to comply with the requirements of the Internal Revenue Code applicable to regulated investment companies and to distribute substantially all of its net taxable income, including any net realized gains on investments, to its shareholders. Therefore, no federal income tax provision is required. There is no material liability for unrecognized tax benefits in the accompanying financial statements. Generally, each of the tax years in the four-year period ended September 30, 2011 remains subject to examination by taxing authorities.
THE OAKMARK FUNDS
78
THE OAKMARK FUNDS
Notes to Financial Statements (cont.)
2. TRANSACTIONS WITH AFFILIATES
Each Fund has an investment advisory agreement with the Adviser. For management services and facilities furnished, the Adviser receives from each Fund a monthly fee based on that Fund's net assets at the end of the preceding month. Annual fee rates are as follows:
| Fund | | Advisory Fees | | Fund | | Advisory Fees | |
Oakmark
Select
Equity and Income
| | 1.00% up to $2 billion;
0.90% on the next $1 billion;
0.80% on the next $2 billion;
0.75% on the next $2.5 billion;
0.70% on the next $2.5 billion; and
0.65% over $10 billion
1.00% up to $1 billion;
0.95% on the next $500 million;
0.90% on the next $500 million;
0.85% on the next $500 million;
0.80% on the next $2.5 billion;
0.75% on the next $5 billion; and
0.725% over $10 billion
0.75% up to $5 billion;
0.70% on the next $2.5 billion;
0.675% on the next $2.5 billion;
0.65% on the next $2.5 billion;
0.60% on the next $3.5 billion;
0.585% on the next $5 billion;
0.5775% on the next $7 billion; and
0.5725% over $28 billion | | Global
Global Select
International
Int'l Small Cap
| | 1.00% up to $2 billion;
0.95% on the next $2 billion;
0.90% on the next $4 billion; and
0.875% over $8 billion
1.00% up to $2 billion;
0.95% on the next $1 billion;
0.875% on the next $4 billion; and
0.85% over $7 billion
1.00% up to $2 billion;
0.95% on the next $1 billion;
0.85% on the next $2 billion;
0.825% on the next $2.5 billion;
0.815% on the next $3.5 billion;
0.805% on the next $5.5 billion; and
0.80% over $16.5 billion
1.25% up to $500 million;
1.10% on the next $1 billion;
1.05% on the next $2 billion;
1.025% on the next $1.5 billion; and
1.00% over $5 billion | |
|
The Adviser is contractually obligated through January 31, 2013 to reimburse each Fund Class to the extent, but only to the extent, that its annualized expenses (excluding taxes, interest, all commissions and other normal charges incident to the purchase and sale of portfolio securities, and extraordinary charges such as litigation costs, but including fees paid to the Adviser) exceed the percent set forth below of average daily net assets of each Fund Class.
| Fund | | Class I | | Class II | |
| Oakmark | | | 1.50 | % | | | 1.75 | % | |
| Select | | | 1.50 | | | | 1.75 | | |
| Equity and Income | | | 1.00 | | | | 1.25 | | |
| Global | | | 1.75 | | | | 2.00 | | |
| Global Select | | | 1.75 | | | | 2.00 | | |
| International | | | 2.00 | | | | 2.25 | | |
| Int'l Small Cap | | | 2.00 | | | | 2.25 | | |
The Adviser is entitled to recoup from any Fund Class, in any fiscal year through September 30, 2015, amounts reimbursed to that Fund Class, except to the extent that the Fund Class already has paid such recoupment to the Adviser or such recoupment would cause the annual ordinary operating expenses of a Fund Class for that fiscal year to exceed the applicable limit stated above. As of March 31, 2012 there were no amounts subject to recoupment.
The Adviser and the Funds have entered into agreements with financial intermediaries to provide recordkeeping, processing, shareholder communications and other services to customers of the intermediaries and have agreed to compensate the intermediaries for providing those services. Certain of those services would be provided by the Funds if the shares of those customers were registered directly with the Funds' transfer agent. Accordingly, the Funds pay a portion of the intermediary fees pursuant to an agreement with the Adviser, which calls for each Fund to pay
THE OAKMARK FUNDS
79
THE OAKMARK FUNDS
Notes to Financial Statements (cont.)
a portion of the intermediary fees attributable to shares of the Fund held by the intermediary (which generally are a percentage of value of the shares held) not exceeding the lesser of 75% of the fees charged by the intermediary or what the Fund would have paid its transfer agent had each customer's shares been registered directly with the transfer agent instead of held through the intermediary. The Adviser pays the remainder of the fees. The fees incurred by the Funds are reflected as other shareholder servicing fees in the Statements of Operations.
The Independent Trustees of the Trust may participate in the Trust's Deferred Compensation Plan for Independent Trustees. Participants in the plan may elect to defer all or a portion of their compensation. Amounts deferred are retained by the Trust and represent an unfunded obligation of the Trust. The value of a participant's deferral account is determined by reference to the change in value of Class I shares of one or more of the Funds or a money market fund as specified by the participant. Benefits would be payable after a stated number of years or retirement from the board. The accrued obligations of the Funds under the plan are reflected as deferred Trustee compensation in the Statements of Assets and Liabilities. The change in the accrued obligations for the period is included in Trustees fees in the Statements of Operations. The Trust pays the compensation of the Trustees other than those affiliated with the Adviser and all expenses incurred in connection with their services to the Trust. The Trust does not provide any pension or retirement benefits to its Trustees.
The Funds reimburse the Adviser for a portion of the compensation paid to the Funds' Chief Compliance Officer ("CCO"). The CCO expenses incurred by the Funds are included in other expenses in the Statements of Operations.
3. FEDERAL INCOME TAXES
At March 31, 2012 the cost of investments for federal income tax purposes and related composition of unrealized gains and losses for each Fund were as follows:
| Fund | | Cost of Investments
for Federal Income
Tax Purposes | | Gross Unrealized
Appreciation | | Gross Unrealized
(Depreciation) | | Net Unrealized
Appreciation
(Depreciation) | |
| Oakmark | | $ | 4,165,713,880 | | | $ | 1,824,178,251 | | | $ | (18,431,108 | ) | | $ | 1,805,747,143 | | |
| Select | | | 2,042,046,824 | | | | 1,093,186,831 | | | | 0 | | | | 1,093,186,831 | | |
| Equity and Income | | | 16,413,553,523 | | | | 3,967,009,198 | | | | (76,274,657 | ) | | | 3,890,734,541 | | |
| Global | | | 1,975,813,343 | | | | 465,141,603 | | | | (148,320,780 | ) | | | 316,820,823 | | |
| Global Select | | | 479,311,013 | | | | 87,425,854 | | | | (27,452,393 | ) | | | 59,973,461 | | |
| International | | | 7,992,685,948 | | | | 1,064,418,123 | | | | (469,983,852 | ) | | | 594,434,271 | | |
| Int'l Small Cap | | | 1,525,198,304 | | | | 195,183,344 | | | | (137,694,651 | ) | | | 57,488,693 | | |
For the six-month period ended March 31, 2012 the components of distributable earnings on a tax basis (excluding unrealized appreciation (depreciation)) were as follows:
| Fund | | Undistributed
Ordinary Income | | Undistributed Long-
Term Gain | | Total Distributable
Earnings | |
| Oakmark | | $ | 10,496,382 | | | $ | 26,567,617 | | | $ | 37,063,999 | | |
| Select | | | 206,607 | | | | 38,601,648 | | | | 38,808,255 | | |
| Equity and Income | | | 24,325,707 | | | | 341,557,700 | | | | 365,883,407 | | |
| Global | | | 11,513,671 | | | | 0 | | | | 11,513,671 | | |
| Global Select | | | 1,107,355 | | | | 0 | | | | 1,107,355 | | |
| International | | | 74,928,710 | | | | 0 | | | | 74,928,710 | | |
| Int'l Small Cap | | | 17,371,419 | | | | 0 | | | | 17,371,419 | | |
THE OAKMARK FUNDS
80
THE OAKMARK FUNDS
Notes to Financial Statements (cont.)
During the six-month period ended March 31, 2012 and the year ended September 30, 2011 the tax character of distributions paid was as follows:
| | | Period ended
March 31, 2012 | | Year ended
September 30, 2011 | |
| Fund | | Distributions Paid
from Ordinary
Income | | Distributions Paid
from Long-Term
Capital Gain | | Distributions Paid
from Ordinary
Income | | Distributions Paid
from Long-Term
Capital Gain | |
| Oakmark | | $ | 42,130,421 | | | $ | 0 | | | $ | 22,616,888 | | | $ | 0 | | |
| Select | | | 5,125,035 | | | | 0 | | | | 5,174,394 | | | | 0 | | |
| Equity and Income | | | 250,655,722 | | | | 319,667,495 | | | | 152,514,944 | | | | 0 | | |
| Global | | | 0 | | | | 0 | | | | 9,080,560 | | | | 0 | | |
| Global Select | | | 0 | | | | 0 | | | | 809,546 | | | | 0 | | |
| International | | | 53,596,687 | | | | 0 | | | | 54,130,299 | | | | 0 | | |
| Int'l Small Cap | | | 1,698,070 | | | | 302,060 | | | | 8,019,297 | | | | 0 | | |
On March 31, 2012 the Funds had temporary book/tax differences in undistributed earnings that were primarily attributable to trustee deferred compensation expenses, passive foreign investment companies, foreign currency contracts, post October capital and currency loss deferrals and capital losses on wash sales. Temporary differences will reverse over time. The Funds have permanent differences in book/tax undistributed earnings primarily attributable to currency gains and losses. Permanent differences have been recorded in their respective component of the Analysis of Net Assets shown on the Statements of Assets and Liabilities.
4. INVESTMENT TRANSACTIONS
For the six-month period ended March 31, 2012 transactions in investment securities (excluding short term and U.S. Government securities) were as follows (in thousands):
| | | Oakmark | | Select | | Equity and
Income | | Global | | Global
Select | | International | | Int'l
Small Cap | |
| Purchases | | $ | 643,930 | | | $ | 342,003 | | | $ | 2,187,004 | | | $ | 318,823 | | | $ | 50,053 | | | $ | 1,735,182 | | | $ | 255,304 | | |
| Proceeds from sales | | | 489,555 | | | | 165,985 | | | | 2,594,887 | | | | 266,864 | | | | 32,375 | | | | 1,612,147 | | | | 278,842 | | |
Purchases at cost and proceeds from sales (in thousands) of long-term U.S. Government securities for the six-month period ended March 31, 2012 were $332,756 and $262,728, respectively, for Equity and Income.
5. INVESTMENT IN AFFILIATED ISSUERS
Each of the companies listed below was considered to be an affiliate of the Fund because the Fund owned 5% or more of the company's voting securities during all or part of the six month period ended March 31, 2012. Purchase and sale transactions and dividend income earned during the period on these securities are set forth below:
Schedule of Transactions with Affiliated Issuers
Oakmark Equity and Income Fund
| Affiliates | | Shares Held | | Purchases
(Cost) | | Sales
(Proceeds) | | Dividend
Income | | Value
September 30,
2011 | | Value
March 31,
2012 | |
Broadridge Financial
Solutions, Inc. | | | 6,900,000 | | | $ | 0 | | | $ | 0 | | | $ | 2,208,000 | | | $ | 138,966,000 | | | $ | 164,979,000 | | |
| Flowserve Corp. | | | 3,639,184 | | | | 4,024,078 | | | | 0 | | | | 2,474,645 | | | | 265,245,748 | | | | 420,362,144 | | |
| Hospira, Inc. (a) | | | 8,640,500 | | | | 27,118,794 | | | | 9,400,139 | | | | 0 | | | | 296,000,000 | | | | 323,068,295 | | |
L-3 Communications
Holdings, Inc. (b) | | | 0 | | | | 0 | | | | 371,945,101 | | | | 2,892,820 | | | | 334,638,000 | | | | 0 | | |
| PharMerica Corp. (a) | | | 1,810,000 | | | | 0 | | | | 0 | | | | 0 | | | | 25,828,700 | | | | 22,498,300 | | |
Varian Medical
Systems, Inc. (a) | | | 5,700,000 | | | | 0 | | | | 0 | | | | 0 | | | | 297,312,000 | | | | 393,072,000 | | |
| Walter Energy, Inc. | | | 3,999,850 | | | | 3,115,333 | | | | 0 | | | | 999,338 | | | | 236,862,471 | | | | 236,831,119 | | |
| TOTALS | | | | $ | 34,258,205 | | | $ | 381,345,240 | | | $ | 8,574,803 | | | $ | 1,594,852,919 | | | $ | 1,560,810,858 | | |
THE OAKMARK FUNDS
81
THE OAKMARK FUNDS
Notes to Financial Statements (cont.)
Schedule of Transactions with Affiliated Issuers
Oakmark International Fund
| Affiliates | | Shares Held | | Purchases
(Cost) | | Sales
(Proceeds) | | Dividend
Income | | Value
September 30,
2011 | | Value
March 31,
2012 | |
| Meitec Corp. | | | 2,475,100 | | | $ | 0 | | | $ | 0 | | | $ | 864,102 | | | $ | 47,315,554 | | | $ | 49,908,685 | | |
| TOTALS | | | | $ | 0 | | | $ | 0 | | | $ | 864,102 | | | $ | 47,315,554 | | | $ | 49,908,685 | | |
Schedule of Transactions with Affiliated Issuers
Oakmark Int'l Small Cap Fund
| Affiliates | | Shares Held | | Purchases
(Cost) | | Sales
(Proceeds) | | Dividend
Income | | Value
September 30,
2011 | | Value
March 31,
2012 | |
| Interpump Group SpA (c) | | | 4,613,000 | | | $ | 0 | | | $ | 4,290,188 | | | $ | 0 | | | $ | 29,367,429 | | | $ | 39,344,320 | | |
Interpump Group SpA,
Warrants (a) (c) | | | 848,916 | | | | 0 | | | | 0 | | | | 0 | | | | 631,221 | | | | 901,117 | | |
| JJB Sports PLC (a) | | | 29,284,528 | | | | 0 | | | | 0 | | | | 0 | | | | 8,099,423 | | | | 4,684,063 | | |
JJB Sports PLC,
Warrants (a) | | | 2,474,255 | | | | 0 | | | | 0 | | | | 0 | | | | 0 | | | | 0 | | |
LSL Property
Services PLC | | | 10,375,000 | | | | 0 | | | | 0 | | | | 970,249 | | | | 36,097,015 | | | | 45,635,762 | | |
| Orbotech, Ltd. (a) | | | 3,337,600 | | | | 0 | | | | 0 | | | | 0 | | | | 32,307,968 | | | | 38,682,784 | | |
| Pasona Group, Inc. | | | 32,040 | | | | 0 | | | | 244,473 | | | | 0 | | | | 32,819,315 | | | | 28,141,935 | | |
| Vitec Group PLC (c) | | | 2,145,559 | | | | 52,418 | | | | 2,612,581 | | | | 0 | | | | 20,058,863 | | | | 23,113,332 | | |
| TOTALS | | | | $ | 52,418 | | | $ | 7,147,242 | | | $ | 970,249 | | | $ | 159,381,234 | | | $ | 180,503,313 | | |
(a) Non-income producing security.
(b) Position in issuer liquidated during the period ended March 31, 2012.
(c) Due to transactions during the period ended March 31, 2012, the company is no longer an affiliated issuer.
6. SUBSEQUENT EVENTS
Management has evaluated the possibility of subsequent events existing in the Funds' financial statements. Management has determined that there are no material events that would require disclosure in the Funds' financial statements through the date of the publication of this report.
THE OAKMARK FUNDS
82
OAKMARK FUND
Financial Highlights–Class I
For a share outstanding throughout each period
| | | Six Months Ended
March 31, 2012
(Unaudited) | | Year Ended
September 30,
2011 | | Year Ended
September 30,
2010 | | Year Ended
September 30,
2009 | | Year Ended
September 30,
2008 | | Year Ended
September 30,
2007 | |
| Net Asset Value, Beginning of Period | | $ | 37.87 | | | $ | 38.36 | | | $ | 34.55 | | | $ | 35.31 | | | $ | 47.28 | | | $ | 44.64 | | |
| Income From Investment Operations: | |
| Net Investment Income | | | 0.19 | | | | 0.34 | (a) | | | 0.24 | | | | 0.29 | (a) | | | 0.52 | | | | 0.47 | (a) | |
Net Gain (Loss) on Investments (both realized
and unrealized) | | | 10.00 | | | | (0.58 | ) | | | 3.80 | | | | 0.39 | | | | (8.51 | ) | | | 4.60 | | |
| Total From Investment Operations | | | 10.19 | | | | (0.24 | ) | | | 4.04 | | | | 0.68 | | | | (7.99 | ) | | | 5.07 | | |
| Less Distributions: | |
| From Net Investment Income | | | (0.35 | ) | | | (0.25 | ) | | | (0.23 | ) | | | (0.45 | ) | | | (0.56 | ) | | | (0.43 | ) | |
| From Capital Gains | | | 0.00 | | | | 0.00 | | | | 0.00 | | | | (0.99 | ) | | | (3.42 | ) | | | (2.00 | ) | |
| Total Distributions | | | (0.35 | ) | | | (0.25 | ) | | | (0.23 | ) | | | (1.44 | ) | | | (3.98 | ) | | | (2.43 | ) | |
| Redemption Fees | | | 0.00 | (b) | | | 0.00 | (b) | | | 0.00 | (b) | | | 0.00 | (b) | | | 0.00 | (b) | | | 0.00 | (b) | |
| Net Asset Value, End of Period | | $ | 47.71 | | | $ | 37.87 | | | $ | 38.36 | | | $ | 34.55 | | | $ | 35.31 | | | $ | 47.28 | | |
| Total Return | | | 27.08 | % | | | -0.67 | % | | | 11.74 | % | | | 3.38 | % | | | -18.14 | % | | | 11.51 | % | |
| Ratios/ Supplemental Data: | |
| Net Assets, End of Period ($million) | | $ | 5,946.9 | | | $ | 4,512.5 | | | $ | 3,419.3 | | | $ | 3,144.2 | | | $ | 3,610.1 | | | $ | 5,656.9 | | |
| Ratio of Expenses to Average Net Assets | | | 1.04 | %† | | | 1.04 | % | | | 1.11 | % | | | 1.23 | % | | | 1.10 | % | | | 1.01 | % | |
| Ratio of Net Investment Income to Average Net Assets | | | 0.90 | %† | | | 0.82 | % | | | 0.65 | % | | | 1.06 | % | | | 1.17 | % | | | 1.01 | % | |
| Portfolio Turnover Rate | | | 11 | % | | | 18 | % | | | 24 | % | | | 62 | % | | | 32 | % | | | 12 | % | |
Financial Highlights–Class II
For a share outstanding throughout each period
| | | Six Months Ended
March 31, 2012
(Unaudited) | | Year Ended
September 30,
2011 | | Year Ended
September 30,
2010 | | Year Ended
September 30,
2009 | | Year Ended
September 30,
2008 | | Year Ended
September 30,
2007 | |
| Net Asset Value, Beginning of Period | | $ | 37.78 | | | $ | 38.32 | | | $ | 34.56 | | | $ | 35.12 | | | $ | 46.97 | | | $ | 44.35 | | |
| Income From Investment Operations: | |
| Net Investment Income | | | 0.14 | (a) | | | 0.19 | (a) | | | 0.13 | | | | 0.24 | (a) | | | 0.54 | | | | 0.32 | (a) | |
Net Gain (Loss) on Investments (both realized
and unrealized) | | | 10.00 | | | | (0.59 | ) | | | 3.79 | | | | 0.45 | | | | (8.64 | ) | | | 4.55 | | |
| Total From Investment Operations | | | 10.14 | | | | (0.40 | ) | | | 3.92 | | | | 0.69 | | | | (8.10 | ) | | | 4.87 | | |
| Less Distributions: | |
| From Net Investment Income | | | (0.22 | ) | | | (0.14 | ) | | | (0.16 | ) | | | (0.26 | ) | | | (0.33 | ) | | | (0.25 | ) | |
| From Capital Gains | | | 0.00 | | | | 0.00 | | | | 0.00 | | | | (0.99 | ) | | | (3.42 | ) | | | (2.00 | ) | |
| Total Distributions | | | (0.22 | ) | | | (0.14 | ) | | | (0.16 | ) | | | (1.25 | ) | | | (3.75 | ) | | | (2.25 | ) | |
| Redemption Fees | | | 0.00 | (b) | | | 0.00 | (b) | | | 0.00 | (b) | | | 0.00 | (b) | | | 0.00 | (b) | | | 0.00 | (b) | |
| Net Asset Value, End of Period | | $ | 47.70 | | | $ | 37.78 | | | $ | 38.32 | | | $ | 34.56 | | | $ | 35.12 | | | $ | 46.97 | | |
| Total Return | | | 26.95 | % | | | -1.07 | % | | | 11.37 | % | | | 3.22 | % | | | -18.44 | % | | | 11.11 | % | |
| Ratios/Supplemental Data: | |
| Net Assets, End of Period ($million) | | $ | 27.0 | | | $ | 24.7 | | | $ | 9.0 | | | $ | 8.2 | | | $ | 12.4 | | | $ | 29.1 | | |
| Ratio of Expenses to Average Net Assets | | | 1.29 | %† | | | 1.45 | % | | | 1.42 | % | | | 1.44 | % | | | 1.47 | % | | | 1.36 | % | |
| Ratio of Net Investment Income to Average Net Assets | | | 0.65 | %† | | | 0.44 | % | | | 0.34 | % | | | 0.88 | % | | | 0.81 | % | | | 0.67 | % | |
| Portfolio Turnover Rate | | | 11 | % | | | 18 | % | | | 24 | % | | | 62 | % | | | 32 | % | | | 12 | % | |
† Data has been annualized.
(a) Computed using average shares outstanding throughout the period.
(b) Amount rounds to less than $0.01 per share.
See accompanying Notes to Financial Statements.
THE OAKMARK FUNDS
83
OAKMARK SELECT FUND
Financial Highlights–Class I
For a share outstanding throughout each period
| | | Six Months Ended
March 31, 2012
(Unaudited) | | Year Ended
September 30,
2011 | | Year Ended
September 30,
2010 | | Year Ended
September 30,
2009 | | Year Ended
September 30,
2008 | | Year Ended
September 30,
2007 | |
| Net Asset Value, Beginning of Period | | $ | 25.50 | | | $ | 25.64 | | | $ | 22.68 | | | $ | 20.34 | | | $ | 33.05 | | | $ | 34.48 | | |
| Income From Investment Operations: | |
| Net Investment Income | | | 0.03 | | | | 0.04 | (a) | | | 0.06 | (a) | | | 0.11 | (a) | | | 0.35 | | | | 0.38 | (a) | |
Net Gain (Loss) on Investments (both realized
and unrealized) | | | 6.87 | | | | (0.12 | ) | | | 2.97 | | | | 2.48 | | | | (9.63 | ) | | | 2.11 | | |
| Total From Investment Operations | | | 6.90 | | | | (0.08 | ) | | | 3.03 | | | | 2.59 | | | | (9.28 | ) | | | 2.49 | | |
| Less Distributions: | |
| From Net Investment Income | | | (0.06 | ) | | | (0.06 | ) | | | (0.07 | ) | | | (0.25 | ) | | | (0.32 | ) | | | (0.39 | ) | |
| From Capital Gains | | | 0.00 | | | | 0.00 | | | | 0.00 | | | | 0.00 | | | | (3.11 | ) | | | (3.53 | ) | |
| Total Distributions | | | (0.06 | ) | | | (0.06 | ) | | | (0.07 | ) | | | (0.25 | ) | | | (3.43 | ) | | | (3.92 | ) | |
| Redemption Fees | | | 0.00 | (b) | | | 0.00 | (b) | | | 0.00 | (b) | | | 0.00 | (b) | | | 0.00 | (b) | | | 0.00 | (b) | |
| Net Asset Value, End of Period | | $ | 32.34 | | | $ | 25.50 | | | $ | 25.64 | | | $ | 22.68 | | | $ | 20.34 | | | $ | 33.05 | | |
| Total Return | | | 27.09 | % | | | -0.34 | % | | | 13.39 | % | | | 13.30 | % | | | -30.43 | % | | | 7.00 | % | |
| Ratios/ Supplemental Data: | |
| Net Assets, End of Period ($million) | | $ | 3,103.2 | | | $ | 2,266.7 | | | $ | 2,407.8 | | | $ | 2,265.3 | | | $ | 2,558.9 | | | $ | 5,397.4 | | |
| Ratio of Expenses to Average Net Assets | | | 1.05 | %† | | | 1.07 | % | | | 1.08 | % | | | 1.19 | % | | | 1.08 | % | | | 0.97 | % | |
| Ratio of Net Investment Income to Average Net Assets | | | 0.20 | %† | | | 0.15 | % | | | 0.22 | % | | | 0.66 | % | | | 1.16 | % | | | 1.11 | % | |
| Portfolio Turnover Rate | | | 7 | % | | | 16 | % | | | 25 | % | | | 34 | % | | | 26 | % | | | 10 | % | |
Financial Highlights–Class II
For a share outstanding throughout each period
| | | Six Months Ended
March 31, 2012
(Unaudited) | | Year Ended
September 30,
2011 | | Year Ended
September 30,
2010 | | Year Ended
September 30,
2009 | | Year Ended
September 30,
2008 | | Year Ended
September 30,
2007 | |
| Net Asset Value, Beginning of Period | | $ | 25.43 | | | $ | 25.59 | | | $ | 22.70 | | | $ | 20.29 | | | $ | 32.82 | | | $ | 34.23 | | |
| Income From Investment Operations: | |
| Net Investment Income (Loss) | | | (0.01 | )(a) | | | (0.05 | )(a) | | | (0.02 | )(a) | | | 0.12 | (a) | | | 0.34 | | | | 0.27 | (a) | |
Net Gain (Loss) on Investments (both realized
and unrealized) | | | 6.85 | | | | (0.11 | ) | | | 2.97 | | | | 2.49 | | | | (9.65 | ) | | | 2.09 | | |
| Total From Investment Operations | | | 6.84 | | | | (0.16 | ) | | | 2.95 | | | | 2.61 | | | | (9.31 | ) | | | 2.36 | | |
| Less Distributions: | |
| From Net Investment Income | | | 0.00 | | | | 0.00 | | | | (0.06 | ) | | | (0.20 | ) | | | (0.11 | ) | | | (0.24 | ) | |
| From Capital Gains | | | 0.00 | | | | 0.00 | | | | 0.00 | | | | 0.00 | | | | (3.11 | ) | | | (3.53 | ) | |
| Total Distributions | | | 0.00 | | | | 0.00 | | | | (0.06 | ) | | | (0.20 | ) | | | (3.22 | ) | | | (3.77 | ) | |
| Redemption Fees | | | 0.00 | | | | 0.00 | (b) | | | 0.00 | (b) | | | 0.00 | (b) | | | 0.00 | (b) | | | 0.00 | (b) | |
| Net Asset Value, End of Period | | $ | 32.27 | | | $ | 25.43 | | | $ | 25.59 | | | $ | 22.70 | | | $ | 20.29 | | | $ | 32.82 | | |
| Total Return | | | 26.94 | % | | | -0.63 | % | | | 12.99 | % | | | 13.34 | % | | | -30.64 | % | | | 6.65 | % | |
| Ratios/Supplemental Data: | |
| Net Assets, End of Period ($million) | | $ | 11.5 | | | $ | 8.0 | | | $ | 8.3 | | | $ | 8.1 | | | $ | 15.1 | | | $ | 36.2 | | |
| Ratio of Expenses to Average Net Assets | | | 1.34 | %† | | | 1.38 | % | | | 1.39 | % | | | 1.28 | % | | | 1.37 | % | | | 1.35 | % | |
Ratio of Net Investment Income (loss) to
Average Net Assets | | | (0.10 | )%† | | | (0.16 | )% | | | (0.08 | )% | | | 0.72 | % | | | 0.88 | % | | | 0.79 | % | |
| Portfolio Turnover Rate | | | 7 | % | | | 16 | % | | | 25 | % | | | 34 | % | | | 26 | % | | | 10 | % | |
† Data has been annualized.
(a) Computed using average shares outstanding throughout the period.
(b) Amount rounds to less than $0.01 per share.
THE OAKMARK FUNDS
84
OAKMARK EQUITY AND INCOME FUND
Financial Highlights–Class I
For a share outstanding throughout each period
| | | Six Months Ended
March 31, 2012
(Unaudited) | | Year Ended
September 30,
2011 | | Year Ended
September 30,
2010 | | Year Ended
September 30,
2009 | | Year Ended
September 30,
2008 | | Year Ended
September 30,
2007 | |
| Net Asset Value, Beginning of Period | | $ | 25.62 | | | $ | 26.03 | | | $ | 24.72 | | | $ | 25.57 | | | $ | 28.67 | | | $ | 26.49 | | |
| Income From Investment Operations: | |
| Net Investment Income | | | 0.09 | | | | 0.26 | | | | 0.27 | (a) | | | 0.35 | (a) | | | 0.53 | (a) | | | 0.58 | (a) | |
Net Gain (Loss) on Investments (both realized
and unrealized) | | | 4.33 | | | | (0.45 | ) | | | 1.33 | | | | (0.24 | ) | | | (1.52 | ) | | | 3.41 | | |
| Total From Investment Operations | | | 4.42 | | | | (0.19 | ) | | | 1.60 | | | | 0.11 | | | | (0.99 | ) | | | 3.99 | | |
| Less Distributions: | |
| From Net Investment Income | | | (0.38 | ) | | | (0.22 | ) | | | (0.29 | ) | | | (0.39 | ) | | | (0.60 | ) | | | (0.50 | ) | |
| From Capital Gains | | | (0.47 | ) | | | 0.00 | | | | 0.00 | | | | (0.57 | ) | | | (1.51 | ) | | | (1.31 | ) | |
| Total Distributions | | | (0.85 | ) | | | (0.22 | ) | | | (0.29 | ) | | | (0.96 | ) | | | (2.11 | ) | | | (1.81 | ) | |
| Redemption Fees | | | 0.00 | | | | 0.00 | | | | 0.00 | | | | 0.00 | | | | 0.00 | (b) | | | 0.00 | (b) | |
| Net Asset Value, End of Period | | $ | 29.19 | | | $ | 25.62 | | | $ | 26.03 | | | $ | 24.72 | | | $ | 25.57 | | | $ | 28.67 | | |
| Total Return | | | 17.59 | % | | | -0.77 | % | | | 6.52 | % | | | 1.02 | % | | | -3.85 | % | | | 15.77 | % | |
| Ratios/ Supplemental Data: | |
| Net Assets, End of Period ($million) | | $ | 18,839.1 | | | $ | 16,441.0 | | | $ | 16,993.7 | | | $ | 14,418.4 | | | $ | 13,263.3 | | | $ | 12,489.5 | | |
| Ratio of Expenses to Average Net Assets | | | 0.78 | %† | | | 0.77 | % | | | 0.79 | % | | | 0.85 | % | | | 0.81 | % | | | 0.83 | % | |
| Ratio of Net Investment Income to Average Net Assets | | | 0.61 | %† | | | 0.93 | % | | | 1.04 | % | | | 1.59 | % | | | 1.93 | % | | | 2.14 | % | |
| Portfolio Turnover Rate | | | 15 | % | | | 47 | % | | | 91 | % | | | 78 | %(c) | | | 65 | %(c) | | | 67 | % | |
Financial Highlights–Class II
For a share outstanding throughout each period
| | | Six Months Ended
March 31, 2012
(Unaudited) | | Year Ended
September 30,
2011 | | Year Ended
September 30,
2010 | | Year Ended
September 30,
2009 | | Year Ended
September 30,
2008 | | Year Ended
September 30,
2007 | |
| Net Asset Value, Beginning of Period | | $ | 25.45 | | | $ | 25.85 | | | $ | 24.57 | | | $ | 25.40 | | | $ | 28.50 | | | $ | 26.35 | | |
| Income From Investment Operations: | |
| Net Investment Income | | | 0.04 | | | | 0.17 | | | | 0.18 | | | | 0.28 | (a) | | | 0.43 | (a) | | | 0.48 | (a) | |
Net Gain (Loss) on Investments (both realized
and unrealized) | | | 4.29 | | | | (0.43 | ) | | | 1.33 | | | | (0.24 | ) | | | (1.51 | ) | | | 3.40 | | |
| Total From Investment Operations | | | 4.33 | | | | (0.26 | ) | | | 1.51 | | | | 0.04 | | | | (1.08 | ) | | | 3.88 | | |
| Less Distributions: | |
| From Net Investment Income | | | (0.28 | ) | | | (0.14 | ) | | | (0.23 | ) | | | (0.30 | ) | | | (0.51 | ) | | | (0.42 | ) | |
| From Capital Gains | | | (0.47 | ) | | | 0.00 | | | | 0.00 | | | | (0.57 | ) | | | (1.51 | ) | | | (1.31 | ) | |
| Total Distributions | | | (0.75 | ) | | | (0.14 | ) | | | (0.23 | ) | | | (0.87 | ) | | | (2.02 | ) | | | (1.73 | ) | |
| Redemption Fees | | | 0.00 | | | | 0.00 | | | | 0.00 | | | | 0.00 | | | | 0.00 | (b) | | | 0.00 | (b) | |
| Net Asset Value, End of Period | | $ | 29.03 | | | $ | 25.45 | | | $ | 25.85 | | | $ | 24.57 | | | $ | 25.40 | | | $ | 28.50 | | |
| Total Return | | | 17.34 | % | | | -1.04 | % | | | 6.17 | % | | | 0.70 | % | | | -4.19 | % | | | 15.38 | % | |
| Ratios/Supplemental Data: | |
| Net Assets, End of Period ($million) | | $ | 1,365.0 | | | $ | 1,212.2 | | | $ | 1,270.1 | | | $ | 1,110.4 | | | $ | 1,009.7 | | | $ | 915.1 | | |
| Ratio of Expenses to Average Net Assets | | | 1.11 | %† | | | 1.09 | % | | | 1.12 | % | | | 1.18 | % | | | 1.16 | % | | | 1.17 | % | |
| Ratio of Net Investment Income to Average Net Assets | | | 0.28 | %† | | | 0.61 | % | | | 0.71 | % | | | 1.26 | % | | | 1.59 | % | | | 1.82 | % | |
| Portfolio Turnover Rate | | | 15 | % | | | 47 | % | | | 91 | % | | | 78 | %(c) | | | 65 | %(c) | | | 67 | % | |
† Data has been annualized.
(a) Computed using average shares outstanding throughout the period.
(b) Amount rounds to less than $0.01 per share.
(c) The ratio excludes in-kind transactions.
See accompanying Notes to Financial Statements.
THE OAKMARK FUNDS
85
OAKMARK GLOBAL FUND
Financial Highlights–Class I
For a share outstanding throughout each period
| | | Six Months Ended
March 31, 2012
(Unaudited) | | Year Ended
September 30,
2011 | | Year Ended
September 30,
2010 | | Year Ended
September 30,
2009 | | Year Ended
September 30,
2008 | | Year Ended
September 30,
2007 | |
| Net Asset Value, Beginning of Period | | $ | 18.81 | | | $ | 20.39 | | | $ | 18.94 | | | $ | 19.43 | | | $ | 28.08 | | | $ | 26.69 | | |
| Income From Investment Operations: | |
| Net Investment Income | | | 0.02 | (a) | | | 0.16 | (a) | | | 0.10 | | | | 0.11 | | | | 0.25 | | | | 0.18 | (a) | |
Net Gain (Loss) on Investments (both realized
and unrealized) | | | 4.16 | | | | (1.65 | ) | | | 1.49 | | | | 0.13 | | | | (5.82 | ) | | | 5.06 | | |
| Total From Investment Operations | | | 4.18 | | | | (1.49 | ) | | | 1.59 | | | | 0.24 | | | | (5.57 | ) | | | 5.24 | | |
| Less Distributions: | |
| From Net Investment Income | | | 0.00 | | | | (0.09 | ) | | | (0.14 | ) | | | (0.70 | ) | | | (0.04 | ) | | | (0.31 | ) | |
| From Capital Gains | | | 0.00 | | | | 0.00 | | | | 0.00 | | | | (0.03 | ) | | | (3.04 | ) | | | (3.54 | ) | |
| Total Distributions | | | 0.00 | | | | (0.09 | ) | | | (0.14 | ) | | | (0.73 | ) | | | (3.08 | ) | | | (3.85 | ) | |
| Redemption Fees | | | 0.00 | (b) | | | 0.00 | (b) | | | 0.00 | (b) | | | 0.00 | (b) | | | 0.00 | (b) | | | 0.00 | (b) | |
| Net Asset Value, End of Period | | $ | 22.99 | | | $ | 18.81 | | | $ | 20.39 | | | $ | 18.94 | | | $ | 19.43 | | | $ | 28.08 | | |
| Total Return | | | 22.22 | % | | | -7.38 | % | | | 8.43 | % | | | 2.65 | % | | | -22.10 | % | | | 21.29 | % | |
| Ratios/ Supplemental Data: | |
| Net Assets, End of Period ($million) | | $ | 2,271.9 | | | $ | 1,816.9 | | | $ | 2,031.8 | | | $ | 1,675.9 | | | $ | 1,946.6 | | | $ | 3,006.2 | | |
| Ratio of Expenses to Average Net Assets | | | 1.16 | %† | | | 1.16 | % | | | 1.15 | % | | | 1.23 | % | | | 1.16 | % | | | 1.13 | % | |
| Ratio of Net Investment Income to Average Net Assets | | | 0.23 | %† | | | 0.70 | % | | | 0.53 | % | | | 0.76 | % | | | 0.95 | % | | | 0.66 | % | |
| Portfolio Turnover Rate | | | 13 | % | | | 29 | %(c) | | | 37 | % | | | 32 | % | | | 41 | % | | | 35 | % | |
Financial Highlights–Class II
For a share outstanding throughout each period
| | | Six Months Ended
March 31, 2012
(Unaudited) | | Year Ended
September 30,
2011 | | Year Ended
September 30,
2010 | | Year Ended
September 30,
2009 | | Year Ended
September 30,
2008 | | Year Ended
September 30,
2007 | |
| Net Asset Value, Beginning of Period | | $ | 18.42 | | | $ | 19.97 | | | $ | 18.58 | | | $ | 19.01 | | | $ | 27.62 | | | $ | 26.31 | | |
| Income From Investment Operations: | |
| Net Investment Income (Loss) | | | (0.11 | ) | | | 0.06 | (a) | | | 0.00 | (b) | | | 0.07 | (a) | | | 0.13 | | | | 0.07 | (a) | |
Net Gain (Loss) on Investments (both realized
and unrealized) | | | 4.16 | | | | (1.61 | ) | | | 1.48 | | | | 0.14 | | | | (5.69 | ) | | | 4.99 | | |
| Total From Investment Operations | | | 4.05 | | | | (1.55 | ) | | | 1.48 | | | | 0.21 | | | | (5.56 | ) | | | 5.06 | | |
| Less Distributions: | |
| From Net Investment Income | | | 0.00 | | | | 0.00 | (b) | | | (0.09 | ) | | | (0.61 | ) | | | (0.01 | ) | | | (0.21 | ) | |
| From Capital Gains | | | 0.00 | | | | 0.00 | | | | 0.00 | | | | (0.03 | ) | | | (3.04 | ) | | | (3.54 | ) | |
| Total Distributions | | | 0.00 | | | | 0.00 | (b) | | | (0.09 | ) | | | (0.64 | ) | | | (3.05 | ) | | | (3.75 | ) | |
| Redemption Fees | | | 0.00 | (b) | | | 0.00 | (b) | | | 0.00 | (b) | | | 0.00 | (b) | | | 0.00 | (b) | | | 0.00 | (b) | |
| Net Asset Value, End of Period | | $ | 22.47 | | | $ | 18.42 | | | $ | 19.97 | | | $ | 18.58 | | | $ | 19.01 | | | $ | 27.62 | | |
| Total Return | | | 21.99 | % | | | -7.75 | % | | | 8.02 | % | | | 2.43 | % | | | -22.46 | % | | | 20.82 | % | |
| Ratios/Supplemental Data: | |
| Net Assets, End of Period ($million) | | $ | 39.0 | | | $ | 36.6 | | | $ | 50.5 | | | $ | 54.4 | | | $ | 57.6 | | | $ | 90.3 | | |
| Ratio of Expenses to Average Net Assets | | | 1.55 | %† | | | 1.55 | % | | | 1.54 | % | | | 1.54 | % | | | 1.57 | % | | | 1.53 | % | |
Ratio of Net Investment Income (loss) to
Average Net Assets | | | (0.18 | )%† | | | 0.27 | % | | | 0.09 | % | | | 0.46 | % | | | 0.54 | % | | | 0.25 | % | |
| Portfolio Turnover Rate | | | 13 | % | | | 29 | %(c) | | | 37 | % | | | 32 | % | | | 41 | % | | | 35 | % | |
† Data has been annualized.
(a) Computed using average shares outstanding throughout the period.
(b) Amount rounds to less than $0.01 per share.
(c) The ratio excludes in-kind transactions.
THE OAKMARK FUNDS
86
OAKMARK GLOBAL SELECT FUND
Financial Highlights–Class I
For a share outstanding throughout each period
| | | Six Months Ended
March 31, 2012
(Unaudited) | | Year Ended
September 30,
2011 | | Year Ended
September 30,
2010 | | Year Ended
September 30,
2009 | | Year Ended
September 30,
2008 | | October 2, 2006
through
September 30, 2007 (a) | |
| Net Asset Value, Beginning of Period | | $ | 9.96 | | | $ | 10.15 | | | $ | 9.54 | | | $ | 8.23 | | | $ | 11.61 | | | $ | 10.00 | | |
| Income From Investment Operations: | |
| Net Investment Income | | | 0.00 | (c) | | | 0.02 | | | | 0.04 | | | | 0.06 | | | | 0.14 | (b) | | | 0.12 | (b) | |
Net Gain (Loss) on Investments (both realized
and unrealized) | | | 2.40 | | | | (0.19 | ) | | | 0.61 | | | | 1.60 | | | | (3.07 | ) | | | 1.49 | | |
| Total From Investment Operations | | | 2.40 | | | | (0.17 | ) | | | 0.65 | | | | 1.66 | | | | (2.93 | ) | | | 1.61 | | |
| Less Distributions: | |
| From Net Investment Income | | | 0.00 | | | | (0.02 | ) | | | (0.04 | ) | | | (0.35 | ) | | | (0.02 | ) | | | (0.01 | ) | |
| From Capital Gains | | | 0.00 | | | | 0.00 | | | | 0.00 | | | | 0.00 | | | | (0.44 | ) | | | 0.00 | | |
| Total Distributions | | | 0.00 | | | | (0.02 | ) | | | (0.04 | ) | | | (0.35 | ) | | | (0.46 | ) | | | (0.01 | ) | |
| Redemption Fees | | | 0.00 | (c) | | | 0.00 | (c) | | | 0.00 | (c) | | | 0.00 | (c) | | | 0.01 | | | | 0.01 | | |
| Net Asset Value, End of Period | | $ | 12.36 | | | $ | 9.96 | | | $ | 10.15 | | | $ | 9.54 | | | $ | 8.23 | | | $ | 11.61 | | |
| Total Return | | | 24.10 | % | | | -1.65 | % | | | 6.81 | % | | | 22.24 | % | | | -25.95 | % | | | 16.23 | %² | |
| Ratios/ Supplemental Data: | |
| Net Assets, End of Period ($million) | | $ | 542.9 | | | $ | 422.0 | | | $ | 329.9 | | | $ | 266.2 | | | $ | 232.8 | | | $ | 377.7 | | |
| Ratio of Expenses to Average Net Assets | | | 1.22 | %† | | | 1.24 | % | | | 1.29 | % | | | 1.43 | % | | | 1.35 | % | | | 1.31 | %† | |
Ratio of Net Investment Income (loss) to
Average Net Assets | | | (0.10 | )%† | | | 0.33 | % | | | 0.40 | % | | | 0.88 | % | | | 1.41 | % | | | 1.01 | %† | |
| Portfolio Turnover Rate | | | 7 | % | | | 49 | % | | | 50 | % | | | 41 | % | | | 62 | % | | | 33 | %² | |
² Data has not been annualized.
† Data has been annualized.
(a) The date on which Fund shares were first offered for sale to the public was October 2, 2006.
(b) Computed using average shares outstanding throughout the period.
(c) Amount rounds to less than $0.01 per share.
See accompanying Notes to Financial Statements.
THE OAKMARK FUNDS
87
OAKMARK INTERNATIONAL FUND
Financial Highlights–Class I
For a share outstanding throughout each period
| | | Six Months Ended
March 31, 2012
(Unaudited) | | Year Ended
September 30,
2011 | | Year Ended
September 30,
2010 | | Year Ended
September 30,
2009 | | Year Ended
September 30,
2008 | | Year Ended
September 30,
2007 | |
| Net Asset Value, Beginning of Period | | $ | 16.13 | | | $ | 18.18 | | | $ | 16.25 | | | $ | 15.71 | | | $ | 26.59 | | | $ | 26.83 | | |
| Income From Investment Operations: | |
| Net Investment Income | | | 0.03 | (a) | | | 0.31 | (a) | | | 0.20 | (a) | | | 0.16 | (a) | | | 0.65 | | | | 0.43 | | |
Net Gain (Loss) on Investments (both realized
and unrealized) | | | 3.30 | | | | (2.20 | ) | | | 1.85 | | | | 1.87 | | | | (7.11 | ) | | | 3.25 | | |
| Total From Investment Operations | | | 3.33 | | | | (1.89 | ) | | | 2.05 | | | | 2.03 | | | | (6.46 | ) | | | 3.68 | | |
| Less Distributions: | |
| From Net Investment Income | | | (0.13 | ) | | | (0.16 | ) | | | (0.12 | ) | | | (1.39 | ) | | | (0.17 | ) | | | (0.44 | ) | |
| From Capital Gains | | | 0.00 | | | | 0.00 | | | | 0.00 | | | | (0.10 | ) | | | (4.25 | ) | | | (3.48 | ) | |
| Total Distributions | | | (0.13 | ) | | | (0.16 | ) | | | (0.12 | ) | | | (1.49 | ) | | | (4.42 | ) | | | (3.92 | ) | |
| Redemption Fees | | | 0.00 | (b) | | | 0.00 | (b) | | | 0.00 | (b) | | | 0.00 | (b) | | | 0.00 | (b) | | | 0.00 | (b) | |
| Net Asset Value, End of Period | | $ | 19.33 | | | $ | 16.13 | | | $ | 18.18 | | | $ | 16.25 | | | $ | 15.71 | | | $ | 26.59 | | |
| Total Return | | | 20.78 | % | | | -10.54 | % | | | 12.67 | % | | | 17.71 | % | | | -28.59 | % | | | 14.53 | % | |
| Ratios/ Supplemental Data: | |
| Net Assets, End of Period ($million) | | $ | 8,428.3 | | | $ | 6,920.8 | | | $ | 5,707.4 | | | $ | 4,045.4 | | | $ | 3,753.6 | | | $ | 8,446.6 | | |
| Ratio of Expenses to Average Net Assets | | | 1.05 | %† | | | 1.06 | % | | | 1.08 | % | | | 1.17 | % | | | 1.10 | % | | | 1.05 | % | |
| Ratio of Net Investment Income to Average Net Assets | | | 0.39 | %† | | | 1.63 | % | | | 1.21 | % | | | 1.32 | % | | | 2.32 | % | | | 1.65 | % | |
| Portfolio Turnover Rate | | | 22 | % | | | 45 | % | | | 51 | % | | | 53 | % | | | 41 | % | | | 50 | % | |
Financial Highlights–Class II
For a share outstanding throughout each period
| | | Six Months Ended
March 31, 2012
(Unaudited) | | Year Ended
September 30,
2011 | | Year Ended
September 30,
2010 | | Year Ended
September 30,
2009 | | Year Ended
September 30,
2008 | | Year Ended
September 30,
2007 | |
| Net Asset Value, Beginning of Period | | $ | 16.18 | | | $ | 18.25 | | | $ | 16.38 | | | $ | 15.55 | | | $ | 26.32 | | | $ | 26.61 | | |
| Income From Investment Operations: | |
| Net Investment Income | | | 0.01 | | | | 0.24 | (a) | | | 0.14 | (a) | | | 0.14 | (a) | | | 0.39 | (a) | | | 0.35 | | |
Net Gain (Loss) on Investments (both realized
and unrealized) | | | 3.30 | | | | (2.20 | ) | | | 1.86 | | | | 1.96 | | | | (6.86 | ) | | | 3.19 | | |
| Total From Investment Operations | | | 3.31 | | | | (1.96 | ) | | | 2.00 | | | | 2.10 | | | | (6.47 | ) | | | 3.54 | | |
| Less Distributions: | |
| From Net Investment Income | | | (0.06 | ) | | | (0.11 | ) | | | (0.13 | ) | | | (1.17 | ) | | | (0.05 | ) | | | (0.35 | ) | |
| From Capital Gains | | | 0.00 | | | | 0.00 | | | | 0.00 | | | | (0.10 | ) | | | (4.25 | ) | | | (3.48 | ) | |
| Total Distributions | | | (0.06 | ) | | | (0.11 | ) | | | (0.13 | ) | | | (1.27 | ) | | | (4.30 | ) | | | (3.83 | ) | |
| Redemption Fees | | | 0.00 | (b) | | | 0.00 | (b) | | | 0.00 | (b) | | | 0.00 | (b) | | | 0.00 | (b) | | | 0.00 | (b) | |
| Net Asset Value, End of Period | | $ | 19.43 | | | $ | 16.18 | | | $ | 18.25 | | | $ | 16.38 | | | $ | 15.55 | | | $ | 26.32 | | |
| Total Return | | | 20.52 | % | | | -10.85 | % | | | 12.26 | % | | | 17.70 | % | | | -28.91 | % | | | 14.04 | % | |
| Ratios/Supplemental Data: | |
| Net Assets, End of Period ($million) | | $ | 245.8 | | | $ | 204.0 | | | $ | 146.0 | | | $ | 107.8 | | | $ | 130.8 | | | $ | 586.9 | | |
| Ratio of Expenses to Average Net Assets | | | 1.35 | %† | | | 1.45 | % | | | 1.45 | % | | | 1.32 | % | | | 1.52 | % | | | 1.44 | % | |
| Ratio of Net Investment Income to Average Net Assets | | | 0.08 | %† | | | 1.26 | % | | | 0.83 | % | | | 1.15 | % | | | 1.96 | % | | | 1.31 | % | |
| Portfolio Turnover Rate | | | 22 | % | | | 45 | % | | | 51 | % | | | 53 | % | | | 41 | % | | | 50 | % | |
† Data has been annualized.
(a) Computed using average shares outstanding throughout the period.
(b) Amount rounds to less than $0.01 per share.
THE OAKMARK FUNDS
88
OAKMARK INTERNATIONAL SMALL CAP FUND
Financial Highlights–Class I
For a share outstanding throughout each period
| | | Six Months Ended
March 31, 2012
(Unaudited) | | Year Ended
September 30,
2011 | | Year Ended
September 30,
2010 | | Year Ended
September 30,
2009 | | Year Ended
September 30,
2008 | | Year Ended
September 30,
2007 | |
| Net Asset Value, Beginning of Period | | $ | 11.56 | | | $ | 13.02 | | | $ | 11.51 | | | $ | 11.36 | | | $ | 23.19 | | | $ | 24.09 | | |
| Income From Investment Operations: | |
| Net Investment Income | | | 0.03 | (a) | | | 0.15 | (a) | | | 0.12 | (a) | | | 0.15 | (a) | | | 0.37 | | | | 0.32 | | |
Net Gain (Loss) on Investments (both realized
and unrealized) | | | 2.79 | | | | (1.53 | ) | | | 1.55 | | | | 1.06 | | | | (6.36 | ) | | | 2.77 | | |
| Total From Investment Operations | | | 2.82 | | | | (1.38 | ) | | | 1.67 | | | | 1.21 | | | | (5.99 | ) | | | 3.09 | | |
| Less Distributions: | |
| From Net Investment Income | | | (0.02 | ) | | | (0.08 | ) | | | (0.16 | ) | | | (0.93 | ) | | | (0.18 | ) | | | (0.56 | ) | |
| From Capital Gains | | | 0.00 | (b) | | | 0.00 | | | | 0.00 | | | | (0.13 | ) | | | (5.66 | ) | | | (3.43 | ) | |
| Total Distributions | | | (0.02 | ) | | | (0.08 | ) | | | (0.16 | ) | | | (1.06 | ) | | | (5.84 | ) | | | (3.99 | ) | |
| Redemption Fees | | | 0.00 | (b) | | | 0.00 | (b) | | | 0.00 | (b) | | | 0.00 | (b) | | | 0.00 | (b) | | | 0.00 | (b) | |
| Net Asset Value, End of Period | | $ | 14.36 | | | $ | 11.56 | | | $ | 13.02 | | | $ | 11.51 | | | $ | 11.36 | | | $ | 23.19 | | |
| Total Return | | | 24.41 | % | | | -10.72 | % | | | 14.70 | % | | | 16.28 | % | | | -32.47 | % | | | 13.35 | % | |
| Ratios/ Supplemental Data: | |
| Net Assets, End of Period ($million) | | $ | 1,602.5 | | | $ | 1,328.4 | | | $ | 1,217.2 | | | $ | 768.0 | | | $ | 663.6 | | | $ | 1,326.5 | | |
| Ratio of Expenses to Average Net Assets | | | 1.40 | %† | | | 1.38 | % | | | 1.38 | % | | | 1.54 | % | | | 1.41 | % | | | 1.34 | % | |
| Ratio of Net Investment Income to Average Net Assets | | | 0.43 | %† | | | 1.10 | % | | | 1.02 | % | | | 1.77 | % | | | 2.17 | % | | | 1.19 | % | |
| Portfolio Turnover Rate | | | 19 | % | | | 46 | % | | | 54 | % | | | 46 | % | | | 50 | % | | | 57 | % | |
Financial Highlights–Class II
For a share outstanding throughout each period
| | | Six Months Ended
March 31, 2012
(Unaudited) | | Year Ended
September 30,
2011 | | Year Ended
September 30,
2010 | | Year Ended
September 30,
2009 | | Year Ended
September 30,
2008 | | Year Ended
September 30,
2007 | |
| Net Asset Value, Beginning of Period | | $ | 11.50 | | | $ | 12.97 | | | $ | 11.50 | | | $ | 11.33 | | | $ | 23.15 | | | $ | 24.05 | | |
| Income From Investment Operations: | |
| Net Investment Income | | | 0.01 | (a) | | | 0.12 | (a) | | | 0.09 | (a) | | | 0.14 | (a) | | | 0.47 | | | | 0.29 | | |
Net Gain (Loss) on Investments (both realized
and unrealized) | | | 2.78 | | | | (1.55 | ) | | | 1.54 | | | | 1.06 | | | | (6.48 | ) | | | 2.79 | | |
| Total From Investment Operations | | | 2.79 | | | | (1.43 | ) | | | 1.63 | | | | 1.20 | | | | (6.01 | ) | | | 3.08 | | |
| Less Distributions: | |
| From Net Investment Income | | | 0.00 | | | | (0.04 | ) | | | (0.16 | ) | | | (0.90 | ) | | | (0.15 | ) | | | (0.55 | ) | |
| From Capital Gains | | | 0.00 | (b) | | | 0.00 | | | | 0.00 | | | | (0.13 | ) | | | (5.66 | ) | | | (3.43 | ) | |
| Total Distributions | | | 0.00 | (b) | | | (0.04 | ) | | | (0.16 | ) | | | (1.03 | ) | | | (5.81 | ) | | | (3.98 | ) | |
| Redemption Fees | | | 0.00 | (b) | | | 0.00 | (b) | | | 0.00 | (b) | | | 0.00 | (b) | | | 0.00 | (b) | | | 0.00 | (b) | |
| Net Asset Value, End of Period | | $ | 14.29 | | | $ | 11.50 | | | $ | 12.97 | | | $ | 11.50 | | | $ | 11.33 | | | $ | 23.15 | | |
| Total Return | | | 24.29 | % | | | -11.09 | % | | | 14.30 | % | | | 16.08 | % | | | -32.63 | % | | | 13.29 | % | |
| Ratios/Supplemental Data: | |
| Net Assets, End of Period ($million) | | $ | 2.4 | | | $ | 1.9 | | | $ | 1.4 | | | $ | 0.8 | | | $ | 0.3 | | | $ | 0.9 | | |
| Ratio of Expenses to Average Net Assets | | | 1.71 | %† | | | 1.72 | % | | | 1.72 | % | | | 1.71 | % | | | 1.54 | % | | | 1.43 | % | |
| Ratio of Net Investment Income to Average Net Assets | | | 0.17 | %† | | | 0.85 | % | | | 0.74 | % | | | 1.66 | % | | | 2.12 | % | | | 1.12 | % | |
| Portfolio Turnover Rate | | | 19 | % | | | 46 | % | | | 54 | % | | | 46 | % | | | 50 | % | | | 57 | % | |
† Data has been annualized.
(a) Computed using average shares outstanding throughout the period.
(b) Amount rounds to less than $0.01 per share.
See accompanying Notes to Financial Statements.
THE OAKMARK FUNDS
89
DISCLOSURE REGARDING THE BOARD OF TRUSTEES' OCTOBER 2011 APPROVAL OF INVESTMENT ADVISORY CONTRACTS AS APPROVED APRIL 18, 2012
Each year, the Board of Trustees of the Oakmark Funds (the "Board"), including a majority of the independent Trustees, is required by the Investment Company Act of 1940 (the "1940 Act") to determine whether to continue each Fund's investment advisory agreement (each an "Agreement") with the Fund's investment adviser (the "Adviser"). The Board requests and receives from the Adviser a broad range of materials and information that are relevant to the Trustees' consideration of the Agreements, both throughout the year and especially in connection with its annual review of the Agreements. In addition, the Board retains an independent data provider to provide performance and expense information for each Fund and for comparable funds.
The Board's committee on contracts (the "Committee") leads the Board in its evaluation of the Agreements. The Committee is comprised entirely of trustees who are not "interested persons" of the Funds as defined in the 1940 Act ("Independent Trustees"), and more than 75% of the Board is comprised of Independent Trustees. During the last year, the Committee and the Board met numerous times to consider the Agreements. At each of those meetings, the Committee and the Board were advised by, and met in executive session with, their experienced independent legal counsel.
In connection with their consideration of each Agreement, the Committee and the Board considered, among other things: (i) the nature, quality and extent of the Adviser's services, (ii) the investment performance of each Fund, as well as performance information for comparable funds, (iii) the fees and other expenses paid by each Fund, as well as fee and expense information for comparable funds and separate accounts managed by the Adviser, (iv) the profitability of the Adviser and its affiliates from their relationship with each Fund, (v) whether economies of scale may be realized as the Funds grow and whether fee levels share with Fund investors economies of scale and (vi) other benefits to the Adviser from its relationship with each Fund.
At a meeting held on October 19, 2011, the Board, including all of the Independent Trustees, upon recommendation of the Committee, determined that the continuation of the Agreement for each Fund was in the best interest of the Fund and its shareholders, and approved the continuation of the Agreements through October 31, 2012. Below is a summary of the principal information considered by the Board as well as the Board's conclusions regarding various factors. In their deliberations, the Independent Trustees did not identify any single factor that was paramount or determinative, and each Independent Trustee may have weighed the information differently.
1. Nature, Extent and Quality of Services
The Board's consideration of the nature, extent and quality of the Adviser's services to the Funds took into account the knowledge the Board gained during meetings with the Adviser throughout the year. In addition, the Board considered: the Adviser's long-term history of care and conscientiousness in the management of the Funds; the consistency of its investment approach; the background and experience of the Adviser's investment personnel responsible for managing the Funds; the Adviser's performance as administrator of the Funds; the Adviser's comprehensive compliance program; and the favorable recognition of the Adviser and the Funds in the media and in industry publications. The Board also reviewed the Adviser's resources and key personnel involved in providing investment management services to the Funds, including the time that investment personnel devoted to each Fund and the investment results produced as a result of the Adviser's in-house research. The Board also noted the significant personal investments that the Adviser's personnel have made in the Funds, which serve to further align the interests of the Adviser and its personnel with those of the Funds' shareholders. The Board concluded that the nature, extent and quality of the services provided by the Adviser to each Fund were appropriate and consistent with the Fund's Agreement and that each Fund was likely to continue to benefit from services provided under its Agreement with the Adviser.
2. Investment Performance of the Funds
The Board considered each Fund's investment performance over various time periods, including how the Fund performed compared to the performance of a group of comparable funds (the Fund's "Performance Universe") selected by Lipper, Inc. ("Lipper"). Among the performance periods considered by the Board
THE OAKMARK FUNDS
90
were those ended on April 30, 2011. Where available, the Board considered one-, three-, five- and ten-year performance.
Further detail considered by the Board regarding the investment performance of each Fund is set forth below:
Oakmark Fund. The Board considered that the Fund outperformed the annualized returns of its Universe Median during the three-, five- and ten-year periods presented, though it underperformed the Universe Median during the shorter one-year period.
Oakmark Select Fund. The Board considered that the Fund outperformed the annualized returns of its Universe Median during the three-, five- and ten-year periods presented, but it underperformed the Universe Median during the shorter one-year period.
Oakmark Equity and Income Fund. The Board took into account the Adviser's assertion that the Fund's risk profile generally is more conservative than many of its peers, which may result in relative underperformance during periods of exceptionally high returns in the equity markets. The Board considered that the Fund outperformed the annualized returns of its Universe Median during the three-, five- and ten-year periods, although it underperformed the Universe Median during the shorter one-year period.
Oakmark Global Fund. The Board considered that the Fund outperformed the annualized returns of its Universe Median during the three-, five- and ten-year periods, although it underperformed the Universe Median during the shorter one-year period.
Oakmark Global Select Fund. Noting that the Fund commenced operations in October 2006, the Board considered that the Fund outperformed the annualized returns of its Universe Median during the three-year and since inception periods, although it underperformed the Universe Median during the shorter one-year period.
Oakmark International Fund. The Board considered that the Fund outperformed the annualized returns of its Universe Median during the three-, five- and ten-year periods presented, but it underperformed the Universe Median during the shorter one-year period.
Oakmark International Small Cap Fund. The Board considered that the Fund outperformed the annualized returns of its Universe Median during the three-, five- and ten-year periods presented, but it underperformed the Universe Median during the shorter one-year period.
In addition to comparing each Fund's performance to that of its Performance Universe, the Board also considered each Fund's performance compared to that of its benchmark and other comparative data provided by Lipper, including each Fund's total return and performance relative to risk. After considering all of this information, the Board concluded that the Adviser was delivering performance for each Fund that was consistent with the long-term investment strategies being pursued by the Fund, and that the Fund and its shareholders were benefiting from the Adviser's investment management of the Fund
3. Costs of Services Provided and Profits Realized by the Adviser
Using information provided by Lipper, the Board evaluated each Fund's advisory fee compared to the advisory fee for other mutual funds comparable in size, character and investment strategy (the "Expense Group"), and each Fund's expense ratio compared to that of the Expense Group.
The Board also reviewed the Adviser's advisory fees for comparable institutional separate account clients and subadvised funds (for which the Adviser provides portfolio management services only). The Board noted the Adviser's explanation that, although in most instances, the fees paid by those other clients were lower than the fees paid by the Funds, the differences reflected the Adviser's significantly greater level of responsibilities and broader scope of services regarding the Funds, and the more extensive regulatory obligations and risks associated with managing the Funds.
The Board also considered the Adviser's costs in serving as the Fund's investment adviser and manager, including costs associated with technology, infrastructure and compliance necessary to manage the Funds. The Board reviewed the Adviser's methodology for allocating costs among the Adviser's lines of business and among the Funds. The Board also considered information regarding the structure of the Adviser's compensation program for portfolio managers, analysts and certain other employees and the relationship
THE OAKMARK FUNDS
91
of such compensation to the Adviser's ability to attract and retain quality personnel. Finally, the Board considered the Adviser's profitability analysis, as well as an Investment Management Industry Profitability Analysis prepared by Lipper. The Board examined the pre-tax profits realized by the Adviser and its affiliates from their relationship with each Fund, as presented in the profitability analyses, as well as the financial condition of the Adviser.
Further detail considered by the Board regarding the management fee rate and expense ratio of each Fund is set forth below:
Oakmark Fund and Oakmark Select Fund. The Board considered that each Fund's management fee rate and total expense ratio are higher than the respective medians of the Fund's Expense Group. The Board, in its consideration of expenses, also took into account its review of each Fund's performance.
Oakmark Equity and Income Fund, Oakmark Global Select Fund and Oakmark International Small Cap Fund. The Board considered that each Fund's management fee rate is higher than the respective medians of the Fund's Expense Group. The Board noted, however, that each Fund's total expense ratio, which reflects the total fees paid by an investor, is lower than the respective median of the Fund's Expense Group. The Board, in its consideration of expenses, also took into account its review of each Fund's performance.
Oakmark Global Fund. The Board considered that the Fund's management fee rate is at the median of the Fund's Expense Group, and the Fund's total expense ratio, which reflects the total fees paid by an investor, is lower than the median of the Fund's Expense Group. The Board, in its consideration of expenses, also took into account its review of the Fund's performance.
Oakmark International Fund. The Board considered that the Fund's management fee rate and total expense ratio, which reflects the total fees paid by an investor, are lower than the median of the Fund's Expense Group. The Board, in its consideration of expenses, also took into account its review of the Fund's performance.
After its review of all the matters addressed, including those outlined above, the Board concluded that the management fees paid by each Fund to the Adviser were reasonable in light of the services provided, and that the profitability of the Adviser's relationship with the Funds appeared to be reasonable in relation to the services performed.
4. Economies of Scale and Fee Levels Reflecting Those Economies
The Board considered whether each Fund's management fee structure provides for a sharing with shareholders of potential economies of scale that may be realized by the Adviser. The Board reviewed each Agreement, which includes breakpoints that decrease the management fee rate as a Fund's assets increase. The Board also considered that the Committee had negotiated with the Adviser for an additional breakpoint in the Agreement for Oakmark International Small Cap Fund. The Board concluded that the breakpoints in the fee schedule for each Fund allow shareholders to benefit from potential economies of scale that may be achieved by the Adviser.
5. Other Benefits Derived from the Relationship with the Funds
The Board also considered other benefits that accrue to the Adviser and its affiliates from their relationship with the Funds. The Board noted that an affiliate of the Adviser serves as the Funds' distributor, without compensation, pursuant to a written agreement the Board evaluates annually.
The Board also considered the Adviser's use of a portion of the commissions paid by the Funds on their portfolio brokerage transactions to obtain research products and services benefiting the Funds and/or other clients of the Adviser and considered the Adviser's assertion that its use of "soft" commission dollars to obtain research products and services was consistent with regulatory requirements.
After full consideration of the above factors, as well as other factors that were instructive in evaluating the Agreements, the Board, including all of the Independent Trustees, concluded that approval of the continuation of each Agreement was in the best interests of the Fund and its shareholders. On October 19, 2011, the Board continued each Agreement.
THE OAKMARK FUNDS
92
Reporting to Shareholders. The Funds reduce the number of duplicate prospectuses, annual and semi-annual reports your household receives by sending only one copy of each to those addresses shared by two or more accounts. Call the Funds at 1-800-OAKMARK to request individual copies of these documents. The Funds will begin sending individual copies thirty days after receiving your request.
Before investing in any Oakmark Fund, you should carefully consider the Fund's investment objectives, risks, management fees and other expenses. This and other important information is contained in a Fund's prospectus and summary prospectus. Please read the prospectus and summary prospectus carefully before investing. For more information, please visit oakmark.com or call 1-800-OAKMARK (1-800-625-6275).
The discussion of the Funds' investments and investment strategy (including current investment themes, the portfolio managers' research and investment process, and portfolio characteristics) represents the Funds' investments and the views of the portfolio managers and Harris Associates L.P., the Funds' investment adviser, at the time of this report, and are subject to change without notice.
Past performance is no guarantee of future results. The performance data quoted represents past performance. Current performance may be lower or higher than the performance data quoted. The investment return and principal value vary so that an investor's shares when redeemed may be worth more or less than the original cost. The performance of the Funds does not reflect the 2% redemption fee imposed on shares redeemed within 90 days of purchase with the exception of the Oakmark Fund, Oakmark Select Fund and Oakmark Equity & Income Fund which do not impose a redemption fee. To obtain the most recent month-end performance data, visit oakmark.com.
Current and future portfolio holdings are subject to risk.
Investing in value stocks presents the risk that value stocks may fall out of favor with investors and underperform growth stocks during given periods.
Because both Oakmark Select Fund and Oakmark Global Select Fund are non-diversified, the performance of each holding in those Funds will have a greater impact on the Funds' total returns, and may make the Funds' returns more volatile than a more diversified fund.
The Oakmark Equity and Income Fund closed to certain new investors as of 5/13/10.
Oakmark Equity and Income Fund may invest in medium- and lower-quality debt securities that have higher yield potential but present greater investment and credit risk than higher-quality securities. These risks may result in greater share price volatility. An economic downturn could severely disrupt the market in medium- or lower-grade debt securities and adversely affect the value of outstanding bonds and the ability of the issuers to repay principal and interest.
Investing in foreign securities presents risks that in some ways may be greater than in U.S. investments. Those risks include: currency fluctuation; different regulation, accounting standards, trading practices and levels of available information; generally higher transaction costs; and political risks.
The stocks of smaller companies often involve more risk than the stocks of larger companies. Stocks of small companies tend to be more volatile and have a smaller public market than stocks of larger companies. Small companies may have a shorter history of operations than larger companies, may not have as great an ability to raise additional capital and may have a less diversified product line, making them more susceptible to market pressure.
Endnotes:
1. Total return includes change in share prices and in each case includes reinvestment of any dividends and capital gain distributions.
2. Portfolio holdings are subject to change without notice and are not intended as recommendations of individual stocks.
3. The S&P 500 Total Return Index is a broad market-weighted average of U.S. blue-chip companies. This index is unmanaged and investors cannot invest directly in this index.
4. EPS refers to Earnings Per Share and is calculated by dividing total earnings by the number of shares outstanding.
THE OAKMARK FUNDS
93
5. The Price-Earnings Ratio ("P/E") is the most common measure of the expensiveness of a stock.
6. The Dow Jones Industrial Average is an index that includes only 30 U.S. blue-chip companies. This index is unmanaged and investors cannot invest directly in this index.
7. The Lipper Large Cap Value Fund Index is an equally weighted index of the largest 30 funds within the large cap value funds investment objective as defined by Lipper Inc. The index is adjusted for the reinvestment of capital gains and income dividends. This index is unmanaged and investors cannot invest directly in this index.
8. The Lipper Multi-Cap Value Funds Index tracks the results of the 30 largest mutual funds in the Lipper Multi-Cap Value Funds category. This index is unmanaged and investors cannot invest directly in this index.
9. The Lipper Balanced Fund Index measures the performance of the 30 largest U.S. balanced funds tracked by Lipper. This index is unmanaged and investors cannot invest directly in this index.
10. The Barclays Capital U.S. Government / Credit Bond Index is a benchmark index made up of the Barclays Capital U.S. Government and U.S. Corporate Bond indices, including U.S. government Treasury and agency securities as well as corporate and Yankee bonds. This index is unmanaged and investors cannot invest directly in this index.
11. The MSCI World Index (Net) is a free float-adjusted market capitalization weighted index that is designed to measure the global equity market performance of developed markets. This benchmark calculates reinvested dividends net of withholding taxes using Luxembourg tax rates. This index is unmanaged and investors cannot invest directly in this index.
12. The Lipper Global Fund Index measures the performance of the 30 largest mutual funds that invest in securities throughout the world. This index is unmanaged and investors cannot invest directly in this index.
13. The Japanese TOPIX Index is an index that measures stock prices on the Tokyo Stock Exchange (TSE). This capitalization-weighted index lists all firms that are considered to be under the 'first section' on the TSE, which groups all of the large firms on the exchange into one pool. This index is unmanaged and investors cannot actually make investments in this index.
14. The MSCI World ex U.S. Index (Net) is a free float-adjusted market capitalization index that is designed to measure international developed market equity performance, excluding the U.S. This benchmark calculates reinvested dividends net of withholding taxes using Luxembourg tax rates. This index is unmanaged and investors cannot invest directly in this index.
15. The MSCI EAFE (Europe, Australasia, Far East) Index (Net) is a free float-adjusted market capitalization index that is designed to measure the international equity market performance of developed markets, excluding the US & Canada. This benchmark calculates reinvested dividends net of withholding taxes using Luxembourg tax rates. This index is unmanaged and investors cannot invest directly in this index.
16. The Lipper International Fund Index reflects the net asset value weighted total return of the 30 largest international equity funds. This index is unmanaged and investors cannot invest directly in this index.
17. The MSCI World ex U.S. Small Cap Index (Net) is a free float-adjusted market capitalization index that is designed to measure global developed market equity performance, excluding the U.S. The MSCI Small Cap Indices target 40% of the eligible Small Cap universe within each industry group, within each country. MSCI defines the Small Cap universe as all listed securities that have a market capitalization in the range of USD200-1,500 million. This benchmark calculates reinvested dividends net of withholding taxes using Luxembourg tax rates. This index is unmanaged and investors cannot invest directly in this index.
18. The Lipper International Small Cap Funds Index measures the performance of the 10 largest international small-cap funds tracked by Lipper. This index is unmanaged and investors cannot invest directly in this index.
OAKMARK, OAKMARK FUNDS, OAKMARK INTERNATIONAL, and OAKMARK and tree design are trademarks owned or registered by Harris Associates L.P. in the U.S. and/or other countries.
THE OAKMARK FUNDS
94
Oakmark Glossary
Book value – A company's common stock equity as it appears on a balance sheet, equal to total assets minus liabilities, preferred stock, and intangible assets such as goodwill. A company's book value often differs substantially from economic value, especially in industries such as media.
Business value/Intrinsic value – The perceived or estimated actual value of a security, as opposed to its current market price or book value. Business value can be evaluated based on what a knowledgeable buyer would pay for a business if the company were sold in its entirety.
Growth investing – Investors who look for companies based on whether the stock of a company is growing earnings and/or revenue faster than the industry as a whole or the overall market. Growth investors generally expect high rates of growth to persist, and the stock, in turn, to deliver returns exceeding the market's. A growth mutual fund is generally one that emphasizes stocks believed to offer above-average growth prospects, with less emphasis on the stock's current price than a value mutual fund would have.
M & A (Mergers & Acquisitions) – Merger: the combining of two or more entities into one, through a purchase acquisition or a pooling of interests. Acquisition: can also be called a takeover, and is defined as acquiring control of a corporation, called a target, by stock purchase or exchange, either hostile or friendly.
Market capitalization (market cap or cap) – The market price of an entire company on any given day, calculated by multiplying the number of shares outstanding by the price per share.
Momentum investing – Approach to investing based on the belief that stock price trends are likely to continue. Momentum investors tend to buy stocks that have been outperforming the market and to sell those stocks when their relative performance deteriorates. Momentum investors typically do not consider a company's underlying value or fundamentals in their investment decisions.
Multiple – A ratio used to measure a stock's valuation, usually greater than 1. Sometimes used to mean price/earnings ratio.
P/B or Price-to-Book Ratio – A stock's capitalization divided by its book value. The value is the same whether the calculation is done for the whole company or on a per-share basis.
P/E or Price-to-Earnings Ratio – The most common measure of a stock's valuation. It is equal to a stock's capitalization divided by its after-tax earnings over a 12-month period. The value is the same whether the calculation is done for the whole company or on a per-share basis. Equivalently, the cost an investor in a given stock must pay per dollar of current annual earnings. Also called earnings multiple.
Share repurchase – Program through which a corporation buys back its own shares in the open market, typically an indication that the corporation's management believes the stock price is undervalued.
Value investing – Investors who utilize valuation measures such as business value (including growth rate), price/earnings ratio, price/book ratio, and yield to gauge the attractiveness of a company. Managers who employ a value investment style believe that the true, underlying value of a company is not reflected in its current share price, and, over time, the price has potential to increase as the market recognizes the overall value of the business. Value stocks sell at relatively low prices in relation to their underlying business value, earnings, or book value.
Stocks become undervalued for a variety of reasons, including an overall market decline, or when a specific industry falls into disfavor and investors view all companies in that industry in the same light. Consequently, an individual company's stock price may fall, even though it may be only temporarily affected by the industry's problems and its underlying value has remained unchanged.
"x times earnings" (e.g. "12 times earnings") – Another way to express a stock's price-to-earnings (P/E) ratio. A stock with a P/E ratio of 12 sells at 12 times earnings.
THE OAKMARK FUNDS
95

(This page has been intentionally left blank.)
THE OAKMARK FUNDS
96
THE OAKMARK FUNDS
Trustees and Officers
Trustees
Gary N. Wilner, M.D.—Chairman
Michael J. Friduss
Thomas H. Hayden
Christine M. Maki
Allan J. Reich
Steven S. Rogers
Kristi L. Rowsell
Burton W. Ruder
Peter S. Voss
Officers
Kristi L. Rowsell—President and Principal Executive Officer
Robert M. Levy—Executive Vice President
Henry R. Berghoef—Vice President
John N. Desmond—Vice President
Richard J. Gorman—Vice President, Chief Compliance
Officer and Assistant Secretary
Kevin G. Grant—Vice President
Thomas E. Herman—Principal Financial Officer
David G. Herro—Vice President
John J. Kane—Treasurer
Michael L. Manelli—Vice President
Clyde S. McGregor—Vice President
Michael J. Neary—Vice President
William C. Nygren—Vice President
John R. Raitt—Vice President
Vineeta D. Raketich—Vice President
Janet L. Reali—Vice President and Secretary
Robert A. Taylor—Vice President
Andrew J. Tedeschi—Assistant Treasurer
Other Information
Investment Adviser
Harris Associates L.P.
Two North LaSalle Street
Chicago, Illinois 60602-3790
Transfer Agent
Boston Financial Data Services, Inc.
Quincy, Massachusetts
Legal Counsel
K&L Gates LLP
Chicago, Illinois
Independent Registered Public
Accounting Firm
Deloitte & Touche LLP
Chicago, Illinois
For More Information
Please call 1-800-OAKMARK
(1-800-625-6275)
or 617-483-8327
Website
oakmark.com
To obtain a prospectus, a new account application, forms or periodic reports, access our web site at oakmark.com, or call 1-800-OAKMARK (1-800-625-6275) or (617) 483-8327.
The Funds will file its complete schedule of portfolio holdings with the Securities and Exchange Commission (the "SEC") for the first and third quarters of each fiscal year on Form N-Q. The Funds' Forms N-Q are available on the SEC's website at www.sec.gov. The Funds' Forms N-Q may be reviewed and copied at the SEC's Public Reference Room in Washington, DC, and information on the operation of the Public Reference Room may be obtained by calling 1-800-SEC-0330.
A description of the policies and procedures the Funds use to determine how to vote proxies relating to portfolio securities is available without charge, upon request, by calling toll-free 1-800-625-6275; on the Funds' website at oakmark.com; and on the SEC's website at www.sec.gov.
No later than August 31 of each year, information regarding how the Adviser, on behalf of the Funds, voted proxies relating to the Funds' portfolio securities for the twelve months ended the preceding June 30 will be available through a link on the Funds' website at oakmark.com and on the SEC's website at www.sec.gov.
This report is submitted for the general information of the Funds' shareholders. The report is not authorized for distribution to prospective investors in the Funds unless it is accompanied or preceded by the Funds' currently effective prospectus.
No sales charge to the shareholder or to the new investor is made in offering the shares of the Funds, however, a shareholder may incur a 2% redemption fee on an exchange or redemption of shares redeemed within 90 days of purchase with the exception of the Oakmark Fund, Oakmark Select Fund and Oakmark Equity & Income Fund which do not impose a redemption fee.
1-800-OAKMARK
oakmark.com
The Oakmark Funds are distributed by Harris Associates Securities L.P., member FINRA. Date of first use: May 2012.
OAKMARK FUND CLASS II
THE VALUE OF A $10,000 INVESTMENT IN OAKMARK FUND FROM ITS
INCEPTION (4/5/01) TO PRESENT (3/31/12) AS COMPARED TO THE
STANDARD & POOR'S 500 INDEX (UNAUDITED)
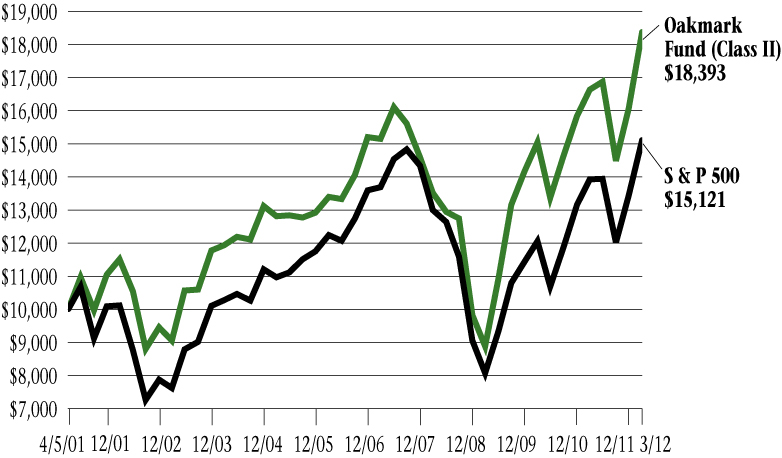
Average Annual Total Returns
(as of 3/31/12)
| (Unaudited) | | 1-year | | 5-year | | 10-year | | Since
Inception
(4/5/01) | |
| Oakmark Fund (Class II) | | | 10.43 | % | | | 3.94 | % | | | 4.81 | % | | | 5.70 | % | |
| S&P 500 Index | | | 8.54 | % | | | 2.01 | % | | | 4.12 | % | | | 3.84 | % | |
The graph and table do not reflect the deduction of taxes that a shareholder would pay on fund distributions or the redemption of fund shares.
The expense ratio for Class II shares as of 9/30/11 was 1.45%.
The performance data quoted represents past performance. Past performance does not guarantee future results. The investment return and principal value will fluctuate so that an investor's shares, when redeemed, may be worth more or less than their original cost. Current performance may be lower or higher than the performance data quoted. Average annual total return measures annualized change, while total return measures aggregate change. To obtain most recent month-end performance data, visit oakmark.com.
The S&P 500 Total Return Index is a broad market-weighted average of U.S. blue-chip companies. This index is unmanaged and investors cannot invest directly in this index.
Harris Associates Securities L.P., member FINRA, March 2012
OAKMARK SELECT FUND CLASS II
THE VALUE OF A $10,000 INVESTMENT IN OAKMARK SELECT FUND FROM ITS
INCEPTION (12/31/99) TO PRESENT (3/31/12) AS COMPARED TO THE
STANDARD & POOR'S 500 INDEX (UNAUDITED)

Average Annual Total Returns
(as of 3/31/12)
| (Unaudited) | | 1-year | | 5-year | | 10-year | | Since
Inception
(12/31/99) | |
| Oakmark Select Fund (Class II) | | | 10.51 | % | | | 2.44 | % | | | 4.60 | % | | | 7.87 | % | |
| S&P 500 Index | | | 8.54 | % | | | 2.01 | % | | | 4.12 | % | | | 1.52 | % | |
The graph and table do not reflect the deduction of taxes that a shareholder would pay on fund distributions or the redemption of fund shares.
The expense ratio for Class II shares as of 9/30/11 was 1.38%.
The performance data quoted represents past performance. Past performance does not guarantee future results. The investment return and principal value will fluctuate so that an investor's shares, when redeemed, may be worth more or less than their original cost. Current performance may be lower or higher than the performance data quoted. Average annual total return measures annualized change, while total return measures aggregate change. To obtain most recent month-end performance data, visit oakmark.com.
The S&P 500 Total Return Index is a broad market-weighted average of U.S. blue-chip companies. This index is unmanaged and investors cannot invest directly in this index.
Harris Associates Securities L.P., member FINRA, March 2012
OAKMARK EQUITY AND INCOME FUND CLASS II
THE VALUE OF A $10,000 INVESTMENT IN OAKMARK EQUITY AND INCOME
FUND FROM ITS INCEPTION (7/12/00) TO PRESENT (3/31/12) AS COMPARED TO
THE LIPPER BALANCED FUND INDEX (UNAUDITED)

Average Annual Total Returns
(as of 3/31/12)
| (Unaudited) | | 1-year | | 5-year | | 10-year | | Since
Inception
(7/13/00) | |
Oakmark Equity & Income Fund
(Class II) | | | 3.41 | % | | | 4.97 | % | | | 7.15 | % | | | 8.91 | % | |
| Lipper Balanced Fund Index | | | 4.60 | % | | | 3.04 | % | | | 4.86 | % | | | 3.76 | % | |
The graph and table do not reflect the deduction of taxes that a shareholder would pay on fund distributions or the redemption of fund shares.
The expense ratio for Class II shares as of 9/30/11 was 1.09%.
The performance data quoted represents past performance. Past performance does not guarantee future results. The investment return and principal value will fluctuate so that an investor's shares, when redeemed, may be worth more or less than their original cost. Current performance may be lower or higher than the performance data quoted. Average annual total return measures annualized change, while total return measures aggregate change. To obtain most recent month-end performance data, visit oakmark.com.
The Lipper Balanced Fund Index measures the performance of the 30 largest U.S. balanced funds tracked by Lipper. This index is unmanaged and investors cannot invest directly in this index.
Harris Associates Securities L.P., member FINRA, March 2012
OAKMARK GLOBAL FUND CLASS II
THE VALUE OF A $10,000 INVESTMENT IN OAKMARK GLOBAL FUND
FROM ITS INCEPTION (10/10/01) TO PRESENT (3/31/12) AS COMPARED TO THE
MSCI WORLD INDEX (UNAUDITED)

Average Annual Total Returns
(as of 3/31/12)
| (Unaudited) | | 1-year | | 5-year | | 10-year | | Since
Inception
(10/10/01) | |
| Oakmark Global Fund (Class II) | | | -0.49 | % | | | 0.38 | % | | | 8.45 | % | | | 11.08 | % | |
| MSCI World Index | | | 0.56 | % | | | -0.70 | % | | | 4.72 | % | | | 5.03 | % | |
The graph and table do not reflect the deduction of taxes that a shareholder would pay on fund distributions or the redemption of fund shares.
The expense ratio for Class II shares as of 9/30/11 was 1.55%.
The performance data quoted represents past performance. The above performance information does not reflect the imposition of a 2% redemption fee on shares held for 90 days or less. If reflected, the fee would reduce the performance quoted. Past performance does not guarantee future results. The investment return and principal value will fluctuate so that an investor's shares, when redeemed, may be worth more or less than their original cost. Current performance may be lower or higher than the performance data quoted. Average annual total return measures annualized change, while total return measures aggregate change. To obtain most recent month-end performance data, visit oakmark.com.
The MSCI World Index (Net) is a free float-adjusted market capitalization weighted index that is designed to measure the global equity market performance of developed markets. This benchmark calculates reinvested dividends net of withholding taxes using Luxembourg tax rates. This index is unmanaged and investors cannot invest directly in this index.
Harris Associates Securities L.P., member FINRA, March 2012
OAKMARK INTERNATIONAL FUND CLASS II
THE VALUE OF A $10,000 INVESTMENT IN OAKMARK INTERNATIONAL FUND
FROM ITS INCEPTION (11/4/99) TO PRESENT (3/31/12) AS COMPARED TO THE
MSCI WORLD EX U.S. INDEX (UNAUDITED)
Average Annual Total Returns
(as of 3/31/12)
| (Unaudited) | | 1-year | | 5-year | | 10-year | | Since
Inception
(11/4/99) | |
| Oakmark International Fund (Class II) | | | -2.30 | % | | | 0.06 | % | | | 7.60 | % | | | 8.02 | % | |
| MSCI World ex U.S. Index | | | -6.67 | % | | | -2.95 | % | | | 6.12 | % | | | 2.67 | % | |
The graph and table do not reflect the deduction of taxes that a shareholder would pay on fund distributions or the redemption of fund shares.
The expense ratio for Class II shares as of 9/30/11 was 1.45%.
The performance data quoted represents past performance. Past performance does not guarantee future results. The investment return and principal value will fluctuate so that an investor's shares, when redeemed, may be worth more or less than their original cost. Current performance may be lower or higher than the performance data quoted. Average annual total return measures annualized change, while total return measures aggregate change. To obtain most recent month-end performance data, visit oakmark.com.
The MSCI World ex U.S. Index (Net) is a free float-adjusted market capitalization index that is designed to measure international developed market equity performance, excluding the U.S. This benchmark calculates reinvested dividends net of withholding taxes using Luxembourg tax rates. This index is unmanaged and investors cannot invest directly in this index.
Harris Associates Securities L.P., member FINRA, March 2012
OAKMARK INTERNATIONAL
SMALL CAP FUND CLASS II
THE VALUE OF A $10,000 INVESTMENT IN OAKMARK INTERNATIONAL SMALL CAP FUND FROM ITS INCEPTION (1/8/01) TO PRESENT (3/31/12) AS COMPARED TO THE MSCI WORLD EX U.S. SMALL CAP INDEX (UNAUDITED)
Average Annual Total Returns
(as of 3/31/12)
| (Unaudited) | | 1-year | | 5-year | | 10-year | | Since
Inception
(1/8/01) | |
Oakmark International Small Cap Fund
(Class II) | | | -2.30 | % | | | -1.11 | % | | | 10.66 | % | | | 11.38 | % | |
| MSCI World ex U.S. Small Cap Index | | | -7.38 | % | | | -2.11 | % | | | 10.15 | % | | | 8.50 | % | |
The graph and table do not reflect the deduction of taxes that a shareholder would pay on fund distributions or the redemption of fund shares.
The expense ratio for Class II shares as of 9/30/11 was 1.72%.
The performance data quoted represents past performance. Past performance does not guarantee future results. The investment return and principal value will fluctuate so that an investor's shares, when redeemed, may be worth more or less than their original cost. Current performance may be lower or higher than the performance data quoted. Average annual total return measures annualized change, while total return measures aggregate change. To obtain most recent month-end performance data, visit oakmark.com.
The MSCI World ex U.S. Small Cap Index (Net) is a free float-adjusted market capitalization index that is designed to measure global developed market equity performance, excluding the U.S. The MSCI Small Cap Indices target 40% of the eligible Small Cap universe within each industry group, within each country. MSCI defines the Small Cap universe as all listed securities that have a market capitalization in the range of USD200-1,500 million. This benchmark calculates reinvested dividends net of withholding taxes using Luxembourg tax rates. This index is unmanaged and investors cannot invest directly in this index.
Harris Associates Securities L.P., member FINRA, March 2012
FUND EXPENSES (Unaudited)
A shareholder of each Fund can incur two types of costs: (1) transaction costs, such as redemption fees, and (2) ongoing costs, including investment advisory fees, transfer agent fees and other fund expenses. The examples below are intended to help shareholders understand the ongoing costs (in dollars) of investing in each Fund and to compare these costs with the ongoing costs of investing in other funds.
Actual Expenses
The following table provides information about actual account values and actual fund expenses for Class II Shares of each Fund. The table shows the expenses a Class II shareholder would have paid on a $1,000 investment in each Fund from October 1, 2011 to March 31, 2012, as well as how much a $1,000 investment would be worth at the close of the period, assuming actual fund returns and expenses. Class II shareholders can estimate expenses incurred for the period by dividing their account value at March 31, 2012 by $1,000 and multiplying the result by the number in the Expenses Paid During Period row as shown below.
Shares of all Funds, other than the Oakmark Fund, Oakmark Select Fund and Oakmark Equity & Income Fund, invested for 90 days or less may be charged a 2% redemption fee. Please consult the Funds' prospectus at oakmark.com for more information.
| | | Oakmark
Fund | | Oakmark
Select Fund | | Oakmark
Equity and
Income Fund | | Oakmark
Global Fund | | Oakmark
International
Fund | | Oakmark
International
Small Cap
Fund | |
| Beginning Account Value | | $ | 1,000.00 | | | $ | 1,000.00 | | | $ | 1,000.00 | | | $ | 1,000.00 | | | $ | 1,000.00 | | | $ | 1,000.00 | | |
| Ending Account Value | | $ | 1,269.50 | | | $ | 1,269.40 | | | $ | 1,173.40 | | | $ | 1,219.90 | | | $ | 1,205.20 | | | $ | 1,242.90 | | |
| Expenses Paid During Period* | | $ | 7.32 | | | $ | 7.60 | | | $ | 6.03 | | | $ | 8.60 | | | $ | 7.44 | | | $ | 9.59 | | |
| Annualized Expense Ratio | | | 1.29 | % | | | 1.34 | % | | | 1.11 | % | | | 1.55 | % | | | 1.35 | % | | | 1.71 | % | |
* Expenses are equal to each Fund's annualized expense ratio for Class II, multiplied by the average account value over the period, multiplied by the number of days in the most recent fiscal half-year divided by 366 (to reflect the one-half year period).
Hypothetical Example for Comparison Purposes
The following table provides information about hypothetical account values and hypothetical expenses for Class II Shares of each Fund based on actual expense ratios and an assumed rate of return of 5% per year before expenses, which are not the Funds' actual returns. The hypothetical account values and expenses may not be used to estimate the actual ending account balances or expenses shareholders paid for the period. Shareholders may use this information to compare the ongoing costs of investing in a Fund and other funds. To do so, compare this 5% hypothetical example with the 5% hypothetical examples that appear in the shareholder reports of the other funds.
Please note that the expenses shown in the table are meant to highlight your ongoing costs only and do not reflect any transaction costs, such as redemption fees. Therefore, the third line of the table is useful in comparing ongoing costs only, and will not help you determine the relative total costs of owning different funds. If these transaction costs were included, the total costs would have been higher.
| | | Oakmark
Fund | | Oakmark
Select Fund | | Oakmark
Equity and
Income Fund | | Oakmark
Global Fund | | Oakmark
International
Fund | | Oakmark
International
Small Cap
Fund | |
| Beginning Account Value | | $ | 1,000.00 | | | $ | 1,000.00 | | | $ | 1,000.00 | | | $ | 1,000.00 | | | $ | 1,000.00 | | | $ | 1,000.00 | | |
| Ending Account Value | | $ | 1,018.55 | | | $ | 1,018.30 | | | $ | 1,019.45 | | | $ | 1,017.25 | | | $ | 1,018.25 | | | $ | 1,016.45 | | |
| Expenses Paid During Period* | | $ | 6.51 | | | $ | 6.76 | | | $ | 5.60 | | | $ | 7.82 | | | $ | 6.81 | | | $ | 8.62 | | |
| Annualized Expense Ratio | | | 1.29 | % | | | 1.34 | % | | | 1.11 | % | | | 1.55 | % | | | 1.35 | % | | | 1.71 | % | |
* Expenses are equal to each Fund's annualized expense ratio for Class II, multiplied by the average account value over the period, multiplied by the number of days in the most recent fiscal half-year divided by 366 (to reflect the one-half year period).
Item 2. Code of Ethics.
Not required in this filing.
Item 3. Audit Committee Financial Expert.
Not required in this filing.
Item 4. Principal Accountant Fees and Services.
Not required in this filing.
Item 5. Audit Committee of Listed Registrants.
Not required in this filing.
Item 6. Investments.
(a) The Schedule of Investments in securities of unaffiliated issuers is included as part of the semi-annual report to shareholders filed under Item 1 of this Form.
(b) No disclosures are required by this Item 6(b).
Item 7. Disclosure of Proxy Voting Policies and Procedures for Closed-End Management Investment Companies.
Not applicable.
Item 8. Portfolio Managers of Closed-End Management Investment Companies.
Not applicable.
Item 9. Purchases of Equity Securities by Closed-End Management Investment Company and Affiliated Purchasers.
Not applicable.
Item 10. Submission of Matters to a Vote of Security Holders.
During the period covered by this report, no amendments were made to the procedures adopted in fiscal year 2007.
Item 11. Controls and Procedures.
(a) Based on an evaluation of the disclosure controls and procedures (as defined in Rule
30a-3(c) under the Investment Company Act of 1940, the “Disclosure Controls”), the Disclosure Controls are effectively designed to ensure that information required to be disclosed by the Registrant in this report is recorded, processed, summarized and reported within 90 days prior to the filing of this report, including ensuring that information required to be disclosed in this report is accumulated and communicated to the Registrant’s management, including the Registrant’s principal executive officer and principal financial officer, as appropriate to allow timely decisions regarding required disclosure.
(b) There were no changes in the Registrant’s internal controls over financial reporting (as defined in Rule 30a-3(d) under the Investment Company Act of 1940) that occurred during the Registrant’s second fiscal quarter of the time period covered by this report that has materially affected, or is reasonably likely to materially affect, the Registrant’s internal control over financial reporting.
Item 12. Exhibits.
(a) | (1) | Not required in this filing. |
| | |
| (2) | Certifications of Kristi L. Rowsell, Principal Executive Officer, and Thomas E. Herman, Principal Financial Officer, pursuant to Rule 30a-2(a) under the Investment Company Act of 1940 (17 CFR 270.30a-2(a)), attached hereto as Exhibits (a)(2)(i) and (a)(2)(ii). |
| | |
| (3) | Not applicable. |
| | |
(b) | | Certifications of Kristi L. Rowsell, Principal Executive Officer and Thomas E. Herman, Principal Financial Officer, pursuant to Section 906 of the Sarbanes-Oxley Act of 2002, attached hereto as Exhibit (b). |
SIGNATURES
Pursuant to the requirements of the Securities Exchange Act of 1934 and the Investment Company Act of 1940, the Registrant has duly caused this report to be signed on its behalf by the undersigned, thereunto duly authorized.
Harris Associates Investment Trust
By: | /s/ Kristi L. Rowsell | |
| Kristi L. Rowsell | |
| Principal Executive Officer | |
Date: | May 24, 2012 | |
Pursuant to the requirements of the Securities Exchange Act of 1934 and the Investment Company Act of 1940, this report has been signed below by the following persons on behalf of the Registrant and in the capacities and on the dates indicated.
By: | /s/ Kristi L. Rowsell | |
| Kristi L. Rowsell | |
| Principal Executive Officer | |
Date: | May 24, 2012 | |
| | |
| | |
By: | /s/ Thomas E. Herman | |
| Thomas E. Herman | |
| Principal Financial Officer | |
Date: | May 24, 2012 | |