UNITED STATES
SECURITIES AND EXCHANGE COMMISSION
Washington, D.C. 20549
FORM N-CSR
CERTIFIED SHAREHOLDER REPORT OF REGISTERED
MANAGEMENT INVESTMENT COMPANIES
Investment Company Act file number | 811-06279 |
|
Harris Associates Investment Trust |
(Exact name of registrant as specified in charter) |
|
Two North La Salle Street, Suite 500 | | |
Chicago, Illinois | | 60602-3790 |
(Address of principal executive offices) | | (Zip code) |
|
John R. Raitt | Paulita A. Pike |
Harris Associates L.P. | K&L Gates LLP |
Two North La Salle Street, #500 | Three First National Plaza, #3100 |
Chicago, Illinois 60602 | Chicago, Illinois 60602 |
(Name and address of agent for service) |
|
Registrant’s telephone number, including area code: | (312) 621-0600 | |
|
Date of fiscal year end: | 9/30/09 | |
|
Date of reporting period: | 3/31/09 | |
| | | | | | | | | |
Item 1. Reports to Shareholders.
SEMI-ANNUAL REPORT
MARCH 31, 2009

Advised by Harris Associates L.P.
THE OAKMARK FUNDS
2009 Semi-Annual Report
| President's Letter | | | 1 | | |
|
| Summary Information | | | 2 | | |
|
| Fund Expenses | | | 4 | | |
|
| Commentary on Oakmark and Oakmark Select Funds | | | 6 | | |
|
| Oakmark Fund | |
|
| Letter from the Portfolio Managers | | | 8 | | |
|
| Schedule of Investments | | | 9 | | |
|
| Oakmark Select Fund | |
|
| Letter from the Portfolio Managers | | | 13 | | |
|
| Schedule of Investments | | | 14 | | |
|
| Oakmark Equity and Income Fund | |
|
| Letter from the Portfolio Managers | | | 16 | | |
|
| Schedule of Investments | | | 19 | | |
|
| Oakmark Global Fund | |
|
| Letter from the Portfolio Managers | | | 25 | | |
|
| Global Diversification Chart | | | 28 | | |
|
| Schedule of Investments | | | 29 | | |
|
| Oakmark Global Select Fund | |
|
| Letter from the Portfolio Managers | | | 33 | | |
|
| Global Diversification Chart | | | 35 | | |
|
| Schedule of Investments | | | 36 | | |
|
| Commentary on International and International Small Cap Funds | | | 39 | | |
|
| Oakmark International Fund | |
|
| Letter from the Portfolio Managers | | | 40 | | |
|
| Global Diversification Chart | | | 42 | | |
|
| Schedule of Investments | | | 43 | | |
|
| Oakmark International Small Cap Fund | |
|
| Letter from the Portfolio Managers | | | 48 | | |
|
| Global Diversification Chart | | | 50 | | |
|
| Schedule of Investments | | | 51 | | |
|
| Financial Statements | |
|
| Statements of Assets and Liabilities | | | 58 | | |
|
| Statements of Operations | | | 60 | | |
|
| Statements of Changes in Net Assets | | | 62 | | |
|
| Notes to Financial Statements | | | 69 | | |
|
| Disclosure Regarding Investment Advisory Contract Approval | | | 86 | | |
|
| Oakmark Glossary | | | 92 | | |
|
| Trustees and Officers | | | 93 | | |
|
FORWARD-LOOKING STATEMENT DISCLOSURE
One of our most important responsibilities as mutual fund managers is to communicate with shareholders in an open and direct manner. Some of our comments in our letters to shareholders are based on current management expectations and are considered "forward-looking statements". Actual future results, however, may prove to be different from our expectations. You can identify forward-looking statements by words such as "estimate", "may", "will", "expect", "believe", "plan" and other similar terms. We cannot promise future returns. Our opinions are a reflection of our best judgment at the time this report is compiled, and we disclaim any obligation to update or alter forward-looking statements as a result of new information, future events, or otherwise.
President's Letter

Dear Fellow Shareholders,
Continued economic weakness and financial system stress weighed heavily on world markets again in the first quarter. The broad U.S. and international market indexes have now fallen well over 45% from their peak in 2007. Even though most of our Funds declined significantly less than the market averages this quarter, we are still disappointed to be reporting another quarter of losses.
Investor Psychology and the Economic Recovery
Over the past quarter, we have had many questions and heard much speculation about when or even if the world economic recovery will begin. Indeed, amidst the relentless waves of bad economic news, it is easy to become overwhelmed by the magnitude of the economy's problems and the seeming inevitability of further economic decline. Cognitive psychologists remind us of the difficulty of keeping perspective amidst a crisis and how "recency bias"—the fact that recent events and information can take on greater importance than more distant events—can distort economic decisions. We believe that an awareness of this effect is an important component of a disciplined investment process.
If we step back from the heat of events and objectively view the current recession in the longer term context of past cycles, we believe that its continuation appears a lot less inevitable. Although we face major problems that need to be fixed, the U.S. economic machine is still fundamentally sound and powerful. Furthermore, government actions and the self-correcting nature of markets are helping heal the economy. Factors contributing to this include: 1) the Fed has now been easing monetary policy for 20 months and has provided massive stimulus for more than six months, 2) short-term global interest rates have fallen more than two points, 3) mortgage rates have fallen more than one point, and housing affordability has actually reached its highest level since the early '70s, 4) energy prices are down and 5) the fiscal stimulus packages are starting to kick in. All of these factors will likely take time to have a positive impact on the economy , but careful observers will actually note some positive signs amidst the drumbeat of negative news—flattening consumer spending, a slight uptick in March auto sales, and increasing sales of existing homes.
We know that the recovery from this downturn will be difficult, but we believe that the seeds of a recovery are planted.... and are growing.
Maintaining Exposure to Equities:
The Critical Decision
In addition to questions about the economy, we are also frequently asked, "Has the market bottomed yet?" Many apprehensive investors have moved from stocks to U.S. government bonds and cash, hoping to avoid further losses and then re-enter the market when it hits bottom. We humbly recognize that the vast majority of investors, ourselves included, have no ability to accurately predict short-term movements in the stock market. Instead, we focus on analyzing individual stocks and factors that we can control: business quality, company management and valuation at the time of purchase. Bill Nygren eloquently argues in his quarterly commentary that equities are unusually attractive at current valuation levels. Although it is impossible to predict precisely when the credit squeeze, the recession and investor panic will end, we are confident that, in time, the economy will recover and that stocks will reflect more normal valuations. From the current extremes of undervaluation, we believe that stocks offer returns over a three- to five-year time frame that are well above historical averages.
With this in mind, we believe that the most important decision is not one of timing, but a decision to build and/or maintain a significant long-term exposure to equities, staying focused on the outsized returns that history—and our analysis—suggests that they offer.
We appreciate the trust and confidence that you have placed in us, particularly during these difficult times. We thank you for your continued patience and support. We welcome your comments and questions. You can reach us via e-mail at ContactOakmark@oakmark.com.
John R. Raitt
President and CEO of The Oakmark Funds
President and CEO of Harris Associates L.P.
March 31, 2009
1
THE OAKMARK FUNDS
Summary Information
Performance for Periods
Ended March 31, 20091 | | Oakmark
Fund—Class I
(OAKMX) | | Oakmark
Select Fund—Class I
(OAKLX) | | Oakmark
Equity and Income
Fund—Class I
(OAKBX) | | Oakmark
Global Fund—Class I
(OAKGX) | |
| 3 Months* | | | -9.59 | % | | | -6.26 | % | | | -6.03 | % | | | -13.70 | % | |
| 1 Year | | | -34.23 | % | | | -35.28 | % | | | -21.99 | % | | | -42.31 | % | |
Average Annual Total
Return for: | |
| 3 Year | | | -12.55 | % | | | -17.11 | % | | | -1.41 | % | | | -12.98 | % | |
| 5 Year | | | -5.47 | % | | | -8.10 | % | | | 2.37 | % | | | -2.36 | % | |
| 10 Year | | | -0.23 | % | | | 2.21 | % | | | 7.99 | % | | | N/A | | |
| Since inception | | | 10.09%
(8/5/91) | | | | 8.75%
(11/1/96) | | | | 10.07%
(11/1/95) | | | | 6.67%3
(8/4/99) | | |
Top Five Equity
Holdings as of
March 31, 20092
Company and % of Total
Net Assets | | | Best Buy Co., Inc. 3.4%
Liberty Media Corp.
-Entertainment 3.0%
Walgreen Co. 2.7%
Intel Corp. 2.7%
Schering-Plough
Corp. 2.6% | | | | Discovery
Communications, Inc.
Class C 8.7%
Liberty Media Corp.
-Entertainment 7.5%
H&R Block, Inc. 7.3%
Schering-Plough
Corp. 6.3%
Best Buy Co., Inc. 5.1% | | | | XTO Energy, Inc. 3.6%
EnCana Corp. 2.7%
Nestle SA 2.7%
General Dynamics
Corp. 2.6%
ConAgra Foods, Inc. 2.5% | | | | Credit Suisse
Group 4.7%
Oracle Corp. 4.7%
Daiwa Securities
Group Inc. 4.6%
Laboratory Corp. of
America Holdings 4.5%
Snap-on, Inc. 4.0% | | |
Sector
Allocation as of
March 31, 2009
Sector and % of
Market Value | | | Consumer
Discretionary 37.8%
Information
Technology 20.8%
Financials 12.4%
Consumer Staples 10.4%
Health Care 10.1%
Industrials 7.4%
Energy 1.1% | | | | Consumer
Discretionary 46.8%
Information
Technology 24.4%
Health Care 16.1%
Financials 9.0%
Energy 3.7% | | | | U.S. Government
Securities 44.8%
Consumer Staples 14.9%
Energy 10.8%
Health Care 9.1%
Industrials 8.4%
Consumer
Discretionary 6.4%
Financials 1.9%
Information
Technology 1.5%
Foreign Government
Securities 1.2%
Materials 1.0% | | | | Information
Technology 25.5%
Consumer
Discretionary 24.1%
Financials 16.8%
Industrials 13.2%
Health Care 13.1%
Energy 5.8%
Consumer Staples 1.5% | | |
The performance data quoted represents past performance. The above performance information for the Funds does not reflect the imposition of a 2% redemption fee on shares of all Funds, other than Oakmark Equity & Income Fund, redeemed within 90 days. If reflected, the fee would reduce the performance quoted. Past performance does not guarantee future results. The investment return and principal value will fluctuate so that an investor's shares, when redeemed, may be worth more or less than their original cost. Current performance may be lower or higher than the performance data quoted. Average annual total return measures annualized change, while total return measures aggregate change. To obtain current month end performance data, visit oakmark.com.
* Not annualized
THE OAKMARK FUNDS
2
Performance for Periods
Ended March 31, 20091 | | Oakmark
Global Select
Fund—Class I
(OAKWX) | | Oakmark
International
Fund—Class I
(OAKIX) | | Oakmark
International
Small Cap Fund—Class I
(OAKEX) | |
| 3 Months* | | | -4.29 | % | | | -9.31 | % | | | -12.36 | % | |
| 1 Year | | | -27.41 | % | | | -39.93 | % | | | -48.24 | % | |
Average Annual Total
Return for: | |
| 3 Year | | | N/A | | | | -14.26 | % | | | -19.28 | % | |
| 5 Year | | | N/A | | | | -1.85 | % | | | -2.89 | % | |
| 10 Year | | | N/A | | | | 4.55 | % | | | 5.39 | % | |
| Since inception | | | -13.87%
(10/2/06) | | | | 7.54%
(9/30/92) | | | | 6.12%
(11/1/95) | | |
Top Five Equity
Holdings as of
March 31, 20092
Company and % of Total
Net Assets | | | Best Buy Co., Inc. 7.2%
Liberty Media Corp.
-Entertainment 6.9%
Credit Suisse
Group 6.6%
Societe Television
Francaise 1 6.3%
Daiwa Securities
Group, Inc. 5.2% | | | | Credit Suisse
Group 3.9%
Daiwa Securities
Group, Inc. 3.7%
Signet Jewelers, Ltd. 3.4%
OMRON Corp. 3.3%
BNP Paribas SA 3.2% | | | | LSL Property
Services PLC 4.2%
Julius Baer Holding,
Ltd. 3.7%
Rheinmetall AG 3.6%
Media Prima Berhad
Berhad 3.1%
Atea ASA 3.0% | | |
Sector
Allocation as of
March 31, 2009
Sector and % of
Market Value | | | Consumer
Discretionary 40.3%
Information
Technology 24.2%
Financials 20.0%
Health Care 10.2%
Industrials 5.3% | | | | Consumer
Discretionary 35.9%
Financials 20.5%
Industrials 15.8%
Information
Technology 15.1%
Consumer Staples 4.2%
Materials 3.6%
Health Care 3.3%
Energy 1.6% | | | | Industrials 35.2%
Consumer
Discretionary 26.1%
Financials 13.8%
Information
Technology 12.2%
Materials 6.7%
Consumer Staples 4.4%
Health Care 1.6% | | |
As of 9/30/08, the expense ratio for Class I shares was 1.10% for Oakmark Fund, 1.08% for Oakmark Select Fund, 0.81% for Oakmark Equity and Income Fund, 1.16% for Oakmark Global Fund, 1.35% for Oakmark Global Select Fund, 1.10% for Oakmark International Fund and 1.41% for Oakmark International Small Cap Fund.
THE OAKMARK FUNDS
3
FUND EXPENSES
A shareholder of each Fund incurs two types of costs: (1) transaction costs, such as redemption fees, and (2) ongoing costs, including investment advisory fees, transfer agent fees, and other fund expenses. The examples below are intended to help shareholders understand the ongoing cost (in dollars) of investing in each Fund and to compare these costs with the ongoing costs of investing in other funds.
Actual Expenses
The following table provides information about actual account values and actual fund expenses for Class I of each Fund. The table shows the expenses a Class I shareholder would have paid on a $1,000 investment in each Fund from October 1, 2008 to March 31, 2009, as well as how much a $1,000 investment would be worth at the close of the period, assuming actual fund returns and expenses. A Class I shareholder can estimate expenses incurred for the period by dividing the account value at March 31, 2009, by $1,000 and multiplying the result by the number in the Expenses Paid During Period row as shown below.
Shares of all Funds, other than Oakmark Equity and Income Fund, invested for 90 days or less may be charged a 2% redemption fee. Please consult the Funds' prospectus at oakmark.com for more information.
| | | Oakmark Fund | | Oakmark Select Fund | | Oakmark Equity and Income Fund | | Oakmark Global Fund | | Oakmark Global Select Fund | | Oakmark International Fund | | Oakmark International Small Cap Fund | |
Beginning
Account
Value | | $ | 1,000.00 | | | $ | 1,000.00 | | | $ | 1,000.00 | | | $ | 1,000.00 | | | $ | 1,000.00 | | | $ | 1,000.00 | | | $ | 1,000.00 | | |
Ending
Account
Value | | $ | 696.60 | | | $ | 748.30 | | | $ | 828.00 | | | $ | 655.30 | | | $ | 800.90 | | | $ | 712.80 | | | $ | 637.50 | | |
Expenses
Paid
During
Period* | | $ | 5.50 | | | $ | 5.54 | | | $ | 3.97 | | | $ | 5.36 | | | $ | 7.23 | | | $ | 5.34 | | | $ | 6.82 | | |
Annualized
Expense
Ratio | | | 1.30 | % | | | 1.27 | % | | | 0.87 | % | | | 1.30 | % | | | 1.61 | % | | | 1.25 | % | | | 1.67 | % | |
* Expenses are equal to each Fund's annualized expense ratio for Class I, multiplied by the average account value over the period, multiplied by the number of days in the most recent fiscal half-year divided by 365 (to reflect the one-half year period).
THE OAKMARK FUNDS
4
Hypothetical Example for Comparison Purposes
The following table provides information about hypothetical account values and hypothetical expenses for Class I of each Fund based on actual expense ratios and an assumed rate of return of 5% per year before expenses, which are not the Funds' actual returns. The hypothetical account values and expenses may not be used to estimate the actual ending account balances or expenses shareholders paid for the period. Shareholders may use this information to compare the ongoing costs of investing in a Fund and other funds. To do so, compare this 5% hypothetical example with the 5% hypothetical examples that appear in the shareholder reports of the other funds.
Please note that the expenses shown in the table are meant to highlight your ongoing costs only and do not reflect any transaction costs, such as redemption fees. Therefore, the third line of the table is useful in comparing ongoing costs only, and will not help you determine the relative total costs of owning different funds. In addition, if these transaction costs were included, the total costs would have been higher.
| | | Oakmark Fund | | Oakmark Select Fund | | Oakmark Equity and Income Fund | | Oakmark Global Fund | | Oakmark Global Select Fund | | Oakmark International Fund | | Oakmark International Small Cap Fund | |
Beginning
Account
Value | | $ | 1,000.00 | | | $ | 1,000.00 | | | $ | 1,000.00 | | | $ | 1,000.00 | | | $ | 1,000.00 | | | $ | 1,000.00 | | | $ | 1,000.00 | | |
Ending
Account
Value | | $ | 1,018.45 | | | $ | 1,018.60 | | | $ | 1,020.59 | | | $ | 1,018.45 | | | $ | 1,016.90 | | | $ | 1,018.70 | | | $ | 1,016.60 | | |
Expenses
Paid
During
Period* | | $ | 6.54 | | | $ | 6.39 | | | $ | 4.38 | | | $ | 6.54 | | | $ | 8.10 | | | $ | 6.29 | | | $ | 8.40 | | |
Annualized
Expense
Ratio | | | 1.30 | % | | | 1.27 | % | | | 0.87 | % | | | 1.30 | % | | | 1.61 | % | | | 1.25 | % | | | 1.67 | % | |
* Expenses are equal to each Fund's annualized expense ratio for Class I, multiplied by the average account value over the period, multiplied by the number of days in the most recent fiscal half-year divided by 365 (to reflect the one-half year period).
THE OAKMARK FUNDS
5
OAKMARK AND OAKMARK SELECT FUNDS
At Oakmark, we are long-term investors. We attempt to identify growing businesses that are managed to benefit their shareholders. We will purchase stock in those businesses only when priced substantially below our estimate of intrinsic value. After purchase, we patiently wait for the gap between stock price and intrinsic value to close.
 "How many times does the end of the world as we know it need to arrive before we realize that it's not the end of the world as we know it?"
Michael Lewis, author
The New York Times is full of stories of lost fortunes. Their search for culprits unearthed commercial bankers, short-sellers, and even the previous Republican administration. They report that the stock market "no longer appraises by its movement actual events and values, but merely reflects a state of mind and then makes that state of mind worse by reflecting it." The Times further states that the consensus view of the stock market is that "if general insolvency is ahead of us, existing prices cannot be too low...they ought to be even lower."4 Time Magazine reflects the negative attitude, reporting: "indicators of the U.S. economy flashed some of their gloomiest signals ever last week,"5 "depression in the housing industry,"6 "doubt among investors about the Administration's ability to control the economy has sent the stock market into a frightening slump,"7 and "the high cost of borrowing a nd the impossibility of selling new stock issues in a collapsing market make it difficult for companies to raise the money needed to expand or in some cases even to stay alive, thus intensifying the threat of recession—or worse."8
Clearly, the U.S. and global economies are going through a tough time, and it is tempting to conclude that we're in uncharted waters. But before we join the camp that says we're entering a post-capitalism era, it might be useful to consider some of the difficulties that our relatively young economy has recovered from. Spring break reading for me included Michael Lewis's latest book, PANIC: The Story of Modern Financial Insanity. In this book Lewis examines panics since 1987 by presenting articles written in the midst of each of those panics. The common thread that soon became obvious is that during each panic the problems appeared intractable, the solutions illusory. Lewis states: "Black Monday (the crash of 1987) was the first of a breed: a crash that suggested disastrous economic and social consequences but in the end had no serious effects at all. The bursting of the Internet bubble, the Asian currency crisis, the Russian government bond default that triggered the failure of the hedge fund Long-Term Capital Management—all of these extreme events have been compressed into a fantastically short space of financial history. And all seemed, in the heat of the moment, to have the power to change the world as we know it. None of them, it turned out, was that big a deal for the U.S. economy or for ordinary citizens."9
But one might say that the panics of the past twenty or so years were really just mini-panics and that what we're facing now is of much larger magnitude, more like the early 1970s or, even worse, the Great Depression. Let's take a step back. Investors are always faced with the choice of investing for safety or of assuming risk in exchange for the higher returns that typically come from owning businesses. Over the past eighty years, owners of stocks have been well rewarded for taking that risk. The annualized return from owning the S&P 50010 has averaged 9% since 1928, compared to only 4% from owning short-term government bonds. And that return advantage has come despite three periods during which stocks drastically underperformed risk-free assets. In the Great Depression, from 1929 to 1932 stocks fell by 86%; from 1973 to 1974 they fell by 48%; and from March 24, 2000 to March 9, 2009, stocks fell 56%. (And, yes, I know the S&P in 2007 slightly surpassed the 2000 peak, but because stocks underperformed T-Bills for those seven years, I think of the peak as having occurred in 2000.) With the pain of the past nine years so fresh in our minds, it's easy to overlook the seventy years of history that preceded it. But it is that very record of stocks outperforming other asset classes that has made stocks the asset of choice for long-term investors.
As investors try to decide what to do now, I think it is useful to contrast two options. Let's assume investors are making their decisions for a five-year time horizon. Were the time horizon any shorter, we would say stocks shouldn't even be considered because short-term results can be too random. One option for an investor is to say "no" to any risk, and invest in a five-year government bond. Many investors, stinging from recent losses, are making that very choice. The annual yield for that bond today is 1.8%. So, at the end of five years, that investor could be certain to have a 9% return (not considering either taxes or inflation). The other choice is to buy equities, anticipating a higher return in exchange for accepting uncertainty. Can history give us any guide as to what that return might be? One approach would be to assume that returns would simply match the historical average of 9% per year, or 54% compounded over a five-year period . That answer, however, ignores the effect of the starting price. I think the following is more useful.
First, the dividend yield of the S&P 500 is now about 3%, so over five years the equity investor should receive a 15%
OAKMARK AND OAKMARK SELECT FUNDS
6
return plus or minus price change. We can estimate the S&P price five years from now by estimating both its earnings level and its P/E11 ratio. Over the past 80 years the median P/E ratio for the S&P 500 has been 15 times. I could argue that today's very low rates on government bonds suggest future P/Es should be higher, but let's not bother with that complexity. Earnings are trickier to forecast. Operating earnings for the S&P 500 peaked at $88 in 2006 but the consensus forecasts a trough at about $62 this year.12 Extrapolating either peak or trough earnings is not likely to be productive. Instead, let's look back over the p ast thirty years. A regression analysis of the past thirty years shows that trend earnings for 2009 are about $84, or 5% below the peak achieved three years earlier. Further, that same regression analysis calculates that earnings growth has averaged between 6 and 7% per year. Extrapolating based on those numbers puts trend line earnings for 2014 at about $115. Multiplying $115 in earnings by a P/E of 15 produces a 2014 expected price for the S&P 500 of 1725, 116% higher than today's price of 798. Were that to happen, the annualized return for the next five years would be about 20%, a little more than twice the historical average, and more than ten times the bond return.
What about the downside? By 2014, the S&P could fall to about 750 and still match the return on a five-year bond because the current dividend yield exceeds the bond's interest rate. If the historical average P/E is attained, that means the S&P earnings would have to be more than 50% below trend for the stock investor to underperform the bond investor. Alternatively, if the earnings trend line proves accurate, the P/E would have to be below 7 times for the stock investor to underperform. While those outcomes are certainly possible, they would be extreme historical outliers. The possibility of historically high returns, combined with what we believe to be a low probability of loss, makes me excited about investing in stocks today. And that's why I significantly added again to my personal Oakmark investment last quarter.
The commentary in my opening paragraph sounds like it was taken from recent publications. However, the summary of stock market reporting from the New York Times is from 1932, just weeks before the Great Depression bear market ended. The quotes from Time Magazine are from fall 1974, just days before that bear market bottom was reached. The Time Magazine archive on their website provides links to "related articles." For the 1974 piece referring to the housing depression they suggest also reading an article titled: "Will President Obama's New Housing Plan Work?" Even a computer program concluded that the current panic looks a lot like earlier panics.
As Michael Lewis showed, in the midst of a panic, the light at the end of the tunnel is not visible, but that doesn't mean the end isn't near. At a recent client meeting, one of our managers was explaining why we so strongly believe that this is a time to be adding to equity exposure. The client asked, almost belittling, if it bothered us that we were their only bullish investment manager. Our manager said, "Please write that down: in the first quarter of 2009, Harris Associates was your most bullish manager." At a time when others are waffling on their positions, I would likewise say to you, "Please write this down: at the end of the first quarter of 2009, the managers of Oakmark and Oakmark Select were your most bullish managers."
William C. Nygren, CFA
Portfolio Manager
oakmx@oakmark.com
oaklx@oakmark.com
March 31, 2009
OAKMARK AND OAKMARK SELECT FUNDS
7
OAKMARK FUND
Report from Bill Nygren and Kevin Grant, Portfolio Managers


THE VALUE OF A $10,000 INVESTMENT IN OAKMARK FUND FROM ITS INCEPTION (8/5/91) TO PRESENT (3/31/09) AS COMPARED TO THE STANDARD & POOR'S 500 INDEX10 (UNAUDITED)
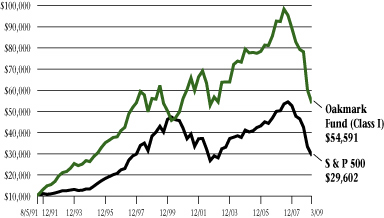
| | | | | Average Annual Total Returns
(as of 3/31/09) | |
| (Unaudited) | | Total Return
Last 3 Months* | | 1-year | | 5-year | | 10-year | | Since
Inception
(8/5/91) | |
| Oakmark Fund (Class I) | | | -9.59 | % | | | -34.23 | % | | | -5.47 | % | | | -0.23 | % | | | 10.09 | % | |
| S&P 500 | | | -11.01 | % | | | -38.09 | % | | | -4.76 | % | | | -3.00 | % | | | 6.34 | % | |
| Dow Jones Average13 | | | -12.48 | % | | | -35.94 | % | | | -3.64 | % | | | -0.36 | % | | | 7.86 | % | |
Lipper Large Cap
Value Index14 | | | -11.75 | % | | | -38.54 | % | | | -4.78 | % | | | -1.83 | % | | | 6.07 | % | |
The graph and table do not reflect the deduction of taxes that a shareholder would pay on fund distributions or the redemption of fund shares.
The expense ratio for Class I shares as of 9/30/08 was 1.10%.
The performance data quoted represents past performance. The above performance information for the Fund does not reflect the imposition of a 2% redemption fee on shares redeemed within 90 days. If reflected, the fee would reduce the performance quoted. Past performance does not guarantee future results. The investment return and principal value will fluctuate so that an investor's shares, when redeemed, may be worth more or less than their original cost. Current performance may be lower or higher than the performance data quoted. Average annual total return measures annualized change, while total return measures aggregate change. To obtain most recent month-end performance data, visit oakmark.com.
* Not annualized
The Oakmark Fund declined 10% last quarter compared to an 11% drop in the S&P 500. Stocks were extremely volatile. As of March 9, the S&P had fallen 25%; it then rose 18% from that date until the end of the quarter. The extreme volatility resulted from widely divergent economic views—one extreme believes we are entering a depression, the other believes low stock prices offer a once-in-a-generation buying opportunity. The letter that precedes this report makes it clear that we are in the latter camp.
The Fund's worst performers in the quarter, like the overall market, were some of our financial stocks. Capital One, Bank of America and Citigroup each lost over 50%. We sold our position in Citigroup and re-invested the proceeds in financial companies we believe are equally undervalued, but have less risk of capital inadequacy. The Fund's best performers were Liberty Media Capital and Morgan Stanley, which gained over 40%. Schering-Plough gained just short of 40%, but made the largest positive contribution to the Fund because it began the year as our third largest holding. Schering agreed to be acquired by Merck in a transaction that we believe will benefit both sets of shareholders. We took advantage of market volatility during the quarter by initiating new positions in Apple, State Street (both explained on our website) and EnCana.
EnCana (ECA – $41)
For the most part, we missed both the big moves up and down in oil stocks. We did not believe that $100-plus oil prices would balance supply and demand. Without considering its stock price, EnCana was a company we wanted to own. Its management acts like owners that are trying to maximize long-term per-share value. When the company's projected returns from share repurchase exceeded returns from exploration or acquisition, management repurchased shares. When the company believed that energy prices had reached unsustainably high levels, management used hedging to reduce exposure to oil and gas prices. Finally, the company has huge reserves in Canadian tar sands, which are of minor value today, but would become very valuable at higher oil prices. When EnCana stock reached $99 last year, it was far above our buy target, which was based on oil prices falling back below $50. Last quarter, we got the chance to buy EnCana for less than $40, and we di dn't let it slip by. With a 4% yield, a single-digit P/E,11 and a large discount to our estimated value, EnCana makes us pleased to again be invested in the energy sector—and especially pleased to be invested with this management team.
William C. Nygren, CFA
Portfolio Manager
oakmx@oakmark.com | | Kevin G. Grant, CFA
Portfolio Manager
oakmx@oakmark.com | |
|
March 31, 2009
OAKMARK FUND
8
OAKMARK FUND
Schedule of Investments—March 31, 2009 (Unaudited)
Name | |
Shares Held | |
Value | |
| Common Stocks—93.6% | |
| Advertising—1.1% | |
| Omnicom Group, Inc. | | | 1,000,000 | | | $ | 23,400,001 | | |
| Apparel Retail—1.2% | |
| Limited Brands | | | 3,014,647 | | | $ | 26,227,429 | | |
| Broadcasting—1.0% | |
| Discovery Communications, Inc. Class C (a) | | | 1,540,140 | | | $ | 22,563,051 | | |
| Cable & Satellite—5.3% | |
| Liberty Media Corp. - Entertainment (a) | | | 3,298,680 | | | $ | 65,808,666 | | |
| Comcast Corp., Class A | | | 3,800,000 | | | | 48,906,000 | | |
| | | | 114,714,666 | | |
| Catalog Retail—0.6% | |
| Liberty Media Holding Corp. - Interactive, Class A (a) | | | 4,199,850 | | | $ | 12,179,565 | | |
| Computer & Electronics Retail—3.3% | |
| Best Buy Co., Inc. | | | 1,919,400 | | | $ | 72,860,424 | | |
| Department Stores—2.5% | |
| Kohl's Corp. (a) | | | 1,276,900 | | | $ | 54,038,408 | | |
| Home Improvement Retail—2.5% | |
| The Home Depot, Inc. | | | 2,281,500 | | | $ | 53,752,140 | | |
| Household Appliances—2.0% | |
| The Black & Decker Corp. | | | 1,400,000 | | | $ | 44,184,000 | | |
| Housewares & Specialties—1.5% | |
| Fortune Brands, Inc. | | | 1,350,000 | | | $ | 33,142,500 | | |
| Motorcycle Manufacturers—1.5% | |
| Harley-Davidson, Inc. | | | 2,462,000 | | | $ | 32,966,180 | | |
| Movies & Entertainment—6.9% | |
| The Walt Disney Co. | | | 2,700,000 | | | $ | 49,032,000 | | |
| Viacom, Inc., Class B (a) | | | 2,339,745 | | | | 40,664,768 | | |
| Time Warner, Inc. | | | 1,982,566 | | | | 38,263,524 | | |
| Time Warner Cable, Inc. | | | 497,644 | | | | 12,341,571 | | |
| Liberty Media Holding Corp. - Capital, Class A (a) | | | 1,395,836 | | | | 9,742,935 | | |
| | | | 150,044,798 | | |
| Restaurants—3.6% | |
| Yum! Brands, Inc. | | | 1,664,000 | | | $ | 45,726,720 | | |
| McDonald's Corp. | | | 594,000 | | | | 32,414,580 | | |
| | | | 78,141,300 | | |
OAKMARK FUND
9
OAKMARK FUND
Schedule of Investments—March 31, 2009 (Unaudited) cont.
Name | |
Shares Held | |
Value | |
| Common Stocks—93.6% (cont.) | |
| Specialized Consumer Services—2.4% | |
| H&R Block, Inc. | | | 2,858,600 | | | $ | 51,997,934 | | |
| Brewers—0.8% | |
| Anheuser-Busch InBev NV (b) | | | 600,000 | | | $ | 16,537,084 | | |
| Anheuser-Busch InBev NV, Rights (a) (b) | | | 600,000 | | | | 2,391 | | |
| | | | 16,539,475 | | |
| Distillers & Vintners—2.1% | |
| Diageo PLC (c) | | | 1,021,000 | | | $ | 45,689,750 | | |
| Drug Retail—2.7% | |
| Walgreen Co. | | | 2,300,000 | | | $ | 59,708,000 | | |
| Hypermarkets & Super Centers—2.1% | |
| Wal-Mart Stores, Inc. | | | 900,000 | | | $ | 46,890,000 | | |
| Packaged Foods & Meats—2.0% | |
| H.J. Heinz Co. | | | 1,300,000 | | | $ | 42,978,000 | | |
| Oil & Gas Exploration & Production—1.0% | |
| EnCana Corp. | | | 550,000 | | | $ | 22,335,500 | | |
| Asset Management & Custody Banks—3.9% | |
| Bank of New York Mellon Corp. | | | 1,839,630 | | | $ | 51,969,548 | | |
| State Street Corp. | | | 1,050,000 | | | | 32,319,000 | | |
| | | | 84,288,548 | | |
| Consumer Finance—3.2% | |
| Capital One Financial Corp. | | | 3,414,800 | | | $ | 41,797,152 | | |
| American Express Co. | | | 2,100,000 | | | | 28,623,000 | | |
| | | | 70,420,152 | | |
| Investment Banking & Brokerage—1.3% | |
| Morgan Stanley | | | 1,200,000 | | | $ | 27,324,000 | | |
| Other Diversified Financial Services—3.2% | |
| JPMorgan Chase & Co. | | | 2,000,000 | | | $ | 53,160,000 | | |
| Bank of America Corp. | | | 2,500,000 | | | | 17,050,000 | | |
| | | | 70,210,000 | | |
| Health Care Equipment—2.3% | |
| Medtronic, Inc. | | | 1,650,000 | | | $ | 48,625,500 | | |
| Pharmaceuticals—7.2% | |
| Schering-Plough Corp. | | | 2,431,135 | | | $ | 57,253,229 | | |
| Bristol-Myers Squibb Co. | | | 2,300,000 | | | | 50,416,000 | | |
| GlaxoSmithKline PLC (c) | | | 1,600,000 | | | | 49,712,000 | | |
| | | | 157,381,229 | | |
OAKMARK FUND
10
OAKMARK FUND
Schedule of Investments—March 31, 2009 (Unaudited) cont.
Name | |
Shares Held | |
Value | |
| Common Stocks—93.6% (cont.) | |
| Aerospace & Defense—1.6% | |
| The Boeing Co. | | | 1,000,000 | | | $ | 35,580,000 | | |
| Air Freight & Logistics—2.1% | |
| FedEx Corp. | | | 1,050,000 | | | $ | 46,714,500 | | |
| Industrial Conglomerates—1.6% | |
| Tyco International, Ltd. (b) | | | 1,739,500 | | | $ | 34,024,620 | | |
| Industrial Machinery—1.6% | |
| Illinois Tool Works, Inc. | | | 1,100,000 | | | $ | 33,935,000 | | |
| Communications Equipment—1.9% | |
| Cisco Systems, Inc. (a) | | | 2,500,000 | | | $ | 41,925,000 | | |
| Computer Hardware—5.6% | |
| Hewlett-Packard Co. | | | 1,725,000 | | | $ | 55,303,500 | | |
| Dell, Inc. (a) | | | 3,900,000 | | | | 36,972,000 | | |
| Apple, Inc. (a) | | | 270,000 | | | | 28,382,400 | | |
| | | | 120,657,900 | | |
| Data Processing & Outsourced Services—1.6% | |
| Western Union Co. | | | 2,775,000 | | | $ | 34,881,750 | | |
| Electronic Manufacturing Services—1.4% | |
| Tyco Electronics, Ltd. | | | 2,839,500 | | | $ | 31,348,080 | | |
| Internet Software & Services—1.4% | |
| eBay, Inc. (a) | | | 2,400,000 | | | $ | 30,144,000 | | |
| Office Electronics—1.1% | |
| Xerox Corp. | | | 5,072,400 | | | $ | 23,079,420 | | |
| Semiconductors—5.1% | |
| Intel Corp. | | | 3,900,000 | | | $ | 58,695,000 | | |
| Texas Instruments, Inc. | | | 3,200,000 | | | | 52,832,000 | | |
| | | | 111,527,000 | | |
| Systems Software—1.4% | |
| Microsoft Corp. | | | 1,600,000 | | | $ | 29,392,000 | | |
| Total Common Stocks (Cost: $2,376,191,666) | | | | | | | 2,035,811,820 | | |
OAKMARK FUND
11
OAKMARK FUND
Schedule of Investments—March 31, 2009 (Unaudited) cont.
Name | |
Par Value | |
Value | |
| Short Term Investment—6.3% | |
| Repurchase Agreement—6.3% | |
Fixed Income Clearing Corp. Repurchase Agreement,
0.17% dated 3/31/2009 due 4/1/2009, repurchase
price $136,469,051, collateralized by a Federal Home
Loan Bank Note, with a rate of 1.620%, with a maturity
of 12/30/2009, and with a market value plus accrued
interest of $1,946,598, by a Federal Home Loan Mortgage
Corp. Bond, with a rate of 3.050%, with a maturity of
4/28/2010, and with a market value plus accrued interest of $33,454,400, and by a Federal National Mortgage
Association Note, with a rate of 4.750%, and a maturity
of 3/12/2010, and with a market value plus accrued
interest of $103,800,000 | | $ | 136,468,407 | | | $ | 136,468,407 | | |
| Total Repurchase Agreement (Cost: $136,468,407) | | | | | 136,468,407 | | |
| Total Short Term Investment (Cost: $136,468,407) | | | | | 136,468,407 | | |
| Total Investments (Cost: $2,512,660,073)—99.9% | | | | $ | 2,172,280,227 | | |
| Other Assets In Excess of Liabilities—0.1% | | | | | 2,931,218 | | |
| Total Net Assets—100% | | | | $ | 2,175,211,445 | | |
(a) Non income-producing security.
(b) Represents a foreign domiciled corporation.
(c) Represents an American Depositary Receipt.
See accompanying Notes to Financial Statements.
OAKMARK FUND
12
OAKMARK SELECT FUND
Report from Bill Nygren and Henry Berghoef, Portfolio Managers


THE VALUE OF A $10,000 INVESTMENT IN OAKMARK SELECT FUND FROM ITS INCEPTION (11/1/96) TO PRESENT (3/31/09) AS COMPARED TO THE STANDARD & POOR'S 500 INDEX10 (UNAUDITED)
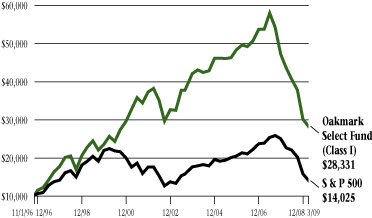
| | | | | Average Annual Total Returns
(as of 3/31/09) | |
| (Unaudited) | | Total Return
Last 3 Months* | | 1-year | | 5-year | | 10-year | | Since
Inception
(11/1/96) | |
Oakmark Select Fund
(Class I) | | | -6.26 | % | | | -35.28 | % | | | -8.10 | % | | | 2.21 | % | | | 8.75 | % | |
| S&P 500 | | | -11.01 | % | | | -38.09 | % | | | -4.76 | % | | | -3.00 | % | | | 2.76 | % | |
Lipper Multi-Cap
Value Index15 | | | -11.56 | % | | | -38.70 | % | | | -5.42 | % | | | -0.02 | % | | | 3.00 | % | |
The graph and table do not reflect the deduction of taxes that a shareholder would pay on fund distributions or the redemption of fund shares.
The expense ratio for Class I shares as of 9/30/08 was 1.08%.
The performance data quoted represents past performance. The above performance information for the Fund does not reflect the imposition of a 2% redemption fee on shares redeemed within 90 days. If reflected, the fee would reduce the performance quoted. Past performance does not guarantee future results. The investment return and principal value will fluctuate so that an investor's shares, when redeemed, may be worth more or less than their original cost. Current performance may be lower or higher than the performance data quoted. Average annual total return measures annualized change, while total return measures aggregate change. To obtain most recent month-end performance data, visit oakmark.com.
* Not annualized
The Oakmark Select Fund declined 6% last quarter. Relative to the S&P 500's 11% loss, the Fund's loss was small. Relative to cash—and coming on top of losses during the past two years—it was painful. We compare our returns to the S&P 500 because we believe that over the long run, the S&P will deliver a better return than most other investments will. Effectively, we believe that simply investing in the S&P 500 would meet our goal for the Fund—achieving long-term growth of capital. If we can grow capital at a higher rate than the S&P grows—or match its growth with less risk—by investing in securities that meet our criteria, we would judge our results a success. Clearly the S&P has fallen far short of that goal over the past ten years, returning a negative 3% per year. However, as outlined in the Oakmark and Oakmark Select Funds letter, we believe that the decline over the past decade has positio ned the S&P for unusual gains in the upcoming decade. For that reason, we will continue to measure our short-term successes or failures by comparison to the S&P.
Two stocks that contributed the most to the Fund's relative outperformance last quarter were Schering-Plough and Best Buy. Schering agreed to be acquired by Merck, which resulted in the stock gaining 39%. We trimmed the position but continue to hold it because it sells at a 10% discount to the merger price, and we believe the transaction will be completed. Best Buy rose 36% as their consumer electronics sales fell less than had been anticipated. We trimmed that position as well, but want to maintain exposure to this category dominant retailer. Our worst performers, each losing over half their value, were Capital One and Bank of America. We continue to believe that both companies will survive this downturn and that they are extremely inexpensive relative to potential recovery earnings.
The only addition last quarter was Newfield Exploration, a mid-sized oil and gas company. After selling Burlington Resources in early 2006, the Fund had zero exposure to energy companies. For two years, as oil prices increased to $150, that lack of exposure hurt our relative results. Over the past few quarters, as oil prices fell back under $50, we also missed their decline. Newfield stock peaked at $70 last May and recently traded under $20. Assuming no rebound in energy prices, we believe that Newfield is now significantly undervalued and is a size that is attractive to acquirers.
William C. Nygren, CFA
Portfolio Manager
oaklx@oakmark.com | | Henry R. Berghoef, CFA
Portfolio Manager
oaklx@oakmark.com | |
|
March 31, 2009
OAKMARK SELECT FUND
13
OAKMARK SELECT FUND
Schedule of Investments—March 31, 2009 (Unaudited)
Name | |
Shares Held | |
Value | |
| Common Stocks—94.0% | |
| Broadcasting—8.6% | |
| Discovery Communications, Inc. Class C (a) | | | 9,509,500 | | | $ | 139,314,175 | | |
| Cable & Satellite—7.5% | |
| Liberty Media Corp. - Entertainment (a) | | | 6,017,029 | | | $ | 120,039,728 | | |
| Catalog Retail—1.7% | |
| Liberty Media Holding Corp. - Interactive, Class A (a) | | | 9,400,000 | | | $ | 27,260,000 | | |
| Computer & Electronics Retail—5.1% | |
| Best Buy Co., Inc. | | | 2,150,000 | | | $ | 81,614,000 | | |
| Movies & Entertainment—9.0% | |
| Viacom, Inc., Class B (a) | | | 4,325,000 | | | $ | 75,168,500 | | |
| Time Warner, Inc. | | | 3,610,666 | | | | 69,685,854 | | |
| | | | 144,854,354 | | |
| Restaurants—4.8% | |
| Yum! Brands, Inc. | | | 2,815,000 | | | $ | 77,356,200 | | |
| Specialized Consumer Services—7.3% | |
| H&R Block, Inc. | | | 6,469,600 | | | $ | 117,682,024 | | |
| Oil & Gas Exploration & Production—3.5% | |
| Newfield Exploration Co. (a) | | | 2,500,000 | | | $ | 56,750,000 | | |
| Consumer Finance—2.2% | |
| Capital One Financial Corp. | | | 2,910,600 | | | $ | 35,625,744 | | |
| Other Diversified Financial Services—6.2% | |
| JPMorgan Chase & Co. | | | 2,494,000 | | | $ | 66,290,520 | | |
| Bank of America Corp. | | | 4,900,000 | | | | 33,418,000 | | |
| | | | 99,708,520 | | |
| Health Care Equipment—4.2% | |
| Medtronic, Inc. | | | 2,300,000 | | | $ | 67,781,000 | | |
| Pharmaceuticals—10.9% | |
| Schering-Plough Corp. | | | 4,282,954 | | | $ | 100,863,567 | | |
| Bristol-Myers Squibb Co. | | | 3,410,200 | | | | 74,751,584 | | |
| | | | 175,615,151 | | |
| Computer Hardware—3.3% | |
| Dell, Inc. (a) | | | 5,613,000 | | | $ | 53,211,240 | | |
| Data Processing & Outsourced Services—4.0% | |
| Western Union Co. | | | 5,065,400 | | | $ | 63,672,078 | | |
| Electronic Manufacturing Services—3.2% | |
| Tyco Electronics, Ltd. | | | 4,667,838 | | | $ | 51,532,931 | | |
OAKMARK SELECT FUND
14
OAKMARK SELECT FUND
Schedule of Investments—March 31, 2009 (Unaudited) cont.
Name | | Shares Held/
Par Value | |
Value | |
| Common Stocks—94.0% (cont.) | |
| Internet Software & Services—3.3% | |
| eBay, Inc. (a) | | | 4,200,000 | | | $ | 52,752,000 | | |
| Semiconductors—9.2% | |
| Intel Corp. | | | 5,247,000 | | | $ | 78,967,350 | | |
| Texas Instruments, Inc. | | | 4,175,000 | | | | 68,929,250 | | |
| | | | 147,896,600 | | |
| Total Common Stocks (Cost: $1,811,096,306) | | | | | | | 1,512,665,745 | | |
| Short Term Investment—4.8% | |
| Repurchase Agreement—4.8% | |
Fixed Income Clearing Corp. Repurchase Agreement,
0.17% dated 3/31/2009 due 4/1/2009, repurchase
price $76,364,699, collateralized by Federal Home Loan
Mortgage Corp. Bonds, with rates from 3.000% - 3.050%,
with maturities from 4/28/2010 - 4/30/2010, and with an
aggregate market value plus accrued interest of $45,659,775,
and by a Federal National Mortgage Association Bond, with
a rate of 3.250%, with a maturity of 4/29/20 11, and with
a market value plus accrued interest of $32,235,450 | | $ | 76,364,338 | | | $ | 76,364,338 | | |
| Total Repurchase Agreement (Cost: $76,364,338) | | | | | | | 76,364,338 | | |
| Total Short Term Investment (Cost: $76,364,338) | | | | | | | 76,364,338 | | |
| Total Investments (Cost: $1,887,460,644)—98.8% | | | | | | $ | 1,589,030,083 | | |
| Other Assets In Excess of Liabilities—1.2% | | | | | | | 19,522,039 | | |
| Total Net Assets—100% | | | | | | $ | 1,608,552,122 | | |
(a) Non income-producing security.
See accompanying Notes to Financial Statements.
OAKMARK SELECT FUND
15
OAKMARK EQUITY AND INCOME FUND
Report from Clyde S. McGregor and Edward A. Studzinski, Portfolio Managers


THE VALUE OF A $10,000 INVESTMENT IN OAKMARK EQUITY AND INCOME FUND FROM ITS INCEPTION (11/1/95) TO PRESENT (3/31/09) AS COMPARED TO THE LIPPER BALANCED FUND INDEX16 (UNAUDITED)
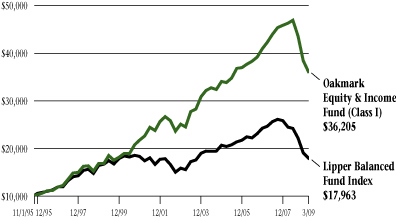
| | | | | Average Annual Total Returns
(as of 3/31/09) | |
| (Unaudited) | | Total Return
Last 3 Months* | | 1-year | | 5-year | | 10-year | | Since
Inception
(11/1/95) | |
Oakmark Equity &
Income Fund (Class I) | | | -6.03 | % | | | -21.99 | % | | | 2.37 | % | | | 7.99 | % | | | 10.07 | % | |
Lipper Balanced
Fund Index | | | -5.84 | % | | | -26.60 | % | | | -1.54 | % | | | 0.76 | % | | | 4.46 | % | |
| S&P 50010 | | | -11.01 | % | | | -38.09 | % | | | -4.76 | % | | | -3.00 | % | | | 4.17 | % | |
Barclays Capital
U.S. Govt./Credit17 | | | -1.28 | % | | | 1.78 | % | | | 3.74 | % | | | 5.64 | % | | | 5.96 | % | |
The graph and table do not reflect the deduction of taxes that a shareholder would pay on fund distributions or the redemption of fund shares.
The expense ratio for Class I shares as of 9/30/08 was 0.81%.
The performance data quoted represents past performance. Past performance does not guarantee future results. The investment return and principal value will fluctuate so that an investor's shares, when redeemed, may be worth more or less than their original cost. Current performance may be lower or higher than the performance data quoted. Average annual total return measures annualized change, while total return measures aggregate change. To obtain most recent month-end performance data, visit oakmark.com.
* Not annualized
Quarter Review
While the Fund's percentage loss for the March quarter was much reduced from the preceding period, to report any loss still disappoints us greatly. The Fund's 6% decline in value was virtually the same as the return for the Lipper Balanced Fund Index, our standard of comparison. Since inception, the Fund's annualized rate of return has been 10% compared to the 4% which the Lipper Index reported.
After a busy end of calendar 2008, portfolio activity returned to more typical levels during the past quarter. We initiated two new equity positions, both involved in medical and scientific instrumentation: PerkinElmer and Varian Medical Systems. Our research department has unearthed a wide variety of interesting names in this area, and we believe that these two companies offer intriguing prospects as well as compelling valuations. We eliminated two equity holdings, ITT and Medtronic, and the January takeover of UST removed that name from the portfolio as well.
Even in down quarters the Fund is blessed with some strong contributors. In the March quarter these included TJX, Hospira, and Walter Industries. TJX, parent company of T.J.Maxx, Marshall's, and other retail concepts, is a natural beneficiary of a difficult retail environment because the company sources its inventories so cheaply. Hospira announced a reorganization during the quarter that should boost the company's profitability. Significant detractors included Medtronic, Diageo, and General Dynamics. Shares of Medtronic and General Dynamics both reacted negatively to the Obama administration's budget, and General Dynamics also suffered delays and cancellations in its Gulfstream business jet unit. Diageo experienced the effects of consumers trading down to less expensive brands.
Equity Portfolio Characteristics
The bear market for stocks has many diverse effects. For example, declining market values have forced Standard & Poors more than once to adjust the minimum market capitalization requirement for companies eligible to be added to the S&P 500 Index. Standard & Poors has also been busy removing and adding names in response to drastic price movements. Even with all of this activity, at the end of February more than 20% of the Index's constituent companies were below the already reduced minimum market capitalization level for index inclusion.
Fortunately, this trend of companies becoming mid-cap or even small-cap is almost irrelevant to our management of the Fund. Oakmark Equity and Income has always been an all-cap fund. Both our new purchases in the March quarter had market capitalizations of less than $5 billion. In fact,
OAKMARK EQUITY AND INCOME FUND
16
using $1.5 billion to $5 billion as the range for mid cap companies and anything below $1.5 billion for small cap companies, as of March 31, 21% of the Fund's holdings are mid caps and 6% small caps. Size is never an important issue except insofar as it limits our ability to invest a material proportion of the Fund in a name. Value is always the determining factor, and in our management of the Fund we go wherever value takes us.
Dividend yield is another characteristic to which the financial press has devoted considerable attention this year. With share prices down dramatically, dividend yields perforce go up, but severe dividend reductions in the financial sector have diminished this effect, especially since financials had been the highest yielding sector. Thankfully, the Equity and Income Fund equity portfolio has enjoyed six dividend increases and no reductions so far this year. We like high dividend yields as much as anyone, but we consider yield to be only one factor in determining the true worth of a stock.
As we have often written, the Equity and Income Fund is intended to be a low volatility, total return oriented portfolio. To that end in this environment we have attempted to invest the Fund in businesses that provide products or services that are not discretionary but that have perpetual utility. Whether the product is food, natural gas, medical supplies, aggregates for road-building, or cable TV systems, we are confident that consumers will find a way to continue to purchase these items. We also believe that the world is not getting any safer, which means that defense companies' business should remain solid.
Finally, in our effort to control risk in this difficult time, we have oriented the holdings to companies that we believe have solid balance sheets and strong cash flows. Most important, we have avoided companies that appear to have the need to refinance debt maturities within the next few years. While we expect market conditions to improve and liquidity to recover before too long, this forecast is highly uncertain. What we do know is that price and value tend to converge over time. If we focus on identifying and owning businesses that are significantly underpriced, that have demonstrated the ability to grow their value per share, and that have managers that treat their shareholders as their partners, we believe we will position the portfolio for the eventual return of a more favorable environment.
Between Scylla and Charybdis
We have offered e-mail communication to our shareholders for many years. Often, shareholder correspondence is not directed to any particular investing theme or sector, but for the past few years one significant focus has been the Fund's fixed income holdings and strategy. This focus surprises us both because of the inherent conservatism of the fixed income strategy, but also because of the fact that the majority of the Fund's historic returns have originated on the equity side.
Now, however, we do understand our shareholders' focus on fixed income. The economic environment facing fixed income investors is described again and again as unprecedented, and justifiably so. Perhaps never before has the world seen so much government intervention and so many simultaneous efforts to stimulate economic activity. At the same time, economic activity continues to contract, resulting in excess inventories and declining prices.
In Greek mythology, Scylla and Charybdis were two sea monsters situated on opposite sides of the Strait of Messina. A ship would have to navigate perfectly in order to avoid both threats. For today's fixed income investor, the twin threats are deflation now and probable inflation in the future. Deflation is good for high-quality fixed coupon bonds and bad for high-yield or inflation-indexed securities. The opposite is true for an inflationary environment. Since we do not know when—or even if—the environment will evolve from deflation to inflation, we have sought to construct all-weather fixed income portfolios.
Fortunately, occasional market dislocations have produced opportunities to adapt the fixed income portfolio better to these twin threats. Throughout the quarter we had several opportunities to build out the commitment to inflation-indexed securities (often called TIPS) at unusually favorable prices. TIPS generally pay a low interest rate, but their principal value adjusts periodically to reflect inflation. The interest income is therefore "real return" i.e., the return after neutralizing inflation (or at least inflation as the government is able to measure it). Usually TIPS have an interest-only return below that of ordinary Treasury notes. During the past quarter, however, TIPS occasionally traded "through Treasurys," meaning that their nominal yield exceeded that of Treasurys of similar maturity. This anomalous occurrence was the result of investors' fears that deflation would persist. We took advantage of this opportunity and increased th e Fund's TIPS commitment to 12% of the portfolio. We also extended the average maturity of the TIPS position and reduced the level of built-in accretion (historic inflation adjustments), the latter an attempt to mitigate the impact of near-term deflation. The enhanced TIPS position has already positively affected the portfolio: on the day that the Federal Reserve announced that it would begin to purchase Treasurys, the Fund's TIPS gained over 4% in market value, a substantial move in bond market terms.
While increasing the TIPS position, we also reduced the Fund's commitment to ordinary Treasury notes from 26% to 22%. The Treasurys are still important for their income generation and their protection against deflation.
Other fixed income changes were more modest, although not for want of effort. We made a vigorous attempt to increase the portfolio's investment-grade corporate bond position, and in fact, we more than doubled this segment's size. However, it still aggregates to approximately 1% of the entire portfolio. We have always looked skeptically at investment-grade corporates because experience teaches us that far more are down-graded than up-graded. We prefer to invest our clients' funds where the probabilities are more favorable. We also do not like the bond market's typical focus on the yield spread of a corporate bond versus a Treasury issue of similar maturity. We much prefer to invest in corporate bonds when they appear to offer attractive absolute, rather than attractive relative, returns. We have
OAKMARK EQUITY AND INCOME FUND
17
found what we believe are several such opportunities during the quarter, but they could not absorb much capital. The corporate bond market continues to suffer from the effects of markets seizing up, and liquidity conditions remain variable. While we would have preferred to have built up a larger investment-grade corporate bond position, we could not do so on our terms.
We also continued to avoid the high yield sector. Mathematically oriented investors have calculated that current prices of high yield (or junk) debt in the aggregate effectively discount default outcomes that have never actually been realized. Such investors make the case for purchasing a wide array of junk issues, in essence betting that the outsized returns of the survivors will more than compensate for those that default. While this could work, investing in such a fashion is alien to the Equity and Income Fund. Although we do believe in diversification, we also insist that every security that enters the Fund should have definite merit and that we should be willing to own all of the issue at our purchase price. Neither knowing how bad the economy will become nor the moment when deflation will mutate over to inflation, we choose to focus on issues that are less economically vulnerable.
Once again, we thank you for being our shareholders and invite your questions and comments.
Clyde S. McGregor, CFA
Portfolio Manager
oakbx@oakmark.com | | Edward A. Studzinski, CFA
Portfolio Manager
oakbx@oakmark.com | |
|
March 31, 2009
OAKMARK EQUITY AND INCOME FUND
18
OAKMARK EQUITY AND INCOME FUND
Schedule of Investments—March 31, 2009 (Unaudited)
Name | |
Shares Held | |
Value | |
| Equity and Equivalents—48.8% | |
| Common Stocks—48.8% | |
| Apparel Retail—2.4% | |
| The TJX Cos., Inc. | | | 9,215,100 | | | $ | 236,275,164 | | |
| Foot Locker, Inc. | | | 5,000,000 | | | | 52,400,000 | | |
| | | | 288,675,164 | | |
| Cable & Satellite—2.7% | |
| Comcast Corp., Class A | | | 13,750,000 | | | $ | 187,550,000 | | |
| Scripps Networks Interactive, Inc., Class A | | | 6,208,000 | | | | 139,742,080 | | |
| | | | 327,292,080 | | |
| Home Furnishings—0.4% | |
| Mohawk Industries, Inc. (a) | | | 1,000,000 | | | $ | 29,870,000 | | |
| Leggett & Platt, Inc. | | | 1,279,056 | | | | 16,614,937 | | |
| | | | 46,484,937 | | |
| Publishing—0.2% | |
| The Washington Post Co., Class B | | | 75,000 | | | $ | 26,782,500 | | |
| Distillers & Vintners—2.2% | |
| Diageo PLC (b) | | | 5,950,000 | | | $ | 266,262,500 | | |
| Drug Retail—2.3% | |
| CVS Caremark Corp. | | | 10,000,000 | | | $ | 274,900,000 | | |
| Packaged Foods & Meats—6.8% | |
| Nestle SA (b) (c) | | | 9,457,500 | | | $ | 319,710,787 | | |
| ConAgra Foods, Inc. | | | 17,500,000 | | | | 295,225,000 | | |
| Kraft Foods, Inc., Class A | | | 9,000,000 | | | | 200,610,000 | | |
| | | | 815,545,787 | | |
| Personal Products—2.4% | |
| Avon Products, Inc. | | | 15,000,000 | | | $ | 288,450,000 | | |
| Coal & Consumable Fuels—0.6% | |
| Walter Industries, Inc. (d) | | | 3,100,000 | | | $ | 70,897,000 | | |
| Oil & Gas Exploration & Production—8.5% | |
| XTO Energy, Inc. | | | 14,305,572 | | | $ | 438,036,615 | | |
| EnCana Corp. (e) | | | 8,100,000 | | | | 328,941,000 | | |
| Apache Corp. | | | 4,000,000 | | | | 256,360,000 | | |
| | | | 1,023,337,615 | | |
| Oil & Gas Storage & Transportation—0.8% | |
| The Williams Cos., Inc. | | | 9,000,000 | | | $ | 102,420,000 | | |
| Reinsurance—1.3% | |
| PartnerRe, Ltd. (e) | | | 2,600,000 | | | $ | 161,382,000 | | |
OAKMARK EQUITY AND INCOME FUND
19
OAKMARK EQUITY AND INCOME FUND
Schedule of Investments—March 31, 2009 (Unaudited) cont.
Name | |
Shares Held | |
Value | |
| Equity and Equivalents—48.8% (cont.) | |
| Health Care Equipment—5.9% | |
| Hospira, Inc. (a) (d) | | | 8,000,000 | | | $ | 246,880,000 | | |
| Covidien, Ltd. | | | 7,000,000 | | | | 232,680,000 | | |
| Varian Medical Systems, Inc. (a) | | | 4,900,000 | | | | 149,156,000 | | |
| Steris Corp. | | | 2,250,000 | | | | 52,380,000 | | |
| Kinetic Concepts, Inc. (a) | | | 1,223,400 | | | | 25,838,208 | | |
| | | | 706,934,208 | | |
| Health Care Services—2.0% | |
| Laboratory Corp. of America Holdings (a) | | | 4,000,000 | | | $ | 233,960,000 | | |
| Life Sciences Tools & Services—0.5% | |
| Varian, Inc. (a) | | | 1,409,400 | | | $ | 33,459,156 | | |
| PerkinElmer, Inc. | | | 2,500,000 | | | | 31,925,000 | | |
| | | | 65,384,156 | | |
| Aerospace & Defense—6.3% | |
| General Dynamics Corp. | | | 7,500,000 | | | $ | 311,925,000 | | |
| Rockwell Collins, Inc. | | | 6,500,000 | | | | 212,160,000 | | |
| Goodrich Corp. | | | 4,000,000 | | | | 151,560,000 | | |
| Alliant Techsystems, Inc. (a) | | | 1,285,200 | | | | 86,082,696 | | |
| | | | 761,727,696 | | |
| Industrial Machinery—0.8% | |
| Pentair, Inc. | | | 4,000,000 | | | $ | 86,680,000 | | |
| Mueller Water Products, Inc., Class A (d) | | | 2,500,000 | | | | 8,250,000 | | |
| | | | 94,930,000 | | |
| Marine—0.6% | |
| Kirby Corp. (a) | | | 2,650,000 | | | $ | 70,596,000 | | |
| Application Software—0.1% | |
| Mentor Graphics Corp. (a) | | | 3,189,718 | | | $ | 14,162,348 | | |
| Communications Equipment—0.6% | |
| EchoStar Corp. (a) (d) | | | 4,900,000 | | | $ | 72,667,000 | | |
| Electronic Manufacturing Services—0.6% | |
| Tyco Electronics, Ltd. | | | 6,250,000 | | | $ | 69,000,000 | | |
| Construction Materials—0.8% | |
| Martin Marietta Materials, Inc. | | | 1,175,000 | | | $ | 93,177,500 | | |
| Total Common Stocks (Cost: $6,753,656,931) | | | | | | | 5,874,968,491 | | |
| Total Equity and Equivalents (Cost: $6,753,656,931) | | | | | | | 5,874,968,491 | | |
OAKMARK EQUITY AND INCOME FUND
20
OAKMARK EQUITY AND INCOME FUND
Schedule of Investments—March 31, 2009 (Unaudited) cont.
Name | |
Par Value | |
Value | |
| Fixed Income—43.0% | |
| Corporate Bonds—0.8% | |
| Diversified Real Estate Activities—0.2% | |
| Brookfield Asset Management, Inc., 7.125%, due 6/15/2012 | | $ | 19,500,000 | | | $ | 16,185,000 | | |
| Brookfield Asset Management, Inc., 5.75%, due 3/1/2010 | | | 4,875,000 | | | | 4,710,713 | | |
| | | | 20,895,713 | | |
| Property & Casualty Insurance—0.1% | |
| Fund American Cos., Inc., 5.875%, due 5/15/2013 | | $ | 20,243,000 | | | $ | 15,541,300 | | |
| Insurance Brokers—0.0% | |
| Marsh & McLennan Cos., Inc., 6.25%, due 3/15/2012 | | $ | 975,000 | | | $ | 929,479 | | |
| Consumer Finance—0.1% | |
| Toyota Motor Credit Corp., 4.00%, due 6/25/2010 | | $ | 15,000,000 | | | $ | 14,762,250 | | |
| Leisure Facilities—0.1% | |
| Vail Resorts, Inc., 6.75%, due 2/15/2014 | | $ | 15,422,000 | | | $ | 13,262,920 | | |
| Paper Packaging—0.2% | |
| Sealed Air Corp., 144A, 5.625%, due 7/15/2013 (f) | | $ | 19,400,000 | | | $ | 16,690,945 | | |
| Semiconductors—0.1% | |
| ASML Holding NV, 5.75%, due 6/13/2017 | | EUR | 10,000,000 | | | $ | 8,104,460 | | |
| Oil & Gas Exploration & Production—0.0% | |
| Newfield Exploration Co., 7.625%, due 3/1/2011 | | $ | 2,300,000 | | | $ | 2,271,250 | | |
| Health Care Services—0.0% | |
| Quest Diagnostic, Inc. Senior Note, 5.125%, due 11/1/2010 | | $ | 1,680,000 | | | $ | 1,686,320 | | |
| Total Corporate Bonds (Cost: $97,294,535) | | | | | | | 94,144,637 | | |
| Government and Agency Securities—42.2% | |
| Canadian Government Bonds—1.1% | |
| Canadian Government Bond, 3.50%, due 6/1/2013 | | CAD | 100,000,000 | | | $ | 85,287,119 | | |
| Canadian Government Bond, 4.00%, due 6/1/2016 | | CAD | 50,000,000 | | | | 44,337,722 | | |
| | | | 129,624,841 | | |
| U.S. Government Agencies—7.5% | |
| Federal Farm Credit Bank, 3.50%, due 10/3/2011 | | $ | 100,000,000 | | | $ | 104,360,400 | | |
| Federal Farm Credit Bank, 0.413%, due 2/22/2012 (g) | | | 97,000,000 | | | | 95,360,603 | | |
| Federal Home Loan Bank, 3.25%, due 3/11/2011 | | | 80,000,000 | | | | 82,778,800 | | |
| Tennessee Valley Authority, 6.79%, due 5/23/2012 | | | 58,730,000 | | | | 66,889,418 | | |
| Tennessee Valley Authority, 5.50%, due 7/18/2017 | | | 58,500,000 | | | | 65,310,336 | | |
| Federal Farm Credit Bank, 2.75%, due 5/4/2010 | | | 50,000,000 | | | | 50,902,700 | | |
OAKMARK EQUITY AND INCOME FUND
21
OAKMARK EQUITY AND INCOME FUND
Schedule of Investments—March 31, 2009 (Unaudited) cont.
Name | |
Par Value | |
Value | |
| Fixed Income—43.0% (cont.) | |
| U.S. Government Agencies—7.5% (cont.) | |
| Federal Farm Credit Bank, 2.25%, due 7/1/2010 | | $ | 50,000,000 | | | $ | 50,689,350 | | |
| Federal Farm Credit Bank, 3.875%, due 11/13/2012 | | | 40,000,000 | | | | 42,168,840 | | |
| Federal Home Loan Bank, 4.25%, due 11/20/2009 | | | 38,000,000 | | | | 38,786,448 | | |
| Federal Farm Credit Bank, 3.15%, due 5/19/2011 | | | 35,000,000 | | | | 36,172,955 | | |
| Private Export Funding Corp. Series Y, 3.55%, due 4/15/2013 | | | 25,000,000 | | | | 26,004,450 | | |
| Federal Farm Credit Bank, 4.92%, due 1/11/2010 | | | 19,400,000 | | | | 19,993,310 | | |
| Federal Farm Credit Bank, 4.50%, due 10/17/2012 | | | 15,750,000 | | | | 16,873,384 | | |
| Federal Farm Credit Bank, 5.125%, due 8/25/2016 | | | 14,625,000 | | | | 16,097,971 | | |
Private Export Funding Corp. Secured Note, Series 1, 7.20%,
due 1/15/2010 | | | 15,000,000 | | | | 15,717,480 | | |
| Federal Agricultural Mortgage Corp., 3.875%, due 8/19/2011 | | | 14,625,000 | | | | 15,374,385 | | |
| Federal Farm Credit Bank, 3.875%, due 8/25/2011 | | | 14,500,000 | | | | 15,245,228 | | |
| Federal Farm Credit Bank, 2.75%, due 11/20/2009 | | | 15,000,000 | | | | 15,174,510 | | |
| Tennessee Valley Authority, 4.375%, due 6/15/2015 | | | 10,000,000 | | | | 10,639,420 | | |
| Federal Farm Credit Bank, 5.15%, due 7/20/2009 | | | 10,216,000 | | | | 10,360,720 | | |
| Federal Farm Credit Bank, 5.25%, due 7/16/2010 | | | 9,700,000 | | | | 10,208,358 | | |
| Federal Home Loan Bank, 4.375%, due 10/22/2010 | | | 9,750,000 | | | | 10,206,271 | | |
| Federal Farm Credit Bank, 3.85%, due 2/11/2015 | | | 9,750,000 | | | | 10,169,289 | | |
| Tennessee Valley Authority, 5.625%, due 1/18/2011 | | | 8,721,000 | | | | 9,356,316 | | |
| Federal Home Loan Bank, 3.50%, due 12/10/2010 | | | 8,750,000 | | | | 9,062,375 | | |
| Federal Farm Credit Bank, 5.28%, due 8/16/2013 | | | 7,500,000 | | | | 8,315,415 | | |
| Federal Farm Credit Bank, 5.20%, due 11/28/2016 | | | 5,850,000 | | | | 6,485,135 | | |
| Federal Farm Credit Bank, 4.85%, due 12/16/2009 | | | 6,305,000 | | | | 6,475,077 | | |
| Federal Farm Credit Bank, 5.125%, due 6/6/2011 | | | 5,435,000 | | | | 5,847,343 | | |
| Federal Farm Credit Bank, 4.92%, due 8/26/2013 | | | 4,875,000 | | | | 5,334,147 | | |
| Federal Farm Credit Bank, 4.875%, due 12/16/2015 | | | 4,875,000 | | | | 5,296,434 | | |
| Federal Farm Credit Bank, 5.10%, due 8/9/2011 | | | 4,850,000 | | | | 5,233,911 | | |
| Federal Farm Credit Bank, 4.75%, due 5/7/2010 | | | 4,850,000 | | | | 5,043,835 | | |
| Federal Farm Credit Bank, 4.85%, due 3/9/2011 | | | 4,322,000 | | | | 4,602,083 | | |
| Federal Farm Credit Bank, 5.05%, due 5/25/2011 | | | 3,880,000 | | | | 4,165,595 | | |
| Tennessee Valley Authority, 4.875%, due 12/15/2016 | | | 3,750,000 | | | | 4,030,729 | | |
| Federal Farm Credit Bank, 4.50%, due 8/8/2011 | | | 2,910,000 | | | | 3,083,340 | | |
| Federal Farm Credit Bank, 4.82%, due 10/12/2012 | | | 2,425,000 | | | | 2,635,303 | | |
| | | | 910,451,664 | | |
| U.S. Government Notes—33.6% | |
| United States Treasury Notes, 4.875%, due 2/15/2012 | | $ | 485,000,000 | | | $ | 537,288,820 | | |
| United States Treasury Notes, 5.125%, due 6/30/2011 | | | 485,000,000 | | | | 531,756,910 | | |
| United States Treasury Notes, 2.875%, due 1/31/2013 | | | 500,000,000 | | | | 528,906,000 | | |
United States Treasury Notes, 1.375%, due 7/15/2018 ,
Inflation Indexed | | | 440,554,500 | | | | 436,974,995 | | |
United States Treasury Notes, 1.625%, due 1/15/2018,
Inflation Indexed | | | 403,088,000 | | | | 407,370,810 | | |
OAKMARK EQUITY AND INCOME FUND
22
OAKMARK EQUITY AND INCOME FUND
Schedule of Investments—March 31, 2009 (Unaudited) cont.
Name | |
Par Value | |
Value | |
| Fixed Income—43.0% (cont.) | |
| U.S. Government Notes—33.6% (cont.) | |
United States Treasury Notes, 2.625%, due 7/15/2017,
Inflation Indexed | | $ | 254,652,500 | | | $ | 276,536,826 | | |
| United States Treasury Notes, 5.00%, due 8/15/2011 | | | 242,500,000 | | | | 266,522,535 | | |
| United States Treasury Notes, 2.75%, due 10/31/2013 | | | 250,000,000 | | | | 263,672,000 | | |
| United States Treasury Notes, 2.75%, due 2/28/2013 | | | 250,000,000 | | | | 263,437,500 | | |
United States Treasury Notes, 2.125%, due 1/15/2019,
Inflation Indexed | | | 196,660,000 | | | | 209,381,542 | | |
| United States Treasury Notes, 4.75%, due 3/31/2011 | | | 194,000,000 | | | | 209,338,028 | | |
United States Treasury Notes, 2.00%, due 1/15/2016,
Inflation Indexed | | | 106,366,000 | | | | 109,723,124 | | |
| | | | 4,040,909,090 | | |
| Total Government and Agency Securities (Cost: $4,775,531,575) | | | | | | | 5,080,985,595 | | |
| Total Fixed Income (Cost: $4,872,826,110) | | | | | | | 5,175,130,232 | | |
| Short Term Investments—8.7% | |
| Canadian Treasury Bills—1.3% | |
Canadian Treasury Bills, 0.53% - 2.65%,
due 8/6/2009 - 3/18/2010 | | CAD | 200,000,000 | | | $ | 158,061,746 | | |
| Total Canadian Treasury Bills (Cost: $168,148,137) | | | | | | | 158,061,746 | | |
| U.S. Government Agencies—0.3% | |
| Federal Home Loan Bank, 0.92%, due 9/14/2009 | | | 40,000,000 | | | $ | 39,942,840 | | |
| Total U.S. Government Agencies (Cost: $39,834,000) | | | | | | | 39,942,840 | | |
| U.S. Government Bills—2.5% | |
United States Treasury Bills, 2.11% - 2.18%,
due 7/2/2009 - 8/27/2009 | | | 300,000,000 | | | $ | 299,741,700 | | |
| Total U.S. Government Bills (Cost: $297,900,333) | | | | | | | 299,741,700 | | |
OAKMARK EQUITY AND INCOME FUND
23
OAKMARK EQUITY AND INCOME FUND
Schedule of Investments—March 31, 2009 (Unaudited) cont.
Name | |
Par Value | |
Value | |
| Short Term Investments—8.7% (cont.) | |
| Repurchase Agreement—4.6% | |
Fixed Income Clearing Corp. Repurchase Agreement,
0.17% dated 3/31/2009 due 4/1/2009, repurchase price
$549,578,978, collateralized by Federal Home Loan Bank
Notes, with rates from 1.620% - 5.000%, with maturities
from 12/11/2009 - 12/30/2009, and with an aggregate
market value plus accrued interest of $383,008,690, and
by a Federal Home Loan Bank Discount Note, with a rate
of 0.000%, with a maturity of 7/31/2009, and with a
market value plus accrued interest of $99,875,000, and
by Freddie Mac Discount Notes, with rates of 0.000%,
with maturities from 6/30/2009 - 9/15/2009, and with
an aggregate market value plus accrued interest
of $77,688,618 | | $ | 549,576,382 | | | $ | 549,576,382 | | |
| Total Repurchase Agreement (Cost: $549,576,382) | | | | | 549,576,382 | | |
| Total Short Term Investments (Cost: $1,055,458,852) | | | | | 1,047,322,668 | | |
| Total Investments (Cost: $12,681,941,893)—100.5% | | | | $ | 12,097,421,391 | | |
| Liabilities In Excess of Other Assets—(0.5)% | | | | | (65,552,052 | ) | |
| Total Net Assets—100% | | | | $ | 12,031,869,339 | | |
(a) Non income-producing security.
(b) Represents an American Depositary Receipt.
(c) Market value is determined in good faith in accordance with procedures established by the Board of Trustees.
(d) See note number five in the Notes to the Financial Statements regarding investments in affiliated issuers.
(e) Represents a foreign domiciled corporation.
(f) Security exempt from registration pursuant to Rule 144A under the Securities Act of 1933. These securities may be resold in transactions exempt from registration, normally to qualified institutional buyers.
(g) Floating Rate Note. Rate shown is as of March 31, 2009.
Key to abbreviations:
CAD: Canadian Dollar
EUR: Euro Dollar
See accompanying Notes to Financial Statements.
OAKMARK EQUITY AND INCOME FUND
24
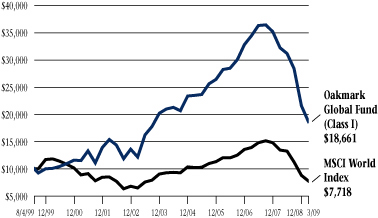
OAKMARK GLOBAL FUND
Report from Clyde S. McGregor and Robert A. Taylor, Portfolio Managers


THE VALUE OF A $10,000 INVESTMENT IN OAKMARK GLOBAL FUND FROM ITS INCEPTION (8/4/99) TO PRESENT (3/31/09) AS COMPARED TO THE MSCI WORLD INDEX18 (UNAUDITED)
| | | | | Average Annual Total Returns
(as of 3/31/09) | |
| (Unaudited) | | Total Return
Last 3 Months* | | 1-year | | 5-year | | Since
Inception
(8/4/99) | |
| Oakmark Global Fund (Class I) | | | -13.70 | % | | | -42.31 | % | | | -2.36 | % | | | 6.67 | %3 | |
| MSCI World | | | -11.92 | % | | | -42.58 | % | | | -3.50 | % | | | -2.65 | % | |
| Lipper Global Fund Index19 | | | -9.75 | % | | | -39.64 | % | | | -2.35 | % | | | -0.65 | % | |
The graph and table do not reflect the deduction of taxes that a shareholder would pay on fund distributions or the redemption of fund shares.
The expense ratio for Class I shares as of 9/30/08 was 1.16%.
The performance data quoted represents past performance. The above performance information for the Fund does not reflect the imposition of a 2% redemption fee on shares redeemed within 90 days. If reflected, the fee would reduce the performance quoted. Past performance does not guarantee future results. The investment return and principal value will fluctuate so that an investor's shares, when redeemed, may be worth more or less than their original cost. Current performance may be lower or higher than the performance data quoted. Average annual total return measures annualized change, while total return measures aggregate change. To obtain most recent month-end performance data, visit oakmark.com.
* Not annualized
Headwinds to Unprecedented
At the end of 2008, we noticed that the financial journalists' favorite word du jour was "headwinds" as in "XYZ faces severe headwinds in its ABC division." During this most recent quarter "unprecedented" became the newly popular buzzword used to refer to any number of economic experiences and policy decisions. Though the word may have been overused, it is true that over the past six months extreme economic events have occurred, often causing major political repercussions in many nations. Aside from the shift in party politics in Washington, parliamentary governments in several smaller European nations have fallen under the weight of economic duress. Warren Buffett has quipped that "when the tide goes out, you discover who has been swimming naked," and the recent discovery of multiple investme nt scams demonstrates the truth of his aphorism. Perhaps the economic contraction will prove salutary in the long term by purging excesses and flaws that good times had facilitated.
Nevertheless, the March quarter was another difficult period for the Oakmark Global Fund. The Fund returned -14% this past quarter, lagging behind the -12% return for the MSCI World Index as well as the -10% return for the Lipper Global Fund Index. More important, the Fund has returned 7% per year since inception, outperforming the MSCI World Index which averaged -3% per year over the same time period.
There were few discernible patterns in stock performance, as favorable and unfavorable stocks in the portfolio were well-distributed across countries and industries. For example, Credit Suisse, the giant Switzerland-based investment and private bank, was the strongest contributor to Fund results in the quarter, while Julius Baer, a smaller Swiss private bank, was one of the biggest detractors. Credit Suisse has had fewer problems than its local competitors, and it also has less exposure to the secrecy issue (see below). On the other hand, Julius Baer's CEO unexpectedly passed away, and the company has experienced asset outflows from GAM, its hedge fund business. U.S. technology stocks Intel and Oracle contributed positively. Intel owns an unusually strong balance sheet, which supports an attractive dividend yield. The company's new generation of microprocessors has also excited investors. Oracle, another balance sheet powerhouse, reported a
OAKMARK GLOBAL FUND
25
positive earnings surprise late in the quarter. Investors continue to be skeptical of Oracle's aggressive consolidation of the software industry, but so far the results have been positive. The largest drag on the portfolio came from Societe Television Francaise 1. Because this was also the case for the Oakmark International Fund, we refer readers to the discussion of the stock in that Fund's letter. U.S. companies Snap-On and Tyco Electronics also detracted from portfolio returns, in part because of their exposure to the automobile industry. Daiwa Securities was another poor performer, a casualty of its participation in a weak Japanese stock market.
Although it felt to us that we were very active during the quarter, we actually added only one new position and eliminated none. The strong Japanese yen and the slowing global economy allowed us to initiate a new position in Canon, the photography and office machine company, at an attractive price. We concede that the yen and the economy will both hurt Canon profits in the short term, but we are encouraged by the $8 billion of net cash and securities that the company has to survive the downturn. Given the price at which we purchased the security, we estimate that we paid only for its printer supplies business and the royalty stream it earns as the key component supplier for all of Hewlett-Packard's laser printers. This means that we have paid nothing for the copier business, the Canon-branded printer business, and the camera business. Finally, Canon's management has repurchased over 7% of the outstanding shares over the past two years, which further enhances Canon's intrinsic value per share.
The March 31 Wall Street Journal Fund Track column reported that "investors in international and global stock funds...need to keep a close eye on the U.S....because, in the view of fund managers, an international recovery will get under way only once the U.S. economy stops its fall. The U.S. accounts for an estimated one-fifth of the global economy and is the world's largest importer. Until it stabilizes, say managers of mutual funds that focus on global stocks, investors shouldn't expect outperformance from other regions."20 While this argument seems sensible, its conclusion was not supported by first quarter '09 outcomes. During the quarte r, the Chinese stock market rallied strongly, despite the depressed conditions in the markets for its exports. In addition, several commodity-sensitive markets, including Russia and Brazil, did well even though the U.S., Europe, and Japan experienced double digit stock market declines. Rather than attempt to make the sort of macro judgments described in the WSJ column, we focus on identifying mis-priced stocks wherever they may be found. While macro factors may swamp value in the short term, we know that over the long term disciplined value investing is a sustainable foundation for success. We are somewhat chagrined that Oakmark Global did not have exposure to the few markets that showed gains in the quarter, but we find it encouraging that the December quarter's universal correlation of markets to the downside did not persist into 2009. In the December quarte r there truly was no place to hide.
Can You Keep a Secret?
In September 2007, the U.S. Department of Justice launched a probe into the offshore accounts of certain U.S. clients of UBS due to allegations that UBS helped those clients avoid paying taxes related to $20 billion worth of assets under management. In February 2009, UBS settled with the Justice Department for $780 million. This incident, along with the global economic crisis, has led other major countries to demand the Swiss government change its secrecy laws in order to uncover other tax evaders. Under the threat of being blacklisted as a tax haven, Switzerland announced on March 13 that it will adopt the OECD standards on administrative assistance in tax matters. But, what does this actually mean and how will it impact our Swiss private bank holdings?
It might be helpful to discuss the history of Switzerland's secrecy and the laws. Banking secrecy, or client confidentiality, became law in Switzerland in 1934 in order to protect bank clients' information from being accessed by either individuals or official bodies. Tax avoidance (simply not paying taxes) is a civil, not a criminal, offense in Switzerland, so authorities cannot access client information in these cases. However, secrecy has always had its limits. It has been lifted when authorities—whether local or foreign—have had sufficient grounds to suspect tax fraud, which is a criminal activity.
This distinction between tax avoidance and tax fraud will be eliminated for clients domiciled outside of Switzerland after the country adopts OECD standards. Yet, the foreign tax authority will still need to submit a written request, indicating sufficient grounds for suspicion of tax evasion. Fishing expeditions will not be allowed; in other words, the IRS cannot force a Swiss private bank to disclose all of its U.S. clients without proper cause. In addition, these changes are not retroactive. At its core, this is a modification of current laws and not a complete elimination of Swiss banking privacy rules.
OAKMARK GLOBAL FUND
26
Here are some important points to consider when looking at the new rules and how they affect our investments in private banks:
1. The vast majority of clients are not using Swiss private banks to avoid taxes. We estimate that less than 15% of assets under management may be linked to tax avoidance. These "avoidance assets" tend to come from legacy customers—2nd or 3rd generations that had to keep the evasion going, but are not actively adding to assets to avoid current tax bills—and not new clients.
2. Net assets lost should be minimal. There is likely to be a transitional period during which time clients have the ability to "normalize" their tax affairs without the penalty from tax authorities. In other words, clients will be able to move their assets from Switzerland back to their home country. Companies with on-shore networks (e.g., a Swiss bank with branches on-shore in the U.S., Germany or France), should be able to retain those assets as they move from Switzerland to the client's home country. This is the case for UBS and Credit Suisse, both of which have substantial on-shore operations. Julius Baer, on the other hand, has a relatively smaller on-shore presence. We would expect Julius Baer's profits to suffer as it builds out its on-shore presence, but not enough to justify the recent share price performance.
3. Credit Suisse and Julius Baer had very few U.S. off-shore clients (U.S. clients with assets in Switzerland) because the business wasn't very profitable. Even for UBS, the $20 billion of U.S. off-shore money is a small percentage of the company's total assets under management of more than $750 billion. Such an amount isn't material to UBS's overall business.
4. Because of newer disclosure rules over the past decade, very little net new money is related to tax avoidance. In fact, much of the new money growth in Swiss banks has come from Southeast Asia and the Middle East where individual tax rates tend to be very low. In other words, if you don't have to pay high taxes, you would not need to utilize a Swiss bank to avoid high taxes.
Assets related to tax avoidance are minimal, steps are being taken by our companies to insure assets are retained and the changes to bank secrecy have been gradual enough that many of the larger Swiss institutions have prepared for the transition. We continue to monitor the situation, but do not expect a material impact to the intrinsic value of our Swiss banks.
In closing, we once again thank you for being our partners in the Oakmark Global Fund. We welcome your questions and comments.
Clyde S. McGregor, CFA
Portfolio Manager
oakgx@oakmark.com | | Robert A. Taylor, CFA
Portfolio Manager
oakgx@oakmark.com | |
|
March 31, 2009
OAKMARK GLOBAL FUND
27
THE OAKMARK GLOBAL FUND
Global Diversification—March 31, 2009 (Unaudited)
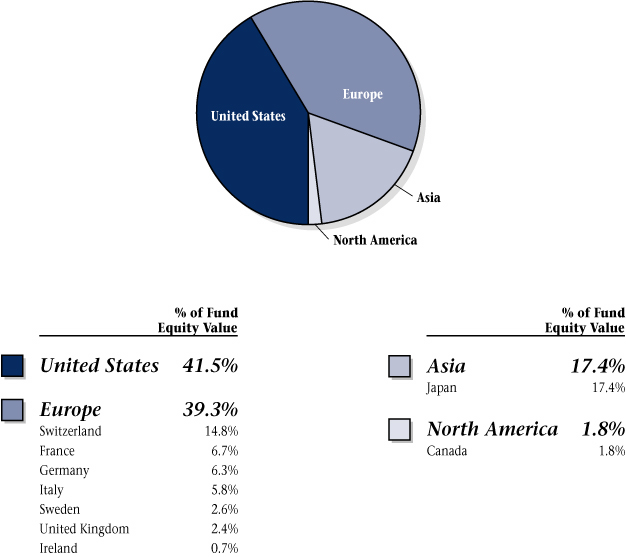
OAKMARK GLOBAL FUND
28
OAKMARK GLOBAL FUND
Schedule of Investments—March 31, 2009 (Unaudited)
Name | |
Description | |
Shares Held | |
Value | |
| Common Stocks—95.7% | |
| Apparel, Accessories & Luxury Goods—5.6% | |
| Bulgari SpA (Italy) (a) | | Jewelry Manufacturer & Retailer | | | 9,199,900 | | | $ | 40,458,088 | | |
| Luxottica Group SpA (Italy) | | Manufacturer and Retailer of
Eyeglass Frames and Sunglasses | | | 1,471,900 | | | | 22,860,570 | | |
| | | | 63,318,658 | | |
| Automobile Manufacturers—5.9% | |
| Toyota Motor Corp. (Japan) | | Automobile Manufacturer | | | 1,090,500 | | | $ | 34,372,481 | | |
Daimler AG Registered
(Germany) (b) | | Automobile Manufacturer | | | 1,278,500 | | | | 32,409,575 | | |
| | | | 66,782,056 | | |
| Broadcasting—5.9% | |
Societe Television
Francaise 1 (France) | | Broadcasting & Cable TV | | | 4,527,700 | | | $ | 35,497,478 | | |
Discovery
Communications, Inc.
Class C (United States) (a) | | Media Management &
Network Services | | | 1,550,150 | | | | 22,709,697 | | |
Discovery
Communications, Inc.
Class A (United States) (a) | | Media Management &
Network Services | | | 532,550 | | | | 8,531,451 | | |
| | | | 66,738,626 | | |
| Household Appliances—4.0% | |
Snap-On, Inc.
(United States) | | Tool & Equipment Manufacturer | | | 1,814,000 | | | $ | 45,531,400 | | |
| Movies & Entertainment—0.8% | |
Live Nation, Inc.
(United States) (a) | | Live Events Producer, Operator, &
Promoter | | | 3,296,600 | | | $ | 8,801,922 | | |
| Publishing—0.9% | |
The Washington Post Co.,
Class B (United States)
| | Newspaper & Magazine Publishing;
Educational & Career Development
Service Provider | | | 30,660 | | | $ | 10,948,686 | | |
| Distillers & Vintners—1.5% | |
Diageo PLC
(United Kingdom) | | Beverages, Wines, & Spirits
Manufacturer | | | 1,471,800 | | | $ | 16,609,402 | | |
OAKMARK GLOBAL FUND
29
OAKMARK GLOBAL FUND
Schedule of Investments—March 31, 2009 (Unaudited) cont.
Name | |
Description | |
Shares Held | |
Value | |
| Common Stocks—95.7% (cont.) | |
| Oil & Gas Exploration & Production—5.5% | |
XTO Energy, Inc.
(United States) | | Oil & Natural Gas Exploration &
Production | | | 1,200,500 | | | $ | 36,759,310 | | |
Apache Corp.
(United States) | | Oil & Natural Gas Exploration &
Production | | | 404,500 | | | | 25,924,405 | | |
| | | | 62,683,715 | | |
| Asset Management & Custody Banks—3.7% | |
Julius Baer Holding AG
(Switzerland) | | Asset Management | | | 1,710,000 | | | $ | 42,062,725 | | |
| Diversified Banks—0.7% | |
| Bank of Ireland (Ireland) | | Commercial Bank | | | 11,664,000 | | | $ | 8,058,331 | | |
| Diversified Capital Markets—7.1% | |
Credit Suisse Group
(Switzerland) | | Wealth Management &
Investment Banking | | | 1,752,300 | | | $ | 53,355,634 | | |
| UBS AG (Switzerland) (a) | | Wealth Management &
Investment Banking | | | 2,855,520 | | | | 26,841,838 | | |
| | | | 80,197,472 | | |
| Investment Banking & Brokerage—4.6% | |
Daiwa Securities
Group, Inc. (Japan) | | Stock Broker | | | 12,014,000 | | | $ | 51,947,184 | | |
| Health Care Equipment—5.5% | |
Covidien, Ltd.
(United States) | | Health Care Equipment & Supplies | | | 1,056,300 | | | $ | 35,111,412 | | |
Medtronic, Inc.
(United States) | | Health Care Equipment | | | 945,900 | | | | 27,875,673 | | |
| | | | 62,987,085 | | |
| Health Care Services—4.4% | |
Laboratory Corp. of
America Holdings
(United States) (a) | | Medical Laboratory & Testing Services | | | 864,400 | | | $ | 50,558,756 | | |
| Life Sciences Tools & Services—1.7% | |
| MDS, Inc. (Canada) (a) | | Products & Services for Medical
Product Manufacturers | | | 4,127,000 | | | $ | 19,479,440 | | |
| Pharmaceuticals—0.8% | |
GlaxoSmithKline PLC
(United Kingdom) | | Pharmaceuticals | | | 569,900 | | | $ | 8,892,716 | | |
OAKMARK GLOBAL FUND
30
OAKMARK GLOBAL FUND
Schedule of Investments—March 31, 2009 (Unaudited) cont.
Name | |
Description | |
Shares Held | |
Value | |
| Common Stocks—95.7% (cont.) | |
| Aerospace & Defense—3.2% | |
ITT Corp. (United States)
| | Designs & Manufactures Variety of
Engineered Products and Military
Defense Systems | | |
480,000 | | | |
$18,465,600 | | |
Alliant Techsystems, Inc.
(United States) (a) | | Propulsion Systems & Munitions | | | 260,487 | | | | 17,447,419 | | |
| | | | 35,913,019 | | |
| Building Products—2.5% | |
Assa Abloy AB, Series B
(Sweden) | | Develops, Designs, & Manufactures
Security Locks | | | 3,043,600 | | | $ | 28,512,689 | | |
| Human Resource & Employment Services—3.4% | |
| Adecco SA (Switzerland) | | Temporary Employment Services | | | 1,227,400 | | | $ | 38,365,011 | | |
| Railroads—3.0% | |
Union Pacific Corp.
(United States) | | Rail Transportation Provider | | | 813,600 | | | $ | 33,447,096 | | |
| Research & Consulting Services—0.6% | |
| Meitec Corp. (Japan) | | Software Engineering Services | | | 565,000 | | | $ | 6,940,850 | | |
| Application Software—3.1% | |
| SAP AG (Germany) | | Develops Business Software | | | 1,009,000 | | | $ | 35,766,071 | | |
| Electronic Components—2.8% | |
| OMRON Corp. (Japan) | | Component, Equipment, &
System Manufacturer | | | 2,706,300 | | | $ | 31,632,965 | | |
| Electronic Manufacturing Services—1.5% | |
Tyco Electronics, Ltd.
(United States) | | Manufactures Electronic
Components | | | 1,581,200 | | | $ | 17,456,448 | | |
| Office Electronics—6.1% | |
| Neopost SA (France) | | Mailroom Equipment Supplier | | | 476,300 | | | $ | 36,959,395 | | |
| Canon, Inc. (Japan) | | Computers & Information | | | 1,117,000 | | | | 31,822,397 | | |
| | | | 68,781,792 | | |
| Semiconductors—6.2% | |
Intel Corp.
(United States) | | Computer Component
Manufacturer & Designer | | | 2,539,000 | | | $ | 38,211,950 | | |
| Rohm Co., Ltd. (Japan) | | Integrated Circuits & Semiconductor
Devices Manufacturer | | | 649,400 | | | | 32,081,285 | | |
| | | | 70,293,235 | | |
OAKMARK GLOBAL FUND
31
OAKMARK GLOBAL FUND
Schedule of Investments—March 31, 2009 (Unaudited) cont.
Name | |
Description | | Shares Held/
Par Value | |
Value | |
| Common Stocks—95.7% (cont.) | |
| Systems Software—4.7% | |
Oracle Corp.
(United States) (a) | | Software Services | | | 2,926,000 | | | $ | 52,872,820 | | |
| Total Common Stocks (Cost: $1,730,204,586) | | | | | | | 1,085,580,170 | | |
| Short Term Investment—3.6% | |
| Repurchase Agreement—3.6% | |
Fixed Income Clearing Corp. Repurchase Agreement,
0.17% dated 3/31/2009 due 4/1/2009, repurchase
price $40,486,620, collateralized by a Federal Home
Loan Bank Note, with a rate of 1.620%, with a
maturity of 12/30/2009, and with a market value
plus accrued interest of $41,297,127 | | | | $ | 40,486,429 | | | $ | 40,486,429 | | |
| Total Repurchase Agreement (Cost: $40,486,429) | | | | | | | 40,486,429 | | |
| Total Short Term Investment (Cost: $40,486,429) | | | | | | | 40,486,429 | | |
| Total Investments (Cost: $1,770,691,015)—99.3% | | | | | | $ | 1,126,066,599 | | |
| Other Assets In Excess of Liabilities—0.7% | | | | | | | 7,607,147 | | |
| Total Net Assets—100% | | $ | 1,133,673,746 | | |
(a) Non income-producing security.
(b) A portion of security out on loan.
See accompanying Notes to Financial Statements.
OAKMARK GLOBAL FUND
32
OAKMARK GLOBAL SELECT FUND
Report from Bill Nygren and David Herro, Portfolio Managers


THE VALUE OF A $10,000 INVESTMENT IN OAKMARK GLOBAL SELECT FUND FROM ITS INCEPTION (10/2/06) TO PRESENT (3/31/09) AS COMPARED TO THE MSCI WORLD INDEX18 (UNAUDITED)

| | | Total Returns
(as of 3/31/09) | |
| (Unaudited) | | Last 3 Months* | | 1-year | | Average Annual
Total Return
Since Inception
(10/2/06) | |
Oakmark Global
Select Fund (Class I) | | | -4.29 | % | | | -27.41 | % | | | -13.87 | % | |
| MSCI World | | | -11.92 | % | | | -42.58 | % | | | -17.66 | % | |
| Lipper Global Fund Index19 | | | -9.75 | % | | | -39.64 | % | | | -15.61 | % | |
The graph and table do not reflect the deduction of taxes that a shareholder would pay on fund distributions or the redemption of fund shares.
The expense ratio for Class I shares as of 9/30/08 was 1.35%.
The performance data quoted represents past performance. The above performance information for the Fund does not reflect the imposition of a 2% redemption fee on shares redeemed within 90 days. If reflected, the fee would reduce the performance quoted. Past performance does not guarantee future results. The investment return and principal value will fluctuate so that an investor's shares, when redeemed, may be worth more or less than their original cost. Current performance may be lower or higher than the performance data quoted. Average annual total return measures annualized change, while total return measures aggregate change. To obtain most recent month-end performance data, visit oakmark.com.
* Not annualized
The Oakmark Global Select Fund finished the quarter down 4%, which compares favorably to the MSCI World Index, which ended down 12%. Our holdings in the health care and information technology sectors contributed the most to the Fund's relative outperformance during the quarter.
One of the biggest contributors to Fund performance during the quarter was Best Buy Co., a U.S.-based consumer electronics retailer, which returned 36%. Fourth quarter earnings were better than expected due to stronger sales and improved inventory and cost controls. Market share increased, and pressure on revenue eased as the country's second largest retailer, Circuit City Stores, Inc., entered liquidation and closed its doors. Looking forward, we expect Best Buy to continue to increase market share and believe management has taken the necessary steps to control costs amid the unknown consumer spending environment. Schering-Plough Corporation was another top contributor for the quarter as it agreed to be acquired by Merck in a cash and stock deal valued around $26 a share. Part of our original thesis for owning Schering was the proven ability of its CEO, Fred Hassan, to maximize shareholder value. He did not disappoint; the company's shares rose 39% during the quarter.
Societe Television Francaise 1 (TF1), France's largest television broadcaster, was the Fund's largest detractor for the quarter. Please reference the Oakmark International Fund letter for commentary on TF1. Another detractor from performance for the quarter was Capital One Financial Corp., a U.S.-based banking and credit card company. Credit card company performance is highly correlated with unemployment. With continued deterioration in economic conditions, and with increases in unemployment, companies with high exposure to credit cards tend to be hard hit. Charge-offs are expected to increase, and while elevated credit costs continue to depress earnings, Capital One ended the quarter well capitalized with a very strong Tier 1 capital ratio of approximately 15%. With a solid balance sheet, strong brand name, conservative management philosophy, and limited mortgage exposure, we believe that fears are exaggerated and that, at current valuation s, the company provides a unique investment opportunity.
OAKMARK GLOBAL SELECT FUND
33
Portfolio Composition
Changes to the portfolio were minimal during the quarter. GlaxoSmithKline plc, a U.K.-based pharmaceutical company, was sold from the portfolio, and we used proceeds from the sale to purchase Compagnie Financiere Richemont SA (Richemont), a Swiss-based luxury goods manufacturer and retailer of brands that include Cartier, Montblanc and Jaeger-LeCoultre.
Geographically, we made minor changes to our portfolio weightings this quarter. As a result, the U.K. decreased to approximately 9% of the portfolio, while North America and the rest of Europe increased to approximately 52% and 29%, respectively. The remaining 10%, excluding cash, was invested in Japan.
Our currency hedges performed well, adding 0.8% to performance for the quarter. Due to the strengthening U.S. dollar relative to other world currencies, we decreased the weighting of our Swiss franc hedges from approximately 50% to 10%, our Japanese yen hedges from 20% to 15%, and completely eliminated our euro hedge.
While some uncertainty remains regarding the global economic crisis, we remain confident in our valuation approach and believe the Fund is well positioned to benefit our shareholders in the long-run. As always, we thank you for your continued patience and support!
William C. Nygren, CFA
Portfolio Manager
oakwx@oakmark.com | | David G. Herro, CFA
Portfolio Manager
oakwx@oakmark.com | |
|
March 31, 2009
OAKMARK GLOBAL SELECT FUND
34
THE OAKMARK GLOBAL SELECT FUND
Global Diversification—March 31, 2009 (Unaudited)

OAKMARK GLOBAL SELECT FUND
35
OAKMARK GLOBAL SELECT FUND
Schedule of Investments—March 31, 2009 (Unaudited)
Name | |
Description | |
Shares Held | |
Value | |
| Common Stocks—94.6% | |
| Apparel, Accessories & Luxury Goods—5.0% | |
Compagnie Financiere
Richemont SA
(Switzerland) | | Manufacturer and Retailer of
Luxury Goods | | | 587,500 | | | $ | 9,176,623 | | |
| Broadcasting—6.3% | |
Societe Television
Francaise 1 (France) | | Broadcasting & Cable TV | | | 1,462,000 | | | $ | 11,462,180 | | |
| Cable & Satellite—11.5% | |
Liberty Media Corp. -
Entertainment
(United States) (a) | | Television & On-line Media
Holdings | | | 625,000 | | | $ | 12,468,750 | | |
British Sky Broadcasting
Group PLC
(United Kingdom) | | Television Production &
Broadcasting | | | 1,347,000 | | | | 8,378,440 | | |
| | | | 20,847,190 | | |
| Computer & Electronics Retail—7.2% | |
Best Buy Co., Inc.
(United States) | | Computer & Electronics Retailer | | | 345,000 | | | $ | 13,096,200 | | |
| Movies & Entertainment—8.1% | |
Viacom, Inc., Class B
(United States) (a) | | Publishing Company | | | 514,000 | | | $ | 8,933,320 | | |
Time Warner, Inc.
(United States) | | Filmed Entertainment & Television
Networks | | | 303,333 | | | | 5,854,327 | | |
| | | | 14,787,647 | | |
| Asset Management & Custody Banks—4.1% | |
Schroders PLC
(United Kingdom) | | International Asset Management | | | 657,000 | | | $ | 7,456,729 | | |
| Consumer Finance—1.7% | |
Capital One Financial Corp.
(United States) | | Credit Card Products & Services
Provider | | | 245,000 | | | $ | 2,998,800 | | |
| Diversified Capital Markets—6.6% | |
Credit Suisse Group
(Switzerland) | | Wealth Management & Investment
Banking | | | 396,800 | | | $ | 12,082,130 | | |
OAKMARK GLOBAL SELECT FUND
36
OAKMARK GLOBAL SELECT FUND
Schedule of Investments—March 31, 2009 (Unaudited) cont.
Name | |
Description | |
Shares Held | |
Value | |
| Common Stocks—94.6% (cont.) | |
| Investment Banking & Brokerage—5.2% | |
Daiwa Securities
Group, Inc. (Japan) | | Stock Broker | | | 2,173,000 | | | $ | 9,395,807 | | |
| Other Diversified Financial Services—1.3% | |
Bank of America Corp.
(United States) | | Banking & Financial Services | | | 350,000 | | | $ | 2,387,000 | | |
| Pharmaceuticals—9.7% | |
Bristol-Myers Squibb Co.
(United States) | | Health & Personal Care | | | 405,000 | | | $ | 8,877,600 | | |
Schering-Plough Corp.
(United States) | | Pharmaceuticals | | | 370,000 | | | | 8,713,500 | | |
| | | | 17,591,100 | | |
| Human Resource & Employment Services—5.0% | |
| Adecco SA (Switzerland) | | Temporary Employment Services | | | 288,900 | | | $ | 9,030,187 | | |
| Application Software—4.3% | |
| SAP AG (Germany) | | Develops Business Software | | | 221,000 | | | $ | 7,833,798 | | |
| Computer Hardware—3.8% | |
| Dell, Inc. (United States) (a) | | Technology Products & Services | | | 738,000 | | | $ | 6,996,240 | | |
| Semiconductors—14.8% | |
Texas Instruments, Inc.
(United States) | | Designs & Supplies Digital Signal
Processing & Analog Technologies | | | 560,000 | | | $ | 9,245,600 | | |
| Intel Corp. (United States) | | Computer Component
Manufacturer & Designer | | | 592,000 | | | | 8,909,600 | | |
| Rohm Co., Ltd. (Japan) | | Integrated Circuits & Semiconductor
Devices Manufacturer | | | 176,500 | | | | 8,719,351 | | |
| | | | 26,874,551 | | |
| Total Common Stocks (Cost: $251,113,262) | | | | | | | | | 172,016,182 | | |
OAKMARK GLOBAL SELECT FUND
37
OAKMARK GLOBAL SELECT FUND
Schedule of Investments—March 31, 2009 (Unaudited) cont.
Name | | | | Par Value | |
Value | |
| Short Term Investment—5.4% | |
| Repurchase Agreement—5.4% | |
Fixed Income Clearing Corp. Repurchase Agreement,
0.17% dated 3/31/2009 due 4/1/2009, repurchase
price $9,886,822, collateralized by a Federal Home
Loan Bank Note, with a rate of 1.620%, with a maturity
of 12/30/2009, and with a market value plus accrued
interest of $10,086,000 | | | | $ | 9,886,775 | | | $ | 9,886,775 | | |
| Total Repurchase Agreement (Cost: $9,886,775) | | | | | | | 9,886,775 | | |
| Total Short Term Investment (Cost: $9,886,775) | | | | | | | 9,886,775 | | |
| Total Investments (Cost: $261,000,037)—100.0% | | | | | | $ | 181,902,957 | | |
| Other Assets In Excess of Liabilities—0.0% | | | | | | | 36,102 | | |
| Total Net Assets—100% | | $ | 181,939,059 | | |
(a) Non income-producing security.
See accompanying Notes to Financial Statements.
OAKMARK GLOBAL SELECT FUND
38
OAKMARK INTERNATIONAL AND
OAKMARK INTERNATIONAL SMALL CAP FUNDS

Fellow Shareholders,
In a quarter that exemplified further extreme volatility, we remain very optimistic about the positioning of The Oakmark International Funds. Both Funds outperformed the MSCI World ex U.S. Index21; in fact, Oakmark International did so significantly. However, both Funds produced a negative rate of return.
In January, global equity markets opened strongly, but the rally did not last. Through February and early March global markets were hammered and slightly recovered in Mid-March. Although some might speculate about why the markets behaved so poorly from mid-January to mid-March, we focus on finding new investment opportunities. So much has happened—in terms of both fiscal and monetary policy initiatives—that it is actually hard to keep track. It also seems that the Europeans outside the U.K. are not in agreement with the U.S. about the need for large stimulus spending. Who would have thought that France would be more concerned about deficit spending than the U.S.?
Despite the fogginess of recession, we remain optimistic about the global economy over the medium to long term. Though it is right to be concerned about future U.S. competitiveness due to some of the new administration's proposals ("card check," high tax rates, cap and trade, etc.), the strength of the emerging markets adds a new dimension compared to former global slowdowns. China, Brazil, India and Vietnam are still projected to grow over the next 12 to 18 months. Also, unlike 20 years ago, these countries now contribute significantly to global consumption and growth. Today, China is the third largest economy in the world, challenging Japan to become the second largest economy. Recall that this is all that the commodity bubble's "super cycle" was based on a few years ago.
There is no doubt that this global economic slowdown is painful. The average rate of growth has been between 4-5% over the last 3 years. In 2009, we will be lucky to achieve a 1-2% rate for the world. Of course, the ugliest implication of slow or no growth is the increased unemployment and the social strain that it causes. However, one can hope that some good will come of what we are experiencing. Remember, the Asia crisis of 1997-1998—which was every bit as severe as this one but only on a more local level—resulted in permanent reforms that have enabled that region to weather the current storm much better than most. Hopefully, today's downturn will have the same effect. If it results in better, smarter regulation, more responsible corporate decision-making and more realistic consumer spending and borrowing, then the pain we are suffering today is not all for naught.
From an investment perspective, we remain focused on "seizing the moment." We do believe the global economy will recover over the medium term, and we are using today's fear and fright to buy quality businesses at bargain-basement prices. We recognize that these situations are not common and remain poised to enthusiastically take advantage of today's fear in order to generate tomorrow's profits.
David G. Herro, CFA
Portfolio Manager
oakix@oakmark.com
oakex@oakmark.com
March 31, 2009
OAKMARK INTERNATIONAL AND OAKMARK INTERNATIONAL SMALL CAP FUNDS
39
OAKMARK INTERNATIONAL FUND
Report from David G. Herro and Robert A. Taylor, Portfolio Managers


THE VALUE OF A $10,000 INVESTMENT IN OAKMARK INTERNATIONAL FUND FROM ITS INCEPTION (9/30/92) TO PRESENT (3/31/09) AS COMPARED TO THE MSCI WORLD EX U.S. INDEX21 (UNAUDITED)
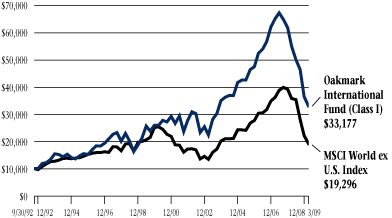
| | | | | Average Annual Total Returns
(as of 3/31/09) | |
| (Unaudited) | | Total Return
Last 3 Months* | | 1-year | | 5-year | | 10-year | | Since
Inception
(9/30/92) | |
Oakmark International
Fund (Class I) | | | -9.31 | % | | | -39.93 | % | | | -1.85 | % | | | 4.55 | % | | | 7.54 | % | |
| MSCI World ex U.S. | | | -13.14 | % | | | -46.31 | % | | | -1.74 | % | | | -0.39 | % | | | 4.06 | % | |
| MSCI EAFE22 | | | -13.94 | % | | | -46.51 | % | | | -2.18 | % | | | -0.84 | % | | | 3.78 | % | |
Lipper International
Fund Index23 | | | -12.36 | % | | | -45.45 | % | | | -1.47 | % | | | 0.67 | % | | | 5.03 | % | |
The graph and table do not reflect the deduction of taxes that a shareholder would pay on fund distributions or the redemption of fund shares.
The expense ratio for Class I shares as of 9/30/08 was 1.10%.
The performance data quoted represents past performance. The above performance information for the Fund does not reflect the imposition of a 2% redemption fee on shares redeemed within 90 days. If reflected, the fee would reduce the performance quoted. Past performance does not guarantee future results. The investment return and principal value will fluctuate so that an investor's shares, when redeemed, may be worth more or less than their original cost. Current performance may be lower or higher than the performance data quoted. Average annual total return measures annualized change, while total return measures aggregate change. To obtain most recent month-end performance data, visit oakmark.com.
* Not annualized
The Oakmark International Fund declined 9% for the quarter ended March 31, 2009, comparing favorably to the MSCI World ex U.S. Index, which lost 13%. More importantly, the Fund has returned an average of 8% per year since inception in September 1992, outperforming the MSCI World ex U.S. Index, which averaged 4% per year over the same period.
While Signet Jewelers, the world's largest jewelry store owner, was a significant detractor from Fund performance last quarter, it was a top contributor in the first quarter of '09, returning 32%. Signet has fared far better than its competitors in this difficult environment because it entered the downturn in a much stronger financial position. Since then, its management has also aggressively initiated cost-cutting programs. Three of Signet's largest competitors either filed for bankruptcy or liquidated in 2008. Compared to its peers, Signet has experienced a more moderate decline in sales. Although Signet reported a 16% decline in sales during the 2008 holiday season, sales at Zales were down 18%, and sales at other competitors such as Shane Co. and Tiffany & Co. were off 28-35%. Contrary to its peers, Signet has not relied heavily on discounts and promotions to move inventory, and it has actually managed to improve gross margins. Anoth er positive for Signet during the quarter was the announcement that it renegotiated its borrowing facilities and loosened its debt covenant. Though we anticipate further weakness in the industry for 2009, we remain confident in Signet's management team, given its performance in this environment, and we believe that they will emerge from this downturn in an exceptionally competitive position.
Societe Television Francaise 1 (TF1), France's largest television broadcaster, was the Fund's largest detractor for the quarter, declining 46%. We can't ignore that this is a challenging environment for advertising and television programming; however, we believe the market has severely over-reacted, which in turn has created a unique investment opportunity. In the short term, as the market leader and premium provider, TF1 will likely suffer disproportionally through the advertising downturn. Longer term, however, TF1 will benefit from being the dominant player in television advertising and from having a leading media franchise in its market. Additionally, across the organization, dramatic
OAKMARK INTERNATIONAL FUND
40
shifts in management and culture have produced greater focus on margins and cash generation. The French government's continued media regulation reform should also benefit the business. From a valuation perspective, if you deduct the value of assets unrelated to the company's core business operations, TF1 is trading at just 5.5x trailing EBIT. While we recognize the cyclical nature of TF1's industry, we believe that the company's current valuations constitute an unwarranted discount compared to its peers in the television and radio industries and is priced significantly below the company's intrinsic value.
Portfolio Composition
We added three new names to the Fund during the quarter. These include two holdings that the Fund has owned before: EnCana Corporation, a Canadian based natural gas producer; and Nestle SA, a Swiss packaged food manufacturer. We also purchased Redecard SA, a Brazilian credit and debit card processor. No positions were eliminated during the quarter.
Geographically, we made minor adjustments to our portfolio weightings this quarter. We decreased Europe and the U.K. holdings to approximately 72% of investments, while we increased Latin and North America investments to roughly 9% of the portfolio, mainly due to increased weightings in Canada and our entrance into the Brazilian market. Our Pacific Rim exposure remained relatively unchanged at 19%, and the balance of the portfolio, excluding cash, was invested in the Middle East.
Our currency hedges performed well during the quarter, adding 1.2% to performance. Due to the strengthening U.S. dollar relative to currencies, we reduced our Swiss franc hedges from approximately 50% to 12%, our Japanese yen hedges from approximately 25% to 14%, and completely eliminated our euro hedge.
We are glad to have 2008 behind us, and although 2009 is proving to be another challenging year, we remain upbeat about the future of the global economy and are excited about the unique buying opportunities this market has created. Our long-term value approach continues to uncover high quality companies that trade at attractive prices that we believe will provide attractive returns for our shareholders in the future. Thanks for your continued support and confidence!
David G. Herro, CFA
Portfolio Manager
oakix@oakmark.com | | Robert A. Taylor, CFA
Portfolio Manager
oakix@oakmark.com | |
|
March 31, 2009
OAKMARK INTERNATIONAL FUND
41
THE OAKMARK INTERNATIONAL FUND
Global Diversification—March 31, 2009 (Unaudited)
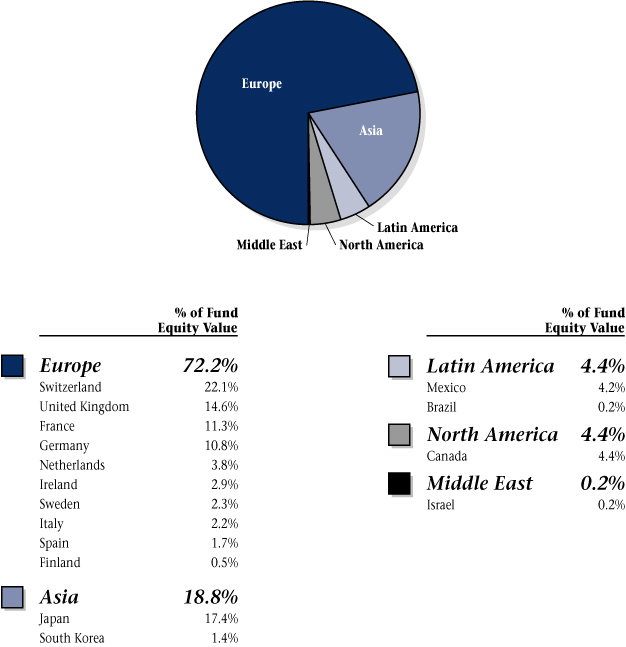
oakmark international fund
42
OAKMARK INTERNATIONAL FUND
Schedule of Investments—March 31, 2009 (Unaudited)
Name | |
Description | |
Shares Held | |
Value | |
| Common Stocks—96.0% | |
| Advertising—2.9% | |
Publicis Groupe
(France) | | Advertising & Media Services | | | 2,605,200 | | | $ | 66,871,710 | | |
| Apparel, Accessories & Luxury Goods—9.3% | |
Compagnie Financiere
Richemont SA
(Switzerland) | | Manufacturer and Retailer of
Luxury Goods | | | 3,928,600 | | | $ | 61,363,883 | | |
LVMH Moet Hennessy
Louis Vuitton SA
(France) | | Diversified Luxury Goods
Conglomerate | | | 862,500 | | | | 54,190,438 | | |
Swatch Group AG, Bearer
Shares (Switzerland) | | Watch Manufacturer | | | 427,500 | | | | 51,639,506 | | |
| Luxottica Group SpA (Italy) | | Manufacturer and Retailer of
Eyeglass Frames and Sunglasses | | | 3,158,915 | | | | 49,062,163 | | |
| | | | 216,255,990 | | |
| Automobile Manufacturers—7.7% | |
Daimler AG Registered
(Germany) (b) | | Automobile Manufacturer | | | 2,277,800 | | | $ | 57,741,518 | | |
| Toyota Motor Corp. (Japan) | | Automobile Manufacturer | | | 1,650,300 | | | | 52,017,336 | | |
Bayerische Motoren Werke
(BMW) AG (Germany) | | Luxury Automobile Manufacturer | | | 1,761,800 | | | | 51,004,451 | | |
Honda Motor Co., Ltd.
(Japan) | | Automobile & Motorcycle
Manufacturer | | | 770,400 | | | | 18,017,639 | | |
| | | | 178,780,944 | | |
| Broadcasting—6.5% | |
Grupo Televisa SA
(Mexico) (c) | | Television Production &
Broadcasting | | | 4,285,800 | | | $ | 58,458,312 | | |
Societe Television
Francaise 1 (France) | | Broadcasting & Cable TV | | | 7,127,000 | | | | 55,876,168 | | |
Gestevision Telecinco
SA (Spain) | | Television Production &
Broadcasting | | | 5,340,895 | | | | 37,040,665 | | |
| | | | 151,375,145 | | |
| Cable & Satellite—2.4% | |
British Sky Broadcasting
Group PLC
(United Kingdom) | | Television Production &
Broadcasting | | | 8,756,100 | | | $ | 54,463,594 | | |
OAKMARK INTERNATIONAL FUND
43
OAKMARK INTERNATIONAL FUND
Schedule of Investments—March 31, 2009 (Unaudited) cont.
Name | |
Description | |
Shares Held | |
Value | |
| Common Stocks—96.0% (cont.) | |
| Publishing—2.2% | |
Thomson Reuters PLC
(Canada) | | Electronic Information &
Solutions Company | | | 2,129,600 | | | $ | 47,668,240 | | |
Johnston Press PLC
(United Kingdom) | | Newspaper Publishing | | | 26,926,703 | | | | 2,553,825 | | |
| | | | 50,222,065 | | |
| Specialty Stores—3.4% | |
Signet Jewelers, Ltd.
(United Kingdom) (d) | | Jewelry Retailer | | | 6,834,400 | | | $ | 78,253,880 | | |
| Distillers & Vintners—1.7% | |
Diageo PLC
(United Kingdom) | | Beverages, Wines, & Spirits
Manufacturer | | | 3,368,000 | | | $ | 38,008,199 | | |
| Packaged Foods & Meats—0.9% | |
| Nestle SA (Switzerland) | | Food & Beverage Manufacturer | | | 609,100 | | | $ | 20,590,501 | | |
| Soft Drinks—1.5% | |
Fomento Economico
Mexicano S.A.B. de C.V.
(Mexico) (c) | | Beverage Company | | | 1,410,900 | | | $ | 35,568,789 | | |
| Oil & Gas Exploration & Production—1.5% | |
| EnCana Corp. (Canada) | | Develops, Produces, & Markets
Natural Gas | | | 882,300 | | | $ | 35,830,203 | | |
| Asset Management & Custody Banks—2.4% | |
Schroders PLC
(United Kingdom) | | International Asset Management | | | 4,854,100 | | | $ | 55,092,399 | | |
| Diversified Banks—4.7% | |
| BNP Paribas SA (France) | | Commercial Bank | | | 1,807,900 | | | $ | 74,749,490 | | |
| Bank of Ireland (Ireland) | | Commercial Bank | | | 28,205,078 | | | | 19,486,098 | | |
Lloyds Banking Group PLC
(United Kingdom) | | Commercial Bank | | | 13,174,737 | | | | 13,364,966 | | |
| | | | 107,600,554 | | |
| Diversified Capital Markets—5.8% | |
Credit Suisse Group
(Switzerland) | | Wealth Management & Investment
Banking | | | 2,934,000 | | | $ | 89,337,117 | | |
| UBS AG (Switzerland) (a) | | Wealth Management & Investment
Banking | | | 4,755,000 | | | | 44,696,916 | | |
| | | | 134,034,033 | | |
OAKMARK INTERNATIONAL FUND
44
OAKMARK INTERNATIONAL FUND
Schedule of Investments—March 31, 2009 (Unaudited) cont.
Name | |
Description | |
Shares Held | |
Value | |
| Common Stocks—96.0% (cont.) | |
| Investment Banking & Brokerage—3.7% | |
Daiwa Securities
Group, Inc. (Japan) | | Stock Broker | | | 19,761,800 | | | $ | 85,447,799 | | |
| Multi-line Insurance—3.1% | |
Allianz SE Registered
(Germany) | | Insurance, Banking & Financial
Services | | | 860,000 | | | $ | 72,280,621 | | |
| Pharmaceuticals—3.2% | |
GlaxoSmithKline PLC
(United Kingdom) | | Pharmaceuticals | | | 2,372,100 | | | $ | 37,014,232 | | |
| Novartis AG (Switzerland) | | Pharmaceuticals | | | 948,000 | | | | 35,877,923 | | |
| | | | 72,892,155 | | |
| Building Products—3.8% | |
Assa Abloy AB, Series B
(Sweden) | | Develops, Designs, & Manufactures
Security Locks | | | 5,323,600 | | | $ | 49,871,913 | | |
Geberit AG, Registered
Shares (Switzerland) | | Building Products | | | 408,500 | | | | 36,712,246 | | |
| | | | 86,584,159 | | |
| Human Resource & Employment Services—2.8% | |
| Adecco SA (Switzerland) | | Temporary Employment Services | | | 2,041,100 | | | $ | 63,798,944 | | |
| Industrial Machinery—0.5% | |
| Kone OYJ (Finland) | | Elevator & Escalator Modernization &
Maintenance | | | 576,200 | | | $ | 11,942,413 | | |
| Marine—2.3% | |
Kuehne + Nagel
International AG
(Switzerland) | | Sea, Land, & Rail Freight
Transportation Businesses | | | 919,900 | | | $ | 53,700,567 | | |
| Railroads—0.6% | |
Canadian National
Railway Co. (Canada) | | Railroad Transportation | | | 402,100 | | | $ | 14,254,445 | | |
| Research & Consulting Services—3.3% | |
Experian Group, Ltd.
(Ireland) | | Credit and Marketing Services | | | 7,178,000 | | | $ | 44,982,423 | | |
| Meitec Corp. (Japan) (d) | | Software Engineering Services | | | 2,475,100 | | | | 30,405,835 | | |
| | | | 75,388,258 | | |
| Security & Alarm Services—1.9% | |
| G4S PLC (United Kingdom) | | Security Services | | | 16,140,300 | | | $ | 44,905,123 | | |
OAKMARK INTERNATIONAL FUND
45
OAKMARK INTERNATIONAL FUND
Schedule of Investments—March 31, 2009 (Unaudited) cont.
Name | |
Description | |
Shares Held | |
Value | |
| Common Stocks—96.0% (cont.) | |
| Application Software—2.6% | |
| SAP AG (Germany) | | Develops Business Software | | | 1,660,300 | | | $ | 58,852,733 | | |
| Data Processing & Outsourced Services—0.2% | |
| Redecard SA (Brazil) | | Processes Credit & Debit Card
Transactions | | | 319,300 | | | $ | 3,860,918 | | |
| Electronic Components—3.3% | |
| OMRON Corp. (Japan) | | Component, Equipment, & System
Manufacturer | | | 6,488,500 | | | $ | 75,841,739 | | |
| Electronic Equipment & Instruments—0.2% | |
| Orbotech, Ltd. (Israel) (a) | | Optical Inspection Systems | | | 1,237,700 | | | $ | 4,690,883 | | |
| Office Electronics—2.6% | |
| Canon, Inc. (Japan) | | Computers & Information | | | 2,132,700 | | | $ | 60,758,842 | | |
| Semiconductor Equipment—1.5% | |
ASML Holding NV
(Netherlands)
| | Develop, Produce and Market
Semiconductor Manufacturing
Equipment | | | 2,008,800 | | | $ | 35,629,703 | | |
| Semiconductors—4.1% | |
Rohm Co., Ltd.
(Japan) | | Integrated Circuits & Semiconductor
Devices Manufacturer | | | 1,280,300 | | | $ | 63,248,644 | | |
Samsung Electronics
Co., Ltd. (South Korea) | | Consumer & Industrial Electronic
Equipment Manufacturer | | | 77,200 | | | | 31,700,416 | | |
| | | | 94,949,060 | | |
| Diversified Chemicals—2.0% | |
Akzo Nobel NV
(Netherlands) | | Produces & Markets Chemicals,
Coatings, & Paints | | | 1,255,300 | | | $ | 47,523,720 | | |
| Specialty Chemicals—1.4% | |
| Givaudan SA (Switzerland) | | Manufactures and Markets Fragrances | | | 62,100 | | | $ | 32,187,473 | | |
| Total Common Stocks (Cost: $3,722,094,469) | | | | | | | | | 2,218,437,561 | | |
OAKMARK INTERNATIONAL FUND
46
OAKMARK INTERNATIONAL FUND
Schedule of Investments—March 31, 2009 (Unaudited) cont.
Name | |
| |
Par Value | |
Value | |
| Short Term Investment—3.2% | |
| Repurchase Agreement—3.2% | |
Fixed Income Clearing Corp. Repurchase Agreement,
0.17% dated 3/31/2009 due 4/1/2009, repurchase
price $74,630,623, collateralized by a Federal Home
Loan Bank Note, with a rate of 1.620%, with a
maturity of 12/30/2009, and with a market value
plus accrued interest of $76,124,085 | | | | $ | 74,630,271 | | | $ | 74,630,271 | | |
| Total Repurchase Agreement (Cost: $74,630,271) | | | | | | | 74,630,271 | | |
| Total Short Term Investment (Cost: $74,630,271) | | | | | | | 74,630,271 | | |
| Total Investments (Cost: $3,796,724,740)—99.2% | | | | | | $ | 2,293,067,832 | | |
| Foreign Currencies (Cost: $811,703)—0.0% | | | | | | $ | 802,970 | | |
| Other Assets In Excess of Liabilities—0.8% | | | | | | | 18,441,132 | | |
| Total Net Assets—100% | | $ | 2,312,311,934 | | |
(a) Non income-producing security.
(b) A portion of security out on loan.
(c) Represents an American Depositary Receipt.
(d) See note number five in the Notes to the Financial Statements regarding investments in affiliated issuers.
See accompanying Notes to Financial Statements.
OAKMARK INTERNATIONAL FUND
47
OAKMARK INTERNATIONAL
SMALL CAP FUND
Report from David G. Herro and Chad M. Clark, Portfolio Managers


THE VALUE OF A $10,000 INVESTMENT IN OAKMARK INT'L SMALL CAP FUND FROM 3/31/99 TO PRESENT (3/31/09) AS COMPARED TO MSCI WORLD EX U.S. SMALL CAP24 AND MSCI WORLD EX U.S.21 INDEXES (UNAUDITED)†
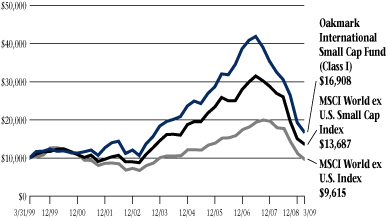
| | | | | Average Annual Total Returns
(as of 3/31/09) | |
| (Unaudited) | | Total Return
Last 3 Months* | | 1-year | | 5-year | | 10-year | | Since
Inception
(11/1/95) | |
Oakmark International
Small Cap Fund
(Class I) | | | -12.36 | % | | | -48.24 | % | | | -2.89 | % | | | 5.39 | % | | | 6.12 | % | |
MSCI World ex U.S.
Small Cap | | | -8.91 | % | | | -49.40 | % | | | -3.27 | % | | | 3.19 | % | | N/A | |
| MSCI World ex U.S. | | | -13.14 | % | | | -46.31 | % | | | -1.74 | % | | | -0.39 | % | | | 2.34 | % | |
Lipper International
Small Cap Index25 | | | -9.99 | % | | | -49.68 | % | | | -1.12 | % | | | 5.03 | % | | N/A | |
The graph and table do not reflect the deduction of taxes that a shareholder would pay on fund distributions or the redemption of fund shares.
The expense ratio for Class I shares as of 9/30/08 was 1.41%.
The performance data quoted represents past performance. The above performance information for the Fund does not reflect the imposition of a 2% redemption fee on shares redeemed within 90 days. If reflected, the fee would reduce the performance quoted. Past performance does not guarantee future results. The investment return and principal value will fluctuate so that an investor's shares, when redeemed, may be worth more or less than their original cost. Current performance may be lower or higher than the performance data quoted. Average annual total return measures annualized change, while total return measures aggregate change. To obtain most recent month-end performance data, visit oakmark.com.
* Not annualized
The Oakmark International Small Cap Fund declined 12% for the quarter ended March 31, 2009. This compares to the MSCI World ex U.S. Small Cap Index, which declined 9% and the MSCI World ex U.S. Index, which fell 13%. More importantly, since inception, your Fund has returned 6% annualized, compared to the MSCI World ex U.S. Index, which returned 2% for the same period.
Despite challenging conditions in the U.K. housing market, LSL Property Services, a leading provider of residential appraisal and brokerage services, was the Fund's top performing stock this quarter. One of the key reasons we originally purchased this investment—despite the expectation of a poor housing market—was the inherent stability of the group's appraisal operations. Any time a new mortgage is issued or an individual refinances, an appraisal of the property is necessary. Given that most mortgages in the U.K. are taken out on "teaser rates" to begin with, the underlying refinance market is reasonably strong irrespective of the overall housing environment. We believe that not only is LSL's model superior to its peers, but LSL's balance sheet is also in far better condition than many of its competitors. This has allowed the group to win substantial market share through the downturn as lenders look toward financially sound firms to generate their appraisals. LSL has also spent much time developing its somewhat counter-cyclical rental and repossession businesses. We believe that LSL will be one of the few groups to make it through the downturn without needing additional capital and that it is equally well positioned to benefit from any recovery in the U.K. housing market.
Our worst performing stock for the quarter was Sperian Protection, a French manufacturer of clothing used to protect people in hazardous work environments. There seems to be no specific factors that can be attributable to the stock decline except the overall market. In the face of the market downturn, Sperian has delivered the performance that we anticipated. Margins have contracted somewhat, but they remain consistent with management expectations. The decrease stems primarily from a Los Angeles court order that temporarily cancelled an important contract. The business generates strong cash flow, and short of a massive fall-off in its market, it isn't—and shouldn't become—highly leveraged.
OAKMARK INTERNATIONAL SMALL CAP FUND
48
Although Sperian could have a difficult year in 2009, we don't believe it warrants the stock's currently low valuation. The market continues to misunderstand and dramatically under-value this business. We believe Sperian is taking the right steps to adapt to the new environment by remaining focused on the strength of its business model—including innovation, being close to customers, and brand recognition—as well as being focused on continued expansion in emerging markets.
With valuations down dramatically we have begun to find an increasing number of interesting opportunities in emerging markets. Of the more than 350 companies that our team has visited overseas in the past six months, approximately 25% of them have been located in emerging markets, including South Korea, Turkey, China, Mexico and Brazil. Brazil, a market that hasn't been represented in the portfolio since 2000, now provides two of our new names: Amil Participacoes, the largest Managed Care Organization (MCO) in Brazil with approximately 7% market share and 3.2 million members; and Totvs, a Brazilian software solutions developer. Other new positions in the Fund include Bobst Group, a Swiss manufacturer of equipment for the folding carton and corrugated box packaging industry; Domino Printing, the U.K. firm specializing in ink jet, thermal and laser print technologies that we owned in the past; Exact Holding, a developer and marketer of busines s software in the Netherlands; and Fourlis Holdings, a Greek wholesaler of electronic appliances.
Geographically, the portfolio weightings have shifted slightly this quarter. As a result, Europe and the U.K. increased somewhat, ending the quarter at approximately 74% of investments; the Pacific Rim declined to 20% of the total portfolio; and, due to the addition of the new Brazilian holdings, Latin America increased to 2.5% of the portfolio.
We continue to hedge the Fund defensively, and the hedges performed well during the quarter, adding almost 1% to performance. At the recent quarter end, approximately 7% of the Fund's Swiss franc and 16% of the Fund's Japanese yen exposures were hedged.
As always, we thank you for your continued confidence and support.
David G. Herro, CFA
Portfolio Manager
oakex@oakmark.com | | Chad M. Clark, CFA
Portfolio Manager
oakex@oakmark.com | |
|
March 31, 2009
† Prior to January 1, 2009, the Fund's primary benchmark was the MSCI World ex U.S. Index, an unmanaged index that includes countries throughout the world, excluding the U.S., in proportion to world stock market capitalization. The Fund changed its primary benchmark because the MSCI World ex U.S. Small Cap Index reached its tenth anniversary on December 31, 2008 and now provides an historical perspective to make a more meaningful comparison given the small cap focus of the Fund.
OAKMARK INTERNATIONAL SMALL CAP FUND
49
THE OAKMARK INTERNATIONAL SMALL CAP FUND
Global Diversification—March 31, 2009 (Unaudited)
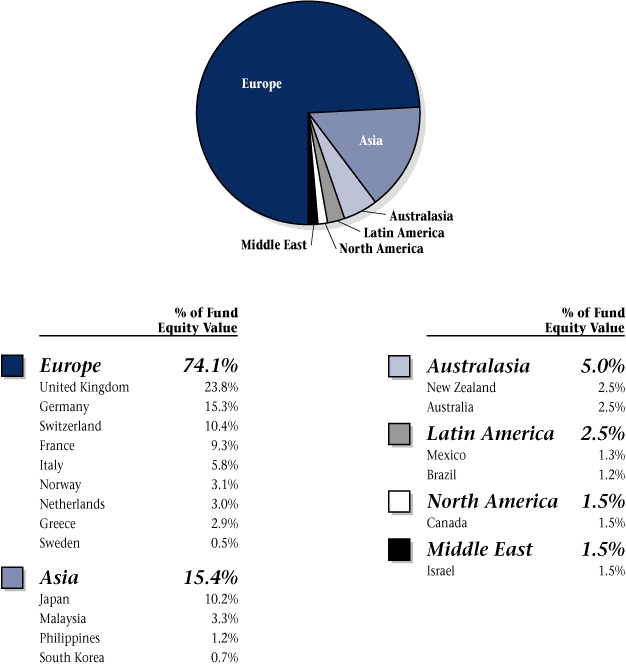
OAKMARK INTERNATIONAL SMALL CAP FUND
50
OAKMARK INTERNATIONAL SMALL CAP FUND
Schedule of Investments—March 31, 2009 (Unaudited)
Name | |
Description | |
Shares Held | |
Value | |
| Common Stocks—94.9% | |
| Advertising—2.0% | |
| Asatsu-DK, Inc. (Japan) | | Advertising Services Provider | | | 453,400 | | | $ | 7,539,490 | | |
| Apparel, Accessories & Luxury Goods—2.7% | |
| Bulgari SpA (Italy) (a) | | Jewelry Manufacturer & Retailer | | | 2,324,400 | | | $ | 10,221,935 | | |
| Automotive Retail—1.0% | |
| USS Co., Ltd. (Japan) | | Used Car Auction Facility Manager | | | 87,700 | | | $ | 3,809,769 | | |
| Broadcasting—8.2% | |
Media Prima Berhad
(Malaysia) (b) | | Film Producer & Sports Promoter | | | 43,674,800 | | | $ | 11,680,957 | | |
M6 Metropole Television
(France) | | Television Entertainment Channel
Owner & Operator | | | 656,000 | | | | 10,711,492 | | |
Ten Network Holdings, Ltd.
(Australia) | | Operates Commercial Television
Stations | | | 16,097,600 | | | | 8,730,902 | | |
| | | | 31,123,351 | | |
| Home Furnishing Retail—2.5% | |
Beter Bed Holding NV
(Netherlands) | | Bedroom Furniture Retailer | | | 936,070 | | | $ | 9,380,947 | | |
Fourlis Holdings SA
(Greece) | | Wholesales Electric & Electronic
Appliances | | | 5,700 | | | | 52,102 | | |
| | | | 9,433,049 | | |
| Home Improvement Retail—2.6% | |
Carpetright PLC
(United Kingdom) | | Carpet Retailer | | | 1,672,533 | | | $ | 9,917,313 | | |
| Movies & Entertainment—1.0% | |
CTS Eventim AG
(Germany) | | Entertainment Tickets Producer &
Distributor | | | 134,700 | | | $ | 3,919,277 | | |
| Photographic Products—1.7% | |
Vitec Group PLC
(United Kingdom) (b) | | Photo Equipment & Supplies | | | 2,812,479 | | | $ | 6,295,357 | | |
| Publishing—1.0% | |
| Tamedia AG (Switzerland) | | TV Broadcasting & Publishing | | | 98,151 | | | $ | 3,681,848 | | |
| Specialty Stores—0.7% | |
JJB Sports PLC
(United Kingdom) (b) | | Sportswear & Sports Equipment
Retailer | | | 15,670,600 | | | $ | 2,529,558 | | |
OAKMARK INTERNATIONAL SMALL CAP FUND
51
OAKMARK INTERNATIONAL SMALL CAP FUND
Schedule of Investments—March 31, 2009 (Unaudited) cont.
Name | |
Description | |
Shares Held | |
Value | |
| Common Stocks—94.9% (cont.) | |
| Textiles—1.3% | |
| Chargeurs SA (France) (b) | | Wool, Textile Production & Trading | | | 772,682 | | | $ | 4,927,609 | | |
| Household Products—0.2% | |
Kimberly-Clark de
Mexico S.A.B. de C.V.
(Mexico) | | Hygiene Products Manufacturer,
Marketer & Distributor | | | 250,000 | | | $ | 809,566 | | |
| Packaged Foods & Meats—1.8% | |
Alaska Milk Corp.
(Philippines) (b) | | Milk Producer | | | 56,360,000 | | | $ | 4,373,512 | | |
Binggrae Co., Ltd.
(South Korea) | | Dairy Products Manufacturer | | | 83,380 | | | | 2,528,676 | | |
| | | | 6,902,188 | | |
| Soft Drinks—2.2% | |
Britvic PLC
(United Kingdom) | | Soft Drink Manufacturer &
Marketer | | | 2,528,600 | | | $ | 8,199,645 | | |
| Asset Management & Custody Banks—6.2% | |
Julius Baer Holding AG
(Switzerland) | | Asset Management | | | 560,100 | | | $ | 13,777,387 | | |
| MLP AG (Germany) | | Asset Management | | | 906,700 | | | | 9,516,669 | | |
| | | | 23,294,056 | | |
| Investment Banking & Brokerage—2.2% | |
Ichiyoshi Securities
Co., Ltd. (Japan) | | Stock Broker | | | 1,977,500 | | | $ | 8,450,599 | | |
D. Carnegie & Co. AB
(Sweden) (c) | | Diversified Financials Services | | | 2,314,000 | | | | 0 | | |
| | | | 8,450,599 | | |
| Life & Health Insurance—0.5% | |
Amil Participacoes SA
(Brazil) | | Provides Health Insurance &
Related Services | | | 694,400 | | | $ | 1,894,839 | | |
| Real Estate Services—4.2% | |
LSL Property Services PLC
(United Kingdom) (a) (b) | | Residential Property Service
Provider | | | 10,362,200 | | | $ | 15,723,123 | | |
| Life Sciences Tools & Services—1.5% | |
| MDS, Inc. (Canada) (a) | | Products & Services for Medical
Product Manufacturing | | | 1,184,000 | | | $ | 5,550,000 | | |
OAKMARK INTERNATIONAL SMALL CAP FUND
52
OAKMARK INTERNATIONAL SMALL CAP FUND
Schedule of Investments—March 31, 2009 (Unaudited) cont.
Name | |
Description | |
Shares Held | |
Value | |
| Common Stocks—94.9% (cont.) | |
| Air Freight & Logistics—4.8% | |
Freightways, Ltd.
(New Zealand) (b) | | Express Package Services | | | 5,397,300 | | | $ | 9,083,523 | | |
Panalpina Welttransport
Holding AG
(Switzerland) | | Freight Shipping & Supply
Chain Management Services | | | 184,800 | | | | 9,075,217 | | |
| | | | 18,158,740 | | |
| Airport Services—3.8% | |
BBA Aviation PLC
(United Kingdom) | | Flight Support & Aftermarket
Services & Systems Provider | | | 8,580,900 | | | $ | 10,157,651 | | |
Grupo Aeroportuario
del Pacifico SAB de CV
(Mexico) (d) | | Operates & Maintains Airports | | | 222,300 | | | | 4,056,975 | | |
| | | | 14,214,626 | | |
| Building Products—1.1% | |
Kaba Holding AG
(Switzerland) | | Provides Mechanical &
Electronic Security Systems | | | 27,986 | | | $ | 4,302,512 | | |
| Human Resource & Employment Services—6.1% | |
Pasona Group, Inc.
(Japan) (b) | | Placement Service Provider | | | 23,842 | | | $ | 10,561,920 | | |
Michael Page International
PLC (United Kingdom) | | Recruitment Consultancy Services | | | 3,191,000 | | | | 8,413,189 | | |
Robert Walters PLC
(United Kingdom) | | International Recruitment
Company | | | 3,787,900 | | | | 4,171,415 | | |
| | | | 23,146,524 | | |
| Industrial Conglomerates—5.7% | |
| Rheinmetall AG (Germany) | | Automotive Pump Manufacturer | | | 395,000 | | | $ | 13,440,051 | | |
Tomkins PLC
(United Kingdom) | | International Manufacturing | | | 4,725,000 | | | | 8,220,345 | | |
| | | | 21,660,396 | | |
| Industrial Machinery—9.1% | |
Interpump Group SpA
(Italy) | | Pump & Piston Manufacturer | | | 2,900,700 | | | $ | 10,578,873 | | |
| Duerr AG (Germany) | | Automotive Industry Machinery
Manufacturer | | | 691,800 | | | | 9,007,430 | | |
IMI PLC (United Kingdom)
| | Manufactures Merchandise Displays,
Ventilation & Air Conditioning
Equipment | | | 2,151,000 | | | | 8,371,757 | | |
OAKMARK INTERNATIONAL SMALL CAP FUND
53
OAKMARK INTERNATIONAL SMALL CAP FUND
Schedule of Investments—March 31, 2009 (Unaudited) cont.
Name | |
Description | |
Shares Held | |
Value | |
| Common Stocks—94.9% (cont.) | |
| Industrial Machinery—9.1% (cont.) | |
Schindler Holding AG
(Switzerland)
| | Manufactures & Installs Elevators,
Escalators, & Moving Walkways
Internationally | | | 95,100 | | | $ | 4,490,578 | | |
Bobst Group AG
(Switzerland) | | Manufactures Printing Presses &
Packaging Producing Machinery | | | 84,600 | | | | 1,727,972 | | |
| | | | 34,176,610 | | |
| Office Services & Supplies—2.3% | |
Sperian Protection
(France)
| | Manufactures Protection Equipment
For People In Hazardous Work
Environments | | | 279,500 | | | $ | 8,518,624 | | |
| Research & Consulting Services—0.5% | |
| Cision AB (Sweden) | | Business & Communication
Intelligence | | | 3,139,100 | | | $ | 1,837,004 | | |
| Application Software—0.3% | |
Exact Holding N.V.
(Netherlands) | | Develops & Markets Business Software | | | 61,215 | | | $ | 1,227,273 | | |
| Communications Equipment—0.2% | |
Raymarine PLC
(United Kingdom) (b) | | Leisure Marine Electronics Products | | | 4,093,379 | | | $ | 822,274 | | |
| Computer Hardware—2.2% | |
Wincor Nixdorf AG
(Germany) | | Banking Machines & Cash Registers
Manufacturer | | | 187,800 | | | $ | 8,510,823 | | |
| Electronic Components—0.4% | |
Hirose Electric Co., Ltd.
(Japan) | | Develops & Sells Electronic Equipment | | | 16,400 | | | $ | 1,567,349 | | |
| Electronic Equipment & Instruments—1.7% | |
| Orbotech, Ltd. (Israel) (a) | | Optical Inspection Systems | | | 1,395,300 | | | $ | 5,288,187 | | |
Domino Printing Sciences
PLC (United Kingdom) | | Printing Equipment | | | 361,590 | | | | 975,395 | | |
| | | | 6,263,582 | | |
| IT Consulting & Other Services—3.0% | |
| Atea ASA (Norway) (a) | | Management & IT Consulting
Services | | | 4,606,000 | | | $ | 11,171,959 | | |
OAKMARK INTERNATIONAL SMALL CAP FUND
54
OAKMARK INTERNATIONAL SMALL CAP FUND
Schedule of Investments—March 31, 2009 (Unaudited) cont.
Name | |
Description | |
Shares Held | |
Value | |
| Common Stocks—94.9% (cont.) | |
| Office Electronics—2.8% | |
| Neopost SA (France) | | Mailroom Equipment Supplier | | | 118,000 | | | $ | 9,156,432 | | |
Boewe Systec AG
(Germany) | | Automated Paper Management
Systems Producer | | | 285,039 | | | | 1,439,071 | | |
| | | | 10,595,503 | | |
| Systems Software—1.0% | |
| Totvs SA (Brazil) | | Develops & Markets Software
Solutions | | | 129,000 | | | $ | 2,266,085 | | |
Monitise PLC
(United Kingdom) (a) (b) | | Mobile Banking Service
Solutions | | | 27,236,288 | | | | 1,416,649 | | |
| | | | 3,682,734 | | |
| Construction Materials—2.7% | |
Titan Cement Co. SA
(Greece) | | Cement & Building Materials
Producer & Distributor | | | 478,300 | | | $ | 10,167,510 | | |
| Specialty Chemicals—3.7% | |
| Symrise AG (Germany) | | Diversified Chemical Manufacturer | | | 770,500 | | | $ | 9,121,045 | | |
Taiyo Ink Manufacturing
Co., Ltd. (Japan) | | Manufactures & Sells Resist Inks | | | 304,300 | | | | 4,706,605 | | |
| | | | 13,827,650 | | |
| Total Common Stocks (Cost: $805,277,108) | | | | | | | | | 358,074,265 | | |
OAKMARK INTERNATIONAL SMALL CAP FUND
55
OAKMARK INTERNATIONAL SMALL CAP FUND
Schedule of Investments—March 31, 2009 (Unaudited) cont.
Name | |
Par Value | |
Value | |
| Short Term Investment—3.9% | |
| Repurchase Agreement—3.9% | |
Fixed Income Clearing Corp. Repurchase Agreement,
0.17% dated 3/31/2009 due 4/1/2009, repurchase
price $14,448,909, collateralized by a Federal National
Mortgage Association Bond, with a rate of 3.250%,
with a maturity of 4/29/2011, and with a market
value plus accrued interest of $14,740,706 | | $ | 14,448,841 | | | $ | 14,448,841 | | |
| Total Repurchase Agreement (Cost: $14,448,841) | | | | | 14,448,841 | | |
| Total Short Term Investment (Cost: $14,448,841) | | | | | 14,448,841 | | |
| Total Investments (Cost: $819,725,949)—98.8% | | | | $ | 372,523,106 | | |
| Foreign Currencies (Cost: $369,565)—0.1% | | | | $ | 372,335 | | |
| Other Assets In Excess of Liabilities—1.1% | | | | | 4,308,570 | | |
| Total Net Assets—100% | | | | $ | 377,204,011 | | |
(a) Non income-producing security.
(b) See note number five in the Notes to the Financial Statements regarding investments in affiliated issuers.
(c) Market value is determined in good faith in accordance with procedures established by the Board of Trustees.
(d) Represents an American Depositary Receipt.
See accompanying Notes to Financial Statements.
OAKMARK INTERNATIONAL SMALL CAP FUND
56

(This page has been intentionally left blank.)
THE OAKMARK FUNDS
57
THE OAKMARK FUNDS
Statements of Assets and Liabilities—March 31, 2009 (Unaudited)
| | | | | Oakmark
Fund | | Oakmark
Select
Fund | | Oakmark
Equity and
Income Fund | |
| Assets | |
| Investments in unaffiliated securities, at value | | (a) | | $ | 2,172,280,227 | | | $ | 1,589,030,083 | | | $ | 11,706,977,391 | | |
| Investments in affiliated securities, at value | | (b) | | | 0 | | | | 0 | | | | 390,444,000 | | |
| Cash | | | | | 0 | | | | 0 | | | | 10,000 | | |
| Foreign currency, at value | | (c) | | | 0 | | | | 0 | | | | 0 | | |
| Receivable for: | |
| Securities sold | | | | | 5,509,334 | | | | 23,379,476 | | | | 0 | | |
| Fund shares sold | | | | | 11,748,225 | | | | 2,085,364 | | | | 50,953,136 | | |
| Dividends and interest (Net of foreign tax withheld) | | | | | 3,773,547 | | | | 970,801 | | | | 46,481,437 | | |
| Foreign currency exchange contracts | | | | | 0 | | | | 0 | | | | 0 | | |
| Tax reclaim | | | | | 442,158 | | | | 0 | | | | 938,803 | | |
| Total receivables | | | | | 21,473,264 | | | | 26,435,641 | | | | 98,373,376 | | |
| Other assets | | | | | 49,464 | | | | 42,618 | | | | 120,723 | | |
| Total assets | | | | $ | 2,193,802,955 | | | $ | 1,615,508,342 | | | $ | 12,195,925,490 | | |
| Liabilities and Net Assets | |
| Payable for: | |
| Securities purchased | | | | $ | 12,818,157 | | | $ | 674,325 | | | $ | 126,171,673 | | |
| Fund shares redeemed | | | | | 3,797,737 | | | | 4,678,803 | | | | 33,234,848 | | |
| Foreign currency exchange contracts | | | | | 0 | | | | 0 | | | | 0 | | |
| Investment advisory fee | | | | | 52,290 | | | | 39,172 | | | | 222,470 | | |
| Other shareholder servicing fees | | | | | 406,076 | | | | 253,947 | | | | 2,024,253 | | |
| Transfer and dividend disbursing agent fees | | | | | 335,162 | | | | 231,074 | | | | 309,391 | | |
| Trustee fees | | | | | 929 | | | | 624 | | | | 1,248 | | |
| Deferred trustee compensation | | | | | 634,993 | | | | 559,114 | | | | 546,804 | | |
| Other | | | | | 546,166 | | | | 519,161 | | | | 1,545,464 | | |
| Total liabilities | | | | | 18,591,510 | | | | 6,956,220 | | | | 164,056,151 | | |
| Net assets applicable to Fund shares outstanding | | | | $ | 2,175,211,445 | | | $ | 1,608,552,122 | | | $ | 12,031,869,339 | | |
| Analysis of Net Assets | |
| Paid in capital | | | | $ | 2,713,123,400 | | | $ | 2,181,290,292 | | | $ | 13,453,345,155 | | |
Accumulated undistributed net realized gain (loss) on investments, forward
contracts, options, short sales and foreign currency transactions | | | | | (204,254,760 | ) | | | (276,089,444 | ) | | | (836,522,967 | ) | |
| Net unrealized appreciation (depreciation) on investments and foreign currencies | | | | | (340,389,383 | ) | | | (298,430,561 | ) | | | (584,520,502 | ) | |
| Net unrealized appreciation (depreciation)—other | | | | | (44,689 | ) | | | 0 | | | | (137,065 | ) | |
| Accumulated undistributed net investment income | | | | | 6,776,877 | | | | 1,781,835 | | | | (295,282 | ) | |
| Net assets applicable to Fund shares outstanding | | | | $ | 2,175,211,445 | | | $ | 1,608,552,122 | | | $ | 12,031,869,339 | | |
| Price of Shares | |
| Net asset value per share: Class I | | | | $ | 23.28 | | | $ | 14.98 | | | $ | 20.26 | | |
| Class I—Net assets | | | | $ | 2,168,872,224 | | | $ | 1,602,987,315 | | | $ | 11,140,794,252 | | |
| Class I—Shares outstanding (Unlimited shares authorized) | | | | | 93,175,480 | | | | 107,024,992 | | | | 549,957,279 | | |
| Net asset value per share: Class II | | | | $ | 23.30 | | | $ | 15.00 | | | $ | 20.17 | | |
| Class II—Net assets | | | | $ | 6,339,221 | | | $ | 5,564,807 | | | $ | 891,075,087 | | |
| Class II—Shares outstanding (Unlimited shares authorized) | | | | | 272,028 | | | | 370,944 | | | | 44,184,059 | | |
| (a) Identified cost of investments in unaffiliated securities | | $ | 2,512,660,073 | | | $ | 1,887,460,644 | | | $ | 12,175,720,234 | | |
| (b) Identified cost of investments in affiliated securities | | | 0 | | | | 0 | | | | 506,221,659 | | |
| (c) Identified cost of foreign currency | | | 0 | | | | 0 | | | | 0 | | |
THE OAKMARK FUNDS
58
| | | Oakmark
Global
Fund | | Oakmark
Global Select
Fund | | Oakmark
International
Fund | | Oakmark
International
Small Cap Fund | |
| Assets | |
| Investments in unaffiliated securities, at value | | $ | 1,126,066,599 | | | $ | 181,902,957 | | | $ | 2,184,408,117 | | | $ | 314,192,146 | | |
| Investments in affiliated securities, at value | | | 0 | | | | 0 | | | | 108,659,715 | | | | 58,330,960 | | |
| Cash | | | 0 | | | | 0 | | | | 0 | | | | 0 | | |
| Foreign currency, at value | | | 0 | | | | 0 | | | | 802,970 | | | | 372,335 | | |
| Receivable for: | |
| Securities sold | | | 0 | | | | 2,677,528 | | | | 18,038,520 | | | | 1,264,012 | | |
| Fund shares sold | | | 2,399,264 | | | | 550,838 | | | | 3,855,742 | | | | 1,368,977 | | |
| Dividends and interest (Net of foreign tax withheld) | | | 2,103,495 | | | | 432,613 | | | | 7,746,829 | | | | 1,122,255 | | |
| Foreign currency exchange contracts | | | 12,340 | | | | 0 | | | | 0 | | | | 46,642 | | |
| Tax reclaim | | | 4,669,765 | | | | 417,119 | | | | 12,763,998 | | | | 1,285,936 | | |
| Total receivables | | | 9,184,864 | | | | 4,078,098 | | | | 42,405,089 | | | | 5,087,822 | | |
| Other assets | | | 38,851 | | | | 27,276 | | | | 51,196 | | | | 30,059 | | |
| Total assets | | $ | 1,135,290,314 | | | $ | 186,008,331 | | | $ | 2,336,327,087 | | | $ | 378,013,322 | | |
| Liabilities and Net Assets | |
| Payable for: | |
| Securities purchased | | $ | 0 | | | $ | 3,648,062 | | | $ | 13,264,061 | | | $ | 74,322 | | |
| Fund shares redeemed | | | 684,220 | | | | 190,835 | | | | 8,450,298 | | | | 221,436 | | |
| Foreign currency exchange contracts | | | 0 | | | | 26,355 | | | | 366,702 | | | | 0 | | |
| Investment advisory fee | | | 29,268 | | | | 4,415 | | | | 57,202 | | | | 12,284 | | |
| Other shareholder servicing fees | | | 172,032 | | | | 16,206 | | | | 549,836 | | | | 37,466 | | |
| Transfer and dividend disbursing agent fees | | | 131,908 | | | | 45,003 | | | | 179,816 | | | | 43,351 | | |
| Trustee fees | | | 185 | | | | 55 | | | | 69 | | | | 49 | | |
| Deferred trustee compensation | | | 264,983 | | | | 8,343 | | | | 400,324 | | | | 253,556 | | |
| Other | | | 333,972 | | | | 129,998 | | | | 746,845 | | | | 166,847 | | |
| Total liabilities | | | 1,616,568 | | | | 4,069,272 | | | | 24,015,153 | | | | 809,311 | | |
| Net assets applicable to Fund shares outstanding | | $ | 1,133,673,746 | | | $ | 181,939,059 | | | $ | 2,312,311,934 | | | $ | 377,204,011 | | |
| Analysis of Net Assets | |
| Paid in capital | | $ | 1,932,557,992 | | | $ | 325,345,908 | | | $ | 4,622,653,443 | | | $ | 909,985,274 | | |
Accumulated undistributed net realized gain (loss) on investments, forward
contracts, options, short sales and foreign currency transactions | | | (157,953,593 | ) | | | (64,787,192 | ) | | | (813,600,353 | ) | | | (86,646,997 | ) | |
| Net unrealized appreciation (depreciation) on investments and foreign currencies | | | (644,612,076 | ) | | | (79,121,548 | ) | | | (1,503,978,992) | | | | (447,158,201) | | |
| Net unrealized appreciation (depreciation)—other | | | (119,691 | ) | | | (20,106 | ) | | | (293,670 | ) | | | 77,330 | | |
| Accumulated undistributed net investment income | | | 3,801,114 | | | | 521,997 | | | | 7,531,506 | | | | 946,605 | | |
| Net assets applicable to Fund shares outstanding | | $ | 1,133,673,746 | | | $ | 181,939,059 | | | $ | 2,312,311,934 | | | $ | 377,204,011 | | |
| Price of Shares | |
| Net asset value per share: Class I | | $ | 12.09 | | | $ | 6.25 | | | $ | 9.84 | | | $ | 6.31 | | |
| Class I—Net assets | | $ | 1,098,260,980 | | | $ | 181,939,059 | | | $ | 2,244,414,901 | | | $ | 376,988,733 | | |
| Class I—Shares outstanding (Unlimited shares authorized) | | | 90,834,689 | | | | 29,103,314 | | | | 228,149,601 | | | | 59,744,390 | | |
| Net asset value per share: Class II | | $ | 11.88 | | | $ | 0 | | | $ | 9.93 | | | $ | 6.31 | | |
| Class II—Net assets | | $ | 35,412,766 | | | $ | 0 | | | $ | 67,897,033 | | | $ | 215,278 | | |
| Class II—Shares outstanding (Unlimited shares authorized) | | | 2,980,519 | | | | 0 | | | | 6,835,026 | | | | 34,129 | | |
| (a) Identified cost of investments in unaffiliated securities | | $ | 1,770,691,015 | | | $ | 261,000,037 | | | $ | 3,551,025,553 | | | $ | 617,345,949 | | |
| (b) Identified cost of investments in affiliated securities | | | 0 | | | | 0 | | | | 245,699,187 | | | | 202,380,000 | | |
| (c) Identified cost of foreign currency | | | 0 | | | | 0 | | | | 811,703 | | | | 369,565 | | |
See accompanying Notes to Financial Statements.
THE OAKMARK FUNDS
59
THE OAKMARK FUNDS
Statements of Operations—March 31, 2009 (Unaudited)
| | | Oakmark
Fund | | Oakmark
Select
Fund | | Oakmark
Equity and
Income Fund | | Oakmark
Global
Fund | |
| Investment Income: | |
| Dividends from unaffiliated securities | | $ | 32,943,588 | | | $ | 20,399,605 | | | $ | 61,262,221 | | | $ | 8,564,322 | | |
| Dividends from affiliated securities | | | 0 | | | | 0 | | | | 790,000 | | | | 0 | | |
| Interest Income | | | 120,767 | | | | 98,949 | | | | 59,740,577 | | | | 31,780 | | |
| Security lending income | | | 0 | | | | 0 | | | | 0 | | | | 13,272 | | |
| Other income | | | 153,786 | | | | 74,289 | | | | 91,645 | | | | 6,840 | | |
| Foreign taxes withheld | | | 0 | | | | 0 | | | | (876,000 | ) | | | (307,742 | ) | |
| Total investment income | | | 33,218,141 | | | | 20,572,843 | | | | 121,008,443 | | | | 8,308,472 | | |
| Expenses: | |
| Investment advisory fee | | | 12,778,982 | | | | 9,094,492 | | | | 44,318,581 | | | | 7,312,246 | | |
| Transfer and dividend disbursing agent fees | | | 646,664 | | | | 416,961 | | | | 617,594 | | | | 248,797 | | |
| Other shareholder servicing fees | | | 1,607,638 | | | | 1,028,174 | | | | 6,265,092 | | | | 615,406 | | |
| Service Fee—Class II | | | 10,357 | | | | 8,362 | | | | 1,136,943 | | | | 48,853 | | |
| Reports to shareholders | | | 601,985 | | | | 517,978 | | | | 876,829 | | | | 206,271 | | |
| Custody and accounting fees | | | 166,989 | | | | 109,050 | | | | 736,740 | | | | 249,520 | | |
| Other | | | 52,235 | | | | 20,999 | | | | 805,037 | | | | 158,333 | | |
| Total expenses | | | 15,864,850 | | | | 11,196,016 | | | | 54,756,816 | | | | 8,839,426 | | |
| Net expenses | | | 15,864,850 | | | | 11,196,016 | | | | 54,756,816 | | | | 8,839,426 | | |
| Net Investment Income (loss): | | | 17,353,291 | | | | 9,376,827 | | | | 66,251,627 | | | | (530,954 | ) | |
Net realized and unrealized gain (loss) on
investments and foreign currency transactions: | |
| Net realized gain (loss) on unaffiliated securities | | | (204,211,842 | ) | | | (8,530,068 | ) | | | (848,124,853 | ) | | | (135,926,336 | ) | |
| Net realized gain (loss) on affiliated securities | | | 0 | | | | 0 | | | | (46,612,459 | ) | | | 0 | | |
| Net realized gain (loss) on foreign currency transactions | | | (280,724 | ) | | | 0 | | | | (3,184,523 | ) | | | 60,598,370 | | |
| Net change in unrealized depreciation of investments and foreign currencies | | | (890,367,891 | ) | | | (648,306,134 | ) | | | (1,649,291,769) | | | | (599,836,058 | ) | |
| Net change in unrealized appreciation (depreciation)—other | | | (28,189 | ) | | | 0 | | | | (41,336 | ) | | | 1,739,210 | | |
Net realized and unrealized loss on
investments and foreign currency transactions: | | | (1,094,888,646) | | | | (656,836,202) | | | | (2,547,254,940 | ) | | | (673,424,814) | | |
| Net decrease in net assets resulting from operations | | $ | (1,077,535,355 | ) | | $ | (647,459,375 | ) | | $ | (2,481,003,313 | ) | | $ | (673,955,768 | ) | |
THE OAKMARK FUNDS
60
| | | Oakmark
Global Select
Fund | | Oakmark
International
Fund | | Oakmark
International
Small Cap Fund | |
| Investment Income: | |
| Dividends from unaffiliated securities | | $ | 1,969,528 | | | $ | 18,342,748 | | | $ | 4,812,154 | | |
| Dividends from affiliated securities | | | 0 | | | | 691,432 | | | | 593,587 | | |
| Interest Income | | | 8,832 | | | | 76,072 | | | | 20,847 | | |
| Security lending income | | | 0 | | | | 376,096 | | | | 0 | | |
| Other income | | | 0 | | | | 1,398 | | | | 0 | | |
| Foreign taxes withheld | | | (17,550 | ) | | | (1,225,872 | ) | | | (345,673 | ) | |
| Total investment income | | | 1,960,810 | | | | 18,261,874 | | | | 5,080,915 | | |
| Expenses: | |
| Investment advisory fee | | | 961,176 | | | | 13,797,869 | | | | 2,845,099 | | |
| Transfer and dividend disbursing agent fees | | | 78,823 | | | | 346,631 | | | | 76,456 | | |
| Other shareholder servicing fees | | | 85,304 | | | | 1,296,439 | | | | 269,265 | | |
| Service Fee—Class II | | | 0 | | | | 15,410 | | | | 246 | | |
| Reports to shareholders | | | 85,572 | | | | 393,912 | | | | 75,300 | | |
| Custody and accounting fees | | | 60,165 | | | | 528,255 | | | | 155,747 | | |
| Other | | | 195,147 | | | | 33,870 | | | | 117,897 | | |
| Total expenses | | | 1,466,187 | | | | 16,412,386 | | | | 3,540,010 | | |
| Net expenses | | | 1,466,187 | | | | 16,412,386 | | | | 3,540,010 | | |
| Net Investment Income (loss): | | | 494,623 | | | | 1,849,488 | | | | 1,540,905 | | |
Net realized and unrealized gain (loss) on
investments and foreign currency transactions: | |
| Net realized gain (loss) on unaffiliated securities | | | (21,491,688 | ) | | | (639,220,000 | ) | | | (54,815,322 | ) | |
| Net realized gain (loss) on affiliated securities | | | 0 | | | | (100,001 | ) | | | (9,774,652 | ) | |
| Net realized gain (loss) on foreign currency transactions | | | 6,059,421 | | | | 200,280,130 | | | | 30,004,876 | | |
| Net change in unrealized depreciation of investments and foreign currencies | | | (30,771,160 | ) | | | (649,259,215 | ) | | | (204,494,437 | ) | |
| Net change in unrealized appreciation (depreciation)—other | | | 96,519 | | | | 572,530 | | | | 158,578 | | |
Net realized and unrealized loss on
investments and foreign currency transactions: | | | (46,106,908) | | | | (1,087,726,556) | | | | (238,920,957) | | |
| Net decrease in net assets resulting from operations | | $ | (45,612,285 | ) | | $ | (1,085,877,068 | ) | | $ | (237,380,052 | ) | |
See accompanying Notes to Financial Statements.
THE OAKMARK FUNDS
61
THE OAKMARK FUNDS
Statements of Changes in Net Assets—March 31, 2009
| | | Oakmark Fund | |
| | | Six Months Ended
March 31, 2009
(Unaudited) | | Year Ended
September 30, 2008 | |
| From Operations: | |
| Net investment income | | $ | 17,353,291 | | | $ | 51,813,927 | | |
| Net realized gain (loss) on investments | | | (204,211,842 | ) | | | 137,304,734 | | |
| Net realized gain (loss) on foreign currency transactions | | | (280,724 | ) | | | (1,701 | ) | |
Net change in unrealized appreciation (depreciation) on
investments and foreign currencies | | | (890,367,891 | ) | | | (1,115,666,009 | ) | |
Net change in unrealized appreciation
(depreciation)—other | | | (28,189 | ) | | | (40,409 | ) | |
| Net decrease in net assets from operations | | | (1,077,535,355 | ) | | | (926,589,458 | ) | |
| Distributions to shareholders from: | |
| Net investment income—Class I | | | (42,726,218 | ) | | | (63,360,741 | ) | |
| Net investment income—Class II | | | (75,879 | ) | | | (183,226 | ) | |
| Net realized gain—Class I | | | (93,416,024 | ) | | | (390,074,654 | ) | |
| Net realized gain—Class II | | | (288,563 | ) | | | (1,912,176 | ) | |
| Total distributions to shareholders | | | (136,506,684 | ) | | | (455,530,797 | ) | |
| From Fund share transactions: | |
| Proceeds from shares sold—Class I | | | 345,131,962 | | | | 506,525,729 | | |
| Proceeds from shares sold—Class II | | | 960,330 | | | | 3,714,709 | | |
| Reinvestment of distributions—Class I | | | 130,743,183 | | | | 430,870,683 | | |
| Reinvestment of distributions—Class II | | | 313,903 | | | | 1,896,434 | | |
| Payment for shares redeemed—Class I | | | (707,365,975 | ) | | | (1,608,697,232 | ) | |
| Payment for shares redeemed—Class II | | | (3,373,708 | ) | | | (15,906,999 | ) | |
| Redemption fees—Class I | | | 344,918 | | | | 222,124 | | |
| Redemption fees—Class II | | | 1,115 | | | | 1,034 | | |
Net decrease in net assets from Fund
share transactions | | | (233,244,272 | ) | | | (681,373,518 | ) | |
| Total decrease in net assets | | | (1,447,286,311 | ) | | | (2,063,493,773 | ) | |
| Net assets: | |
| Beginning of period | | | 3,622,497,756 | | | | 5,685,991,529 | | |
| End of period | | $ | 2,175,211,445 | | | $ | 3,622,497,756 | | |
| Undistributed net investment income | | $ | 6,776,877 | | | $ | 36,894,100 | | |
| Fund Share Transactions—Class I: | |
| Shares sold | | | 13,997,944 | | | | 12,842,108 | | |
| Shares issued in reinvestment of dividends | | | 5,145,211 | | | | 10,404,991 | | |
| Less shares redeemed | | | (28,203,840 | ) | | | (40,648,554 | ) | |
| Net decrease in shares outstanding | | | (9,060,685 | ) | | | (17,401,455 | ) | |
| Fund Share Transactions—Class II: | |
| Shares sold | | | 39,379 | | | | 94,005 | | |
| Shares issued in reinvestment of dividends | | | 12,339 | | | | 45,918 | | |
| Less shares redeemed | | | (133,254 | ) | | | (404,846 | ) | |
| Net decrease in shares outstanding | | | (81,536 | ) | | | (264,923 | ) | |
THE OAKMARK FUNDS
62
| | | Oakmark Select Fund | |
| | | Six Months Ended
March 31, 2009
(Unaudited) | | Year Ended
September 30, 2008 | |
| From Operations: | |
| Net investment income | | $ | 9,376,827 | | | $ | 42,414,250 | | |
| Net realized gain (loss) on investments | | | (8,530,068 | ) | | | (244,888,582 | ) | |
Net change in unrealized appreciation (depreciation) on
investments | | | (648,306,134 | ) | | | (1,164,736,462 | ) | |
| Net decrease in net assets from operations | | | (647,459,375 | ) | | | (1,367,210,794 | ) | |
| Distributions to shareholders from: | |
| Net investment income—Class I | | | (28,947,169 | ) | | | (47,221,721 | ) | |
| Net investment income—Class II | | | (126,188 | ) | | | (109,460 | ) | |
| Net realized gain—Class I | | | — | | | | (453,949,363 | ) | |
| Net realized gain—Class II | | | — | | | | (3,023,620 | ) | |
| Total distributions to shareholders | | | (29,073,357 | ) | | | (504,304,164 | ) | |
| From Fund share transactions: | |
| Proceeds from shares sold—Class I | | | 132,422,492 | | | | 434,582,524 | | |
| Proceeds from shares sold—Class II | | | 1,010,718 | | | | 6,382,536 | | |
| Reinvestment of distributions—Class I | | | 27,928,206 | | | | 475,037,841 | | |
| Reinvestment of distributions—Class II | | | 63,894 | | | | 1,916,898 | | |
| Payment for shares redeemed—Class I | | | (443,655,363 | ) | | | (1,888,941,538 | ) | |
| Payment for shares redeemed—Class II | | | (7,041,673 | ) | | | (17,433,503 | ) | |
| Redemption fees—Class I | | | 318,786 | | | | 388,517 | | |
| Redemption fees—Class II | | | 1,462 | | | | 2,582 | | |
Net decrease in net assets from Fund
share transactions | | | (288,951,478 | ) | | | (988,064,143 | ) | |
| Total decrease in net assets | | | (965,484,210 | ) | | | (2,859,579,101 | ) | |
| Net assets: | |
| Beginning of period | | | 2,574,036,332 | | | | 5,433,615,433 | | |
| End of period | | $ | 1,608,552,122 | | | $ | 2,574,036,332 | | |
| Undistributed net investment income | | $ | 1,781,835 | | | $ | 25,275,328 | | |
| Fund Share Transactions—Class I: | |
| Shares sold | | | 8,715,694 | | | | 17,349,363 | | |
| Shares issued in reinvestment of dividends | | | 1,777,628 | | | | 18,055,426 | | |
| Less shares redeemed | | | (29,280,484 | ) | | | (72,910,322 | ) | |
| Net decrease in shares outstanding | | | (18,787,162 | ) | | | (37,505,533 | ) | |
| Fund Share Transactions—Class II: | |
| Shares sold | | | 65,518 | | | | 252,902 | | |
| Shares issued in reinvestment of dividends | | | 4,065 | | | | 72,941 | | |
| Less shares redeemed | | | (444,832 | ) | | | (683,111 | ) | |
| Net decrease in shares outstanding | | | (375,249 | ) | | | (357,268 | ) | |
See accompanying Notes to Financial Statements.
THE OAKMARK FUNDS
63
THE OAKMARK FUNDS
Statements of Changes in Net Assets—March 31, 2009
| | | Oakmark
Equity and Income Fund | |
| | | Six Months Ended
March 31, 2009
(Unaudited) | | Year Ended
September 30, 2008 | |
| From Operations: | |
| Net investment income | | $ | 66,251,627 | | | $ | 271,023,392 | | |
| Net realized gain (loss) on investments | | | (894,737,312 | ) | | | 483,313,820 | | |
| Net realized gain (loss) on foreign currency transactions | | | (3,184,523 | ) | | | (2,296,321 | ) | |
Net change in unrealized appreciation (depreciation) on
investments | | | (1,649,291,769 | ) | | | (1,376,779,294 | ) | |
Net change in unrealized appreciation
(depreciation)—other | | | (41,336 | ) | | | (415,416 | ) | |
| Net decrease in net assets from operations | | | (2,481,003,313 | ) | | | (625,153,819 | ) | |
| Distributions to shareholders from: | |
| Net investment income—Class I | | | (196,387,842 | ) | | | (267,024,200 | ) | |
| Net investment income—Class II | | | (12,072,914 | ) | | | (16,634,567 | ) | |
| Net realized gain—Class I | | | (292,455,172 | ) | | | (664,948,149 | ) | |
| Net realized gain—Class II | | | (23,185,484 | ) | | | (48,763,636 | ) | |
| Total distributions to shareholders | | | (524,101,412 | ) | | | (997,370,552 | ) | |
| From Fund share transactions: | |
| Proceeds from shares sold—Class I | | | 2,287,021,788 | | | | 3,585,440,574 | | |
| Proceeds from shares sold—Class II | | | 255,412,734 | | | | 445,155,517 | | |
| Reinvestment of distributions—Class I | | | 465,061,022 | | | | 889,650,962 | | |
| Reinvestment of distributions—Class II | | | 30,396,980 | | | | 54,888,687 | | |
| Payment for shares redeemed—Class I | | | (2,084,934,528 | ) | | | (2,190,825,510 | ) | |
| Payment for shares redeemed—Class II | | | (189,001,442 | ) | | | (293,563,855 | ) | |
| Redemption fees—Class I | | | 2,907 | | | | 112,554 | | |
| Redemption fees—Class II | | | 232 | | | | 8,242 | | |
Net increase in net assets from Fund
share transactions | | | 763,959,693 | | | | 2,490,867,171 | | |
| Total increase (decrease) in net assets | | | (2,241,145,032 | ) | | | 868,342,800 | | |
| Net assets: | |
| Beginning of period | | | 14,273,014,371 | | | | 13,404,671,571 | | |
| End of period | | $ | 12,031,869,339 | | | $ | 14,273,014,371 | | |
| Undistributed net investment income (loss) | | $ | (295,282 | ) | | $ | 217,855,622 | | |
| Fund Share Transactions—Class I: | |
| Shares sold | | | 107,335,733 | | | | 131,246,453 | | |
| Shares issued in reinvestment of dividends | | | 21,781,473 | | | | 32,913,467 | | |
| Less shares redeemed | | | (97,788,474 | ) | | | (81,153,863 | ) | |
| Net increase in shares outstanding | | | 31,328,732 | | | | 83,006,057 | | |
| Fund Share Transactions—Class II: | |
| Shares sold | | | 11,831,327 | | | | 16,431,464 | | |
| Shares issued in reinvestment of dividends | | | 1,428,429 | | | | 2,038,956 | | |
| Less shares redeemed | | | (8,824,329 | ) | | | (10,835,135 | ) | |
| Net increase in shares outstanding | | | 4,435,427 | | | | 7,635,285 | | |
THE OAKMARK FUNDS
64
| | | Oakmark
Global Fund | |
| | | Six Months Ended
March 31, 2009
(Unaudited) | | Year Ended
September 30, 2008 | |
| From Operations: | |
| Net investment income (loss) | | $ | (530,954 | ) | | $ | 24,515,760 | | |
| Net realized gain (loss) on investments | | | (135,926,336 | ) | | | 41,778,664 | | |
| Net realized gain (loss) on foreign currency transactions | | | 60,598,370 | | | | (11,186,522 | ) | |
Net change in unrealized appreciation (depreciation) on
investments and foreign currencies | | | (599,836,058 | ) | | | (695,307,787 | ) | |
Net change in unrealized appreciation
(depreciation)—other | | | 1,739,210 | | | | (2,005,400 | ) | |
| Net decrease in net assets from operations | | | (673,955,768 | ) | | | (642,205,285 | ) | |
| Distributions to shareholders from: | |
| Net investment income—Class I | | | (64,681,154 | ) | | | (3,870,141 | ) | |
| Net investment income—Class II | | | (1,812,855 | ) | | | (32,286 | ) | |
| Net realized gain—Class I | | | (2,594,712 | ) | | | (320,109,533 | ) | |
| Net realized gain—Class II | | | (83,374 | ) | | | (9,616,102 | ) | |
| Total distributions to shareholders | | | (69,172,095 | ) | | | (333,628,062 | ) | |
| From Fund share transactions: | |
| Proceeds from shares sold—Class I | | | 128,724,263 | | | | 533,804,675 | | |
| Proceeds from shares sold—Class II | | | 2,570,235 | | | | 5,683,298 | | |
| Reinvestment of distributions—Class I | | | 64,695,685 | | | | 313,392,738 | | |
| Reinvestment of distributions—Class II | | | 1,830,946 | | | | 9,333,596 | | |
| Payment for shares redeemed—Class I | | | (320,304,043 | ) | | | (958,997,589 | ) | |
| Payment for shares redeemed—Class II | | | (5,128,760 | ) | | | (19,949,158 | ) | |
| Redemption fees—Class I | | | 196,241 | | | | 235,186 | | |
| Redemption fees—Class II | | | 6,162 | | | | 6,748 | | |
Net decrease in net assets from Fund
share transactions | | | (127,409,271 | ) | | | (116,490,506 | ) | |
| Total decrease in net assets | | | (870,537,134 | ) | | | (1,092,323,853 | ) | |
| Net assets: | |
| Beginning of period | | | 2,004,210,880 | | | | 3,096,534,733 | | |
| End of period | | $ | 1,133,673,746 | | | $ | 2,004,210,880 | | |
| Undistributed net investment income | | $ | 3,801,114 | | | $ | 17,630,590 | | |
| Fund Share Transactions—Class I: | |
| Shares sold | | | 9,214,076 | | | | 23,088,428 | | |
| Shares issued in reinvestment of dividends | | | 4,715,429 | | | | 12,822,943 | | |
| Less shares redeemed | | | (23,289,060 | ) | | | (42,758,112 | ) | |
| Net decrease in shares outstanding | | | (9,359,555 | ) | | | (6,846,741 | ) | |
| Fund Share Transactions—Class II: | |
| Shares sold | | | 193,963 | | | | 248,561 | | |
| Shares issued in reinvestment of dividends | | | 135,827 | | | | 389,224 | | |
| Less shares redeemed | | | (381,186 | ) | | | (875,330 | ) | |
| Net decrease in shares outstanding | | | (51,396 | ) | | | (237,545 | ) | |
See accompanying Notes to Financial Statements.
THE OAKMARK FUNDS
65
THE OAKMARK FUNDS
Statements of Changes in Net Assets—March 31, 2009
| | | Oakmark
Global Select Fund | |
| | | Six Months Ended
March 31, 2009
(Unaudited) | | Year Ended
September 30, 2008 | |
| From Operations: | |
| Net investment income | | $ | 494,623 | | | $ | 4,135,149 | | |
| Net realized gain (loss) on investments | | | (21,491,688 | ) | | | (36,205,681 | ) | |
| Net realized gain (loss) on foreign currency transactions | | | 6,059,421 | | | | 45,993 | | |
Net change in unrealized appreciation (depreciation) on
investments and foreign currencies | | | (30,771,160 | ) | | | (56,222,021 | ) | |
Net change in unrealized appreciation
(depreciation)—other | | | 96,519 | | | | (162,269 | ) | |
| Net decrease in net assets from operations | | | (45,612,285 | ) | | | (88,408,829 | ) | |
| Distributions to shareholders from: | |
| Net investment income—Class I | | | (10,153,265 | ) | | | (725,540 | ) | |
| Net realized gain—Class I | | | — | | | | (13,372,501 | ) | |
| Total distributions to shareholders | | | (10,153,265 | ) | | | (14,098,041 | ) | |
| From Fund share transactions: | |
| Proceeds from shares sold—Class I | | | 45,451,264 | | | | 152,328,234 | | |
| Reinvestment of distributions—Class I | | | 8,870,032 | | | | 13,571,933 | | |
| Payment for shares redeemed—Class I | | | (49,509,858 | ) | | | (208,397,143 | ) | |
| Redemption fees—Class I | | | 51,477 | | | | 157,379 | | |
Net increase (decrease) in net assets from Fund
share transactions | | | 4,862,915 | | | | (42,339,597 | ) | |
| Total decrease in net assets | | | (50,902,635 | ) | | | (144,846,467 | ) | |
| Net assets: | |
| Beginning of period | | | 232,841,694 | | | | 377,688,161 | | |
| End of period | | $ | 181,939,059 | | | $ | 232,841,694 | | |
| Undistributed net investment income | | $ | 521,997 | | | $ | 5,201,770 | | |
| Fund Share Transactions—Class I: | |
| Shares sold | | | 7,271,288 | | | | 15,695,713 | | |
| Shares issued in reinvestment of dividends | | | 1,377,334 | | | | 1,303,740 | | |
| Less shares redeemed | | | (7,835,664 | ) | | | (21,253,051 | ) | |
| Net increase (decrease) in shares outstanding | | | 812,958 | | | | (4,253,598 | ) | |
THE OAKMARK FUNDS
66
| | | Oakmark
International Fund | |
| | | Six Months Ended
March 31, 2009
(Unaudited) | | Year Ended
September 30, 2008 | |
| From Operations: | |
| Net investment income | | $ | 1,849,488 | | | $ | 149,365,461 | | |
| Net realized gain (loss) on investments | | | (639,320,001 | ) | | | (27,112,283 | ) | |
| Net realized gain (loss) on foreign currency transactions | | | 200,280,130 | | | | (4,453,599 | ) | |
Net change in unrealized appreciation (depreciation) on
investments and foreign currencies | | | (649,259,215 | ) | | | (2,181,656,978 | ) | |
Net change in unrealized appreciation
(depreciation)—other | | | 572,530 | | | | (1,810,771 | ) | |
| Net decrease in net assets from operations | | | (1,085,877,068 | ) | | | (2,065,668,170 | ) | |
| Distributions to shareholders from: | |
| Net investment income—Class I | | | (299,543,444 | ) | | | (51,882,590 | ) | |
| Net investment income—Class II | | | (7,710,397 | ) | | | (959,117 | ) | |
| Net realized gain—Class I | | | (21,453,694 | ) | | | (1,274,258,080 | ) | |
| Net realized gain—Class II | | | (657,046 | ) | | | (85,876,351 | ) | |
| Total distributions to shareholders | | | (329,364,581 | ) | | | (1,412,976,138 | ) | |
| From Fund share transactions: | |
| Proceeds from shares sold—Class I | | | 430,124,538 | | | | 843,973,862 | | |
| Proceeds from shares sold—Class II | | | 15,350,110 | | | | 154,989,608 | | |
| Reinvestment of distributions—Class I | | | 294,325,480 | | | | 1,166,912,506 | | |
| Reinvestment of distributions—Class II | | | 4,861,449 | | | | 62,134,167 | | |
| Payment for shares redeemed—Class I | | | (862,419,748 | ) | | | (3,432,270,289 | ) | |
| Payment for shares redeemed—Class II | | | (39,338,991 | ) | | | (466,708,322 | ) | |
| Redemption fees—Class I | | | 185,849 | | | | 557,708 | | |
| Redemption fees—Class II | | | 7,047 | | | | 36,364 | | |
Net decrease in net assets from Fund
share transactions | | | (156,904,266 | ) | | | (1,670,374,396 | ) | |
| Total decrease in net assets | | | (1,572,145,915 | ) | | | (5,149,018,704 | ) | |
| Net assets: | |
| Beginning of period | | | 3,884,457,849 | | | | 9,033,476,553 | | |
| End of period | | $ | 2,312,311,934 | | | $ | 3,884,457,849 | | |
| Undistributed net investment income | | $ | 7,531,506 | | | $ | 187,993,621 | | |
| Fund Share Transactions—Class I: | |
| Shares sold | | | 38,725,192 | | | | 41,879,271 | | |
| Shares issued in reinvestment of dividends | | | 27,252,147 | | | | 54,991,164 | | |
| Less shares redeemed | | | (76,738,998 | ) | | | (175,636,861 | ) | |
| Net decrease in shares outstanding | | | (10,761,659 | ) | | | (78,766,426 | ) | |
| Fund Share Transactions—Class II: | |
| Shares sold | | | 1,407,677 | | | | 7,714,499 | | |
| Shares issued in reinvestment of dividends | | | 447,235 | | | | 2,948,940 | | |
| Less shares redeemed | | | (3,434,624 | ) | | | (24,543,341 | ) | |
| Net decrease in shares outstanding | | | (1,579,712 | ) | | | (13,879,902 | ) | |
See accompanying Notes to Financial Statements.
THE OAKMARK FUNDS
67
THE OAKMARK FUNDS
Statements of Changes in Net Assets—March 31, 2009
| | | Oakmark International
Small Cap Fund | |
| | | Six Months Ended
March 31, 2009
(Unaudited) | | Year Ended
September 30, 2008 | |
| From Operations: | |
| Net investment income | | $ | 1,540,905 | | | $ | 19,984,041 | | |
| Net realized gain (loss) on investments | | | (64,589,974 | ) | | | 9,870,657 | | |
| Net realized gain (loss) on foreign currency transactions | | | 30,004,876 | | | | (774,440 | ) | |
Net change in unrealized appreciation (depreciation) on
investments and foreign currencies | | | (204,494,437 | ) | | | (380,342,817 | ) | |
Net change in unrealized appreciation
(depreciation)—other | | | 158,578 | | | | (173,259 | ) | |
| Net decrease in net assets from operations | | | (237,380,052 | ) | | | (351,435,818 | ) | |
| Distributions to shareholders from: | |
| Net investment income—Class I | | | (47,097,712 | ) | | | (8,925,646 | ) | |
| Net investment income—Class II | | | (24,604 | ) | | | (4,217 | ) | |
| Net realized gain—Class I | | | (6,559,210 | ) | | | (278,426,262 | ) | |
| Net realized gain—Class II | | | (3,537 | ) | | | (164,501 | ) | |
| Total distributions to shareholders | | | (53,685,063 | ) | | | (287,520,626 | ) | |
| From Fund share transactions: | |
| Proceeds from shares sold—Class I | | | 112,657,270 | | | | 286,377,418 | | |
| Proceeds from shares sold—Class II | | | 84,301 | | | | 142,977 | | |
| Reinvestment of distributions—Class I | | | 51,693,806 | | | | 274,317,138 | | |
| Reinvestment of distributions—Class II | | | 17,043 | | | | 93,759 | | |
| Payment for shares redeemed—Class I | | | (160,100,903 | ) | | | (585,285,695 | ) | |
| Payment for shares redeemed—Class II | | | (35,754 | ) | | | (541,602 | ) | |
| Redemption fees—Class I | | | 113,872 | | | | 223,596 | | |
| Redemption fees—Class II | | | 58 | | | | 138 | | |
Net increase (decrease) in net assets from Fund
share transactions | | | 4,429,693 | | | | (24,672,271 | ) | |
| Total decrease in net assets | | | (286,635,422 | ) | | | (663,628,715 | ) | |
| Net assets: | |
| Beginning of period | | | 663,839,433 | | | | 1,327,468,148 | | |
| End of period | | $ | 377,204,011 | | | $ | 663,839,433 | | |
| Undistributed net investment income | | $ | 946,605 | | | $ | 23,572,192 | | |
| Fund Share Transactions—Class I: | |
| Shares sold | | | 15,442,895 | | | | 19,764,158 | | |
| Shares issued in reinvestment of dividends | | | 7,199,694 | | | | 17,778,168 | | |
| Less shares redeemed | | | (21,330,268 | ) | | | (36,305,356 | ) | |
| Net increase in shares outstanding | | | 1,312,321 | | | | 1,236,970 | | |
| Fund Share Transactions—Class II: | |
| Shares sold | | | 11,107 | | | | 9,539 | | |
| Shares issued in reinvestment of dividends | | | 2,374 | | | | 6,080 | | |
| Less shares redeemed | | | (4,236 | ) | | | (31,659 | ) | |
| Net increase (decrease) in shares outstanding | | | 9,245 | | | | (16,040 | ) | |
THE OAKMARK FUNDS
68
THE OAKMARK FUNDS
Notes to Financial Statements (Unaudited)
1. SIGNIFICANT ACCOUNTING POLICIES
The following are the significant accounting policies of Oakmark Fund ("Oakmark"), Oakmark Select Fund ("Select"), Oakmark Equity and Income Fund ("Equity and Income"), Oakmark Global Fund ("Global"), Oakmark Global Select Fund ("Global Select"), Oakmark International Fund ("International"), and Oakmark International Small Cap Fund ("Int'l Small Cap"), collectively referred to as "the Funds", each a series of Harris Associates Investment Trust (the "Trust"), a Massachusetts business trust, organized on February 1, 1991, which is registered as an open-end investment company under the Investment Company Act of 1940. Each Fund other than Select and Global Select is diversified. These policies are in conformity with accounting principles generally accepted in the United States of America ("GAAP"). The presentation of financial statements in conformity with GAAP requires management to make estimates and assumptions that affect the re ported amounts of assets and liabilities at the date of the financial statements and the reported amounts of revenues and expenses during the reporting period. Actual results could differ from those estimates and assumptions. These financial statements contain all adjustments which are, in the opinion of management, necessary to a fair statement of the interim period presented. Such adjustments are normal and recurring in nature.
Class disclosure—
Each Fund offers two classes of shares: Class I Shares and Class II Shares. Class I Shares are offered to the general public. Class II Shares are offered to certain retirement plans such as 401(k) and profit sharing plans. Class II Shares pay a service fee at the annual rate of up to 0.25% of average net assets of Class II Shares of the Funds. This service fee is paid to a third-party administrator for performing the services associated with the administration of such retirement plans. Class I Shares do not have an associated service fee.
Income, realized and unrealized capital gains and losses, and expenses of the Funds not directly attributable to a specific class of shares are allocated to each class pro rata based on the relative net assets of each class. Transfer and dividend disbursing agent fees and other shareholder servicing fees are attributed to each class.
Redemption fees—
Each Fund (except Equity and Income ) imposes a short-term trading fee on redemptions of shares held for 90 days or less to offset two types of costs to the Fund caused by short-term trading: portfolio transaction and market impact costs associated with erratic redemption activity and administrative costs associated with processing redemptions. The fee is 2% of the redemption value and is deducted from either the redemption proceeds or from the balance in the account. The "first-in, first-out" ("FIFO") method is used to determine the holding period.
Security valuation—
The Funds' share prices or net asset values ("NAVs") are calculated as of the close of regular session trading (usually 4:00 pm Eastern time) on the New York Stock Exchange ("NYSE") on any day on which the NYSE is open for trading. Equity securities principally traded on securities exchanges in the United States and over-the-counter securities are valued at the last sales price or the official closing price on the day of valuation, or lacking any reported sales that day, at the most recent bid quotation. Securities traded on the NASDAQ National Market are valued at the NASDAQ Official Closing Price ("NOCP"), or lacking an NOCP, at the most recent bid quotation on the NASDAQ National Market. Equity securities principally traded on securities exchanges outside the United States shall be valued, depending on local convention or regulation, at the last sales price, the last bid or asked price, the mean between the last bid and asked prices, or the official closing price, or shall be based on a pricing composite as of the close of the regular trading hours on the appropriate exchange or other designated time. Debt obligations and money market instruments maturing in more than 60 days from the date of purchase are valued at the latest bid quotation. Debt obligations and money market instruments maturing in less than 61 days from the date of purchase are valued on an amortized cost basis, which approximates value. Options are valued at the last reported sales price on the day of valuation or, lacking any reported sale price on the valuation date, at the mean of the most recent bid and asked quotations or, if the mean is not available, at the most recent bid quotation.
Securities for which quotations are not readily available or securities that may have been affected by a significant event occurring between the close of a foreign market and the close of the NYSE are valued at fair values, determined by or under the direction of the pricing committee established by the Board of Trustees. A significant event may include the performance of U.S. markets since the close of foreign markets. The Funds may use a systematic fair valuation model provided by an independent third party to value foreign securities in order to adjust for stale pricing, which may occur between the close of certain foreign exchanges and the NYSE. At March 31, 2009, Equity and Income and Int'l Small Cap held securities for which market quotations were not readily available and were valued by the pricing committee at a fair value determined in good faith in accordance with procedures established by the Board of Trustees.
THE OAKMARK FUNDS
69
THE OAKMARK FUNDS
Notes to Financial Statements (Unaudited) (cont.)
The Funds adopted Financial Accounting Standards Board Statement of Financial Accounting Standards No. 157, Fair Value Measurements ("SFAS 157"), effective October 1, 2008. Under SFAS 157, various inputs are used in determining the value of each Fund's investments. These inputs are prioritized into three broad levels as follows:
Level 1—quoted prices in active markets for identical securities
Level 2—other significant observable inputs (including quoted prices for similar investments, interest rates, prepayment speeds, credit risk, and others)
Level 3—significant unobservable inputs (including the Fund's own assumptions in determining the fair value of investments)
Observable inputs are those based on market data obtained from independent sources, and unobservable inputs reflect the Funds' own assumptions based on the best information available. The input levels are not necessarily an indication of risk or liquidity associated with investing in those securities.
The following is a summary of the inputs used as of March 31, 2009, in valuing each Fund's assets:
| | | Valuation Inputs | |
| | | Level 1—Quoted
Prices | | Level 2—Other
Significant
Observable Inputs | | Level 3—
Significant
Unobservable
Inputs | | Total | |
| Oakmark | | $ | 2,035,811,820 | | | $ | 136,468,407 | | | $ | — | | | $ | 2,172,280,227 | | |
| Select | | | 1,512,665,745 | | | | 76,364,338 | | | | — | | | | 1,589,030,083 | | |
| Equity and Income | | | 5,555,257,704 | | | | 6,542,163,687 | | | | — | | | | 12,097,421,391 | | |
| Global | | | 1,085,592,510 | * | | | 40,486,429 | | | | — | | | | 1,126,078,939 | | |
| Global Select | | | 171,989,827 | * | | | 9,886,775 | | | | — | | | | 181,876,602 | | |
| International | | | 2,218,070,859 | * | | | 74,630,271 | | | | — | | | | 2,292,701,130 | | |
| Int'l Small Cap+ | | | 358,120,907 | * | | | 14,448,841 | | | | — | | | | 372,569,748 | | |
* Includes forward foreign currency contracts.
+ On September 30, 2008, Int'l Small Cap did not hold any securities classified as Level 3, and for the 6-month period ending March 31, 2009, the Fund had no purchases or sales of Level 3 securities. During the 6-month period ending March 31, 2009, a security was transferred into the Level 3 category with a market value of zero and remained at that value on March 31, 2009.
Foreign currency translations—
Certain Funds invest in foreign securities, which may involve a number of risk factors and special considerations not present with investments in securities of U.S. corporations. Values of investments and other assets and liabilities denominated in foreign currencies are translated into U.S. dollars at current exchange rates obtained by a recognized bank, dealer, or independent pricing service on the day of valuation. Purchases and sales of investments and dividend and interest income are converted at the prevailing rate of exchange on the respective dates of such transactions. Forward foreign currency contracts are valued at the current day's interpolated foreign exchange rates.
The Funds do not isolate that portion of the results of operations resulting from changes in foreign exchange rates on investments from the fluctuations arising from changes in market prices of securities held. Such fluctuations are included in the net realized and unrealized gains and losses from securities.
Net realized gains and losses on foreign currency transactions arise from sales of foreign currencies, currency gains or losses realized between the trade and settlement dates on securities transactions, the difference between the amounts of dividends, interest, and foreign withholding taxes recorded and the U.S. dollar equivalent of the amounts actually received or paid, and the realized gains or losses resulting from portfolio and transaction hedges. Net unrealized foreign exchange gains and losses arise from changes in the fair value of assets and liabilities, other than investments in securities, at quarter end resulting from changes in exchange rates.
THE OAKMARK FUNDS
70
THE OAKMARK FUNDS
Notes to Financial Statements (Unaudited) (cont.)
At March 31, 2009, net unrealized appreciation (depreciation) - other included the following components:
| | | Oakmark | | Equity and
Income | | Global | | Global
Select | | International | | Int'l
Small Cap | |
Unrealized appreciation
(depreciation) on
interest, dividends and
tax reclaims receivable | | $ | (48,419 | ) | | $ | (137,065 | ) | | $ | (119,691 | ) | | $ | (18,490 | ) | | $ | (260,837 | ) | | $ | 74,145 | | |
Unrealized appreciation
(depreciation) on open
securities purchases and
sales | | | 3,730 | | | | 0 | | | | 0 | | | | (1,616 | ) | | | (32,833 | ) | | | 3,185 | | |
Net unrealized
appreciation
(depreciation) - Other | | $ | (44,689 | ) | | $ | (137,065 | ) | | $ | (119,691 | ) | | $ | (20,106 | ) | | $ | (293,670 | ) | | $ | 77,330 | | |
Forward foreign currency contracts—
The Funds' currency transactions are limited to transaction hedging and portfolio hedging. The contractual amounts of forward foreign currency contracts do not necessarily represent the amounts potentially subject to risk. The measurement of the risks associated with these instruments is meaningful only when all related and offsetting transactions are considered. Risks arise from the possible inability of counterparties to meet the terms of their contracts and from movements in currency values. At March 31, 2009, Global, Global Select, International, and Int'l Small Cap held forward foreign currency contracts as follows:
Oakmark Global Fund
| | | Contract
Amount | | Settlement
Date | | Valuation at
3/31/09 | | Unrealized
Appreciation/
(Depreciation) | |
Foreign Currency Sold:
Japanese Yen | | | 2,585,000,000 | | | 3/3/10 | | $ | 26,320,535 | | | $ | 476,193 | | |
| Swiss Franc | | | 23,300,000 | | | 3/3/10 | | | 20,658,869 | | | | (463,853 | ) | |
| | | | | | | $ | 46,979,404 | | | $ | 12,340 | | |
Oakmark Global Select Fund
| | | Contract
Amount | | Settlement
Date | | Valuation at
3/31/09 | | Unrealized
Appreciation/
(Depreciation) | |
Foreign Currency Sold:
Japanese Yen | | | 273,000,000 | | | 3/3/10 | | $ | 2,779,693 | | | $ | 50,290 | | |
| Swiss Franc | | | 3,850,000 | | | 3/3/10 | | | 3,413,590 | | | | (76,645 | ) | |
| | | | | | | $ | 6,193,283 | | | $ | (26,355 | ) | |
Oakmark International Fund
| | | Contract
Amount | | Settlement
Date | | Valuation at
3/31/09 | | Unrealized
Appreciation/
(Depreciation) | |
Foreign Currency Sold:
Japanese Yen | | | 5,250,000,000 | | | 3/3/10 | | $ | 53,455,632 | | | $ | 967,124 | | |
| Swiss Franc | | | 67,000,000 | | | 3/3/10 | | | 59,405,332 | | | | (1,333,826 | ) | |
| | | | | | | $ | 112,860,964 | | | $ | (366,702 | ) | |
THE OAKMARK FUNDS
71
THE OAKMARK FUNDS
Notes to Financial Statements (Unaudited) (cont.)
Oakmark Int'l Small Cap Fund
| | | Contract
Amount | | Settlement
Date | | Valuation at
3/31/09 | | Unrealized
Appreciation/
(Depreciation) | |
Foreign Currency Sold:
Japanese Yen | | | 572,000,000 | | | 3/3/10 | | $ | 5,824,118 | | | $ | 105,370 | | |
| Swiss Franc | | | 2,950,000 | | | 3/3/10 | | | 2,615,608 | | | | (58,728 | ) | |
| | | | | | | $ | 8,439,726 | | | $ | 46,642 | | |
Security transactions and investment income—
Security transactions are accounted for on the trade date (date the order to buy or sell is executed) and dividend income is recorded on the ex-dividend date. Interest income and expenses are recorded on an accrual basis. Bond discount is accreted and premium is amortized over the expected life of each applicable security using the effective yield method. Withholding taxes on foreign dividends have been provided for in accordance with the Funds' understanding of the applicable country's tax rules and rates. Net realized gains and losses on investments are determined by the specific identification method.
Short sales—
Each Fund may sell "short" a security it does not own in anticipation of a decline in the value of that security. When the Fund sells a security short, it must borrow the security sold short and deliver it to the broker-dealer through which it made the short sale. A gain, limited to the price at which the Fund sold the security short, or loss, unlimited in size, will be recognized upon the termination of the short sale. At March 31, 2009, none of the Funds had short sales.
Accounting for options—
When a Fund writes an option, the premium received by the Fund is recorded as a liability and is subsequently adjusted to the current market value of the option written. Premiums received from writing options that expire are recorded by the Fund on the expiration date as realized gains from option transactions. The difference between the premium and the amount paid on effecting a closing purchase transaction, including brokerage commissions, is also treated as a realized gain, or if the premium is less than the amount paid for the closing purchase transaction, as a realized loss. If a call option is exercised, the premium is added to the proceeds from the sale of the underlying security or currency in determining whether the Fund has realized a gain or a loss. If a put option is exercised, the premium reduces the cost basis of the security or currency purchased by the Fund. In writing an option, the Fund bears the market risk of an unfavorable change in the price of the security or currency underlying the written option. Exercise of an option written by the Fund could result in the Fund selling or buying a security or currency at a price different from the current market value. Options written by the Fund do not give rise to counterparty credit risk, as they obligate the Fund, not its counterparties, to perform.
When a Fund purchases an option, the premium paid by the Fund is recorded as an asset and is subsequently adjusted to the current value of the option purchased. Purchasing call options tends to increase the Fund's exposure to the underlying instrument. Purchasing put options tends to decrease the Fund's exposure to the underlying instrument. Premiums paid for purchasing options that expire are treated as realized losses. Premiums paid for purchasing options that are exercised or closed are added to the amounts paid or offset against the proceeds on the underlying security to determine the realized gain or loss. The risks associated with purchasing put and call options are potential loss of the premium paid and the failure of the counterparty to honor its obligation under the contract.
At March 31, 2009, the Funds had no outstanding options.
Committed line of credit—
The Trust has an unsecured committed line of credit (the "Facility") with State Street Bank and Trust Company ("State Street") in the amount of $450 million. Borrowings under that arrangement bear interest at 0.75% above the greater of the Federal Funds Effective Rate or LIBOR, as defined in the credit agreement. To maintain the Facility, an annualized commitment fee of 0.125% on the unused portion is charged to the Trust as well as an annual renewal fee of 0.02% of the Facility amount. There were no borrowings outstanding under the arrangement at March 31, 2009.
THE OAKMARK FUNDS
72
THE OAKMARK FUNDS
Notes to Financial Statements (Unaudited) (cont.)
Expense offset arrangement—
State Street serves as custodian of the Funds. State Street's fee may be reduced by credits that are an earnings allowance calculated on the average daily cash balances each Fund maintains with State Street. Credit balances used to reduce the Funds' custodian fees, if any, are reported as a reduction of total expenses in the Statements of Operations. During the period ended March 31, 2009, none of the Funds received an expense offset credit.
Repurchase agreements—
Each Fund may invest in repurchase agreements, which are short-term investments whereby the Fund acquires ownership of a debt security and the seller agrees to repurchase the security at a future date at a specified price.
The Fund's custodian receives delivery of the underlying securities collateralizing repurchase agreements. It is the Funds' policy that the value of the collateral be at least equal to 102% of the repurchase price, including interest. Harris Associates L.P. ("the Adviser") is responsible for determining that the value of the collateral is at all times at least equal to 102% of the repurchase price, including interest. Repurchase agreements could involve certain risks in the event of default or insolvency of the counterparty including possible delays or restrictions upon a Fund's ability to dispose of the underlying securities.
Security lending—
Each Fund, except Oakmark, may lend its portfolio securities to broker-dealers and banks. Any such loan must be continuously secured by collateral in cash or cash equivalents maintained on a current basis in an amount at least equal to the fair value of the securities loaned by the Fund. Collateral is marked to market and monitored daily. The Fund would continue to receive the equivalent of the interest or dividends paid by the issuer on the securities loaned, and would also receive an additional return that may be in the form of a fixed fee or a percentage of the earnings on the collateral. The Fund would have the right to call the loan and attempt to obtain the securities loaned at any time on notice of not more than five business days. In the event of bankruptcy or other default of the borrower, the Fund could experience delays in liquidating the loan collateral or recovering the loaned securities and incur expenses related t o enforcing its rights. In addition, there could be a decline in the value of the collateral or in the fair value of the securities loaned while the Fund seeks to enforce its rights thereto and the Fund could experience subnormal levels of income or lack of access to income during that period.
At March 31, 2009, Global and International had securities on loan with a value of $30,782,145 and $54,842,057 respectively, and held as collateral for the loans U.S. Treasury securities with a value of $32,323,792 and $57,588,685 respectively.
Restricted securities—
The following investments, the sales of which are restricted to qualified institutional buyers, have been valued according to the securities valuation procedures for debt obligations and money market instruments (as stated in the Security valuation section) since their acquisition dates. These securities are priced using market quotations and there are no unrestricted securities with the same maturity dates and yields for the issuer.
At March 31, 2009, Equity and Income held the following restricted securities:
| Quantity | | Security
Name | | Acquisition
Date | | Carrying
Value | | Cost | | Value | | Percentage of
Net Assets | |
| $ | 3,000,000 | | | Sealed Air Corporation,
144A, 5.625% due
7/15/2013 | | 6/27/2003 | | | 86.0358 | | | | 100.68 | | | | 2,581,074 | | | | 0.02 | % | |
| | 4,400,000 | | | Sealed Air Corporation,
144A, 5.625% due
7/15/2013 | | 8/20/2003 | | | 86.0358 | | | | 96.41 | | | | 3,785,575 | | | | 0.03 | % | |
| | 300,000 | | | Sealed Air Corporation,
144A, 5.625% due
7/15/2013 | | 8/21/2003 | | | 86.0358 | | | | 96.79 | | | | 258,107 | | | | 0.00 | % | |
| | 11,700,000 | | | Sealed Air Corporation,
144A, 5.625% due
7/15/2013 | | 4/6/2004 | | | 86.0358 | | | | 103.31 | | | | 10,066,189 | | | | 0.08 | % | |
| | | | | | | | | | | | | | | | | | 16,690,945 | | | | 0.13 | % | |
THE OAKMARK FUNDS
73
THE OAKMARK FUNDS
Notes to Financial Statements (Unaudited) (cont.)
Federal income taxes—
It is each Fund's policy to comply with the requirements of the Internal Revenue Code applicable to regulated investment companies and to distribute substantially all of its net taxable income, including any net realized gains on investments, to its shareholders. Therefore, no federal income tax provision is required.
The Funds implemented the provisions of the Financial Accounting Standards Board ("FASB") Interpretation No. 48 ("FIN48") "Accounting for Uncertainty in Income Taxes—an interpretation of FASB Statement No. 109". This interpretation prescribes a recognition threshold and measurement attribute for the financial statement recognition and measurement of a tax position taken or expected to be taken in a tax return. It also provides guidance on de-recognition, classification, interest and penalties, accounting in interim periods, disclosure and transition. The implementation of FIN 48 resulted in no material liability for unrecognized tax benefits in the accompanying financial statements.
Recently issued accounting pronouncement—
In March 2008, FASB issued Statement of Financial Accounting Standards No. 161 ("FAS 161") "Disclosures about Derivative Instruments and Hedging Activities"—an amendment of FASB Statement No. 133 ("FAS 133")," which expands the disclosure requirements in FAS 133 about an entity's derivative instruments and hedging activities. FAS 161 is effective for fiscal years and interim periods beginning after November 15, 2008.
Management is currently evaluating the impact the adoption of this accounting pronouncement will have on the Funds' financial statements and related disclosures.
2. TRANSACTIONS WITH AFFILIATES
Each Fund has an investment advisory agreement with the Adviser. For management services and facilities furnished, the Funds pay the Adviser monthly fees. Each fee is calculated on the total net assets as determined at the end of each preceding calendar month. Annual fee rates are as follows:
| Fund | | Advisory Fees | | Fund | | Advisory Fees | |
Oakmark
| | 1.00% up to $2 billion;
0.90% on the next $1 billion;
0.80% on the next $2 billion;
0.75% on the next $2.5 billion;
0.70% on the next $2.5 billion; and
0.65% over $10 billion
| | Global
Global Select
| | 1.00% up to $2 billion;
0.95% on the next $2 billion;
0.90% on the next $4 billion; and
0.875% over $8 billion
1.00% up to $2 billion;
0.95% on the next $1 billion; | |
|
Select
| | 1.00% up to $1 billion;
0.95% on the next $500 million;
0.90% on the next $500 million;
0.85% on the next $500 million;
0.80% on the next $2.5 billion;
0.75% on the next $5 billion; and
0.725% over $10 billion
| |
International
| | 0.875% on the next $4 billion; and
0.85% over $7 billion
1.00% up to $2 billion;
0.95% on the next $1 billion;
0.85% on the next $2 billion;
0.825% on the next $2.5 billion;
0.815% on the next $3.5 billion; | |
|
Equity and Income
| | 0.75% up to $5 billion;
0.70% on the next $2.5 billion;
0.675% on the next $2.5 billion;
0.65% on the next $2.5 billion;
0.60% on the next $3.5 billion;
0.585% on the next $5 billion;
0.5775% on the next $7 billion; and
0.5725% over $28 billion | |
Int'l Small Cap
| | 0.805% on the next $5.5 billion; and
0.80% over $16.5 billion
1.25% up to $500 million;
1.10% on the next $1 billion;
1.05% on the next $2 billion; and
1.025% over $3.5 billion
| |
|
THE OAKMARK FUNDS
74
THE OAKMARK FUNDS
Notes to Financial Statements (Unaudited) (cont.)
The Adviser is contractually obligated through January 31, 2010 to reimburse each Fund Class to the extent, but only to the extent, that its annualized expenses (excluding taxes, interest, all commissions and other normal charges incident to the purchase and sale of portfolio securities, and extraordinary charges such as litigation costs, but including fees paid to the Adviser) exceed the percent set forth below of average daily net assets of the Fund Class.
| Fund | | Class I | | Class II | |
| Oakmark | | | 1.50 | % | | | 1.75 | % | |
| Select | | | 1.50 | | | | 1.75 | | |
| Equity and Income | | | 1.00 | | | | 1.25 | | |
| Global | | | 1.75 | | | | 2.00 | | |
| Global Select | | | 1.75 | | | | 2.00 | | |
| International | | | 2.00 | | | | 2.25 | | |
| Int'l Small Cap | | | 2.00 | | | | 2.25 | | |
The Adviser is entitled to recoup from any Fund class, in any fiscal year through the Funds' fiscal year ending September 30, 2013, amounts reimbursed to that Fund class, except to the extent that the Fund class already has paid such recoupment to the Adviser or such recoupment would cause the annual ordinary operating expenses of a Fund class for that fiscal year to exceed the applicable limit stated above.
The Adviser and the Funds have entered into agreements with financial intermediaries to provide recordkeeping, processing, shareholder communications and other services to customers of the intermediaries and have agreed to compensate the intermediaries for providing those services. Certain of those services would be provided by the Funds if the shares of those customers were registered directly with the Funds' transfer agent. Accordingly, the Funds pay a portion of the intermediary fees pursuant to an agreement with the Adviser, which calls for each Fund to pay a portion of the intermediary fees attributable to shares of the Fund held by the intermediary (which generally are a percentage of value of the shares held) not exceeding the lesser of 75% of the fees charged by the intermediary or what the Fund would have paid its transfer agent had each customer's shares been registered directly with the transfer agent instead of held through the intermediary. The Adviser pays the remainder of the fees. The fees incurred by the Funds are reflected as other shareholder servicing fees in the Statements of Operations.
The non-interested Trustees of the Trust may participate in the Trust's Deferred Compensation Plan for Independent Trustees. Participants in the plan may elect to defer all or a portion of their compensation. Amounts deferred are retained by the Trust and represent an unfunded obligation of the Trust. The value of a participant's deferral account is determined by reference to the change in value of Class I shares of one or more of the Funds or a money market fund as specified by the participant. Benefits would be payable after a stated number of years or retirement from the board. The accrued obligations of the Funds under the plan are reflected as deferred trustee compensation in the Statements of Assets and Liabilities. The Trust pays the compensation of the trustees other than those affiliated with the Adviser and all expenses incurred in connection with their services to the Trust. The Trust does not provide any pension or r etirement benefits to its trustees.
3. FEDERAL INCOME TAXES
At March 31, 2009, cost of investments for federal income tax purposes and related composition of unrealized gains and losses for each fund were as follows:
| Fund | | Cost of Investments
for Federal Income
Tax Purposes | | Gross Unrealized
Appreciation | | Gross Unrealized
(Depreciation) | | Net Unrealized
Appreciation
(Depreciation) | |
| Oakmark | | $ | 2,516,829,150 | | | $ | 196,979,791 | | | $ | (541,528,714 | ) | | $ | (344,548,923 | ) | |
| Select | | | 1,887,460,644 | | | | 266,328,452 | | | | (564,759,013 | ) | | | (298,430,561 | ) | |
| Equity and Income | | | 12,681,941,893 | | | | 728,506,746 | | | | (1,313,027,248 | ) | | | (584,520,502 | ) | |
| Global | | | 1,772,838,620 | | | | 61,508,540 | | | | (708,280,561 | ) | | | (646,772,021 | ) | |
| Global Select | | | 263,279,905 | | | | 11,338,102 | | | | (92,715,050 | ) | | | (81,376,948 | ) | |
| International | | | 3,855,062,815 | | | | 58,698,511 | | | | (1,620,693,494 | ) | | | (1,561,994,983 | ) | |
| Int'l Small Cap | | | 827,962,980 | | | | 9,195,647 | | | | (464,635,521 | ) | | | (455,439,874 | ) | |
THE OAKMARK FUNDS
75
THE OAKMARK FUNDS
Notes to Financial Statements (Unaudited) (cont.)
For the six-month period ended March 31, 2009, the components of distributable earnings on a tax basis (excluding unrealized appreciation (depreciation)) were as follows:
| Fund | | Undistributed
Ordinary Income | | Undistributed Long-
Term Gain | | Total Distributable
Earnings | |
| Oakmark | | $ | 7,789,299 | | | $ | — | | | $ | 7,789,299 | | |
| Select | | | 2,679,825 | | | | — | | | | 2,679,825 | | |
| Equity and Income | | | 503,543 | | | | — | | | | 503,543 | | |
| Global | | | 4,232,995 | | | | — | | | | 4,232,995 | | |
| Global Select | | | 535,925 | | | | — | | | | 535,925 | | |
| International | | | 7,920,670 | | | | — | | | | 7,920,670 | | |
| Int'l Small Cap | | | 1,395,721 | | | | — | | | | 1,395,721 | | |
During the six-month period ended March 31, 2009 and the year ended September 30, 2008, the tax character of distributions paid was as follows:
| | | Period Ended
March 31, 2009 | | Year Ended
September 30, 2008 | |
| Fund | | Distributions Paid
from Ordinary
Income | | Distributions Paid
from Long-Term
Capital Gain | | Distributions Paid
from Ordinary
Income | | Distributions Paid
from Long-Term
Capital Gain | |
| Oakmark | | $ | 42,799,180 | | | $ | 93,707,504 | | | $ | 63,543,967 | | | $ | 391,986,830 | | |
| Select | | | 29,073,357 | | | | — | | | | 47,324,894 | | | | 456,979,270 | | |
| Equity and Income | | | 208,460,756 | | | | 315,640,656 | | | | 283,658,767 | | | | 713,711,785 | | |
| Global | | | 69,172,095 | | | | — | | | | 37,019,816 | | | | 296,608,246 | | |
| Global Select | | | 10,153,265 | | | | — | | | | 13,614,523 | | | | 483,518 | | |
| International | | | 312,029,168 | | | | 17,335,413 | | | | 152,440,649 | | | | 1,260,535,489 | | |
| Int'l Small Cap | | | 48,127,666 | | | | 5,557,397 | | | | 23,990,953 | | | | 263,529,673 | | |
On March 31, 2009, the Funds had temporary book/tax differences in undistributed earnings that were primarily attributable to trustee deferred compensation expenses, passive foreign investment companies, foreign currency contracts, post October losses and deferrals of capital losses on wash sales. Temporary differences will reverse over time. The Funds have permanent differences in book/tax undistributed earnings primarily attributable to currency gains and losses and equalization debits. Permanent differences have been recorded in their respective component of the Analysis of Net Assets.
4. INVESTMENT TRANSACTIONS
For the six-month period ended March 31, 2009, transactions in investment securities (excluding short term and U.S. Government securities) were as follows (in thousands):
| | | Oakmark | | Select | | Equity and
Income | | Global | | Global
Select | | International | | Int'l
Small Cap | |
| Purchases | | $ | 629,908 | | | $ | 589,723 | | | $ | 3,432,098 | | | $ | 202,563 | | | $ | 63,883 | | | $ | 645,461 | | | $ | 105,849 | | |
| Proceeds from sales | | | 943,666 | | | | 861,136 | | | | 2,013,224 | | | | 332,366 | | | | 58,803 | | | | 917,828 | | | | 115,691 | | |
Purchases at cost and proceeds from sales (in thousands) of long-term U.S. Government securities for the six-month period ended March 31, 2009, were 3,087,180 and 2,945,373 respectively for Equity and Income.
THE OAKMARK FUNDS
76
THE OAKMARK FUNDS
Notes to Financial Statements (Unaudited) (cont.)
5. INVESTMENT IN AFFILIATED ISSUERS
An issuer in which a Fund's holdings represents 5% or more of the outstanding voting securities of the issuer is an affiliated issuer as defined under the Investment Company Act of 1940. A schedule of each Fund's investments in securities of affiliated issuers for the six-month period ended March 31, 2009, is set forth below:
Schedule of Transactions with Affiliated Issuers
Oakmark Equity and Income Fund
| Affiliates | | Shares Held | | Purchases
(Cost) | | Sales
(Proceeds) | | Dividend
Income | | Value
March 31,
2009 | |
| EchoStar Corp.+ | | | 4,900,000 | | | $ | 18,201,426 | | | $ | 0 | | | $ | 0 | | | $ | 72,667,000 | | |
| Hospira, Inc.+ | | | 8,000,000 | | | | 44,398,550 | | | | 0 | | | | 0 | | | | 246,880,000 | | |
Mueller Water Products, Inc.,
Class A* | | | 2,500,000 | | | | 0 | | | | 7,220,799 | | | | 210,000 | | | | 8,250,000 | | |
| Walter Industries, Inc. | | | 3,100,000 | | | | 21,468,114 | | | | 0 | | | | 580,000 | | | | 70,897,000 | | |
| TOTALS | | | | | | $ | 84,068,090 | | | $ | 7,220,799 | | | $ | 790,000 | | | $ | 398,694,000 | | |
Schedule of Transactions with Affiliated Issuers
Oakmark International Fund
| Affiliates | | Shares Held | | Purchases
(Cost) | | Sales
(Proceeds) | | Dividend
Income | | Value
March 31,
2009 | |
| Meitec Corp. | | | 2,475,100 | | | $ | 0 | | | $ | 229,249 | | | $ | 691,432 | | | $ | 30,405,835 | | |
| Signet Jewelers, Ltd. | | | 6,834,400 | | | | 13,630,664 | | | | 0 | | | | 0 | | | | 78,253,880 | | |
| TOTALS | | | | $ | 13,630,664 | | | $ | 229,249 | | | $ | 691,432 | | | $ | 108,659,715 | | |
Schedule of Transactions with Affiliated Issuers
Oakmark Int'l Small Cap Fund
| Affiliates | | Shares Held | | Purchases
(Cost) | | Sales
(Proceeds) | | Dividend
Income | | Value
March 31,
2009 | |
| Alaska Milk Corp. | | | 56,360,000 | | | $ | 0 | | | $ | 0 | | | $ | 173,176 | | | $ | 4,373,512 | | |
| Chargeurs SA | | | 772,682 | | | | 0 | | | | 181,363 | | | | 0 | | | | 4,927,609 | | |
| Freightways Ltd.* | | | 5,397,300 | | | | 0 | | | | 3,560,306 | | | | 270,171 | | | | 9,083,523 | | |
| JJB Sports PLC | | | 15,670,600 | | | | 1,519,392 | | | | 0 | | | | 0 | | | | 2,529,558 | | |
| LSL Property Services PLC+ | | | 10,362,200 | | | | 0 | | | | 0 | | | | 0 | | | | 15,723,123 | | |
| Media Prima Berhad | | | 43,674,800 | | | | 3,090,546 | | | | 0 | | | | 0 | | | | 11,680,957 | | |
| Monitise PLC+ | | | 27,236,288 | | | | 0 | | | | 216,546 | | | | 0 | | | | 1,416,649 | | |
| Pasona Group, Inc. | | | 23,842 | | | | 0 | | | | 2,451,835 | | | | 150,240 | | | | 10,561,920 | | |
| Raymarine PLC | | | 4,093,379 | | | | 0 | | | | 0 | | | | 0 | | | | 822,274 | | |
| Vitec Group PLC | | | 2,812,479 | | | | 0 | | | | 0 | | | | 0 | | | | 6,295,357 | | |
| TOTALS | | | | | | $ | 4,609,938 | | | $ | 6,410,050 | | | $ | 593,587 | | | $ | 67,414,482 | | |
+ Non-income producing security.
* Due to transactions during the period ended March 31, 2009, the company is no longer an affiliated security.
THE OAKMARK FUNDS
77
THE OAKMARK FUNDS
FINANCIAL HIGHLIGHTS
The following tables are intended to help you understand each Fund's financial performance during the last 5 years (or since it began operations, if less than five years). Certain information reflects financial results for a single Fund share. Total returns represent the rate you would have earned (or lost) on an investment, assuming reinvestment of all dividends and distributions. The Information for the period ended March 31, 2009 is unaudited, and each Fund's financial statements is included in this report. Deloitte & Touche LLP, an independent registered public accounting firm, has audited the information for the fiscal years ended September 30, 2008, 2007, 2006, 2005 and 2004. For each year shown, all information is for the fiscal year ended September 30, unless otherwise noted.
THE OAKMARK FUNDS
78
OAKMARK FUND
Financial Highlights–Class I
For a share outstanding throughout each period
| | | Six Months Ended
March 31, 2009
(Unaudited) | | Year Ended
September 30,
2008 | | Year Ended
September 30,
2007 | | Year Ended
September 30,
2006 | | Year Ended
September 30,
2005 | | Year Ended
September 30,
2004 | |
| Net Asset Value, Beginning of Period | | $ | 35.31 | | | $ | 47.28 | | | $ | 44.64 | | | $ | 40.75 | | | $ | 38.68 | | | $ | 33.85 | | |
| Income From Investment Operations: | |
| Net Investment Income | | | 0.21 | | | | 0.52 | | | | 0.47 | (a) | | | 0.39 | (a) | | | 0.34 | | | | 0.16 | | |
Net Gain (Loss) on Investments (both realized
and unrealized) | | | (10.80 | ) | | | (8.51 | ) | | | 4.60 | | | | 3.85 | | | | 1.90 | | | | 4.81 | | |
| Total From Investment Operations: | | | (10.59 | ) | | | (7.99 | ) | | | 5.07 | | | | 4.24 | | | | 2.24 | | | | 4.97 | | |
| Less Distributions: | |
| Dividends (from net investment income) | | | (0.45 | ) | | | (0.56 | ) | | | (0.43 | ) | | | (0.35 | ) | | | (0.17 | ) | | | (0.14 | ) | |
| Dividends (from capital gains) | | | (0.99 | ) | | | (3.42 | ) | | | (2.00 | ) | | | 0.00 | | | | 0.00 | | | | 0.00 | | |
| Total Distributions | | | (1.44 | ) | | | (3.98 | ) | | | (2.43 | ) | | | (0.35 | ) | | | (0.17 | ) | | | (0.14 | ) | |
| Redemption Fees | | | 0.00 | (b) | | | 0.00 | (b) | | | 0.00 | (b) | | | 0.00 | (b) | | | 0.00 | (b) | | | 0.00 | (b) | |
| Net Asset Value, End of Period | | $ | 23.28 | | | $ | 35.31 | | | $ | 47.28 | | | $ | 44.64 | | | $ | 40.75 | | | $ | 38.68 | | |
| Total Return | | | -30.34 | % | | | -18.14 | % | | | 11.51 | % | | | 10.46 | % | | | 5.79 | % | | | 14.73 | % | |
| Ratios/Supplemental Data: | |
| Net Assets, End of Period ($million) | | $ | 2,168.9 | | | $ | 3,610.1 | | | $ | 5,656.9 | | | $ | 5,486.2 | | | $ | 6,340.4 | | | $ | 6,474.0 | | |
| Ratio of Expenses to Average Net Assets* | | | 1.30 | %† | | | 1.10 | % | | | 1.01 | % | | | 1.05 | % | | | 1.03 | % | | | 1.05 | % | |
| Ratio of Net Investment Income to Average Net Assets | | | 1.43 | %† | | | 1.17 | % | | | 1.01 | % | | | 0.94 | % | | | 0.79 | % | | | 0.47 | % | |
| Portfolio Turnover Rate | | | 26 | % | | | 32 | % | | | 12 | % | | | 9 | % | | | 16 | % | | | 19 | % | |
Financial Highlights–Class II
For a share outstanding throughout each period
| | | Six Months Ended
March 31, 2009
(Unaudited) | | Year Ended
September 30,
2008 | | Year Ended
September 30,
2007 | | Year Ended
September 30,
2006 | | Year Ended
September 30,
2005 | | Year Ended
September 30,
2004 | |
| Net Asset Value, Beginning of Period | | $ | 35.12 | | | $ | 46.97 | | | $ | 44.35 | | | $ | 40.51 | | | $ | 38.45 | | | $ | 33.68 | | |
| Income From Investment Operations: | |
| Net Investment Income | | | 0.15 | (a) | | | 0.54 | | | | 0.32 | (a) | | | 0.25 | (a) | | | 0.26 | (a) | | | 0.04 | (a) | |
Net Gain (Loss) on Investments (both realized
and unrealized) | | | (10.72 | ) | | | (8.64 | ) | | | 4.55 | | | | 3.82 | | | | 1.87 | | | | 4.78 | | |
| Total From Investment Operations: | | | (10.57 | ) | | | (8.10 | ) | | | 4.87 | | | | 4.07 | | | | 2.13 | | | | 4.82 | | |
| Less Distributions: | |
| Dividends (from net investment income) | | | (0.26 | ) | | | (0.33 | ) | | | (0.25 | ) | | | (0.23 | ) | | | (0.07 | ) | | | (0.05 | ) | |
| Distributions (from capital gains) | | | (0.99 | ) | | | (3.42 | ) | | | (2.00 | ) | | | 0.00 | | | | 0.00 | | | | 0.00 | | |
| Total Distributions | | | (1.25 | ) | | | (3.75 | ) | | | (2.25 | ) | | | (0.23 | ) | | | (0.07 | ) | | | (0.05 | ) | |
| Redemption Fees | | | 0.00 | (b) | | | 0.00 | (b) | | | 0.00 | (b) | | | 0.00 | (b) | | | 0.00 | | | | 0.00 | | |
| Net Asset Value, End of Period | | $ | 23.30 | | | $ | 35.12 | | | $ | 46.97 | | | $ | 44.35 | | | $ | 40.51 | | | $ | 38.45 | | |
| Total Return | | | -30.41 | % | | | -18.44 | % | | | 11.11 | % | | | 10.08 | % | | | 5.55 | % | | | 14.32 | % | |
| Ratios/Supplemental Data: | |
| Net assets, end of period ($million) | | $ | 6.3 | | | $ | 12.4 | | | $ | 29.1 | | | $ | 37.5 | | | $ | 43.7 | | | $ | 51.9 | | |
| Ratio of Expenses to Average Net Assets* | | | 1.53 | %† | | | 1.47 | % | | | 1.36 | % | | | 1.40 | % | | | 1.26 | % | | | 1.40 | % | |
| Ratio of Net Investment Income to Average Net Assets | | | 1.21 | %† | | | 0.81 | % | | | 0.67 | % | | | 0.59 | % | | | 0.58 | % | | | 0.11 | % | |
| Portfolio Turnover Rate | | | 26 | % | | | 32 | % | | | 12 | % | | | 9 | % | | | 16 | % | | | 19 | % | |
† Data has been annualized.
* The ratio excludes expense offset arrangement.
(a) Computed using average shares outstanding throughout the period.
(b) Amount rounds to less than $0.01 per share.
See accompanying Notes to Financial Statements.
THE OAKMARK FUNDS
79
OAKMARK SELECT FUND
Financial Highlights–Class I
For a share outstanding throughout each period
| | | Six Months Ended
March 31, 2009
(Unaudited) | | Year Ended
September 30,
2008 | | Year Ended
September 30,
2007 | | Year Ended
September 30,
2006 | | Year Ended
September 30,
2005 | | Year Ended
September 30,
2004 | |
| Net Asset Value, Beginning of Period | | $ | 20.34 | | | $ | 33.05 | | | $ | 34.48 | | | $ | 33.44 | | | $ | 31.20 | | | $ | 27.55 | | |
| Income From Investment Operations: | |
| Net Investment Income | | | 0.10 | | | | 0.35 | | | | 0.38 | (a) | | | 0.36 | (a) | | | 0.29 | | | | 0.15 | (a) | |
Net Gain (Loss) on Investments (both realized
and unrealized) | | | (5.21 | ) | | | (9.63 | ) | | | 2.11 | | | | 2.76 | | | | 2.19 | | | | 3.60 | | |
| Total From Investment Operations: | | | (5.11 | ) | | | (9.28 | ) | | | 2.49 | | | | 3.12 | | | | 2.48 | | | | 3.75 | | |
| Less Distributions: | |
| Dividends (from net investment income) | | | (0.25 | ) | | | (0.32 | ) | | | (0.39 | ) | | | (0.29 | ) | | | (0.24 | ) | | | (0.10 | ) | |
| Dividends (from capital gains) | | | 0.00 | | | | (3.11 | ) | | | (3.53 | ) | | | (1.79 | ) | | | 0.00 | | | | 0.00 | | |
| Total Distributions | | | (0.25 | ) | | | (3.43 | ) | | | (3.92 | ) | | | (2.08 | ) | | | (0.24 | ) | | | (0.10 | ) | |
| Redemption Fees | | | 0.00 | (b) | | | 0.00 | (b) | | | 0.00 | (b) | | | 0.00 | (b) | | | 0.00 | (b) | | | 0.00 | (b) | |
| Net Asset Value, End of Period | | $ | 14.98 | | | $ | 20.34 | | | $ | 33.05 | | | $ | 34.48 | | | $ | 33.44 | | | $ | 31.20 | | |
| Total Return | | | -25.17 | % | | | -30.43 | % | | | 7.00 | % | | | 9.58 | % | | | 7.98 | % | | | 13.64 | % | |
| Ratios/Supplemental Data: | |
| Net Assets, End of Period ($million) | | $ | 1,603.0 | | | $ | 2,558.9 | | | $ | 5,397.4 | | | $ | 5,776.6 | | | $ | 5,908.0 | | | $ | 5,463.0 | | |
| Ratio of Expenses to Average Net Assets* | | | 1.27 | %† | | | 1.08 | % | | | 0.97 | % | | | 0.99 | % | | | 1.00 | % | | | 1.00 | % | |
| Ratio of Net Investment Income to Average Net Assets | | | 1.07 | %† | | | 1.16 | % | | | 1.11 | % | | | 1.08 | % | | | 0.87 | % | | | 0.50 | % | |
| Portfolio Turnover Rate | | | 34 | % | | | 26 | % | | | 10 | % | | | 22 | % | | | 21 | % | | | 14 | % | |
Financial Highlights–Class II
For a share outstanding throughout each period
| | | Six Months Ended
March 31, 2009
(Unaudited) | | Year Ended
September 30,
2008 | | Year Ended
September 30,
2007 | | Year Ended
September 30,
2006 | | Year Ended
September 30,
2005 | | Year Ended
September 30,
2004 | |
| Net Asset Value, Beginning of Period | | $ | 20.29 | | | $ | 32.82 | | | $ | 34.23 | | | $ | 33.24 | | | $ | 31.00 | | | $ | 27.37 | | |
| Income From Investment Operations: | |
| Net Investment Income | | | 0.09 | (a) | | | 0.34 | | | | 0.27 | (a) | | | 0.26 | (a) | | | 0.21 | | | | 0.09 | (a) | |
Net Gain (Loss) on Investments (both realized
and unrealized) | | | (5.18 | ) | | | (9.65 | ) | | | 2.09 | | | | 2.72 | | | | 2.18 | | | | 3.58 | | |
| Total From Investment Operations: | | | (5.09 | ) | | | (9.31 | ) | | | 2.36 | | | | 2.98 | | | | 2.39 | | | | 3.67 | | |
| Less Distributions: | |
| Dividends (from net investment income) | | | (0.20 | ) | | | (0.11 | ) | | | (0.24 | ) | | | (0.20 | ) | | | (0.15 | ) | | | (0.04 | ) | |
| Distributions (from capital gains) | | | 0.00 | | | | (3.11 | ) | | | (3.53 | ) | | | (1.79 | ) | | | 0.00 | | | | 0.00 | | |
| Total Distributions | | | (0.20 | ) | | | (3.22 | ) | | | (3.77 | ) | | | (1.99 | ) | | | (0.15 | ) | | | (0.04 | ) | |
| Redemption Fees | | | 0.00 | (b) | | | 0.00 | (b) | | | 0.00 | (b) | | | 0.00 | (b) | | | 0.00 | | | | 0.00 | | |
| Net Asset Value, End of Period | | $ | 15.00 | | | $ | 20.29 | | | $ | 32.82 | | | $ | 34.23 | | | $ | 33.24 | | | $ | 31.00 | | |
| Total Return | | | -25.11 | % | | | -30.64 | % | | | 6.65 | % | | | 9.18 | % | | | 7.72 | % | | | 13.40 | % | |
| Ratios/Supplemental Data: | |
| Net assets, end of period ($million) | | $ | 5.6 | | | $ | 15.1 | | | $ | 36.2 | | | $ | 68.1 | | | $ | 85.2 | | | $ | 98.0 | | |
| Ratio of Expenses to Average Net Assets* | | | 1.28 | %† | | | 1.37 | % | | | 1.35 | % | | | 1.34 | % | | | 1.25 | % | | | 1.21 | % | |
| Ratio of Net Investment Income to Average Net Assets | | | 1.22 | %† | | | 0.88 | % | | | 0.79 | % | | | 0.78 | % | | | 0.65 | % | | | 0.29 | % | |
| Portfolio Turnover Rate | | | 34 | % | | | 26 | % | | | 10 | % | | | 22 | % | | | 21 | % | | | 14 | % | |
† Data has been annualized.
* The ratio excludes expense offset arrangement.
(a) Computed using average shares outstanding throughout the period.
(b) Amount rounds to less than $0.01 per share.
THE OAKMARK FUNDS
80
OAKMARK EQUITY AND INCOME FUND
Financial Highlights–Class I
For a share outstanding throughout each period
| | | Six Months Ended
March 31, 2009
(Unaudited) | | Year Ended
September 30,
2008 | | Year Ended
September 30,
2007 | | Year Ended
September 30,
2006 | | Year Ended
September 30,
2005 | | Year Ended
September 30,
2004 | |
| Net Asset Value, Beginning of Period | | $ | 25.57 | | | $ | 28.67 | | | $ | 26.49 | | | $ | 25.41 | | | $ | 23.12 | | | $ | 20.30 | | |
| Income From Investment Operations: | |
| Net Investment Income | | | 0.12 | (a) | | | 0.53 | (a) | | | 0.58 | (a) | | | 0.44 | | | | 0.31 | | | | 0.15 | | |
Net Gain (Loss) on Investments (both realized
and unrealized) | | | (4.47 | ) | | | (1.52 | ) | | | 3.41 | | | | 1.18 | | | | 2.77 | | | | 2.81 | | |
| Total From Investment Operations: | | | (4.35 | ) | | | (0.99 | ) | | | 3.99 | | | | 1.62 | | | | 3.08 | | | | 2.96 | | |
| Less Distributions: | |
| Dividends (from net investment income) | | | (0.39 | ) | | | (0.60 | ) | | | (0.50 | ) | | | (0.34 | ) | | | (0.20 | ) | | | (0.14 | ) | |
| Dividends (from capital gains) | | | (0.57 | ) | | | (1.51 | ) | | | (1.31 | ) | | | (0.20 | ) | | | (0.59 | ) | | | 0.00 | | |
| Total Distributions | | | (0.96 | ) | | | (2.11 | ) | | | (1.81 | ) | | | (0.54 | ) | | | (0.79 | ) | | | (0.14 | ) | |
| Redemption Fees | | | 0.00 | (b) | | | 0.00 | (b) | | | 0.00 | (b) | | | 0.00 | (b) | | | 0.00 | (b) | | | 0.00 | (b) | |
| Net Asset Value, End of Period | | $ | 20.26 | | | $ | 25.57 | | | $ | 28.67 | | | $ | 26.49 | | | $ | 25.41 | | | $ | 23.12 | | |
| Total Return | | | -17.20 | % | | | -3.85 | % | | | 15.77 | % | | | 6.51 | % | | | 13.65 | % | | | 14.64 | % | |
| Ratios/Supplemental Data: | |
| Net Assets, End of Period ($million) | | $ | 11,140.8 | | | $ | 13,263.3 | | | $ | 12,489.5 | | | $ | 10,414.5 | | | $ | 9,223.2 | | | $ | 7,577.9 | | |
| Ratio of Expenses to Average Net Assets* | | | 0.87 | %† | | | 0.81 | % | | | 0.83 | % | | | 0.86 | % | | | 0.89 | % | | | 0.92 | % | |
| Ratio of Net Investment Income to Average Net Assets | | | 1.11 | %† | | | 1.93 | % | | | 2.14 | % | | | 1.88 | % | | | 1.36 | % | | | 0.78 | % | |
| Portfolio Turnover Rate | | | 44 | % | | | 65 | %(c) | | | 67 | % | | | 81 | % | | | 112 | % | | | 72 | % | |
Financial Highlights–Class II
For a share outstanding throughout each period
| | | Six Months Ended
March 31, 2009
(Unaudited) | | Year Ended
September 30,
2008 | | Year Ended
September 30,
2007 | | Year Ended
September 30,
2006 | | Year Ended
September 30,
2005 | | Year Ended
September 30,
2004 | |
| Net Asset Value, Beginning of Period | | $ | 25.40 | | | $ | 28.50 | | | $ | 26.35 | | | $ | 25.29 | | | $ | 23.03 | | | $ | 20.24 | | |
| Income From Investment Operations: | |
| Net Investment Income | | | 0.08 | (a) | | | 0.43 | (a) | | | 0.48 | (a) | | | 0.35 | | | | 0.28 | | | | 0.11 | | |
Net Gain (Loss) on Investments (both realized
and unrealized) | | | (4.44 | ) | | | (1.51 | ) | | | 3.40 | | | | 1.19 | | | | 2.72 | | | | 2.79 | | |
| Total From Investment Operations: | | | (4.36 | ) | | | (1.08 | ) | | | 3.88 | | | | 1.54 | | | | 3.00 | | | | 2.90 | | |
| Less Distributions: | |
| Dividends (from net investment income) | | | (0.30 | ) | | | (0.51 | ) | | | (0.42 | ) | | | (0.28 | ) | | | (0.15 | ) | | | (0.11 | ) | |
| Distributions (from capital gains) | | | (0.57 | ) | | | (1.51 | ) | | | (1.31 | ) | | | (0.20 | ) | | | (0.59 | ) | | | 0.00 | | |
| Total Distributions | | | (0.87 | ) | | | (2.02 | ) | | | (1.73 | ) | | | (0.48 | ) | | | (0.74 | ) | | | (0.11 | ) | |
| Redemption Fees | | | 0.00 | (b) | | | 0.00 | (b) | | | 0.00 | (b) | | | 0.00 | (b) | | | 0.00 | (b) | | | 0.00 | | |
| Net Asset Value, End of Period | | $ | 20.17 | | | $ | 25.40 | | | $ | 28.50 | | | $ | 26.35 | | | $ | 25.29 | | | $ | 23.03 | | |
| Total Return | | | -17.33 | % | | | -4.19 | % | | | 15.38 | % | | | 6.18 | % | | | 13.34 | % | | | 14.36 | % | |
| Ratios/Supplemental Data: | |
| Net assets, end of period ($million) | | $ | 891.1 | | | $ | 1,009.7 | | | $ | 915.1 | | | $ | 718.1 | | | $ | 582.0 | | | $ | 478.7 | | |
| Ratio of Expenses to Average Net Assets* | | | 1.22 | %† | | | 1.16 | % | | | 1.17 | % | | | 1.18 | % | | | 1.14 | % | | | 1.17 | % | |
| Ratio of Net Investment Income to Average Net Assets | | | 0.76 | %† | | | 1.59 | % | | | 1.82 | % | | | 1.57 | % | | | 1.11 | % | | | 0.53 | % | |
| Portfolio Turnover Rate | | | 44 | % | | | 65 | %(c) | | | 67 | % | | | 81 | % | | | 112 | % | | | 72 | % | |
† Data has been annualized.
* The ratio excludes expense offset arrangement.
(a) Computed using average shares outstanding throughout the period.
(b) Amount rounds to less than $0.01 per share.
(c) The ratio excludes in-kind transactions.
See accompanying Notes to Financial Statements.
THE OAKMARK FUNDS
81
OAKMARK GLOBAL FUND
Financial Highlights–Class I
For a share outstanding throughout each period
| | | Six Months Ended
March 31, 2009
(Unaudited) | | Year Ended
September 30,
2008 | | Year Ended
September 30,
2007 | | Year Ended
September 30,
2006 | | Year Ended
September 30,
2005 | | Year Ended
September 30,
2004 | |
| Net Asset Value, Beginning of Period | | $ | 19.43 | | | $ | 28.08 | | | $ | 26.69 | | | $ | 23.91 | | | $ | 19.73 | | | $ | 16.98 | | |
| Income From Investment Operations: | |
| Net Investment Income | | | (0.00 | )(b) | | | 0.25 | | | | 0.18 | (a) | | | 0.27 | | | | 0.17 | | | | 0.09 | | |
Net Gain (Loss) on Investments (both realized
and unrealized) | | | (6.61 | ) | | | (5.82 | ) | | | 5.06 | | | | 3.74 | | | | 4.48 | | | | 2.71 | | |
| Total From Investment Operations: | | | (6.61 | ) | | | (5.57 | ) | | | 5.24 | | | | 4.01 | | | | 4.65 | | | | 2.80 | | |
| Less Distributions: | |
| Dividends (from net investment income) | | | (0.70 | ) | | | (0.04 | ) | | | (0.31 | ) | | | (0.26 | ) | | | (0.10 | ) | | | 0.00 | (b) | |
| Dividends (from capital gains) | | | (0.03 | ) | | | (3.04 | ) | | | (3.54 | ) | | | (0.97 | ) | | | (0.37 | ) | | | (0.05 | ) | |
| Total Distributions | | | (0.73 | ) | | | (3.08 | ) | | | (3.85 | ) | | | (1.23 | ) | | | (0.47 | ) | | | (0.05 | ) | |
| Redemption Fees | | | 0.00 | (b) | | | 0.00 | (b) | | | 0.00 | (b) | | | 0.00 | (b) | | | 0.00 | (b) | | | 0.00 | (b) | |
| Net Asset Value, End of Period | | $ | 12.09 | | | $ | 19.43 | | | $ | 28.08 | | | $ | 26.69 | | | $ | 23.91 | | | $ | 19.73 | | |
| Total Return | | | -34.47 | % | | | -22.10 | % | | | 21.29 | % | | | 17.46 | % | | | 23.88 | % | | | 16.54 | % | |
| Ratios/Supplemental Data: | |
| Net Assets, End of Period ($million) | | $ | 1,098.3 | | | $ | 1,946.6 | | | $ | 3,006.2 | | | $ | 2,282.2 | | | $ | 1,842.9 | | | $ | 1,336.3 | | |
| Ratio of Expenses to Average Net Assets* | | | 1.30 | %† | | | 1.16 | % | | | 1.13 | % | | | 1.18 | % | | | 1.20 | % | | | 1.26 | % | |
Ratio of Net Investment Income (Loss) to
Average Net Assets | | | (0.07 | )%† | | | 0.95 | % | | | 0.66 | % | | | 1.18 | % | | | 0.81 | % | | | 0.47 | % | |
| Portfolio Turnover Rate | | | 15 | % | | | 41 | % | | | 35 | % | | | 41 | % | | | 17 | % | | | 16 | % | |
Financial Highlights–Class II
For a share outstanding throughout each period
| | | Six Months Ended
March 31, 2009
(Unaudited) | | Year Ended
September 30,
2008 | | Year Ended
September 30,
2007 | | Year Ended
September 30,
2006 | | Year Ended
September 30,
2005 | | Year Ended
September 30,
2004 | |
| Net Asset Value, Beginning of Period | | $ | 19.01 | | | $ | 27.62 | | | $ | 26.31 | | | $ | 23.63 | | | $ | 19.53 | | | $ | 16.84 | | |
| Income From Investment Operations: | |
| Net Investment Income | | | (0.03 | ) | | | 0.13 | | | | 0.07 | (a) | | | 0.18 | | | | 0.11 | | | | 0.05 | | |
Net Gain (Loss) on Investments (both realized
and unrealized) | | | (6.46 | ) | | | (5.69 | ) | | | 4.99 | | | | 3.69 | | | | 4.43 | | | | 2.69 | | |
| Total From Investment Operations: | | | (6.49 | ) | | | (5.56 | ) | | | 5.06 | | | | 3.87 | | | | 4.54 | | | | 2.74 | | |
| Less Distributions: | |
| Dividends (from net investment income) | | | (0.61 | ) | | | (0.01 | ) | | | (0.21 | ) | | | (0.22 | ) | | | (0.07 | ) | | | 0.00 | | |
| Distributions (from capital gains) | | | (0.03 | ) | | | (3.04 | ) | | | (3.54 | ) | | | (0.97 | ) | | | (0.37 | ) | | | (0.05 | ) | |
| Total Distributions | | | (0.64 | ) | | | (3.05 | ) | | | (3.75 | ) | | | (1.19 | ) | | | (0.44 | ) | | | (0.05 | ) | |
| Redemption Fees | | | 0.00 | (b) | | | 0.00 | (b) | | | 0.00 | (b) | | | 0.00 | (b) | | | 0.00 | (b) | | | 0.00 | | |
| Net Asset Value, End of Period | | $ | 11.88 | | | $ | 19.01 | | | $ | 27.62 | | | $ | 26.31 | | | $ | 23.63 | | | $ | 19.53 | | |
| Total Return | | | -34.51 | % | | | -22.46 | % | | | 20.82 | % | | | 17.01 | % | | | 23.53 | % | | | 16.32 | % | |
| Ratios/Supplemental Data: | |
| Net assets, end of period ($million) | | $ | 35.4 | | | $ | 57.6 | | | $ | 90.3 | | | $ | 77.1 | | | $ | 58.6 | | | $ | 24.7 | | |
| Ratio of Expenses to Average Net Assets* | | | 1.61 | %† | | | 1.57 | % | | | 1.53 | % | | | 1.56 | % | | | 1.45 | % | | | 1.50 | % | |
Ratio of Net Investment Income (Loss) to
Average Net Assets | | | (0.38 | )%† | | | 0.54 | % | | | 0.25 | % | | | 0.80 | % | | | 0.63 | % | | | 0.37 | % | |
| Portfolio Turnover Rate | | | 15 | % | | | 41 | % | | | 35 | % | | | 41 | % | | | 17 | % | | | 16 | % | |
† Data has been annualized.
* The ratio excludes expense offset arrangement.
(a) Computed using average shares outstanding throughout the period.
(b) Amount rounds to less than $0.01 per share.
THE OAKMARK FUNDS
82
OAKMARK GLOBAL SELECT FUND
Financial Highlights–Class I
For a share outstanding throughout each period
| | | Six Months Ended
March 31, 2009
(Unaudited) | | Year Ended
September 30,
2008 | | October 2, 2006
through
September 30,
2007 (a) | |
| Net Asset Value, Beginning of Period | | $ | 8.23 | | | $ | 11.61 | | | $ | 10.00 | | |
| Income From Investment Operations: | |
| Net Investment Income | | | 0.02 | | | | 0.14 | (b) | | | 0.12 | | |
| Net Gain (Loss) on Investments (both realized and unrealized) | | | (1.65 | ) | | | (3.07 | ) | | | 1.49 | | |
| Total From Investment Operations: | | | (1.63 | ) | | | (2.93 | ) | | | 1.61 | | |
| Less Distributions: | |
| Dividends (from net investment income) | | | (0.35 | ) | | | (0.02 | ) | | | (0.01 | ) | |
| Dividends (from capital gains) | | | 0.00 | | | | (0.44 | ) | | | 0.00 | | |
| Total Distributions | | | (0.35 | ) | | | (0.46 | ) | | | (0.01 | ) | |
| Redemption Fees | | | 0.00 | (c) | | | 0.01 | | | | 0.01 | | |
| Net Asset Value, End of Period | | $ | 6.25 | | | $ | 8.23 | | | $ | 11.61 | | |
| Total Return | | | -19.91 | % | | | -25.95 | % | | | 16.23 | %² | |
| Ratios/Supplemental Data: | |
| Net Assets, End of Period ($million) | | $ | 181.9 | | | $ | 232.8 | | | $ | 377.7 | | |
| Ratio of Expenses to Average Net Assets* | | | 1.61 | %† | | | 1.35 | % | | | 1.31 | %† | |
| Ratio of Net Investment Income to Average Net Assets | | | 0.54 | %† | | | 1.41 | % | | | 1.01 | % | |
| Portfolio Turnover Rate | | | 33 | % | | | 62 | % | | | 33 | % | |
² Data has not been annualized.
† Data has been annualized.
* The ratio excludes expense offset arrangement.
(a) The date on which fund shares were first offered for sale to the public was October 2, 2006.
(b) Computed using average shares outstanding throughout the period.
(c) Amount rounds to less than $0.01 per share.
See accompanying Notes to Financial Statements.
THE OAKMARK FUNDS
83
OAKMARK INTERNATIONAL FUND
Financial Highlights–Class I
For a share outstanding throughout each period
| | | Six Months Ended
March 31, 2009
(Unaudited) | | Year Ended
September 30,
2008 | | Year Ended
September 30,
2007 | | Year Ended
September 30,
2006 | | Year Ended
September 30,
2005 | | Year Ended
September 30,
2004 | |
| Net Asset Value, Beginning of Period | | $ | 15.71 | | | $ | 26.59 | | | $ | 26.83 | | | $ | 23.52 | | | $ | 18.98 | | | $ | 15.67 | | |
| Income From Investment Operations: | |
| Net Investment Income | | | 0.01 | (a) | | | 0.65 | | | | 0.43 | | | | 0.41 | | | | 0.27 | | | | 0.24 | | |
Net Gain (Loss) on Investments (both realized
and unrealized) | | | (4.39 | ) | | | (7.11 | ) | | | 3.25 | | | | 4.49 | | | | 4.59 | | | | 3.18 | | |
| Total From Investment Operations: | | | (4.38 | ) | | | (6.46 | ) | | | 3.68 | | | | 4.90 | | | | 4.86 | | | | 3.42 | | |
| Less Distributions: | |
| Dividends (from net investment income) | | | (1.39 | ) | | | (0.17 | ) | | | (0.44 | ) | | | (0.59 | ) | | | (0.27 | ) | | | (0.11 | ) | |
| Dividends (from capital gains) | | | (0.10 | ) | | | (4.25 | ) | | | (3.48 | ) | | | (1.00 | ) | | | (0.05 | ) | | | 0.00 | | |
| Total Distributions | | | (1.49 | ) | | | (4.42 | ) | | | (3.92 | ) | | | (1.59 | ) | | | (0.32 | ) | | | (0.11 | ) | |
| Redemption Fees | | | 0.00 | (b) | | | 0.00 | (b) | | | 0.00 | (b) | | | 0.00 | (b) | | | 0.00 | (b) | | | 0.00 | (a) | |
| Net Asset Value, End of Period | | $ | 9.84 | | | $ | 15.71 | | | $ | 26.59 | | | $ | 26.83 | | | $ | 23.52 | | | $ | 18.98 | | |
| Total Return | | | -28.72 | % | | | -28.59 | % | | | 14.53 | % | | | 22.14 | % | | | 25.85 | % | | | 21.92 | % | |
| Ratios/Supplemental Data: | |
| Net Assets, End of Period ($million) | | $ | 2,244.4 | | | $ | 3,753.6 | | | $ | 8,446.6 | | | $ | 7,200.5 | | | $ | 5,627.4 | | | $ | 4,036.9 | | |
| Ratio of Expenses to Average Net Assets* | | | 1.25 | %† | | | 1.10 | % | | | 1.05 | % | | | 1.08 | % | | | 1.11 | % | | | 1.20 | % | |
| Ratio of Net Investment Income to Average Net Assets | | | 0.14 | %† | | | 2.32 | % | | | 1.65 | % | | | 1.80 | % | | | 1.32 | % | | | 1.40 | % | |
| Portfolio Turnover Rate | | | 25 | % | | | 41 | % | | | 50 | % | | | 37 | % | | | 14 | % | | | 21 | % | |
Financial Highlights–Class II
For a share outstanding throughout each period
| | | Six Months Ended
March 31, 2009
(Unaudited) | | Year Ended
September 30,
2008 | | Year Ended
September 30,
2007 | | Year Ended
September 30,
2006 | | Year Ended
September 30,
2005 | | Year Ended
September 30,
2004 | |
| Net Asset Value, Beginning of Period | | $ | 15.55 | | | $ | 26.32 | | | $ | 26.61 | | | $ | 23.36 | | | $ | 18.86 | | | $ | 15.58 | | |
| Income From Investment Operations: | |
| Net Investment Income | | | 0.01 | (a) | | | 0.39 | (a) | | | 0.35 | | | | 0.34 | | | | 0.22 | | | | 0.18 | | |
Net Gain (Loss) on Investments (both realized
and unrealized) | | | (4.36 | ) | | | (6.86 | ) | | | 3.19 | | | | 4.45 | | | | 4.55 | | | | 3.16 | | |
| Total From Investment Operations: | | | (4.35 | ) | | | (6.47 | ) | | | 3.54 | | | | 4.79 | | | | 4.77 | | | | 3.34 | | |
| Less Distributions: | |
| Dividends (from net investment income) | | | (1.17 | ) | | | (0.05 | ) | | | (0.35 | ) | | | (0.54 | ) | | | (0.22 | ) | | | (0.06 | ) | |
| Distributions (from capital gains) | | | (0.10 | ) | | | (4.25 | ) | | | (3.48 | ) | | | (1.00 | ) | | | (0.05 | ) | | | 0.00 | | |
| Total Distributions | | | (1.27 | ) | | | (4.30 | ) | | | (3.83 | ) | | | (1.54 | ) | | | (0.27 | ) | | | (0.06 | ) | |
| Redemption Fees | | | 0.00 | (b) | | | 0.00 | (b) | | | 0.00 | (b) | | | 0.00 | (b) | | | 0.00 | | | | 0.00 | | |
| Net Asset Value, End of Period | | $ | 9.93 | | | $ | 15.55 | | | $ | 26.32 | | | $ | 26.61 | | | $ | 23.36 | | | $ | 18.86 | | |
| Total Return | | | -28.64 | % | | | -28.91 | % | | | 14.04 | % | | | 21.71 | % | | | 25.50 | % | | | 21.52 | % | |
| Ratios/Supplemental Data: | |
| Net assets, end of period ($million) | | $ | 67.9 | | | $ | 130.8 | | | $ | 586.9 | | | $ | 496.0 | | | $ | 362.9 | | | $ | 259.2 | | |
| Ratio of Expenses to Average Net Assets* | | | 1.20 | %† | | | 1.52 | % | | | 1.44 | % | | | 1.47 | % | | | 1.38 | % | | | 1.53 | % | |
| Ratio of Net Investment Income to Average Net Assets | | | 0.18 | %† | | | 1.96 | % | | | 1.31 | % | | | 1.43 | % | | | 1.08 | % | | | 1.18 | % | |
| Portfolio Turnover Rate | | | 25 | % | | | 41 | % | | | 50 | % | | | 37 | % | | | 14 | % | | | 21 | % | |
† Data has been annualized.
* The ratio excludes expense offset arrangement.
(a) Computed using average shares outstanding throughout the period.
(b) Amount rounds to less than $0.01 per share.
THE OAKMARK FUNDS
84
OAKMARK INTERNATIONAL SMALL CAP FUND
Financial Highlights–Class I
For a share outstanding throughout each period
| | | Six Months Ended
March 31, 2009
(Unaudited) | | Year Ended
September 30,
2008 | | Year Ended
September 30,
2007 | | Year Ended
September 30,
2006 | | Year Ended
September 30,
2005 | | Year Ended
September 30,
2004 | |
| Net Asset Value, Beginning of Period | | $ | 11.36 | | | $ | 23.19 | | | $ | 24.09 | | | $ | 22.79 | | | $ | 18.26 | | | $ | 13.74 | | |
| Income From Investment Operations: | |
| Net Investment Income | | | 0.03 | (a) | | | 0.37 | | | | 0.32 | | | | 0.42 | | | | 0.20 | | | | 0.11 | | |
Net Gain (Loss) on Investments (both realized
and unrealized) | | | (4.02 | ) | | | (6.36 | ) | | | 2.77 | | | | 5.12 | | | | 4.98 | | | | 4.52 | | |
| Total From Investment Operations: | | | (3.99 | ) | | | (5.99 | ) | | | 3.09 | | | | 5.54 | | | | 5.18 | | | | 4.63 | | |
| Less Distributions: | |
| Dividends (from net investment income) | | | (0.93 | ) | | | (0.18 | ) | | | (0.56 | ) | | | (0.70 | ) | | | (0.27 | ) | | | (0.12 | ) | |
| Dividends (from capital gains) | | | (0.13 | ) | | | (5.66 | ) | | | (3.43 | ) | | | (3.54 | ) | | | (0.38 | ) | | | 0.00 | | |
| Total Distributions | | | (1.06 | ) | | | (5.84 | ) | | | (3.99 | ) | | | (4.24 | ) | | | (0.65 | ) | | | (0.12 | ) | |
| Redemption Fees | | | 0.00 | (b) | | | 0.00 | (b) | | | 0.00 | (b) | | | 0.00 | (b) | | | 0.00 | (b) | | | 0.01 | | |
| Net Asset Value, End of Period | | $ | 6.31 | | | $ | 11.36 | | | $ | 23.19 | | | $ | 24.09 | | | $ | 22.79 | | | $ | 18.26 | | |
| Total Return | | | -36.25 | % | | | -32.47 | % | | | 13.35 | % | | | 28.50 | % | | | 29.04 | % | | | 33.94 | % | |
| Ratios/Supplemental Data: | |
| Net Assets, End of Period ($million) | | $ | 377.0 | | | $ | 663.6 | | | $ | 1,326.5 | | | $ | 1,274.5 | | | $ | 1,007.2 | | | $ | 734.1 | | |
| Ratio of Expenses to Average Net Assets* | | | 1.67 | %† | | | 1.41 | % | | | 1.34 | % | | | 1.37 | % | | | 1.41 | % | | | 1.49 | % | |
| Ratio of Net Investment Income to Average Net Assets | | | 0.73 | %† | | | 2.17 | % | | | 1.19 | % | | | 1.73 | % | | | 0.96 | % | | | 0.72 | % | |
| Portfolio Turnover Rate | | | 25 | % | | | 50 | % | | | 57 | % | | | 44 | % | | | 47 | % | | | 29 | % | |
Financial Highlights–Class II
For a share outstanding throughout each period
| | | Six Months Ended
March 31, 2009
(Unaudited) | | Year Ended
September 30,
2008 | | Year Ended
September 30,
2007 | | Year Ended
September 30,
2006 | | Year Ended
September 30,
2005 | | Year Ended
September 30,
2004 | |
| Net Asset Value, Beginning of Period | | $ | 11.33 | | | $ | 23.15 | | | $ | 24.05 | | | $ | 22.77 | | | $ | 18.25 | | | $ | 13.69 | | |
| Income From Investment Operations: | |
| Net Investment Income | | | 0.02 | (a) | | | 0.47 | | | | 0.29 | | | | 0.41 | | | | 0.18 | | | | 0.13 | | |
Net Gain (Loss) on Investments (both realized
and unrealized) | | | (4.01 | ) | | | (6.48 | ) | | | 2.79 | | | | 5.10 | | | | 4.98 | | | | 4.52 | | |
| Total From Investment Operations: | | | (3.99 | ) | | | (6.01 | ) | | | 3.08 | | | | 5.51 | | | | 5.16 | | | | 4.65 | | |
| Less Distributions: | |
| Dividends (from net investment income) | | | (0.90 | ) | | | (0.15 | ) | | | (0.55 | ) | | | (0.69 | ) | | | (0.26 | ) | | | (0.09 | ) | |
| Distributions (from capital gains) | | | (0.13 | ) | | | (5.66 | ) | | | (3.43 | ) | | | (3.54 | ) | | | (0.38 | ) | | | 0.00 | | |
| Total Distributions | | | (1.03 | ) | | | (5.81 | ) | | | (3.98 | ) | | | (4.23 | ) | | | (0.64 | ) | | | (0.09 | ) | |
| Redemption Fees | | | 0.00 | (b) | | | 0.00 | (b) | | | 0.00 | (b) | | | 0.00 | (b) | | | 0.00 | (b) | | | 0.00 | | |
| Net Asset Value, End of Period | | $ | 6.31 | | | $ | 11.33 | | | $ | 23.15 | | | $ | 24.05 | | | $ | 22.77 | | | $ | 18.25 | | |
| Total Return | | | -36.31 | % | | | -32.63 | % | | | 13.29 | % | | | 28.33 | % | | | 28.94 | % | | | 34.11 | % | |
| Ratios/Supplemental Data: | |
| Net assets, end of period ($million) | | $ | 0.2 | | | $ | 0.3 | | | $ | 0.9 | | | $ | 0.8 | | | $ | 0.6 | | | $ | 0.5 | | |
| Ratio of Expenses to Average Net Assets* | | | 1.90 | %† | | | 1.54 | % | | | 1.43 | % | | | 1.47 | % | | | 1.49 | % | | | 1.39 | % | |
| Ratio of Net Investment Income to Average Net Assets | | | 0.51 | %† | | | 2.12 | % | | | 1.12 | % | | | 1.62 | % | | | 0.87 | % | | | 0.75 | % | |
| Portfolio Turnover Rate | | | 25 | % | | | 50 | % | | | 57 | % | | | 44 | % | | | 47 | % | | | 29 | % | |
† Data has been annualized.
* The ratio excludes expense offset arrangement.
(a) Computed using average shares outstanding throughout the period.
(b) Amount rounds to less than $0.01 per share.
See accompanying Notes to Financial Statements.
THE OAKMARK FUNDS
85
THE OAKMARK FUNDS DISCLOSURE REGARDING THE BOARD OF TRUSTEES' OCTOBER 2008 APPROVAL OF INVESTMENT ADVISORY CONTRACTS
Each year the Board of Trustees of the Oakmark Funds (the "Board"), including a majority of the independent Trustees, is required by the Investment Company Act of 1940 (the "1940 Act") to determine whether to continue each Fund's investment advisory agreement (each an "Agreement") with the Fund's investment adviser (the "Adviser"). The Board requests and receives from the Adviser a broad range of materials and information that are relevant to the Trustees' consideration of the Agreements, both throughout the year and especially in connection with its annual review of the Agreements. In addition, the Board retains an independent consultant to provide performance and expense information for each Fund and for comparable funds.
The Board's contracts committee (the "Committee") leads the Board in its evaluation of the Agreements. The Committee is comprised entirely of trustees who are not "interested persons" of the Funds as defined in the 1940 Act ("Independent Trustees"), and more than 75% of the Board is comprised of Independent Trustees. During the last year, the Committee and the Board met numerous times to consider the Agreements. At each of those meetings, the Committee and the Board were advised by, and met in executive session with, their experienced independent legal counsel.
In determining whether to continue each Agreement, the Committee and the Board reviewed among other things: (i) the nature, quality and extent of the Adviser's services, (ii) the investment performance of each Fund as well as performance information for comparable funds, (iii) the fees and other expenses paid by each Fund as well as expense information for comparable funds, (iv) the profitability of the Adviser and its affiliates from their relationship with each Fund, (v) whether economies of scale may be realized as each Fund grows and whether fee levels share with Fund investors economies of scale and (vi) other benefits to the Adviser from its relationship with the Fund.
At a meeting held on October 22, 2008, the Board, including all of the Independent Trustees, upon recommendation of the Committee and after the successful completion of negotiations to add additional breakpoints in the schedule of fees for The Oakmark Equity and Income Fund, determined that the continuation of the Agreement for each Fund was in the best interest of the Fund and its shareholders, and approved the continuation of the Agreements through October 31, 2009. Below is a summary of the principal information considered by the Board as well as the Board's conclusions regarding various factors. In their deliberations, the Independent Trustees did not identify any single factor that was paramount or dispositive, and each Independent Trustee may have weighed the information differently.
1. Nature, Extent and Quality of Services
The Board's consideration of the nature, extent and quality of the Adviser's services to the Funds took into account the knowledge gained from the Board's meetings with the Adviser throughout the prior year. In addition, the Board considered: the Adviser's long-term history of care and conscientiousness in the management of the Funds; the consistency of the Adviser's investment approach; the background and experience of the Adviser's investment personnel responsible for managing the Funds; the Adviser's performance as administrator of the Funds, including, among other things, in the areas of brokerage selection, trade execution, compliance and shareholder communications; and frequent favorable recognition of the Adviser and the Funds in the media and in industry publications. The Board also reviewed the Adviser's resources and key personnel involved in providing investment management services to the Funds, including the time that investment personnel devote to each Fund and the investment results produced by the Adviser's in-house research. The Board also noted the significant personal investments that the Adviser's personnel have made in the Funds, which further aligns the interests of the Adviser and its personnel with those of the Funds' shareholders. The Trustees concluded that the nature, extent and quality of the services provided by the Adviser to each Fund were appropriate and consistent with the Fund's Agreement and that each Fund was likely to continue to benefit from services provided under its Agreement with the Adviser.
THE OAKMARK FUNDS
86
2. Investment Performance of the Funds
The Board considered each Fund's investment performance over various time periods, including as compared to information provided by its consultant, Lipper Inc. ("Lipper"), an independent data service provider that was retained by the Board to prepare a study comparing each Fund's performance with that of comparable funds selected by Lipper (the "Performance Universe"). The Board noted that the long-term performance of each Fund that has been in operation for five or more years compared favorably with that Fund's respective Performance Universe, with four of those Funds placing in the top quintile of the Performance Universe for the longest period reported by Lipper. The Board also noted that, for the more recent periods, the performance of a number of the Funds lagged the Performance Universe median.
In addition to comparing each Fund's performance to that of its Performance Universe, the Board also considered each Fund's performance compared to that of its benchmark and other comparative data provided by Lipper, including the Fund's total return and performance relative to risk. The Board also considered that the Adviser has dedicated additional resources to support the portfolio management process of Oakmark Fund. After considering all of the information, the Trustees concluded that the Adviser was delivering performance for each Fund that was consistent with the long-term investment strategies being pursued by that Fund and that each Fund and its shareholders were benefiting from the Adviser's investment management of the Fund.
3. Costs of Services Provided and Profits Realized by the Adviser
Using information provided by Lipper, the Board evaluated each Fund's advisory fee compared to the advisory fee for other mutual funds comparable in size, character and investment strategy (the "Expense Group"), and the Fund's expense ratio compared to that of the Expense Group.
The Board also reviewed the Adviser's advisory fees for its institutional separate account clients and for its subadvised funds (for which the Adviser provides portfolio management services only). The Trustees noted that, although in most instances, the fees paid by those other clients were lower than the rates of fees paid by the Funds, the differences reflected the Adviser's significantly greater level of responsibilities and broader scope of services regarding the Funds, and the Adviser's more extensive regulatory obligations and risks associated with managing the Funds.
The Board also considered the Adviser's costs in serving as the Funds' investment adviser and administrator, including costs associated with technology, infrastructure and compliance necessary to manage the Funds. The Board reviewed the Adviser's methodology for allocating costs among the Adviser's lines of business and among the Funds. The Board also considered information regarding the structure of the Adviser's compensation program for portfolio managers, analysts and certain other employees and the relationship of such compensation to the attraction and retention of quality personnel. Finally, the Board considered the Adviser's profitability analysis, including the manner in which the profitability analysis was generated, as well as a separate Investment Management Profitability Analysis prepared by Lipper. The Board noted the pre-tax profits realized by the Adviser and its affiliates from their relationship with each Fund, as well as th e financial condition of the Adviser.
The Board considered that the total expenses (inclusive of management fees) of five of the Funds, as a percentage of average net assets, were lower than or near the median of those of comparable funds, while the total expenses of Oakmark Fund and Oakmark Global Select Fund were above the median.
After their review of all the matters addressed, including those outlined above, the Trustees concluded that the management fees paid by each Fund to the Adviser were reasonable in light of the services provided.
4. Economies of Scale and Fee Levels Reflecting Those Economies
The Board considered whether each Fund's management fee structure provides for a sharing with shareholders of potential economies of scale that may be realized by the Adviser. The Board reviewed each Fund's Agreement, which includes breakpoints that decrease the management fee rate as the Fund's assets increase. The Board also considered that the Committee had negotiated with the Adviser for additional breakpoints in the Agreement for Oakmark Equity and Income Fund. The Trustees concluded that the
THE OAKMARK FUNDS
87
breakpoints in the fee schedule for each Fund allow shareholders to benefit from potential economies of scale that may be achieved by the Adviser.
5. Other Benefits Derived from the Relationship with the Funds
The Board also considered other benefits that accrue to the Adviser and its affiliates from their relationship with the Funds. The Board noted that an affiliate of the Adviser serves as the Funds' distributor, without compensation, pursuant to a written agreement that the Board evaluates and approves annually.
The Board also considered the Adviser's use of a portion of the commissions paid by the Funds on their portfolio brokerage transactions to obtain research products and services benefiting the Funds and/or other clients of the Adviser and concluded that the Adviser's use of "soft" commission dollars to obtain research products and services was consistent with regulatory requirements.
After full consideration of the above factors, as well as other factors that were instructive in evaluating the Agreements, the Board, including all of the Independent Trustees, concluded that approval of each Fund's agreement was in the best interests of the Fund and its shareholders. On October 22, 2008, the Board continued each Agreement, with amendments to the Agreement for The Oakmark Equity and Income Fund to add additional breakpoints in the fee schedule.
THE OAKMARK FUNDS
88
For a prospectus and more information about The Oakmark Funds, including management fees and expenses and the special risks of investing, please visit oakmark.com or call 1-800-OAKMARK (1-800-625-6275). Please read the prospectus carefully before investing. An investor should consider a fund's investment objectives, risks, and charges and expenses carefully before investing. This and other information about The Oakmark Funds are contained in the Funds' prospectus.
The discussion of the Funds' investments and investment strategy (including current investment themes, the portfolio managers' research and investment process, and portfolio characteristics) represents the Funds' investments and the views of the portfolio managers and Harris Associates L.P., the Funds' investment adviser, at the time of this letter, and are subject to change without notice.
The performance data quoted represents past performance. The performance information for the Funds does not reflect the imposition of a 2% redemption fee on shares of all Funds, other than Oakmark Equity & Income Fund, redeemed within 90 days, in order to deter market timers. If reflected, the fee would reduce the performance quoted. Past performance is no guarantee of future results. The investment return and principal value will fluctuate so that an investor's shares, when redeemed, may be worth more or less than their original cost. Current performance may be lower or higher than the performance data quoted. Average annual total return measures annualized change, while total return measures aggregate change. To obtain current month end performance data, visit oakmark.com.
Current and future portfolio holdings are subject to risk.
Investing in value stocks presents the risk that value stocks may fall out of favor with investors and underperform growth stocks during given periods.
Because Oakmark Select Fund and Oakmark Global Select Fund are non-diversified, the performance of each holding will have a greater impact on each Fund's total return, and may make the Funds' returns more volatile than a more diversified fund.
Oakmark Equity and Income Fund invests in medium- and lower-quality debt securities that have higher yield potential but present greater investment and credit risk than higher-quality securities, which may result in greater share price volatility. An economic downturn could severely disrupt the market in medium or lower grade debt securities and adversely affect the value of outstanding bonds and the ability of the issuers to repay principal and interest.
Investing in foreign securities represents risks which in some way may be greater than in U.S. investments. Those risks include: currency fluctuation; different regulation, accounting standards, trading practices and levels of available information; generally higher transaction costs; and political risks.
The stocks of smaller companies often involve more risk than the stocks of larger companies. Stocks of small companies tend to be more volatile and have a smaller public market than stocks of larger companies. Small companies may have a shorter history of operations than larger companies, may not have as great an ability to raise additional capital and may have a less diversified product line, making them more susceptible to market pressure.
1. Total return includes change in share prices and in each case includes reinvestment of any dividends and capital gain distributions.
2. Portfolio holdings are subject to change without notice and are not intended as recommendations of individual stocks.
3. During the period since inception (8/4/99 – 3/31/09), IPO's contributed an annualized 0.88% to the performance of the Oakmark Global Fund. As the IPO environment changes and the total net assets of the Fund grow, the impact of IPOs on performance is expected to diminish. "IPO" stands for Initial Public Offering, which is the first sale of stock by a company to the public.
4. "Prices of Stocks, Bond Market Valuations, and People's State of Mind," Alexander D. Noyes, The New York Times, April 18, 1932.
5. "Scary Omens," Time Magazine, Vol. 104 No. 13, September 23, 1974.
6. "Who Is Hurting and Who Is Not," Time Magazine, Vol. 104 No. 16, October 14, 1974.
7. "Ford's Plan: (Mostly) Modest Proposals," Time Magazine, Vol. 104 No. 16, October 14, 1974.
THE OAKMARK FUNDS
89
8. "Seeking Relief from a Massive Migraine," Time Magazine, Vol. 104 No. 11, September 9, 1974.
9. Panic: The Story of Modern Financial Insanity, Michael Lewis, W.W. Norton & Co., November 17, 2008.
10. The S&P 500 Index is a broad market-weighted average of U.S. blue-chip companies. This index is unmanaged and investors cannot actually make investments in this index.
11. The Price-Earnings Ratio ("P/E") is the most common measure of the expensiveness of a stock.
12. 2009 consensus forecast for S&P 500 operating earnings taken from Bloomberg.
13. The Dow Jones Industrial Average is an unmanaged index that includes only 30 big companies. This index is unmanaged and investors cannot invest directly in this index.
14. The Lipper Large Cap Value Fund Index is an equally weighted index of the largest 30 funds within the large cap value funds investment objective as defined by Lipper Inc. The index is adjusted for the reinvestment of capital gains and income dividends. This index is unmanaged and investors cannot invest directly in this index.
15. The Lipper Multi-Cap Value Funds Index tracks the results of the 30 largest mutual funds in the Lipper Multi-Cap Value Funds category. This index is unmanaged and investors cannot invest directly in this index.
16. The Lipper Balanced Fund Index measures the performance of the 30 largest U.S. balanced funds tracked by Lipper. This index is unmanaged and investors cannot invest directly in this index.
17. The Barclays Capital U.S. Government/Credit Index measures performance of U.S. dollar denominated U.S. Treasuries, government-related, and investment grade U.S. corporate securities that have a remaining maturity of greater than or equal to 1 year. In addition, the securities have $250 million or more of outstanding face value, and must be fixed rate and non-convertible.
18. The MSCI World Index is a free float-adjusted market capitalization weighted index that is designed to measure the equity market performance of developed markets. The MSCI World Index currently consists of the following 23 developed market country indices: Australia, Austria, Belgium, Canada, Denmark, Finland, France, Germany, Greece, Hong Kong, Ireland, Italy, Japan, Netherlands, New Zealand, Norway, Portugal, Singapore, Spain, Sweden, Switzerland, the United Kingdom, and the United States. This index is unmanaged and investors cannot invest directly in this index.
19. The Lipper Global Fund Index is an unmanaged index of the 30 largest funds, based on total year-end net asset value, in the Global fund category, which consists of funds that invest at least 25% in securities traded outside of the United States. It assumes the reinvestment of dividends and capital gains and does not include any management fees or expenses. This index is unmanaged and investors cannot actually make investments in this index.
20. "World Stock Funds Post 11.5% Decline, Managers Say Turnaround Hinges on U.S.," Sam Mamudi, The Wall Street Journal, Fund Track, March 31, 2009.
21. The MSCI World Index ex U.S. is a free float-adjusted market capitalization weighted index that is designed to measure the equity market performance of developed markets. The MSCI World Index currently consists of the following 22 developed market country indices: Australia, Austria, Belgium, Canada, Denmark, Finland, France, Germany, Greece, Hong Kong, Ireland, Italy, Japan, Netherlands, New Zealand, Norway, Portugal, Singapore, Spain, Sweden, Switzerland, and the United Kingdom. This index is unmanaged and investors cannot invest directly in this index.
22. The MSCI EAFE Index (Europe, Australasia, Far East) is a free float-adjusted market capitalization index that is designed to measure developed market equity performance, excluding the US & Canada. As of June 2006 the MSCI EAFE Index consisted of the following 21 developed market country indices: Australia, Austria, Belgium, Denmark, Finland, France, Germany, Greece, Hong Kong, Ireland, Italy, Japan, the Netherlands, New Zealand, Norway, Portugal, Singapore, Spain, Sweden, Switzerland and the United Kingdom. This index is unmanaged and investors cannot invest directly in this index.
23. The Lipper International Fund Index reflects the net asset value weighted total return of the 30 largest international equity funds. This index is unmanaged and investors cannot invest directly in this index.
24. The MSCI World ex U.S. Small Cap Index is a free float-adjusted market capitalization index that is designed to measure global developed market equity performance, excluding the U.S. The MSCI World ex U.S. Small Cap Index
THE OAKMARK FUNDS
90
currently consists of 22 developed market country indices. The MSCI Small Cap Indices target 40% of the eligible Small Cap universe within each industry group, within each country. MSCI defines the Small Cap universe as all listed securities that have a market capitalization in the range of USD200-1,500 million. This index is unmanaged and investors cannot actually make investments in this index.
25. The Lipper International Small Cap Funds Index measures the performance of the 10 largest international small-cap funds tracked by Lipper. This index is unmanaged and investors cannot invest directly in this index.
OAKMARK, OAKMARK FUNDS, OAKMARK INTERNATIONAL, and OAKMARK and tree design are trademarks owned or registered by Harris Associates L.P. in the U.S. and/or other countries.
THE OAKMARK FUNDS
91
Oakmark Glossary
Book value – A company's common stock equity as it appears on a balance sheet, equal to total assets minus liabilities, preferred stock, and intangible assets such as goodwill. A company's book value often differs substantially from economic value, especially in industries such as media.
Business value/Intrinsic value – The perceived or estimated actual value of a security, as opposed to its current market price or book value. Business value can be evaluated based on what a knowledgeable buyer would pay for a business if the company were sold in its entirety.
Growth investing – Investors who look for companies based on whether the stock of a company is growing earnings and/or revenue faster than the industry as a whole or the overall market. Growth investors generally expect high rates of growth to persist, and the stock, in turn, to deliver returns exceeding the market's. A growth mutual fund is generally one that emphasizes stocks believed to offer above-average growth prospects, with little to no emphasis on the stock's current price.
M & A (Mergers & Acquisitions) – Merger: the combining of two or more entities into one, through a purchase acquisition or a pooling of interests. Acquisition: can also be called a takeover, and is defined as acquiring control of a corporation, called a target, by stock purchase or exchange, either hostile or friendly.
Market capitalization (market cap or cap) – The market price of an entire company on any given day, calculated by multiplying the number of shares outstanding by the price per share.
Momentum investing – Approach to investing based on the belief that stock price trends are likely to continue. Momentum investors tend to buy stocks that have been outperforming the market and to sell those stocks when their relative performance deteriorates. Momentum investors do not consider a company's underlying value or fundamentals in their investment decisions.
Multiple – A ratio used to measure a stock's valuation, usually greater than 1. Sometimes used to mean price/earnings ratio.
P/B or Price-to-Book Ratio – A stock's capitalization divided by its book value. The value is the same whether the calculation is done for the whole company or on a per-share basis.
P/E or Price-to-Earnings Ratio – The most common measure of a stock's valuation. It is equal to a stock's capitalization divided by its after-tax earnings over a 12-month period. The value is the same whether the calculation is done for the whole company or on a per-share basis. Equivalently, the cost an investor in a given stock must pay per dollar of current annual earnings. Also called earnings multiple.
Share repurchase – Program through which a corporation buys back its own shares in the open market, typically an indication that the corporation's management believes the stock price is undervalued.
Value investing – Investors who utilize valuation measures such as business value (including growth rate), price/earnings ratio, price/book ratio, and yield to gauge the attractiveness of a company. Managers who employ a value investment style believe that the true, underlying value of a company is not reflected in its current share price, and, over time, the price has potential to increase as the market recognizes the overall value of the business. Value stocks sell at relatively low prices in relation to their underlying business value, earnings, or book value.
Stocks become undervalued for a variety of reasons, including an overall market decline, or when a specific industry falls into disfavor and investors view all companies in that industry in the same light. Consequently, an individual company's stock price may fall, even though it may be only temporarily affected by the industry's problems and its underlying value has remained unchanged.
"x times earnings" ("12 times earnings") – Another way to express a stock's price-to-earnings (P/E) ratio. A stock with a P/E ratio of 12 sells at 12 times earnings.
THE OAKMARK FUNDS
92
THE OAKMARK FUNDS
Trustees and Officers
Trustees
Gary N. Wilner, M.D.—Chairman
Michael J. Friduss
Thomas H. Hayden
Christine M. Maki
John R. Raitt
Allan J. Reich
Steven S. Rogers
Burton W. Ruder
Peter S. Voss
Officers
John R. Raitt—President and Chief Executive Officer
Robert M. Levy—Executive Vice President
Henry R. Berghoef—Vice President
Chad M. Clark—Vice President
John N. Desmond—Vice President
Richard J. Gorman—Vice President, Chief Compliance
Officer and Assistant Secretary
Kevin G. Grant—Vice President
David G. Herro—Vice President
John J. Kane—Treasurer
Clyde S. McGregor—Vice President
William C. Nygren—Vice President
Vineeta D. Raketich—Vice President
Janet L. Reali—Vice President and Secretary
Kristi L. Rowsell—Vice President and Principal Financial
Officer
Edward A. Studzinski—Vice President
Robert A. Taylor—Vice President
Andrew J. Tedeschi—Assistant Treasurer
Christopher P. Wright—Vice President
Other Information
Investment Adviser
Harris Associates L.P.
Two North LaSalle Street
Chicago, Illinois 60602-3790
Transfer Agent
Boston Financial Data Services, Inc.
Quincy, Massachusetts
Legal Counsel
K&L Gates LLP
Chicago, Illinois
Independent Registered Public
Accounting Firm
Deloitte & Touche LLP
Chicago, Illinois
For More Information
Please call 1-800-OAKMARK
(1-800-625-6275)
or 617-483-3250
Website
oakmark.com
To obtain a prospectus, an application or periodic reports, access our web site at oakmark.com, or call 1-800-OAKMARK (1-800-625-6275) or (617) 483-3250.
The Funds will file its complete schedule of portfolio holdings with the Securities and Exchange Commission (the "SEC") for the first and third quarters of each fiscal year on Form N-Q. The Funds' Forms N-Q are available on the SEC's website at www.sec.gov. The Funds' Forms N-Q may be reviewed and copied at the SEC's Public Reference Room in Washington, DC, and information on the operation of the Public Reference Room may be obtained by calling 1-800-SEC-0330.
A description of the policies and procedures the Funds use to determine how to vote proxies relating to portfolio securities is available without charge, upon request, by calling toll-free 1-800-625-6275; on the Funds' website at oakmark.com; and on the SEC's website at www.sec.gov.
No later than August 31 of each year, information regarding how the Adviser, on behalf of the Funds, voted proxies relating to the Funds' portfolio securities for the twelve months ended the preceding June 30 will be available through a link on the Funds' website at oakmark.com and on the SEC's website at www.sec.gov.
This report is submitted for the general information of the Funds' shareholders. The report is not authorized for distribution to prospective investors in the Funds unless it is accompanied or preceded by the Funds' currently effective prospectus.
No sales charge to the shareholder or to the new investor is made in offering the shares of the Funds, however, a shareholder may incur a 2% redemption fee on an exchange or redemption of shares redeemed within 90 days from any Fund other than Oakmark Equity & Income Fund.

1-800-OAKMARK
oakmark.com
The Oakmark Funds are distributed by Harris Associates Securities L.P., member FINRA. Date of first use: May 2009.
OAKMARK FUND CLASS II
THE VALUE OF A $10,000 INVESTMENT IN OAKMARK FUND FROM ITS
INCEPTION (4/5/01) TO PRESENT (3/31/09) AS COMPARED TO THE
STANDARD & POOR'S 500 INDEX (UNAUDITED)
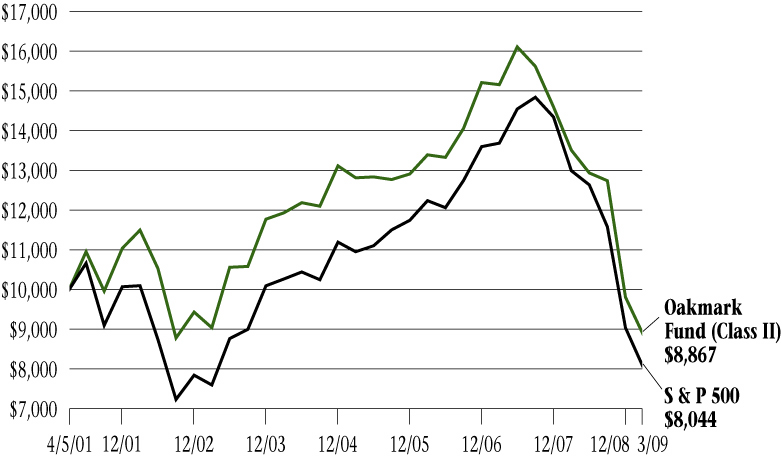
Average Annual Total Returns
(as of 3/31/09)
| (Unaudited) | | 1-year | | 5-year | | Since
Inception
(4/5/01) | |
| Oakmark Fund (Class II) | | | -34.37 | % | | | -5.77 | % | | | -1.50 | % | |
| S&P 500 | | | -38.09 | % | | | -4.76 | % | | | -2.69 | % | |
The graph and table do not reflect the deduction of taxes that a shareholder would pay on fund distributions or the redemption of fund shares.
The expense ratio for Class II shares as of 9/30/08 was 1.47%.
The performance data quoted represents past performance. The above performance information does not reflect the imposition of a 2% redemption fee on shares held for 90 days or less. If reflected, the fee would reduce the performance quoted. Past performance does not guarantee future results. The investment return and principal value will fluctuate so that an investor's shares, when redeemed, may be worth more or less than their original cost. Current performance may be lower or higher than the performance data quoted. Average annual total return measures annualized change, while total return measures aggregate change. To obtain most recent month-end performance data, visit oakmark.com.
Harris Associates Securities L.P., member FINRA, May 2009
OAKMARK SELECT FUND CLASS II
THE VALUE OF A $10,000 INVESTMENT IN OAKMARK SELECT FUND FROM ITS
INCEPTION (12/31/99) TO PRESENT (3/31/09) AS COMPARED TO THE
STANDARD & POOR'S 500 INDEX (UNAUDITED)
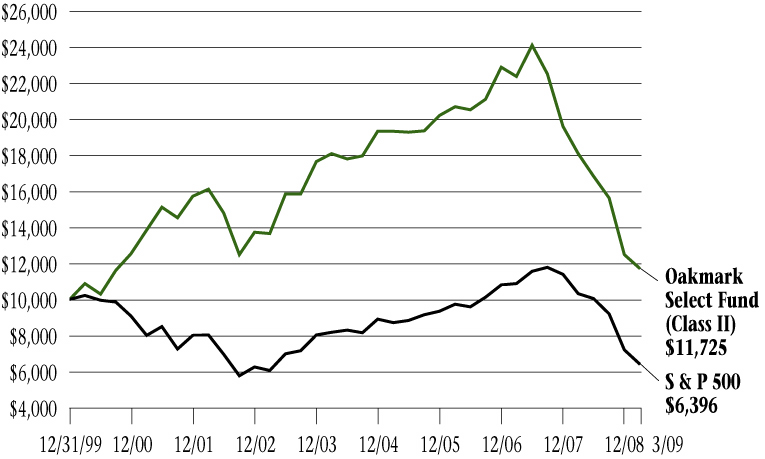
Average Annual Total Returns
(as of 3/31/09)
| (Unaudited) | | 1-year | | 5-year | | Since
Inception
(12/31/99) | |
| Oakmark Select Fund (Class II) | | | -35.26 | % | | | -8.33 | % | | | 1.74 | % | |
| S&P 500 | | | -38.09 | % | | | -4.76 | % | | | -4.72 | % | |
The graph and table do not reflect the deduction of taxes that a shareholder would pay on fund distributions or the redemption of fund shares.
The expense ratio for Class II shares as of 9/30/08 was 1.37%.
The performance data quoted represents past performance. The above performance information does not reflect the imposition of a 2% redemption fee on shares held for 90 days or less. If reflected, the fee would reduce the performance quoted. Past performance does not guarantee future results. The investment return and principal value will fluctuate so that an investor's shares, when redeemed, may be worth more or less than their original cost. Current performance may be lower or higher than the performance data quoted. Average annual total return measures annualized change, while total return measures aggregate change. To obtain most recent month-end performance data, visit oakmark.com.
Harris Associates Securities L.P., member FINRA, May 2009
OAKMARK EQUITY AND INCOME FUND CLASS II
THE VALUE OF A $10,000 INVESTMENT IN OAKMARK EQUITY AND INCOME
FUND FROM ITS INCEPTION (7/12/00) TO PRESENT (3/31/09) AS COMPARED TO
THE LIPPER BALANCED FUND INDEX (UNAUDITED)
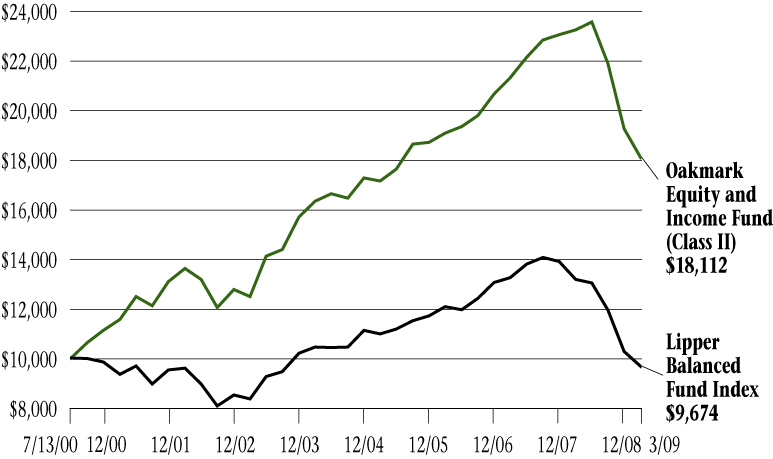
Average Annual Total Returns
(as of 3/31/09)
| (Unaudited) | | 1-year | | 5-year | | Since
Inception
(7/13/00) | |
| Oakmark Equity & Income Fund (Class II) | | | -22.23 | % | | | 2.06 | % | | | 7.05 | % | |
| Lipper Balanced Fund Index | | | -26.60 | % | | | -1.54 | % | | | -0.38 | % | |
The graph and table do not reflect the deduction of taxes that a shareholder would pay on fund distributions or the redemption of fund shares.
The expense ratio for Class II shares as of 9/30/08 was 1.16%.
The performance data quoted represents past performance. Past performance does not guarantee future results. The investment return and principal value will fluctuate so that an investor's shares, when redeemed, may be worth more or less than their original cost. Current performance may be lower or higher than the performance data quoted. Average annual total return measures annualized change, while total return measures aggregate change. To obtain most recent month-end performance data, visit oakmark.com.
Harris Associates Securities L.P., member FINRA, May 2009
OAKMARK GLOBAL FUND CLASS II
THE VALUE OF A $10,000 INVESTMENT IN OAKMARK GLOBAL FUND
FROM ITS INCEPTION (10/10/01) TO PRESENT (3/31/09) AS COMPARED TO THE
MSCI WORLD INDEX (UNAUDITED)
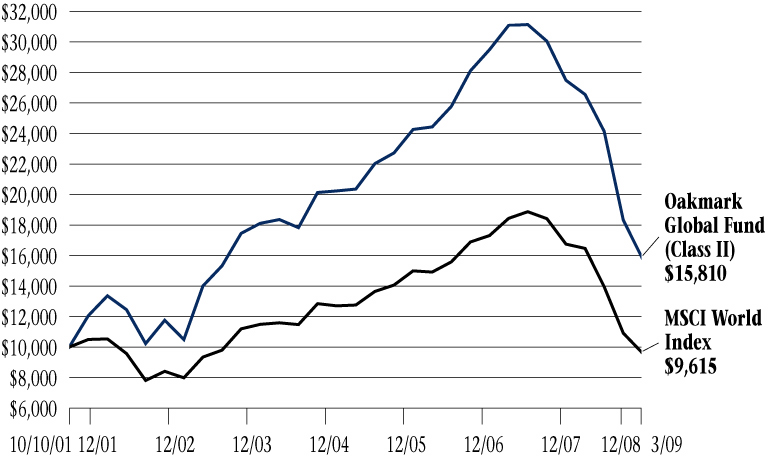
Average Annual Total Returns
(as of 3/31/09)
| (Unaudited) | | 1-year | | 5-year | | Since
Inception
(10/10/01) | |
| Oakmark Global Fund (Class II) | | | -42.47 | % | | | -2.68 | % | | | 6.32 | % | |
| MSCI World | | | -42.58 | % | | | -3.50 | % | | | -0.52 | % | |
The graph and table do not reflect the deduction of taxes that a shareholder would pay on fund distributions or the redemption of fund shares.
The expense ratio for Class II shares as of 9/30/08 was 1.57%.
The performance data quoted represents past performance. The above performance information does not reflect the imposition of a 2% redemption fee on shares held for 90 days or less. If reflected, the fee would reduce the performance quoted. Past performance does not guarantee future results. The investment return and principal value will fluctuate so that an investor's shares, when redeemed, may be worth more or less than their original cost. Current performance may be lower or higher than the performance data quoted. Average annual total return measures annualized change, while total return measures aggregate change. To obtain most recent month-end performance data, visit oakmark.com.
Harris Associates Securities L.P., member FINRA, May 2009
OAKMARK INTERNATIONAL FUND CLASS II
THE VALUE OF A $10,000 INVESTMENT IN OAKMARK INTERNATIONAL FUND
FROM ITS INCEPTION (11/4/99) TO PRESENT (3/31/09) AS COMPARED TO THE
MSCI WORLD EX U.S. INDEX (UNAUDITED)
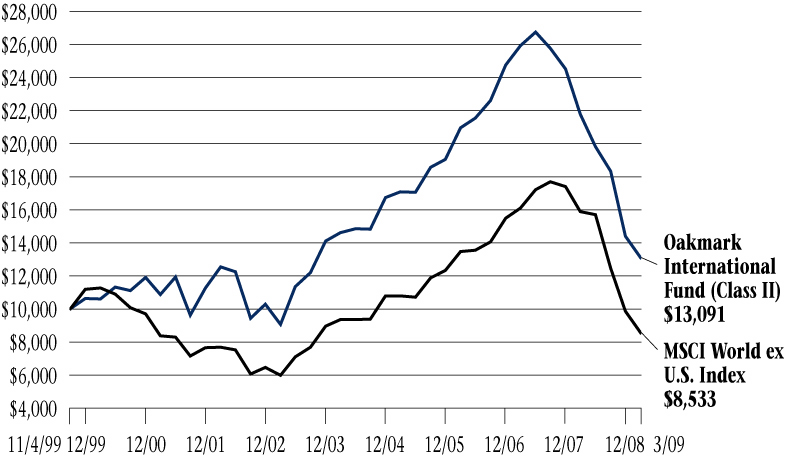
Average Annual Total Returns
(as of 3/31/09)
| (Unaudited) | | 1-year | | 5-year | | Since
Inception
(11/4/99) | |
| Oakmark International Fund (Class II) | | | -40.00 | % | | | -2.15 | % | | | 2.91 | % | |
| MSCI World ex U.S. | | | -46.31 | % | | | -1.74 | % | | | -1.67 | % | |
The graph and table do not reflect the deduction of taxes that a shareholder would pay on fund distributions or the redemption of fund shares.
The expense ratio for Class II shares as of 9/30/08 was 1.52%.
The performance data quoted represents past performance. The above performance information does not reflect the imposition of a 2% redemption fee on shares held for 90 days or less. If reflected, the fee would reduce the performance quoted. Past performance does not guarantee future results. The investment return and principal value will fluctuate so that an investor's shares, when redeemed, may be worth more or less than their original cost. Current performance may be lower or higher than the performance data quoted. Average annual total return measures annualized change, while total return measures aggregate change. To obtain most recent month-end performance data, visit oakmark.com.
Harris Associates Securities L.P., member FINRA, May 2009
OAKMARK INTERNATIONAL
SMALL CAP FUND CLASS II
THE VALUE OF A $10,000 INVESTMENT IN OAKMARK INTERNATIONAL SMALL CAP FUND FROM ITS INCEPTION (1/8/01) TO PRESENT (3/31/09) AS COMPARED TO THE MSCI WORLD EX U.S. SMALL CAP AND THE MSCI WORLD EX U.S. INDEXES (UNAUDITED)†

Average Annual Total Returns
(as of 3/31/09)
| (Unaudited) | | 1-year | | 5-year | | Since
Inception
(1/8/01) | |
| Oakmark International Small Cap Fund (Class II) | | | -48.27 | % | | | -2.98 | % | | | 4.68 | % | |
| MSCI World ex U.S. Small Cap Index | | | -49.40 | % | | | -3.27 | % | | | 2.91 | % | |
| MSCI World ex U.S. Index | | | -46.31 | % | | | -1.74 | % | | | -1.47 | % | |
The graph and table do not reflect the deduction of taxes that a shareholder would pay on fund distributions or the redemption of fund shares.
The expense ratio for Class II shares as of 9/30/08 was 1.54%.
The performance data quoted represents past performance. The above performance information does not reflect the imposition of a 2% redemption fee on shares held for 90 days or less. If reflected, the fee would reduce the performance quoted. Past performance does not guarantee future results. The investment return and principal value will fluctuate so that an investor's shares, when redeemed, may be worth more or less than their original cost. Current performance may be lower or higher than the performance data quoted. Average annual total return measures annualized change, while total return measures aggregate change. To obtain most recent month-end performance data, visit oakmark.com.
† Prior to January 1, 2009, the Fund's primary benchmark was the MSCI World ex U.S. Index, an unmanaged index that includes countries throughout the world, excluding the U.S., in proportion to world stock market capitalization. The Fund changed its primary benchmark because the MSCI World ex U.S. Small Cap Index reached its tenth anniversary on December 31, 2008 and now provides an historical perspective to make a more meaningful comparison given the small cap focus of the Fund.
Harris Associates Securities L.P., member FINRA, May 2009
FUND EXPENSES
A shareholder of each Fund incurs two types of costs: (1) transaction costs, such as redemption fees, and (2) ongoing costs, including investment advisory fees, transfer agent fees, and other fund expenses. The examples below are intended to help shareholders understand the ongoing cost (in dollars) of investing in each Fund and to compare these costs with the ongoing costs of investing in other funds.
Actual Expenses
The following table provides information about actual account values and actual fund expenses for Class II of each Fund. The table shows the expenses a Class II shareholder would have paid on a $1,000 investment in each Fund from October 1, 2008, to March 31, 2009, as well as how much a $1,000 investment would be worth at the close of the period, assuming actual fund returns and expenses. Class II shareholders can estimate expenses incurred for the period by dividing their account value at March 31, 2009, by $1,000 and multiplying the result by the number in the Expenses Paid During Period row as shown below.
Shares of all Funds, other than Oakmark Equity & Income Fund, invested for 90 days or less may be charged a 2% redemption fee. Please consult the Funds' prospectus at oakmark.com for more information.
| | | Oakmark
Fund | | Oakmark
Select Fund | | Oakmark
Equity and
Income Fund | | Oakmark
Global Fund | | Oakmark
International
Fund | | Oakmark
International
Small Cap
Fund | |
| Beginning Account Value | | $ | 1,000.00 | | | $ | 1,000.00 | | | $ | 1,000.00 | | | $ | 1,000.00 | | | $ | 1,000.00 | | | $ | 1,000.00 | | |
| Ending Account Value | | $ | 695.90 | | | $ | 748.90 | | | $ | 826.70 | | | $ | 654.90 | | | $ | 713.60 | | | $ | 636.90 | | |
| Expenses Paid During Period* | | $ | 6.47 | | | $ | 5.58 | | | $ | 5.56 | | | $ | 6.64 | | | $ | 5.13 | | | $ | 7.75 | | |
| Annualized Expense Ratio | | | 1.53 | % | | | 1.28 | % | | | 1.22 | % | | | 1.61 | % | | | 1.20 | % | | | 1.90 | % | |
* Expenses are equal to each Fund's annualized expense ratio for Class II, multiplied by the average account value over the period, multiplied by the number of days in the most recent fiscal half-year divided by 365 (to reflect the one-half year period).
Hypothetical Example for Comparison Purposes
The following table provides information about hypothetical account values and hypothetical expenses for Class II of each Fund based on actual expense ratios and an assumed rate of return of 5% per year before expenses, which are not the Funds' actual returns. The hypothetical account values and expenses may not be used to estimate the actual ending account balances or expenses shareholders paid for the period. Shareholders may use this information to compare the ongoing costs of investing in a Fund and other funds. To do so, compare this 5% hypothetical example with the 5% hypothetical examples that appear in the shareholder reports of the other funds.
Please note that the expenses shown in the table are meant to highlight your ongoing costs only and do not reflect any transaction costs, such as redemption fees. Therefore, the third line of the table is useful in comparing ongoing costs only, and will not help you determine the relative total costs of owning different funds. In addition, if these transaction costs were included, the total costs would have been higher.
| | | Oakmark
Fund | | Oakmark
Select Fund | | Oakmark
Equity and
Income Fund | | Oakmark
Global Fund | | Oakmark
International
Fund | | Oakmark
International
Small Cap
Fund | |
| Beginning Account Value | | $ | 1,000.00 | | | $ | 1,000.00 | | | $ | 1,000.00 | | | $ | 1,000.00 | | | $ | 1,000.00 | | | $ | 1,000.00 | | |
| Ending Account Value | | $ | 1,017.30 | | | $ | 1,018.55 | | | $ | 1,018.85 | | | $ | 1,016.90 | | | $ | 1,018.95 | | | $ | 1,015.46 | | |
| Expenses Paid During Period* | | $ | 7.70 | | | $ | 6.44 | | | $ | 6.14 | | | $ | 8.10 | | | $ | 6.04 | | | $ | 9.55 | | |
| Annualized Expense Ratio | | | 1.53 | % | | | 1.28 | % | | | 1.22 | % | | | 1.61 | % | | | 1.20 | % | | | 1.90 | % | |
* Expenses are equal to each Fund's annualized expense ratio for Class II, multiplied by the average account value over the period, multiplied by the number of days in the most recent fiscal half-year divided by 365 (to reflect the one-half year period).
Item 2. Code of Ethics.
Not required in this filing.
Item 3. Audit Committee Financial Expert.
Not required in this filing.
Item 4. Principal Accountant Fees and Services.
Not required in this filing.
Item 5. Audit Committee of Listed Registrants.
Not required in this filing.
Item 6. Investments.
(a) The Schedule of Investments in securities of unaffiliated issuers is included as part of the semi-annual report to shareholders filed under Item 1 of this Form.
(b) No disclosures are required by this Item 6(b).
Item 7. Disclosure of Proxy Voting Policies and Procedures for Closed-End Management Investment Companies.
Not applicable.
Item 8. Portfolio Managers of Closed-End Management Investment Companies.
Not applicable.
Item 9. Purchases of Equity Securities by Closed-End Management Investment Company and Affiliated Purchasers.
Not applicable.
Item 10. Submission of Matters to a Vote of Security Holders.
During the period covered by this report, no amendments were made to the procedures adopted in fiscal year 2007.
Item 11. Controls and Procedures.
(a) Based on an evaluation of the disclosure controls and procedures (as defined in Rule
30a-3(c) under the Investment Company Act of 1940, the “Disclosure Controls”), the Disclosure Controls are effectively designed to ensure that information required to be disclosed by the Registrant in this report is recorded, processed, summarized and reported within 90 days prior to the filing of this report, including ensuring that information required to be disclosed in this report is accumulated and communicated to the Registrant’s management, including the Registrant’s principal executive officer and principal financial officer, as appropriate to allow timely decisions regarding required disclosure.
(b) There were no changes in the Registrant’s internal controls over financial reporting (as defined in Rule 30a-3(d) under the Investment Company Act of 1940) that occurred during the Registrant’s second fiscal quarter of the time period covered by this report that has materially affected, or is reasonably likely to materially affect, the Registrant’s internal control over financial reporting.
Item 12. Exhibits.
(a) | (1) | Not required in this filing. |
| | |
| (2) | Certifications of John R. Raitt, Principal Executive Officer, and Kristi L. Rowsell, Principal Financial Officer, pursuant to Rule 30a-2(a) under the Investment Company Act of 1940 (17 CFR 270.30a-2(a)), attached hereto as Exhibits (a)(2)(i) and (a)(2)(ii). |
| | |
| (3) | Not applicable. |
| | |
(b) | | Certification of John R. Raitt, Principal Executive Officer and Kristi L. Rowsell, Principal Financial Officer, pursuant to Section 906 of the Sarbanes-Oxley Act of 2002, attached hereto as Exhibit (b). |
SIGNATURES
Pursuant to the requirements of the Securities Exchange Act of 1934 and the Investment Company Act of 1940, the Registrant has duly caused this report to be signed on its behalf by the undersigned, thereunto duly authorized.
Harris Associates Investment Trust
By: | /s/ John R. Raitt | |
| John R. Raitt | |
| Principal Executive Officer | |
Date: | May 15, 2009 | |
Pursuant to the requirements of the Securities Exchange Act of 1934 and the Investment Company Act of 1940, this report has been signed below by the following persons on behalf of the Registrant and in the capacities and on the dates indicated.
| | |
By: | /s/ John R. Raitt | |
| John R. Raitt | |
| Principal Executive Officer | |
Date: | May 15, 2009 | |
| | |
| | |
By: | /s/ Kristi L. Rowsell | |
| Kristi L. Rowsell | |
| Principal Financial Officer | |
Date: | May 15, 2009 | |