UNITED STATES
SECURITIES AND EXCHANGE COMMISSION
Washington, D.C. 20549
FORM N-CSR
CERTIFIED SHAREHOLDER REPORT OF REGISTERED
MANAGEMENT INVESTMENT COMPANIES
Investment Company Act file number | 811-06279 |
|
Harris Associates Investment Trust |
(Exact name of registrant as specified in charter) |
|
Two North La Salle Street, Suite 500
Chicago, Illinois | | 60602-3790 |
(Address of principal executive offices) | | (Zip code) |
|
John R. Raitt Harris Associates L.P. Two North La Salle Street, #500 Chicago, Illinois 60602 | Cameron S. Avery Bell, Boyd & Lloyd LLP Three First National Plaza, #3100 Chicago, Illinois 60602 |
(Name and address of agent for service) |
|
Registrant’s telephone number, including area code: | (312) 621-0600 | |
|
Date of fiscal year end: | 9/30/08 | |
|
Date of reporting period: | 3/31/08 | |
| | | | | | | | |
Item 1. Reports to Shareholders.

SEMI-ANNUAL REPORT
MARCH 31, 2008

Advised by Harris Associates L.P.
THE OAKMARK FUNDS
2008 Semi-Annual Report
| President's Letter | | | 1 | | |
|
| Summary Information | | | 2 | | |
|
| Fund Expenses | | | 4 | | |
|
| Commentary on The Oakmark and Oakmark Select Funds | | | 6 | | |
|
| The Oakmark Fund | |
|
| Letter from the Portfolio Managers | | | 8 | | |
|
| Schedule of Investments | | | 9 | | |
|
| The Oakmark Select Fund | |
|
| Letter from the Portfolio Managers | | | 13 | | |
|
| Schedule of Investments | | | 14 | | |
|
| The Oakmark Equity and Income Fund | |
|
| Letter from the Portfolio Managers | | | 16 | | |
|
| Schedule of Investments | | | 18 | | |
|
| The Oakmark Global Fund | |
|
| Letter from the Portfolio Managers | | | 24 | | |
|
| Global Diversification Chart | | | 26 | | |
|
| Schedule of Investments | | | 27 | | |
|
| The Oakmark Global Select Fund | |
|
| Letter from the Portfolio Managers | | | 31 | | |
|
| Global Diversification Chart | | | 33 | | |
|
| Schedule of Investments | | | 34 | | |
|
| Commentary on The International and International Small Cap Funds | | | 37 | | |
|
| The Oakmark International Fund | |
|
| Letter from the Portfolio Manager | | | 38 | | |
|
| Global Diversification Chart | | | 40 | | |
|
| Schedule of Investments | | | 41 | | |
|
| The Oakmark International Small Cap Fund | |
|
| Letter from the Portfolio Managers | | | 46 | | |
|
| Global Diversification Chart | | | 48 | | |
|
| Schedule of Investments | | | 49 | | |
|
| Financial Statements | |
|
| Statements of Assets and Liabilities | | | 54 | | |
|
| Statements of Operations | | | 56 | | |
|
| Statements of Changes in Net Assets | | | 58 | | |
|
| Notes to Financial Statements | | | 65 | | |
|
| Disclosure Regarding Investment Advisory Contract Approval | | | 82 | | |
|
| Oakmark Philosophy and Process | | | 87 | | |
|
| The Oakmark Glossary | | | 88 | | |
|
| Trustees and Officers | | | 89 | | |
|
FORWARD-LOOKING STATEMENT DISCLOSURE
One of our most important responsibilities as mutual fund managers is to communicate with shareholders in an open and direct manner. Some of our comments in our letters to shareholders are based on current management expectations and are considered "forward-looking statements". Actual future results, however, may prove to be different from our expectations. You can identify forward-looking statements by words such as "estimate", "may", "will", "expect", "believe", "plan" and other similar terms. We cannot promise future returns. Our opinions are a reflection of our best judgment at the time this report is compiled, and we disclaim any obligation to update or alter forward-looking statements as a result of new information, future events, or otherwise.
President's Letter

Dear Fellow Shareholders,
The first quarter proved to be difficult for equity investors. Domestic and international stock markets fell sharply during the quarter. Broader equity market indexes around the world registered declines in the 8-10% range, due to concerns about economic growth and unsettled credit markets. While we are not pleased with recent performance, we still remain intently focused on future prospects for our investments and on helping our clients build long-term wealth.
Credit Market Developments and the Economy
The credit correction that began last spring continued to deepen during the first quarter. What started last year as a reversal in the mortgage market now has expanded to almost every corner of the lending marketplace. Tighter credit has brought a predictable slowing of economic growth, and these abrupt shifts in the markets have created several instances of severe financial stress. Significant setbacks recently hit the markets in rapid succession. Large increases in mortgage foreclosures, major loan write-offs at banks that forced substantial capital infusions, money market liquidity runs, the dramatic failure and rescue of Bear Stearns and the plummeting value of the dollar have all shaken investor confidence.
The sharp contrast between today's market conditions and those of only a year ago is remarkable and instructive. Lenders and equity investors have gone from being confident and aggressive to fearful and tentative. Credit has gone from being plentiful to scarce. Lastly, with the shift in the availability of capital, equity and fixed income markets have become less liquid and more volatile. In fact, equity market volatility reached its highest level in seventy years in the first quarter, with broader U.S. market indexes changing by over 1% on more than half of the quarter's trading days. Stock prices today seem much more a function of a stock's liquidity than the fundamentals of its underlying business and business value.
Maintaining Investment Discipline and Adhering to a Long-Term Plan
At times like this it can be difficult for investors to maintain a proper perspective in making investment decisions. Recent economic events are worrisome, and the sharp market declines are unnerving. Moreover, the constant barrage of negative news and the herd-like behavior of the media make it easy to decide to head for the investment sidelines.
Once again, however, we reiterate our belief that when market conditions are difficult, it is especially important to maintain a consistent investment discipline, removing emotion from the investment decision process, and buying stocks when they are weak and out of favor. While we anticipate that the remainder of 2008 will be challenging for the economy—and for financial firms in particular—past experience has shown us that times like these can play to the strengths of our value philosophy. We believe that the impetuous and often extreme sentiments surrounding the market today can actually create greater investment opportunity. Volatile prices, illiquidity, emotional investors, and broad market declines are all factors that provide us opportunities to execute upon our value investing discipline—and acquire stocks at substantial discounts to underlying business value and at prices that prove to be very attractive over time.
Thank you for your continued investment and confidence in The Oakmark Funds. We welcome your comments and questions. You can reach us via e-mail at ContactOakmark@oakmark.com.
John R. Raitt
President and CEO of The Oakmark Funds
President and CEO of Harris Associates L.P.
March 31, 2008
1
THE OAKMARK FUNDS
Summary Information
Performance for Periods
Ended March 31, 20081 | | The Oakmark
Fund—Class I
(OAKMX) | | The Oakmark
Select Fund—Class I
(OAKLX) | | The Oakmark
Equity and Income
Fund—Class I
(OAKBX) | | The Oakmark
Global Fund—Class I
(OAKGX) | |
| 3 Months* | | | -7.36 | % | | | -7.62 | % | | | 0.97 | % | | | -8.42 | % | |
| 1 Year | | | -10.49 | % | | | -18.87 | % | | | 9.54 | % | | | -6.38 | % | |
Average Annual Total
Return for: | |
| 3 Year | | | 2.13 | % | | | -1.88 | % | | | 11.05 | % | | | 11.17 | % | |
| 5 Year | | | 8.75 | % | | | 6.12 | % | | | 13.62 | % | | | 21.63 | % | |
| 10 Year | | | 3.38 | % | | | 8.11 | % | | | 11.08 | % | | | N/A | | |
| Since inception | | | 13.55%
(8/5/91) | | | | 13.81%
(11/1/96) | | | | 13.17%
(11/1/95) | | | | 14.53%
(8/4/99) | | |
Top Five Equity
Holdings as of
March 31, 20082
Company and % of Total
Net Assets | | | Yum! Brands, Inc. 3.5%
Viacom, Inc.-
Class B 2.7%
H&R Block, Inc. 2.7%
Wal-Mart Stores,
Inc. 2.5%
Capital One
Financial
Corporation 2.5% | | | | Yum! Brands, Inc. 8.7%
H&R Block, Inc. 8.6%
Discovery Holding
Company,
Class A 6.2%
Washington
Mutual, Inc. 6.2%
Viacom, Inc.
Class B 5.0% | | | | XTO Energy, Inc. 5.7%
Nestle SA 3.4%
Apache Corporation 3.2%
CVS Caremark
Corporation 3.1%
Newfield Exploration
Company 2.7% | | | | Neopost SA 4.5%
XTO Energy, Inc. 4.5%
Daiwa Securities
Group Inc. 4.2%
Snap-on
Incorporated 3.8%
Credit Suisse Group 3.8% | | |
Sector
Allocation as of
March 31, 2008
Sector and %
of Market Value | | | Consumer
Discretionary 39.3%
Financials 16.2%
Information
Technology 15.8%
Consumer Staples 14.0%
Health Care 8.7%
Industrials 3.5%
Telecommunication
Services 1.5%
Energy 1.0% | | | | Consumer
Discretionary 57.1%
Financials 19.8%
Information
Technology 18.6%
Health Care 4.5% | | | | U.S. Government
Securities 39.1%
Energy 14.9%
Consumer Staples 13.7%
Consumer
Discretionary 10.0%
Industrials 9.0%
Health Care 5.7%
Foreign Government
Securities 3.8%
Financials 2.5%
Information
Technology 1.2%
Materials 0.1% | | | | Consumer
Discretionary 24.4%
Information
Technology 22.7%
Health Care 17.5%
Financials 16.7%
Energy 7.8%
Industrials 7.3%
Consumer Staples 3.6% | | |
The performance data quoted represents past performance. The above performance information for the Funds does not reflect the imposition of a 2% redemption fee on shares of all Funds, other than The Oakmark Equity & Income Fund, held for 90 days or less to deter market timers. If reflected, the fee would reduce the performance quoted. Past performance does not guarantee future results. The investment return and principal value will fluctuate so that an investor's shares, when redeemed, may be worth more or less than their original cost. Current performance may be lower or higher than the performance data quoted. Average annual total return measures annualized change, while total return measures aggregate change. To obtain current month end performance data, visit oakmark.com.
* Not annualized
THE OAKMARK FUNDS
2
Performance for Periods
Ended March 31, 20081 | | The Oakmark
Global Select
Fund—Class I
(OAKWX) | | The Oakmark
International
Fund—Class I
(OAKIX) | | The Oakmark
International
Small Cap Fund—Class I
(OAKEX) | |
| 3 Months* | | | -10.98 | % | | | -11.03 | % | | | -8.08 | % | |
| 1 Year | | | -15.16 | % | | | -15.63 | % | | | -20.37 | % | |
Average Annual Total
Return for: | |
| 3 Year | | N/A | | | 8.91 | % | | | 9.34 | % | |
| 5 Year | | N/A | | | 19.69 | % | | | 25.29 | % | |
| 10 Year | | N/A | | | 9.16 | % | | | 14.13 | % | |
| Since inception | | -3.41%
(10/2/06) | | | 11.66%
(9/30/92) | | | | 12.44%
(11/1/95) | | |
Top Five Equity
Holdings as of
March 31, 20082
Company and % of Total
Net Assets | | Adecco SA 7.6%
Daiwa Securities
Group Inc. 6.0%
Schroders PLC 5.6%
Societe Television
Francaise 1 5.5%
Credit Suisse Group 5.3% | | | Credit Suisse Group 4.7%
Daiwa Securities
Group Inc. 3.7%
GlaxoSmithKline plc 3.6%
Adecco SA 3.4%
Publicis Groupe 3.4% | | | | Neopost SA 5.1%
MLP AG 4.3%
Orbotech, Ltd. 3.1%
Duerr AG 3.1%
USS Co., Ltd. 2.9% | | |
Sector
Allocation as of
March 31, 2008
Sector and %
of Market Value | | Consumer
Discretionary 37.9%
Financials 25.5%
Information
Technology 14.6%
Health Care 14.0%
Industrials 8.0% | | | Financials 33.2%
Consumer
Discretionary 32.5%
Information
Technology 14.3%
Industrials 9.8%
Health Care 7.2%
Consumer Staples 3.0% | | | | Consumer
Discretionary 29.5%
Industrials 28.6%
Information
Technology 17.0%
Financials 14.9%
Consumer Staples 5.7%
Health Care 2.2%
Materials 2.1% | | |
As of 9/30/07, the expense ratio for Class I shares was 1.01% for The Oakmark Fund, 0.97% for The Oakmark Select Fund, 0.83% for The Oakmark Equity and Income Fund, 1.13% for The Oakmark Global Fund, 1.31% for The Oakmark Global Select Fund, 1.05% for The Oakmark International Fund and 1.34% for The Oakmark International Small Cap Fund.
THE OAKMARK FUNDS
3
FUND EXPENSES
A shareholder of each Fund incurs two types of costs: (1) transaction costs, such as redemption fees, and (2) ongoing costs, including investment advisory fees, transfer agent fees, and other fund expenses. The examples below are intended to help shareholders understand the ongoing cost (in dollars) of investing in each Fund and to compare these costs with the ongoing costs of investing in other funds.
Actual Expenses
The following table provides information about actual account values and actual fund expenses for Class I of each Fund. The table shows the expenses a Class I shareholder would have paid on a $1,000 investment in each Fund from October 1, 2007, to March 31, 2008, as well as how much a $1,000 investment would be worth at the close of the period, assuming actual fund returns and expenses. Class I shareholders can estimate expenses incurred for the period by dividing their account value at March 31, 2008, by $1,000 and multiplying the result by the number in the Expenses Paid During Period row as shown below.
Certain accounts invested for 90 days or less may be charged a 2% redemption fee. Please consult the Funds' prospectus at oakmark.com for more information.
| | | The Oakmark Fund | | The Oakmark Select Fund | | The Oakmark Equity and Income Fund | | The Oakmark Global Fund | | The Oakmark Global Select Fund | | The Oakmark International Fund | | The Oakmark International Small Cap Fund | |
Beginning
Account
Value | | $ | 1,000.00 | | | $ | 1,000.00 | | | $ | 1,000.00 | | | $ | 1,000.00 | | | $ | 1,000.00 | | | $ | 1,000.00 | | | $ | 1,000.00 | | |
Ending
Account
Value | | $ | 867.10 | | | $ | 804.50 | | | $ | 1,020.50 | | | $ | 884.70 | | | $ | 817.00 | | | $ | 847.20 | | | $ | 831.60 | | |
Expenses
Paid
During
Period* | | $ | 5.09 | | | $ | 4.87 | | | $ | 4.14 | | | $ | 5.56 | | | $ | 6.13 | | | $ | 5.17 | | | $ | 6.69 | | |
Annualized
Expense
Ratio | | | 1.09 | % | | | 1.08 | % | | | 0.82 | % | | | 1.18 | % | | | 1.35 | % | | | 1.12 | % | | | 1.46 | % | |
* Expenses are equal to each Fund's annualized expense ratio for Class I, multiplied by the average account value over the period, multiplied by the number of days in the most recent fiscal half-year divided by 366 (to reflect the one-half year period).
THE OAKMARK FUNDS
4
Hypothetical Example for Comparison Purposes
The following table provides information about hypothetical account values and hypothetical expenses for Class I of each Fund based on actual expense ratios and an assumed rate of return of 5% per year before expenses, which are not the Funds' actual returns. The hypothetical account values and expenses may not be used to estimate the actual ending account balances or expenses shareholders paid for the period. Shareholders may use this information to compare the ongoing costs of investing in a Fund and other funds. To do so, compare this 5% hypothetical example with the 5% hypothetical examples that appear in the shareholder reports of the other funds.
Please note that the expenses shown in the table are meant to highlight your ongoing costs only and do not reflect any transaction costs, such as redemption fees. Therefore, the third line of the table is useful in comparing ongoing costs only, and will not help you determine the relative total costs of owning different funds. In addition, if these transaction costs were included, the total costs would have been higher.
| | | The Oakmark Fund | | The Oakmark Select Fund | | The Oakmark Equity and Income Fund | | The Oakmark Global Fund | | The Oakmark Global Select Fund | | The Oakmark International Fund | | The Oakmark International Small Cap Fund | |
Beginning
Account
Value | | $ | 1,000.00 | | | $ | 1,000.00 | | | $ | 1,000.00 | | | $ | 1,000.00 | | | $ | 1,000.00 | | | $ | 1,000.00 | | | $ | 1,000.00 | | |
Ending
Account
Value | | $ | 1,019.55 | | | $ | 1,019.60 | | | $ | 1,020.90 | | | $ | 1,019.10 | | | $ | 1,018.25 | | | $ | 1,019.40 | | | $ | 1,017.70 | | |
Expenses
Paid
During
Period* | | $ | 5.50 | | | $ | 5.45 | | | $ | 4.14 | | | $ | 5.96 | | | $ | 6.81 | | | $ | 5.65 | | | $ | 7.36 | | |
Annualized
Expense
Ratio | | | 1.09 | % | | | 1.08 | % | | | 0.82 | % | | | 1.18 | % | | | 1.35 | % | | | 1.12 | % | | | 1.46 | % | |
* Expenses are equal to each Fund's annualized expense ratio for Class I, multiplied by the average account value over the period, multiplied by the number of days in the most recent fiscal half-year divided by 366 (to reflect the one-half year period).
THE OAKMARK FUNDS
5
THE OAKMARK AND OAKMARK SELECT FUNDS
At Oakmark, we are long-term investors. We attempt to identify growing businesses that are managed to benefit their shareholders. We will purchase stock in those businesses only when priced substantially below our estimate of intrinsic value. After purchase, we patiently wait for the gap between stock price and intrinsic value to close.
 "More than any time in history, mankind faces a crossroads. One path leads to total despair and utter hopelessness. The other, to total extinction. Let us pray we have the wisdom to choose correctly."
Woody Allen
"My Speech to the Graduates"
August 10, 1979, New York Times
I guess Woody Allen wouldn't be an uplifting commencement speaker. But his view of the world, almost thirty years later, seems to be the dominant view in today's commodity and credit markets. If prices in those markets reflect fundamentals, then we are facing a future of materials shortages and unprecedented bankruptcies. If one looks at Main Street instead of Wall Street, the picture, though far from perfect, looks much brighter. Businesses are profitable, unemployment is low and consumer spending remains at reasonable levels. Is it possible that market forecasts could be that far off the mark?
As large shareholders in JP Morgan, we took more than a passing interest in its agreement to purchase Bear Stearns. Bear opened its doors in 1923, survived the Great Depression and grew into one of the world's leading securities firms. Like many other financial services firms, Bear had heavy exposure to home mortgages because those securities historically had very low default rates. Like many of its peers, Bear's 2007 earnings were nearly erased by mortgage losses, and its stock price was cut in half, closing the year at $88. By Thursday, March 13, Bear stock had fallen to $57. Up to that point, you could have substituted quite a few financial company names for "Bear Stearns," and the story would have hardly changed. On Friday, March 14, however, Bear's story sharply diverged from the others. Rumors that Bear had a liquidity problem caused customers to search for safety and move their funds to other firms. The stock price was again cut in ha lf to $30. In that one day, Bear's liquidity problems sharply increased as it needed to sell assets to fund withdrawals. The downward spiral had gone too far to be reversed. On Sunday, JP Morgan agreed to rescue Bear Stearns for $2 per share. A run on the bank had virtually wiped out the stockholders. Did the short sellers profit from being quick to identify a fire raging out of control, or had they spotted a spark and thrown gasoline on it? The answer to that question will be an important one to those calling for more regulation. To the stockholders, whether or not Bear was insolvent on Thursday had become irrelevant. On Sunday it was. Fearful investors had forced the outcome. At least it was one of our companies, JP Morgan, that was positioned to take advantage of an amazing bargain (even at the revised price of $10 per share).
There is a tremendous amount of fear in today's markets. Some portion is due to real economic events. The future for home prices is clearly not the straight upward march it used to be. With average home prices already down 10% from their peak and many homeowners having borrowed as much as their banks would allow, credit losses are certainly increasing. But are loss rates really going to be as high as the bond market is predicting? We normally like to use market prices as estimates for macro variables such as bond default rates, future inflation rates, or energy costs. We assume that those markets incorporate their specific experts' best thinking and that our time would be more productively spent analyzing individual companies. However, the magnitude of gaps we now see between price and value across many markets has made it imprudent to simply use current market prices for our forecasts.
In his New York Times column last month, Ben Stein argued that today's economy is not in such bad shape, but rather, "the new part is the hedge funds and the changing of Wall Street from a financing entity to a market manipulation entity."3 In its cover story "Guess Who's Behind the Commodities Boom,"4 Barron's argued that the increase in mo st commodity prices had less to do with changes in supply and demand than it did with increased investment by institutions who now consider commodities an asset class deserving of a higher portfolio allocation. Barron's states that most long positions are held by speculators and most shorts are held by suppliers. This implies that if commodity market participants were limited to producers and consumers, prices would almost certainly be much lower. A recent article in the Wall Street Journal5 examined the role short sellers play in stock price declines. In July of last year the short sale rules were changed to make it easier to sel l short stocks that were already falling. The article quoted legendary fund manager Marty Whitman, who said "In my 58 years in the market it has never been easier to conduct bear raids." As these articles suggest, there are numerous examples of large pools of new capital whose investment rationale is unrelated to estimates of intrinsic value. In the long run, the resulting higher price volatility should improve the opportunities for investors like us, but in the short run it requires more suspicion of the assumption that any given day's market price reflects long-term fundamental reality.
THE OAKMARK AND OAKMARK SELECT FUNDS
6
As shown by Bear Stearns, the market today is extracting a large toll from forced sellers. Though we always discourage short-term investing, we believe that such advice is especially important now. The gaps between price and value in a fearful market can become very large. If you have to sell stocks by a certain date, the risk is high that you might not get full intrinsic value for those shares. As always, we believe that equity investors, including those in mutual funds, should only invest capital that can remain invested for at least five years. We also don't ever want an Oakmark fund to be a forced seller. That's why we keep a percentage of each of our mutual fund's assets in cash equivalents. Some argue that funds should invest every last dollar to prevent cash from being a drag, but we believe that by holding some cash we not only avoid the cost of forced selling, but we are positioned to benefit when other sellers become desperate.
The financial media is painting a picture that is similar to the Woody Allen quote at the beginning of this report: If the Fed acts aggressively then we are doomed to a future of hyper-inflation and a permanently declining dollar. If the Fed doesn't act, then there is no bottom to the housing market and we are headed toward a depression. We hope they have the wisdom to choose correctly! As you might guess, our view is not so dire, and is in fact quite positive. We find it encouraging that the Fed is thinking outside the box and directly targeting the problem of financial market illiquidity. More importantly, we believe that the dividend yield of the S&P 5006 now equaling the five-year Treasury yield is a significant sign of undervaluation. When the front page news is so negative, there is a high probability that the reality won't be as bad as feared. In 1995, the financial author John Train wrote The Craft of Investing. Five years ago I cited a section from his book that described a typical market bottom. I think it is worth revisiting:
"At a major bottom, current business news is usually terrible and many authorities feel that things are likely to get even worse. There are several spectacular bankruptcies, of international importance. Unemployment is usually up. There is usually some grave unresolved national problem that is bothering everybody. The brokerage business itself is likely to be in the dumps, with many bankruptcies. Big "producers" of the up years have to cut back on their lifestyles. Wall Street's own desperation reinforces the syndrome. When in a market collapse everything finally caves in during a few catastrophic days and weeks, there is an almost audible flushing effect. Stocks are hurled into the abyss, like the cargo of a sinking ship that the crew is desperately trying to save. Value means nothing."7
To me, the Bear Stearns collapse was "an almost audible flushing effect." There is, of course, no guarantee that things won't get worse, but this environment seems to closely parallel Train's description of a bottom. Time to buy?
William C. Nygren, CFA
Portfolio Manager
oakmx@oakmark.com
oaklx@oakmark.com
March 31, 2008
THE OAKMARK AND OAKMARK SELECT FUNDS
7
THE OAKMARK FUND
Report from Bill Nygren and Kevin Grant, Portfolio Managers


THE VALUE OF A $10,000 INVESTMENT IN THE OAKMARK FUND FROM ITS INCEPTION (8/5/91) TO PRESENT (3/31/08) AS COMPARED TO THE STANDARD & POOR'S 500 INDEX6 (UNAUDITED)

| | | | | Average Annual Total Returns
(as of 3/31/08) | |
| (Unaudited) | | Total Return
Last 3 Months* | | 1-year | | 5-year | | 10-year | | Since
Inception
(8/5/91) | |
| Oakmark Fund (Class I) | | | -7.36 | % | | | -10.49 | % | | | 8.75 | % | | | 3.38 | % | | | 13.55 | % | |
| S&P 500 | | | -9.44 | % | | | -5.08 | % | | | 11.32 | % | | | 3.50 | % | | | 9.85 | % | |
| Dow Jones Average8 | | | -7.00 | % | | | 1.58 | % | | | 11.44 | % | | | 5.49 | % | | | 11.32 | % | |
Lipper Large Cap
Value Index9 | | | -9.53 | % | | | -7.99 | % | | | 11.92 | % | | | 3.93 | % | | | 9.60 | % | |
The graph and table do not reflect the deduction of taxes that a shareholder would pay on fund distributions or the redemption of fund shares.
Expense Ratio for Class I shares as of 9/30/07 was 1.01%.
The performance data quoted represents past performance. The above performance information for the Fund does not reflect the imposition of a 2% redemption fee on shares held for 90 days or less to deter market timers. If reflected, the fee would reduce the performance quoted. Past performance does not guarantee future results. The investment return and principal value will fluctuate so that an investor's shares, when redeemed, may be worth more or less than their original cost. Current performance may be lower or higher than the performance data quoted. Average annual total return measures annualized change, while total return measures aggregate change. To obtain most recent month-end performance data, visit oakmark.com.
* Not annualized
The Oakmark Fund declined in value 7% last quarter. The sting of another down quarter was somewhat softened by comparison to the larger 9% loss for the S&P 500. The Fund's top performers were H&R Block and Pulte Homes. We applaud Block's new management for exiting its mortgage business and refocusing the company on its successful tax preparation business. We sold our position in Pulte following its significant price rebound. On the negative side, Sprint declined due to continued defections of its Nextel subscribers, and Schering–Plough declined following release of a study claiming poor efficacy for its Vytorin and Zetia drugs. We continue to hold both stocks because we believe their prices reflect worst case scenarios, which we believe are unlikely.
During the quarter we eliminated six holdings. Baxter, Honeywell, and Raytheon achieved our targets. Abbott performed significantly better than other healthcare companies, and even though it had not quite reached our sell target, we sold it to fund an investment in a related business, which we judged to be much more undervalued. We also sold two stocks that have been disappointments: Masco and Pulte Homes. Both businesses have been hard hit by the collapse in new home construction. Though both traded well below our sell targets, we captured tax-losses and re-invested in financial stocks that we judged to be more undervalued.
We have five new holdings. We bought positions in the technology leader Cisco Systems, pharmaceutical company GlaxoSmithKline, and brokerage firms Merrill Lynch and Morgan Stanley. Our purchase rationale for each is provided on our website, Oakmark.com. We also received shares of Liberty Media Entertainment (LMDIA - $23) when it was spun-off to holders of Liberty Capital. We believed Liberty Capital was undervalued prior to the spin-off, and now we believe that both Liberty Capital and Liberty Entertainment are attractive. Liberty Entertainment's most important asset is its 41% stake in DirecTV (DTV - $25). DirecTV is the leading provider of satellite TV service in the U.S. Each share of Liberty Entertainment effectively owns about seven-eighths of a DirecTV share. Liberty currently trades for just the market value of its DirecTV, before giving any credit to its ownership of Starz/Encore, its regional sports channels, or the net cash on its balance sheet. We believe that combining Liberty Entertainment and DirecTV would be synergistic, and if it happens, Liberty's value would increase and its discount would be eliminated.
William C. Nygren, CFA
Portfolio Manager
oakmx@oakmark.com | | Kevin G. Grant, CFA
Portfolio Manager
oakmx@oakmark.com | |
|
March 31, 2008
THE OAKMARK FUND
8
THE OAKMARK FUND
Schedule of Investments—March 31, 2008 (Unaudited)
| Name | | Shares Held | | Market Value | |
| Common Stocks—94.9% | |
| Apparel Retail—1.9% | |
| Limited Brands | | | 4,628,047 | | | $ | 79,139,603 | | |
| Broadcasting & Cable TV—4.7% | |
| Liberty Media Corp. - Entertainment (a) | | | 3,798,680 | | | $ | 86,002,115 | | |
| Comcast Corporation, Class A | | | 4,000,000 | | | | 75,880,000 | | |
| Discovery Holding Company, Class A (a) | | | 1,540,140 | | | | 32,681,771 | | |
| | | | 194,563,886 | | |
| Catalog Retail—1.4% | |
| Liberty Media Holding Corporation - Interactive, Class A (a) | | | 3,699,850 | | | $ | 59,715,579 | | |
| Computer & Electronics Retail—2.4% | |
| Best Buy Co., Inc. | | | 2,419,400 | | | $ | 100,308,324 | | |
| Department Stores—2.2% | |
| Kohl's Corporation (a) | | | 2,076,900 | | | $ | 89,078,241 | | |
| Home Improvement Retail—2.2% | |
| The Home Depot, Inc. | | | 3,181,500 | | | $ | 88,986,555 | | |
| Household Appliances—2.2% | |
| The Black & Decker Corporation | | | 1,350,000 | | | $ | 89,235,000 | | |
| Housewares & Specialties—2.3% | |
| Fortune Brands, Inc. | | | 1,350,000 | | | $ | 93,825,000 | | |
| Motorcycle Manufacturers—1.8% | |
| Harley-Davidson, Inc. | | | 2,000,000 | | | $ | 75,000,000 | | |
| Movies & Entertainment—7.6% | |
| Viacom, Inc., Class B (a) | | | 2,839,745 | | | $ | 112,510,697 | | |
| The Walt Disney Company | | | 3,300,000 | | | | 103,554,000 | | |
| Time Warner, Inc. | | | 7,147,700 | | | | 100,210,754 | | |
| | | | 316,275,451 | | |
| Restaurants—5.9% | |
| Yum! Brands, Inc. | | | 3,864,000 | | | $ | 143,779,440 | | |
| McDonald's Corporation | | | 1,794,000 | | | | 100,051,380 | | |
| | | | 243,830,820 | | |
| Specialized Consumer Services—2.7% | |
| H&R Block, Inc. | | | 5,358,600 | | | $ | 111,244,536 | | |
THE OAKMARK FUND
9
THE OAKMARK FUND
Schedule of Investments—March 31, 2008 (Unaudited) cont.
| Name | | Shares Held | | Market Value | |
| Common Stocks—94.9% (cont.) | |
| Brewers—4.3% | |
| InBev NV (b) | | | 1,000,000 | | | $ | 87,999,457 | | |
| Anheuser-Busch Companies, Inc. | | | 1,850,000 | | | | 87,782,500 | | |
| | | | 175,781,957 | | |
| Distillers & Vintners—2.0% | |
| Diageo Plc (c) | | | 1,021,000 | | | $ | 83,027,720 | | |
| Hypermarkets & Super Centers—2.5% | |
| Wal-Mart Stores, Inc. | | | 2,000,000 | | | $ | 105,360,000 | | |
| Packaged Foods & Meats—4.5% | |
| General Mills, Inc. | | | 1,556,000 | | | $ | 93,173,280 | | |
| H.J. Heinz Company | | | 1,950,000 | | | | 91,591,500 | | |
| | | | 184,764,780 | | |
| Integrated Oil & Gas—0.9% | |
| ConocoPhillips | | | 500,373 | | | $ | 38,133,426 | | |
| Asset Management & Custody Banks—1.9% | |
| Bank of New York Mellon Corporation | | | 1,839,630 | | | $ | 76,767,760 | | |
| Consumer Finance—2.5% | |
| Capital One Financial Corporation | | | 2,128,000 | | | $ | 104,740,160 | | |
| Diversified Banks—2.1% | |
| U.S. Bancorp | | | 2,650,000 | | | $ | 85,754,000 | | |
| Investment Banking & Brokerage—2.1% | |
| Morgan Stanley | | | 1,100,000 | | | $ | 50,270,000 | | |
| Merrill Lynch & Co., Inc. | | | 900,000 | | | | 36,666,000 | | |
| | | | 86,936,000 | | |
| Life & Health Insurance—0.7% | |
| AFLAC Incorporated | | | 467,000 | | | $ | 30,331,650 | | |
| Multi-Sector Holdings—0.4% | |
| Liberty Media Holding Corporation - Capital, Class A (a) | | | 949,670 | | | $ | 14,947,806 | | |
| Other Diversified Financial Services—4.1% | |
| JPMorgan Chase & Co. | | | 2,400,000 | | | $ | 103,080,000 | | |
| Citigroup, Inc. | | | 3,100,000 | | | | 66,402,000 | | |
| | | | 169,482,000 | | |
| Thrifts & Mortgage Finance—1.6% | |
| Washington Mutual, Inc. | | | 6,637,300 | | | $ | 68,364,190 | | |
THE OAKMARK FUND
10
THE OAKMARK FUND
Schedule of Investments—March 31, 2008 (Unaudited) cont.
| Name | | Shares Held | | Market Value | |
| Common Stocks—94.9% (cont.) | |
| Health Care Equipment—2.8% | |
| Medtronic, Inc. | | | 1,850,000 | | | $ | 89,484,500 | | |
| Covidien Limited | | | 639,500 | | | | 28,297,875 | | |
| | | | 117,782,375 | | |
| Pharmaceuticals—5.4% | |
| GlaxoSmithKline plc (c) | | | 2,000,000 | | | $ | 84,860,000 | | |
| Bristol-Myers Squibb Company | | | 3,600,000 | | | | 76,680,000 | | |
| Schering-Plough Corporation | | | 4,260,200 | | | | 61,389,482 | | |
| | | | 222,929,482 | | |
| Air Freight & Logistics—2.2% | |
| FedEx Corp. | | | 950,000 | | | $ | 88,036,500 | | |
| Industrial Conglomerates—1.2% | |
| Tyco International, Ltd. | | | 1,139,500 | | | $ | 50,194,975 | | |
| Communications Equipment—1.2% | |
| Cisco Systems, Inc. (a) | | | 2,000,000 | | | $ | 48,180,000 | | |
| Computer Hardware—5.2% | |
| Dell Inc. (a) | | | 4,100,000 | | | $ | 81,672,000 | | |
| Hewlett-Packard Company | | | 1,725,000 | | | | 78,763,500 | | |
| Sun Microsystems, Inc. (a) | | | 3,442,500 | | | | 53,462,025 | | |
| | | | 213,897,525 | | |
| Data Processing & Outsourced Services—1.3% | |
| Western Union Company | | | 2,575,000 | | | $ | 54,770,250 | | |
| Electronic Manufacturing Services—0.5% | |
| Tyco Electronics, Ltd. | | | 639,500 | | | $ | 21,947,640 | | |
| Office Electronics—1.9% | |
| Xerox Corporation | | | 5,272,400 | | | $ | 78,927,828 | | |
| Semiconductors—4.9% | |
| Texas Instruments Incorporated | | | 3,700,000 | | | $ | 104,599,000 | | |
| Intel Corporation | | | 4,700,000 | | | | 99,546,000 | | |
| | | | 204,145,000 | | |
| Wireless Telecommunication Services—1.4% | |
| Sprint Nextel Corporation | | | 8,903,000 | | | $ | 59,561,071 | | |
| Total Common Stocks (Cost: $3,429,444,244) | | | | | | | 3,925,967,090 | | |
THE OAKMARK FUND
11
THE OAKMARK FUND
Schedule of Investments—March 31, 2008 (Unaudited) cont.
| Name | | Par Value | | Market Value | |
| Short Term Investment—5.1% | |
| Repurchase Agreement—5.1% | |
Fixed Income Clearing Corp. Repurchase Agreement,
2.25% dated 3/31/2008 due 4/1/2008, repurchase price
$211,564,821, collateralized by Federal Home Loan
Mortgage Corp. Bonds, with rates from 3.550% - 7.000%,
with maturities from 2/12/2010 - 9/15/2011, and with an
aggregate market value plus accrued interest of
$112,382,556, and by a Federal National Mortgage
Association Bond, with a rate of 5.125%, with a maturity
of 4/15/2011, and with an aggregate market value plus
accrued interest of $109,750,000 | | $ | 211,551,599 | | | $ | 211,551,599 | | |
| Total Repurchase Agreement (Cost: $211,551,599) | | | | | 211,551,599 | | |
| Total Investments (Cost: $3,640,995,843)—100.0% | | | | $ | 4,137,518,689 | | |
| Other Assets In Excess of Liabilities—0.0% | | | | | 47,988 | | |
| Total Net Assets—100% | | | | $ | 4,137,566,677 | | |
(a) Non income-producing security.
(b) Represents a foreign domiciled corporation.
(c) Represents an American Depositary Receipt.
See accompanying Notes to Financial Statements.
THE OAKMARK FUND
12
THE OAKMARK SELECT FUND
Report from Bill Nygren and Henry Berghoef, Portfolio Managers


THE VALUE OF A $10,000 INVESTMENT IN THE OAKMARK SELECT FUND FROM ITS INCEPTION (11/1/96) TO PRESENT (3/31/08) AS COMPARED TO THE STANDARD & POOR'S 500 INDEX6 (UNAUDITED)

| | | | | Average Annual Total Returns
(as of 3/31/08) | |
| (Unaudited) | | Total Return
Last 3 Months* | | 1-year | | 5-year | | 10-year | | Since
Inception
(11/1/96) | |
Oakmark Select Fund
(Class I) | | | -7.62 | % | | | -18.87 | % | | | 6.12 | % | | | 8.11 | % | | | 13.81 | % | |
| S&P 500 | | | -9.44 | % | | | -5.08 | % | | | 11.32 | % | | | 3.50 | % | | | 7.43 | % | |
Lipper Multi-Cap
Value Index10 | | | -10.04 | % | | | -11.70 | % | | | 12.03 | % | | | 4.59 | % | | | 7.79 | % | |
The graph and table do not reflect the deduction of taxes that a shareholder would pay on fund distributions or the redemption of fund shares.
Expense Ratio for Class I shares as of 9/30/07 was 0.97%.
The performance data quoted represents past performance. The above performance information for the Fund does not reflect the imposition of a 2% redemption fee on shares held for 90 days or less to deter market timers. If reflected, the fee would reduce the performance quoted. Past performance does not guarantee future results. The investment return and principal value will fluctuate so that an investor's shares, when redeemed, may be worth more or less than their original cost. Current performance may be lower or higher than the performance data quoted. Average annual total return measures annualized change, while total return measures aggregate change. To obtain most recent month-end performance data, visit oakmark.com.
* Not annualized
The Oakmark Select Fund declined 8% last quarter. We take small comfort that the decline was less than the 9% decline in the S&P 500. Our focus is more on absolute returns, and even our relative performance recouped only a fraction of last year's underperformance. Our best performing stocks, both achieving double-digit increases, were H&R Block and Capital One. The market breathed a sigh of relief when Block exited its sub-prime mortgage business without requiring further write-downs. Capital One was a new purchase for the Fund and immediately helped results. The turmoil in the asset-backed debt markets allowed us to purchase it at an attractive price. Our third most positive contributor was another new purchase, Morgan Stanley. Although the stock actually declined fractionally, the quarter-end price was up significantly from both our purchase price and the low it reached following the Bear Stearns take over. On the negative side, Wa shington Mutual was hurt by continued declines in the mortgage market, Discovery Holdings suffered a partial reversal of its strong 2007 performance, and Intel and Dell were part of a weak technology market. For both the positive and negative outliers, we continue to believe these stocks are attractive.
We sold two holdings during the quarter, Dun & Bradstreet and IMS International. D&B was the last of Select's original holdings. Shares we purchased in 1996, adjusted for their Moody's spin-off, had a cost below $10 and were among Select's most successful investments. IMS had been a profitable investment for us. However, operating results were below what we anticipated, and we believed that financial services companies had become more undervalued.
In our last report we noted our belief that many financial stocks had become attractive, but we hadn't added to Washington Mutual because of increased company-specific risk. Our two sales this quarter were non-financial companies, and our two purchases were both financials. We believed, due to unsettled capital markets, that it was prudent to increase the number of financial holdings rather than the weighting of one holding. Because each company has somewhat different exposure, portfolio risk is lowered by spreading our investment across multiple companies. Note that we do not believe that company-specific risk has increased for non-financial businesses, and we are very comfortable with the combined 24% portfolio weighting in our three largest positions, YUM Brands, H&R Block and Discovery Holdings.
William C. Nygren, CFA
Portfolio Manager
oaklx@oakmark.com | | Henry R. Berghoef, CFA
Portfolio Manager
oaklx@oakmark.com | |
|
March 31, 2008
THE OAKMARK SELECT FUND
13
THE OAKMARK SELECT FUND
Schedule of Investments—March 31, 2008 (Unaudited)
| Name | | Shares Held | | Market Value | |
| Common Stocks—94.2% | |
| Apparel Retail—4.6% | |
| Limited Brands | | | 9,180,981 | | | $ | 156,994,775 | | |
| Broadcasting & Cable TV—10.5% | |
| Discovery Holding Company, Class A (a) | | | 10,009,500 | | | $ | 212,401,590 | | |
| Comcast Corporation, Class A | | | 7,600,000 | | | | 144,172,000 | | |
| | | | 356,573,590 | | |
| Catalog Retail—4.9% | |
| Liberty Media Holding Corporation - Interactive, Class A (a) | | | 10,350,000 | | | $ | 167,049,000 | | |
| Home Improvement Retail—3.0% | |
| The Home Depot, Inc. | | | 3,700,000 | | | $ | 103,489,000 | | |
| Movies & Entertainment—9.4% | |
| Viacom, Inc., Class B (a) | | | 4,275,000 | | | $ | 169,375,500 | | |
| Time Warner, Inc. | | | 10,817,000 | | | | 151,654,340 | | |
| | | | 321,029,840 | | |
| Restaurants—12.7% | |
| Yum! Brands, Inc. | | | 7,965,000 | | | $ | 296,377,650 | | |
| McDonald's Corporation | | | 2,428,000 | | | | 135,409,560 | | |
| | | | 431,787,210 | | |
| Specialized Consumer Services—8.7% | |
| H&R Block, Inc. | | | 14,169,600 | | | $ | 294,160,896 | | |
| Consumer Finance—4.0% | |
| Capital One Financial Corporation | | | 2,810,600 | | | $ | 138,337,732 | | |
| Investment Banking & Brokerage—3.9% | |
| Morgan Stanley | | | 2,900,000 | | | $ | 132,530,000 | | |
| Other Diversified Financial Services—4.5% | |
| JPMorgan Chase & Co. | | | 3,544,000 | | | $ | 152,214,800 | | |
| Thrifts & Mortgage Finance—6.2% | |
| Washington Mutual, Inc. | | | 20,417,400 | | | $ | 210,299,220 | | |
| Pharmaceuticals—4.2% | |
| Bristol-Myers Squibb Company | | | 6,760,200 | | | $ | 143,992,260 | | |
| Computer Hardware—4.4% | |
| Dell Inc. (a) | | | 7,513,000 | | | $ | 149,658,960 | | |
THE OAKMARK SELECT FUND
14
THE OAKMARK SELECT FUND
Schedule of Investments—March 31, 2008 (Unaudited) cont.
| Name | | Shares Held/
Par Value | | Market Value | |
| Common Stocks—94.2% (cont.) | |
| Data Processing & Outsourced Services—4.5% | |
| Western Union Company | | | 7,165,400 | | | $ | 152,408,058 | | |
| Office Electronics—4.0% | |
| Xerox Corporation | | | 9,146,400 | | | $ | 136,921,608 | | |
| Semiconductors—4.7% | |
| Intel Corporation | | | 7,447,000 | | | $ | 157,727,460 | | |
| Total Common Stocks (Cost: $2,886,112,825) | | | | | | | 3,205,174,409 | | |
| Short Term Investment—5.4% | |
| Repurchase Agreement—5.4% | |
Fixed Income Clearing Corp. Repurchase Agreement,
2.25% dated 3/31/2008 due 4/1/2008, repurchase price
$183,545,292, collateralized a by Federal Home Loan
Mortgage Corp. Bond, with a rate of 5.500%, with a
maturity of 9/15/2011, and with an aggregate market
value plus accrued interest of $111,912,500, and by a
Federal Home Loan Bank Bond, with a rate of 4.875%,
with a maturity of 10/5/2011, and with an aggregate
market value plus accrued interest of $80,802,075 | | $ | 183,533,821 | | | $ | 183,533,821 | | |
| Total Repurchase Agreement (Cost: $183,533,821) | | | | | | | 183,533,821 | | |
| Total Short Term Investment (Cost: $183,533,821) | | | | | | | 183,533,821 | | |
| Total Investments (Cost: $3,069,646,646)—99.6% | | | | | | $ | 3,388,708,230 | | |
| Other Assets In Excess of Liabilities—0.4% | | | | | | | 14,441,505 | | |
| Total Net Assets—100% | | | | | | $ | 3,403,149,735 | | |
(a) Non income-producing security.
See accompanying Notes to Financial Statements.
THE OAKMARK SELECT FUND
15
THE OAKMARK EQUITY AND INCOME FUND
Report from Clyde S. McGregor and Edward A. Studzinski, Portfolio Managers


THE VALUE OF A $10,000 INVESTMENT IN THE OAKMARK EQUITY AND INCOME FUND FROM ITS INCEPTION (11/1/95) TO PRESENT (3/31/08) AS COMPARED TO THE LIPPER BALANCED FUND INDEX11 (UNAUDITED)

| | | | | Average Annual Total Returns
(as of 3/31/08) | |
| (Unaudited) | | Total Return
Last 3 Months* | | 1-year | | 5-year | | 10-year | | Since
Inception
(11/1/95) | |
Oakmark Equity &
Income Fund (Class I) | | | 0.97 | % | | | 9.54 | % | | | 13.62 | % | | | 11.08 | % | | | 13.17 | % | |
Lipper Balanced
Fund Index | | | -5.29 | % | | | -0.64 | % | | | 9.55 | % | | | 4.76 | % | | | 7.44 | % | |
| S&P 5006 | | | -9.44 | % | | | -5.08 | % | | | 11.32 | % | | | 3.50 | % | | | 8.62 | % | |
Lehman Govt./
Corp. Bond12 | | | 2.53 | % | | | 8.35 | % | | | 4.62 | % | | | 6.12 | % | | | 6.30 | % | |
The graph and table do not reflect the deduction of taxes that a shareholder would pay on fund distributions or the redemption of fund shares.
Expense Ratio for Class I shares as of 9/30/07 was 0.83%.
The performance data quoted represents past performance. Past performance does not guarantee future results. The investment return and principal value will fluctuate so that an investor's shares, when redeemed, may be worth more or less than their original cost. Current performance may be lower or higher than the performance data quoted. Average annual total return measures annualized change, while total return measures aggregate change. To obtain most recent month-end performance data, visit oakmark.com.
* Not annualized
Quarter Review
In a quarter remarkable for its volatility (by one measure the most volatile for equities in seventy years!) the Equity and Income Fund managed to eke out a positive return of 1%. This contrasts to the -5% that Lipper reported for its Balanced Funds Index. For the six-month fiscal year-to-date, the Fund returned 2%, while the Index reported -6%. We are pleased to report returns that best the benchmark in this difficult time period. But more important to us is the generation of positive returns. We know that our co-investors can survive mediocre positive returns, but negative returns—no matter how strong they may be in relative terms—can create actual hardship. This is especially true for the Equity and Income Fund because many investors use the Fund as a complete investment program. As always, we are most happy to report that the compound annualized rate of return since inception for the Fund is 13%.
The lead article in the March 26 edition of the Wall Street Journal was titled "Stocks Tarnished By 'Lost Decade.'"13 E.S. Browning, the author of the piece, described in unpleasant detail the stock market's lack of returns in the new millennium. The article goes further to describe historical market cycles, investing manias, etc. The article's focus on stock market averages is understandable, but misleading from the standpoint of fundamental value investors. We do not invest the Equity and Income Fund in "the market" as represented by indices and averages. Rather, for the equity portion of the Fund, we attempt to take advantage of the stock market's propensity to create a constant flow of undervalued equities even in the most unsavory environment. Since the beginning of 2000, the Equity and Income Fund has produced a compound annualized rate of return of just over 12%. For the past five years, which excludes the Fund's one down year of the decade (2002), the Fund's compound rate of return is 14%. Your managers' job now is to try to figure out how to do the same (or better) in the future.
In terms of equities, our portfolio activity was rather modest in the quarter. We initiated positions in Advanced Medical Optics, Dish Network, Kirby, and Pentair, and we eliminated the holdings of CBS Class A and International Rectifier. Investors often ask us if our investing is thematic. For our new purchases the best theme we can come up with is water: Kirby is an inland waterway barge company and Pentair makes water filters and pumps. Of course, the real theme is value: buying strong, growing businesses that are selling at a discount to their intrinsic value and that have management teams that treat their shareholders as partners. We were more active in the fixed income segment of the portfolio, and we will devote the remainder of the report to that discussion.
THE OAKMARK EQUITY AND INCOME FUND
16
The Airbag
A recent James Altucher column in the Financial Times newspaper was titled "Forget the stock crash—grab an airbag."14 This piece brought back memories of the days when previous Oakmark Funds group Chairman Victor Morgenstern referred to the Equity and Income Fund as "the Oakmark Fund with an airbag." When your writer mentioned Vic's description in an earlier quarterly report, your writer also took pains to explain that the airbag referred to the Fund's fixed income allocation and not the writer/portfolio managers. To this date, few have accepted this explanation.
In any event, the recent quarter helped to illustrate how the fixed income portion of the portfolio can dampen volatility. We began the quarter with roughly 39% of the Fund invested in fixed income investments. U.S. Treasury notes and bonds comprised nearly two-thirds of the 39%. Inflation-indexed Treasury notes were another one-fourth of the fixed income allocation, and government agencies made up nearly all of the rest.
You will note that the Fund did not have any mortgage-backed securities (RMBS, CMO's, CDO's, CDS's, etc.). We have historically avoided investing in the vast array of mortgage-backed securities because of what our industry terms "negative convexity," a term which basically means that in order to win conditions can never change. This idea is simpler than the jargon makes it sound. Think about how mortgages normally work. If a home-owner with a mortgage spies an opportunity to refinance at a desirable (lower) interest rate, he/she will do so and pay off the higher rate mortgage. As an owner of a mortgage-backed security, I would find that my principal was being returned to me prematurely at a time when interest rates had fallen, forcing me to reinvest at a lower rate, which is less desirable to me as a security holder. Conversely, if mortgage interest rates rise, home-owners do not refinance, and I am stuck with an investment that does not yie ld as much as current opportunities.
The past few years have introduced many other reasons for not owning these securities. As is now well known, lending standards declined over the decade. For example, obtaining a mortgage historically required documentation of income and financial assets. As the current decade matured, however, mortgage originators became increasingly lenient. By 2006 low-documentation loans made up almost half of new mortgage originations. Another example of the evolution of lending standards was the emergence of mortgages that did not require down payments. No-down-payment mortgages made up more than one-fourth of 2006 mortgage originations. As long as housing prices continued to climb, a virtuous circle prevailed whereby even mortgages written with the loosest standards could be packaged into securities, taken off the balance sheet of the originator, and sold to investors. Declining home prices, however, broke the circle.
During the housing boom, investment bankers became increasingly creative when constructing new types of securities out of pools of mortgages. Besides negative convexity, your managers have many natural aversions. One such aversion is to complexity. If we cannot explain a potential investment to our clients in a few simple declarative sentences, the investment is probably a bad idea. We also have an aversion to anything that smart salespeople are trying hard to sell to us. Mortgage-backed securities presented us with both complexity and the hard sell, and given our temperament, this made them easy for us to avoid.
While avoiding the pitfalls of mortgage-backed securities, we were active in the fixed income portion of the portfolio. We reestablished a position in Canadian Government debt, which increased overall portfolio yield and allowed us to invest in a country that is benefiting from the current resource boom. We also increased the position in U.S. Treasury inflation-indexed securities, generally called TIPS. We have often written about TIPS, but for the purposes of this report the reader must only understand that TIPS provide returns both through a conventional interest rate coupon and through a periodic adjustment in principal value based on actual inflation. Oddly, all of this activity had no meaningful effect on portfolio duration (a measure of sensitivity to changes in interest rates), while increasing the portfolio's fixed income allocation to 41%.
The bond market's move toward greater risk aversion in the quarter both enhanced the value of our TIPS and created a quandary for your managers. At the nadir for equity investing sentiment in the quarter, the "flight to quality" caused some TIPS prices to reach levels which implied a zero or negative yield—that is, the only investing return would come from the inflation-indexing factor. Yield compression (very low income generation at current bond prices) is probably the single greatest challenge facing the Fund's managers at present. While we will continue to seek out opportunities to enhance portfolio income, we will do so while remembering that the function of the bond portfolio is to be "the airbag" for the portfolio. In closing this section your writer should note that Mr. Altucher's column actually discussed a European company which manufactures airbags.
As always, we thank you for being our shareholders and invite your comments and questions.
Clyde S. McGregor, CFA
Portfolio Manager
oakbx@oakmark.com | | Edward A. Studzinski, CFA
Portfolio Manager
oakbx@oakmark.com | |
|
March 31, 2008
THE OAKMARK EQUITY AND INCOME FUND
17
THE OAKMARK EQUITY AND INCOME FUND
Schedule of Investments—March 31, 2008 (Unaudited)
| Name | | Shares Held | | Market Value | |
| Equity and Equivalents—53.8% | |
| Common Stocks—53.8% | |
| Apparel Retail—1.3% | |
| The TJX Companies, Inc. | | | 2,813,000 | | | $ | 93,025,910 | | |
| Foot Locker, Inc. | | | 7,050,000 | | | | 82,978,500 | | |
| | | | 176,004,410 | | |
| Apparel, Accessories & Luxury Goods—0.1% | |
| Carter's, Inc. (a) | | | 1,033,500 | | | $ | 16,691,025 | | |
| Automobile Manufacturers—0.4% | |
| Thor Industries, Inc. | | | 2,000,000 | | | $ | 59,540,000 | | |
| Broadcasting & Cable TV—3.5% | |
| The E.W. Scripps Company, Class A | | | 6,208,000 | | | $ | 260,798,080 | | |
| DISH Network Corp. (a) | | | 8,002,500 | | | | 229,911,825 | | |
| | | | 490,709,905 | | |
| Home Furnishings—1.2% | |
| Mohawk Industries, Inc. (a) | | | 2,314,100 | | | $ | 165,712,701 | | |
| Movies & Entertainment—1.3% | |
| News Corporation, Class B | | | 9,405,100 | | | $ | 179,073,104 | | |
| Publishing—1.6% | |
| The Washington Post Company, Class B | | | 315,200 | | | $ | 208,504,800 | | |
| Idearc, Inc. | | | 5,200,000 | | | | 18,928,000 | | |
| Primedia, Inc. | | | 572,300 | | | | 4,206,405 | | |
| | | | 231,639,205 | | |
| Brewers—1.4% | |
| InBev NV (b) | | | 2,279,000 | | | $ | 200,550,762 | | |
| Distillers & Vintners—2.3% | |
| Diageo Plc (c) | | | 3,977,000 | | | $ | 323,409,640 | | |
| Drug Retail—3.1% | |
| CVS Caremark Corporation | | | 10,670,000 | | | $ | 432,241,700 | | |
| Packaged Foods & Meats—3.4% | |
| Nestle SA (c) (d) | | | 3,783,000 | | | $ | 472,587,492 | | |
| Personal Products—1.6% | |
| Avon Products, Inc. | | | 5,548,500 | | | $ | 219,387,690 | | |
| Tobacco—1.1% | |
| UST, Inc. | | | 2,969,625 | | | $ | 161,903,955 | | |
THE OAKMARK EQUITY AND INCOME FUND
18
THE OAKMARK EQUITY AND INCOME FUND
Schedule of Investments—March 31, 2008 (Unaudited) cont.
| Name | | Shares Held | | Market Value | |
| Equity and Equivalents—53.8% (cont.) | |
| Oil & Gas Exploration & Production—14.1% | |
| XTO Energy, Inc. | | | 12,805,572 | | | $ | 792,152,684 | | |
| Apache Corporation | | | 3,734,500 | | | | 451,202,290 | | |
| Newfield Exploration Co. (a) (e) | | | 7,203,000 | | | | 380,678,550 | | |
| EnCana Corp. (b) | | | 4,500,000 | | | | 340,875,000 | | |
| | | | 1,964,908,524 | | |
| Property & Casualty Insurance—1.6% | |
| SAFECO Corporation | | | 3,880,000 | | | $ | 170,254,400 | | |
| First American Corporation | | | 1,406,500 | | | | 47,736,610 | | |
| | | | 217,991,010 | | |
| Reinsurance—0.8% | |
| PartnerRe, Ltd. (b) | | | 1,500,000 | | | $ | 114,450,000 | | |
| Health Care Distributors—0.2% | |
| Advanced Medical Optics, Inc. (a) | | | 1,310,090 | | | $ | 26,594,827 | | |
| Health Care Equipment—3.8% | |
| Medtronic, Inc. | | | 6,693,000 | | | $ | 323,740,410 | | |
| Hospira, Inc. (a) | | | 4,850,000 | | | | 207,434,500 | | |
| | | | 531,174,910 | | |
| Health Care Services—0.8% | |
| Express Scripts, Inc. (a) | | | 1,800,000 | | | $ | 115,776,000 | | |
| Life Sciences Tools & Services—0.6% | |
| Varian, Inc. (a) (e) | | | 1,459,400 | | | $ | 84,528,448 | | |
| Aerospace & Defense—5.1% | |
| General Dynamics Corporation | | | 4,559,000 | | | $ | 380,083,830 | | |
| Raytheon Company | | | 3,200,000 | | | | 206,752,000 | | |
| Alliant Techsystems, Inc. (a) | | | 1,285,200 | | | | 133,056,756 | | |
| | | | 719,892,586 | | |
| Industrial Conglomerates—1.1% | |
| Walter Industries, Inc. | | | 2,425,700 | | | $ | 151,921,591 | | |
| Industrial Machinery—2.2% | |
| Ingersoll-Rand Co., Class A | | | 5,111,478 | | | $ | 227,869,689 | | |
| Mueller Water Products, Inc., Class B (e) | | | 6,000,000 | | | | 47,280,000 | | |
| Pentair, Inc. | | | 1,058,142 | | | | 33,754,730 | | |
| | | | 308,904,419 | | |
| Marine—0.1% | |
| Kirby Corporation (a) | | | 150,000 | | | $ | 8,550,000 | | |
THE OAKMARK EQUITY AND INCOME FUND
19
THE OAKMARK EQUITY AND INCOME FUND
Schedule of Investments—March 31, 2008 (Unaudited) cont.
| Name | | Shares Held/
Par Value | | Market Value | |
| Equity and Equivalents—53.8% (cont.) | |
| Application Software—0.2% | |
| Mentor Graphics Corporation (a) | | | 3,189,718 | | | $ | 28,165,210 | | |
| Communications Equipment—0.7% | |
| EchoStar Corp. (a) | | | 3,158,557 | | | $ | 93,303,774 | | |
| Computer Hardware—0.2% | |
| Teradata Corporation (a) | | | 1,557,600 | | | $ | 34,360,656 | | |
| Total Common Stocks (Cost: $5,497,996,430) | | | | | | | 7,529,973,544 | | |
| Total Equity and Equivalents (Cost: $5,497,996,430) | | | | | | | 7,529,973,544 | | |
| Fixed Income—40.5% | |
| Corporate Bonds—0.1% | |
| Paper Packaging—0.1% | |
| Sealed Air Corporation, 144A, 5.625%, due 7/15/2013 (f) | | $ | 19,400,000 | | | $ | 20,281,866 | | |
| Total Corporate Bonds (Cost: $19,552,362) | | | | | | | 20,281,866 | | |
| Government and Agency Securities—40.4% | |
| Canadian Government Bonds—3.0% | |
| Canadian Government, 3.75%, due 6/1/2012 | | CAD | 250,000,000 | | | $ | 251,546,593 | | |
| Canadian Government, 4.25%, due 9/1/2008 | | CAD | 125,000,000 | | | | 122,661,844 | | |
| Canadian Government, 4.25%, due 9/1/2009 | | CAD | 50,000,000 | | | | 49,796,385 | | |
| | | | 424,004,822 | | |
| France Government Bonds—0.5% | |
France Government, 3.00%, due 7/25/2012,
Inflation Indexed | | EUR | 44,099,692 | | | $ | 74,433,238 | | |
| U.S. Government Agencies—4.1% | |
| Federal Farm Credit Bank, 2.489%, due 2/22/2012 (g) | | | 97,000,000 | | | $ | 96,727,236 | | |
| Tennessee Valley Authority, 6.79%, due 5/23/2012 | | | 58,730,000 | | | | 66,552,073 | | |
| Federal Farm Credit Bank, 2.25%, due 7/1/2010 | | | 50,000,000 | | | | 49,880,500 | | |
Federal National Mortgage Association, 5.00%,
due 10/15/2010 | | | 48,500,000 | | | | 49,176,575 | | |
Federal National Mortgage Association, 5.30%,
due 8/6/2009 | | | 48,500,000 | | | | 48,947,994 | | |
| Federal Home Loan Bank, 4.75%, due 12/12/2014 | | | 25,000,000 | | | | 26,583,925 | | |
| Federal Home Loan Bank, 3.50%, due 11/3/2009 | | | 25,000,000 | | | | 25,475,400 | | |
| Federal Home Loan Bank, 4.50%, due 6/9/2010 | | | 24,250,000 | | | | 25,364,675 | | |
Federal Home Loan Mortgage Corp., 5.05%,
due 10/15/2010 | | | 24,250,000 | | | | 24,593,428 | | |
THE OAKMARK EQUITY AND INCOME FUND
20
THE OAKMARK EQUITY AND INCOME FUND
Schedule of Investments—March 31, 2008 (Unaudited) cont.
| Name | | Par Value | | Market Value | |
| Fixed Income—40.5% (cont.) | |
| U.S. Government Agencies—4.1% (cont.) | |
| Federal Farm Credit Bank, 4.92%, due 1/11/2010 | | $ | 19,400,000 | | | $ | 20,299,656 | | |
| Federal Home Loan Bank, 4.50%, due 5/12/2010 | | | 14,550,000 | | | | 15,205,492 | | |
| Federal National Mortgage Association, 5.75%, due 6/9/2011 | | | 14,140,000 | | | | 14,220,018 | | |
| Federal Farm Credit Bank, 5.15%, due 7/20/2009 | | | 10,216,000 | | | | 10,594,779 | | |
| Federal Farm Credit Bank, 5.25%, due 7/16/2010 | | | 9,700,000 | | | | 10,317,715 | | |
| Federal Home Loan Bank, 4.54%, due 7/6/2010 | | | 9,700,000 | | | | 10,163,088 | | |
| Tennessee Valley Authority, 5.625%, due 1/18/2011 | | | 8,721,000 | | | | 9,410,430 | | |
| Federal Farm Credit Bank, 5.28%, due 8/16/2013 | | | 7,500,000 | | | | 8,182,043 | | |
| Federal Farm Credit Bank, 4.85%, due 12/16/2009 | | | 6,305,000 | | | | 6,570,794 | | |
| Federal Farm Credit Bank, 5.125%, due 6/6/2011 | | | 5,435,000 | | | | 5,818,787 | | |
| Federal Home Loan Bank, 5.25%, due 9/12/2014 | | | 5,000,000 | | | | 5,460,125 | | |
| Federal Farm Credit Bank, 5.10%, due 8/9/2011 | | | 4,850,000 | | | | 5,203,812 | | |
| Federal Farm Credit Bank, 4.75%, due 5/7/2010 | | | 4,850,000 | | | | 5,092,141 | | |
| Federal Home Loan Bank, 4.75%, due 12/11/2009 | | | 4,850,000 | | | | 5,049,675 | | |
| Federal Farm Credit Bank, 4.90%, due 9/2/2009 | | | 4,850,000 | | | | 5,029,916 | | |
| Federal Farm Credit Bank, 4.125%, due 7/17/2009 | | | 4,850,000 | | | | 4,965,580 | | |
| Federal Farm Credit Bank, 2.534%, due 7/29/2009 (g) | | | 4,850,000 | | | | 4,848,118 | | |
| Federal Farm Credit Bank, 4.85%, due 3/9/2011 | | | 4,322,000 | | | | 4,578,831 | | |
| Federal Farm Credit Bank, 5.05%, due 5/25/2011 | | | 3,880,000 | | | | 4,143,157 | | |
| Federal Farm Credit Bank, 4.50%, due 8/8/2011 | | | 2,910,000 | | | | 3,043,537 | | |
| Federal Farm Credit Bank, 4.82%, due 10/12/2012 | | | 2,425,000 | | | | 2,590,967 | | |
| | | | 574,090,467 | | |
| U.S. Government Bonds—4.1% | |
U.S. Treasury Bond, 2.375%, due 4/15/2011,
Inflation Indexed | | $ | 531,640,000 | | | $ | 571,180,725 | | |
| U.S. Government Notes—28.7% | |
United States Treasury Notes, 0.875%, due 4/15/2010,
Inflation Indexed | | $ | 556,508,691 | | | $ | 569,508,178 | | |
United States Treasury Notes, 2.00%, due 4/15/2012,
Inflation Indexed | | | 519,551,982 | | | | 559,370,965 | | |
| United States Treasury Notes, 4.875%, due 2/15/2012 | | | 485,000,000 | | | | 534,977,795 | | |
| United States Treasury Notes, 5.125%, due 6/30/2011 | | | 485,000,000 | | | | 533,992,760 | | |
| United States Treasury Notes, 4.875%, due 5/15/2009 | | | 477,500,000 | | | | 494,958,355 | | |
| United States Treasury Notes, 5.125%, due 5/15/2016 | | | 250,000,000 | | | | 284,804,750 | | |
| United States Treasury Notes, 5.00%, due 8/15/2011 | | | 242,500,000 | | | | 266,731,085 | | |
| United States Treasury Notes, 4.75%, due 3/31/2011 | | | 242,500,000 | | | | 263,112,500 | | |
| United States Treasury Notes, 4.00%, due 4/15/2010 | | | 242,500,000 | | | | 253,980,920 | | |
| United States Treasury Notes, 4.875%, due 8/15/2009 | | | 242,500,000 | | | | 253,374,670 | | |
| | | | 4,014,811,978 | | |
THE OAKMARK EQUITY AND INCOME FUND
21
THE OAKMARK EQUITY AND INCOME FUND
Schedule of Investments—March 31, 2008 (Unaudited) cont.
| Name | | Par Value | | Market Value | |
| Fixed Income—40.5% (cont.) | |
| U.S. Government Notes—28.7% (cont.) | |
Total Government and Agency Securities
(Cost: $5,359,715,540) | | | | | | $ | 5,658,521,230 | | |
| Total Fixed Income (Cost: $5,379,267,902) | | | | | | | 5,678,803,096 | | |
| Short Term Investments—5.1% | |
| U.S. Government Agencies—1.2% | |
Federal National Mortgage Association, 4.12%,
due 4/11/2008 | | $ | 100,000,000 | | | $ | 99,885,555 | | |
| Federal Home Loan Bank, 2.93% - 3.00%, due 3/4/2009 | | | 48,845,000 | | | | 48,845,000 | | |
Federal Agricultural Mortgage Corp., 0.00%,
due 4/22/2008 (h) | | | 10,000,000 | | | | 9,986,350 | | |
| Federal Home Loan Mortgage Corp., 3.56%, due 4/25/2008 | | | 5,000,000 | | | | 5,003,307 | | |
| Federal Home Loan Bank, 0.00%, due 4/18/2008 (h) | | | 5,000,000 | | | | 4,988,125 | | |
| Total U.S. Government Agencies (Cost: $168,708,337) | | | | | | | 168,708,337 | | |
| Repurchase Agreement—3.9% | |
Fixed Income Clearing Corp. Repurchase Agreement,
2.25% dated 3/31/2008 due 4/1/2008, repurchase price
$542,703,747, collateralized by a Federal Home Loan
Bank Bond, with a rate of 4.400%, with a maturity of
5/5/2008, and with an aggregate market value plus
accrued interest of $86,340,600, and by Federal Home
Loan Mortgage Corp. Bonds, with rates of
3.550% - 6.625%, with maturities from
9/15/2009 - 6/27/2016, and with an aggregate market
value plus accrued interest of $202,142,219, and by
Federal National Mortgage Association Bonds, with
rates of 2.750% - 6.375%, with maturities from
6/30/2008 - 1/22/2018, and with an aggregate market
value plus accrued interest of $281,329,994 | | $ | 542,669,830 | | | $ | 542,669,830 | | |
| Total Repurchase Agreement (Cost: $542,669,830) | | | | | | | 542,669,830 | | |
| Total Short Term Investments (Cost: $711,378,167) | | | | | | | 711,378,167 | | |
| Total Investments (Cost: $11,588,642,499)—99.4% | | | | | | $ | 13,920,154,807 | | |
| Other Assets In Excess of Liabilities—0.6% | | | | | | | 81,830,910 | | |
| Total Net Assets—100% | | | | | | $ | 14,001,985,717 | | |
THE OAKMARK EQUITY AND INCOME FUND
22
THE OAKMARK EQUITY AND INCOME FUND
Schedule of Investments—March 31, 2008 (Unaudited) cont.
(a) Non income-producing security.
(b) Represents a foreign domiciled corporation.
(c) Represents an American Depositary Receipt.
(d) Market value is determined in accordance with procedures established in good faith by the Board of Trustees.
(e) See footnote number five in the Notes to the Financial Statements regarding investments in affiliated issuers.
(f) Security exempt from registration under Rule 144A of the Securities Act of 1933. These securities may be resold in transactions exempt from registration, normally to qualified institutional buyers.
(g) Floating Rate Note. Rate shown is as of March 31, 2008.
(h) Zero Coupon Bond.
Key to abbreviations:
CAD: Canadian Dollar
EUR: Euro Dollar
See accompanying Notes to Financial Statements.
THE OAKMARK EQUITY AND INCOME FUND
23
THE OAKMARK GLOBAL FUND
Report from Clyde S. McGregor and Robert A. Taylor, Portfolio Managers


THE VALUE OF A $10,000 INVESTMENT IN THE OAKMARK GLOBAL FUND FROM ITS INCEPTION (8/4/99) TO PRESENT (3/31/08) AS COMPARED TO THE MSCI WORLD INDEX15 (UNAUDITED)

| | | | | Average Annual Total Returns
(as of 3/31/08) | |
| (Unaudited) | | Total Return
Last 3 Months* | | 1-year | | 5-year | | Since
Inception
(8/4/99) | |
| Oakmark Global Fund (Class I) | | | -8.42 | % | | | -6.38 | % | | | 21.63 | % | | | 14.53 | % | |
| MSCI World | | | -9.06 | % | | | -3.25 | % | | | 15.96 | % | | | 3.48 | % | |
| Lipper Global Fund Index16 | | | -8.45 | % | | | -2.43 | % | | | 16.65 | % | | | 5.24 | % | |
The graph and table do not reflect the deduction of taxes that a shareholder would pay on fund distributions or the redemption of fund shares.
Expense Ratio for Class I shares as of 9/30/07 was 1.13%.
The performance data quoted represents past performance. The above performance information for the Fund does not reflect the imposition of a 2% redemption fee on shares held for 90 days or less to deter market timers. If reflected, the fee would reduce the performance quoted. Past performance does not guarantee future results. The investment return and principal value will fluctuate so that an investor's shares, when redeemed, may be worth more or less than their original cost. Current performance may be lower or higher than the performance data quoted. Average annual total return measures annualized change, while total return measures aggregate change. To obtain most recent month-end performance data, visit oakmark.com.
* Not annualized
Quarter Review
The Oakmark Global Fund registered a decline of 8% for the quarter ended March 31. The MSCI World Index, the benchmark for global funds, lost 9% for the quarter, and the Lipper Global Fund Index, which measures the outcomes of mutual funds similar to Oakmark Global, reported an 8% drop. We are not "benchmark investors," so we derive little satisfaction from returns that are competitive with indices that are probably at best an obscure abstraction to many of our shareholder/partners. Companies with declining stocks varied from Swiss financials to Japanese semiconductor manufacturers to U.S. media concerns. Countries where the Fund enjoyed strong relative performance included the U.S., South Korea, and France, while Switzerland, Japan, and the United Kingdom produced the worst relative outcomes. For the 2008 fiscal year-to-date, returns are also negative with the Fund reporting a drop of 12%, while the MSCI World Index declined 11% and the Lip per Global Fund Index declined 10%.
"Stocks Tarnished by 'Lost Decade' "proclaimed the headline of a March 26 Wall Street Journal article.13 The article, written by E.S. Browning, described in harrowing detail the minimal returns stocks had managed over the past ten years. While written from the perspective of a U.S. investor focused on U.S. stocks, the story is much the same for internationally diversified investors. Beginning January 1, 2000, the MSCI World Index, our usual standard of comparison, has returned a mere 2% per year. We are pleased to be able to report that the Global Fund, despite the recent poor quarter, has returned more than 15% annualized over that same 8.2 5 year period. Expressed in dollar terms, a dollar invested in the Fund as of January 1, 2000, would now be worth $3.24.
All Financials Are Not Created Equal
JPMorgan Chase, helped by emergency funding from the Federal Reserve Bank, is acquiring Bear Stearns. Even after the eye-popping $2/share bid was increased to $10/share, the total amount paid is little more than the value of Bear Stearns's Madison Avenue headquarters. Given this property value, along with a solid prime brokerage business that earned over $500 million in operating profits in 2007, why was Bear Stearns sold for such a cheap price? The answer is liquidity.
While there is no doubt Bear Stearns had troubled assets on its books, the real reason the company needed to be saved was due to a traditional bank run. Hedge fund clients no longer wanted to do prime brokerage business with Bear Stearns, and lenders no longer wanted to extend credit to
THE OAKMARK GLOBAL FUND
24
such a leveraged firm. This net impact resulted in Bear Stearns losing $17 billion in liquidity in a mere two days. Without JPMorgan Chase and the Fed, bankruptcy was highly probable.
Since UBS was the Fund's largest detractor and is, like Bear Stearns, an investment bank, it seemed appropriate to highlight the reasons why UBS is not facing the same issues that affected Bear Stearns:
1. Bear Stearns is heavily involved in investment banking activities, which include prime brokerage, proprietary trading and underwriting—all of which require short-term funding and leverage. These activities comprise 85% of Bear Stearns's revenues, compared to less than 50% of UBS's revenues.
2. Bear Stearns makes very little money from its private banking/asset management franchise. These businesses generate less than 5% of total profits at Bear Stearns compared to over 50% of the profits at UBS. Private banking and asset management businesses require very little capital and generate strong, stable cashflows. These cashflows provide UBS with steady income that it can use for liquidity needs at the investment bank.
3. The Swiss banking regulator is very conservative, requiring banks to maintain some of the highest capital and liquidity ratios in the world.
Investment banks have been negatively affected by the mortgage bubble in the U.S., and the subsequent liquidity crisis has hurt all financial securities. Despite this, the private banking franchise at UBS has yet to be materially harmed. We know this because UBS's private banking continues to attract net inflows. Although we overestimated the value of UBS's investment bank, our assessment of the private bank remains unchanged. Private banking is an excellent business due to its sticky asset base, steady growth and limited capital needs. We are now buying UBS for just the value of the private bank while getting the investment bank, asset management business and Swiss commercial bank for less than zero. Because of this, we continue to hold and add to this position.
Astute followers of our holdings will notice the weight in UBS has decreased since December 31, 2007, while the weight in Credit Suisse has increased. This trade was done to capture the short-term losses incurred in our UBS position while maintaining our exposure to the attractive private banking business. This tax trade is similar to the one done in the Oakmark Global Select portfolio last quarter. This is in line with our strategy to maximize the after-tax returns for our shareholders.
We were active in the quarter, taking advantage of worldwide volatility to improve and strengthen the portfolio. As always, we strive to orient the portfolio to our highest return opportunities. We added three new names and eliminated nine, mostly smaller holdings. The resulting portfolio has 39 equity names with a 43% U.S. allocation. The international allocation is split between Europe (40%), Canada (3%), and Asia (14%). The portfolio remains diversified across market capitalizations. The smallest company, Live Nation, has a $908 million capitalization while the largest company, Novartis, has a $140 billion market cap.
Clyde S. McGregor, CFA
Portfolio Manager
oakgx@oakmark.com | | Robert A. Taylor, CFA
Portfolio Manager
oakgx@oakmark.com | |
|
March 31, 2008
THE OAKMARK GLOBAL FUND
25
THE OAKMARK GLOBAL FUND
Global Diversification—March 31, 2008 (Unaudited)
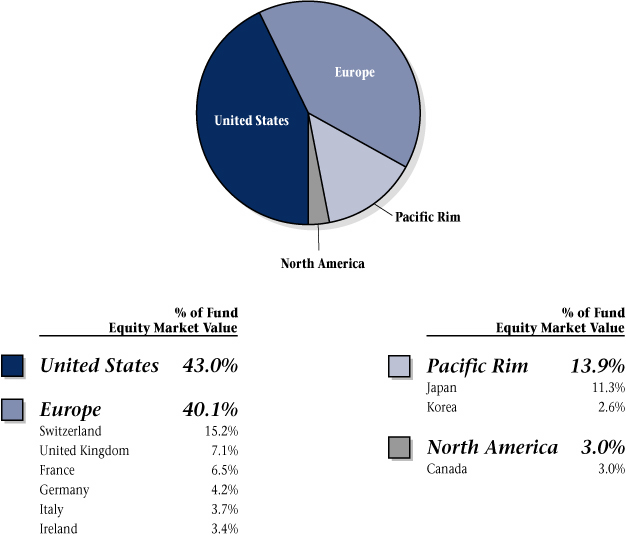
THE OAKMARK GLOBAL FUND
26
THE OAKMARK GLOBAL FUND
Schedule of Investments—March 31, 2008 (Unaudited)
| Name | | Description | | Shares Held | | Market Value | |
| Common Stocks—99.0% | |
| Apparel, Accessories & Luxury Goods—3.7% | |
| Bulgari S.p.A. (Italy) | | Jewelry Manufacturer & Retailer | | | 4,678,800 | | | $ | 54,070,277 | | |
Luxottica Group S.p.A.
(Italy) | | Manufacturer and Retailer of
Eyeglass Frames and Sunglasses | | | 1,410,700 | | | | 35,567,440 | | |
| | | | 89,637,717 | | |
| Automobile Manufacturers—4.1% | |
Bayerische Motoren Werke
(BMW) AG (Germany) | | Luxury Automobile Manufacturer | | | 962,900 | | | $ | 53,191,000 | | |
Daimler AG Registered
(Germany) | | Automobile Manufacturer | | | 565,100 | | | | 48,309,973 | | |
| | | | 101,500,973 | | |
| Broadcasting & Cable TV—4.5% | |
Discovery Holding
Company, Class A
(United States) (a) | | Media Management &
Network Services | | | 2,913,700 | | | $ | 61,828,714 | | |
Societe Television
Francaise 1 (France) | | Broadcasting & Cable TV | | | 2,163,600 | | | | 47,581,827 | | |
| | | | 109,410,541 | | |
| Household Appliances—3.8% | |
Snap-On Incorporated
(United States) | | Tool & Equipment Manufacturer | | | 1,850,300 | | | $ | 94,087,755 | | |
| Motorcycle Manufacturers—1.3% | |
Harley-Davidson, Inc.
(United States) | | Motorcycle Manufacturer | | | 844,700 | | | $ | 31,676,250 | | |
| Movies & Entertainment—4.9% | |
Viacom, Inc., Class B
(United States) (a) | | Publishing Company | | | 1,276,300 | | | $ | 50,567,006 | | |
Live Nation, Inc.
(United States) (a) | | Live Events Producer, Operator, &
Promoter | | | 3,119,500 | | | | 37,839,535 | | |
News Corporation, Class B
(United States) | | International Multimedia &
Entertainment Company | | | 1,726,500 | | | | 32,872,560 | | |
| | | | 121,279,101 | | |
| Publishing—1.9% | |
The Washington Post
Company, Class B
(United States) Newspaper & Magazine Publishing;
Educational & Career Development | |
Service Provider | | | 72,169 | | | $ | 47,739,794 | | |
THE OAKMARK GLOBAL FUND
27
THE OAKMARK GLOBAL FUND
Schedule of Investments—March 31, 2008 (Unaudited) cont.
| Name | | Description | | Shares Held | | Market Value | |
| Common Stocks—99.0% (cont.) | |
| Distillers & Vintners—1.2% | |
Diageo plc
(United Kingdom) | | Beverages, Wines, & Spirits
Manufacturer | | | 1,516,000 | | | $ | 30,568,702 | | |
| Packaged Foods & Meats—2.3% | |
Cadbury Schweppes plc
(United Kingdom) | | Beverage & Confectionary
Manufacturer | | | 5,129,500 | | | $ | 56,347,771 | | |
| Oil & Gas Exploration & Production—7.8% | |
XTO Energy, Inc.
(United States) | | Oil & Natural Gas Exploration &
Production | | | 1,787,750 | | | $ | 110,590,215 | | |
Apache Corporation
(United States) | | Oil & Natural Gas Exploration &
Production | | | 667,500 | | | | 80,647,350 | | |
| | | | 191,237,565 | | |
| Asset Management & Custody Banks—2.9% | |
Julius Baer Holding AG
(Switzerland) | | Asset Management | | | 952,700 | | | $ | 70,222,173 | | |
| Diversified Banks—3.3% | |
| Bank of Ireland (Ireland) | | Commercial Bank | | | 5,514,300 | | | $ | 82,007,641 | | |
| Diversified Capital Markets—6.1% | |
Credit Suisse Group
(Switzerland) | | Wealth Management & Investment
Banking | | | 1,831,200 | | | $ | 93,210,311 | | |
| UBS AG (Switzerland) | | Wealth Management & Investment
Banking | | | 1,956,300 | | | | 56,851,091 | | |
| | | | 150,061,402 | | |
| Investment Banking & Brokerage—4.2% | |
Daiwa Securities Group, Inc.
(Japan) | | Stock Broker | | | 12,014,000 | | | $ | 104,134,189 | | |
| Health Care Equipment—4.0% | |
Medtronic, Inc.
(United States) | | Health Care Equipment | | | 1,075,700 | | | $ | 52,031,609 | | |
Covidien Limited
(United States) | | Health Care Equipment & Supplies | | | 1,039,700 | | | | 46,006,725 | | |
| | | | 98,038,334 | | |
THE OAKMARK GLOBAL FUND
28
THE OAKMARK GLOBAL FUND
Schedule of Investments—March 31, 2008 (Unaudited) cont.
| Name | | Description | | Shares Held | | Market Value | |
| Common Stocks—99.0% (cont.) | |
| Health Care Services—3.2% | |
Laboratory Corporation of
America Holdings
(United States) (a) | | Medical Laboratory & Testing
Services | | | 1,077,000 | | | $ | 79,353,360 | | |
| Life Sciences Tools & Services—3.0% | |
| MDS, Inc. (Canada) (a) | | Products & Services for Medical
Product Manufacturers | | | 3,800,600 | | | $ | 74,035,688 | | |
| Pharmaceuticals—7.1% | |
| Novartis AG (Switzerland) | | Pharmaceuticals | | | 1,724,900 | | | $ | 88,407,421 | | |
GlaxoSmithKline plc
(United Kingdom) | | Pharmaceuticals | | | 4,069,800 | | | | 86,102,222 | | |
| | | | 174,509,643 | | |
| Aerospace & Defense—1.1% | |
Alliant Techsystems, Inc.
(United States) (a) | | Propulsion Systems & Munitions | | | 269,087 | | | $ | 27,858,577 | | |
| Diversified Commercial & Professional Services—1.0% | |
Meitec Corporation
(Japan) | | Software Engineering Services | | | 760,000 | | | $ | 23,025,682 | | |
| Human Resource & Employment Services—2.5% | |
| Adecco SA (Switzerland) | | Temporary Employment Services | | | 1,074,300 | | | $ | 62,039,176 | | |
| Railroads—2.6% | |
Union Pacific Corporation
(United States) | | Rail Transportation Provider | | | 512,300 | | | $ | 64,232,174 | | |
| Computer Hardware—1.5% | |
Teradata Corporation
(United States) (a) | | Computer Software | | | 1,653,000 | | | $ | 36,465,180 | | |
| Electronic Equipment Manufacturers—3.2% | |
OMRON Corporation
(Japan) | | Component, Equipment, &
System Manufacturer | | | 3,894,200 | | | $ | 79,892,044 | | |
| Electronic Manufacturing Services—1.9% | |
Tyco Electronics, Ltd.
(United States) | | Manufactures Electronic
Components | | | 1,366,100 | | | $ | 46,884,552 | | |
| Office Electronics—4.5% | |
| Neopost SA (France) | | Mailroom Equipment Supplier | | | 989,850 | | | $ | 111,094,083 | | |
THE OAKMARK GLOBAL FUND
29
THE OAKMARK GLOBAL FUND
Schedule of Investments—March 31, 2008 (Unaudited) cont.
| Name | | Description | | Shares Held/
Par Value | | Market Value | |
| Common Stocks—99.0% (cont.) | |
| Semiconductors—8.2% | |
Rohm Company Limited
(Japan) | | Integrated Circuits & Semiconductor
Devices Manufacturer | | | 1,116,988 | | | $ | 69,139,406 | | |
Intel Corporation
(United States) | | Computer Component
Manufacturer & Designer | | | 3,238,300 | | | | 68,587,194 | | |
Samsung Electronics
Co., Ltd. (Korea) | | Consumer & Industrial Electronic
Equipment Manufacturer | | | 101,900 | | | | 64,102,287 | | |
| | | | 201,828,887 | | |
| Systems Software—3.2% | |
Oracle Corporation
(United States) (a) | | Software Services | | | 4,004,600 | | | $ | 78,329,976 | | |
| Total Common Stocks (Cost: $2,255,254,676) | | | | | | | | | 2,437,498,930 | | |
| Short Term Investment—1.7% | |
| Repurchase Agreement—1.7% | |
Fixed Income Clearing Corp. Repurchase Agreement,
2.25% dated 3/31/2008 due 4/1/2008, repurchase
price $42,272,734, collateralized by a Federal Home
Loan Bank Bond, with a rate of 4.400%, with a
maturity of 5/5/2008, and with an aggregate
market value plus accrued interest of $44,384,719 | | | | $ | 42,270,092 | | | $ | 42,270,092 | | |
| Total Repurchase Agreement (Cost: $42,270,092) | | | | | | | | | 42,270,092 | | |
| Total Short Term Investment (Cost: $42,270,092) | | | | | | | | | 42,270,092 | | |
| Total Investments (Cost: $2,297,524,768)—100.7% | | | | | | | | $ | 2,479,769,022 | | |
| Foreign Currencies (Cost: $378)—0.0% | | | | | | | | $ | 379 | | |
| Liabilities In Excess of Other Assets—(0.7)% | | | | | | | | | (18,230,906 | ) | |
| Total Net Assets—100% | | | | | | | | $ | 2,461,538,495 | | |
(a) Non income-producing security.
See accompanying Notes to Financial Statements.
THE OAKMARK GLOBAL FUND
30
THE OAKMARK GLOBAL SELECT FUND
Report from Bill Nygren and David Herro, Portfolio Managers


THE VALUE OF A $10,000 INVESTMENT IN THE OAKMARK GLOBAL SELECT FUND FROM ITS INCEPTION (10/2/06) TO PRESENT (3/31/08) AS COMPARED TO THE MSCI WORLD INDEX15 (UNAUDITED)
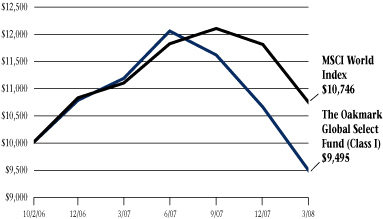
| | | Total Returns
(as of 3/31/08) | |
| (Unaudited) | | Last 3 Months* | | 1-year | | Average Annual
Total Return
Since Inception
(10/2/06) | |
Oakmark Global
Select Fund (Class I) | | | -10.98 | % | | | -15.16 | % | | | -3.41 | % | |
| MSCI World | | | -9.06 | % | | | -3.25 | % | | | 4.93 | % | |
| Lipper Global Fund Index16 | | | -8.45 | % | | | -2.43 | % | | | 5.61 | % | |
The graph and table do not reflect the deduction of taxes that a shareholder would pay on fund distributions or the redemption of fund shares.
Expense Ratio for Class I shares as of 9/30/07 was 1.31%.
The performance data quoted represents past performance. The above performance information for the Fund does not reflect the imposition of a 2% redemption fee on shares held for 90 days or less to deter market timers. If reflected, the fee would reduce the performance quoted. Past performance does not guarantee future results. The investment return and principal value will fluctuate so that an investor's shares, when redeemed, may be worth more or less than their original cost. Current performance may be lower or higher than the performance data quoted. Average annual total return measures annualized change, while total return measures aggregate change. To obtain most recent month-end performance data, visit oakmark.com.
* Not annualized
It was a difficult quarter for The Oakmark Global Select Fund, which declined 11% for the quarter ended March 31, 2007. This compares unfavorably to the MSCI World Index loss of 9%.
Impact Players
Adecco, a Swiss-based personnel and temporary employment company, was the largest contributor during the quarter, returning 7%. The restructuring plan put in place by new management continues to improve margins and cash generation. Despite weak underlying demand and recessionary fear in the U.S., the temporary employment market has not reacted as negatively as it has during past slowdowns. Capital One Financial Corp., a U.S.-based financial services company, was the second largest contributor, returning 5% for the quarter. The market responded positively to recent credit quality metrics that were better than expected. Additionally, unlike most financials in the current market, Capital One announced a dividend increase that will yield approximately 3% annually at the quarter-end price. Rounding out the top contributors was The Home Depot, Inc., a U.S.-based home improvement retail chain, returning 4.5% for the quarter. With the continued hous ing market weakness, shares of Home Depot had been trading at extremely attractive levels at just 12x forward earnings. Despite macro-driven weakness, Home Depot's new management team is making strong progress on their initiatives to improve the company's supply chain and the customer shopping experience.
Rohm Co., a Japanese semiconductor manufacturer, was the largest detractor from performance, declining 27% for the quarter. Rohm's share price was negatively affected by disappointing sales numbers and a larger than expected seasonal slowdown. In addition, an industry-wide weakness for semiconductor-related stocks continued during the quarter. Schroders PLC, a United Kingdom asset manager, was the second largest detractor, declining 26%. Schroders reported positive results, including increased inflows, increased market share in the U.K., and positive top line growth and continued margin expansion in the private bank. Despite these positive results, overall nervousness about earnings for financial businesses caused the share price to fall. Credit Suisse Group, a Swiss financial services group, rounded out the top detractors, declining 15% for the quarter. The $2.9 billion write-down associated with Collateralized Debt Obligation (CDO) asset m ispricing caused the share price to fall. While this mispricing raises concerns, it's important to note that it had a minimal effect on 2007 results. A review of the risk procedures determined that the proper controls are being followed and found no additional issues in other areas of the
THE OAKMARK GLOBAL SELECT FUND
31
company. Furthermore, the review judged that the mispricing was initially overlooked because CDOs are inherently difficult to value and are not priced by a centralized source. The parties involved in this matter were disciplined appropriately. We maintain our positive outlook on these companies and believe they will become solid contributors to the portfolio over the long-term.
Portfolio Composition
There were not many changes to the portfolio in the quarter. Diageo plc was sold from the Fund as it approached fair value and Television Francaise (TF1), the operator of the French television channel TF1, was added to the portfolio.
In closing, we are long-term value investors focused on finding attractive, under-valued foreign companies trading at a significant discount to their measured worth. We welcome market weakness and instability because they create opportunities that allow us to invest in quality companies trading at low prices. We thank you for your continued support.
William C. Nygren, CFA
Portfolio Manager
oakwx@oakmark.com | | David G. Herro, CFA
Portfolio Manager
oakwx@oakmark.com | |
|
March 31, 2008
THE OAKMARK GLOBAL SELECT FUND
32
THE OAKMARK GLOBAL SELECT FUND
Global Diversification—March 31, 2008 (Unaudited)

THE OAKMARK GLOBAL SELECT FUND
33
THE OAKMARK GLOBAL SELECT FUND
Schedule of Investments—March 31, 2008 (Unaudited)
| Name | | Description | | Shares Held | | Market Value | |
| Common Stocks—95.9% | |
| Broadcasting & Cable TV—14.2% | |
Societe Television
Francaise 1 (France) | | Broadcasting & Cable TV | | | 700,100 | | | $ | 15,396,579 | | |
Comcast Corporation,
Class A (United States) | | Cable Communication
Networks Provider | | | 697,400 | | | | 13,229,678 | | |
British Sky Broadcasting
Group plc
(United Kingdom) | | Television Production &
Broadcasting | | | 988,000 | | | | 10,912,046 | | |
| | | | 39,538,303 | | |
| Computer & Electronics Retail—4.3% | |
Best Buy Co., Inc.
(United States) | | Computer & Electronics Retailer | | | 285,000 | | | $ | 11,816,100 | | |
| Home Improvement Retail—4.6% | |
The Home Depot, Inc.
(United States) | | Home Improvement Retailer | | | 460,000 | | | $ | 12,866,200 | | |
| Movies & Entertainment—8.7% | |
Viacom, Inc., Class B
(United States) (a) | | Publishing Company | | | 319,000 | | | $ | 12,638,780 | | |
Time Warner, Inc.
(United States) | | Filmed Entertainment &
Television Networks | | | 820,000 | | | | 11,496,400 | | |
| | | | 24,135,180 | | |
| Restaurants—4.6% | |
McDonald's Corporation
(United States) | | Fast-food Restaurant Operator | | | 231,000 | | | $ | 12,882,870 | | |
| Asset Management & Custody Banks—5.6% | |
Schroders PLC
(United Kingdom) | | International Asset Management | | | 830,400 | | | $ | 15,458,746 | | |
| Consumer Finance—4.6% | |
Capital One Financial
Corporation
(United States) | | Credit Card Products &
Services Provider | | | 260,000 | | | $ | 12,797,200 | | |
| Diversified Capital Markets—5.3% | |
Credit Suisse Group
(Switzerland) | | Wealth Management &
Investment Banking | | | 291,000 | | | $ | 14,812,254 | | |
THE OAKMARK GLOBAL SELECT FUND
34
THE OAKMARK GLOBAL SELECT FUND
Schedule of Investments—March 31, 2008 (Unaudited) cont.
| Name | | Description | | Shares Held | | Market Value | |
| Common Stocks—95.9% (cont.) | |
| Investment Banking & Brokerage—6.0% | |
Daiwa Securities
Group, Inc. (Japan) | | Stock Broker | | | 1,916,000 | | | $ | 16,607,384 | | |
| Thrifts & Mortgage Finance—3.0% | |
Washington Mutual, Inc.
(United States) | | Diversified Financial Services | | | 810,000 | | | $ | 8,343,000 | | |
| Pharmaceuticals—13.4% | |
GlaxoSmithKline plc
(United Kingdom) | | Pharmaceuticals | | | 615,300 | | | $ | 13,017,518 | | |
Novartis AG
(Switzerland) | | Pharmaceuticals | | | 247,100 | | | | 12,664,777 | | |
Bristol-Myers Squibb
Company (United States) | | Health & Personal Care | | | 549,000 | | | | 11,693,700 | | |
| | | | 37,375,995 | | |
| Human Resource & Employment Services—7.6% | |
| Adecco SA (Switzerland) | | Temporary Employment Services | | | 367,700 | | | $ | 21,234,110 | | |
| Computer Hardware—4.4% | |
| Dell Inc. (United States) (a) | | Technology Products & Services | | | 623,000 | | | $ | 12,410,160 | | |
| Semiconductors—9.6% | |
Intel Corporation
(United States) | | Computer Component
Manufacturer & Designer | | | 642,000 | | | $ | 13,597,560 | | |
Rohm Company
Limited (Japan) | | Integrated Circuits & Semiconductor
Devices Manufacturer | | | 210,400 | | | | 13,023,356 | | |
| | | | 26,620,916 | | |
| Total Common Stocks (Cost: $313,668,929) | | | | | | | | | 266,898,418 | | |
THE OAKMARK GLOBAL SELECT FUND
35
THE OAKMARK GLOBAL SELECT FUND
Schedule of Investments—March 31, 2008 (Unaudited) cont.
| Name | | Description | | Par Value | | Market Value | |
| Short Term Investment—4.3% | |
| Repurchase Agreement—4.3% | |
Fixed Income Clearing Corp. Repurchase Agreement,
2.25% dated 3/31/2008 due 4/1/2008, repurchase
price $11,816,021, collateralized by a Federal Home
Loan Bank Bond, with a rate of 4.400%, with a
maturity of 5/5/2008, and with an aggregate
market value plus accrued interest of $12,408,413 | | | | $ | 11,815,283 | | | $ | 11,815,283 | | |
| Total Repurchase Agreement (Cost: $11,815,283) | | | | | | | 11,815,283 | | |
| Total Short Term Investment (Cost: $11,815,283) | | | | | | | 11,815,283 | | |
| Total Investments (Cost: $325,484,212)—100.2% | | | | | | $ | 278,713,701 | | |
| Foreign Currencies (Cost: $48)—0.0% | | | | | | $ | 48 | | |
| Liabilities In Excess of Other Assets—(0.2)% | | | | | | | (440,793 | ) | |
| Total Net Assets—100% | | | | | | $ | 278,272,956 | | |
(a) Non income-producing security.
See accompanying Notes to Financial Statements.
THE OAKMARK GLOBAL SELECT FUND
36
THE OAKMARK INTERNATIONAL AND
OAKMARK INTERNATIONAL SMALL CAP FUNDS

Fellow shareholders,
As your statements show, the quarter ended March 31, 2008, was not good for international equity markets or your Funds. Shares of both The Oakmark International Fund and The Oakmark International Small Cap Fund declined in value this quarter. Though this negative trend has continued for about nine months, I am becoming more optimistic that equity prices will begin to reflect the positive values we are finding throughout international markets.
What Makes a Company "Valuable"?
As value investors, we believe that the value of any business is determined by what it generates in free cash over time. As we know, in the short-term, stock markets tend not to be concerned with fundamentals; they react to such things as changes in the macro economy, rumors, momentum, etc. We believe we have an edge because we ignore these short-term influences and make investment decisions based on the long-term fundamental characteristics of underlying businesses. Though at times we are early, we have greatly benefitted in the past from buying when markets are impatient and fearful. As an example, recall the Asian crisis of 1997-1998. Both international funds underperformed quite noticeably while capital fled the Pacific Rim in droves. Headlines during the time included "Asia: the lost deca de" and "Will Asia Ever Recover?" We used this volatile opportunity to load up on Asian stocks, and over the next three years we not only earned back what we lost in the crisis, but Oakmark International outperformed the EAFE index17 by over 63% from 1999 to 2001.
Today it is a different set of problems. The U.S. and global economies are slowing because of the fallout from the "sub-prime crisis." The housing bubble in the U.S. has popped, and pundits are crying, "the sky is falling." Indeed, declining house prices are hurting the macro economy, but the world is not coming to an end. Policy makers and regulators are already proposing various initiatives that will help the healing process and will improve the system for the future. This is exactly what happened in Asia in the late 90s. Despite the abundance of fear surrounding the markets today, we think natural market forces and proactive crisis management will help the situation to run its course. And we believe, at a time least expected, equity markets will recover.
In the meantime, stock prices have plummeted, particularly for companies in the financial sector and for those in certain consumer-oriented sectors, such as retail and media. Yes, the past six months have not been good for these companies, and the immediate future doesn't look so hot. But, as we stated above, value isn't determined by the last few—or even the next couple of—months. To value a business properly, one must consider the business's long-term prospects, including its ability to generate cash over the next five to ten years. From this perspective, we see lots of opportunity as the market, driven by fear and conjecture, has trashed the share prices of many quality businesses. This has consequently given us the opportunity to pay unrealistically low prices for what we view are some of the world's great business franchises.
Though the speculators and pundits claim "this time it is different," history suggests that markets recover. When they do, we strongly believe that our international portfolios are very well positioned for the re-convergence of price and value.
Traveler's Log—Japan
Many of us on the international team continue to spend lots of time in Japan visiting with managements. Though its market peaked in 1989, Japan has proven of little or no interest to us until recently. As you may have read in past commentaries, we had great difficulty finding investments that met our criteria of being low in price and high in quality. Two things have happened to get us a bit more excited about investment prospects there. First, prices are low, and valuations are extremely compelling. Second—and perhaps where we have seen the biggest change—"quality" is on the rise. We define quality companies as those companies that are led by managements that build value per share by increasing returns and by allocating capital intelligently. Previously, Japanese managements seemed more obsessed with building big cash piles than with building shareholder value. This is definitely changing as ROE's are rising across corporate Japan partially due to much sounder capital allocation. In fact, some members of "Japan Inc" (such as Rohm, one of our holdings) are now paying out to shareholders annually all of the free cash they generate, which has caused dividend payout ratios to rise dramatically.
With low prices and improving quality, the Japanese market is now providing real value, and we are cautiously enthusiastic that Japanese managements are slowly starting to "get it."
David G. Herro, CFA
Portfolio Manager
oakix@oakmark.com
oakex@oakmark.com
March 31, 2008
| | | | | Average Annual Total Returns
(as of 3/31/08) | |
| (Unaudited) | | Total Return
Last 3 Months* | | 1-year | | 5-year | | 10-year | | Since
Inception
(9/30/92) | |
Oakmark International
Fund (Class I) | | | -11.03 | % | | | -15.63 | % | | | 19.69 | % | | | 9.16 | % | | | 11.66 | % | |
| MSCI World ex U.S. | | | -8.70 | % | | | -1.30 | % | | | 21.81 | % | | | 6.53 | % | | | 8.60 | % | |
| MSCI EAFE17 | | | -8.91 | % | | | -2.69 | % | | | 21.41 | % | | | 6.19 | % | | | 8.31 | % | |
Lipper International
Fund Index19 | | | -9.43 | % | | | -0.23 | % | | | 21.66 | % | | | 6.90 | % | | | 9.57 | % | |
The graph and table do not reflect the deduction of taxes that a shareholder would pay on fund distributions or the redemption of fund shares.
Expense Ratio for Class I shares as of 9/30/07 was 1.05%.
The performance data quoted represents past performance. The above performance information for the Fund does not reflect the imposition of a 2% redemption fee on shares held for 90 days or less to deter market timers. If reflected, the fee would reduce the performance quoted. Past performance does not guarantee future results. The investment return and principal value will fluctuate so that an investor's shares, when redeemed, may be worth more or less than their original cost. Current performance may be lower or higher than the performance data quoted. Average annual total return measures annualized change, while total return measures aggregate change. To obtain most recent month-end performance data, visit oakmark.com.
* Not annualized
THE OAKMARK INTERNATIONAL AND OAKMARK INTERNATIONAL SMALL CAP FUNDS
37
THE OAKMARK INTERNATIONAL FUND
Report from David G. Herro

THE VALUE OF A $10,000 INVESTMENT IN THE OAKMARK INTERNATIONAL FUND FROM ITS INCEPTION (9/30/92) TO PRESENT (3/31/08) AS COMPARED TO THE MSCI WORLD EX U.S. INDEX18 (UNAUDITED)

| | | | | Average Annual Total Returns
(as of 3/31/08) | |
| (Unaudited) | | Total Return
Last 3 Months* | | 1-year | | 5-year | | 10-year | | Since
Inception
(9/30/92) | |
Oakmark International
Fund (Class I) | | | -11.03 | % | | | -15.63 | % | | | 19.69 | % | | | 9.16 | % | | | 11.66 | % | |
| MSCI World ex U.S. | | | -8.70 | % | | | -1.30 | % | | | 21.81 | % | | | 6.53 | % | | | 8.60 | % | |
| MSCI EAFE17 | | | -8.91 | % | | | -2.69 | % | | | 21.41 | % | | | 6.19 | % | | | 8.31 | % | |
Lipper International
Fund Index19 | | | -9.43 | % | | | -0.23 | % | | | 21.66 | % | | | 6.90 | % | | | 9.57 | % | |
The graph and table do not reflect the deduction of taxes that a shareholder would pay on fund distributions or the redemption of fund shares.
Expense Ratio for Class I shares as of 9/30/07 was 1.05%.
The performance data quoted represents past performance. The above performance information for the Fund does not reflect the imposition of a 2% redemption fee on shares held for 90 days or less to deter market timers. If reflected, the fee would reduce the performance quoted. Past performance does not guarantee future results. The investment return and principal value will fluctuate so that an investor's shares, when redeemed, may be worth more or less than their original cost. Current performance may be lower or higher than the performance data quoted. Average annual total return measures annualized change, while total return measures aggregate change. To obtain most recent month-end performance data, visit oakmark.com.
* Not annualized
The Oakmark International Fund declined 11% for the quarter ended March 31, 2008, lagging behind the MSCI World ex U.S. Index, which lost 9%. More importantly, however, since the Fund's inception in September 1992, it is up an average of 12% per annum, which compares favorably with the MSCI World ex U.S. Index's return of 9% over the same period.
Impact Players
Chinatrust Financial Holding Company, one of Taiwan's largest banks and the owner of Taiwan's largest credit-card issuer, was the top contributor this quarter, returning 23%. Chinatrust's price rebounded off its fourth quarter lows on news that it returned to a profit in fourth quarter due to an increase in fee income and a decrease in loss provisions. Additionally, the Taiwanese market as a whole benefitted from news that the opposition party to President Chen was elected to a majority of the parliamentary seats. The opposition party supports closer ties with China, which investors believe will boost the economy. We sold our position in Chinatrust during the quarter, and due to the strength in price we were able to do so at prices near the stock's all-time high. Adecco, a Swiss personnel and temporary employment company, was the second largest contributor during the quarter, returning 7%. The restructuring plan implemented by the new manage ment team has continued to provide good results, including margin improvement and improved cash generation. Despite weak underlying demand and recessionary fear in the U.S., the market has not reacted as negatively as it has during past slowdowns. Rounding out the top three contributors was Samsung Electronics Co., a Korean manufacturer of consumer and industrial electronics equipment and products, returning 7% during the quarter. While the semi-conductor market remains weak due to poor pricing conditions and oversupply, Samsung's LCD and handset businesses have performed very well.
As discussed in the International lead letter, the global markets have been negatively affected by "the sub-prime crisis" and recessionary fears. We have seen this weakness continue to hurt our top names, including UBS AG and Credit Suisse. UBS, Europe's largest bank, was the quarter's largest detractor from performance, declining 37%. UBS continues to announce write-downs related to the U.S. mortgage market. The management team responsible for these problems has been replaced by a team that we believe will build shareholder value over time. With the troubled assets marked at what appear to be very low levels, we believe the worst is behind UBS and that it will now return to profitable growth. Credit Suisse Group, a Swiss financial services group, also was affected
THE OAKMARK INTERNATIONAL FUND
38
by global financial market weakness, declining 15% for the quarter. The market negatively reacted to the $2.9 billion write-down related to its Collateralized Debt Obligation (CDO) asset mispricing. While this mispricing raises concerns, it's important to note that its effect on 2007 results was minimal. A risk procedure review found that proper controls are in place and determined that the mispricing was initially overlooked because CDOs are inherently difficult to value and because they are not priced by a centralized source. The parties involved in the matter were disciplined appropriately. Another top detractor from performance was Rohm Co., a Japanese semiconductor manufacturer, declining 27% for the quarter. Rohm shares were dragged down by disappointing sales numbers and larger than expected seasonal slowdown. Additionally, an industry-wide weakness for semiconductor-related stocks continued during the quarter. We remain confident in our investments and believe over the long-term they will be positive contributors to the Fund.
Portfolio Composition
In addition to Chinatrust, we sold our positions in Compass Group, Giordano International, Lotte Chilsung, Uni-Charm Corp., and Vivendi SA because they reached their respective sell targets or because better investment opportunities materialized. Only two new names were added to the portfolio during the quarter: Canon Inc., a Japanese imaging equipment manufacturer; and Swatch Group AG, a large Swiss watch manufacturer. We previously owned both names in the Fund and used weak share prices as an opportunity to repurchase these high quality companies.
We held significant positions in sectors that performed poorly during the quarter, including financials, consumer discretionary, and information technology. Together, these sectors detracted approximately 8% from Fund performance.
In closing, we would like to remind you that we measure our performance over the long term. Short-term fluctuations in the market create opportunities for us to invest in under-valued companies that have fallen out of favor.
Thank you for your continued support.
David G. Herro, CFA
Portfolio Manager
oakix@oakmark.com | |
|
March 31, 2008
THE OAKMARK INTERNATIONAL FUND
39
THE OAKMARK INTERNATIONAL FUND
Global Diversification—March 31, 2008 (Unaudited)

THE OAKMARK INTERNATIONAL FUND
40
THE OAKMARK INTERNATIONAL FUND
Schedule of Investments—March 31, 2008 (Unaudited)
| Name | | Description | | Shares Held | | Market Value | |
| Common Stocks—97.6% | |
| Advertising—3.4% | |
| Publicis Groupe (France) | | Advertising & Media Services | | | 5,651,400 | | | $ | 215,915,808 | | |
| Apparel, Accessories & Luxury Goods—6.4% | |
Compagnie Financiere
Richemont SA
(Switzerland) | | Manufacturer and Retailer of
Luxury Goods | | | 2,510,700 | | | $ | 140,817,632 | | |
LVMH Moet Hennessy
Louis Vuitton SA
(France) | | Diversified Luxury Goods
Conglomerate | | | 1,066,200 | | | | 118,669,967 | | |
Luxottica Group S.p.A.
(Italy) | | Manufacturer and Retailer of
Eyeglass Frames and Sunglasses | | | 3,288,057 | | | | 82,900,525 | | |
Swatch Group AG,
Bearer Shares
(Switzerland) | | Watch Manufacturer | | | 241,100 | | | | 64,456,802 | | |
| | | | 406,844,926 | | |
| Automobile Manufacturers—7.8% | |
Bayerische Motoren Werke
(BMW) AG (Germany) | | Luxury Automobile Manufacturer | | | 3,703,300 | | | $ | 204,571,846 | | |
Daimler AG Registered
(Germany) | | Automobile Manufacturer | | | 1,787,100 | | | | 152,777,832 | | |
Honda Motor Co., Ltd.
(Japan) | | Automobile & Motorcycle
Manufacturer | | | 4,898,300 | | | | 139,804,008 | | |
| | | | 497,153,686 | | |
| Broadcasting & Cable TV—9.3% | |
Societe Television
Francaise 1 (France) | | Broadcasting & Cable TV | | | 8,507,500 | | | $ | 187,096,689 | | |
Gestevision Telecinco SA
(Spain) | | Television Production &
Broadcasting | | | 7,920,800 | | | | 161,188,848 | | |
British Sky Broadcasting
Group plc
(United Kingdom) | | Television Production &
Broadcasting | | | 11,818,400 | | | | 130,529,279 | | |
Grupo Televisa S.A.
(Mexico) (a) | | Television Production &
Broadcasting | | | 4,882,000 | | | | 118,339,680 | | |
| | | | 597,154,496 | | |
THE OAKMARK INTERNATIONAL FUND
41
THE OAKMARK INTERNATIONAL FUND
Schedule of Investments—March 31, 2008 (Unaudited) cont.
| Name | | Description | | Shares Held | | Market Value | |
| Common Stocks—97.6% (cont.) | |
| Publishing—2.0% | |
Trinity Mirror plc
(United Kingdom) (b) | | Newspaper Publishing | | | 15,461,248 | | | $ | 90,521,272 | | |
Johnston Press plc
(United Kingdom) (b) | | Newspaper Publishing | | | 16,045,172 | | | | 39,486,637 | | |
| | | | 130,007,909 | | |
| Specialty Stores—2.9% | |
Signet Group plc
(United Kingdom) (b) | | Jewelry Retailer | | | 151,982,759 | | | $ | 186,258,187 | | |
| Distillers & Vintners—1.1% | |
Diageo plc
(United Kingdom) | | Beverages, Wines, & Spirits
Manufacturer | | | 3,541,300 | | | $ | 71,406,955 | | |
| Packaged Foods & Meats—1.9% | |
Cadbury Schweppes plc
(United Kingdom) | | Beverage & Confectionary
Manufacturer | | | 10,725,400 | | | $ | 117,818,966 | | |
| Asset Management & Custody Banks—1.7% | |
Schroders PLC
(United Kingdom) | | International Asset Management | | | 6,029,000 | | | $ | 112,236,007 | | |
| Diversified Banks—14.2% | |
| Bank of Ireland (Ireland) | | Commercial Bank | | | 13,032,700 | | | $ | 193,819,884 | | |
Barclays PLC
(United Kingdom) | | Commercial & Investment
Banking, Insurance, Financial,
Asset Management and
Related Services | | |
20,290,100 | | | |
182,417,489 | | |
| BNP Paribas SA (France) | | Commercial Bank | | | 1,769,900 | | | | 178,523,193 | | |
Lloyds TSB Group plc
(United Kingdom) | | Commercial Bank | | | 17,421,300 | | | | 155,934,131 | | |
HSBC Holdings plc
(United Kingdom) | | International Banking &
Financial Services | | | 9,055,000 | | | | 149,159,401 | | |
| Kookmin Bank (Korea) | | Commercial Bank | | | 861,850 | | | | 48,211,733 | | |
| | | | 908,065,831 | | |
| Diversified Capital Markets—7.5% | |
Credit Suisse Group
(Switzerland) | | Wealth Management &
Investment Banking | | | 5,958,800 | | | $ | 303,310,180 | | |
| UBS AG (Switzerland) | | Wealth Management &
Investment Banking | | | 5,996,500 | | | | 174,261,394 | | |
| | | | 477,571,574 | | |
THE OAKMARK INTERNATIONAL FUND
42
THE OAKMARK INTERNATIONAL FUND
Schedule of Investments—March 31, 2008 (Unaudited) cont.
| Name | | Description | | Shares Held | | Market Value | |
| Common Stocks—97.6% (cont.) | |
| Investment Banking & Brokerage—5.8% | |
Daiwa Securities
Group, Inc. (Japan) | | Stock Broker | | | 26,984,000 | | | $ | 233,890,208 | | |
Nomura Holdings, Inc.
(Japan) | | Financial Services | | | 9,291,000 | | | | 138,880,317 | | |
| | | | 372,770,525 | | |
| Multi-line Insurance—2.1% | |
| Allianz SE (Germany) | | Insurance, Banking &
Financial Services | | | 668,000 | | | $ | 132,331,733 | | |
| Reinsurance—1.1% | |
Hannover
Rueckversicherung AG
(Germany) | | Reinsurance | | | 1,324,600 | | | $ | 69,051,775 | | |
| Pharmaceuticals—7.0% | |
GlaxoSmithKline plc
(United Kingdom) | | Pharmaceuticals | | | 11,011,700 | | | $ | 232,967,672 | | |
| Novartis AG (Switzerland) | | Pharmaceuticals | | | 4,184,400 | | | | 214,465,774 | | |
| | | | 447,433,446 | | |
| Building Products—1.3% | |
Geberit AG-Registered
(Switzerland) | | Building Products | | | 564,800 | | | $ | 84,171,181 | | |
| Diversified Commercial & Professional Services—4.4% | |
Experian Group, Ltd.
(Ireland) | | Credit and Marketing Services | | | 19,544,600 | | | $ | 142,356,380 | | |
Meitec Corporation
(Japan) (b) | | Software Engineering Services | | | 2,483,800 | | | | 75,251,565 | | |
| G4S PLC (United Kingdom) | | Security Services | | | 14,480,400 | | | | 65,452,016 | | |
| | | | 283,059,961 | | |
| Human Resource & Employment Services—3.4% | |
| Adecco SA (Switzerland) | | Temporary Employment Services | | | 3,762,800 | | | $ | 217,295,922 | | |
| Industrial Conglomerates—0.2% | |
Koninklijke (Royal) Philips
Electronics N.V.
(Netherlands) | | Electronics Manufacturer | | | 273,600 | | | $ | 10,466,043 | | |
| Railroads—0.2% | |
Canadian National
Railway Company
(Canada) | | Operates Network of Rail Tracks | | | 317,000 | | | $ | 15,370,539 | | |
THE OAKMARK INTERNATIONAL FUND
43
THE OAKMARK INTERNATIONAL FUND
Schedule of Investments—March 31, 2008 (Unaudited) cont.
| Name | | Description | | Shares Held | | Market Value | |
| Common Stocks—97.6% (cont.) | |
| Application Software—2.7% | |
| SAP AG (Germany) | | Develops Business Software | | | 3,514,400 | | | $ | 174,662,206 | | |
| Electronic Equipment Manufacturers—3.2% | |
OMRON Corporation
(Japan) | | Component, Equipment, &
System Manufacturer | | | 9,028,600 | | | $ | 185,227,599 | | |
| Orbotech, Ltd. (Israel) (c) | | Optical Inspection Systems | | | 1,237,700 | | | | 22,699,418 | | |
| | | | 207,927,017 | | |
| Office Electronics—1.2% | |
| Canon, Inc. (Japan) | | Computers & Information | | | 1,722,500 | | | $ | 79,316,563 | | |
| Semiconductor Equipment—1.5% | |
| ASML Holding NV | | | | | | | | |
| | |
| (Netherlands) (c) | | Develop, Produce and Market | | | | | | |
| | |
| | | Semiconductor Manufacturing | | | | | | |
| | |
| | | Equipment | | | 3,791,200 | | | $ | 93,251,790 | | |
| Semiconductors—5.3% | |
| Rohm Company Limited | | | | | | | | |
| | |
| (Japan) | | Integrated Circuits & | | | | | | |
| | |
| | | Semiconductor Devices | | | | | | |
| | |
| | | Manufacturer | | | 2,941,500 | | | $ | 182,073,184 | | |
Samsung Electronics
Co., Ltd. (Korea) | | Consumer & Industrial Electronic
Equipment Manufacturer | | | 245,200 | | | | 154,248,094 | | |
| | | | 336,321,278 | | |
| Total Common Stocks (Cost: $6,636,862,889) | | | | | | | | | 6,243,864,324 | | |
THE OAKMARK INTERNATIONAL FUND
44
THE OAKMARK INTERNATIONAL FUND
Schedule of Investments—March 31, 2008 (Unaudited) cont.
| Name | | Description | | Par Value | | Market Value | |
| Short Term Investment—2.3% | |
| Repurchase Agreement—2.3% | |
Fixed Income Clearing Corp. Repurchase Agreement,
2.25% dated 3/31/2008 due 4/1/2008, repurchase
price $148,238,794, collateralized by Federal Home
Loan Bank Bonds, with rates from 4.400% - 4.875,
with maturities from 5/5/2008 - 11/15/2012, and
with an aggregate market value plus accrued interest of
$83,078,006, by a Federal Home Loan Mortgage Corp.
Bond, with a rate of 5.095%, with a maturity of 12/29/2011,
and with an aggregate market value plus accrued interest
of $53,316,288, and by a Federal National Mortgage
Association Bond, with a rate of 3.830%, with a
maturity of 1/22/2013, and with an aggregate market
value plus accrued interest of $19,250,700 | | $ | 148,229,530 | | | $ | 148,229,530 | | |
| Total Repurchase Agreement (Cost: $148,229,530) | | | | | 148,229,530 | | |
| Total Short Term Investment (Cost: $148,229,530) | | | | | 148,229,530 | | |
| Total Investments (Cost: $6,785,092,419)—99.9% | | | | $ | 6,392,093,854 | | |
| Foreign Currencies (Cost: $121,485)—0.0% | | | | $ | 121,261 | | |
| Other Assets In Excess of Liabilities—0.1% | | | | | 9,309,767 | | |
| Total Net Assets—100% | | | | $ | 6,401,524,882 | | |
(a) Represents an American Depositary Receipt.
(b) See footnote number five in the Notes to the Financial Statements regarding investments in affiliated issuers.
(c) Non income-producing security.
See accompanying Notes to Financial Statements.
THE OAKMARK INTERNATIONAL FUND
45
THE OAKMARK INTERNATIONAL
SMALL CAP FUND
Report from David G. Herro and Chad M. Clark, Portfolio Managers


THE VALUE OF A $10,000 INVESTMENT IN THE OAKMARK INTERNATIONAL SMALL CAP FUND FROM ITS INCEPTION (11/1/95) TO PRESENT (3/31/08) AS COMPARED TO THE MSCI WORLD EX U.S. INDEX18 (UNAUDITED)
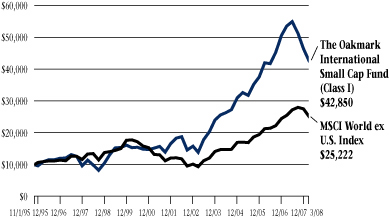
| | | | | Average Annual Total Returns
(as of 3/31/08) | |
| (Unaudited) | | Total Return
Last 3 Months* | | 1-year | | 5-year | | 10-year | | Since
Inception
(11/1/95) | |
Oakmark International
Small Cap Fund
(Class I) | | | -8.08 | % | | | -20.37 | % | | | 25.29 | % | | | 14.13 | % | | | 12.44 | % | |
| MSCI World ex U.S. | | | -8.70 | % | | | -1.30 | % | | | 21.81 | % | | | 6.53 | % | | | 7.74 | % | |
MSCI World ex U.S.
Small Cap20 | | | -6.44 | % | | | -9.92 | % | | | 25.46 | % | | | N/A | | | N/A | |
Lipper International
Small Cap Index21 | | | -8.60 | % | | | -5.94 | % | | | 27.30 | % | | | 12.14 | % | | N/A | |
The graph and table do not reflect the deduction of taxes that a shareholder would pay on fund distributions or the redemption of fund shares.
Expense Ratio for Class I shares as of 9/30/07 was 1.34%.
The performance data quoted represents past performance. The above performance information for the Fund does not reflect the imposition of a 2% redemption fee on shares held for 90 days or less to deter market timers. If reflected, the fee would reduce the performance quoted. Past performance does not guarantee future results. The investment return and principal value will fluctuate so that an investor's shares, when redeemed, may be worth more or less than their original cost. Current performance may be lower or higher than the performance data quoted. Average annual total return measures annualized change, while total return measures aggregate change. To obtain most recent month-end performance data, visit oakmark.com.
* Not annualized
It was a difficult quarter for international equity markets, and The Oakmark International Small Cap Fund was not immune to this, with the Fund declining 8% for the quarter ended March 31. This compares to the MSCI World ex U.S. Index, which lost 9%, and the MSCI World ex U.S. Small Cap Index, which declined 6%. Since inception, your Fund has returned 12% annualized, compared to the MSCI World ex U.S. Index, which returned 8% for the same period.
Stock selection in Japan and France boosted the Fund during the quarter, adding around 1.5% to relative performance. The U.K., Swiss and Italian holdings were the largest detractors from performance relative to the benchmark. From a sector perspective, relative performance was aided by the returns of our financial and industrial holdings versus those of the benchmark. Poor stock selection in the consumer staples sector, our underweighting in the materials sector, and our lack of exposure to energy accounted for a large percentage of relative underperformance.
Contributors
Neopost, the Fund's biggest position, is the second largest manufacturer of franking machines, behind Pitney Bowes. During the quarter Neopost announced 4th quarter earnings results that were better than expected, which boosted the stock price. This along with its size in the Fund helped make Neopost the largest contributor to return for the first quarter.
IMI plc is a new holding to the Fund and was the second-best performer in the quarter. IMI is a U.K. manufacturer of fluid controls, retail displays and other products. It also produces severe service valves and beverage dispensing machines. IMI's stock came under pressure in late 2007 over concerns surrounding a Department of Justice investigation at its severe service division. With the company proactively managing the investigation and ending relationships with the staff responsible for the indiscretions, it now appears the major issues of the investigation have been resolved, and the severe service division should return to more normalized growth rates in '09. We used the share weakness to establish a position in the Fund this quarter.
Rounding out the top three contributors was Japanese advertising agency Asatsu-DK. The stock was up 27% during the quarter, with most of this gain coming in February after the announcement of a buyback of up to one million shares. During the quarter Asatsu posted solid revenue growth in a difficult environment and was also able to expand operating margins by avoiding lower margin projects and maintaining a strict focus on costs.
THE OAKMARK INTERNATIONAL SMALL CAP FUND
46
Detractors
Although Vitec, a U.K. manufacturer and supplier of camera and lighting equipment, reported strong overall results in the first quarter for 2007, margins were hurt by a weak U.S. dollar because a large portion of its sales come from the U.S. It expects that this will have some negative impact on 2008 results as well. Vitec was also hurt by a slower than expected integration of the Tomcat staging business it acquired in 2006. This appears to be resolved.
Shares of Japanese placement and staffing services company Pasona were hurt from a tight job recruitment market, which has forced the company to increase its temporary staff's wages and benefits. Pasona has struggled to fully pass along the increased costs to its customers, which has caused operating margins to decline. The company also faces pressure because Japan's competitive market for permanent employees has slowed demand for temporary workers and also made it difficult to find candidates for temporary positions.
M6 Metropole Television was the third largest detractor from performance for the quarter. The stock has been hurt by cyclical concerns over the French advertising market and uncertainty about the impact of the pending restructuring of state-owned broadcaster France TV. Despite the new contribution of the retail sector's advertising, the underlying advertising market was weak in 2007, hurt by low investments in telecoms and publishing. M6 performed relatively well in audience in strategic time slots, and didn't lose shares overall. However, its margins suffered because it has had to maintain investments in programming to keep pace with channel fragmentation and changing regulations. It is likely that the business will have to weather further deterioration of the advertising environment in 2008. The longer term outlook remains favorable, however, and management is operating the business with good cost discipline, as well as a strategically and financially sound approach to diversification activities in other media, such as the Internet. We don't think the current share price reflects the quality of the business and its management team. In addition to the potential benefits from reform measures, we believe the stock is fundamentally undervalued and offers significant upside at these levels.
Portfolio Composition
The Fund exited many positions during the quarter, including Australian Pharmaceutical Industries, Santen Pharmaceutical, Haw Par, Daekyo, and Domino Printing, because they either reached fair value or because we identified other investment opportunities that had more upside. There has been no shortage of new ideas. In addition to IMI, we added six new holdings to the Fund during the quarter: Ten Network Holdings operates commercial television stations in Australia; Heidelberger, a German manufacturer of printing presses; Wincor Nixdorf, a German manufacturer of banking machines and cash registers; Japanese Hirose Electric Co. develops and sells electronic equipment specializing in connectors; Square Enix, a Japanese company that develops and sells software for home video and a firm that we've owned in the past; and Robert Walters, a U.K. recruiting firm that we owned in the Fund in 2006-2007.
Geographically, our portfolio weightings have remained the same over the quarter with Europe and the U.K. representing approximately 75% of investments. The majority of the balance excluding cash is invested in the Pacific Rim.
We'd like to thank you, our shareholders, for your continued support. As long-term value investors, we will continue to focus on finding attractive, undervalued foreign companies with management teams focused on building shareholder value.
David G. Herro, CFA
Portfolio Manager
oakex@oakmark.com | | Chad M. Clark, CFA
Portfolio Manager
oakex@oakmark.com | |
|
March 31, 2008
THE OAKMARK INTERNATIONAL SMALL CAP FUND
47
THE OAKMARK INTERNATIONAL SMALL CAP FUND
Global Diversification—March 31, 2008 (Unaudited)

THE OAKMARK INTERNATIONAL SMALL CAP FUND
48
THE OAKMARK INTERNATIONAL SMALL CAP FUND
Schedule of Investments—March 31, 2008 (Unaudited)
| Name | | Description | | Shares Held | | Market Value | |
| Common Stocks—98.6% | |
| Advertising—2.2% | |
| Asatsu-DK, Inc. (Japan) | | Advertising Services Provider | | | 315,100 | | | $ | 11,221,960 | | |
Aegis Group plc
(United Kingdom) | | Media Services Provider | | | 2,868,000 | | | | 7,072,283 | | |
| | | | 18,294,243 | | |
| Apparel, Accessories & Luxury Goods—2.6% | |
| Bulgari S.p.A. (Italy) | | Jewelry Manufacturer & Retailer | | | 1,911,400 | | | $ | 22,088,981 | | |
| Automotive Retail—2.9% | |
| USS Co., Ltd. (Japan) | | Used Car Auction Facility Manager | | | 359,300 | | | $ | 24,871,288 | | |
| Broadcasting & Cable TV—5.5% | |
M6 Metropole
Television (France) | | Television Entertainment Channel
Owner & Operator | | | 1,045,700 | | | $ | 23,277,656 | | |
Media Prima Berhad
(Malaysia) | | Film Producer & Sports Promoter | | | 18,907,000 | | | | 13,359,331 | | |
Ten Network Holdings
Limited (Australia) | | Operates Commercial Television
Stations | | | 5,457,900 | | | | 10,724,142 | | |
| | | | 47,361,129 | | |
| Home Furnishing Retail—2.2% | |
Beter Bed Holding NV
(Netherlands) | | Bedroom Furniture Retailer | | | 836,770 | | | $ | 18,943,852 | | |
| Home Improvement Retail—2.5% | |
Carpetright plc
(United Kingdom) | | Carpet Retailer | | | 1,432,310 | | | $ | 21,675,092 | | |
| Leisure Products—1.7% | |
| Trigano SA (France) | | Manufacturer and Retailer of | | | | | | |
| | |
| | | Recreational Vehicles and | | | | | | |
| | |
| | | Garden Equipment | | | 376,800 | | | $ | 14,508,941 | | |
| Movies & Entertainment—0.5% | |
CTS Eventim AG
(Germany) | | Entertainment Tickets Producer &
Distributor | | | 94,941 | | | $ | 3,859,616 | | |
| Photographic Products—2.8% | |
Vitec Group plc
(United Kingdom) (a) | | Photo Equipment & Supplies | | | 2,812,479 | | | $ | 23,945,873 | | |
| Publishing—1.6% | |
| Tamedia AG (Switzerland) | | TV Broadcasting & Publishing | | | 121,208 | | | $ | 13,925,922 | | |
THE OAKMARK INTERNATIONAL SMALL CAP FUND
49
THE OAKMARK INTERNATIONAL SMALL CAP FUND
Schedule of Investments—March 31, 2008 (Unaudited) cont.
| Name | | Description | | Shares Held | | Market Value | |
| Common Stocks—98.6% (cont.) | |
| Specialty Stores—2.7% | |
JJB Sports plc
(United Kingdom) | | Sportswear & Sports Equipment
Retailer | | | 10,782,800 | | | $ | 23,326,100 | | |
| Textiles—1.9% | |
| Chargeurs SA (France) (a) | | Wool, Textile Production & Trading | | | 790,182 | | | $ | 16,155,110 | | |
| Household Products—1.9% | |
Kimberly-Clark de Mexico
S.A.B. de C.V. (Mexico) | | Hygiene Products Manufacturer,
Marketer & Distributor | | | 3,627,700 | | | $ | 16,092,055 | | |
| Packaged Foods & Meats—2.3% | |
| Binggrae Co., Ltd. (Korea) (a) | | Dairy Products Manufacturer | | | 380,800 | | | $ | 12,823,426 | | |
Alaska Milk Corporation
(Philippines) (a) | | Milk Producer | | | 56,360,000 | | | | 6,881,398 | | |
| | | | 19,704,824 | | |
| Soft Drinks—1.4% | |
Britvic Plc
(United Kingdom) | | Soft Drink Manufacturer &
Marketer | | | 1,920,400 | | | $ | 12,148,593 | | |
| Asset Management & Custody Banks—7.0% | |
| MLP AG (Germany) | | Asset Management | | | 2,608,300 | | | $ | 37,143,011 | | |
Julius Baer Holding AG
(Switzerland) | | Asset Management | | | 301,000 | | | | 22,186,285 | | |
| | | | 59,329,296 | | |
| Investment Banking & Brokerage—2.8% | |
Ichiyoshi Securities Co.,
Ltd. (Japan) (a) | | Stock Broker | | | 2,399,500 | | | $ | 24,047,958 | | |
| Real Estate Management & Development—2.9% | |
LSL Property Services PLC
(United Kingdom) (a) | | Residential Property Service
Provider | | | 8,205,000 | | | $ | 21,820,639 | | |
| Estavis AG (Germany) (b) | | Real Estate Investment Company | | | 267,400 | | | | 3,026,869 | | |
| | | | 24,847,508 | | |
| Reinsurance—2.0% | |
Benfield Group Ltd.
(United Kingdom) | | Reinsurance Service Provider | | | 3,474,000 | | | $ | 17,167,745 | | |
| Health Care Distributors—0.3% | |
| Amplifon S.p.A. (Italy) | | Hearing Aids and Supplies
Distributor | | | 682,454 | | | $ | 2,316,460 | | |
THE OAKMARK INTERNATIONAL SMALL CAP FUND
50
THE OAKMARK INTERNATIONAL SMALL CAP FUND
Schedule of Investments—March 31, 2008 (Unaudited) cont.
| Name | | Description | | Shares Held | | Market Value | |
| Common Stocks—98.6% (cont.) | |
| Life Sciences Tools & Services—1.9% | |
| MDS, Inc. (Canada) (b) | | Products & Services for Medical
Product Manufactur | | | 859,200 | | | $ | 16,741,196 | | |
| Air Freight & Logistics—2.4% | |
Freightways Limited
(New Zealand) (a) | | Express Package Services | | | 7,624,568 | | | $ | 20,680,802 | | |
| Airport Services—1.4% | |
BBA Aviation PLC
(United Kingdom) | | Flight Support & Aftermarket
Services & Systems Provider | | | 3,896,200 | | | $ | 11,637,557 | | |
| Diversified Commercial & Professional Services—0.9% | |
| Cision AB (Sweden) (b) | | Business & Communication
Intelligence | | | 2,818,000 | | | $ | 7,825,341 | | |
| Human Resource & Employment Services—5.1% | |
Michael Page
International plc
(United Kingdom) | | Recruitment Consultancy Services | | | 3,851,700 | | | $ | 23,104,833 | | |
Pasona Group, Inc.
(Japan) (a) | | Placement Service Provider | | | 23,200 | | | | 14,593,098 | | |
Robert Walters plc
(United Kingdom) | | International Recruitment
Company | | | 1,609,900 | | | | 5,543,480 | | |
| | | | 43,241,411 | | |
| Industrial Conglomerates—4.0% | |
Tomkins plc
(United Kingdom) | | International Manufacturing | | | 5,869,500 | | | $ | 20,822,422 | | |
| Rheinmetall AG (Germany) | | Automotive Pump Manufacturer | | | 192,700 | | | | 13,598,853 | | |
| | | | 34,421,275 | | |
| Industrial Machinery—12.0% | |
| Duerr AG (Germany) (b) | | Automotive Industry
Machinery Manufacturer | | | 624,700 | | | $ | 26,234,100 | | |
Interpump Group S.p.A.
(Italy) | | Pump & Piston Manufacturer | | | 2,261,776 | | | | 21,692,465 | | |
Enodis plc
(United Kingdom) | | Food Processing Equipment | | | 7,678,150 | | | | 21,219,536 | | |
Heidelberger
Druckmaschinen AG
(Germany) | | Manufactures of Printing &
Binding Equipment | | | 732,300 | | | | 19,665,562 | | |
THE OAKMARK INTERNATIONAL SMALL CAP FUND
51
THE OAKMARK INTERNATIONAL SMALL CAP FUND
Schedule of Investments—March 31, 2008 (Unaudited) cont.
| Name | | Description | | Shares Held | | Market Value | |
| Common Stocks—98.6% (cont.) | |
| Industrial Machinery—12.0% (cont.) | |
IMI PLC (United Kingdom) Manufactures Merchandise Displays,
Ventilation & Air Conditioning | |
Equipment | | | 1,492,200 | | | $ | 13,467,402 | | |
| | | | 102,279,065 | | |
| Office Services & Supplies—2.4% | |
Sperian Protection (France) Manufactures Protection Equipment
For People In Hazardous Work | |
Environments | | | 177,600 | | | $ | 20,524,239 | | |
| Communications Equipment—1.3% | |
Raymarine PLC
(United Kingdom) | | Leisure Marine Electronics Products | | | 2,345,057 | | | $ | 10,832,462 | | |
| Computer Hardware—0.3% | |
Wincor Nixdorf AG
(Germany) | | Banking Machines & Cash
Registers Manufacturer | | | 27,400 | | | $ | 2,193,166 | | |
| Electronic Equipment Manufacturers—4.0% | |
| Orbotech, Ltd. (Israel) (b) | | Optical Inspection Systems | | | 1,464,025 | | | $ | 26,850,218 | | |
Hirose Electric Co., Ltd.
(Japan) Develops & Sells Electronic | |
Equipment | | | 67,700 | | | | 7,599,950 | | |
| | | | 34,450,168 | | |
| Home Entertainment Software—0.6% | |
| Square Enix Co., Ltd. | | | | | | | | |
| | |
| (Japan) | | Develops & Sells Entertainment | | | | | | |
| | |
| | | Software for Video Game | | | | | | |
| | |
| | | Consoles | | | 141,600 | | | $ | 4,943,499 | | |
| IT Consulting & Other Services—4.1% | |
| Ementor ASA (Norway) (b) | | Management & IT Consulting
Services | | | 3,761,000 | | | $ | 24,224,729 | | |
Morse PLC
(United Kingdom) (a) | | IT Consulting & Other Services | | | 8,843,615 | | | | 11,057,437 | | |
| | | | 35,282,166 | | |
| Office Electronics—6.1% | |
| Neopost SA (France) | | Mailroom Equipment Supplier | | | 385,189 | | | $ | 43,231,014 | | |
Boewe Systec AG
(Germany) | | Automated Paper Management
Systems Producer | | | 285,039 | | | | 9,144,101 | | |
| | | | 52,375,115 | | |
THE OAKMARK INTERNATIONAL SMALL CAP FUND
52
THE OAKMARK INTERNATIONAL SMALL CAP FUND
Schedule of Investments—March 31, 2008 (Unaudited) cont.
| Name | | Description | | Shares Held/
Par Value | | Market Value | |
| Common Stocks—98.6% (cont.) | |
| Systems Software—0.4% | |
Monitise PLC
(United Kingdom) (a) (b) | | Mobile Banking Service Solutions | | | 24,657,285 | | | $ | 3,303,187 | | |
| Construction Materials—2.0% | |
Titan Cement Co. SA
(Greece) | | Cement & Building Materials
Producer & Distributor | | | 410,700 | | | $ | 17,454,716 | | |
| Total Common Stocks (Cost: $907,704,529) | | | | | | | | | 842,795,951 | | |
| Short Term Investment—1.4% | |
| Repurchase Agreement—1.4% | |
Fixed Income Clearing Corp. Repurchase Agreement,
2.25% dated 3/31/2008 due 4/1/2008, repurchase
price $12,121,653 collateralized by a Federal National
Mortgage Association Bond, with a rate of 6.375%,
with a maturity of 6/15/2009, and with an aggregate
market value plus accrued interest of $12,731,806 | | | | $ | 12,120,895 | | | $ | 12,120,895 | | |
| Total Repurchase Agreement (Cost: $12,120,895) | | | | | | | | | 12,120,895 | | |
| Total Short Term Investment (Cost: $12,120,895) | | | | | | | | | 12,120,895 | | |
| Total Investments (Cost: $919,825,424)—100.0% | | | | | | | | $ | 854,916,846 | | |
| Other Assets In Excess of Liabilities—0.0% | | | | | | | | | 15,881 | | |
| Total Net Assets—100% | | | | | | | | $ | 854,932,727 | | |
(a) See footnote number five in the Notes to the Financial Statements regarding investments in affiliated issuers.
(b) Non income-producing security.
See accompanying Notes to Financial Statements.
THE OAKMARK INTERNATIONAL SMALL CAP FUND
53
THE OAKMARK FUNDS
Statements of Assets and Liabilities—March 31, 2008 (Unaudited)
| | | | | The Oakmark
Fund | | The Oakmark
Select
Fund | | The Oakmark
Equity and
Income Fund | |
| Assets | |
| Investments in unaffiliated securities, at value | | (a) | | $ | 4,137,518,689 | | | $ | 3,388,708,230 | | | $ | 13,407,667,809 | | |
| Investments in affiliated securities, at value | | (b) | | | 0 | | | | 0 | | | | 512,486,998 | | |
| Foreign currency, at value | | (c) | | | 0 | | | | 0 | | | | 0 | | |
| Receivable for: | |
| Securities sold | | | | | 0 | | | | 15,394,153 | | | | 16,434,412 | | |
| Fund shares sold | | | | | 3,191,690 | | | | 4,998,929 | | | | 43,344,357 | | |
| Dividends and interest | | | | | 4,535,848 | | | | 2,908,611 | | | | 62,965,867 | | |
| Tax reclaim | | | | | 350,483 | | | | 0 | | | | 0 | | |
| Total receivables | | | | | 8,078,021 | | | | 23,301,693 | | | | 122,744,636 | | |
| Other assets | | | | | 58,945 | | | | 56,168 | | | | 103,956 | | |
| Total assets | | | | $ | 4,145,655,655 | | | $ | 3,412,066,091 | | | $ | 14,043,003,399 | | |
| Liabilities and Net Assets | |
| Custodian Bank | | | | $ | 0 | | | $ | 0 | | | $ | 0 | | |
| Payable for: | |
| Securities purchased | | | | | 0 | | | | 0 | | | | 22,483,535 | | |
| Fund shares redeemed | | | | | 5,081,032 | | | | 6,121,952 | | | | 11,991,038 | | |
| Forward foreign currency contracts | | | | | 0 | | | | 0 | | | | 0 | | |
| Investment advisory fee | | | | | 294,527 | | | | 248,612 | | | | 739,437 | | |
| Other shareholder servicing fees | | | | | 557,601 | | | | 759,884 | | | | 2,961,827 | | |
| Transfer and dividend disbursing agent fees | | | | | 494,554 | | | | 324,166 | | | | 382,873 | | |
| Deferred trustee compensation | | | | | 1,028,835 | | | | 905,892 | | | | 826,177 | | |
| Other | | | | | 632,429 | | | | 555,850 | | | | 1,632,795 | | |
| Total liabilities | | | | | 8,088,978 | | | | 8,916,356 | | | | 41,017,682 | | |
| Net assets applicable to Fund shares outstanding | | | | $ | 4,137,566,677 | | | $ | 3,403,149,735 | | | $ | 14,001,985,717 | | |
| Analysis of Net Assets | |
| Paid in capital | | | | $ | 3,232,831,816 | | | $ | 2,889,031,295 | | | $ | 11,491,088,664 | | |
Accumulated undistributed net realized gain (loss) of investments, forward
contracts, options, short sales and foreign currency transactions | | | | | 394,938,603 | | | | 179,877,260 | | | | 115,455,342 | | |
| Net unrealized appreciation (depreciation) of investments and foreign currencies | | | | | 496,522,846 | | | | 319,061,584 | | | | 2,331,512,308 | | |
| Net unrealized appreciation—other | | | | | 57,831 | | | | 0 | | | | 61,380 | | |
| Accumulated undistributed net investment income | | | | | 13,215,581 | | | | 15,179,596 | | | | 63,868,023 | | |
| Net assets applicable to Fund shares outstanding | | | | $ | 4,137,566,677 | | | $ | 3,403,149,735 | | | $ | 14,001,985,717 | | |
| Price of Shares | |
| Net asset value per share: Class I | | | | $ | 37.40 | | | $ | 23.52 | | | $ | 27.14 | | |
| Class I—Net assets | | | | $ | 4,118,812,047 | | | $ | 3,382,268,736 | | | $ | 13,013,072,232 | | |
| Class I—Shares outstanding (Unlimited shares authorized) | | | | | 110,140,775 | | | | 143,774,611 | | | | 479,532,950 | | |
| Net asset value per share: Class II | | | | $ | 37.24 | | | $ | 23.46 | | | $ | 27.00 | | |
| Class II—Net assets | | | | $ | 18,754,630 | | | $ | 20,880,999 | | | $ | 988,913,485 | | |
| Class II—Shares outstanding (Unlimited shares authorized) | | | | | 503,581 | | | | 890,125 | | | | 36,621,538 | | |
| (a) Identified cost of investments in unaffiliated securities | | | | $ | 3,640,995,843 | | | $ | 3,069,646,646 | | | $ | 11,092,260,633 | | |
| (b) Identified cost of investments in affiliated securities | | | | | 0 | | | | 0 | | | | 496,381,866 | | |
| (c) Identified cost of foreign currency | | | | | 0 | | | | 0 | | | | 0 | | |
THE OAKMARK FUNDS
54
| | | The Oakmark
Global
Fund | | The Oakmark
Global Select
Fund | | The Oakmark
International
Fund | | The Oakmark
International
Small Cap Fund | |
| Assets | |
| Investments in unaffiliated securities, at value | | $ | 2,479,769,022 | | | $ | 278,713,701 | | | $ | 6,000,576,193 | | | $ | 672,757,700 | | |
| Investments in affiliated securities, at value | | | 0 | | | | 0 | | | | 391,517,661 | | | | 182,159,146 | | |
| Foreign currency, at value | | | 379 | | | | 48 | | | | 121,261 | | | | 0 | | |
| Receivable for: | |
| Securities sold | | | 52,856 | | | | 0 | | | | 39,758,717 | | | | 1,613,919 | | |
| Fund shares sold | | | 2,178,070 | | | | 514,680 | | | | 10,922,720 | | | | 1,318,085 | | |
| Dividends and interest | | | 7,234,343 | | | | 1,128,832 | | | | 47,448,940 | | | | 3,065,865 | | |
| Tax reclaim | | | 3,347,440 | | | | 220,517 | | | | 10,902,786 | | | | 1,127,944 | | |
| Total receivables | | | 12,812,709 | | | | 1,864,029 | | | | 109,033,163 | | | | 7,125,813 | | |
| Other assets | | | 45,835 | | | | 31,068 | | | | 76,420 | | | | 35,899 | | |
| Total assets | | $ | 2,492,627,945 | | | $ | 280,608,846 | | | $ | 6,501,324,698 | | | $ | 862,078,558 | | |
| Liabilities and Net Assets | |
| Custodian Bank | | $ | 0 | | | $ | 0 | | | $ | 0 | | | $ | 342,154 | | |
| Payable for: | |
| Securities purchased | | | 4,696,207 | | | | 0 | | | | 20,564,334 | | | | 971,576 | | |
| Fund shares redeemed | | | 2,521,767 | | | | 114,915 | | | | 14,209,357 | | | | 1,191,058 | | |
| Forward foreign currency contracts | | | 22,185,673 | | | | 1,988,822 | | | | 59,430,944 | | | | 3,616,394 | | |
| Investment advisory fee | | | 201,438 | | | | 23,370 | | | | 477,391 | | | | 85,618 | | |
| Other shareholder servicing fees | | | 230,371 | | | | 29,732 | | | | 1,804,547 | | | | 124,960 | | |
| Transfer and dividend disbursing agent fees | | | 176,957 | | | | 52,746 | | | | 282,848 | | | | 44,049 | | |
| Deferred trustee compensation | | | 429,332 | | | | 13,517 | | | | 713,623 | | | | 410,817 | | |
| Other | | | 647,705 | | | | 112,788 | | | | 2,316,772 | | | | 359,205 | | |
| Total liabilities | | | 31,089,450 | | | | 2,335,890 | | | | 99,799,816 | | | | 7,145,831 | | |
| Net assets applicable to Fund shares outstanding | | $ | 2,461,538,495 | | | $ | 278,272,956 | | | $ | 6,401,524,882 | | | $ | 854,932,727 | | |
| Analysis of Net Assets | |
| Paid in capital | | $ | 2,215,850,185 | | | $ | 340,023,471 | | | $ | 6,414,567,728 | | | $ | 929,415,272 | | |
Accumulated undistributed net realized gain (loss) of investments, forward
contracts, options, short sales and foreign currency transactions | | | 85,384,842 | | | | (15,725,055 | ) | | | 407,845,134 | | | | (8,517,571 | ) | |
| Net unrealized appreciation (depreciation) of investments and foreign currencies | | | 160,058,201 | | | | (48,759,333 | ) | | | (452,330,255 | ) | | | (68,523,629 | ) | |
| Net unrealized appreciation—other | | | 484,521 | | | | 21,378 | | | | 1,263,467 | | | | 193,028 | | |
| Accumulated undistributed net investment income | | | (239,254 | ) | | | 2,712,495 | | | | 30,178,808 | | | | 2,365,627 | | |
| Net assets applicable to Fund shares outstanding | | $ | 2,461,538,495 | | | $ | 278,272,956 | | | $ | 6,401,524,882 | | | $ | 854,932,727 | | |
| Price of Shares | |
| Net asset value per share: Class I | | $ | 22.06 | | | $ | 9.08 | | | $ | 18.63 | | | $ | 13.99 | | |
| Class I—Net assets | | $ | 2,391,222,628 | | | $ | 278,272,956 | | | $ | 6,009,552,313 | | | $ | 854,360,689 | | |
| Class I—Shares outstanding (Unlimited shares authorized) | | | 108,380,098 | | | | 30,650,555 | | | | 322,534,096 | | | | 61,081,730 | | |
| Net asset value per share: Class II | | $ | 21.62 | | | $ | 0 | | | $ | 18.47 | | | $ | 13.95 | | |
| Class II—Net assets | | $ | 70,315,867 | | | $ | 0 | | | $ | 391,972,569 | | | $ | 572,038 | | |
| Class II—Shares outstanding (Unlimited shares authorized) | | | 3,251,744 | | | | 0 | | | | 21,218,336 | | | | 41,003 | | |
| (a) Identified cost of investments in unaffiliated securities | | $ | 2,297,524,768 | | | $ | 325,484,212 | | | $ | 6,197,984,701 | | | $ | 672,182,784 | | |
| (b) Identified cost of investments in affiliated securities | | | 0 | | | | 0 | | | | 587,107,718 | | | | 247,642,640 | | |
| (c) Identified cost of foreign currency | | | 378 | | | | 48 | | | | 121,485 | | | | 0 | | |
See accompanying Notes to Financial Statements.
THE OAKMARK FUNDS
55
THE OAKMARK FUNDS
Statements of Operations—March 31, 2008 (Unaudited)
| | | The Oakmark
Fund | | The Oakmark
Select
Fund | | The Oakmark
Equity and
Income Fund | | The Oakmark
Global
Fund | |
| Investment Income: | |
| Dividends from unaffiliated securities | | $ | 47,993,261 | | | $ | 49,776,796 | | | $ | 43,159,045 | | | $ | 19,003,245 | | |
| Dividends from affiliated securities | | | 0 | | | | 0 | | | | 231,318 | | | | 0 | | |
| Interest income | | | 4,770,706 | | | | 3,935,670 | | | | 136,736,930 | | | | 1,021,843 | | |
| Security lending income | | | 0 | | | | 0 | | | | 0 | | | | 0 | | |
| Other income | | | 2,257,153 | | | | 50,708 | | | | 113,252 | | | | 66,902 | | |
| Foreign taxes withheld | | | 0 | | | | 0 | | | | (431,544 | ) | | | (892,842 | ) | |
| Total investment income | | | 55,021,120 | | | | 53,763,174 | | | | 179,809,001 | | | | 19,199,148 | | |
| Expenses: | |
| Investment advisory fee | | | 22,708,514 | | | | 19,433,388 | | | | 47,467,160 | | | | 14,139,210 | | |
| Transfer and dividend disbursing agent fees | | | 908,717 | | | | 590,471 | | | | 717,114 | | | | 332,476 | | |
| Other shareholder servicing fees | | | 1,878,731 | | | | 1,844,755 | | | | 6,175,669 | | | | 789,401 | | |
| Service Fee—Class II | | | 30,779 | | | | 36,739 | | | | 1,149,118 | | | | 101,983 | | |
| Reports to shareholders | | | 509,550 | | | | 409,408 | | | | 727,114 | | | | 221,279 | | |
| Custody and accounting fees | | | 315,675 | | | | 248,968 | | | | 799,526 | | | | 765,077 | | |
| Registration and blue sky expenses | | | 9,528 | | | | 8,105 | | | | 149,079 | | | | 30,089 | | |
| Legal fees | | | 68,240 | | | | 64,418 | | | | 124,191 | | | | 55,886 | | |
| Audit fees | | | 26,591 | | | | 24,587 | | | | 52,586 | | | | 20,698 | | |
| Other | | | 106,980 | | | | 105,769 | | | | 294,696 | | | | 127,082 | | |
| Total expenses | | | 26,563,305 | | | | 22,766,608 | | | | 57,656,253 | | | | 16,583,181 | | |
| Expense offset credit | | | 0 | | | | 0 | | | | (669 | ) | | | 0 | | |
| Net expenses | | | 26,563,305 | | | | 22,766,608 | | | | 57,655,584 | | | | 16,583,181 | | |
| Net Investment Income: | | | 28,457,815 | | | | 30,996,566 | | | | 122,153,417 | | | | 2,615,967 | | |
Net realized and unrealized gain (loss) on
investments and foreign currency transactions: | |
| Net realized gain (loss) on unaffiliated securities | | | 426,585,906 | | | | 203,937,687 | | | | 252,159,787 | | | | 146,105,360 | | |
| Net realized gain (loss) on affiliated securities | | | 0 | | | | 0 | | | | 2,734,627 | | | | 0 | | |
| Net realized gain (loss) on foreign currency transactions | | | 7,267 | | | | 0 | | | | (1,619,155 | ) | | | (7,199,483 | ) | |
Net change in unrealized appreciation (depreciation) of
investments and foreign currencies | | | (1,169,121,671 | ) | | | (1,195,550,451 | ) | | | (110,038,253 | ) | | | (490,473,568 | ) | |
| Net change in unrealized appreciation (depreciation)—other | | | 33,922 | | | | 0 | | | | (258,307 | ) | | | 338,022 | | |
Net realized and unrealized gain (loss) on
investments and foreign currency transactions: | | | (742,494,576 | ) | | | (991,612,764 | ) | | | 142,978,699 | | | | (351,229,669 | ) | |
| Net increase (decrease) in net assets from operations | | $ | (714,036,761 | ) | | $ | (960,616,198 | ) | | $ | 265,132,116 | | | $ | (348,613,702 | ) | |
THE OAKMARK FUNDS
56
| | | The Oakmark
Global Select
Fund | | The Oakmark
International
Fund | | The Oakmark
International
Small Cap Fund | |
| Investment Income: | |
| Dividends from unaffiliated securities | | $ | 3,995,573 | | | $ | 78,676,345 | | | $ | 7,325,729 | | |
| Dividends from affiliated securities | | | 0 | | | | 4,117,950 | | | | 3,342,313 | | |
| Interest income | | | 367,107 | | | | 3,748,514 | | | | 469,664 | | |
| Security lending income | | | 0 | | | | 42,976 | | | | 0 | | |
| Other income | | | 0 | | | | 183,929 | | | | 0 | | |
| Foreign taxes withheld | | | (89,443 | ) | | | (3,264,033 | ) | | | (545,384 | ) | |
| Total investment income | | | 4,273,237 | | | | 83,505,681 | | | | 10,592,322 | | |
| Expenses: | |
| Investment advisory fee | | | 1,623,572 | | | | 35,456,441 | | | | 6,317,014 | | |
| Transfer and dividend disbursing agent fees | | | 82,716 | | | | 522,452 | | | | 79,846 | | |
| Other shareholder servicing fees | | | 113,604 | | | | 3,474,473 | | | | 313,775 | | |
| Service Fee—Class II | | | 0 | | | | 623,943 | | | | 360 | | |
| Reports to shareholders | | | 49,140 | | | | 521,519 | | | | 71,792 | | |
| Custody and accounting fees | | | 84,834 | | | | 2,982,058 | | | | 464,936 | | |
| Registration and blue sky expenses | | | 15,900 | | | | 51,498 | | | | 63,701 | | |
| Legal fees | | | 41,692 | | | | 68,307 | | | | 36,867 | | |
| Audit fees | | | 6,880 | | | | 36,883 | | | | 14,788 | | |
| Other | | | 109,390 | | | | 197,635 | | | | 93,959 | | |
| Total expenses | | | 2,127,728 | | | | 43,935,209 | | | | 7,457,038 | | |
| Expense offset credit | | | 0 | | | | 0 | | | | 0 | | |
| Net expenses | | | 2,127,728 | | | | 43,935,209 | | | | 7,457,038 | | |
| Net Investment Income: | | | 2,145,509 | | | | 39,570,472 | | | | 3,135,284 | | |
Net realized and unrealized gain (loss) on
investments and foreign currency transactions: | |
| Net realized gain (loss) on unaffiliated securities | | | (8,635,232 | ) | | | 441,110,902 | | | | 50,243,482 | | |
| Net realized gain (loss) on affiliated securities | | | 0 | | | | 85,060,005 | | | | (33,422,852 | ) | |
| Net realized gain (loss) on foreign currency transactions | | | (451,505 | ) | | | (52,960,405 | ) | | | (8,169,335 | ) | |
Net change in unrealized appreciation (depreciation) of
investments and foreign currencies | | | (56,630,966 | ) | | | (1,779,267,456 | ) | | | (206,202,682 | ) | |
| Net change in unrealized appreciation (depreciation)—other | | | (24,266 | ) | | | 318,896 | | | | 101,017 | | |
Net realized and unrealized gain (loss) on
investments and foreign currency transactions: | | | (65,741,969 | ) | | | (1,305,738,058 | ) | | | (197,450,370 | ) | |
| Net increase (decrease) in net assets from operations | | $ | (63,596,460 | ) | | $ | (1,266,167,586 | ) | | $ | (194,315,086 | ) | |
See accompanying Notes to Financial Statements.
THE OAKMARK FUNDS
57
THE OAKMARK FAMILY OF FUNDS
Statements of Changes in Net Assets—March 31, 2008
| | | The Oakmark Fund | |
| | | Six Months Ended
March 31, 2008
(Unaudited) | | Year Ended
September 30, 2007 | |
| From Operations: | |
| Net investment income | | $ | 28,457,815 | | | $ | 59,659,681 | | |
| Net realized gain (loss) on investments | | | 426,585,906 | | | | 420,551,189 | | |
| Net realized gain (loss) on foreign currency transactions | | | 7,267 | | | | (15,670 | ) | |
Net change in unrealized appreciation (depreciation) of
investments | | | (1,169,121,671 | ) | | | 156,908,305 | | |
| Net change in unrealized appreciation (depreciation)—other | | | 33,922 | | | | 22,000 | | |
| Net increase (Decrease) in net assets from operations | | | (714,036,761 | ) | | | 637,125,505 | | |
| Distributions to shareholders from: | |
| Net investment income—Class I | | | (63,359,490 | ) | | | (53,539,601 | ) | |
| Net investment income—Class II | | | (183,228 | ) | | | (208,772 | ) | |
| Net realized gain—Class I | | | (390,070,385 | ) | | | (247,108,056 | ) | |
| Net realized gain—Class II | | | (1,912,155 | ) | | | (1,637,719 | ) | |
| Total distributions to shareholders | | | (455,525,258 | ) | | | (302,494,148 | ) | |
| From Fund share transactions: | |
| Proceeds from shares sold—Class I | | | 266,054,064 | | | | 861,518,944 | | |
| Proceeds from shares sold—Class II | | | 1,967,290 | | | | 9,068,112 | | |
| Reinvestment of distributions—Class I | | | 430,878,990 | | | | 284,353,008 | | |
| Reinvestment of distributions—Class II | | | 1,896,434 | | | | 1,632,253 | | |
| Payment for shares redeemed—Class I | | | (1,071,165,811 | ) | | | (1,307,641,112 | ) | |
| Payment for shares redeemed—Class II | | | (8,618,598 | ) | | | (21,478,972 | ) | |
| Redemption fees—Class I | | | 124,203 | | | | 247,506 | | |
| Redemption fees—Class II | | | 595 | | | | 1,510 | | |
Net decrease in net assets from Fund
share transactions | | | (378,862,833 | ) | | | (172,298,751 | ) | |
| Total increase (decrease) in net assets | | | (1,548,424,852 | ) | | | 162,332,606 | | |
| Net assets: | |
| Beginning of period | | | 5,685,991,529 | | | | 5,523,658,923 | | |
| End of period | | $ | 4,137,566,677 | | | $ | 5,685,991,529 | | |
| Undistributed net investment income | | $ | 13,215,581 | | | $ | 56,183,788 | | |
| Fund Share Transactions—Class I: | |
| Shares sold | | | 6,447,129 | | | | 18,391,432 | | |
| Shares issued in reinvestment of dividends | | | 10,405,192 | | | | 6,185,622 | | |
| Less shares redeemed | | | (26,349,166 | ) | | | (27,830,195 | ) | |
| Net decrease in shares outstanding | | | (9,496,845 | ) | | | (3,253,141 | ) | |
| Fund Share Transactions—Class II: | |
| Shares sold | | | 48,301 | | | | 194,191 | | |
| Shares issued in reinvestment of dividends | | | 45,919 | | | | 35,647 | | |
| Less shares redeemed | | | (209,126 | ) | | | (456,470 | ) | |
| Net decrease in shares outstanding | | | (114,906 | ) | | | (226,632 | ) | |
THE OAKMARK FUNDS
58
| | | The Oakmark Select Fund | |
| | | Six Months Ended
March 31, 2008
(Unaudited) | | Year Ended
September 30, 2007 | |
| From Operations: | |
| Net investment income | | $ | 30,996,566 | | | $ | 66,533,144 | | |
| Net realized gain (loss) on investments | | | 203,937,687 | | | | 507,407,977 | | |
Net change in unrealized appreciation (depreciation) of
investments | | | (1,195,550,451 | ) | | | (160,141,522 | ) | |
| Net increase (decrease) in net assets from operations | | | (960,616,198 | ) | | | 413,799,599 | | |
| Distributions to shareholders from: | |
| Net investment income—Class I | | | (47,232,113 | ) | | | (64,072,754 | ) | |
| Net investment income—Class II | | | (109,439 | ) | | | (433,784 | ) | |
| Net realized gain—Class I | | | (453,955,609 | ) | | | (576,351,927 | ) | |
| Net realized gain—Class II | | | (3,023,661 | ) | | | (6,348,277 | ) | |
| Total distributions to shareholders | | | (504,320,822 | ) | | | (647,206,742 | ) | |
| From Fund share transactions: | |
| Proceeds from shares sold—Class I | | | 285,542,231 | | | | 774,598,160 | | |
| Proceeds from shares sold—Class II | | | 4,656,360 | | | | 15,646,313 | | |
| Reinvestment of distributions—Class I | | | 475,037,840 | | | | 618,361,472 | | |
| Reinvestment of distributions—Class II | | | 1,916,898 | | | | 3,215,331 | | |
| Payment for shares redeemed—Class I | | | (1,320,605,404 | ) | | | (1,541,125,659 | ) | |
| Payment for shares redeemed—Class II | | | (12,347,231 | ) | | | (48,592,972 | ) | |
| Redemption fees—Class I | | | 268,864 | | | | 223,491 | | |
| Redemption fees—Class II | | | 1,764 | | | | 2,154 | | |
Net decrease in net assets from Fund
share transactions | | | (565,528,678 | ) | | | (177,671,710 | ) | |
| Total decrease in net assets | | | (2,030,465,698 | ) | | | (411,078,853 | ) | |
| Net assets: | |
| Beginning of period | | | 5,433,615,433 | | | | 5,844,694,286 | | |
| End of period | | $ | 3,403,149,735 | | | $ | 5,433,615,433 | | |
| Undistributed net investment income | | $ | 15,179,596 | | | $ | 39,662,331 | | |
| Fund Share Transactions—Class I: | |
| Shares sold | | | 10,967,221 | | | | 22,573,030 | | |
| Shares issued in reinvestment of dividends | | | 18,055,426 | | | | 18,359,901 | | |
| Less shares redeemed | | | (48,565,723 | ) | | | (45,169,924 | ) | |
| Net decrease in shares outstanding | | | (19,543,076 | ) | | | (4,236,993 | ) | |
| Fund Share Transactions—Class II: | |
| Shares sold | | | 178,671 | | | | 459,298 | | |
| Shares issued in reinvestment of dividends | | | 72,941 | | | | 95,865 | | |
| Less shares redeemed | | | (464,948 | ) | | | (1,441,127 | ) | |
| Net decrease in shares outstanding | | | (213,336 | ) | | | (885,964 | ) | |
See accompanying Notes to Financial Statements.
THE OAKMARK FUNDS
59
THE OAKMARK FAMILY OF FUNDS
Statements of Changes in Net Assets—March 31, 2008
| | | The Oakmark
Equity and Income Fund | |
| | | Six Months Ended
March 31, 2008
(Unaudited) | | Year Ended
September 30, 2007 | |
| From Operations: | |
| Net investment income | | $ | 122,153,417 | | | $ | 262,368,113 | | |
| Net realized gain (loss) on investments | | | 254,894,414 | | | | 755,956,267 | | |
| Net realized gain (loss) on foreign currency transactions | | | (1,619,155 | ) | | | (1,022,336 | ) | |
Net change in unrealized appreciation (depreciation) of
investments | | | (110,038,253 | ) | | | 777,795,316 | | |
| Net change in unrealized appreciation (depreciation)—other | | | (258,307 | ) | | | (164,029 | ) | |
| Net increase in net assets from operations | | | 265,132,116 | | | | 1,794,933,331 | | |
| Distributions to shareholders from: | |
| Net investment income—Class I | | | (267,040,847 | ) | | | (197,295,609 | ) | |
| Net investment income—Class II | | | (16,635,460 | ) | | | (11,590,883 | ) | |
| Net realized gain—Class I | | | (664,942,641 | ) | | | (514,829,367 | ) | |
| Net realized gain—Class II | | | (48,763,224 | ) | | | (36,037,949 | ) | |
| Total distributions to shareholders | | | (997,382,172 | ) | | | (759,753,808 | ) | |
| From Fund share transactions: | |
| Proceeds from shares sold—Class I | | | 1,621,618,797 | | | | 2,268,150,133 | | |
| Proceeds from shares sold—Class II | | | 207,486,883 | | | | 303,169,618 | | |
| Reinvestment of distributions—Class I | | | 889,651,167 | | | | 676,419,126 | | |
| Reinvestment of distributions—Class II | | | 54,888,687 | | | | 38,550,451 | | |
| Payment for shares redeemed—Class I | | | (1,303,397,231 | ) | | | (1,835,852,952 | ) | |
| Payment for shares redeemed—Class II | | | (140,801,577 | ) | | | (213,986,804 | ) | |
| Redemption fees—Class I | | | 109,467 | | | | 396,816 | | |
| Redemption fees—Class II | | | 8,009 | | | | 28,756 | | |
Net increase in net assets from Fund
share transactions | | | 1,329,564,202 | | | | 1,236,875,144 | | |
| Total increase in net assets | | | 597,314,146 | | | | 2,272,054,667 | | |
| Net assets: | |
| Beginning of period | | | 13,404,671,571 | | | | 11,132,616,904 | | |
| End of period | | $ | 14,001,985,717 | | | $ | 13,404,671,571 | | |
| Undistributed net investment income | | $ | 63,868,023 | | | $ | 247,021,572 | | |
| Fund Share Transactions—Class I: | |
| Shares sold | | | 59,222,483 | | | | 84,094,622 | | |
| Shares issued in reinvestment of dividends | | | 32,913,474 | | | | 26,036,152 | | |
| Less shares redeemed | | | (48,225,497 | ) | | | (67,666,574 | ) | |
| Net increase in shares outstanding | | | 43,910,460 | | | | 42,464,200 | | |
| Fund Share Transactions—Class II: | |
| Shares sold | | | 7,601,913 | | | | 11,303,525 | | |
| Shares issued in reinvestment of dividends | | | 2,038,956 | | | | 1,489,010 | | |
| Less shares redeemed | | | (5,132,678 | ) | | | (7,935,650 | ) | |
| Net increase in shares outstanding | | | 4,508,191 | | | | 4,856,885 | | |
THE OAKMARK FUNDS
60
| | | The Oakmark
Global Fund | |
| | | Six Months Ended
March 31, 2008
(Unaudited) | | Year Ended
September 30, 2007 | |
| From Operations: | |
| Net investment income | | $ | 2,615,967 | | | $ | 18,208,414 | | |
| Net realized gain (loss) on investments | | | 146,105,360 | | | | 324,857,952 | | |
| Net realized gain (loss) on foreign currency transactions | | | (7,199,483 | ) | | | (3,749,056 | ) | |
Net change in unrealized appreciation (depreciation) of
investments and foreign currencies | | | (490,473,568 | ) | | | 180,426,535 | | |
| Net change in unrealized appreciation (depreciation)—other | | | 338,022 | | | | 106,323 | | |
| Net increase (decrease) in net assets from operations | | | (348,613,702 | ) | | | 519,850,168 | | |
| Distributions to shareholders from: | |
| Net investment income—Class I | | | (3,871,234 | ) | | | (27,704,385 | ) | |
| Net investment income—Class II | | | (32,194 | ) | | | (645,340 | ) | |
| Net realized gain—Class I | | | (320,103,434 | ) | | | (312,319,850 | ) | |
| Net realized gain—Class II | | | (9,615,919 | ) | | | (10,681,345 | ) | |
| Total distributions to shareholders | | | (333,622,781 | ) | | | (351,350,920 | ) | |
| From Fund share transactions: | |
| Proceeds from shares sold—Class I | | | 230,159,507 | | | | 609,489,866 | | |
| Proceeds from shares sold—Class II | | | 3,042,094 | | | | 17,269,919 | | |
| Reinvestment of distributions—Class I | | | 313,393,002 | | | | 326,216,720 | | |
| Reinvestment of distributions—Class II | | | 9,333,596 | | | | 10,756,868 | | |
| Payment for shares redeemed—Class I | | | (496,215,280 | ) | | | (375,481,639 | ) | |
| Payment for shares redeemed—Class II | | | (12,612,738 | ) | | | (19,691,332 | ) | |
| Redemption fees—Class I | | | 136,077 | | | | 161,035 | | |
| Redemption fees—Class II | | | 3,987 | | | | 5,156 | | |
Net increase in net assets from Fund
share transactions | | | 47,240,245 | | | | 568,726,593 | | |
| Total increase (decrease) in net assets | | | (634,996,238 | ) | | | 737,225,841 | | |
| Net assets: | |
| Beginning of period | | | 3,096,534,733 | | | | 2,359,308,892 | | |
| End of period | | $ | 2,461,538,495 | | | $ | 3,096,534,733 | | |
| Undistributed net invesment income (loss) | | $ | (239,254 | ) | | $ | 8,856,800 | | |
| Fund Share Transactions—Class I: | |
| Shares sold | | | 9,384,542 | | | | 22,540,232 | | |
| Shares issued in reinvestment of dividends | | | 12,822,954 | | | | 12,934,841 | | |
| Less shares redeemed | | | (20,868,383 | ) | | | (13,937,033 | ) | |
| Net increase in shares outstanding | | | 1,339,113 | | | | 21,538,040 | | |
| Fund Share Transactions—Class II: | |
| Shares sold | | | 126,154 | | | | 643,786 | | |
| Shares issued in reinvestment of dividends | | | 389,224 | | | | 432,350 | | |
| Less shares redeemed | | | (533,094 | ) | | | (737,986 | ) | |
| Net increase (decrease) in shares outstanding | | | (17,716 | ) | | | 338,150 | | |
See accompanying Notes to Financial Statements.
THE OAKMARK FUNDS
61
THE OAKMARK FAMILY OF FUNDS
Statements of Changes in Net Assets—March 31, 2008
| | | The Oakmark
Global Select Fund | |
| | | Six Months Ended
March 31, 2008
(Unaudited) | | Period Ended
September 30, 2007 (a) | |
| From Operations: | |
| Net investment income | | $ | 2,145,509 | | | $ | 2,383,876 | | |
| Net realized gain (loss) on investments | | | (8,635,232 | ) | | | 7,145,836 | | |
| Net realized gain (loss) on foreign currency transactions | | | (451,505 | ) | | | (448,111 | ) | |
Net change in unrealized appreciation (depreciation) of
investments and foreign currencies | | | (56,630,966 | ) | | | 7,871,633 | | |
| Net change in unrealized appreciation (depreciation)—other | | | (24,266 | ) | | | 45,644 | | |
| Net Increase (decrease) in net assets from operations | | | (63,596,460 | ) | | | 16,998,878 | | |
| Distributions to shareholders from: | |
| Net investment income—Class I | | | (725,378 | ) | | | (114,308 | ) | |
| Net realized gain—Class I | | | (13,374,800 | ) | | | — | | |
| Total distributions to shareholders | | | (14,100,178 | ) | | | (114,308 | ) | |
| From fund share transactions: | |
| Proceeds from shares sold—Class I | | | 119,634,750 | | | | 417,863,246 | | |
| Reinvestment of distributions—Class I | | | 13,571,774 | | | | 113,161 | | |
| Payment for shares redeemed—Class I | | | (155,043,556 | ) | | | (57,339,417 | ) | |
| Redemption fees—Class I | | | 118,465 | | | | 166,601 | | |
Net increase (decrease) in net assets from Fund
Share Transactions | | | (21,718,567 | ) | | | 360,803,591 | | |
| Total increase (decrease) in net assets | | | (99,415,205 | ) | | | 377,688,161 | | |
| Net assets: | |
| Beginning of period | | | 377,688,161 | | | | — | | |
| End of period | | $ | 278,272,956 | | | $ | 377,688,161 | | |
| Undistributed net investment income | | $ | 2,712,495 | | | $ | 1,821,456 | | |
| Fund Share Transactions—Class I: | |
| Shares sold | | | 12,124,100 | | | | 37,547,411 | | |
| Shares issued in reinvestment of dividends | | | 1,303,725 | | | | 10,576 | | |
| Less shares redeemed | | | (15,321,224 | ) | | | (5,014,033 | ) | |
| Net Increase (decrease) in shares outstanding | | | (1,893,399 | ) | | | 32,543,954 | | |
(a) From October 2, 2006, the date on which Fund shares were first offered for sale to the public.
THE OAKMARK FUNDS
62
| | | The Oakmark
International Fund | |
| | | Six Months Ended
March 31, 2008
(Unaudited) | | Year Ended
September 30, 2007 | |
| From Operations: | |
| Net investment income | | $ | 39,570,472 | | | $ | 146,096,746 | | |
| Net realized gain (loss) on investments | | | 526,170,907 | | | | 1,426,186,914 | | |
| Net realized gain (loss) on foreign currency transactions | | | (52,960,405 | ) | | | (27,388,159 | ) | |
Net change in unrealized appreciation (depreciation) of
investments and foreign currencies | | | (1,779,267,456 | ) | | | (406,414,072 | ) | |
| Net change in unrealized appreciation (depreciation)—other | | | 318,896 | | | | 1,025,662 | | |
| Net Increase (decrease) in net assets from operations | | | (1,266,167,586 | ) | | | 1,139,507,091 | | |
| Distributions to shareholders from: | |
| Net investment income—Class I | | | (51,877,746 | ) | | | (122,435,261 | ) | |
| Net investment income—Class II | | | (959,390 | ) | | | (6,951,720 | ) | |
| Net realized gain—Class I | | | (1,274,272,066 | ) | | | (961,546,440 | ) | |
| Net realized gain—Class II | | | (85,877,295 | ) | | | (69,459,593 | ) | |
| Total distributions to shareholders | | | (1,412,986,497 | ) | | | (1,160,393,014 | ) | |
| From Fund share transactions: | |
| Proceeds from shares sold—Class I | | | 587,586,137 | | | | 1,677,032,856 | | |
| Proceeds from shares sold—Class II | | | 103,034,259 | | | | 382,659,739 | | |
| Reinvestment of distributions—Class I | | | 1,166,894,451 | | | | 957,801,465 | | |
| Reinvestment of distributions—Class II | | | 62,134,167 | | | | 53,952,152 | | |
| Payment for shares redeemed—Class I | | | (1,680,077,988 | ) | | | (1,369,590,984 | ) | |
| Payment for shares redeemed—Class II | | | (192,696,374 | ) | | | (344,460,679 | ) | |
| Redemption fees—Class I | | | 307,245 | | | | 397,544 | | |
| Redemption fees—Class II | | | 20,515 | | | | 29,502 | | |
Net increase in net assets from Fund
share transactions | | | 47,202,412 | | | | 1,357,821,595 | | |
| Total increase (decrease) in net assets | | | (2,631,951,671 | ) | | | 1,336,935,672 | | |
| Net assets: | |
| Beginning of period | | | 9,033,476,553 | | | | 7,696,540,881 | | |
| End of period | | $ | 6,401,524,882 | | | $ | 9,033,476,553 | | |
| Undistributed net investment income | | $ | 30,178,808 | | | $ | 104,342,170 | | |
| Fund Share Transactions—Class I: | |
| Shares sold | | | 27,659,566 | | | | 62,804,278 | | |
| Shares issued in reinvestment of dividends | | | 54,990,313 | | | | 38,038,184 | | |
| Less shares redeemed | | | (77,793,469 | ) | | | (51,521,932 | ) | |
| Net increase in shares outstanding | | | 4,856,410 | | | | 49,320,530 | | |
| Fund Share Transactions—Class II: | |
| Shares sold | | | 4,840,110 | | | | 14,470,106 | | |
| Shares issued in reinvestment of dividends | | | 2,948,940 | | | | 2,157,223 | | |
| Less shares redeemed | | | (8,865,354 | ) | | | (12,976,190 | ) | |
| Net increase (decrease) in shares outstanding | | | (1,076,304 | ) | | | 3,651,139 | | |
See accompanying Notes to Financial Statements.
THE OAKMARK FUNDS
63
THE OAKMARK FAMILY OF FUNDS
Statements of Changes in Net Assets—March 31, 2008
| | | The Oakmark International
Small Cap Fund | |
| | | Six Months Ended
March 31, 2008
(Unaudited) | | Year Ended
September 30, 2007 | |
| From Operations: | |
| Net investment income | | $ | 3,135,284 | | | $ | 16,938,125 | | |
| Net realized gain (loss) on investments | | | 16,820,630 | | | | 335,034,721 | | |
| Net realized gain (loss) on foreign currency transactions | | | (8,169,335 | ) | | | (3,567,638 | ) | |
Net change in unrealized appreciation (depreciation) of
investments and foreign currencies | | | (206,202,682 | ) | | | (175,792,106 | ) | |
| Net change in unrealized appreciation (depreciation)—other | | | 101,017 | | | | 97,505 | | |
| Net increase (decrease) in net assets from operations | | | (194,315,086 | ) | | | 172,710,607 | | |
| Distributions to shareholders from: | |
| Net investment income—Class I | | | (8,931,710 | ) | | | (29,840,093 | ) | |
| Net investment income—Class II | | | (4,218 | ) | | | (20,129 | ) | |
| Net realized gain—Class I | | | (278,429,073 | ) | | | (181,349,841 | ) | |
| Net realized gain—Class II | | | (164,502 | ) | | | (126,536 | ) | |
| Total distributions to shareholders | | | (287,529,503 | ) | | | (211,336,599 | ) | |
| From Fund share transactions: | |
| Proceeds from shares sold—Class I | | | 167,047,311 | | | | 239,079,369 | | |
| Proceeds from shares sold—Class II | | | 103,314 | | | | 334,644 | | |
| Reinvestment of distributions—Class I | | | 274,317,138 | | | | 201,840,075 | | |
| Reinvestment of distributions—Class II | | | 93,759 | | | | 74,623 | | |
| Payment for shares redeemed—Class I | | | (432,138,499 | ) | | | (350,389,665 | ) | |
| Payment for shares redeemed—Class II | | | (291,470 | ) | | | (200,687 | ) | |
| Redemption fees—Class I | | | 177,504 | | | | 43,370 | | |
| Redemption fees—Class II | | | 111 | | | | 32 | | |
Net increase in net assets from Fund
share transactions | | | 9,309,168 | | | | 90,781,761 | | |
| Total increase (decrease) in net assets | | | (472,535,421 | ) | | | 52,155,769 | | |
| Net assets: | |
| Beginning of period | | | 1,327,468,148 | | | | 1,275,312,379 | | |
| End of period | | $ | 854,932,727 | | | $ | 1,327,468,148 | | |
| Undistributed net investment income | | $ | 2,365,627 | | | $ | 2,424,644 | | |
| Fund Share Transactions—Class I: | |
| Shares sold | | | 10,972,973 | | | | 10,010,170 | | |
| Shares issued in reinvestment of dividends | | | 17,778,168 | | | | 8,962,703 | | |
| Less shares redeemed | | | (24,864,510 | ) | | | (14,693,607 | ) | |
| Net increase in Shares Outstanding | | | 3,886,631 | | | | 4,279,266 | | |
| Fund Share Transactions—Class II: | |
| Shares sold | | | 6,561 | | | | 14,067 | | |
| Shares issued in reinvestment of dividends | | | 6,080 | | | | 3,318 | | |
| Less shares redeemed | | | (12,562 | ) | | | (8,271 | ) | |
| Net increase in Shares Outstanding | | | 79 | | | | 9,114 | | |
THE OAKMARK FUNDS
64
THE OAKMARK FUNDS
Notes to Financial Statements (Unaudited)
1. SIGNIFICANT ACCOUNTING POLICIES
The following are the significant accounting policies of The Oakmark Fund ("Oakmark"), The Oakmark Select Fund ("Select"), The Oakmark Equity and Income Fund ("Equity and Income"), The Oakmark Global Fund ("Global"), The Oakmark Global Select Fund ("Global Select"), The Oakmark International Fund ("International"), and The Oakmark International Small Cap Fund ("Int'l Small Cap"), collectively referred to as "the Funds", each a series of Harris Associates Investment Trust (the "Trust"), a Massachusetts business trust, organized on February 1, 1991, which is registered as an investment company under the Investment Company Act of 1940. These policies are in conformity with accounting principles generally accepted in the United States of America ("GAAP"). The presentation of financial statements in conformity with GAAP requires management to make estimates and assumptions that affect the reported amounts of assets and liabilities at the date of the financial statements and the reported amounts of revenues and expenses during the reporting period. Actual results could differ from those estimates and assumptions. These financial statements contain all adjustments which are, in the opinion of management, necessary to a fair statement of the interim period presented. Such adjustments are normal and recurring in nature.
Class Disclosure—
Each Fund offers two classes of shares: Class I Shares and Class II Shares. Class I Shares are offered to the general public. Class II Shares are offered to certain retirement plans such as 401(k) and profit sharing plans. Class II Shares pay a service fee at the annual rate of up to 0.25% of average net assets of Class II Shares of the Funds. This service fee is paid to plan administrators for performing the services associated with the administration of such retirement plans. Class I Shares do not pay a service fee.
Income, realized and unrealized capital gains and losses and expenses of the Funds that are not directly attributable to a specific class of shares are prorated among the classes based on the relative net assets of each class.
Redemption fees—
Each Fund (except Equity and Income as of October 29, 2007) imposes a short-term trading fee on redemptions of shares held for 90 days or less to offset two types of costs to the Fund caused by short-term trading: portfolio transaction and market impact costs associated with erratic redemption activity and administrative costs associated with processing redemptions. The fee is 2% of the redemption value and is deducted from the redemption proceeds. The "first-in, first-out" ("FIFO") method is used to determine the holding period.
Security valuation—
The Funds' share prices or net asset values ("NAVs") are calculated as of the close of regular session trading (usually 4:00 pm Eastern time) on the New York Stock Exchange ("NYSE") on any day on which the NYSE is open for trading. Equity securities principally traded on securities exchanges in the United States and over-the-counter securities are valued at the last sales price on the day of valuation, or lacking any reported sales that day, at the most recent bid quotation. Securities traded on the NASDAQ National Market are valued at the NASDAQ Official Closing Price ("NOCP"), or lacking an NOCP, at the most recent bid quotation on the NASDAQ National Market. Equity securities principally traded on securities exchanges outside the United States shall be valued, depending on local convention or regulation, at the last sales price, the last bid or asked price, the mean between the last bid and asked prices, or the official closi ng price, or shall be based on a pricing composite as of the close of the regular trading hours on the appropriate exchange or other designated time. Debt obligations and money market instruments maturing in more than 60 days from the date of purchase are valued at the latest bid quotation. Debt obligations and money market instruments maturing in less than 61 days from the date of purchase are valued on an amortized cost basis, which approximates value. Options are valued at the last reported sales price on the day of valuation or, lacking any reported sale price on the valuation date, at the mean of the most recent bid and asked quotations or, if the mean is not available, at the most recent bid quotation.
Securities for which quotations are not readily available or securities that may have been affected by a significant event occurring between the close of a foreign market and the close of the NYSE are valued at fair values, determined by or under the direction of the pricing committee established by the Board of Trustees. A significant event may include the performance of U.S. markets since the close of foreign markets. The Funds may use a systematic fair valuation model provided by an independent third party to value foreign securities in order to adjust for stale pricing, which may occur between the close of certain foreign exchanges and the NYSE. At March 31, 2008, no Funds except Equity and Income held securities for which market quotations were not readily available. Equity and Income held a security that was valued at a fair value determined in accordance with procedures established in good faith by the Board of Trustees.
Foreign currency translations—
Certain Funds invest in foreign securities, which may involve a number of risk factors and special considerations not present with investments in securities of U.S. corporations. Values of investments and other assets and liabilities denominated in foreign currencies are translated into
THE OAKMARK FUNDS
65
THE OAKMARK FUNDS
Notes to Financial Statements (Unaudited) (cont.)
U.S. dollars at current exchange rates obtained by a recognized bank, dealer, or independent pricing service on the day of valuation. Purchases and sales of investments and dividend and interest income are converted at the prevailing rate of exchange on the respective dates of such transactions. Forward foreign currency contracts are valued at the current day's interpolated foreign exchange rates.
The Funds do not isolate that portion of the results of operations resulting from changes in foreign exchange rates on investments from the fluctuations arising from changes in market prices of securities held. Such fluctuations are included with the net realized and unrealized gains and losses from securities.
Net realized gains and losses on foreign currency transactions arise from sales of foreign currencies, currency gains or losses realized between the trade and settlement dates on securities transactions, the difference between the amounts of dividends, interest, and foreign withholding taxes recorded and the U.S. dollar equivalent of the amounts actually received or paid, and the realized gains or losses resulting from portfolio and transaction hedges. Net unrealized foreign exchange gains and losses arise from changes in the fair value of assets and liabilities, other than investments in securities, at period end resulting from changes in exchange rates.
At March 31, 2008, net unrealized appreciation (depreciation) - other included the following components:
| | | Oakmark | | Equity and
Income | | Global | | Global Select | | International | | Int'l
Small Cap | |
Unrealized appreciation
(depreciation) on
interest, dividends and
tax reclaims receivable | | $ | 57,831 | | | $ | 61,380 | | | $ | 483,643 | | | $ | 21,378 | | | $ | 1,376,800 | | | $ | 202,544 | | |
Unrealized appreciation
(depreciation) on open
securities purchases and
sales | | | 0 | | | | 0 | | | | 878 | | | | 0 | | | | (113,333 | ) | | | (9,516 | ) | |
Net unrealized appreciation
(depreciation) - Other | | $ | 57,831 | | | $ | 61,380 | | | $ | 484,521 | | | $ | 21,378 | | | $ | 1,263,467 | | | $ | 193,028 | | |
Forward foreign currency contracts—
The Funds' currency transactions are limited to transaction hedging and portfolio hedging. The contractual amounts of forward foreign currency contracts do not necessarily represent the amounts potentially subject to risk. The measurement of the risks associated with these instruments is meaningful only when all related and offsetting transactions are considered. Risks arise from the possible inability of counterparties to meet the terms of their contracts and from movements in currency values. At March 31, 2008, Global, Global Select, International, and Int'l Small Cap held forward foreign currency contracts as follows:
The Oakmark Global Fund
| | | Contract
Amount | | Settlement
Date | | Valuation at
3/31/08 | | Unrealized
Appreciation
(Depreciation) | |
Foreign Currency Sold:
British Pound Sterling | | | 22,130,000 | | | 4/4/08 | | $ | 43,907,638 | | | $ | 1,069,374 | | |
| British Pound Sterling | | | 26,600,000 | | | 4/21/08 | | | 52,711,777 | | | | 1,191,128 | | |
| British Pound Sterling | | | 5,600,000 | | | 7/8/08 | | | 11,027,201 | | | | (801 | ) | |
| British Pound Sterling | | | 11,150,000 | | | 7/22/08 | | | 21,930,672 | | | | (126,847 | ) | |
| Euro | | | 18,550,000 | | | 5/23/08 | | | 29,221,180 | | | | (1,752,340 | ) | |
| Euro | | | 57,700,000 | | | 2/27/09 | | | 89,567,858 | | | | (3,744,878 | ) | |
| Euro | | | 61,200,000 | | | 3/31/09 | | | 94,857,477 | | | | (148,029 | ) | |
| Swiss Franc | | | 105,500,000 | | | 5/9/08 | | | 106,250,540 | | | | (12,255,530 | ) | |
| Swiss Franc | | | 40,700,000 | | | 5/23/08 | | | 40,987,867 | | | | (3,928,572 | ) | |
| Swiss Franc | | | 39,400,000 | | | 8/29/08 | | | 39,645,804 | | | | (2,655,014 | ) | |
| Swiss Franc | | | 27,740,000 | | | 3/19/09 | | | 27,829,481 | | | | 165,836 | | |
| | | | | | | | | $ | 557,937,495 | | | $ | (22,185,673 | ) | |
THE OAKMARK FUNDS
66
THE OAKMARK FUNDS
Notes to Financial Statements (Unaudited) (cont.)
The Oakmark Global Select Fund
| | | Contract
Amount | | Settlement
Date | | Valuation at
3/31/08 | | Unrealized
Appreciation
(Depreciation) | |
Foreign Currency Sold:
British Pound Sterling | | | 4,930,000 | | | 4/21/08 | | $ | 9,769,514 | | | $ | 220,762 | | |
| British Pound Sterling | | | 1,280,000 | | | 5/21/08 | | | 2,530,427 | | | | 81,515 | | |
| British Pound Sterling | | | 5,330,000 | | | 6/5/08 | | | 10,523,804 | | | | 400,563 | | |
| Euro | | | 2,840,000 | | | 7/18/08 | | | 4,460,315 | | | | (271,316 | ) | |
| Euro | | | 2,442,000 | | | 2/27/09 | | | 3,790,723 | | | | (158,492 | ) | |
| Swiss Franc | | | 12,640,000 | | | 5/9/08 | | | 12,729,923 | | | | (1,468,340 | ) | |
| Swiss Franc | | | 4,940,000 | | | 5/23/08 | | | 4,974,940 | | | | (476,834 | ) | |
| Swiss Franc | | | 5,120,000 | | | 8/29/08 | | | 5,151,942 | | | | (345,017 | ) | |
| Swiss Franc | | | 4,740,000 | | | 3/19/09 | | | 4,755,290 | | | | 28,337 | | |
| | | | | | | | | $ | 58,686,878 | | | $ | (1,988,822 | ) | |
The Oakmark International Fund
| | | Contract
Amount | | Settlement
Date | | Valuation at
3/31/08 | | Unrealized
Appreciation
(Depreciation) | |
Foreign Currency Sold:
British Pound Sterling | | | 284,900,000 | | | 4/4/08 | | $ | 565,263,719 | | | $ | 13,767,041 | | |
| British Pound Sterling | | | 257,000,000 | | | 4/21/08 | | | 509,282,961 | | | | 11,508,264 | | |
| British Pound Sterling | | | 95,500,000 | | | 7/22/08 | | | 187,836,696 | | | | (1,086,446 | ) | |
| Euro | | | 121,500,000 | | | 5/23/08 | | | 191,394,789 | | | | (11,477,589 | ) | |
| Euro | | | 197,000,000 | | | 2/27/09 | | | 305,803,604 | | | | (12,785,804 | ) | |
| Euro | | | 303,500,000 | | | 3/31/09 | | | 470,412,489 | | | | (734,099 | ) | |
| Swiss Franc | | | 333,600,000 | | | 5/9/08 | | | 335,973,272 | | | | (38,753,030 | ) | |
| Swiss Franc | | | 134,500,000 | | | 5/23/08 | | | 135,451,305 | | | | (12,982,628 | ) | |
| Swiss Franc | | | 112,000,000 | | | 8/29/08 | | | 112,698,732 | | | | (7,547,248 | ) | |
| Swiss Franc | | | 110,500,000 | | | 3/19/09 | | | 110,856,440 | | | | 660,595 | | |
| | | | | | | | | $ | 2,924,974,007 | | | $ | (59,430,944 | ) | |
The Oakmark Int'l Small Cap Fund
| | | Contract
Amount | | Settlement
Date | | Valuation at
3/31/08 | | Unrealized
Appreciation
(Depreciation) | |
Foreign Currency Sold:
British Pound Sterling | | | 21,150,000 | | | 4/4/08 | | $ | 41,963,242 | | | $ | 1,022,018 | | |
| British Pound Sterling | | | 35,750,000 | | | 4/21/08 | | | 70,843,836 | | | | 1,600,858 | | |
| British Pound Sterling | | | 19,750,000 | | | 7/22/08 | | | 38,845,809 | | | | (224,684 | ) | |
| Euro | | | 27,600,000 | | | 5/23/08 | | | 43,477,335 | | | | (2,607,255 | ) | |
| Euro | | | 19,200,000 | | | 2/27/09 | | | 29,804,209 | | | | (1,246,129 | ) | |
| Euro | | | 50,300,000 | | | 3/31/09 | | | 77,962,926 | | | | (121,664 | ) | |
| Swiss Franc | | | 14,250,000 | | | 5/9/08 | | | 14,351,376 | | | | (1,655,368 | ) | |
| Swiss Franc | | | 3,980,000 | | | 5/23/08 | | | 4,008,150 | | | | (384,170 | ) | |
| | | | | | | | | $ | 321,256,883 | | | $ | (3,616,394 | ) | |
THE OAKMARK FUNDS
67
THE OAKMARK FUNDS
Notes to Financial Statements (Unaudited) (cont.)
Security transactions and investment income—
Security transactions are accounted for on the trade date (date the order to buy or sell is executed) and dividend income is recorded on the ex-dividend date. Interest income and expenses are recorded on an accrual basis. Bond discount is accreted and premium is amortized over the expected life of each applicable security using the effective yield method. Withholding taxes on foreign dividends have been provided for in accordance with the Funds' understanding of the applicable country's tax rules and rates. Net realized gains and losses on investments are determined by the specific identification method.
Short sales—
Each Fund may sell "short" a security it does not own in anticipation of a decline in the value of that security. When the Fund sells a security short, it must borrow the security sold short and deliver it to the broker-dealer through which it made the short sale. A gain, limited to the price at which the Fund sold the security short, or loss, unlimited in size, will be recognized upon the termination of the short sale. At March 31, 2008, none of the funds had short sales.
Accounting for Options—
When a Fund writes an option, the premium received by the Fund is recorded as a liability and is subsequently adjusted to the current market value of the option written. Premiums received from writing options that expire are recorded by the Fund on the expiration date as realized gains from option transactions. The difference between the premium and the amount paid on effecting a closing purchase transaction, including brokerage commissions, is also treated as a realized gain, or if the premium is less than the amount paid for the closing purchase transaction, as a realized loss. If a call option is exercised, the premium is added to the proceeds from the sale of the underlying security or currency in determining whether the Fund has realized a gain or a loss. If a put option is exercised, the premium reduces the cost basis of the security or currency purchased by the Fund. In writing an option, the Fund bears the market risk of an unfavorable change in the price of the security or currency underlying the written option. Exercise of an option written by the Fund could result in the Fund selling or buying a security or currency at a price different from the current market value. Options written by the Fund do not give rise to counterparty credit risk, as they obligate the Fund, not its counterparties, to perform.
When a Fund purchases an option, the premium paid by the Fund is recorded as an asset and is subsequently adjusted to the current value of the option purchased. Purchasing call options tends to increase the Fund's exposure to the underlying instrument. Purchasing put options tends to decrease the Fund's exposure to the underlying instrument. Premiums paid for purchasing options that expire are treated as realized losses. Premiums paid for purchasing options that are exercised or closed are added to the amounts paid or offset against the proceeds on the underlying security to determine the realized gain or loss. The risks associated with purchasing put and call options are potential loss of the premium paid and the failure of the counterparty to honor its obligation under the contract.
At March 31, 2008, the Funds had no outstanding options.
Committed line of credit—
The Trust has an unsecured committed line of credit with State Street Bank and Trust Company ("State Street") in the amount of $500 million. Borrowings under that arrangement bear interest at 0.45% above the Federal Funds Effective Rate, as defined in the credit agreement. There were no borrowings outstanding under the arrangement at March 31, 2008.
Expense offset arrangement—
State Street serves as custodian of the Funds. State Street's fee may be reduced by credits that are an earnings allowance calculated on the average daily cash balances each Fund maintains with State Street. Credit balances used to reduce the Funds' custodian fees, if any, are reported as a reduction of total expenses in the Statements of Operations. During the period ended March 31, 2008, Equity and Income received an expense offset credit of $669.
Repurchase agreements—
Each Fund may invest in repurchase agreements, which are short-term investments whereby the Fund acquires ownership of a debt security and the seller agrees to repurchase the security at a future date at a specified price.
The Fund, through State Street, receives delivery of the underlying securities collateralizing repurchase agreements. It is the Funds' policy that the value of the collateral be at least equal to 102% of the repurchase price, including interest. Harris Associates L.P. ("the Adviser") is responsible for
THE OAKMARK FUNDS
68
THE OAKMARK FUNDS
Notes to Financial Statements (Unaudited) (cont.)
determining that the value of the collateral is at all times at least equal to 102% of the repurchase price, including interest. Repurchase agreements could involve certain risks in the event of default or insolvency of the counterparty including possible delays or restrictions upon a Fund's ability to dispose of the underlying securities.
Security lending—
Each Fund, except Oakmark, may lend its portfolio securities to broker-dealers and banks. Any such loan must be continuously secured by collateral in cash or cash equivalents maintained on a current basis in an amount at least equal to the fair value of the securities loaned by the Fund. Collateral is marked to market and monitored daily. The Fund would continue to receive the equivalent of the interest or dividends paid by the issuer on the securities loaned, and would also receive an additional return that may be in the form of a fixed fee or a percentage of the earnings on the collateral. The Fund would have the right to call the loan and obtain the securities loaned at any time, and the counterparty is required to return the securities within five business days or less. In the event of bankruptcy or other default of the borrower, the Fund could experience delays in liquidating the loan collateral or recovering the loaned sec urities and incur expenses related to enforcing its rights. In addition, there could be a decline in the value of the collateral or in the fair value of the securities loaned while the Fund seeks to enforce its rights thereto and the Fund could experience subnormal levels of income or lack of access to income during that period.
At March 31, 2008, none of the Funds had securities on loan.
Restricted securities—
The following investments, the sales of which are restricted to qualified institutional buyers, have been valued according to the securities valuation procedures for debt obligations and money market instruments (as stated in the Security valuation section) since their acquisition dates. These securities are priced using market quotations and there are no unrestricted securities with the same maturity dates and yields for the issuer.
At March 31, 2008, Equity and Income held the following restricted securities:
| Quantity | | Security
Name | | Acquisition
Date | | Carrying
Value | | Cost | | Value | | Percentage of
Net Assets | |
| $ | 3,000,000 | | | Sealed Air Corporation,
144A, 5.625% due
7/15/2013 | | 6/27/2003 | | | 104.5457 | | | | 100.68 | | | | 3,136,371 | | | | 0.02 | % | |
| | 4,400,000 | | | Sealed Air Corporation,
144A, 5.625% due
7/15/2013 | | 8/20/2003 | | | 104.5457 | | | | 96.41 | | | | 4,600,011 | | | | 0.03 | % | |
| | 300,000 | | | Sealed Air Corporation,
144A, 5.625% due
7/15/2013 | | 8/21/2003 | | | 104.5457 | | | | 96.79 | | | | 313,637 | | | | 0.00 | % | |
| | 11,700,000 | | | Sealed Air Corporation,
144A, 5.625% due
7/15/2013 | | 4/6/2004 | | | 104.5457 | | | | 103.31 | | | | 12,231,847 | | | | 0.09 | % | |
| | | | | | | | | | | | | | | | | | 20,281,866 | | | | 0.14 | % | |
Federal income taxes—
It is each Fund's policy to comply with the requirements of the Internal Revenue Code applicable to regulated investment companies and to distribute substantially all of its net taxable income, including any net realized gains on investments, to its shareholders. Therefore, no federal income tax provision is required.
The Funds implemented the provisions of the Financial Accounting Standards Board ("FASB") Interpretation No. 48 ("FIN48") "Accounting for Uncertainty in Income Taxes—an interpretation of FASB Statement No. 109". This interpretation prescribes a recognition threshold and measurement attribute for the financial statement recognition and measurement of a tax position taken or expected to be taken in a tax return. It also provides guidance on de-recognition, classification, interest and penalties, accounting in interim periods, disclosure and transition. The implementation of FIN 48 resulted in no material liability for unrecognized tax benefits in the accompanying financial statements.
THE OAKMARK FUNDS
69
THE OAKMARK FUNDS
Notes to Financial Statements (Unaudited) (cont.)
Recently issued accounting pronouncement—
In September 2006, FASB issued Statement of Financial Accounting Standards No. 157 ("FAS 157") "Fair Value Measurements." FAS 157 defines fair value, establishes a framework for measuring fair value in accordance with generally accepted accounting principles and expands required disclosure about fair value measurements. FAS 157 is effective for fiscal years beginning after November 15, 2007.
In February 2007, FASB issued Statement of Financial Accounting Standards No. 159 ("FAS 159") "The Fair Value Option for Financial Assets and Financial Liabilities—including an amendment of FASB Statement No. 115." FAS 159 permits entities to elect to measure certain financial assets and liabilities at fair value. Unrealized gains and losses on items for which the fair value option has been elected will be reported in earnings at each subsequent reporting date. FAS 159 is effective for fiscal years beginning after November 15, 2007.
In March 2008, FASB issued Statement of Financial Accounting Standards No. 161 ("FAS 161") "Disclosures about Derivative Instruments and Hedging Activities"—an amendment of FASB Statement No. 133 ("FAS 133")," which expands the disclosure requirements in FAS 133 about an entity's derivative instruments and hedging activities. FAS 161 is effective for fiscal years and interim periods beginning after November 15, 2008.
Management is currently evaluating the impact the adoption of these accounting pronouncements will have on the Funds' financial statements and related disclosures.
2. TRANSACTIONS WITH AFFILIATES
Each Fund has an investment advisory agreement with the Adviser. For management services and facilities furnished, the Funds pay the Adviser monthly fees. Each fee is calculated on the total net assets as determined at the end of each preceding calendar month. Annual fee rates are as follows:
| Fund | | Advisory Fees | | Fund | | Advisory Fees | |
Oakmark
Select
Equity and Income
| | 1.00% up to $2 billion;
0.90% on the next $1 billion;
0.80% on the next $2 billion;
0.75% on the next $2.5 billion;
0.70% on the next $2.5 billion; and
0.65% over 10 billion
1.00% up to $1 billion;
0.95% on the next $500 million;
0.90% on the next $500 million;
0.85% on the next $500 million;
0.80% on the next $2.5 billion;
0.75% on the next $5 billion; and
0.725% over 10 billion
0.75% up to $5 billion;
0.70% on t he next $2.5 billion;
0.675% on the next $2.5 billion;
0.65% on the next $2.5 billion;
0.60% on the next $3.5 billion; and
0.585% over $16 billion
| | Global
Global Select
International
Int'l Small Cap
| | 1.00% up to $2 billion;
0.95% on the next $2 billion;
0.90% on the next $4 billion; and
0.875% over $8 billion
1.00% up to $2 billion;
0.95% on the next $1 billion;
0.875% on the next $4 billion; and
0.85% over $7 billion
1.00% up to $2 billion;
0.95% on the next $1 billion;
0.85% on the next $2 billion;
0.825% on the next $2.5 billion;
0.815% on the next $3.5 billion;
0.805% on the next $5.5 billion; and
0.80% ov er $16.5 billion
1.25% up to $500 million;
1.10% on the next $1 billion;
1.05% on the next $2 billion; and
1.025% over $3.5 billion | |
|
The Adviser is contractually obligated through January 31, 2009 to reimburse each Fund Class to the extent, but only to the extent, that its annualized expenses (excluding taxes, interest, all commissions and other normal charges incident to the purchase and sale of portfolio securities, and extraordinary charges such as litigation costs, but including fees paid to the Adviser) exceed the percent set forth below of average daily net assets of the Fund Class.
THE OAKMARK FUNDS
70
THE OAKMARK FUNDS
Notes to Financial Statements (Unaudited) (cont.)
| Fund | | Class I | | Class II | |
| Oakmark | | | 1.50 | % | | | 1.75 | % | |
| Select | | | 1.50 | | | | 1.75 | | |
| Equity and Income | | | 1.00 | | | | 1.25 | | |
| Global | | | 1.75 | | | | 2.00 | | |
| Global Select | | | 1.75 | | | | 2.00 | | |
| International | | | 2.00 | | | | 2.25 | | |
| Int'l Small Cap | | | 2.00 | | | | 2.25 | | |
The Adviser and the Funds have entered into agreements with financial intermediaries to provide recordkeeping, processing, shareholder communications and other services to customers of the intermediaries and have agreed to compensate the intermediaries for providing those services. Certain of those services would be provided by the Funds if the shares of those customers were registered directly with the Funds' transfer agent. Accordingly, the Funds pay a portion of the intermediary fees pursuant to an agreement with the Adviser, which calls for each Fund to pay a portion of the intermediary fees attributable to shares of the Fund held by the intermediary (which generally are a percentage of value of the shares held) not exceeding the lesser of 75% of the fees charged by the intermediary or what the Fund would have paid its transfer agent had each customer's shares been registered directly with the transfer agent instead of held through the intermediary. The Adviser pays the remainder of the fees. The fees incurred by the Funds are reflected as other shareholder servicing fees in the Statements of Operations.
The non-interested Trustees of the Trust may participate in the Trust's Deferred Compensation Plan for Independent Trustees. Participants in the plan may elect to defer all or a portion of their compensation. Amounts deferred are retained by the Trust and represent an unfunded obligation of the Trust. The value of a participant's deferral account is determined by reference to the change in value of Class I shares of one or more of the Funds or a money market fund as specified by the participant. Benefits would be payable after a stated number of years or retirement from the board. The accrued obligations of the Funds under the plan are reflected as deferred trustee compensation in the Statements of Assets and Liabilities. The interested trustees are not compensated by the Funds.
3. FEDERAL INCOME TAXES
For the six-month period ended March 31, 2008, cost of investments for federal income tax purposes and related composition of unrealized gains and losses were as follows:
| Fund | | Cost of Investments
for Federal Income
Tax Purposes | | Gross Unrealized
Appreciation | | Gross Unrealized
(Depreciation) | | Net Unrealized
Appreciation
(Depreciation) | |
| Oakmark | | $ | 3,644,778,620 | | | $ | 845,041,379 | | | $ | 352,301,310 | | | $ | 492,740,069 | | |
| Select | | | 3,069,856,849 | | | | 782,271,297 | | | | 463,419,916 | | | | 318,851,381 | | |
| Equity and Income | | | 11,592,572,362 | | | | 2,712,190,123 | | | | 384,607,678 | | | | 2,327,582,445 | | |
| Global | | | 2,297,751,883 | | | | 366,560,205 | | | | 184,543,066 | | | | 182,017,139 | | |
| Global Select | | | 330,834,892 | | | | 3,767,314 | | | | 55,888,505 | | | | (52,121,191 | ) | |
| International | | | 6,786,639,944 | | | | 436,916,200 | | | | 831,462,290 | | | | (394,546,090 | ) | |
| Int'l Small Cap | | | 926,989,614 | | | | 85,864,187 | | | | 157,936,955 | | | | (72,072,768 | ) | |
For the six-month period ended March 31, 2008, the components of distributable earnings on a tax basis (excluding unrealized appreciation (depreciation)) were as follows:
| Fund | | Undistributed
Ordinary Income | | Undistributed Long-
Term Gain | | Total Distributable
Earnings | |
| Oakmark | | $ | 14,288,484 | | | $ | 398,721,380 | | | $ | 413,009,864 | | |
| Select | | | 16,122,443 | | | | 180,087,463 | | | | 196,209,906 | | |
| Equity and Income | | | 64,709,513 | | | | 119,384,149 | | | | 184,093,662 | | |
| Global | | | 1,078,717 | | | | 82,482,643 | | | | 83,561,360 | | |
| Global Select | | | 764,669 | | | | 0 | | | | 764,669 | | |
| International | | | 5,949,897 | | | | 403,442,762 | | | | 409,392,659 | | |
| Int'l Small Cap | | | 0 | | | | 6,589,852 | | | | 6,589,852 | | |
THE OAKMARK FUNDS
71
THE OAKMARK FUNDS
Notes to Financial Statements (Unaudited) (cont.)
During the six-month period ended March 31, 2008 and the year ended September 30, 2007, the tax character of distributions paid was as follows:
| | | Six Months Ended
March 31, 2008 | | Year Ended
September 30, 2007 | |
| Fund | | Distributions Paid
from Ordinary
Income | | Distributions Paid
from Long-Term
Capital Gain | | Distributions Paid
from Ordinary
Income | | Distributions Paid
from Long-Term
Capital Gain | |
| Oakmark | | $ | 63,542,718 | | | $ | 391,982,540 | | | $ | 53,748,373 | | | $ | 248,745,775 | | |
| Select | | | 47,341,552 | | | | 456,979,270 | | | | 64,506,538 | | | | 582,700,204 | | |
| Equity and Income | | | 283,676,307 | | | | 713,705,865 | | | | 208,886,492 | | | | 550,867,316 | | |
| Global | | | 37,014,535 | | | | 296,608,246 | | | | 28,349,725 | | | | 323,001,195 | | |
| Global Select | | | 13,616,660 | | | | 483,518 | | | | 114,308 | | | | 0 | | |
| International | | | 152,436,078 | | | | 1,260,550,419 | | | | 144,238,130 | | | | 1,016,154,884 | | |
| Int'l Small Cap | | | 23,997,018 | | | | 263,532,485 | | | | 55,312,279 | | | | 156,024,320 | | |
Additionally, the Funds designated the character of capital gains distributions using equalization accounting during the year ended September 30, 2007 as follows:
| Fund | | Amount | |
| Oakmark | | $ | 41,576,149 | | |
| Select | | | 62,411,372 | | |
| Equity and Income | | | 50,309,541 | | |
| Global | | | 12,477,528 | | |
| International | | | 115,025,375 | | |
| Int'l Small Cap | | | 35,307,537 | | |
4. INVESTMENT TRANSACTIONS
For the six-month period ended March 31, 2008, transactions in investment securities (excluding short term and U.S. Government securities) were as follows (in thousands):
| | | Oakmark | | Select | | Equity and
Income | | Global | | Global
Select | | International | | Int'l
Small Cap | |
| Purchases | | $ | 536,806 | | | $ | 472,055 | | | $ | 1,484,263 | | | $ | 583,159 | | | $ | 129,295 | | | $ | 1,592,331 | | | $ | 264,609 | | |
| Proceeds from sales | | | 1,285,628 | | | | 1,471,989 | | | | 1,556,539 | | | | 791,776 | | | | 151,225 | | | | 2,876,396 | | | | 502,187 | | |
Purchases at cost and proceeds (in thousands) from sales of long-term U.S. Government securities for the six-month period ended March 31, 2008, were 1,723,923 and 1,509,570 respectively for Equity and Income.
5. INVESTMENT IN AFFILIATED ISSUERS
An issuer in which a Fund's holdings represents 5% or more of the outstanding voting securities of the issuer is an affiliated issuer as defined under the Investment Company Act of 1940. A schedule of each Fund's investments in securities of affiliated issuers held during the six-month period ended March 31, 2008, is set forth below:
Schedule of Transactions with Affiliated Issuers
The Oakmark Equity and Income Fund
| Affiliates | | Shares Held | | Purchases
(Cost) | | Sales
(Proceeds) | | Dividend
Income | | Value
March 31,
2008 | |
Mueller Water Products, Inc.,
Class B | | | 6,000,000 | | | $ | 0 | | | $ | 6,161,019 | | | $ | 231,318 | | | $ | 47,280,000 | | |
| Newfield Exploration Co.+ | | | 7,203,000 | | | | 93,665,851 | | | | 9,856,938 | | | | 0 | | | | 380,678,550 | | |
| Varian, Inc.+ | | | 1,459,400 | | | | 0 | | | | 12,805,983 | | | | 0 | | | | 84,528,448 | | |
| TOTALS | | | | | | $ | 93,665,851 | | | $ | 28,823,940 | | | $ | 231,318 | | | $ | 512,486,998 | | |
THE OAKMARK FUNDS
72
THE OAKMARK FUNDS
Notes to Financial Statements (Unaudited) (cont.)
Schedule of Transactions with Affiliated Issuers
The Oakmark International Fund
| Affiliates | | Shares Held | | Purchases
(Cost) | | Sales
(Proceeds) | | Dividend
Income | | Value
March 31,
2008 | |
| Giordano International Limited * | | | 0 | | | $ | 0 | | | $ | 49,882,149 | | | $ | 0 | | | $ | 0 | | |
| Johnston Press plc | | | 16,045,172 | | | | 11,935,995 | | | | 12,945,034 | | | | 903,227 | | | | 39,486,637 | | |
| Lotte Chilsung Beverage Co., Ltd. * | | | 0 | | | | 0 | | | | 99,499,295 | | | | 0 | | | | 0 | | |
| Meitec Corporation | | | 2,483,800 | | | | 0 | | | | 0 | | | | 895,211 | | | | 75,251,565 | | |
| Signet Group plc | | | 151,982,759 | | | | 37,642,283 | | | | 11,191,905 | | | | 0 | | | | 186,258,187 | | |
| Trinity Mirror plc | | | 15,461,248 | | | | 0 | | | | 18,079,018 | | | | 2,319,512 | | | | 90,521,272 | | |
| TOTALS | | | | | | $ | 49,578,278 | | | $ | 191,597,401 | | | $ | 4,117,950 | | | $ | 391,517,661 | | |
Schedule of Transactions with Affiliated Issuers
The Oakmark Int'l Small Cap Fund
| Affiliates | | Shares Held | | Purchases
(Cost) | | Sales
(Proceeds) | | Dividend
Income | | Value
March 31,
2008 | |
| Alaska Milk Corporation | | | 56,360,000 | | | $ | 0 | | | $ | 0 | | | $ | 203,050 | | | $ | 6,881,398 | | |
| Binggrae Co., Ltd. ** | | | 380,800 | | | | 0 | | | | 8,402,317 | | | | 56,011 | | | | 12,823,426 | | |
| Chargeurs SA | | | 790,182 | | | | 0 | | | | 0 | | | | 0 | | | | 16,155,110 | | |
| Freightways Limited | | | 7,624,568 | | | | 0 | | | | 0 | | | | 681,087 | | | | 20,680,802 | | |
| Ichiyoshi Securities Co., Ltd. | | | 2,399,500 | | | | 0 | | | | 0 | | | | 387,231 | | | | 24,047,958 | | |
| Kongsberg Automotive ASA * | | | 0 | | | | 0 | | | | 21,782,126 | | | | 0 | | | | 0 | | |
| LSL Property Services PLC | | | 8,205,000 | | | | 8,909,123 | | | | 3,768,241 | | | | 628,960 | | | | 21,820,639 | | |
| Monitise PLC + | | | 24,657,285 | | | | 0 | | | | 0 | | | | 0 | | | | 3,303,187 | | |
| Morse PLC | | | 8,843,615 | | | | 0 | | | | 3,755,488 | | | | 1,086,458 | | | | 11,057,437 | | |
| Orbotech, Ltd. +** | | | 1,464,025 | | | | 0 | | | | 4,542,198 | | | | 0 | | | | 26,850,218 | | |
| Pasona Group, Inc. | | | 23,200 | | | | 6,139,077 | | | | 5,991,108 | | | | 299,516 | | | | 14,593,098 | | |
| Vitec Group plc | | | 2,812,479 | | | | 0 | | | | 1,118,824 | | | | 0 | | | | 23,945,873 | | |
| TOTALS | | | | | | $ | 15,048,200 | | | $ | 49,360,302 | | | $ | 3,342,313 | | | $ | 182,159,146 | | |
+ Non-income producing security.
* Position in issuer liquidated during the six months ended March 31, 2008.
** Due to transactions during the six months ended March 31, 2008, the company is no longer an affiliated security.
THE OAKMARK FUNDS
73
THE OAKMARK FUNDS
FINANCIAL HIGHLIGHTS
The following tables are intended to help you understand each Fund's financial performance during the last 5 years (or since it began operations, if less than five years). Certain information reflects financial results for a single Fund share. Total returns represent the rate you would have earned (or lost) on an investment, assuming reinvestment of all dividends and distributions. The information for the period ended March 31, 2008 is unaudited, and each Fund's financial statements is included in this report. Deloitte & Touche LLP, an independent registered accounting firm has audited the information for the fiscal years ended September 30, 2007, 2006, 2005 and 2004. For each year shown, all information is for the fiscal year ended September 30, unless otherwise noted.
THE OAKMARK FUNDS
74
THE OAKMARK FUND
Financial Highlights–Class I
For a share outstanding throughout each period
| | | Six Months Ended
March 31,
2008
(Unaudited) | | Year Ended
September 30,
2007 | | Year Ended
September 30,
2006 | | Year Ended
September 30,
2005 | | Year Ended
September 30,
2004 | |
| Net Asset Value, Beginning of Period | | $ | 47.28 | | | $ | 44.64 | | | $ | 40.75 | | | $ | 38.68 | | | $ | 33.85 | | |
| Income From Investment Operations: | |
| Net Investment Income | | | 0.28 | | | | 0.47 | (a) | | | 0.39 | (a) | | | 0.34 | | | | 0.16 | | |
| Net Gain (Loss) on Investments (both realized and unrealized) | | | (6.18 | ) | | | 4.60 | | | | 3.85 | | | | 1.90 | | | | 4.81 | | |
| Total From Investment Operations: | | | (5.90 | ) | | | 5.07 | | | | 4.24 | | | | 2.24 | | | | 4.97 | | |
| Less Distributions: | |
| Dividends (from net investment income) | | | (0.56 | ) | | | (0.43 | ) | | | (0.35 | ) | | | (0.17 | ) | | | (0.14 | ) | |
| Dividends (from capital gains) | | | (3.42 | ) | | | (2.00 | ) | | | 0.00 | | | | 0.00 | | | | 0.00 | | |
| Total Distributions | | | (3.98 | ) | | | (2.43 | ) | | | (0.35 | ) | | | (0.17 | ) | | | (0.14 | ) | |
| Redemption Fees | | | 0.00 | (b) | | | 0.00 | (b) | | | 0.00 | (b) | | | 0.00 | (b) | | | 0.00 | (b) | |
| Net Asset Value, End of Period | | $ | 37.40 | | | $ | 47.28 | | | $ | 44.64 | | | $ | 40.75 | | | $ | 38.68 | | |
| Total Return | | | -13.29 | % | | | 11.51 | % | | | 10.46 | % | | | 5.79 | % | | | 14.73 | % | |
| Ratios/Supplemental Data: | |
| Net Assets, End of Period ($million) | | $ | 4,118.8 | | | $ | 5,656.9 | | | $ | 5,486.2 | | | $ | 6,340.4 | | | $ | 6,474.0 | | |
| Ratio of Expenses to Average Net Assets | | | 1.09 | %*† | | | 1.01 | %* | | | 1.05 | %* | | | 1.03 | %* | | | 1.05 | % | |
| Ratio of Net Investment Income to Average Net Assets | | | 1.17 | %† | | | 1.01 | % | | | 0.94 | % | | | 0.79 | % | | | 0.47 | % | |
| Portfolio Turnover Rate | | | 11 | % | | | 12 | % | | | 9 | % | | | 16 | % | | | 19 | % | |
Financial Highlights–Class II
For a share outstanding throughout each period
| | | Six Months Ended
March 31,
2008
(Unaudited) | | Year Ended
September 30,
2007 | | Year Ended
September 30,
2006 | | Year Ended
September 30,
2005 | | Year Ended
September 30,
2004 | |
| Net Asset Value, Beginning of Period | | $ | 46.97 | | | $ | 44.35 | | | $ | 40.51 | | | $ | 38.45 | | | $ | 33.68 | | |
| Income From Investment Operations: | |
| Net Investment Income | | | 0.21 | | | | 0.32 | (a) | | | 0.25 | (a) | | | 0.26 | (a) | | | 0.04 | (a) | |
| Net Gain (Loss) on Investments (both realized and unreailzed) | | | (6.19 | ) | | | 4.55 | | | | 3.82 | | | | 1.87 | | | | 4.78 | | |
| Total From Investment Operations: | | | (5.98 | ) | | | 4.87 | | | | 4.07 | | | | 2.13 | | | | 4.82 | | |
| Less Distributions: | |
| Dividends (from net investment income) | | | (0.33 | ) | | | (0.25 | ) | | | (0.23 | ) | | | (0.07 | ) | | | (0.05 | ) | |
| Distributions (from capital gains) | | | (3.42 | ) | | | (2.00 | ) | | | 0.00 | | | | 0.00 | | | | 0.00 | | |
| Total Distributions | | | (3.75 | ) | | | (2.25 | ) | | | (0.23 | ) | | | (0.07 | ) | | | (0.05 | ) | |
| Redemption Fees | | | 0.00 | (b) | | | 0.00 | (b) | | | 0.00 | (b) | | | 0.00 | | | | 0.00 | | |
| Net Asset Value, End of Period | | $ | 37.24 | | | $ | 46.97 | | | $ | 44.35 | | | $ | 40.51 | | | $ | 38.45 | | |
| Total Return | | | -13.51 | % | | | 11.11 | % | | | 10.08 | % | | | 5.55 | % | | | 14.32 | % | |
| Ratios/Supplemental Data: | |
| Net Assets, End of Period ($million) | | $ | 18.8 | | | $ | 29.1 | | | $ | 37.5 | | | $ | 43.7 | | | $ | 51.9 | | |
| Ratio of Expenses to Average Net Assets | | | 1.55 | %*† | | | 1.36 | %* | | | 1.40 | %* | | | 1.26 | %* | | | 1.40 | % | |
| Ratio of Net Investment Income to Average Net Assets | | | 0.72 | %† | | | 0.67 | % | | | 0.59 | % | | | 0.58 | % | | | 0.11 | % | |
| Portfolio Turnover Rate | | | 11 | % | | | 12 | % | | | 9 | % | | | 16 | % | | | 19 | % | |
* The ratio excludes expense offset arrangement.
† Data has been annualized.
(a) Computed using average shares outstanding throughout the period.
(b) Amount rounds to less than $0.01 per share.
See accompanying Notes to Financial Statements.
THE OAKMARK FUNDS
75
THE OAKMARK SELECT FUND
Financial Highlights–Class I
For a share outstanding throughout each period
| | | Six Months Ended
March 31,
2008
(Unaudited) | | Year Ended
September 30,
2007 | | Year Ended
September 30,
2006 | | Year Ended
September 30,
2005 | | Year Ended
September 30,
2004 | |
| Net Asset Value, Beginning of Period | | $ | 33.05 | | | $ | 34.48 | | | $ | 33.44 | | | $ | 31.20 | | | $ | 27.55 | | |
| Income From Investment Operations: | |
| Net Investment Income | | | 0.24 | | | | 0.38 | (a) | | | 0.36 | (a) | | | 0.29 | | | | 0.15 | (a) | |
| Net Gain (Loss) on Investments (both realized and unrealized) | | | (6.34 | ) | | | 2.11 | | | | 2.76 | | | | 2.19 | | | | 3.60 | | |
| Total From Investment Operations: | | | (6.10 | ) | | | 2.49 | | | | 3.12 | | | | 2.48 | | | | 3.75 | | |
| Less Distributions: | |
| Dividends (from net investment income) | | | (0.32 | ) | | | (0.39 | ) | | | (0.29 | ) | | | (0.24 | ) | | | (0.10 | ) | |
| Dividends (from capital gains) | | | (3.11 | ) | | | (3.53 | ) | | | (1.79 | ) | | | 0.00 | | | | 0.00 | | |
| Total Distributions | | | (3.43 | ) | | | (3.92 | ) | | | (2.08 | ) | | | (0.24 | ) | | | (0.10 | ) | |
| Redemption Fees | | | 0.00 | (b) | | | 0.00 | (b) | | | 0.00 | (b) | | | 0.00 | (b) | | | 0.00 | (b) | |
| Net Asset Value, End of Period | | $ | 23.52 | | | $ | 33.05 | | | $ | 34.48 | | | $ | 33.44 | | | $ | 31.20 | | |
| Total Return | | | -19.55 | % | | | 7.00 | % | | | 9.58 | % | | | 7.98 | % | | | 13.64 | % | |
| Ratios/Supplemental Data: | |
| Net Assets, End of Period ($million) | | $ | 3,382.3 | | | $ | 5,397.4 | | | $ | 5,776.6 | | | $ | 5,908.0 | | | $ | 5,463.0 | | |
| Ratio of Expenses to Average Net Assets | | | 1.08 | %*† | | | 0.97 | %* | | | 0.99 | %* | | | 1.00 | %* | | | 1.00 | % | |
| Ratio of Net Investment Income to Average Net Assets | | | 1.48 | %† | | | 1.11 | % | | | 1.08 | % | | | 0.87 | % | | | 0.50 | % | |
| Portfolio Turnover Rate | | | 12 | % | | | 10 | % | | | 22 | % | | | 21 | % | | | 14 | % | |
Financial Highlights–Class II
For a share outstanding throughout each period
| | | Six Months Ended
March 31,
2008
(Unaudited) | | Year Ended
September 30,
2007 | | Year Ended
September 30,
2006 | | Year Ended
September 30,
2005 | | Year Ended
September 30,
2004 | |
| Net Asset Value, Beginning of Period | | $ | 32.82 | | | $ | 34.23 | | | $ | 33.24 | | | $ | 31.00 | | | $ | 27.37 | | |
| Income From Investment Operations: | |
| Net Investment Income | | | 0.19 | | | | 0.27 | (a) | | | 0.26 | (a) | | | 0.21 | | | | 0.09 | (a) | |
| Net Gain (Loss) on Investments (both realized and unreailzed) | | | (6.33 | ) | | | 2.09 | | | | 2.72 | | | | 2.18 | | | | 3.58 | | |
| Total From Investment Operations: | | | (6.14 | ) | | | 2.36 | | | | 2.98 | | | | 2.39 | | | | 3.67 | | |
| Less Distributions: | |
| Dividends (from net investment income) | | | (0.11 | ) | | | (0.24 | ) | | | (0.20 | ) | | | (0.15 | ) | | | (0.04 | ) | |
| Distributions (from capital gains) | | | (3.11 | ) | | | (3.53 | ) | | | (1.79 | ) | | | 0.00 | | | | 0.00 | | |
| Total Distributions | | | (3.22 | ) | | | (3.77 | ) | | | (1.99 | ) | | | (0.15 | ) | | | (0.04 | ) | |
| Redemption Fees | | | 0.00 | (b) | | | 0.00 | (b) | | | 0.00 | (b) | | | 0.00 | | | | 0.00 | | |
| Net Asset Value, End of Period | | $ | 23.46 | | | $ | 32.82 | | | $ | 34.23 | | | $ | 33.24 | | | $ | 31.00 | | |
| Total Return | | | -19.76 | % | | | 6.65 | % | | | 9.18 | % | | | 7.72 | % | | | 13.40 | % | |
| Ratios/Supplemental Data: | |
| Net Assets, End of Period ($million) | | $ | 20.9 | | | $ | 36.2 | | | $ | 68.1 | | | $ | 85.2 | | | $ | 98.0 | | |
| Ratio of Expenses to Average Net Assets | | | 1.63 | %*† | | | 1.35 | %* | | | 1.34 | %* | | | 1.25 | %* | | | 1.21 | % | |
| Ratio of Net Investment Income to Average Net Assets | | | 0.95 | %† | | | 0.79 | % | | | 0.78 | % | | | 0.65 | % | | | 0.29 | % | |
| Portfolio Turnover Rate | | | 12 | % | | | 10 | % | | | 22 | % | | | 21 | % | | | 14 | % | |
* The ratio excludes expense offset arrangement.
† Data has been annualized.
(a) Computed using average shares outstanding throughout the period.
(b) Amount rounds to less than $0.01 per share.
THE OAKMARK FUNDS
76
THE OAKMARK EQUITY AND INCOME FUND
Financial Highlights–Class I
For a share outstanding throughout each period
| | | Six Months Ended
March 31,
2008
(Unaudited) | | Year Ended
September 30,
2007 | | Year Ended
September 30,
2006 | | Year Ended
September 30,
2005 | | Year Ended
September 30,
2004 | |
| Net Asset Value, Beginning of Period | | $ | 28.67 | | | $ | 26.49 | | | $ | 25.41 | | | $ | 23.12 | | | $ | 20.30 | | |
| Income From Investment Operations: | |
| Net Investment Income | | | 0.25 | (a) | | | 0.58 | (a) | | | 0.44 | | | | 0.31 | | | | 0.15 | | |
| Net Gain (Loss) on Investments (both realized and unrealized) | | | 0.33 | | | | 3.41 | | | | 1.18 | | | | 2.77 | | | | 2.81 | | |
| Total From Investment Operations: | | | 0.58 | | | | 3.99 | | | | 1.62 | | | | 3.08 | | | | 2.96 | | |
| Less Distributions: | |
| Dividends (from net investment income) | | | (0.60 | ) | | | (0.50 | ) | | | (0.34 | ) | | | (0.20 | ) | | | (0.14 | ) | |
| Dividends (from capital gains) | | | (1.51 | ) | | | (1.31 | ) | | | (0.20 | ) | | | (0.59 | ) | | | 0.00 | | |
| Total Distributions | | | (2.11 | ) | | | (1.81 | ) | | | (0.54 | ) | | | (0.79 | ) | | | (0.14 | ) | |
| Redemption Fees | | | 0.00 | (b) | | | 0.00 | (b) | | | 0.00 | (b) | | | 0.00 | (b) | | | 0.00 | (b) | |
| Net Asset Value, End of Period | | $ | 27.14 | | | $ | 28.67 | | | $ | 26.49 | | | $ | 25.41 | | | $ | 23.12 | | |
| Total Return | | | 2.05 | % | | | 15.77 | % | | | 6.51 | % | | | 13.65 | % | | | 14.64 | % | |
| Ratios/Supplemental Data: | |
| Net Assets, End of Period ($million) | | $ | 13,013.1 | | | $ | 12,489.5 | | | $ | 10,414.5 | | | $ | 9,223.2 | | | $ | 7,577.9 | | |
| Ratio of Expenses to Average Net Assets | | | 0.82 | %*† | | | 0.83 | %* | | | 0.86 | %* | | | 0.89 | %* | | | 0.92 | % | |
| Ratio of Net Investment Income to Average Net Assets | | | 1.82 | %† | | | 2.14 | % | | | 1.88 | % | | | 1.36 | % | | | 0.78 | % | |
| Portfolio Turnover Rate | | | 23 | % | | | 67 | % | | | 81 | % | | | 112 | % | | | 72 | % | |
Financial Highlights–Class II
For a share outstanding throughout each period
| | | Six Months Ended
March 31,
2008
(Unaudited) | | Year Ended
September 30,
2007 | | Year Ended
September 30,
2006 | | Year Ended
September 30,
2005 | | Year Ended
September 30,
2004 | |
| Net Asset Value, Beginning of Period | | $ | 28.50 | | | $ | 26.35 | | | $ | 25.29 | | | $ | 23.03 | | | $ | 20.24 | | |
| Income From Investment Operations: | |
| Net Investment Income | | | 0.20 | (a) | | | 0.48 | (a) | | | 0.35 | | | | 0.28 | | | | 0.11 | | |
| Net Gain (Loss) on Investments (both realized and unreailzed) | | | 0.32 | | | | 3.40 | | | | 1.19 | | | | 2.72 | | | | 2.79 | | |
| Total From Investment Operations: | | | 0.52 | | | | 3.88 | | | | 1.54 | | | | 3.00 | | | | 2.90 | | |
| Less Distributions: | |
| Dividends (from net investment income) | | | (0.51 | ) | | | (0.42 | ) | | | (0.28 | ) | | | (0.15 | ) | | | (0.11 | ) | |
| Distributions (from capital gains) | | | (1.51 | ) | | | (1.31 | ) | | | (0.20 | ) | | | (0.59 | ) | | | 0.00 | | |
| Total Distributions | | | (2.02 | ) | | | (1.73 | ) | | | (0.48 | ) | | | (0.74 | ) | | | (0.11 | ) | |
| Redemption Fees | | | 0.00 | (b) | | | 0.00 | (b) | | | 0.00 | (b) | | | 0.00 | | | | 0.00 | | |
| Net Asset Value, End of Period | | $ | 27.00 | | | $ | 28.50 | | | $ | 26.35 | | | $ | 25.29 | | | $ | 23.03 | | |
| Total Return | | | 1.84 | % | | | 15.38 | % | | | 6.18 | % | | | 13.34 | % | | | 14.36 | % | |
| Ratios/Supplemental Data: | |
| Net Assets, End of Period ($million) | | $ | 988.9 | | | $ | 915.1 | | | $ | 718.1 | | | $ | 582.0 | | | $ | 478.7 | | |
| Ratio of Expenses to Average Net Assets | | | 1.16 | %*† | | | 1.17 | %* | | | 1.18 | %* | | | 1.14 | %* | | | 1.17 | % | |
| Ratio of Net Investment Income to Average Net Assets | | | 1.48 | %† | | | 1.82 | % | | | 1.57 | % | | | 1.11 | % | | | 0.53 | % | |
| Portfolio Turnover Rate | | | 23 | % | | | 67 | % | | | 81 | % | | | 112 | % | | | 72 | % | |
* The ratio excludes expense offset arrangement.
† Data has been annualized.
(a) Computed using average shares outstanding throughout the period.
(b) Amount rounds to less than $0.01 per share.
See accompanying Notes to Financial Statements.
THE OAKMARK FUNDS
77
THE OAKMARK GLOBAL FUND
Financial Highlights–Class I
For a share outstanding throughout each period
| | | Six Months Ended
March 31,
2008
(Unaudited) | | Year Ended
September 30,
2007 | | Year Ended
September 30,
2006 | | Year Ended
September 30,
2005 | | Year Ended
September 30,
2004 | |
| Net Asset Value, Beginning of Period | | $ | 28.08 | | | $ | 26.69 | | | $ | 23.91 | | | $ | 19.73 | | | $ | 16.98 | | |
| Income From Investment Operations: | |
| Net Investment Income | | | 0.03 | | | | 0.18 | (a) | | | 0.27 | | | | 0.17 | | | | 0.09 | | |
| Net Gain (Loss) on Investments (both realized and unrealized) | | | (2.97 | ) | | | 5.06 | | | | 3.74 | | | | 4.48 | | | | 2.71 | | |
| Total From Investment Operations: | | | (2.94 | ) | | | 5.24 | | | | 4.01 | | | | 4.65 | | | | 2.80 | | |
| Less Distributions: | |
| Dividends (from net investment income) | | | (0.04 | ) | | | (0.31 | ) | | | (0.26 | ) | | | (0.10 | ) | | | 0.00 | (b) | |
| Dividends (from capital gains) | | | (3.04 | ) | | | (3.54 | ) | | | (0.97 | ) | | | (0.37 | ) | | | (0.05 | ) | |
| Total Distributions | | | (3.08 | ) | | | (3.85 | ) | | | (1.23 | ) | | | (0.47 | ) | | | (0.05 | ) | |
| Redemption Fees | | | 0.00 | (b) | | | 0.00 | (b) | | | 0.00 | (b) | | | 0.00 | (b) | | | 0.00 | (b) | |
| Net Asset Value, End of Period | | $ | 22.06 | | | $ | 28.08 | | | $ | 26.69 | | | $ | 23.91 | | | $ | 19.73 | | |
| Total Return | | | -11.52 | % | | | 21.29 | % | | | 17.46 | % | | | 23.88 | % | | | 16.54 | % | |
| Ratios/Supplemental Data: | |
| Net Assets, End of Period ($million) | | $ | 2,391.2 | | | $ | 3,006.2 | | | $ | 2,282.2 | | | $ | 1,842.9 | | | $ | 1,336.3 | | |
| Ratio of Expenses to Average Net Assets | | | 1.18 | %*† | | | 1.13 | %* | | | 1.18 | %* | | | 1.20 | %* | | | 1.26 | % | |
| Ratio of Net Investment Income to Average Net Assets | | | 0.20 | %† | | | 0.66 | % | | | 1.18 | % | | | 0.81 | % | | | 0.47 | % | |
| Portfolio Turnover Rate | | | 21 | % | | | 35 | % | | | 41 | % | | | 17 | % | | | 16 | % | |
Financial Highlights–Class II
For a share outstanding throughout each period
| | | Six Months Ended
March 31,
2008
(Unaudited) | | Year Ended
September 30,
2007 | | Year Ended
September 30,
2006 | | Year Ended
September 30,
2005 | | Year Ended
September 30,
2004 | |
| Net Asset Value, Beginning of Period | | $ | 27.62 | | | $ | 26.31 | | | $ | 23.63 | | | $ | 19.53 | | | $ | 16.84 | | |
| Income From Investment Operations: | |
| Net Investment Income | | | (0.03 | ) | | | 0.07 | (a) | | | 0.18 | | | | 0.11 | | | | 0.05 | | |
| Net Gain (Loss) on Investments (both realized and unreailzed) | | | (2.92 | ) | | | 4.99 | | | | 3.69 | | | | 4.43 | | | | 2.69 | | |
| Total From Investment Operations: | | | (2.95 | ) | | | 5.06 | | | | 3.87 | | | | 4.54 | | | | 2.74 | | |
| Less Distributions: | |
| Dividends (from net investment income) | | | (0.01 | ) | | | (0.21 | ) | | | (0.22 | ) | | | (0.07 | ) | | | 0.00 | | |
| Distributions (from capital gains) | | | (3.04 | ) | | | (3.54 | ) | | | (0.97 | ) | | | (0.37 | ) | | | (0.05 | ) | |
| Total Distributions | | | (3.05 | ) | | | (3.75 | ) | | | (1.19 | ) | | | (0.44 | ) | | | (0.05 | ) | |
| Redemption Fees | | | 0.00 | (b) | | | 0.00 | (b) | | | 0.00 | (b) | | | 0.00 | | | | 0.00 | | |
| Net Asset Value, End of Period | | $ | 21.62 | | | $ | 27.62 | | | $ | 26.31 | | | $ | 23.63 | | | $ | 19.53 | | |
| Total Return | | | -11.73 | % | | | 20.82 | % | | | 17.01 | % | | | 23.53 | % | | | 16.32 | % | |
| Ratios/Supplemental Data: | |
| Net Assets, End of Period ($million) | | $ | 70.3 | | | $ | 90.3 | | | $ | 77.1 | | | $ | 58.6 | | | $ | 24.7 | | |
| Ratio of Expenses to Average Net Assets | | | 1.62 | %*† | | | 1.53 | %* | | | 1.56 | %* | | | 1.45 | %* | | | 1.50 | % | |
| Ratio of Net Investment Income (Loss) to Average Net Assets | | | (0.25 | )%† | | | 0.25 | % | | | 0.80 | % | | | 0.63 | % | | | 0.37 | % | |
| Portfolio Turnover Rate | | | 21 | % | | | 35 | % | | | 41 | % | | | 17 | % | | | 16 | % | |
* The ratio excludes expense offset arrangement.
† Data has been annualized.
(a) Computed using average shares outstanding throughout the period.
(b) Amount rounds to less than $0.01 per share.
THE OAKMARK FUNDS
78
THE OAKMARK GLOBAL SELECT FUND
Financial Highlights–Class I
For a share outstanding throughout each period
| | | Six Months Ended
March 31,
2008
(Unaudited) | | October 2, 2006
through
September 30,
2007 (a) | | | |
| Net Asset Value, Beginning of Period | | $ | 11.61 | | | $ | 10.00 | | | | |
| Income From Investment Operations: | |
| Net Investment Income | | | 0.07 | (b) | | | 0.12 | (b) | | | |
| Net Gain (Loss) on Investments (both realized and unrealized) | | | (2.14 | ) | | | 1.49 | | | | |
| Total From Investment Operations: | | | (2.07 | ) | | | 1.61 | | | | |
| Less Distributions: | |
| Dividends (from net investment income) | | | (0.02 | ) | | | (0.01 | ) | | | |
| Dividends (from capital gains) | | | (0.44 | ) | | | 0.00 | | | | |
| Total Distributions | | | (0.46 | ) | | | (0.01 | ) | | | |
| Redemption Fees | | | 0.00 | (c) | | | 0.01 | | | | |
| Net Asset Value, End of Period | | $ | 9.08 | | | $ | 11.61 | | | | |
| Total Return | | | -18.30 | % | | | 16.23 | % | |  | |
| Ratios/Supplemental Data: | |
| Net Assets, End of Period ($million) | | $ | 278.3 | | | $ | 377.7 | | | | |
| Ratio of Expenses to Average Net Assets | | | 1.35 | %*† | | | 1.31 | %*† | | | |
| Ratio of Net Investment Income to Average Net Assets | | | 1.36 | %† | | | 1.01 | % | | | |
| Portfolio Turnover Rate | | | 43 | % | | | 33 | % | | | |
 Data has not been annualized.
* The ratio excludes expense offset arrangement.
† Data has been annualized.
(a) The date of which fund shares were first offered for sale to the public was October 2, 2006.
(b) Computed using average shares outstanding throughout the period.
(c) Amount rounds to less than $0.01 per share.
See accompanying Notes to Financial Statements.
THE OAKMARK FUNDS
79
THE OAKMARK INTERNATIONAL FUND
Financial Highlights–Class I
For a share outstanding throughout each period
| | | Six Months Ended
March 31,
2008
(Unaudited) | | Year Ended
September 30,
2007 | | Year Ended
September 30,
2006 | | Year Ended
September 30,
2005 | | Year Ended
September 30,
2004 | |
| Net Asset Value, Beginning of Period | | $ | 26.59 | | | $ | 26.83 | | | $ | 23.52 | | | $ | 18.98 | | | $ | 15.67 | | |
| Income From Investment Operations: | |
| Net Investment Income | | | 0.12 | | | | 0.43 | | | | 0.41 | | | | 0.27 | | | | 0.24 | | |
| Net Gain (Loss) on Investments (both realized and unrealized) | | | (3.66 | ) | | | 3.25 | | | | 4.49 | | | | 4.59 | | | | 3.18 | | |
| Total From Investment Operations: | | | (3.54 | ) | | | 3.68 | | | | 4.90 | | | | 4.86 | | | | 3.42 | | |
| Less Distributions: | |
| Dividends (from net investment income) | | | (0.17 | ) | | | (0.44 | ) | | | (0.59 | ) | | | (0.27 | ) | | | (0.11 | ) | |
| Dividends (from capital gains) | | | (4.25 | ) | | | (3.48 | ) | | | (1.00 | ) | | | (0.05 | ) | | | 0.00 | | |
| Total Distributions | | | (4.42 | ) | | | (3.92 | ) | | | (1.59 | ) | | | (0.32 | ) | | | (0.11 | ) | |
| Redemption Fees | | | 0.00 | (a) | | | 0.00 | (a) | | | 0.00 | (a) | | | 0.00 | (a) | | | 0.00 | (a) | |
| Net Asset Value, End of Period | | $ | 18.63 | | | $ | 26.59 | | | $ | 26.83 | | | $ | 23.52 | | | $ | 18.98 | | |
| Total Return | | | -15.28 | % | | | 14.53 | % | | | 22.14 | % | | | 25.85 | % | | | 21.92 | % | |
| Ratios/Supplemental Data: | |
| Net Assets, End of Period ($million) | | $ | 6,009.6 | | | $ | 8,446.6 | | | $ | 7,200.5 | | | $ | 5,627.4 | | | $ | 4,036.9 | | |
| Ratio of Expenses to Average Net Assets | | | 1.12 | %*† | | | 1.05 | %* | | | 1.08 | %* | | | 1.11 | %* | | | 1.20 | % | |
| Ratio of Net Investment Income to Average Net Assets | | | 1.07 | %† | | | 1.65 | % | | | 1.80 | % | | | 1.32 | % | | | 1.40 | % | |
| Portfolio Turnover Rate | | | 21 | % | | | 50 | % | | | 37 | % | | | 14 | % | | | 21 | % | |
Financial Highlights–Class II
For a share outstanding throughout each period
| | | Six Months Ended
March 31,
2008
(Unaudited) | | Year Ended
September 30,
2007 | | Year Ended
September 30,
2006 | | Year Ended
September 30,
2005 | | Year Ended
September 30,
2004 | |
| Net Asset Value, Beginning of Period | | $ | 26.32 | | | $ | 26.61 | | | $ | 23.36 | | | $ | 18.86 | | | $ | 15.58 | | |
| Income From Investment Operations: | |
| Net Investment Income | | | 0.08 | | | | 0.35 | | | | 0.34 | | | | 0.22 | | | | 0.18 | | |
| Net Gain (Loss) on Investments (both realized and unreailzed) | | | (3.63 | ) | | | 3.19 | | | | 4.45 | | | | 4.55 | | | | 3.16 | | |
| Total From Investment Operations: | | | (3.55 | ) | | | 3.54 | | | | 4.79 | | | | 4.77 | | | | 3.34 | | |
| Less Distributions: | |
| Dividends (from net investment income) | | | (0.05 | ) | | | (0.35 | ) | | | (0.54 | ) | | | (0.22 | ) | | | (0.06 | ) | |
| Distributions (from capital gains) | | | (4.25 | ) | | | (3.48 | ) | | | (1.00 | ) | | | (0.05 | ) | | | 0.00 | | |
| Total Distributions | | | (4.30 | ) | | | (3.83 | ) | | | (1.54 | ) | | | (0.27 | ) | | | (0.06 | ) | |
| Redemption Fees | | | 0.00 | (a) | | | 0.00 | (a) | | | 0.00 | (a) | | | 0.00 | | | | 0.00 | | |
| Net Asset Value, End of Period | | $ | 18.47 | | | $ | 26.32 | | | $ | 26.61 | | | $ | 23.36 | | | $ | 18.86 | | |
| Total Return | | | -15.46 | % | | | 14.04 | % | | | 21.71 | % | | | 25.50 | % | | | 21.52 | % | |
| Ratios/Supplemental Data: | |
| Net Assets, End of Period ($million) | | $ | 392.0 | | | $ | 586.9 | | | $ | 496.0 | | | $ | 362.9 | | | $ | 259.2 | | |
| Ratio of Expenses to Average Net Assets | | | 1.59 | %*† | | | 1.44 | %* | | | 1.47 | %* | | | 1.38 | %* | | | 1.53 | % | |
| Ratio of Net Investment Income to Average Net Assets | | | 0.61 | %† | | | 1.31 | % | | | 1.43 | % | | | 1.08 | % | | | 1.18 | % | |
| Portfolio Turnover Rate | | | 21 | % | | | 50 | % | | | 37 | % | | | 14 | % | | | 21 | % | |
* The ratio excludes expense offset arrangement.
† Data has been annualized.
(a) Amount rounds to less than $0.01 per share.
THE OAKMARK FUNDS
80
THE OAKMARK INTERNATIONAL SMALL CAP FUND
Financial Highlights–Class I
For a share outstanding throughout each period
| | | Six Months Ended
March 31,
2008
(Unaudited) | | Year Ended
September 30,
2007 | | Year Ended
September 30,
2006 | | Year Ended
September 30,
2005 | | Year Ended
September 30,
2004 | |
| Net Asset Value, Beginning of Period | | $ | 23.19 | | | $ | 24.09 | | | $ | 22.79 | | | $ | 18.26 | | | $ | 13.74 | | |
| Income From Investment Operations: | |
| Net Investment Income | | | 0.08 | | | | 0.32 | | | | 0.42 | | | | 0.20 | | | | 0.11 | | |
| Net Gain (Loss) on Investments (both realized and unrealized) | | | (3.44 | ) | | | 2.77 | | | | 5.12 | | | | 4.98 | | | | 4.52 | | |
| Total From Investment Operations: | | | (3.36 | ) | | | 3.09 | | | | 5.54 | | | | 5.18 | | | | 4.63 | | |
| Less Distributions: | |
| Dividends (from net investment income) | | | (0.18 | ) | | | (0.56 | ) | | | (0.70 | ) | | | (0.27 | ) | | | (0.12 | ) | |
| Dividends (from capital gains) | | | (5.66 | ) | | | (3.43 | ) | | | (3.54 | ) | | | (0.38 | ) | | | 0.00 | | |
| Total Distributions | | | (5.84 | ) | | | (3.99 | ) | | | (4.24 | ) | | | (0.65 | ) | | | (0.12 | ) | |
| Redemption Fees | | | 0.00 | (a) | | | 0.00 | (a) | | | 0.00 | (a) | | | 0.00 | (a) | | | 0.01 | | |
| Net Asset Value, End of Period | | $ | 13.99 | | | $ | 23.19 | | | $ | 24.09 | | | $ | 22.79 | | | $ | 18.26 | | |
| Total Return | | | -16.83 | % | | | 13.35 | % | | | 28.50 | % | | | 29.04 | % | | | 33.94 | % | |
| Ratios/Supplemental Data: | |
| Net Assets, End of Period ($million) | | $ | 854.4 | | | $ | 1,326.5 | | | $ | 1,274.5 | | | $ | 1,007.2 | | | $ | 734.1 | | |
| Ratio of Expenses to Average Net Assets | | | 1.46 | %*† | | | 1.34 | %* | | | 1.37 | %* | | | 1.41 | %* | | | 1.49 | % | |
| Ratio of Net Investment Income to Average Net Assets | | | 0.61 | %† | | | 1.19 | % | | | 1.73 | % | | | 0.96 | % | | | 0.72 | % | |
| Portfolio Turnover Rate | | | 26 | % | | | 57 | % | | | 44 | % | | | 47 | % | | | 29 | % | |
Financial Highlights–Class II
For a share outstanding throughout each period
| | | Six Months Ended
March 31,
2008
(Unaudited) | | Year Ended
September 30,
2007 | | Year Ended
September 30,
2006 | | Year Ended
September 30,
2005 | | Year Ended
September 30,
2004 | |
| Net Asset Value, Beginning of Period | | $ | 23.15 | | | $ | 24.05 | | | $ | 22.77 | | | $ | 18.25 | | | $ | 13.69 | | |
| Income From Investment Operations: | |
| Net Investment Income | | | 0.07 | | | | 0.29 | | | | 0.41 | | | | 0.18 | | | | 0.13 | | |
| Net Gain (Loss) on Investments (both realized and unreailzed) | | | (3.46 | ) | | | 2.79 | | | | 5.10 | | | | 4.98 | | | | 4.52 | | |
| Total From Investment Operations: | | | (3.39 | ) | | | 3.08 | | | | 5.51 | | | | 5.16 | | | | 4.65 | | |
| Less Distributions: | |
| Dividends (from net investment income) | | | (0.15 | ) | | | (0.55 | ) | | | (0.69 | ) | | | (0.26 | ) | | | (0.09 | ) | |
| Distributions (from capital gains) | | | (5.66 | ) | | | (3.43 | ) | | | (3.54 | ) | | | (0.38 | ) | | | 0.00 | | |
| Total Distributions | | | (5.81 | ) | | | (3.98 | ) | | | (4.23 | ) | | | (0.64 | ) | | | (0.09 | ) | |
| Redemption Fees | | | 0.00 | (a) | | | 0.00 | (a) | | | 0.00 | (a) | | | 0.00 | | | | 0.00 | | |
| Net Asset Value, End of Period | | $ | 13.95 | | | $ | 23.15 | | | $ | 24.05 | | | $ | 22.77 | | | $ | 18.25 | | |
| Total Return | | | -17.05 | % | | | 13.29 | % | | | 28.33 | % | | | 28.94 | % | | | 34.11 | % | |
| Ratios/Supplemental Data: | |
| Net Assets, End of Period ($million) | | $ | 0.6 | | | $ | 0.9 | | | $ | 0.8 | | | $ | 0.6 | | | $ | 0.5 | | |
| Ratio of Expenses to Average Net Assets | | | 1.75 | %*† | | | 1.43 | %* | | | 1.47 | %* | | | 1.49 | %* | | | 1.39 | % | |
| Ratio of Net Investment Income to Average Net Assets | | | 0.36 | %† | | | 1.12 | % | | | 1.62 | % | | | 0.87 | % | | | 0.75 | % | |
| Portfolio Turnover Rate | | | 26 | % | | | 57 | % | | | 44 | % | | | 47 | % | | | 29 | % | |
* The ratio excludes expense offset arrangement.
† Data has been annualized.
(a) Amount rounds to less than $0.01 per share.
See accompanying Notes to Financial Statements.
THE OAKMARK FUNDS
81
THE OAKMARK FUNDS DISCLOSURE REGARDING THE BOARD OF TRUSTEES' OCTOBER 2007 APPROVAL OF INVESTMENT ADVISORY CONTRACTS AS APPROVED APRIL 23, 2008
Each year the Board of Trustees of the Oakmark Funds (the "Board"), including a majority of the independent Trustees, is required by the Investment Company Act of 1940 (the "1940 Act") to determine whether to continue each Fund's investment advisory agreement (each an "Agreement") with the Fund's investment adviser (the "Adviser"). The Board requests and receives from the Adviser a broad range of materials and information that are relevant to the Trustees' consideration of the Agreements, both throughout the year and especially in connection with its annual review of the Agreements. In addition, the Board retains an independent consultant to provide performance and expense information for each Fund and for comparable funds.
The Board's contracts committee (the "Committee") leads the Board in its evaluation of the Agreements. The Committee is comprised entirely of trustees who are not "interested persons" of the Funds as defined in the 1940 Act ("Independent Trustees"), and more than 75% of the Board is comprised of Independent Trustees. During the last year, the Committee and the Board met numerous times to consider the Agreements. At each of those meetings, the Committee and the Board were advised by, and met in executive session with, their experienced independent legal counsel.
In determining whether to continue each Agreement, the Committee and the Board reviewed among other things: (i) the nature, quality and extent of the Adviser's services, (ii) the investment performance of each Fund as well as performance information for comparable funds, (iii) the fees and other expenses paid by each Fund as well as expense information for comparable funds, (iv) the Adviser's profitability from its relationship with each Fund, (v) whether economies of scale may be realized as each Fund grows and whether fee levels share with Fund investors economies of scale and (vi) other benefits to the Adviser from its relationship with the Funds.
At a meeting held on October 24, 2007, the Board, including all of the Independent Trustees, upon recommendation of the Committee and after negotiation of additional breakpoints in the schedule of fees for The Oakmark Equity and Income Fund, The Oakmark International Fund and The Oakmark Global Fund, determined that the continuation of the Agreement for each Fund was in the best interest of the Fund and its shareholders, and approved the continuation of the Agreements through October 31, 2008. Below is a summary of the principal information considered by the Board as well as the Board's conclusions regarding various factors. In their deliberations, the Independent Trustees did not identify any single factor that was paramount or dispositive, and each Independent Trustee may have weighed the information differently.
1. Nature, Extent and Quality of Services
The Board's consideration of the nature, extent and quality of the Adviser's services to the Funds took into account the knowledge gained from the Board's meetings with the Adviser over a period of years. In addition, the Board considered: the Adviser's long-term history of care and conscientiousness in the management of the Funds; the consistency of the Adviser's investment approach; the background and experience of the Adviser's investment personnel responsible for managing the Funds; the Adviser's performance as investment manager and administrator of the Funds, including, among other things, in the areas of brokerage selection, trade execution, compliance, shareholder communications, treasury administration, service provider oversight, and risk management; and frequent favorable recognition of the Adviser and the Funds in the media and in industry publications. The Board also reviewed the Adviser's resources and key personnel involved in providing investment management services to the Funds, including the time that investment personnel devote to each Fund and the investment results produced by the Adviser's in-house research. The Board also noted the significant personal investments that the Adviser's personnel have made in the Funds, which further align the interests of the Adviser and its personnel with those of the Funds' shareholders. The Trustees concluded that the nature, extent and quality of the services provided by the Adviser to each Fund were appropriate and consistent with the Fund's Agreement and that each Fund was likely to continue to benefit from services provided under its Agreement with the Adviser.
THE OAKMARK FUNDS
82
2. Investment Performance of the Funds
The Board considered each Fund's investment performance over various time periods, including comparative information provided by its consultant, Lipper Inc. ("Lipper"), an independent data service provider that was retained by the Board to prepare a study comparing each Fund's performance with that of comparable funds selected by Lipper (the "Performance Universe").
In addition to comparing each Fund's performance to that of its Performance Universe, the Board also considered the Fund's performance compared to that of its benchmark and other comparative data provided by Lipper, including the Fund's total return and performance relative to risk. The Board had numerous discussions with the Adviser about the performance of each Fund and the Adviser's investment philosophy. The Board noted the Adviser's assertion that it has remained consistent in its application of a value investing discipline throughout various market cycles and periods of over- and under-performance experienced by the Funds. After considering all of the information, the Trustees concluded that the Adviser was delivering performance for each Fund that was consistent with the long-term investment strategies being pursued by the Fund and that the Fund and its shareholders were benefiting from the Adviser's investment management of the Fund.
3. Costs of Services Provided and Profits Realized by the Adviser
Using information provided by Lipper, the Board evaluated each Fund's advisory fee compared to the advisory fees paid by other mutual funds similar in size, character and investment strategy ("Expense Group"), and the Fund's expense ratio compared to that of the Expense Group.
The Board also reviewed the Adviser's advisory fees for its institutional separate accounts and for its subadvised funds (for which the Adviser provides portfolio management services only). The Trustees noted that, although in most instances, the fees paid by those clients generally were lower than the rates of fees paid by the Funds, the differences reflected the Adviser's significantly greater level of responsibilities and broader scope of services regarding the Funds, and the more extensive regulatory obligations and risks associated with managing the Funds.
The Board also considered the Adviser's costs in serving as the Fund's investment adviser and manager, including costs associated with technology, infrastructure and compliance necessary to manage the Funds effectively. The Board reviewed the Adviser's methodology for allocating costs among the Adviser's lines of business. The Board also considered information regarding the structure of the Adviser's compensation program for portfolio managers, analysts and certain other employees and the relationship of such compensation to the attraction and retention of quality personnel. The Board noted that at certain times the Adviser had voluntarily limited the growth of assets that it manages in order to protect investment performance by partially closing a majority of the Funds to new investors and limiting investments in a number of its institutional investment strategies. Finally, the Board considered the Adviser's profitability analysis as well a s an Investment Management Profitability Analysis prepared by Lipper. The Board noted the pre-tax profits realized by the Adviser and its affiliates from their relationship with each Fund, as well as the financial condition of the Adviser.
The Board considered that, as a percent of net assets, the total expenses (inclusive of management fees) of four of the Funds were lower than or near the medians for their respective Expense Groups, while the total expenses of The Oakmark Fund, The Oakmark Select Fund and The Oakmark Global Select Fund were above the medians for their Expense Groups.
After their review of all the matters addressed, including those outlined above, the Trustees concluded that the management fees paid by each Fund to the Adviser were reasonable in light of the services provided and that the profitability to the Adviser of its relationship with the Funds appeared to be reasonable in relation to the services provided.
4. Economies of Scale and Fee Levels Reflecting Those Economies
The Board considered whether the management fee structure for each Fund provides for a sharing with the Funds of potential economies of scale that may be achieved by the Adviser. The Board reviewed each Fund's
THE OAKMARK FUNDS
83
Agreement, which provide for breakpoints that decrease the management fee rate at various asset levels as the Fund's assets increase. The Board also considered that the Committee and the Adviser had negotiated additional breakpoints in the Agreements for The Oakmark Equity and Income Fund, The Oakmark International Fund and The Oakmark Global Fund. The Trustees concluded that the breakpoints in the fee schedule for each Fund allow the Fund and its shareholders to benefit from potential economies of scale that may be achieved by the Adviser as Fund assets increase.
5. Other Benefits Derived from the Relationship with the Funds
The Board also considered other benefits that accrue to the Adviser and its affiliates from their relationship with the Funds. The Board noted that an affiliate of the Adviser serves as the Funds' distributor, without compensation, pursuant to a written agreement that the Board evaluates and approves annually.
The Board also considered the Adviser's use of a portion of the commissions paid by the Funds on their portfolio brokerage transactions to obtain research products and services benefiting the Funds and/or other clients of the Adviser and concluded that the Adviser's use of "soft" commission dollars to obtain research products and services was consistent with regulatory requirements. The Board also noted that the Adviser's use of "soft" commission dollars was relatively low compared to many others in the industry and that the Adviser generally limits the use of "soft" commission dollars to obtain proprietary research products and services from brokers with which it trades.
After full consideration of the above factors, as well as other factors that were instructive in evaluating the Agreements, the Board, including all of the Independent Trustees, concluded that approval of each Fund's agreement was in the best interests of the Fund and its shareholders. On October 24, 2007, the Board continued each Agreement, with amendments to the Agreements for The Oakmark Equity and Income Fund, The Oakmark International Fund and The Oakmark Global Fund to add additional breakpoints in the fee schedules.
THE OAKMARK FUNDS
84
For a prospectus and more information about The Oakmark Funds, including management fees and expenses and the special risks of investing, please visit oakmark.com or call 1-800-OAKMARK (1-800-625-6275). Please read the prospectus carefully before investing. An investor should consider a fund's investment objectives, risks, and charges and expenses carefully before investing. This and other information about The Oakmark Funds are contained in the Funds' prospectus.
The discussion of the Funds' investments and investment strategy (including current investment themes, the portfolio managers' research and investment process, and portfolio characteristics) represents the Funds' investments and the views of the portfolio managers and Harris Associates L.P., the Funds' investment adviser, at the time of this letter, and are subject to change without notice.
Past performance is no guarantee of future results. The performance data quoted represents past performance. Current performance may be lower or higher than the performance data quoted. The investment return and principal value vary so that an investor's shares when redeemed may be worth more or less than their original cost. The performance of the Funds does not reflect a 2% redemption fee on shares held by an investor for 90 days or less with the exception of The Oakmark Equity & Income Fund which does not impose a redemption fee. The purpose of the fee is to deter market timers.
Investing in value stocks presents the risk that value stocks may fall out of favor with investors and underperform growth stocks during given periods.
The Oakmark Global Fund closed to certain new investors as of 12/15/03 and The Oakmark Equity and Income Fund closed to certain new investors as of 5/7/04.
Because The Oakmark Select Fund and The Oakmark Global Select Fund are non-diversified, the performance of each holding will have a greater impact on each Fund's total return, and may make the Funds' returns more volatile than a more diversified fund.
The Oakmark Equity and Income Fund invests in medium- and lower-quality debt securities that have higher yield potential but present greater investment and credit risk than higher-quality securities, which may result in greater share price volatility. An economic downturn could severely disrupt the market in medium or lower grade debt securities and adversely affect the value of outstanding bonds and the ability of the issuers to repay principal and interest.
Investing in foreign securities represents risks which in some way may be greater than in U.S. investments. Those risks include: currency fluctuation; different regulation, accounting standards, trading practices and levels of available information; generally higher transaction costs; and political risks.
The stocks of smaller companies often involve more risk than the stocks of larger companies. Stocks of small companies tend to be more volatile and have a smaller public market than stocks of larger companies. Small companies may have a shorter history of operations than larger companies, may not have as great an ability to raise additional capital and may have a less diversified product line, making them more susceptible to market pressure.
1. Total return includes change in share prices and in each case includes reinvestment of any dividends and capital gain distributions.
2. Portfolio holdings are subject to change without notice and are not intended as recommendations of individual stocks.
3. Ben Stein, "Making Sense of a Scared New World." The New York Times, March 23, 2008.
4. Gene Epstein, "Commodities: Who's Behind the Boom?" Barron's, March 31, 2008.
5. Gregory Zuckerman, "Blame Game: The 'Uptick' Rule Debate." The Wall Street Journal, April 1, 2008.
6. The S&P 500 Index is a broad market-weighted average of U.S. blue-chip companies. This index is unmanaged and investors cannot actually make investments in this index.
7. John Train, "The Craft of Investing: Growth and Value Stocks, Emerging Markets, Market Timing, Mutual Funds, Alternative Investments, Retirement and Estate Planning, Tax Savings." HarperCollins Publishers, Inc., 1994.
8. The Dow Jones Industrial Average is an unmanaged index that includes only 30 big companies. This index is unmanaged and investors cannot invest directly in this index.
THE OAKMARK FUNDS
85
9. The Lipper Large Cap Value Fund Index is an equally weighted index of the largest 30 funds within the large cap value funds investment objective as defined by Lipper Inc. The index is adjusted for the reinvestment of capital gains and income dividends. This index is unmanaged and investors cannot invest directly in this index.
10. The Lipper Multi-Cap Value Funds Index tracks the results of the 30 largest mutual funds in the Lipper Multi-Cap Value Funds category. This index is unmanaged and investors cannot invest directly in this index.
11. The Lipper Balanced Fund Index measures the performance of the 30 largest U.S. balanced funds tracked by Lipper. This index is unmanaged and investors cannot invest directly in this index.
12. Lehman Brothers Government/Corporate Bond Index is a benchmark index made up of the Lehman Brothers Government and Corporate Bond indexes, including U.S. government Treasury and agency securities as well as corporate and Yankee bonds. This index is unmanaged and investors cannot invest directly in this index.
13. E.S. Browning, "Stocks Tarnished By 'Lost Decade.'" The Wall Street Journal, March 26, 2008.
14. James Altucher, "Forget the stock crash – grab an airbag." The Financial Times, February 26, 2008.
15. The MSCI World Index is a free float-adjusted market capitalization weighted index that is designed to measure the equity market performance of developed markets. The MSCI World Index currently consists of the following 23 developed market country indices: Australia, Austria, Belgium, Canada, Denmark, Finland, France, Germany, Greece, Hong Kong, Ireland, Italy, Japan, Netherlands, New Zealand, Norway, Portugal, Singapore, Spain, Sweden, Switzerland, the United Kingdom, and the United States. This index is unmanaged and investors cannot invest directly in this index.
16. The Lipper Global Fund Index is an unmanaged index of the 30 largest funds, based on total year-end net asset value, in the Global fund category, which consists of funds that invest at least 25% in securities traded outside of the United States. It assumes the reinvestment of dividends and capital gains and does not include any management fees or expenses. This index is unmanaged and investors cannot actually make investments in this index.
17. The MSCI EAFE Index (Europe, Australasia, Far East) is a free float-adjusted market capitalization index that is designed to measure developed market equity performance, excluding the US & Canada. As of June 2006 the MSCI EAFE Index consisted of the following 21 developed market country indices: Australia, Austria, Belgium, Denmark, Finland, France, Germany, Greece, Hong Kong, Ireland, Italy, Japan, the Netherlands, New Zealand, Norway, Portugal, Singapore, Spain, Sweden, Switzerland and the United Kingdom. This index is unmanaged and investors cannot invest directly in this index.
18. The MSCI World Index ex U.S. is a free float-adjusted market capitalization weighted index that is designed to measure the equity market performance of developed markets. The MSCI World Index currently consists of the following 22 developed market country indices: Australia, Austria, Belgium, Canada, Denmark, Finland, France, Germany, Greece, Hong Kong, Ireland, Italy, Japan, Netherlands, New Zealand, Norway, Portugal, Singapore, Spain, Sweden, Switzerland, and the United Kingdom. This index is unmanaged and investors cannot invest directly in this index.
19. The Lipper International Fund Index reflects the net asset value weighted total return of the 30 largest international equity funds. This index is unmanaged and investors cannot invest directly in this index.
20. The MSCI World ex U.S. Small Cap Index is a free float-adjusted market capitalization index that is designed to measure global developed market equity performance, excluding the U.S. The MSCI World ex U.S. Small Cap Index currently consists of 22 developed market country indices. The MSCI Small Cap Indices target 40% of the eligible Small Cap universe within each industry group, within each country. MSCI defines the Small Cap universe as all listed securities that have a market capitalization in the range of USD200-1,500 million. This index is unmanaged and investors cannot actually make investments in this index.
21. The Lipper International Small Cap Funds Index measures the performance of the 10 largest international small-cap funds tracked by Lipper. This index is unmanaged and investors cannot invest directly in this index.
OAKMARK, OAKMARK FUNDS, OAKMARK INTERNATIONAL, and OAKMARK and tree design are trademarks owned or registered by Harris Associates L.P. in the U.S. and/or other countries.
THE OAKMARK FUNDS
86
THE OAKMARK FUNDS
Investment Philosophy
All Oakmark managers follow a consistent investment philosophy—to invest in companies they believe are trading at a substantial discount to underlying business value. Critical to this philosophy is to invest with management teams who are committed to maximizing the company's business value.
Three key tenets of our
investment philosophy:
1 Buy businesses trading at a significant discount
to our estimate of true business value.
2 Invest in companies expected to grow shareholder value over time.
3 Invest with management teams who think
and act as owners.
Investment Process
We seek to identify undervalued companies through an intensive, in-house research process. This process is not based on macro-economic factors, such as the performance of the economy or the direction of interest rates. Nor is it based on technical factors, such as the performance of the stock market itself. And, while some value managers might use only one summary statistic—such as price-earnings ratio—our investment professionals take a more in-depth approach using a range of valuation measures appropriate for a specific company or industry.
From the universe of thousands of equity securities, our team generates investment ideas through a variety of methods. If a security appears attractive, detailed quantitative and qualitative research follows. This careful process of identifying undervalued stocks results in an "approved list."
The Result: a unified effort aimed at identifying the best values in the marketplace. From the list of
approved stocks, each fund manager constructs a relatively focused portfolio, built on a stock-by-stock basis from the bottom up.
Who Should Invest
Any investor who is seeking a disciplined value manager for the purposes of growing and diversifying a portfolio should consider one of The Oakmark Funds, keeping in mind that all equity investments should be considered long-term investments. As value investors, we recognize that patience is a virtue and believe that, over the long term, investors are rewarded for their patience. We generally hold the companies in which we invest for three to five years, a time horizon that we encourage our shareholders to consider as well.
How to Use Value Funds
in an Overall Portfolio
Investment styles tend to move in cycles. One style may be in favor for a few years while the other is out of favor, and vice versa. Diversifying the stock portion of your portfolio may help reduce overall volatility—and potentially provide more consistent returns over time.

THE OAKMARK FUNDS
87
The Oakmark Glossary
Book value – A company's common stock equity as it appears on a balance sheet, equal to total assets minus liabilities, preferred stock, and intangible assets such as goodwill. A company's book value often differs substantially from economic value, especially in industries such as media.
Business value/Intrinsic value – The perceived or estimated actual value of a security, as opposed to its current market price or book value. Business value can be evaluated based on what a knowledgeable buyer would pay for a business if the company were sold in its entirety.
Growth investing – Investors who look for companies based on whether the stock of a company is growing earnings and/or revenue faster than the industry as a whole or the overall market. Growth investors generally expect high rates of growth to persist, and the stock, in turn, to deliver returns exceeding the market's. A growth mutual fund is generally one that emphasizes stocks believed to offer above-average growth prospects, with little to no emphasis on the stock's current price.
M & A (Mergers & Acquisitions) – Merger: the combining of two or more entities into one, through a purchase acquisition or a pooling of interests. Acquisition: can also be called a takeover, and is defined as acquiring control of a corporation, called a target, by stock purchase or exchange, either hostile or friendly.
Market capitalization (market cap or cap) – The market price of an entire company on any given day, calculated by multiplying the number of shares outstanding by the price per share.
Momentum investing – Approach to investing based on the belief that stock price trends are likely to continue. Momentum investors tend to buy stocks that have been outperforming the market and to sell those stocks when their relative performance deteriorates. Momentum investors do not consider a company's underlying value or fundamentals in their investment decisions.
Multiple – A ratio used to measure a stock's valuation, usually greater than 1. Sometimes used to mean price/earnings ratio.
P/B or Price-to-Book Ratio – A stock's capitalization divided by its book value. The value is the same whether the calculation is done for the whole company or on a per-share basis.
P/E or Price-to-Earnings Ratio – The most common measure of a stock's valuation. It is equal to a stock's capitalization divided by its after-tax earnings over a 12-month period. The value is the same whether the calculation is done for the whole company or on a per-share basis. Equivalently, the cost an investor in a given stock must pay per dollar of current annual earnings. Also called earnings multiple.
Share repurchase – Program through which a corporation buys back its own shares in the open market, typically an indication that the corporation's management believes the stock price is undervalued.
Value investing – Investors who utilize valuation measures such as business value (including growth rate), price/earnings ratio, price/book ratio, and yield to gauge the attractiveness of a company. Managers who employ a value investment style believe that the true, underlying value of a company is not reflected in its current share price, and, over time, the price has potential to increase as the market recognizes the overall value of the business. Value stocks sell at relatively low prices in relation to their underlying business value, earnings, or book value.
Stocks become undervalued for a variety of reasons, including an overall market decline, or when a specific industry falls into disfavor and investors view all companies in that industry in the same light. Consequently, an individual company's stock price may fall, even though it may be only temporarily affected by the industry's problems and its underlying value has remained unchanged.
"x times earnings" ("12 times earnings") – Another way to express a stock's price-to-earnings (P/E) ratio. A stock with a P/E ratio of 12 sells at 12 times earnings.
THE OAKMARK FUNDS
88
THE OAKMARK FUNDS
Trustees and Officers
Trustees
Gary N. Wilner, M.D.—Chairman
Michael J. Friduss
Thomas H. Hayden
Christine M. Maki
John R. Raitt
Allan J. Reich
Steven S. Rogers
Burton W. Ruder
Peter S. Voss
Officers
John R. Raitt—President and Chief Executive Officer
Robert M. Levy—Executive Vice President
Henry R. Berghoef—Vice President
Chad M. Clark—Vice President
Richard J. Gorman—Vice President, Chief Compliance
Offic er and Assistant Secretary
Kevin G. Grant—Vice President
David G. Herro—Vice President
John J. Kane—Treasurer
Clyde S. McGregor—Vice President
William C. Nygren—Vice President
Vineeta D. Raketich—Vice President
Janet L. Reali—Vice President and Secretary
Kristi L. Rowsell—Vice President and Principal Financial
Officer
Edward A. Studzinski—Vice President
Robert A. Taylor—Vice President
Andrew J. Tedeschi—Assistant Treasurer
Christopher P. Wright—Vice President
Other Information
Investment Adviser
Harris Associates L.P.
Two North LaSalle Street
Chicago, Illinois 60602-3790
Transfer Agent
Boston Financial Data Services, Inc.
Quincy, Massachusetts
Legal Counsel
Bell, Boyd & Lloyd LLP
Chicago, Illinois
Independent Registered Public
Accounting Firm
Deloitte & Touche LLP
Chicago, Illinois
For More Information
Please call 1-800-OAKMARK
(1-800-625-6275)
or 617-483-3250
Website
oakmark.com
To obtain a prospectus, an application or periodic reports, access our web
site at oakmark.com, or call 1-800-OAKMARK (1-800-625-6275) or
(617) 483-3250.
The Funds will file its complete schedule of portfolio holdings with the Securities and Exchange Commission (the "SEC") for the first and third quarters of each fiscal year on Form N-Q. The Funds' Forms N-Q are available on the SEC's website at www.sec.gov. The Funds' Forms N-Q may be reviewed and copied at the SEC's Public Reference Room in Washington, DC, and information on the operation of the Public Reference Room may be obtained by calling 1-800-SEC-0330.
A description of the policies and procedures the Funds use to determine how to vote proxies relating to portfolio securities is available without charge, upon request, by calling toll-free 1-800-625-6275; on the Funds' website at oakmark.com; and on the SEC's website at www.sec.gov.
No later than August 31 of each year, information regarding how the Adviser, on behalf of the Funds, voted proxies relating to the Funds' portfolio securities for the twelve months ended the preceding June 30 will be available through a link on the Funds' website at oakmark.com and on the SEC's website at www.sec.gov.
This report is submitted for the general information of the Funds' shareholders. The report is not authorized for distribution to prospective investors in the Funds unless it is accompanied or preceded by the Funds' currently effective prospectus.
No sales charge to the shareholder or to the new investor is made in offering the shares of the Funds, however, a shareholder may incur a 2% redemption fee on an exchange or redemption of Class I shares held for 90 days or less from any Fund other than The Oakmark Equity & Income Fund.

1-800-OAKMARK
oakmark.com
The Oakmark Funds are distributed by Harris Associates Securities L.P., member FINRA. Date of first use: May 2008.
THE OAKMARK FUND CLASS II
THE VALUE OF A $10,000 INVESTMENT IN THE OAKMARK FUND FROM ITS
INCEPTION (4/5/01) TO PRESENT (3/31/08) AS COMPARED TO THE
STANDARD & POOR'S 500 INDEX (UNAUDITED)
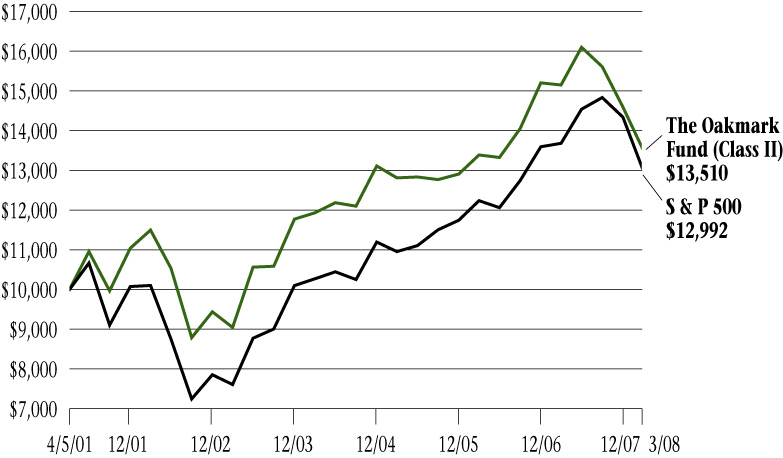
Average Annual Total Returns
(as of 3/31/08)
| (Unaudited) | | 1-year | | 5-year | | Since
Inception
(4/5/01) | |
| Oakmark Fund (Class II) | | | -10.87 | % | | | 8.36 | % | | | 4.40 | % | |
| S&P 500 | | | -5.08 | % | | | 11.32 | % | | | 3.82 | % | |
The graph and table do not reflect the deduction of taxes that a shareholder would pay on fund distributions or the redemption of fund shares.
Expense Ratio as of 9/30/07 was 1.36%.
The performance data quoted represents past performance. The above performance information does not reflect the imposition of a 2% redemption fee on shares held for 90 days or less to deter market timers. If reflected, the fee would reduce the performance quoted. Past performance does not guarantee future results. The investment return and principal value will fluctuate so that an investor's shares, when redeemed, may be worth more or less than their original cost. Current performance may be lower or higher than the performance data quoted. Average annual total return measures annualized change, while total return measures aggregate change. To obtain most recent month-end performance data, visit oakmark.com.
Harris Associates Securities L.P., member FINRA, May 2008
THE OAKMARK SELECT FUND CLASS II
THE VALUE OF A $10,000 INVESTMENT IN THE OAKMARK SELECT FUND FROM ITS
INCEPTION (12/31/99) TO PRESENT (3/31/08) AS COMPARED TO THE
STANDARD & POOR'S 500 INDEX (UNAUDITED)
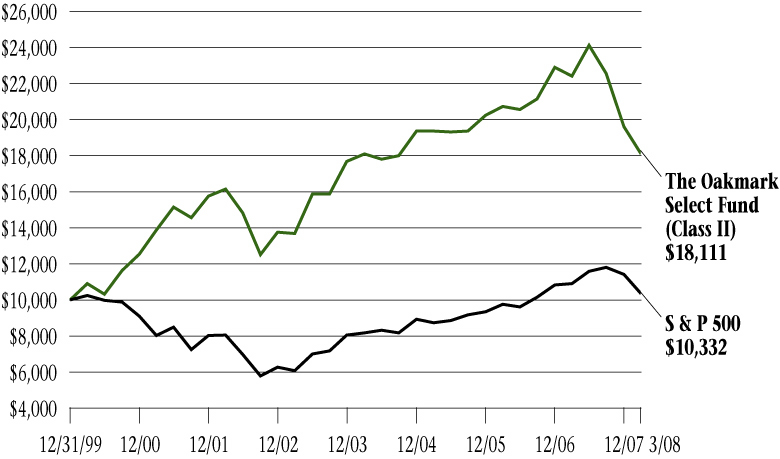
Average Annual Total Returns
(as of 3/31/08)
| (Unaudited) | | 1-year | | 5-year | | Since
Inception
(12/31/99) | �� |
| Oakmark Select Fund (Class II) | | | -19.22 | % | | | 5.78 | % | | | 7.47 | % | |
| S&P 500 | | | -5.08 | % | | | 11.32 | % | | | 0.40 | % | |
The graph and table do not reflect the deduction of taxes that a shareholder would pay on fund distributions or the redemption of fund shares.
Expense Ratio as of 9/30/07 was 1.35%.
The performance data quoted represents past performance. The above performance information does not reflect the imposition of a 2% redemption fee on shares held for 90 days or less to deter market timers. If reflected, the fee would reduce the performance quoted. Past performance does not guarantee future results. The investment return and principal value will fluctuate so that an investor's shares, when redeemed, may be worth more or less than their original cost. Current performance may be lower or higher than the performance data quoted. Average annual total return measures annualized change, while total return measures aggregate change. To obtain most recent month-end performance data, visit oakmark.com.
Harris Associates Securities L.P., member FINRA, May 2008
THE OAKMARK EQUITY AND INCOME FUND CLASS II
THE VALUE OF A $10,000 INVESTMENT IN THE OAKMARK EQUITY AND INCOME
FUND FROM ITS INCEPTION (7/12/00) TO PRESENT (3/31/08) AS COMPARED TO
THE LIPPER BALANCED FUND INDEX (UNAUDITED)
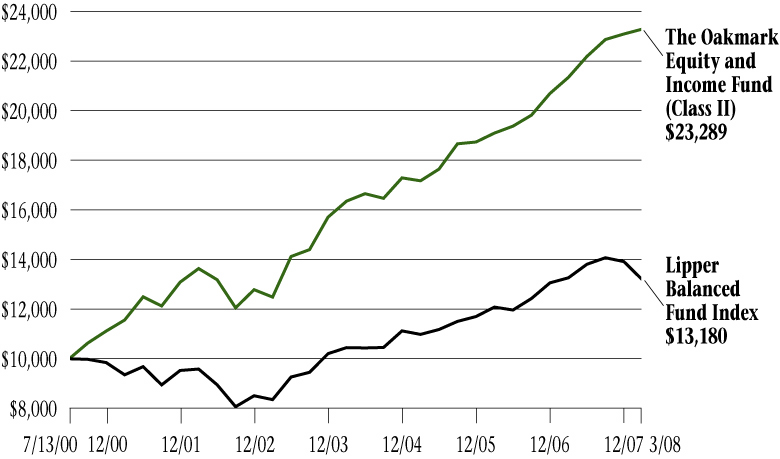
Average Annual Total Returns
(as of 3/31/08)
| (Unaudited) | | 1-year | | 5-year | | Since
Inception
(7/12/00) | |
| Oakmark Equity & Income Fund (Class II) | | | 9.12 | % | | | 13.28 | % | | | 11.58 | % | |
| Lipper Balanced Fund Index | | | -0.64 | % | | | 9.55 | % | | | 3.64 | % | |
The graph and table do not reflect the deduction of taxes that a shareholder would pay on fund distributions or the redemption of fund shares.
Expense Ratio as of 9/30/07 was 1.17%.
The performance data quoted represents past performance. Past performance does not guarantee future results. The investment return and principal value will fluctuate so that an investor's shares, when redeemed, may be worth more or less than their original cost. Current performance may be lower or higher than the performance data quoted. Average annual total return measures annualized change, while total return measures aggregate change. To obtain most recent month-end performance data, visit oakmark.com.
Harris Associates Securities L.P., member FINRA, May 2008
THE OAKMARK GLOBAL FUND CLASS II
THE VALUE OF A $10,000 INVESTMENT IN THE OAKMARK GLOBAL FUND
FROM ITS INCEPTION (10/10/01) TO PRESENT (3/31/08) AS COMPARED TO THE
MSCI WORLD INDEX (UNAUDITED)
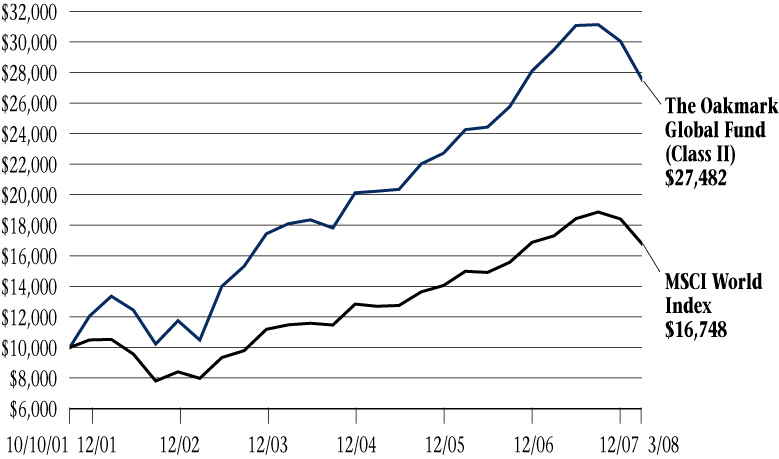
Average Annual Total Returns
(as of 3/31/08)
| (Unaudited) | | 1-year | | 5-year | | Since
Inception
(10/10/01) | |
| Oakmark Global Fund (Class II) | | | -6.81 | % | | | 21.23 | % | | | 16.91 | % | |
| MSCI World | | | -3.25 | % | | | 15.96 | % | | | 8.29 | % | |
The graph and table do not reflect the deduction of taxes that a shareholder would pay on fund distributions or the redemption of fund shares.
Expense Ratio as of 9/30/07 was 1.53%.
The performance data quoted represents past performance. The above performance information does not reflect the imposition of a 2% redemption fee on shares held for 90 days or less to deter market timers. If reflected, the fee would reduce the performance quoted. Past performance does not guarantee future results. The investment return and principal value will fluctuate so that an investor's shares, when redeemed, may be worth more or less than their original cost. Current performance may be lower or higher than the performance data quoted. Average annual total return measures annualized change, while total return measures aggregate change. To obtain most recent month-end performance data, visit oakmark.com.
Harris Associates Securities L.P., member FINRA, May 2008
THE OAKMARK INTERNATIONAL FUND CLASS II
THE VALUE OF A $10,000 INVESTMENT IN THE OAKMARK INTERNATIONAL FUND
FROM ITS INCEPTION (11/4/99) TO PRESENT (3/31/08) AS COMPARED TO THE
MSCI WORLD EX U.S. INDEX (UNAUDITED)

Average Annual Total Returns
(as of 3/31/08)
| (Unaudited) | | 1-year | | 5-year | | Since
Inception
(11/4/99) | |
| Oakmark International Fund (Class II) | | | -15.97 | % | | | 19.25 | % | | | 9.73 | % | |
| MSCI World ex U.S. | | | -1.30 | % | | | 21.81 | % | | | 5.66 | % | |
The graph and table do not reflect the deduction of taxes that a shareholder would pay on fund distributions or the redemption of fund shares.
Expense Ratio as of 9/30/07 was 1.44%.
The performance data quoted represents past performance. The above performance information does not reflect the imposition of a 2% redemption fee on shares held for 90 days or less to deter market timers. If reflected, the fee would reduce the performance quoted. Past performance does not guarantee future results. The investment return and principal value will fluctuate so that an investor's shares, when redeemed, may be worth more or less than their original cost. Current performance may be lower or higher than the performance data quoted. Average annual total return measures annualized change, while total return measures aggregate change. To obtain most recent month-end performance data, visit oakmark.com.
Harris Associates Securities L.P., member FINRA, May 2008
THE OAKMARK INTERNATIONAL
SMALL CAP FUND CLASS II
THE VALUE OF A $10,000 INVESTMENT IN THE OAKMARK INTERNATIONAL SMALL
CAP FUND FROM ITS INCEPTION (1/8/01) TO PRESENT (3/31/08) AS COMPARED
TO THE MSCI WORLD EX U.S. INDEX (UNAUDITED)
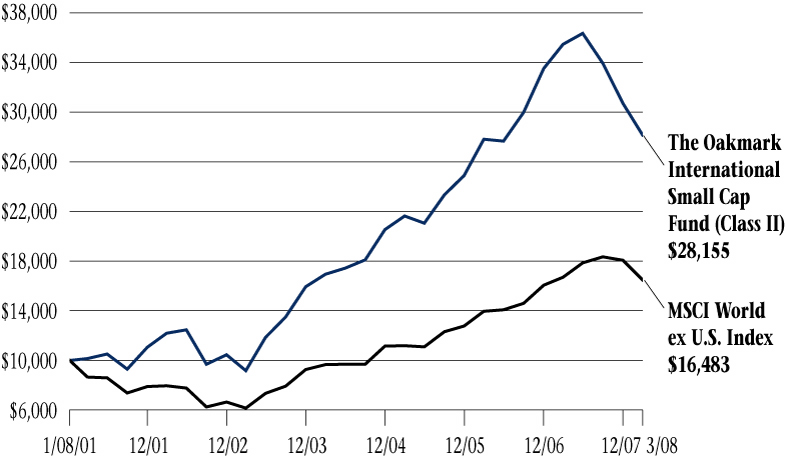
Average Annual Total Returns
(as of 3/31/08)
| (Unaudited) | | 1-year | | 5-year | | Since
Inception
(1/8/01) | |
| Oakmark International Small Cap Fund (Class II) | | | -20.59 | % | | | 25.15 | % | | | 15.41 | % | |
| MSCI World ex U.S. | | | -1.30 | % | | | 21.81 | % | | | 7.16 | % | |
The graph and table do not reflect the deduction of taxes that a shareholder would pay on fund distributions or the redemption of fund shares.
Expense Ratio as of 9/30/07 was 1.43%.
The performance data quoted represents past performance. The above performance information does not reflect the imposition of a 2% redemption fee on shares held for 90 days or less to deter market timers. If reflected, the fee would reduce the performance quoted. Past performance does not guarantee future results. The investment return and principal value will fluctuate so that an investor's shares, when redeemed, may be worth more or less than their original cost. Current performance may be lower or higher than the performance data quoted. Average annual total return measures annualized change, while total return measures aggregate change. To obtain most recent month-end performance data, visit oakmark.com.
Harris Associates Securities L.P., member FINRA, May 2008
FUND EXPENSES
A shareholder of each Fund incurs two types of costs: (1) transaction costs, such as redemption fees, and (2) ongoing costs, including investment advisory fees, transfer agent fees, and other fund expenses. The examples below are intended to help shareholders understand the ongoing cost (in dollars) of investing in each Fund and to compare these costs with the ongoing costs of investing in other funds.
Actual Expenses
The following table provides information about actual account values and actual fund expenses for Class II of each Fund. The table shows the expenses a Class II shareholder would have paid on a $1,000 investment in each Fund from October 1, 2007, to March 31, 2008, as well as how much a $1,000 investment would be worth at the close of the period, assuming actual fund returns and expenses. Class II shareholders can estimate expenses incurred for the period by dividing their account value at March 31, 2008, by $1,000 and multiplying the result by the number in the Expenses Paid During Period row as shown below.
Certain accounts invested for 90 days or less may be charged a 2% redemption fee. Please consult the Funds' prospectus at oakmark.com for more information.
| | | The Oakmark
Fund | | The Oakmark
Select Fund | | The Oakmark
Equity and
Income Fund | | The Oakmark
Global Fund | | The Oakmark
International
Fund | | The Oakmark
International
Small Cap
Fund | |
| Beginning Account Value | | $ | 1,000.00 | | | $ | 1,000.00 | | | $ | 1,000.00 | | | $ | 1,000.00 | | | $ | 1,000.00 | | | $ | 1,000.00 | | |
| Ending Account Value | | $ | 864.90 | | | $ | 802.40 | | | $ | 1,018.40 | | | $ | 882.70 | | | $ | 845.40 | | | $ | 829.50 | | |
| Expenses Paid During Period* | | $ | 7.23 | | | $ | 7.34 | | | $ | 5.85 | | | $ | 7.62 | | | $ | 7.34 | | | $ | 8.00 | | |
| Annualized Expense Ratio | | | 1.55 | % | | | 1.63 | % | | | 1.16 | % | | | 1.62 | % | | | 1.59 | % | | | 1.75 | % | |
* Expenses are equal to each Fund's annualized expense ratio for Class II, multiplied by the average account value over the period, multiplied by the number of days in the most recent fiscal half-year divided by 366 (to reflect the one-half year period).
Hypothetical Example for Comparison Purposes
The following table provides information about hypothetical account values and hypothetical expenses for Class II of each Fund based on actual expense ratios and an assumed rate of return of 5% per year before expenses, which are not the Funds' actual returns. The hypothetical account values and expenses may not be used to estimate the actual ending account balances or expenses shareholders paid for the period. Shareholders may use this information to compare the ongoing costs of investing in a Fund and other funds. To do so, compare this 5% hypothetical example with the 5% hypothetical examples that appear in the shareholder reports of the other funds.
Please note that the expenses shown in the table are meant to highlight your ongoing costs only and do not reflect any transaction costs, such as redemption fees. Therefore, the third line of the table is useful in comparing ongoing costs only, and will not help you determine the relative total costs of owning different funds. In addition, if these transaction costs were included, the total costs would have been higher.
| | | The Oakmark
Fund | | The Oakmark
Select Fund | | The Oakmark
Equity and
Income Fund | | The Oakmark
Global Fund | | The Oakmark
International
Fund | | The Oakmark
International
Small Cap
Fund | |
| Beginning Account Value | | $ | 1,000.00 | | | $ | 1,000.00 | | | $ | 1,000.00 | | | $ | 1,000.00 | | | $ | 1,000.00 | | | $ | 1,000.00 | | |
| Ending Account Value | | $ | 1,017.25 | | | $ | 1,016.85 | | | $ | 1,019.20 | | | $ | 1,016.90 | | | $ | 1,017.05 | | | $ | 1,016.25 | | |
| Expenses Paid During Period* | | $ | 7.82 | | | $ | 8.22 | | | $ | 5.86 | | | $ | 8.17 | | | $ | 8.02 | | | $ | 8.82 | | |
| Annualized Expense Ratio | | | 1.55 | % | | | 1.63 | % | | | 1.16 | % | | | 1.62 | % | | | 1.59 | % | | | 1.75 | % | |
* Expenses are equal to each Fund's annualized expense ratio for Class II, multiplied by the average account value over the period, multiplied by the number of days in the most recent fiscal half-year divided by 366 (to reflect the one-half year period).
Item 2. Code of Ethics.
Not required in this filing.
Item 3. Audit Committee Financial Expert.
Not required in this filing.
Item 4. Principal Accountant Fees and Services.
Not required in this filing.
Item 5. Audit Committee of Listed Registrants.
Not required in this filing.
Item 6. Investments.
(a) The Schedule of Investments in securities of unaffiliated issuers is included as part of the semi-annual report to shareholders filed under Item 1 of this Form.
(b) No disclosures are required by this Item 6(b).
Item 7. Disclosure of Proxy Voting Policies and Procedures for Closed-End Management Investment Companies.
Not applicable.
Item 8. Portfolio Managers of Closed-End Management Investment Companies.
Not applicable.
Item 9. Purchases of Equity Securities by Closed-End Management Investment Company and Affiliated Purchasers.
Not applicable.
Item 10. Submission of Matters to a Vote of Security Holders.
During the period covered by this report, no amendments were made to the procedures adopted in fiscal year 2007.
Item 11. Controls and Procedures.
(a) Based on an evaluation of the disclosure controls and procedures (as defined in
Rule 30a-3(c) under the Investment Company Act of 1940, the “Disclosure Controls”), the Disclosure Controls are effectively designed to ensure that information required to be disclosed by the Registrant in this report is recorded, processed, summarized and reported within 90 days prior to the filing of this report, including ensuring that information required to be disclosed in this report is accumulated and communicated to the Registrant’s management, including the Registrant’s principal executive officer and principal financial officer, as appropriate to allow timely decisions regarding required disclosure.
(b) There were no changes in the Registrant’s internal controls over financial reporting (as defined in Rule 30a-3(d) under the Investment Company Act of 1940) that occurred during the Registrant’s second fiscal quarter of the time period covered by this report that has materially affected, or is reasonably likely to materially affect, the Registrant’s internal control over financial reporting.
Item 12. Exhibits.
(a) | (1) | Not required in this filing. |
| | |
| (2) | Certifications of John R. Raitt, Principal Executive Officer, and Kristi L. Rowsell, Principal Financial Officer, pursuant to Rule 30a-2(a) under the Investment Company Act of 1940 (17 CFR 270.30a-2(a)), attached hereto as Exhibits (a)(2)(i) and (a)(2)(ii). |
| | |
| (3) | Not applicable. |
| | |
(b) | | Certification of John R. Raitt, Principal Executive Officer and Kristi L. Rowsell, Principal Financial Officer, pursuant to Section 906 of the Sarbanes-Oxley Act of 2002, attached hereto as Exhibit (b). |
SIGNATURES
Pursuant to the requirements of the Securities Exchange Act of 1934 and the Investment Company Act of 1940, the Registrant has duly caused this report to be signed on its behalf by the undersigned, thereunto duly authorized.
Harris Associates Investment Trust
By: | /s/ John R. Raitt | |
| John R. Raitt | |
| Principal Executive Officer | |
Date: | May 19, 2008 | |
Pursuant to the requirements of the Securities Exchange Act of 1934 and the Investment Company Act of 1940, this report has been signed below by the following persons on behalf of the Registrant and in the capacities and on the dates indicated.
By: | /s/ John R. Raitt | |
| John R. Raitt | |
| Principal Executive Officer | |
Date: | May 19, 2008 | |
| | |
| | |
By: | /s/ Kristi L. Rowsell | |
| Kristi L. Rowsell | |
| Principal Financial Officer | |
Date: | May 19, 2008 | |