UNITED STATES
SECURITIES AND EXCHANGE COMMISSION
Washington, D.C. 20549
FORM N-CSR
CERTIFIED SHAREHOLDER REPORT OF REGISTERED
MANAGEMENT INVESTMENT COMPANIES
Investment Company Act file number | 811-06279 |
|
Harris Associates Investment Trust |
(Exact name of registrant as specified in charter) |
|
Two North La Salle Street, Suite 500 | | |
Chicago, Illinois | | 60602-3790 |
(Address of principal executive offices) | | (Zip code) |
|
John R. Raitt | Cameron S. Avery |
Harris Associates L.P. | Bell, Boyd & Lloyd LLP |
Two North La Salle Street, #500 | Three First National Plaza, #3100 |
Chicago, Illinois 60602 | Chicago, Illinois 60602 |
(Name and address of agent for service) |
|
Registrant’s telephone number, including area code: | (312) 621-0600 | |
|
Date of fiscal year end: | 9/30/07 | |
|
Date of reporting period: | 3/31/07 | |
| | | | | | | | | |
Item 1. Reports to Shareholders.
SEMI-ANNUAL REPORT
MARCH 31, 2007


Advised by Harris Associates L.P.
THE OAKMARK FUNDS
2007 Semi-Annual Report
| President's Letter | | | 1 | | |
|
| Summary Information | | | 2 | | |
|
| Fund Expenses | | | 4 | | |
|
| Commentary on The Oakmark and Oakmark Select Funds | | | 6 | | |
|
| The Oakmark Fund | |
|
| Letter from the Portfolio Managers | | | 8 | | |
|
| Schedule of Investments | | | 9 | | |
|
| The Oakmark Select Fund | |
|
| Letter from the Portfolio Managers | | | 13 | | |
|
| Schedule of Investments | | | 14 | | |
|
| The Oakmark Equity and Income Fund | |
|
| Letter from the Portfolio Managers | | | 16 | | |
|
| Schedule of Investments | | | 18 | | |
|
| The Oakmark Global Fund | |
|
| Letter from the Portfolio Managers | | | 22 | | |
|
| Global Diversification Chart | | | 24 | | |
|
| Schedule of Investments | | | 25 | | |
|
| The Oakmark Global Select Fund | |
|
| Letter from the Portfolio Managers | | | 30 | | |
|
| Global Diversification Chart | | | 31 | | |
|
| Schedule of Investments | | | 32 | | |
|
| Commentary on The International and International Small Cap Funds | | | 35 | | |
|
| The Oakmark International Fund | |
|
| Letter from the Portfolio Manager | | | 36 | | |
|
| International Diversification Chart | | | 37 | | |
|
| Schedule of Investments | | | 38 | | |
|
| The Oakmark International Small Cap Fund | |
|
| Letter from the Portfolio Managers | | | 43 | | |
|
| International Diversification Chart | | | 45 | | |
|
| Schedule of Investments | | | 46 | | |
|
| Financial Statements | |
|
| Statements of Assets and Liabilities | | | 52 | | |
|
| Statements of Operations | | | 54 | | |
|
| Statements of Changes in Net Assets | | | 56 | | |
|
| Notes to Financial Statements | | | 63 | | |
|
| Disclosure Regarding Investment Advisory Contract Approval | | | 81 | | |
|
| Oakmark Philosophy and Process | | | 86 | | |
|
| The Oakmark Glossary | | | 87 | | |
|
| Trustees and Officers | | | 89 | | |
|
FORWARD-LOOKING STATEMENT DISCLOSURE
One of our most important responsibilities as mutual fund managers is to communicate with shareholders in an open and direct manner. Some of our comments in our letters to shareholders are based on current management expectations and are considered "forward-looking statements". Actual future results, however, may prove to be different from our expectations. You can identify forward-looking statements by words such as "estimate", "may", "will", "expect", "believe", "plan" and other similar terms. We cannot promise future returns. Our opinions are a reflection of our best judgment at the time this report is compiled, and we disclaim any obligation to update or alter forward-looking statements as a result of new information, future events, or otherwise.
President's Letter
Dear Fellow Shareholders,
Domestic and international stock markets rose again in the first quarter. The broader U.S. indexes finished the quarter up slightly, while international indexes extended their strong recent performance with percentage advances in the mid-single-digits. These summary statistics mask a very volatile quarter for world markets, however. The year started with strong advances around the world, but abruptly turned negative in late February, when the Chinese market fell 9% in a single day and U.S. stocks fell 3.5% in reaction. While the markets' heightened volatility has persisted, markets recovered most of these losses by quarter end.
Market Volatility and Long-Term Investment Strategy
The volatility of world markets in the last quarter provides another lesson in investment risk and the importance of following a long-term investment strategy. We have to admit experiencing a little bit of "déjà vu" when looking back at this quarter. At the end of last year's second quarter, we described a very similar series of events: strong returns around the world—led by red-hot international markets, a sudden and sharp market correction—with the largest declines concentrated among the former market leaders, a rapid negative shift in investor sentiment, and financial reporters' newfound focus on investment risk (after the horses were out of the barn).
As we wrote last summer and as we saw reaffirmed this quarter, market declines like this are not unusual events. Investor emotion—greed in a strong market and fear during large declines—often magnifies small market events into larger price swings. It is in circumstances such as this that our value investing discipline becomes most valuable. This discipline removes emotion from the investment equation. It focuses our analysis, not on where a stock has been, but where it lies today relative to business value. In this light, we can dispassionately view a stock decline as an opportunity to buy a good stock at an even more attractive price. We actually welcome market volatility as a means to enhance returns and build more attractive portfolios for our shareholders. Both during this quarter and last year's second quarter, we used the market's weakness to add to positions or buy new stocks at attractive prices.
Once a stock is purchased, patience, realistic expectations for long-term business performance and a continued focus on valuation are required for success. Decisions to buy stocks on sharp price declines are rarely rewarded as quickly as they were this past quarter. Ultimately, the market has shown that a disciplined analytical process, such as Oakmark practices, minimizes emotional mistakes and proves rewarding over time.
Market Volatility and Mutual Fund Investing
We encourage mutual fund investors to take a similar approach when formulating their own investment strategy. First and foremost, fund investors should take emotion out of their investment decision-making process. The best way to do this is to develop and stick to a long-term investment and asset allocation plan, using reasonable long-term expectations for investment returns. Second, investors should limit portfolio turnover in order to minimize taxes and other costs, although it is appropriate to occasionally rebalance portfolios to match long-term allocation targets. Lastly, in picking funds and fund managers, investors should ignore short-term swings in performance and focus upon long-term investment track records. At Oakmark, we manage our portfolios to maximize wealth over the long run—with a seven-to-ten-year horizon. While this approach takes patience and discipline, we believe that this same horizon is most appropriate for fund investors to evaluate their own funds' performance.
Thank you for entrusting your long term assets to The Oakmark Funds. We welcome your comments and questions. You can reach us via e-mail at ContactOakmark@oakmark.com.
John R. Raitt
President of The Oakmark Funds
President and CEO of Harris Associates L.P.

1
THE OAKMARK FUNDS
Summary Information
Performance for Period
Ended March 31, 20071 | | The Oakmark
Fund—Class I
(OAKMX) | | The Oakmark
Select Fund—Class I
(OAKLX) | | The Oakmark
Equity and Income
Fund—Class I
(OAKBX) | | The Oakmark
Global Fund—Class I
(OAKGX) | |
| 3 Months* | | | -0.26 | % | | | -2.12 | % | | | 3.21 | % | | | 4.98 | % | |
| 1 Year | | | 13.62 | % | | | 8.45 | % | | | 12.13 | % | | | 22.00 | % | |
Average Annual Total
Return for: | |
| 3 Year | | | 8.64 | % | | | 7.68 | % | | | 9.58 | % | | | 18.00 | % | |
| 5 Year | | | 6.02 | % | | | 7.09 | % | | | 9.67 | % | | | 17.56 | % | |
| 10 Year | | | 8.13 | % | | | 16.09 | % | | | 13.30 | % | | | N/A | | |
| Since inception | | | 15.29%
(8/5/91) | | | | 17.58%
(11/1/96) | | | | 13.49%
(11/1/95) | | | | 17.58%
(8/4/99) | | |
Top Five Equity
Holdings as of
March 31, 20072
Company and % of Total
Net Assets | | | McDonald's
Corporation 3.1%
Washington
Mutual, Inc. 2.8%
Yum! Brands, Inc. 2.7%
Time Warner Inc. 2.5%
Baxter
International Inc. 2.4% | | | | Washington
Mutual, Inc. 13.9%
Yum! Brands, Inc. 8.4%
McDonald's
Corporation 6.3%
H&R Block, Inc. 5.7%
Time Warner Inc. 5.2% | | | | XTO Energy, Inc. 4.7%
Nestle SA 3.1%
General Dynamics
Corporation 2.9%
EchoStar
Communications
Corporation,
Class A 2.9%
Diageo plc 2.7% | | | | DaimlerChrysler AG 3.9%
Nikko Cordial
Corporation 3.7%
GlaxoSmithKline plc 3.4%
UBS AG 3.2%
XTO Energy, Inc. 3.1% | | |
Sector
Allocation as of
March 31, 2007
Sector and %
of Market Value | | | Consumer
Discretionary 37.7%
Information
Technology 13.6%
Consumer Staples 13.5%
Financials 13.4%
Health Care 11.3%
Industrials 7.1%
Telecommunication
Services 1.9%
Energy 1.5% | | | | Consumer
Discretionary 48.7%
Financials 19.3%
Information
Technology 15.6%
Health Care 8.6%
Industrials 4.4%
Telecommunication
Services 3.4% | | | | U.S. Government
Securities 35.9%
Consumer
Discretionary 14.2%
Consumer Staples 13.6%
Energy 10.9%
Industrials 8.6%
Health Care 6.0%
Financials 5.5%
Information
Technology 2.9%
Foreign Government
Securities 2.2%
Materials 0.2% | | | | Consumer
Discretionary 27.8%
Information
Technology 17.5%
Financials 15.5%
Health Care 13.7%
Consumer Staples 8.8%
Industrials 8.0%
Telecommunication
Services 4.7%
Energy 3.1%
Materials 0.9% | | |
The performance data quoted represents past performance. The above performance information for the Funds does not reflect the imposition of a 2% redemption fee on shares held for 90 days or less to deter market timers. If reflected, the fee would reduce the performance quoted. Past performance does not guarantee future results. The investment return and principal value will fluctuate so that an investor's shares, when redeemed, may be worth more or less than their original cost. Current performance may be lower or higher than the performance data quoted. Average annual total return measures annualized change, while total return measures aggregate change. To obtain current month end performance data, visit oakmark.com.
* Not annualized
THE OAKMARK FUNDS
2
Performance for Period
Ended March 31, 20071 | | The Oakmark
Global Select
Fund—Class I
(OAKWX) | | The Oakmark
International
Fund—Class I
(OAKIX) | | The Oakmark
International
Small Cap Fund—Class I
(OAKEX) | |
| 3 Months* | | | 3.71 | % | | | 4.91 | % | | | 5.81 | % | |
| 1 Year | | | N/A | | | | 24.37 | % | | | 27.60 | % | |
Average Annual Total
Return for: | |
| 3 Year | | | N/A | | | | 21.58 | % | | | 27.96 | % | |
| 5 Year | | | N/A | | | | 16.12 | % | | | 23.98 | % | |
| 10 Year | | | N/A | | | | 12.06 | % | | | 16.11 | % | |
| Since inception | | | N/A
(10/2/06) | | | | 13.84%
(9/30/92) | | | | 15.89%
(11/1/95) | | |
Top Five Equity
Holdings as of
March 31, 20072
Company and % of Total
Net Assets | | | Diageo plc 4.9%
GlaxoSmithKline plc 4.8%
Rohm Company
Limited 4.8%
UBS AG 4.8%
Schroders PLC 4.8% | | | | DaimlerChrysler AG 3.9%
UBS AG 3.8%
GlaxoSmithKline plc 3.8%
HSBC Holdings plc 3.3%
Bayerische
Motoren Werke
(BMW) AG 3.1% | | | | MLP AG 4.0%
Sogecable SA 3.7%
Benfield Group Plc 3.4%
Veda Advantage
Limited 3.0%
Julius Baer
Holding AG 2.8% | | |
Sector
Allocation as of
March 31, 2007
Sector and %
of Market Value | | | Consumer
Discretionary 29.5%
Financials 24.8%
Health Care 15.1%
Information
Technology 15.0%
Consumer Staples 5.4%
Industrials 5.2%
Telecommunication
Services 5.0% | | | | Consumer
Discretionary 32.0%
Financials 31.6%
Consumer Staples 10.2%
Health Care 9.1%
Information
Technology 5.6%
Telecommunication
Services 4.8%
Industrials 4.0%
Materials 2.4%
Energy 0.3% | | | | Consumer
Discretionary 32.5%
Information
Technology 19.3%
Industrials 18.4%
Financials 14.1%
Consumer Staples 6.8%
Materials 3.7%
Health Care 3.5%
Telecommunication
Services 1.7% | | |
As of 9/30/06, the expense ratio was 1.05% for The Oakmark Fund, 0.99% for The Oakmark Select Fund, 0.86% for The Oakmark Equity & Income Fund, 1.18% for The Oakmark Global Fund, 1.08% for The Oakmark International Fund and 1.37% for The Oakmark International Small Cap Fund. As of 10/2/06, the expense ratio was 1.75% for The Oakmark Global Select Fund.
THE OAKMARK FUNDS
3
FUND EXPENSES
A shareholder of each Fund incurs two types of costs: (1) transaction costs, such as redemption fees, and (2) ongoing costs, including investment advisory fees, transfer agent fees, and other fund expenses. The examples below are intended to help shareholders understand the ongoing cost (in dollars) of investing in each Fund and to compare these costs with the ongoing costs of investing in other funds.
Actual Expenses
The following table provides information about actual account values and actual fund expenses for Class I of each Fund. The table shows the expenses a Class I shareholder would have paid on a $1,000 investment in each Fund from October 1, 2006, to March 31, 2007, as well as how much a $1,000 investment would be worth at the close of the period, assuming actual fund returns and expenses. A Class I shareholder can estimate expenses incurred for the period by dividing the account value at March 31, 2007, by $1,000 and multiplying the result by the number in the Expenses Paid During Period row as shown below.
Certain accounts invested for 90 days or less may be charged a 2% redemption fee. Please consult the Funds' prospectus at oakmark.com for more information.
| | | The Oakmark Fund | | The Oakmark Select Fund | | The Oakmark Equity and Income Fund | | The Oakmark Global Fund | | The Oakmark Global Select Fund | | The Oakmark International Fund | | The Oakmark International Small Cap Fund | |
Beginning
Account
Value | | $ | 1,000.00 | | | $ | 1,000.00 | | | $ | 1,000.00 | | | $ | 1,000.00 | | | $ | 1,000.00 | | | $ | 1,000.00 | | | $ | 1,000.00 | | |
Ending
Account
Value | | $ | 1,080.20 | | | $ | 1,060.90 | | | $ | 1,078.50 | | | $ | 1,146.40 | | | $ | 1,119.20 | | | $ | 1,150.10 | | | $ | 1,183.90 | | |
Expenses
Paid
During
Period* | | $ | 5.29 | | | $ | 5.04 | | | $ | 4.35 | | | $ | 6.10 | | | $ | 7.51 | | | $ | 5.57 | | | $ | 7.30 | | |
Annualized
Expense
Ratio | | | 1.02 | % | | | 0.98 | % | | | 0.84 | % | | | 1.14 | % | | | 1.43 | % | | | 1.04 | % | | | 1.34 | % | |
* Except for the Oakmark Global Select Fund, expenses are equal to each Fund's annualized expense ratio for Class I, multiplied by the average account value over the period, multiplied by the number of days in the most recent fiscal half-year divided by 365 (to reflect the one-half year period). Expenses for the Global Select Fund, which commenced operations on October 2, 2006, are calculated using the Fund's annualized expense ratio for Class I, multiplied by the average account value for the period, multiplied by the number of days in the period (181 days), and divided by the number of days in the year (365 days).
THE OAKMARK FUNDS
4
Hypothetical Example for Comparison Purposes
The following table provides information about hypothetical account values and hypothetical expenses for Class I of each Fund based on actual expense ratios and an assumed rate of return of 5% per year before expenses, which are not the Funds' actual returns. The hypothetical account values and expenses may not be used to estimate the actual ending account balances or expenses shareholders paid for the period. Shareholders may use this information to compare the ongoing costs of investing in a Fund and other funds. To do so, compare this 5% hypothetical example with the 5% hypothetical examples that appear in the shareholder reports of the other funds.
Please note that the expenses shown in the table are meant to highlight your ongoing costs only and do not reflect any transaction costs, such as redemption fees. Therefore, the third line of the table is useful in comparing ongoing costs only, and will not help you determine the relative total costs of owning different funds. In addition, if these transaction costs were included, the total costs would have been higher.
| | | The Oakmark Fund | | The Oakmark Select Fund | | The Oakmark Equity and Income Fund | | The Oakmark Global Fund | | The Oakmark Global Select Fund | | The Oakmark International Fund | | The Oakmark International Small Cap Fund | |
Beginning
Account
Value | | $ | 1,000.00 | | | $ | 1,000.00 | | | $ | 1,000.00 | | | $ | 1,000.00 | | | $ | 1,000.00 | | | $ | 1,000.00 | | | $ | 1,000.00 | | |
Ending
Account
Value | | $ | 1,019.85 | | | $ | 1,020.04 | | | $ | 1,020.74 | | | $ | 1,019.25 | | | $ | 1,017.70 | | | $ | 1,019.75 | | | $ | 1,018.25 | | |
Expenses
Paid
During
Period* | | $ | 5.14 | | | $ | 4.94 | | | $ | 4.23 | | | $ | 5.74 | | | $ | 7.15 | | | $ | 5.24 | | | $ | 6.74 | | |
Annualized
Expense
Ratio | | | 1.02 | % | | | 0.98 | % | | | 0.84 | % | | | 1.14 | % | | | 1.43 | % | | | 1.04 | % | | | 1.34 | % | |
* Except for the Oakmark Global Select Fund, expenses are equal to each Fund's annualized expense ratio for Class I, multiplied by the average account value over the period, multiplied by the number of days in the most recent fiscal half-year divided by 365 (to reflect the one-half year period). Expenses for the Global Select Fund, which commenced operations on October 2, 2006, are calculated using the Fund's annualized expense ratio for Class I, multiplied by the average account value for the period, multiplied by the number of days in the period (181 days), and divided by the number of days in the year (365 days).
THE OAKMARK FUNDS
5
THE OAKMARK AND OAKMARK SELECT FUNDS
At Oakmark, we are long-term investors. We attempt to identify growing businesses that are managed to benefit their shareholders. We will purchase stock in those businesses only when priced substantially below our estimate of intrinsic value. After purchase, we patiently wait for the gap between stock price and intrinsic value to close.
 "Investors should remember that excitement and expenses are their enemies. And if they insist on trying to time their participation in equities, they should try to be fearful when others are greedy and greedy only when others are fearful."
Warren Buffett—Berkshire Hathaway 2004 Report to Shareholders
In reviewing 2007's first quarter, with the S&P 5003 increasing by less than 1%, one could reasonably assume that it was a relatively uneventful quarter. As long-term investors, we'd basically agree with that assessment. Contrast that point of view with what we see and hear in the financial media: "Mortgage Armageddon" or "Dow suffers worst single day decline in four years." One needs to remember that the goals of the media and the serious investor are not well-aligned. The media wants to create excitement. During the NCAA basketball tournament last month, one show hosted an investment tournament with bracket match-ups that mimicked the NCAA's. Another hosted a reality show investment competition where the best performers avoided getting "voted off the island." These contests can be ex citing and probably even help ratings. They shouldn't in any way, however, be confused with real investing. The timeframe is so short that stock movements aren't tied to business fundamentals, and rewarding the largest return without imposing any cost for losing money encourages the most risky behavior. Though it would no doubt make for dull television, successful long-term investing is much closer to "three yards and a cloud of dust" than it is to the West Coast offense!
On February 27th the stock market fell 4%. Perhaps we've all gotten spoiled with a market whose path has been nearly straight up for three years, but the reaction to that decline seemed intensely negative. Time Magazine headlined their March 12th issue with: "Is the Stock Market Getting Too Risky?" The Wall Street Journal told the story of an individual who bought some stock at $98 a share. The investor said "Before I could blink, the stock had sunk to $96, so I started selling at a loss."4 Many have become convinced that investing requires constant monitoring of news and price moves and believe that a serious investor needs to be a hyper-active trader. These reactions are exactly the opposite of our response at Oakmark. In the absence of negative fundamental news, if a stock falls from $9 8 to $96 it has become more attractive, not less. Likewise, the time to ask if the market is getting too risky is before, not after it declines. Following that drop, I had several calls from reporters, all asking the same question: "The market is down 5%, what does that mean?" My answer, which not surprisingly wasn't used by any of them, was that five-year compound annual returns were now going to be 1% higher than they were before the market fell. That answer didn't convey quite the level of fear they wanted.
The other question I was repeatedly asked by both reporters and shareholders was: "What are you buying?" First, that's a question we never answer. Our portfolio changes are only discussed on a quarterly basis. To communicate portfolio changes at other times would simply increase the risk of us getting front-run. But further, the question shows a lack of understanding of how we manage portfolios. The Oakmark Fund and The Oakmark Select Fund's portfolios are generally fully invested. That means that unless shareholders invest additional capital, we can't be net buyers. Whether the market has gone up, down, or sideways, we are always on the lookout for opportunities to sell fully valued stocks, and then use that money to buy undervalued stocks. Unfortunately, the first quarter decline was quite uniform. In fact, on the day of the big drop, only two of the S&P 500 stocks were up, and not one fell by over 10%. That's not the kind of volatilit y that produces great swap opportunities. Another thing to remember when analyzing changes in our positions is to look at whether shareholders have increased or decreased the capital they've invested in our Funds. In both Oakmark and Oakmark Select, we've had modest net redemptions. So if you want to see where we've increased positions, remember to include those stocks that we've opted not to trim.
The opportunity to take advantage of market corrections is in asset allocation – how much of your wealth is invested in stocks, in bonds, in cash and so on. Over long time periods, stocks have outearned other assets and have become the primary investment for most long-term investors. Despite that long-term performance, short-term results have been erratic. Depending on how you measure when one stock market decline stops and when a new one begins, the stock market has averaged a 10% drop once every year or two. Unfortunately, fearful investors pulled money out of stocks after those declines and re-invested after recoveries. Such mis-timing is one of the surest ways to earn less than the market return. It's been almost four years since we've had a 10% correction. When it happens again, and it most certainly will, we encourage you to
THE OAKMARK AND OAKMARK SELECT FUNDS
6
either realize it is normal and ignore it—or even better, use it as an opportunity to invest more at higher prospective returns.
One sector of the market that continued to decline in March as the rest of the market recovered was the consumer lending companies, especially those involved with subprime mortgages. A mortgage is generally termed subprime if the borrower does not have strong enough credit to qualify for a traditional "prime" mortgage. And just like in the corporate market, where junk bonds have higher yields than investment grade bonds, mortgage lenders charge a premium on their riskier subprime mortgages to compensate for higher default risk. But in the past few years, with defaults on most corporate and consumer debt at very low levels, those premiums collapsed as investors convinced themselves that cyclic-low default rates had become permanent. Subprime mortgages were being underwritten at such narrow premiums that if defaults returned to historic norms, they would no longer be worth the full amount of the mortgage. That's what happened last quarter. And with so many subprime lenders having very high leverage, even a small decline in mortgage values was enough to throw them into a tailspin. Many of the most aggressive subprime companies were forced out of business, and sale of their mortgage portfolios put further pressure on prices. Reporting on those sales has seemed pretty one-sided. When a TV reporter states that loans were sold for "pennies on the dollar," I don't think they are conveying reality when the number of pennies was actually in the nineties!
Although the decline in the subprime market negatively affected several of our holdings, shareholders focused on one of our largest: "How does this affect Washington Mutual (Wamu)?" We believe Wamu has built a very valuable retail bank. The stock appears inexpensive based on its low P/E5, high yield, and above-average growth in retail banking income. It is also priced very inexpensively relative to the deposit premiums that have been paid in recent banking acquisitions. Those plusses, however, fade to the background when investors worry about the mortgage market. Like all banks, Wamu has significant financial leverage, holding about $390 of assets per Wamu share. About 5% of those assets, $20 per share, are subprime mortgages. Let's assume a pretty negative case – 10% of those loans g et foreclosed, and proceeds from sales of those homes are 20% less than the mortgage amount. The after-tax loss in that case would be well under 10% of Wamu's earnings. Wamu has been warning for several years that premiums on many newly written mortgages were not large enough. We believe they've acted prudently by selling those mortgages and retaining mortgages backed both by stronger personal credit and more valuable collateral. Even if one assumes a worse outcome, where much higher defaults spread to prime mortgages, it is difficult to imagine an outcome much worse than Wamu's business value not growing this year. Wamu has been a positive contributor to our Funds over the years we've owned it. Despite that, there have been short time periods, including last quarter, when that was not the case. We believe that from its current price, Wamu has a very favorable risk-return profile, and that justifies it continuing to be one of our largest holdings.
William C. Nygren, CFA
Portfolio Manager
bnygren@oakmark.com
THE OAKMARK AND OAKMARK SELECT FUNDS
7
THE OAKMARK FUND
Report from Bill Nygren and Kevin Grant, Portfolio Managers


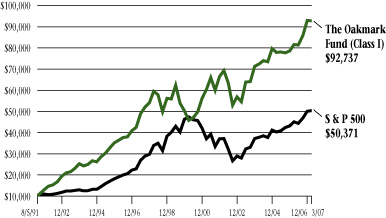
THE VALUE OF A $10,000 INVESTMENT IN THE OAKMARK FUND FROM ITS INCEPTION (8/5/91) TO PRESENT (3/31/07) AS COMPARED TO THE STANDARD & POOR'S 500 INDEX3
| | | | | Average Annual Total Returns
(as of 3/31/07) | |
| | | Total Return
Last 3 Months* | | 1-year | | 5-year | | 10-year | | Since
Inception
(8/5/91) | |
| Oakmark Fund (Class I) | | | -0.26 | % | | | 13.62 | % | | | 6.02 | % | | | 8.13 | % | | | 15.29 | % | |
| S&P 500 | | | 0.64 | % | | | 11.83 | % | | | 6.27 | % | | | 8.20 | % | | | 10.88 | % | |
| Dow Jones Average6 | | | -0.33 | % | | | 13.82 | % | | | 5.85 | % | | | 8.61 | % | | | 11.97 | % | |
Lipper Large Cap
Value Index7 | | | 0.76 | % | | | 14.17 | % | | | 7.43 | % | | | 8.43 | % | | | 10.83 | % | |
The graph and table do not reflect the deduction of taxes that a shareholder would pay on fund distributions or the redemption of fund shares.
Expense Ratio as of 9/30/06 was 1.05%.
The performance data quoted represents past performance. The above performance information for the Fund does not reflect the imposition of a 2% redemption fee on shares held for 90 days or less to deter market timers. If reflected, the fee would reduce the performance quoted. Past performance does not guarantee future results. The investment return and principal value will fluctuate so that an investor's shares, when redeemed, may be worth more or less than their original cost. Current performance may be lower or higher than the performance data quoted. Average annual total return measures annualized change, while total return measures aggregate change. To obtain most recent month-end performance data, visit oakmark.com.
* Not annualized
The Oakmark Fund was flat last quarter compared to a less than 1% gain in the S&P 500. The comparison looks better for the past year, up 14% compared to 12%. For the quarter, strong performance from our health care companies was offset by declines in Harley Davidson, Pulte Homes and Washington Mutual. The common link is the fear that flat housing prices will halt new home construction, will lead to higher mortgage defaults, and will lower purchases of durables. Though that may be correct short-term, we believe that demographics present a favorable long-term outlook for housing.
During the quarter we completed sales of both Comcast and Mattel. Both were sold because share prices appreciated to business value estimates. We also sold Gannett at a price just above what we paid for it in 2000 when newspapers were being acquired for about 13 times pretax cash flow. At that time, Gannett looked quite attractive to us, selling at only 8 times. Unfortunately, valuation spreads can close in two directions. We have recently seen substantial evidence that newspapers are not as valuable as they once were. Just last quarter the Minneapolis Tribune was sold for about half the price McClatchy paid for it in 1988, and the estimated value of the Boston Globe was written down to about half the price New York Times Company paid to acquire it in 1993. Finally, in our home market of Chicago, the Tribune Company's search for an acquirer barely produced a premium to the stock price. Though Gannett is definitely an example of a "mistake," it is also an example of how purchasing at a discount to private value can help protect us from loss.
Sprint-Nextel (S - $19)
We bought shares of Sprint-Nextel, the country's third largest wireless telephony provider. Delays in integrating Sprint's 2004 acquisition of Nextel have led to disappointing operating profits. Sprint's stock price reflected that, falling from the mid-$20s to a first quarter low of under $17. During that time, other telecommunication stocks increased, resulting in Sprint now being priced at a lower multiple of cash-flow than competitors who get most of their income from the declining wired telephony business. Further, if Sprint's subscribers were valued similarly to recent wireless acquisitions, Sprint stock would nearly double from its low. As with many of our holdings, we believe management will either improve operations or the company will be acquired.
William C. Nygren, CFA
Portfolio Manager
bnygren@oakmark.com | | Kevin G. Grant, CFA
Portfolio Manager
kgrant@oakmark.com | |
|
THE OAKMARK FUND
8
THE OAKMARK FUND
Schedule of Investments—March 31, 2007 (Unaudited)
Name | |
Shares Held | |
Market Value | |
| Common Stocks—93.9% | |
| Apparel Retail—3.6% | |
| Limited Brands | | | 4,628,047 | | | $ | 120,606,905 | | |
| The Gap, Inc. | | | 5,066,700 | | | | 87,197,907 | | |
| | | | 207,804,812 | | |
| Broadcasting & Cable TV—4.0% | |
| Liberty Media Holding Corporation - Capital, Class A (a) | | | 999,670 | | | $ | 110,553,505 | | |
| EchoStar Communications Corporation, Class A (a) | | | 1,025,000 | | | | 44,515,750 | | |
| The DIRECTV Group, Inc. (a) | | | 1,850,000 | | | | 42,679,500 | | |
| Discovery Holding Company, Class A (a) | | | 1,740,140 | | | | 33,288,878 | | |
| | | | 231,037,633 | | |
| Catalog Retail—1.5% | |
| Liberty Media Holding Corporation - Interactive, Class A (a) | | | 3,699,850 | | | $ | 88,130,427 | | |
| Department Stores—2.4% | |
| Kohl's Corporation (a) | | | 1,850,000 | | | $ | 141,728,500 | | |
| Home Improvement Retail—2.0% | |
| The Home Depot, Inc. | | | 3,181,500 | | | $ | 116,888,310 | | |
| Homebuilding—1.6% | |
| Pulte Homes, Inc. | | | 3,500,000 | | | $ | 92,610,000 | | |
| Household Appliances—2.0% | |
| The Black & Decker Corporation | | | 1,400,000 | | | $ | 114,268,000 | | |
| Housewares & Specialties—1.9% | |
| Fortune Brands, Inc. | | | 1,400,000 | | | $ | 110,348,000 | | |
| Motorcycle Manufacturers—2.0% | |
| Harley-Davidson, Inc. | | | 2,000,000 | | | $ | 117,500,000 | | |
| Movies & Entertainment—6.7% | |
| Time Warner, Inc. | | | 7,447,700 | | | $ | 146,868,644 | | |
| Viacom, Inc., Class B (a) | | | 3,239,745 | | | | 133,185,917 | | |
| The Walt Disney Company | | | 3,300,000 | | | | 113,619,000 | | |
| | | | 393,673,561 | | |
| Restaurants—5.8% | |
| McDonald's Corporation | | | 4,050,000 | | | $ | 182,452,500 | | |
| Yum! Brands, Inc. | | | 2,724,000 | | | | 157,338,240 | | |
| | | | 339,790,740 | | |
| Specialized Consumer Services—1.9% | |
| H&R Block, Inc. | | | 5,358,600 | | | $ | 112,744,944 | | |
THE OAKMARK FUND
9
THE OAKMARK FUND
Schedule of Investments—March 31, 2007 (Unaudited) cont.
Name | |
Shares Held | |
Market Value | |
| Common Stocks—93.9% (cont.) | |
| Brewers—4.2% | |
| InBev NV (b) | | | 1,850,000 | | | $ | 133,574,981 | | |
| Anheuser-Busch Companies, Inc. | | | 2,250,000 | | | | 113,535,000 | | |
| | | | 247,109,981 | | |
| Distillers & Vintners—1.8% | |
| Diageo plc (c) | | | 1,271,000 | | | $ | 102,887,450 | | |
| Hypermarkets & Super Centers—2.0% | |
| Wal-Mart Stores, Inc. | | | 2,500,000 | | | $ | 117,375,000 | | |
| Packaged Foods & Meats—3.6% | |
| H.J. Heinz Company | | | 2,250,000 | | | $ | 106,020,000 | | |
| General Mills, Inc. | | | 1,756,000 | | | | 102,234,320 | | |
| | | | 208,254,320 | | |
| Soft Drinks—1.1% | |
| The Coca-Cola Company | | | 1,398,700 | | | $ | 67,137,600 | | |
| Integrated Oil & Gas—1.4% | |
| ConocoPhillips | | | 1,200,373 | | | $ | 82,045,495 | | |
| Asset Management & Custody Banks—1.5% | |
| The Bank of New York Company, Inc. | | | 2,150,000 | | | $ | 87,182,500 | | |
| Diversified Banks—2.1% | |
| U.S. Bancorp | | | 3,450,000 | | | $ | 120,646,500 | | |
| Life & Health Insurance—1.4% | |
| AFLAC Incorporated | | | 1,767,000 | | | $ | 83,155,020 | | |
| Other Diversified Financial Services—4.3% | |
| JPMorgan Chase & Co. | | | 2,700,000 | | | $ | 130,626,000 | | |
| Citigroup, Inc. | | | 2,400,000 | | | | 123,216,000 | | |
| | | | 253,842,000 | | |
| Thrifts & Mortgage Finance—3.2% | |
| Washington Mutual, Inc. | | | 4,037,300 | | | $ | 163,026,174 | | |
| MGIC Investment Corporation | | | 455,600 | | | | 26,843,952 | | |
| | | | 189,870,126 | | |
| Health Care Equipment—4.0% | |
| Baxter International, Inc. | | | 2,700,000 | | | $ | 142,209,000 | | |
| Medtronic, Inc. | | | 1,850,000 | | | | 90,761,000 | | |
| | | | 232,970,000 | | |
THE OAKMARK FUND
10
THE OAKMARK FUND
Schedule of Investments—March 31, 2007 (Unaudited) cont.
Name | |
Shares Held | |
Market Value | |
| Common Stocks—93.9% (cont.) | |
| Pharmaceuticals—6.7% | |
| Abbott Laboratories | | | 2,487,300 | | | $ | 138,791,340 | | |
| Schering-Plough Corporation | | | 4,960,200 | | | | 126,534,702 | | |
| Bristol-Myers Squibb Company | | | 4,500,000 | | | | 124,920,000 | | |
| | | | 390,246,042 | | |
| Aerospace & Defense—3.7% | |
| Raytheon Company | | | 2,450,000 | | | $ | 128,527,000 | | |
| Honeywell International, Inc. | | | 1,900,000 | | | | 87,514,000 | | |
| | | | 216,041,000 | | |
| Building Products—1.6% | |
| Masco Corporation | | | 3,433,600 | | | $ | 94,080,640 | | |
| Industrial Conglomerates—1.4% | |
| Tyco International Ltd. | | | 2,558,000 | | | $ | 80,704,900 | | |
| Computer Hardware—4.9% | |
| Hewlett-Packard Company | | | 2,925,000 | | | $ | 117,409,500 | | |
| Dell Inc. (a) | | | 4,000,000 | | | | 92,840,000 | | |
| Sun Microsystems, Inc. (a) | | | 12,270,000 | | | | 73,742,700 | | |
| | | | 283,992,200 | | |
| Data Processing & Outsourced Services—2.1% | |
| First Data Corporation | | | 2,575,000 | | | $ | 69,267,500 | | |
| Western Union Company | | | 2,575,000 | | | | 56,521,250 | | |
| | | | 125,788,750 | | |
| Office Electronics—1.5% | |
| Xerox Corporation (a) | | | 5,272,400 | | | $ | 89,050,836 | | |
| Semiconductors—4.2% | |
| Texas Instruments Incorporated | | | 4,400,000 | | | $ | 132,440,000 | | |
| Intel Corporation | | | 5,900,000 | | | | 112,867,000 | | |
| | | | 245,307,000 | | |
| Wireless Telecommunication Services—1.8% | |
| Sprint Nextel Corporation | | | 5,403,000 | | | $ | 102,440,880 | | |
| Total Common Stocks (Cost: $3,739,564,186) | | | | | | | 5,486,653,167 | | |
THE OAKMARK FUND
11
THE OAKMARK FUND
Schedule of Investments—March 31, 2007 (Unaudited) cont.
Name | |
Par Value | |
Market Value | |
| Short Term Investments—6.0% | |
| U.S. Government Bills—3.4% | |
United States Treasury Bills, 5.07%-5.135%,
due 4/19/2007 - 4/26/2007 | | $ | 200,000,000 | | | $ | 199,391,166 | | |
| Total U.S. Government Bills (Cost: $199,391,166) | | | | | 199,391,166 | | |
| Repurchase Agreement—2.6% | |
IBT Repurchase Agreement, 5.20% dated 3/30/2007
due 4/2/2007, repurchase price $151,308,300,
collateralized by Federal National Mortgage Association
Bonds, with rates of 4.266% - 7.222%, with maturities
from 10/1/2029 - 5/25/2036, and with an aggregate
market value plus accrued interest of $158,804,900 | | $ | 151,242,762 | | | $ | 151,242,762 | | |
| Total Repurchase Agreement (Cost: $151,242,762) | | | | | 151,242,762 | | |
| Total Short Term Investments (Cost: $350,633,928) | | | | | 350,633,928 | | |
| Total Investments (Cost $4,090,198,114)—99.9% | | | | $ | 5,837,287,095 | | |
| Other Assets In Excess Of Other Liabilities—0.1% | | | | | 4,710,069 | | |
| Total Net Assets—100% | | | | $ | 5,841,997,164 | | |
(a) Non-income producing security.
(b) Represents a foreign domiciled corporation.
(c) Represents an American Depository Receipt.
See accompanying Notes to Financial Statements.
THE OAKMARK FUND
12
THE OAKMARK SELECT FUND
Report from Bill Nygren and Henry Berghoef, Portfolio Managers


THE VALUE OF A $10,000 INVESTMENT IN THE OAKMARK SELECT FUND FROM ITS INCEPTION (11/1/96) TO PRESENT (3/31/07) AS COMPARED TO THE STANDARD & POOR'S 500 INDEX3

| | | | | Average Annual Total Returns
(as of 3/31/07) | |
| | | Total Return
Last 3 Months* | | 1-year | | 5-year | | 10-year | | Since
Inception
(11/1/96) | |
Oakmark Select Fund
(Class I) | | | -2.12 | % | | | 8.45 | % | | | 7.09 | % | | | 16.09 | % | | | 17.58 | % | |
| S&P 500 | | | 0.64 | % | | | 11.83 | % | | | 6.27 | % | | | 8.20 | % | | | 8.71 | % | |
Lipper Multi-Cap
Value Index8 | | | 0.81 | % | | | 12.23 | % | | | 9.03 | % | | | 9.45 | % | | | 9.87 | % | |
The graph and table do not reflect the deduction of taxes that a shareholder would pay on fund distributions or the redemption of fund shares.
Expense Ratio as of 9/30/06 was 0.99%.
The performance data quoted represents past performance. The above performance information for the Fund does not reflect the imposition of a 2% redemption fee on shares held for 90 days or less to deter market timers. If reflected, the fee would reduce the performance quoted. Past performance does not guarantee future results. The investment return and principal value will fluctuate so that an investor's shares, when redeemed, may be worth more or less than their original cost. Current performance may be lower or higher than the performance data quoted. Average annual total return measures annualized change, while total return measures aggregate change. To obtain most recent month-end performance data, visit oakmark.com.
* Not annualized
The Oakmark Select Fund lost 2% last quarter. The S&P 500 eked out a gain of a fraction of a percent, so our small loss was also disappointing on a relative basis. With one large exception, our winners and losers largely cancelled out each other. Our top performer, up nearly 20%, was Discovery Holding. Discovery reported good financial results for 2006, driven by higher viewer ratings. Further, last month they announced a value added share repurchase transaction. (As an aside, to get the most from your HDTV, try watching Discovery's new "Planet Earth" series.) Two other strong performers, Liberty Interactive (owner of QVC) and Dun & Bradstreet, both posted double-digit price gains due to continued strong fundamental performance. Those positives were offset by losses in Pulte Homes, H&R Block and Gap Stores. We continue to like the long-term positioning of large homebuilders, such as Pulte, and we believe that H&R Block's tax preparation leadership is underappreciated. The turnaround at Gap has stagnated, but we believe the business will either be reignited by new management or will be sold. The loss that was not offset was Washington Mutual, down 10% in the quarter. We have regularly reported that Wamu had the greatest effect on quarterly portfolio performance—not because it was our most extreme performer, but because it was our largest position. As explained in the opening letter, we continue to believe Wamu stock is very attractive, and expect that in future reports we'll again be reporting on its positive portfolio impact.
During the quarter, we completed the sale of our Mattel shares, and we established a position in Sprint-Nextel. Mattel was a good holding for the Fund, purchased for just under $10 in 2000, when investors had lost interest in non-Internet consumer businesses. Through expense reduction and good capital allocation, business value grew, despite disappointing sales for their largest product, Barbie. No longer priced at a discount to most consumer product companies, we believed the valuation was no longer compelling. Observing the personal trading of Mattel's management, they don't seem to disagree. In the first two months of 2006 there was one transaction, a purchase at $17. This year, there were no purchases, and 10 individuals sold stock or options at prices averaging $26. Despite some contrary examples, we've found stocks tend to do better when management's economic alignment with shareholders is increasing rather than decreasing.
William C. Nygren, CFA
Portfolio Manager
bnygren@oakmark.com | | Henry R. Berghoef, CFA
Portfolio Manager
berghoef@oakmark.com | |
|
THE OAKMARK SELECT FUND
13
THE OAKMARK SELECT FUND
Schedule of Investments—March 31, 2007 (Unaudited)
Name | |
Shares Held | |
Market Value | |
| Common Stocks—95.6% | |
| Apparel Retail—5.5% | |
| Limited Brands | | | 9,280,981 | | | $ | 241,862,365 | | |
| The Gap, Inc. | | | 4,560,000 | | | | 78,477,600 | | |
| | | | 320,339,965 | | |
| Broadcasting & Cable TV—3.5% | |
| Discovery Holding Company, Class A (a) | | | 10,809,500 | | | $ | 206,785,735 | | |
| Catalog Retail—4.9% | |
| Liberty Media Holding Corporation - Interactive, Class A (a) | | | 12,050,000 | | | $ | 287,031,000 | | |
| Homebuilding—2.9% | |
| Pulte Homes, Inc. | | | 6,474,200 | | | $ | 171,307,332 | | |
| Movies & Entertainment—9.4% | |
| Time Warner, Inc. | | | 15,340,000 | | | $ | 302,504,800 | | |
| Viacom, Inc., Class B (a) | | | 5,975,000 | | | | 245,632,250 | | |
| | | | 548,137,050 | | |
| Restaurants—14.7% | |
| Yum! Brands, Inc. | | | 8,557,000 | | | $ | 494,252,320 | | |
| McDonald's Corporation | | | 8,200,000 | | | | 369,410,000 | | |
| | | | 863,662,320 | | |
| Specialized Consumer Services—5.7% | |
| H&R Block, Inc. | | | 15,919,600 | | | $ | 334,948,384 | | |
| Other Diversified Financial Services—4.5% | |
| JPMorgan Chase & Co. | | | 5,500,000 | | | $ | 266,090,000 | | |
| Thrifts & Mortgage Finance—13.9% | |
| Washington Mutual, Inc. | | | 20,167,400 | | | $ | 814,359,612 | | |
| Health Care Technology—4.2% | |
| IMS Health Incorporated | | | 8,303,441 | | | $ | 246,280,060 | | |
| Pharmaceuticals—4.0% | |
| Bristol-Myers Squibb Company | | | 8,490,200 | | | $ | 235,687,952 | | |
| Diversified Commercial & Professional Services—4.2% | |
| The Dun & Bradstreet Corporation (b) | | | 2,684,900 | | | $ | 244,862,880 | | |
| Computer Hardware—3.4% | |
| Dell Inc. (a) | | | 8,500,000 | | | $ | 197,285,000 | | |
| Data Processing & Outsourced Services—3.2% | |
| Western Union Company | | | 8,615,400 | | | $ | 189,108,030 | | |
| Office Electronics—4.5% | |
| Xerox Corporation (a) | | | 15,446,400 | | | $ | 260,889,696 | | |
THE OAKMARK SELECT FUND
14
THE OAKMARK SELECT FUND
Schedule of Investments—March 31, 2007 (Unaudited) cont.
Name | | Shares Held/
Par Value | |
Market Value | |
| Common Stocks—95.6% (cont.) | |
| Semiconductors—3.9% | |
| Intel Corporation | | | 12,000,000 | | | $ | 229,560,000 | | |
| Wireless Telecommunication Services—3.2% | |
| Sprint Nextel Corporation | | | 10,000,000 | | | $ | 189,600,000 | | |
| Total Common Stocks (Cost: $3,831,482,161) | | | | | | | 5,605,935,016 | | |
| Short Term Investments—3.9% | |
| U.S. Government Bills—1.7% | |
| United States Treasury Bill, 5.135% due 4/19/2007 | | $ | 100,000,000 | | | $ | 99,743,250 | | |
| Total U.S. Government Bills (Cost: $99,743,250) | | | | | | | 99,743,250 | | |
| Repurchase Agreement—2.2% | |
IBT Repurchase Agreement, 5.20% dated 3/30/2007
due 4/2/2007, repurchase price $132,221,970,
collateralized by Government National Mortgage
Association Bonds, with rates of 4.750% - 6.125%,
with maturities from 1/20/2022 - 4/20/2035, and
with an aggregate market value plus accrued interest
of $102,333,949, and by Federal National Mortgage
Association Bonds, with rates of 4.165% - 6.383%,
with maturities from 12/25/2021 - 10/1/2040,
and with an aggregate market value plus accrued
interest of $36,438,985 | | $ | 132,164,699 | | | $ | 132,164,699 | | |
| Total Repurchase Agreement (Cost: $132,164,699) | | | | | | | 132,164,699 | | |
| Total Short Term Investments (Cost: $231,907,949) | | | | | | | 231,907,949 | | |
| Total Investments (Cost $4,063,390,110)—99.5% | | | | | | $ | 5,837,842,965 | | |
| Other Assets In Excess Of Other Liabilities—0.5% | | | | | | | 28,512,819 | | |
| Total Net Assets—100% | | | | | | $ | 5,866,355,784 | | |
(a) Non-income producing security.
(b) See footnote number five in the Notes to the Financial Statements regarding investments in affiliated issuers.
See accompanying Notes to Financial Statements.
THE OAKMARK SELECT FUND
15
THE OAKMARK EQUITY AND INCOME FUND
Report from Clyde S. McGregor and Edward A. Studzinski, Portfolio Managers


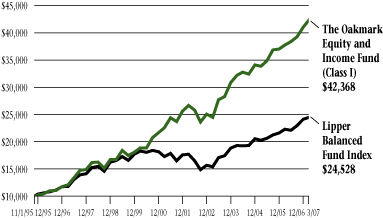
THE VALUE OF A $10,000 INVESTMENT IN THE OAKMARK EQUITY AND INCOME FUND FROM ITS INCEPTION (11/1/95) TO PRESENT (3/31/07) AS COMPARED TO THE LIPPER BALANCED FUND INDEX9
| | | | | Average Annual Total Returns
(as of 3/31/07) | |
| | | Total Return
Last 3 Months* | | 1-year | | 5-year | | 10-year | | Since
Inception
(11/1/95) | |
Oakmark Equity &
Income Fund (Class I) | | | 3.21 | % | | | 12.13 | % | | | 9.67 | % | | | 13.30 | % | | | 13.49 | % | |
Lipper Balanced
Fund Index | | | 1.56 | % | | | 9.78 | % | | | 6.71 | % | | | 7.55 | % | | | 8.18 | % | |
| S&P 5003 | | | 0.64 | % | | | 11.83 | % | | | 6.27 | % | | | 8.20 | % | | | 9.91 | % | |
Lehman Govt./
Corp. Bond10 | | | 1.47 | % | | | 6.38 | % | | | 5.57 | % | | | 6.51 | % | | | 6.12 | % | |
The graph and table do not reflect the deduction of taxes that a shareholder would pay on fund distributions or the redemption of fund shares.
Expense Ratio as of 9/30/06 was 0.86%.
The performance data quoted represents past performance. The above performance information for the Fund does not reflect the imposition of a 2% redemption fee on shares held for 90 days or less to deter market timers. If reflected, the fee would reduce the performance quoted. Past performance does not guarantee future results. The investment return and principal value will fluctuate so that an investor's shares, when redeemed, may be worth more or less than their original cost. Current performance may be lower or higher than the performance data quoted. Average annual total return measures annualized change, while total return measures aggregate change. To obtain most recent month-end performance data, visit oakmark.com.
* Not annualized
Quarter Review
The Equity and Income Fund achieved a return of 3% in the quarter ended March 31, 2007 which contrasts to the 2% that Lipper reported for its Balanced Fund Index. For the first six months of the current fiscal year, the comparison is 8% for the Fund and 7% for the Lipper Balanced Fund Index. We are most pleased to report a return of 13% compounded annually since inception for the Fund. Important contributors in the quarter included XTO Energy (outstanding fundamental results), Caremark (CVS/Express Scripts takeover battle), EchoStar Communications (results exceeded forecast), and Ceridian (activist investor agitation). Significant losers for the quarter included Scripps (poor print media trends), MBIA (speculation that the turmoil in mortgages could hurt the insurers of derivative instruments), Progressive (earnings deceleration), and Medtronic (problems regarding both stent efficacy and the company's Physio-Control unit).
As the quarter began, equity strategists' favorite topic was the low level of volatility that the stock market had enjoyed throughout 2006. Many commentators had been predicting that the market was "due for a correction." Stock market parlance normally defines correction as a 10% decline from a previous high, and the most recent 10% or greater decline took place in early 2003 before the Iraq invasion. Forecasters speculated about many different catalysts for the impending correction, most involving the geopolitical picture or possible interest rate changes. Looking back at the quarter, developments in China and Japan appear to have inspired a stock market tumble in late February, and the market has remained somewhat turbulent since.
Was this "the correction" that was so well anticipated? Not in the classic sense, as the various market indices experienced a maximum decline (so far, anyway) of only 6-7% from their highs attained in early February. Statistics strongly suggest that hedge funds are the current dominant force behind trading activity in the securities markets. It is plausible that hedge funds collectively act to dampen volatility, both up and down, and that in this new hedge fund era old rules concerning such things as corrections are not meaningful.
We were moderately active in the quarter, initiating positions in Ingersoll-Rand, Foot Locker, and Express Scripts, while eliminating the small positions in Rockwell Collins and Smithfield Foods. After a bitterly contested takeover battle, CVS, the drugstore chain, won control of Fund holding Caremark, a leading pharmacy benefit manager. The Fund's Caremark shares are now shares of CVS/Caremark. While the battle for Caremark raged, we spent time with the management teams from each of the principal actors. We came away impressed with all of them and, more importantly, with a heightened appreciation for the strengths of
THE OAKMARK EQUITY AND INCOME FUND
16
the pharmacy benefit management (PBM) industry. In particular, we have concluded that the development of biogenerics (generic versions of biological pharmaceuticals) may be transformative for the PBMs. In the past, we have usually found Express Scripts' stock valuation to be expensive. Our opportunity to purchase shares on better terms arose when the market's February turbulence combined with investor fears that Express Scripts would overpay in the bidding war for Caremark. In contrast, Ingersoll-Rand and Foot Locker are more traditional names for value investors. Ingersoll-Rand is an old-line industrial company that has evolved substantially under new management. We believe that the market price does not fully recognize this evolution to higher margin, less cyclical businesses. Foot Locker, the shoe retailer, is simply an unpopular, cheap stock in an industry subject to the vagaries of fashion.
Balance Issues
Shareholder e-mails often help to suggest issues warranting attention in our quarterly letters. Lately, we have received questions concerning our approach to balancing the Fund between stocks and bonds. The Fund ended the quarter almost exactly on an asset allocation of 60% equity, 40% fixed income and cash. As we have often written, history has shown that a 60/40 allocation is psychologically sustainable for most people in times of financial market stress. As well, a 60/40 balance helps to mediate between the competing goals of current income and capital growth.
While 60/40 is the Fund's central asset allocation tendency, the percentages do move around. This movement is not the result of top-down "macro" thinking but is merely the cumulative effect of many decisions on individual securities. Each day your managers are trying to answer the question, "What are the dominant investment opportunities available to this Fund and is the allocation to those securities optimal for the Fund's objectives of income and preservation and growth of capital?" If the aggregation of these decisions pushes the Fund's equity allocation up to 65%, we realize that we have found equities to be dominant. If we are not finding abundant and compelling equity opportunities, the equity allocation will drift down toward 50%.
The same analysis is applicable to our thinking about industry sectors within the equity portfolio. At various times in the Fund's history, concentrated positions in industries have emerged, but never did this outcome develop because we intentionally overweighted a sector. Rather, the industries themselves became so undervalued and fundamentally attractive that our analysts perforce identified ample individual opportunities.
Within the fixed income universe, we attempt to apply the same bottom-up thinking to build a portfolio that best complements the Fund's equity exposures. Early in the Fund's history we often wrote about our fixed income "quality barbell" strategy. This simply meant that we owned fixed income securities that the rating agencies evaluated as either low-grade or high-grade with nothing in between. This strategy served the portfolio well in the 1990s, but the current decade has witnessed yield compression such that we no longer find low-grade securities to offer good value.
As well, we usually find mortgage backed securities unattractive. Mortgage backed issues suffer from "negative convexity," a wonderful term that can be reduced to "heads I win, tails you lose." In practice, it means that when rates fall, homeowners refinance for lower rates, so the owner of the security that holds mortgages gets funds back precisely when they do not want them. Conversely, rising rates inhibit refinancing, which leaves the security owner holding a less attractive issue. It is negative convexity that discourages your Fund's managers from investing in this type of security, rather than a particular belief about the problems now emerging in the housing sector. In fact, during the recent turmoil in the sub-prime mortgage sector we have attempted to determine if opportunities were emerging to buy securities at fire-sale prices. To date this search has been unproductive.
All of The Oakmark Funds base their investing activity on the idea of fundamental or intrinsic value. Fixed income securities do develop pricing inefficiencies, but rarely to the degree available in equities. The proliferation of specialist fixed income managers has made these opportunities even more limited and fleeting. Accordingly, we generally choose to have the Fund take on risk in the equity portfolio where the rewards for successful analysis are far greater.
So, what should an investor expect today in terms of asset allocation for the Equity and Income Fund? Absent major investing environment change, the Fund will continue as it always has, with the equity allocation moving between its prospectus limits of 50 to 75% based on our ability to populate the portfolio with dominant value opportunities. For now the fixed income allocation is likely to remain heavily oriented to U.S. Treasury issues, but we will always be looking for occasions to purchase riskier fixed income holdings when value is available.
As always, we thank you for entrusting us with your assets and welcome your questions or comments.
Clyde S. McGregor, CFA
Portfolio Manager
mcgregor@oakmark.com | | Edward A. Studzinski, CFA
Portfolio Manager
estudzinski@oakmark.com | |
|
THE OAKMARK EQUITY AND INCOME FUND
17
THE OAKMARK EQUITY AND INCOME FUND
Schedule of Investments—March 31, 2007 (Unaudited)
Name | |
Shares Held | |
Market Value | |
| Equity and Equivalents—60.2% | |
| Common Stocks—60.2% | |
| Apparel Retail—2.3% | |
| The TJX Companies, Inc. | | | 5,500,000 | | | $ | 148,280,000 | | |
| Foot Locker, Inc. | | | 6,000,000 | | | | 141,300,000 | | |
| | | | 289,580,000 | | |
| Broadcasting & Cable TV—5.0% | |
| EchoStar Communications Corporation, Class A (a) | | | 8,250,000 | | | $ | 358,297,500 | | |
| The E.W. Scripps Company, Class A | | | 5,337,200 | | | | 238,466,096 | | |
| CBS Corporation, Class A | | | 910,000 | | | | 27,855,100 | | |
| | | | 624,618,696 | | |
| Movies & Entertainment—1.9% | |
| News Corporation, Class B | | | 9,735,100 | | | $ | 238,217,897 | | |
| Publishing—3.2% | |
| The Washington Post Company, Class B | | | 325,000 | | | $ | 248,137,500 | | |
| Idearc, Inc. | | | 4,000,000 | | | | 140,400,000 | | |
| PRIMEDIA, Inc. (a) | | | 3,500,000 | | | | 9,310,000 | | |
| | | | 397,847,500 | | |
| Restaurants—1.1% | |
| McDonald's Corporation | | | 3,000,000 | | | $ | 135,150,000 | | |
| Specialty Stores—0.2% | |
| Zale Corporation (a) | | | 940,000 | | | $ | 24,797,200 | | |
| Brewers—1.4% | |
| InBev NV (b) | | | 2,350,000 | | | $ | 169,676,327 | | |
| Distillers & Vintners—2.7% | |
| Diageo plc (c) | | | 4,100,000 | | | $ | 331,895,000 | | |
| Drug Retail—1.8% | |
| CVS/Caremark Corporation | | | 6,680,000 | | | $ | 228,055,200 | | |
| Hypermarkets & Super Centers—0.9% | |
| Costco Wholesale Corporation | | | 2,100,000 | | | $ | 113,064,000 | | |
| Packaged Foods & Meats—3.1% | |
| Nestle SA (c) | | | 3,900,000 | | | $ | 379,723,500 | | |
| Personal Products—1.7% | |
| Avon Products, Inc. | | | 5,720,100 | | | $ | 213,130,926 | | |
| Tobacco—1.6% | |
| UST, Inc. | | | 3,500,000 | | | $ | 202,930,000 | | |
| Integrated Oil & Gas—2.5% | |
| ConocoPhillips | | | 4,500,000 | | | $ | 307,575,000 | | |
THE OAKMARK EQUITY AND INCOME FUND
18
THE OAKMARK EQUITY AND INCOME FUND
Schedule of Investments—March 31, 2007 (Unaudited) cont.
Name | |
Shares Held | |
Market Value | |
| Equity and Equivalents—60.2% (cont.) | |
| Oil & Gas Exploration & Production—8.2% | |
| XTO Energy, Inc. | | | 10,561,338 | | | $ | 578,866,936 | | |
| EnCana Corp. (b) | | | 6,500,000 | | | | 329,095,000 | | |
| St. Mary Land & Exploration Company (d) | | | 2,900,000 | | | | 106,372,000 | | |
| | | | 1,014,333,936 | | |
| Property & Casualty Insurance—5.0% | |
| SAFECO Corporation | | | 4,000,000 | | | $ | 265,720,000 | | |
| MBIA, Inc. | | | 2,518,300 | | | | 164,923,467 | | |
| The Allstate Corporation | | | 2,000,000 | | | | 120,120,000 | | |
| The Progressive Corporation | | | 3,000,000 | | | | 65,460,000 | | |
| | | | 616,223,467 | | |
| Reinsurance—0.4% | |
| PartnerRe, Ltd. | | | 800,000 | | | $ | 54,832,000 | | |
| Biotechnology—1.9% | |
| MedImmune, Inc. (a) | | | 6,500,800 | | | $ | 236,564,112 | | |
| Health Care Equipment—2.3% | |
| Medtronic, Inc. | | | 4,685,322 | | | $ | 229,861,897 | | |
| Hospira, Inc. (a) | | | 1,350,000 | | | | 55,215,000 | | |
| | | | 285,076,897 | | |
| Health Care Services—0.8% | |
| Express Scripts, Inc. (a) | | | 1,300,000 | | | $ | 104,936,000 | | |
| Life Sciences Tools & Services—0.8% | |
| Varian, Inc. (a)(d) | | | 1,649,400 | | | $ | 96,094,044 | | |
| Aerospace & Defense—6.1% | |
| General Dynamics Corporation | | | 4,700,000 | | | $ | 359,080,000 | | |
| Raytheon Company | | | 3,599,700 | | | | 188,840,262 | | |
| Alliant Techsystems, Inc. (a) | | | 1,325,000 | | | | 116,494,000 | | |
| Honeywell International, Inc. | | | 1,889,500 | | | | 87,030,370 | | |
| | | | 751,444,632 | | |
| Industrial Conglomerates—0.5% | |
| Walter Industries, Inc. | | | 2,250,700 | | | $ | 55,704,825 | | |
| Industrial Machinery—1.9% | |
| Ingersoll-Rand Co., Class A | | | 3,212,500 | | | $ | 139,326,125 | | |
| Mueller Water Products, Inc., Class B (d) | | | 6,719,153 | | | | 89,969,459 | | |
| | | | 229,295,584 | | |
| Application Software—0.4% | |
| Mentor Graphics Corporation (a) | | | 3,288,318 | | | $ | 53,731,116 | | |
| Data Processing & Outsourced Services—1.4% | |
| Ceridian Corporation (a) | | | 4,800,000 | | | $ | 167,232,000 | | |
THE OAKMARK EQUITY AND INCOME FUND
19
THE OAKMARK EQUITY AND INCOME FUND
Schedule of Investments—March 31, 2007 (Unaudited) cont.
Name | | Shares Held/
Par Value | |
Market Value | |
| Equity and Equivalents—60.2% (cont.) | |
| Semiconductors—0.5% | |
| International Rectifier Corporation (a) | | | 1,539,700 | | | $ | 58,831,937 | | |
| Technology Distributors—0.6% | |
| CDW Corporation | | | 1,200,000 | | | $ | 73,716,000 | | |
| Paper Products—0.0% | |
| Schweitzer-Mauduit International, Inc. | | | 125,000 | | | $ | 3,106,250 | | |
| Total Common Stocks (Cost: $5,142,320,203) | | | | | | | 7,457,384,046 | | |
| Total Equity And Equivalents (Cost: $5,142,320,203) | | | | | | | 7,457,384,046 | | |
| Fixed Income—37.4% | |
| Corporate Bonds—0.2% | |
| Paper Packaging—0.2% | |
| Sealed Air Corporation, 144A, 5.625% due 7/15/2013 (e) | | $ | 20,000,000 | | | $ | 20,058,180 | | |
| Total Corporate Bonds (Cost: $20,162,497) | | | | | | | 20,058,180 | | |
| Government and Agency Securities—37.2% | |
| Canadian Government Bonds—1.7% | |
| Canada Government, 2.75% due 12/1/2007 | | CAD | 250,000,000 | | | $ | 214,595,063 | | |
| France Government Bonds—0.4% | |
France Government, 3.00% due 7/25/2012,
Inflation Indexed | | EUR | 38,550,750 | | | $ | 54,660,513 | | |
| U.S. Government Notes—35.1% | |
| United States Treasury Notes, 4.875% due 5/15/2009 | | $ | 750,000,000 | | | $ | 754,043,250 | | |
| United States Treasury Notes, 4.875% due 2/15/2012 | | | 500,000,000 | | | | 507,793,000 | | |
| United States Treasury Notes, 5.125% due 6/30/2008 | | | 500,000,000 | | | | 501,797,000 | | |
| United States Treasury Notes, 4.875% due 8/15/2016 | | | 375,000,000 | | | | 380,947,125 | | |
| United States Treasury Notes, 4.50% due 2/15/2016 (f) | | | 375,000,000 | | | | 371,191,500 | | |
| United States Treasury Notes, 5.125% due 6/30/2011 | | | 250,000,000 | | | | 255,527,250 | | |
| United States Treasury Notes, 4.875% due 5/31/2011 | | | 250,000,000 | | | | 253,105,500 | | |
| United States Treasury Notes, 4.75% due 3/31/2011 | | | 250,000,000 | | | | 251,894,500 | | |
| United States Treasury Notes, 5.00% due 7/31/2008 | | | 250,000,000 | | | | 250,664,000 | | |
| United States Treasury Notes, 4.75% due 12/31/2008 | | | 250,000,000 | | | | 250,332,000 | | |
| United States Treasury Notes, 4.75% due 11/15/2008 | | | 250,000,000 | | | | 250,117,250 | | |
THE OAKMARK EQUITY AND INCOME FUND
20
THE OAKMARK EQUITY AND INCOME FUND
Schedule of Investments—March 31, 2007 (Unaudited) cont.
Name | |
Par Value | |
Market Value | |
| Fixed Income—37.4% (cont.) | |
| U.S. Government Notes—35.1% (cont.) | |
| United States Treasury Notes, 4.875% due 4/30/2008 | | $ | 250,000,000 | | | $ | 249,970,750 | | |
United States Treasury Notes, 3.625% due 1/15/2008,
Inflation Indexed | | | 62,634,000 | | | | 63,590,609 | | |
| | | | 4,340,973,734 | | |
| Total Government and Agency Securities (Cost: $4,564,203,641) | | | | | | | 4,610,229,310 | | |
| Total Fixed Income (Cost: $4,584,366,138) | | | | | | | 4,630,287,490 | | |
| Short Term Investments—2.2% | |
| Repurchase Agreement—2.2% | |
IBT Repurchase Agreement, 5.20% dated 3/30/2007
due 4/2/2007, repurchase price $268,306,232,
collateralized by Government National Mortgage
Association Bonds, with rates of 5.875% - 6.000%,
with maturities from 4/20/2034 - 10/20/2034, and
with an aggregate market value plus accrued interest
of $57,105,300, and by Federal National Mortgage
Association Bonds, with rates of 4.375% - 5.680%,
with maturities from 1/1/2033 - 10/25/2036, and
with an aggregate market value plus accrued interest
of $224,494,217 | | $ | 268,190,016 | | | $ | 268,190,016 | | |
| Total Repurchase Agreement (Cost: $268,190,016) | | | | | | | 268,190,016 | | |
| Total Short Term Investments (Cost: $268,190,016) | | | | | | | 268,190,016 | | |
| Total Investments (Cost $9,994,876,357)—99.8% | | | | | | $ | 12,355,861,552 | | |
| Other Assets In Excess Of Other Liabilities—0.2% | | | | | | | 21,913,566 | | |
| Total Net Assets—100% | | | | | | $ | 12,377,775,118 | | |
(a) Non-income producing security.
(b) Represents a foreign domiciled corporation.
(c) Represents an American Depository Receipt.
(d) See footnote number five in the Notes to the Financial Statements regarding investments in affiliated issuers.
(e) Security exempt from registration under Rule 144A of the Securities Act of 1933. These securities may be resold in transactions exempt from registration, normally to qualified institutional buyers.
(f) All or a portion of security out on loan.
Key to abbreviations:
CAD: Canadian Dollar
EUR: Euro Dollar
See accompanying Notes to Financial Statements.
THE OAKMARK EQUITY AND INCOME FUND
21
THE OAKMARK GLOBAL FUND
Report from Clyde S. McGregor and Robert A. Taylor, Portfolio Managers


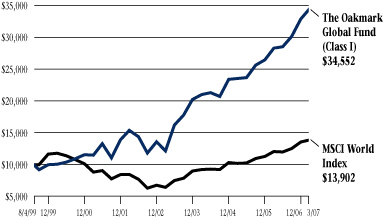
THE VALUE OF A $10,000 INVESTMENT IN THE OAKMARK GLOBAL FUND FROM ITS INCEPTION (8/4/99) TO PRESENT (3/31/07) AS COMPARED TO THE MSCI WORLD INDEX11
| | | | | Average Annual Total Returns
(as of 3/31/07) | |
| | | Total Return
Last 3 Months* | | 1-year | | 5-year | | Since
Inception
(8/4/99) | |
| Oakmark Global Fund (Class I) | | | 4.98 | % | | | 22.00 | % | | | 17.56 | % | | | 17.58 | % | |
| MSCI World11 | | | 2.50 | % | | | 15.44 | % | | | 10.44 | % | | | 4.40 | % | |
| Lipper Global Fund Index12 | | | 2.53 | % | | | 14.24 | % | | | 10.73 | % | | | 6.29 | % | |
The graph and table do not reflect the deduction of taxes that a shareholder would pay on fund distributions or the redemption of fund shares.
Expense Ratio as of 9/30/06 was 1.18%.
The performance data quoted represents past performance. The above performance information for the Fund does not reflect the imposition of a 2% redemption fee on shares held for 90 days or less to deter market timers. If reflected, the fee would reduce the performance quoted. Past performance does not guarantee future results. The investment return and principal value will fluctuate so that an investor's shares, when redeemed, may be worth more or less than their original cost. Current performance may be lower or higher than the performance data quoted. Average annual total return measures annualized change, while total return measures aggregate change. To obtain most recent month-end performance data, visit oakmark.com.
* Not annualized
Quarter Review
Corporate merger and restructuring activity, both announced and rumored, propelled The Oakmark Global Fund to a 5% return in the quarter ending March 31, 2007. During the same period, both the MSCI World Index and the Lipper Global Fund Index gained 3%. For the first six months of the current fiscal year, the Fund returned 15% compared to 11% for the MSCI World Index and the Lipper Global Fund Index. We are most pleased to report that the compound annualized rate of return since the Fund's inception is 18%.
While the return picture for the Fund was pleasant in the quarter, the period nevertheless frustrated your management team. We have found it difficult to identify value opportunities in most emerging markets for several years and have been hoping for a period of market turbulence. In late February we saw the possibility for just such an opening when a one-day collapse in the Chinese Shanghai stock market combined with an increase in Japanese interest rates to unsettle investors. Regrettably, from our standpoint at least, the worldwide downdraft in stocks proved insufficient to reduce prices of individual issues to levels that we deem appropriate for new investment. In addition, this volatility was so short-lived that the Shanghai market completely recovered its losses by the end of the quarter.
During the past quarter, the countries in which the Fund has significant allocations each produced positive returns, especially Japan and Germany. David Herro, co-manager of the Oakmark International and International Small Cap Funds, has discussed Japanese brokerage firm Nikko Cordial, a first quarter purchase in the Global Fund, at length in his lead International letter, and we encourage you to read his comments. Another top contributor was Germany's DaimlerChrysler (DCX) whose management began exploring sale or divestiture possibilities for Chrysler. Only a few months ago, problems at Chrysler caused DCX's share price to fall, and at that time we initiated our position in the stock. Fears of a massive earnings loss, failed union negotiations, a domestic incentives war, rising interest rates and high oil prices led many people to believe that Chrysler was worthless. Today, in contrast, the daily news is full of rumors and speculations con cerning both the potential value of Chrysler and the suitors for the business.
The DaimlerChrysler experience offers several lessons. First, our focus on fundamental business value rather than headlines or share price movements creates the most value for our investors. Despite the fears stated above and the swings of DCX's share price, our estimate of Chrysler's
THE OAKMARK GLOBAL FUND
22
worth has remained constant. Second, it is important that we invest with managers who think and act like owners of their business. While Chrysler's fate remains unclear, we believe that Dr. Dieter Zetsche and the rest of DCX's top management are acting to maximize shareholder value over time. Finally, portfolio weightings will favor the companies with the largest discounts to value. Since we added the stock to the Fund, DCX has consistently been one of the largest holdings because of its attractive valuation, even though it is in a relatively unattractive industry. At the time we purchased DCX we were only paying for the Mercedes brand and the net cash on its balance sheet; Chrysler (less its pension obligation), the commercial vehicles division, the auto finance book, and miscellaneous long-term financial assets were free.
Many additional holdings contributed meaningfully to the portfolio's return for the quarter, including Julius Baer (Switzerland), XTO Energy (U.S.), Kinetic Concepts (U.S.), Discovery Holding (U.S.), NTT Docomo (Japan), Cadbury Schweppes (UK), and Ceridian (U.S.). Discovery announced the repurchase of Cox's 25% holding in the company. Cadbury's shares rose as investor Nelson Peltz disclosed an ownership stake and management proposed to break the company apart. Ceridian also attracted the attention of activist investors.
Activity
While market movements made us appear active in the quarter, we actually initiated positions in only two names and eliminated two holdings as well. We sold ANZ Banking Group (Australia) and Waste Management (U.S.) when they met our price objectives. We have already mentioned our purchase of Nikko Cordial. Our other new purchase was UBS, the Swiss-based financial conglomerate. UBS's private banking franchise is the world's largest. The private banking business achieves high operating margins and huge returns on capital. Unusual for a business with solid growth potential, private banking requires only modest incremental capital. UBS's private bank franchise and asset management business together generate the majority of the company's profits. Nevertheless, UBS's stock has been more sensitive to investor attitudes toward the company's investment banking business, thereby creating our opportunity. The investment banking industry has had great re sults for several years. Record mergers and acquisition activity as well as strong proprietary trading from products such as mortgages and commodities have boosted profits. UBS's investment bank has gained share over the past few years and generates very good returns on capital. We are sympathetic to the point of view that the investment banking results may be above trend, but we believe that the share price discounts this risk. Management seems to agree and has repurchased 20% of the company over the past five years and announced another 10% repurchase in the March quarter.
Weights
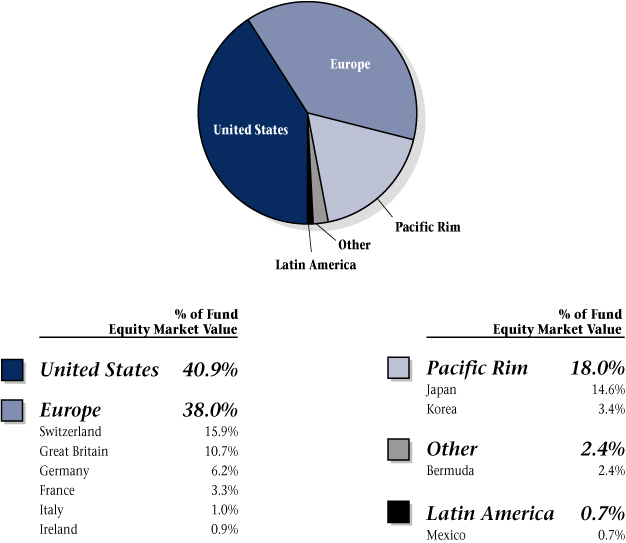
In one sense, we ended the quarter right where we began it: the portfolio weight for U.S. stocks remained at approximately 40%. The percentage allocations in Switzerland and Japan rose, largely because of the UBS and Nikko purchases, while the Fund's United Kingdom allocation diminished. Consultants point out that the Fund's 40% weight for U.S. holdings is less than the weight in the benchmark, the MSCI World Index. Although that is true, in our opinion it is not meaningful. Over the course of the Fund's history, the U.S. allocation has at times been 50% and at other times 30%. Your managers, however, have never paid attention to benchmarks when building the portfolio. Within the prospectus limits for the Fund, we invest wherever we believe there is value, and currently that means 41% U.S., 15% Japan, and most of the remainder in the UK and continental Europe.
We thank you for being our shareholders and welcome your suggestions and comments.
Clyde S. McGregor, CFA
Portfolio Manager
mcgregor@oakmark.com | | Robert A. Taylor, CFA
Portfolio Manager
rtaylor@oakmark.com | |
|
THE OAKMARK GLOBAL FUND
23
THE OAKMARK GLOBAL FUND
Global Diversification—March 31, 2007 (Unaudited)
THE OAKMARK GLOBAL FUND
24
THE OAKMARK GLOBAL FUND
Schedule of Investments—March 31, 2007 (Unaudited)
Name | |
Description | |
Shares Held | |
Market Value | |
| Common Stocks—98.3% | |
| Apparel, Accessories & Luxury Goods—1.0% | |
| Bulgari S.p.A. (Italy) | | Jewelry Manufacturer & Retailer | | | 1,946,000 | | | $ | 28,101,288 | | |
| Automobile Manufacturers—6.1% | |
DaimlerChrysler AG
(Germany) (a) | | Automobile Manufacturer | | | 1,365,000 | | | $ | 111,958,924 | | |
Bayerische Motoren
Werke (BMW) AG
(Germany) | | Luxury Automobile Manufacturer | | | 1,064,000 | | | | 62,780,782 | | |
| | | | 174,739,706 | | |
| Broadcasting & Cable TV—3.6% | |
Discovery Holding
Company, Class A
(United States) (b) | | Media Management &
Network Services | | | 2,913,700 | | | $ | 55,739,081 | | |
CBS Corporation, Class B
(United States) | | Radio & Television Broadcasting | | | 1,585,000 | | | | 48,485,150 | | |
| | | | 104,224,231 | | |
| Household Appliances—3.0% | |
Snap-on Incorporated
(United States) | | Tool & Equipment Manufacturer | | | 1,760,000 | | | $ | 84,656,000 | | |
| Leisure Products—1.0% | |
Brunswick Corp.
(United States) | | Leisure & Recreation Products
Manufacturer | | | 877,000 | | | $ | 27,932,450 | | |
| Motorcycle Manufacturers—1.7% | |
Harley-Davidson, Inc.
(United States) | | Motorcycle Manufacturer | | | 824,000 | | | $ | 48,410,000 | | |
| Movies & Entertainment—7.5% | |
Viacom, Inc., Class B
(United States) (b) | | Publishing Company | | | 1,186,500 | | | $ | 48,777,015 | | |
Time Warner, Inc.
(United States) | | Filmed Entertainment &
Television Networks | | | 2,322,600 | | | | 45,801,672 | | |
Live Nation
(United States) (b) | | Live Events Producer, Operator, &
Promoter | | | 1,992,963 | | | | 43,964,764 | | |
News Corporation, Class B
(United States) | | International Multimedia &
Entertainment Company | | | 1,726,500 | | | | 42,247,455 | | |
Vivendi Universal SA
(France) | | Music, Games, Television, Film, &
Telecommunications | | | 811,500 | | | | 32,976,566 | | |
| | | | 213,767,472 | | |
THE OAKMARK GLOBAL FUND
25
THE OAKMARK GLOBAL FUND
Schedule of Investments—March 31, 2007 (Unaudited) cont.
Name | |
Description | |
Shares Held | |
Market Value | |
| Common Stocks—98.3% (cont.) | |
| Publishing—3.4% | |
The Washington Post
Company, Class B
(United States) Newspaper & Magazine Publishing;
Educational & Career Development | |
Service Provider | | | 70,360 | | | $ | 53,719,860 | | |
Trinity Mirror plc
(Great Britain) | | Newspaper Publishing | | | 4,078,900 | | | | 42,701,849 | | |
| | | | 96,421,709 | | |
| Distillers & Vintners—2.8% | |
| Diageo plc (Great Britain) | | Beverages, Wines, & Spirits
Manufacturer | | | 3,902,500 | | | $ | 79,060,809 | | |
| Household Products—1.4% | |
Kimberly-Clark de Mexico
S.A.B. de C.V (Mexico) | | Hygiene Products Manufacturer,
Marketer & Distributor | | | 4,391,000 | | | $ | 19,802,413 | | |
Uni-Charm Corporation
(Japan) | | Toiletry Products Manufacturer | | | 310,100 | | | | 19,631,246 | | |
| | | | 39,433,659 | | |
| Packaged Foods & Meats—3.7% | |
| Nestle SA (Switzerland) | | Food & Beverage Manufacturer | | | 157,500 | | | $ | 61,339,649 | | |
Cadbury Schweppes plc
(Great Britain) | | Beverage & Confectionary
Manufacturer | | | 3,493,000 | | | | 44,816,524 | | |
| | | | 106,156,173 | | |
| Soft Drinks—0.7% | |
Lotte Chilsung
Beverage Co., Ltd.
(Korea) | | Soft Drinks, Juices & Sports
Drinks Manufacturer | | | 16,615 | | | $ | 21,210,263 | | |
| Oil & Gas Exploration & Production—3.0% | |
XTO Energy, Inc.
(United States) | | Oil & Natural Gas Exploration &
Production | | | 1,589,000 | | | $ | 87,093,090 | | |
| Asset Management & Custody Banks—2.6% | |
Julius Baer Holding AG
(Switzerland) | | Asset Management | | | 545,200 | | | $ | 74,389,302 | | |
| Diversified Banks—0.9% | |
| Bank of Ireland (Ireland) | | Commercial Bank | | | 1,155,700 | | | $ | 24,933,046 | | |
THE OAKMARK GLOBAL FUND
26
THE OAKMARK GLOBAL FUND
Schedule of Investments—March 31, 2007 (Unaudited) cont.
Name | |
Description | |
Shares Held | |
Market Value | |
| Common Stocks—98.3% (cont.) | |
| Diversified Capital Markets—6.1% | |
| UBS AG (Switzerland) | | Investment Banking | | | 1,516,300 | | | $ | 90,093,289 | | |
Credit Suisse Group
(Switzerland) | | Investment Services & Insurance | | | 1,137,400 | | | | 81,620,606 | | |
| | | | 171,713,895 | | |
| Investment Banking & Brokerage—5.7% | |
Nikko Cordial
Corporation (Japan) | | Comprehensive Financial
Services Provider | | | 7,281,300 | | | $ | 103,992,090 | | |
Daiwa Securities
Group, Inc. (Japan) | | Stock Broker | | | 4,944,000 | | | | 59,702,240 | | |
| | | | 163,694,330 | | |
| Health Care Equipment—4.2% | |
Medtronic, Inc.
(United States) | | Health Care Equipment | | | 1,283,500 | | | $ | 62,968,510 | | |
Kinetic Concepts, Inc.
(United States) (b) | | Health Care Equipment & Supplies | | | 1,115,100 | | | | 56,468,664 | | |
| | | | 119,437,174 | | |
| Health Care Services—2.8% | |
Laboratory Corporation
of America Holdings
(United States) (b) | | Medical Laboratory &
Testing Services | | | 1,085,000 | | | $ | 78,803,550 | | |
| Pharmaceuticals—6.6% | |
GlaxoSmithKline plc
(Great Britain) | | Pharmaceuticals | | | 3,483,000 | | | $ | 95,750,681 | | |
Novartis AG
(Switzerland) (c) | | Pharmaceuticals | | | 1,155,900 | | | | 63,146,817 | | |
Takeda Pharmaceutical
Company Limited
(Japan) | | Pharmaceuticals &
Food Supplements | | | 416,000 | | | | 27,288,527 | | |
| | | | 186,186,025 | | |
| Aerospace & Defense—0.8% | |
Alliant Techsystems, Inc.
(United States) (b) | | Propulsion Systems & Munitions | | | 269,087 | | | $ | 23,658,129 | | |
| Diversified Commercial & Professional Services—0.9% | |
Meitec Corporation
(Japan) | | Software Engineering Services | | | 760,000 | | | $ | 24,507,807 | | |
| Human Resource & Employment Services—1.7% | |
| Adecco SA (Switzerland) | | Temporary Employment Services | | | 783,000 | | | $ | 49,712,752 | | |
THE OAKMARK GLOBAL FUND
27
THE OAKMARK GLOBAL FUND
Schedule of Investments—March 31, 2007 (Unaudited) cont.
Name | |
Description | |
Shares Held | |
Market Value | |
| Common Stocks—98.3% (cont.) | |
| Industrial Conglomerates—2.4% | |
Tyco International Ltd.
(Bermuda) | | Diversified Manufacturing &
Services | | | 2,131,000 | | | $ | 67,233,050 | | |
| Railroads—2.0% | |
Union Pacific Corporation
(United States) | | Rail Transportation Provider | | | 573,700 | | | $ | 58,259,235 | | |
| Computer Hardware—1.3% | |
Dell Inc.
(United States) (b) | | Technology Products & Services | | | 1,635,000 | | | $ | 37,948,350 | | |
| Data Processing & Outsourced Services—3.9% | |
eFunds Corporation
(United States) (b) | | Electronic Debit Payment Services | | | 2,201,900 | | | $ | 58,702,654 | | |
Ceridian Corporation
(United States) (b) | | Data Management Services | | | 1,438,000 | | | | 50,099,920 | | |
| | | | 108,802,574 | | |
| Home Entertainment Software—2.5% | |
Square Enix Co., Ltd.
(Japan) | | Entertainment Software | | | 2,718,000 | | | $ | 70,118,126 | | |
| Office Electronics—2.1% | |
| Neopost SA (France) | | Mailroom Equipment Supplier | | | 424,750 | | | $ | 60,712,045 | | |
| Semiconductors—4.8% | |
Rohm Company
Limited (Japan) | | Integrated Circuits & Semiconductor
Devices Manufacturer | | | 915,988 | | | $ | 83,094,974 | | |
Intel Corporation
(United States) | | Computer Component
Manufacturer & Designer | | | 2,914,200 | | | | 55,748,646 | | |
| | | | 138,843,620 | | |
| Systems Software—2.7% | |
Oracle Corporation
(United States) (b) | | Software Services | | | 4,182,000 | | | $ | 75,819,660 | | |
| Specialty Chemicals—0.9% | |
| Givaudan (Switzerland) | | Fragrance & Flavor Compound
Manufacturer | | | 26,900 | | | $ | 24,882,196 | | |
| Wireless Telecommunication Services—4.5% | |
SK Telecom Co., Ltd.
(Korea) | | Mobile Telecommunications | | | 353,930 | | | $ | 72,042,512 | | |
Vodafone Group Plc
(Great Britain) | | Mobile Telecommunications | | | 13,938,225 | | | | 37,165,395 | | |
THE OAKMARK GLOBAL FUND
28
THE OAKMARK GLOBAL FUND
Schedule of Investments—March 31, 2007 (Unaudited) cont.
Name | |
Description | | Shares Held/
Par Value | |
Market Value | |
| Common Stocks—98.3% (cont.) | |
| Wireless Telecommunication Services—4.5% (cont.) | |
NTT DoCoMo, Inc.
(Japan) | | Mobile Telecommunications | | | 11,600 | | | $ | 21,459,606 | | |
SK Telecom Co., Ltd.
(Korea) (d) | | Mobile Telecommunications | | | 55,000 | | | | 1,288,100 | | |
| | | | 131,955,613 | | |
| Total Common Stocks (Cost: $2,123,940,062) | | | | | | | 2,802,817,329 | | |
| Short Term Investments—2.3% | |
| Repurchase Agreement—2.3% | |
IBT Repurchase Agreement, 5.20% dated 3/30/2007
due 4/2/2007, repurchase price $64,010,431,
collateralized by a Federal National Mortgage
Association Bond, with a rate of 7.193%, with a
maturity date of 11/1/2033, and with a market
value plus accrued interest of $3,360,740, and by
Government National Mortgage Association Bonds,
with rates of 5.000% - 6.000%, with maturities from
7/20/2034 - 2/20/2035, and with an aggregate market
value plus accrued interest of $63,821,100 | | $ | 63,982,705 | | | $ | 63,982,705 | | |
| Total Repurchase Agreement (Cost: $63,982,705) | | | | | 63,982,705 | | |
| Total Short Term Investments (Cost: $63,982,705) | | | | | 63,982,705 | | |
| Total Investments (Cost $2,187,922,767)—100.6% | | | | $ | 2,866,800,034 | | |
| Foreign Currencies (Cost $1,877,571)—0.1% | | | | $ | 1,877,073 | | |
| Other Liabilities In Excess Of Other Assets—(0.7%) | | | | | (18,692,223 | ) | |
| Total Net Assets—100% | | | | $ | 2,849,984,884 | | |
(a) All or a portion of security out on loan.
(b) Non-income producing security.
(c) Market value is determined in accordance with procedures established in good faith by the Board of Trustees.
(d) Represents an American Depository Receipt.
See accompanying Notes to Financial Statements.
THE OAKMARK GLOBAL FUND
29
THE OAKMARK GLOBAL SELECT FUND
Report from Bill Nygren and David Herro, Portfolio Managers


THE VALUE OF A $10,000 INVESTMENT IN THE OAKMARK GLOBAL SELECT FUND FROM ITS INCEPTION (10/2/06) TO PRESENT (3/31/07) AS COMPARED TO THE MSCI WORLD INDEX11
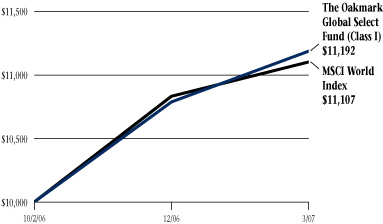
| | | Total Return
(as of 3/31/07) | |
| | | Last 3 Months* | | Since
Inception
(10/2/06) | |
| Oakmark Global Select Fund (Class I) | | | 3.71 | % | | | 11.92 | % | |
| MSCI World | | | 2.50 | % | | | 11.07 | % | |
| Lipper Global Fund Index12 | | | 2.53 | % | | | 11.21 | % | |
The graph and table do not reflect the deduction of taxes that a shareholder would pay on fund distributions or the redemption of fund shares.
Expense Ratio as of 10/2/06 was 1.75%.
The performance data quoted represents past performance. The above performance information for the Fund does not reflect the imposition of a 2% redemption fee on shares held for 90 days or less to deter market timers. If reflected, the fee would reduce the performance quoted. Past performance does not guarantee future results. The investment return and principal value will fluctuate so that an investor's shares, when redeemed, may be worth more or less than their original cost. Current performance may be lower or higher than the performance data quoted. Average annual total return measures annualized change, while total return measures aggregate change. To obtain most recent month-end performance data, visit oakmark.com.
* Not annualized
The Oakmark Global Select Fund returned 4% for the quarter ending March 31, 2007, which compares favorably to the MSCI World Index return of 3%.
Impact Players
The foreign holdings outperformed domestic this quarter. All of the top five contributors were foreign stocks. Nikko Cordial was added to the portfolio mid-quarter while it was trading near its 52-week low. Nikko Cordial ended the quarter as the largest contributor to return due to its recent rebound in price. We encourage you to read the thorough discussion of Nikko Cordial in the lead International letter. The second largest contributor to return was DaimlerChrysler, which recovered after management began exploring sale or divestiture possibilities for the Chrysler division. Rounding out the top three is Schroders plc, a UK-based investment management company, which was up 16% during the quarter. Schroders reported better than expected earnings, which forced investors who had long ignored it to take a second look at this solid business selling at a discounted price.
The largest detractors to performance for the Fund were U.S.-based Washington Mutual Inc. and Time Warner Inc. Washington Mutual has had a positive impact on our other Funds over the many years we have owned it. However, this is not the case in every quarter, including this most recent one. Washington Mutual's price was negatively affected by investors' concerns about the subprime mortgage market. We maintain our positive, long-term outlook on the stock and believe it has a very favorable risk-return profile. Rounding out the bottom three detractors was Japan based Rohm Co. The 9% decline in share price was largely due to general weakness in the semiconductor industry.
Portfolio Composition
During the quarter we sold our entire positions in Vodafone Group plc and Daiwa Securities as more attractive investment opportunities arose. Nikko Cordial Corp. and Sprint Corp. were added during the quarter. We believe that both are great businesses selling at discounted prices that will be good long-term performers for the Fund.
As long-term value investors, we continue to focus on finding attractive, under-valued companies trading at a discount with management teams focused on building shareholder value.
William C. Nygren, CFA
Portfolio Manager
bnygren@oakmark.com | | David G. Herro, CFA
Portfolio Manager
dherro@oakmark.com | |
|
THE OAKMARK GLOBAL SELECT FUND
30
THE OAKMARK GLOBAL SELECT FUND
Global Diversification—March 31, 2007 (Unaudited)
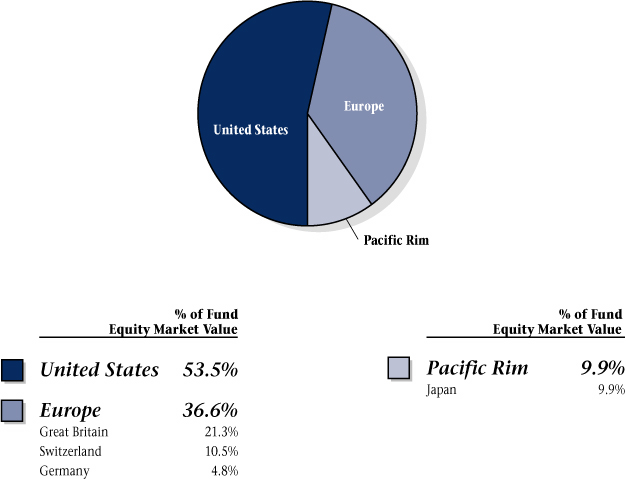
THE OAKMARK GLOBAL SELECT FUND
31
THE OAKMARK GLOBAL SELECT FUND
Schedule of Investments—March 31, 2007 (Unaudited)
Name | |
Description | |
Shares Held | |
Market Value | |
| Common Stocks—90.5% | |
| Automobile Manufacturers—4.4% | |
DaimlerChrysler AG
(Germany) | | Automobile Manufacturer | | | 122,900 | | | $ | 10,080,404 | | |
| Broadcasting & Cable TV—4.8% | |
British Sky Broadcasting
Group plc
(Great Britain) | | Television Production & Broadcasting | | | 984,000 | | | $ | 10,921,095 | | |
| Home Improvement Retail—4.4% | |
The Home Depot, Inc.
(United States) | | Home Improvement Retailer | | | 273,000 | | | $ | 10,030,020 | | |
| Movies & Entertainment—8.7% | |
Viacom, Inc., Class B
(United States) (a) | | Publishing Company | | | 246,000 | | | $ | 10,113,060 | | |
Time Warner, Inc.
(United States) | | Filmed Entertainment &
Television Networks | | | 505,000 | | | | 9,958,600 | | |
| | | | 20,071,660 | | |
| Restaurants—4.4% | |
McDonald's Corporation
(United States) | | Fast-food Restaurant Operator | | | 224,000 | | | $ | 10,091,200 | | |
| Distillers & Vintners—4.9% | |
| Diageo plc (Great Britain) | | Beverages, Wines, & Spirits
Manufacturer | | | 554,000 | | | $ | 11,223,495 | | |
| Asset Management & Custody Banks—4.8% | |
Schroders PLC
(Great Britain) | | International Asset Management | | | 438,100 | | | $ | 10,931,619 | | |
| Diversified Capital Markets—4.8% | |
| UBS AG (Switzerland) | | Investment Banking | | | 185,000 | | | $ | 10,992,059 | | |
| Investment Banking & Brokerage—4.1% | |
Nikko Cordial
Corporation (Japan) | | Comprehensive Financial
Services Provider | | | 666,000 | | | $ | 9,511,864 | | |
| Other Diversified Financial Services—4.3% | |
Citigroup, Inc.
(United States) | | Diversified Financial Services | | | 194,000 | | | $ | 9,959,960 | | |
| Thrifts & Mortgage Finance—4.4% | |
Washington Mutual, Inc.
(United States) | | Diversified Financial Services | | | 249,000 | | | $ | 10,054,620 | | |
THE OAKMARK GLOBAL SELECT FUND
32
THE OAKMARK GLOBAL SELECT FUND
Schedule of Investments—March 31, 2007 (Unaudited) cont.
Name | |
Description | |
Shares Held | |
Market Value | |
| Common Stocks—90.5% (cont.) | |
| Pharmaceuticals—13.7% | |
GlaxoSmithKline plc
(Great Britain) | | Pharmaceuticals | | | 404,000 | | | $ | 11,106,309 | | |
Schering-Plough
Corporation
(United States) | | Pharmaceuticals | | | 402,000 | | | | 10,255,020 | | |
Bristol-Myers Squibb
Company
(United States) | | Health & Personal Care | | | 364,000 | | | | 10,104,640 | | |
| | | | 31,465,969 | | |
| Human Resource & Employment Services—4.8% | |
| Adecco SA (Switzerland) | | Temporary Employment Services | | | 171,700 | | | $ | 10,901,251 | | |
| Computer Hardware—4.3% | |
Dell Inc.
(United States) (a) | | Technology Products & Services | | | 430,000 | | | $ | 9,980,300 | | |
| Semiconductors—9.2% | |
Rohm Company Limited
(Japan) | | Integrated Circuits & Semiconductor
Devices Manufacturer | | | 121,400 | | | $ | 11,012,950 | | |
Intel Corporation
(United States) | | Computer Component
Manufacturer & Designer | | | 533,000 | | | | 10,196,290 | | |
| | | | 21,209,240 | | |
| Wireless Telecommunication Services—4.5% | |
Sprint Nextel Corporation
(United States) | | Telecommunications | | | 543,000 | | | $ | 10,295,280 | | |
| Total Common Stocks (Cost: $198,406,751) | | | | | | | | | 207,720,036 | | |
THE OAKMARK GLOBAL SELECT FUND
33
THE OAKMARK GLOBAL SELECT FUND
Schedule of Investments—March 31, 2007 (Unaudited) cont.
Name | |
Par Value | |
Market Value | |
| Short Term Investments—12.1% | |
| U.S. Government Bills—0.8% | |
| United States Treasury Bill, 5.07% due 4/26/2007 | | $ | 2,000,000 | | | $ | 1,992,958 | | |
| Total U.S. Government Bills (Cost: $1,992,958) | | | | | 1,992,958 | | |
| Repurchase Agreement—11.3% | |
IBT Repurchase Agreement, 5.20% dated 3/30/2007
due 4/2/2007, repurchase price $25,918,086,
collateralized by Federal National Mortgage
Association Bonds, with rates of 5.670% - 5.820%,
with maturities from 3/25/2033 - 12/25/2035, and
with an aggregate market value plus accrued interest
of $27,202,203 | | $ | 25,906,860 | | | $ | 25,906,860 | | |
| Total Repurchase Agreement (Cost: $25,906,860) | | | | | 25,906,860 | | |
| Total Short Term Investments (Cost: $27,899,818) | | | | | 27,899,818 | | |
| Total Investments (Cost $226,306,569)—102.6% | | | | $ | 235,619,854 | | |
| Foreign Currencies (Cost $390,151)—0.2% | | | | $ | 390,039 | | |
| Other Liabilities In Excess Of Other Assets—(2.8%) | | | | | (6,438,048 | ) | |
| Total Net Assets—100% | | | | $ | 229,571,845 | | |
(a) Non-income producing security.
See accompanying Notes to Financial Statements.
THE OAKMARK GLOBAL SELECT FUND
34
THE OAKMARK INTERNATIONAL AND
OAKMARK INTERNATIONAL SMALL CAP FUNDS
Fellow Shareholders,
Both International Funds performed acceptably during the quarter that ended March 31, 2007. The return of market volatility this quarter did not concern us because, as long-term investors, we view instability as an opportunity to achieve better long-term results for our Funds. Please see the individual Fund letters for more specific performance information.
In Like a Bull, Out Like a Bear?
The strong global equity market of 2006 continued into the first six weeks of 2007. However, global markets began an abrupt sell-off in late February, triggered by a 9% decline in the Chinese market. Despite all of the panicky headlines, we view this as normal equity market behavior and continue to focus on finding value—searching for high quality businesses that sell at attractive prices. Market sell-offs actually help our quest because they provide us with more investment opportunities. Keep in mind that we strongly believe that the way to achieve investment success over time is to stay focused on the long term. We will continue to use periods of market volatility to try to enhance the attractiveness of our portfolios.
During the quarter we initiated hedges on the UK holdings in our Funds as we believe that the Sterling has appreciated above the range of its intrinsic valuation parameters as measured by purchase power parity and other economic fundamentals.
Japanese Corporate Governance and the Case of Nikko Cordial
One star performer in not only The Oakmark International Fund but also in both of our Global Funds was Nikko Cordial, a Japanese investment firm and the country's third largest brokerage firm. We invested in Nikko towards the end of 2006 after the share price had been hit exceptionally hard due to a relatively small accounting scandal that raised the possibility of the stock being de-listed from the Tokyo exchange. We believed that Nikko offered significantly higher return potential because, in addition to the company's exceptionally strong franchise, the Japanese investment sector presented a huge growth opportunity. This opportunity is the result of recent Japanese regulations that allowed investors to move savings from deposits that earned less than 1% to products and funds offered by Nikko that could offer significantly higher returns. Additionally, because those who were involved in the accounting scandal were fired, we estimated that i t was improbable that the stock would be de-listed.
Our hypotheses were mostly correct about the strength of Nikko's business and the Japanese exchange's action, and we correctly assumed that Citigroup, who owned approximately 5% of Nikko and runs a joint venture with them, would be interested in bidding for the company. As a result, Nikko's share price increased almost 25% for the quarter. We did not, however, anticipate that Nikko's management would seem more interested in pleasing Citigroup than in serving the other 95% of its shareholders. Sadly, once Citigroup expressed interest in buying the company, Nikko's management seemed to actively discourage other interested parties.
Time and time again I have written about Japanese boards' failure to focus on maximizing shareholder value. The Nikko case exemplifies why we have so much difficulty in finding Japanese stocks for our portfolios: generally speaking, the shareholders do not appear to be a high-ranking constituency in the eyes of corporate Japan. We have trimmed our position as a result of the share price's massive appreciation, but our preference at this time would be to stay on as Nikko shareholders given the unsatisfactory price that Citigroup is offering.
When searching for stocks in Japan, the world's largest equity market outside of the U.S., we continue to look for companies that are both cheap in price and have management teams that view building shareholder value as a key priority. Though there is an abundance of the former, the latter has proven to be more elusive.
As always, thanks for your continued support and confidence.
David G. Herro, CFA
Portfolio Manager
dherro@oakmark.com

THE OAKMARK INTERNATIONAL AND OAKMARK INTERNATIONAL SMALL CAP FUNDS
35
THE OAKMARK INTERNATIONAL FUND
Report from David G. Herro

THE VALUE OF A $10,000 INVESTMENT IN THE OAKMARK INTERNATIONAL FUND FROM ITS INCEPTION (9/30/92) TO PRESENT (3/31/07) AS COMPARED TO THE MSCI WORLD EX U.S. INDEX13

| | | | | Average Annual Total Returns
(as of 3/31/07) | |
| | | Total Return
Last 3 Months* | | 1-year | | 5-year | | 10-year | | Since
Inception
(9/30/92) | |
Oakmark International
Fund (Class I) | | | 4.91 | % | | | 24.37 | % | | | 16.12 | % | | | 12.06 | % | | | 13.84 | % | |
| MSCI World ex U.S. | | | 4.01 | % | | | 19.60 | % | | | 16.03 | % | | | 8.56 | % | | | 9.32 | % | |
| MSCI EAFE14 | | | 4.08 | % | | | 20.20 | % | | | 15.78 | % | | | 8.31 | % | | | 9.11 | % | |
Lipper International
Fund Index15 | | | 3.70 | % | | | 18.83 | % | | | 15.42 | % | | | 8.90 | % | | | 10.28 | % | |
The graph and table do not reflect the deduction of taxes that a shareholder would pay on fund distributions or the redemption of fund shares.
Expense Ratio as of 9/30/06 was 1.08%.
The performance data quoted represents past performance. The above performance information for the Fund does not reflect the imposition of a 2% redemption fee on shares held for 90 days or less to deter market timers. If reflected, the fee would reduce the performance quoted. Past performance does not guarantee future results. The investment return and principal value will fluctuate so that an investor's shares, when redeemed, may be worth more or less than their original cost. Current performance may be lower or higher than the performance data quoted. Average annual total return measures annualized change, while total return measures aggregate change. To obtain most recent month-end performance data, visit oakmark.com.
* Not annualized
The Oakmark International Fund returned 5% for the quarter ending March 31, 2007, which compares favorably to the MSCI World ex U.S. Index return of 4%. More importantly, since the Fund's inception in September 1992, it is up 14% per annum which again compares favorably with the MSCI World ex U.S. Index's return of 9% over the same period.
Impact Players
As mentioned in the lead International letter, Nikko Cordial was a star performer for the Fund and was also the quarter's largest contributor to return. The second largest contributor to return was DaimlerChrysler with its stock price gaining 32% for the quarter. The Mercedes division continues its progressive turnaround in manufacturing and quality improvements. However, much of the boost in price was caused by news that management began exploring sale or divestiture possibilities for its ailing Chrysler division. Although its fate remains unclear, we remain confident that management will act to create the most long-term value for the overall group. Rounding out the top three was long-term holding Cadbury Schweppes plc, a UK-based confectionary and beverage company. Most of the 20% increase in price followed the mid-March announcement that a leading hedge fund had taken interest in 3% of issued share capital, which generated market speculat ion that the company was a takeover target. Bowing to pressure led by the new hedge fund activist, Cadbury announced the spin-off of its North American beverage unit, the maker of Dr. Pepper and 7 Up.
SK Telecom Co., a leading telecommunication provider in South Korea, was the biggest performance detractor. The stock was negatively affected by profit declines caused by the company's decision to step up marketing spending in order to prevent market share losses in the increasingly competitive Korean market. Shares of Japanese security Rohm Co. also lagged during the quarter mostly due to an industry-wide weakness for semiconductor-related stocks. Our long-term outlook on the quality of these two businesses remains positive despite the lackluster short-term performance.
Portfolio Composition
During the quarter we sold our entire positions in Kao Corp., Lonza Group AG, Metro AG, and Michelin as they reached their respective sell targets. Samsung Electronics Co., a Korean manufacturer of consumer and industrial electronics equipment and products, was added to the portfolio towards the end of the quarter.
The portfolio composition remains relatively similar to last quarter, geographically speaking. We remain heavily weighted in the UK and Europe while our Japanese holdings remain underweight at 14% compared to the MSCI World ex U.S. weighting of 21%.
As long-term value investors, we continue to focus on finding attractive, under-valued foreign companies with management teams focused on building shareholder value.
David G. Herro, CFA
Portfolio Manager
dherro@oakmark.com | |
|
THE OAKMARK INTERNATIONAL FUND
36
THE OAKMARK INTERNATIONAL FUND
International Diversification—March 31, 2007 (Unaudited)
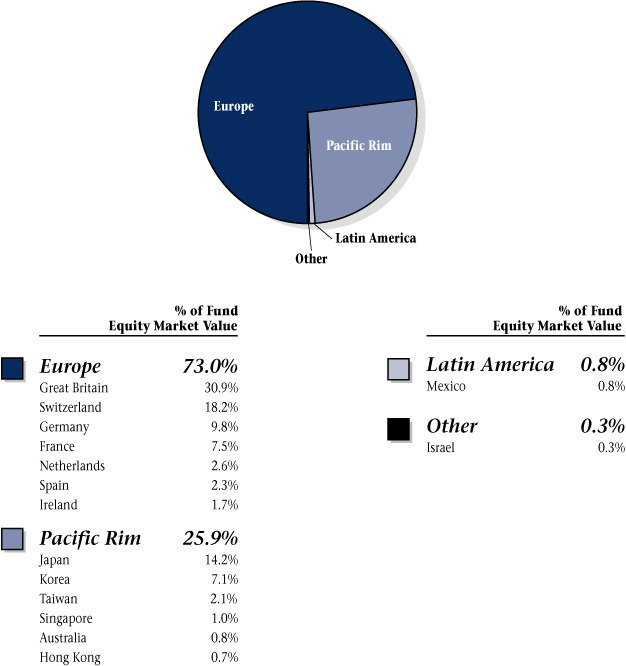
THE OAKMARK INTERNATIONAL FUND
37
THE OAKMARK INTERNATIONAL FUND
Schedule of Investments—March 31, 2007 (Unaudited)
Name | |
Description | |
Shares Held | |
Market Value | |
| Common Stocks—95.0% | |
| Advertising—2.0% | |
Publicis Groupe
(France) | | Advertising & Media Services | | | 3,745,500 | | | $ | 180,923,890 | | |
| Apparel Retail—0.6% | |
Giordano International
Limited
(Hong Kong) (a) | | Pacific Rim Clothing Retailer &
Manufacturer | | | 121,265,300 | | | $ | 58,975,893 | | |
| Apparel, Accessories & Luxury Goods—0.8% | |
Swatch Group AG,
Bearer Shares
(Switzerland) | | Watch Manufacturer | | | 268,100 | | | $ | 70,877,772 | | |
| Automobile Manufacturers—8.1% | |
DaimlerChrysler AG
(Germany) (b) | | Automobile Manufacturer | | | 4,421,400 | | | $ | 362,648,489 | | |
Bayerische Motoren
Werke (BMW)
AG (Germany) | | Luxury Automobile
Manufacturer | | | 4,901,000 | | | | 289,181,028 | | |
Honda Motor Co.,
Ltd. (Japan) | | Automobile & Motorcycle
Manufacturer | | | 2,790,000 | | | | 97,309,063 | | |
| | | | 749,138,580 | | |
| Broadcasting & Cable TV—7.1% | |
British Sky Broadcasting
Group plc
(Great Britain) | | Television Production &
Broadcasting | | | 25,124,300 | | | $ | 278,846,415 | | |
Gestevision Telecinco
SA (Spain) | | Television Production &
Broadcasting | | | 6,860,900 | | | | 198,241,833 | | |
Societe Television
Francaise 1 (France) | | Television Production &
Broadcasting | | | 3,438,000 | | | | 115,091,867 | | |
Grupo Televisa S.A.
(Mexico) (c) | | Television Production &
Broadcasting | | | 2,343,300 | | | | 69,830,340 | | |
| | | | 662,010,455 | | |
| Consumer Electronics—1.7% | |
Koninklijke (Royal)
Philips Electronics
N.V. (Netherlands) (b) | | Electronics Manufacturer | | | 4,213,300 | | | $ | 160,914,149 | | |
THE OAKMARK INTERNATIONAL FUND
38
THE OAKMARK INTERNATIONAL FUND
Schedule of Investments—March 31, 2007 (Unaudited) cont.
Name | |
Description | |
Shares Held | |
Market Value | |
| Common Stocks—95.0% (cont.) | |
| Movies & Entertainment—1.6% | |
Vivendi Universal SA
(France) | | Music, Games, Television,
Film, & Telecommunications | | | 3,572,300 | | | $ | 145,165,973 | | |
| Publishing—3.3% | |
Trinity Mirror plc
(Great Britain) (a) | | Newspaper Publishing | | | 17,792,038 | | | $ | 186,264,170 | | |
Johnston Press plc
(Great Britain) | | Newspaper Publishing | | | 13,392,300 | | | | 122,612,160 | | |
| | | | 308,876,330 | | |
| Restaurants—2.4% | |
Compass Group PLC
(Great Britain) | | International Foodservice
Group Operator | | | 33,783,000 | | | $ | 226,031,580 | | |
| Specialty Stores—2.7% | |
Signet Group PLC
(Great Britain) (a) | | Jewelry Retailer | | | 100,745,000 | | | $ | 248,805,066 | | |
| Distillers & Vintners—2.8% | |
| Diageo plc (Great Britain) | | Beverages, Wines, &
Spirits Manufacturer | | | 12,570,000 | | | $ | 254,655,828 | | |
| Household Products—1.5% | |
Uni-Charm Corporation
(Japan) | | Toiletry Products Manufacturer | | | 1,525,400 | | | $ | 96,567,244 | | |
| Henkel KGaA (Germany) | | Consumer Chemical Products
Manufacturer | | | 334,800 | | | | 44,885,265 | | |
| | | | 141,452,509 | | |
| Packaged Foods & Meats—4.2% | |
| Nestle SA (Switzerland) | | Food & Beverage Manufacturer | | | 521,000 | | | $ | 202,907,666 | | |
Cadbury Schweppes plc
(Great Britain) | | Beverage & Confectionary
Manufacturer | | | 14,531,000 | | | | 186,438,281 | | |
| | | | 389,345,947 | | |
| Soft Drinks—1.2% | |
Lotte Chilsung
Beverage Co.,
Ltd. (Korea) (a) | | Soft Drinks, Juices & Sports
Drinks Manufacturer | | | 88,635 | | | $ | 113,149,059 | | |
| Integrated Oil & Gas—0.3% | |
| Total SA (France) | | Oil & Natural Gas Exploration
and Production | | | 344,000 | | | $ | 24,102,474 | | |
THE OAKMARK INTERNATIONAL FUND
39
THE OAKMARK INTERNATIONAL FUND
Schedule of Investments—March 31, 2007 (Unaudited) cont.
Name | |
Description | |
Shares Held | |
Market Value | |
| Common Stocks—95.0% (cont.) | |
| Asset Management & Custody Banks—2.5% | |
Schroders PLC
(Great Britain) | | International Asset Management | | | 9,274,900 | | | $ | 231,430,440 | | |
| Diversified Banks—13.3% | |
HSBC Holdings plc
(Great Britain) | | International Banking &
Financial Services | | | 17,396,800 | | | $ | 304,514,035 | | |
Lloyds TSB Group plc
(Great Britain) | | Commercial Bank | | | 19,557,800 | | | | 215,526,174 | | |
Chinatrust Financial
Holding Co. (Taiwan) | | Commercial Bank | | | 233,188,318 | | | | 182,156,353 | | |
| Bank of Ireland (Ireland) | | Commercial Bank | | | 6,803,500 | | | | 146,778,556 | | |
| BNP Paribas SA (France) | | Commercial Bank | | | 1,327,000 | | | | 138,605,298 | | |
United Overseas Bank
Limited (Singapore) | | Commercial Bank | | | 6,507,368 | | | | 90,073,314 | | |
| Kookmin Bank (Korea) | | Commercial Bank | | | 975,000 | | | | 87,468,112 | | |
Australia and New Zealand
Banking Group Limited
(Australia) | | Commercial Bank | | | 2,876,300 | | | | 69,118,266 | | |
| | | | 1,234,240,108 | | |
| Diversified Capital Markets—6.8% | |
| UBS AG (Switzerland) | | Investment Banking | | | 5,939,900 | | | $ | 352,928,264 | | |
Credit Suisse Group
(Switzerland) | | Investment Services & Insurance | | | 3,837,400 | | | | 275,374,464 | | |
| | | | 628,302,728 | | |
| Insurance Brokers—0.5% | |
Willis Group Holdings
Limited (Great Britain) | | Consulting Services Provider | | | 1,086,000 | | | $ | 42,983,880 | | |
| Investment Banking & Brokerage—5.0% | |
Nikko Cordial Corporation
(Japan) | | Comprehensive Financial
Services Provider | | | 18,227,500 | | | $ | 260,326,566 | | |
Daiwa Securities Group,
Inc. (Japan) | | Stock Broker | | | 17,044,000 | | | | 205,818,160 | | |
| | | | 466,144,726 | | |
| Reinsurance—1.8% | |
Hannover
Rueckversicherung
AG (Germany) | | Reinsurance | | | 3,760,600 | | | $ | 167,536,977 | | |
THE OAKMARK INTERNATIONAL FUND
40
THE OAKMARK INTERNATIONAL FUND
Schedule of Investments—March 31, 2007 (Unaudited) cont.
Name | |
Description | |
Shares Held | |
Market Value | |
| Common Stocks—95.0% (cont.) | |
| Pharmaceuticals—8.7% | |
GlaxoSmithKline plc
(Great Britain) | | Pharmaceuticals | | | 12,756,000 | | | $ | 350,673,468 | | |
Novartis AG
(Switzerland) (d) | | Pharmaceuticals | | | 5,242,200 | | | | 286,381,388 | | |
Takeda Pharmaceutical
Company Limited
(Japan) | | Pharmaceuticals & Food
Supplements | | | 1,658,600 | | | | 108,799,881 | | |
| Sanofi-Aventis (France) | | Pharmaceuticals | | | 588,508 | | | | 51,178,913 | | |
| | | | 797,033,650 | | |
| Diversified Commercial & Professional Services—0.9% | |
Meitec Corporation
(Japan) (a) | | Software Engineering Services | | | 2,483,800 | | | $ | 80,095,383 | | |
| Human Resource & Employment Services—3.0% | |
| Adecco SA (Switzerland) | | Temporary Employment Services | | | 4,333,000 | | | $ | 275,102,621 | | |
| Electronic Equipment Manufacturers—0.9% | |
OMRON Corporation
(Japan) | | Component, Equipment, & System
Manufacturer | | | 1,995,100 | | | $ | 53,669,951 | | |
| Orbotech, Ltd. (Israel) (e) | | Optical Inspection Systems | | | 1,237,700 | | | | 27,266,531 | | |
| | | | 80,936,482 | | |
| Semiconductors—4.4% | |
Rohm Company Limited
(Japan) | | Integrated Circuits & Semiconductor
Devices Manufacturer | | | 3,076,979 | | | $ | 279,131,920 | | |
Samsung Electronics Co.,
Ltd. (Korea) | | Consumer & Industrial Electronic
Equipment Manufacturer | | | 221,500 | | | | 132,551,552 | | |
| | | | 411,683,472 | | |
| Diversified Chemicals—0.8% | |
Akzo Nobel N.V.
(Netherlands) | | Chemical Producer | | | 921,000 | | | $ | 69,943,570 | | |
| Fertilizers & Agricultural Chemicals—0.3% | |
Syngenta AG
(Switzerland) (e) | | Agricultural Chemicals | | | 162,500 | | | $ | 31,091,840 | | |
| Specialty Chemicals—1.2% | |
| Givaudan (Switzerland) | | Fragrance & Flavor Compound
Manufacturer | | | 114,700 | | | $ | 106,096,202 | | |
THE OAKMARK INTERNATIONAL FUND
41
THE OAKMARK INTERNATIONAL FUND
Schedule of Investments—March 31, 2007 (Unaudited) cont.
Name | |
Description | | Shares Held/
Par Value | |
Market Value | |
| Common Stocks—95.0% (cont.) | |
| Wireless Telecommunication Services—4.6% | |
SK Telecom Co., Ltd.
(Korea) | | Mobile Telecommunications | | | 1,371,112 | | | $ | 279,090,081 | | |
NTT DoCoMo, Inc.
(Japan) | | Mobile Telecommunications | | | 36,200 | | | | 66,968,771 | | |
Vodafone Group Plc
(Great Britain) | | Mobile Telecommunications | | | 20,137,062 | | | | 53,694,202 | | |
Vodafone Group Plc
(Great Britain) (c) | | Mobile Telecommunications | | | 530,250 | | | | 14,242,515 | | |
SK Telecom Co., Ltd.
(Korea) (c) | | Mobile Telecommunications | | | 405,100 | | | | 9,487,442 | | |
| | | | 423,483,011 | | |
| Total Common Stocks (Cost: $6,577,275,873) | | | | | | | | | 8,780,530,595 | | |
| Short Term Investments—4.2% | |
| U.S. Government Bills—1.6% | |
United States Treasury Bills, 5.07%-5.135%
due 4/19/2007 - 4/26/2007 | | $ | 150,000,000 | | | $ | 149,543,375 | | |
| Total U.S. Government Bills (Cost: $149,543,375) | | | | | 149,543,375 | | |
| Repurchase Agreement—2.6% | |
IBT Repurchase Agreement, 5.20% dated 3/30/2007
due 4/2/2007, repurchase price $235,912,342,
collateralized by Federal National Mortgage Association
Bonds, with rates of 4.282% - 5.870%, with maturities
from 9/25/2031 - 1/25/2036, and with an aggregate
market value plus accrued interest of $247,600,666 | | $ | 235,810,158 | | | $ | 235,810,158 | | |
| Total Repurchase Agreement (Cost: $235,810,158) | | | | | 235,810,158 | | |
| Total Short Term Investments (Cost: $385,353,533) | | | | | 385,353,533 | | |
| Total Investments (Cost $6,962,629,406)—99.2% | | | | $ | 9,165,884,128 | | |
| Foreign Currencies (Cost $1,320,634)—0.0% | | | | $ | 1,313,372 | | |
| Other Assets In Excess Of Other Liabilities—0.8% | | | | | 70,137,026 | | |
| Total Net Assets—100% | | | | $ | 9,237,334,526 | | |
(a) See footnote number five in the Notes to the Financial Statements regarding investments in affiliated issuers.
(b) All or a portion of security out on loan.
(c) Represents an American Depository Receipt.
(d) Market value is determined in accordance with procedures established in good faith by the Board of Trustees.
(e) Non-income producing security.
See accompanying Notes to Financial Statements.
THE OAKMARK INTERNATIONAL FUND
42
THE OAKMARK INTERNATIONAL
SMALL CAP FUND
Report from David G. Herro and Chad M. Clark, Portfolio Managers


THE VALUE OF A $10,000 INVESTMENT IN THE OAKMARK INTERNATIONAL SMALL CAP FUND FROM ITS INCEPTION (11/1/95) TO PRESENT (3/31/07) AS COMPARED TO THE MSCI WORLD EX U.S. INDEX13
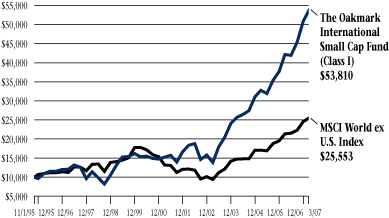
| | | | | Average Annual Total Returns
(as of 3/31/07) | |
| | | Total Return
Last 3 Months* | | 1-year | | 5-year | | 10-year | | Since
Inception
(11/1/95) | |
Oakmark International
Small Cap Fund
(Class I) | | | 5.81 | % | | | 27.60 | % | | | 23.98 | % | | | 16.11 | % | | | 15.89 | % | |
| MSCI World ex U.S. | | | 4.01 | % | | | 19.60 | % | | | 16.03 | % | | | 8.56 | % | | | 8.56 | % | |
MSCI World ex U.S.
Small Cap16 | | | 7.27 | % | | | 15.70 | % | | | 23.94 | % | | | N/A | | | | N/A | | |
Lipper International
Small Cap Index17 | | | 6.77 | % | | | 20.64 | % | | | 24.61 | % | | | 13.98 | % | | | N/A | | |
The graph and table do not reflect the deduction of taxes that a shareholder would pay on fund distributions or the redemption of fund shares.
Expense Ratio as of 9/30/06 was 1.37%.
The performance data quoted represents past performance. The above performance information for the Fund does not reflect the imposition of a 2% redemption fee on shares held for 90 days or less to deter market timers. If reflected, the fee would reduce the performance quoted. Past performance does not guarantee future results. The investment return and principal value will fluctuate so that an investor's shares, when redeemed, may be worth more or less than their original cost. Current performance may be lower or higher than the performance data quoted. Average annual total return measures annualized change, while total return measures aggregate change. To obtain most recent month-end performance data, visit oakmark.com.
* Not annualized
The Oakmark International Small Cap Fund gained 6% for the quarter ending March 31, 2007, compared to the MSCI World ex U.S. Index that returned 4% and the MSCI World ex U.S. Small Cap Index that returned 7%. More importantly, however, for the past twelve months and since inception, your Fund is up 28% and 16% respectively, outpacing the MSCI World ex U.S. Index, which returned 20% and 9%.
Impact Players
MLP, one of Germany's largest independent financial advisors (IFAs), was the Fund's largest contributor as the stock price rose 26% in the quarter. Germany is an attractive market as there is a shift from long-term government savings programs to individuals and corporate retirement plans. IFA growth in Germany is industry wide. There is a new head of sales at MLP who should help drive growth. He compliments the CEO and CFO, who have been very proactive in selling off non-core businesses and returning excess funds to shareholders. We anticipate another share repurchase this year after an 8% buyback in 2006. Veda Advantage, the biggest credit-checking company in Australia and New Zealand rose 29% in the quarter. Shares were up as talks of a buyout continued. Julius Baer, Switzerland's largest independent money manger, was another large contributor for the quarter as the share price rose 24% fueled by a strong Swiss market. Expansion in Asia an d sizeable asset growth in the second-half of 2006 helped increase profits by 44%.
South Korean Daekyo Co., a study guide provider for elementary and pre-schools, was the largest detractor to performance in the quarter. Daekyo raised prices on its educational materials at the beginning of the year, which caused subscriptions to decline. Nevertheless, non-core operations continue to improve from losses and Daekyo's large holding in Shinhan Financial Group has increased in value by 15% in the quarter. Daekyo remains a very cheap stock trading at a mid-single-digit EBIT multiple after adjusting for its financial investments.
Portfolio Composition
The Fund exited many positions that had reached their fair values in the quarter, including Alsea, Tandberg, Britvic, and Robert Walters. New ideas generated in the quarter include Titan Cement, a Greek cement company, Pasona, a Japanese temporary agency, USS Co., which manages used car auction facilities throughout Japan, Observer, a Swedish communication company, and Enodis, a UK holding company whose subsidiaries sell commercial food equipment.
THE OAKMARK INTERNATIONAL SMALL CAP FUND
43
Geographically, our portfolio weightings remain similar to last quarter. Europe and the UK represent approximately 60% of investments, and the majority of the balance excluding cash is invested in the Pacific Rim. With the addition of the two new Japanese names our weighting increased to 13% still well below the MSCI World ex U.S. Index weighting of 21%.
We continue to own names that we believe have demonstrated a consistent ability to grow value per share over time. We thank you for your continued support.
David G. Herro, CFA
Portfolio Manager
dherro@oakmark.com | | Chad M. Clark, CFA
Portfolio Manager
cclark@oakmark.com | |
|
THE OAKMARK INTERNATIONAL SMALL CAP FUND
44
THE OAKMARK INTERNATIONAL SMALL CAP FUND
International Diversification—March 31, 2007 (Unaudited)
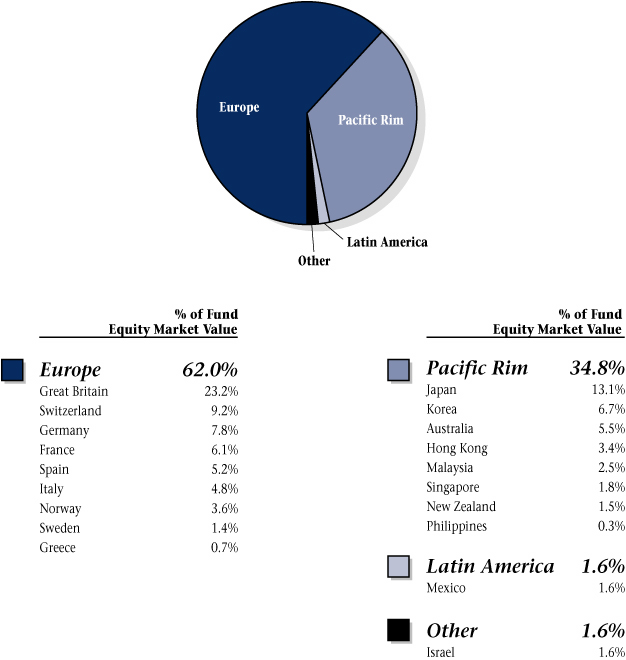
THE OAKMARK INTERNATIONAL SMALL CAP FUND
45
THE OAKMARK INTERNATIONAL SMALL CAP FUND
Schedule of Investments—March 31, 2007 (Unaudited)
Name | |
Description | |
Shares Held | |
Market Value | |
| Common Stocks—96.4% | |
| Advertising—1.2% | |
| Asatsu-DK, Inc. (Japan) | | Advertising Services Provider | | | 554,700 | | | $ | 17,510,896 | | |
| Apparel, Accessories & Luxury Goods—2.2% | |
| Bulgari S.p.A. (Italy) | | Jewelry Manufacturer & Retailer | | | 2,312,000 | | | $ | 33,386,525 | | |
| Automotive Retail—2.3% | |
| USS Co., Ltd. (Japan) | | Used Car Auction Facility Manager | | | 518,700 | | | $ | 33,849,313 | | |
| Auto Parts & Equipment—3.0% | |
Kongsberg Automotive
ASA (Norway) (a) | | Auto Parts & Equipment
Manufacturer | | | 3,527,500 | | | $ | 31,338,532 | | |
Wagon PLC
(Great Britain) | | Auto Parts & Equipment
Manufacturer | | | 4,762,600 | | | | 12,628,881 | | |
| | | | 43,967,413 | | |
| Broadcasting & Cable TV—6.9% | |
| Sogecable SA (Spain) (b) | | Cable Television Services | | | 1,305,400 | | | $ | 54,163,005 | | |
Media Prima Berhad
(Malaysia) (a) | | Film Producer & Sports Promoter | | | 50,212,300 | | | | 36,016,342 | | |
M6 Metropole
Television (France) | | Television Entertainment
Channel Owner & Operator | | | 356,500 | | | | 13,058,241 | | |
| | | | 103,237,588 | | |
| Home Improvement Retail—2.8% | |
Carpetright plc
(Great Britain) | | Carpet Retailer | | | 1,827,200 | | | $ | 41,817,474 | | |
| Movies & Entertainment—1.4% | |
CTS Eventim AG
(Germany) | | Entertainment Tickets Producer &
Distributor | | | 528,000 | | | $ | 20,412,216 | | |
| Photographic Products—2.2% | |
Vitec Group plc
(Great Britain) (a) | | Photo Equipment & Supplies | | | 2,780,379 | | | $ | 32,499,931 | | |
| Publishing—5.4% | |
| Daekyo Co., Ltd. (Korea) | | Educational Information
Service Provider | | | 407,900 | | | $ | 34,945,515 | | |
SCMP Group, Ltd.
(Hong Kong) | | Newspaper Publisher &
Distributor | | | 67,095,000 | | | | 24,215,511 | | |
Tamedia AG
(Switzerland) | | TV Broadcasting & Publishing | | | 156,000 | | | | 21,182,570 | | |
| | | | 80,343,596 | | |
THE OAKMARK INTERNATIONAL SMALL CAP FUND
46
THE OAKMARK INTERNATIONAL SMALL CAP FUND
Schedule of Investments—March 31, 2007 (Unaudited) cont.
Name | |
Description | |
Shares Held | |
Market Value | |
| Common Stocks—96.4% (cont.) | |
| Specialty Stores—2.0% | |
JJB Sports plc
(Great Britain) | | Sportswear & Sports Equipment
Retailer | | | 6,129,294 | | | $ | 30,304,597 | | |
| Textiles—1.9% | |
Chargeurs SA
(France) (a) (b) | | Wool, Textile Production &
Trading | | | 790,182 | | | $ | 27,866,906 | | |
| Distillers & Vintners—0.7% | |
Baron de Ley, S.A.
(Spain) (b) | | Beverages, Wines, & Spirits
Manufacturer | | | 146,700 | | | $ | 9,700,475 | | |
| Household Products—1.5% | |
Kimberly-Clark de
Mexico S.A.B. de C.V.
(Mexico) | | Hygiene Products Manufacturer,
Marketer & Distributor | | | 5,027,200 | | | $ | 22,671,530 | | |
| Packaged Foods & Meats—4.4% | |
Lotte Confectionery
Co., Ltd. (Korea) | | Candy & Snacks Manufacturer | | | 30,231 | | | $ | 38,720,615 | | |
Binggrae Co., Ltd.
(Korea) (a) | | Dairy Products Manufacturer | | | 535,090 | | | | 22,409,169 | | |
Alaska Milk Corporation
(Philippines) (a) | | Milk Producer | | | 56,360,000 | | | | 4,497,120 | | |
| | | | 65,626,904 | | |
| Asset Management & Custody Banks—6.8% | |
| MLP AG (Germany) | | Asset Management | | | 2,352,075 | | | $ | 58,944,284 | | |
Julius Baer Holding
AG (Switzerland) | | Asset Management | | | 306,600 | | | | 41,833,749 | | |
| | | | 100,778,033 | | |
| Investment Banking & Brokerage—1.8% | |
Ichiyoshi Securities
Co., Ltd. (Japan) | | Stock Broker | | | 1,696,600 | | | $ | 27,240,048 | | |
| Multi-Sector Holdings—1.5% | |
Pargesa Holding AG
(Switzerland) | | Diversified Operations | | | 215,400 | | | $ | 22,600,913 | | |
| Reinsurance—3.4% | |
Benfield Group Ltd.
(Great Britain) | | Reinsurance Service Provider | | | 7,927,500 | | | $ | 50,583,424 | | |
THE OAKMARK INTERNATIONAL SMALL CAP FUND
47
THE OAKMARK INTERNATIONAL SMALL CAP FUND
Schedule of Investments—March 31, 2007 (Unaudited) cont.
Name | |
Description | |
Shares Held | |
Market Value | |
| Common Stocks—96.4% (cont.) | |
| Health Care Distributors—1.3% | |
Australian Pharmaceutical
Industries Limited
(Australia) | | Pharmaceutical Products
Distributor | | | 11,507,000 | | | $ | 19,551,659 | | |
| Health Care Supplies—1.7% | |
| Ansell Limited (Australia) | | Protective Rubber &
Plastics Products | | | 1,526,900 | | | $ | 14,330,812 | | |
Medisize Holding AG
(Switzerland) | | Medical & Dental Applications
Holding Company | | | 140,000 | | | | 10,207,793 | | |
| | | | 24,538,605 | | |
| Pharmaceuticals—0.4% | |
Santen Pharmaceutical
Co., Ltd. (Japan) | | Pharmaceuticals | | | 245,100 | | | $ | 6,302,215 | | |
| Air Freight & Logistics—1.5% | |
Freightways Limited
(New Zealand) | | Express Package Services | | | 4,384,393 | | | $ | 13,624,162 | | |
Mainfreight Limited
(New Zealand) | | Logistics Services | | | 1,606,200 | | | | 8,375,940 | | |
| | | | 22,000,102 | | |
| Diversified Commercial & Professional Services—2.0% | |
Intrum Justitia AB
(Sweden) | | Diversified Financial Services | | | 1,332,943 | | | $ | 17,943,610 | | |
Prosegur, Compania
de Seguridad SA (Spain) | | Security & Transportation Services | | | 292,000 | | | | 11,074,036 | | |
| Observer AB (Sweden) (b) | | Business & Communication
Intelligence | | | 286,500 | | | | 1,300,632 | | |
| | | | 30,318,278 | | |
| Human Resource & Employment Services—1.3% | |
| Pasona, Inc. (Japan) | | Placement Service Provider | | | 8,869 | | | $ | 18,740,504 | | |
| Industrial Conglomerates—4.1% | |
Tomkins plc
(Great Britain) | | International Manufacturing | | | 5,079,000 | | | $ | 26,685,876 | | |
Haw Par Corporation
Limited (Singapore) | | Diversified Operations | | | 5,508,687 | | | | 26,142,798 | | |
Rheinmetall AG
(Germany) | | Automotive Pump Manufacturer | | | 82,700 | | | | 7,666,951 | | |
| | | | 60,495,625 | | |
THE OAKMARK INTERNATIONAL SMALL CAP FUND
48
THE OAKMARK INTERNATIONAL SMALL CAP FUND
Schedule of Investments—March 31, 2007 (Unaudited) cont.
Name | |
Description | |
Shares Held | |
Market Value | |
| Common Stocks—96.4% (cont.) | |
| Industrial Machinery—8.9% | |
| Enodis plc (Great Britain) | | Food Processing Equipment | | | 8,865,450 | | | $ | 35,894,889 | | |
Interpump Group
S.p.A. (Italy) | | Pump & Piston Manufacturer | | | 3,202,700 | | | | 35,809,595 | | |
Domino Printing
Sciences plc
(Great Britain) | | Printing Equipment | | | 4,570,800 | | | | 32,560,629 | | |
Schindler Holding AG
(Switzerland) | | Escalator & Elevator Manufacturer | | | 334,000 | | | | 20,614,739 | | |
Pfeiffer Vacuum
Technology AG
(Germany) | | Vacuum Pump Manufacturer | | | 79,800 | | | | 7,263,781 | | |
| LISI (France) | | Industrial Fastener Manufacturer | | | 2,900 | | | | 261,880 | | |
| | | | 132,405,513 | | |
| Application Software—1.0% | |
| Lectra (France) (a) | | Manufacturing Process Systems | | | 1,709,779 | | | $ | 14,412,092 | | |
| Data Processing & Outsourced Services—3.0% | |
Veda Advantage
Limited (Australia) (a) | | Credit Reference Services | | | 17,001,000 | | | $ | 45,118,070 | | |
| Electronic Equipment Manufacturers—5.6% | |
Spectris Plc
(Great Britain) Electronic Component
Manufacturer, Designer & | |
Marketer | | | 1,539,300 | | | $ | 26,656,181 | | |
| Orbotech, Ltd. (Israel) (b) | | Optical Inspection Systems | | | 1,018,900 | | | | 22,446,367 | | |
Citizen Watch Co.,
Ltd. (Japan) | | Watch & Machine Tool
Producer & Seller | | | 2,075,000 | | | | 19,475,136 | | |
Mabuchi Motor Co.,
Ltd. (Japan) | | Digital Camera Motors
Manufacturer | | | 235,900 | | | | 14,593,610 | | |
| | | | 83,171,294 | | |
| Home Entertainment Software—2.5% | |
Square Enix Co.,
Ltd. (Japan) | | Entertainment Software | | | 1,447,400 | | | $ | 37,339,579 | | |
| IT Consulting & Other Services—3.3% | |
Morse plc
(Great Britain) (a) | | Business & Technology Solutions | | | 15,231,000 | | | $ | 27,799,330 | | |
Ementor ASA
(Norway) (b) | | Management & IT Consulting
Services | | | 2,325,000 | | | | 20,368,565 | | |
| | | | 48,167,895 | | |
THE OAKMARK INTERNATIONAL SMALL CAP FUND
49
THE OAKMARK INTERNATIONAL SMALL CAP FUND
Schedule of Investments—March 31, 2007 (Unaudited) cont.
Name | |
Description | | Shares Held/
Par Value | |
Market Value | |
| Common Stocks—96.4% (cont.) | |
| Office Electronics—3.2% | |
| Neopost SA (France) | | Mailroom Equipment Supplier | | | 220,700 | | | $ | 31,545,964 | | |
Boewe Systec AG
(Germany) | | Automated Paper Management
Systems Producer | | | 269,000 | | | | 16,777,755 | | |
| | | | 48,323,719 | | |
| Construction Materials—0.6% | |
Titan Cement Co. SA
(Greece) | | Cement & Building Materials
Producer & Distributor | | | 177,000 | | | $ | 9,552,396 | | |
| Specialty Chemicals—2.9% | |
Croda International plc
(Great Britain) | | Chemical Producer | | | 1,213,800 | | | $ | 15,239,117 | | |
Gurit Holding AG
(Switzerland) | | Chemical Producer | | | 14,407 | | | | 14,464,502 | | |
Taiyo Ink Mfg. Co.,
Ltd. (Japan) | | Manufacturer of Resist Inks | | | 436,000 | | | | 12,949,762 | | |
| | | | 42,653,381 | | |
| Alternative Carriers—1.7% | |
Asia Satellite
Telecommunications
Holdings Limited
(Hong Kong) | | Satellite Operator | | | 10,903,800 | | | $ | 24,672,578 | | |
| Total Common Stocks (Cost: $1,035,139,875) | | | | | | | | | 1,432,161,287 | | |
| Short Term Investments—4.2% | |
| U.S. Government Bills—1.7% | |
United States Treasury Bills, 5.07%-5.135%
due 4/19/2007 - 4/26/2007 | | | | $ | 25,000,000 | | | $ | 24,949,178 | | |
| Total U.S. Government Bills (Cost: $24,949,178) | | | | | | | | | 24,949,178 | | |
THE OAKMARK INTERNATIONAL SMALL CAP FUND
50
THE OAKMARK INTERNATIONAL SMALL CAP FUND
Schedule of Investments—March 31, 2007 (Unaudited) cont.
Name | | Par Value | |
Market Value | |
| Short Term Investments—4.2% (cont.) | |
| Repurchase Agreement—2.5% | |
IBT Repurchase Agreement, 5.20% dated 3/30/2007
due 4/2/2007, repurchase price $36,912,728,
collateralized by Federal National Mortgage
Association Bonds, with rates of 5.620% - 6.855%,
with maturities from 3/1/2029 - 8/25/2034, and
with an aggregate market value plus accrued
interest of $38,741,576 | | $ | 36,896,739 | | | $ | 36,896,739 | | |
| Total Repurchase Agreement (Cost: $36,896,739) | | | | | 36,896,739 | | |
| Total Short Term Investments (Cost: $61,845,917) | | | | | 61,845,917 | | |
| Total Investments (Cost $1,096,985,792)—100.6% | | | | $ | 1,494,007,204 | | |
| Foreign Currencies (Cost $3,661,854)—0.2% | | | | $ | 3,672,651 | | |
| Other Liabilities In Excess Of Other Assets—(0.8%) | | | | | (11,882,627 | ) | |
| Total Net Assets—100% | | | | $ | 1,485,797,228 | | |
(a) See footnote number five in the Notes to the Financial Statements regarding investments in affiliated issuers.
(b) Non-income producing security.
See accompanying Notes to Financial Statements.
THE OAKMARK INTERNATIONAL SMALL CAP FUND
51
THE OAKMARK FUNDS
Statements of Assets and Liabilities—March 31, 2007 (Unaudited)
| | | | | The Oakmark
Fund | | The Oakmark
Select
Fund | | The Oakmark
Equity and
Income Fund | |
| Assets | |
| Investments in unaffiliated securities, at value | | (a) | | $ | 5,837,287,095 | | | $ | 5,592,980,085 | | | $ | 12,063,426,049 | | |
| Investments in affiliated securities, at value | | (b) | | | 0 | | | | 244,862,880 | | | | 292,435,503 | | |
| Cash | | | | | 0 | | | | 0 | | | | 0 | | |
| Foreign currency, at value | | (c) | | | 0 | | | | 0 | | | | 0 | | |
| Receivable for: | |
| Securities sold | | | | | 0 | | | | 25,950,731 | | | | 0 | | |
| Fund shares sold | | | | | 4,840,118 | | | | 7,438,813 | | | | 20,891,741 | | |
| Dividends and interest | | | | | 6,990,835 | | | | 2,378,795 | | | | 67,579,135 | | |
| Forward foreign currency contracts | | | | | 0 | | | | 0 | | | | 0 | | |
| Tax reclaim | | | | | 118,623 | | | | 0 | | | | 80,151 | | |
| Total receivables | | | | | 11,949,576 | | | | 35,768,339 | | | | 88,551,027 | | |
| Other assets | | | | | 88,885 | | | | 90,684 | | | | 160,603 | | |
| Total assets | | | | $ | 5,849,325,556 | | | $ | 5,873,701,988 | | | $ | 12,444,573,182 | | |
| Liabilities and Net Assets | |
| Payable for: | |
| Securities purchased | | | | $ | 0 | | | $ | 0 | | | $ | 49,492,460 | | |
| Fund shares redeemed | | | | | 4,188,837 | | | | 4,354,159 | | | | 12,593,209 | | |
| Forward currency exchange contracts | | | | | 0 | | | | 0 | | | | 0 | | |
| Dividends | | | | | 0 | | | | 0 | | | | 26,260 | | |
| Investment advisory fee | | | | | 285,369 | | | | 270,002 | | | | 463,524 | | |
| Transfer and dividend disbursing agent fees | | | | | 341,633 | | | | 220,264 | | | | 247,046 | | |
| Trustee fee | | | | | 34,411 | | | | 34,880 | | | | 51,889 | | |
| Deferred trustee compensation | | | | | 1,146,553 | | | | 1,009,560 | | | | 920,699 | | |
| Other | | | | | 1,331,589 | | | | 1,457,339 | | | | 3,002,977 | | |
| Total liabilities | | | | | 7,328,392 | | | | 7,346,204 | | | | 66,798,064 | | |
| Net assets applicable to Fund shares outstanding | | | | $ | 5,841,997,164 | | | $ | 5,866,355,784 | | | $ | 12,377,775,118 | | |
| Analysis of Net Assets | |
| Paid in capital | | | | $ | 3,909,269,124 | | | $ | 3,873,513,363 | | | $ | 9,886,438,631 | | |
Accumulated undistributed net realized gain (loss) of investments, forward
contracts, options, short sales and foreign currency transactions | | | | | 154,655,953 | | | | 205,502,407 | | | | 40,260,429 | | |
| Net unrealized appreciation (depreciation) of investments and foreign currencies | | | | | 1,747,088,981 | | | | 1,774,452,855 | | | | 2,360,985,195 | | |
| Net unrealized appreciation (depreciation)—other | | | | | 7,930 | | | | 0 | | | | 70,541 | | |
| Accumulated undistributed net investment income (loss) | | | | | 30,975,176 | | | | 12,887,159 | | | | 90,020,322 | | |
| Net assets applicable to Fund shares outstanding | | | | $ | 5,841,997,164 | | | $ | 5,866,355,784 | | | $ | 12,377,775,118 | | |
| Price of Shares | |
| Net asset value per share: Class I | | | | $ | 45.80 | | | $ | 32.77 | | | $ | 26.71 | | |
| Class I—Net assets | | | | $ | 5,805,768,897 | | | $ | 5,809,947,080 | | | $ | 11,542,774,067 | | |
| Class I—Shares outstanding (Unlimited shares authorized) | | | | | 126,753,085 | | | | 177,288,706 | | | | 432,082,336 | | |
| Net asset value per share: Class II | | | | $ | 45.58 | | | $ | 32.60 | | | $ | 26.60 | | |
| Class II—Net assets | | | | $ | 36,228,267 | | | $ | 56,408,704 | | | $ | 835,001,051 | | |
| Class II—Shares outstanding (Unlimited shares authorized) | | | | | 794,795 | | | | 1,730,555 | | | | 31,395,016 | | |
| (a) Identified cost of investments in unaffiliated securities | | | | $ | 4,090,198,114 | | | $ | 4,020,592,692 | | | $ | 9,808,199,909 | | |
| (b) Identified cost of investments in affiliated securities | | | | | 0 | | | | 42,797,418 | | | | 186,676,448 | | |
| (c) Identified cost of foreign currency | | | | | 0 | | | | 0 | | | | 0 | | |
THE OAKMARK FUNDS
52
| | | The Oakmark
Global
Fund | | The Oakmark
Global Select
Fund | | The Oakmark
International
Fund | | The Oakmark
International
Small Cap Fund | |
| Assets | |
| Investments in unaffiliated securities, at value | | $ | 2,866,800,034 | | | $ | 235,619,854 | | | $ | 8,478,594,557 | | | $ | 1,252,049,712 | | |
| Investments in affiliated securities, at value | | | 0 | | | | 0 | | | | 687,289,571 | | | | 241,957,492 | | |
| Cash | | | 0 | | | | 0 | | | | 25 | | | | 0 | | |
| Foreign currency, at value | | | 1,877,073 | | | | 390,039 | | | | 1,313,372 | | | | 3,672,651 | | |
| Receivable for: | |
| Securities sold | | | 3,722,350 | | | | 0 | | | | 43,564,268 | | | | 3,837,328 | | |
| Fund shares sold | | | 3,743,498 | | | | 4,442,074 | | | | 25,069,961 | | | | 1,211,509 | | |
| Dividends and interest | | | 4,734,504 | | | | 523,057 | | | | 35,636,283 | | | | 3,352,567 | | |
| Forward foreign currency contracts | | | 0 | | | | 0 | | | | 397,258 | | | | 27,422 | | |
| Tax reclaim | | | 474,708 | | | | 0 | | | | 991,350 | | | | 625,924 | | |
| Total receivables | | | 12,675,060 | | | | 4,965,131 | | | | 105,659,120 | | | | 9,054,750 | | |
| Other assets | | | 105,880 | | | | 58,584 | | | | 303,200 | | | | 51,796 | | |
| Total assets | | $ | 2,881,458,047 | | | $ | 241,033,608 | | | $ | 9,273,159,845 | | | $ | 1,506,786,401 | | |
| Liabilities and Net Assets | |
| Payable for: | |
| Securities purchased | | $ | 28,936,992 | | | $ | 11,285,406 | | | $ | 26,788,224 | | | $ | 19,524,917 | | |
| Fund shares redeemed | | | 1,166,157 | | | | 25,697 | | | | 5,360,474 | | | | 562,909 | | |
| Forward currency exchange contracts | | | 2,519 | | | | 6,249 | | | | 0 | | | | 0 | | |
| Dividends | | | 0 | | | | 0 | | | | 0 | | | | 0 | | |
| Investment advisory fee | | | 144,731 | | | | 9,839 | | | | 412,759 | | | | 88,750 | | |
| Transfer and dividend disbursing agent fees | | | 99,620 | | | | 9,300 | | | | 175,068 | | | | 28,211 | | |
| Trustee fee | | | 24,068 | | | | 16,368 | | | | 42,143 | | | | 20,241 | | |
| Deferred trustee compensation | | | 478,483 | | | | 15,070 | | | | 795,269 | | | | 457,818 | | |
| Other | | | 620,593 | | | | 93,834 | | | | 2,251,382 | | | | 306,327 | | |
| Total liabilities | | | 31,473,163 | | | | 11,461,763 | | | | 35,825,319 | | | | 20,989,173 | | |
| Net assets applicable to Fund shares outstanding | | $ | 2,849,984,884 | | | $ | 229,571,845 | | | $ | 9,237,334,526 | | | $ | 1,485,797,228 | | |
| Analysis of Net Assets | |
| Paid in capital | | $ | 2,073,362,889 | | | $ | 217,546,332 | | | $ | 6,394,688,247 | | | $ | 981,008,947 | | |
Accumulated undistributed net realized gain (loss) of investments, forward
contracts, options, short sales and foreign currency transactions | | | 98,357,518 | | | | 2,283,837 | | | | 617,252,797 | | | | 120,208,223 | | |
| Net unrealized appreciation (depreciation) of investments and foreign currencies | | | 678,887,779 | | | | 9,302,744 | | | | 2,203,715,106 | | | | 397,074,044 | | |
| Net unrealized appreciation (depreciation)—other | | | (18,438 | ) | | | 4,083 | | | | 288,797 | | | | 8,237 | | |
| Accumulated undistributed net investment income (loss) | | | (604,864 | ) | | | 434,849 | | | | 21,389,579 | | | | (12,502,223 | ) | |
| Net assets applicable to Fund shares outstanding | | $ | 2,849,984,884 | | | $ | 229,571,845 | | | $ | 9,237,334,526 | | | $ | 1,485,797,228 | | |
| Price of Shares | |
| Net asset value per share: Class I | | $ | 26.54 | | | $ | 11.18 | | | $ | 26.70 | | | $ | 24.22 | | |
| Class I—Net assets | | $ | 2,762,109,207 | | | $ | 229,571,845 | | | $ | 8,582,269,631 | | | $ | 1,484,705,047 | | |
| Class I—Shares outstanding (Unlimited shares authorized) | | | 104,058,817 | | | | 20,526,159 | | | | 321,477,596 | | | | 61,312,461 | | |
| Net asset value per share: Class II | | $ | 26.16 | | | $ | 0.00 | | | $ | 26.48 | | | $ | 24.18 | | |
| Class II—Net assets | | $ | 87,875,677 | | | $ | 0 | | | $ | 655,064,895 | | | $ | 1,092,181 | | |
| Class II—Shares outstanding (Unlimited shares authorized) | | | 3,359,733 | | | | 0 | | | | 24,734,175 | | | | 45,172 | | |
| (a) Identified cost of investments in unaffiliated securities | | $ | 2,187,922,767 | | | $ | 226,306,569 | | | $ | 6,462,914,215 | | | $ | 921,636,045 | | |
| (b) Identified cost of investments in affiliated securities | | | 0 | | | | 0 | | | | 499,715,191 | | | | 175,349,747 | | |
| (c) Identified cost of foreign currency | | | 1,877,571 | | | | 390,151 | | | | 1,320,634 | | | | 3,661,854 | | |
See accompanying Notes to Financial Statements.
THE OAKMARK FUNDS
53
THE OAKMARK FUNDS
Statements of Operations—March 31, 2007 (Unaudited)
| | | The Oakmark
Fund | | The Oakmark
Select
Fund | | The Oakmark
Equity and
Income Fund | | The Oakmark
Global
Fund | |
| Investment Income: | |
| Dividends from unaffiliated securities | | $ | 53,163,873 | | | $ | 61,256,192 | | | $ | 69,047,195 | | | $ | 18,359,912 | | |
| Dividends from affiliated securities | | | 0 | | | | 696,225 | | | | 315,085 | | | | 0 | | |
| Interest income | | | 8,844,634 | | | | 7,089,657 | | | | 109,813,041 | | | | 1,202,216 | | |
| Securities lending income | | | 0 | | | | 0 | | | | 513,691 | | | | 44,316 | | |
| Other income | | | 38,370 | | | | 65,073 | | | | 88,930 | | | | 0 | | |
| Foreign taxes withheld | | | 0 | | | | 0 | | | | (292,500 | ) | | | (721,325 | ) | |
| Total investment income | | | 62,046,877 | | | | 69,107,147 | | | | 179,485,442 | | | | 18,885,119 | | |
| Expenses: | |
| Investment advisory fee | | | 25,773,205 | | | | 25,763,742 | | | | 41,325,239 | | | | 12,806,512 | | |
| Transfer and dividend disbursing agent fees | | | 942,792 | | | | 610,988 | | | | 687,450 | | | | 282,322 | | |
| Other shareholder servicing fees | | | 2,154,603 | | | | 2,222,868 | | | | 5,510,760 | | | | 753,674 | | |
| Service Fee—Class II | | | 48,091 | | | | 82,274 | | | | 955,017 | | | | 106,817 | | |
| Reports to shareholders | | | 412,083 | | | | 392,976 | | | | 621,734 | | | | 167,184 | | |
| Custody and accounting fees | | | 342,120 | | | | 311,411 | | | | 760,756 | | | | 657,738 | | |
| Registration and blue sky expenses | | | 0 | | | | 0 | | | | 126,538 | | | | 50,550 | | |
| Trustee fees | | | 209,498 | | | | 198,123 | | | | 243,555 | | | | 117,950 | | |
| Legal fees | | | 52,866 | | | | 53,961 | | | | 78,897 | | | | 40,285 | | |
| Audit fees | | | 25,503 | | | | 26,395 | | | | 38,869 | | | | 19,080 | | |
| Amortization of organization expenses | | | 0 | | | | 0 | | | | 0 | | | | 0 | | |
| Insurance | | | 0 | | | | 0 | | | | 0 | | | | 0 | | |
| Other | | | 65,775 | | | | 146,258 | | | | 258,220 | | | | 119,642 | | |
| Total expenses | | | 30,026,536 | | | | 29,808,996 | | | | 50,607,035 | | | | 15,121,754 | | |
| Expense offset arrangements | | | 0 | | | | (193 | ) | | | 0 | | | | 0 | | |
| Net expenses | | | 30,026,536 | | | | 29,808,803 | | | | 50,607,035 | | | | 15,121,754 | | |
| Net Investment Income: | | | 32,020,341 | | | | 39,298,344 | | | | 128,878,407 | | | | 3,763,365 | | |
Net realized and unrealized gain (loss) on
investments and foreign currency transactions: | |
| Net realized gain (loss) on unaffiliated securities | | | 177,682,062 | | | | 176,233,426 | | | | 61,647,035 | | | | 141,783,666 | | |
| Net realized gain (loss) on affiliated securities | | | 0 | | | | 41,804,669 | | | | (1,874,809 | ) | | | 0 | | |
| Net realized gain (loss) on options | | | 274,481 | | | | 0 | | | | 0 | | | | 0 | | |
| Net realized gain (loss) on foreign currency transactions | | | 0 | | | | 0 | | | | (806,269 | ) | | | (249,551 | ) | |
| Net change in unrealized appreciation (depreciation) of investments and foreign currencies | | | 238,352,769 | | | | 99,699,298 | | | | 697,229,950 | | | | 208,782,545 | | |
| Net change in unrealized appreciation (depreciation)—other | | | 6,021 | | | | 0 | | | | (413,175 | ) | | | (58,614 | ) | |
Net realized and unrealized gain on
investments and foreign currency transactions | | | 416,315,333 | | | | 317,737,393 | | | | 755,782,732 | | | | 350,258,046 | | |
| Net increase in net assets resulting from operations | | $ | 448,335,674 | | | $ | 357,035,737 | | | $ | 884,661,139 | | | $ | 354,021,411 | | |
(a) From October 2, 2006, the date on which Fund shares were first offered for sale to the public.
THE OAKMARK FUNDS
54
| | | The Oakmark
Global Select
Fund(a) | | The Oakmark
International
Fund | | The Oakmark
International
Small Cap Fund | |
| Investment Income: | |
| Dividends from unaffiliated securities | | $ | 1,191,027 | | | $ | 74,986,747 | | | $ | 9,386,274 | | |
| Dividends from affiliated securities | | | 0 | | | | 3,018,791 | | | | 5,088,995 | | |
| Interest income | | | 271,472 | | | | 8,292,499 | | | | 2,036,918 | | |
| Securities lending income | | | 0 | | | | 195,540 | | | | 0 | | |
| Other income | | | 0 | | | | 21,819 | | | | 0 | | |
| Foreign taxes withheld | | | (3,616 | ) | | | (3,875,283 | ) | | | (474,669 | ) | |
| Total investment income | | | 1,458,883 | | | | 82,640,113 | | | | 16,037,518 | | |
| Expenses: | |
| Investment advisory fee | | | 516,718 | | | | 37,214,016 | | | | 7,919,670 | | |
| Transfer and dividend disbursing agent fees | | | 26,705 | | | | 496,449 | | | | 78,761 | | |
| Other shareholder servicing fees | | | 52,867 | | | | 3,061,868 | | | | 311,979 | | |
| Service Fee—Class II | | | 0 | | | | 722,886 | | | | 440 | | |
| Reports to shareholders | | | 9,712 | | | | 414,995 | | | | 58,239 | | |
| Custody and accounting fees | | | 68,164 | | | | 3,008,053 | | | | 566,940 | | |
| Registration and blue sky expenses | | | 31,404 | | | | 110,368 | | | | 19,118 | | |
| Trustee fees | | | 48,227 | | | | 201,982 | | | | 104,629 | | |
| Legal fees | | | 20,467 | | | | 66,908 | | | | 33,610 | | |
| Audit fees | | | 18,013 | | | | 31,922 | | | | 16,464 | | |
| Amortization of organization expenses | | | 16,983 | | | | 0 | | | | 0 | | |
| Insurance | | | 0 | | | | 0 | | | | 0 | | |
| Other | | | 65,715 | | | | 208,609 | | | | 97,920 | | |
| Total expenses | | | 874,975 | | | | 45,538,056 | | | | 9,207,770 | | |
| Expense offset arrangements | | | 0 | | | | 0 | | | | 0 | | |
| Net expenses | | | 874,975 | | | | 45,538,056 | | | | 9,207,770 | | |
| Net Investment Income: | | | 583,908 | | | | 37,102,057 | | | | 6,829,748 | | |
Net realized and unrealized gain (loss) on
investments and foreign currency transactions: | |
| Net realized gain (loss) on unaffiliated securities | | | 2,283,837 | | | | 673,007,901 | | | | 140,997,405 | | |
| Net realized gain (loss) on affiliated securities | | | 0 | | | | 3,783,693 | | | | 932,552 | | |
| Net realized gain (loss) on options | | | 0 | | | | 0 | | | | 0 | | |
| Net realized gain (loss) on foreign currency transactions | | | (34,751 | ) | | | (1,355,403 | ) | | | (287,990 | ) | |
| Net change in unrealized appreciation (depreciation) of investments and foreign currencies | | | 9,302,744 | | | | 470,363,833 | | | | 83,602,885 | | |
| Net change in unrealized appreciation (depreciation)—other | | | 4,083 | | | | 369,888 | | | | 13,731 | | |
Net realized and unrealized gain on
investments and foreign currency transactions | | | 11,555,913 | | | | 1,146,169,912 | | | | 225,258,583 | | |
| Net increase in net assets resulting from operations | | $ | 12,139,821 | | | $ | 1,183,271,969 | | | $ | 232,088,331 | | |
See accompanying Notes to Financial Statements.
THE OAKMARK FUNDS
55
THE OAKMARK FUNDS
Statements of Changes in Net Assets—March 31, 2007 (Unaudited)
| | | The Oakmark Fund | |
| | | Period Ended
March 31, 2007
(Unaudited) | | Year Ended
September 30, 2006 | |
| From Operations: | |
| Net investment income | | $ | 32,020,341 | | | $ | 53,784,303 | | |
| Net realized gain (loss) on investments | | | 177,956,543 | | | | 270,986,174 | | |
| Net realized gain (loss) on foreign currency transactions | | | 0 | | | | (6,771 | ) | |
Net change in unrealized appreciation (depreciation) of
investments | | | 238,352,769 | | | | 238,673,740 | | |
| Net change in unrealized appreciation (depreciation)—other | | | 6,021 | | | | 1,909 | | |
| Net increase in net assets from operations | | | 448,335,674 | | | | 563,439,355 | | |
| Distributions to shareholders from: | |
| Net investment income—Class I | | | (53,538,834 | ) | | | (51,650,726 | ) | |
| Net investment income—Class II | | | (208,771 | ) | | | (231,758 | ) | |
| Net realized gain—Class I | | | (247,108,056 | ) | | | 0 | | |
| Net realized gain—Class II | | | (1,637,719 | ) | | | 0 | | |
| Total distributions to shareholders | | | (302,493,380 | ) | | | (51,882,484 | ) | |
| From Fund share transactions: | |
| Proceeds from shares sold—Class I | | | 540,399,936 | | | | 779,885,052 | | |
| Proceeds from shares sold—Class II | | | 5,812,872 | | | | 6,336,611 | | |
| Reinvestment of distributions—Class I | | | 284,352,640 | | | | 48,533,582 | | |
| Reinvestment of distributions—Class II | | | 1,632,253 | | | | 201,619 | | |
| Payments for shares redeemed—Class I | | | (650,048,130 | ) | | | (2,190,991,773 | ) | |
| Payments for shares redeemed—Class II | | | (9,767,811 | ) | | | (16,267,132 | ) | |
| Redemption fees—Class I | | | 113,450 | | | | 324,889 | | |
| Redemption fees—Class II | | | 737 | | | | 680 | | |
Net increase (decrease) in net assets from Fund
share transactions | | | 172,495,947 | | | | (1,371,976,472 | ) | |
| Total increase (decrease) in net assets | | | 318,338,241 | | | | (860,419,601 | ) | |
| Net assets: | |
| Beginning of period | | | 5,523,658,923 | | | | 6,384,078,524 | | |
| End of period | | $ | 5,841,997,164 | | | $ | 5,523,658,923 | | |
| Undistributed net investment income | | $ | 30,975,176 | | | $ | 52,702,440 | | |
| Fund Share Transactions—Class I: | |
| Shares sold | | | 11,690,015 | | | | 18,756,564 | | |
| Shares issued in reinvestment of dividends | | | 6,185,613 | | | | 1,171,177 | | |
| Less shares redeemed | | | (14,013,304 | ) | | | (52,610,324 | ) | |
| Net increase (decrease) in shares outstanding | | | 3,862,324 | | | | (32,682,583 | ) | |
| Fund Share Transactions—Class II: | |
| Shares sold | | | 126,062 | | | | 152,248 | | |
| Shares issued in reinvestment of dividends | | | 35,646 | | | | 4,883 | | |
| Less shares redeemed | | | (212,032 | ) | | | (390,394 | ) | |
| Net increase (decrease) in shares outstanding | | | (50,324 | ) | | | (233,263 | ) | |
THE OAKMARK FUNDS
56
| | | The Oakmark Select Fund | |
| | | Period Ended
March 31, 2007
(Unaudited) | | Year Ended
September 30, 2006 | |
| From Operations: | |
| Net investment income | | $ | 39,298,344 | | | $ | 65,028,737 | | |
| Net realized gain (loss) on investments | | | 218,038,095 | | | | 579,399,446 | | |
Net change in unrealized appreciation (depreciation) of
investments | | | 99,699,298 | | | | (92,754,575 | ) | |
| Net increase in net assets from operations | | | 357,035,737 | | | | 551,673,608 | | |
| Distributions to shareholders from: | |
| Net investment income—Class I | | | (64,071,053 | ) | | | (51,471,735 | ) | |
| Net investment income—Class II | | | (433,784 | ) | | | (488,531 | ) | |
| Net realized gain—Class I | | | (576,351,926 | ) | | | (313,884,121 | ) | |
| Net realized gain—Class II | | | (6,348,277 | ) | | | (4,367,840 | ) | |
| Total distributions to shareholders | | | (647,205,040 | ) | | | (370,212,227 | ) | |
| From Fund share transactions: | |
| Proceeds from shares sold—Class I | | | 396,689,559 | | | | 971,797,581 | | |
| Proceeds from shares sold—Class II | | | 10,565,445 | | | | 17,443,658 | | |
| Reinvestment of distributions—Class I | | | 618,361,471 | | | | 352,444,215 | | |
| Reinvestment of distributions—Class II | | | 3,215,331 | | | | 2,386,123 | | |
| Payments for shares redeemed—Class I | | | (694,251,700 | ) | | | (1,635,155,035 | ) | |
| Payments for shares redeemed—Class II | | | (22,879,329 | ) | | | (39,109,368 | ) | |
| Redemption fees—Class I | | | 128,685 | | | | 251,026 | | |
| Redemption fees—Class II | | | 1,339 | | | | 1,251 | | |
Net increase (decrease) in net assets from Fund share
transactions | | | 311,830,801 | | | | (329,940,549 | ) | |
| Total increase (decrease) in net assets | | | 21,661,498 | | | | (148,479,168 | ) | |
| Net assets: | |
| Beginning of period | | | 5,844,694,286 | | | | 5,993,173,454 | | |
| End of period | | $ | 5,866,355,784 | | | $ | 5,844,694,286 | | |
| Undistributed net investment income | | $ | 12,887,159 | | | $ | 38,093,652 | | |
| Fund Share Transactions—Class I: | |
| Shares sold | | | 11,553,637 | | | | 29,030,193 | | |
| Shares issued in reinvestment of dividends | | | 18,359,901 | | | | 10,628,595 | | |
| Less shares redeemed | | | (20,179,512 | ) | | | (48,799,020 | ) | |
| Net increase (decrease) in shares outstanding | | | 9,734,026 | | | | (9,140,232 | ) | |
| Fund Share Transactions—Class II: | |
| Shares sold | | | 311,149 | | | | 523,360 | | |
| Shares issued in reinvestment of dividends | | | 95,865 | | | | 72,263 | | |
| Less shares redeemed | | | (665,884 | ) | | | (1,169,938 | ) | |
| Net increase (decrease) in shares outstanding | | | (258,870 | ) | | | (574,315 | ) | |
See accompanying Notes to Financial Statements.
THE OAKMARK FUNDS
57
THE OAKMARK FUNDS
Statements of Changes in Net Assets—March 31, 2007 (Unaudited)
| | | The Oakmark
Equity and Income Fund | |
| | | Period Ended
March 31, 2007
(Unaudited) | | Year Ended
September 30, 2006 | |
| From Operations: | |
| Net investment income | | $ | 128,878,407 | | | $ | 193,197,493 | | |
| Net realized gain (loss) on investments | | | 59,772,226 | | | | 545,472,604 | | |
| Net realized gain (loss) on foreign currency transactions | | | (806,269 | ) | | | 953,110 | | |
Net change in unrealized appreciation (depreciation) of
investments | | | 697,229,950 | | | | (77,004,918 | ) | |
| Net change in unrealized appreciation (depreciation)—other | | | (413,175 | ) | | | 254,072 | | |
| Net increase in net assets from operations | | | 884,661,139 | | | | 662,872,361 | | |
| Distributions to shareholders from: | |
| Net investment income—Class I | | | (197,337,258 | ) | | | (127,230,307 | ) | |
| Net investment income—Class II | | | (11,590,883 | ) | | | (6,660,455 | ) | |
| Net realized gain—Class I | | | (514,829,367 | ) | | | (76,265,144 | ) | |
| Net realized gain—Class II | | | (36,037,949 | ) | | | (4,944,566 | ) | |
| Total distributions to shareholders | | | (759,795,457 | ) | | | (215,100,472 | ) | |
| From Fund share transactions: | |
| Proceeds from shares sold—Class I | | | 1,234,145,800 | | | | 2,056,526,635 | | |
| Proceeds from shares sold—Class II | | | 173,739,820 | | | | 311,212,011 | | |
| Reinvestment of distributions—Class I | | | 676,431,156 | | | | 193,933,598 | | |
| Reinvestment of distributions—Class II | | | 38,550,450 | | | | 7,917,854 | | |
| Payments for shares redeemed—Class I | | | (898,616,292 | ) | | | (1,479,474,288 | ) | |
| Payments for shares redeemed—Class II | | | (104,068,049 | ) | | | (210,686,071 | ) | |
| Redemption fees—Class I | | | 102,423 | | | | 190,842 | | |
| Redemption fees—Class II | | | 7,224 | | | | 4,611 | | |
Net increase (decrease) in net assets from Fund
share transactions | | | 1,120,292,532 | | | | 879,625,192 | | |
| Total increase in net assets | | | 1,245,158,214 | | | | 1,327,397,081 | | |
| Net assets: | |
| Beginning of period | | | 11,132,616,904 | | | | 9,805,219,823 | | |
| End of period | | $ | 12,377,775,118 | | | $ | 11,132,616,904 | | |
| Undistributed net investment income | | $ | 90,020,322 | | | $ | 163,377,760 | | |
| Fund Share Transactions—Class I: | |
| Shares sold | | | 46,825,810 | | | | 80,485,715 | | |
| Shares issued in reinvestment of dividends | | | 26,036,616 | | | | 7,695,778 | | |
| Less shares redeemed | | | (33,938,380 | ) | | | (57,994,019 | ) | |
| Net increase (decrease) in shares outstanding | | | 38,924,046 | | | | 30,187,474 | | |
| Fund Share Transactions—Class II: | |
| Shares sold | | | 6,604,867 | | | | 12,229,061 | | |
| Shares issued in reinvestment of dividends | | | 1,489,009 | | | | 315,076 | | |
| Less shares redeemed | | | (3,955,322 | ) | | | (8,300,682 | ) | |
| Net increase (decrease) in shares outstanding | | | 4,138,554 | | | | 4,243,455 | | |
THE OAKMARK FUNDS
58
| | | The Oakmark
Global Fund | |
| | | Period Ended
March 31, 2007
(Unaudited) | | Year Ended
September 30, 2006 | |
| From Operations: | |
| Net investment income | | $ | 3,763,365 | | | $ | 24,869,019 | | |
| Net realized gain (loss) on investments | | | 141,783,666 | | | | 310,301,304 | | |
| Net realized gain (loss) on foreign currency transactions | | | (249,551 | ) | | | 6,838,930 | | |
Net change in unrealized appreciation (depreciation) of
investments and foreign currencies | | | 208,782,545 | | | | 2,947,332 | | |
| Net change in unrealized appreciation (depreciation)—other | | | (58,614 | ) | | | 163,945 | | |
| Net increase in net assets from operations | | | 354,021,411 | | | | 345,120,530 | | |
| Distributions to shareholders from: | |
| Net investment income—Class I | | | (27,699,212 | ) | | | (20,913,767 | ) | |
| Net investment income—Class II | | | (645,340 | ) | | | (581,696 | ) | |
| Net realized gain—Class I | | | (312,319,850 | ) | | | (76,617,645 | ) | |
| Net realized gain—Class II | | | (10,681,345 | ) | | | (2,579,429 | ) | |
| Total distributions to shareholders | | | (351,345,747 | ) | | | (100,692,537 | ) | |
| From Fund share transactions: | |
| Proceeds from shares sold—Class I | | | 321,835,757 | | | | 439,182,726 | | |
| Proceeds from shares sold—Class II | | | 7,656,103 | | | | 17,019,479 | | |
| Reinvestment of distributions—Class I | | | 326,216,720 | | | | 92,918,085 | | |
| Reinvestment of distributions—Class II | | | 10,756,868 | | | | 2,954,863 | | |
| Payments for shares redeemed—Class I | | | (170,947,783 | ) | | | (329,606,864 | ) | |
| Payments for shares redeemed—Class II | | | (7,579,615 | ) | | | (9,199,239 | ) | |
| Redemption fees—Class I | | | 60,285 | | | | 104,623 | | |
| Redemption fees—Class II | | | 1,993 | | | | 2,156 | | |
Net increase (decrease) in net assets from Fund
share transactions | | | 488,000,328 | | | | 213,375,829 | | |
| Total increase in net assets | | | 490,675,992 | | | | 457,803,822 | | |
| Net assets: | |
| Beginning of period | | | 2,359,308,892 | | | | 1,901,505,070 | | |
| End of period | | $ | 2,849,984,884 | | | $ | 2,359,308,892 | | |
| Undistributed net investment income (loss) | | $ | (604,864 | ) | | $ | 22,747,166 | | |
| Fund Share Transactions—Class I: | |
| Shares sold | | | 12,148,837 | | | | 17,806,211 | | |
| Shares issued in reinvestment of dividends | | | 12,934,842 | | | | 3,942,219 | | |
| Less shares redeemed | | | (6,527,807 | ) | | | (13,308,581 | ) | |
| Net increase (decrease) in shares outstanding | | | 18,555,872 | | | | 8,439,849 | | |
| Fund Share Transactions—Class II: | |
| Shares sold | | | 293,233 | | | | 699,957 | | |
| Shares issued in reinvestment of dividends | | | 432,350 | | | | 126,818 | | |
| Less shares redeemed | | | (297,160 | ) | | | (375,302 | ) | |
| Net increase (decrease) in shares outstanding | | | 428,423 | | | | 451,473 | | |
See accompanying Notes to Financial Statements.
THE OAKMARK FUNDS
59
THE OAKMARK FUNDS
Statements of Changes in Net Assets—March 31, 2007 (Unaudited)
| | | The Oakmark
Global Select Fund | |
| | | For the Period from
October 2, 2006 (a) to
March 31, 2007
(Unaudited) | |
| From Operations: | |
| Net investment income | | $ | 583,908 | | |
| Net realized gain (loss) on investments | | | 2,283,837 | | |
| Net realized gain (loss) on foreign currency transactions | | | (34,751 | ) | |
| Net change in unrealized appreciation (depreciation) of investments and foreign currencies | | | 9,302,744 | | |
| Net change in unrealized appreciation (depreciation)—other | | | 4,083 | | |
| Net increase in net assets from operations | | | 12,139,821 | | |
| Distributions to shareholders from: | |
| Net investment income—Class I | | | (114,308 | ) | |
| Total distributions to shareholders | | | (114,308 | ) | |
| From Fund share transactions: | |
| Proceeds from shares sold—Class I | | | 225,767,299 | | |
| Reinvestment of distributions—Class I | | | 113,161 | | |
| Payments for shares redeemed—Class I | | | (8,400,091 | ) | |
| Redemption fees—Class I | | | 65,963 | | |
| Net increase (decrease) in net assets from Fund share transactions | | | 217,546,332 | | |
| Total increase in net assets | | | 229,571,845 | | |
| Net assets: | |
| End of period | | $ | 229,571,845 | | |
| Undistributed net investment income | | $ | 434,849 | | |
| Fund Share Transactions—Class I: | |
| Shares sold | | | 21,292,343 | | |
| Shares issued in reinvestment of dividends | | | 10,576 | | |
| Less shares redeemed | | | (776,760 | ) | |
| Net increase (decrease) in shares outstanding | | | 20,526,159 | | |
(a) From October 2, 2006, the date on which Fund shares were first offered for sale to the public.
THE OAKMARK FUNDS
60
| | | The Oakmark
International Fund | |
| | | Period Ended
March 31, 2007
(Unaudited) | | Year Ended
September 30, 2006 | |
| From Operations: | |
| Net investment income | | $ | 37,102,057 | | | $ | 121,327,693 | | |
| Net realized gain (loss) on investments | | | 676,791,594 | | | | 1,022,230,924 | | |
| Net realized gain (loss) on foreign currency transactions | | | (1,355,403 | ) | | | 85,933,770 | | |
Net change in unrealized appreciation (depreciation) of
investments and foreign currencies | | | 470,363,833 | | | | 131,694,166 | | |
| Net change in unrealized appreciation (depreciation)—other | | | 369,888 | | | | 294,298 | | |
| Net increase in net assets from operations | | | 1,183,271,969 | | | | 1,361,480,851 | | |
| Distributions to shareholders from: | |
| Net investment income—Class I | | | (122,425,919 | ) | | | (144,087,090 | ) | |
| Net investment income—Class II | | | (6,951,720 | ) | | | (8,528,390 | ) | |
| Net realized gain—Class I | | | (961,546,440 | ) | | | (241,359,448 | ) | |
| Net realized gain—Class II | | | (69,459,593 | ) | | | (15,880,415 | ) | |
| Total distributions to shareholders | | | (1,160,383,672 | ) | | | (409,855,343 | ) | |
| From Fund share transactions: | |
| Proceeds from shares sold—Class I | | | 1,042,165,274 | | | | 1,307,428,773 | | |
| Proceeds from shares sold—Class II | | | 233,968,453 | | | | 271,362,458 | | |
| Reinvestment of distributions—Class I | | | 957,808,244 | | | | 348,431,594 | | |
| Reinvestment of distributions—Class II | | | 53,952,152 | | | | 16,204,525 | | |
| Payments for shares redeemed—Class I | | | (639,059,824 | ) | | | (975,665,459 | ) | |
| Payments for shares redeemed—Class II | | | (131,045,994 | ) | | | (213,303,958 | ) | |
| Redemption fees—Class I | | | 108,934 | | | | 198,369 | | |
| Redemption fees—Class II | | | 8,109 | | | | 9,557 | | |
Net increase (decrease) in net assets from Fund
share transactions | | | 1,517,905,348 | | | | 754,665,859 | | |
| Total increase in net assets | | | 1,540,793,645 | | | | 1,706,291,367 | | |
| Net assets: | |
| Beginning of period | | | 7,696,540,881 | | | | 5,990,249,514 | | |
| End of period | | $ | 9,237,334,526 | | | $ | 7,696,540,881 | | |
| Undistributed net investment income | | $ | 21,389,579 | | | $ | 113,836,202 | | |
| Fund Share Transactions—Class I: | |
| Shares sold | | | 39,497,911 | | | | 53,137,278 | | |
| Shares issued in reinvestment of dividends | | | 38,038,453 | | | | 15,492,735 | | |
| Less shares redeemed | | | (24,415,924 | ) | | | (39,575,515 | ) | |
| Net increase (decrease) in shares outstanding | | | 53,120,440 | | | | 29,054,498 | | |
| Fund Share Transactions—Class II: | |
| Shares sold | | | 8,967,212 | | | | 11,066,476 | | |
| Shares issued in reinvestment of dividends | | | 2,157,223 | | | | 724,062 | | |
| Less shares redeemed | | | (5,033,761 | ) | | | (8,682,291 | ) | |
| Net increase (decrease) in shares outstanding | | | 6,090,674 | | | | 3,108,247 | | |
See accompanying Notes to Financial Statements.
THE OAKMARK FUNDS
61
THE OAKMARK FUNDS
Statements of Changes in Net Assets—March 31, 2007 (Unaudited)
| | | The Oakmark International
Small Cap Fund | |
| | | Period Ended
March 31, 2007
(Unaudited) | | Year Ended
September 30, 2006 | |
| From Operations: | |
| Net investment income | | $ | 6,829,748 | | | $ | 19,607,669 | | |
| Net realized gain (loss) on investments | | | 141,929,957 | | | | 177,109,165 | | |
| Net realized gain (loss) on foreign currency transactions | | | (287,990 | ) | | | 14,662,887 | | |
Net change in unrealized appreciation (depreciation) of
investments and foreign currencies | | | 83,602,885 | | | | 71,230,284 | | |
| Net change in unrealized appreciation (depreciation)—other | | | 13,731 | | | | 43,207 | | |
| Net increase in net assets from operations | | | 232,088,331 | | | | 282,653,212 | | |
| Distributions to shareholders from: | |
| Net investment income—Class I | | | (29,840,093 | ) | | | (31,166,621 | ) | |
| Net investment income—Class II | | | (20,128 | ) | | | (18,114 | ) | |
| Net realized gain—Class I | | | (181,349,841 | ) | | | (156,716,232 | ) | |
| Net realized gain—Class II | | | (126,536 | ) | | | (93,410 | ) | |
| Total distributions to shareholders | | | (211,336,598 | ) | | | (187,994,377 | ) | |
| From Fund share transactions: | |
| Proceeds from shares sold—Class I | | | 125,254,799 | | | | 201,993,652 | | |
| Proceeds from shares sold—Class II | | | 255,301 | | | | 144,934 | | |
| Reinvestment of distributions—Class I | | | 201,840,076 | | | | 176,611,867 | | |
| Reinvestment of distributions—Class II | | | 74,623 | | | | 64,080 | | |
| Payments for shares redeemed—Class I | | | (137,693,657 | ) | | | (205,919,657 | ) | |
| Payments for shares redeemed—Class II | | | (19,300 | ) | | | (101,375 | ) | |
| Redemption fees—Class I | | | 21,259 | | | | 48,587 | | |
| Redemption fees—Class II | | | 15 | | | | 19 | | |
Net increase (decrease) in net assets from Fund
share transactions | | | 189,733,116 | | | | 172,842,107 | | |
| Total increase in net assets | | | 210,484,849 | | | | 267,500,942 | | |
| Net assets: | |
| Beginning of period | | | 1,275,312,379 | | | | 1,007,811,437 | | |
| End of period | | $ | 1,485,797,228 | | | $ | 1,275,312,379 | | |
| Undistributed net investment income (loss) | | $ | (12,502,223 | ) | | $ | 10,816,240 | | |
| Fund Share Transactions—Class I: | |
| Shares sold | | | 5,292,434 | | | | 9,211,608 | | |
| Shares issued in reinvestment of dividends | | | 8,962,703 | | | | 8,974,181 | | |
| Less shares redeemed | | | (5,858,509 | ) | | | (9,457,429 | ) | |
| Net increase (decrease) in shares outstanding | | | 8,396,628 | | | | 8,728,360 | | |
| Fund Share Transactions—Class II: | |
| Shares sold | | | 10,859 | | | | 6,780 | | |
| Shares issued in reinvestment of dividends | | | 3,318 | | | | 3,259 | | |
| Less shares redeemed | | | (815 | ) | | | (4,539 | ) | |
| Net increase (decrease) in shares outstanding | | | 13,362 | | | | 5,500 | | |
THE OAKMARK FUNDS
62
THE OAKMARK FUNDS
Notes to Financial Statements (Unaudited)
1. SIGNIFICANT ACCOUNTING POLICIES
The following are the significant accounting policies of The Oakmark Fund ("Oakmark"), The Oakmark Select Fund ("Select"), The Oakmark Equity and Income Fund ("Equity and Income"), The Oakmark Global Fund ("Global"), The Oakmark Global Select Fund ("Global Select") [which commenced operations on October 2, 2006], The Oakmark International Fund ("International"), and The Oakmark International Small Cap Fund ("Int'l Small Cap"), collectively referred to as "the Funds", each a series of Harris Associates Investment Trust (the "Trust"), a Massachusetts business trust, organized on February 1, 1991, which is registered as an investment company under the Investment Company Act of 1940. These policies are in conformity with accounting principles generally accepted in the United States of America ("GAAP"). The presentation of financial statements in conformity with GAAP requires management to make estimates and assumptions that affect t he reported amounts of assets and liabilities at the date of the financial statements and the reported amounts of revenues and expenses during the reporting period. Actual results could differ from those estimates and assumptions. These financial statements contain all adjustments which are, in the opinion of management, necessary to a fair statement of the interim period presented. Such adjustments are normal and recurring nature.
Class Disclosure—
Each Fund offers two classes of shares: Class I Shares and Class II Shares. Class I Shares are offered to the general public. Class II Shares are offered to certain retirement plans such as 401(k) and profit sharing plans. Class II Shares pay a service fee at the annual rate of up to 0.25% of average net assets of Class II Shares of the Funds. This service fee is paid to an administrator for performing the services associated with the administration of such retirement plans. Class I Shares do not have an associated service fee.
Income, realized and unrealized capital gains and losses and expenses of the Funds that are not directly attributable to a specific class of shares are prorated among the classes based on the relative net assets of each class.
Redemption fees—
Each Fund imposes a short-term trading fee on redemptions of shares held for 90 days or less to offset two types of costs to the Fund caused by short-term trading: portfolio transaction and market impact costs associated with erratic redemption activity and administrative costs associated with processing redemptions. The fee is 2% of the redemption value and is deducted from the redemption proceeds. The "first-in, first-out" ("FIFO") method is used to determine the holding period.
Security valuation—
The Funds' share prices or net asset values ("NAVs") are calculated as of the close of regular session trading (usually 4:00 pm Eastern time) on the New York Stock Exchange ("NYSE") on any day on which the NYSE is open for trading. Domestic equity securities traded on securities exchanges and over-the-counter securities are valued at the last sales price on the day of valuation, or lacking any reported sales that day, at the most recent bid quotation. Securities traded on the NASDAQ National Market are valued at the NASDAQ Official Closing Price ("NOCP"), or lacking an NOCP, at the most recent bid quotation on the NASDAQ National Market. Foreign equity securities traded on securities exchanges shall be valued at, depending on local convention or regulation, the last sales price, last bid or asked price, the mean between the last bid and asked prices, an official closing price, or shall be based on a pricing composite as of the c lose of the regular trading hours on the appropriate exchange or other designated time. Debt obligations and money market instruments maturing in more than 60 days from the date of purchase are valued at the latest bid quotation. Debt obligations and money market instruments maturing in less than 61 days from the date of purchase are valued on an amortized cost basis, which approximates value. Options are valued at the last reported sales price on the day of valuation, or lacking any reported sales that day, at the mean of the most recent bid and asked quotations, or if the mean is not available, at the most recent bid quotation.
Securities for which quotations are not readily available or securities that may have been affected by a significant event occurring between the close of a foreign market and the close of the NYSE are valued at fair values, determined by or under the direction of the pricing committee established by the Board of Trustees. A significant event may include the performance of U.S. markets since the close of foreign markets. The pricing committee will evaluate movements in the U.S markets after the close of foreign markets and may adjust security prices to reflect changes in reaction to U.S. markets as determined by a third party model. At March 31, 2007, the Funds held no securities for which quotations were not readily available, and Global and International each held a security whose market value was determined by procedures established in good faith by the Board of Trustees.
Foreign currency translations—
Certain Funds invest in foreign securities, which may involve a number of risk factors and special considerations not present with investments in securities of U.S. corporations. Values of investments and other assets and liabilities denominated in foreign currencies are translated into
THE OAKMARK FUNDS
63
THE OAKMARK FUNDS
Notes to Financial Statements (Unaudited) (cont.)
U.S. dollars at current exchange rates obtained by a recognized bank, dealer, or independent pricing service on the day of valuation. Purchases and sales of investments and dividend and interest income are converted at the prevailing rate of exchange on the respective dates of such transactions. Forward foreign currency contracts are valued at the current day's interpolated foreign exchange rates.
The Funds do not isolate that portion of the results of operations resulting from changes in foreign exchange rates on investments from the fluctuations arising from changes in market prices of securities held. Such fluctuations are included with the net realized and unrealized gains and losses from securities.
Net realized gains and losses on foreign currency transactions arise from sales of foreign currencies, currency gains or losses realized between the trade and settlement dates on securities transactions, the difference between the amounts of dividends, interest, and foreign withholding taxes recorded and the U.S. dollar equivalent of the amounts actually received or paid, and the realized gains or losses resulting from portfolio and transaction hedges. Net unrealized foreign exchange gains and losses arise from changes in the fair value of assets and liabilities, other than investments in securities, at fiscal year end resulting from changes in exchange rates.
At March 31, 2007, net unrealized appreciation (depreciation) - other included the following components:
| | | Oakmark | | Equity and
Income | | Global | | Global Select | | International | | Int'l
Small Cap | |
Unrealized appreciation
(depreciation) on
interest, dividends and
dividend reclaims receivable | | $ | 7,930 | | | $ | 70,541 | | | $ | 38,622 | | | $ | 5,200 | | | $ | 349,593 | | | $ | 19,999 | | |
Unrealized appreciation
(depreciation) on open
securities purchases and
sales | | | 0 | | | | 0 | | | | (57,060 | ) | | | (1,117 | ) | | | (60,796 | ) | | | (11,762 | ) | |
Net Unrealized
appreciation
(depreciation) - other | | $ | 7,930 | | | $ | 70,541 | | | $ | (18,438 | ) | | $ | 4,083 | | | $ | 288,797 | | | $ | 8,237 | | |
Forward foreign currency contracts—
The Funds' currency transactions are limited to transaction hedging and portfolio hedging. The contractual amounts of forward foreign exchange contracts do not necessarily represent the amounts potentially subject to risk. The measurement of the risks associated with these instruments is meaningful only when all related and offsetting transactions are considered. Risks arise from the possible inability of counterparties to meet the terms of their contracts and from movements in currency values. At March 31, 2007, Global, Global Select, International, and Int'l Small Cap held forward foreign currency contracts.
The Oakmark Global Fund
| | | Contract
Amount | | Settlement
Date | | Valuation at
03/31/07 | | Unrealized
Appreciation/
(Depreciation) | |
Foreign Currency Sold:
British Pound Sterling | | | 16,900,000 | | | 7/5/07 | | $ | 33,241,135 | | | $ | (146,710 | ) | |
| British Pound Sterling | | | 17,700,000 | | | 7/18/07 | | | 34,809,052 | | | | (122,362 | ) | |
| British Pound Sterling | | | 14,210,000 | | | 7/25/07 | | | 27,943,139 | | | | 266,553 | | |
| | | | | | | | | $ | 95,993,326 | | | $ | (2,519 | ) | |
THE OAKMARK FUNDS
64
THE OAKMARK FUNDS
Notes to Financial Statements (Unaudited) (cont.)
The Oakmark Global Select Fund
| | | Contract
Amount | | Settlement
Date | | Valuation at
03/31/07 | | Unrealized
Appreciation/
(Depreciation) | |
Foreign Currency Sold:
British Pound Sterling | | | 1,440,000 | | | 7/5/07 | | $ | 2,832,381 | | | $ | (12,501 | ) | |
| British Pound Sterling | | | 1,910,000 | | | 7/18/07 | | | 3,756,231 | | | | (13,204 | ) | |
| British Pound Sterling | | | 1,320,000 | | | 7/25/07 | | | 2,595,703 | | | | 24,761 | | |
| British Pound Sterling | | | 1,310,000 | | | 9/24/07 | | | 2,574,084 | | | | (5,305 | ) | |
| | | | | | | | | $ | 11,758,399 | | | $ | (6,249 | ) | |
The Oakmark International Fund
| | | Contract
Amount | | Settlement
Date | | Valuation at
03/31/07 | | Unrealized
Appreciation/
(Depreciation) | |
Foreign Currency Sold:
British Pound Sterling | | | 127,510,000 | | | 7/5/07 | | $ | 250,803,382 | | | $ | (1,106,925 | ) | |
| British Pound Sterling | | | 129,950,000 | | | 7/18/07 | | | 255,561,372 | | | | (898,357 | ) | |
| British Pound Sterling | | | 128,080,000 | | | 7/25/07 | | | 251,861,876 | | | | 2,402,540 | | |
| | | | | | | | | $ | 758,226,630 | | | $ | 397,258 | | |
The Oakmark International Small Cap Fund
| | | Contract
Amount | | Settlement
Date | | Valuation at
03/31/07 | | Unrealized
Appreciation/
(Depreciation) | |
Foreign Currency Sold:
British Pound Sterling | | | 15,570,000 | | | 7/5/07 | | $ | 30,625,117 | | | $ | (135,164 | ) | |
| British Pound Sterling | | | 16,640,000 | | | 7/18/07 | | | 32,724,442 | | | | (115,034 | ) | |
| British Pound Sterling | | | 14,800,000 | | | 7/25/07 | | | 29,103,340 | | | | 277,620 | | |
| | | | | | | | | $ | 92,452,899 | | | $ | 27,422 | | |
Security transactions and investment income—
Security transactions are accounted for on the trade date (date the order to buy or sell is executed) and dividend income is recorded on the ex-dividend date. Interest income and expenses are recorded on an accrual basis. Bond discount is accreted and premium is amortized over the expected life of each applicable security using the effective yield method. Withholding taxes on foreign dividends have been provided for in accordance with the Funds' understanding of the applicable country's tax rules and rates. Net realized gains and losses on investments are determined by the specific identification method.
Short sales—
Each Fund may sell a security it does not own in anticipation of a decline in the value of that security. When the Fund sells a security short, it must borrow the security sold short and deliver it to the broker-dealer through which it made the short sale. A gain, limited to the price at which the Fund sold the security short, or loss, unlimited in size, will be recognized upon the termination of a short sale. At March 31, 2007, none of the Funds had short sales.
Accounting for options—
When a Fund writes an option, the premium received by the Fund is recorded as a liability and is subsequently adjusted to the current market value of the option written. Premiums received from writing options that expire are recorded by the Fund on the expiration date as realized gains from
THE OAKMARK FUNDS
65
THE OAKMARK FUNDS
Notes to Financial Statements (Unaudited) (cont.)
option transactions. The difference between the premium and the amount paid on effecting a closing purchase transaction, including brokerage commissions, is also treated as a realized gain, or if the premium is less than the amount paid for the closing purchase transaction, as a realized loss. If a call option is exercised, the premium is added to the proceeds from the sale of the underlying security or currency in determining whether the Fund has realized a gain or a loss. If a put option is exercised, the premium reduces the cost basis of the security or currency purchased by the Fund. In writing an option, the Fund bears the market risk of an unfavorable change in the price of the security or currency underlying the written option. Exercise of an option written by the Fund could result in the Fund selling or buying a security or currency at a price different from the current market value. Options written by the Fund do not gi ve rise to counterparty credit risk, as they obligate the Funds, not its counterparties, to perform.
When a Fund purchases an option, the premium paid by the Fund is recorded as an asset and is subsequently adjusted to the current value of the option purchased. Purchasing call options tends to increase the Fund's exposure to the underlying instrument. Purchasing put options tends to decrease the Fund's exposure to the underlying instrument. Premiums paid for purchasing options that expire are treated as realized losses. Premiums paid for purchasing options that are exercised or closed are added to the amounts paid or offset against the proceeds on the underlying security to determine the realized gain or loss. The risks associated with purchasing put and call options are potential loss of the premium paid and the failure of the counterparty to honor its obligation under the contract.
At March 31, 2007, the Funds had no outstanding options.
Committed line of credit—
The Trust has an unsecured committed line of credit with Investors Bank & Trust Company ("IBT") in the amount of $450 million. Borrowings under that arrangement bear interest at 0.45% above the Federal Funds Effective Rate, as defined in the credit agreement. There were no borrowings under the arrangement during the six-month period ended March 31, 2007.
Expense offset arrangement—
IBT serves as custodian of the Funds. IBT's fee may be reduced by credits that are an earnings allowance calculated on the average daily cash balances each Fund maintains with IBT. Credit balances used to reduce the Funds' custodian fees, if any, are reported as a reduction of total expenses in the Statements of Operations.
Repurchase agreements—
Each Fund may invest in repurchase agreements, which are short-term investments whereby the Fund acquires ownership of a debt security and the seller agrees to repurchase the security at a future date at a specified price.
The Fund, through IBT, receives delivery of the underlying securities collateralizing repurchase agreements. It is the Funds' policy that the value of the collateral be at least equal to 105% of the repurchase price, including interest. Harris Associates L.P. ("the Adviser") is responsible for determining that the value of the collateral is at all times at least equal to 105% of the repurchase price, including interest. Repurchase agreements could involve certain risks in the event of default or insolvency of the counterparty including possible delays or restrictions upon a Fund's ability to dispose of the underlying securities.
Security lending—
Each Fund, except Oakmark, may lend its portfolio securities to broker-dealers and banks. Any such loan must be continuously secured by collateral in cash or cash equivalents maintained on a current basis in an amount at least equal to the fair value of the securities loaned by the Fund. Collateral is marked to market and monitored daily. The Fund would continue to receive the equivalent of the interest or dividends paid by the issuer on the securities loaned, and would also receive an additional return that may be in the form of a fixed fee or a percentage of the earnings on the collateral. The Fund would have the right to call the loan and obtain the securities loaned at any time, and the counterparty is required to return the securities within five business days or less. In the event of bankruptcy or other default of the borrower, the Fund could experience delays in liquidating the loan collateral or recovering the loaned sec urities and incur expenses related to enforcing its rights. In addition, there could be a decline in the value of the collateral or in the fair value of the securities loaned while the Fund seeks to enforce its rights thereto and the Fund could experience subnormal levels of income or lack of access to income during that period.
At March 31, 2007, Equity and Income, Global and International had securities on loan with a value of approximately $296,940,000, $83,907,677 and $397,305,702, respectively, and held $311,088,665, $87,674,769 and $419,295,968 of U.S. Treasury securities as collateral for the loans, respectively.
THE OAKMARK FUNDS
66
THE OAKMARK FUNDS
Notes to Financial Statements (Unaudited) (cont.)
Restricted securities—
The following investments, the sales of which are restricted to qualified institutional buyers, have been valued according to the securities valuation procedures for debt obligations and money market instruments (as stated in the Security valuation section) since their acquisition dates. These securities are priced using market quotations and there are no unrestricted securities with the same maturity dates and yields for the issuer.
At March 31, 2007, Equity and Income held the following restricted securities:
| Quantity | | Security
Name | | Acquisition
Date | | Carrying
Value | | Cost | | Value | | Percentage of
Value
Net Assets | |
| $ | 3,000,000 | | | Sealed Air Corporation,
144A, 5.625% due
7/15/2013 | | 6/27/2003 | | | 100.2909 | | | | 100.68 | | | | 3,008,727 | | | | 0.02 | % | |
| | 5,000,000 | | | Sealed Air Corporation,
144A, 5.625% due
7/15/2013 | | 8/20/2003 | | | 100.2909 | | | | 96.41 | | | | 5,014,545 | | | | 0.04 | % | |
| | 300,000 | | | Sealed Air Corporation,
144A, 5.625% due
7/15/2013 | | 8/21/2003 | | | 100.2909 | | | | 96.79 | | | | 300,873 | | | | 0.00 | % | |
| | 11,700,000 | | | Sealed Air Corporation,
144A, 5.625% due
7/15/2013 | | 4/6/2004 | | | 100.2909 | | | | 103.31 | | | | 11,734,035 | | | | 0.10 | % | |
| | | | | | | | | | | | | | | | | | 20,058,180 | | | | 0.16 | % | |
Federal income taxes—
It is each Fund's policy to comply with the requirements of the Internal Revenue Code applicable to regulated investment companies and to distribute substantially all of its net taxable income, including any net realized gains on investments, to its shareholders. Therefore, no federal income tax provision is required.
Recently issued accounting pronouncement—
In June 2006, the Financial Accounting Standards Board ("FASB") issued Interpretation No. 48, ("FIN 48") "Accounting for Uncertainty in Income Taxes—an interpretation of FASB Statement No. 109". This interpretation prescribes a recognition threshold and measurement attribute for the financial statement recognition and measurement of a tax position taken or expected to be taken in a tax return. It also provides guidance on de-recognition, classification, interest and penalties, accounting in interim periods, disclosure and transition. FIN 48 is effective for fiscal years beginning after December 15, 2006. The Trust is currently evaluating the impact of applying the various provisions of FIN 48.
In September 2006, FASB issued Statement of Financial Accounting Standards No. 157 ("FAS 157"), "Fair Value Measurements." FAS 157 defines fair value, establishes a framework for measuring fair value in accordance with generally accepted accounting principles and expands disclosure about fair value measurements. FAS 157 is effective for fiscal years beginning after November 15, 2007. The Trust is currently evaluating the impact the adoption of FAS 157 will have on the Funds' financial statement disclosures.
THE OAKMARK FUNDS
67
THE OAKMARK FUNDS
Notes to Financial Statements (Unaudited) (cont.)
2. TRANSACTIONS WITH AFFILIATES
Each Fund has an investment advisory agreement with the Adviser. For management services and facilities furnished, the Funds pay the Adviser monthly fees. Each fee is calculated on the total net assets as determined at the end of each preceding calendar month. Annual fee rates are as follows:
| Fund | | Advisory Fees | | Fund | | Advisory Fees | |
Oakmark
| | 1.00% up to $2 billion;
0.90% on the next $1 billion;
0.80% on the next $2 billion;
0.75% on the next $2.5 billion;
0.70% on the next $2.5 billion; and
0.65% over 10 billion
| | Global
Global Select
| | 1.00% up to $2 billion;
0.95% on the next $2 billion; and
0.90% over $4 billion
1.00% up to $2 billion;
0.95% on the next $1 billion;
0.875% on the next $4 billion; and
0.85% over $7 billion | |
|
Select
| | 1.00% up to $1 billion;
0.95% on the next $500 million;
0.90% on the next $500 million;
0.85% on the next $500 million;
0.80% on the next $2.5 billion;
0.75% on the next $5 billion; and
0.725% over 10 billion
| |
International
| |
1.00% up to $2 billion;
0.95% on the next $1 billion;
0.85% on the next $2 billion;
0.825% on the next $2.5 billion;
0.815% on the next $3.5 billion; and
0.805% over $11 billion | |
|
Equity and Income
| | 0.75% up to $5 billion;
0.70% on the next $2.5 billion;
0.675% on the next $2.5 billion;
0.65% on the next $2.5 billion; and
0.60% over $12.5 billion | | Int'l Small Cap
| | 1.25% up to $500 million;
1.10% on the next $1 billion;
1.05% on the next $2 billion; and
1.025% over $3.5 billion | |
|
The Adviser is contractually obligated through January 31, 2008 to reimburse each Fund Class to the extent, but only to the extent, that its annualized expenses (excluding taxes, interest, all commissions and other normal charges incident to the purchase and sale of portfolio securities, and extraordinary charges such as litigation costs, but including fees paid to the Adviser) exceed the percent set forth below of average daily net assets of the Fund Class.
| Fund | | Class I | | Class II | |
| Oakmark | | | 1.50 | % | | | 1.75 | % | |
| Select | | | 1.50 | | | | 1.75 | | |
| Equity and Income | | | 1.00 | | | | 1.25 | | |
| Global | | | 1.75 | | | | 2.00 | | |
| Global Select | | | 1.75 | | | | 2.00 | | |
| International | | | 2.00 | | | | 2.25 | | |
| Int'l Small Cap | | | 2.00 | | | | 2.25 | | |
The Adviser and the Funds have entered into agreements with financial intermediaries to provide recordkeeping, processing, shareholder communications and other services to customers of the intermediaries and have agreed to compensate the intermediaries for providing those services. Certain of those services would be provided by the Funds if the shares of those customers were registered directly with the Funds' transfer agent. Accordingly, the Funds pay a portion of the intermediary fees pursuant to an agreement with the Adviser, which calls for each Fund to pay a portion of the intermediary fees attributable to shares of the Fund held by the intermediary (which generally are a percentage of value of the shares held) not exceeding the lesser of 75% of the fees charged by the intermediary or what the Fund would have paid its transfer agent had each customer's shares been registered directly with the transfer agent instead of held through the intermediary. The Adviser pays the remainder of the fees. The fees incurred by the Funds are reflected as other shareholder servicing fees in the Statements of Operations.
THE OAKMARK FUNDS
68
THE OAKMARK FUNDS
Notes to Financial Statements (Unaudited) (cont.)
The non-interested Trustees of the Trust may participate in the Trust's Deferred Compensation Plan for Independent Trustees. Participants in the plan may elect to defer all or a portion of their compensation. Amounts deferred are retained by the Trust and represent an unfunded obligation of the Trust. The value of amounts deferred for a participant is determined by reference to the change in value of Class I shares of one or more of the Funds or a money market fund as specified by the participant. Benefits would be payable after a stated number of years or retirement from the board. The accrued obligations of the Funds under the plan are reflected as deferred trustee compensation in the Statement of Assets and Liabilities. The interested trustees are not compensated by the Funds.
3. FEDERAL INCOME TAXES
For the six-month period ended March 31, 2007, cost of investments for federal income tax purposes and related composition of unrealized gains and losses were as follows:
| Fund | | Cost of Investments
for Federal Income
Tax Purposes | | Gross Unrealized
Appreciation | | Gross Unrealized
(Depreciation) | | Net Unrealized
Appreciation
(Depreciation) | |
| Oakmark | | $ | 4,094,254,680 | | | $ | 1,788,412,454 | | | $ | (45,380,039 | ) | | $ | 1,743,032,415 | | |
| Select | | | 4,074,515,621 | | | | 1,850,881,513 | | | | (87,554,169 | ) | | | 1,763,327,344 | | |
| Equity and Income | | | 9,994,876,358 | | | | 2,397,766,779 | | | | (36,781,585 | ) | | | 2,360,985,194 | | |
| Global | | | 2,188,423,041 | | | | 698,457,082 | | | | (20,080,089 | ) | | | 678,376,993 | | |
| Global Select | | | 226,306,569 | | | | 12,897,448 | | | | (3,584,163 | ) | | | 9,313,285 | | |
| International | | | 6,968,204,522 | | | | 2,221,039,928 | | | | (23,360,322 | ) | | | 2,197,679,606 | | |
| Int'l Small Cap | | | 1,114,678,077 | | | | 390,316,336 | | | | (10,987,209 | ) | | | 379,329,127 | | |
For the six-month period ended March 31, 2007, the components of distributable earnings on a tax basis (excluding unrealized appreciation (depreciation)) were as follows:
| Fund | | Undistributed
Ordinary Income | | Undistributed Long-
Term Gain | | Total Distributable
Earnings | |
| Oakmark | | $ | 32,344,322 | | | $ | 158,438,038 | | | $ | 190,782,360 | | |
| Select | | | 13,848,758 | | | | 216,627,918 | | | | 230,476,676 | | |
| Equity and Income | | | 104,271,804 | | | | 26,865,181 | | | | 131,136,985 | | |
| Global | | | 12,923,295 | | | | 85,934,497 | | | | 98,857,792 | | |
| Global Select | | | 2,766,367 | | | | 0 | | | | 2,766,367 | | |
| International | | | 119,882,253 | | | | 526,223,278 | | | | 646,105,531 | | |
| Int'l Small Cap | | | 12,915,242 | | | | 113,105,584 | | | | 126,020,826 | | |
During the six-months ended March 31, 2007, and the year ended September 30, 2006, the tax character of distributions paid was as follows:
| | | Period Ended
March 31, 2007 | | Year Ended
September 30, 2006 | |
| Fund | | Distributions Paid
from Ordinary
Income | | Distributions Paid
from Long-Term
Capital Gain | | Distributions Paid
from Ordinary
Income | | Distributions Paid
from Long-Term
Capital Gain | |
| Oakmark | | $ | 53,747,605 | | | $ | 248,745,775 | | | $ | 51,882,484 | | | $ | 0 | | |
| Select | | | 64,504,837 | | | | 582,700,203 | | | | 51,960,266 | | | | 318,251,961 | | |
| Equity and Income | | | 208,928,141 | | | | 550,867,316 | | | | 133,890,762 | | | | 81,209,710 | | |
| Global | | | 28,344,552 | | | | 323,001,195 | | | | 27,510,133 | | | | 73,182,404 | | |
| Global Select | | | 114,308 | | | | 0 | | | | N/A | | | | N/A | | |
| International | | | 144,228,788 | | | | 1,016,154,884 | | | | 158,218,276 | | | | 251,637,067 | | |
| Int'l Small Cap | | | 55,312,278 | | | | 156,024,320 | | | | 40,979,591 | | | | 147,014,786 | | |
N/A – Not applicable as Fund commenced operations on October 2, 2006.
THE OAKMARK FUNDS
69
THE OAKMARK FUNDS
Notes to Financial Statements (Unaudited) (cont.)
4. INVESTMENT TRANSACTIONS
For the six-month period ended March 31, 2007, transactions in investment securities (excluding short term and U.S. Government securities) were as follows (in thousands):
| | | Oakmark | | Select | | Equity and
Income | | Global | | Global
Select | | International | | Int'l
Small Cap | |
| Purchases | | $ | 315,126 | | | $ | 248,394 | | | $ | 1,153,159 | | | $ | 577,946 | | | $ | 211,896 | | | $ | 2,304,136 | | | $ | 361,150 | | |
| Proceeds from sales | | | 486,630 | | | | 525,974 | | | | 1,390,802 | | | | 436,684 | | | | 15,773 | | | | 1,999,719 | | | | 369,291 | | |
Purchases at cost and proceeds from sales of long-term U.S. Government securities for the six-month period ended March 31, 2007 were $1,620,523 and $765,141 respectively for Equity and Income.
5. INVESTMENTS IN AFFILIATED ISSUERS
An issuer in which a Fund's holdings represents 5% or more of the outstanding voting securities of the issuer is an affiliated issuer as defined under the Investment Company Act of 1940. A schedule of each Fund's investments in securities of affiliated issuers held during the six-month period ended March 31, 2007, is set forth below:
Schedule of Transactions with Affiliated Issuers
The Oakmark Select Fund
| Affiliates | | Shares Held | | Purchases
(Cost) | | Sales
Proceeds | | Dividend
Income | | Value
March 31,
2007 | |
The Dun & Bradstreet
Corporation* | | | 2,684,900 | | | $ | 0 | | | $ | 52,505,912 | | | $ | 696,225 | | | $ | 244,862,880 | | |
| TOTALS | | | | | | $ | 0 | | | $ | 52,505,912 | | | $ | 696,225 | | | $ | 244,862,880 | | |
Schedule of Transactions with Affiliated Issuers
The Oakmark Equity and Income Fund
| Affiliates | | Shares Held | | Purchases
(Cost) | | Sales
Proceeds | | Dividend
Income | | Value
March 31,
2007 | |
Meuller Water Products, Inc.,
Class A** | | | 0 | | | $ | 18,773,063 | | | $ | 44,367,930 | | | $ | 52,500 | | | $ | 0 | | |
Meuller Water Products, Inc.,
Class B | | | 6,719,153 | | | | 44,113,565 | | | | 13 | | | | 117,585 | | | | 89,969,459 | | |
St Mary Land & Exploration
Company | | | 2,900,000 | | | | 0 | | | | 0 | | | | 145,000 | | | | 106,372,000 | | |
| Varian, Inc.*+ | | | 1,649,400 | | | | 0 | | | | 0 | | | | 0 | | | | 96,094,044 | | |
| TOTALS | | | | | | $ | 62,886,628 | | | $ | 44,367,943 | | | $ | 315,085 | | | $ | 292,435,503 | | |
Schedule of Transactions with Affiliated Issuers
The Oakmark International Fund
| Affiliates | | Shares Held | | Purchases
(Cost) | | Sales
Proceeds | | Dividend
Income | | Value
March 31,
2007 | |
| Giordano International Limited | | | 121,265,300 | | | $ | 0 | | | $ | 0 | | | $ | 0 | | | $ | 58,975,893 | | |
| Lotte Chilsung Beverage Co., Ltd. | | | 88,635 | | | | 0 | | | | 261,462 | | | | 179,294 | | | | 113,149,059 | | |
| Meitec Corporation | | | 2,483,800 | | | | 0 | | | | 0 | | | | 881,467 | | | | 80,095,383 | | |
| Signet Group PLC | | | 100,745,000 | | | | 0 | | | | 25,771,035 | | | | 0 | | | | 248,805,066 | | |
| Trinity Mirror plc | | | 17,792,038 | | | | 14,614,222 | | | | 0 | | | | 1,958,030 | | | | 186,264,170 | | |
| TOTALS | | | | | | $ | 14,614,222 | | | $ | 26,032,497 | | | $ | 3,018,791 | | | $ | 687,289,571 | | |
THE OAKMARK FUNDS
70
THE OAKMARK FUNDS
Notes to Financial Statements (Unaudited) (cont.)
Schedule of Transactions with Affiliated Issuers
The Oakmark Int'l Small Cap Fund
| Affiliates | | Shares Held | | Purchases
(Cost) | | Sales
Proceeds | | Dividend
Income | | Value
March 31,
2007 | |
| Alaska Milk Corporation | | | 56,360,000 | | | $ | 0 | | | $ | 0 | | | $ | 86,001 | | | $ | 4,497,120 | | |
| Binggrae Co., Ltd. | | | 535,090 | | | | 6,974,114 | | | | 0 | | | | 359,306 | | | | 22,409,169 | | |
| Chargeurs SA + | | | 790,182 | | | | 0 | | | | 0 | | | | 0 | | | | 27,866,906 | | |
| Kongsberg Automotive ASA | | | 3,527,500 | | | | 1,687,076 | | | | 0 | | | | 0 | | | | 31,338,532 | | |
| Lectra* | | | 1,709,779 | | | | 0 | | | | 3,654,490 | | | | 0 | | | | 14,412,092 | | |
| Media Prima Berhad | | | 50,212,300 | | | | 2,709,439 | | | | 0 | | | | 0 | | | | 36,016,342 | | |
| Morse plc | | | 15,231,000 | | | | 0 | | | | 0 | | | | 1,142,315 | | | | 27,799,330 | | |
| Veda Advantage Limited | | | 17,001,000 | | | | 15,900,070 | | | | 0 | | | | 3,501,373 | | | | 45,118,070 | | |
| Vitec Group plc | | | 2,780,379 | | | | 0 | | | | 0 | | | | 0 | | | | 32,499,931 | | |
| TOTALS | | | | | | $ | 27,270,699 | | | $ | 3,654,490 | | | $ | 5,088,995 | | | $ | 241,957,492 | | |
* Due to transactions during the six-month period ended March 31, 2007, the company is no longer an affiliated security.
** Position in issuer liquidated during the six-month period ended March 31, 2007.
+ Non-income producing security.
THE OAKMARK FUNDS
71
THE OAKMARK FUNDS
FINANCIAL HIGHLIGHTS
The following tables are intended to help you understand each Fund's financial performance during the last 51/2 years (or since it began operations, if less than five years). Certain information reflects financial results for a single Fund share. Total returns represent the rate you would have earned (or less) on an investment, assuming reinvestment of all dividends and distributions. The information for the period ended March 31, 2007, is unaudited, and each Fund's financial statements, is included in this report. Deloitte & Touche LLP, an independent registered accounting firm has audited the information for the fiscal years ended September 30, 2006, 2005, 2004, 2003 and 2002. For each year shown, all information is for the fiscal year ended September 30, unless otherwise noted.
THE OAKMARK FUNDS
72
THE OAKMARK FUND
Financial Highlights–Class I
For a share outstanding throughout each period
| | | Period Ended
March 31,
2007
(Unaudited) | | Year Ended
September 30,
2006 | | Year Ended
September 30,
2005 | | Year Ended
September 30,
2004 | | Year Ended
September 30,
2003 | | Year Ended
September 30,
2002 | |
| Net Asset Value, Beginning of Period | | $ | 44.64 | | | $ | 40.75 | | | $ | 38.68 | | | $ | 33.85 | | | $ | 28.08 | | | $ | 32.01 | | |
| Income From Investment Operations: | |
| Net Investment Income | | | 0.25 | (a) | | | 0.39 | (a) | | | 0.34 | | | | 0.16 | | | | 0.13 | | | | 0.12 | | |
Net Gain (Loss) on Investments
(both realized and unrealized) | | | 3.34 | | | | 3.85 | | | | 1.90 | | | | 4.81 | | | | 5.75 | | | | (3.85 | ) | |
| Total From Investment Operations | | | 3.59 | | | | 4.24 | | | | 2.24 | | | | 4.97 | | | | 5.88 | | | | (3.73 | ) | |
| Less Distributions: | |
| Dividends (from net investment income) | | | (0.43 | ) | | | (0.35 | ) | | | (0.17 | ) | | | (0.14 | ) | | | (0.11 | ) | | | (0.20 | ) | |
| Distributions (from capital gains) | | | (2.00 | ) | | | 0.00 | | | | 0.00 | | | | 0.00 | | | | 0.00 | | | | 0.00 | | |
| Total Distributions | | | (2.43 | ) | | | (0.35 | ) | | | (0.17 | ) | | | (0.14 | ) | | | (0.11 | ) | | | (0.20 | ) | |
| Redemption Fees | | | 0.00 | (b) | | | 0.00 | (b) | | | 0.00 | (b) | | | 0.00 | (b) | | | 0.00 | | | | 0.00 | | |
| Net Asset Value, End of Period | | $ | 45.80 | | | $ | 44.64 | | | $ | 40.75 | | | $ | 38.68 | | | $ | 33.85 | | | $ | 28.08 | | |
| Total Return | | | 8.02 | % | | | 10.46 | % | | | 5.79 | % | | | 14.73 | % | | | 20.99 | % | | | (11.77 | )% | |
| Ratios/Supplemental Data: | |
| Net Assets, End of Period ($million) | | $ | 5,805.8 | | | $ | 5,486.2 | | | $ | 6,340.4 | | | $ | 6,474.0 | | | $ | 4,769.4 | | | $ | 3,300.9 | | |
| Ratio of Expenses to Average Net Assets | | | 1.02 | %* | | | 1.05 | %** | | | 1.03 | %** | | | 1.05 | % | | | 1.14 | % | | | 1.17 | % | |
| Ratio of Net Investment Income to Average Net Assets | | | 1.09 | %* | | | 0.94 | % | | | 0.79 | % | | | 0.47 | % | | | 0.48 | % | | | 0.38 | % | |
| Portfolio Turnover Rate | | | 6 | % | | | 9 | % | | | 16 | % | | | 19 | % | | | 21 | % | | | 44 | % | |
Financial Highlights–Class II
For a share outstanding throughout each period
| | | Period Ended
March 31,
2007
(Unaudited) | | Year Ended
September 30,
2006 | | Year Ended
September 30,
2005 | | Year Ended
September 30,
2004 | | Year Ended
September 30,
2003 | | Year Ended
September 30,
2002 | |
| Net Asset Value, Beginning of Period | | $ | 44.35 | | | $ | 40.51 | | | $ | 38.45 | | | $ | 33.68 | | | $ | 28.04 | | | $ | 31.97 | | |
| Income From Investment Operations: | |
| Net Investment Income | | | 0.17 | (a) | | | 0.25 | (a) | | | 0.26 | (a) | | | 0.04 | (a) | | | 0.05 | (a) | | | 0.16 | | |
Net Gain (Loss) on Investments
(both realized and unrealized) | | | 3.31 | | | | 3.82 | | | | 1.87 | | | | 4.78 | | | | 5.69 | | | | (3.92 | ) | |
| Total From Investment Operations | | | 3.48 | | | | 4.07 | | | | 2.13 | | | | 4.82 | | | | 5.74 | | | | (3.76 | ) | |
| Less Distributions: | |
| Dividends (from net investment income) | | | (0.25 | ) | | | (0.23 | ) | | | (0.07 | ) | | | (0.05 | ) | | | (0.10 | ) | | | (0.17 | ) | |
| Distributions (from capital gains) | | | (2.00 | ) | | | 0.00 | | | | 0.00 | | | | 0.00 | | | | 0.00 | | | | 0.00 | | |
| Total Distributions | | | (2.25 | ) | | | (0.23 | ) | | | (0.07 | ) | | | (0.05 | ) | | | (0.10 | ) | | | (0.17 | ) | |
| Redemption Fees | | | 0.00 | (b) | | | 0.00 | (b) | | | 0.00 | | | | 0.00 | | | | 0.00 | | | | 0.00 | | |
| Net Asset Value, End of Period | | $ | 45.58 | | | $ | 44.35 | | | $ | 40.51 | | | $ | 38.45 | | | $ | 33.68 | | | $ | 28.04 | | |
| Total Return | | | 7.83 | % | | | 10.08 | % | | | 5.55 | % | | | 14.32 | % | | | 20.52 | % | | | (11.85 | )% | |
| Ratios/Supplemental Data: | |
| Net Assets, End of Period ($million) | | $ | 36.2 | | | $ | 37.5 | | | $ | 43.7 | | | $ | 51.9 | | | $ | 21.1 | | | $ | 7.7 | | |
| Ratio of Expenses to Average Net Assets | | | 1.36 | %* | | | 1.40 | %** | | | 1.26 | %** | | | 1.40 | % | | | 1.53 | % | | | 1.44 | % | |
| Ratio of Net Investment Income to Average Net Assets | | | 0.76 | %* | | | 0.59 | % | | | 0.58 | % | | | 0.11 | % | | | 0.06 | % | | | 0.35 | % | |
| Portfolio Turnover Rate | | | 6 | % | | | 9 | % | | | 16 | % | | | 19 | % | | | 21 | % | | | 44 | % | |
* Data has been annualized.
** The ratio excludes expense offset arrangement.
(a) Computed using average shares outstanding throughout the period.
(b) Amount rounds to less than $0.01 per share.
See accompanying Notes to Financial Statements.
THE OAKMARK FUNDS
73
THE OAKMARK SELECT FUND
Financial Highlights–Class I
For a share outstanding throughout each period
| | | Period Ended
March 31,
2007
(Unaudited) | | Year Ended
September 30,
2006 | | Year Ended
September 30,
2005 | | Year Ended
September 30,
2004 | | Year Ended
September 30,
2003 | | Year Ended
September 30,
2002 | |
| Net Asset Value, Beginning of Period | | $ | 34.48 | | | $ | 33.44 | | | $ | 31.20 | | | $ | 27.55 | | | $ | 21.67 | | | $ | 25.20 | | |
| Income From Investment Operations: | |
| Net Investment Income | | | 0.22 | (a) | | | 0.36 | (a) | | | 0.29 | | | | 0.15 | (a) | | | 0.05 | | | | 0.02 | | |
Net Gain (Loss) on Investments
(both realized and unrealized) | | | 1.99 | | | | 2.76 | | | | 2.19 | | | | 3.60 | | | | 5.85 | | | | (3.50 | ) | |
| Total From Investment Operations | | | 2.21 | | | | 3.12 | | | | 2.48 | | | | 3.75 | | | | 5.90 | | | | (3.48 | ) | |
| Less Distributions: | |
| Dividends (from net investment income) | | | (0.39 | ) | | | (0.29 | ) | | | (0.24 | ) | | | (0.10 | ) | | | (0.02 | ) | | | (0.05 | ) | |
| Distributions (from capital gains) | | | (3.53 | ) | | | (1.79 | ) | | | 0.00 | | | | 0.00 | | | | 0.00 | | | | 0.00 | | |
| Total Distributions | | | (3.92 | ) | | | (2.08 | ) | | | (0.24 | ) | | | (0.10 | ) | | | (0.02 | ) | | | (0.05 | ) | |
| Redemption Fees | | | 0.00 | (b) | | | 0.00 | (b) | | | 0.00 | (b) | | | 0.00 | (b) | | | 0.00 | | | | 0.00 | | |
| Net Asset Value, End of Period | | $ | 32.77 | | | $ | 34.48 | | | $ | 33.44 | | | $ | 31.20 | | | $ | 27.55 | | | $ | 21.67 | | |
| Total Return | | | 6.09 | % | | | 9.58 | % | | | 7.98 | % | | | 13.64 | % | | | 27.25 | % | | | (13.85 | )% | |
| Ratios/Supplemental Data: | |
| Net Assets, End of Period ($million) | | $ | 5,809.9 | | | $ | 5,776.6 | | | $ | 5,908.0 | | | $ | 5,463.0 | | | $ | 4,993.0 | | | $ | 3,717.6 | | |
| Ratio of Expenses to Average Net Assets | | | 0.98 | %*† | | | 0.99 | %† | | | 1.00 | %† | | | 1.00 | % | | | 1.02 | % | | | 1.07 | % | |
| Ratio of Net Investment Income to Average Net Assets | | | 1.30 | %* | | | 1.08 | % | | | 0.87 | % | | | 0.50 | % | | | 0.23 | % | | | 0.09 | % | |
| Portfolio Turnover Rate | | | 4 | % | | | 22 | % | | | 21 | % | | | 14 | % | | | 20 | % | | | 32 | % | |
Financial Highlights–Class II
For a share outstanding throughout each period
| | | Period Ended
March 31,
2007
(Unaudited) | | Year Ended
September 30,
2006 | | Year Ended
September 30,
2005 | | Year Ended
September 30,
2004 | | Year Ended
September 30,
2003 | | Year Ended
September 30,
2002 | |
| Net Asset Value, Beginning of Period | | $ | 34.23 | | | $ | 33.24 | | | $ | 31.00 | | | $ | 27.37 | | | $ | 21.56 | | | $ | 25.10 | | |
| Income From Investment Operations: | |
| Net Investment Income (Loss) | | | 0.16 | (a) | | | 0.26 | (a) | | | 0.21 | | | | 0.09 | (a) | | | 0.00 | (b) | | | (0.04 | ) | |
Net Gain (Loss) on Investments
(both realized and unrealized) | | | 1.98 | | | | 2.72 | | | | 2.18 | | | | 3.58 | | | | 5.81 | | | | (3.50 | ) | |
| Total From Investment Operations | | | 2.14 | | | | 2.98 | | | | 2.39 | | | | 3.67 | | | | 5.81 | | | | (3.54 | ) | |
| Less Distributions: | |
| Dividends (from net investment income) | | | (0.24 | ) | | | (0.20 | ) | | | (0.15 | ) | | | (0.04 | ) | | | 0.00 | | | | 0.00 | | |
| Distributions (from capital gains) | | | (3.53 | ) | | | (1.79 | ) | | | 0.00 | | | | 0.00 | | | | 0.00 | | | | 0.00 | | |
| Total Distributions | | | (3.77 | ) | | | (1.99 | ) | | | (0.15 | ) | | | (0.04 | ) | | | 0.00 | | | | 0.00 | | |
| Redemption Fees | | | 0.00 | (b) | | | 0.00 | (b) | | | 0.00 | | | | 0.00 | | | | 0.00 | | | | 0.00 | | |
| Net Asset Value, End of Period | | $ | 32.60 | | | $ | 34.23 | | | $ | 33.24 | | | $ | 31.00 | | | $ | 27.37 | | | $ | 21.56 | | |
| Total Return | | | 5.93 | % | | | 9.18 | % | | | 7.72 | % | | | 13.40 | % | | | 26.95 | % | | | (14.10 | )% | |
| Ratios/Supplemental Data: | |
| Net Assets, End of Period ($million) | | $ | 56.4 | | | $ | 68.1 | | | $ | 85.2 | | | $ | 98.0 | | | $ | 93.1 | | | $ | 64.4 | | |
| Ratio of Expenses to Average Net Assets | | | 1.37 | %*† | | | 1.34 | %† | | | 1.25 | %† | | | 1.21 | % | | | 1.29 | % | | | 1.36 | % | |
Ratio of Net Investment Income (Loss) to Average
Net Assets | | | 0.96 | %* | | | 0.78 | % | | | 0.65 | % | | | 0.29 | % | | | (0.04 | )% | | | (0.19 | )% | |
| Portfolio Turnover Rate | | | 4 | % | | | 22 | % | | | 21 | % | | | 14 | % | | | 20 | % | | | 32 | % | |
* Data has been annualized.
† The ratio excludes expense offset arrangement.
(a) Computed using average shares outstanding throughout the period.
(b) Amount rounds to less than $0.01 per share.
THE OAKMARK FUNDS
74
THE OAKMARK EQUITY AND INCOME FUND
Financial Highlights–Class I
For a share outstanding throughout each period
| | | Period Ended
March 31,
2007
(Unaudited) | | Year Ended
September 30,
2006 | | Year Ended
September 30,
2005 | | Year Ended
September 30,
2004 | | Year Ended
September 30,
2003 | | Year Ended
September 30,
2002 | |
| Net Asset Value, Beginning of Period | | $ | 26.49 | | | $ | 25.41 | | | $ | 23.12 | | | $ | 20.30 | | | $ | 17.18 | | | $ | 17.45 | | |
| Income From Investment Operations: | |
| Net Investment Income | | | 0.29 | (a) | | | 0.44 | | | | 0.31 | | | | 0.15 | | | | 0.17 | | | | 0.33 | (a) | |
Net Gain (Loss) on Investments
(both realized and unrealized) | | | 1.74 | | | | 1.18 | | | | 2.77 | | | | 2.81 | | | | 3.19 | | | | (0.40 | ) | |
| Total From Investment Operations | | | 2.03 | | | | 1.62 | | | | 3.08 | | | | 2.96 | | | | 3.36 | | | | (0.07 | ) | |
| Less Distributions: | |
| Dividends (from net investment income) | | | (0.50 | ) | | | (0.34 | ) | | | (0.20 | ) | | | (0.14 | ) | | | (0.24 | ) | | | (0.16 | ) | |
| Distributions (from capital gains) | | | (1.31 | ) | | | (0.20 | ) | | | (0.59 | ) | | | 0.00 | | | | 0.00 | | | | (0.04 | ) | |
| Total Distributions | | | (1.81 | ) | | | (0.54 | ) | | | (0.79 | ) | | | (0.14 | ) | | | (0.24 | ) | | | (0.20 | ) | |
| Redemption Fees | | | 0.00 | (b) | | | 0.00 | (b) | | | 0.00 | (b) | | | 0.00 | (b) | | | 0.00 | | | | 0.00 | | |
| Net Asset Value, End of Period | | $ | 26.71 | | | $ | 26.49 | | | $ | 25.41 | | | $ | 23.12 | | | $ | 20.30 | | | $ | 17.18 | | |
| Total Return | | | 7.85 | % | | | 6.51 | % | | | 13.65 | % | | | 14.64 | % | | | 19.75 | % | | | (0.47 | )% | |
| Ratios/Supplemental Data: | |
| Net Assets, End of Period ($million) | | $ | 11,542.8 | | | $ | 10,414.5 | | | $ | 9,223.2 | | | $ | 7,577.9 | | | $ | 4,138.0 | | | $ | 2,241.9 | | |
| Ratio of Expenses to Average Net Assets | | | 0.84 | %* | | | 0.86 | %** | | | 0.89 | %** | | | 0.92 | % | | | 0.93 | % | | | 0.96 | % | |
| Ratio of Net Investment Income to Average Net Assets | | | 2.22 | %* | | | 1.88 | % | | | 1.36 | % | | | 0.78 | % | | | 1.07 | % | | | 1.71 | % | |
| Portfolio Turnover Rate | | | 19 | % | | | 81 | % | | | 112 | % | | | 72 | % | | | 48 | % | | | 73 | % | |
Financial Highlights–Class II
For a share outstanding throughout each period
| | | Period Ended
March 31,
2007
(Unaudited) | | Year Ended
September 30,
2006 | | Year Ended
September 30,
2005 | | Year Ended
September 30,
2004 | | Year Ended
September 30,
2003 | | Year Ended
September 30,
2002 | |
| Net Asset Value, Beginning of Period | | $ | 26.35 | | | $ | 25.29 | | | $ | 23.03 | | | $ | 20.24 | | | $ | 17.15 | | | $ | 17.40 | | |
| Income From Investment Operations: | |
| Net Investment Income | | | 0.25 | (a) | | | 0.35 | | | | 0.28 | | | | 0.11 | | | | 0.16 | | | | 0.30 | (a) | |
Net Gain (Loss) on Investments
(both realized and unrealized) | | | 1.73 | | | | 1.19 | | | | 2.72 | | | | 2.79 | | | | 3.15 | | | | (0.40 | ) | |
| Total From Investment Operations | | | 1.98 | | | | 1.54 | | | | 3.00 | | | | 2.90 | | | | 3.31 | | | | (0.10 | ) | |
| Less Distributions: | |
| Dividends (from net investment income) | | | (0.42 | ) | | | (0.28 | ) | | | (0.15 | ) | | | (0.11 | ) | | | (0.22 | ) | | | (0.11 | ) | |
| Distributions (from capital gains) | | | (1.31 | ) | | | (0.20 | ) | | | (0.59 | ) | | | 0.00 | | | | 0.00 | | | | (0.04 | ) | |
| Total Distributions | | | (1.73 | ) | | | (0.48 | ) | | | (0.74 | ) | | | (0.11 | ) | | | (0.22 | ) | | | (0.15 | ) | |
| Redemption Fees | | | 0.00 | (b) | | | 0.00 | (b) | | | 0.00 | | | | 0.00 | | | | 0.00 | | | | 0.00 | | |
| Net Asset Value, End of Period | | $ | 26.60 | | | $ | 26.35 | | | $ | 25.29 | | | $ | 23.03 | | | $ | 20.24 | | | $ | 17.15 | | |
| Total Return | | | 7.69 | % | | | 6.18 | % | | | 13.34 | % | | | 14.36 | % | | | 19.46 | % | | | (0.60 | )% | |
| Ratios/Supplemental Data: | |
| Net Assets, End of Period ($million) | | $ | 835.0 | | | $ | 718.1 | | | $ | 582.0 | | | $ | 478.7 | | | $ | 246.6 | | | $ | 118.7 | | |
| Ratio of Expenses to Average Net Assets | | | 1.18 | %* | | | 1.18 | %** | | | 1.14 | %** | | | 1.17 | % | | | 1.17 | % | | | 1.20 | % | |
| Ratio of Net Investment Income to Average Net Assets | | | 1.90 | %* | | | 1.57 | % | | | 1.11 | % | | | 0.53 | % | | | 0.84 | % | | | 1.50 | % | |
| Portfolio Turnover Rate | | | 19 | % | | | 81 | % | | | 112 | % | | | 72 | % | | | 48 | % | | | 73 | % | |
* Data has been annualized.
** The ratio excludes expense offset arrangements.
(a) Computed using average shares outstanding throughout the period.
(b) Amount rounds to less than $0.01 per share.
See accompanying Notes to Financial Statements.
THE OAKMARK FUNDS
75
THE OAKMARK GLOBAL FUND
Financial Highlights–Class I
For a share outstanding throughout each period
| | | Period Ended
March 31,
2007
(Unaudited) | | Year Ended
September 30,
2006 | | Year Ended
September 30,
2005 | | Year Ended
September 30,
2004 | | Year Ended
September 30,
2003 | | Year Ended
September 30,
2002 | |
| Net Asset Value, Beginning of Period | | $ | 26.69 | | | $ | 23.91 | | | $ | 19.73 | | | $ | 16.98 | | | $ | 11.30 | | | $ | 10.83 | | |
| Income From Investment Operations: | |
| Net Investment Income | | | 0.04 | (a) | | | 0.27 | | | | 0.17 | | | | 0.09 | | | | 0.01 | | | | 0.00 | (a)(b) | |
Net Gain (Loss) on Investments
(both realized and unrealized) | | | 3.66 | | | | 3.74 | | | | 4.48 | | | | 2.71 | | | | 5.67 | | | | 0.76 | (c) | |
| Total From Investment Operations | | | 3.70 | | | | 4.01 | | | | 4.65 | | | | 2.80 | | | | 5.68 | | | | 0.76 | | |
| Less Distributions: | |
| Dividends (from net investment income) | | | (0.31 | ) | | | (0.26 | ) | | | (0.10 | ) | | | 0.00 | (b) | | | 0.00 | | | | 0.00 | | |
| Distributions (from capital gains) | | | (3.54 | ) | | | (0.97 | ) | | | (0.37 | ) | | | (0.05 | ) | | | 0.00 | | | | (0.29 | ) | |
| Total Distributions | | | (3.85 | ) | | | (1.23 | ) | | | (0.47 | ) | | | (0.05 | ) | | | 0.00 | | | | (0.29 | ) | |
| Redemption Fees | | | 0.00 | (b) | | | 0.00 | (b) | | | 0.00 | (b) | | | 0.00 | (b) | | | 0.00 | | | | 0.00 | | |
| Net Asset Value, End of Period | | $ | 26.54 | | | $ | 26.69 | | | $ | 23.91 | | | $ | 19.73 | | | $ | 16.98 | | | $ | 11.30 | | |
| Total Return | | | 14.64 | % | | | 17.46 | % | | | 23.88 | % | | | 16.54 | % | | | 50.27 | % | | | 6.84 | % | |
| Ratios/Supplemental Data: | |
| Net Assets, End of Period ($million) | | $ | 2,762.1 | | | $ | 2,282.2 | | | $ | 1,842.9 | | | $ | 1,336.3 | | | $ | 704.8 | | | $ | 175.6 | | |
| Ratio of Expenses to Average Net Assets | | | 1.14 | %* | | | 1.18 | %** | | | 1.20 | %** | | | 1.26 | % | | | 1.28 | % | | | 1.55 | % | |
Ratio of Net Investment Income (Loss)
to Average Net Assets | | | 0.30 | %* | | | 1.18 | % | | | 0.81 | % | | | 0.47 | % | | | 0.00 | %(d) | | | (0.01 | )% | |
| Portfolio Turnover Rate | | | 17 | % | | | 41 | % | | | 17 | % | | | 16 | % | | | 42 | % | | | 86 | % | |
* Data has been annualized.
** The ratio excludes expense offset arrangement.
(a) Computed using average shares outstanding throughout the period.
(b) Amount rounds to less than $0.01 per share.
(c) The amount shown for a share outstanding does not correspond with the aggregate net realized and unrealized gain/loss for the period due to the timing of purchases and redemptions of Fund shares in relation to the fluctuating net asset value per share of the class.
(d) Amount rounds to less than 0.01%.
THE OAKMARK FUNDS
76
THE OAKMARK GLOBAL FUND
Financial Highlights–Class II
For a share outstanding throughout each period
| | | Period Ended
March 31,
2007
(Unaudited) | | Year Ended
September 30,
2006 | | Year Ended
September 30,
2005 | | Year Ended
September 30,
2004 | | Year Ended
September 30,
2003 | | October 10, 2001
through
September 30,
2002 (a) | |
| Net Asset Value, Beginning of Period | | $ | 26.31 | | | $ | 23.63 | | | $ | 19.53 | | | $ | 16.84 | | | $ | 11.24 | | | $ | 11.25 | | |
| Income From Investment Operations: | |
| Net Investment Income (Loss) | | | (0.01 | )(b) | | | 0.18 | | | | 0.11 | | | | 0.05 | | | | 0.02 | | | | (0.03 | ) | |
Net Gain (Loss) on Investments
(both realized and unrealized) | | | 3.61 | | | | 3.69 | | | | 4.43 | | | | 2.69 | | | | 5.58 | | | | 0.31 | (c) | |
| Total From Investment Operations | | | 3.60 | | | | 3.87 | | | | 4.54 | | | | 2.74 | | | | 5.60 | | | | 0.28 | | |
| Less Distributions: | |
| Dividends (from net investment income) | | | (0.21 | ) | | | (0.22 | ) | | | (0.07 | ) | | | 0.00 | | | | 0.00 | | | | 0.00 | | |
| Distributions (from capital gains) | | | (3.54 | ) | | | (0.97 | ) | | | (0.37 | ) | | | (0.05 | ) | | | 0.00 | | | | (0.29 | ) | |
| Total Distributions | | | (3.75 | ) | | | (1.19 | ) | | | (0.44 | ) | | | (0.05 | ) | | | 0.00 | | | | (0.29 | ) | |
| Redemption Fees | | | 0.00 | (d) | | | 0.00 | (d) | | | 0.00 | | | | 0.00 | | | | 0.00 | | | | 0.00 | | |
| Net Asset Value, End of Period | | $ | 26.16 | | | $ | 26.31 | | | $ | 23.63 | | | $ | 19.53 | | | $ | 16.84 | | | $ | 11.24 | | |
| Total Return | | | 14.44 | % | | | 17.01 | % | | | 23.53 | % | | | 16.32 | % | | | 49.82 | % | | | 2.31 | % | |
| Ratios/Supplemental Data: | |
| Net Assets, End of Period ($million) | | $ | 87.9 | | | $ | 77.1 | | | $ | 58.6 | | | $ | 24.7 | | | $ | 5.8 | | | $ | 0.6 | | |
| Ratio of Expenses to Average Net Assets | | | 1.53 | %* | | | 1.56 | %** | | | 1.45 | %** | | | 1.50 | % | | | 1.46 | % | | | 1.86 | % | |
Ratio of Net Investment Income (Loss)
to Average Net Assets | | | (0.09 | )%* | | | 0.80 | % | | | 0.63 | % | | | 0.37 | % | | | (0.01 | )% | | | (0.26 | )% | |
| Portfolio Turnover Rate | | | 17 | % | | | 41 | % | | | 17 | % | | | 16 | % | | | 42 | % | | | 86 | % | |
* Data has been annualized.
** The ratio excludes expense offset arrangement.
(a) The date on which Class II shares were first offered for sale to the public was October 10, 2001.
(b) Computed using average shares outstanding throughout the period.
(c) The amount shown for a share outstanding does not correspond with the aggregate net realized and unrealized gain/loss for the period due to the timing of purchases and redemptions of Fund shares in relation to the fluctuating net asset value per share of the class.
(d) Amount rounds to less than $0.01 per share
See accompanying Notes to Financial Statements.
THE OAKMARK FUNDS
77
THE OAKMARK GLOBAL SELECT FUND
Financial Highlights–Class I
For a share outstanding throughout each period
| | | October 2, 2006
through
March 31,
2007 (a)
(Unaudited) | |
| Net Asset Value, Beginning of Period | | $ | 10.00 | | |
| Income From Investment Operations: | |
| Net Investment Income | | | 0.05 | (b) | |
| Net Gain (Loss) on Investments (both realized and unrealized) | | | 1.14 | | |
| Total From Investment Operations | | | 1.19 | | |
| Less Distributions: | |
| Dividends (from net investment income) | | | (0.01 | ) | |
| Total Distributions | | | (0.01 | ) | |
| Redemption Fees | | | 0.00 | (c) | |
| Net Asset Value, End of Period | | $ | 11.18 | | |
| Total Return | | | 11.92 | %* | |
| Ratios/Supplemental Data: | |
| Net Assets, End of Period ($million) | | $ | 229.6 | | |
| Ratio of Expenses to Average Net Assets | | | 1.43 | %** | |
| Ratio of Net Investment Income to Average Net Assets | | | 0.96 | %** | |
| Portfolio Turnover Rate | | | 14 | % | |
* Data has not been annualized.
** Data has been annualized.
(a) The date on which Fund shares were first offered for sale to the public was October 2, 2006.
(b) Computed using average shares outstanding throughout the period.
(c) Amount rounds to less than $0.01 per share.
THE OAKMARK FUNDS
78
THE OAKMARK INTERNATIONAL FUND
Financial Highlights–Class I
For a share outstanding throughout each period
| | | Period Ended
March 31,
2007
(Unaudited) | | Year Ended
September 30,
2006 | | Year Ended
September 30,
2005 | | Year Ended
September 30,
2004 | | Year Ended
September 30,
2003 | | Year Ended
September 30,
2002 | |
| Net Asset Value, Beginning of Period | | $ | 26.83 | | | $ | 23.52 | | | $ | 18.98 | | | $ | 15.67 | | | $ | 12.17 | | | $ | 12.51 | | |
| Income From Investment Operations: | |
| Net Investment Income | | | 0.12 | (a) | | | 0.41 | | | | 0.27 | | | | 0.24 | | | | 0.11 | | | | 0.14 | | |
Net Gain (Loss) on Investments
(both realized and unrealized) | | | 3.67 | | | | 4.49 | | | | 4.59 | | | | 3.18 | | | | 3.52 | | | | (0.31 | ) | |
| Total From Investment Operations | | | 3.79 | | | | 4.90 | | | | 4.86 | | | | 3.42 | | | | 3.63 | | | | (0.17 | ) | |
| Less Distributions: | |
| Dividends (from net investment income) | | | (0.44 | ) | | | (0.59 | ) | | | (0.27 | ) | | | (0.11 | ) | | | (0.13 | ) | | | (0.17 | ) | |
| Distributions (from capital gains) | | | (3.48 | ) | | | (1.00 | ) | | | (0.05 | ) | | | 0.00 | | | | 0.00 | | | | 0.00 | | |
| Total Distributions | | | (3.92 | ) | | | (1.59 | ) | | | (0.32 | ) | | | (0.11 | ) | | | (0.13 | ) | | | (0.17 | ) | |
| Redemption Fees | | | 0.00 | (b) | | | 0.00 | (b) | | | 0.00 | (b) | | | 0.00 | (b) | | | 0.00 | | | | 0.00 | | |
| Net Asset Value, End of Period | | $ | 26.70 | | | $ | 26.83 | | | $ | 23.52 | | | $ | 18.98 | | | $ | 15.67 | | | $ | 12.17 | | |
| Total Return | | | 15.01 | % | | | 22.14 | % | | | 25.85 | % | | | 21.92 | % | | | 29.97 | % | | | (1.53 | )% | |
| Ratios/Supplemental Data: | |
| Net Assets, End of Period ($million) | | $ | 8,582.3 | | | $ | 7,200.5 | | | $ | 5,627.4 | | | $ | 4,036.9 | | | $ | 2,676.6 | | | $ | 1,393.8 | | |
| Ratio of Expenses to Average Net Assets | | | 1.04 | %* | | | 1.08 | %** | | | 1.11 | %** | | | 1.20 | % | | | 1.25 | % | | | 1.31 | % | |
| Ratio of Net Investment Income to Average Net Assets | | | 0.90 | %* | | | 1.80 | % | | | 1.32 | % | | | 1.40 | % | | | 1.03 | % | | | 1.34 | % | |
| Portfolio Turnover Rate | | | 25 | % | | | 37 | % | | | 14 | % | | | 21 | % | | | 34 | % | | | 24 | % | |
Financial Highlights–Class II
For a share outstanding throughout each period
| | | Period Ended
March 31,
2007
(Unaudited) | | Year Ended
September 30,
2006 | | Year Ended
September 30,
2005 | | Year Ended
September 30,
2004 | | Year Ended
September 30,
2003 | | Year Ended
September 30,
2002 | |
| Net Asset Value, Beginning of Period | | $ | 26.61 | | | $ | 23.36 | | | $ | 18.86 | | | $ | 15.58 | | | $ | 12.13 | | | $ | 12.47 | | |
| Income From Investment Operations: | |
| Net Investment Income | | | 0.07 | (a) | | | 0.34 | | | | 0.22 | | | | 0.18 | | | | 0.08 | | | | 0.15 | | |
Net Gain (Loss) on Investments
(both realized and unrealized) | | | 3.63 | | | | 4.45 | | | | 4.55 | | | | 3.16 | | | | 3.48 | | | | (0.37 | ) | |
| Total From Investment Operations | | | 3.70 | | | | 4.79 | | | | 4.77 | | | | 3.34 | | | | 3.56 | | | | (0.22 | ) | |
| Less Distributions: | |
| Dividends (from net investment income) | | | (0.35 | ) | | | (0.54 | ) | | | (0.22 | ) | | | (0.06 | ) | | | (0.11 | ) | | | (0.12 | ) | |
| Distributions (from capital gains) | | | (3.48 | ) | | | (1.00 | ) | | | (0.05 | ) | | | 0.00 | | | | 0.00 | | | | 0.00 | | |
| Total Distributions | | | (3.83 | ) | | | (1.54 | ) | | | (0.27 | ) | | | (0.06 | ) | | | (0.11 | ) | | | (0.12 | ) | |
| Redemption Fees | | | 0.00 | (b) | | | 0.00 | (b) | | | 0.00 | | | | 0.00 | | | | 0.00 | | | | 0.00 | | |
| Net Asset Value, End of Period | | $ | 26.48 | | | $ | 26.61 | | | $ | 23.36 | | | $ | 18.86 | | | $ | 15.58 | | | $ | 12.13 | | |
| Total Return | | | 14.73 | % | | | 21.71 | % | | | 25.50 | % | | | 21.52 | % | | | 29.52 | % | | | (1.76 | )% | |
| Ratios/Supplemental Data: | |
| Net Assets, End of Period ($million) | | $ | 655.1 | | | $ | 496.0 | | | $ | 362.9 | | | $ | 259.2 | | | $ | 123.2 | | | $ | 48.5 | | |
| Ratio of Expenses to Average Net Assets | | | 1.42 | %* | | | 1.47 | %** | | | 1.38 | %** | | | 1.53 | % | | | 1.67 | % | | | 1.58 | % | |
| Ratio of Net Investment Income to Average Net Assets | | | 0.55 | %* | | | 1.43 | % | | | 1.08 | % | | | 1.18 | % | | | 0.69 | % | | | 1.33 | % | |
| Portfolio Turnover Rate | | | 25 | % | | | 37 | % | | | 14 | % | | | 21 | % | | | 34 | % | | | 24 | % | |
* Data has been annualized.
** The ratio excludes expense offset arrangement.
(a) Computed using average shares outstanding throughout he period.
(b) Amount rounds to less than $0.01 per share.
See accompanying Notes to Financial Statements.
THE OAKMARK FUNDS
79
THE OAKMARK INTERNATIONAL SMALL CAP FUND
Financial Highlights–Class I
For a share outstanding throughout each period
| | | Period Ended
March 31,
2007
(Unaudited) | | Year Ended
September 30,
2006 | | Year Ended
September 30,
2005 | | Year Ended
September 30,
2004 | | Year Ended
September 30,
2003 | | Year Ended
September 30,
2002 | |
| Net Asset Value, Beginning of Period | | $ | 24.09 | | | $ | 22.79 | | | $ | 18.26 | | | $ | 13.74 | | | $ | 10.17 | | | $ | 10.00 | | |
| Income From Investment Operations: | |
| Net Investment Income | | | 0.12 | (a) | | | 0.42 | | | | 0.20 | | | | 0.11 | | | | 0.11 | | | | 0.11 | | |
Net Gain (Loss) on Investments
(both realized and unrealized) | | | 4.01 | | | | 5.12 | | | | 4.98 | | | | 4.52 | | | | 3.82 | | | | 0.36 | (b) | |
| Total From Investment Operations | | | 4.13 | | | | 5.54 | | | | 5.18 | | | | 4.63 | | | | 3.93 | | | | 0.47 | | |
| Less Distributions: | |
| Dividends (from net investment income) | | | (0.57 | ) | | | (0.70 | ) | | | (0.27 | ) | | | (0.12 | ) | | | (0.09 | ) | | | (0.16 | ) | |
| Distributions (from capital gains) | | | (3.43 | ) | | | (3.54 | ) | | | (0.38 | ) | | | 0.00 | | | | (0.27 | ) | | | (0.14 | ) | |
| Total Distributions | | | (4.00 | ) | | | (4.24 | ) | | | (0.65 | ) | | | (0.12 | ) | | | (0.36 | ) | | | (0.30 | ) | |
| Redemption Fees | | | 0.00 | (c) | | | 0.00 | (c) | | | 0.00 | (c) | | | 0.01 | | | | 0.00 | | | | 0.00 | | |
| Net Asset Value, End of Period | | $ | 24.22 | | | $ | 24.09 | | | $ | 22.79 | | | $ | 18.26 | | | $ | 13.74 | | | $ | 10.17 | | |
| Total Return | | | 18.39 | % | | | 28.50 | % | | | 29.04 | % | | | 33.94 | % | | | 39.78 | % | | | 4.68 | % | |
| Ratios/Supplemental Data: | |
| Net Assets, End of Period ($million) | | $ | 1,484.7 | | | $ | 1,274.5 | | | $ | 1,007.2 | | | $ | 734.1 | | | $ | 477.8 | | | $ | 357.7 | | |
| Ratio of Expenses to Average Net Assets | | | 1.34 | %* | | | 1.37 | %** | | | 1.41 | %** | | | 1.49 | % | | | 1.57 | % | | | 1.64 | % | |
| Ratio of Net Investment Income to Average Net Assets | | | 0.99 | %* | | | 1.73 | % | | | 0.96 | % | | | 0.72 | % | | | 0.99 | % | | | 1.28 | % | |
| Portfolio Turnover Rate | | | 28 | % | | | 44 | % | | | 47 | % | | | 29 | % | | | 30 | % | | | 42 | % | |
Financial Highlights–Class II
For a share outstanding throughout each period
| | | Period Ended
March 31,
2007
(Unaudited) | | Year Ended
September 30,
2006 | | Year Ended
September 30,
2005 | | Year Ended
September 30,
2004 | | Year Ended
September 30,
2003 | | Year Ended
September 30,
2002 | |
| Net Asset Value, Beginning of Period | | $ | 24.05 | | | $ | 22.77 | | | $ | 18.25 | | | $ | 13.69 | | | $ | 10.14 | | | $ | 9.97 | | |
| Income From Investment Operations: | |
| Net Investment Income | | | 0.11 | (a) | | | 0.41 | | | | 0.18 | | | | 0.13 | | | | 0.08 | | | | 0.13 | (a) | |
Net Gain (Loss) on Investments
(both realized and unrealized) | | | 4.00 | | | | 5.10 | | | | 4.98 | | | | 4.52 | | | | 3.81 | | | | 0.30 | (b) | |
| Total From Investment Operations | | | 4.11 | | | | 5.51 | | | | 5.16 | | | | 4.65 | | | | 3.89 | | | | 0.43 | | |
| Less Distributions: | |
| Dividends (from net investment income) | | | (0.55 | ) | | | (0.69 | ) | | | (0.26 | ) | | | (0.09 | ) | | | (0.07 | ) | | | (0.12 | ) | |
| Distributions (from capital gains) | | | (3.43 | ) | | | (3.54 | ) | | | (0.38 | ) | | | 0.00 | | | | (0.27 | ) | | | (0.14 | ) | |
| Total Distributions | | | (3.98 | ) | | | (4.23 | ) | | | (0.64 | ) | | | (0.09 | ) | | | (0.34 | ) | | | (0.26 | ) | |
| Redemption Fees | | | 0.00 | (c) | | | 0.00 | (c) | | | 0.00 | | | | 0.00 | | | | 0.00 | | | | 0.00 | | |
| Net Asset Value, End of Period | | $ | 24.18 | | | $ | 24.05 | | | $ | 22.77 | | | $ | 18.25 | | | $ | 13.69 | | | $ | 10.14 | | |
| Total Return | | | 18.33 | % | | | 28.33 | % | | | 28.94 | % | | | 34.11 | % | | | 39.39 | % | | | 4.25 | % | |
| Ratios/Supplemental Data: | |
| Net Assets, End of Period ($million) | | $ | 1.1 | | | $ | 0.8 | | | $ | 0.6 | | | $ | 0.5 | | | $ | 0.4 | | | $ | 0.3 | | |
| Ratio of Expenses to Average Net Assets | | | 1.41 | %* | | | 1.47 | %** | | | 1.49 | %** | | | 1.39 | % | | | 1.81 | % | | | 1.87 | % | |
| Ratio of Net Investment Income to Average Net Assets | | | 0.90 | %* | | | 1.62 | % | | | 0.87 | % | | | 0.75 | % | | | 0.72 | % | | | 1.06 | % | |
| Portfolio Turnover Rate | | | 28 | % | | | 44 | % | | | 47 | % | | | 29 | % | | | 30 | % | | | 42 | % | |
* Data has been annualized.
** The ratio excludes expense offset arrangement.
(a) Computed using average shares outstanding throughout the period.
(b) The amount shown for a share outstanding does not correspond with the aggregate net realized and unrealized gain/loss for the period due to the timing of purchases and redemption of Fund shares in relation to the fluctuating net asset value per share of the class.
(c) Amount rounds to less than $0.01 per share.
THE OAKMARK FUNDS
80
THE OAKMARK FUNDS DISCLOSURE REGARDING THE BOARD OF TRUSTEES' SEPTEMBER 2006 APPROVAL OF INVESTMENT ADVISORY CONTRACTS AS APPROVED APRIL 25, 2007
Each year, the Board of Trustees of the Oakmark Funds (the "Board"), including a majority of the independent Trustees, is required to determine whether to continue each Fund's investment advisory agreement (the "Agreements"). The Investment Company Act of 1940, as amended (the "1940 Act"), requires that the Board request and evaluate, and that the Funds' adviser (the "Adviser") provide, such information as may be reasonably necessary to evaluate the terms of the Agreements. The Board requests and receives a broad range of materials and information throughout the year and in connection with its annual review of the Agreements relating to the nature, extent and quality of the services provided by the Adviser to the Funds, including investment performance, portfolio trading practices and shareholder services. In addition, the Board retains an independent consultant to provide performance and expense information for each Fund and comparable fund s.
The Board's committee on management contracts (the "Committee") leads the Board in its evaluation of the Agreements. The Committee is comprised entirely of trustees who are not "interested persons" of the Funds as defined in the 1940 Act ("Independent Trustees"), and eighty percent of the Board is comprised of Independent Trustees. During the last year, the Committee and the Board met numerous times to consider the Agreements. At each of those meetings, the Committee and the Board were advised by, and met in executive session with, experienced independent legal counsel.
In determining whether to continue each Agreement, the Committee and the Board reviewed among other things: (i) the nature, quality and extent of the Adviser's services, (ii) the investment performance of each Fund as well as performance information for comparable funds, (iii) the fees and other expenses paid by each Fund as well as expense information for comparable funds, (iv) the Adviser's profitability from its relationship with each Fund, (v) whether economies of scale may be realized as each Fund grows and whether fee levels share with Fund investors economies of scale and (vi) other benefits to the Adviser from its relationship with the Funds.
At a meeting held on September 1, 2006, the Board, including all of the Independent Trustees, upon recommendation of the Committee and after negotiation of additional breakpoints in the schedule of fees for International Fund and International Small Cap Fund, determined that the continuation of the Agreement for each Fund was in the best interest of the Fund and its shareholders, and approved the continuation of the Agreements through October 31, 2007. Below is a summary of the principal information considered by the Board as well as the Board's conclusions regarding various factors. In their deliberations, the Independent Trustees did not identify any single factor that was paramount or dispositive, and each Independent Trustee may have weighed the information differently.
1. Nature, Extent and Quality of Services
The Board's consideration of the nature, extent and quality of the Adviser's services to the Funds took into account the knowledge gained from the Board's meetings with the Adviser throughout the prior year. In addition, the Board considered: the Adviser's long-term history of care and conscientiousness in the management of the Funds; the consistency of investment approach; the background and experience of the Adviser's investment personnel responsible for managing the Funds; the Adviser's performance as administrator of the Funds, including, among other things, in the areas of brokerage selection, trade execution, compliance and shareholder communications; and frequent favorable recognition of the Adviser and the Funds in the media and in industry publications. The Board also reviewed the Adviser's resources and key personnel involved in providing investment management services to the Funds, including the time that investment personnel devo te to each Fund and the investment results produced by the Adviser's in-house research. The Board also acknowledged the Adviser's decision to partially close a number of its investment strategies and the Board's actions, at the recommendation of the Adviser, to close or partially close a majority of the Funds to new investors to help control the pace of growth. The Board also noted the significant personal investments that the Adviser's personnel have made in the Funds, which further align the interests of the Adviser and its personnel with those of the Funds' shareholders. The Board concluded
THE OAKMARK FUNDS
81
that the nature, extent and quality of the services provided by the Adviser to each Fund were appropriate and consistent with the Fund's Agreement and that each Fund was likely to continue to benefit from services provided under its Agreement with the Adviser.
2. Investment Performance of the Funds
The Board considered each Fund's investment performance over various time periods, including comparative information provided by its consultant, Lipper Inc. ("Lipper"), an independent data service provider. Lipper was retained by the Board to prepare a study comparing each Fund's performance with that of comparable funds selected by Lipper (the "Performance Universe").
In addition to comparing each Fund's performance to that of its Performance Universe, the Board also considered the Fund's performance compared to that of its benchmark and other comparative data provided by Lipper, including the Fund's total return and performance relative to risk. After considering all of the information, the Board concluded that the Adviser was delivering favorable performance for each Fund consistent with the long-term investment strategies being pursued by the Fund and that the Fund and its shareholders were benefiting from the Adviser's investment management of the Fund.
3. Costs of Services Provided and Profits Realized by the Adviser
Using information provided by Lipper, the Board evaluated each Fund's advisory fee compared to the advisory fee for other mutual funds similar in size, character and investment strategy ("Expense Group"), and the Fund's expense ratio compared to that of the Expense Group.
The Board also reviewed the Adviser's advisory fees for its institutional separate accounts and for its subadvised funds (for which the Adviser provides portfolio management services only). The Board noted that, although in most instances, the fees paid by those clients generally were lower than the rates of fees paid by the Funds, the differences reflected the Adviser's significantly greater level of responsibilities and broader scope of services regarding the Funds, and the more extensive regulatory obligations and risks associated with managing the Funds.
The Board also considered the Adviser's costs in serving as the Fund's investment adviser and manager, including costs associated with technology, infrastructure and compliance necessary to manage the Funds. The Board reviewed the Adviser's methodology for allocating costs among the Adviser's lines of business. The Board also considered information regarding the structure of the Adviser's compensation program for portfolio managers, analysts and certain other employees and the relationship of such compensation to the attraction and retention of quality personnel. The Board noted that the Adviser had voluntarily limited additions to assets that it manages in order to protect investment performance by partially closing a majority of the Funds to new investors and limiting investments in a number of its institutional investment strategies. Finally, the Board considered the Adviser's profitability analysis as well as an Investment Management Pro fitability Analysis prepared by Lipper. The Board noted the pre-tax profits realized by the Adviser and its affiliates from their relationship with each Fund, as well as the financial condition of the Adviser.
The Board considered that, as a percent of net assets, the total expenses (inclusive of management fees) of five of the Funds were lower than or near the median of those of comparable funds and that the total expenses of the Oakmark Fund were above the median.
After its review of all the matters addressed, including those outlined above, the Board concluded that the management fees paid by each Fund to the Adviser were reasonable in light of the services provided and that the profitability of the Adviser's relationship with the Funds appeared to be reasonable in relation to the services performed.
4. Economies of Scale and Fee Levels Reflecting Those Economies
The Board considered whether each Fund's management fee shares with shareholders potential economies of scale that may be achieved by the Adviser. The Board reviewed each Fund's Agreement, which includes breakpoints that decrease the management fee rate as the Fund's assets increase. The Board also considered that the Committee and the Adviser had negotiated additional breakpoints in the Agreements for the International Fund and the International Small Cap Fund. The Board concluded that the breakpoints in the
THE OAKMARK FUNDS
82
fee schedule for each Fund allow shareholders to benefit from potential economies of scale that may be achieved by the Adviser.
5. Other Benefits Derived from the Relationship with the Funds
The Board also considered other benefits that accrue to the Adviser and its affiliates from their relationship with the Funds. The Board noted that an affiliate of the Adviser serves as the Funds' distributor, without compensation, pursuant to a written agreement that the Board evaluates and approves annually.
The Board also considered the Adviser's use of a portion of the commissions paid by the Funds on their portfolio brokerage transactions to obtain research products and services benefiting the Funds and/or other clients of the Adviser and concluded that the Adviser's use of "soft" commission dollars to obtain research products and services was consistent with regulatory requirements. The Board also noted that the Adviser's use of "soft" commission dollars was relatively low compared to many others in the industry and that the Adviser generally limits the use of "soft" commission dollars to obtain proprietary research products and services from brokers with which it trades.
After full consideration of the above factors, as well as other factors that were instructive in evaluating the Agreements, the Board, including all of the Independent Trustees, concluded that approval of each Fund's agreement was in the best interests of the Fund and its shareholders. On September 1, 2006, the Board continued each Agreement, with amendments to the Agreements for the International Fund and the International Small Cap Fund to add additional breakpoints in the fee schedule.
THE OAKMARK FUNDS
83
This material must be preceded or accompanied by a prospectus. To order a prospectus, which explains management fees and expenses and the special risks of investing in the Funds, visit oakmark.com or call 1-800-OAKMARK. Please read the prospectus carefully before investing.
The discussion the Funds' investments and investment strategies (including current investment themes, the portfolio managers' research and investment process, and portfolio characteristics) represents the Funds' investments and the views of the portfolio managers and Harris Associates L.P., the Funds' investment adviser, at the time of this report, and are subject to change without notice.
The performance data quoted represents past performance. The above performance for the Funds does not reflect the imposition of a 2% redemption fee on shares held for 90 days or less to deter market timers. If reflected, the fee would reduce the performance quoted. Past performance does not guarantee future results. The investment return and principal value will fluctuate so that an investor's shares, when redeemed, may be worth more or less than their original cost. Current performance may be lower or higher than the performance data quoted. Average annual total return measures annualized change, while total return measures aggregate change. To obtain most recent month-end performance data visit oakmark.com.
The performance information for Class I shares of The Oakmark Fund, The Oakmark Select Fund, The Oakmark Equity & Income Fund, The Oakmark Global Fund, The Oakmark Global Select Fund, The Oakmark International Fund and The Oakmark International Small Cap Fund does not reflect the imposition of a 2% redemption fee on shares held by an investor for 90 days or less. The purpose of this redemption fee is to deter market timers.
Investing in value stocks presents the risk that value stocks may fall out of favor with investors and underperform growth stocks during given periods.
Because The Oakmark Select Fund and The Oakmark Global Select Fund are non-diversified, the performance of each holding will have a greater impact on each Fund's total return, and may make the Funds' returns more volatile than a more diversified fund.
The Oakmark Equity and Income Fund closed to certain new investors as of 5/7/04.
The Oakmark Equity and Income Fund invests in medium- and lower-quality debt securities that have higher yield potential but present greater investment and credit risk than higher-quality securities, which may result in greater share price volatility. An economic downturn could severely disrupt the market in medium or lower grade debt securities and adversely affect the value of outstanding bonds and the ability of the issuers to repay principal and interest.
The Oakmark Global Fund and The Oakmark International Fund closed to certain new investors as of 12/15/03.
The Oakmark International Small Cap Fund closed to new investors as of 5/10/02.
Investing in foreign securities represents risks which in some way may be greater than in U.S. investments. Those risks include: currency fluctuation; different regulation, accounting standards, trading practices and levels of available information; generally higher transaction costs; and political risks.
The stocks of smaller companies often involve more risk than the stocks of larger companies. Stocks of small companies tend to be more volatile and have a smaller public market than stocks of larger companies. Small companies may have a shorter history of operations than larger companies, may not have as great an ability to raise additional capital and may have a less diversified product line, making them more susceptible to market pressure.
1. Total return includes change in share prices and in each case includes reinvestment of any dividends and capital gain distributions.
2. Portfolio holdings are subject to change without notice and are not intended as recommendations of individual stocks.
3. The S&P 500 Index is a broad market-weighted average of U.S. blue-chip companies. This index is unmanaged and investors cannot actually make investments in this index.
THE OAKMARK FUNDS
84
4. The quoted passage is taken from As Market Fell, Some Big Names Won Their Bets written by Susan Pulliam, Randall Smith and Henry Sender and published by the Wall Street Journal, March 1, 2007.
5. The Price-Earnings Ratio ("P/E") is the most common measure of the expensiveness of a stock.
6. Dow Jones Industrial Average is an unmanaged index that includes only 30 big companies. This index is unmanaged and investors cannot invest directly in this index.
7. The Lipper Large Cap Value Fund Index is an equally weighted index of the largest 30 funds within the large cap value funds investment objective as defined by Lipper Inc. The index is adjusted for the reinvestment of capital gains and income dividends. This index is unmanaged and investors cannot invest directly in this index.
8. The Lipper Multi-Cap Value Funds Index tracks the results of the 30 largest mutual funds in the Lipper Multi-Cap Value Funds category. This index is unmanaged and investors cannot invest directly in this index.
9. The Lipper Balanced Fund Index measures the performance of the 30 largest U.S. balanced funds tracked by Lipper. This index is unmanaged and investors cannot invest directly in this index.
10. Lehman Brothers Government/Corporate Bond Index is a benchmark index made up of the Lehman Brothers Government and Corporate Bond indexes, including U.S. government Treasury and agency securities as well as corporate and Yankee bonds. This index is unmanaged and investors cannot invest directly in this index.
11. The MSCI World Index is a free float-adjusted market capitalization index that is designed to measure global developed market equity performance. As of June 2006 the MSCI World Index consisted of the following 23 developed market country indices: Australia, Austria, Belgium, Canada, Denmark, Finland, France, Germany, Greece, Hong Kong, Ireland, Italy, Japan, Netherlands, New Zealand, Norway, Portugal, Singapore, Spain, Sweden, Switzerland, the United Kingdom and the United States. This index is unmanaged and investors cannot invest directly in this index.
12. The Lipper Global Fund Index measures the performance of the 30 largest mutual funds that invest in securities throughout the world. This index is unmanaged and investors cannot invest directly in this index.
13. The MSCI World ex U.S. Index is a free float-adjusted market capitalization index that is designed to measure global developed market equity performance. As of June 2006 the MSCI World Index consisted of the following 22 developed market country indices: Australia, Austria, Belgium, Canada, Denmark, Finland, France, Germany, Greece, Hong Kong, Ireland, Italy, Japan, Netherlands, New Zealand, Norway, Portugal, Singapore, Spain, Sweden, Switzerland, and the United Kingdom. This index is unmanaged and investors cannot invest directly in this index.
14. The MSCI EAFE Index (Europe, Australasia, Far East) is a free float-adjusted market capitalization index that is designed to measure developed market equity performance, excluding the US & Canada. As of June 2006 the MSCI EAFE Index consisted of the following 21 developed market country indices: Australia, Austria, Belgium, Denmark, Finland, France, Germany, Greece, Hong Kong, Ireland, Italy, Japan, the Netherlands, New Zealand, Norway, Portugal, Singapore, Spain, Sweden, Switzerland and the United Kingdom. This index is unmanaged and investors cannot invest directly in this index.
15. The Lipper International Fund Index reflects the net asset value weighted total return of the 30 largest international equity funds. This index is unmanaged and investors cannot invest directly in this index.
16. The MSCI World ex U.S. Small Cap Index is the small cap component of the MSCI World ex U.S. Standard Index. Securities selected represent 40% of the small cap asset class in each developed market on a capitalization-weighted basis. This index is unmanaged and investors cannot invest directly in this index.
17. The Lipper International Small Cap Funds Index measures the performance of the 10 largest international small-cap funds tracked by Lipper. This index is unmanaged and investors cannot invest directly in this index.
THE OAKMARK FUNDS
85
THE OAKMARK FUNDS
Investment Philosophy
All Oakmark managers follow a consistent investment philosophy—to invest in companies they believe are trading at a substantial discount to underlying business value. Critical to this philosophy is to invest with management teams who are committed to maximizing the company's business value.
Three key tenets of our
investment philosophy:
1 Buy businesses trading at a significant discount
to our estimate of true business value.
2 Invest in companies expected to grow shareholder value over time.
3 Invest with management teams who think
and act as owners.
Investment Process
We seek to identify undervalued companies through an intensive, in-house research process. This process is not based on macro-economic factors, such as the performance of the economy or the direction of interest rates. Nor is it based on technical factors, such as the performance of the stock market itself. And, while some value managers might use only one summary statistic—such as price-earnings ratio—our investment professionals take a more in-depth approach using a range of valuation measures appropriate for a specific company or industry.
From the universe of thousands of equity securities, our team generates investment ideas through a variety of methods. If a security appears attractive, detailed quantitative and qualitative research follows. This careful process of identifying undervalued stocks results in an "approved list."
The Result: a unified effort aimed at identifying the best values in the marketplace. From the list of
approved stocks, each fund manager constructs a relatively focused portfolio, built on a stock-by-stock basis from the bottom up.
Who Should Invest
Any investor who is seeking a disciplined value manager for the purposes of growing and diversifying a portfolio should consider one of The Oakmark Funds, keeping in mind that all equity investments should be considered long-term investments. As value investors, we recognize that patience is a virtue and believe that, over the long term, investors are rewarded for their patience. We generally hold the companies in which we invest for three to five years, a time horizon that we encourage our shareholders to consider as well.
How to Use Value Funds
in an Overall Portfolio
Investment styles tend to move in cycles. One style may be in favor for a few years while the other is out of favor, and vice versa. Diversifying the stock portion of your portfolio may help reduce overall volatility—and potentially provide more consistent returns over time.

THE OAKMARK FUNDS
86
The Oakmark Glossary
Book value – A company's common stock equity as it appears on a balance sheet, equal to total assets minus liabilities, preferred stock, and intangible assets such as goodwill. A company's book value often differs substantially from economic value, especially in industries such as media.
Business value/Intrinsic value – The perceived or estimated actual value of a security, as opposed to its current market price or book value. Business value can be evaluated based on what a knowledgeable buyer would pay for a business if the company were sold in its entirety.
Growth investing – Investors who look for companies based on whether the stock of a company is growing earnings and/or revenue faster than the industry as a whole or the overall market. Growth investors generally expect high rates of growth to persist, and the stock, in turn, to deliver returns exceeding the market's. A growth mutual fund is generally one that emphasizes stocks believed to offer above-average growth prospects, with little to no emphasis on the stock's current price.
M & A (Mergers & Acquisitions) – Merger: the combining of two or more entities into one, through a purchase acquisition or a pooling of interests. Acquisition: can also be called a takeover, and is defined as acquiring control of a corporation, called a target, by stock purchase or exchange, either hostile or friendly.
Market capitalization (market cap or cap) – The market price of an entire company on any given day, calculated by multiplying the number of shares outstanding by the price per share.
Momentum investing – Approach to investing based on the belief that stock price trends are likely to continue. Momentum investors tend to buy stocks that have been outperforming the market and to sell those stocks when their relative performance deteriorates. Momentum investors do not consider a company's underlying value or fundamentals in their investment decisions.
Multiple – A ratio used to measure a stock's valuation, usually greater than 1. Sometimes used to mean price/earnings ratio.
P/B or Price-to-Book Ratio – A stock's capitalization divided by its book value. The value is the same whether the calculation is done for the whole company or on a per-share basis.
P/E or Price-to-Earnings Ratio – The most common measure of a stock's valuation. It is equal to a stock's capitalization divided by its after-tax earnings over a 12-month period. The value is the same whether the calculation is done for the whole company or on a per-share basis. Equivalently, the cost an investor in a given stock must pay per dollar of current annual earnings. Also called earnings multiple.
Share repurchase – Program through which a corporation buys back its own shares in the open market, typically an indication that the corporation's management believes the stock price is undervalued.
Value investing – Investors who utilize valuation measures such as business value (including growth rate), price/earnings ratio, price/book ratio, and yield to gauge the attractiveness of a company. Managers who employ a value investment style believe that the true, underlying value of a company is not reflected in its current share price, and, over time, the price has potential to increase as the market recognizes the overall value of the business. Value stocks sell at relatively low prices in relation to their underlying business value, earnings, or book value.
Stocks become undervalued for a variety of reasons, including an overall market decline, or when a specific industry falls into disfavor and investors view all companies in that industry in the same light. Consequently, an individual company's stock price may fall, even though it may be only temporarily affected by the industry's problems and its underlying value has remained unchanged.
"x times earnings" ("12 times earnings") – Another way to express a stock's price-to-earnings (P/E) ratio. A stock with a P/E ratio of 12 sells at 12 times earnings.
THE OAKMARK FUNDS
87

(This page has been intentionally left blank.)
The Oakmark Funds
88
THE OAKMARK FUNDS
Trustees and Officers
Trustees
Gary N. Wilner, M.D.—Chairman
Michael J. Friduss
Thomas H. Hayden
Christine M. Maki
John R. Raitt
Allan J. Reich
Steven S. Rogers
Marv R. Rotter
Burton W. Ruder
Peter S. Voss
Officers
John R. Raitt—President
Robert M. Levy—Executive Vice President
Henry R. Berghoef—Vice President
Chad M. Clark—Vice President
Richard J. Gorman—Vice President and
Assistant Secretary
Kevin G. Grant—Vice President
David G. Herro—Vice President
John J. Kane—Treasurer
Clyde S. McGregor—Vice President
William C. Nygren—Vice President
Vineeta D. Raketich—Vice President
Janet L. Reali—Vice President and Secretary
Kristi L. Rowsell—Vice President
Edward A. Studzinski—Vice President
Robert A. Taylor—Vice President
Christopher P. Wright—Vice President
Other Information
Investment Adviser
Harris Associates L.P.
Two North LaSalle Street
Chicago, Illinois 60602-3790
Transfer Agent
Boston Financial Data Services, Inc.
Quincy, Massachusetts
Legal Counsel
Bell, Boyd & Lloyd LLC
Chicago, Illinois
Independent Registered Public
Accounting Firm
Deloitte & Touche LLP
Chicago, Illinois
For More Information
Please call 1-800-OAKMARK
(1-800-625-6275)
or 617-483-3250
Website
oakmark.com
To obtain a prospectus, an application or periodic reports, access our web
site at oakmark.com, or call 1-800-OAKMARK (1-800-625-6275) or
(617) 483-3250.
The Funds will file its complete schedule of portfolio holdings with the Securities and Exchange Commission (the "SEC") for the first and third quarters of each fiscal year on Form N-Q. The Funds' Forms N-Q are available on the SEC's website at www.sec.gov. The Funds' Forms N-Q may be reviewed and copied at the SEC's Public Reference Room in Washington, DC, and information on the operation of the Public Reference Room may be obtained by calling 1-800-SEC-0330.
A description of the policies and procedures the Funds use to determine how to vote proxies relating to portfolio securities is available without charge, upon request, by calling toll-free 1-800-625-6275; on the Funds' website at oakmark.com; and on the SEC's website at www.sec.gov.
No later than August 31 of each year, information regarding how the Adviser, on behalf of the Funds, voted proxies relating to the Funds' portfolio securities for the twelve months ended the preceding June 30 will be available through a link on the Funds' website at oakmark.com and on the SEC's website at www.sec.gov.
This report is submitted for the general information of the Funds' shareholders. The report is not authorized for distribution to prospective investors in the Funds unless it is accompanied or preceded by the Funds' currently effective prospectus.
No sales charge to the shareholder or to the new investor is made in offering the shares of the Funds, however, a shareholder may incur a 2% redemption fee on an exchange or redemption of Class I shares held for 90 days or less from any Fund.

1-800-OAKMARK
oakmark.com
The Oakmark Funds are distributed by Harris Associates Securities L.P., member NASD. Date of first use: May 2007.
THE OAKMARK FUND CLASS II
THE VALUE OF A $10,000 INVESTMENT IN THE OAKMARK FUND FROM ITS
INCEPTION (4/5/01) TO PRESENT (3/31/07) AS COMPARED TO THE
STANDARD & POOR'S 500 INDEX (UNAUDITED)
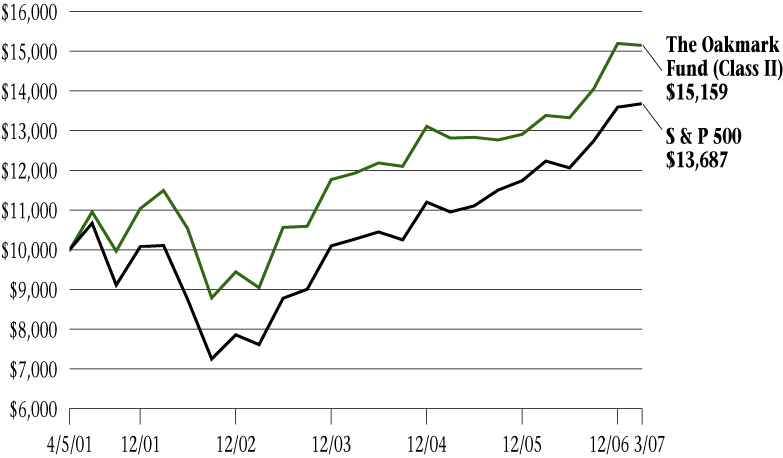
Average Annual Total Returns
(as of 3/31/07)
| | | 1-year | | 5-year | | Since
Inception
(4/5/01) | |
| Oakmark Fund (Class II) | | | 13.19 | % | | | 5.68 | % | | | 8.86 | % | |
| S&P 500 | | | 11.83 | % | | | 6.27 | % | | | 5.38 | % | |
The graph and table do not reflect the deduction of taxes that a shareholder would pay on fund distributions or the redemption of fund shares.
Expense Ratio as of 9/30/06 was 1.40%.
The performance data quoted represents past performance. Past performance does not guarantee future results. The investment return and principal value will fluctuate so that an investor's shares, when redeemed, may be worth more or less than their original cost. Current performance may be lower or higher than the performance data quoted. Average annual total return measures annualized change, while total return measures aggregate change. To obtain most recent month-end performance data, visit oakmark.com.
Harris Associates Securities L.P., member NASD, May 2007
THE OAKMARK SELECT FUND CLASS II
THE VALUE OF A $10,000 INVESTMENT IN THE OAKMARK SELECT FUND FROM ITS
INCEPTION (12/31/99) TO PRESENT (3/31/07) AS COMPARED TO THE
STANDARD & POOR'S 500 INDEX (UNAUDITED)

Average Annual Total Returns
(as of 3/31/07)
| (Unaudited) | | 1-year | | 5-year | | Since
Inception
(12/31/99) | |
| Oakmark Select Fund (Class II) | | | 8.08 | % | | | 6.80 | % | | | 14.00 | % | |
| S&P 500 | | | 11.83 | % | | | 6.27 | % | | | 1.18 | % | |
The graph and table do not reflect the deduction of taxes that a shareholder would pay on fund distributions or the redemption of fund shares.
Expense Ratio as of 9/30/06 was 1.34%.
The performance data quoted represents past performance. Past performance does not guarantee future results. The investment return and principal value will fluctuate so that an investor's shares, when redeemed, may be worth more or less than their original cost. Current performance may be lower or higher than the performance data quoted. Average annual total return measures annualized change, while total return measures aggregate change. To obtain most recent month-end performance data, visit oakmark.com.
Harris Associates Securities L.P., member NASD, May 2007
THE OAKMARK EQUITY AND INCOME FUND CLASS II
THE VALUE OF A $10,000 INVESTMENT IN THE OAKMARK EQUITY AND INCOME
FUND FROM ITS INCEPTION (7/13/00) TO PRESENT (3/31/07) AS COMPARED TO
THE LIPPER BALANCED FUND INDEX (UNAUDITED)
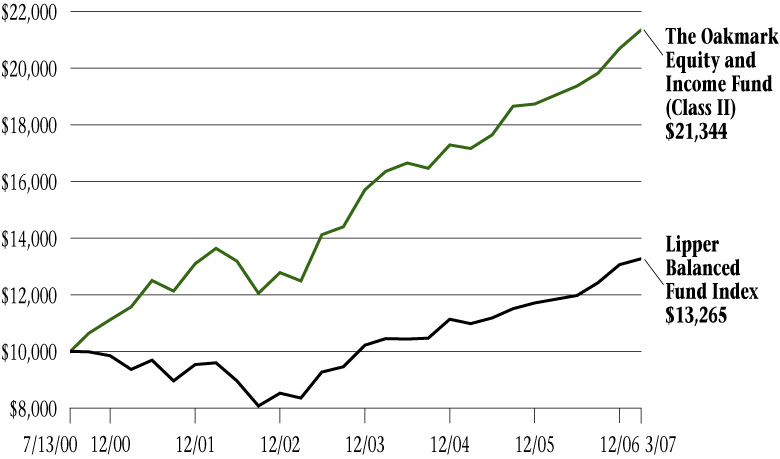
Average Annual Total Returns
(as of 3/31/07)
| (Unaudited) | | 1-year | | 5-year | | Since
Inception
(7/13/00) | |
| Oakmark Equity & Income Fund (Class II) | | | 11.76 | % | | | 9.37 | % | | | 14.42 | % | |
| Lipper Balanced Fund Index | | | 9.78 | % | | | 6.71 | % | | | 4.30 | % | |
The graph and table do not reflect the deduction of taxes that a shareholder would pay on fund distributions or the redemption of fund shares.
Expense Ratio as of 9/30/06 was 1.18%.
The performance data quoted represents past performance. Past performance does not guarantee future results. The investment return and principal value will fluctuate so that an investor's shares, when redeemed, may be worth more or less than their original cost. Current performance may be lower or higher than the performance data quoted. Average annual total return measures annualized change, while total return measures aggregate change. To obtain most recent month-end performance data, visit oakmark.com.
Harris Associates Securities L.P., member NASD, May 2007
THE OAKMARK GLOBAL FUND CLASS II
THE VALUE OF A $10,000 INVESTMENT IN THE OAKMARK GLOBAL FUND
FROM ITS INCEPTION (10/10/01) TO PRESENT (3/31/07) AS COMPARED TO THE
MSCI WORLD INDEX (UNAUDITED)

Average Annual Total Returns
(as of 3/31/07)
| | | 1-year | | 5-year | | Since
Inception
(10/10/01) | |
| Oakmark Global Fund (Class II) | | | 21.55 | % | | | 17.16 | % | | | 27.96 | % | |
| MSCI World | | | 15.44 | % | | | 10.44 | % | | | 10.54 | % | |
The graph and table do not reflect the deduction of taxes that a shareholder would pay on fund distributions or the redemption of fund shares.
Expense Ratio as of 9/30/06 was 1.56%.
The performance data quoted represents past performance. Past performance does not guarantee future results. The investment return and principal value will fluctuate so that an investor's shares, when redeemed, may be worth more or less than their original cost. Current performance may be lower or higher than the performance data quoted. Average annual total return measures annualized change, while total return measures aggregate change. To obtain most recent month-end performance data, visit oakmark.com.
Harris Associates Securities L.P., member NASD, May 2007
THE OAKMARK INTERNATIONAL FUND CLASS II
THE VALUE OF A $10,000 INVESTMENT IN THE OAKMARK INTERNATIONAL FUND
FROM ITS INCEPTION (11/4/99) TO PRESENT (3/31/07) AS COMPARED TO THE
MSCI WORLD EX U.S. INDEX (UNAUDITED)
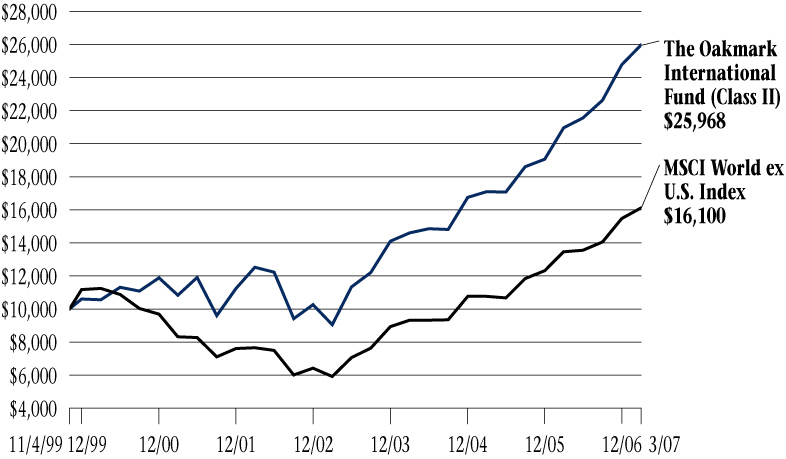
Average Annual Total Returns
(as of 3/31/07)
| (Unaudited) | | 1-year | | 5-year | | Since
Inception
(11/4/99) | |
| Oakmark International Fund (Class II) | | | 23.85 | % | | | 15.70 | % | | | 16.31 | % | |
| MSCI World ex U.S. Index | | | 19.60 | % | | | 16.03 | % | | | 6.64 | % | |
The graph and table do not reflect the deduction of taxes that a shareholder would pay on fund distributions or the redemption of fund shares.
Expense Ratio as of 9/30/06 1.47%.
The performance data quoted represents past performance. Past performance does not guarantee future results. The investment return and principal value will fluctuate so that an investor's shares, when redeemed, may be worth more or less than their original cost. Current performance may be lower or higher than the performance data quoted. Average annual total return measures annualized change, while total return measures aggregate change. To obtain most recent month-end performance data, visit oakmark.com.
Harris Associates Securities L.P., member NASD, May 2007
THE OAKMARK INTERNATIONAL
SMALL CAP FUND CLASS II
THE VALUE OF A $10,000 INVESTMENT IN THE OAKMARK INTERNATIONAL SMALL
CAP FUND FROM ITS INCEPTION (1/8/01) TO PRESENT (3/31/07) AS COMPARED
TO THE MSCI WORLD EX U.S. INDEX (UNAUDITED)
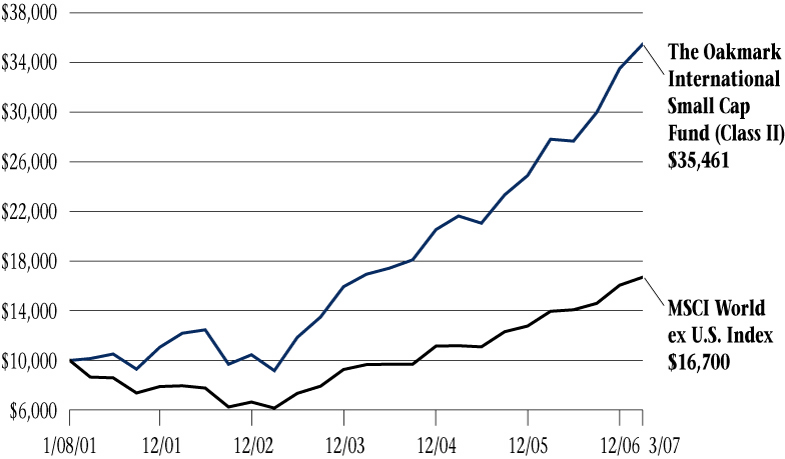
Average Annual Total Returns
(as of 3/31/07)
| (Unaudited) | | 1-year | | 5-year | | Since
Inception
(1/8/01) | |
| Oakmark International Small Cap Fund (Class II) | | | 27.44 | % | | | 23.83 | % | | | 27.93 | % | |
| MSCI World ex U.S. | | | 19.60 | % | | | 16.03 | % | | | 8.58 | % | |
The graph and table do not reflect the deduction of taxes that a shareholder would pay on fund distributions or the redemption of fund shares.
Expense Ratio as of 9/30/06 1.47%.
The performance data quoted represents past performance. Past performance does not guarantee future results. The investment return and principal value will fluctuate so that an investor's shares, when redeemed, may be worth more or less than their original cost. Current performance may be lower or higher than the performance data quoted. Average annual total return measures annualized change, while total return measures aggregate change. To obtain most recent month-end performance data, visit oakmark.com.
Harris Associates Securities L.P., member NASD, May 2007
FUND EXPENSES
A shareholder of each Fund incurs two types of costs: (1) transaction costs, such as redemption fees, and (2) ongoing costs, including investment advisory fees, transfer agent fees, and other fund expenses. The examples below are intended to help shareholders understand the ongoing cost (in dollars) of investing in each Fund and to compare these costs with the ongoing costs of investing in other funds.
Actual Expenses
The following table provides information about actual account values and actual fund expenses for Class II of each Fund. The table shows the expenses a Class II shareholder would have paid on a $1,000 investment in each Fund from October 1, 2006, to March 31, 2007, as well as how much a $1,000 investment would be worth at the close of the period, assuming actual fund returns and expenses. A Class II shareholder can estimate expenses incurred for the period by dividing the account value at March 31, 2007, by $1,000 and multiplying the result by the number in the Expenses Paid During the Period row as shown below.
| | | The Oakmark
Fund | | The Oakmark
Select Fund | | The Oakmark
Equity and
Income Fund | | The Oakmark
Global Fund | | The Oakmark
International
Fund | | The Oakmark
International
Small Cap
Fund | |
| Beginning Account Value | | $ | 1,000.00 | | | $ | 1,000.00 | | | $ | 1,000.00 | | | $ | 1,000.00 | | | $ | 1,000.00 | | | $ | 1,000.00 | | |
| Ending Account Value | | $ | 1,078.30 | | | $ | 1,059.30 | | | $ | 1,076.90 | | | $ | 1,144.40 | | | $ | 1,147.30 | | | $ | 1,183.30 | | |
| Expenses Paid During Period* | | $ | 7.05 | | | $ | 7.03 | | | $ | 6.11 | | | $ | 8.18 | | | $ | 7.60 | | | $ | 7.68 | | |
| Annualized Expense Ratio | | | 1.36 | % | | | 1.37 | % | | | 1.18 | % | | | 1.53 | % | | | 1.42 | % | | | 1.41 | % | |
* Expenses are equal to each Fund's annualized expense ratio for Class II, multiplied by the average account value over the period, multiplied by the number of days in the most recent fiscal half-year divided by 365 (to reflect the one-half year period).
Hypothetical Example for Comparison Purposes
The following table provides information about hypothetical account values and hypothetical expenses for Class II of each Fund based on actual expense ratios and an assumed rate of return of 5% per year before expenses, which are not the Funds' actual returns. The hypothetical account values and expenses may not be used to estimate the actual ending account balances or expenses shareholders paid for the period. Shareholders may use this information to compare the ongoing costs of investing in a Fund and other funds. To do so, compare this 5% hypothetical example with the 5% hypothetical examples that appear in the shareholder reports of the other funds.
Please note that the expenses shown in the table are meant to highlight your ongoing costs only and do not reflect any transaction costs, such as redemption fees. Therefore, the third line of the table is useful in comparing ongoing costs only, and will not help you determine the relative total costs of owning different funds. In addition, if these transaction costs were included, the total costs would have been higher.
| | | The Oakmark
Fund | | The Oakmark
Select Fund | | The Oakmark
Equity and
Income Fund | | The Oakmark
Global Fund | | The Oakmark
International
Fund | | The Oakmark
International
Small Cap
Fund | |
| Beginning Account Value | | $ | 1,000.00 | | | $ | 1,000.00 | | | $ | 1,000.00 | | | $ | 1,000.00 | | | $ | 1,000.00 | | | $ | 1,000.00 | | |
| Ending Account Value | | $ | 1,018.15 | | | $ | 1,018.10 | | | $ | 1,019.05 | | | $ | 1,017.30 | | | $ | 1,017.85 | | | $ | 1,017.90 | | |
| Expenses Paid During Period* | | $ | 6.84 | | | $ | 6.89 | | | $ | 5.94 | | | $ | 7.70 | | | $ | 7.14 | | | $ | 7.09 | | |
| Annualized Expense Ratio | | | 1.36 | % | | | 1.37 | % | | | 1.18 | % | | | 1.53 | % | | | 1.42 | % | | | 1.41 | % | |
* Expenses are equal to each Fund's annualized expense ratio for Class II, multiplied by the average account value over the period, multiplied by the number of days in the most recent fiscal half-year divided by 365 (to reflect the one-half year period).
Item 2. Code of Ethics.
Not required in this filing.
Item 3. Audit Committee Financial Expert.
Not required in this filing.
Item 4. Principal Accountant Fees and Services.
Not required in this filing.
Item 5. Audit Committee of Listed Registrants.
Not required in this filing.
Item 6. Schedule of Investments.
The Schedule of Investments in securities of unaffiliated issuers is included as part of the semi-annual report to shareholders filed under Item 1 of this Form.
Item 7. Disclosure of Proxy Voting Policies and Procedures for Closed-End Management Investment Companies.
Not applicable.
Item 8. Portfolio Managers of Closed-End Management Investment Companies.
Not applicable.
Item 9. Purchases of Equity Securities by Closed-End Management Investment Company and Affiliated Purchasers.
Not applicable.
Item 10. Submission of Matters to a Vote of Security Holders.
During the period covered by this report, no amendments were made to the procedures adopted in fiscal year 2006.
Item 11. Controls and Procedures.
(a) Based on an evaluation of the disclosure controls and procedures (as defined in Rule 30a-3(c) under the Investment Company Act of 1940, the “Disclosure Controls”), the Disclosure Controls are effectively designed to ensure that information required to be disclosed by the Registrant in this report is recorded, processed, summarized and reported within 90 days prior to the filing of this report, including ensuring that information required to be disclosed in this report is accumulated and communicated to the Registrant’s management, including the Registrant’s principal executive officer and principal financial officer, as appropriate to allow timely decisions regarding required disclosure.
(b) There were no changes in the Registrant’s internal controls over financial reporting (as defined in Rule 30a-3(d) under the Investment Company Act of 1940) that occurred during the Registrant’s second fiscal quarter of the time period covered by this report that has materially affected, or is reasonably likely to materially affect, the Registrant’s internal control over financial reporting.
Item 12. Exhibits.
(a) (1) | Not required in this filing. |
| |
(2) | Certifications of John R. Raitt, Principal Executive Officer, and Kristi L. Rowsell, Principal Financial Officer, pursuant to Rule 30a-2(a) under the Investment Company Act of 1940 (17 CFR 270.30a-2(a)), attached hereto as Exhibits (a)(2)(i) and (a)(2)(ii). |
| |
(3) | Not applicable. |
| |
(b) | Certification of John R. Raitt, Principal Executive Officer and Kristi L. Rowsell, Principal Financial Officer, pursuant to Section 906 of the Sarbanes-Oxley Act of 2002, attached hereto as Exhibit (b). |
SIGNATURES
Pursuant to the requirements of the Securities Exchange Act of 1934 and the Investment Company Act of 1940, the Registrant has duly caused this report to be signed on its behalf by the undersigned, thereunto duly authorized.
Harris Associates Investment Trust
By: | | /s/ John R. Raitt | |
| | John R. Raitt | |
| | Principal Executive Officer | |
Date: | | May 17, 2007 | |
Pursuant to the requirements of the Securities Exchange Act of 1934 and the Investment Company Act of 1940, this report has been signed below by the following persons on behalf of the Registrant and in the capacities and on the dates indicated.
By: | | /s/ John R. Raitt | |
| | John R. Raitt | |
| | Principal Executive Officer | |
Date: | | May 17, 2007 | |
| | | |
| | | |
By: | | /s/ Kristi L. Rowsell | |
| | Kristi L. Rowsell | |
| | Principal Financial Officer | |
Date: | | May 17, 2007 | |