UNITED STATES
SECURITIES AND EXCHANGE COMMISSION
Washington, D.C. 20549
FORM N-CSR
CERTIFIED SHAREHOLDER REPORT OF REGISTERED
MANAGEMENT INVESTMENT COMPANIES
Investment Company Act file number | 811-06279 |
|
Harris Associates Investment Trust |
(Exact name of registrant as specified in charter) |
|
Two North La Salle Street, Suite 500
Chicago, Illinois | | 60602-3790 |
(Address of principal executive offices) | | (Zip code) |
|
John R. Raitt
Harris Associates L.P.
Two North La Salle Street, #500
Chicago, Illinois 60602 | Cameron S. Avery
Bell, Boyd & Lloyd LLC
Three First National Plaza, #3100
Chicago, Illinois 60602 |
(Name and address of agent for service) |
|
Registrant’s telephone number, including area code: | (312) 621-0600 | |
|
Date of fiscal year end: | 9/30/06 | |
|
Date of reporting period: | 3/31/06 | |
| | | | | | | | | |
Item 1. Reports to Shareholders.
SEMI-ANNUAL REPORT
MARCH 31, 2006

Advised by Harris Associates L.P.
THE OAKMARK FUNDS
2006 Semi-Annual Report
| President's Letter | | | 1 | | |
|
| Summary Information | | | 2 | | |
|
| Fund Expenses | | | 4 | | |
|
| Commentary on The Oakmark and Oakmark Select Funds | | | 6 | | |
|
| The Oakmark Fund | |
|
| Letter from the Portfolio Managers | | | 8 | | |
|
| Schedule of Investments | | | 9 | | |
|
| The Oakmark Select Fund | |
|
| Letter from the Portfolio Managers | | | 13 | | |
|
| Schedule of Investments | | | 14 | | |
|
| The Oakmark Equity and Income Fund | |
|
| Letter from the Portfolio Managers | | | 16 | | |
|
| Schedule of Investments | | | 18 | | |
|
| The Oakmark Global Fund | |
|
| Letter from the Portfolio Managers | | | 24 | | |
|
| Global Diversification Chart | | | 26 | | |
|
| Schedule of Investments | | | 27 | | |
|
| Commentary on The International and International Small Cap Funds | | | 32 | | |
|
| The Oakmark International Fund | |
|
| Letter from the Portfolio Manager | | | 33 | | |
|
| International Diversification Chart | | | 34 | | |
|
| Schedule of Investments | | | 35 | | |
|
| The Oakmark International Small Cap Fund | |
|
| Letter from the Portfolio Managers | | | 41 | | |
|
| International Diversification Chart | | | 43 | | |
|
| Schedule of Investments | | | 44 | | |
|
| Financial Statements | |
|
| Statements of Assets and Liabilities | | | 50 | | |
|
| Statements of Operations | | | 52 | | |
|
| Statements of Changes in Net Assets | | | 54 | | |
|
| Notes to Financial Statements | | | 60 | | |
|
| Disclosure Regarding Investment Advisory Contract Approval | | | 76 | | |
|
| Oakmark Philosophy and Process | | | 79 | | |
|
| The Oakmark Glossary | | | 80 | | |
|
| Trustees and Officers | | | 81 | | |
|
FORWARD-LOOKING STATEMENT DISCLOSURE
One of our most important responsibilities as mutual fund managers is to communicate with shareholders in an open and direct manner. Some of our comments in our letters to shareholders are based on current management expectations and are considered "forward-looking statements". Actual future results, however, may prove to be different from our expectations. You can identify forward-looking statements by words such as "estimate", "may", "will", "expect", "believe", "plan" and other similar terms. We cannot promise future returns. Our opinions are a reflection of our best judgment at the time this report is compiled, and we disclaim any obligation to update or alter forward-looking statements as a result of new information, future events, or otherwise.
President's Letter
Dear Fellow Shareholders,
Both domestic and international stock markets increased significantly in the first quarter. Most major market indexes enjoyed returns in the mid to high single digits. Each of our Funds also produced significant positive returns during the quarter. More importantly, every one of our Funds achieved a new all-time high net asset value during the quarter.
Benchmarks, Performance Goals and Long Term Investing
During the first quarter, our Funds as a group achieved mixed results relative to their "benchmark" indexes. Some Funds outperformed the benchmarks, some were in line, and some lagged. This mix is not unusual. While we often mention relative performance as a point of reference in our quarterly reports, quarterly benchmarks do not drive our investment process. Instead, our primary focus is to provide positive returns, protecting our investors' capital from loss. Second, while we strive to significantly outperform the returns earned by our peers—our focus is on doing so over the long run.
Many fund managers are evaluated on the basis of their funds' short-term performance relative to their benchmarks, and their compensation is tied to this relative performance. For fear of underperforming the benchmark, they often create a broadly diversified portfolio that looks a lot like the market index, and have little chance of achieving returns much different from the benchmark in any given quarter.
At Oakmark, we understand that good investment ideas are scarce. We pick out-of-favor stocks about which investors often have near-term concerns. We then concentrate our portfolios in our most attractive ideas. We recognize that our portfolio concentration and choice of unloved stocks may increase the chances that our portfolios lag behind the broader indexes for several quarters. At the same time, we believe that our selectivity and disciplined stock analysis dramatically increase the chances for long-term outperformance. Studies of the most successful money managers of the past several decades reveal a similar pattern. While their long-term performance far exceeded their peers, there were periods of as long as two or three years when their performance significantly lagged behind market indexes and their peers.
The compression in market valuations, which we have mentioned in recent quarters, still persists. In our view, companies with strong balance sheets, leading market positions, and excellent growth prospects are being valued in the market at earnings multiples similar to those of average companies. Similarly, in the credit markets, yields on lower quality bonds are at historically low premiums to high quality bonds. We sold most of our high yield bonds from the Equity and Income Fund last year, and over the past two years we have populated our portfolios with many high quality companies that are selling at average market multiples. While we cannot predict the exact moment when these trends will change, we strongly believe that the market will recognize these differences in fundamentals by establishing premium market values for quality businesses, including our holdings.
In the meantime, just as the managers discussed above went through significant periods when the market did not recognize their portfolios' values, we recognize that our Funds may lag behind the broader market indexes at times. As always, we encourage patience from our Fund investors. At times when performance does lag, it is important to have a disciplined long-term plan and the patience to let that plan work.
Thank you for your continued investment and confidence in The Oakmark Funds. We welcome your comments and questions. You can reach us via e-mail at ContactOakmark@oakmark.com.

John R. Raitt
President of The Oakmark Funds
President and CEO of Harris Associates L.P.

1
THE OAKMARK FUNDS
Summary Information
Performance for Period
Ended March 31, 20061 | | The Oakmark
Fund—Class I
(OAKMX) | | The Oakmark
Select Fund—Class I
(OAKLX) | | The Oakmark
Equity and Income
Fund—Class I
(OAKBX) | | The Oakmark
Global Fund—Class I
(OAKGX) | | The Oakmark
International
Fund—Class I
(OAKIX) | | The Oakmark
International
Small Cap Fund—Class I
(OAKEX) | |
| 3 Months* | | | 3.82 | % | | | 2.52 | % | | | 2.00 | % | | | 6.86 | % | | | 10.17 | % | | | 11.86 | % | |
|
| 1 Year | | | 4.76 | % | | | 7.36 | % | | | 11.49 | % | | | 20.28 | % | | | 23.10 | % | | | 28.65 | % | |
|
Average Annual Total
Return for: | |
|
| 3 Year | | | 14.36 | % | | | 15.21 | % | | | 15.51 | % | | | 32.58 | % | | | 32.78 | % | | | 44.83 | % | |
|
| 5 Year | | | 6.23 | % | | | 8.67 | % | | | 10.81 | % | | | 19.79 | % | | | 14.48 | % | | | 22.59 | % | |
|
| 10 Year | | | 8.41 | % | | | N/A | | | | 13.66 | % | | | N/A | | | | 11.95 | % | | | 14.41 | % | |
|
| Since inception | | | 15.40%
(8/5/91) | | | | 18.58%
(11/1/96) | | | | 13.61%
(11/1/95) | | | | 16.92%
(8/4/99) | | | | 13.09%
(9/30/92) | | | | 14.82%
(11/1/95) | | |
|
Top Five Equity
Holdings as of
March 31, 20062
Company and % of Total
Net Assets | | | Washington
Mutual, Inc. 3.3%
McDonald's
Corporation 3.0%
Yum! Brands, Inc. 2.6%
The Walt Disney
Company 2.5%
First Data
Corporation 2.4% | | | | Washington
Mutual, Inc. 15.3%
Yum! Brands, Inc. 7.3%
First Data
Corporation 5.9%
H&R Block, Inc. 5.8%
The Dun &
Bradstreet
Corporation 4.9% | | | | XTO Energy, Inc. 4.4%
Burlington
Resources Inc. 3.5%
EnCana Corp 2.9%
General Dynamics
Corporation 2.9%
Nestle SA 2.8% | | | | Bayerische Motoren
Werke (BMW) AG 3.5%
GlaxoSmithKline plc 3.3%
Takeda
Pharmaceutical
Company Limited 3.3%
Nestle SA 3.2%
Diageo plc 3.1% | | | | Bayerische Motoren
Werke (BMW) AG 3.6%
GlaxoSmithKline plc 3.6%
NTT DoCoMo, Inc. 2.9%
Bank of Ireland 2.9%
SK Telecom Co., Ltd. 2.9% | | | | Matalan PLC 3.9%
Carpetright plc 3.5%
JJB Sports plc 3.4%
MLP AG 3.1%
Interpump Group
S.p.A. 3.1% | | |
|
Sector
Allocation as of
March 31, 2006
Sector and %
of Market Value | | | Consumer
Discretionary 44.3%
Financials 14.4%
Information
Technology 12.9%
Consumer Staples 12.1%
Industrials 7.6%
Health Care 6.3%
Energy 2.4% | | | | Consumer
Discretionary 48.7%
Financials 20.9%
Information
Technology 17.1%
Health Care 8.2%
Industrials 5.1% | | | | U.S. Government
Securities 28.1%
Energy 13.8%
Consumer
Discretionary 12.3%
Consumer Staples 11.5%
Industrials 11.5%
Financials 6.7%
Foreign Government
Securities 6.5%
Health Care 6.0%
Information
Technology 3.2%
Materials 0.4% | | | | Consumer
Discretionary 26.4%
Information
Technology 14.2%
Health Care 12.6%
Consumer Staples 12.1%
Industrials 10.4%
Financials 8.7%
Telecommunication
Services 7.3%
Materials 4.2%
Energy 4.1% | | | | Consumer
Discretionary 26.0%
Financials 18.7%
Consumer Staples 17.1%
Health Care 9.6%
Telecommunication
Services 9.3%
Industrials 8.5%
Materials 7.1%
Information
Technology 2.1%
Energy 1.6% | | | | Consumer
Discretionary 28.8%
Industrials 24.0%
Information
Technology 17.0%
Financials 15.0%
Materials 5.1%
Consumer Staples 4.4%
Health Care 4.1%
Telecommunication
Services 1.6% | | |
|
The performance data quoted represents past performance. The above performance information for the Funds does not reflect the imposition of a 2% redemption fee on shares held for 90 days or less to deter market timers. If reflected, the fee would reduce the performance quoted. Past performance does not guarantee future results. The investment return and principal value will fluctuate so that an investor's shares, when redeemed, may be worth more or less than their original cost. Current performance may be lower or higher than the performance data quoted. Average annual total return measures annualized change, while total return measures aggregate change. To obtain most recent month-end performance data, visit www.oakmark.com.
* Not annualized
THE OAKMARK FUNDS
2
THE OAKMARK FUNDS
3
FUND EXPENSES
A shareholder of each Fund incurs two types of costs: (1) transaction costs, such as redemption fees, and (2) ongoing costs, including investment advisory fees, transfer agent fees, and other fund expenses. The examples below are intended to help shareholders understand the ongoing cost (in dollars) of investing in each Fund and to compare these costs with the ongoing costs of investing in other funds.
Actual Expenses
The following table provides information about actual account values and actual fund expenses for Class I of each Fund. The table shows the expenses a Class I shareholder would have paid on a $1,000 investment in each Fund from October 1, 2005, to March 31, 2006, as well as how much a $1,000 investment would be worth at the close of the period, assuming actual fund returns and expenses. A Class I shareholder can estimate expenses incurred for the period by dividing the account value at March 31, 2006, by $1,000 and multiplying the result by the number in the Expenses Paid During Period row as shown below.
Certain accounts invested for 90 days or less may be charged a 2% redemption fee. Please consult the Funds' prospectus at www.oakmark.com for more information.
| | | The Oakmark Fund | | The Oakmark Select Fund | | The Oakmark Equity and Income Fund | | The Oakmark Global Fund | | The Oakmark International Fund | | The Oakmark International Small Cap Fund | |
Beginning
Account Value | | $ | 1,000.00 | | | $ | 1,000.00 | | | $ | 1,000.00 | | | $ | 1,000.00 | | | $ | 1,000.00 | | | $ | 1,000.00 | | |
Ending
Account Value | | $ | 1,050.20 | | | $ | 1,072.00 | | | $ | 1,024.50 | | | $ | 1,103.70 | | | $ | 1,129.50 | | | $ | 1,192.20 | | |
Expenses Paid
During Period* | | $ | 5.47 | | | $ | 5.17 | | | $ | 4.39 | | | $ | 6.24 | | | $ | 5.79 | | | $ | 7.54 | | |
Annualized
Expense Ratio | | | 1.07 | % | | | 1.00 | % | | | 0.87 | % | | | 1.19 | % | | | 1.09 | % | | | 1.38 | % | |
* Expenses are equal to each Fund's annualized expense ratio for Class I, multiplied by the average account value over the period, multiplied by the number of days in the most recent fiscal half-year divided by 365 (to reflect the one-half year period).
THE OAKMARK FUNDS
4
Hypothetical Example for Comparison Purposes
The following table provides information about hypothetical account values and hypothetical expenses for Class I of each Fund based on actual expense ratios and an assumed rate of return of 5% per year before expenses, which are not the Funds' actual returns. The hypothetical account values and expenses may not be used to estimate the actual ending account balances or expenses shareholders paid for the period. Shareholders may use this information to compare the ongoing costs of investing in a Fund and other funds. To do so, compare this 5% hypothetical example with the 5% hypothetical examples that appear in the shareholder reports of the other funds.
Please note that the expenses shown in the table are meant to highlight your ongoing costs only and do not reflect any transaction costs, such as redemption fees. Therefore, the third line of the table is useful in comparing ongoing costs only, and will not help you determine the relative total costs of owning different funds. In addition, if these transaction costs were included, the total costs would have been higher.
| | | The Oakmark Fund | | The Oakmark Select Fund | | The Oakmark Equity and Income Fund | | The Oakmark Global Fund | | The Oakmark International Fund | | The Oakmark International Small Cap Fund | |
Beginning
Account Value | | $ | 1,000.00 | | | $ | 1,000.00 | | | $ | 1,000.00 | | | $ | 1,000.00 | | | $ | 1,000.00 | | | $ | 1,000.00 | | |
Ending
Account Value | | $ | 1,019.60 | | | $ | 1,019.95 | | | $ | 1,020.59 | | | $ | 1,019.00 | | | $ | 1,019.50 | | | $ | 1,018.05 | | |
Expenses Paid
During Period* | | $ | 5.39 | | | $ | 5.04 | | | $ | 4.38 | | | $ | 5.99 | | | $ | 5.49 | | | $ | 6.94 | | |
Annualized
Expense Ratio | | | 1.07 | % | | | 1.00 | % | | | 0.87 | % | | | 1.19 | % | | | 1.09 | % | | | 1.38 | % | |
* Expenses are equal to each Fund's annualized expense ratio for Class I, multiplied by the average account value over the period, multiplied by the number of days in the most recent fiscal half-year divided by 365 (to reflect the one-half year period).
THE OAKMARK FUNDS
5
THE OAKMARK AND OAKMARK SELECT FUNDS
At Oakmark, we are long-term investors. We attempt to identify growing businesses that are managed to benefit their shareholders. We will purchase stock in those businesses only when priced substantially below our estimate of intrinsic value. After purchase, we patiently wait for the gap between stock price and intrinsic value to close.
Are you a patient investor?
Try this quick test.
1) A bat and a ball cost $1.10 in total. The bat costs a dollar more than the ball. How much does the ball cost?
2) If it takes 5 machines 5 minutes to make 5 widgets, how long would it take 100 machines to make 100 widgets?
3) In a lake, there is a patch of lily pads. Every day, the patch doubles in size. If it takes 48 days for the patch to cover the entire lake, how long would it take for the patch to cover half the lake?
(Answers at the end of this commentary.)
Just the phrase "standardized testing" is enough to cause some to break into a cold sweat. The pressure of having years of work summarized by one test score can be enormous! I've had discussions with my high-school-aged children about upcoming ACT exams and their importance for college admission. The nation's colleges will use this four-hour test, with 215 questions, to decide who is and who isn't worthy of admission. It is amazing that a four-hour test is considered more predictive of college success than is a four-year grade point average! And standardized testing doesn't end with one's academic career. Many employers now use such tests to influence who does or doesn't get hired. Even in the NFL, a profession not often mistaken for rocket science, players are given an intelligence test before they get drafted. Last month a college star was rumored to have hurt his draft position by scoring barely higher than a rock on his exam.
The Wonderlic, named for its founder, is a 50-question exam given over 12 minutes to college players who are entering the NFL draft. According to Wonderlic's website, "For the NFL, years of testing shows that the higher a player scores on the Wonderlic, the more likely he is to be in the starting lineup—for any position." Again, it's interesting that a 12-minute test has more predictive value than does a four-year grade transcript! If a player who is projected to be drafted fifth scores poorly on the test and falls to tenth, it results in him earning about $3 million less in annual salary. Talk about pressure! (Note: There is a limit to how much the test can help one's NFL potential. My colleague Jim Benson had to settle for an investment job with us despite his perfect Wonderlic score!)
With testing in the news, it caught my eye when the New York Times ran an article about a test that could predict whether or not one was a patient investor. I found this interesting, because patience is one of the most valuable traits an investor can possess. If it takes 215 questions to see whether or not you're smart enough for college, and 50 questions to see if you're smart enough for the NFL, then how many does it take to identify a patient investor? It turns out that the three questions at the top of this page is all it takes to separate the patient investors from the crowd. Each question has a logical answer that quickly pops into one's head, but is wrong. Test takers that are more patient avoid this intuitive answer and calculate the correct one. And patient decision-making in the test seems to correlate with patient decision-making in other endeavors, including investing. On the Ball: Cognitive Reflection and Decision Making3 by MIT professor Shane Frederick explores the correlation between one's score on this three-question test and one's preferences about money. As an example, those taking the exam, mostly college students, were asked if they would rather get $3400 this month or $3800 next month. Of those who went three-for-three on the test, a solid majority said they'd wait for the $3800—a good choice given the implied annualized return of 280%. Of those who scored zero, only about one-third were willing to wait.
I think there are important similarities between this quiz and being a value investor. To succeed on the quiz, subjects need to ignore the obvious intuitive answers that end up being wrong. Similarly, successful value investors need to ignore obvious negative news that has been more than fully reflected in a stock's price. Recently, I received an e-mail from a shareholder who was concerned about our Fund, saying he questioned every single stock we owned because anyone watching the news was aware that these companies all had problems. He's right. The reality is that value investors are always invested in companies that have problems—that's why stocks become undervalued. Where we differ from consensus is in our assessment of the magnitude and duration of these problems.

THE OAKMARK AND OAKMARK SELECT FUNDS
6
As consumers, we are all used to the trade-off between price and quality. Not everyone drives a Ferrari, shops at Tiffany's, and wears Armani suits. If not for price, they probably would. Consumers who choose other products aren't making negative statements about these prestigious brands, but rather are simply saying that their price premiums are too high. In consumer purchases, price prevents the best products from achieving 100% market share. But for some reason, when consumers invest their money, they seem to forget the importance of price. When we bought Pulte Homes, shareholders asked, "Haven't you read about the housing bubble?" We have. If all stocks were priced the same, then an investor's job would simply be to identify the companies with the highest combination of growth and dividends. In that world, believing that new home construction would decline would be sufficient reason to avoid owning a homebuilder like Pulte. But in realit y, stocks aren't all priced the same. Pulte is one of the very few stocks now selling at less than half the S&P 5004 P/E5 multiple. At that valuation, a significant housing decline appears to be discounted in the stock price. Just like in the test, the intuitive answer—that housing stocks are bad—may not be the right answer.
Our portfolios are full of similar stocks: media companies that are losing advertising dollars to Google; H&R Block, which is losing market share to other tax preparers; financial stocks that earn less when short-term interest rates rise; and retailers that missed last season's styles. By simply reading the newspaper, an investor could avoid investing in companies that are experiencing such problems. But, by the time these problems are common knowledge, it is nearly certain that other investors have already reacted, forcing stock prices lower. And at that point, even mildly negative news can be viewed by the market as positive. Although it is natural to want to avoid investing in companies that have had disappointments, this may be the same response that produced the wrong answers on the test. It is important to remember that a great business can reach a high enough price that it becomes a bad investment, and an average business can reac h a low enough price that it becomes a great investment. Value investors normally own the latter: stocks priced so low that even mediocre-at-best businesses can become good investments. Most times, we believe superior businesses are priced too highly to merit consideration for our portfolios. However, today, many of what we consider to be the best businesses have lost their premium price due to uncertainty about the sustainability of their growth rates. So our portfolios now have an uncharacteristically high percentage of assets in such names. When Ferraris get priced like Fords, we'll gladly purchase them!
At Oakmark, we recognize that most investors use a shorter investment time horizon than we use. We also realize that while we're trying to anticipate change that may be several years away, most investors, relying on their intuition, try to steer by watching in the rear-view mirror. They assume the road will continue on its present course. We assume that long-term economics will require most trends to eventually reverse their direction. This is why our portfolios rarely include those stocks that have been performing the best and have become the most popular. If you didn't do well on the quiz, hopefully you found it an entertaining, and perhaps thought-provoking exercise. If you did well on it, congratulations! Your patience is a good match for this fund family, and we continue to strive to make that patience rewarding.
Best wishes,

William C. Nygren, CFA
Portfolio Manager
bnygren@oakmark.com
Answers:
1) The ball costs 5¢. The bat costs $1.00 more, or $1.05.
2) It takes 5 minutes. Five machines make five widgets in five minutes. Effectively, five machine-minutes are required to produce each widget. Making 100 widgets thus requires 500 machine-minutes, with 100 machines, requires 5 minutes of time.
3) 47 days. If 100% of the lake is covered on day 48, after the pond doubled in size that day, it must have covered 50% of the lake on day 47.
THE OAKMARK AND OAKMARK SELECT FUNDS
7
THE OAKMARK FUND
Report from Bill Nygren and Kevin Grant, Portfolio Managers


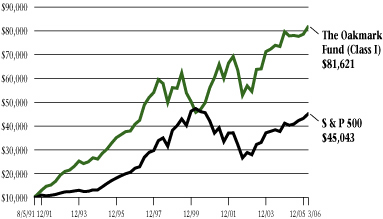
THE VALUE OF A $10,000 INVESTMENT IN THE
OAKMARK FUND FROM ITS INCEPTION (8/5/91) TO PRESENT (3/31/06) AS COMPARED TO THE STANDARD & POOR'S 500 INDEX4
| | | Average Annual Total Returns | |
| | | (as of 3/31/06) | |
| | | Total Return
Last 3 Months* | | 1-year | | 5-year | | 10-year | | Since
Inception
(8/5/91) | |
| Oakmark Fund (Class I) | | | 3.82 | % | | | 4.76 | % | | | 6.23 | % | | | 8.41 | % | | | 15.40 | % | |
| S&P 500 | | | 4.21 | % | | | 11.73 | % | | | 3.97 | % | | | 8.95 | % | | | 10.82 | % | |
| Dow Jones Average6 | | | 4.24 | % | | | 8.26 | % | | | 4.59 | % | | | 9.23 | % | | | 11.85 | % | |
Lipper Large Cap
Value Index7 | | | 4.40 | % | | | 11.86 | % | | | 4.83 | % | | | 8.70 | % | | | 10.61 | % | |
The graph and table do not reflect the deduction of taxes that a shareholder would pay on fund distributions or the redemption of fund shares.
The performance data quoted represents past performance. The above performance information for the Fund does not reflect the imposition of a 2% redemption fee on shares held for 90 days or less to deter market timers. If reflected, the fee would reduce the performance quoted. Past performance does not guarantee future results. The investment return and principal value will fluctuate so that an investor's shares, when redeemed, may be worth more or less than their original cost. Current performance may be lower or higher than the performance data quoted. Average annual total return measures annualized change, while total return measures aggregate change. To obtain most recent month-end performance data, visit www.oakmark.com.
* Not annualized
The Oakmark Fund achieved another new all-time high NAV8 last quarter, advancing by 4%. This increase was consistent with the 4% gain achieved by the S&P 500. Twelve stocks in the portfolio increased by 10% or more. Sun Microsystems was our best performer, advancing by 22% as Sun's new products finally lived up to expectations. We've endured some false starts—and a lot of volatility—since our initial purchase of Sun three-and-a-half years ago, when it was considered a dying company, but it has been an excellent stock. Our worst performer for the quarter, Intel, reported results that were, to us, modestly disappointing. The market reacted as if the shortfall was much more serious. We believed the stock was cheap before the bad news. So, after the market's overreaction, we incr eased our position. During the quarter we sold our shares of Knight Ridder and added Dell Computer.
Dell Computer (DELL—$30)
When we started managing The Oakmark Fund we viewed Dell as one of those great businesses that was unlikely to ever get priced cheaply enough for us to own it. In March of 2000, Dell stock peaked at $60—a robust 88 times trailing earnings. Dell's business has performed well since then, with sales and EPS9 both more than doubling. Dell's stock, however, hasn't done so well, now selling for just half the price it did six years ago. The world's largest manufacturer and distributor of PCs is now priced at less than 16 times expected 2007 earnings. At this price, Dell is selling at only a slight premium to the average company's P/E5 mult iple, and it actually sells at a discount after adjusting for its large cash balance. We think Dell's brand name and low cost structure will provide an enduring competitive advantage that will allow the company to continue growing faster than most businesses, which will warrant the stock selling at a significant premium.
Best wishes,
 | |  | |
|
William C. Nygren, CFA
Portfolio Manager
bnygren@oakmark.com | | Kevin G. Grant, CFA
Portfolio Manager
kgrant@oakmark.com | |
|
THE OAKMARK FUND
8
THE OAKMARK FUND
Schedule of Investments—March 31, 2006 (Unaudited)
Name | |
Shares Held | |
Market Value | |
| Common Stocks—95.0% | |
| Apparel Retail—4.2% | |
| Limited Brands | | | 4,828,047 | | | $ | 118,094,030 | | |
| The Gap, Inc. | | | 6,266,700 | | | | 117,061,956 | | |
| | | | 235,155,986 | | |
| Broadcasting & Cable TV—9.0% | |
| Liberty Media Corporation, Class A (a) | | | 15,299,400 | | | $ | 125,608,074 | | |
| The DIRECTV Group, Inc. (a) | | | 6,950,000 | | | | 113,980,000 | | |
| Comcast Corporation, Special Class A (a) | | | 3,925,000 | | | | 102,521,000 | | |
| EchoStar Communications Corporation, Class A (a) | | | 2,775,000 | | | | 82,889,250 | | |
| CBS Corporation, Class B | | | 2,239,745 | | | | 53,709,085 | | |
| Discovery Holding Company, Class A (a) | | | 1,878,140 | | | | 28,172,100 | | |
| | | | 506,879,509 | | |
| Department Stores—2.0% | |
| Kohl's Corporation (a) | | | 2,150,000 | | | $ | 113,971,500 | | |
| Home Improvement Retail—2.4% | |
| The Home Depot, Inc. | | | 3,231,500 | | | $ | 136,692,450 | | |
| Homebuilding—2.0% | |
| Pulte Homes, Inc. | | | 2,900,000 | | | $ | 111,418,000 | | |
| Household Appliances—1.8% | |
| The Black & Decker Corporation | | | 1,150,000 | | | $ | 99,923,500 | | |
| Housewares & Specialties—2.1% | |
| Fortune Brands, Inc. | | | 1,450,000 | | | $ | 116,913,500 | | |
| Leisure Products—1.1% | |
| Mattel, Inc. | | | 3,474,300 | | | $ | 62,989,059 | | |
| Motorcycle Manufacturers—2.1% | |
| Harley-Davidson, Inc. | | | 2,250,000 | | | $ | 116,730,000 | | |
| Movies & Entertainment—6.2% | |
| The Walt Disney Company | | | 5,100,000 | | | $ | 142,239,000 | | |
| Time Warner, Inc. | | | 7,647,700 | | | | 128,404,883 | | |
| Viacom, Inc., Class B (a) | | | 2,039,745 | | | | 79,142,106 | | |
| | | | 349,785,989 | | |
| Publishing—1.4% | |
| Gannett Co., Inc. | | | 1,334,500 | | | $ | 79,963,240 | | |
| Restaurants—5.6% | |
| McDonald's Corporation | | | 4,850,000 | | | $ | 166,646,000 | | |
| Yum! Brands, Inc. | | | 2,974,000 | | | | 145,309,640 | | |
| | | | 311,955,640 | | |
THE OAKMARK FUND
9
THE OAKMARK FUND
Schedule of Investments—March 31, 2006 (Unaudited) cont.
Name | |
Shares Held | |
Market Value | |
| Common Stocks—95.0% (cont.) | |
| Specialized Consumer Services—2.2% | |
| H&R Block, Inc. | | | 5,658,600 | | | $ | 122,508,690 | | |
| Brewers—3.6% | |
| Anheuser-Busch Companies, Inc. | | | 2,750,000 | | | $ | 117,617,500 | | |
| InBev NV (b) | | | 1,850,000 | | | | 86,748,082 | | |
| | | | 204,365,582 | | |
| Distillers & Vintners—1.5% | |
| Diageo plc (c) | | | 1,371,000 | | | $ | 86,962,530 | | |
| Hypermarkets & Super Centers—2.2% | |
| Wal-Mart Stores, Inc. | | | 2,600,000 | | | $ | 122,824,000 | | |
| Packaged Foods & Meats—2.9% | |
| General Mills, Inc. | | | 1,806,000 | | | $ | 91,528,080 | | |
| H.J. Heinz Company | | | 1,950,000 | | | | 73,944,000 | | |
| | | | 165,472,080 | | |
| Soft Drinks—1.2% | |
| Coca-Cola Enterprises, Inc. | | | 3,300,000 | | | $ | 67,122,000 | | |
| Integrated Oil & Gas—0.7% | |
| ConocoPhillips | | | 620,670 | | | $ | 39,195,310 | | |
| Oil & Gas Exploration & Production—1.5% | |
| Burlington Resources, Inc. | | | 942,200 | | | $ | 86,597,602 | | |
| Asset Management & Custody Banks—1.4% | |
| The Bank of New York Company, Inc. | | | 2,150,000 | | | $ | 77,486,000 | | |
| Diversified Banks—1.9% | |
| U.S. Bancorp | | | 3,550,000 | | | $ | 108,275,000 | | |
| Life & Health Insurance—1.5% | |
| AFLAC Incorporated | | | 1,817,000 | | | $ | 82,001,210 | | |
| Other Diversified Financial Services—4.3% | |
| JP Morgan Chase & Co. | | | 3,000,000 | | | $ | 124,920,000 | | |
| Citigroup, Inc. | | | 2,450,000 | | | | 115,713,500 | | |
| | | | 240,633,500 | | |
| Thrifts & Mortgage Finance—4.7% | |
| Washington Mutual, Inc. | | | 4,387,300 | | | $ | 186,986,726 | | |
| MGIC Investment Corporation | | | 1,140,600 | | | | 75,998,178 | | |
| | | | 262,984,904 | | |
| Health Care Equipment—2.1% | |
| Baxter International, Inc. | | | 3,050,000 | | | $ | 118,370,500 | | |
THE OAKMARK FUND
10
THE OAKMARK FUND
Schedule of Investments—March 31, 2006 (Unaudited) cont.
Name | | Shares Held/
Par Value | |
Market Value | |
| Common Stocks—95.0% (cont.) | |
| Pharmaceuticals—3.9% | |
| Bristol-Myers Squibb Company | | | 4,500,000 | | | $ | 110,745,000 | | |
| Abbott Laboratories | | | 2,537,300 | | | | 107,759,131 | | |
| | | | 218,504,131 | | |
| Aerospace & Defense—3.9% | |
| Raytheon Company | | | 2,800,000 | | | $ | 128,352,000 | | |
| Honeywell International, Inc. | | | 2,100,000 | | | | 89,817,000 | | |
| | | | 218,169,000 | | |
| Building Products—2.2% | |
| Masco Corporation | | | 3,733,600 | | | $ | 121,304,664 | | |
| Industrial Conglomerates—1.2% | |
| Tyco International Ltd. (b) | | | 2,558,000 | | | $ | 68,759,040 | | |
| Computer Hardware—5.3% | |
| Sun Microsystems, Inc. (a) | | | 21,270,000 | | | $ | 109,115,100 | | |
| Hewlett-Packard Company | | | 3,025,000 | | | | 99,522,500 | | |
| Dell Inc. (a) | | | 3,000,000 | | | | 89,280,000 | | |
| | | | 297,917,600 | | |
| Data Processing & Outsourced Services—2.4% | |
| First Data Corporation | | | 2,925,000 | | | $ | 136,948,500 | | |
| Office Electronics—1.4% | |
| Xerox Corporation (a) | | | 5,272,400 | | | $ | 80,140,480 | | |
| Semiconductors—3.1% | |
| Texas Instruments Incorporated | | | 2,800,000 | | | $ | 90,916,000 | | |
| Intel Corp. | | | 4,200,000 | | | | 81,270,000 | | |
| | | | 172,186,000 | | |
| Total Common Stocks (Cost: $4,000,351,488) | | | | | | | 5,341,106,696 | | |
| Short Term Investments—5.1% | |
| U.S. Government Bills—2.6% | |
United States Treasury Bills, 4.34% - 4.585%
due 4/13/2006 - 4/27/2006 | | $ | 150,000,000 | | | $ | 149,645,195 | | |
| Total U.S. Government Bills (Cost: $149,645,195) | | | | | | | 149,645,195 | | |
THE OAKMARK FUND
11
THE OAKMARK FUND
Schedule of Investments—March 31, 2006 (Unaudited) cont.
Name | |
Par Value | |
Market Value | |
| Short Term Investments—5.1% (cont.) | |
| Repurchase Agreements—2.5% | |
IBT Repurchase Agreement, 4.55% dated 3/31/2006
due 4/3/2006, repurchase price $137,552,135,
collateralized by a Government National Mortgage
Association Bond with a rate of 5.000%, with a
maturity date of 8/20/2034, and with a market
value plus accrued interest of $22,819,712, and by
Small Business Administration Bonds, with rates
of 7.000% - 8.080%, with maturities from
10/25/2022 - 8/25/2030, and with an aggregate
market value plus accrued interest of $121,555,288 | | $ | 137,500,000 | | | $ | 137,500,000 | | |
IBT Repurchase Agreement, 3.25% dated 3/31/2006
due 4/3/2006, repurchase price $1,941,427,
collateralized by a Small Business Administration
Bond, with a rate of 7.125%, with a maturity
date of 7/25/2025, and with a market value plus
accrued interest of $2,037,946 | | | 1,940,901 | | | | 1,940,901 | | |
| Total Repurchase Agreements (Cost: $139,440,901) | | | | | 139,440,901 | | |
| Total Short Term Investments (Cost: $289,086,096) | | | | | 289,086,096 | | |
| Total Investments (Cost $4,289,437,584)—100.1% | | | | $ | 5,630,192,792 | | |
| Other Liabilities In Excess Of Other Assets—(0.1%) | | | | | (6,592,166 | ) | |
| Total Net Assets—100% | | | | $ | 5,623,600,626 | | |
(a) Non-income producing security.
(b) Represents a foreign domiciled corporation.
(c) Represents an American Depository Receipt.
THE OAKMARK FUND
See accompanying notes to financial statements.
12
THE OAKMARK SELECT FUND
Report from Bill Nygren and Henry Berghoef, Portfolio Managers


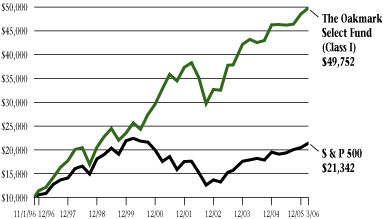
THE VALUE OF A $10,000 INVESTMENT IN THE
OAKMARK SELECT FUND FROM ITS INCEPTION (11/1/96) TO PRESENT (3/31/06) AS COMPARED TO THE STANDARD & POOR'S 500 INDEX4
| | | Average Annual Total Returns | |
| | | (as of 3/31/06) | |
| | | Total Return
Last 3 Months* | | 1-year | | 5-year | | Since
Inception
(11/1/96) | |
| Oakmark Select Fund (Class I) | | | 2.52 | % | | | 7.36 | % | | | 8.67 | % | | | 18.58 | % | |
| S&P 500 | | | 4.21 | % | | | 11.73 | % | | | 3.97 | % | | | 8.38 | % | |
| S&P MidCap 40010 | | | 7.63 | % | | | 21.62 | % | | | 12.75 | % | | | 14.74 | % | |
| Lipper Mid Cap Value Index11 | | | 6.77 | % | | | 16.38 | % | | | 12.84 | % | | | 11.48 | % | |
The graph and table do not reflect the deduction of taxes that a shareholder would pay on fund distributions or the redemption of fund shares.
The performance data quoted represents past performance. The above performance information for the Fund does not reflect the imposition of a 2% redemption fee on shares held for 90 days or less to deter market timers. If reflected, the fee would reduce the performance quoted. Past performance does not guarantee future results. The investment return and principal value will fluctuate so that an investor's shares, when redeemed, may be worth more or less than their original cost. Current performance may be lower or higher than the performance data quoted. Average annual total return measures annualized change, while total return measures aggregate change. To obtain most recent month-end performance data, visit www.oakmark.com.
* Not annualized
The Oakmark Select Fund increased by 3% during the quarter compared to 4% for the S&P 500, and it again achieved another new all-time high NAV8. Though returns relative to other funds have recently been disappointing, the plus sign that has preceded our returns has allowed us to continue compounding our shareholders' capital. As we have often said, we consider avoiding significant losses to be the most important requirement for achieving long-term financial goals, and we believe our approach is well suited for that.
Our best performing stock in the quarter was Mattel, up 15%. Mattel had been one of our worst performers, but it responded well to early signs that the Bratz doll fad may be nearing an end. That would be very welcome news for Barbie! Our worst performer was H&R Block, whose tax preparation business lost market share to a competitor that offered customers earlier access to their refunds. We believe that Block will take steps to prevent that problem next year, and we continue to believe the stock is an attractive investment.
During the quarter, we completed our sale of Burlington Resources, which is being acquired by ConocoPhillips. We also finished selling Moody's. Moody's is a great business and was one of Select's all-time best performing stocks. But at 35 times earnings, we are no longer confident it is a great value. We also sold Knight Ridder after it agreed to be acquired for $67.25 per share. We were pleased that the acquisition price, though not as high as past newspaper transactions, was a 30% premium to Knight Ridder's price before its largest shareholders requested this action. We added three companies to the portfolio last quarter: Dell, Intel, and Pulte Homes. We believe Dell and Intel are great businesses that are selling at average prices. Pulte sells at less than seven times estimated 2006 earnings, and we believe the market is being too pessimistic about how far earnings will fall when housing price increases moderate.
Best wishes,
 | |  | |
|
William C. Nygren, CFA
Portfolio Manager
bnygren@oakmark.com | | Henry R. Berghoef, CFA
Portfolio Manager
berghoef@oakmark.com | |
|
THE OAKMARK SELECT FUND
13
THE OAKMARK SELECT FUND
Schedule of Investments—March 31, 2006 (Unaudited)
Name | |
Shares Held | |
Market Value | |
| Common Stocks—94.8% | |
| Apparel Retail—7.4% | |
| Limited Brands | | | 9,580,981 | | | $ | 234,350,795 | | |
| The Gap, Inc. | | | 12,060,000 | | | | 225,280,800 | | |
| | | | 459,631,595 | | |
| Broadcasting & Cable TV—8.2% | |
| Liberty Media Corporation, Class A (a) | | | 31,000,000 | | | $ | 254,510,000 | | |
| Discovery Holding Company, Class A (a) | | | 11,224,300 | | | | 168,364,500 | | |
| CBS Corporation, Class B | | | 3,675,000 | | | | 88,126,500 | | |
| | | | 511,001,000 | | |
| Homebuilding—3.4% | |
| Pulte Homes, Inc. | | | 5,500,000 | | | $ | 211,310,000 | | |
| Leisure Products—2.8% | |
| Mattel, Inc. | | | 9,670,900 | | | $ | 175,333,417 | | |
| Movies & Entertainment—6.7% | |
| Time Warner, Inc. | | | 16,240,000 | | | $ | 272,669,600 | | |
| Viacom, Inc., Class B (a) | | | 3,675,000 | | | | 142,590,000 | | |
| | | | 415,259,600 | | |
| Restaurants—11.8% | |
| Yum! Brands, Inc. | | | 9,207,000 | | | $ | 449,854,020 | | |
| McDonald's Corporation | | | 8,300,000 | | | | 285,188,000 | | |
| | | | 735,042,020 | | |
| Specialized Consumer Services—5.8% | |
| H&R Block, Inc. (b) | | | 16,519,600 | | | $ | 357,649,340 | | |
| Other Diversified Financial Services—4.5% | |
| JP Morgan Chase & Co. | | | 6,750,000 | | | $ | 281,070,000 | | |
| Thrifts & Mortgage Finance—15.3% | |
| Washington Mutual, Inc. | | | 22,217,400 | | | $ | 946,905,588 | | |
| Health Care Services—3.4% | |
| IMS Health Incorporated | | | 8,303,441 | | | $ | 213,979,675 | | |
| Pharmaceuticals—4.4% | |
| Bristol-Myers Squibb Company | | | 10,990,200 | | | $ | 270,468,822 | | |
| Diversified Commercial and Professional Services—4.9% | |
| The Dun & Bradstreet Corporation (a)(b) | | | 3,934,900 | | | $ | 301,728,132 | | |
| Computer Hardware—3.4% | |
| Dell Inc. (a) | | | 7,000,000 | | | $ | 208,320,000 | | |
| Data Processing & Outsourced Services—5.9% | |
| First Data Corporation | | | 7,815,400 | | | $ | 365,917,028 | | |
THE OAKMARK SELECT FUND
14
THE OAKMARK SELECT FUND
Schedule of Investments—March 31, 2006 (Unaudited) cont.
Name | | Shares Held/
Par Value | |
Market Value | |
| Common Stocks—94.8% (cont.) | |
| Office Electronics—4.1% | |
| Xerox Corporation (a) | | | 16,746,400 | | | $ | 254,545,280 | | |
| Semiconductors—2.8% | |
| Intel Corp. | | | 9,000,000 | | | $ | 174,150,000 | | |
| Total Common Stocks (Cost: $4,270,392,238) | | | | | | | 5,882,311,497 | | |
| Short Term Investments—5.0% | |
| U.S. Government Bills—2.4% | |
United States Treasury Bills, 4.385% - 4.43%
due 4/6/2006 - 4/20/2006 | | $ | 150,000,000 | | | $ | 149,779,396 | | |
| Total U.S. Government Bills (Cost: $149,779,396) | | | | | | | 149,779,396 | | |
| Repurchase Agreements—2.6% | |
IBT Repurchase Agreement, 4.55% dated 3/31/2006
due 4/3/2006, repurchase price $155,058,771
collateralized by a Government National Mortgage
Association Bond with a rate of 5.375%, with
a maturity date of 7/20/2034, and with a market
value plus accrued interest of $27,299,914, and by
Small Business Administration Bonds, with rates of
6.125% - 7.740%, with maturities from
6/25/2019 - 11/25/2030, and with an aggregate
market value plus accrued interest of $135,450,086 | | $ | 155,000,000 | | | $ | 155,000,000 | | |
IBT Repurchase Agreement, 3.25% dated 3/31/2006
due 4/3/2006, repurchase price $1,822,337,
collateralized by a Small Business Administration
Bond, with a rate of 6.625%, with a maturity
date of 4/25/2024, and with a market value plus
accrued interest of $1,912,936 | | | 1,821,844 | | | | 1,821,844 | | |
| Total Repurchase Agreements (Cost: $156,821,844) | | | | | | | 156,821,844 | | |
| Total Short Term Investments (Cost: $306,601,240) | | | | | | | 306,601,240 | | |
| Total Investments (Cost $4,576,993,478)—99.8% | | | | | | $ | 6,188,912,737 | | |
| Other Assets In Excess Of Other Liabilities—0.2% | | | | | | | 13,594,619 | | |
| Total Net Assets—100% | | | | | | $ | 6,202,507,356 | | |
(a) Non-income producing security.
(b) See footnote number five in the Notes to the Financial Statements regarding investments in affiliated issuers.
See accompanying notes to financial statements.
THE OAKMARK SELECT FUND
15
THE OAKMARK EQUITY AND INCOME FUND
Report from Clyde S. McGregor and Edward A. Studzinski, Portfolio Managers


THE VALUE OF A $10,000 INVESTMENT IN THE
OAKMARK EQUITY AND INCOME FUND FROM ITS INCEPTION (11/1/95) TO PRESENT (3/31/06) AS COMPARED TO THE LIPPER BALANCED FUND INDEX12

| | | Average Annual Total Returns | |
| | | (as of 3/31/06) | |
| | | Total Return
Last 3 Months* | | 1-year | | 5-year | | 10-year | | Since
Inception
(11/1/95) | |
Oakmark Equity &
Income Fund (Class I) | | | 2.00 | % | | | 11.49 | % | | | 10.81 | % | | | 13.66 | % | | | 13.61 | % | |
Lipper Balanced
Fund Index | | | 3.25 | % | | | 10.02 | % | | | 5.25 | % | | | 7.68 | % | | | 8.02 | % | |
| S&P 5004 | | | 4.21 | % | | | 11.73 | % | | | 3.97 | % | | | 8.95 | % | | | 9.73 | % | |
Lehman Govt./
Corp. Bond13 | | | -1.01 | % | | | 2.02 | % | | | 5.23 | % | | | 6.32 | % | | | 6.10 | % | |
The graph and table do not reflect the deduction of taxes that a shareholder would pay on fund distributions or the redemption of fund shares.
The performance data quoted represents past performance. The above performance information for the Fund does not reflect the imposition of a 2% redemption fee on shares held for 90 days or less to deter market timers. If reflected, the fee would reduce the performance quoted. Past performance does not guarantee future results. The investment return and principal value will fluctuate so that an investor's shares, when redeemed, may be worth more or less than their original cost. Current performance may be lower or higher than the performance data quoted. Average annual total return measures annualized change, while total return measures aggregate change. To obtain most recent month-end performance data, visit www.oakmark.com.
* Not annualized
Quarter Review
The Equity and Income Fund returned 2% in the quarter ended March 31, which contrasts to the 3% result Lipper reported for its Balanced Fund Index. Equities provided virtually all of the Equity and Income Fund's return as rising interest rates caused the prices of fixed income investments to weaken. The shortfall compared to the Lipper Balanced Fund Index does not diminish our pleasure in reporting another positive quarter. As we have often said in these letters, we present the Lipper Balanced Fund Index as a standard for comparison, but our personal benchmark is to earn substantial, persistent positive returns. Persistent positive returns over time build wealth faster than volatile return streams, and the persistent stream demands less psychological fortitude from the investor.
Nonetheless, during this quarter, many of you communicated discomfiture with our progress. Most comments pertained to 2006 year-to-date returns, while one individual was quite particular, highlighting the period September 15, 2005 through January 31, 2006. Some correspondents asked if the Fund was lagging because we had restructured the portfolio prematurely, while others suggested that we should restructure the portfolio immediately in order to escape our malaise. We have always said that we welcome your e-mailed comments and queries, and we are almost as glad for the unhappy tidings as we are for the compliments. This past quarter's e-mails suggest that we need once again to discuss our core principles in managing this Fund.
Core Principles
The Equity and Income Fund is a balanced fund intended to produce income while preserving and growing capital. The Fund's asset allocation has tended to stay in the general neighborhood of 60% equity and 40% fixed income, a common structure for balanced funds. Asset allocations of this sort are responsive to the universal need to mediate between goals for current income and long-term growth, and, happily, they ask little of human nature. For an asset allocation to be effective, it must provide its greatest utility in times of stress. Experience has demonstrated that investors who maintain a well-balanced asset allocation are less likely to panic. Equity and Income's similarities with most other balanced funds end with our average asset allocation, however.
The factor that most distinguishes the Fund is our investment philosophy. To manage the Equity and Income Fund, we use the same value investment philosophy that undergirds all of the Funds in the Oakmark group. We continually ask "what are our holdings worth" and "what are their prices." In addition for our equity investments, we seek to determine if the issuing company shows persistent growth in intrinsic value per
THE OAKMARK EQUITY AND INCOME FUND
16
share and if its management team treats its shareholders as though they are partners.
Second, our concept of a balanced fund differs from most other fund managers. We understand a balanced fund to be an integrated portfolio, not an aggregation of independent pieces. All of the Fund's holdings compete with every other holding for space. Accordingly, our ability to identify attractive investment opportunities affects the Fund's asset allocation. Over the Fund's more than ten-year history, the equity allocation percentage has ranged from the low 50's to the mid-60's, always a function of our ability to identify undervalued equities. In the same manner, the allocation to corporate debt instruments has varied widely depending on our evaluation of opportunities in that sector.
Other Differentiating Characteristics Include:
• Benchmarks do not drive our investing. Investors in the Fund should expect results to differ from benchmarks, especially over short time periods. We are pretty much congenitally unable to do anything other than buy and own securities at a discount to intrinsic value. And, we accept that periods of underperformance will occur when the market does not recognize the values we have identified.
• We are relatively indifferent to the size of the opportunity. We have the ability to invest the Fund in stocks of small-cap, mid-cap, and large-cap companies, as well as foreign-domiciled concerns.
• While income is always desirable, value is determinative. What this means is that income is a characteristic to which we assign value and, like most characteristics, it can be over-priced or under-valued.
• Quality, like income, is a factor to which we ascribe value. We can and will own low grade bonds and/or preferred stocks in the Fund, but only when we perceive their potential return to be competitive with equities.
• The Fund's diversification is an outcome of our bottom-up investment process. We will generally invest the Fund in a more concentrated fashion than other balanced funds. Outstanding investment opportunities are scarce, in our opinion.
• Our investment horizon is very long-term. The ability to think and act with a long-term horizon is a great advantage. At the same time, we can be rather inactive for long periods. In our view, sometimes the best course of action is to do nothing.
For investors in mutual funds the question of "fit" is paramount. Investors make the best decisions when they have invested with funds whose style and philosophy mesh well with their own character and needs. Perhaps the most useful advice we can give fund investors is that they should often check to see if they understand their funds and, if so, consider whether their funds still fit their investing needs.
Fixed Income Update
In any given time period our shareholders' e-mails tend to coalesce around specific issues. While recently the flow of e-mails has focused on short-term results, three years ago the flow overwhelmingly centered on the question of how to protect against rising interest rates. We wrote then about our efforts to protect the portfolio through the use of short duration securities and inflation-indexed bonds. How has this worked out? In an unexpected and not particularly satisfying fashion, we would say.
To all of our correspondents who warned us that the Federal Reserve would substantially increase short-term interest rates, you were correct. The effect on the fixed income market, however, has been quite limited. For example, ten-year U.S. Treasury notes trade for yields almost unchanged from two years ago. Our defensive posture in our fixed income holdings has, to date, reduced both risk and return.
Nevertheless, we remain risk-averse in our fixed income allocation, both in terms of sensitivity to interest rate changes and in terms of quality. The fixed income duration is just under two years and the portfolio has no high yield debt. We will happily change these portfolio characteristics when we perceive that value has returned to the sector.
A Note on Activity
As mentioned above, during the quarter shareholders asked us repeatedly if we were substantially restructuring the portfolio. Merely looking at the number of equity holdings that left the portfolio in the quarter (nine), one could easily come to this conclusion. This is misleading, however. Eight of the holdings were of minimal size, collectively comprising less than 2% of the portfolio. The ninth, Burlington Resources, completed its sale to ConocoPhillips on March 31 (effective 4/3/06). The portfolio ended the quarter somewhat more concentrated but little changed in fundamental character.
In closing, we should note that we also receive many complimentary e-mails for which we are grateful. As always, we thank you for entrusting us with your assets.
 | |  | |
|
Clyde S. McGregor, CFA
Portfolio Manager
mcgregor@oakmark.com | | Edward A. Studzinski, CFA
Portfolio Manager
estudzinski@oakmark.com | |
|
THE OAKMARK EQUITY AND INCOME FUND
17
THE OAKMARK EQUITY AND INCOME FUND
Schedule of Investments—March 31, 2006 (Unaudited)
Name | |
Shares Held | |
Market Value | |
| Equity and Equivalents—62.3% | |
| Common Stocks—62.3% | |
| Apparel Retail—1.7% | |
| The TJX Companies, Inc. | | | 7,240,000 | | | $ | 179,696,800 | | |
| Broadcasting & Cable TV—5.6% | |
| EchoStar Communications Corporation, Class A (a) | | | 8,250,000 | | | $ | 246,427,500 | | |
| The E.W. Scripps Company, Class A | | | 4,200,000 | | | | 187,782,000 | | |
| The DIRECTV Group, Inc. (a) | | | 8,026,722 | | | | 131,638,241 | | |
| CBS Corporation, Class A | | | 823,800 | | | | 19,853,580 | | |
| | | | 585,701,321 | | |
| Homebuilding—0.1% | |
| Pulte Homes, Inc. | | | 200,000 | | | $ | 7,684,000 | | |
| Movies & Entertainment—1.5% | |
| News Corporation, Class B | | | 9,000,000 | | | $ | 158,040,000 | | |
| Publishing—1.8% | |
| The Washington Post Company, Class B | | | 235,500 | | | $ | 182,924,625 | | |
| Restaurants—1.0% | |
| McDonald's Corporation | | | 3,000,000 | | | $ | 103,080,000 | | |
| Brewers—0.6% | |
| InBev NV (b) | | | 1,250,000 | | | $ | 58,613,569 | | |
| Distillers & Vintners—2.5% | |
| Diageo plc (c) | | | 4,100,000 | | | $ | 260,063,000 | | |
| Hypermarkets & Super Centers—1.7% | |
| Costco Wholesale Corporation | | | 3,200,000 | | | $ | 173,312,000 | | |
| Packaged Foods & Meats—3.6% | |
| Nestle SA (c) | | | 3,900,000 | | | $ | 289,403,400 | | |
| Smithfield Foods, Inc. (a) | | | 2,800,000 | | | | 82,152,000 | | |
| | | | 371,555,400 | | |
| Personal Products—1.4% | |
| Avon Products, Inc. | | | 4,520,000 | | | $ | 140,888,400 | | |
| Tobacco—1.3% | |
| UST, Inc. | | | 3,300,000 | | | $ | 137,280,000 | | |
| Integrated Oil & Gas—1.2% | |
| ConocoPhillips | | | 2,000,000 | | | $ | 126,300,000 | | |
THE OAKMARK EQUITY AND INCOME FUND
18
THE OAKMARK EQUITY AND INCOME FUND
Schedule of Investments—March 31, 2006 (Unaudited) cont.
Name | |
Shares Held | |
Market Value | |
| Equity and Equivalents—62.3% (cont.) | |
| Oil & Gas Exploration & Production—12.0% | |
| XTO Energy, Inc. | | | 10,561,338 | | | $ | 460,157,497 | | |
| Burlington Resources, Inc. | | | 4,000,000 | | | | 367,640,000 | | |
| EnCana Corp. (b) | | | 6,500,000 | | | | 303,745,000 | | |
| St. Mary Land & Exploration Company (d) | | | 2,900,000 | | | | 118,407,000 | | |
| | | | 1,249,949,497 | | |
| Investment Banking & Brokerage—1.9% | |
| Morgan Stanley | | | 3,200,000 | | | $ | 201,024,000 | | |
| Property & Casualty Insurance—4.4% | |
| SAFECO Corporation | | | 4,610,000 | | | $ | 231,468,100 | | |
| The Progressive Corporation | | | 1,125,000 | | | | 117,292,500 | | |
| MBIA, Inc. | | | 1,850,000 | | | | 111,240,500 | | |
| | | | 460,001,100 | | |
| Real Estate Investment Trusts—0.0% | |
| Plum Creek Timber Company, Inc. | | | 140,000 | | | $ | 5,170,200 | | |
| Biotechnology—2.1% | |
| MedImmune, Inc. (a) | | | 6,000,000 | | | $ | 219,480,000 | | |
| Health Care Equipment—1.2% | |
| Varian, Inc. (a)(d) | | | 1,649,400 | | | $ | 67,922,292 | | |
| Hospira, Inc. (a) | | | 1,350,000 | | | | 53,271,000 | | |
| | | | 121,193,292 | | |
| Health Care Services—2.5% | |
| Caremark Rx, Inc. (a) | | | 5,301,300 | | | $ | 260,717,934 | | |
| Aerospace & Defense—7.1% | |
| General Dynamics Corporation | | | 4,700,000 | | | $ | 300,706,000 | | |
| Raytheon Company | | | 3,599,700 | | | | 165,010,248 | | |
| Alliant Techsystems, Inc. (a) | | | 1,325,000 | | | | 102,250,250 | | |
| Rockwell Collins, Inc. | | | 1,600,000 | | | | 90,160,000 | | |
| Honeywell International, Inc. | | | 1,889,500 | | | | 80,813,915 | | |
| | | | 738,940,413 | | |
| Commercial Printing—1.5% | |
| R.R. Donnelley & Sons Company | | | 4,909,500 | | | $ | 160,638,840 | | |
| Human Resource & Employment Services—0.4% | |
| Watson Wyatt & Company Holdings | | | 1,236,100 | | | $ | 40,272,138 | | |
| Industrial Conglomerates—1.9% | |
| Tyco International Ltd. (b) | | | 7,500,000 | | | $ | 201,600,000 | | |
THE OAKMARK EQUITY AND INCOME FUND
19
THE OAKMARK EQUITY AND INCOME FUND
Schedule of Investments—March 31, 2006 (Unaudited) cont.
| Name | | Shares Held/
Par Value | |
Market Value | |
| Equity and Equivalents—62.3% (cont.) | |
| Application Software—0.4% | |
| Mentor Graphics Corporation (a) | | | 3,640,000 | | | $ | 40,222,000 | | |
| Data Processing & Outsourced Services—1.2% | |
| Ceridian Corporation (a) | | | 4,800,000 | | | $ | 122,160,000 | | |
| Internet Software & Services—0.8% | |
| Jupiter Telecommunications Co., Ltd. (a)(b) | | | 125,000 | | | $ | 88,356,484 | | |
| Technology Distributors—0.7% | |
| CDW Corporation | | | 1,200,000 | | | $ | 70,620,000 | | |
| Paper Products—0.2% | |
| Schweitzer-Mauduit International, Inc. | | | 700,000 | | | $ | 16,800,000 | | |
| Total Common Stocks (Cost: $4,795,442,630) | | | | | | | 6,482,285,013 | | |
| Total Equity and Equivalents (Cost: $4,795,442,630) | | | | | | | 6,482,285,013 | | |
| Fixed Income—33.4% | |
| Corporate Bonds—0.2% | |
| Automobile Manufacturers—0.0% | |
Toyota Motor Credit Corp., Series B, (MTN),
4.75% due 4/20/2009 | | $ | 5,000,000 | | | $ | 4,948,190 | | |
| Paper Packaging—0.2% | |
Sealed Air Corporation, 144A,
5.625% due 7/15/2013 (e) | | $ | 20,000,000 | | | $ | 19,438,140 | | |
| Total Corporate Bonds (Cost: $25,184,655) | | | | | | | 24,386,330 | | |
| Government and Agency Securities—33.2% | |
| Canadian Government Bonds—6.1% | |
| Canada Government, 3.25% due 12/1/2006 | | CAD | 250,000,000 | | | $ | 213,053,438 | | |
| Canada Government, 3.00% due 6/1/2007 | | CAD | 250,000,000 | | | | 211,631,840 | | |
| Canada Government, 2.75% due 12/1/2007 | | CAD | 250,000,000 | | | | 209,812,024 | | |
| | | | 634,497,302 | | |
| Norwegian Government Bonds—0.1% | |
| Norway Government, 6.75% due 1/15/2007 | | NOK | 50,000,000 | | | $ | 7,849,377 | | |
| Swedish Government Bonds—0.1% | |
| Kingdom of Sweden, 3.50% due 4/20/2006 | | SEK | 50,000,000 | | | $ | 6,422,996 | | |
THE OAKMARK EQUITY AND INCOME FUND
20
THE OAKMARK EQUITY AND INCOME FUND
Schedule of Investments—March 31, 2006 (Unaudited) cont.
Name | |
Par Value | |
Market Value | |
| Fixed Income—33.4% (cont.) | |
| U.S. Government Notes—19.7% | |
| United States Treasury Notes, 4.625% due 2/29/2008 | | $ | 500,000,000 | | | $ | 497,988,500 | | |
| United States Treasury Notes, 4.125% due 8/15/2008 (f) | | | 500,000,000 | | | | 492,851,500 | | |
United States Treasury Notes, 3.375% due 1/15/2007,
Inflation Indexed | | | 266,529,030 | | | | 269,381,690 | | |
| United States Treasury Notes, 4.50% due 2/15/2009 | | | 250,000,000 | | | | 247,832,000 | | |
| United States Treasury Notes, 4.25% due 10/31/2007 | | | 250,000,000 | | | | 247,714,750 | | |
| United States Treasury Notes, 4.50% due 2/28/2011 (f) | | | 250,000,000 | | | | 246,357,500 | | |
| United States Treasury Notes, 4.25% due 11/30/2007 | | | 50,000,000 | | | | 49,521,500 | | |
| | | | 2,051,647,440 | | |
| U.S. Government Agencies—7.2% | |
| Fannie Mae, 5.25% due 4/15/2007 | | $ | 50,000,000 | | | $ | 50,054,850 | | |
Federal Home Loan Mortgage Corporation,
3.75% due 11/15/2006 | | | 50,000,000 | | | | 49,581,250 | | |
| Fannie Mae, 3.875% due 5/15/2007 | | | 50,000,000 | | | | 49,323,700 | | |
Federal Home Loan Mortgage Corporation,
4.00% due 8/17/2007 | | | 50,000,000 | | | | 49,266,350 | | |
| Federal Home Loan Bank, 3.625% due 6/20/2007 | | | 50,000,000 | | | | 49,124,300 | | |
| Federal Home Loan Bank, 4.125% due 4/18/2008 | | | 50,000,000 | | | | 49,114,300 | | |
| Federal Home Loan Bank, 3.875% due 8/22/2008 | | | 50,000,000 | | | | 48,688,100 | | |
| Federal Home Loan Bank, 5.00% due 12/20/2011 | | | 34,555,000 | | | | 33,735,563 | | |
| Federal Home Loan Bank, 2.875% due 9/15/2006 | | | 25,000,000 | | | | 24,758,000 | | |
| Fannie Mae, 4.25% due 7/15/2007 | | | 25,000,000 | | | | 24,730,700 | | |
| Federal Home Loan Bank, 2.625% due 10/16/2006 | | | 25,000,000 | | | | 24,671,375 | | |
Federal Home Loan Mortgage Corporation,
3.75% due 4/15/2007 | | | 25,000,000 | | | | 24,654,825 | | |
| Federal Home Loan Bank, 2.75% due 12/15/2006 | | | 25,000,000 | | | | 24,593,225 | | |
| Fannie Mae, 4.25% due 5/15/2009 | | | 25,000,000 | | | | 24,388,325 | | |
| Fannie Mae, 3.25% due 11/15/2007 | | | 25,000,000 | | | | 24,290,050 | | |
| Fannie Mae, 3.625% due 12/28/2009 | | | 24,435,000 | | | | 23,966,679 | | |
| Federal Home Loan Bank, 2.50% due 4/20/2009 | | | 20,000,000 | | | | 19,975,920 | | |
Federal Home Loan Mortgage Corporation,
3.625% due 3/24/2008 | | | 20,000,000 | | | | 19,876,780 | | |
Federal Home Loan Mortgage Corporation,
5.00% due 10/18/2010 | | | 20,000,000 | | | | 19,646,180 | | |
| Fannie Mae, 2.60% due 4/28/2009 | | | 18,800,000 | | | | 18,768,115 | | |
| Fannie Mae, 3.125% due 11/30/2009 | | | 12,697,000 | | | | 12,538,148 | | |
| Fannie Mae, 4.25% due 2/19/2010 | | | 12,888,000 | | | | 12,452,734 | | |
Federal Home Loan Mortgage Corporation,
3.00% due 11/17/2006 | | | 10,000,000 | | | | 9,870,230 | | |
| Fannie Mae, 3.00% due 10/6/2009 | | | 10,000,000 | | | | 9,817,420 | | |
| Fannie Mae, 3.375% due 3/3/2008 | | | 9,300,000 | | | | 9,202,964 | | |
| Fannie Mae, 3.50% due 10/14/2010 | | | 7,550,000 | | | | 7,443,379 | | |
THE OAKMARK EQUITY AND INCOME FUND
21
THE OAKMARK EQUITY AND INCOME FUND
Schedule of Investments—March 31, 2006 (Unaudited) cont.
Name | |
Par Value | |
Market Value | |
| Fixed Income—33.4% (cont.) | |
| U.S. Government Agencies—7.2% (cont.) | |
| Federal Home Loan Bank, 3.00% due 8/17/2007 | | $ | 7,500,000 | | | $ | 7,389,952 | | |
| Fannie Mae, 4.00% due 4/13/2009 | | | 5,000,000 | | | | 4,981,565 | | |
| Federal Home Loan Bank, 4.30% due 8/16/2010 | | | 5,000,000 | | | | 4,959,975 | | |
| Federal Home Loan Bank, 4.52% due 8/26/2009 | | | 4,825,000 | | | | 4,715,617 | | |
| Federal Home Loan Bank, 2.25% due 2/22/2007 | | | 4,000,000 | | | | 3,969,508 | | |
| Fannie Mae, 5.125% due 5/4/2012 | | | 4,013,000 | | | | 3,928,779 | | |
| Fannie Mae, 3.75% due 6/23/2009 | | | 2,820,000 | | | | 2,807,818 | | |
| | | | 747,286,676 | | |
| Total Government and Agency Securities (Cost: $3,457,906,238) | | | | | | | 3,447,703,791 | | |
| Total Fixed Income (Cost: $3,483,090,893) | | | | | | | 3,472,090,121 | | |
| Short Term Investments—3.8% | |
| U.S. Government Bills—0.9% | |
| United States Treasury Bills, 4.395%-4.43% | | $ | 100,000,000 | | | $ | 99,724,389 | | |
| due 4/20/2006 - 4/27/2006 | | | | | | | | | |
| Total U.S. Government Bills (Cost: $99,724,389) | | | | | | | 99,724,389 | | |
| Repurchase Agreements—2.9% | |
IBT Repurchase Agreement, 4.55% dated 3/31/2006 due
4/3/2006, repurchase price $297,112,612, collateralized
by Government National Mortgage Association Bonds
with a rate of 4.000% - 4.875%, with maturities from
1/20/2033 - 2/20/2035, and with a market
value plus accrued interest of $78,836,304, and by Small
Business Administration Bonds, with rates of
6.765% - 8.625%, with maturities from
12/25/2013 - 9/25/2030, and with an aggregate
market value plus accrued interest of $233,013,696 | | $ | 297,000,000 | | | $ | 297,000,000 | | |
IBT Repurchase Agreement, 3.25% dated 3/31/2006 due
4/3/2006, repurchase price $2,200,458, collateralized
by a Small Business Administration Bond,
with a rate of 7.875%, with a maturity date of
4/25/2027, and with a market value plus accrued
interest of $2,309,856 | | | 2,199,863 | | | | 2,199,863 | | |
| Total Repurchase Agreements (Cost: $299,199,863) | | | | | | | 299,199,863 | | |
| Total Short Term Investments (Cost: $398,924,252) | | | | | | | 398,924,252 | | |
| Total Investments (Cost $8,677,457,775)—99.5% | | | | | | $ | 10,353,299,386 | | |
| Other Assets In Excess Of Other Liabilities—0.5% | | | | | | | 51,747,902 | | |
| Total Net Assets—100% | | | | | | $ | 10,405,047,288 | | |
THE OAKMARK EQUITY AND INCOME FUND
22
THE OAKMARK EQUITY AND INCOME FUND
Schedule of Investments—March 31, 2006 (Unaudited) cont.
(a) Non-income producing security.
(b) Represents a foreign domiciled corporation.
(c) Represents an American Depository Receipt.
(d) See footnote number five in the Notes to the Financial Statements regarding investments in affiliated issuers.
(e) Security exempt from registration under Rule 144A of the Securities Act of 1933. These securities may be resold in transactions exempt from registration, normally to qualified institutional buyers.
(f) All or a portion of security out on loan.
Key to abbreviations:
CAD: Canadian Dollar
MTN: Medium Term Note
NOK: Norwegian Krone
SEK: Swedish Krona
See accompanying notes to financial statements.
THE OAKMARK EQUITY AND INCOME FUND
23
THE OAKMARK GLOBAL FUND
Report from Clyde S. McGregor and Robert A. Taylor, Portfolio Managers


THE VALUE OF A $10,000 INVESTMENT IN THE
OAKMARK GLOBAL FUND FROM ITS INCEPTION (8/4/99) TO PRESENT (3/31/06) AS COMPARED TO THE MSCI WORLD INDEX14

| | | Average Annual Total Returns | |
| | | (as of 3/31/06) | |
| | | Total Return
Last 3 Months* | | 1-year | | 5-year | | Since
Inception
(8/4/99) | |
| Oakmark Global Fund (Class I) | | | 6.86 | % | | | 20.28 | % | | | 19.79 | % | | | 16.92 | % | |
| MSCI World | | | 6.60 | % | | | 18.02 | % | | | 6.38 | % | | | 2.83 | % | |
| Lipper Global Fund Index15 | | | 7.08 | % | | | 20.87 | % | | | 7.17 | % | | | 5.14 | % | |
The graph and table do not reflect the deduction of taxes that a shareholder would pay on fund distributions or the redemption of fund shares.
The performance data quoted represents past performance. The above performance information for the Fund does not reflect the imposition of a 2% redemption fee on shares held for 90 days or less to deter market timers. If reflected, the fee would reduce the performance quoted. Past performance does not guarantee future results. The investment return and principal value will fluctuate so that an investor's shares, when redeemed, may be worth more or less than their original cost. Current performance may be lower or higher than the performance data quoted. Average annual total return measures annualized change, while total return measures aggregate change. To obtain most recent month-end performance data, visit www.oakmark.com.
* Not annualized
Quarter Review
The Oakmark Global Fund posted a return of 7% for the quarter ended March 31, 2006, in line with the figures for the Lipper Global Fund Index and the MSCI World Index.
International stock markets showed considerable strength during the quarter. While some international markets enjoyed double-digit increases, the U.S., though positive, trailed. In our view, these returns indicate a continuation and even amplification of 2005 trends. As is often the case, the U.S. is somewhat out-of-phase with the economies of other developed nations. Coming out of the 2002 downturn, the U.S. economy rebounded vigorously, while most other developed nations experienced more modest improvement. Now the situation is reversed. As much of the world experiences accelerating economic growth, in the U.S., the Federal Reserve is attempting to reduce speculation in some sectors, especially housing, without pushing the entire economy into recession. After 15 short-term interest rate increases over the past two years, U.S. government securities now have some of the highest yields in the world. For example, yields on U.S. ten-year bonds exceed not only those of all other G7 nations but also those from smaller countries, including Greece and the Czech Republic. The Fed's moves have not prevented corporate earnings from growing rapidly, however.
As we have often noted in these letters, we construct the Fund from the bottom up, populating the portfolio with the most attractive issues available to us from across the globe. Because of this approach, our country weightings will change over time as our perception of value evolves. This can be seen clearly in our weighting for U.S. stocks. Several years ago the Fund was split 50:50 between the U.S. and the rest of the world. As U.S. issues attained our price targets, we found that the dominant new opportunities had shifted abroad. For example, at the end of 2000, the Fund had no Japanese issues compared to seven holdings and a 13% weighting as of this writing. The necessary outcome after 2000 was that the U.S. allocation declined, eventually reaching a nadir of 34%.
However, over the past two years relative price movements in combination with strong earnings growth in the U.S. have changed the valuation calculus. We believe U.S. issues are generically more competitive today. The Fund's asset allocation
THE OAKMARK GLOBAL FUND
24
expresses this observation as the U.S. weighting has risen to approximately 40%. All other things being equal, we expect the U.S. allocation to continue to grow; then again, how often are all other things equal? In any event, you may be assured we will continue to take the Fund wherever value leads us.
Activity
Our trading activity was rather high in the quarter. We sold two holdings that met our price objectives, Banco Popolare di Verona and Euronext, while Burlington Resources completed its sale to ConocoPhillips on the last day of the quarter (effective 4/3/06). We also eliminated the Fund's holding of Tribune, believing that News Corp. (discussed below) was a superior opportunity among diversified media companies. We added six new names to the portfolio: three international and three U.S.-domiciled.
Beginning alphabetically, Swiss-headquartered Adecco is one of the largest temporary employment agencies in the world. We have long admired the company's franchise, but management's capital allocation decisions had limited our interest. Apparently, the company's Board came to a similar conclusion. Adecco recently completed the acquisition of DIS, a German temporary help agency, and installed the DIS management team at the helm of Adecco. We view this change to be very positive as DIS had produced industry-leading margins and demonstrated a strong shareholder orientation.
News Corp. is one of the largest global media conglomerates. The company has interests in TV and satellite broadcasting, film production, magazines, newspapers, books, and cable television networks. The company benefits from growing free cash flow and, as a result, enjoys a strong balance sheet. We find News to be unusually cheap relative to the value of its individual pieces.
Until very recently, a name like Oracle would not have shown up in a value-based portfolio. But, for value investors, a bargain price combined with strong cash generation and a solid balance sheet overcomes any initial inhibitions. Oracle is the world's largest enterprise software company and maintains a dominant position in database software. Previously a distant second place in enterprise application software, we believe Oracle's acquisitions of Peoplesoft and Seibel Systems have greatly enhanced the company's market position.
Uni-Charm is a Japanese company with interests in hygiene products and pet food. The company's brands are well established with large market shares, resulting in attractive returns on capital and substantial free cash generation. Uni-Charm's management's words and deeds demonstrate their shareholder-friendly orientation.
Vodafone is another former growth favorite that recently afforded us the opportunity to purchase shares at an attractive price. The company is one of the leading mobile phone operators in the world enjoying strong market positions in the UK, Germany, and Italy as well as an important joint venture with Verizon in the U.S. Soon after our investment in Vodafone, management announced the sale of the company's operations in Japan, a market where the company had never been able to prosper. We believe that this sale and other recent actions demonstrate the company's improved capital allocation. Combined with the effects of the completion of the rollout of 3G, the new industry standard, we believe Vodafone's earnings should begin to experience accelerating growth.
Last but not least, XTO Energy is an independent energy exploration and production company focused on onshore North America basins. Management is unusually adept at purchasing properties from the major oil companies and re-engineering the fields to enhance their value. Management has been able to grow the company's production and reserves at rates we find far superior to most competitors.
Hopefully, the diversity of this list of new names for the portfolio demonstrates that we continue to find value in a wide variety of industries and locales. We thank you for your trust and patience.
 | |  | |
|
Clyde S. McGregor, CFA
Portfolio Manager
mcgregor@oakmark.com | | Robert A. Taylor, CFA
Portfolio Manager
rtaylor@oakmark.com | |
|
THE OAKMARK GLOBAL FUND
25
THE OAKMARK GLOBAL FUND
Global Diversification—March 31, 2006 (Unaudited)
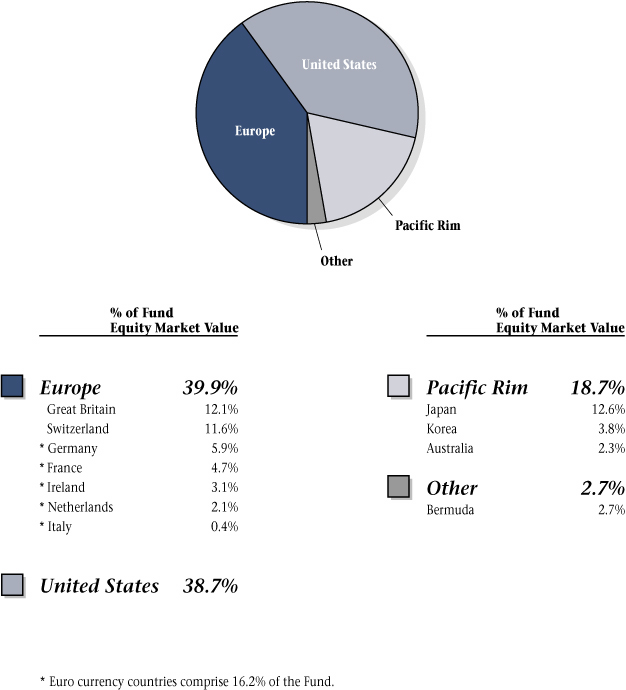
THE OAKMARK GLOBAL FUND
26
THE OAKMARK GLOBAL FUND
Schedule of Investments—March 31, 2006 (Unaudited)
| Name | | Description | | Shares Held | | Market Value | |
| Common Stocks—99.3% | |
| Apparel Retail—2.1% | |
The TJX Companies, Inc.
(United States) | | Discount Apparel & Home
Fashion Retailer | | | 1,900,000 | | | $ | 47,158,000 | | |
| Apparel, Accessories & Luxury Goods—0.4% | |
| Bulgari S.p.A. (Italy) | | Jewelry Manufacturer &
Retailer | | | 740,000 | | | $ | 8,903,447 | | |
| Automobile Manufacturers—3.5% | |
Bayerische Motoren Werke
(BMW) AG (Germany) | | Luxury Automobile Manufacturer | | | 1,424,000 | | | $ | 78,418,957 | | |
| Broadcasting & Cable TV—3.5% | |
Discovery Holding
Company, Class A
(United States) (a) | | Media Management &
Network Services | | | 2,955,000 | | | $ | 44,325,000 | | |
CBS Corporation, Class B
(United States) | | Radio & Television Broadcasting | | | 1,350,000 | | | | 32,373,000 | | |
| | | | 76,698,000 | | |
| Household Appliances—2.8% | |
Snap-on Incorporated
(United States) | | Tool & Equipment Manufacturer | | | 1,630,000 | | | $ | 62,135,600 | | |
| Leisure Products—1.2% | |
Brunswick Corp.
(United States) | | Leisure & Recreation Products
Manufacturer | | | 688,000 | | | $ | 26,735,680 | | |
| Motorcycle Manufacturers—2.4% | |
Harley-Davidson, Inc.
(United States) | | Motorcycle Manufacturer | | | 1,037,000 | | | $ | 53,799,560 | | |
| Movies & Entertainment—6.2% | |
Vivendi Universal SA
(France) | | Music, Games, Television, Film, &
Telecommunications | | | 1,430,500 | | | $ | 49,120,739 | | |
Viacom, Inc., Class B
(United States) (a) | | Worldwide Entertainment &
Publishing Company | | | 884,000 | | | | 34,299,200 | | |
Time Warner, Inc.
(United States) | | Filmed Entertainment & Television
Networks | | | 1,844,000 | | | | 30,960,760 | | |
News Corporation, Class B
(United States) | | International Multimedia &
Entertainment Company | | | 1,388,000 | | | | 24,373,280 | | |
| | | | 138,753,979 | | |
THE OAKMARK GLOBAL FUND
27
THE OAKMARK GLOBAL FUND
Schedule of Investments—March 31, 2006 (Unaudited) cont.
| Name | | Description | | Shares Held | | Market Value | |
| Common Stocks—99.3% (cont.) | |
| Publishing—4.1% | |
Trinity Mirror plc
(Great Britain) | | Newspaper Publishing | | | 4,596,800 | | | $ | 45,520,318 | | |
The Washington Post
Company, Class B
(United States) | | Newspaper & Magazine Publishing | | | 55,700 | | | | 43,264,975 | | |
| | | | 88,785,293 | | |
| Distillers & Vintners—3.1% | |
| Diageo plc (Great Britain) | | Beverages, Wines, & Spirits
Manufacturer | | | 4,398,500 | | | $ | 69,270,325 | | |
| Household Products—3.6% | |
| Henkel KGaA (Germany) (b) | | Consumer Chemical Products
Manufacturer | | | 473,000 | | | $ | 50,892,208 | | |
Uni-Charm Corporation
(Japan) | | Toiletry Products Manufacturer | | | 596,200 | | | | 29,276,887 | | |
| | | | 80,169,095 | | |
| Packaged Foods & Meats—4.3% | |
| Nestle SA (Switzerland) (b) | | Food & Beverage Manufacturer | | | 239,000 | | | $ | 70,941,096 | | |
Cadbury Schweppes plc
(Great Britain) | | Beverage & Confectionary
Manufacturer | | | 2,423,000 | | | | 24,078,214 | | |
| | | | 95,019,310 | | |
| Soft Drinks—1.0% | |
Lotte Chilsung Beverage
Co., Ltd. (Korea) | | Soft Drinks, Juices & Sports Drinks
Manufacturer | | | 20,880 | | | $ | 23,209,551 | | |
| Oil & Gas Exploration & Production—4.0% | |
XTO Energy, Inc.
(United States) | | Oil & Natural Gas Exploration &
Production | | | 1,038,000 | | | $ | 45,225,660 | | |
Burlington Resources, Inc.
(United States) | | Oil & Natural Gas Exploration &
Production | | | 483,000 | | | | 44,392,530 | | |
| | | | 89,618,190 | | |
| Asset Management & Custody Banks—2.0% | |
Julius Baer Holding AG-B
(Switzerland) | | Asset Management | | | 481,000 | | | $ | 43,495,858 | | |
| Diversified Banks—5.0% | |
| Bank of Ireland (Ireland) | | Commercial Bank | | | 3,651,000 | | | $ | 67,904,319 | | |
Australia and New Zealand
Banking Group Limited
(Australia) | | Commercial Bank | | | 2,260,000 | | | | 42,878,246 | | |
| | | | 110,782,565 | | |
THE OAKMARK GLOBAL FUND
28
THE OAKMARK GLOBAL FUND
Schedule of Investments—March 31, 2006 (Unaudited) cont.
| Name | | Description | | Shares Held | | Market Value | |
| Common Stocks—99.3% (cont.) | |
| Diversified Capital Markets—0.5% | |
Credit Suisse Group
(Switzerland) | | Investment Services & Insurance | | | 190,700 | | | $ | 10,699,268 | | |
| Investment Banking & Brokerage—1.3% | |
Daiwa Securities Group, Inc.
(Japan) | | Stock Broker | | | 2,062,000 | | | $ | 27,661,510 | | |
| Health Care Services—2.4% | |
Laboratory Corporation of
America Holdings
(United States) (a) | | Medical Laboratory &
Testing Services | | | 920,000 | | | $ | 53,801,600 | | |
| Health Care Supplies—0.3% | |
| Ansell Limited (Australia) | | Protective Rubber & Plastics Products | | | 840,966 | | | $ | 6,984,239 | | |
| Pharmaceuticals—9.7% | |
GlaxoSmithKline plc
(Great Britain) | | Pharmaceuticals | | | 2,825,000 | | | $ | 73,863,481 | | |
Takeda Pharmaceutical
Company Limited (Japan) | | Pharmaceuticals & Food
Supplements | | | 1,281,000 | | | | 73,025,870 | | |
| Novartis AG (Switzerland) | | Pharmaceuticals | | | 899,600 | | | | 50,023,777 | | |
Santen Pharmaceutical
Co., Ltd. (Japan) | | Pharmaceuticals | | | 781,000 | | | | 18,777,707 | | |
| | | | 215,690,835 | | |
| Aerospace & Defense—0.9% | |
Alliant Techsystems, Inc.
(United States) (a) | | Propulsion Systems & Munitions | | | 269,087 | | | $ | 20,765,444 | | |
| Diversified Commercial and Professional Services—2.1% | |
| Meitec Corporation (Japan) | | Software Engineering Services | | | 760,000 | | | $ | 24,987,893 | | |
| Equifax Inc. (United States) | | Credit Reporting & Collection | | | 619,900 | | | | 23,085,076 | | |
| | | | 48,072,969 | | |
| Environmental & Facilities Services—2.4% | |
Waste Management, Inc.
(United States) | | Waste Management Services | | | 1,500,000 | | | $ | 52,950,000 | | |
| Human Resource & Employment Services—2.2% | |
| Adecco SA (Switzerland) | | Temporary Employment Services | | | 617,000 | | | $ | 34,474,958 | | |
Michael Page International
plc (Great Britain) | | Recruitment Consultancy Services | | | 2,161,400 | | | | 12,804,551 | | |
| | | | 47,279,509 | | |
| Industrial Conglomerates—2.7% | |
Tyco International Ltd.
(Bermuda) | | Diversified Manufacturing &
Services | | | 2,205,000 | | | $ | 59,270,400 | | |
THE OAKMARK GLOBAL FUND
29
THE OAKMARK GLOBAL FUND
Schedule of Investments—March 31, 2006 (Unaudited) cont.
| Name | | Description | | Shares Held | | Market Value | |
| Common Stocks—99.3% (cont.) | |
| Computer Hardware—2.8% | |
| Dell Inc. (United States) (a) | | Technology Products & Services | | | 2,054,000 | | | $ | 61,127,040 | | |
| Data Processing & Outsourced Services—4.4% | |
eFunds Corporation
(United States) (a) | | Electronic Debit Payment Services | | | 2,237,100 | | | $ | 57,806,664 | | |
Ceridian Corporation
(United States) (a) | | Data Management Services | | | 1,538,000 | | | | 39,142,100 | | |
| | | | 96,948,764 | | |
| Office Electronics—2.4% | |
| Neopost SA (France) | | Mailroom Equipment Supplier | | | 494,750 | | | $ | 53,771,906 | | |
| Semiconductors—2.1% | |
Rohm Company Limited
(Japan) | | Integrated Circuits & Semiconductor
Devices Manufacturer | | | 442,000 | | | $ | 46,751,625 | | |
| Systems Software—2.4% | |
Oracle Corporation
(United States) (a) | | Software Services | | | 3,932,000 | | | $ | 53,829,080 | | |
| Diversified Chemicals—2.1% | |
Akzo Nobel N.V.
(Netherlands) | | Chemical Producer | | | 862,300 | | | $ | 45,752,046 | | |
| Specialty Chemicals—2.1% | |
| Givaudan (Switzerland) (b) | | Fragrance & Flavor
Compound Manufacturer | | | 32,800 | | | $ | 25,207,547 | | |
Lonza Group AG,
Registered Shares
(Switzerland) | | Industrial Organic Chemicals | | | 316,400 | | | | 21,683,034 | | |
| | | | 46,890,581 | | |
| Wireless Telecommunication Services—7.3% | |
SK Telecom Co., Ltd.
(Korea) | | Mobile Telecommunications | | | 302,130 | | | $ | 59,860,050 | | |
| NTT DoCoMo, Inc. (Japan) | | Mobile Telecommunications | | | 39,200 | | | | 57,948,260 | | |
Vodafone Group Plc
(Great Britain) | | Mobile Telecommunications | | | 19,669,000 | | | | 41,175,999 | | |
SK Telecom Co., Ltd.
(Korea) (c) | | Mobile Telecommunications | | | 55,000 | | | | 1,297,449 | | |
| | | | 160,281,758 | | |
| Total Common Stocks (Cost: $1,714,092,569) | | | | | | | | | 2,201,481,984 | | |
THE OAKMARK GLOBAL FUND
30
THE OAKMARK GLOBAL FUND
Schedule of Investments—March 31, 2006 (Unaudited) cont.
| Name | | Par Value | | Market Value | |
| Short Term Investments—0.8% | |
| Repurchase Agreements—0.8% | |
IBT Repurchase Agreement, 4.55% dated 3/31/2006
due 4/3/2006, repurchase price $17,006,446, collateralized
by Small Business Administration Bonds, with rates of
7.065% - 7.875%, with maturities from
10/25/2014 - 9/25/2030, and an aggregate market value
plus accrued interest of 17,850,000 | | $ | 17,000,000 | | | $ | 17,000,000 | | |
IBT Repurchase Agreement, 3.25% dated 3/31/2006
due 4/3/2006, repurchase price $1,170,923, collateralized
by a Small Business Administration Bond, with a rate of
8.125%, with a maturity date of 9/25/2019, and with a
market value plus accrued interest of $1,229,137 | | | 1,170,606 | | | | 1,170,606 | | |
| Total Repurchase Agreements (Cost: $18,170,606) | | | | | 18,170,606 | | |
| Total Short Term Investments (Cost: $18,170,606) | | | | | 18,170,606 | | |
| Total Investments (Cost $1,732,263,175)—100.1% | | | | $ | 2,219,652,590 | | |
| Foreign Currencies (Cost $2,053,174)—0.1% | | | | $ | 2,062,577 | | |
| Other Liabilities In Excess Of Other Assets—(0.2%) | | | | | (4,342,546 | ) | |
| Total Net Assets—100% | | | | $ | 2,217,372,621 | | |
(a) Non-income producing security.
(b) All or a portion of security out on loan.
(c) Represents an American Depository Receipt.
See accompanying notes to financial statements.
THE OAKMARK GLOBAL FUND
31
THE OAKMARK INTERNATIONAL AND
OAKMARK INTERNATIONAL SMALL CAP FUNDS
Fellow Shareholders,
The Oakmark International Funds ended the first quarter with satisfactory performance on an absolute basis. In addition, both Funds outpaced most international market indexes for the quarter. Please see the individual Fund letters for more specific performance information.
Traveler's Log: Japan
In February, as I left Japan after my third visit in fifteen months, I had the definite sense that the country had passed a turning point in relation to its national confidence and economic achievement, which should bode very well for future growth. Consider the fact that deflation finally appears defeated. This alone has tremendous macro-economic consequences as a decade plus of pent-up demand is being slowly unleashed. I expect the pace to pick up dramatically very soon. The signs are already there: cranes everywhere, a firming job market, rising interest rates, and increasing property values. In our view, when consumers are fully convinced, they will transfer out of low interest savings accounts and into higher earning investment products, and they will also purchase additional goods and services. Recall that in periods of deflation, not only is cash king, but spending is curtailed because it makes no sense to buy today what will cost les s tomorrow.
Add to this environment a political leader who supports a far more responsible monetary policy, and it's easy to become darn right enthusiastic. Even Japan's foreign policy is also becoming more assertive. The country is no longer afraid to engage in global problem-solving, as its actions in the North Korean situation demonstrate.
There is some bad news, however. On this trip we heard a lot of lip service about return on equity ("ROE"). I fear much of this is just posturing and telling foreign investors what we want to hear. I really don't believe that attitudes towards shareholders have changed all that much. For every company that "gets it," at least five don't. Toshiba and Nippon Koa have often been labeled as foreign favorites, and I have no idea why. Even the progressive government was cautious about letting in more foreign workers, claiming that it will lead to more crime and "social conflict." Unfortunately, these attitudes are as conducive to enhancing long-term economic growth as a negative population growth rate is.
As such, my enthusiasm for Japan's economic transformation is mitigated by some unique cultural issues that will impede the pace of advance and development. And, that is without even factoring in the inability of Tokyo cab drivers to deliver their fares to common destinations just a mile or so away!
Up, Up, and Away!
Commodities, metals, energy, real estate, global small caps, cyclical stocks, emerging markets... what do they all have in common? All of these asset classes have experienced strong price increases in the past three to five years. In the meantime some of the most secure, profitable, and best run businesses in the world have experienced poor price performance. To us, this spells value. We continue to be enthusiastic about the opportunities we are finding in the forgotten asset class of large, blue chip global companies. About the other asset classes, we must warn: what goes strongly up, also can fall down.

David G. Herro, CFA
Portfolio Manager
dherro@oakmark.com

THE OAKMARK INTERNATIONAL AND OAKMARK INTERNATIONAL SMALL CAP FUNDS
32
THE OAKMARK INTERNATIONAL FUND
Report from David G. Herro

THE VALUE OF A $10,000 INVESTMENT IN THE
OAKMARK INTERNATIONAL FUND FROM ITS INCEPTION (9/30/92) TO PRESENT (3/31/06) AS COMPARED TO THE MSCI WORLD EX U.S. INDEX16
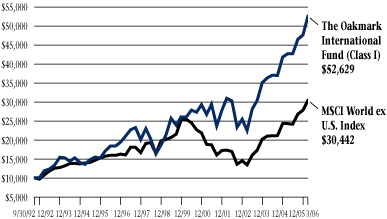
| | | Average Annual Total Returns | |
| | | (as of 3/31/06) | |
| | | Total Return
Last 3 Months* | | 1-year | | 5-year | | 10-year | | Since
Inception
(9/30/92) | |
Oakmark International
Fund (Class I) | | | 10.17 | % | | | 23.10 | % | | | 14.48 | % | | | 11.95 | % | | | 13.09 | % | |
| MSCI World ex U.S. | | | 9.33 | % | | | 25.06 | % | | | 10.08 | % | | | 6.86 | % | | | 8.60 | % | |
| MSCI EAFE17 | | | 9.40 | % | | | 24.41 | % | | | 9.63 | % | | | 6.49 | % | | | 8.33 | % | |
Lipper International
Fund Index18 | | | 9.88 | % | | | 27.15 | % | | | 10.38 | % | | | 8.29 | % | | | 9.67 | % | |
The graph and table do not reflect the deduction of taxes that a shareholder would pay on fund distributions or the redemption of fund shares.
The performance data quoted represents past performance. The above performance information for the Fund does not reflect the imposition of a 2% redemption fee on shares held for 90 days or less to deter market timers. If reflected, the fee would reduce the performance quoted. Past performance does not guarantee future results. The investment return and principal value will fluctuate so that an investor's shares, when redeemed, may be worth more or less than their original cost. Current performance may be lower or higher than the performance data quoted. Average annual total return measures annualized change, while total return measures aggregate change. To obtain most recent month-end performance data, visit www.oakmark.com.
* Not annualized
The Oakmark International Fund performed satisfactorily over the past 3 months with a return of 10%. This compares with the MSCI World ex U.S. Index's 9% and the Lipper International Fund Index's 10%. Most importantly, since inception, The Oakmark International Fund has returned annually 13% versus 9% for the MSCI World ex U.S. Index and 10% for the Lipper International Fund Index.
Impact Players
Munich-based BMW was the quarter's largest contributor to return. Though much of the auto industry is in trouble, BMW continues to grow its business with updated lines like the 3 Series and 7 Series, which are fueling very strong unit growth. Because the newly wealthy often showcase their economic success via "The Ultimate Driving Machine," BMW is also profiting from emerging market prosperity. In other sectors, our holdings in the European exchanges Deutsche Boerse and Euronext continued their ascent, becoming the Fund's second and fourth strongest positive contributors, due to increased talk of global consolidation in the sector. In fact, during the quarter, Euronext reached its sell target, and we no longer own the stock. Finally, as fears of competition in the Irish home lending market subsided, long-term holding Bank of Ireland contributed over 1/2 of 1% to the return of Oakmark International.
On the negative side, the possibility of adverse lending regulation in Taiwan took its toll on new position Chinatrust. We remain very confident of its strong investment fundamentals and have increased our position in the stock. Japanese securities Rohm and NTT DoCoMo also lagged. We believe fears of an overly competitive market and slowing mobile phone usage continue to plague NTT and negatively affect its share price. However, with a 50% plus market share, a new 3G network, and its newly formed alliances with "down stream" services, NTT is very well positioned for future growth, in our view.
New Additions
During the quarter, we added three new names: old Fund holding Michelin, global employment agency Adecco, and DaimlerChrysler. Though the global auto industry seems rough, we feel that DaimlerChrysler has ample restructuring opportunities, especially given the will demonstrated by new CEO Dieter Zetsche to dramatically enhance the company's profitability.
Despite the Fund's relatively healthy returns, we have been able to add promising new investments to our buy list and have plenty of prospects on our research list. As long-term international equity investors, we are still finding attractive opportunities and remain enthusiastic about investment prospects.
 | |
|
David G. Herro, CFA
Portfolio Manager
dherro@oakmark.com | |
|
THE OAKMARK INTERNATIONAL FUND
33
THE OAKMARK INTERNATIONAL FUND
International Diversification—March 31, 2006 (Unaudited)
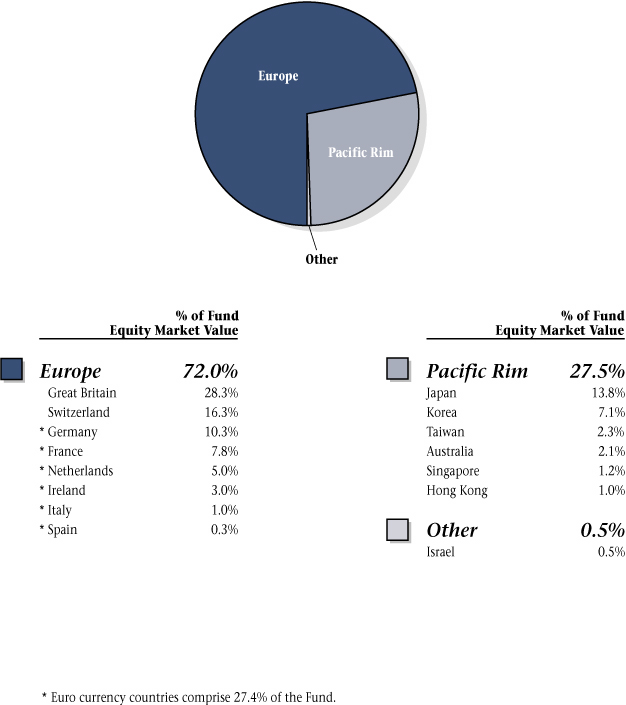
THE OAKMARK INTERNATIONAL FUND
34
THE OAKMARK INTERNATIONAL FUND
Schedule of Investments—March 31, 2006 (Unaudited)
| Name | | Description | | Shares Held | | Market Value | |
| Common Stocks—95.7% | |
| Advertising—2.1% | |
| Publicis Groupe (France) | | Advertising & Media Services | | | 3,706,400 | | | $ | 144,605,678 | | |
| Apparel Retail—1.0% | |
Giordano International
Limited (Hong Kong) (b) | | Pacific Rim Clothing Retailer &
Manufacturer | | | 121,265,300 | | | $ | 67,203,339 | | |
| Apparel, Accessories & Luxury Goods—2.0% | |
Swatch Group AG, Bearer
Shares (Switzerland) | | Watch Manufacturer | | | 824,700 | | | $ | 138,462,057 | | |
Swatch Group AG,
Registered Shares
(Switzerland) | | Watch Manufacturer | | | 24,700 | | | | 860,086 | | |
| | | | 139,322,143 | | |
| Automobile Manufacturers—7.6% | |
Bayerische Motoren
Werke (BMW) AG
(Germany) | | Luxury Automobile Manufacturer | | | 4,581,500 | | | $ | 252,300,880 | | |
DaimlerChrysler AG
(Germany) (c) | | Automobile Manufacturer | | | 2,648,000 | | | | 152,080,492 | | |
Honda Motor Co., Ltd.
(Japan) | | Automobile & Motorcycle
Manufacturer | | | 2,025,000 | | | | 125,417,357 | | |
| | | | 529,798,729 | | |
| Broadcasting & Cable TV—3.5% | |
British Sky Broadcasting
Group plc
(Great Britain) | | Television Production &
Broadcasting | | | 20,784,300 | | | $ | 194,986,248 | | |
Societe Television
Francaise 1 (France) | | Television Production &
Broadcasting | | | 1,261,000 | | | | 38,197,266 | | |
Gestevision Telecinco SA
(Spain) | | Television Production &
Broadcasting | | | 669,500 | | | | 16,718,825 | | |
| | | | 249,902,339 | | |
| Consumer Electronics—0.9% | |
Koninklijke (Royal)
Philips Electronics N.V.
(Netherlands) (c) | | Electronics Manufacturer | | | 1,787,000 | | | $ | 60,387,945 | | |
| Movies & Entertainment—1.6% | |
Vivendi Universal SA
(France) | | Music, Games, Television, Film, &
Telecommunications | | | 3,275,600 | | | $ | 112,478,080 | | |
THE OAKMARK INTERNATIONAL FUND
35
THE OAKMARK INTERNATIONAL FUND
Schedule of Investments—March 31, 2006 (Unaudited) cont.
| Name | | Description | | Shares Held | | Market Value | |
| Common Stocks—95.7% (cont.) | |
| Publishing—3.5% | |
Trinity Mirror plc
(Great Britain) (b) | | Newspaper Publishing | | | 15,132,538 | | | $ | 149,851,622 | | |
Johnston Press plc
(Great Britain) | | Newspaper Publishing | | | 11,400,300 | | | | 96,305,417 | | |
| | | | 246,157,039 | | |
| Specialty Stores—2.3% | |
Signet Group plc
(Great Britain) | | Jewelry Retailer | | | 86,443,900 | | | $ | 164,445,991 | | |
| Tires & Rubber—0.4% | |
Compagnie Generale des
Etablissements Michelin
(France) | | Tire Manufacturer | | | 459,000 | | | $ | 28,836,240 | | |
| Brewers—1.6% | |
Heineken Holding NV
(Netherlands) | | Brewer | | | 2,594,600 | | | $ | 89,408,167 | | |
Heineken NV
(Netherlands) | | Brewer | | | 497,500 | | | | 18,879,567 | | |
| | | | 108,287,734 | | |
| Distillers & Vintners—2.8% | |
| Diageo plc (Great Britain) | | Beverages, Wines, & Spirits
Manufacturer | | | 12,570,000 | | | $ | 197,960,210 | | |
| Household Products—3.6% | |
Henkel KGaA
(Germany) (c) | | Consumer Chemical Products
Manufacturer | | | 1,228,200 | | | $ | 132,147,589 | | |
Uni-Charm Corporation
(Japan) | | Toiletry Products Manufacturer | | | 2,169,400 | | | | 106,530,156 | | |
| KAO Corp. (Japan) | | Household & Chemical Products
Manufacturer | | | 575,000 | | | | 15,143,792 | | |
| | | | 253,821,537 | | |
| Hypermarkets & Super Centers—1.3% | |
| Metro AG (Germany) | | Internet Food Retailer | | | 1,719,000 | | | $ | 88,124,383 | | |
| Packaged Foods & Meats—4.2% | |
| Nestle SA (Switzerland) (c) | | Food & Beverage Manufacturer | | | 575,100 | | | $ | 170,703,866 | | |
Cadbury Schweppes plc
(Great Britain) | | Beverage & Confectionary
Manufacturer | | | 12,390,400 | | | | 123,127,816 | | |
| | | | 293,831,682 | | |
| Personal Products—0.5% | |
| L'Oreal SA (France) | | Health & Beauty Aid Manufacturer | | | 438,043 | | | $ | 38,585,874 | | |
THE OAKMARK INTERNATIONAL FUND
36
THE OAKMARK INTERNATIONAL FUND
Schedule of Investments—March 31, 2006 (Unaudited) cont.
| Name | | Description | | Shares Held | | Market Value | |
| Common Stocks—95.7% (cont.) | |
| Soft Drinks—1.4% | |
Lotte Chilsung Beverage
Co., Ltd. (Korea) (b) | | Soft Drinks, Juices & Sports
Drinks Manufacturer | | | 88,800 | | | $ | 98,707,287 | | |
| Tobacco—1.0% | |
KT&G Corporation
(Korea) | | Tobacco Products Manufacturer | | | 1,232,250 | | | $ | 69,501,132 | | |
| Integrated Oil & Gas—1.5% | |
| BP plc (Great Britain) | | Oil & Natural Gas Exploration &
Production | | | 6,294,100 | | | $ | 72,278,631 | | |
| Total SA (France) | | Oil & Natural Gas Exploration &
Production | | | 126,000 | | | | 33,235,802 | | |
| | | | 105,514,433 | | |
| Diversified Banks—13.5% | |
| Bank of Ireland (Ireland) | | Commercial Bank | | | 10,968,500 | | | $ | 204,001,239 | | |
Chinatrust Financial
Holding Co. (Taiwan) | | Commercial Bank | | | 214,534,606 | | | | 152,349,082 | | |
Australia and New Zealand
Banking Group Limited
(Australia) | | Commercial Bank | | | 7,348,800 | | | | 139,426,394 | | |
Lloyds TSB Group plc
(Great Britain) | | Commercial Bank | | | 12,952,600 | | | | 123,876,549 | | |
| Kookmin Bank (Korea) | | Commercial Bank | | | 1,114,000 | | | | 96,196,583 | | |
United Overseas Bank
Limited, Foreign Shares
(Singapore) | | Commercial Bank | | | 8,395,368 | | | | 81,041,887 | | |
| BNP Paribas SA (France) | | Commercial Bank | | | 775,000 | | | | 71,976,554 | | |
Banco Popolare di Verona e
Novara Scrl (Italy) | | Commercial Bank | | | 2,556,400 | | | | 67,648,571 | | |
| | | | 936,516,859 | | |
| Diversified Capital Markets—2.0% | |
Credit Suisse Group
(Switzerland) | | Investment Services & Insurance | | | 2,507,000 | | | $ | 140,655,814 | | |
| Investment Banking & Brokerage—1.6% | |
Daiwa Securities
Group, Inc. (Japan) | | Stock Broker | | | 8,256,000 | | | $ | 110,753,358 | | |
| Real Estate Management & Development—0.0% | |
United Overseas Land
Limited (Singapore) | | Real Estate Investor | | | 839,536 | | | $ | 1,501,351 | | |
| Reinsurance—0.3% | |
Hannover
Rueckversicherung AG
(Germany) | | Reinsurance | | | 626,400 | | | $ | 23,232,303 | | |
THE OAKMARK INTERNATIONAL FUND
37
THE OAKMARK INTERNATIONAL FUND
Schedule of Investments—March 31, 2006 (Unaudited) cont.
| Name | | Description | | Shares Held | | Market Value | |
| Common Stocks—95.7% (cont.) | |
| Specialized Finance—0.6% | |
Deutsche Boerse AG
(Germany) | | Electronic Trading Systems | | | 309,000 | | | $ | 44,553,582 | | |
| Pharmaceuticals—9.2% | |
GlaxoSmithKline plc
(Great Britain) | | Pharmaceuticals | | | 9,565,000 | | | $ | 250,089,981 | | |
| Novartis AG (Switzerland) | | Pharmaceuticals | | | 3,089,000 | | | | 171,769,060 | | |
Takeda Pharmaceutical
Company Limited
(Japan) | | Pharmaceuticals & Food
Supplements | | | 2,969,800 | | | | 169,299,163 | | |
| Sanofi-Aventis (France) | | Pharmaceuticals | | | 588,508 | | | | 55,975,659 | | |
| | | | 647,133,863 | | |
| Diversified Commercial and Professional Services—1.2% | |
Meitec Corporation
(Japan) (b) | | Software Engineering Services | | | 2,483,800 | | | $ | 81,664,381 | | |
| Environmental & Facilities Services—0.1% | |
Rentokil Initial plc
(Great Britain) | | Global Business Services | | | 3,400,000 | | | $ | 9,214,639 | | |
| Human Resource & Employment Services—3.8% | |
| Adecco SA (Switzerland) | | Temporary Employment Services | | | 2,865,000 | | | $ | 160,082,260 | | |
Michael Page
International plc
(Great Britain) (b) | | Recruitment Consultancy Services | | | 18,043,000 | | | | 106,890,214 | | |
| | | | 266,972,474 | | |
| Industrial Machinery—1.2% | |
Enodis plc
(Great Britain) (b) | | Food Processing Equipment | | | 33,585,320 | | | $ | 87,521,665 | | |
| Marine Ports & Services—1.8% | |
Associated British Ports
Holdings plc
(Great Britain) | | Port Operator | | | 9,818,000 | | | $ | 123,406,031 | | |
| Electronic Equipment Manufacturers—0.4% | |
| Orbotech, Ltd. (Israel) (a) | | Optical Inspection Systems | | | 1,237,700 | | | $ | 30,484,551 | | |
| Semiconductors—1.6% | |
Rohm Company Limited
(Japan) Integrated Circuits &
Semiconductor Devices | |
Manufacturer | | | 1,052,000 | | | $ | 111,273,098 | | |
THE OAKMARK INTERNATIONAL FUND
38
THE OAKMARK INTERNATIONAL FUND
Schedule of Investments—March 31, 2006 (Unaudited) cont.
| Name | | Description | | Shares Held/
Par Value | | Market Value | |
| Common Stocks—95.7% (cont.) | |
| Diversified Chemicals—2.4% | |
Akzo Nobel N.V.
(Netherlands) | | Chemical Producer | | | 3,182,200 | | | $ | 168,841,656 | | |
| Fertilizers & Agricultural Chemicals—1.2% | |
Syngenta AG
(Switzerland) (a) | | Crop Protection Products | | | 590,000 | | | $ | 82,902,286 | | |
| Specialty Chemicals—3.2% | |
Givaudan
(Switzerland) (c) | | Fragrance & Flavor Compound
Manufacturer | | | 155,700 | | | $ | 119,658,997 | | |
Lonza Group AG,
Registered Shares
(Switzerland) | | Industrial Organic Chemicals | | | 1,553,800 | | | | 106,482,612 | | |
| | | | 226,141,609 | | |
| Wireless Telecommunication Services—8.8% | |
NTT DoCoMo, Inc.
(Japan) | | Mobile Telecommunications | | | 139,600 | | | $ | 206,366,764 | | |
SK Telecom Co., Ltd.
(Korea) | | Mobile Telecommunications | | | 1,021,312 | | | | 202,349,279 | | |
Vodafone Group Plc
(Great Britain) | | Mobile Telecommunications | | | 90,624,500 | | | | 189,717,542 | | |
Vodafone Group Plc
(Great Britain) (d) | | Mobile Telecommunications | | | 606,000 | | | | 12,665,400 | | |
SK Telecom Co., Ltd.
(Korea) (d) | | Mobile Telecommunications | | | 405,100 | | | | 9,556,309 | | |
| | | | 620,655,294 | | |
| Total Common Stocks (Cost: $4,969,871,813) | | | | | | | | | 6,710,896,609 | | |
| Short Term Investments—3.4% | |
| U.S. Government Bills—0.9% | |
United States Treasury Bills, 4.34% - 4.585%
due 4/13/2006 - 4/27/2006 | | | | $ | 60,000,000 | | | $ | 59,858,078 | | |
| Total U.S. Government Bills (Cost: $59,858,078) | | | | | | | | | 59,858,078 | | |
THE OAKMARK INTERNATIONAL FUND
39
THE OAKMARK INTERNATIONAL FUND
Schedule of Investments—March 31, 2006 (Unaudited) cont.
| Name | | Par Value | | Market Value | |
| Short Term Investments—3.4% (cont.) | |
| Repurchase Agreements—2.5% | |
IBT Repurchase Agreement, 4.55% dated 3/31/2006 due
4/3/2006, repurchase price $181,068,629, collateralized
by Government National Mortgage Association Bonds
with rates of 3.750% - 5.00%, with maturities of
1/20/2034 - 10/20/2034, and with a market value plus
accrued interest of $70,943,487, and by Small Business
Administration Bonds, with rates of 6.625% - 7.25%,
with maturities from 7/25/2028 - 8/25/2030, and with
a market value plus accrued interest of $119,106,513 | | $ | 181,000,000 | | | $ | 181,000,000 | | |
IBT Repurchase Agreement, 3.25% dated 3/31/2006 due
4/3/2006, repurchase price $1,184,908, collateralized
by a Small Business Administration Bond, with a rate
of 7.875%, with a maturity date of 7/25/2026, and
with a market value plus accrued interest of $1,243,816 | | | 1,184,587 | | | | 1,184,587 | | |
| Total Repurchase Agreements (Cost: $182,184,587) | | | | | 182,184,587 | | |
| Total Short Term Investments (Cost: $242,042,665) | | | | | 242,042,665 | | |
| Total Investments (Cost $5,211,914,478)—99.1% | | | | $ | 6,952,939,274 | | |
| Foreign Currencies (Cost $9,166,914)—0.1% | | | | $ | 9,180,434 | | |
| Other Assets In Excess Of Other Liabilities—0.8% | | | | | 52,932,584 | | |
| Total Net Assets—100% | | | | $ | 7,015,052,292 | | |
(a) Non-income producing security.
(b) See footnote number five in the Notes to the Financial Statements regarding investments in affiliated issuers.
(c) All or a portion of security out on loan.
(d) Represents an American Depository Receipt.
THE OAKMARK INTERNATIONAL FUND
See accompanying notes to financial statements.
40
THE OAKMARK INTERNATIONAL
SMALL CAP FUND
Report from David G. Herro and Chad M. Clark, Portfolio Managers


THE VALUE OF A $10,000 INVESTMENT IN THE
OAKMARK INTERNATIONAL SMALL CAP FUND FROM ITS INCEPTION (11/1/95) TO PRESENT (3/31/06) AS COMPARED TO THE MSCI WORLD EX U.S. INDEX16
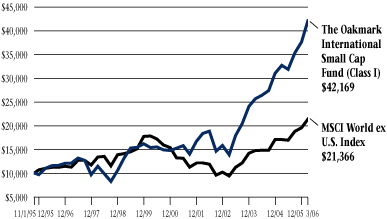
| | | Average Annual Total Returns | |
| | | (as of 3/31/06) | |
| | | Total Return
Last 3 Months* | | 1-year | | 5-year | | 10-year | | Since
Inception
(11/1/95) | |
Oakmark International
Small Cap Fund
(Class I) | | | 11.86 | % | | | 28.65 | % | | | 22.59 | % | | | 14.41 | % | | | 14.82 | % | |
| MSCI World ex U.S. | | | 9.33 | % | | | 25.06 | % | | | 10.08 | % | | | 6.86 | % | | | 7.56 | % | |
MSCI World ex U.S.
Small Cap19 | | | 10.76 | % | | | 33.00 | % | | | 20.73 | % | | | N/A | | | | N/A | | |
Lipper International
Small Cap Index20 | | | 13.35 | % | | | 35.10 | % | | | 19.04 | % | | | 12.62 | % | | | N/A | | |
The graph and table do not reflect the deduction of taxes that a shareholder would pay on fund distributions or the redemption of fund shares.
The performance data quoted represents past performance. The above performance information for the Fund does not reflect the imposition of a 2% redemption fee on shares held for 90 days or less to deter market timers. If reflected, the fee would reduce the performance quoted. Past performance does not guarantee future results. The investment return and principal value will fluctuate so that an investor's shares, when redeemed, may be worth more or less than their original cost. Current performance may be lower or higher than the performance data quoted. Average annual total return measures annualized change, while total return measures aggregate change. To obtain most recent month-end performance data, visit www.oakmark.com.
* Not annualized
The Oakmark International Small Cap Fund gained 12% for the quarter, outperforming most of our benchmark indices. More importantly, however, for the past twelve months and since inception your Fund is up 29% and 15% respectively, outpacing the MSCI World ex U.S. Index with returns of 25% and 8%.
While stock selection was once again strong, our relative underweight position in a flat Japanese market certainly helped performance compared to our benchmarks. We found extremely compelling ideas in Switzerland, Norway, and Britain, which together offset our relative underweighting in Japan. And, in these markets, our names advanced 19.9%, 42.2% and 9.8%, respectively on average.
Large Contributors
Tandberg, a Norwegian provider of video-conferencing equipment, was the largest contributor to performance. One of our team members, Eric Bokota, met with Tandberg in September in Norway, initially passing on the stock due to valuation. (The share price was at Norwegian Kroner 83.75 at the time.) But, he was impressed with the group's market position, the return and free cash flow characteristics of the business, and the underlying growth profile of the industry. Then in early fall, Tandberg missed the Street's earnings expectations, and the stock fell 24% in a matter of days. Eric revisited the idea and began to do more in-depth research, talking to both vendors and customers. What he found was that customers' buying patterns had changed, leading to further inter-quarter volatility, but the underlying attractiveness of Tandberg's product suite remained solid. After another earnings miss in December, the resignation of the CEO, and an additi onal 36% drop in the share price (then at Norwegian Kroner 41.00), we began accumulating shares. Since our purchase, a new CEO has come on board, the demand picture has stabilized, and insiders have made large stock purchases. Combined, these have driven a rebound in Tandberg's share price, though we believe nothing has materially changed with the fundamental attractiveness of this company over the last six months. Tandberg advanced 49% in the quarter.
Julius Baer, the Swiss private banking entity we've discussed in several previous letters, has continued to exceed expectations. Asset growth was strong
THE OAKMARK INTERNATIONAL SMALL CAP FUND
41
in the fourth quarter report with respect to both Baer's historical relationships and those coming from the newly acquired entities. Customer attrition was low, the integration is proceeding faster than we expected, and we were impressed with the group's new Head of Private Banking, Alex Widmer. We believe excess capital will continue to be deployed in the most value accretive manner, primarily in private banking acquisitions. If these aren't attractive, we believe that capital will be returned to shareholders. Given the strength in the share price compared against the upside remaining to intrinsic value, we've had to trim back our weighting as Baer advanced 28% in the quarter.
Schindler, a Swiss-based elevator manufacturer, was the third largest contributor to performance in the quarter. The group's 2005 financial release was quite strong, with sales advancing 8% and operating profit advancing 5% despite several one-off costs including labor settlements, research and development related to new product releases and unusually large marketing expenses. More importantly, however, the group's order backlog grew by 23% locally. Asian business is robust, and the new European Safety Norms for Existing Lifts regulation is beginning to drive demand in the region. In our view, the strong operating performance and the positive outlook for 2006 were the two key reasons behind the 37% advance in the shares in the quarter.
We are happy to report that there were no large negative contributors in the quarter. Three of our bottom five performers were Japanese, including Santen Pharmaceutical, Mabuchi Motor, and Square Enix. While none fell materially, together their performance was a bit below the index in the country. Our Korean positions, including Daekyo and Kook Soon Dang, were also negative contributors.
There is no hedge impact to report from the quarter because we closed all of our hedge contracts at the end of 2005. We believe the U.S. Dollar continues to trade in a reasonable value range against other major currencies when measured by purchasing power parity.
Portfolio Composition
We sold our entire positions in Wincor Nixdorf, Athens Stock Exchange, and Dogan Sirketler in the period as each reached its respective sell target. Also, we've added positions in Alsea, a Mexican operator of the Dominos, Burger King, and Starbucks franchises, and in South China Morning Post (SCMP Group Limited), the publisher of Hong Kong's largest English daily newspaper. As sales exceeded purchases, our overall cash position rose to 7.3% of net assets at quarter end.
Geographically, our portfolio weightings remain very similar to last quarter. Europe and the UK represent 75% of investments, and the majority of the balance excluding cash is in the Pacific Rim.
Small capitalization international stocks have had a tremendous run over the past four years. While the quantity of new ideas has slowed, we've held names that have demonstrated a consistent ability to grow value per share over time. We thank you for your continued confidence.
 | |  | |
|
David G. Herro, CFA
Portfolio Manager
dherro@oakmark.com | | Chad M. Clark, CFA
Portfolio Manager
cclark@oakmark.com | |
|
THE OAKMARK INTERNATIONAL SMALL CAP FUND
42
THE OAKMARK INTERNATIONAL SMALL CAP FUND
International Diversification—March 31, 2006 (Unaudited)
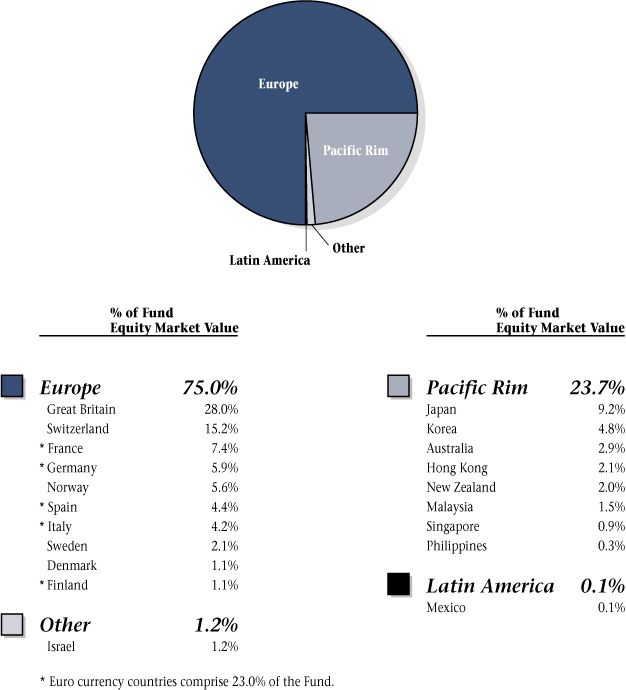
THE OAKMARK INTERNATIONAL SMALL CAP FUND
43
THE OAKMARK INTERNATIONAL SMALL CAP FUND
Schedule of Investments—March 31, 2006 (Unaudited)
| Name | | Description | | Shares Held | | Market Value | |
| Common Stocks—92.7% | |
| Advertising—1.2% | |
Asatsu-DK, Inc.
(Japan) | | Advertising Services Provider | | | 400,200 | | | $ | 13,974,105 | | |
| Apparel Retail—7.3% | |
Matalan plc
(Great Britain) | | Clothing Retailer | | | 14,095,000 | | | $ | 46,831,853 | | |
JJB Sports plc
(Great Britain) (b) | | Sportswear & Sports Equipment
Retailer | | | 12,705,000 | | | | 40,668,391 | | |
| | | | 87,500,244 | | |
| Apparel, Accessories & Luxury Goods—0.8% | |
| Bulgari S.p.A. (Italy) | | Jewelry Manufacturer & Retailer | | | 784,900 | | | $ | 9,443,669 | | |
| Auto Parts & Equipment—2.4% | |
Kongsberg Automotive
ASA (Norway) (b) | | Auto Parts & Equipment
Manufacturer | | | 3,094,400 | | | $ | 28,796,973 | | |
| Broadcasting & Cable TV—3.9% | |
| Sogecable SA (Spain) (a) | | Cable Television Services | | | 529,500 | | | $ | 21,165,351 | | |
Media Prima Berhad
(Malaysia) (a)(b) | | Film Producer & Sports Promoter | | | 33,747,000 | | | | 16,492,791 | | |
M6 Metropole Television
(France) | | Television Entertainment Channel
Owner & Operator | | | 297,700 | | | | 8,840,958 | | |
| | | | 46,499,100 | | |
| Home Improvement Retail—3.5% | |
Carpetright plc
(Great Britain) | | Carpet Retailer | | | 2,098,600 | | | $ | 42,474,709 | | |
| Photographic Products—1.7% | |
Vitec Group plc
(Great Britain) (b) | | Photo Equipment & Supplies | | | 2,383,907 | | | $ | 20,593,915 | | |
| Publishing—4.0% | |
| Daekyo Co., Ltd. (Korea) | | Educational Information Service
Provider | | | 371,900 | | | $ | 26,793,948 | | |
| Tamedia AG (Switzerland) | | TV Broadcasting & Publishing | | | 167,341 | | | | 16,685,327 | | |
SCMP Group, Ltd.
(Hong Kong) | | Newspaper Publisher & Distributor | | | 11,874,000 | | | | 4,246,644 | | |
| | | | 47,725,919 | | |
| Restaurants—0.1% | |
| Alsea SA (Mexico) | | Pizza Restaurants | | | 311,800 | | | $ | 1,077,618 | | |
THE OAKMARK INTERNATIONAL SMALL CAP FUND
44
THE OAKMARK INTERNATIONAL SMALL CAP FUND
Schedule of Investments—March 31, 2006 (Unaudited) cont.
| Name | | Description | | Shares Held | | Market Value | |
| Common Stocks—92.7% (cont.) | |
| Textiles—1.9% | |
| Chargeurs SA (France) (b) | | Wool, Textile Production & Trading | | | 790,182 | | | $ | 22,307,980 | | |
| Brewers—0.6% | |
Kook Soon Dang Brewery
Co., Ltd. (Korea) | | Wine & Spirits Manufacturer | | | 446,500 | | | $ | 6,893,269 | | |
| Distillers & Vintners—1.1% | |
Baron De Ley, S.A.
(Spain) (a) | | Beverages, Wines, & Spirits
Manufacturer | | | 232,057 | | | $ | 13,262,877 | | |
| Packaged Foods & Meats—2.3% | |
Lotte Confectionery
Co., Ltd. (Korea) | | Candy & Snacks Manufacturer | | | 15,334 | | | $ | 19,301,649 | | |
Robert Wiseman Dairies plc
(Great Britain) | | Milk Processor & Distributor | | | 959,000 | | | | 5,198,141 | | |
Alaska Milk Corporation
(Philippines) (b) | | Milk Producer | | | 56,360,000 | | | | 3,860,274 | | |
| | | | 28,360,064 | | |
| Asset Management & Custody Banks—5.7% | |
| MLP AG (Germany) | | Asset Management | | | 1,526,500 | | | $ | 37,306,104 | | |
Julius Baer Holding AG-B
(Switzerland) | | Asset Management | | | 345,400 | | | | 31,233,824 | | |
| | | | 68,539,928 | | |
| Insurance Brokers—2.9% | |
Benfield Group Ltd.
Common Stock
(Great Britain) | | Reinsurance Service Provider | | | 5,352,000 | | | $ | 35,053,572 | | |
| Multi-Sector Holdings—2.9% | |
Pargesa Holding AG,
Class B (Switzerland) | | Diversified Operations | | | 357,800 | | | $ | 34,495,674 | | |
| Other Diversified Financial Services—0.4% | |
Ichiyoshi Securities
Co., Ltd. (Japan) | | Stock Broker | | | 248,000 | | | $ | 4,782,804 | | |
| Real Estate Management & Development—2.0% | |
Countrywide PLC
(Great Britain) | | Real Estate Service Provider | | | 2,693,000 | | | $ | 23,427,834 | | |
| Health Care Supplies—2.0% | |
| Ansell Limited (Australia) | | Protective Rubber & Plastics
Products | | | 1,507,384 | | | $ | 12,518,854 | | |
Coloplast A/S, Class B
(Denmark) | | Healthcare Products & Services
Provider | | | 159,600 | | | | 12,011,789 | | |
| | | | 24,530,643 | | |
THE OAKMARK INTERNATIONAL SMALL CAP FUND
45
THE OAKMARK INTERNATIONAL SMALL CAP FUND
Schedule of Investments—March 31, 2006 (Unaudited) cont.
| Name | | Description | | Shares Held | | Market Value | |
| Common Stocks—92.7% (cont.) | |
| Pharmaceuticals—1.8% | |
Santen Pharmaceutical
Co., Ltd. (Japan) | | Pharmaceuticals | | | 897,000 | | | $ | 21,566,713 | | |
| Air Freight & Logistics—1.9% | |
Mainfreight Limited
(New Zealand) (b) | | Logistics Services | | | 8,049,571 | | | $ | 23,240,432 | | |
| Commercial Printing—1.0% | |
De La Rue Plc
(Great Britain) | | Commercial Printing | | | 1,255,190 | | | $ | 12,167,980 | | |
| Diversified Commercial and Professional Services—2.7% | |
| Intrum Justitia AB (Sweden) | | Diversified Financial Services | | | 1,978,943 | | | $ | 18,038,432 | | |
Prosegur, Compania de
Seguridad SA (Spain) | | Security & Transportation Services | | | 552,800 | | | | 13,965,333 | | |
| | | | 32,003,765 | | |
| Electrical Components & Equipment—1.4% | |
Pfeiffer Vacuum
Technology AG
(Germany) | | Vacuum Pump Manufacturer | | | 254,000 | | | $ | 16,988,302 | | |
| Industrial Conglomerates—1.7% | |
| Rheinmetall AG (Germany) | | Automotive Pump Manufacturer | | | 144,300 | | | $ | 11,189,830 | | |
Haw Par Corporation
Limited (Singapore) | | Diversified Operations | | | 2,663,687 | | | | 9,807,207 | | |
| | | | 20,997,037 | | |
| Industrial Machinery—12.1% | |
Interpump Group S.p.A.
(Italy) (b) | | Pump & Piston Manufacturer | | | 4,709,000 | | | $ | 37,001,204 | | |
Schindler Holding AG
(Switzerland) | | Escalator & Elevator Manufacturer | | | 642,000 | | | | 34,468,477 | | |
| Halma plc (Great Britain) | | Electronic Instrument Producer | | | 9,825,000 | | | | 32,046,996 | | |
| Saurer AG (Switzerland) (a) | | Textile Equipment Manufacturer | | | 298,853 | | | | 23,838,558 | | |
| LISI (France) | | Industrial Fastener Manufacturer | | | 170,600 | | | | 11,296,564 | | |
| Alfa Laval AB (Sweden) | | Filtration & Separation Equipment | | | 206,400 | | | | 5,551,379 | | |
| | | | 144,203,178 | | |
| Office Services & Supplies—1.4% | |
Domino Printing Sciences
plc (Great Britain) | | Printing Equipment | | | 3,620,500 | | | $ | 16,951,266 | | |
| Communication Equipment—2.8% | |
| Tandberg ASA (Norway) | | Develops & Markets
Communication Equipments | | | 3,663,000 | | | $ | 33,110,507 | | |
THE OAKMARK INTERNATIONAL SMALL CAP FUND
46
THE OAKMARK INTERNATIONAL SMALL CAP FUND
Schedule of Investments—March 31, 2006 (Unaudited) cont.
| Name | | Description | | Shares Held | | Market Value | |
| Common Stocks—92.7% (cont.) | |
| Computer Storage & Peripherals—1.3% | |
| Lectra (France) (b) | | Manufacturing Process Systems | | | 2,186,404 | | | $ | 15,524,057 | | |
| Data Processing & Outsourced Services—1.7% | |
Baycorp Advantage
Limited (Australia) | | Credit Reference Services | | | 8,662,000 | | | $ | 20,155,066 | | |
| Electronic Equipment Manufacturers—4.4% | |
Mabuchi Motor Co., Ltd.
(Japan) | | Digital Camera Motors
Manufacturer | | | 546,000 | | | $ | 28,110,615 | | |
| Orbotech, Ltd. (Israel) (a) | | Optical Inspection Systems | | | 536,500 | | | | 13,213,995 | | |
Vaisala Oyj, Class A
(Finland) | | Atmospheric Observation
Equipment | | | 380,400 | | | | 12,444,615 | | |
| | | | 53,769,225 | | |
| Home Entertainment Software—1.6% | |
Square Enix Co., Ltd.
(Japan) | | Entertainment Software | | | 757,900 | | | $ | 19,574,496 | | |
| IT Consulting & Other Services—1.9% | |
Morse plc
(Great Britain) (b) | | Business & Technology Solutions | | | 12,474,000 | | | $ | 22,429,568 | | |
| Office Electronics—2.0% | |
| Neopost SA (France) | | Mailroom Equipment Supplier | | | 220,700 | | | $ | 23,986,781 | | |
| Industrial Gases—1.2% | |
Taiyo Ink Mfg. Co., Ltd.
(Japan) | | Manufacturer of Resist Inks | | | 252,700 | | | $ | 14,470,057 | | |
| Specialty Chemicals—3.6% | |
Gurit-Heberlein AG
(Switzerland) (b) | | Chemical Producer | | | 26,700 | | | $ | 28,670,041 | | |
Croda International plc
(Great Britain) | | Chemical Producer | | | 1,625,900 | | | | 13,953,900 | | |
| | | | 42,623,941 | | |
| Alternative Carriers—1.5% | |
Asia Satellite
Telecommunications
Holdings Limited
(Hong Kong) | | Satellite Operator | | | 9,887,500 | | | $ | 17,967,657 | | |
| Total Common Stocks (Cost: $793,896,044) | | | | | | | | | 1,111,470,925 | | |
THE OAKMARK INTERNATIONAL SMALL CAP FUND
47
THE OAKMARK INTERNATIONAL SMALL CAP FUND
Schedule of Investments—March 31, 2006 (Unaudited) cont.
| Name | | Par Value | | Market Value | |
| Short Term Investments—7.4% | |
| U.S. Government Bills—3.3% | |
United States Treasury Bills, 4.34% - 4.585%
due 4/13/2006 - 4/27/2006 | | $ | 40,000,000 | | | $ | 39,897,298 | | |
| Total U.S. Government Bills (Cost: $39,897,298) | | | | | | | 39,897,298 | | |
| Repurchase Agreements—4.1% | |
IBT Repurchase Agreement, 4.55% dated 3/31/2006
due 4/3/2006, repurchase price $47,017,821,
collateralized by Small Business Administration Bonds,
with rates of 7.050% - 7.090%, with maturities from
5/25/2029 - 11/25/2029, and an aggregate market
value plus accrued interest of $49,350,000 | | $ | 47,000,000 | | | $ | 47,000,000 | | |
IBT Repurchase Agreement, 3.25% dated 3/31/2006
due 4/3/2006, repurchase price $1,729,543,
collateralized by a Small Business Adminstration Bond,
with a rate of 7.375%, with a maturity date of
11/25/2025, and with a market value plus accrued
interest of $1,815,529 | | | 1,729,075 | | | | 1,729,075 | | |
| Total Repurchase Agreements (Cost: $48,729,075) | | | | | | | 48,729,075 | | |
| Total Short Term Investments (Cost: $88,626,373) | | | | | | | 88,626,373 | | |
| Total Investments (Cost $882,522,417)—100.1% | | | | | | $ | 1,200,097,298 | | |
| Foreign Currencies (Cost $604,522)—0.0% | | | | | | $ | 605,189 | | |
| Other Liabilities In Excess Of Other Assets—(0.1%) | | | | | | | (1,276,188 | ) | |
| Total Net Assets—100% | | | | | | $ | 1,199,426,299 | | |
(a) Non-income producing security.
(b) See footnote number five in the Notes to the Financial Statements regarding investments in affiliated issuers.
THE OAKMARK INTERNATIONAL SMALL CAP FUND
See accompanying notes to financial statements.
48

(This page has been intentionally left blank.)
THE OAKMARK FUNDS
49
THE OAKMARK FUNDS
Statements of Assets and Liabilities—March 31, 2006 (Unaudited)
| | | | | The Oakmark
Fund | | The Oakmark
Select
Fund | | The Oakmark
Equity and
Income Fund | | The Oakmark
Global
Fund | | The Oakmark
International
Fund | | The Oakmark
International
Small Cap Fund | |
| Assets | |
| Investments in unaffiliated securities, at value | | (a) | | $ | 5,630,192,792 | | | $ | 5,529,535,265 | | | $ | 10,166,970,094 | | | $ | 2,219,652,590 | | | $ | 6,361,100,766 | | | $ | 940,511,672 | | |
| Investments in affiliated securities, at value | | (b) | | | 0 | | | | 659,377,472 | | | | 186,329,292 | | | | 0 | | | | 591,838,508 | | | | 259,585,626 | | |
| Cash | | | | | 36 | | | | 426 | | | | 191 | | | | 0 | | | | 231 | | | | 0 | | |
| Foreign currency, at value | | (c) | | | 0 | | | | 0 | | | | 0 | | | | 2,062,577 | | | | 9,180,434 | | | | 605,189 | | |
| Receivable for: | |
| Securities sold | | | | | 0 | | | | 0 | | | | 33,653,419 | | | | 0 | | | | 22,027,294 | | | | 2,192,321 | | |
| Fund shares sold | | | | | 4,930,478 | | | | 17,437,896 | | | | 65,523,869 | | | | 2,802,614 | | | | 16,501,140 | | | | 1,663,680 | | |
| Dividends and interest | | | | | 6,624,703 | | | | 4,646,789 | | | | 43,033,807 | | | | 4,398,455 | | | | 30,554,347 | | | | 2,827,278 | | |
| Forward foreign currency contracts | | | | | 0 | | | | 0 | | | | 0 | | | | 38,034 | | | | 0 | | | | 862,950 | | |
| Tax reclaim | | | | | 0 | | | | 0 | | | | 1,350,000 | | | | 1,299,363 | | | | 4,615,772 | | | | 813,484 | | |
| Total receivables | | | | | 11,555,181 | | | | 22,084,685 | | | | 143,561,095 | | | | 8,538,466 | | | | 73,698,553 | | | | 8,359,713 | | |
| Other assets | | | | | 94,893 | | | | 96,721 | | | | 399,275 | | | | 90,016 | | | | 238,550 | | | | 53,828 | | |
| Total assets | | | | $ | 5,641,842,902 | | | $ | 6,211,094,569 | | | $ | 10,497,259,947 | | | $ | 2,230,343,649 | | | $ | 7,036,057,042 | | | $ | 1,209,116,028 | | |
| Liabilities and Net Assets | |
| Payable for: | |
| Securities purchased | | | | $ | 0 | | | $ | 0 | | | $ | 23,509,496 | | | $ | 10,998,847 | | | $ | 15,289,154 | | | $ | 8,859,106 | | |
| Fund shares redeemed | | | | | 15,101,125 | | | | 6,222,339 | | | | 65,065,258 | | | | 930,566 | | | | 2,995,279 | | | | 118,329 | | |
| Due to Adviser | | | | | 133,809 | | | | 141,495 | | | | 197,405 | | | | 57,530 | | | | 163,298 | | | | 36,179 | | |
| Due to transfer agent | | | | | 306,446 | | | | 173,909 | | | | 195,136 | | | | 60,317 | | | | 118,603 | | | | 22,354 | | |
| Trustee fee | | | | | 23,107 | | | | 23,199 | | | | 31,014 | | | | 14,685 | | | | 23,030 | | | | 12,714 | | |
| Deferred trustee compensation | | | | | 950,227 | | | | 817,135 | | | | 677,614 | | | | 360,494 | | | | 598,215 | | | | 353,229 | | |
| Other | | | | | 1,727,562 | | | | 1,209,136 | | | | 2,536,736 | | | | 548,589 | | | | 1,817,171 | | | | 287,818 | | |
| Total liabilities | | | | | 18,242,276 | | | | 8,587,213 | | | | 92,212,659 | | | | 12,971,028 | | | | 21,004,750 | | | | 9,689,729 | | |
| Net assets applicable to fund shares outstanding | | | | $ | 5,623,600,626 | | | $ | 6,202,507,356 | | | $ | 10,405,047,288 | | | $ | 2,217,372,621 | | | $ | 7,015,052,292 | | | $ | 1,199,426,299 | | |
| Analysis of Net Assets | |
| Paid in capital | | | | $ | 4,110,186,362 | | | $ | 4,043,600,867 | | | $ | 8,451,951,885 | | | $ | 1,584,522,479 | | | $ | 4,767,529,857 | | | $ | 806,567,312 | | |
Accumulated undistributed net realized gain (loss) of investments,
forward contracts, options, short sales and foreign currency transactions | | | | | 146,594,704 | | | | 534,342,686 | | | | 224,924,388 | | | | 145,233,316 | | | | 492,761,504 | | | | 79,023,650 | | |
| Net unrealized appreciation (depreciation) of investments and foreign currencies | | | | | 1,340,755,208 | | | | 1,611,919,259 | | | | 1,675,841,611 | | | | 487,436,853 | | | | 1,740,986,178 | | | | 318,452,841 | | |
| Net unrealized appreciation (depreciation)—other | | | | | 0 | | | | 0 | | | | 130,832 | | | | (80,421 | ) | | | 144,849 | | | | (33,569 | ) | |
| Accumulated undistributed net investment income (loss) | | | | | 26,064,352 | | | | 12,644,544 | | | | 52,198,572 | | | | 260,394 | | | | 13,629,904 | | | | (4,583,935 | ) | |
| Net assets applicable to Fund shares outstanding | | | | $ | 5,623,600,626 | | | $ | 6,202,507,356 | | | $ | 10,405,047,288 | | | $ | 2,217,372,621 | | | $ | 7,015,052,292 | | | $ | 1,199,426,299 | | |
| Price of Shares | |
| Net asset value per share: Class I | | | | $ | 42.44 | | | $ | 33.73 | | | $ | 25.48 | | | $ | 25.08 | | | $ | 24.81 | | | $ | 22.35 | | |
| Class I—Net assets | | | | $ | 5,583,372,431 | | | $ | 6,129,000,884 | | | $ | 9,801,146,632 | | | $ | 2,146,240,984 | | | $ | 6,573,551,360 | | | $ | 1,198,684,252 | | |
| Class I—Shares outstanding (Unlimited shares authorized) | | | | | 131,549,561 | | | | 181,721,517 | | | | 384,691,132 | | | | 85,584,108 | | | | 264,990,109 | | | | 53,628,949 | | |
| Net asset value per share: Class II | | | | $ | 42.25 | | | $ | 33.55 | | | $ | 25.39 | | | $ | 24.77 | | | $ | 24.65 | | | $ | 22.33 | | |
| Class II—Net assets | | | | $ | 40,228,195 | | | $ | 73,506,472 | | | $ | 603,900,656 | | | $ | 71,131,637 | | | $ | 441,500,932 | | | $ | 742,047 | | |
| Class II—Shares outstanding (Unlimited shares authorized) | | | | | 952,246 | | | | 2,190,881 | | | | 23,782,381 | | | | 2,871,764 | | | | 17,910,932 | | | | 33,233 | | |
| (a) Identified cost of investments in unaffiliated securities | | | | $ | 4,289,437,584 | | | $ | 4,346,213,295 | | | $ | 8,591,551,786 | | | $ | 1,732,263,175 | | | $ | 4,815,895,965 | | | $ | 681,398,525 | | |
| (b) Identified cost of investments in affiliated securities | | | | | 0 | | | | 230,780,183 | | | | 85,905,989 | | | | 0 | | | | 396,018,513 | | | | 201,123,892 | | |
| (c) Identified cost of foreign currency | | | | | 0 | | | | 0 | | | | 0 | | | | 2,053,174 | | | | 9,166,914 | | | | 604,522 | | |
THE OAKMARK FUNDS
50
See accompanying notes to financial statements.
THE OAKMARK FUNDS
51
THE OAKMARK FUNDS
Statements of Operations—March 31, 2006 (Unaudited)
| | | The Oakmark
Fund | | The Oakmark
Select
Fund | | The Oakmark
Equity and
Income Fund | | The Oakmark
Global
Fund | | The Oakmark
International
Fund | | The Oakmark
International
Small Cap Fund | |
| Investment Income: | |
| Dividends from unaffiliated securities | | $ | 52,945,324 | | | $ | 56,778,616 | | | $ | 38,712,576 | | | $ | 14,387,827 | | | $ | 52,694,530 | | | $ | 10,163,144 | | |
| Dividends from affiliated securities | | | 0 | | | | 4,129,900 | | | | 145,000 | | | | 0 | | | | 1,979,831 | | | | 5,777,025 | | |
| Interest Income | | | 6,254,843 | | | | 9,275,859 | | | | 81,870,320 | | | | 1,061,842 | | | | 5,295,499 | | | | 1,078,763 | | |
| Securities lending income | | | 0 | | | | 0 | | | | 1,446,203 | | | | 36,609 | | | | 208,494 | | | | 231,022 | | |
| Other income | | | 314,862 | | | | 53,548 | | | | 150,342 | | | | 5,148 | | | | 15,451 | | | | 0 | | |
| Foreign taxes withheld | | | 0 | | | | 0 | | | | (1,141,875 | ) | | | (785,803 | ) | | | (3,605,713 | ) | | | (1,008,559 | ) | |
| Total investment income | | | 59,515,029 | | | | 70,237,923 | | | | 121,182,566 | | | | 14,705,623 | | | | 56,588,092 | | | | 16,241,395 | | |
| Expenses: | |
| Investment advisory fee | | | 26,589,658 | | | | 25,941,445 | | | | 35,961,081 | | | | 10,020,761 | | | | 28,354,838 | | | | 6,181,008 | | |
| Transfer and dividend disbursing agent fees | | | 1,153,443 | | | | 698,254 | | | | 746,889 | | | | 259,919 | | | | 480,242 | | | | 86,296 | | |
| Other shareholder servicing fees | | | 2,974,524 | | | | 2,491,989 | | | | 4,962,889 | | | | 715,046 | | | | 2,345,625 | | | | 315,185 | | |
| Service Fee—Class II | | | 53,011 | | | | 103,507 | | | | 754,530 | | | | 80,807 | | | | 480,898 | | | | 298 | | |
| Reports to shareholders | | | 783,523 | | | | 544,849 | | | | 846,747 | | | | 195,948 | | | | 464,794 | | | | 78,783 | | |
| Custody and accounting fees | | | 358,248 | | | | 325,656 | | | | 662,717 | | | | 546,972 | | | | 2,286,980 | | | | 443,250 | | |
| Registration and blue sky expenses | | | 0 | | | | 73,547 | | | | 124,080 | | | | 54,171 | | | | 172,475 | | | | 33,108 | | |
| Trustee fees | | | 54,086 | | | | 55,264 | | | | 75,486 | | | | 35,709 | | | | 56,609 | | | | 30,860 | | |
| Deferred trustee compensation | | | 83,788 | | | | 85,583 | | | | 115,495 | | | | 55,156 | | | | 87,842 | | | | 47,802 | | |
| Legal fees | | | 130,364 | | | | 131,702 | | | | 177,868 | | | | 84,221 | | | | 134,006 | | | | 82,398 | | |
| Audit fees | | | 27,760 | | | | 26,793 | | | | 36,423 | | | | 17,555 | | | | 28,056 | | | | 15,272 | | |
| Other | | | 163,140 | | | | 183,462 | | | | 267,097 | | | | 99,056 | | | | 187,297 | | | | 78,653 | | |
| Total expenses | | | 32,371,545 | | | | 30,662,051 | | | | 44,731,302 | | | | 12,165,321 | | | | 35,079,662 | | | | 7,392,913 | | |
| Net expenses | | | 32,371,545 | | | | 30,662,051 | | | | 44,731,302 | | | | 12,165,321 | | | | 35,079,662 | | | | 7,392,913 | | |
| Net Investment Income: | | | 27,143,484 | | | | 39,575,872 | | | | 76,451,264 | | | | 2,540,302 | | | | 21,508,430 | | | | 8,848,482 | | |
Net realized and unrealized gain (loss) on
investments and foreign currency transactions: | |
| Net realized gain on unaffiliated securities | | | 192,095,058 | | | | 543,516,664 | | | | 237,800,388 | | | | 174,480,866 | | | | 525,478,926 | | | | 90,670,929 | | |
| Net realized gain on affiliated securities | | | 0 | | | | 0 | | | | 0 | | | | 0 | | | | 16,861,904 | | | | 1,938,735 | | |
| Net realized gain on short sales | | | 40,635 | | | | 60,953 | | | | 0 | | | | 0 | | | | 0 | | | | 0 | | |
| Net realized gain (loss) on foreign currency transactions | | | (4,074 | ) | | | 0 | | | | 262,833 | | | | 6,680,879 | | | | 85,546,229 | | | | 13,790,409 | | |
Net change in unrealized appreciation (depreciation)
of investments and foreign currencies | | | 70,692,736 | | | | (155,588,873 | ) | | | (64,918,552 | ) | | | 20,278,951 | | | | 139,329,071 | | | | 76,211,966 | | |
| Net change in appreciation (depreciation)—other | | | 0 | | | | 0 | | | | (98,812 | ) | | | 43,348 | | | | 520,238 | | | | 15,132 | | |
Net realized and unrealized gain on investments
and foreign currency transactions: | | | 262,824,355 | | | | 387,988,744 | | | | 173,045,857 | | | | 201,484,044 | | | | 767,736,368 | | | | 182,627,171 | | |
| Net increase in net assets resulting from operations | | $ | 289,967,839 | | | $ | 427,564,616 | | | $ | 249,497,121 | | | $ | 204,024,346 | | | $ | 789,244,798 | | | $ | 191,475,653 | | |
THE OAKMARK FUNDS
52
See accompanying notes to financial statements.
THE OAKMARK FUNDS
53
THE OAKMARK FUNDS
Statements of Changes in Net Assets—March 31, 2006
| | | The Oakmark Fund | |
| | | Period Ended
March 31, 2006
(Unaudited) | | Year Ended
September 30, 2005 | |
| From Operations: | |
| Net investment income | | $ | 27,143,484 | | | $ | 54,415,372 | | |
| Net realized gain (loss) on investments | | | 192,135,693 | | | | 222,641,166 | | |
| Net realized gain (loss) on foreign currency transactions | | | (4,074 | ) | | | (8,888 | ) | |
Net change in unrealized appreciation (depreciation)
of investments and foreign currencies | | | 70,692,736 | | | | 106,334,519 | | |
| Net increase in net assets from operations | | | 289,967,839 | | | | 383,382,169 | | |
| Distributions to shareholders from: | |
| Net investment income—Class I | | | (51,650,692 | ) | | | (29,018,121 | ) | |
| Net investment income—Class II | | | (231,758 | ) | | | (112,443 | ) | |
| Total distributions to shareholders | | | (51,882,450 | ) | | | (29,130,564 | ) | |
| From Fund share transactions: | |
| Proceeds from shares sold—Class I | | | 476,196,283 | | | | 1,362,078,314 | | |
| Proceeds from shares sold—Class II | | | 3,614,495 | | | | 24,293,697 | | |
| Reinvestment of distributions—Class I | | | 48,533,583 | | | | 26,428,576 | | |
| Reinvestment of distributions—Class II | | | 201,618 | | | | 63,924 | | |
| Payments for shares redeemed, net of fees—Class I | | | (1,518,339,047 | ) | | | (1,874,276,130 | ) | |
| Payments for shares redeemed, net of fees—Class II | | | (8,998,285 | ) | | | (34,990,942 | ) | |
| Redemption fees—Class I | | | 228,066 | | | | 334,756 | | |
Net increase (decrease) in net assets from Fund
share transactions | | | (998,563,287 | ) | | | (496,067,805 | ) | |
| Total decrease in net assets | | | (760,477,898 | ) | | | (141,816,200 | ) | |
| Net assets: | |
| Beginning of period | | | 6,384,078,524 | | | | 6,525,894,724 | | |
| End of period | | $ | 5,623,600,626 | | | $ | 6,384,078,524 | | |
| Undistributed net investment income | | $ | 26,064,352 | | | $ | 50,807,392 | | |
| Fund Share Transactions—Class I: | |
| Shares sold | | | 11,626,965 | | | | 33,399,717 | | |
| Shares issued in reinvestment of dividends | | | 1,171,177 | | | | 648,872 | | |
| Less shares redeemed | | | (36,821,925 | ) | | | (45,831,912 | ) | |
| Net increase (decrease) in shares outstanding | | | (24,023,783 | ) | | | (11,783,323 | ) | |
| Fund Share Transactions—Class II: | |
| Shares sold | | | 88,073 | | | | 602,472 | | |
| Shares issued in reinvestment of dividends | | | 4,883 | | | | 1,576 | | |
| Less shares redeemed | | | (219,092 | ) | | | (874,201 | ) | |
| Net increase (decrease) in shares outstanding | | | (126,136 | ) | | | (270,153 | ) | |
THE OAKMARK FUNDS
54
| | | The Oakmark Select Fund | |
| | | Period Ended
March 31, 2006
(Unaudited) | | Year Ended
September 30, 2005 | |
| From Operations: | |
| Net investment income | | $ | 39,575,872 | | | $ | 50,968,447 | | |
| Net realized gain (loss) on investments | | | 543,577,617 | | | | 365,072,967 | | |
Net change in unrealized appreciation (depreciation)
of investments and foreign currencies | | | (155,588,873 | ) | | | 19,063,862 | | |
| Net increase in net assets from operations | | | 427,564,616 | | | | 435,105,276 | | |
| Distributions to shareholders from: | |
| Net investment income—Class I | | | (54,183,960 | ) | | | (41,681,659 | ) | |
| Net investment income—Class II | | | (514,309 | ) | | | (456,984 | ) | |
| Net realized gain—Class I | | | (347,307,344 | ) | | | 0 | | |
| Net realized gain—Class II | | | (4,832,939 | ) | | | 0 | | |
| Total distributions to shareholders | | | (406,838,552 | ) | | | (42,138,643 | ) | |
| From Fund share transactions: | |
| Proceeds from shares sold—Class I | | | 651,539,347 | | | | 1,213,430,549 | | |
| Proceeds from shares sold—Class II | | | 10,594,760 | | | | 25,716,965 | | |
| Reinvestment of distributions—Class I | | | 352,444,215 | | | | 39,145,855 | | |
| Reinvestment of distributions—Class II | | | 2,386,123 | | | | 205,309 | | |
| Payments for shares redeemed, net of fees—Class I | | | (803,520,713 | ) | | | (1,193,862,714 | ) | |
| Payments for shares redeemed, net of fees—Class II | | | (24,985,849 | ) | | | (45,645,335 | ) | |
| Redemption fees—Class I | | | 149,955 | | | | 183,103 | | |
Net increase (decrease) in net assets from Fund
share transactions | | | 188,607,838 | | | | 39,173,732 | | |
| Total increase in net assets | | | 209,333,902 | | | | 432,140,365 | | |
| Net assets: | |
| Beginning of period | | | 5,993,173,454 | | | | 5,561,033,089 | | |
| End of period | | $ | 6,202,507,356 | | | $ | 5,993,173,454 | | |
| Undistributed net investment income | | $ | 12,644,544 | | | $ | 27,766,940 | | |
| Fund Share Transactions—Class I: | |
| Shares sold | | | 19,477,602 | | | | 36,498,372 | | |
| Shares issued in reinvestment of dividends | | | 10,628,595 | | | | 1,205,230 | | |
| Less shares redeemed | | | (25,079,592 | ) | | | (36,106,003 | ) | |
| Net increase (decrease) in shares outstanding | | | 5,026,605 | | | | 1,597,599 | | |
| Fund Share Transactions—Class II: | |
| Shares sold | | | 318,658 | | | | 781,192 | | |
| Shares issued in reinvestment of dividends | | | 72,263 | | | | 6,346 | | |
| Less shares redeemed | | | (763,780 | ) | | | (1,385,275 | ) | |
| Net increase (decrease) in shares outstanding | | | (372,859 | ) | | | (597,737 | ) | |
See accompanying notes to financial statements.
THE OAKMARK FUNDS
55
THE OAKMARK FUNDS
Statements of Changes in Net Assets—March 31, 2006
| | | The Oakmark
Equity and Income Fund | |
| | | Period Ended
March 31, 2006
(Unaudited) | | Year Ended
September 30, 2005 | |
| From Operations: | |
| Net investment income | | $ | 76,451,264 | | | $ | 119,409,290 | | |
| Net realized gain (loss) on investments | | | 237,800,388 | | | | 113,595,101 | | |
| Net realized gain (loss) on foreign currency transactions | | | 262,833 | | | | 349,069 | | |
Net change in unrealized appreciation (depreciation)
of investments and foreign currencies | | | (64,918,552 | ) | | | 912,480,570 | | |
| Net change in unrealized appreciation (depreciation)—other | | | (98,812 | ) | | | 102,972 | | |
| Net increase in net assets from operations | | | 249,497,121 | | | | 1,145,937,002 | | |
| Distributions to shareholders from: | |
| Net investment income—Class I | | | (135,245,819 | ) | | | (67,147,479 | ) | |
| Net investment income—Class II | | | (7,080,046 | ) | | | (3,563,528 | ) | |
| Net realized gain—Class I | | | (82,965,126 | ) | | | (196,511,764 | ) | |
| Net realized gain—Class II | | | (5,378,953 | ) | | | (13,715,030 | ) | |
| Total distributions to shareholders | | | (230,669,944 | ) | | | (280,937,801 | ) | |
| From Fund share transactions: | |
| Proceeds from shares sold—Class I | | | 1,073,261,759 | | | | 1,820,363,521 | | |
| Proceeds from shares sold—Class II | | | 152,565,753 | | | | 312,413,005 | | |
| Reinvestment of distributions—Class I | | | 193,934,159 | | | | 254,487,605 | | |
| Reinvestment of distributions—Class II | | | 7,917,854 | | | | 7,740,318 | | |
| Payments for shares redeemed, net of fees—Class I | | | (705,805,315 | ) | | | (1,238,425,257 | ) | |
| Payments for shares redeemed, net of fees—Class II | | | (140,994,137 | ) | | | (273,110,583 | ) | |
| Redemption fees—Class I | | | 120,215 | | | | 194,331 | | |
Net increase in net assets from Fund
share transactions | | | 581,000,288 | | | | 883,662,940 | | |
| Total increase in net assets | | | 599,827,465 | | | | 1,748,662,141 | | |
| Net assets: | |
| Beginning of period | | | 9,805,219,823 | | | | 8,056,557,682 | | |
| End of period | | $ | 10,405,047,288 | | | $ | 9,805,219,823 | | |
| Undistributed net investment income | | $ | 52,198,572 | | | $ | 104,982,979 | | |
| Fund Share Transactions—Class I: | |
| Shares sold | | | 42,670,275 | | | | 76,592,615 | | |
| Shares issued in reinvestment of dividends | | | 7,695,800 | | | | 10,997,735 | | |
| Less shares redeemed | | | (28,645,759 | ) | | | (52,314,769 | ) | |
| Net increase (decrease) in shares outstanding | | | 21,720,316 | | | | 35,275,581 | | |
| Fund Share Transactions—Class II: | |
| Shares sold | | | 6,089,262 | | | | 13,294,303 | | |
| Shares issued in reinvestment of dividends | | | 315,076 | | | | 335,369 | | |
| Less shares redeemed | | | (5,634,964 | ) | | | (11,403,546 | ) | |
| Net increase (decrease) in shares outstanding | | | 769,374 | | | | 2,226,126 | | |
THE OAKMARK FUNDS
56
| | | The Oakmark
Global Fund | |
| | | Period Ended
March 31, 2006
(Unaudited) | | Year Ended
September 30, 2005 | |
| From Operations: | |
| Net investment income | | $ | 2,540,302 | | | $ | 13,170,380 | | |
| Net realized gain (loss) on investments | | | 174,480,866 | | | | 55,983,090 | | |
| Net realized gain (loss) on foreign currency transactions | | | 6,680,879 | | | | 2,655,497 | | |
Net change in unrealized appreciation (depreciation) of
investments and foreign currencies | | | 20,278,951 | | | | 268,798,583 | | |
| Net change in unrealized appreciation (depreciation)—other | | | 43,348 | | | | (200,695 | ) | |
| Net increase in net assets from operations | | | 204,024,346 | | | | 340,406,855 | | |
| Distributions to shareholders from: | |
| Net investment income—Class I | | | (22,234,549 | ) | | | (7,092,334 | ) | |
| Net investment income—Class II | | | (618,442 | ) | | | (103,658 | ) | |
| Net realized gain—Class I | | | (80,101,052 | ) | | | (25,218,974 | ) | |
| Net realized gain—Class II | | | (2,696,702 | ) | | | (520,696 | ) | |
| Total distributions to shareholders | | | (105,650,745 | ) | | | (32,935,662 | ) | |
| From Fund share transactions: | |
| Proceeds from shares sold—Class I | | | 253,692,027 | | | | 414,769,896 | | |
| Proceeds from shares sold—Class II | | | 9,914,646 | | | | 29,165,244 | | |
| Reinvestment of distributions—Class I | | | 92,918,090 | | | | 30,609,171 | | |
| Reinvestment of distributions—Class II | | | 2,954,863 | | | | 557,171 | | |
| Payments for shares redeemed, net of fees—Class I | | | (138,580,920 | ) | | | (238,881,611 | ) | |
| Payments for shares redeemed, net of fees—Class II | | | (3,444,594 | ) | | | (3,289,295 | ) | |
| Redemption fees—Class I | | | 39,838 | | | | 81,661 | | |
Net increase (decrease) in net assets from Fund
share transactions | | | 217,493,950 | | | | 233,012,237 | | |
| Total increase in net assets | | | 315,867,551 | | | | 540,483,430 | | |
| Net assets: | |
| Beginning of period | | | 1,901,505,070 | | | | 1,361,021,640 | | |
| End of period | | $ | 2,217,372,621 | | | $ | 1,901,505,070 | | |
| Undistributed net investment income | | $ | 260,394 | | | $ | 13,892,204 | | |
| Fund Share Transactions—Class I: | |
| Shares sold | | | 10,523,203 | | | | 18,829,404 | | |
| Shares issued in reinvestment of dividends | | | 3,942,219 | | | | 1,443,149 | | |
| Less shares redeemed | | | (5,944,410 | ) | | | (10,924,262 | ) | |
| Net increase (decrease) in shares outstanding | | | 8,521,012 | | | | 9,348,291 | | |
| Fund Share Transactions—Class II: | |
| Shares sold | | | 417,195 | | | | 1,339,114 | | |
| Shares issued in reinvestment of dividends | | | 126,818 | | | | 26,519 | | |
| Less shares redeemed | | | (152,086 | ) | | | (151,324 | ) | |
| Net increase (decrease) in shares outstanding | | | 391,927 | | | | 1,214,309 | | |
See accompanying notes to financial statements.
THE OAKMARK FUNDS
57
THE OAKMARK FUNDS
Statements of Changes in Net Assets—March 31, 2006
| | | The Oakmark
International Fund | |
| | | Period Ended
March 31, 2006
(Unaudited) | | Year Ended
September 30, 2005 | |
| From Operations: | |
| Net investment income | | $ | 21,508,430 | | | $ | 67,741,309 | | |
| Net realized gain (loss) on investments | | | 542,340,830 | | | | 231,949,113 | | |
| Net realized gain (loss) on foreign currency transactions | | | 85,546,229 | | | | 12,385,971 | | |
Net change in unrealized appreciation (depreciation)
of investments and foreign currencies | | | 139,329,071 | | | | 848,532,506 | | |
| Net change in unrealized appreciation (depreciation)—other | | | 520,238 | | | | (671,292 | ) | |
| Net increase in net assets from operations | | | 789,244,798 | | | | 1,159,937,607 | | |
| Distributions to shareholders from: | |
| Net investment income—Class I | | | (155,361,533 | ) | | | (57,688,379 | ) | |
| Net investment income—Class II | | | (9,195,731 | ) | | | (3,146,570 | ) | |
| Net realized gain—Class I | | | (258,316,383 | ) | | | (11,785,113 | ) | |
| Net realized gain—Class II | | | (16,996,109 | ) | | | (790,281 | ) | |
| Total distributions to shareholders | | | (439,869,756 | ) | | | (73,410,343 | ) | |
| From Fund share transactions: | |
| Proceeds from shares sold—Class I | | | 663,585,292 | | | | 1,220,262,175 | | |
| Proceeds from shares sold—Class II | | | 128,647,933 | | | | 191,988,151 | | |
| Reinvestment of distributions—Class I | | | 348,431,089 | | | | 63,036,515 | | |
| Reinvestment of distributions—Class II | | | 16,204,525 | | | | 2,198,011 | | |
| Payments for shares redeemed, net of fees—Class I | | | (393,400,582 | ) | | | (713,216,070 | ) | |
| Payments for shares redeemed, net of fees—Class II | | | (88,099,186 | ) | | | (156,918,221 | ) | |
| Redemption fees—Class I | | | 58,665 | | | | 261,391 | | |
Net increase (decrease) in net assets from Fund
share transactions | | | 675,427,736 | | | | 607,611,952 | | |
| Total increase in net assets | | | 1,024,802,778 | | | | 1,694,139,216 | | |
| Net assets: | |
| Beginning of period | | | 5,990,249,514 | | | | 4,296,110,298 | | |
| End of period | | $ | 7,015,052,292 | | | $ | 5,990,249,514 | | |
| Undistributed net investment income | | $ | 13,629,904 | | | $ | 71,132,509 | | |
| Fund Share Transactions—Class I: | |
| Shares sold | | | 28,154,306 | | | | 56,890,583 | | |
| Shares issued in reinvestment of dividends | | | 15,492,712 | | | | 3,074,952 | | |
| Less shares redeemed | | | (17,959,567 | ) | | | (33,360,212 | ) | |
| Net increase (decrease) in shares outstanding | | | 25,687,451 | | | | 26,605,323 | | |
| Fund Share Transactions—Class II: | |
| Shares sold | | | 5,493,273 | | | | 8,978,667 | | |
| Shares issued in reinvestment of dividends | | | 724,062 | | | | 107,693 | | |
| Less shares redeemed | | | (3,841,657 | ) | | | (7,296,822 | ) | |
| Net increase (decrease) in shares outstanding | | | 2,375,678 | | | | 1,789,538 | | |
THE OAKMARK FUNDS
58
| | | The Oakmark International
Small Cap Fund | |
| | | Period Ended
March 31, 2006
(Unaudited) | | Year Ended
September 30, 2005 | |
| From Operations: | |
| Net investment income | | $ | 8,848,482 | | | $ | 8,562,439 | | |
| Net realized gain (loss) on investments | | | 92,609,664 | | | | 163,621,128 | | |
| Net realized gain (loss) on foreign currency transactions | | | 13,790,409 | | | | 362,424 | | |
Net change in unrealized appreciation (depreciation)
of investments and foreign currencies | | | 76,211,966 | | | | 47,885,993 | | |
| Net change in unrealized appreciation (depreciation)—other | | | 15,132 | | | | (85,458 | ) | |
| Net increase in net assets from operations | | | 191,475,653 | | | | 220,346,526 | | |
| Distributions to shareholders from: | |
| Net investment income—Class I | | | (33,137,198 | ) | | | (11,222,305 | ) | |
| Net investment income—Class II | | | (19,259 | ) | | | (6,999 | ) | |
| Net realized gain—Class I | | | (166,767,203 | ) | | | (15,538,999 | ) | |
| Net realized gain—Class II | | | (99,401 | ) | | | (10,001 | ) | |
| Total distributions to shareholders | | | (200,023,061 | ) | | | (26,778,304 | ) | |
| From Fund share transactions: | |
| Proceeds from shares sold—Class I | | | 112,770,479 | | | | 180,090,052 | | |
| Proceeds from shares sold—Class II | | | 108,770 | | | | 112,795 | | |
| Reinvestment of distributions—Class I | | | 176,611,867 | | | | 24,846,478 | | |
| Reinvestment of distributions—Class II | | | 64,080 | | | | 10,284 | | |
| Payments for shares redeemed, net of fees—Class I | | | (89,382,343 | ) | | | (125,328,062 | ) | |
| Payments for shares redeemed, net of fees—Class II | | | (26,706 | ) | | | (110,335 | ) | |
| Redemption fees—Class I | | | 16,123 | | | | 38,178 | | |
Net increase (decrease) in net assets from Fund
share transactions | | | 200,162,270 | | | | 79,659,390 | | |
| Total increase in net assets | | | 191,614,862 | | | | 273,227,612 | | |
| Net assets: | |
| Beginning of period | | | 1,007,811,437 | | | | 734,583,825 | | |
| End of period | | $ | 1,199,426,299 | | | $ | 1,007,811,437 | | |
| Undistributed net investment income (loss) | | $ | (4,583,935 | ) | | $ | 5,933,633 | | |
| Fund Share Transactions—Class I: | |
| Shares sold | | | 5,275,198 | | | | 8,779,360 | | |
| Shares issued in reinvestment of dividends | | | 8,974,181 | | | | 1,298,823 | | |
| Less shares redeemed | | | (4,807,903 | ) | | | (6,084,980 | ) | |
| Net increase (decrease) in shares outstanding | | | 9,441,476 | | | | 3,993,203 | | |
| Fund Share Transactions—Class II: | |
| Shares sold | | | 5,196 | | | | 5,611 | | |
| Shares issued in reinvestment of dividends | | | 3,259 | | | | 537 | | |
| Less shares redeemed | | | (1,532 | ) | | | (5,127 | ) | |
| Net increase (decrease) in shares outstanding | | | 6,923 | | | | 1,021 | | |
See accompanying notes to financial statements.
THE OAKMARK FUNDS
59
THE OAKMARK FUNDS
Notes to Financial Statements (Unaudited)
1. SIGNIFICANT ACCOUNTING POLICIES
The following are the significant accounting policies of The Oakmark Fund ("Oakmark"), The Oakmark Select Fund ("Select"), The Oakmark Equity and Income Fund ("Equity and Income"), The Oakmark Global Fund ("Global"), The Oakmark International Fund ("International"), and The Oakmark International Small Cap Fund ("Int'l Small Cap") collectively referred to as "the Funds", each a series of Harris Associates Investment Trust (the "Trust"), a Massachusetts business trust, organized on February 1, 1991, which is registered as an investment company under the Investment Company Act of 1940. These policies are in conformity with accounting principles generally accepted in the United States of America ("GAAP"). The presentation of financial statements in conformity with GAAP requires management to make estimates and assumptions that affect the reported amounts of assets and liabilities at the date of the financial statements and the repor ted amounts of revenues and expenses during the reporting period. Actual results could differ from those estimates and assumptions. These financial statements contain all adjustments which are, in the opinion of management, necessary to a fair statement of the interim period presented. Such adjustments are of a normal and recurring nature.
Class Disclosure—
Each Fund offers two classes of shares: Class I Shares and Class II Shares. Class I Shares are offered to the general public. Class II Shares are offered to certain retirement plans such as 401(k) and profit sharing plans. Class II Shares pay a service fee at the annual rate of 0.25% of average net assets of Class II Shares of the Funds. This service fee is paid to an administrator for performing the services associated with the administration of such retirement plans.
Income, realized and unrealized capital gains and losses and expenses of the Funds that are not directly attributable to a specific class of shares are prorated among the classes based on the relative net assets of each class. Expenses directly attributable to a class of shares are recorded to the specific class.
Redemption fees—
Each Fund imposes a short-term trading fee on redemptions of Class I Shares held for 90 days or less to offset two types of costs to the Fund caused by short-term trading: portfolio transaction and market impact costs associated with erratic redemption activity and administrative costs associated with processing redemptions. The fee is 2% of the redemption value and is deducted from the redemption proceeds. The "first-in, first-out" ("FIFO") method is used to determine the holding period. The fee is retained by Class I shareholders of the Fund. Effective April 1, 2006, the fee will be allocated to both Class I and Class II pro rata based on their respective net assets.
Security valuation—
The Funds' share prices or net asset values ("NAV") are calculated as of the close of regular session trading (usually 4:00 pm Eastern time) on the New York Stock Exchange ("NYSE") on any day on which the NYSE is open for trading. Domestic equity securities traded on securities exchanges and over-the-counter securities are valued at the last sales price on the day of valuation, or lacking any reported sales that day, at the most recent bid quotation. Securities traded on the NASDAQ National Market are valued at the NASDAQ Official Closing Price ("NOCP"), or lacking an NOCP, at the most recent bid quotation on the NASDAQ National Market. Foreign equity securities traded on securities exchanges shall be valued at, depending on local convention or regulation, the last sales price, last bid or asked price, the mean between the last bid and asked prices, an official closing price, or shall be based on a pricing composite as of the cl ose of the regular trading hours on the appropriate exchange or other designated time. Debt obligations and money market instruments maturing in more than 60 days from the date of purchase are valued at the latest bid quotation. Debt obligations and money market instruments maturing in less than 61 days from the date of purchase are valued on an amortized cost basis, which approximates value. Options are valued at the last reported sales price on the day of valuation, or lacking any reported sales that day, at the mean of the most recent bid and asked quotations, or if the mean is not available, at the most recent bid quotation.
Securities for which quotations are not readily available or securities that may have been affected by a significant event occurring between the close of a foreign market and the close of the NYSE are valued at fair values, determined by or under the direction of the pricing committee established by the Board of Trustees. A significant event may include the performance of U.S. markets since the close of foreign markets. The pricing committee will evaluate movements in the U.S markets after the close of foreign markets and may adjust security prices to reflect changes in reaction to U.S. markets as determined by a third party model. At March 31, 2006, the Funds held no securities for which quotations were not readily available, and no securities that were believed to be affected by a significant event prior to the computation of the NAV.
Foreign currency translations—
Certain Funds invest in foreign securities, which may involve a number of risk factors and special considerations not present with investments in securities of U.S. corpororations. Values of investments and other assets and liabilities denominated in foreign currencies are translated into U.S. dollars at current exchange rates obtained by a recognized bank, dealer, or independent pricing service on the day of valuation. Purchases and sales of investments and dividend and interest income are converted at the prevailing rate of exchange on the respective dates of such transactions. Forward foreign currency contracts are valued at the current day's interpolated foreign exchange rates.
THE OAKMARK FUNDS
60
THE OAKMARK FUNDS
Notes to Financial Statements (Unaudited) (cont.)
The Funds do not isolate that portion of the results of operations resulting from changes in foreign exchange rates on investments from the fluctuations arising from changes in market prices of securities held. Such fluctuations are included with the net realized and unrealized gains and losses from securities.
Net realized gains and losses on foreign currency transactions arise from sales of foreign currencies, currency gains or losses realized between the trade and settlement dates on securities transactions, the difference between the amounts of dividends, interest, and foreign withholding taxes recorded and the U.S. dollar equivalent of the amounts actually received or paid, and the realized gains or losses resulting from portfolio and transaction hedges. Net unrealized foreign exchange gains and losses arise from changes in the fair value of assets and liabilities, other than investments in securities at fiscal year end resulting from changes in exchange rates.
At March 31, 2006, net unrealized appreciation (depreciation) - other included the following components:
| | | Equity and
Income | | Global | | International | | Int'l
Small Cap | |
Unrealized appreciation
(depreciation) on
interest, dividends, and
dividend reclaims
receivable | | $ | 130,832 | | | $ | (80,421 | ) | | $ | 148,562 | | | $ | (35,536 | ) | |
Unrealized appreciation
(depreciation) on open
securities purchases and
sales | | | 0 | | | | 0 | | | | (3,713 | ) | | | 1,967 | | |
Net Unrealized
appreciation
(depreciation) -
Other | | $ | 130,832 | | | $ | (80,421 | ) | | $ | 144,849 | | | $ | (33,569 | ) | |
Forward foreign currency contracts—
The Funds' currency transactions are limited to transaction hedging and portfolio hedging. The contractual amounts of forward foreign exchange contracts do not necessarily represent the amounts potentially subject to risk. The measurement of the risks associated with these instruments is meaningful only when all related and offsetting transactions are considered. Risks arise from the possible inability of counterparties to meet the terms of their contracts and from movements in currency values. At March 31, 2006, Global and Int'l Small Cap held the following outstanding forward foreign currency contracts:
The Oakmark Global Fund
| | | Contract
Amount | | Settlement
Date | | Valuation at
3/31/06 | | Unrealized
Appreciation/
(Depreciation) | |
Foreign Currency Bought:
British Pound
Sterling | | | 20,800,000 | | | 4/18/06 | | $ | 36,140,986 | | | $ | (204,340 | ) | |
Foreign Currency Sold:
British Pound
Sterling | | | 20,800,000 | | | 4/18/06 | | $ | (36,140,986 | ) | | $ | 242,374 | | |
| | | | | Total | | $ | 0 | | | $ | 38,034 | | |
The Oakmark International Small Cap Fund
| | | Contract
Amount | | Settlement
Date | | Valuation at
3/31/06 | | Unrealized
Appreciation/
(Depreciation) | |
Foreign Currency Bought:
British Pound
Sterling | | | 11,000,000 | | | 5/17/06 | | $ | 19,119,438 | | | $ | (235,612 | ) | |
Foreign Currency Sold:
British Pound
Sterling | | | 11,000,000 | | | 5/17/06 | | $ | (19,119,438 | ) | | $ | 1,098,562 | | |
| | | | | Total | | $ | 0 | | | $ | 862,950 | | |
THE OAKMARK FUNDS
61
THE OAKMARK FUNDS
Notes to Financial Statements (Unaudited) (cont.)
Security transactions and investment income—
Security transactions are accounted for on the trade date (date the order to buy or sell is executed) and dividend income is recorded on the ex-dividend date. Interest income and expenses are recorded on an accrual basis. Bond discount is accreted and premium is amortized over the expected life of each applicable security using the effective yield method. Withholding taxes on foreign dividends have been provided for in accordance with the Funds' understanding of the applicable country's tax rules and rates. Net realized gains and losses on investments are determined by the specific identification method.
Distributions to shareholders—
Income, dividends and capital gains distributions are determined in accordance with federal income tax regulations, which may differ from GAAP. Tax and book differences are primarily related to foreign currency transactions, deferral of certain losses, character of capital loss carryforwards, and tax equalization.
Short sales—
Each Fund may sell a security it does not own in anticipation of a decline in the fair value of that security. When the Fund sells a security short, it must borrow the security sold short and deliver it to the broker-dealer through which it made the short sale. A gain, limited to the price at which the Fund sold the security short, or loss, unlimited in size, will be recognized upon the termination of a short sale. For the six-month period ending March 31, 2006, the Funds had no short sales outstanding.
Accounting for options—
When a Fund writes an option, the premium received by the Fund is recorded as a liability and is subsequently adjusted to the current market value of the option written. Premiums received from writing options that expire are recorded by the Fund on the expiration date as realized gains from option transactions. The difference between the premium and the amount paid on effecting a closing purchase transaction, including brokerage commissions, is also treated as a realized gain, or if the premium is less than the amount paid for the closing purchase transaction, as a realized loss. If a call option is exercised, the premium is added to the proceeds from the sale of the underlying security or currency in determining whether the Fund has realized a gain or a loss. If a put option is exercised, the premium reduces the cost basis of the security or currency purchased by the Fund. In writing an option, the Fund bears the market risk of an unfavorable change in the price of the security or currency underlying the written option. Exercise of an option written by the Fund could result in the Fund selling or buying a security or currency at a price different from the current value. Options written by the Funds do not give rise to counterparty credit risk, as they obligate the Funds, not their counterparties, to perform.
When a Fund purchases an option, the premium paid by the Fund is recorded as an asset and is subsequently adjusted to the current value of the option purchased. Purchasing call options tends to increase the Fund's exposure to the underlying instrument. Purchasing put options tends to decrease the Fund's exposure to the underlying instrument. Premiums paid for purchasing options which expire are treated as realized losses. Premiums paid for purchasing options which are exercised or closed are added to the amounts paid or offset against the proceeds on the underlying security to determine the realized gain or loss. The risks associated with purchasing put and call options are potential loss of the premium paid and the failure of the counterparty to honor their obligation under the contract.
At March 31, 2006, the Funds had no outstanding options.
Committed line of credit—
The Trust has an unsecured committed line of credit with Investors Bank & Trust Company ("IBT") in the amount of $450 million. Borrowings under that arrangement bear interest at 0.45% above the Federal Funds Effective Rate. There were no borrowings during the six-month period ended March 31, 2006.
Expense offset arrangement—
IBT serves as custodian of the Funds. IBT's fee may be reduced by credits which are an earnings allowance calculated on the average daily cash balances each Fund maintains with IBT. Credit balances used to reduce the Funds' custodian fees, if any, are reported as a reduction of total expenses in the Statements of Operations.
Repurchase agreements—
Each Fund may invest in repurchase agreements, which are short-term investments whereby the Fund acquires ownership of a debt security and the seller agrees to repurchase the security in the future at a specified price.
Each Fund, through IBT, receives delivery of the underlying securities collateralizing repurchase agreements. It is each Fund's policy that the value of the collateral be at least equal to 105% of the repurchase price, including interest. Harris Associates L.P. ("the Adviser") is responsible for determining that the value of the collateral is at all times at least equal to 105% of the repurchase price, including interest. Repurchase agreements could involve certain risks in the event of default or insolvency of the counterparty including possible delays or restrictions upon a Fund's ability to dispose of the underlying securities.
Security lending—
Each Fund, except Oakmark Fund, may lend its portfolio securities to broker-dealers and banks. Any such loan must be continuously secured by collateral in cash or cash equivalents maintained on a current basis in an amount at least equal to the fair value of the securities loaned by the Fund. Collateral is marked to market and monitored daily. The Fund would continue to receive the equivalent of the interest or dividends paid by the issuer on the securities loaned, and would also receive an additional return that may be in the form of a fixed fee or a percentage of the earnings on the collateral. The Fund would have the right to call
THE OAKMARK FUNDS
62
THE OAKMARK FUNDS
Notes to Financial Statements (Unaudited) (cont.)
the loan and obtain the securities loaned at any time, and the counterparty shall return the securities within five business days or less. In the event of bankruptcy or other default of the borrower, the Fund could experience delays in liquidating the loan collateral or recovering the loaned securities and incur expenses related to enforcing its rights. In addition, there could be a decline in the value of the collateral or in the fair value of the securities loaned while the Fund seeks to enforce its rights thereto and the Fund could experience subnormal levels of income or lack of access to income during that period.
At March 31, 2006, Equity and Income, Global and International had securities on loan with values of approximately $594,006,000, $131,807,000 and $565,184,000, respectively, and received $619,595,331, $139,235,677 and $599,076,392 of U.S. Treasury securities as collateral for the loans, respectively.
Restricted securities—
The following investments, the sales of which are restricted to qualified institutional buyers, have been valued according to the securities valuation procedures for debt obligations and money market instruments (as stated in the Security valuation section) since their acquisition dates. These securities are priced using market quotations and there are no unrestricted securities with the same maturity dates and yields for the issuer.
At March 31, 2006, Equity and Income held the following restricted securities:
| Quantity | | Security
Name | | Acquisition
Date | | Carrying
Value | | Cost | | Value | | Percentage of
Net Assets | |
| $ | 3,000,000 | | | Sealed Air Corporation,
144A, 5.625% due
7/15/2013 | | 6/27/2003 | | | 97.1907 | | | | 100.68 | | | $ | 2,915,721 | | | | 0.03 | % | |
| | 5,000,000 | | | Sealed Air Corporation,
144A, 5.625% due
7/15/2013 | | 8/20/2003 | | | 97.1907 | | | | 96.41 | | | | 4,859,535 | | | | 0.05 | % | |
| | 300,000 | | | Sealed Air Corporation,
144A, 5.625% due
7/15/2013 | | 8/21/2003 | | | 97.1907 | | | | 96.79 | | | | 291,572 | | | | 0.00 | % | |
| | 11,700,000 | | | Sealed Air Corporation,
144A 5.625% due
7/15/2013 | | 4/6/2004 | | | 97.1907 | | | | 103.31 | | | | 11,371,312 | | | | 0.11 | % | |
| | | | | | | | | | | | | | | | | $ | 19,438,140 | | | | 0.19 | % | |
2. TRANSACTIONS WITH AFFILIATES
Each Fund has an investment advisory agreement with the Adviser. For management services and facilities furnished, the Funds pay the Advisor monthly fees. Each fee is calculated on the total net assets as determined at the end of each preceding calendar month. Annual fee rates are as follows:
| Fund | | Advisory Fees | | Fund | | Advisory Fees | |
Oakmark
| | 1.00% up to $2 billion;
0.90% on the next $1 billion;
0.80% on the next $2 billion;
0.75% on the next $2.5 billion;
0.70% on the next $2.5 billion; and
0.65% over 10 billion | | Equity and Income
| | 0.75% up to $5 billion;
0.70% on the next $2.5 billion;
0.675% on the next $2.5 billion;
0.65% on the next $2.5 billion; and
0.60% over $12.5 billion
| |
|
Select
| | 1.00% up to $1 billion;
0.95% on the next $500 million;
0.90% on the next $500 million;
0.85% on the next $500 million;
0.80% on the next $2.5 billion;
0.75% on the next $5 billion; and
0.725% over 10 billion
| | Global
International
| | 1.00% up to $2 billion;
0.95% on the next $2 billion; and
0.90% over $4 billion
1.00% up to $2 billion;
0.95% on the next $1 billion;
0.85% on the next $2 billion;
0.825% on the next $2.5 billion; and
0.815% over $7.5 billion | |
|
| |
| | Int'l Small Cap
| | 1.25% up to $500 million;
1.10% on the next $1 billion; and
1.05% over $1.5 billion | |
|
THE OAKMARK FUNDS
63
THE OAKMARK FUNDS
Notes to Financial Statements (Unaudited) (cont.)
The Adviser is contractually obligated to reimburse each Fund Class to the extent, but only to the extent, that its annualized expenses (excluding taxes, interest, all commissions and other normal charges incident to the purchase and sale of portfolio securities, and extraordinary charges such as litigation costs, but including fees paid to the Adviser) exceed the percent set forth below of average daily net assets of the Fund Class through January 31, 2007.
| Fund | | Class I | | Class II | |
| Oakmark | | | 1.50 | % | | | 1.75 | % | |
| Select | | | 1.50 | | | | 1.75 | | |
| Equity and Income | | | 1.00 | | | | 1.25 | | |
| Global | | | 1.75 | | | | 2.00 | | |
| International | | | 2.00 | | | | 2.25 | | |
| Int'l Small Cap | | | 2.00 | | | | 2.25 | | |
The Adviser has entered into agreements with financial intermediaries to provide recordkeeping, processing, shareholder communications and other services to customers of the intermediaries and has agreed to compensate the intermediaries for providing those services. Certain of those services would be provided by the Funds if the shares of each customer were registered directly with the Funds' transfer agent. Accordingly, the Funds pay a portion of the intermediary fees pursuant to separate agreements with the Adviser. Each agreement with the Adviser calls for each Fund to pay a portion of the intermediary fees attributable to shares of the Fund (which generally are a percentage of value of the shares) not exceeding what the Fund would have paid its transfer agent had each customer's shares been registered directly with the transfer agent instead of held through the intermediary accounts. The Adviser pays the remainder of the fee s. The fees incurred by the Funds are reflected as other shareholder servicing fees in the Statements of Operations.
The non-interested Trustees of the Trust may participate in the Trust's Deferred Compensation Plan for Independent Trustees. Participants in the plan may elect to defer all or a portion of their compensation. Amounts deferred are retained by the Trust and represent an unfunded obligation of the Trust. The value of amounts deferred for a participant is determined by reference to the change in value of Class I shares of one or more of the Funds or a money market fund as specified by the participant. Benefits under the plan are payable upon retirement. The deferred fees are reflected as deferred trustee compensation in the Statement of Operations. The interested trustees are not compensated by the Funds.
3. FEDERAL INCOME TAXES
It is the policy of each Fund to comply with the requirements of the Internal Revenue Code applicable to regulated investment companies and to distribute substantially all of its net taxable income, including any net realized gains on investments, to its shareholders. Therefore, no federal income tax provision is required.
| Fund | | Cost of Investments
for Federal Income
Tax Purposes | | Gross Unrealized
Appreciation | | Gross Unrealized
(Depreciation) | | Net Unrealized
Appreciation
(Depreciation) | |
| Oakmark | | $ | 4,295,671,573 | | | $ | 1,410,402,391 | | | $ | (75,881,172 | ) | | $ | 1,334,521,219 | | |
| Select | | | 4,586,228,409 | | | | 1,653,000,332 | | | | (50,316,004 | ) | | | 1,602,684,328 | | |
| Equity and Income | | | 8,676,341,538 | | | | 1,767,766,563 | | | | (90,808,715 | ) | | | 1,676,957,848 | | |
| Global | | | 1,732,428,995 | | | | 503,577,992 | | | | (16,354,397 | ) | | | 487,223,595 | | |
| International | | | 5,218,512,594 | | | | 1,778,110,287 | | | | (43,683,607 | ) | | | 1,734,426,680 | | |
| Int'l Small Cap | | | 898,345,693 | | | | 318,656,850 | | | | (16,905,245 | ) | | | 301,751,605 | | |
For the six-month period ended March 31, 2006, the components of distributable earnings on a tax basis (excluding unrealized appreciation (depreciation)) were as follows:
| Fund | | Undistributed
Ordinary Income | | Undistributed Long-
Term Gain | | Total Distributable
Earnings | |
| Oakmark | | $ | 27,008,113 | | | $ | 152,828,693 | | | $ | 179,836,806 | | |
| Select | | | 13,564,078 | | | | 543,466,888 | | | | 557,030,966 | | |
| Equity and Income | | | 51,722,525 | | | | 224,924,388 | | | | 276,646,913 | | |
| Global | | | 710,845 | | | | 145,333,971 | | | | 146,044,816 | | |
| International | | | 24,219,952 | | | | 489,351,331 | | | | 513,571,283 | | |
| Int'l Small Cap | | | 26,526,585 | | | | 64,943,140 | | | | 91,469,725 | | |
THE OAKMARK FUNDS
64
THE OAKMARK FUNDS
Notes to Financial Statements (Unaudited) (cont.)
During the six-month period ended March 31, 2006, and year ended September 30, 2005, the tax character of distributions paid was as follows:
| | | Period Ended
March 31, 2006 | | Year Ended
September 30, 2005 | |
| Fund | | Distributions Paid
from Ordinary
Income | | Distributions Paid
from Long-Term
Capital Gain | | Distributions Paid
from Ordinary
Income | | Distributions Paid
from Long-Term
Capital Gain | |
| Oakmark | | $ | 51,882,450 | | | $ | 0 | | | $ | 29,130,564 | | | $ | 0 | | |
| Select | | | 54,698,269 | | | | 352,140,283 | | | | 42,138,643 | | | | 0 | | |
| Equity and Income | | | 142,325,865 | | | | 88,344,079 | | | | 70,711,007 | | | | 210,226,794 | | |
| Global | | | 29,299,802 | | | | 76,350,943 | | | | 7,195,992 | | | | 25,739,670 | | |
| International | | | 170,634,189 | | | | 269,235,567 | | | | 60,834,949 | | | | 12,575,394 | | |
| Int'l Small Cap | | | 43,619,663 | | | | 156,403,398 | | | | 11,229,304 | | | | 15,549,000 | | |
4. INVESTMENT TRANSACTIONS
For the six-month period ended March 31, 2006, transactions in investment securities (excluding short term and U.S. Government securities) were as follows (in thousands):
| | | Oakmark | | Select | | Equity and
Income | | Global | | International | | Int'l
Small Cap | |
| Purchases | | $ | 151,616 | | | $ | 770,258 | | | $ | 3,202,905 | | | $ | 657,970 | | | $ | 1,416,196 | | | $ | 222,623 | | |
| Proceeds from sales | | | 1,035,228 | | | | 809,230 | | | | 3,003,358 | | | | 476,546 | | | | 1,130,434 | | | | 240,080 | | |
Purchases at cost and proceeds from sales of long-term U.S. Government securities for the six-month period ended March 31, 2006 were $1,876,936,291 and $2,019,096,253 respectively for Equity and Income.
5. INVESTMENTS IN AFFILIATED ISSUERS
An affiliated issuer, as defined under the Investment Company Act of 1940, is one in which a Fund's holdings of an issuer represents 5% or more of the outstanding voting securities of the issuer. A summary of each Fund's investments in securities of these issuers for the six-month period ended March 31, 2006, is set forth below:
Summary of Transactions with Affiliated Companies
The Oakmark Select Fund
| Affiliates | | Shares Held | | Purchases
(Cost) | | Sales
Proceeds | | Dividend
Income | | Value
March 31,
2006 | |
The Dun & Bradstreet
Corporation + | | | 3,934,900 | | | $ | 0 | | | $ | 0 | | | $ | 0 | | | $ | 301,728,132 | | |
| H&R Block, Inc. | | | 16,519,600 | | | | 0 | | | | 0 | | | | 4,129,900 | | | | 357,649,340 | | |
| TOTALS | | | | $ | 0 | | | $ | 0 | | | $ | 4,129,900 | | | $ | 659,377,472 | | |
Summary of Transactions with Affiliated Companies
The Oakmark Equity and Income Fund
| Affiliates | | Shares Held | | Purchases
(Cost) | | Sales
Proceeds | | Dividend
Income | | Value
March 31,
2006 | |
St Mary Land & Exploration
Company | | | 2,900,000 | | | $ | 0 | | | $ | 0 | | | $ | 145,000 | | | $ | 118,407,000 | | |
| Varian, Inc.+ | | | 1,649,400 | | | | 0 | | | | 0 | | | | 0 | | | | 67,922,292 | | |
| TOTALS | | | | $ | 0 | | | $ | 0 | | | $ | 145,000 | | | $ | 186,329,292 | | |
THE OAKMARK FUNDS
65
THE OAKMARK FUNDS
Notes to Financial Statements (Unaudited) (cont.)
Summary of Transactions with Affiliated Companies
The Oakmark International Fund
| Affiliates | | Shares Held | | Purchases
(Cost) | | Sales
Proceeds | | Dividend
Income | | Value
March 31,
2006 | |
| Chargeurs SA * | | | 0 | | | $ | 0 | | | $ | 17,467,399 | | | $ | 0 | | | $ | 0 | | |
| Endonis plc | | | 33,585,320 | | | | 0 | | | | 0 | | | | 769,131 | | | | 87,521,665 | | |
| Giordano International Limited | | | 121,265,300 | | | | 34,054,359 | | | | 0 | | | | 0 | | | | 67,203,339 | | |
| Lotte Chilsung Beverage Co., Ltd. | | | 88,800 | | | | 4,508,699 | | | | 0 | | | | 192,699 | | | | 98,707,287 | | |
| Meitec Corporation | | | 2,483,800 | | | | 0 | | | | 0 | | | | 1,018,001 | | | | 81,664,381 | | |
| Michael Page International plc | | | 18,043,000 | | | | 0 | | | | 30,669,429 | | | | 0 | | | | 106,890,214 | | |
| Trinity Mirror plc | | | 15,132,538 | | | | 157,043,029 | | | | 0 | | | | 0 | | | | 149,851,622 | | |
| TOTALS | | | | | | $ | 195,606,087 | | | $ | 48,136,828 | | | $ | 1,979,831 | | | $ | 591,838,508 | | |
Summary of Transactions with Affiliated Companies
The Oakmark International Small Cap Fund
| Affiliates | | Shares Held | | Purchases
(Cost) | | Sales
Proceeds | | Dividend
Income | | Value
March 31,
2006 | |
| Alaska Milk Corporation | | | 56,360,000 | | | $ | 0 | | | $ | 0 | | | $ | 161,135 | | | $ | 3,860,274 | | |
| Chargeurs SA | | | 790,182 | | | | 17,467,399 | | | | 0 | | | | 0 | | | | 22,307,980 | | |
| Gurit-Heberlein AG | | | 26,700 | | | | 0 | | | | 5,895,445 | | | | 0 | | | | 28,670,041 | | |
| Interpump Group S.p.A. | | | 4,709,000 | | | | 0 | | | | 0 | | | | 3,897,265 | | | | 37,001,204 | | |
| JJB Sports plc | | | 12,705,000 | | | | 10,645,634 | | | | 0 | | | | 590,831 | | | | 40,668,391 | | |
| Kongsberg Automotive ASA | | | 3,094,400 | | | | 24,064,944 | | | | 0 | | | | 0 | | | | 28,796,973 | | |
| Lectra | | | 2,186,404 | | | | | | | | 0 | | | | 0 | | | | 15,524,057 | | |
| Mainfreight Limited | | | 8,049,571 | | | | 2,558,745 | | | | 1,099,139 | | | | 293,964 | | | | 23,240,432 | | |
| Media Prima Berhad + | | | 33,747,000 | | | | 5,149,972 | | | | 0 | | | | 0 | | | | 16,492,791 | | |
| Morse plc | | | 12,474,000 | | | | 0 | | | | 0 | | | | 833,830 | | | | 22,429,568 | | |
| Vitec Group plc | | | 2,383,907 | | | | 0 | | | | 0 | | | | 0 | | | | 20,593,915 | | |
| TOTALS | | | | | | $ | 59,886,694 | | | $ | 6,994,584 | | | $ | 5,777,025 | | | $ | 259,585,626 | | |
* Position in issuer liquidated during the six-month period ended March 31, 2006.
+ Non-income producing security.
THE OAKMARK FUNDS
66
THE OAKMARK FUND
Financial Highlights–Class I
For a share outstanding throughout each period
| | | Period Ended
March 31,
2006
(Unaudited) | | Year Ended
September 30,
2005 | | Year Ended
September 30,
2004 | | Year Ended
September 30,
2003 | | Year Ended
September 30,
2002 | | Year Ended
September 30,
2001 | |
| Net Asset Value, Beginning of Period | | $ | 40.75 | | | $ | 38.68 | | | $ | 33.85 | | | $ | 28.08 | | | $ | 32.01 | | | $ | 26.95 | | |
| Income From Investment Operations: | |
| Net Investment Income | | | 0.20 | (a) | | | 0.34 | | | | 0.16 | | | | 0.13 | | | | 0.12 | | | | 0.07 | | |
Net Gains or Losses on Investments
(both realized and unrealized) | | | 1.84 | | | | 1.90 | | | | 4.81 | | | | 5.75 | | | | (3.85 | ) | | | 5.38 | | |
| Total From Investment Operations: | | | 2.04 | | | | 2.24 | | | | 4.97 | | | | 5.88 | | | | (3.73 | ) | | | 5.45 | | |
| Less Distributions: | |
| Dividends (from net investment income) | | | (0.35 | ) | | | (0.17 | ) | | | (0.14 | ) | | | (0.11 | ) | | | (0.20 | ) | | | (0.39 | ) | |
| Distributions (from capital gains) | | | 0.00 | | | | 0.00 | | | | 0.00 | | | | 0.00 | | | | 0.00 | | | | 0.00 | | |
| Total Distributions | | | (0.35 | ) | | | (0.17 | ) | | | (0.14 | ) | | | (0.11 | ) | | | (0.20 | ) | | | (0.39 | ) | |
| Redemption Fee per share | | | 0.00 | (b) | | | 0.00 | (b) | | | 0.00 | (b) | | | — | | | | — | | | | — | | |
| Net Asset Value, End of Period | | $ | 42.44 | | | $ | 40.75 | | | $ | 38.68 | | | $ | 33.85 | | | $ | 28.08 | | | $ | 32.01 | | |
| Total Return | | | 5.02 | % | | | 5.79 | % | | | 14.73 | % | | | 20.99 | % | | | (11.77 | )% | | | 20.42 | % | |
| Ratios/Supplemental Data: | |
| Net Assets, End of Period ($million) | | $ | 5,583.4 | | | $ | 6,340.4 | | | $ | 6,474.0 | | | $ | 4,769.4 | | | $ | 3,300.9 | | | $ | 3,109.1 | | |
| Ratio of Expenses to Average Net Assets | | | 1.07 | %* | | | 1.03 | %** | | | 1.05 | % | | | 1.14 | % | | | 1.17 | % | | | 1.15 | % | |
| Ratio of Net Investment Income to Average Net Assets | | | 0.90 | %* | | | 0.79 | % | | | 0.47 | % | | | 0.48 | % | | | 0.38 | % | | | 0.73 | % | |
| Portfolio Turnover Rate | | | 3 | % | | | 16 | % | | | 19 | % | | | 21 | % | | | 44 | % | | | 57 | % | |
Financial Highlights–Class II
For a share outstanding throughout each period
| | | Period Ended
March 31,
2006
(Unaudited) | | Year Ended
September 30,
2005 | | Year Ended
September 30,
2004 | | Year Ended
September 30,
2003 | | Year Ended
September 30,
2002 | | April 5, 2001
through
September 30,
2001(c) | |
| Net Asset Value, Beginning of Period | | $ | 40.51 | | | $ | 38.45 | | | $ | 33.68 | | | $ | 28.04 | | | $ | 31.97 | | | $ | 32.09 | | |
| Income From Investment Operations: | |
| Net Investment Income | | | 0.13 | (a) | | | 0.26 | | | | 0.04 | (a) | | | 0.05 | | | | 0.16 | | | | 0.05 | | |
Net Gains or Losses on Investments
(both realized and unrealized) | | | 1.84 | | | | 1.87 | | | | 4.78 | | | | 5.69 | | | | (3.92 | ) | | | (0.17 | ) | |
| Total From Investment Operations: | | | 1.97 | | | | 2.13 | | | | 4.82 | | | | 5.74 | | | | (3.76 | ) | | | (0.12 | ) | |
| Less Distributions: | |
| Dividends (from net investment income) | | | (0.23 | ) | | | (0.07 | ) | | | (0.05 | ) | | | (0.10 | ) | | | (0.17 | ) | | | 0.00 | | |
| Distributions (from capital gains) | | | 0.00 | | | | 0.00 | | | | 0.00 | | | | 0.00 | | | | 0.00 | | | | 0.00 | | |
| Total Distributions | | | (0.23 | ) | | | (0.07 | ) | | | (0.05 | ) | | | (0.10 | ) | | | (0.17 | ) | | | 0.00 | | |
| Net Asset Value, End of Period | | $ | 42.25 | | | $ | 40.51 | | | $ | 38.45 | | | $ | 33.68 | | | $ | 28.04 | | | $ | 31.97 | | |
| Total Return | | | 4.87 | % | | | 5.55 | % | | | 14.32 | % | | | 20.52 | % | | | (11.85 | )% | | | (0.37 | )% | |
| Ratios/Supplemental Data: | |
| Net Assets, End of Period ($million) | | $ | 40.2 | | | $ | 43.7 | | | $ | 51.9 | | | $ | 21.1 | | | $ | 7.7 | | | $ | 0.1 | | |
| Ratio of Expenses to Average Net Assets | | | 1.37 | %* | | | 1.26 | %** | | | 1.40 | % | | | 1.53 | % | | | 1.44 | % | | | 1.32 | %* | |
| Ratio of Net Investment Income to Average Net Assets | | | 0.60 | %* | | | 0.58 | % | | | 0.11 | % | | | 0.06 | % | | | 0.35 | % | | | 0.46 | %* | |
| Portfolio Turnover Rate | | | 3 | % | | | 16 | % | | | 19 | % | | | 21 | % | | | 44 | % | | | 57 | % | |
* Data has been annualized.
** The ratio excludes expense offset arrangement.
(a) Computed using average shares outstanding throughout the period.
(b) Amounts round to less than $0.01 per share.
(c) The date on which Class II shares were first sold to the public was April 5, 2001.
See accompanying notes to financial statements.
THE OAKMARK FUNDS
67
THE OAKMARK SELECT FUND
Financial Highlights–Class I
For a share outstanding throughout each period
| | | Period Ended
March 31,
2006
(Unaudited) | | Year Ended
September 30,
2005 | | Year Ended
September 30,
2004 | | Year Ended
September 30,
2003 | | Year Ended
September 30,
2002 | | Year Ended
September 30,
2001 | |
| Net Asset Value, Beginning of Period | | $ | 33.44 | | | $ | 31.20 | | | $ | 27.55 | | | $ | 21.67 | | | $ | 25.20 | | | $ | 21.45 | | |
| Income From Investment Operations: | |
| Net Investment Income | | | 0.22 | (a) | | | 0.29 | | | | 0.15 | (a) | | | 0.05 | | | | 0.02 | | | | 0.03 | | |
Net Gains or Losses on Investments
(both realized and unrealized) | | | 2.15 | | | | 2.19 | | | | 3.60 | | | | 5.85 | | | | (3.50 | ) | | | 5.17 | | |
| Total From Investment Operations: | | | 2.37 | | | | 2.48 | | | | 3.75 | | | | 5.90 | | | | (3.48 | ) | | | 5.20 | | |
| Less Distributions: | |
| Dividends (from net investment income) | | | (0.29 | ) | | | (0.24 | ) | | | (0.10 | ) | | | (0.02 | ) | | | (0.05 | ) | | | (0.09 | ) | |
| Distributions (from capital gains) | | | (1.79 | ) | | | 0.00 | | | | 0.00 | | | | 0.00 | | | | 0.00 | | | | (1.36 | ) | |
| Total Distributions | | | (2.08 | ) | | | (0.24 | ) | | | (0.10 | ) | | | (0.02 | ) | | | (0.05 | ) | | | (1.45 | ) | |
| Redemption Fee per share | | | 0.00 | (b) | | | 0.00 | (b) | | | 0.00 | (b) | | | 0.00 | | | | 0.00 | | | | 0.00 | | |
| Net Asset Value, End of Period | | $ | 33.73 | | | $ | 33.44 | | | $ | 31.20 | | | $ | 27.55 | | | $ | 21.67 | | | $ | 25.20 | | |
| Total Return | | | 7.20 | % | | | 7.98 | % | | | 13.64 | % | | | 27.25 | % | | | (13.85 | )% | | | 25.75 | % | |
| Ratios/Supplemental Data: | |
| Net Assets, End of Period ($million) | | $ | 6,129.0 | | | $ | 5,908.0 | | | $ | 5,463.0 | | | $ | 4,993.0 | | | $ | 3,717.6 | | | $ | 4,161.4 | | |
| Ratio of Expenses to Average Net Assets | | | 1.00 | %* | | | 1.00 | % | | | 1.00 | % | | | 1.02 | % | | | 1.07 | % | | | 1.08 | % | |
| Ratio of Net Investment Income to Average Net Assets | | | 1.29 | %* | | | 0.87 | % | | | 0.50 | % | | | 0.23 | % | | | 0.09 | % | | | 0.26 | % | |
| Portfolio Turnover Rate | | | 14 | % | | | 21 | % | | | 14 | % | | | 20 | % | | | 32 | % | | | 21 | % | |
Financial Highlights–Class II
For a share outstanding throughout each period
| | | Period Ended
March 31,
2006
(Unaudited) | | Year Ended
September 30,
2005 | | Year Ended
September 30,
2004 | | Year Ended
September 30,
2003 | | Year Ended
September 30,
2002 | | Year Ended
September 30,
2001 | |
| Net Asset Value, Beginning of Period | | $ | 33.24 | | | $ | 31.00 | | | $ | 27.37 | | | $ | 21.56 | | | $ | 25.10 | | | $ | 21.40 | | |
| Income From Investment Operations: | |
| Net Investment Income (Loss) | | | 0.19 | (a) | | | 0.21 | | | | 0.09 | (a) | | | 0.00 | (b) | | | (0.04 | ) | | | 0.00 | (b) | |
Net Gains or Losses on Investments
(both realized and unrealized) | | | 2.11 | | | | 2.18 | | | | 3.58 | | | | 5.81 | | | | (3.50 | ) | | | 5.10 | | |
| Total From Investment Operations: | | | 2.30 | | | | 2.39 | | | | 3.67 | | | | 5.81 | | | | (3.54 | ) | | | 5.10 | | |
| Less Distributions: | |
| Dividends (from net investment income) | | | (0.20 | ) | | | (0.15 | ) | | | (0.04 | ) | | | 0.00 | | | | 0.00 | | | | (0.06 | ) | |
| Distributions (from capital gains) | | | (1.79 | ) | | | 0.00 | | | | 0.00 | | | | 0.00 | | | | 0.00 | | | | (1.34 | ) | |
| Total Distributions | | | (1.99 | ) | | | (0.15 | ) | | | (0.04 | ) | | | 0.00 | | | | 0.00 | | | | (1.40 | ) | |
| Net Asset Value, End of Period | | $ | 33.55 | | | $ | 33.24 | | | $ | 31.00 | | | $ | 27.37 | | | $ | 21.56 | | | $ | 25.10 | | |
| Total Return | | | 7.01 | % | | | 7.72 | % | | | 13.40 | % | | | 26.95 | % | | | (14.10 | )% | | | 25.28 | % | |
| Ratios/Supplemental Data: | |
| Net Assets, End of Period ($million) | | $ | 73.5 | | | $ | 85.2 | | | $ | 98.0 | | | $ | 93.1 | | | $ | 64.4 | | | $ | 35.4 | | |
| Ratio of Expenses to Average Net Assets | | | 1.33 | %* | | | 1.25 | % | | | 1.21 | % | | | 1.29 | % | | | 1.36 | % | | | 1.40 | % | |
Ratio of Net Investment Income (Loss)
to Average Net Assets | | | 1.00 | %* | | | 0.65 | % | | | 0.29 | % | | | (0.04 | )% | | | (0.19 | )% | | | (0.08 | )% | |
| Portfolio Turnover Rate | | | 14 | % | | | 21 | % | | | 14 | % | | | 20 | % | | | 32 | % | | | 21 | % | |
* Data has been annualized.
(a) Computed using average shares outstanding throughout the period.
(b) Amount rounds to less than $0.01 per share.
THE OAKMARK FUNDS
68
THE OAKMARK EQUITY AND INCOME FUND
Financial Highlights–Class I
For a share outstanding throughout each period
| | | Period Ended
March 31,
2006
(Unaudited) | | Year Ended
September 30,
2005 | | Year Ended
September 30,
2004 | | Year Ended
September 30,
2003 | | Year Ended
September 30,
2002 | | Year Ended
September 30,
2001 | |
| Net Asset Value, Beginning of Period | | $ | 25.41 | | | $ | 23.12 | | | $ | 20.30 | | | $ | 17.18 | | | $ | 17.45 | | | $ | 16.50 | | |
| Income From Investment Operations: | |
| Net Investment Income | | | 0.19 | (a) | | | 0.31 | | | | 0.15 | | | | 0.17 | | | | 0.33 | (a) | | | 0.08 | | |
Net Gains or Losses on Investments
(both realized and unrealized) | | | 0.42 | | | | 2.77 | | | | 2.81 | | | | 3.19 | | | | (0.40 | ) | | | 2.11 | | |
| Total From Investment Operations: | | | 0.61 | | | | 3.08 | | | | 2.96 | | | | 3.36 | | | | (0.07 | ) | | | 2.19 | | |
| Less Distributions: | |
| Dividends (from net investment income) | | | (0.34 | ) | | | (0.20 | ) | | | (0.14 | ) | | | (0.24 | ) | | | (0.16 | ) | | | (0.24 | ) | |
| Distributions (from capital gains) | | | (0.20 | ) | | | (0.59 | ) | | | 0.00 | | | | 0.00 | | | | (0.04 | ) | | | (1.00 | ) | |
| Total Distributions | | | (0.54 | ) | | | (0.79 | ) | | | (0.14 | ) | | | (0.24 | ) | | | (0.20 | ) | | | (1.24 | ) | |
| Redemption Fee per share | | | 0.00 | (b) | | | 0.00 | (b) | | | 0.00 | (b) | | | — | | | | — | | | | — | | |
| Net Asset Value, End of Period | | $ | 25.48 | | | $ | 25.41 | | | $ | 23.12 | | | $ | 20.30 | | | $ | 17.18 | | | $ | 17.45 | | |
| Total Return | | | 2.45 | % | | | 13.65 | % | | | 14.64 | % | | | 19.75 | % | | | (0.47 | )% | | | 14.40 | % | |
| Ratios/Supplemental Data: | |
| Net Assets, End of Period ($million) | | $ | 9,801.1 | | | $ | 9,223.2 | | | $ | 7,577.9 | | | $ | 4,138.0 | | | $ | 2,241.9 | | | $ | 620.1 | | |
| Ratio of Expenses to Average Net Assets | | | 0.87 | %* | | | 0.89 | %** | | | 0.92 | % | | | 0.93 | % | | | 0.96 | % | | | 0.98 | % | |
| Ratio of Net Investment Income to Average Net Assets | | | 1.54 | %* | | | 1.36 | % | | | 0.78 | % | | | 1.07 | % | | | 1.71 | % | | | 2.07 | % | |
| Portfolio Turnover Rate | | | 31 | % | | | 112 | % | | | 72 | % | | | 48 | % | | | 73 | % | | | 124 | % | |
Financial Highlights–Class II
For a share outstanding throughout each period
| | | Period Ended
March 31,
2006
(Unaudited) | | Year Ended
September 30,
2005 | | Year Ended
September 30,
2004 | | Year Ended
September 30,
2003 | | Year Ended
September 30,
2002 | | Year Ended
September 30,
2001 | |
| Net Asset Value, Beginning of Period | | $ | 25.29 | | | $ | 23.03 | | | $ | 20.24 | | | $ | 17.15 | | | $ | 17.40 | | | $ | 16.49 | | |
| Income From Investment Operations: | |
| Net Investment Income | | | 0.14 | (a) | | | 0.28 | | | | 0.11 | | | | 0.16 | | | | 0.30 | (a) | | | 0.07 | | |
Net Gains or Losses on Investments
(both realized and unrealized) | | | 0.44 | | | | 2.72 | | | | 2.79 | | | | 3.15 | | | | (0.40 | ) | | | 2.08 | | |
| Total From Investment Operations: | | | 0.58 | | | | 3.00 | | | | 2.90 | | | | 3.31 | | | | (0.10 | ) | | | 2.15 | | |
| Less Distributions: | |
| Dividends (from net investment income) | | | (0.28 | ) | | | (0.15 | ) | | | (0.11 | ) | | | (0.22 | ) | | | (0.11 | ) | | | (0.24 | ) | |
| Distributions (from capital gains) | | | (0.20 | ) | | | (0.59 | ) | | | 0.00 | | | | 0.00 | | | | (0.04 | ) | | | (1.00 | ) | |
| Total Distributions | | | (0.48 | ) | | | (0.74 | ) | | | (0.11 | ) | | | (0.22 | ) | | | (0.15 | ) | | | (1.24 | ) | |
| Net Asset Value, End of Period | | $ | 25.39 | | | $ | 25.29 | | | $ | 23.03 | | | $ | 20.24 | | | $ | 17.15 | | | $ | 17.40 | | |
| Total Return | | | 2.32 | % | | | 13.34 | % | | | 14.36 | % | | | 19.46 | % | | | (0.60 | )% | | | 14.07 | % | |
| Ratios/Supplemental Data: | |
| Net Assets, End of Period ($million) | | $ | 603.9 | | | $ | 582.0 | | | $ | 478.7 | | | $ | 246.6 | | | $ | 118.7 | | | $ | 3.3 | | |
| Ratio of Expenses to Average Net Assets | | | 1.16 | %* | | | 1.14 | %** | | | 1.17 | % | | | 1.17 | % | | | 1.20 | % | | | 1.23 | % | |
| Ratio of Net Investment Income to Average Net Assets | | | 1.25 | %* | | | 1.11 | % | | | 0.53 | % | | | 0.84 | % | | | 1.50 | % | | | 1.95 | % | |
| Portfolio Turnover Rate | | | 31 | % | | | 112 | % | | | 72 | % | | | 48 | % | | | 73 | % | | | 124 | % | |
* Data has been annualized.
** The ratio excludes expense offset arrangements.
(a) Computed using average shares outstanding throughout the period.
(b) Amount rounds to less than $0.01 per share.
See accompanying notes to financial statements.
THE OAKMARK FUNDS
69
THE OAKMARK GLOBAL FUND
Financial Highlights–Class I
For a share outstanding throughout each period
| | | Period Ended
March 31,
2006
(Unaudited) | | Year Ended
September 30,
2005 | | Year Ended
September 30,
2004 | | Year Ended
September 30,
2003 | | Year Ended
September 30,
2002 | | Year Ended
September 30,
2001 | |
| Net Asset Value, Beginning of Period | | $ | 23.91 | | | $ | 19.73 | | | $ | 16.98 | | | $ | 11.30 | | | $ | 10.83 | | | $ | 10.91 | | |
| Income From Investment Operations: | |
| Net Investment Income | | | 0.03 | (a) | | | 0.17 | | | | 0.09 | | | | 0.01 | | | | 0.00 | (a)(b) | | | 0.03 | | |
Net Gains or Losses on Investments
(both realized and unrealized) | | | 2.37 | | | | 4.48 | | | | 2.71 | | | | 5.67 | | | | 0.76 | (c) | | | 0.12 | | |
| Total From Investment Operations: | | | 2.40 | | | | 4.65 | | | | 2.80 | | | | 5.68 | | | | 0.76 | | | | 0.15 | | |
| Less Distributions: | |
| Dividends (from net investment income) | | | (0.26 | ) | | | (0.10 | ) | | | 0.00 | (b) | | | 0.00 | | | | 0.00 | | | | (0.17 | ) | |
| Distributions (from capital gains) | | | (0.97 | ) | | | (0.37 | ) | | | (0.05 | ) | | | 0.00 | | | | (0.29 | ) | | | (0.06 | ) | |
| Total Distributions | | | (1.23 | ) | | | (0.47 | ) | | | (0.05 | ) | | | 0.00 | | | | (0.29 | ) | | | (0.23 | ) | |
| Redemption Fee per share | | | 0.00 | (b) | | | 0.00 | (b) | | | 0.00 | (b) | | | 0.00 | | | | 0.00 | | | | 0.00 | | |
| Net Asset Value, End of Period | | $ | 25.08 | | | $ | 23.91 | | | $ | 19.73 | | | $ | 16.98 | | | $ | 11.30 | | | $ | 10.83 | | |
| Total Return | | | 10.37 | % | | | 23.88 | % | | | 16.54 | % | | | 50.27 | % | | | 6.84 | % | | | 1.37 | % | |
| Ratios/Supplemental Data: | |
| Net Assets, End of Period ($million) | | $ | 2,146.2 | | | $ | 1,842.9 | | | $ | 1,336.3 | | | $ | 704.8 | | | $ | 175.6 | | | $ | 48.2 | | |
| Ratio of Expenses to Average Net Assets | | | 1.19 | %* | | | 1.20 | %** | | | 1.26 | % | | | 1.28 | % | | | 1.55 | % | | | 1.75 | %(e) | |
Ratio of Net Investment Income (Loss)
to Average Net Assets | | | 0.26 | %* | | | 0.81 | % | | | 0.47 | % | | | 0.00 | %(d) | | | (0.01 | )% | | | 0.00 | (e) | |
| Portfolio Turnover Rate | | | 24 | % | | | 17 | % | | | 16 | % | | | 42 | % | | | 86 | % | | | 114 | % | |
* Data has been annualized.
** The ratio excludes expense offset arrangement.
(a) Computed using average shares outstanding throughout the period.
(b) Amount rounds to less than $0.01 per share.
(c) The amount shown for a share outstanding does not correspond with the aggregate net realized and unrealized gain/loss for the period due to the timing of purchases and redemptions of Fund shares in relation to the fluctuating net asset value per share of the class.
(d) Amount rounds to less than 0.01%.
(e) If the Fund had paid all of its expenses and there had been no expense reimbursement by the Adviser, ratios would have been as follows:
| | | September 30,
2001 | |
| Ratio of Expenses to Average Net Assets | | | 1.80 | % | |
| Ratio of Net Income (Loss) to Average Net Assets | | | (0.05 | )% | |
THE OAKMARK FUNDS
70
THE OAKMARK GLOBAL FUND
Financial Highlights–Class II
For a share outstanding throughout each period
| | | Period Ended
March 31,
2006
(Unaudited) | | Year Ended
September 30,
2005 | | Year Ended
September 30,
2004 | | Year Ended
September 30,
2003 | | October 10, 2001
through
September 30,
2002(a) | |
| Net Asset Value, Beginning of Period | | $ | 23.63 | | | $ | 19.53 | | | $ | 16.84 | | | $ | 11.24 | | | $ | 11.25 | | |
| Income From Investment Operations: | |
| Net Investment Income (Loss) | | | (0.01 | )(b) | | | 0.11 | | | | 0.05 | | | | 0.02 | | | | (0.03 | ) | |
| Net Gains or Losses on Investments (both realized and unrealized) | | | 2.34 | | | | 4.43 | | | | 2.69 | | | | 5.58 | | | | 0.31 | (c) | |
| Total From Investment Operations: | | | 2.33 | | | | 4.54 | | | | 2.74 | | | | 5.60 | | | | 0.28 | | |
| Less Distributions: | |
| Dividends (from net investment income) | | | (0.22 | ) | | | (0.07 | ) | | | 0.00 | | | | 0.00 | | | | 0.00 | | |
| Distributions (from capital gains) | | | (0.97 | ) | | | (0.37 | ) | | | (0.05 | ) | | | 0.00 | | | | (0.29 | ) | |
| Total Distributions | | | (1.19 | ) | | | (0.44 | ) | | | (0.05 | ) | | | 0.00 | | | | (0.29 | ) | |
| Net Asset Value, End of Period | | $ | 24.77 | | | $ | 23.63 | | | $ | 19.53 | | | $ | 16.84 | | | $ | 11.24 | | |
| Total Return | | | 10.16 | % | | | 23.53 | % | | | 16.32 | % | | | 49.82 | % | | | 2.31 | % | |
| Ratios/Supplemental Data: | |
| Net Assets, End of Period ($million) | | $ | 71.1 | | | $ | 58.6 | | | $ | 24.7 | | | $ | 5.8 | | | $ | 0.6 | | |
| Ratio of Expenses to Average Net Assets | | | 1.55 | %* | | | 1.45 | %** | | | 1.50 | % | | | 1.46 | % | | | 1.86 | %* | |
| Ratio of Net Investment Income (Loss) to Average Net Assets | | | (0.10 | )%* | | | 0.63 | % | | | 0.37 | % | | | (0.01 | )% | | | (0.26 | )%* | |
| Portfolio Turnover Rate | | | 24 | % | | | 17 | % | | | 16 | % | | | 42 | % | | | 86 | % | |
* Data has been annualized.
** The ratio excludes expense offset arrangement.
(a) The date on which Class II shares were first offered for sale to the public was October 10, 2001.
(b) Computed using average shares outstanding throughout the period.
(c) The amount shown for a share outstanding does not correspond with the aggregate net realized and unrealized gain/loss for the period due to the timing of purchases and redemptions of Fund shares in relation to the fluctuating net asset value per share of the class.
See accompanying notes to financial statements.
THE OAKMARK FUNDS
71
THE OAKMARK INTERNATIONAL FUND
Financial Highlights–Class I
For a share outstanding throughout each period
| | | Period Ended
March 31,
2006
(Unaudited) | | Year Ended
September 30,
2005 | | Year Ended
September 30,
2004 | | Year Ended
September 30,
2003 | | Year Ended
September 30,
2002 | | Year Ended
September 30,
2001 | |
| Net Asset Value, Beginning of Period | | $ | 23.52 | | | $ | 18.98 | | | $ | 15.67 | | | $ | 12.17 | | | $ | 12.51 | | | $ | 15.40 | | |
| Income From Investment Operations: | |
| Net Investment Income | | | 0.08 | (a) | | | 0.27 | | | | 0.24 | | | | 0.11 | | | | 0.14 | | | | 0.20 | | |
Net Gains or Losses on Investments
(both realized and unrealized) | | | 2.80 | | | | 4.59 | | | | 3.18 | | | | 3.52 | | | | (0.31 | ) | | | (2.07 | ) | |
| Total From Investment Operations: | | | 2.88 | | | | 4.86 | | | | 3.42 | | | | 3.63 | | | | (0.17 | ) | | | (1.87 | ) | |
| Less Distributions: | |
| Dividends (from net investment income) | | | (0.59 | ) | | | (0.27 | ) | | | (0.11 | ) | | | (0.13 | ) | | | (0.17 | ) | | | (0.51 | ) | |
| Distributions (from capital gains) | | | (1.00 | ) | | | (0.05 | ) | | | 0.00 | | | | 0.00 | | | | 0.00 | | | | (0.51 | ) | |
| Total Distributions | | | (1.59 | ) | | | (0.32 | ) | | | (0.11 | ) | | | (0.13 | ) | | | (0.17 | ) | | | (1.02 | ) | |
| Redemption Fee per share | | | 0.00 | (b) | | | 0.00 | (b) | | | 0.00 | (b) | | | 0.00 | | | | 0.00 | | | | 0.00 | | |
| Net Asset Value, End of Period | | $ | 24.81 | | | $ | 23.52 | | | $ | 18.98 | | | $ | 15.67 | | | $ | 12.17 | | | $ | 12.51 | | |
| Total Return | | | 12.95 | % | | | 25.85 | % | | | 21.92 | % | | | 29.97 | % | | | (1.53 | )% | | | (13.10 | )% | |
| Ratios/Supplemental Data: | |
| Net Assets, End of Period ($million) | | $ | 6,573.6 | | | $ | 5,627.4 | | | $ | 4,036.9 | | | $ | 2,676.6 | | | $ | 1,393.8 | | | $ | 738.5 | | |
| Ratio of Expenses to Average Net Assets | | | 1.09 | %* | | | 1.11 | %** | | | 1.20 | % | | | 1.25 | % | | | 1.31 | % | | | 1.30 | % | |
| Ratio of Net Investment Income to Average Net Assets | | | 0.70 | %* | | | 1.32 | % | | | 1.40 | % | | | 1.03 | % | | | 1.34 | % | | | 1.40 | % | |
| Portfolio Turnover Rate | | | 19 | % | | | 14 | % | | | 21 | % | | | 34 | % | | | 24 | % | | | 58 | % | |
Financial Highlights–Class II
For a share outstanding throughout each period
| | | Period Ended
March 31,
2006
(Unaudited) | | Year Ended
September 30,
2005 | | Year Ended
September 30,
2004 | | Year Ended
September 30,
2003 | | Year Ended
September 30,
2002 | | Year Ended
September 30,
2001 | |
| Net Asset Value, Beginning of Period | | $ | 23.36 | | | $ | 18.86 | | | $ | 15.58 | | | $ | 12.13 | | | $ | 12.47 | | | $ | 15.37 | | |
| Income From Investment Operations: | |
| Net Investment Income | | | 0.04 | (a) | | | 0.22 | | | | 0.18 | | | | 0.08 | | | | 0.15 | | | | 0.17 | | |
Net Gains or Losses on Investments
(both realized and unrealized) | | | 2.79 | | | | 4.55 | | | | 3.16 | | | | 3.48 | | | | (0.37 | ) | | | (2.10 | ) | |
| Total From Investment Operations: | | | 2.83 | | | | 4.77 | | | | 3.34 | | | | 3.56 | | | | (0.22 | ) | | | (1.93 | ) | |
| Less Distributions: | |
| Dividends (from net investment income) | | | (0.54 | ) | | | (0.22 | ) | | | (0.06 | ) | | | (0.11 | ) | | | (0.12 | ) | | | (0.49 | ) | |
| Distributions (from capital gains) | | | (1.00 | ) | | | (0.05 | ) | | | 0.00 | | | | 0.00 | | | | 0.00 | | | | (0.48 | ) | |
| Total Distributions | | | (1.54 | ) | | | (0.27 | ) | | | (0.06 | ) | | | (0.11 | ) | | | (0.12 | ) | | | (0.97 | ) | |
| Net Asset Value, End of Period | | $ | 24.65 | | | $ | 23.36 | | | $ | 18.86 | | | $ | 15.58 | | | $ | 12.13 | | | $ | 12.47 | | |
| Total Return | | | 12.74 | % | | | 25.50 | % | | | 21.52 | % | | | 29.52 | % | | | (1.76 | )% | | | (13.44 | )% | |
| Ratios/Supplemental Data: | |
| Net Assets, End of Period ($million) | | $ | 441.5 | | | $ | 362.9 | | | $ | 259.2 | | | $ | 123.2 | | | $ | 48.5 | | | $ | 1.9 | | |
| Ratio of Expenses to Average Net Assets | | | 1.44 | %* | | | 1.38 | %** | | | 1.53 | % | | | 1.67 | % | | | 1.58 | % | | | 1.64 | % | |
| Ratio of Net Investment Income to Average Net Assets | | | 0.36 | %* | | | 1.08 | % | | | 1.18 | % | | | 0.69 | % | | | 1.33 | % | | | 0.62 | % | |
| Portfolio Turnover Rate | | | 19 | % | | | 14 | % | | | 21 | % | | | 34 | % | | | 24 | % | | | 58 | % | |
* Data has been annualized.
** The ratio excludes expense offset arrangement.
(a) Computed using average shares outstanding throughout the period.
(b) Amount rounds to less than $0.01 per share.
THE OAKMARK FUNDS
72
THE OAKMARK INTERNATIONAL SMALL CAP FUND
Financial Highlights–Class I
For a share outstanding throughout each period
| | | Period Ended
March 31,
2006
(Unaudited) | | Year Ended
September 30,
2005 | | Year Ended
September 30,
2004 | | Year Ended
September 30,
2003 | | Year Ended
September 30,
2002 | | Year Ended
September 30,
2001 | |
| Net Asset Value, Beginning of Period | | $ | 22.79 | | | $ | 18.26 | | | $ | 13.74 | | | $ | 10.17 | | | $ | 10.00 | | | $ | 11.51 | | |
| Income From Investment Operations: | |
| Net Investment Income | | | 0.17 | (a) | | | 0.20 | | | | 0.11 | | | | 0.11 | | | | 0.11 | | | | 0.13 | | |
Net Gains or Losses on Investments
(both realized and unrealized) | | | 3.63 | | | | 4.98 | | | | 4.52 | | | | 3.82 | | | | 0.36 | (c) | | | (0.81 | ) | |
| Total From Investment Operations: | | | 3.80 | | | | 5.18 | | | | 4.63 | | | | 3.93 | | | | 0.47 | | | | (0.68 | ) | |
| Less Distributions: | |
| Dividends (from net investment income) | | | (0.70 | ) | | | (0.27 | ) | | | (0.12 | ) | | | (0.09 | ) | | | (0.16 | ) | | | (0.34 | ) | |
| Distributions (from capital gains) | | | (3.54 | ) | | | (0.38 | ) | | | 0.00 | | | | (0.27 | ) | | | (0.14 | ) | | | (0.49 | ) | |
| Total Distributions | | | (4.24 | ) | | | (0.65 | ) | | | (0.12 | ) | | | (0.36 | ) | | | (0.30 | ) | | | (0.83 | ) | |
| Redemption Fee per share | | | 0.00 | (b) | | | 0.00 | (b) | | | 0.01 | | | | 0.00 | | | | 0.00 | | | | 0.00 | | |
| Net Asset Value, End of Period | | $ | 22.35 | | | $ | 22.79 | | | $ | 18.26 | | | $ | 13.74 | | | $ | 10.17 | | | $ | 10.00 | | |
| Total Return | | | 19.22 | % | | | 29.04 | % | | | 33.94 | % | | | 39.78 | % | | | 4.68 | % | | | (6.18 | )% | |
| Ratios/Supplemental Data: | |
| Net Assets, End of Period ($million) | | $ | 1,198.7 | | | $ | 1,007.2 | | | $ | 734.1 | | | $ | 477.8 | | | $ | 357.7 | | | $ | 118.9 | | |
| Ratio of Expenses to Average Net Assets | | | 1.38 | %* | | | 1.41 | %** | | | 1.49 | % | | | 1.57 | % | | | 1.64 | % | | | 1.74 | % | |
| Ratio of Net Investment Income to Average Net Assets | | | 1.66 | %* | | | 0.96 | % | | | 0.72 | % | | | 0.99 | % | | | 1.28 | % | | | 1.83 | % | |
| Portfolio Turnover Rate | | | 22 | % | | | 47 | % | | | 29 | % | | | 30 | % | | | 42 | % | | | 49 | % | |
Financial Highlights–Class II
For a share outstanding throughout each period
| | | Period Ended
March 31,
2006
(Unaudited) | | Year Ended
September 30,
2005 | | Year Ended
September 30,
2004 | | Year Ended
September 30,
2003 | | Year Ended
September 30,
2002 | | January 8, 2001
through
September 30,
2001(d) | |
| Net Asset Value, Beginning of Period | | $ | 22.77 | | | $ | 18.25 | | | $ | 13.69 | | | $ | 10.14 | | | $ | 9.97 | | | $ | 10.73 | | |
| Income From Investment Operations: | |
| Net Investment Income | | | 0.15 | (a) | | | 0.18 | | | | 0.13 | | | | 0.08 | | | | 0.13 | (a) | | | 0.15 | | |
Net Gains or Losses on Investments
(both realized and unrealized) | | | 3.64 | | | | 4.98 | | | | 4.52 | | | | 3.81 | | | | 0.30 | (c) | | | (0.91 | ) | |
| Total From Investment Operations: | | | 3.79 | | | | 5.16 | | | | 4.65 | | | | 3.89 | | | | 0.43 | | | | (0.76 | ) | |
| Less Distributions: | |
| Dividends (from net investment income) | | | (0.69 | ) | | | (0.26 | ) | | | (0.09 | ) | | | (0.07 | ) | | | (0.12 | ) | | | 0.00 | | |
| Distributions (from capital gains) | | | (3.54 | ) | | | (0.38 | ) | | | 0.00 | | | | (0.27 | ) | | | (0.14 | ) | | | 0.00 | | |
| Total Distributions | | | (4.23 | ) | | | (0.64 | ) | | | (0.09 | ) | | | (0.34 | ) | | | (0.26 | ) | | | 0.00 | | |
| Net Asset Value, End of Period | | $ | 22.33 | | | $ | 22.77 | | | $ | 18.25 | | | $ | 13.69 | | | $ | 10.14 | | | $ | 9.97 | | |
| Total Return | | | 19.15 | % | | | 28.94 | % | | | 34.11 | % | | | 39.39 | % | | | 4.25 | % | | | (7.08 | )% | |
| Ratios/Supplemental Data: | |
| Net Assets, End of Period ($million) | | $ | 0.7 | | | $ | 0.6 | | | $ | 0.5 | | | $ | 0.4 | | | $ | 0.3 | | | $ | 0.0 | | |
| Ratio of Expenses to Average Net Assets | | | 1.46 | %* | | | 1.49 | %** | | | 1.39 | % | | | 1.81 | % | | | 1.87 | % | | | 1.97 | %* | |
| Ratio of Net Investment Income to Average Net Assets | | | 1.57 | %* | | | 0.87 | % | | | 0.75 | % | | | 0.72 | % | | | 1.06 | % | | | 1.76 | %* | |
| Portfolio Turnover Rate | | | 22 | % | | | 47 | % | | | 29 | % | | | 30 | % | | | 42 | % | | | 49 | % | |
* Data has been annualized.
** The ratio excludes expense offset arrangement.
(a) Computed using average shares outstanding throughout the period.
(b) Amount rounds to less than .01 per share.
(c) The amount shown for a share outstanding does not correspond with the aggregate net realized and unrealized gain/loss for the period due to the timing of purchases and redemption of Fund shares in relation to the fluctuating net asset value per share of the class.
(d) The date on which Class II Shares were first sold to the public was January 8, 2001.
See accompanying notes to financial statements.
THE OAKMARK FUNDS
73
This material must be preceded or accompanied by a prospectus. To order a prospectus, which explains management fees and expenses and the special risks of investing in the Funds, visit www.oakmark.com or call 1-800-OAKMARK. Please read the prospectus carefully before investing.
The discussion of investments and investment strategy of the Funds (including current investment themes, the portfolio managers' research and investment process, and portfolio characteristics) represents the investments of the Funds and the views of the portfolio managers and Harris Associates L.P., the Funds' investment adviser, at the time of this report, and are subject to change without notice.
The performance data quoted represents past performance. The above performance for the Fund does not reflect the imposition of a 2% redemption fee on shares held for 90 days or less to deter market timers. If reflected, the fee would reduce the performance quoted. Past performance does not guarantee future results. The investment return and principal value will fluctuate so that an investor's shares, when redeemed, may be worth more or less than their original cost. Current performance may be lower or higher than the performance data quoted. Average annual total return measures annualized change, while total return measures aggregate change. To obtain most recent month-end performance data visit www.oakmark.com.
The performance information for Class I shares of The Oakmark Fund, The Oakmark Select Fund, The Oakmark Equity & Income Fund, The Oakmark Global Fund, The Oakmark International Fund and The Oakmark International Small Cap Fund does not reflect the imposition of a 2% redemption fee on shares held by an investor for 90 days or less. The purpose of this redemption fee is to deter market timers.
Investing in value stocks presents the risk that value stocks may fall out of favor with investors and underperform growth stocks during given periods.
Because The Oakmark Select Fund is non-diversified, the performance of each holding will have a greater impact on the Fund's total return, and may make the Fund's returns more volatile than a more diversified fund.
The Oakmark Equity and Income Fund closed to certain new investors as of 5/7/04.
Equity and Income invests in medium- and lower-quality debt securities that have higher yield potential but present greater investment and credit risk than higher-quality securities, which may result in greater share price volatility. An economic downturn could severely disrupt the market in medium or lower grade debt securities and adversely affect the value of outstanding bonds and the ability of the issuers to repay principal and interest.
The Oakmark Global Fund and The Oakmark International Fund closed to certain new investors as of 12/15/03.
The Oakmark International Small Cap Fund closed to new investors as of 5/10/02.
Investing in foreign securities represents risks which in some way may be greater than in U.S. investments. Those risks include: currency fluctuation; different regulation, accounting standards, trading practices and levels of available information; generally higher transaction costs; and political risks.
The stocks of smaller companies often involve more risk than the stocks of larger companies. Stocks of small companies tend to be more volatile and have a smaller public market than stocks of larger companies. Small companies may have a shorter history of operations than larger companies, may not have as great an ability to raise additional capital and may have a less diversified product line, making them more susceptible to market pressure.
1. Total return includes change in share prices and in each case includes reinvestment of any dividends and capital gain distributions.
2. Portfolio holdings are subject to change without notice and are not intended as recommendations of individual stocks.
3. On the Ball: Cognitive Reflection and Decision Making, Shane Frederick, Journal of Economic Perspectives, Volume 19, Number 4, Fall 2005, Pages 25-42.
4. The S&P 500 Index is a broad market-weighted average of U.S. blue-chip companies. This index is unmanaged and investors cannot actually make investments in this index.
THE OAKMARK FUNDS
74
5. The Price-Earnings Ratio ("P/E") is the most common measure of the expensiveness of a stock.
6. The Dow Jones Industrial Average is an unmanaged index that includes only 30 big companies. This index is unmanaged and investors cannot actually make investments in this index.
7. The Lipper Large Cap Value Fund Index is an equally weighted index of the largest 30 funds within the large cap value funds investment objective as defined by Lipper Inc. The index is adjusted for the reinvestment of capital gains and income dividends. This index is unmanaged and investors cannot actually make investments in this index.
8. NAV stands for Net Asset Value. NAV is the dollar value of a single mutual fund share, based on the value of the underlying assets of the fund minus its liabilities divided by the number of shares outstanding.
9. EPS refers to Earnings Per Share and is calculated by dividing total earnings by the number of shares outstanding.
10. The S&P MidCap 400 is an unmanaged broad market-weighted index of 400 stocks that are in the next tier down from the S&P 500 and that are chosen for market size, liquidity, and industry group representation. This index is unmanaged and investors cannot actually make investments in this index.
11. The Lipper Mid Cap Value Fund Index measures the performance of the 30 largest U.S. mid-cap value funds tracked by Lipper. This index is unmanaged and investors cannot actually make investments in this index.
12. The Lipper Balanced Fund Index measures the performance of the 30 largest U.S. balanced funds tracked by Lipper. This index is unmanaged and investors cannot actually make investments in this index.
13. Lehman Brothers Government/Corporate Bond Index is a benchmark index made up of the Lehman Brothers Government and Corporate Bond indexes, including U.S. government Treasury and agency securities as well as corporate and Yankee bonds. This index is unmanaged and investors cannot actually make investments in this index.
14. The MSCI World Index is a free float-adjusted market capitalization index that is designed to measure global developed market equity performance. As of December 2003 the MSCI World Index consisted of the following 23 developed market country indices: Australia, Austria, Belgium, Canada, Denmark, Finland, France, Germany, Greece, Hong Kong, Ireland, Italy, Japan, Netherlands, New Zealand, Norway, Portugal, Singapore, Spain, Sweden, Switzerland, the United Kingdom and the United States. This index is unmanaged and investors cannot actually make investments in this index.
15. The Lipper Global Fund Index measures the performance of the 30 largest mutual funds that invest in securities throughout the world. This index is unmanaged and investors cannot actually make investments in this index.
16. The MSCI World Index ex U.S. is a free float-adjusted market capitalization index that is designed to measure global developed market equity performance. As of April 2002 the MSCI World Index consisted of the following 22 developed market country indices: Australia, Austria, Belgium, Canada, Denmark, Finland, France, Germany, Greece, Hong Kong, Ireland, Italy, Japan, Netherlands, New Zealand, Norway, Portugal, Singapore, Spain, Sweden, Switzerland, and the United Kingdom. This index is unmanaged and investors cannot actually make investments in this index.
17. The MSCI EAFE Index (Europe, Australasia, Far East) is a free float-adjusted market capitalization index that is designed to measure developed market equity performance, excluding the US & Canada. As of December 2003 the MSCI EAFE Index consisted of the following 21 developed market country indices: Australia, Austria, Belgium, Denmark, Finland, France, Germany, Greece, Hong Kong, Ireland, Italy, Japan, the Netherlands, New Zealand, Norway, Portugal, Singapore, Spain, Sweden, Switzerland and the United Kingdom. This index is unmanaged and investors cannot actually make investments in this index.
18. The Lipper International Fund Index reflects the net asset value weighted total return of the 30 largest international equity funds. This index is unmanaged and investors cannot actually make investments in this index.
19. The MSCI World ex U.S. Small Cap Index is the small cap component of the MSCI World ex U.S. Standard Index. Securities selected represent 40% of the small cap asset class in each developed market on a capitalization-weighted basis. This index is unmanaged and investors cannot actually make an investment in this index.
20. The Lipper International Small Cap Funds Index measures the performance of the 10 largest international small-cap funds tracked by Lipper. This index is unmanaged and investors cannot actually make investments in this index.
THE OAKMARK FUNDS
75
DISCLOSURE REGARDING THE BOARD OF TRUSTEES' APPROVAL OF THE INVESTMENT ADVISORY CONTRACT FOR EACH OF THE OAKMARK FUNDS
Each year, the Board of Trustees of the Oakmark Funds (the "Board"), including a majority of the independent Trustees, is required to determine whether to continue each Fund's investment advisory agreement (the "Agreements"). The Investment Company Act of 1940, as amended (the "1940 Act"), requires that the Board request and evaluate, and that the Funds' adviser (the "Adviser") provide, such information as may be reasonably necessary to evaluate the terms of the Agreements. The Board requests and receives a broad range of materials and information throughout the year and in connection with its annual review of the Agreements relating to the nature, extent and quality of the services provided by the Adviser to the Funds including investment performance, portfolio trading practices and shareholder services. In addition, the Board retains an independent consultant to prepare performance and expense reports for each Fund and comparable funds.
The Board's committee on management contracts (the "Committee") leads the Board in its evaluation of the Agreements. The Committee is comprised entirely of trustees who are not "interested persons" of the Funds as defined in the 1940 Act ("Independent Trustees"), and over seventy-five percent of the Board is comprised of Independent Trustees. During the last year, the Committee and the Board met numerous times to consider the Agreements. At each of those meetings, the Committee and the Board were advised by, and met in executive session with, experienced independent legal counsel.
Matters considered by the Committee and the Board in connection with their consideration of the Agreements included, among other things, the following: (i) the nature, quality and extent of the Adviser's services, (ii) the investment performance of each Fund as well as comparative performance information, (iii) the fees and other expenses paid by each Fund as well as comparative expense information, (iv) the profitability of the Adviser from its relationship with each Fund, (v) whether economies of scale may be realized as each Fund grows and whether fee levels share with Fund investors economies of scale, and (vi) other benefits to the Adviser from its relationship with the Funds.
At a meeting held on October 26, 2005, the Board, including a majority of the Independent Trustees, upon recommendation of the Committee, determined that the continuation of each Agreement was in the best interest of each Fund and its shareholders, and approved the continuation of the Agreements through October 31, 2006. Outlined below is a summary of the principal information considered by the Board as well as the Board's conclusions. In their deliberations, the Independent Trustees did not identify any single factor that was paramount or dispositive, and each Independent Trustee may have weighed the information differently.
1. Nature, Extent and Quality of Services
The Board's analysis of the nature, extent and quality of the Adviser's services to the Funds took into account the knowledge gained from the Board's meetings with the Adviser throughout the prior year. In addition, the Board considered the Adviser's long-term history of care and conscientiousness in the management of the Funds; consistency in investment approach; the background and experience of the Adviser's investment personnel responsible for managing the Funds; the Adviser's performance as administrator of the Funds, including, among other things, in the areas of brokerage selection, trade execution, compliance and shareholder communications; and frequent favorable recognition of the Adviser and the Funds in the media and in industry publications. The Board also reviewed the Adviser's resources and key personnel involved in providing investment management services to the Funds, including the time that investment personnel devote to each Fund and the investment results produced by the Adviser's in-house research. The Board also acknowledged the Adviser's decision to partially close a number of its investment strategies and the Board's actions, at the recommendation of the Adviser, to close or partially close a majority of the Funds to help control the pace of growth. The Board also noted the significant personal investments that the Adviser's personnel have made in the Funds, which further aligns the interests of the Adviser and its personnel with those of the Funds' shareholders. The Board concluded that the
THE OAKMARK FUNDS
76
nature, extent and quality of the services provided by the Adviser to each Fund were appropriate and that each Fund was likely to continue to benefit from services provided under its Agreement with the Adviser.
2. Investment Performance of the Funds
The Board considered the investment performance of each Fund over various periods of time, including comparative information provided by its consultant, Lipper Inc. ("Lipper"), an independent data service provider. Lipper was retained by the Board to prepare a study comparing each Fund's performance and expenses with those of comparable funds selected by Lipper (the "Performance Universe").
In addition to comparing each Fund's performance to that of its Performance Universe, the Board also considered the performance of the Funds versus that of their respective benchmarks and other comparative data provided by Lipper, including each Fund's total return and performance relative to risk. After considering all of the information, the Board concluded that the Adviser was delivering favorable performance for the Funds' investors consistent with the long-term investment strategies being pursued by the Funds and that the Funds and their shareholders were benefiting from the Adviser's investment management of each Fund.
3. Costs of Services Provided and Profits Realized by the Adviser
Using information provided by Lipper, the Board evaluated each Fund's advisory fee compared to the advisory fee for other mutual funds similar in size, character and investment strategy ("Expense Group"), and each fund's expense ratio after waivers compared to the expense ratio of the Expense Group.
The Board also reviewed the Adviser's advisory fees for its institutional separate accounts and for its subadvised funds (for which the Adviser provides portfolio management services only). The Board noted that, although in most instances, the fees paid by those clients generally were lower than the rates of fees paid by the Funds, the differences reflected the Adviser's significantly greater level of responsibilities and broader scope of services regarding the Funds, and the more extensive regulatory obligations and risks associated with managing the Funds.
The Board also considered the Adviser's costs in serving as the Fund's investment adviser and manager, including costs associated with technology, infrastructure and compliance necessary to manage the Funds. The Board reviewed the Adviser's methodology for allocating costs among the Adviser's lines of business. The Board noted that the magnitude of costs and risks borne by the Adviser in rendering services to the Funds is increasing. The Board also considered information regarding the structure of the Adviser's compensation program for portfolio managers, analysts and certain other employees and the relationship of such compensation to the attraction and retention of quality personnel. The Board noted that the Adviser has voluntarily limited the growth of assets to protect investment performance by partially closing a majority of the Funds as well as a number of its institutional investment strategies. Finally, the Board considered the Advis er's profitability analysis as well as an Investment Management Profitability Analysis prepared by Lipper. The Board noted the pre-tax profits realized by the Adviser and its affiliates from their relationship with each Fund, as well as the financial condition of the Adviser.
The Board concluded that the management fees paid by each Fund to the Adviser were reasonable in light of the services provided and that the total expenses of each Fund, including the management fees, as a percent of net assets were lower than or near the median of those of comparable funds. The Board also concluded that the profitability of the Adviser's relationship with the Funds appeared to be reasonable in relation to the services performed.
4. Economies of Scale and Fee Levels Reflecting Those Economies
The Board considered the extent to which each Fund's management fee reflected economies of scale for the benefit of Fund shareholders. The Board reviewed each Fund's Agreement, which includes breakpoints that decrease the management fee rate as a Fund's assets increase. The Board also considered that in 2003 and 2004, the Board and the Adviser negotiated additional breakpoints in the Agreement for each of the Funds. The Board concluded that each Fund's Agreement allows shareholders to benefit from growth in Fund assets.
THE OAKMARK FUNDS
77
5. Other Benefits Derived from the Relationship with the Funds
The Board also considered other benefits that accrue to the Adviser and its affiliates from their relationship with the Funds. The Board noted that, prior to October 1, 2005, an affiliate of the Adviser had served the Funds as transfer agent and received compensation from the Funds for its services. In addition, the Board noted that another affiliate of the Funds serves as the Funds' distributor, without compensation from the Funds. The Board considered that those services have been provided to the Funds pursuant to written agreements with the affiliates and that the Board evaluated and approved each agreement annually.
The Board also noted that in June 2005 Harris Associates Securities L.P., the Adviser's affiliated broker-dealer, ceased executing brokerage transactions for the Funds. Prior to that time, the Adviser's affiliated broker-dealer had executed a portion of the portfolio brokerage transactions for the Funds and other clients of the Adviser, for which the broker received commissions. The Board concluded, based on its quarterly review of affiliated brokerage and on additional information it received from the Adviser, that the Adviser's use of an affiliated broker to execute portfolio transactions for the Funds was appropriate and consistent with the procedures for affiliated brokerage adopted by the Board and with regulatory requirements.
The Board also considered the Adviser's use of a portion of the commissions paid by the Funds on their portfolio brokerage transactions to obtain research products and services benefiting the Funds and/or other clients of the Adviser and concluded that the Adviser's use of "soft" commission dollars to obtain research products and services was consistent with regulatory requirements. The Board also noted that the Adviser's use of "soft" commission dollars was relatively low compared to many others in the industry and that the Adviser no longer obtains third-party research products or services through the use of "soft" commission dollars.
After full consideration of all material factors including those listed above, the Board, including a majority of the Independent Trustees, concluded that approval of each Fund's Agreement was in the best interests of the Fund and its shareholders.
THE OAKMARK FUNDS
78
THE OAKMARK FUNDS
Investment Philosophy
All Oakmark managers follow a consistent investment philosophy—to invest in companies they believe are trading at a substantial discount to underlying business value. Critical to this philosophy is to invest with management teams who are committed to maximizing the company's business value.
Three key tenets of our
investment philosophy:
1 Buy businesses trading at a significant discount
to our estimate of true business value.
2 Invest in companies expected to grow shareholder value over time.
3 Invest with management teams who think
and act as owners.
Investment Process
We seek to identify undervalued companies through an intensive, in-house research process. This process is not based on macro-economic factors, such as the performance of the economy or the direction of interest rates. Nor is it based on technical factors, such as the performance of the stock market itself. And, while some value managers might use only one summary statistic—such as price-earnings ratio—our investment professionals take a more in-depth approach using a range of valuation measures appropriate for a specific company or industry.
From the universe of thousands of equity securities, our team generates investment ideas through a variety of methods. If a security appears attractive, detailed quantitative and qualitative research follows. This careful process of identifying undervalued stocks results in an "approved list."
The Result: a unified effort aimed at identifying the best values in the marketplace. From the list of
approved stocks, each fund manager constructs a relatively focused portfolio, built on a stock-by-stock basis from the bottom up.
Who Should Invest
Any investor who is seeking a disciplined value manager for the purposes of growing and diversifying a portfolio should consider one of The Oakmark Funds, keeping in mind that all equity investments should be considered long-term investments. As value investors, we recognize that patience is a virtue and believe that, over the long term, investors are rewarded for their patience. We generally hold the companies in which we invest for three to five years, a time horizon that we encourage our shareholders to consider as well.
How to Use Value Funds
in an Overall Portfolio
Investment styles tend to move in cycles. One style may be in favor for a few years while the other is out of favor, and vice versa. Diversifying the stock portion of your portfolio may help reduce overall volatility—and potentially provide more consistent returns over time.
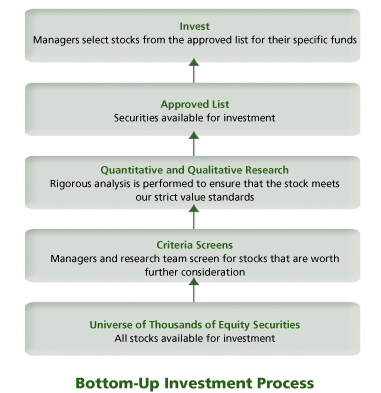
THE OAKMARK FUNDS
79
The Oakmark Glossary
Book value – A company's common stock equity as it appears on a balance sheet, equal to total assets minus liabilities, preferred stock, and intangible assets such as goodwill. A company's book value often differs substantially from economic value, especially in industries such as media.
Business value/Intrinsic value – The perceived or estimated actual value of a security, as opposed to its current market price or book value. Business value can be evaluated based on what a knowledgeable buyer would pay for a business if the company were sold in its entirety.
Growth investing – Investors who look for companies based on whether the stock of a company is growing earnings and/or revenue faster than the industry as a whole or the overall market. Growth investors generally expect high rates of growth to persist, and the stock, in turn, to deliver returns exceeding the market's. A growth mutual fund is generally one that emphasizes stocks believed to offer above-average growth prospects, with little to no emphasis on the stock's current price.
M & A (Mergers & Acquisitions) – Merger: the combining of two or more entities into one, through a purchase acquisition or a pooling of interests. Acquisition: can also be called a takeover, and is defined as acquiring control of a corporation, called a target, by stock purchase or exchange, either hostile or friendly.
Market capitalization (market cap or cap) – The market price of an entire company on any given day, calculated by multiplying the number of shares outstanding by the price per share.
Momentum investing – Approach to investing based on the belief that stock price trends are likely to continue. Momentum investors tend to buy stocks that have been outperforming the market and to sell those stocks when their relative performance deteriorates. Momentum investors do not consider a company's underlying value or fundamentals in their investment decisions.
Multiple – A ratio used to measure a stock's valuation, usually greater than 1. Sometimes used to mean price/earnings ratio.
P/B or Price-to-Book Ratio – A stock's capitalization divided by its book value. The value is the same whether the calculation is done for the whole company or on a per-share basis.
P/E or Price-to-Earnings Ratio – The most common measure of a stock's valuation. It is equal to a stock's capitalization divided by its after-tax earnings over a 12-month period. The value is the same whether the calculation is done for the whole company or on a per-share basis. Equivalently, the cost an investor in a given stock must pay per dollar of current annual earnings. Also called earnings multiple.
Share repurchase – Program through which a corporation buys back its own shares in the open market, typically an indication that the corporation's management believes the stock price is undervalued.
Value investing – Investors who utilize valuation measures such as business value (including growth rate), price/earnings ratio, price/book ratio, and yield to gauge the attractiveness of a company. Managers who employ a value investment style believe that the true, underlying value of a company is not reflected in its current share price, and, over time, the price has potential to increase as the market recognizes the overall value of the business. Value stocks sell at relatively low prices in relation to their underlying business value, earnings, or book value.
Stocks become undervalued for a variety of reasons, including an overall market decline, or when a specific industry falls into disfavor and investors view all companies in that industry in the same light. Consequently, an individual company's stock price may fall, even though it may be only temporarily affected by the industry's problems and its underlying value has remained unchanged.
"x times earnings" ("12 times earnings") – Another way to express a stock's price-to-earnings (P/E) ratio. A stock with a P/E ratio of 12 sells at 12 times earnings.
THE OAKMARK FUNDS
80
THE OAKMARK FUNDS
Trustees and Officers
Trustees
Gary N. Wilner, M.D.—Chairman
Michael J. Friduss
Thomas H. Hayden
Christine M. Maki
John R. Raitt
Allan J. Reich
Marv R. Rotter
Burton W. Ruder
Peter S. Voss
Officers
John R. Raitt—President
Robert M. Levy—Executive Vice President
Henry R. Berghoef—Vice President
Chad M. Clark—Vice President
Kevin G. Grant—Vice President
David G. Herro—Vice President
Clyde S. McGregor—Vice President
William C. Nygren—Vice President
Vineeta D. Raketich—Vice President
Janet L. Reali—Vice President and Secretary
Ann W. Regan—Vice President and Assistant Secretary
Kristi L. Rowsell—Vice President
Edward A. Studzinski—Vice President
Robert A. Taylor—Vice President
Christopher P. Wright—Vice President
John J. Kane—Treasurer
Other Information
Investment Adviser
Harris Associates L.P.
Two North LaSalle Street
Chicago, Illinois 60602-3790
Transfer Agent
Boston Financial Data Services, Inc.
Quincy, Massachusetts
Legal Counsel
Bell, Boyd & Lloyd LLC
Chicago, Illinois
Independent Registered Public
Accounting Firm
Deloitte & Touche LLP
Chicago, Illinois
For More Information
Please call 1-800-OAKMARK
(1-800-625-6275)
or 617-483-3250
Website
www.oakmark.com
To obtain a prospectus, an application or periodic reports, access our web
site at www.oakmark.com, or call 1-800-OAKMARK (1-800-625-6275) or
(617) 483-3250.
The Funds will file its complete schedule of portfolio holdings with the Securities and Exchange Commission ("SEC") for the first and third quarters of each fiscal year on Form N-Q. The Funds' Forms N-Q's are available on the SEC's website at www.sec.gov. The Funds' Forms N-Q may be reviewed and copied at the SEC's Public Reference Room in Washington, DC, and that information on the operation of the Public Reference Room may be obtained by calling 1-800-SEC-0330.
A description of the policies and procedures the Funds use to determine how to vote proxies relating to portfolio securities is available without charge, upon request, by calling toll-free 1-800-625-6275; on the Funds' website at www.oakmark.com; and on the Securities and Exchange Commission's website at www.sec.gov.
No later than August 31 of each year, information regarding how the Adviser, on behalf of the Funds, voted proxies relating to the Funds' portfolio securities for the twelve months ended the preceding June 30 will be available through a link on the Funds' website at www.oakmark.com and on the SEC's website at www.sec.gov.
This report is submitted for the general information of the shareholders of the Funds. The report is not authorized for distribution to prospective investors in the Funds unless it is accompanied or preceded by a currently effective prospectus of the Funds.
No sales charge to the shareholder or to the new investor is made in offering the shares of the Funds, however, a shareholder may incur a 2% redemption fee on an exchange or redemption of Class I shares held for 90 days or less from any Fund.

1-800-OAKMARK
www.oakmark.com
The Oakmark Funds are distributed by Harris Associates Securities L.P., member NASD. Date of first use: May 2006.
THE OAKMARK FUND CLASS II
THE VALUE OF A $10,000 INVESTMENT IN THE OAKMARK FUND FROM ITS
INCEPTION (4/5/01) TO PRESENT (3/31/06) AS COMPARED TO THE
STANDARD & POOR'S 500 INDEX
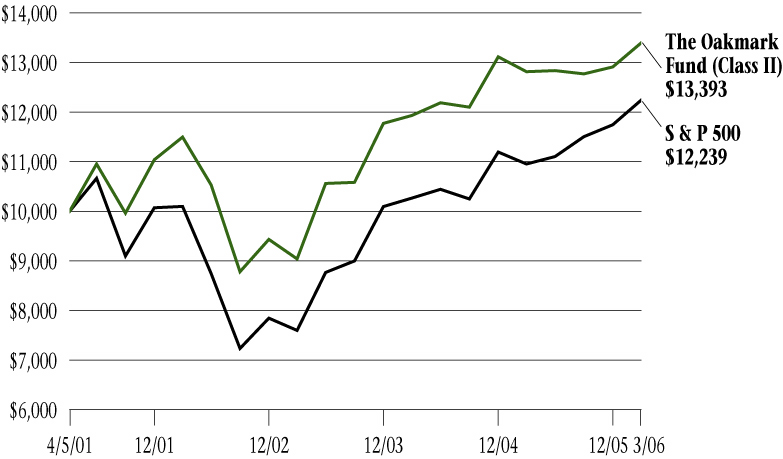
Average Annual Total Returns
(as of 3/31/06)
| | | 1-year | | 5-year | | Since
Inception
(4/5/01) | |
| Oakmark Fund (Class II) | | | 4.50 | % | | | 6.02 | % | | | 6.15 | % | |
| S&P 500 | | | 11.73 | % | | | 3.97 | % | | | 4.13 | % | |
The graph and table do not reflect the deduction of taxes that a shareholder would pay on fund distributions or the redemption of fund shares.
The performance data quoted represents past performance. Past performance does not guarantee future results. The investment return and principal value will fluctuate so that an investor's shares, when redeemed, may be worth more or less than their original cost. Current performance may be lower or higher than the performance data quoted. Average annual total return measures annualized change, while total return measures aggregate change. To obtain most recent month-end performance data, visit www.oakmark.com.
Harris Associates Securities L.P., member NASD, May 2006
THE OAKMARK SELECT FUND CLASS II
THE VALUE OF A $10,000 INVESTMENT IN THE OAKMARK SELECT FUND FROM ITS
INCEPTION (12/31/99) TO PRESENT (3/31/06) AS COMPARED TO THE
STANDARD & POOR'S 500 INDEX
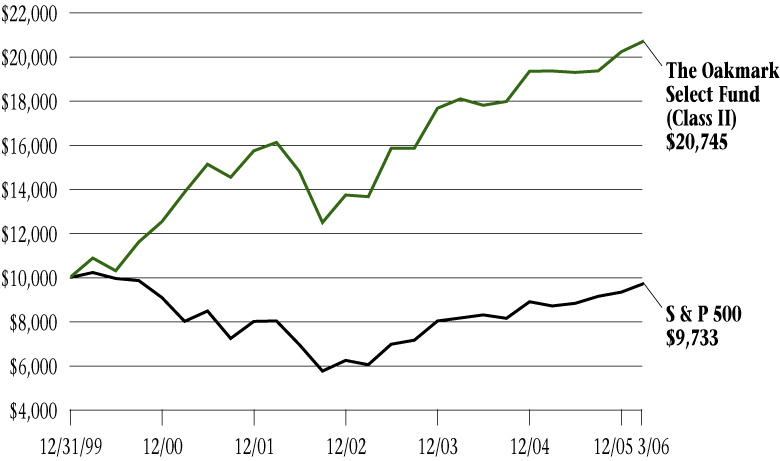
Average Annual Total Returns
(as of 3/31/06)
| | | 1-year | | 5-year | | Since
Inception
(12/31/99) | |
| Oakmark Select Fund (Class II) | | | 7.04 | % | | | 8.37 | % | | | 12.57 | % | |
| S&P 500 | | | 11.73 | % | | | 3.97 | % | | | -0.43 | % | |
The graph and table do not reflect the deduction of taxes that a shareholder would pay on fund distributions or the redemption of fund shares.
The performance data quoted represents past performance. Past performance does not guarantee future results. The investment return and principal value will fluctuate so that an investor's shares, when redeemed, may be worth more or less than their original cost. Current performance may be lower or higher than the performance data quoted. Average annual total return measures annualized change, while total return measures aggregate change. To obtain most recent month-end performance data, visit www.oakmark.com.
Harris Associates Securities L.P., member NASD, May 2006
THE OAKMARK EQUITY AND INCOME FUND CLASS II
THE VALUE OF A $10,000 INVESTMENT IN THE OAKMARK EQUITY AND INCOME
FUND FROM ITS INCEPTION (7/13/00) TO PRESENT (3/31/06) AS COMPARED TO
THE LIPPER BALANCED FUND INDEX

Average Annual Total Returns
(as of 3/31/06)
| | |
1-year | |
5-year | | Since
Inception
(7/13/00) | |
| Oakmark Equity & Income Fund (Class II) | | | 11.20 | % | | | 10.56 | % | | | 12.19 | % | |
| Lipper Balanced Fund Index | | | 10.02 | % | | | 5.25 | % | | | 3.37 | % | |
The graph and table do not reflect the deduction of taxes that a shareholder would pay on fund distributions or the redemption of fund shares.
The performance data quoted represents past performance. Past performance does not guarantee future results. The investment return and principal value will fluctuate so that an investor's shares, when redeemed, may be worth more or less than their original cost. Current performance may be lower or higher than the performance data quoted. Average annual total return measures annualized change, while total return measures aggregate change. To obtain most recent month-end performance data, visit www.oakmark.com.
Harris Associates Securities L.P., member NASD, May 2006
THE OAKMARK GLOBAL FUND CLASS II
THE VALUE OF A $10,000 INVESTMENT IN THE OAKMARK GLOBAL FUND
FROM ITS INCEPTION (10/10/01) TO PRESENT (3/31/06) AS COMPARED TO THE
MSCI WORLD INDEX

Average Annual Total Returns
(as of 3/31/06)
| | | 1-year | | Since
Inception
(10/10/01) | |
| Oakmark Global Fund (Class II) | | | 19.90 | % | | | 22.41 | % | |
| MSCI World | | | 18.02 | % | | | 9.48 | % | |
The graph and table do not reflect the deduction of taxes that a shareholder would pay on fund distributions or the redemption of fund shares.
The performance data quoted represents past performance. Past performance does not guarantee future results. The investment return and principal value will fluctuate so that an investor's shares, when redeemed, may be worth more or less than their original cost. Current performance may be lower or higher than the performance data quoted. Average annual total return measures annualized change, while total return measures aggregate change. To obtain most recent month-end performance data, visit www.oakmark.com.
Harris Associates Securities L.P., member NASD, May 2006
THE OAKMARK INTERNATIONAL FUND CLASS II
THE VALUE OF A $10,000 INVESTMENT IN THE OAKMARK INTERNATIONAL FUND
FROM ITS INCEPTION (11/4/99) TO PRESENT (3/31/06) AS COMPARED TO THE
MSCI WORLD EX U.S. INDEX
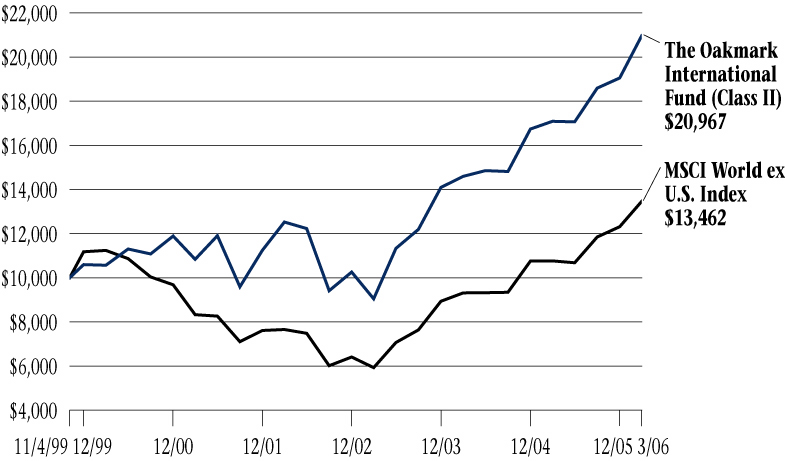
Average Annual Total Returns
(as of 3/31/06)
| | | 1-year | | 5-year | | Since
Inception
(11/4/99) | |
| Oakmark International Fund (Class II) | | | 22.67 | % | | | 14.11 | % | | | 12.44 | % | |
| MSCI World ex U.S. Index | | | 25.06 | % | | | 10.08 | % | | | 4.75 | % | |
The graph and table do not reflect the deduction of taxes that a shareholder would pay on fund distributions or the redemption of fund shares.
The performance data quoted represents past performance. Past performance does not guarantee future results. The investment return and principal value will fluctuate so that an investor's shares, when redeemed, may be worth more or less than their original cost. Current performance may be lower or higher than the performance data quoted. Average annual total return measures annualized change, while total return measures aggregate change. To obtain most recent month-end performance data, visit www.oakmark.com.
Harris Associates Securities L.P., member NASD, May 2006
THE OAKMARK INTERNATIONAL
SMALL CAP FUND CLASS II
THE VALUE OF A $10,000 INVESTMENT IN THE OAKMARK INTERNATIONAL SMALL
CAP FUND FROM ITS INCEPTION (1/8/01) TO PRESENT (3/31/06) AS COMPARED
TO THE MSCI WORLD EX U.S. INDEX
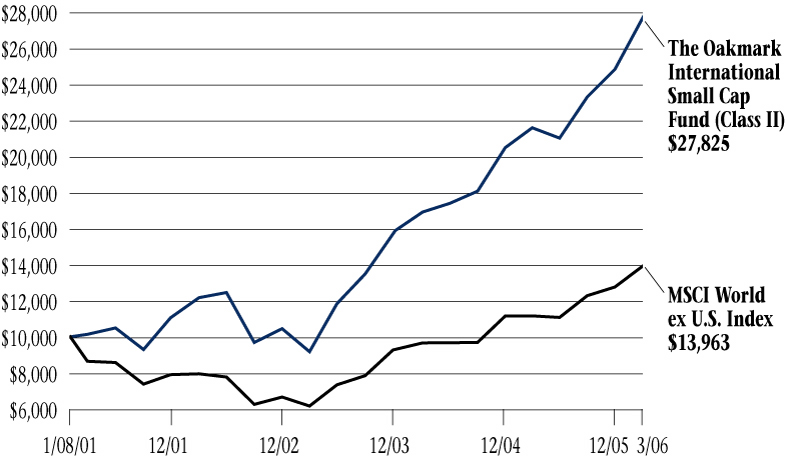
Average Annual Total Returns
(as of 3/31/06)
| | | 1-year | | 5-year | | Since
Inception
(1/8/01) | |
| Oakmark International Small Cap Fund (Class II) | | | 28.58 | % | | | 22.37 | % | | | 22.03 | % | |
| MSCI World ex U.S. Index | | | 25.06 | % | | | 10.08 | % | | | 6.59 | % | |
The graph and table do not reflect the deduction of taxes that a shareholder would pay on fund distributions or the redemption of fund shares.
The performance data quoted represents past performance. Past performance does not guarantee future results. The investment return and principal value will fluctuate so that an investor's shares, when redeemed, may be worth more or less than their original cost. Current performance may be lower or higher than the performance data quoted. Average annual total return measures annualized change, while total return measures aggregate change. To obtain most recent month-end performance data, visit www.oakmark.com.
Harris Associates Securities L.P., member NASD, May 2006
FUND EXPENSES
A shareholder of each Fund incurs two types of costs: (1) transaction costs, such as redemption fees, and (2) ongoing costs, including investment advisory fees, transfer agent fees, and other fund expenses. The examples below are intended to help shareholders understand the ongoing cost (in dollars) of investing in each Fund and to compare these costs with the ongoing costs of investing in other funds.
Actual Expenses
The following table provides information about actual account values and actual fund expenses for Class II of each Fund. The table shows the expenses a Class II shareholder would have paid on a $1,000 investment in each Fund from October 1, 2005, to March 31, 2006, as well as how much a $1,000 investment would be worth at the close of the period, assuming actual fund returns and expenses. A Class II shareholder can estimate expenses incurred for the period by dividing the account value at March 31, 2006, by $1,000 and multiplying the result by the number in the Expenses Paid During the Period row as shown below.
| | | The Oakmark
Fund | | The Oakmark
Select Fund | | The Oakmark
Equity and
Income Fund | | The Oakmark
Global Fund | | The Oakmark
International
Fund | | The Oakmark
International
Small Cap
Fund | |
| Beginning Account Value | | $ | 1,000.00 | | | $ | 1,000.00 | | | $ | 1,000.00 | | | $ | 1,000.00 | | | $ | 1,000.00 | | | $ | 1,000.00 | | |
| Ending Account Value | | $ | 1,048.70 | | | $ | 1,070.10 | | | $ | 1,023.20 | | | $ | 1,101.60 | | | $ | 1,127.40 | | | $ | 1,191.50 | | |
| Expenses Paid During Period* | | $ | 7.00 | | | $ | 6.86 | | | $ | 5.85 | | | $ | 8.12 | | | $ | 7.64 | | | $ | 7.98 | | |
| Annualized Expense Ratio | | | 1.37 | % | | | 1.33 | % | | | 1.16 | % | | | 1.55 | % | | | 1.44 | % | | | 1.46 | % | |
* Expenses are equal to each Fund's annualized expense ratio for Class II, multiplied by the average account value over the period, multiplied by the number of days in the most recent fiscal half-year divided by 365 (to reflect the one-half year period).
Hypothetical Example for Comparison Purposes
The following table provides information about hypothetical account values and hypothetical expenses for Class II of each Fund based on actual expense ratios and an assumed rate of return of 5% per year before expenses, which are not the Funds' actual returns. The hypothetical account values and expenses may not be used to estimate the actual ending account balances or expenses shareholders paid for the period. Shareholders may use this information to compare the ongoing costs of investing in a Fund and other funds. To do so, compare this 5% hypothetical example with the 5% hypothetical examples that appear in the shareholder reports of the other funds.
Please note that the expenses shown in the table are meant to highlight your ongoing costs only and do not reflect any transaction costs, such as redemption fees. Therefore, the third line of the table is useful in comparing ongoing costs only, and will not help you determine the relative total costs of owning different funds. In addition, if these transaction costs were included, the total costs would have been higher.
| | | The Oakmark
Fund | | The Oakmark
Select Fund | | The Oakmark
Equity and
Income Fund | | The Oakmark
Global Fund | | The Oakmark
International
Fund | | The Oakmark
International
Small Cap
Fund | |
| Beginning Account Value | | $ | 1,000.00 | | | $ | 1,000.00 | | | $ | 1,000.00 | | | $ | 1,000.00 | | | $ | 1,000.00 | | | $ | 1,000.00 | | |
| Ending Account Value | | $ | 1,018.10 | | | $ | 1,018.30 | | | $ | 1,019.15 | | | $ | 1,017.20 | | | $ | 1,017.75 | | | $ | 1,017.65 | | |
| Expenses Paid During Period* | | $ | 6.89 | | | $ | 6.69 | | | $ | 5.84 | | | $ | 7.80 | | | $ | 7.24 | | | $ | 7.34 | | |
| Annualized Expense Ratio | | | 1.37 | % | | | 1.33 | % | | | 1.16 | % | | | 1.55 | % | | | 1.44 | % | | | 1.46 | % | |
* Expenses are equal to each Fund's annualized expense ratio for Class II, multiplied by the average account value over the period, multiplied by the number of days in the most recent fiscal half-year divided by 365 (to reflect the one-half year period).
Item 2. Code of Ethics.
Not required in this filing.
Item 3. Audit Committee Financial Expert.
Not required in this filing.
Item 4. Principal Accountant Fees and Services.
Not required in this filing.
Item 5. Audit Committee of Listed Registrants.
Not required in this filing.
Item 6. Schedule of Investments.
The Schedule of Investments in securities of unaffiliated issuers is included as part of the semi-annual report to shareholders filed under Item 1 of this Form.
Item 7. Disclosure of Proxy Voting Policies and Procedures for Closed-End Management Investment Companies.
Not applicable.
Item 8. Portfolio Managers of Closed-End Management Investment Companies.
Not applicable.
Item 9. Purchases of Equity Securities by Closed-End Management Investment Company and Affiliated Purchasers.
Not applicable.
Item 10. Submission of Matters to a Vote of Security Holders.
During the period covered by this report, no amendments were made to the procedures adopted in fiscal year 2005.
Item 11. Controls and Procedures.
(a) Based on an evaluation of the disclosure controls and procedures (as defined in Rule 30a-3(c) under the Investment Company Act of 1940, the “Disclosure Controls”), the Disclosure Controls are effectively designed to ensure that information required to be disclosed by the Registrant in this report is recorded, processed, summarized and reported within 90 days prior to the filing of this report, including ensuring that information required to be disclosed in this report is accumulated and communicated to the Registrant’s management, including the Registrant’s principal executive officer and principal financial officer, as appropriate to allow timely decisions regarding required disclosure.
(b) There were no changes in the Registrant’s internal controls over financial reporting (as defined in Rule 30a-3(d) under the Investment Company Act of 1940) that occurred during the Registrant’s second fiscal quarter of the time period covered by this report that has materially affected, or is reasonably likely to materially affect, the Registrant’s internal control over financial reporting.
Item 12. Exhibits.
(a) | (1) | Not required in this filing. |
| | |
| (2) | Certifications of John R. Raitt, Principal Executive Officer, and Kristi L. Rowsell, Principal Financial Officer, pursuant to Rule 30a-2(a) under the Investment Company Act of 1940 (17 CFR 270.30a-2(a)), attached hereto as Exhibits (a)(2)(i) and (a)(2)(ii). |
| | |
| (3) | Not applicable. |
| | |
(b) | | Certification of John R. Raitt, Principal Executive Officer and Kristi L. Rowsell, Principal Financial Officer, pursuant to Section 906 of the Sarbanes-Oxley Act of 2002, attached hereto as Exhibit (b). |
SIGNATURES
Pursuant to the requirements of the Securities Exchange Act of 1934 and the Investment Company Act of 1940, the Registrant has duly caused this report to be signed on its behalf by the undersigned, thereunto duly authorized.
Harris Associates Investment Trust
By: | /s/ John R. Raitt | |
| John R. Raitt |
| Principal Executive Officer |
Date: | May 15, 2006 | |
Pursuant to the requirements of the Securities Exchange Act of 1934 and the Investment Company Act of 1940, this report has been signed below by the following persons on behalf of the Registrant and in the capacities and on the dates indicated.
By: | /s/ John R. Raitt | |
| John R. Raitt | |
| Principal Executive Officer | |
Date: | May 15, 2006 | |
| | |
| | |
By: | /s/ Kristi L. Rowsell | |
| Kristi L. Rowsell | |
| Principal Financial Officer | |
Date: | May 15, 2006 | |