UNITED STATES
SECURITIES AND EXCHANGE COMMISSION
Washington, D.C. 20549
FORM N-CSR
CERTIFIED SHAREHOLDER REPORT OF REGISTERED
MANAGEMENT INVESTMENT COMPANIES
Investment Company Act file number | 811-06279 |
|
Harris Associates Investment Trust |
(Exact name of registrant as specified in charter) |
|
Two North La Salle Street, Suite 500 Chicago, Illinois | | 60602-3790 |
(Address of principal executive offices) | | (Zip code) |
|
| | | |
John R. Raitt | | Paulita A. Pike |
Harris Associates L.P. | | K&L Gates LLP |
Two North La Salle Street, #500 | | Three First National Plaza, #3100 |
Chicago, Illinois 60602 | | Chicago, Illinois 60602 |
(Name and address of agent for service) |
|
Registrant’s telephone number, including area code: | (312) 621-0600 | |
|
Date of fiscal year end: | 9/30/10 | |
|
Date of reporting period: | 3/31/10 | |
| | | | | |
Item 1. Reports to Shareholders.
SEMI-ANNUAL REPORT
MARCH 31, 2010
oakmark.com

Advised by Harris Associates L.P.
THE OAKMARK FUNDS
2010 Semi-Annual Report
| President's Letter | | | 1 | | |
|
| Summary Information | | | 2 | | |
|
| Fund Expenses | | | 4 | | |
|
| Commentary on Oakmark and Oakmark Select Funds | | | 6 | | |
|
| Oakmark Fund | |
|
| Letter from the Portfolio Managers | | | 8 | | |
|
| Schedule of Investments | | | 9 | | |
|
| Oakmark Select Fund | |
|
| Letter from the Portfolio Managers | | | 13 | | |
|
| Schedule of Investments | | | 14 | | |
|
| Oakmark Equity and Income Fund | |
|
| Letter from the Portfolio Managers | | | 16 | | |
|
| Schedule of Investments | | | 18 | | |
|
| Oakmark Global Fund | |
|
| Letter from the Portfolio Managers | | | 25 | | |
|
| Global Diversification Chart | | | 28 | | |
|
| Schedule of Investments | | | 29 | | |
|
| Oakmark Global Select Fund | |
|
| Letter from the Portfolio Managers | | | 34 | | |
|
| Global Diversification Chart | | | 36 | | |
|
| Schedule of Investments | | | 37 | | |
|
| Oakmark International Fund | |
|
| Letter from the Portfolio Managers | | | 40 | | |
|
| Global Diversification Chart | | | 42 | | |
|
| Schedule of Investments | | | 43 | | |
|
| Oakmark International Small Cap Fund | |
|
| Letter from the Portfolio Manager | | | 49 | | |
|
| Global Diversification Chart | | | 51 | | |
|
| Schedule of Investments | | | 52 | | |
|
| Financial Statements | |
|
| Statements of Assets and Liabilities | | | 60 | | |
|
| Statements of Operations | | | 62 | | |
|
| Statements of Changes in Net Assets | | | 64 | | |
|
| Notes to Financial Statements | | | 71 | | |
|
| Financial Highlights | | | 83 | | |
|
| Disclosure Regarding Investment Advisory Contract Approval | | | 91 | | |
|
| Oakmark Glossary | | | 96 | | |
|
| Trustees and Officers | | | 99 | | |
|
FORWARD-LOOKING STATEMENT DISCLOSURE
One of our most important responsibilities as mutual fund managers is to communicate with shareholders in an open and direct manner. Some of our comments in our letters to shareholders are based on current management expectations and are considered "forward-looking statements". Actual future results, however, may prove to be different from our expectations. You can identify forward-looking statements by words such as "estimate", "may", "will", "expect", "believe", "plan" and other similar terms. We cannot promise future returns. Our opinions are a reflection of our best judgment at the time this report is compiled, and we disclaim any obligation to update or alter forward-looking statements as a result of new information, future events, or otherwise.

IMPORTANT MESSAGE ABOUT
OAKMARK QUARTERLY REPORT MAILINGS
Kindly be advised that we will no longer print and mail our first and third quarter reports. These reports will only be available online at oakmark.com.
If you wish to receive an e-mail each quarter letting you know when the quarterly reports are posted, please visit our website and sign up for e-mail updates.
To sign up, simply enter your e-mail address in the appropriate box on the right-hand side of the home page and click Join.

(This page has been intentionally left blank.)
President's Letter
Dear Fellow Shareholders,
The Oakmark Funds performed well in the first half of fiscal year 2010. Stock markets around the world continued to rise, driven by stronger corporate earnings and the unfolding economic recovery. Each one of the Oakmark Funds significantly grew shareholder capital for the fiscal year-to-date and the most recent quarter, extending the strong long-term record of outperformance for all of our Funds.
Economic Recovery and Market Valuation
The worldwide economic expansion continued to gain momentum in the recent quarter. Signs of economic strength are now wide-spread. International trade is up, and U.S. exports are growing at a rate of more than 25%. Housing price indexes are also improving. Capital markets, which were completely frozen only a year ago, are active again, and issuance of corporate debt, equity and even mortgage-backed securities is robust. Finally, employment, which is typically one of the last areas to recover after a downturn, is now rising around the world. We believe that the U.S and world economies will continue to grow for the foreseeable future, but we admit to being concerned about the growing size of the U.S. budget deficit and its potential long-term impact on interest rates and the health of the U.S. economy.
World stock markets have rebounded strongly from their lows of a year ago. While the valuation gap has narrowed from the extreme levels at the height of the market panic, we believe that stocks are still undervalued. Bonds—and U.S. government bonds in particular—present a different case, however. The Federal Reserve has provided immense amounts of liquidity to the markets over the past two years to support the economy. With the economy steadily regaining its health, the need for aggressive stimulus is receding. In fact, we believe the Fed will ultimately need to tighten monetary policy in order to prevent the economy from overheating and to avoid triggering inflation. The combination of: 1) the massive borrowings needed to fund the growing federal deficit; 2) the typical rebound in corporate and individual borrowings in an economic recovery; and 3) tighter monetary policy suggest to us that interest rates will rise over the next fe w years. Because bond prices fall when interest rates rise, we believe that U.S. government bonds hold significant risk today. Since stocks currently offer healthy dividend yields and will benefit from a stronger economy, we also believe that the typical risk hierarchy has been reversed and that stocks are actually less risky than bonds in today's market.
Many investors decreased their equity holdings after last year's stock market decline, choosing instead the "safety" of bonds. While we see the attraction of safety after the roller coaster ride equity investors have experienced over the last few years, we believe that chasing what has "worked" (high quality bonds) is a mistake. With this in mind, we take the opportunity to remind investors of the value of adopting and adhering to a long-term investment plan, which includes target asset weightings. We believe emotions can often lead investors in the wrong direction, but sticking to a long-term plan can ensure that you maintain your exposure to equities, especially when they are attractively valued, as we believe they are now.
Minding the Details
Investment advisors frequently discuss the power of compound growth and the ability to multiply wealth over long periods of time, even at average rates of return. A corollary to this truth is that small changes in returns can have a very significant impact on long-term wealth accumulation.
Mutual fund returns are a function of both investment returns and fund expenses. While fund expenses are typically small relative to investment returns, higher fund expenses can create a significant drag on results. Thus, while we believe that it is important to choose a fund run by talented investors, it is also important to choose a fund that watches clients' pennies when making investment decisions.
Morningstar, Inc., one of the mutual fund industry's most respected commentators, recently published a study of mutual fund industry trading costs. Granted, this is a complicated subject, and brokerage commissions can vary across funds for many reasons, but the Morningstar study does allow us to draw some broad conclusions. The study found that an average equity mutual fund incurs commission expense (as a percent of average net assets) in the range of 30 basis points (0.30%) annually. At Oakmark, we watch expenses like brokerage commissions closely. Therefore, we are pleased to report that average brokerage commission expense for every one of our Funds was less than half of the 2009 Morningstar peer group average, with several Funds running at substantially less than half of the average. Clearly, our attention to details like trading costs is paying off for our shareholders.
Thank you for your continued investment and confidence in The Oakmark Funds. We welcome your comments and questions. You can reach us via e-mail at ContactOakmark@oakmark.com.
John R. Raitt
President and CEO of The Oakmark Funds
President and CEO of Harris Associates L.P.
March 31, 2010

1
THE OAKMARK FUNDS
Summary Information
Performance for Period
Ended March 31, 20101 | | Oakmark
Fund—Class I
(OAKMX) | | Oakmark
Select Fund—Class I
(OAKLX) | | Oakmark
Equity and Income
Fund—Class I
(OAKBX) | | Oakmark
Global Fund—Class I
(OAKGX) | |
| 3 Months* | | | 6.21 | % | | | 6.34 | % | | | 4.70 | % | | | 6.67 | % | |
| 1 Year | | | 70.07 | % | | | 72.95 | % | | | 33.52 | % | | | 73.29 | % | |
Average Annual Total
Return for: | |
| 3 Year | | | 0.04 | % | | | -3.16 | % | | | 4.49 | % | | | -2.18 | % | |
| 5 Year | | | 3.57 | % | | | 1.12 | % | | | 7.36 | % | | | 6.55 | % | |
| 10 Year | | | 7.33 | % | | | 6.68 | % | | | 9.84 | % | | | 12.38 | % | |
| Since inception | | | 12.69%
(8/5/91) | | | | 12.58%
(11/1/96) | | | | 11.55%
(11/1/95) | | | | 11.64%
(8/4/99) | | |
Top Five Equity
Holdings as of
March 31, 20102
Company and % of Total
Net Assets | | | Intel Corp. 2.4%
DIRECTV, Class A 2.3%
Medtronic, Inc. 2.3%
Comcast Corp. 2.2%
Liberty Media
Holding Corp.
- Interactive,
Class A 2.1% | | | | Discovery
Communications Inc.
Class C 10.1%
DIRECTV, Class A 7.0%
Liberty Media
Holding Corp.
- Interactive,
Class A 5.5%
Bristol-Myers
Squibb Co. 4.5%
H&R Block, Inc. 4.4% | | | | General Dynamics
Corp. 3.3%
Wal-Mart Stores,
Inc. 3.0%
Covidien Plc. 2.8%
Avon Products, Inc. 2.8%
Cenovus Energy, Inc. 2.6% | | | | Snap-on Inc. 4.4%
Oracle Corp. 4.0%
Laboratory Corp. of
America Holdings 4.0%
Daiwa Securities
Group Inc. 3.9%
Square Enix
Holdings Co., Ltd. 3.7% | | |
Sector
Allocation as of
March 31, 2010
Sector and % of
Market Value | | | Consumer
Discretionary 31.7%
Information
Technology 25.3%
Financials 13.5%
Health Care 11.3%
Industrials 8.3%
Consumer Staples 7.3%
Energy 2.6% | | | | Consumer
Discretionary 44.7%
Information
Technology 24.5%
Financials 12.6%
Health Care 9.4%
Energy 8.8% | | | | U.S. Government
Securities 24.1%
Consumer Staples 20.3%
Industrials 13.6%
Energy 12.3%
Health Care 12.1%
Consumer
Discretionary 7.5%
Materials 2.7%
Information
Technology 2.7%
Foreign Government
Securities 2.6%
Financials 2.1% | | | | Information
Technology 27.7%
Consumer
Discretionary 20.0%
Industrials 18.4%
Financials 14.8%
Health Care 8.3%
Consumer Staples 6.2%
Materials 2.4%
Energy 2.2% | | |
The performance data quoted represents past performance. The above performance information for the Funds does not reflect the imposition of a 2% redemption fee on shares of all Funds, other than Oakmark Equity & Income Fund, redeemed within 90 days, in order to deter market timers. If reflected, the fee would reduce the performance quoted. Past performance does not guarantee future results. The investment return and principal value will fluctuate so that an investor's shares, when redeemed, may be worth more or less than their original cost. Current performance may be lower or higher than the performance data quoted. Average annual total return measures annualized change, while total return measures aggregate change. To obtain current month end performance data, visit oakmark. com.
* Not annualized
THE OAKMARK FUNDS
2
Performance for Period
Ended March 31, 20101 | | Oakmark
Global Select
Fund—Class I
(OAKWX) | | Oakmark
International
Fund—Class I
(OAKIX) | | Oakmark
International
Small Cap Fund—Class I
(OAKEX) | |
| 3 Months* | | | 6.41 | % | | | 5.70 | % | | | 5.38 | % | |
| 1 Year | | | 70.74 | % | | | 82.17 | % | | | 101.36 | % | |
Average Annual Total
Return for: | |
| 3 Year | | | 1.69 | % | | | -2.62 | % | | | -6.02 | % | |
| 5 Year | | | N/A | | | | 7.17 | % | | | 6.38 | % | |
| 10 Year | | | N/A | | | | 8.80 | % | | | 11.24 | % | |
| Since inception | | | 4.77%
(10/2/06) | | | | 10.83%
(9/30/92) | | | | 10.94%
(11/1/95) | | |
Top Five Equity
Holdings as of
March 31, 20102
Company and % of Total
Net Assets | | | Adecco SA 6.7%
Societe Television
Francaise 1 6.1%
ROHM Company
Ltd. 6.1%
Compagnie Financiere
Richemont SA 6.0%
UBS AG 5.3% | | | | Credit Suisse Group 3.5%
Daiwa Securities
Group Inc. 3.4%
Allianz SE 3.1%
Daimler AG 3.0%
Adecco SA 3.0% | | | | Julius Baer Group,
Ltd. 3.7%
Sperian Protection 3.3%
Square Enix
Holdings Co., Ltd. 3.2%
BBA Aviation PLC 3.1%
Interpump Group
SpA 3.0% | | |
Sector
Allocation as of
March 31, 2010
Sector and % of
Market Value | | | Consumer
Discretionary 39.7%
Information
Technology 24.8%
Financials 19.3%
Industrials 7.1%
Energy 4.9%
Health Care 4.2% | | | | Consumer
Discretionary 34.6%
Financials 22.0%
Industrials 14.8%
Information
Technology 11.7%
Consumer Staples 10.0%
Health Care 4.0%
Materials 2.4%
Energy 0.5% | | | | Industrials 35.3%
Consumer
Discretionary 17.9%
Information
Technology 16.3%
Financials 12.4%
Consumer Staples 8.3%
Materials 5.6%
Health Care 4.2% | | |
As of 9/30/09, the expense ratio for Class I shares was 1.23% for Oakmark Fund, 1.19% for Oakmark Select Fund, 0.85% for Oakmark Equity and Income Fund, 1.23% for Oakmark Global Fund, 1.43% for Oakmark Global Select Fund, 1.17% for Oakmark International Fund and 1.54% for Oakmark International Small Cap Fund.
THE OAKMARK FUNDS
3
FUND EXPENSES
A shareholder of each Fund incurs two types of costs: (1) transaction costs, such as redemption fees, and (2) ongoing costs, including investment advisory fees, transfer agent fees, and other fund expenses. The examples below are intended to help shareholders understand the ongoing cost (in dollars) of investing in each Fund and to compare these costs with the ongoing costs of investing in other funds.
Actual Expenses
The following table provides information about actual account values and actual fund expenses for Class I of each Fund. The table shows the expenses a Class I shareholder would have paid on a $1,000 investment in each Fund from October 1, 2009 to March 31, 2010, as well as how much a $1,000 investment would be worth at the close of the period, assuming actual fund returns and expenses. A Class I shareholder can estimate expenses incurred for the period by dividing the account value at March 31, 2010, by $1,000 and multiplying the result by the number in the Expenses Paid During Period row as shown below.
Shares of all Funds, other than Oakmark Equity and Income Fund, invested for 90 days or less may be charged a 2% redemption fee. Please consult the Funds' prospectus at oakmark.com for more information.
| | | Oakmark Fund | | Oakmark Select Fund | | Oakmark Equity and Income Fund | | Oakmark Global Fund | | Oakmark Global Select Fund | | Oakmark International Fund | | Oakmark International Small Cap Fund | |
Beginning
Account
Value | | $ | 1,000.00 | | | $ | 1,000.00 | | | $ | 1,000.00 | | | $ | 1,000.00 | | | $ | 1,000.00 | | | $ | 1,000.00 | | | $ | 1,000.00 | | |
Ending
Account
Value | | $ | 1,145.90 | | | $ | 1,142.30 | | | $ | 1,094.30 | | | $ | 1,106.10 | | | $ | 1,118.60 | | | $ | 1,103.10 | | | $ | 1,103.90 | | |
Expenses
Paid
During
Period* | | $ | 5.99 | | | $ | 5.82 | | | $ | 4.12 | | | $ | 6.04 | | | $ | 6.71 | | | $ | 5.66 | | | $ | 7.19 | | |
Annualized
Expense
Ratio | | | 1.12 | % | | | 1.09 | % | | | 0.79 | % | | | 1.15 | % | | | 1.27 | % | | | 1.08 | % | | | 1.37 | % | |
* Expenses are equal to each Fund's annualized expense ratio for Class I, multiplied by the average account value over the period, multiplied by the number of days in the most recent fiscal half-year divided by 365 (to reflect the one-half year period).
THE OAKMARK FUNDS
4
Hypothetical Example for Comparison Purposes
The following table provides information about hypothetical account values and hypothetical expenses for Class I of each Fund based on actual expense ratios and an assumed rate of return of 5% per year before expenses, which are not the Funds' actual returns. The hypothetical account values and expenses may not be used to estimate the actual ending account balances or expenses shareholders paid for the period. Shareholders may use this information to compare the ongoing costs of investing in a Fund and other funds. To do so, compare this 5% hypothetical example with the 5% hypothetical examples that appear in the shareholder reports of the other funds.
Please note that the expenses shown in the table are meant to highlight your ongoing costs only and do not reflect any transaction costs, such as redemption fees. Therefore, the third line of the table is useful in comparing ongoing costs only, and will not help you determine the relative total costs of owning different funds. In addition, if these transaction costs were included, the total costs would have been higher.
| | | Oakmark Fund | | Oakmark Select Fund | | Oakmark Equity and Income Fund | | Oakmark Global Fund | | Oakmark Global Select Fund | | Oakmark International Fund | | Oakmark International Small Cap Fund | |
Beginning
Account
Value | | $ | 1,000.00 | | | $ | 1,000.00 | | | $ | 1,000.00 | | | $ | 1,000.00 | | | $ | 1,000.00 | | | $ | 1,000.00 | | | $ | 1,000.00 | | |
Ending
Account
Value | | $ | 1,019.35 | | | $ | 1,019.50 | | | $ | 1,020.99 | | | $ | 1,019.20 | | | $ | 1,018.60 | | | $ | 1,019.55 | | | $ | 1,018.10 | | |
Expenses
Paid
During
Period* | | $ | 5.64 | | | $ | 5.49 | | | $ | 3.98 | | | $ | 5.79 | | | $ | 6.39 | | | $ | 5.44 | | | $ | 6.89 | | |
Annualized
Expense
Ratio | | | 1.12 | % | | | 1.09 | % | | | 0.79 | % | | | 1.15 | % | | | 1.27 | % | | | 1.08 | % | | | 1.37 | % | |
* Expenses are equal to each Fund's annualized expense ratio for Class I, multiplied by the average account value over the period, multiplied by the number of days in the most recent fiscal half-year divided by 365 (to reflect the one-half year period).
THE OAKMARK FUNDS
5
OAKMARK AND OAKMARK SELECT FUNDS
At Oakmark, we are long-term investors. We attempt to identify growing businesses that are managed to benefit their shareholders. We will purchase stock in those businesses only when priced substantially below our estimate of intrinsic value. After purchase, we patiently wait for the gap between stock price and intrinsic value to close.
 "It was then late 2008. By then there was a long and growing list of pundits who claimed they predicted the catastrophe, but a far shorter list who actually did."
Michael Lewis, The Big Short
Michael Lewis has been on quite a roll. His 1989 best seller, Liar's Poker, provided an early insight into how life was changing inside investment banking firms. His 2003 best seller, Moneyball, about the economics of baseball salaries, changed the way teams are managed. Last year, The Blind Side, his 2006 book about the emergence of the left tackle as one of the highest paid positions in the NFL, was turned into a feel-good movie that was both a box office hit and an Oscar winner. Last month he r eleased another best seller, The Big Short, which explores the sub-prime mortgage collapse through the eyes of a handful of investors who saw it coming. (As one who didn't, I can tell you the book didn't make me feel very smart!) The quote at the top of the page was his well-deserved shot at those in the financial community who are now behaving like politicians, re-inventing history in an attempt to make themselves appear smarter than they really were. We see the spin machines rolling as CEOs quote pro-forma earnings that exclude losses from mistakes they know will recur, money managers advertise short-term performance numbers they know aren't sustainable, and the financial media tout retirement plan recovery schemes they know are destined to fail.
As one considers the plusses and minuses of various investments, I think one of the most overlooked positives of mutual funds is the vast amount of information that becomes permanent public record. Though past performance is no guarantee of future results, daily performance of every mutual fund is public record. There is no way to spin past performance to make it look better than it was—no representative account, no carefully selected endpoints for performance measurement, and no performance numbers that hide the cost of management fees. A mutual fund is also required to send reports to shareholders semi-annually, which explain its investment performance. (Oakmark voluntarily writes these reports every quarter and posts each one on its website Oakmark.com.) These reports highlight the stocks that most significantly affected a fund's performance and often give rationales for important holdings. Additionally, a mutual fund is required to file a full list of its portfolio holdings quarterly with the SEC. If a fund owns a given stock at the end of a quarter, there's no way to get around disclosing it. Although these reports are available to anyone through the SEC's website, they can often be tricky to find. Again, we put all our reports on Oakmark.com as a convenience to our investors and potential investors and to save them the trouble of searching for the reports on the SEC's website. It amazes me that more investors don't take advantage of this resource. Investors are eager to hear a fund manager's thoughts on the market and specific stocks, but most don't do the research to develop a historical perspective for evaluating a manager's current commentary.
So, with Kevin Grant and me recently passing the ten-year mark as managers of The Oakmark Fund, I thought it would be interesting to re-visit the first report we wrote to shareholders in March of 2000.
"It is important to us that our investors understand that we will continue to employ the same value philosophy that has been responsible for [Oakmark's historically strong] results. We will only buy a stock when it is selling below 60% of what we believe the business is worth today. We will sell it when it is priced at more than 90% of estimated value, or when we believe we have made a mistake analyzing the company. In addition, we will seek to identify companies where value grows as time passes and where managements have economic interests that are well aligned with their shareholders. When we identify these stocks, we will buy them in meaningful size. While most mutual funds own over 100 different stocks, we expect to usually have only 40-50 stocks. We are confident that this approach will continue to deliver excellent long-term returns, and we have both made substantial personal investments in The Oakmark Fund since being named the new ma nagers."
About the only change we'd make if we wrote that paragraph today would be that we own about 55 stocks, compared to the average equity fund, which is now up to 166. We still believe that stock picking is our most important skill, and we want to maximize its effect without taking excessive risk in any individual position. Our investment philosophy, the long-term goals, and investing side-by-side with the shareholders all remain the same—not just for The Oakmark Fund, but for all of Oakmark's Funds.
"We are well aware that recent results have been disappointing, and the quarter just ended was no exception.... We are not satisfied with recent performance and are energized by the challenge of restoring The Oakmark Fund to the position of the premier diversified value fund."
OAKMARK AND OAKMARK SELECT FUNDS
6
Candor in shareholder communication has always been important to us, whether we are communicating to our shareholders or whether a management team is communicating to us. If things aren't going well, we want a management team to be upfront about it.
"In addition to having a portfolio full of great values, we inherit a very favorable tax position. It is unlikely that we will have to make any capital gains distributions for at least a couple of years. We will only pay capital gains taxes after the portfolio appreciates substantially from current levels and that will be welcomed by all of us!"
We have always managed our portfolios with the goal of maximizing long-term after-tax returns. We won't enter into transactions that hurt our tax-free holders, but by actively managing our tax situation—selling our highest cost shares first, tax-trading loss positions, and taking mostly long-term gains—our shareholders have kept a very high percentage of their pre-tax gains.
"We are seeing an increased level of acquisition activity that we believe will benefit the Fund. Additionally, our companies continue to repurchase large quantities of their own stocks, which we believe adds significant value to the remaining shares. The price-to-earnings ratio of The Oakmark Fund stands at 11.5 (using estimated 2000 eps3) compared to 26 for the S&P 5004. That means that each share of The Oakmark Fund that you purchase for $24.76 represents $2.16 of current earnings. If you invested enough money in the S&P 500 to create that same $2.16 of earnings, it would cost $57 or 130% more than in The Oakmark Fund."
Merger activity has significantly contributed to our returns and served as confirmation that we have been identifying undervalued businesses. Of the 44 stocks we owned in Oakmark ten years ago, 13 were subsequently acquired. We continue to like managers who use excess capital to repurchase their company's shares when their stock is undervalued. Most managers today understand that they need to maximize value. Those who embrace the goal of maximizing per-share value, rather than total value, continue to be our preferred managers. Last, we remain focused on undeserved valuation gaps. That valuation gap in 2000 was the single largest contributor to our outperformance over the past decade. Today the valuation gap is much smaller, but the good news is that the market itself sells at a markedly lower price-to-earnings ratio than it did then, and competing bond yields are substantially lower. I'm almost certain we won't outperform the market by as m uch in this decade as we did in the past decade, but I also expect that the market will provide a tailwind (as it usually does) rather than a headwind.
The 2000 report closed with a look at our largest holdings: Fortune Brands, Washington Mutual, Dun & Bradstreet, Brunswick and AC Nielsen. The average performance of that list was a gain of 74% during our ownership. AC Nielsen was acquired by VNU soon after that report was written. Dun & Bradstreet split into two companies, and we sold both pieces after nice increases. Brunswick was also sold after a good gain. We still own Fortune Brands along with Heinz, H&R Block and YUM! Brands. Our business value estimates for all four have grown substantially, and we continue to believe they are undervalued despite an average total return of just over 200% for the decade. Finally, Washington Mutual—the mistake I'd love to exclude by using pro-forma numbers. We sold the stock, down 80% in price, after being proven dead wrong about the company's participation in bad sub-prime mortgage underwriting. But even with an error of this magnitud e, after including dividend income, the stock only lost 12% during our ownership. Anyone who says dividends don't matter clearly hasn't looked at the numbers.
Before we invest your assets in new companies, we read through their old annual reports to see if the management team and the company goals have been consistent. It also gives us a chance to evaluate how management has reacted to their successes and failures. Next time you are trying to figure out if the guy who says he can double your money in three years is legit or not (he's not), remember the advantages inherent in mutual fund transparency. Before you invest your money in another fund, consider investing some time to read its old reports. Even if it only confirms your decision to purchase, gaining the perspective of history can make it a lot easier to confidently stay the course in uncertain times. And now with Oakmark's historical context in place, here's what we are thinking today. We still believe stocks are undervalued, though not nearly to the degree they were a year ago. Despite the strong rally, investors continue to pour money in to bond funds, not equity funds, and skepticism remains very high. We've never liked being on the side with the crowd, and most investors remain underinvested in equities. We believe they are still making a mistake.
William C. Nygren, CFA
Portfolio Manager
oakmx@oakmark.com
oaklx@oakmark.com
March 31, 2010
OAKMARK AND OAKMARK SELECT FUNDS
7
OAKMARK FUND
Report from Bill Nygren and Kevin Grant, Portfolio Managers


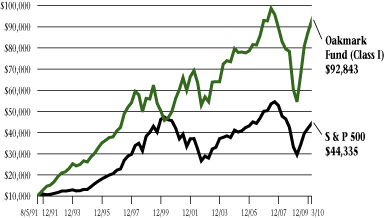
THE VALUE OF A $10,000 INVESTMENT IN OAKMARK FUND FROM ITS INCEPTION (8/5/91) TO PRESENT (3/31/10) AS COMPARED TO THE STANDARD & POOR'S 500 INDEX4 (UNAUDITED)
| | | | | Average Annual Total Returns
(as of 3/31/10) | |
| (Unaudited) | | Total Return
Last 3 Months* | | 1-year | | 5-year | | 10-year | | Since
Inception
(8/5/91) | |
| Oakmark Fund (Class I) | | | 6.21 | % | | | 70.07 | % | | | 3.57 | % | | | 7.33 | % | | | 12.69 | % | |
| S&P 500 | | | 5.39 | % | | | 49.77 | % | | | 1.92 | % | | | -0.65 | % | | | 8.31 | % | |
| Dow Jones Average5 | | | 4.82 | % | | | 46.93 | % | | | 3.34 | % | | | 2.26 | % | | | 9.67 | % | |
Lipper Large Cap
Value Index6 | | | 5.74 | % | | | 49.73 | % | | | 1.57 | % | | | 1.40 | % | | | 8.05 | % | |
The graph and table do not reflect the deduction of taxes that a shareholder would pay on fund distributions or the redemption of fund shares.
The expense ratio for Class I shares as of 9/30/09 was 1.23%.
The performance data quoted represents past performance. The above performance information for the Fund does not reflect the imposition of a 2% redemption fee on shares redeemed within 90 days. If reflected, the fee would reduce the performance quoted. Past performance does not guarantee future results. The investment return and principal value will fluctuate so that an investor's shares, when redeemed, may be worth more or less than their original cost. Current performance may be lower or higher than the performance data quoted. Average annual total return measures annualized change, while total return measures aggregate change. To obtain most recent month-end performance data, visit oakmark.com.
* Not annualized
The Oakmark Fund increased in value by 6% for the quarter compared to a 5% gain for the S&P 500. The stock market has now been up for four consecutive quarters, and the S&P 500 has returned 50% for the trailing twelve months. The Oakmark Fund has performed even better, gaining 70% over that same time period. As mentioned in the introductory letter, we passed the ten-year mark last month as your Fund's co-managers. The S&P 500 performed poorly for the decade ended March 31, losing 6% of its value. We are pleased to report that for that same decade The Oakmark Fund gained 103%.
The Fund's biggest gainers in the quarter were its Liberty Media investments: Liberty Capital up 52% and Liberty Interactive up 41%. About a year ago Liberty Capital made an investment in Sirius XM Radio debt, which allowed Sirius to avoid bankruptcy. That debt has been repaid with generous interest. In addition, at the market value of Sirius stock, the warrants that Liberty received are now worth more than $21 per Liberty share. Liberty Interactive's primary business, QVC, is recovering from the recession much more rapidly than investors had expected. The stock that most hurt our quarterly performance was H&R Block, down 21%. Block reported a larger than expected decline in early season tax filers. We believe that the recession caused many of Block's lower income customers not to file returns for 2009. When that headwind reverses, we expect Block's customer count will recover. During the quarter we eliminated our position in Limited Bra nds, because the stock responded strongly to some improvement at its Victoria's Secret chain, and we purchased Allstate.
Allstate Corp (ALL - $32)
Allstate is the second largest auto insurer in the United States. Additionally, the company offers homeowners and life insurance. Like many financial companies, Allstate's investment portfolio suffered when the markets fell in 2008. Unlike many financial companies, Allstate neither required government assistance nor diluted shareholders by raising additional capital. At the end of 2006, Allstate's book value peaked at $35. At the end of 2009, including mark-to-market hits on its investments, book value had declined only to $31. For that, the market slashed the company's stock price in half. The stock now sells at 8 times estimated earnings and yields 3%. Put differently, we are buying the high-return auto insurance business at a meaningful discount to our estimate of fair value, and we are getting the homeowners and life insurance operations for free. At this price, we believe our investment is in good hands with Allstate.
William C. Nygren, CFA
Portfolio Manager
oakmx@oakmark.com | | Kevin G. Grant, CFA
Portfolio Manager
oakmx@oakmark.com | |
|
March 31, 2010
OAKMARK FUND
8
OAKMARK FUND
Schedule of Investments—March 31, 2010 (Unaudited)
Name | |
Shares Held | |
Value | |
| Common Stocks—94.6% | |
| Advertising—1.5% | |
| Omnicom Group, Inc. | | | 1,316,254 | | | $ | 51,083,818 | | |
| Aerospace & Defense—2.0% | |
| The Boeing Co. | | | 975,000 | | | | 70,794,750 | | |
| Air Freight & Logistics—1.0% | |
| FedEx Corp. | | | 390,000 | | | | 36,426,000 | | |
| Asset Management & Custody Banks—4.1% | |
| Bank of New York Mellon Corp. | | | 2,389,630 | | | | 73,791,775 | | |
| State Street Corp. | | | 1,560,000 | | | | 70,418,400 | | |
| | | | 144,210,175 | | |
| Broadcasting—1.3% | |
| Discovery Communications, Inc., Class C (a) | | | 1,500,140 | | | | 44,119,117 | | |
| Cable & Satellite—4.5% | |
| DIRECTV, Class A (a) | | | 2,399,155 | | | | 81,115,431 | | |
| Comcast Corp., Class A | | | 4,320,000 | | | | 77,630,400 | | |
| | | | 158,745,831 | | |
| Catalog Retail—2.1% | |
| Liberty Media Corp. - Interactive, Class A (a) | | | 4,905,000 | | �� | | 75,095,550 | | |
| Communications Equipment—1.8% | |
| Cisco Systems, Inc. (a) | | | 2,450,000 | | | | 63,773,500 | | |
| Computer & Electronics Retail—2.1% | |
| Best Buy Co., Inc. | | | 1,760,000 | | | | 74,870,400 | | |
| Computer Hardware—5.3% | |
| Hewlett-Packard Co. | | | 1,370,000 | | | | 72,815,500 | | |
| Dell, Inc. (a) | | | 3,820,000 | | | | 57,338,200 | | |
| Apple, Inc. (a) | | | 240,000 | | | | 56,383,200 | | |
| | | | 186,536,900 | | |
| Consumer Finance—3.0% | |
| Capital One Financial Corp. | | | 1,694,800 | | | | 70,181,668 | | |
| American Express Co. | | | 850,000 | | | | 35,071,000 | | |
| | | | 105,252,668 | | |
| Data Processing & Outsourced Services—2.8% | |
| Automatic Data Processing, Inc. | | | 1,275,000 | | | | 56,699,250 | | |
| Western Union Co. | | | 2,490,000 | | | | 42,230,400 | | |
| | | | 98,929,650 | | |
| Department Stores—1.0% | |
| Kohl's Corp. (a) | | | 611,900 | | | | 33,519,882 | | |
OAKMARK FUND
9
OAKMARK FUND
Schedule of Investments—March 31, 2010 (Unaudited) cont.
Name | |
Shares Held | |
Value | |
| Common Stocks—94.6% (cont.) | |
| Distillers & Vintners—1.7% | |
| Diageo PLC (b) | | | 896,000 | | | $ | 60,435,200 | | |
| Diversified Banks—1.6% | |
| Wells Fargo & Co. | | | 1,800,000 | | | | 56,016,000 | | |
| Drug Retail—1.8% | |
| Walgreen Co. | | | 1,665,000 | | | | 61,754,850 | | |
| Electronic Manufacturing Services—2.1% | |
| Tyco Electronics, Ltd. (c) | | | 2,729,500 | | | | 75,006,660 | | |
| Health Care Equipment—3.5% | |
| Medtronic, Inc. | | | 1,800,000 | | | | 81,054,000 | | |
| Covidien PLC (c) | | | 840,000 | | | | 42,235,200 | | |
| | | | 123,289,200 | | |
| Home Improvement Retail—2.1% | |
| The Home Depot, Inc. | | | 2,231,500 | | | | 72,189,025 | | |
| Housewares & Specialties—1.8% | |
| Fortune Brands, Inc. | | | 1,320,000 | | | | 64,033,200 | | |
| Hypermarkets & Super Centers—2.0% | |
| Wal-Mart Stores, Inc. | | | 1,270,000 | | | | 70,612,000 | | |
| Industrial Conglomerates—3.3% | |
| Tyco International, Ltd. (c) | | | 1,860,000 | | | | 71,145,000 | | |
| 3M Co. | | | 540,000 | | | | 45,127,800 | | |
| | | | 116,272,800 | | |
| Industrial Machinery—1.5% | |
| Illinois Tool Works, Inc. | | | 1,075,000 | | | | 50,912,000 | | |
| Integrated Oil & Gas—1.5% | |
| Cenovus Energy, Inc. (c) | | | 1,930,000 | | | | 50,585,300 | | |
| Internet Software & Services—1.8% | |
| eBay, Inc. (a) | | | 2,340,000 | | | | 63,063,000 | | |
| Motorcycle Manufacturers—1.8% | |
| Harley-Davidson, Inc. | | | 2,212,000 | | | | 62,090,840 | | |
| Movies & Entertainment—7.0% | |
| Viacom, Inc., Class B (a) | | | 2,039,745 | | | | 70,126,433 | | |
OAKMARK FUND
10
OAKMARK FUND
Schedule of Investments—March 31, 2010 (Unaudited) cont.
Name | |
Shares Held | |
Value | |
| Common Stocks—94.6% (cont.) | |
| Movies & Entertainment—7.0% (cont.) | |
| The Walt Disney Co. | | | 1,950,000 | | | $ | 68,074,500 | | |
| Time Warner, Inc. | | | 1,942,566 | | | | 60,744,039 | | |
| Liberty Media Holding Corp. - Capital, Class A (a) | | | 1,320,836 | | | | 48,038,805 | | |
| | | | 246,983,777 | | |
| Oil & Gas Exploration & Production—1.0% | |
| EnCana Corp. (c) | | | 1,140,000 | | | | 35,374,200 | | |
| Other Diversified Financial Services—3.1% | |
| Bank of America Corp. | | | 3,271,000 | | | | 58,387,350 | | |
| JPMorgan Chase & Co. | | | 1,130,000 | | | | 50,567,500 | | |
| | | | 108,954,850 | | |
| Packaged Foods & Meats—1.4% | |
| H.J. Heinz Co. | | | 1,100,000 | | | | 50,171,000 | | |
| Pharmaceuticals—7.2% | |
| Bristol-Myers Squibb Co. | | | 2,650,000 | | | | 70,755,000 | | |
| Johnson & Johnson | | | 980,000 | | | | 63,896,000 | | |
| GlaxoSmithKline PLC (b) | | | 1,565,000 | | | | 60,283,800 | | |
| Merck & Co., Inc. | | | 1,571,535 | | | | 58,696,832 | | |
| | | | 253,631,632 | | |
| Property & Casualty Insurance—0.9% | |
| Allstate Corp. | | | 1,000,000 | | | | 32,310,000 | | |
| Restaurants—3.3% | |
| McDonald's Corp. | | | 869,000 | | | | 57,979,680 | | |
| Yum! Brands, Inc. | | | 1,484,000 | | | | 56,881,720 | | |
| | | | 114,861,400 | | |
| Semiconductor Equipment—1.9% | |
| Applied Materials, Inc. | | | 5,050,000 | | | | 68,074,000 | | |
| Semiconductors—4.4% | |
| Intel Corp. | | | 3,850,000 | | | | 85,701,000 | | |
| Texas Instruments, Inc. | | | 2,750,000 | | | | 67,292,500 | | |
| | | | 152,993,500 | | |
| Specialized Consumer Services—1.6% | |
| H&R Block, Inc. | | | 3,128,600 | | | | 55,689,080 | | |
| Systems Software—3.8% | |
| Oracle Corp. | | | 2,750,000 | | | | 70,647,500 | | |
| Microsoft Corp. | | | 2,150,000 | | | | 62,930,500 | | |
| | | | 133,578,000 | | |
| Total Common Stocks (Cost: $2,144,598,163) | | | | | | $ | 3,322,239,755 | | |
OAKMARK FUND
11
OAKMARK FUND
Schedule of Investments—March 31, 2010 (Unaudited) cont.
Name | |
Par Value | |
Value | |
| Short Term Investment—2.9% | |
| Repurchase Agreement—2.9% | |
Fixed Income Clearing Corp. Repurchase
Agreement, 0.00% dated 3/31/2010 due 4/1/2010,
repurchase price $101,231,632, collateralized by
a Federal Home Loan Bank Bond, with a rate of
2.330%, with a maturity of 5/23/2013, and with
a market value plus accrued interest of $45,795,913,
and by Federal Home Loan Mortgage Corp. Bonds,
with rates from 2.000% - 2.250%, with maturities
from 8/24/2012 - 3/29/2013, and with an aggregate
market value plus accrued interest of $11,916,319,
and by Federal National Mortgage Association Bonds,
with a rate of 1.750%, with maturities from
3/23/2011 - 5/7/2013, and with an aggregate
market value plus accrued interest of $45,544,563
(Cost: $101,231,632) | | $ | 101,231,632 | | | $ | 101,231,632 | | |
| Total Short Term Investment (Cost: $101,231,632) | | | | $ | 101,231,632 | | |
| Total Investments (Cost: $2,245,829,795)—97.5% | | | | | 3,423,471,387 | | |
| Other Assets In Excess of Liabilities—2.5% | | | | | 89,273,855 | | |
| Total Net Assets—100% | | | | $ | 3,512,745,242 | | |
(a) Non income-producing security.
(b) Represents a Sponsored American Depositary Receipt.
(c) Represents a foreign domiciled corporation.
See accompanying Notes to Financial Statements.
OAKMARK FUND
12
OAKMARK SELECT FUND
Report from Bill Nygren and Henry Berghoef, Portfolio Managers


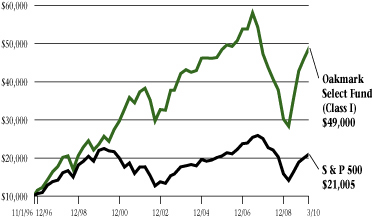
THE VALUE OF A $10,000 INVESTMENT IN OAKMARK SELECT FUND FROM ITS INCEPTION (11/1/96) TO PRESENT (3/31/10) AS COMPARED TO THE STANDARD & POOR'S 500 INDEX4 (UNAUDITED)
| | | | | Average Annual Total Returns
(as of 3/31/10) | |
| (Unaudited) | | Total Return
Last 3 Months* | | 1-year | | 5-year | | 10-year | | Since
Inception
(11/1/96) | |
Oakmark Select Fund
(Class I) | | | 6.34 | % | | | 72.95 | % | | | 1.12 | % | | | 6.68 | % | | | 12.58 | % | |
| S&P 500 | | | 5.39 | % | | | 49.77 | % | | | 1.92 | % | | | -0.65 | % | | | 5.69 | % | |
Lipper Multi-Cap
Value Index7 | | | 6.18 | % | | | 51.98 | % | | | 0.85 | % | | | 3.70 | % | | | 6.04 | % | |
The graph and table do not reflect the deduction of taxes that a shareholder would pay on fund distributions or the redemption of fund shares.
The expense ratio for Class I shares as of 9/30/09 was 1.19%.
The performance data quoted represents past performance. The above performance information for the Fund does not reflect the imposition of a 2% redemption fee on shares redeemed within 90 days. If reflected, the fee would reduce the performance quoted. Past performance does not guarantee future results. The investment return and principal value will fluctuate so that an investor's shares, when redeemed, may be worth more or less than their original cost. Current performance may be lower or higher than the performance data quoted. Average annual total return measures annualized change, while total return measures aggregate change. To obtain most recent month-end performance data, visit oakmark.com.
* Not annualized
The Oakmark Select Fund increased in value by 6% for the quarter compared to a 5% gain for the S&P 500. The stock market has now been up for four consecutive quarters, and the S&P 500 has returned 50% for the trailing twelve months. The Oakmark Select Fund has performed significantly better, gaining 73% over that same time period. Though we view gains of that magnitude as unsustainable, we continue to believe that long-term returns from stocks are likely to be meaningfully higher than returns for either bonds or cash.
During the past quarter, our biggest contributors were Liberty Interactive, up 41%, Bank of America, up 19%, and Discovery Communications, up 11%. Liberty Interactive's primary business is QVC. QVC, remembered by many as a peddler of cubic zirconium jewelry, is now an on-air and on-line department store. We view QVC's quick recovery from the recession as a testament to its competitive advantages over its brick and mortar department store competition. Bank of America is benefiting from an apparent peak in loan charge-offs. As investors gain the confidence to look forward to normalized losses, we think they'll like the earnings outlook for Bank of America. Discovery continued to demonstrate its ability to grow its viewership and thus its attractiveness to advertisers. If you enjoyed the Planet Earth series, make sure you see Life. Its debut set a new high for Discovery Channel's ratings, giving viewers some of the best HD nature photography ever seen on TV.
The biggest detractors for the quarter were H&R Block, down 21%, Western Union, down 10%, and Texas Instruments, down 6%. Importantly, these were the only stocks in the portfolio that declined. Block reported a larger than expected decline in early season tax filers. Investors are concerned that the decline is secular, as a growing number of individuals prepare their own returns using tax preparation software. We believe the problem is mostly cyclical, with the recession causing many of Block's lower income customers not to file returns for 2009. When employment recovers, we expect that headwind to become a tailwind and that Block's customer counts will recover. Western Union's money transfer business also reported weak results, and again, our expectation is that this will reverse as employment recovers. Texas Instruments, despite a strong sales and earnings rebound, left some investors disappointed that its margins weren't improving eve n more rapidly. We remain pleased with the company's investments in future growth, and we continue to believe that the stock is quite undervalued. No positions were eliminated during the quarter, and no new positions were added.
William C. Nygren, CFA
Portfolio Manager
oaklx@oakmark.com | | Henry R. Berghoef, CFA
Portfolio Manager
oaklx@oakmark.com | |
|
March 31, 2010
OAKMARK SELECT FUND
13
OAKMARK SELECT FUND
Schedule of Investments—March 31, 2010 (Unaudited)
Name | |
Shares Held | |
Value | |
| Common Stocks—95.0% | |
| Broadcasting—10.1% | |
| Discovery Communications, Inc., Class C (a) | | | 8,709,500 | | | $ | 256,146,395 | | |
| Cable & Satellite—11.0% | |
| DIRECTV, Class A (a) | | | 5,247,949 | | | | 177,433,156 | | |
| Comcast Corp., Class A | | | 5,750,000 | | | | 103,327,500 | | |
| | | | 280,760,656 | | |
| Catalog Retail—5.5% | |
| Liberty Media Corp. - Interactive, Class A (a) | | | 9,100,000 | | | | 139,321,000 | | |
| Computer & Electronics Retail—4.3% | |
| Best Buy Co., Inc. | | | 2,550,000 | | | | 108,477,000 | | |
| Computer Hardware—3.3% | |
| Dell, Inc. (a) | | | 5,613,000 | | | | 84,251,130 | | |
| Consumer Finance—3.9% | |
| Capital One Financial Corp. | | | 2,410,600 | | | | 99,822,946 | | |
| Data Processing & Outsourced Services—3.4% | |
| Western Union Co. | | | 5,165,400 | | | | 87,605,184 | | |
| Electronic Manufacturing Services—4.4% | |
| Tyco Electronics, Ltd. (b) | | | 4,067,838 | | | | 111,784,188 | | |
| Health Care Equipment—4.4% | |
| Medtronic, Inc. | | | 2,500,000 | | | | 112,575,000 | | |
| Integrated Oil & Gas—4.0% | |
| Cenovus Energy, Inc. (b) | | | 3,924,800 | | | | 102,869,008 | | |
| Internet Software & Services—4.0% | |
| eBay, Inc. (a) | | | 3,800,000 | | | | 102,410,000 | | |
| Movies & Entertainment—4.0% | |
| Time Warner, Inc. | | | 3,210,666 | | | | 100,397,526 | | |
| Oil & Gas Exploration & Production—4.3% | |
| Newfield Exploration Co. (a) | | | 2,100,000 | | | | 109,305,000 | | |
OAKMARK SELECT FUND
14
OAKMARK SELECT FUND
Schedule of Investments—March 31, 2010 (Unaudited) cont.
Name | | Shares Held/
Par Value | |
Value | |
| Common Stocks—95.0% (cont.) | |
| Other Diversified Financial Services—8.0% | |
| Bank of America Corp. | | | 6,195,100 | | | $ | 110,582,535 | | |
| JPMorgan Chase & Co. | | | 2,094,000 | | | | 93,706,500 | | |
| | | | 204,289,035 | | |
| Pharmaceuticals—4.5% | |
| Bristol-Myers Squibb Co. | | | 4,310,200 | | | | 115,082,340 | | |
| Restaurants—3.3% | |
| Yum! Brands, Inc. | | | 2,215,000 | | | | 84,900,950 | | |
| Semiconductors—8.1% | |
| Intel Corp. | | | 5,047,000 | | | | 112,346,220 | | |
| Texas Instruments, Inc. | | | 3,875,000 | | | | 94,821,250 | | |
| | | | 207,167,470 | | |
| Specialized Consumer Services—4.5% | |
| H&R Block, Inc. | | | 6,369,600 | | | | 113,378,880 | | |
| Total Common Stocks (Cost: $1,697,647,719) | | | | | | $ | 2,420,543,708 | | |
| Short Term Investment—5.0% | |
| Repurchase Agreement—5.0% | |
Fixed Income Clearing Corp. Repurchase
Agreement, 0.00% dated 3/31/2010 due 4/1/2010,
repurchase price $126,701,474, collateralized by
a Federal Home Loan Bank Bond, with a rate of
2.330%, with a maturity of 5/23/2013, and with
a market value plus accrued interest of $4,579,088,
and by Federal Home Loan Mortgage Corp. Bonds,
with rates from 2.125% - 4.000%, with maturities
from 6/12/2013 - 6/18/2013, and with an aggregate
market value plus accrued interest of
$124,660,000 (Cost: $126,701,474) | | $ | 126,701,474 | | | $ | 126,701,474 | | |
| Total Short Term Investment (Cost: $126,701,474) | | | | | | $ | 126,701,474 | | |
| Total Investments (Cost: $1,824,349,193)—100.0% | | | | | | | 2,547,245,182 | | |
| Other Assets In Excess of Liabilities—0.0% | | | | | | | 1,106,428 | | |
| Total Net Assets—100% | | | | | | $ | 2,548,351,610 | | |
(a) Non income-producing security.
(b) Represents a foreign domiciled corporation.
See accompanying Notes to Financial Statements.
OAKMARK SELECT FUND
15
OAKMARK EQUITY AND INCOME FUND
Report from Clyde S. McGregor and Edward A. Studzinski, Portfolio Managers


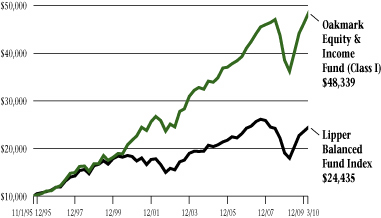
THE VALUE OF A $10,000 INVESTMENT IN OAKMARK EQUITY AND INCOME FUND FROM ITS INCEPTION (11/1/95) TO PRESENT (3/31/10) AS COMPARED TO THE LIPPER BALANCED FUND INDEX8 (UNAUDITED)
| | | | | Average Annual Total Returns
(as of 3/31/10) | |
| (Unaudited) | | Total Return
Last 3 Months* | | 1-year | | 5-year | | 10-year | | Since
Inception
(11/1/95) | |
Oakmark Equity &
Income Fund (Class I) | | | 4.70 | % | | | 33.52 | % | | | 7.36 | % | | | 9.84 | % | | | 11.55 | % | |
Lipper Balanced
Fund Index | | | 3.84 | % | | | 36.03 | % | | | 3.68 | % | | | 2.88 | % | | | 6.40 | % | |
| S&P 5004 | | | 5.39 | % | | | 49.77 | % | | | 1.92 | % | | | -0.65 | % | | | 6.82 | % | |
Barclays Capital
U.S. Govt./Credit9 | | | 1.55 | % | | | 7.51 | % | | | 5.17 | % | | | 6.22 | % | | | 6.07 | % | |
The graph and table do not reflect the deduction of taxes that a shareholder would pay on fund distributions or the redemption of fund shares.
The expense ratio for Class I shares as of 9/30/09 was 0.85%.
The performance data quoted represents past performance. Past performance does not guarantee future results. The investment return and principal value will fluctuate so that an investor's shares, when redeemed, may be worth more or less than their original cost. Current performance may be lower or higher than the performance data quoted. Average annual total return measures annualized change, while total return measures aggregate change. To obtain most recent month-end performance data, visit oakmark.com.
* Not annualized
Quarter Review
We are happy to report the fourth consecutive quarter of positive returns to the Equity and Income Fund. In the March quarter the Fund gained nearly 5%, slightly besting the 4% return that Lipper Analytics reports for its Balanced Fund Index. The Fund's equities contributed nearly all of the total return, earning over 7% in the period while the fixed income segment generated only a fractional percentage return. For the first six months of the Fund's fiscal year, the returns are 9% for the Fund versus 8% for the Lipper Balanced Fund Index. The annualized rate of return from the Fund's inception date is 12% compared to the Lipper Balanced Fund Index return of 6%.
During the past quarter the leading contributors to the Fund's return were General Dynamics, Walter Energy, Varian Medical Systems, Rockwell Collins, and Hospira. Fund holdings that declined in price included: H&R Block (disappointing preliminary tax season results), Unilever (unexpected management changes along with euro weakness), Alliant Techsystems (adverse changes in NASA's budget), Martin Marietta Materials (disappointing economic stimulus derived sales), and Diageo (some trade-down to cheaper liquor brands). Our discussion of net equity purchases later in this letter will make it clear why we continued to increase the portfolio's equity allocation to 65%. Appreciation, however, also contributed to the growth in equity commitment. We reduced the fixed income portfolio duration to 2 1/4 years.
Sharp-eyed readers may have already noted that this quarter's winner's list is populated with companies from politically challenged industries. General Dynamics and Rockwell Collins both have significant private aviation product lines, Walter Energy is a coal company, and Varian Medical and Hospira are health care concerns. The stock market seems to have come around to our viewpoint that the environment is not really as negative for these companies and their industries as was feared. General aviation is an industry that the U.S. dominates, its employees are highly compensated, and it generates significant export volumes. As well, General Dynamics participates in the U.S. cyber-defense effort, while Rockwell Collins benefits from an improving production outlook for Boeing and Airbus. Although Walter Energy mines coal, its coal is primarily metallurgical quality, meaning that it is used in steel production. And, exports to emerging markets countries take up much of Walter's output. The Fund's health care holdings' share prices moved upward as the health care bill's details hardened. In this case, certainty seems to have relieved investors. Several smaller health care holdings also enjoyed strong share price advances in the quarter: Kinetic Concepts, Steris, PerkinElmer, and Omnicare. Finally, we should note that the Fund's retail holdings gained strength. Three months ago we wrote somewhat skeptically about the consumer's role in
OAKMARK EQUITY AND INCOME FUND
16
the economic recovery, titling one of our paragraphs "Consumer to the Rescue?" While consumers may not have been particularly ebullient in the March quarter, retailers' stocks were, as evidenced by Fund holdings Foot Locker, TJX, Home Depot, CVS, and Tractor Supply.
Transaction Activity
Although our equity transaction activity had been fairly quiet as calendar 2009 ended, the March quarter proved rather busy. We initiated six new equity holdings while eliminating four. Beginning with the eliminations, Precision Cast Parts, Varian, and Williams were all successful holdings for the Fund. Precision Cast Parts hit our price target very quickly, and Varian is being acquired. We chose to exit the Williams position because of concerns regarding management strategy and so that we could redeploy the proceeds to more attractive opportunities. The fourth sale, Mueller Water, was not a successful holding for the Fund, but it was through our involvement with Mueller that we began to develop our position in Walter Energy, a stock that has proven extremely rewarding.
Addressing the new names alphabetically, Concho Resources is an independent exploration and production company with particular strengths in older onshore North American oilfields. The company's management team has demonstrated entrepreneurial success at predecessor firms. At Home Depot, new management appears to be revitalizing the company just as the environment for home improvement retailing improves. The stock also sports a superior dividend yield. Omnicare returns to the Fund after a seven-year absence. Interestingly, we began this round of share purchases at almost exactly the same share price at which we last sold the stock in 2003. Omnicare is an institutional pharmacy company, primarily solving the pharmaceutical needs of long-term care patients. Of the six new purchases, Teledyne Technologies has the smallest market capitalization, but it participates in a wide variety of capital goods markets, in particular defense electronics and instrumentation. Transocean Limited is the world's largest offshore drilling contractor with particular expertise in deepwater drilling. As oil exploration activity continues to migrate to deeper waters, we believe Transocean should benefit. Last but not least, Weight Watchers is a major beneficiary of what our security analyst calls the "corpulence wave." The company has suffered somewhat from the recession, but we believe that management's efforts to reignite growth, including a significant internet effort, make the stock attractive.
Is Greek Tragedy Too Much Drama?
"Should the woes of a country with fewer people than metropolitan Los Angeles really roil the massive U.S. financial markets?" asked Tom Lauricella in a February 8 Wall Street Journal article10. (This section's title is also borrowed from that article.) Although U.S. markets have stabilized and rebounded since the article was written, it remains unclear which force is stronger: over-indebted smaller nations' ability to spawn financial contagion or multinational agencies' ability to contain this contagion. Before 2007, investors would not have worried about such issues, but the extreme correlations experienced in the recent bear market have c hanged attitudes.
We believe that the answer to the question in the previous paragraph is "no," but that does not mean that Greece's problems (as well as those in Portugal, Ireland, Italy, Spain, etc.) are irrelevant to our management of the Equity and Income Fund. From our vantage point these issues have the greatest impact on our fixed income activity, both long-term and short-term. History teaches that problems such as Greece's tend to be handled by accelerating inflation and currency debasement, both of which work to make debt less onerous to the debtor. Although Europe's common currency (the euro) complicates the situation, we still expect that the policy answer will be the same. Accordingly, we have attempted to protect the Fund's fixed income portfolio by avoiding euro-denominated debt in this period.
Of course, it can well be asked, as Michael Gordon did in the January 7th Financial Times, "Should [any] government bonds still be viewed as risk free?"11 Greece's bonds have been downgraded, but they are a tiny, albeit rapidly growing, factor in the total debt market. Of far greater import was Moody's warning that the U.S. could lose its triple-A bond rating unless the federal budget deficit declines or the economy recovers sufficiently. Adding to the fiscal stress, the government admitted that the Social Security program went into a deficit position in 2009, seven years before this was expected to occur. The cause was the high unemployment level (which reduces tax payments to the "trust fund") combined with a surfeit of individuals filing for benefits sooner than anticipated. Finally, Am erican states' fiscal problems (e.g. California and Illinois) have become well-known.
We come to the conclusion that for now bonds are more likely than stocks to produce losses and that we should take an extremely risk-averse fixed income posture. As noted above, we have reduced the fixed income duration down to near two years. Remember that the duration number tells you how much your principal value would change if the entire yield curve would shift by 1%. A more typical duration for the portfolio has been four years, so we have halved the exposure to a shift in the term structure of interest rates. We have also diversified the long-term fixed income portfolio into Canadian government bonds and the short-term portfolio into Canadian and Australian Treasury bills. Finally, we have increased the Fund's equity percentage to its historic zenith, believing that equities that have growing income and dividend streams are a safer investment under current conditions.
Of course, we do not claim to be able to predict the future given the very difficult choices investors face today. What we can attempt is to protect our investors' capital while positioning the Fund to benefit from many likely scenarios. Once again, we thank you for being our shareholders and invite your questions and comments.
Clyde S. McGregor, CFA
Portfolio Manager
oakbx@oakmark.com | | Edward A. Studzinski, CFA
Portfolio Manager
oakbx@oakmark.com | |
|
March 31, 2010
OAKMARK EQUITY AND INCOME FUND
17
OAKMARK EQUITY AND INCOME FUND
Schedule of Investments—March 31, 2010 (Unaudited)
Name | |
Shares Held | |
Value | |
| Common Stocks—64.9% | |
| Aerospace & Defense—9.6% | |
| General Dynamics Corp. | | | 8,000,000 | | | $ | 617,600,000 | | |
| L-3 Communications Holdings, Inc. | | | 4,410,625 | | | | 404,145,569 | | |
| Rockwell Collins, Inc. | | | 6,279,000 | | | | 393,002,610 | | |
| Goodrich Corp. | | | 4,293,700 | | | | 302,791,724 | | |
| Alliant Techsystems, Inc. (a) | | | 1,000,000 | | | | 81,300,000 | | |
| Teledyne Technologies, Inc. (a) | | | 191,210 | | | | 7,891,237 | | |
| | | | 1,806,731,140 | | |
| Apparel Retail—1.8% | |
| The TJX Cos., Inc. | | | 6,000,000 | | | | 255,120,000 | | |
| Foot Locker, Inc. | | | 4,830,000 | | | | 72,643,200 | | |
| | | | 327,763,200 | | |
| Application Software—0.1% | |
| Mentor Graphics Corp. (a) | | | 3,081,318 | | | | 24,712,170 | | |
| Cable & Satellite—1.7% | |
| Scripps Networks Interactive, Inc., Class A | | | 7,000,000 | | | | 310,450,000 | | |
| Communications Equipment—0.6% | |
| Cisco Systems, Inc. (a) | | | 4,000,000 | | | | 104,120,000 | | |
| Computer Hardware—0.2% | |
| Diebold, Inc. | | | 1,250,000 | | | | 39,700,000 | | |
| Construction Materials—0.8% | |
| Martin Marietta Materials, Inc. | | | 1,900,000 | | | | 158,745,000 | | |
| Data Processing & Outsourced Services—0.5% | |
| Broadridge Financial Solutions, Inc. | | | 4,343,300 | | | | 92,859,754 | | |
| Distillers & Vintners—2.0% | |
| Diageo PLC (b) | | | 5,683,300 | | | | 383,338,585 | | |
| Diversified Metals & Mining—1.5% | |
| Walter Energy, Inc. (c) | | | 3,000,000 | | | | 276,810,000 | | |
| Drug Retail—1.4% | |
| CVS Caremark Corp. | | | 7,000,000 | | | | 255,920,000 | | |
| Electrical Components & Equipment—1.1% | |
| Rockwell Automation Inc. | | | 3,609,600 | | | | 203,437,056 | | |
OAKMARK EQUITY AND INCOME FUND
18
OAKMARK EQUITY AND INCOME FUND
Schedule of Investments—March 31, 2010 (Unaudited) cont.
Name | |
Shares Held | |
Value | |
| Common Stocks—64.9% (cont.) | |
| Electronic Manufacturing Services—1.0% | |
| Tyco Electronics, Ltd. (d) | | | 6,500,000 | | | $ | 178,620,000 | | |
| Health Care Equipment—7.8% | |
| Covidien PLC (d) | | | 10,600,000 | | | | 532,968,000 | | |
| Hospira, Inc. (a) | | | 7,728,000 | | | | 437,791,200 | | |
| Varian Medical Systems, Inc. (a) | | | 5,700,000 | | | | 315,381,000 | | |
| Steris Corp. | | | 2,873,300 | | | | 96,715,278 | | |
| Kinetic Concepts, Inc. (a) | | | 1,800,000 | | | | 86,058,000 | | |
| | | | 1,468,913,478 | | |
| Health Care Services—2.5% | |
| Laboratory Corp. of America Holdings (a) | | | 4,935,000 | | | | 373,628,850 | | |
| Omnicare, Inc. | | | 3,300,000 | | | | 93,357,000 | | |
| | | | 466,985,850 | | |
| Home Furnishings—1.1% | |
| Mohawk Industries, Inc. (a) | | | 3,420,000 | | | | 185,979,600 | | |
| Leggett & Platt, Inc. | | | 1,327,656 | | | | 28,730,476 | | |
| | | | 214,710,076 | | |
| Home Improvement Retail—1.1% | |
| The Home Depot, Inc. | | | 6,425,500 | | | | 207,864,925 | | |
| Hypermarkets & Super Centers—5.0% | |
| Wal-Mart Stores, Inc. | | | 10,000,000 | | | | 556,000,000 | | |
| Costco Wholesale Corp. | | | 6,426,400 | | | | 383,720,344 | | |
| | | | 939,720,344 | | |
| Industrial Machinery—0.8% | |
| Pentair, Inc. | | | 4,200,000 | | | | 149,604,000 | | |
| Integrated Oil & Gas—2.6% | |
| Cenovus Energy, Inc. (d) | | | 18,500,000 | | | | 484,885,000 | | |
| Life Sciences Tools & Services—0.4% | |
| PerkinElmer, Inc. | | | 3,500,000 | | | | 83,650,000 | | |
| Marine—0.6% | |
| Kirby Corp. (a) (c) | | | 2,809,900 | | | | 107,197,685 | | |
| Oil & Gas Drilling—1.4% | |
| Transocean, Ltd. (a) (d) | | | 3,000,000 | | | | 259,140,000 | | |
OAKMARK EQUITY AND INCOME FUND
19
OAKMARK EQUITY AND INCOME FUND
Schedule of Investments—March 31, 2010 (Unaudited) cont.
Name | | Shares Held/
Par Value | |
Value | |
| Common Stocks—64.9% (cont.) | |
| Oil & Gas Exploration & Production—7.0% | |
| XTO Energy, Inc. | | | 10,000,000 | | | $ | 471,800,000 | | |
| Apache Corp. | | | 4,000,000 | | | | 406,000,000 | | |
| EnCana Corp. (d) | | | 8,250,000 | | | | 255,997,500 | | |
| Concho Resources, Inc. (a) | | | 3,500,000 | | | | 176,260,000 | | |
| | | | 1,310,057,500 | | |
| Packaged Foods & Meats—6.8% | |
| Nestle SA (b) (e) | | | 9,136,000 | | | | 467,891,104 | | |
| ConAgra Foods, Inc. | | | 17,500,000 | | | | 438,725,000 | | |
| Unilever PLC (b) | | | 8,500,000 | | | | 248,880,000 | | |
| Unilever NV (b) | | | 4,000,000 | | | | 120,640,000 | | |
| | | | 1,276,136,104 | | |
| Personal Products—2.8% | |
| Avon Products, Inc. | | | 15,500,000 | | | | 524,985,000 | | |
| Real Estate Investment Trusts—0.1% | |
| Walter Investment Management Corp. (c) | | | 1,093,695 | | | | 17,499,120 | | |
| Reinsurance—1.7% | |
| PartnerRe, Ltd. (d) | | | 3,900,000 | | | | 310,908,000 | | |
| Specialized Consumer Services—0.5% | |
| H&R Block, Inc. | | | 3,300,000 | | | | 58,740,000 | | |
| Weight Watchers International, Inc. | | | 1,085,000 | | | | 27,700,050 | | |
| | | | 86,440,050 | | |
| Specialty Stores—0.4% | |
| Tractor Supply Co. | | | 1,367,300 | | | | 79,371,765 | | |
| Total Common Stocks (Cost: $9,191,271,101) | | | | | | $ | 12,151,275,802 | | |
| Fixed Income—24.0% | |
| Corporate Bonds—0.4% | |
| Leisure Facilities—0.1% | |
| Vail Resorts, Inc., 6.75%, due 2/15/2014 | | $ | 14,897,000 | | | $ | 14,952,864 | | |
| Paper Packaging—0.1% | |
| Sealed Air Corp., 144A, 5.625%, due 7/15/2013 (f) | | | 18,740,000 | | | | 19,804,619 | | |
| Property & Casualty Insurance—0.1% | |
| Fund American Cos., Inc., 5.875%, due 5/15/2013 | | | 20,498,000 | | | | 21,096,890 | | |
OAKMARK EQUITY AND INCOME FUND
20
OAKMARK EQUITY AND INCOME FUND
Schedule of Investments—March 31, 2010 (Unaudited) cont.
Name | |
Par Value | |
Value | |
| Fixed Income—24.0% (cont.) | |
| Semiconductor Equipment—0.1% | |
| ASML Holding NV, 5.75%, due 6/13/2017 | | EUR | 9,660,000 | | | $ | 13,569,175 | | |
| Total Corporate Bonds (Cost: $57,103,093) | | | | | | $ | 69,423,548 | | |
| Government and Agency Securities—23.6% | |
| Canadian Government Bonds—2.1% | |
| Canadian Government Bond, 4.00%, due 6/1/2016 | | CAD | 97,735,000 | | | | 100,960,597 | | |
| Canadian Government Bond, 3.00%, due 6/1/2014 | | CAD | 98,870,000 | | | | 98,465,038 | | |
| Canadian Government Bond, 3.50%, due 6/1/2013 | | CAD | 96,600,000 | | | | 98,337,687 | | |
| Canadian Government Bond, 1.25%, due 6/1/2011 | | CAD | 98,870,000 | | | | 97,489,626 | | |
| | | | 395,252,948 | | |
| Swedish Government Bonds—0.1% | |
| Swedish Government Bond, 3.00%, due 7/12/2016 | | SEK | 200,000,000 | | | | 28,177,437 | | |
| U.S. Government Agencies—4.0% | |
| Federal Farm Credit Bank, 3.50%, due 10/3/2011 | | $ | 96,600,000 | | | | 100,368,946 | | |
| Federal Farm Credit Bank, 0.13%, due 2/22/2012 (g) | | | 93,700,000 | | | | 93,450,758 | | |
| Tennessee Valley Authority, 6.79%, due 5/23/2012 | | | 56,735,000 | | | | 63,240,178 | | |
| Tennessee Valley Authority, 5.50%, due 7/18/2017 | | | 56,515,000 | | | | 62,954,489 | | |
| Federal Farm Credit Bank, 3.875%, due 11/13/2012 | | | 38,645,000 | | | | 40,849,427 | | |
Federal Home Loan Mortgage Corp., 0.75%,
due 2/19/2013 (h) | | | 22,500,000 | | | | 22,493,835 | | |
| Federal Home Loan Bank, 1.30%, due 1/25/2013 (h) | | | 20,000,000 | | | | 20,013,020 | | |
| Federal Home Loan Bank, 1.00%, due 3/15/2013 (h) | | | 20,000,000 | | | | 19,973,860 | | |
Federal National Mortgage Association, 1.00%,
due 3/15/2013 (h) | | | 20,000,000 | | | | 19,945,900 | | |
Federal National Mortgage Association, 1.00%,
due 2/11/2013 (h) | | | 18,500,000 | | | | 18,508,972 | | |
| Federal Farm Credit Bank, 4.50%, due 10/17/2012 | | | 15,215,000 | | | | 16,320,522 | | |
| Federal Farm Credit Bank, 5.125%, due 8/25/2016 | | | 14,130,000 | | | | 15,659,926 | | |
| Federal Home Loan Bank, 0.75%, due 12/11/2012 (h) | | | 15,000,000 | | | | 15,006,855 | | |
| Federal Farm Credit Bank, 3.875%, due 8/25/2011 | | | 14,005,000 | | | | 14,602,271 | | |
| Federal Home Loan Bank, 1.25%, due 3/30/2015 (h) | | | 12,200,000 | | | | 12,153,799 | | |
| Tennessee Valley Authority, 4.375%, due 6/15/2015 | | | 9,660,000 | | | | 10,274,675 | | |
| Federal Farm Credit Bank, 3.85%, due 2/11/2015 | | | 9,415,000 | | | | 9,898,545 | | |
| Federal Farm Credit Bank, 0.278%, due 6/8/2011 (g) | | | 9,885,000 | | | | 9,892,967 | | |
Federal National Mortgage Association, 3.10%,
due 8/18/2015 | | | 9,500,000 | | | | 9,480,981 | | |
Federal National Mortgage Association, 1.00%,
due 9/18/2012 (h) | | | 9,500,000 | | | | 9,463,691 | | |
| Federal Home Loan Bank, 1.00%, due 12/10/2014 (h) | | | 9,450,000 | | | | 9,458,590 | | |
| Federal Home Loan Bank, 1.00%, due 6/8/2012 (h) | | | 9,390,000 | | | | 9,400,075 | | |
Federal Home Loan Mortgage Corp., 3.00%,
due 6/30/2014 (h) | | | 8,780,000 | | | | 8,843,541 | | |
OAKMARK EQUITY AND INCOME FUND
21
OAKMARK EQUITY AND INCOME FUND
Schedule of Investments—March 31, 2010 (Unaudited) cont.
Name | |
Par Value | |
Value | |
| Fixed Income—24.0% (cont.) | |
| U.S. Government Agencies—4.0% (cont.) | |
| Federal Farm Credit Bank, 5.28%, due 8/16/2013 | | $ | 7,245,000 | | | $ | 7,999,422 | | |
| Federal Home Loan Bank, 2.10%, due 12/17/2014 (h) | | | 6,970,000 | | | | 6,938,558 | | |
| Federal Farm Credit Bank, 5.20%, due 11/28/2016 | | | 5,650,000 | | | | 6,229,176 | | |
| Federal Farm Credit Bank, 5.125%, due 6/6/2011 | | | 5,250,000 | | | | 5,523,730 | | |
| Federal Home Loan Bank, 2.00%, due 12/24/2014 (h) | | | 5,500,000 | | | | 5,506,105 | | |
| Federal Farm Credit Bank, 4.875%, due 12/16/2015 | | | 4,710,000 | | | | 5,155,858 | | |
| Federal Farm Credit Bank, 4.92%, due 8/26/2013 | | | 4,710,000 | | | | 5,147,074 | | |
Federal National Mortgage Association, 1.50%,
due 1/12/2015 (h) | | | 5,000,000 | | | | 5,017,735 | | |
Federal National Mortgage Association, 1.25%,
due 11/10/2014 (h) | | | 5,000,000 | | | | 5,004,520 | | |
| Federal Farm Credit Bank, 5.10%, due 8/9/2011 | | | 4,685,000 | | | | 4,957,302 | | |
Federal Home Loan Mortgage Corp., 1.25%,
due 3/16/2015 (h) | | | 4,800,000 | | | | 4,813,474 | | |
Federal National Mortgage Association, 1.125%,
due 12/30/2014 (h) | | | 4,750,000 | | | | 4,779,749 | | |
Federal National Mortgage Association, 1.50%,
due 1/20/2015 (h) | | | 4,750,000 | | | | 4,758,949 | | |
Federal Home Loan Mortgage Corp., 1.00%,
due 3/15/2013 (h) | | | 4,750,000 | | | | 4,750,869 | | |
Federal National Mortgage Association, 1.00%,
due 3/15/2013 (h) | | | 4,750,000 | | | | 4,732,354 | | |
Federal National Mortgage Association, 2.25%,
due 12/15/2014 (h) | | | 4,750,000 | | | | 4,710,523 | | |
Federal National Mortgage Association, 1.00%,
due 9/30/2013 (h) | | | 4,700,000 | | | | 4,685,289 | | |
| Federal Home Loan Bank, 1.375%, due 9/16/2013 (h) | | | 4,700,000 | | | | 4,681,035 | | |
Federal National Mortgage Association, 2.00%,
due 3/30/2016 (h) | | | 4,700,000 | | | | 4,668,656 | | |
| Federal Home Loan Bank, 2.00%, due 9/16/2015 (h) | | | 4,700,000 | | | | 4,665,666 | | |
| Federal Home Loan Bank, 0.625%, due 11/12/2013 (h) | | | 4,650,000 | | | | 4,652,916 | | |
Federal National Mortgage Association, 1.25%,
due 2/25/2015 (h) | | | 4,650,000 | | | | 4,641,918 | | |
Federal National Mortgage Association, 1.00%,
due 3/15/2013 (h) | | | 4,650,000 | | | | 4,619,966 | | |
Federal National Mortgage Association, 2.00%,
due 3/26/2015 (h) | | | 4,600,000 | | | | 4,565,882 | | |
Federal National Mortgage Association, 1.25%,
due 12/30/2014 (h) | | | 4,500,000 | | | | 4,534,173 | | |
| Federal Farm Credit Bank, 5.05%, due 5/25/2011 | | | 3,746,000 | | | | 3,933,884 | | |
| Federal Farm Credit Bank, 4.50%, due 8/8/2011 | | | 2,815,000 | | | | 2,955,660 | | |
| Federal Farm Credit Bank, 4.82%, due 10/12/2012 | | | 2,345,000 | | | | 2,533,015 | | |
| | | | 749,419,281 | | |
OAKMARK EQUITY AND INCOME FUND
22
OAKMARK EQUITY AND INCOME FUND
Schedule of Investments—March 31, 2010 (Unaudited) cont.
Name | |
Par Value | |
Value | |
| Fixed Income—24.0% (cont.) | |
| U.S. Government Notes—17.4% | |
United States Treasury Note, 1.375%, due 7/15/2018,
Inflation Indexed | | $ | 502,375,000 | | | $ | 502,728,170 | | |
| United States Treasury Note, 2.875%, due 1/31/2013 | | | 483,005,000 | | | | 501,646,095 | | |
| United States Treasury Note, 3.25%, due 5/31/2016 | | | 494,340,000 | | | | 500,557,808 | | |
| United States Treasury Note, 0.875%, due 1/31/2012 | | | 500,000,000 | | | | 499,414,000 | | |
| United States Treasury Note, 0.75%, due 11/30/2011 | | | 500,000,000 | | | | 499,316,500 | | |
| United States Treasury Note, 1.375%, due 9/15/2012 | | | 250,000,000 | | | | 250,547,000 | | |
| United States Treasury Note, 1.375%, due 10/15/2012 | | | 250,000,000 | | | | 250,312,500 | | |
| United States Treasury Note, 1.125%, due 12/15/2012 | | | 250,000,000 | | | | 247,832,000 | | |
| | | | 3,252,354,073 | | |
Total Government and Agency Securities
(Cost: $4,320,036,059) | | | | | | $ | 4,425,203,739 | | |
| Total Fixed Income (Cost: $4,377,139,152) | | | | | | $ | 4,494,627,287 | | |
| Short Term Investments—11.4% | |
| Australian Government Bills—0.2% | |
Australian Treasury Bills, 3.76% - 3.85%,
due 4/23/2010 - 6/11/2010 (i) (Cost: $36,681,011) | | AUD | 41,000,000 | | | $ | 37,483,611 | | |
| Canadian Treasury Bills—1.8% | |
Canadian Treasury Bills, 0.45% - 0.84%,
due 4/15/2010 - 3/17/2011 (i) (Cost: $323,290,470) | | CAD | 349,145,000 | | | | 342,694,332 | | |
| Commercial Paper—2.5% | |
American Honda Finance Corp., 0.13% - 0.18%,
due 4/13/2010 - 5/4/2010 (i) | | $ | 96,000,000 | | | | 95,986,063 | | |
Johnson & Johnson, 144A, 0.09% - 0.17%,
due 4/12/2010 - 5/3/2010 (f) (i) | | | 75,000,000 | | | | 74,995,905 | | |
Medtronic, Inc., 144A, 0.13% - 0.16%,
due 4/5/2010 - 4/21/2010 (f) (i) | | | 50,000,000 | | | | 49,997,788 | | |
Microsoft Corp., 144A, 0.10% - 0.18%,
due 4/14/2010 - 8/17/2010 (f) (i) | | | 122,000,000 | | | | 121,942,727 | | |
Procter & Gamble International Funding,
144A, 0.11% - 0.16%, due 4/8/2010 - 4/29/2010 (f) (i) | | | 87,000,000 | | | | 86,993,539 | | |
| Toyota Motor Credit Corp., 0.17%, due 4/26/2010 (i) | | | 10,000,000 | | | | 9,998,725 | | |
| Wal-Mart Stores, Inc., 144A, 0.11%, due 4/1/2010 (f) (i) | | | 20,000,000 | | | | 20,000,000 | | |
| Wellpoint, Inc., 144A, 0.25%, due 4/28/2010 (f) (i) | | | 10,000,000 | | | | 9,998,125 | | |
| Total Commercial Paper (Cost: $469,925,488) | | | | | | | 469,912,872 | | |
OAKMARK EQUITY AND INCOME FUND
23
OAKMARK EQUITY AND INCOME FUND
Schedule of Investments—March 31, 2010 (Unaudited) cont.
Name | |
Par Value | |
Value | |
| Short Term Investments—11.4% (cont.) | |
| U.S. Government Bills—4.5% | |
United States Treasury Bills, 0.14% - 0.41%,
due 4/8/2010 - 12/16/2010 (i) (Cost: $848,956,815) | | $ | 850,000,000 | | | $ | 849,043,200 | | |
| Repurchase Agreement—2.4% | |
Fixed Income Clearing Corp. Repurchase Agreement,
0.00% dated 3/31/2010 due 4/1/2010, repurchase
price $448,257,642, collateralized by a Fannie Mae
Discount Note with a rate of 0.000%, with a maturity
of 3/1/2011, and with a market value plus accrued
interest of $74,718,750, and by a Federal Home Loan
Bank Bond with a rate of 0.750%, with a maturity
of 3/18/2011, and with a market value plus accrued
interest of $255,717,700, and by a Federal Home Loan
Mortgage Corp. Bond, with a rate of 4.125%, with a
maturity of 2/24/2011, and with a market value plus
accrued interest of $126,790,369 (Cost: $448,257,642) | | $ | 448,257,642 | | | | 448,257,642 | | |
| Total Short Term Investments (Cost: $2,127,111,426) | | | | $ | 2,147,391,657 | | |
| Total Investments (Cost: $15,695,521,679)—100.3% | | | | | 18,793,294,746 | | |
| Liabilities In Excess of Other Assets—(0.3)% | | | | | (62,468,755 | ) | |
| Total Net Assets—100% | | | | $ | 18,730,825,991 | | |
(a) Non income-producing security.
(b) Represents a Sponsored American Depositary Receipt.
(c) See Note 5 in the Notes to the Financial Statements regarding investments in affiliated issuers.
(d) Represents a foreign domiciled corporation.
(e) Fair value is determined in good faith in accordance with procedures established by the Board of Trustees.
(f) Security exempt from registration pursuant to Rule 144A under the Securities Act of 1933. These securities may be resold only in transactions exempt from registration, normally to qualified institutional buyers.
(g) Floating Rate Note. Rate shown is as of March 31, 2010.
(h) Step-Coupon.
(i) The rate shown represents the annualized yield at the time of purchase; not a coupon rate.
Key to abbreviations:
AUD: Australian Dollar
CAD: Canadian Dollar
EUR: Euro
SEK: Swedish Krona
See accompanying Notes to Financial Statements.
OAKMARK EQUITY AND INCOME FUND
24
OAKMARK GLOBAL FUND
Report from Clyde S. McGregor and Robert A. Taylor, Portfolio Managers


THE VALUE OF A $10,000 INVESTMENT IN OAKMARK GLOBAL FUND FROM ITS INCEPTION (8/4/99) TO PRESENT (3/31/10) AS COMPARED TO THE MSCI WORLD INDEX12 (UNAUDITED)

| | | | | Average Annual Total Returns
(as of 3/31/10) | |
| (Unaudited) | | Total Return
Last 3 Months* | | 1-year | | 5-year | | 10-year | | Since
Inception
(8/4/99) | |
Oakmark Global
Fund (Class I) | | | 6.67 | % | | | 73.29 | % | | | 6.55 | % | | | 12.38 | % | | | 11.64 | % | |
| MSCI World | | | 3.24 | % | | | 52.37 | % | | | 2.89 | % | | | -0.03 | % | | | 1.53 | % | |
| Lipper Global Fund Index13 | | | 3.24 | % | | | 49.93 | % | | | 4.04 | % | | | 0.90 | % | | | 3.26 | % | |
The graph and table do not reflect the deduction of taxes that a shareholder would pay on fund distributions or the redemption of fund shares.
The expense ratio for Class I shares as of 9/30/09 was 1.23%.
The performance data quoted represents past performance. The above performance information for the Fund does not reflect the imposition of a 2% redemption fee on shares redeemed within 90 days. If reflected, the fee would reduce the performance quoted. Past performance does not guarantee future results. The investment return and principal value will fluctuate so that an investor's shares, when redeemed, may be worth more or less than their original cost. Current performance may be lower or higher than the performance data quoted. Average annual total return measures annualized change, while total return measures aggregate change. To obtain most recent month-end performance data, visit oakmark.com.
* Not annualized
Quarter Review
The March quarter proved profitable for the Oakmark Global Fund. The Fund gained nearly 7%, which contrasts to 3% for the MSCI World Index and 3% for the Lipper Global Fund Index. For the six months of the Fund's fiscal year, the returns are 11% for the Fund, 7% for the MSCI World Index, and 8% for the Lipper Global Fund Index. As always, we are most pleased to report the Fund's 12% compound annualized rate of return since inception. Double-digit compounded rates of return in a low-inflation environment grow shareholder wealth, our ultimate goal for the Fund's shareowners.
The countries that had the largest positive effect on the Fund's quarter were the U.S., Switzerland, and Japan, which also happen to be the countries with the largest weights in the portfolio. In fact, the Fund's holdings domiciled in these three countries constitute nearly three-fourths of the total portfolio. Countries where holdings generated losses for the Fund included the U.K., Italy, and France.
The stock that contributed the most (by far) to the Fund's three-month return was Live Nation Entertainment, the U.S.-based concert promotion and venue concern. Throughout the Fund's history, a recurring theme has been for disappointing holdings suddenly to bounce back strongly, often when least expected, and that has certainly been the case with Live Nation. During the downturn, investors feared that concert attendance would collapse, and this fear severely depressed Live Nation's share price. We observed, however, that concert attendance had proven fairly recession-resistant in the past, and when it became clear that the company's fundamentals had weathered the recent downturn well, the share price experienced an outstanding recovery. Other strong contributors to the Fund's return included OMRON (Japan), Richemont (Switzerland), Union Pacific (U.S.), and ROHM (Japan). Stocks with negative impacts on the Fund's return included Daimler (Germ any), Alliant Techsystems (U.S.), and Toyota (Japan).
Toyota
The March quarter proved to be quite challenging for Toyota, a Global Fund 2008 vintage purchase. Several Toyota product lines were alleged to have
OAKMARK GLOBAL FUND
25
serious quality issues and the company announced a massive auto recall during February. Although Toyota's management may have responded too cautiously in this crisis, we believe that the Toyota brand name remains strong and that developments in the product recall are now evolving favorably. There may be some long-term damage to Toyota's per share value given all that has transpired, but we believe that the share price decline over the past few months is larger than any lost business value. We admit that the product liability lawsuit flow likely will grow in the future, and some estimates suggest that losses from those suits could fall in a range of $3-5 billion. With net cash and securities worth more than $50 billion on its balance sheet, we believe Toyota currently has ample liquidity to cover this level of loss. In addition, we believe the company can continue to generate $5-10 billion in annual free cash flow.
Recent events aside, Akio Toyoda has impressed us with the steps he has taken since becoming Toyota president less than one year ago. He closed down the money-losing Formula One team, despite his well-known love for race cars. He also announced the closure of the only unionized Toyota car plant in the United States because it suffered the lowest productivity. These actions impress us because they went against the trend for Japanese management teams, many of which are not shareholder-oriented and instead focus on permanent employment for their workforce. Finally, he is removing the previous management's market-share focus and replacing it with an emphasis on quality and customer satisfaction. We expect this to restore customer faith in the Toyota brand and allow for reasonable growth in the future. We added to our position in Toyota during the quarter and still see it as one of the most attractive companies represented in the Fund.
Portfolio Activity
We added four new companies to the portfolio during the first quarter while eliminating three. The eliminations were Alliant Techsystems (U.S.), GAM (Switzerland), and MDS (Canada). We wrote at length (ad nauseam?) about the Fund's experience with MDS six months ago and are pleased that a partial rebound in its share price afforded us the ability to move capital to more attractive names. GAM shares were spun out of the Fund's holding in Julius Baer; although both GAM and Alliant have been profitable Fund holdings, we perceived more opportunity elsewhere.
We initiated positions in two U.S. names, Sara Lee and Applied Materials, along with Australian-domiciled Primary Health Care and Mexico-based FEMSA. Our investment in FEMSA is the only emerging market listed company in the Fund. FEMSA owns the largest Coke bottler in Latin and South America as well as Oxxo, the largest convenience store operator in Mexico. FEMSA is in the process of selling its beer operations to Heineken. We initiated the position in the Fund after FEMSA's share price fell on the news of Heineken's proposed price for the beer business, as many thought this unit warranted a higher price. Not only is the transaction price in line with our expectations for that unit, but as FEMSA shareholders, the Fund will receive what we believe is undervalued Heineken stock in the deal and still own the Coke business and Oxxo for what we perceive to be less than fair value.
We have received many questions from investors regarding our limited exposure to companies listed in emerging markets. In our opinion, certain markets, like Russia, exhibit such weak rule of law and corporate governance that we will not put our shareholders' money at risk in those regions, regardless of price. Other markets, such as India, are suitable for investment, but investor expectations can be so euphoric as to make it nearly impossible to identify any value there. It is much cheaper to purchase shares of businesses domiciled in developed markets that have significant emerging market penetration. For example, Richemont, the company that owns the coveted Cartier brand name (and many others), sells at just 15 times next year's earnings yet has over 30% of its business originating in emerging markets.
Although we are not finding value in emerging markets, we do spend significant time researching these markets. Over the past eighteen months our analysts have traveled to China, India, Brazil, Mexico, Indonesia, Malaysia, South Korea, Taiwan and Thailand. We encourage this effort to ensure that we know those countries' most impressive businesses and management teams so that we may react quickly when such companies become more attractively priced. As you may recall, the Oakmark International Fund invested over 25% of its assets in emerging markets during the 1997-1998 emerging market crisis. It is important to remember the risks associated with investing in such countries. Their stock markets are relatively illiquid, which means that unstable governments and economies can significantly and rapidly affect share prices. We require emerging market domiciled companies to be cheaper to compensate the Fund's shareholders for these risks.
OAKMARK GLOBAL FUND
26
Shifting gears to the new U.S. names, Applied Materials and Sara Lee both have attractive share prices but have very different investment concepts. We believe Applied Materials' share price is unduly depressed for cyclical reasons while Sara Lee is in the midst of an evolving corporate restructuring. Applied Materials is the largest capital equipment supplier for manufacturing semiconductors and liquid crystal display (LCD) panels. The company enjoys dominant market shares and a strong balance sheet. Applied entered the solar energy business during the last decade, and although solar is very sensitive to the level of government subsidies offered, we believe that we are not paying anything currently for what should be an interesting long-term option. In contrast, many of Sara Lee's products may be familiar to you from supermarket visits (e.g. Hillshire Farms, Jimmy Dean, etc.), though the company's strongest product set is probably its international beverage division. Sara Lee's management is in the process of selling the company's international household and body care business, the proceeds from which are expected to be applied to debt reduction and share repurchase. Combined with an attractive dividend yield, we believe that Sara Lee shares offer interesting total return potential.
As always, we thank you for your support and welcome your questions and comments.
Clyde S. McGregor, CFA
Portfolio Manager
oakgx@oakmark.com | | Robert A. Taylor, CFA
Portfolio Manager
oakgx@oakmark.com | |
|
March 31, 2010
OAKMARK GLOBAL FUND
27
OAKMARK GLOBAL FUND
Global Diversification—March 31, 2010 (Unaudited)

OAKMARK GLOBAL FUND
28
OAKMARK GLOBAL FUND
Schedule of Investments—March 31, 2010 (Unaudited)
| Name | | Description | | Shares Held | | Value | |
| Common Stocks—96.3% | |
| Aerospace & Defense—1.3% | |
| ITT Corp. (United States) | | Designs & Manufactures a Variety of
Engineered Products & Military
Defense Systems | | | 480,000 | | | $ | 25,732,799 | | |
| Apparel, Accessories & Luxury Goods—4.8% | |
Cie Financiere
Richemont
SA (Switzerland) | | Manufacturer & Retailer of
Luxury Goods | | | 1,475,500 | | | | 57,136,442 | | |
| Bulgari SpA (Italy) | | Jewelry Manufacturer & Retailer | | | 4,772,493 | | | | 38,869,199 | | |
| | | | 96,005,641 | | |
| Application Software—2.9% | |
| SAP AG (Germany) | | Develops Business Software | | | 1,204,700 | | | | 58,348,833 | | |
| Asset Management & Custody Banks—3.5% | |
Julius Baer Group, Ltd.
(Switzerland) | | Asset Management | | | 1,944,800 | | | | 70,550,645 | | |
| Automobile Manufacturers—6.0% | |
| Toyota Motor Corp. (Japan) | | Automobile Manufacturer | | | 1,531,500 | | | | 61,348,460 | | |
Daimler AG Registered
(Germany) | | Automobile Manufacturer | | | 1,235,300 | | | | 58,154,122 | | |
| | | | 119,502,582 | | |
| Broadcasting—6.1% | |
Societe Television
Francaise 1 (France) | | Broadcasting & Cable TV | | | 3,807,000 | | | | 70,624,358 | | |
Discovery
Communications, Inc.,
Class C (United States) (a) | | Media Management &
Network Services | | | 1,550,150 | | | | 45,589,912 | | |
Discovery
Communications, Inc.,
Class A (United States) (a) | | Media Management &
Network Services | | | 179,200 | | | | 6,055,168 | | |
| | | | 122,269,438 | | |
| Building Products—1.9% | |
Assa Abloy AB, Series B
(Sweden) | | Develops, Designs &
Manufactures Security Locks | | | 1,914,400 | | | | 37,462,914 | | |
OAKMARK GLOBAL FUND
29
OAKMARK GLOBAL FUND
Schedule of Investments—March 31, 2010 (Unaudited) cont.
| Name | | Description | | Shares Held | | Value | |
| Common Stocks—96.3% (cont.) | |
| Distillers & Vintners—1.9% | |
Diageo PLC
(United Kingdom) | | Beverages, Wines & Spirits
Manufacturer | | | 2,321,800 | | | $ | 38,968,022 | | |
| Diversified Banks—1.0% | |
Bank of Ireland
(Ireland) (a) | | Commercial Bank | | | 9,370,700 | | | | 20,250,465 | | |
| Diversified Capital Markets—5.9% | |
Credit Suisse Group
(Switzerland) | | Wealth Management &
Investment Banking | | | 1,281,000 | | | | 66,030,301 | | |
| UBS AG (Switzerland) (a) | | Wealth Management &
Investment Banking | | | 3,180,020 | | | | 51,693,421 | | |
| | | | 117,723,722 | | |
| Electronic Components—1.4% | |
| OMRON Corp. (Japan) | | Component, Equipment &
System Manufacturer | | | 1,168,900 | | | | 27,131,383 | | |
| Electronic Manufacturing Services—2.2% | |
Tyco Electronics, Ltd.
(Switzerland) | | Manufactures Electronic
Components | | | 1,581,200 | | | | 43,451,376 | | |
| Health Care Equipment—2.8% | |
| Covidien PLC (Ireland) | | Health Care Equipment & Supplies | | | 1,098,000 | | | | 55,207,440 | | |
| Health Care Services—5.2% | |
Laboratory Corp. of
America Holdings
(United States) (a) | | Medical Laboratory &
Testing Services | | | 1,043,200 | | | | 78,980,672 | | |
Primary Health Care, Ltd.
(Australia) | | Health Care Service Provider | | | 6,304,760 | | | | 25,745,758 | | |
| | | | 104,726,430 | | |
| Home Entertainment Software—3.7% | |
Square Enix Holdings
Co., Ltd. (Japan) | | Develops & Sells Entertainment
Software for Video Game Consoles | | | 3,367,000 | | | | 73,613,734 | | |
| Human Resource & Employment Services—2.6% | |
| Adecco SA (Switzerland) | | Temporary Employment Services | | | 914,000 | | | | 51,880,596 | | |
| Industrial Conglomerates—2.5% | |
| Rheinmetall AG (Germany) | | Automotive Pump Manufacturer | | | 688,400 | | | | 49,306,646 | | |
OAKMARK GLOBAL FUND
30
OAKMARK GLOBAL FUND
Schedule of Investments—March 31, 2010 (Unaudited) cont.
| Name | | Description | | Shares Held | | Value | |
| Common Stocks—96.3% (cont.) | |
| Industrial Machinery—4.4% | |
Snap-On, Inc.
(United States) | | Tool & Equipment Manufacturer | | | 2,017,000 | | | $ | 87,416,780 | | |
| Investment Banking & Brokerage—3.8% | |
Daiwa Securities
Group, Inc. (Japan) | | Stock Broker | | | 14,642,000 | | | | 77,054,915 | | |
| Movies & Entertainment—2.4% | |
Live Nation
Entertainment, Inc.
(United States) (a) | | Live Events Producer, Operator, &
Promoter | | | 3,296,600 | | | | 47,800,700 | | |
| Office Electronics—4.4% | |
| Neopost SA (France) | | Mailroom Equipment Supplier | | | 611,575 | | | | 48,875,844 | | |
| Canon, Inc. (Japan) | | Computers & Information | | | 850,100 | | | | 39,372,478 | | |
| | | | 88,248,322 | | |
| Oil & Gas Exploration & Production—2.1% | |
Apache Corp.
(United States) | | Oil & Natural Gas Exploration &
Production | | | 404,500 | | | | 41,056,750 | | |
XTO Energy, Inc.
(United States) | | Oil & Natural Gas Exploration &
Production | | | 39,300 | | | | 1,854,174 | | |
| | | | 42,910,924 | | |
| Packaged Foods & Meats—2.2% | |
Sara Lee Corp.
(United States) | | Manufactures & Markets Brand
Name Products for Consumers
Worldwide | | | 3,180,500 | | | | 44,304,365 | | |
| Railroads—2.9% | |
Union Pacific Corp.
(United States) | | Rail Transportation Provider | | | 795,100 | | | | 58,280,830 | | |
| Research & Consulting Services—2.2% | |
Equifax, Inc.
(United States) | | Information Management,
Transaction Processing,
Direct Marketing & Customer
Relationship Management | | | 869,800 | | | | 31,138,840 | | |
| Meitec Corp. (Japan) | | Software Engineering Services | | | 664,000 | | | | 13,004,428 | | |
| | | | 44,143,268 | | |
OAKMARK GLOBAL FUND
31
OAKMARK GLOBAL FUND
Schedule of Investments—March 31, 2010 (Unaudited) cont.
| Name | | Description | | Shares Held | | Value | |
| Common Stocks—96.3% (cont.) | |
| Semiconductor Equipment—2.0% | |
Applied Materials, Inc.
(United States) | | Develops, Manufactures, Markets &
Services Semiconductor Wafer
Fabrication Equipment | | | 2,903,000 | | | $ | 39,132,440 | | |
| Semiconductors—6.1% | |
| ROHM Co., Ltd. (Japan) | | Integrated Circuits & Semiconductor
Devices Manufacturer | | | 836,600 | | | | 62,460,884 | | |
Intel Corp.
(United States) | | Computer Component
Manufacturer & Designer | | | 2,720,200 | | | | 60,551,652 | | |
| | | | 123,012,536 | | |
| Soft Drinks—1.8% | |
Fomento Economico
Mexicano S.A.B. de C.V.
(Mexico) (b) | | Beverage Company | | | 753,500 | | | | 35,813,855 | | |
| Specialty Chemicals—2.3% | |
International Flavors &
Fragrances, Inc.
(United States) | | Manufactures Flavors & Fragrance
Products | | | 686,500 | | | | 32,725,455 | | |
Givaudan SA
(Switzerland) | | Manufactures & Markets Fragrances | | | 15,300 | | | | 13,422,325 | | |
| | | | 46,147,780 | | |
| Systems Software—4.0% | |
Oracle Corp.
(United States) | | Software Services | | | 3,086,200 | | | | 79,284,478 | | |
| Total Common Stocks (Cost: $1,631,896,661) | | | | | | | | $ | 1,925,683,859 | | |
OAKMARK GLOBAL FUND
32
OAKMARK GLOBAL FUND
Schedule of Investments—March 31, 2010 (Unaudited) cont.
| Name | | Par Value | | Value | |
| Short Term Investment—3.5% | |
| Repurchase Agreement—3.5% | |
Fixed Income Clearing Corp. Repurchase Agreement,
0.00% dated 3/31/2010 due 4/1/2010, repurchase
price $69,456,930, collateralized by a Federal
Home Loan Bank Bond, with a rate of 0.750%,
with a maturity of 3/18/2011, and with a market
value plus accrued interest of $19,969,800, and
by a Federal National Mortgage Association Bond,
with a rate of 1.750%, with a maturity of 3/23/2011,
and with a market value plus accrued interest of $50,878,125
(Cost: $69,456,930) | | $ | 69,456,930 | | | $ | 69,456,930 | | |
| Total Short Term Investment (Cost: $69,456,930) | | | | $ | 69,456,930 | | |
| Total Investments (Cost: $1,701,353,591)—99.8% | | | | | 1,995,140,789 | | |
| Foreign Currencies (Cost: $632,553)—0.0% | | | | | 627,817 | | |
| Other Assets In Excess of Liabilities—0.2% | | | | | 3,461,413 | | |
| Total Net Assets—100% | | | | $ | 1,999,230,019 | | |
(a) Non income-producing security.
(b) Represents a Sponsored American Depositary Receipt.
See accompanying Notes to Financial Statements.
OAKMARK GLOBAL FUND
33
OAKMARK GLOBAL SELECT FUND
Report from Bill Nygren and David Herro, Portfolio Managers


THE VALUE OF A $10,000 INVESTMENT IN OAKMARK GLOBAL SELECT FUND FROM ITS INCEPTION (10/2/06) TO PRESENT (3/31/10) AS COMPARED TO THE MSCI WORLD INDEX12 (UNAUDITED)
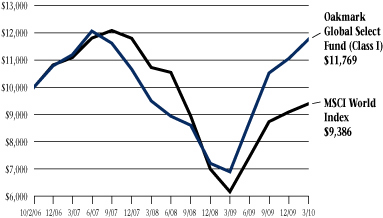
| | | Total Returns
(as of 3/31/10) | |
| (Unaudited) | | Last 3 Months* | | 1-year | | Average Annual
Total Return
Since Inception
(10/2/06) | |
Oakmark Global
Select Fund (Class I) | | | 6.41 | % | | | 70.74 | % | | | 4.77 | % | |
| MSCI World | | | 3.24 | % | | | 52.37 | % | | | -1.80 | % | |
| Lipper Global Fund Index13 | | | 3.24 | % | | | 49.93 | % | | | -0.52 | % | |
The graph and table do not reflect the deduction of taxes that a shareholder would pay on fund distributions or the redemption of fund shares.
The expense ratio for Class I shares as of 9/30/09 was 1.43%.
The performance data quoted represents past performance. The above performance information for the Fund does not reflect the imposition of a 2% redemption fee on shares redeemed within 90 days. If reflected, the fee would reduce the performance quoted. Past performance does not guarantee future results. The investment return and principal value will fluctuate so that an investor's shares, when redeemed, may be worth more or less than their original cost. Current performance may be lower or higher than the performance data quoted. Average annual total return measures annualized change, while total return measures aggregate change. To obtain most recent month-end performance data, visit oakmark.com.
* Not annualized
The Oakmark Global Select Fund returned 6% for the quarter ended March 31, 2010, compared to the MSCI World Index, which returned 3% for the same period. Since inception, the Fund has returned an average of 5% per year, outperforming the MSCI World Index, which has averaged -2% per year over the same period.
For the second quarter in a row, Swiss-based Compagnie Financiere Richemont ("Richemont"), a luxury goods manufacturer and retailer of brands such as Cartier and Montblanc, was the top contributor to the Fund's performance, returning 15.5%. During the past quarter, the market reacted favorably to the company's strong fourth quarter 2009 results. Regionally, the company's sales increased the most in Asia. Sales in the U.S. also grew due to improved consumer confidence. Richemont's strong portfolio of brands has held up well through the economic downturn, and their sizeable presence in emerging markets has contributed to their strong relative performance. Because the company's balance sheet contains nearly one billion euros in net cash, we believe that our investment carries little risk—no matter how long it takes the company's sales to return to normalized levels. We maintain our belief that Richemont is very well positioned, owns one of the premier portfolios of luxury brands, and has a world-class management team. Trading at just 15 times next year's earnings, it is a solid investment opportunity.
Another top contributor to Fund performance was Comcast Corp, a U.S.-based cable service provider, which returned 12.6% for the quarter. Comcast's recent results stem from another quarter of good free cash flow generation and lower maintenance capital spending requirements. We believe Comcast has one of the best clustered cable systems in the industry, and its superior management team maintains capital discipline, keeping the company in solid financial condition.
The biggest detractor from Fund performance for the quarter was Toyota Motor. Please reference the Oakmark Global Fund letter for commentary regarding Toyota. Another detractor from performance for the quarter was Texas Instruments, a U.S.-based semiconductor manufacturer, falling 5.8%. Even though the company experienced a strong rebound in sales and earnings, some investors were disappointed that the company's margins didn't improve even more rapidly. We
OAKMARK GLOBAL SELECT FUND
34
remain pleased with the strong management team and the company's investments in future growth, and we continue to believe that the stock is undervalued.
There were minor changes to the portfolio during the quarter. We eliminated our position in DirecTV and used the proceeds to purchase Liberty Interactive, a U.S.-based interactive retailing group that owns QVC and other online retailers. QVC, which accounts for 80% of the company's value, reported great results from the fourth quarter of 2009. Its Black Friday sales increased 60% compared to last year, and the retailer had its busiest day ever on Cyber Monday. Despite improvements in revenue and margins, Liberty Interactive continues to trade at a discount to intrinsic value.
Due to the euro's continued weakness, we decreased our euro hedges to approximately 12%. Additionally, we decreased our Swiss franc hedge to approximately 22%, and our Japanese yen hedge remained relatively unchanged at approximately 25%.
As long-term value investors, we continue to focus on finding under-valued companies trading at attractive prices that are run by management teams who focus on building shareholder value. We are confident in our valuation approach and believe that the Fund is well positioned to generate long-term results. We thank you for your continued confidence and support, and we welcome any questions you may have.
William C. Nygren, CFA
Portfolio Manager
oakwx@oakmark.com | | David G. Herro, CFA
Portfolio Manager
oakwx@oakmark.com | |
|
March 31, 2010
OAKMARK GLOBAL SELECT FUND
35
OAKMARK GLOBAL SELECT FUND
Global Diversification—March 31, 2010 (Unaudited)

OAKMARK GLOBAL SELECT FUND
36
OAKMARK GLOBAL SELECT FUND
Schedule of Investments—March 31, 2010 (Unaudited)
| Name | | Description | | Shares Held | | Value | |
| Common Stocks—94.0% | |
| Apparel, Accessories & Luxury Goods—6.0% | |
Cie Financiere
Richemont SA
(Switzerland) | | Manufacturer & Retailer
of Luxury Goods | | | 547,000 | | | $ | 21,181,723 | | |
| Application Software—4.9% | |
| SAP AG (Germany) | | Develops Business Software | | | 356,500 | | | | 17,266,837 | | |
| Automobile Manufacturers—5.1% | |
| Toyota Motor Corp. (Japan) | | Automobile Manufacturer | | | 450,000 | | | | 18,025,992 | | |
| Broadcasting—6.1% | |
Societe Television
Francaise 1 (France) | | Broadcasting & Cable TV | | | 1,161,000 | | | | 21,537,925 | | |
| Cable & Satellite—7.3% | |
Comcast Corp., Class A
(United States) | | Cable Communication Networks
Provider | | | 880,000 | | | | 15,813,600 | | |
British Sky Broadcasting
Group PLC
(United Kingdom) | | Television Production &
Broadcasting | | | 1,078,000 | | | | 9,847,901 | | |
| | | | 25,661,501 | | |
| Catalog Retail—4.6% | |
Liberty Media Corp. -
Interactive, Class A
(United States) (a) | | Home & Internet Shopping
Online Travel | | | 1,050,000 | | | | 16,075,500 | | |
| Computer & Electronics Retail—4.4% | |
Best Buy Co., Inc.
(United States) | | Computer & Electronics Retailer | | | 360,000 | | | | 15,314,400 | | |
| Computer Hardware—3.8% | |
| Dell, Inc. (United States) (a) | | Technology Products & Services | | | 878,000 | | | | 13,178,780 | | |
| Consumer Finance—4.1% | |
Capital One Financial
Corp. (United States) | | Credit Card Products & Services
Provider | | | 350,000 | | | | 14,493,500 | | |
| Diversified Capital Markets—5.3% | |
| UBS AG (Switzerland) (a) | | Wealth Management & Investment
Banking | | | 1,138,000 | | | | 18,498,976 | | |
OAKMARK GLOBAL SELECT FUND
37
OAKMARK GLOBAL SELECT FUND
Schedule of Investments—March 31, 2010 (Unaudited) cont.
| Name | | Description | | Shares Held | | Value | |
| Common Stocks—94.0% (cont.) | |
| Human Resource & Employment Services—6.7% | |
| Adecco SA (Switzerland) | | Temporary Employment Services | | | 415,000 | | | $ | 23,556,288 | | |
| Integrated Oil & Gas—4.6% | |
Cenovus Energy, Inc.
(Canada) | | Integrated Oil Company | | | 612,900 | | | | 16,064,109 | | |
| Investment Banking & Brokerage—4.9% | |
Daiwa Securities
Group, Inc. (Japan) | | Stock Broker | | | 3,234,000 | | | | 17,019,232 | | |
| Movies & Entertainment—3.8% | |
Time Warner, Inc.
(United States) | | Filmed Entertainment &
Television Networks | | | 423,333 | | | | 13,237,623 | | |
| Other Diversified Financial Services—3.8% | |
Bank of America Corp.
(United States) | | Banking & Financial Services | | | 756,500 | | | | 13,503,525 | | |
| Pharmaceuticals—4.0% | |
Bristol-Myers Squibb Co.
(United States) | | Health & Personal Care | | | 525,000 | | | | 14,017,500 | | |
| Semiconductors—14.6% | |
| ROHM Co., Ltd. (Japan) | | Integrated Circuits & Semiconductor
Devices Manufacturer | | | 288,000 | | | | 21,502,193 | | |
| Intel Corp. (United States) | | Computer Component
Manufacturer & Designer | | | 682,000 | | | | 15,181,320 | | |
Texas Instruments, Inc.
(United States) | | Designs & Supplies Digital Signal
Processing & Analog Technologies | | | 595,000 | | | | 14,559,650 | | |
| | | | 51,243,163 | | |
| Total Common Stocks (Cost: $301,619,165) | | | | | | | | $ | 329,876,574 | | |
OAKMARK GLOBAL SELECT FUND
38
OAKMARK GLOBAL SELECT FUND
Schedule of Investments—March 31, 2010 (Unaudited) cont.
| Name | | Par Value | | Value | |
| Short Term Investment—5.2% | |
| Repurchase Agreement—5.2% | |
Fixed Income Clearing Corp. Repurchase Agreement,
0.00% dated 3/31/2010 due 4/1/2010, repurchase
price $18,088,991, collateralized by a Federal Home
Loan Mortgage Corp. Bond, with a rate of 4.125%,
with a maturity of 2/24/2011, and with a market
value plus accrued interest of $18,455,613
(Cost: $18,088,991) | | $ | 18,088,991 | | | $ | 18,088,991 | | |
| Total Short Term Investment (Cost: $18,088,991) | | | | $ | 18,088,991 | | |
| Total Investments (Cost: $319,708,156)—99.2% | | | | | 347,965,565 | | |
| Other Assets In Excess of Liabilities—0.8% | | | | | 2,891,391 | | |
| Total Net Assets—100% | | | | $ | 350,856,956 | | |
(a) Non income-producing security.
See accompanying Notes to Financial Statements.
OAKMARK GLOBAL SELECT FUND
39
OAKMARK INTERNATIONAL FUND
Report from David G. Herro and Robert A. Taylor, Portfolio Managers


THE VALUE OF A $10,000 INVESTMENT IN OAKMARK INTERNATIONAL FUND FROM ITS INCEPTION (9/30/92) TO PRESENT (3/31/10) AS COMPARED TO THE MSCI WORLD EX U.S. INDEX14 (UNAUDITED)

| | | | | Average Annual Total Returns
(as of 3/31/10) | |
| (Unaudited) | | Total Return
Last 3 Months* | | 1-year | | 5-year | | 10-year | | Since
Inception
(9/30/92) | |
Oakmark International
Fund (Class I) | | | 5.70 | % | | | 82.17 | % | | | 7.17 | % | | | 8.80 | % | | | 10.83 | % | |
| MSCI World ex U.S. | | | 1.35 | % | | | 55.96 | % | | | 4.33 | % | | | 1.70 | % | | | 6.50 | % | |
| MSCI EAFE15 | | | 0.87 | % | | | 54.44 | % | | | 3.75 | % | | | 1.27 | % | | | 6.16 | % | |
Lipper International
Fund Index16 | | | 1.88 | % | | | 57.29 | % | | | 5.28 | % | | | 2.08 | % | | | 7.48 | % | |
The graph and table do not reflect the deduction of taxes that a shareholder would pay on fund distributions or the redemption of fund shares.
The expense ratio for Class I shares as of 9/30/09 was 1.17%.
The performance data quoted represents past performance. The above performance information for the Fund does not reflect the imposition of a 2% redemption fee on shares redeemed within 90 days. If reflected, the fee would reduce the performance quoted. Past performance does not guarantee future results. The investment return and principal value will fluctuate so that an investor's shares, when redeemed, may be worth more or less than their original cost. Current performance may be lower or higher than the performance data quoted. Average annual total return measures annualized change, while total return measures aggregate change. To obtain most recent month-end performance data, visit oakmark.com.
* Not annualized
The Oakmark International Fund returned 6% for the quarter ended March 31, 2010, comparing favorably to the MSCI World ex U.S. Index, which returned 1% over the same period. Most importantly, the Fund has returned an average of 11% per year since its inception in September 1992, outperforming the MSCI World ex U.S. Index, which has averaged 7% per year over the same period.
The global economy continues to recover. The Fund's top contributor this quarter, Japan-based OMRON, which returned 30.6%, benefited from improving market conditions. OMRON manufactures electronic components and systems for factory automation. Over the past few years, shares were negatively impacted by fears of a prolonged economic downturn. In fact, OMRON did experience a decrease in orders as end market demand eroded; however, this market is recovering, and OMRON has experienced increased demand across all of its divisions. Additionally, in reaction to the downturn, management implemented a cost-reduction plan, which generated benefits more quickly than expected. When OMRON's order book increases, we expect its margins to return to more normal levels. Another top contributor for the quarter was U.K.-based Signet Jewelers, returning 21%. The company's cost-savings plan continues to deliver, and we believe that Signet will exit the cycle in a much stronger competitive position.
The largest detractor from Fund performance during the quarter was Daimler, the premium auto manufacturer of the Mercedes brand, which dropped 11.7%. The market responded negatively when Daimler cancelled its dividend, a decision management made in order to avoid consolidating operating losses which would have reduced reserves and limited the company's future payout capabilities. We believe that the right capital allocation decision was made here, and we appreciate management's longer term strategic focus on building shareholder value. We also believe that the management team is stronger after the company renewed the contract of Dieter Zetsche, Chairman, and appointed Wolfgang Bernhard to head production and procurement. The company's financial discipline also remains sound. Management has structurally improved the business by removing billions of costs and by planning to improve efficiency through a broad range
OAKMARK INTERNATIONAL FUND
40
of pending initiatives. In addition, the U.S. auto market has shown signs of recovery, while growth has accelerated in new markets such as China. Daimler's successful model launches and shift towards Asia should also improve the company's results. After years of unprecedented weakness in trucks, the market seems finally set for a comeback, and Daimler's global engine platform makes it well positioned to benefit. We remain positive about the company's long-term outlook and view the recent weakness as another opportunity to invest at attractive prices. Another large detractor to the Fund during the quarter was Toyota Motor. Please reference the Oakmark Global Fund letter for commentary on Toyota.
The Fund experienced above-average trade activity this quarter as we eliminated our positions in Atlas Copco, Compass Group, EnCana, Telecinco, L'Oreal, Rolls Royce and Unilever. We purchased three new names: Banco Santander, a Spanish-based multi-national banking conglomerate; Japan Tobacco, a Japanese manufacturer and distributor of tobacco products; and KT&G, a South Korean tobacco products manufacturer and reseller.
Geographical composition remained steady with Europe accounting for 70% of the Fund, the Pacific Rim accounting for 24%, and Latin and North America accounting for 6%. The remainder, excluding cash, is invested in the Middle East.
Global currency fluctuations during the quarter affected the Fund's hedging exposure. Due to the euro's continued weakness, we decreased our underlying euro hedge to approximately 11%. Our Japanese yen hedge remained relatively unchanged from last quarter at approximately 26%, and we decreased our hedge of the Swiss franc to 27%.
Global equity markets continued to improve during the first quarter of 2010. Previous market volatility has enabled us to build a portfolio of what we believe are high-quality, under-valued names that could generate long-term positive returns. We are pleased to deliver positive returns to our shareholders and look forward to what lies ahead in 2010. Thank you for your continued support.
David G. Herro, CFA
Portfolio Manager
oakix@oakmark.com | | Robert A. Taylor, CFA
Portfolio Manager
oakix@oakmark.com | |
|
March 31, 2010
OAKMARK INTERNATIONAL FUND
41
OAKMARK INTERNATIONAL FUND
Global Diversification—March 31, 2010 (Unaudited)
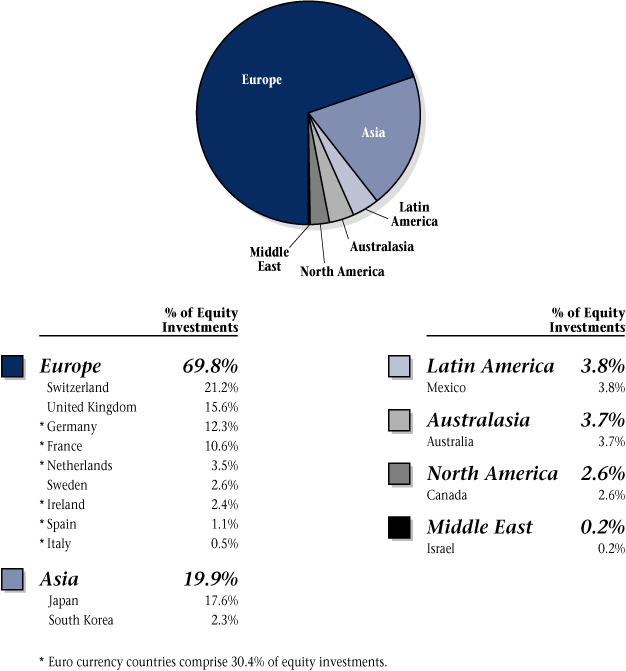
OAKMARK INTERNATIONAL FUND
42
OAKMARK INTERNATIONAL FUND
Schedule of Investments—March 31, 2010 (Unaudited)
| Name | | Description | | Shares Held | | Value | |
| Common Stocks—95.1% | |
| Advertising—2.6% | |
Publicis Groupe SA
(France) | | Advertising & Media Services | | | 3,089,900 | | | $ | 132,212,517 | | |
| Aerospace & Defense—0.6% | |
BAE Systems PLC
(United Kingdom) | | Develops, Delivers & Supports
Advanced Aerospace &
Defense Systems | | | 5,837,300 | | | | 32,890,115 | | |
| Apparel, Accessories & Luxury Goods—5.3% | |
Cie Financiere
Richemont SA
(Switzerland) | | Manufacturer & Retailer of
Luxury Goods | | | 3,729,600 | | | | 144,422,959 | | |
Swatch Group AG, Bearer
Shares (Switzerland) | | Watch Manufacturer | | | 253,700 | | | | 80,893,342 | | |
LVMH Moet Hennessy
Louis Vuitton SA
(France) | | Diversified Luxury Goods
Conglomerate | | | 210,000 | | | | 24,545,912 | | |
Luxottica Group SpA
(Italy) | | Manufacturer & Retailer of Eyeglass
Frames & Sunglasses | | | 873,815 | | | | 23,368,329 | | |
| | | | 273,230,542 | | |
| Application Software—2.8% | |
| SAP AG (Germany) | | Develops Business Software | | | 2,942,600 | | | | 142,522,848 | | |
| Asset Management & Custody Banks—1.8% | |
Schroders PLC
(United Kingdom) | | International Asset Management | | | 3,921,800 | | | | 83,735,181 | | |
Schroders PLC, Non-Voting
(United Kingdom) | | International Asset Management | | | 579,800 | | | | 10,091,833 | | |
| | | | 93,827,014 | | |
| Automobile Manufacturers—9.7% | |
Daimler AG Registered
(Germany) | | Automobile Manufacturer | | | 3,274,700 | | | | 154,162,797 | | |
Bayerische Motoren Werke
(BMW) AG (Germany) | | Luxury Automobile Manufacturer | | | 3,121,800 | | | | 144,118,625 | | |
| Toyota Motor Corp. (Japan) | | Automobile Manufacturer | | | 3,452,000 | | | | 138,279,388 | | |
Honda Motor Co., Ltd.
(Japan) | | Automobile & Motorcycle
Manufacturer | | | 1,732,300 | | | | 61,146,540 | | |
| | | | 497,707,350 | | |
OAKMARK INTERNATIONAL FUND
43
OAKMARK INTERNATIONAL FUND
Schedule of Investments—March 31, 2010 (Unaudited) cont.
| Name | | Description | | Shares Held | | Value | |
| Common Stocks—95.1% (cont.) | |
| Brewers—3.0% | |
Heineken Holdings NV
(Netherlands) | | Produces Beers, Spirits, Wines &
Soft Drinks | | | 1,872,600 | | | $ | 83,300,127 | | |
Foster's Group, Ltd.
(Australia) | | Manufactures & Markets
Alcoholic & Non-Alcoholic
Beverages | | | 14,342,500 | | | | 69,623,786 | | |
| | | | 152,923,913 | | |
| Broadcasting—4.7% | |
Societe Television
Francaise 1 (France) | | Broadcasting & Cable TV | | | 7,889,000 | | | | 146,350,292 | | |
Grupo Televisa SA
(Mexico) (b) | | Television Production &
Broadcasting | | | 4,477,700 | | | | 94,121,254 | | |
| | | | 240,471,546 | | |
| Building Products—2.7% | |
Assa Abloy AB, Series B
(Sweden) | | Develops, Designs & Manufactures
Security Locks | | | 6,353,000 | | | | 124,321,926 | | |
Geberit AG, Registered
Shares (Switzerland) | | Building Products | | | 89,600 | | | | 16,035,205 | | |
| | | | 140,357,131 | | |
| Cable & Satellite—1.8% | |
British Sky Broadcasting
Group PLC
(United Kingdom) | | Television Production &
Broadcasting | | | 10,259,900 | | | | 93,727,718 | | |
| Distillers & Vintners—2.2% | |
Diageo PLC
(United Kingdom) | | Beverages, Wines & Spirits
Manufacturer | | | 6,560,400 | | | | 110,106,732 | | |
| Diversified Banks—6.2% | |
| BNP Paribas (France) | | Commercial Bank | | | 1,461,938 | | | | 112,273,894 | | |
Sumitomo Mitsui
Financial Group, Inc.
(Japan) | | Commercial Bank | | | 2,644,900 | | | | 87,418,344 | | |
| Bank of Ireland (Ireland) (a) | | Commercial Bank | | | 29,132,161 | | | | 62,955,787 | | |
OAKMARK INTERNATIONAL FUND
44
OAKMARK INTERNATIONAL FUND
Schedule of Investments—March 31, 2010 (Unaudited) cont.
| Name | | Description | | Shares Held | | Value | |
| Common Stocks—95.1% (cont.) | |
| Diversified Banks—6.2% (cont.) | |
Banco Santander SA
(Spain)
| | Retail, Commercial &
Private Banking & Asset
Management Services | | | 3,933,500 | | | $ | 52,277,791 | | |
| | | | 314,925,816 | | |
| Diversified Capital Markets—6.4% | |
Credit Suisse Group
(Switzerland) | | Wealth Management & Investment
Banking | | | 3,491,000 | | | | 179,946,747 | | |
| UBS AG (Switzerland) (a) | | Wealth Management & Investment
Banking | | | 9,128,300 | | | | 148,386,819 | | |
| | | | 328,333,566 | | |
| Diversified Chemicals—1.2% | |
Akzo Nobel NV
(Netherlands) | | Produces & Markets Chemicals,
Coatings & Paints | | | 1,107,500 | | | | 63,117,197 | | |
| Diversified Support Services—2.2% | |
| Brambles, Ltd. (Australia) | | Provides Pallet & Plastic Container
Pooling Services | | | 16,381,800 | | | | 110,641,114 | | |
| Electronic Components—1.6% | |
| OMRON Corp. (Japan) | | Component, Equipment & System
Manufacturer | | | 3,633,500 | | | | 84,337,309 | | |
| Electronic Equipment & Instruments—0.2% | |
| Orbotech, Ltd. (Israel) (a) | | Optical Inspection Systems | | | 1,056,300 | | | | 11,439,729 | | |
| Food Retail—0.5% | |
Koninklijke Ahold NV
(Netherlands) | | Retails Health & Beauty Supplies,
Prescriptions Drugs,
Wine & Liquor | | | 1,729,500 | | | | 23,055,826 | | |
| Human Resource & Employment Services—3.0% | |
| Adecco SA (Switzerland) | | Temporary Employment Services | | | 2,679,300 | | | | 152,082,801 | | |
| Industrial Conglomerates—0.5% | |
Tyco International, Ltd.
(Switzerland) (a) | | Security Products & Services Provider | | | 640,200 | | | | 24,487,650 | | |
| Integrated Oil & Gas—0.5% | |
Cenovus Energy, Inc.
(Canada) | | Integrated Oil Company | | | 955,800 | | | | 25,051,518 | | |
OAKMARK INTERNATIONAL FUND
45
OAKMARK INTERNATIONAL FUND
Schedule of Investments—March 31, 2010 (Unaudited) cont.
| Name | | Description | | Shares Held | | Value | |
| Common Stocks—95.1% (cont.) | |
| Investment Banking & Brokerage—3.4% | |
Daiwa Securities
Group, Inc. (Japan) | | Stock Broker | | | 32,568,400 | | | $ | 171,394,297 | | |
| Marine—1.2% | |
Kuehne + Nagel
International AG
(Switzerland) | | Sea, Land & Rail Freight
Transportation Businesses | | | 614,500 | | | | 62,184,323 | | |
| Multi-line Insurance—3.1% | |
Allianz SE Registered
(Germany) | | Insurance, Banking & Financial
Services | | | 1,278,000 | | | | 160,236,769 | | |
| Office Electronics—1.9% | |
| Canon, Inc. (Japan) | | Computers & Information | | | 2,152,900 | | | | 99,711,809 | | |
| Packaged Foods & Meats—1.3% | |
| Nestle SA (Switzerland) | | Food & Beverage Manufacturer | | | 1,289,500 | | | | 66,040,402 | | |
| Pharmaceuticals—3.8% | |
| Novartis AG (Switzerland) | | Pharmaceuticals | | | 1,865,800 | | | | 100,775,142 | | |
GlaxoSmithKline PLC
(United Kingdom) | | Pharmaceuticals | | | 4,851,000 | | | | 93,158,363 | | |
| | | | 193,933,505 | | |
| Publishing—4.1% | |
Reed Elsevier PLC
(United Kingdom) | | Publisher & Information Provider | | | 13,732,000 | | | | 109,505,250 | | |
Thomson Reuters Corp.
(Canada) | | Electronic Information &
Solutions Company | | | 2,803,200 | | | | 102,009,818 | | |
| | | | 211,515,068 | | |
| Research & Consulting Services—2.0% | |
Experian Group, Ltd.
(Ireland) | | Credit & Marketing Services | | | 5,607,476 | | | | 55,183,066 | | |
| Meitec Corp. (Japan) (c) | | Software Engineering Services | | | 2,475,100 | | | | 48,474,790 | | |
| | | | 103,657,856 | | |
| Restaurants—2.0% | |
| Sodexo (France) (a) | | Food & Facilities Management
Services | | | 1,696,000 | | | | 101,363,617 | | |
| Security & Alarm Services—1.8% | |
| G4S PLC (United Kingdom) | | Security Services | | | 23,254,000 | | | | 92,277,918 | | |
OAKMARK INTERNATIONAL FUND
46
OAKMARK INTERNATIONAL FUND
Schedule of Investments—March 31, 2010 (Unaudited) cont.
| Name | | Description | | Shares Held | | Value | |
| Common Stocks—95.1% (cont.) | |
| Semiconductors—4.5% | |
| ROHM Co., Ltd. (Japan) | | Integrated Circuits & Semiconductor
Devices Manufacturer | | | 1,960,000 | | | $ | 146,334,367 | | |
Samsung Electronics
Co., Ltd. (South Korea) | | Consumer & Industrial Electronic
Equipment Manufacturer | | | 118,700 | | | | 85,816,077 | | |
| | | | 232,150,444 | | |
| Soft Drinks—1.8% | |
Fomento Economico
Mexicano S.A.B. de C.V.
(Mexico) (b) | | Beverage Company | | | 1,884,100 | | | | 89,551,273 | | |
| Specialty Chemicals—1.1% | |
| Givaudan SA (Switzerland) | | Manufactures & Markets Fragrances | | | 62,900 | | | | 55,180,671 | | |
| Specialty Stores—2.7% | |
Signet Jewelers, Ltd.
(United Kingdom) (a) | | Jewelry Retailer | | | 4,211,600 | | | | 136,203,144 | | |
| Tobacco—0.9% | |
| KT&G Corp. (South Korea) | | Produces & Sells Tobacco Products | | | 450,100 | | | | 24,902,788 | | |
| Japan Tobacco, Inc. (Japan) | | Manufactures & Sells Tobacco,
Food, & Pharmaceutical Products | | | 5,200 | | | | 19,356,081 | | |
| | | | 44,258,869 | | |
| Total Common Stocks (Cost: $4,159,220,403) | | | | | | | | $ | 4,867,109,917 | | |
OAKMARK INTERNATIONAL FUND
47
OAKMARK INTERNATIONAL FUND
Schedule of Investments—March 31, 2010 (Unaudited) cont.
| Name | | Par Value | | Value | |
| Short Term Investment—4.5% | |
| Repurchase Agreement—4.5% | |
Fixed Income Clearing Corp. Repurchase Agreement,
0.00% dated 3/31/2010 due 4/1/2010, repurchase
price $228,740,516, collateralized by Federal Home
Loan Mortgage Corp. Bonds, with rates from
2.125% - 4.250%, with maturities from
6/18/2013 - 12/12/2018, and with an aggregate
market value plus accrued interest of $233,318,613
(Cost: $228,740,516) | | $ | 228,740,516 | | | $ | 228,740,516 | | |
| Total Short Term Investment (Cost: $228,740,516) | | | | $ | 228,740,516 | | |
| Total Investments (Cost: $4,387,960,919)—99.6% | | | | | 5,095,850,433 | | |
| Foreign Currencies (Cost: $1,544,621)—0.0% | | | | | 1,534,384 | | |
| Other Assets In Excess of Liabilities—0.4% | | | | | 18,389,480 | | |
| Total Net Assets—100% | | | | $ | 5,115,774,297 | | |
(a) Non income-producing security.
(b) Represents a Sponsored American Depositary Receipt.
(c) See Note 5 in the Notes to the Financial Statements regarding investments in affiliated issuers.
See accompanying Notes to Financial Statements.
OAKMARK INTERNATIONAL FUND
48
OAKMARK INTERNATIONAL
SMALL CAP FUND
Report from David G. Herro, Portfolio Manager

THE VALUE OF A $10,000 INVESTMENT IN OAKMARK INT'L SMALL CAP FUND FROM 3/31/00 TO PRESENT (3/31/10) AS COMPARED TO MSCI WORLD EX U.S. SMALL CAP17 AND MSCI WORLD EX U.S.14 INDEXES (UNAUDITED)†
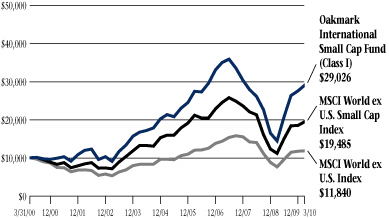
| | | | | Average Annual Total Returns
(as of 3/31/10) | |
| (Unaudited) | | Total Return
Last 3 Months* | | 1-year | | 5-year | | 10-year | | Since
Inception
(11/1/95) | |
Oakmark International
Small Cap Fund
(Class I) | | | 5.38 | % | | | 101.36 | % | | | 6.38 | % | | | 11.24 | % | | | 10.94 | % | |
MSCI World ex U.S.
Small Cap | | | 5.41 | % | | | 74.54 | % | | | 4.13 | % | | | 6.90 | % | | | N/A | | |
| MSCI World ex U.S. | | | 1.35 | % | | | 55.96 | % | | | 4.33 | % | | | 1.70 | % | | | 5.37 | % | |
Lipper International
Small Cap Index18 | | | 3.86 | % | | | 71.63 | % | | | 5.78 | % | | | 4.92 | % | | | N/A | | |
The graph and table do not reflect the deduction of taxes that a shareholder would pay on fund distributions or the redemption of fund shares.
The expense ratio for Class I shares as of 9/30/09 was 1.54%.
The performance data quoted represents past performance. The above performance information for the Fund does not reflect the imposition of a 2% redemption fee on shares redeemed within 90 days. If reflected, the fee would reduce the performance quoted. Past performance does not guarantee future results. The investment return and principal value will fluctuate so that an investor's shares, when redeemed, may be worth more or less than their original cost. Current performance may be lower or higher than the performance data quoted. Average annual total return measures annualized change, while total return measures aggregate change. To obtain most recent month-end performance data, visit oakmark.com.
* Not annualized
The Oakmark International Small Cap Fund returned 5% for the quarter ended March 31, 2010, compared to the MSCI World ex U.S. Small Cap Index, which also returned 5%. For the last 10 years, the Fund has earned an annualized rate of return of 11%, compared to the MSCI World ex U.S. Small Cap Index, which has returned 7% for the same period.
The top performing stock in the portfolio this quarter was Media Prima Berhard, Malaysia's largest media investment group. Through its subsidiaries, Media Prima has a diversified interest in the media arena, including television and radio, online content, outdoor advertising, print media and even event management. Media Prima's share price has increased since the company began growing again in the fourth quarter of 2009. As the global economy rebounds, advertisers' budgets are increasing, and due to its market position Media Prima is the prime beneficiary of this additional spending. Additionally, the company appears poised to benefit from the acquisitions it made in the fourth quarter of 2009.
Two Swiss holdings, Kaba Holding and Panalpina Welttransport, were also large contributors to relative performance this quarter. Kaba, which provides mechanical and electronic security systems, rallied this quarter following a positive earnings report. Margins came through better than expected, demonstrating that recent cost reduction strategies have improved the company's cost structure. Kaba's outlook suggests that the worst of its revenue declines are behind it. Freight forwarder, Panalpina, was a strong performer during the quarter despite reporting very poor fourth quarter results as the company struggled to handle a surge in ocean and air freight volumes that caused significant margin contraction. Despite the disappointing results investors bid up the shares, anticipating that Panalpina's air and ocean freight forwarding business will benefit from the improved outlook for global trade. We continue to be disappointed with management's i nability to bring Panalpina's performance more in-line with its forwarding peers, but we still believe the market undervalues the strength of the company's global network.
The two largest detractors from performance for the quarter were both U.K. firms, Carepetright and JJB Sports. Shares of carpet retailer Carpetright declined because the market was
OAKMARK INTERNATIONAL SMALL CAP FUND
49
disappointed by the company's lower than expected sales growth in the first quarter of 2010. Although there may be some delay between the improving U.K. economy and the rebound in Carpetright's sales and operating profit, we are confident that the company has emerged from the recession in a significantly stronger position. We added to our position during the quarter. Shares of sporting good retailer JJB Sports suffered due to disappointing year-over-year sales, which were caused by the company's recent sale of its gym business and its decision to close underperforming stores. Still, we believe that JJB's new management team has made significant improvements to the business and will create significant value for shareholders over the medium term.
It was another above-average quarter of trading. We sold several holdings, including: CTS Eventim, Domino Printing Sciences, ElringKlinger, IMI, Kimberly Clark de Mexico, Mainfreight, Monitise, Rational, Schindler Holding and Symrise. From the proceeds of these sales, we were able to purchase a number of new securities, including Aegis Group (U.K.), a media services holding company; QinetiQ Group (U.K.), a science and technology research company; Alten (France), a former Fund holding that is a consulting and engineering services firm; Nexans (France), a cable manufacturer; Rexel (France), a distributor of low voltage electrical equipment; Bucher Industries (Switzerland), a manufacturer of food processing machinery and hydraulic components; Prysmian (Italy), a developer and producer of cables for the telecommunication and energy industries; NSD (Japan), a software development company; and Matsumotokiyoshi Holdings (Japan), a holding company t hat operates drug store chains as well as supermarkets and home centers.
Geographically, our European and U.K. holdings represented approximately 66% of the portfolio at the end of the quarter, and the Pacific Rim holdings and Latin American holdings constituted 31% and 1% of the portfolio, respectively.
We continue to hedge some of the Fund's currency exposure. At the recent quarter end, approximately 20% of the Fund's Swiss franc, 12% of the euro and 26% of the Japanese yen exposures were hedged.
We remain optimistic about the future of the global economy and are excited about the unique buying opportunities the market volatility has created. As evidenced by our new positions in the Fund this quarter, our long-term value approach continues to uncover high quality companies that we believe will provide attractive returns for our shareholders in the future. Thank you for your continued support and confidence!
David G. Herro, CFA
Portfolio Manager
oakex@oakmark.com | |
|
March 31, 2010
† Prior to January 1, 2009, the Fund's primary benchmark was the MSCI World ex U.S. Index, an unmanaged index that includes countries throughout the world, excluding the U.S., in proportion to world stock market capitalization. The Fund changed its primary benchmark because the MSCI World ex U.S. Small Cap Index reached its tenth anniversary on December 31, 2008 and now provides an historical perspective to make a more meaningful comparison given the small cap focus of the Fund.
OAKMARK INTERNATIONAL SMALL CAP FUND
50
OAKMARK INTERNATIONAL SMALL CAP FUND
Global Diversification—March 31, 2010 (Unaudited)

OAKMARK INTERNATIONAL SMALL CAP FUND
51
OAKMARK INTERNATIONAL SMALL CAP FUND
Schedule of Investments—March 31, 2010 (Unaudited)
| Name | | Description | | Shares Held | | Value | |
| Common Stocks—94.6% | |
| Advertising—2.1% | |
| Asatsu-DK, Inc. (Japan) | | Advertising Services Provider | | | 776,000 | | | $ | 16,476,201 | | |
Aegis Group PLC
(United Kingdom) | | Media Services Provider | | | 2,215,066 | | | | 4,275,650 | | |
| | | | 20,751,851 | | |
| Aerospace & Defense—0.5% | |
QinetiQ Group PLC
(United Kingdom) | | Science & Technology Research
Company | | | 2,426,700 | | | | 4,934,570 | | |
| Air Freight & Logistics—3.6% | |
Panalpina Welttransport
Holding AG
(Switzerland) | | Freight Shipping & Supply Chain
Management Services | | | 224,600 | | | | 19,075,237 | | |
Freightways, Ltd.
(New Zealand) | | Express Package Services | | | 7,483,000 | | | | 16,797,132 | | |
| | | | 35,872,369 | | |
| Airport Services—3.1% | |
BBA Aviation PLC
(United Kingdom) | | Flight Support & Aftermarket
Services & Systems Provider | | | 10,253,000 | | | | 30,293,213 | | |
| Apparel, Accessories & Luxury Goods—1.9% | |
| Bulgari SpA (Italy) | | Jewelry Manufacturer & Retailer | | | 2,267,200 | | | | 18,465,034 | | |
| Application Software—0.9% | |
| NSD Co., Ltd. (Japan) | | Develops Computer Software | | | 731,000 | | | | 8,780,757 | | |
| Asset Management & Custody Banks—7.6% | |
Julius Baer Group, Ltd.
(Switzerland) | | Asset Management | | | 1,011,900 | | | | 36,708,246 | | |
| MLP AG (Germany) | | Asset Management | | | 2,549,900 | | | | 26,866,829 | | |
GAM Holding, Ltd.
(Switzerland) | | Asset Management | | | 983,000 | | | | 12,073,075 | | |
| | | | 75,648,150 | | |
| Auto Parts & Equipment—0.7% | |
Toyota Industries Corp.
(Japan) | | Assembles Motor Vehicles &
Manufactures Automotive Parts | | | 259,100 | | | | 7,399,690 | | |
| Automotive Retail—0.9% | |
| USS Co., Ltd. (Japan) | | Used Car Auction Facility Manager | | | 137,700 | | | | 9,352,818 | | |
OAKMARK INTERNATIONAL SMALL CAP FUND
52
OAKMARK INTERNATIONAL SMALL CAP FUND
Schedule of Investments—March 31, 2010 (Unaudited) cont.
| Name | | Description | | Shares Held | | Value | |
| Common Stocks—94.6% (cont.) | |
| Broadcasting—3.8% | |
Media Prima Berhad
(Malaysia) | | Film Producer & Sports Promoter | | | 31,962,400 | | | $ | 21,066,573 | | |
M6 Metropole Television
(France) | | Television Entertainment
Channel Owner & Operator | | | 433,600 | | | | 11,215,045 | | |
Ten Network Holdings, Ltd.
(Australia) (a) | | Operates Commercial Television
Stations | | | 2,689,000 | | | | 4,688,366 | | |
Media Prima Berhad,
Warrants
(Malaysia) (a) | | Film Producer & Sports Promoter | | | 1,058,457 | | | | 204,423 | | |
| | | | 37,174,407 | | |
| Building Products—2.3% | |
Kaba Holding AG
(Switzerland) | | Provides Mechanical & Electronic
Security Systems | | | 75,200 | | | | 22,501,517 | | |
| Commodity Chemicals—1.2% | |
| Nifco, Inc (Japan) | | Manufactures Synthetic Resinous
Fasteners & Plastic Components
For Automobiles & Home
Electronic Appliances | | | 504,300 | | | | 11,597,444 | | |
| Computer Hardware—1.5% | |
Wincor Nixdorf AG
(Germany) | | Banking Machines & Cash Registers
Manufacturer | | | 218,400 | | | | 14,793,350 | | |
| Construction & Farm Machinery & Heavy Trucks—0.7% | |
Bucher Industries AG
(Switzerland) | | Manufactures Food Processing
Machinery, Vehicles, & Hydraulic
Components | | | 52,945 | | | | 7,180,515 | | |
| Construction Materials—1.8% | |
Titan Cement Co. SA
(Greece) | | Cement & Building Materials
Producer & Distributor | | | 685,000 | | | | 18,133,833 | | |
| Drug Retail—2.5% | |
Sugi Holdings Co., Ltd.
(Japan) | | Drug Store Operator | | | 585,000 | | | | 13,985,185 | | |
OAKMARK INTERNATIONAL SMALL CAP FUND
53
OAKMARK INTERNATIONAL SMALL CAP FUND
Schedule of Investments—March 31, 2010 (Unaudited) cont.
| Name | | Description | | Shares Held | | Value | |
| Common Stocks—94.6% (cont.) | |
| Drug Retail—2.5% (cont.) | |
Matsumotokiyoshi
Holdings Co., Ltd.
(Japan) | | Drug Store Operator | | | 477,900 | | | $ | 10,811,408 | | |
| | | | 24,796,593 | | |
| Electrical Components & Equipment—1.4% | |
| Nexans SA (France) | | Manufactures Cables | | | 140,300 | | | | 11,959,109 | | |
| Prysmian SpA (Italy) | | Develops, Designs, Produces,
Supplies & Installs Cable | | | 77,400 | | | | 1,521,062 | | |
| | | | 13,480,171 | | |
| Electronic Components—1.3% | |
Hirose Electric Co., Ltd.
(Japan) | | Develops & Sells Electronic
Equipment | | | 110,800 | | | | 12,775,955 | | |
| Electronic Equipment & Instruments—1.9% | |
Orbotech, Ltd.
(Israel) (a) (c) | | Optical Inspection Systems | | | 1,715,000 | | | | 18,573,450 | | |
| Health Care Services—2.6% | |
Primary Health Care, Ltd.
(Australia) | | Health Care Service Provider | | | 6,243,800 | | | | 25,496,825 | | |
| Health Care Supplies—1.3% | |
| Ansell, Ltd. (Australia) | | Manufactures Latex | | | 1,194,855 | | | | 13,311,010 | | |
| Home Entertainment Software—3.2% | |
Square Enix Holdings
Co., Ltd. (Japan) | | Develops & Sells Entertainment
Software for Video Game Consoles | | | 1,445,700 | | | | 31,607,774 | | |
| Home Furnishing Retail—1.4% | |
Beter Bed Holding NV
(Netherlands) | | Bedroom Furniture Retailer | | | 331,070 | | | | 9,184,663 | | |
Fourlis Holdings SA
(Greece) | | Wholesales Electric & Electronic
Appliances | | | 381,614 | | | | 4,566,685 | | |
| | | | 13,751,348 | | |
| Home Improvement Retail—2.1% | |
Carpetright PLC
(United Kingdom) | | Carpet Retailer | | | 1,685,376 | | | | 20,460,452 | | |
OAKMARK INTERNATIONAL SMALL CAP FUND
54
OAKMARK INTERNATIONAL SMALL CAP FUND
Schedule of Investments—March 31, 2010 (Unaudited) cont.
| Name | | Description | | Shares Held | | Value | |
| Common Stocks—94.6% (cont.) | |
| Human Resource & Employment Services—3.6% | |
Pasona Group, Inc.
(Japan) (c) | | Placement Service Provider | | | 23,842 | | | $ | 15,709,351 | | |
Michael Page
International PLC
(United Kingdom) | | Recruitment Consultancy Services | | | 1,744,600 | | | | 10,589,715 | | |
Robert Walters PLC
(United Kingdom) | | International Recruitment
Company | | | 2,806,338 | | | | 9,581,884 | | |
| | | | 35,880,950 | | |
| Industrial Conglomerates—3.3% | |
| Rheinmetall AG (Germany) | | Automotive Pump Manufacturer | | | 329,500 | | | | 23,600,436 | | |
Tomkins PLC
(United Kingdom) | | International Manufacturing | | | 2,501,700 | | | | 8,959,332 | | |
| | | | 32,559,768 | | |
| Industrial Machinery—9.4% | |
Interpump Group SpA
(Italy) (a) (c) | | Pump & Piston Manufacturer | | | 5,909,300 | | | | 29,172,013 | | |
| GEA Group AG (Germany) | | Engineering Services Provider | | | 757,200 | | | | 17,549,747 | | |
| Duerr AG (Germany) | | Automotive Industry Machinery
Manufacturer | | | 691,800 | | | | 15,884,460 | | |
Bobst Group AG
(Switzerland) (a) | | Manufactures Printing Presses &
Packaging Producing Machinery | | | 400,500 | | | | 15,193,475 | | |
Melrose PLC
(United Kingdom) | | Engineering, Design, Development &
Manufacturer of Diversified
Specialist Components | | | 2,911,800 | | | | 9,729,876 | | |
Burckhardt Compression
Holding AG
(Switzerland) | | Manufactures Reciprocating
Compressors | | | 24,900 | | | | 4,911,988 | | |
Interpump Group SpA,
Warrants (Italy) (a) (c) | | Pump & Piston Manufacturer | | | 1,042,080 | | | | 379,317 | | |
| | | | 92,820,876 | | |
| Investment Banking & Brokerage—1.4% | |
Ichiyoshi Securities
Co., Ltd. (Japan) | | Stock Broker | | | 2,057,800 | | | | 14,064,972 | | |
D. Carnegie & Co. AB
(Sweden) (a) (b) | | Diversified Financials Services | | | 2,314,000 | | | | 0 | | |
| | | | 14,064,972 | | |
OAKMARK INTERNATIONAL SMALL CAP FUND
55
OAKMARK INTERNATIONAL SMALL CAP FUND
Schedule of Investments—March 31, 2010 (Unaudited) cont.
| Name | | Description | | Shares Held | | Value | |
| Common Stocks—94.6% (cont.) | |
| IT Consulting & Other Services—2.6% | |
| Alten, Ltd. (France) (a) | | Consulting & Engineering Services | | | 463,100 | | | $ | 13,050,770 | | |
| Atea ASA (Norway) | | Management & IT Consulting
Services | | | 1,505,300 | | | | 12,727,374 | | |
| | | | 25,778,144 | | |
| Life Sciences Tools & Services—0.1% | |
| MDS, Inc. (Canada) (a) | | Products & Services for Medical
Product Manufacturing | | | 61,100 | | | | 492,097 | | |
| Office Electronics—2.6% | |
| Neopost SA (France) | | Mailroom Equipment Supplier | | | 297,000 | | | | 23,735,643 | | |
Boewe Systec AG
(Germany) (a) | | Automated Paper Management
Systems Producer | | | 285,039 | | | | 2,309,928 | | |
| | | | 26,045,571 | | |
| Office Services & Supplies—3.3% | |
Sperian Protection
(France) (b) | | Manufactures Protection Equipment
For People In Hazardous Work
Environments | | | 361,600 | | | | 32,478,281 | | |
| Packaged Foods & Meats—4.0% | |
Goodman Fielder, Ltd.
(Australia) | | Produces Food Products | | | 15,842,700 | | | | 20,789,419 | | |
Alaska Milk Corp.
(Philippines) (c) | | Milk Producer | | | 56,360,000 | | | | 10,226,864 | | |
Binggrae Co., Ltd.
(South Korea) | | Dairy Products Manufacturer | | | 200,000 | | | | 8,369,791 | | |
| | | | 39,386,074 | | |
| Photographic Products—1.9% | |
Vitec Group PLC
(United Kingdom) (c) | | Photo Equipment & Supplies | | | 3,035,979 | | | | 18,658,736 | | |
| Publishing—0.4% | |
| Tamedia AG (Switzerland) | | TV Broadcasting & Publishing | | | 52,452 | | | | 4,278,141 | | |
| Real Estate Services—2.6% | |
LSL Property Services PLC
(United Kingdom) (a) (c) | | Residential Property Service
Provider | | | 5,681,723 | | | | 26,167,798 | | |
OAKMARK INTERNATIONAL SMALL CAP FUND
56
OAKMARK INTERNATIONAL SMALL CAP FUND
Schedule of Investments—March 31, 2010 (Unaudited) cont.
| Name | | Description | | Shares Held | | Value | |
| Common Stocks—94.6% (cont.) | |
| Research & Consulting Services—1.6% | |
| Bureau Veritas SA (France) | | Provides Consulting Services | | | 225,100 | | | $ | 11,948,435 | | |
| Cision AB (Sweden) (a) | | Business & Communication
Intelligence | | | 3,139,100 | | | | 2,499,768 | | |
Cision AB, Rights
(Sweden) (a) | | Business & Communication
Intelligence | | | 3,139,100 | | | | 1,021,644 | | |
| | | | 15,469,847 | | |
| Soft Drinks—1.3% | |
Coca-Cola Femsa
S.A.B de C.V.
(Mexico) (d) | | Bottles & Distributes Branded
Beverages | | | 149,100 | | | | 9,907,695 | | |
Britvic PLC
(United Kingdom) | | Soft Drink Manufacturer & Marketer | | | 467,794 | | | | 3,293,829 | | |
| | | | 13,201,524 | | |
| Specialty Chemicals—2.3% | |
Taiyo Ink Manufacturing
Co., Ltd. (Japan) | | Manufactures & Sells Resist Inks | | | 518,300 | | | | 13,887,491 | | |
| Sika AG (Switzerland) | | Manufactures Construction Materials | | | 5,300 | | | | 8,947,268 | | |
| | | | 22,834,759 | | |
| Specialty Stores—1.7% | |
JJB Sports PLC
(United Kingdom) (a) (c) | | Sportswear & Sports Equipment
Retailer | | | 50,389,541 | | | | 17,204,868 | | |
| Systems Software—1.4% | |
Exact Holding NV
(Netherlands) | | Develops & Markets Business
Software | | | 530,600 | | | | 14,157,522 | | |
| Trading Companies & Distributors—0.8% | |
| Rexel SA (France) (a) | | Distributes Electrical & Ventilation
Equipment | | | 504,100 | | | | 7,659,708 | | |
| Total Common Stocks (Cost: $921,967,474) | | | | | | | | $ | 936,272,732 | | |
OAKMARK INTERNATIONAL SMALL CAP FUND
57
OAKMARK INTERNATIONAL SMALL CAP FUND
Schedule of Investments—March 31, 2010 (Unaudited) cont.
| Name | | Par Value | | Value | |
| Short Term Investment—5.1% | |
| Repurchase Agreement—5.1% | |
Fixed Income Clearing Corp. Repurchase Agreement,
0.00% dated 3/31/2010 due 4/1/2010, repurchase
price $50,219,460, collateralized by a Federal Home
Loan Mortgage Corp. Bond, with a rate of 4.125%,
with a maturity of 2/24/2011, and with a market
value plus accrued interest of $51,227,019
(Cost: $50,219,460) | | $ | 50,219,460 | | | $ | 50,219,460 | | |
| Total Short Term Investment (Cost: $50,219,460) | | | | $ | 50,219,460 | | |
| Total Investments (Cost: $972,186,934)—99.7% | | | | | 986,492,192 | | |
| Foreign Currencies (Cost: $988,216)—0.1% | | | | | 992,367 | | |
| Other Assets In Excess of Liabilities—0.2% | | | | | 2,417,263 | | |
| Total Net Assets—100% | | | | $ | 989,901,822 | | |
(a) Non income-producing security.
(b) Fair value is determined in good faith in accordance with procedures established by the Board of Trustees.
(c) See Note 5 in the Notes to the Financial Statements regarding investments in affiliated issuers.
(d) Represents a Sponsored American Depositary Receipt.
See accompanying Notes to Financial Statements.
OAKMARK INTERNATIONAL SMALL CAP FUND
58

(This page has been intentionally left blank.)
THE OAKMARK FUNDS
59
THE OAKMARK FUNDS
Statements of Assets and Liabilities—March 31, 2010 (Unaudited)
| | | | | Oakmark
Fund | | Oakmark
Select
Fund | | Oakmark
Equity and
Income Fund | |
| Assets | |
| Investments in unaffiliated securities, at value | | (a) | | $ | 3,423,471,387 | | | $ | 2,547,245,182 | | | $ | 18,391,787,941 | | |
| Investments in affiliated securities, at value | | (b) | | | 0 | | | | 0 | | | | 401,506,805 | | |
| Foreign currency, at value | | (c) | | | 0 | | | | 0 | | | | 0 | | |
| Receivable for: | |
| Securities sold | | | | | 80,608,670 | | | | 0 | | | | 109,856,963 | | |
| Fund shares sold | | | | | 6,670,140 | | | | 1,816,758 | | | | 87,484,173 | | |
| Dividends and interest (Net of foreign tax withheld) | | | | | 6,166,981 | | | | 2,334,704 | | | | 37,886,752 | | |
| Forward foreign currency contracts | | | | | 0 | | | | 0 | | | | 0 | | |
| Tax reclaim | | | | | 329,559 | | | | 0 | | | | 751,065 | | |
| Total receivables | | | | | 93,775,350 | | | | 4,151,462 | | | | 235,978,953 | | |
| Other assets | | | | | 42,651 | | | | 37,367 | | | | 116,662 | | |
| Total assets | | | | $ | 3,517,289,388 | | | $ | 2,551,434,011 | | | $ | 19,029,390,361 | | |
| Liabilities and Net Assets | |
| Payable for: | |
| Securities purchased | | | | $ | 0 | | | $ | 0 | | | $ | 273,995,799 | | |
| Fund shares redeemed | | | | | 2,606,851 | | | | 1,541,044 | | | | 19,544,029 | | |
| Investment advisory fee | | | | | 85,364 | | | | 60,377 | | | | 320,117 | | |
| Other shareholder servicing fees | | | | | 307,734 | | | | 199,416 | | | | 2,248,008 | | |
| Transfer and dividend disbursing agent fees | | | | | 145,219 | | | | 98,964 | | | | 115,813 | | |
| Trustee fees | | | | | 5,153 | | | | 4,779 | | | | 15,924 | | |
| Deferred trustee compensation | | | | | 955,023 | | | | 840,900 | | | | 822,384 | | |
| Other | | | | | 438,802 | | | | 336,921 | | | | 1,502,296 | | |
| Total liabilities | | | | | 4,544,146 | | | | 3,082,401 | | | | 298,564,370 | | |
| Net assets applicable to Fund shares outstanding | | | | $ | 3,512,745,242 | | | $ | 2,548,351,610 | | | $ | 18,730,825,991 | | |
| Analysis of Net Assets | |
| Paid in capital | | | | $ | 2,567,944,789 | | | $ | 2,003,919,777 | | | $ | 16,158,850,025 | | |
Accumulated undistributed net realized gain (loss) on investments, forward
contracts, short sales and foreign currency transactions | | | | | (238,063,040 | ) | | | (179,014,624 | ) | | | (574,151,488 | ) | |
Net unrealized appreciation on investments, forward
contracts and foreign currency translation | | | | | 1,177,591,267 | | | | 722,895,989 | | | | 3,097,712,648 | | |
| Accumulated undistributed net investment income | | | | | 5,272,226 | | | | 550,468 | | | | 48,414,806 | | |
| Net assets applicable to Fund shares outstanding | | | | $ | 3,512,745,242 | | | $ | 2,548,351,610 | | | $ | 18,730,825,991 | | |
| Price of Shares | |
| Net asset value per share: Class I | | | | $ | 39.34 | | | $ | 25.83 | | | $ | 26.74 | | |
| Class I—Net assets | | | | $ | 3,504,341,691 | | | $ | 2,539,318,796 | | | $ | 17,441,241,381 | | |
| Class I—Shares outstanding (Unlimited shares authorized) | | | | | 89,070,122 | | | | 98,318,199 | | | | 652,206,175 | | |
| Net asset value per share: Class II | | | | $ | 39.37 | | | $ | 25.83 | | | $ | 26.61 | | |
| Class II—Net assets | | | | $ | 8,403,551 | | | $ | 9,032,814 | | | $ | 1,289,584,610 | | |
| Class II—Shares outstanding (Unlimited shares authorized) | | | | | 213,446 | | | | 349,739 | | | | 48,469,259 | | |
| (a) Identified cost of investments in unaffiliated securities | | | | $ | 2,245,829,795 | | | $ | 1,824,349,193 | | | $ | 15,500,837,933 | | |
| (b) Identified cost of investments in affiliated securities | | | | | 0 | | | | 0 | | | | 194,683,746 | | |
| (c) Identified cost of foreign currency | | | | | 0 | | | | 0 | | | | 0 | | |
THE OAKMARK FUNDS
60
| | | Oakmark
Global
Fund | | Oakmark
Global Select
Fund | | Oakmark
International
Fund | | Oakmark
International
Small Cap Fund | |
| Assets | |
| Investments in unaffiliated securities, at value | | $ | 1,995,140,789 | | | $ | 347,965,565 | | | $ | 5,047,375,643 | | | $ | 850,399,795 | | |
| Investments in affiliated securities, at value | | | 0 | | | | 0 | | | | 48,474,790 | | | | 136,092,397 | | |
| Foreign currency, at value | | | 627,817 | | | | 0 | | | | 1,534,384 | | | | 992,367 | | |
| Receivable for: | |
| Securities sold | | | 4,925,660 | | | | 3,543,391 | | | | 23,869,899 | | | | 6,442,296 | | |
| Fund shares sold | | | 5,144,502 | | | | 1,185,987 | | | | 25,127,938 | | | | 4,110,567 | | |
| Dividends and interest (Net of foreign tax withheld) | | | 2,527,926 | | | | 522,343 | | | | 10,978,176 | | | | 3,034,535 | | |
| Forward foreign currency contracts | | | 9,757,618 | | | | 1,277,911 | | | | 30,209,304 | | | | 6,008,096 | | |
| Tax reclaim | | | 5,011,218 | | | | 258,792 | | | | 16,400,282 | | | | 610,189 | | |
| Total receivables | | | 27,366,924 | | | | 6,788,424 | | | | 106,585,599 | | | | 20,205,683 | | |
| Other assets | | | 34,128 | | | | 25,398 | | | | 48,611 | | | | 28,412 | | |
| Total assets | | $ | 2,023,169,658 | | | $ | 354,779,387 | | | $ | 5,204,019,027 | | | $ | 1,007,718,654 | | |
| Liabilities and Net Assets | |
| Payable for: | |
| Securities purchased | | $ | 22,455,393 | | | $ | 3,557,132 | | | $ | 83,994,077 | | | $ | 16,756,626 | | |
| Fund shares redeemed | | | 509,728 | | | | 215,828 | | | | 2,419,219 | | | | 491,999 | | |
| Investment advisory fee | | | 48,977 | | | | 8,282 | | | | 114,109 | | | | 27,769 | | |
| Other shareholder servicing fees | | | 172,559 | | | | 9,184 | | | | 523,440 | | | | 42,846 | | |
| Transfer and dividend disbursing agent fees | | | 63,483 | | | | 14,951 | | | | 65,777 | | | | 6,224 | | |
| Trustee fees | | | 3,731 | | | | 3,950 | | | | 3,006 | | | | 2,574 | | |
| Deferred trustee compensation | | | 398,528 | | | | 12,548 | | | | 663,322 | | | | 381,343 | | |
| Other | | | 287,240 | | | | 100,556 | | | | 461,780 | | | | 107,451 | | |
| Total liabilities | | | 23,939,639 | | | | 3,922,431 | | | | 88,244,730 | | | | 17,816,832 | | |
| Net assets applicable to Fund shares outstanding | | $ | 1,999,230,019 | | | $ | 350,856,956 | | | $ | 5,115,774,297 | | | $ | 989,901,822 | | |
| Analysis of Net Assets | |
| Paid in capital | | $ | 1,990,157,092 | | | $ | 366,278,746 | | | $ | 5,450,779,619 | | | $ | 1,126,069,388 | | |
Accumulated undistributed net realized gain (loss) on investments, forward
contracts, short sales and foreign currency transactions | | | (291,622,432 | ) | | | (45,176,046 | ) | | | (1,087,633,704 | ) | | | (156,698,220 | ) | |
Net unrealized appreciation on investments, forward
contracts and foreign currency translation | | | 303,684,402 | | | | 29,563,259 | | | | 738,854,137 | | | | 20,317,338 | | |
| Accumulated undistributed net investment income | | | (2,989,043 | ) | | | 190,997 | | | | 13,774,245 | | | | 213,316 | | |
| Net assets applicable to Fund shares outstanding | | $ | 1,999,230,019 | | | $ | 350,856,956 | | | $ | 5,115,774,297 | | | $ | 989,901,822 | | |
| Price of Shares | |
| Net asset value per share: Class I | | $ | 20.80 | | | $ | 10.63 | | | $ | 17.80 | | | $ | 12.53 | | |
| Class I—Net assets | | $ | 1,942,264,071 | | | $ | 350,856,956 | | | $ | 4,990,789,344 | | | $ | 988,772,014 | | |
| Class I—Shares outstanding (Unlimited shares authorized) | | | 93,360,560 | | | | 32,998,030 | | | | 280,408,664 | | | | 78,922,620 | | |
| Net asset value per share: Class II | | $ | 20.42 | | | $ | 0 | | | $ | 17.90 | | | $ | 12.50 | | |
| Class II—Net assets | | $ | 56,965,948 | | | $ | 0 | | | $ | 124,984,953 | | | $ | 1,129,808 | | |
| Class II—Shares outstanding (Unlimited shares authorized) | | | 2,790,001 | | | | 0 | | | | 6,981,021 | | | | 90,402 | | |
| (a) Identified cost of investments in unaffiliated securities | | $ | 1,701,353,591 | | | $ | 319,708,156 | | | $ | 4,316,577,363 | | | $ | 807,381,671 | | |
| (b) Identified cost of investments in affiliated securities | | | 0 | | | | 0 | | | | 71,383,556 | | | | 164,805,263 | | |
| (c) Identified cost of foreign currency | | | 632,553 | | | | 0 | | | | 1,544,621 | | | | 988,216 | | |
See accompanying Notes to Financial Statements.
THE OAKMARK FUNDS
61
THE OAKMARK FUNDS
Statements of Operations—March 31, 2010 (Unaudited)
| | | Oakmark
Fund | | Oakmark
Select
Fund | | Oakmark
Equity and
Income Fund | | Oakmark
Global
Fund | |
| Investment Income: | |
| Dividends from unaffiliated securities | | $ | 29,009,023 | | | $ | 15,838,978 | | | $ | 91,911,070 | | | $ | 8,502,590 | | |
| Dividends from affiliated securities | | | 0 | | | | 0 | | | | 1,693,695 | | | | 0 | | |
| Interest income | | | 48,205 | | | | 36,123 | | | | 62,458,946 | | | | 11,995 | | |
| Security lending income | | | 0 | | | | 0 | | | | 0 | | | | 210,239 | | |
| Other income | | | 3,181,734 | | | | 4,634,980 | | | | 3,076 | | | | 1,144 | | |
| Foreign taxes withheld | | | (177,125 | ) | | | (115,248 | ) | | | (1,638,133 | ) | | | (360,123 | ) | |
| Total investment income | | | 32,061,837 | | | | 20,394,833 | | | | 154,428,654 | | | | 8,365,845 | | |
| Expenses: | |
| Investment advisory fee | | | 15,511,658 | | | | 11,014,327 | | | | 55,962,388 | | | | 8,831,677 | | |
| Transfer and dividend disbursing agent fees | | | 602,087 | | | | 364,536 | | | | 724,466 | | | | 233,619 | | |
| Other shareholder servicing fees | | | 1,730,829 | | | | 909,534 | | | | 7,372,078 | | | | 706,680 | | |
| Service fee—Class II | | | 9,860 | | | | 9,097 | | | | 1,397,967 | | | | 68,069 | | |
| Reports to shareholders | | | 259,393 | | | | 168,394 | | | | 534,058 | | | | 102,102 | | |
| Custody and accounting fees | | | 166,167 | | | | 113,954 | | | | 896,456 | | | | 283,191 | | |
| Registration and blue sky expenses | | | 32,094 | | | | 27,879 | | | | 282,718 | | | | 37,819 | | |
| Trustees fees | | | 173,122 | | | | 152,353 | | | | 310,240 | | | | 104,609 | | |
| Legal fees | | | 35,174 | | | | 32,444 | | | | 103,363 | | | | 29,479 | | |
| Audit fees | | | 17,111 | | | | 14,563 | | | | 52,582 | | | | 13,591 | | |
| Other | | | 140,347 | | | | 130,172 | | | | 306,794 | | | | 114,691 | | |
| Total expenses | | | 18,677,842 | | | | 12,937,253 | | | | 67,943,110 | | | | 10,525,527 | | |
| Net Investment Income (Loss) | | | 13,383,995 | | | | 7,457,580 | | | | 86,485,544 | | | | (2,159,682 | ) | |
| Net realized and unrealized gain (loss): | |
| Net realized gain (loss) on: | |
| Unaffiliated securities | | | 191,049,619 | | | | 67,307,181 | | | | 243,916,935 | | | | (13,041,320 | ) | |
| Affiliated securities | | | 0 | | | | 0 | | | | 0 | | | | 0 | | |
| Forward foreign currency contracts | | | 0 | | | | 0 | | | | 0 | | | | (2,194,010 | ) | |
| Foreign currency transactions | | | 9,124 | | | | 0 | | | | (514,744 | ) | | | (132,806 | ) | |
| Net realized gain (loss) | | | 191,058,743 | | | | 67,307,181 | | | | 243,402,191 | | | | (15,368,136 | ) | |
| Net change in unrealized appreciation (depreciation) on: | |
| Investments | | | 251,402,385 | | | | 245,130,775 | | | | 1,203,344,050 | | | | 191,708,391 | | |
| Forward foreign currency contracts | | | 0 | | | | 0 | | | | 0 | | | | 15,553,624 | | |
| Foreign currency translation | | | (46,750 | ) | | | 0 | | | | (57,617 | ) | | | (153,807 | ) | |
| Net change in unrealized appreciation (depreciation) | | | 251,355,635 | | | | 245,130,775 | | | | 1,203,286,433 | | | | 207,108,208 | | |
| Net realized and unrealized gain | | | 442,414,378 | | | | 312,437,956 | | | | 1,446,688,624 | | | | 191,740,072 | | |
| Net increase in net assets resulting from operations | | $ | 455,798,373 | | | $ | 319,895,536 | | | $ | 1,533,174,168 | | | $ | 189,580,390 | | |
THE OAKMARK FUNDS
62
| | | Oakmark
Global Select
Fund | | Oakmark
International
Fund | | Oakmark
International
Small Cap Fund | |
| Investment Income: | |
| Dividends from unaffiliated securities | | $ | 1,758,293 | | | $ | 31,676,611 | | | $ | 7,321,840 | | |
| Dividends from affiliated securities | | | 0 | | | | 0 | | | | 1,050,140 | | |
| Interest income | | | 4,523 | | | | 42,247 | | | | 11,083 | | |
| Security lending income | | | 0 | | | | 310,148 | | | | 145,011 | | |
| Other income | | | 0 | | | | 230,688 | | | | 0 | | |
| Foreign taxes withheld | | | (30,394 | ) | | | (2,054,381 | ) | | | (635,686 | ) | |
| Total investment income | | | 1,732,422 | | | | 30,205,313 | | | | 7,892,388 | | |
| Expenses: | |
| Investment advisory fee | | | 1,422,171 | | | | 20,509,113 | | | | 4,970,674 | | |
| Transfer and dividend disbursing agent fees | | | 66,374 | | | | 350,072 | | | | 83,802 | | |
| Other shareholder servicing fees | | | 101,391 | | | | 1,819,146 | | | | 300,763 | | |
| Service fee—Class II | | | 0 | | | | 129,757 | | | | 937 | | |
| Reports to shareholders | | | 27,822 | | | | 172,484 | | | | 36,848 | | |
| Custody and accounting fees | | | 66,904 | | | | 879,128 | | | | 246,356 | | |
| Registration and blue sky expenses | | | 18,377 | | | | 91,524 | | | | 42,873 | | |
| Trustees fees | | | 53,077 | | | | 155,826 | | | | 91,602 | | |
| Legal fees | | | 21,774 | | | | 39,545 | | | | 23,838 | | |
| Audit fees | | | 8,740 | | | | 21,261 | | | | 10,859 | | |
| Other | | | 74,210 | | | | 158,224 | | | | 78,207 | | |
| Total expenses | | | 1,860,840 | | | | 24,326,080 | | | | 5,886,759 | | |
| Net Investment Income (Loss) | | | (128,418 | ) | | | 5,879,233 | | | | 2,005,629 | | |
| Net realized and unrealized gain (loss): | |
| Net realized gain (loss) on: | |
| Unaffiliated securities | | | 22,596,342 | | | | 64,471,231 | | | | 29,845,516 | | |
| Affiliated securities | | | 0 | | | | (2,292,487 | ) | | | (10,168,190 | ) | |
| Forward foreign currency contracts | | | (360,540 | ) | | | (4,366,152 | ) | | | 532,789 | | |
| Foreign currency transactions | | | (59,783 | ) | | | (1,613,094 | ) | | | (34,582 | ) | |
| Net realized gain (loss) | | | 22,176,019 | | | | 56,199,498 | | | | 20,175,533 | | |
| Net change in unrealized appreciation (depreciation) on: | |
| Investments | | | 10,482,685 | | | | 348,178,236 | | | | 56,737,201 | | |
| Forward foreign currency contracts | | | 2,062,919 | | | | 44,967,478 | | | | 7,229,861 | | |
| Foreign currency translation | | | 3,612 | | | | (323,075 | ) | | | (62,308 | ) | |
| Net change in unrealized appreciation (depreciation) | | | 12,549,216 | | | | 392,822,639 | | | | 63,904,754 | | |
| Net realized and unrealized gain | | | 34,725,235 | | | | 449,022,137 | | | | 84,080,287 | | |
| Net increase in net assets resulting from operations | | $ | 34,596,817 | | | $ | 454,901,370 | | | $ | 86,085,916 | | |
See accompanying Notes to Financial Statements.
THE OAKMARK FUNDS
63
THE OAKMARK FUNDS
Statements of Changes in Net Assets
| | | Oakmark Fund | |
| | | Six Months Ended
March 31, 2010 (Unaudited) | | Year Ended
September 30, 2009 | |
| From Operations: | |
| Net investment income | | $ | 13,383,995 | | | $ | 27,689,167 | | |
| Net realized gain (loss) | | | 191,058,743 | | | | (433,393,783 | ) | |
| Net change in unrealized appreciation (depreciation) | | | 251,355,635 | | | | 376,273,624 | | |
| Net increase (decrease) in net assets from operations | | | 455,798,373 | | | | (29,430,992 | ) | |
| Distributions to shareholders from: | |
| Net investment income—Class I | | | (21,156,755 | ) | | | (42,725,032 | ) | |
| Net investment income—Class II | | | (34,759 | ) | | | (75,879 | ) | |
| Net realized gain—Class I | | | 0 | | | | (93,416,024 | ) | |
| Net realized gain—Class II | | | 0 | | | | (288,563 | ) | |
| Total distributions to shareholders | | | (21,191,514 | ) | | | (136,505,498 | ) | |
| From Fund share transactions: | |
| Proceeds from shares sold—Class I | | | 393,362,701 | | | | 601,934,705 | | |
| Proceeds from shares sold—Class II | | | 915,340 | | | | 1,887,729 | | |
| Reinvestment of distributions—Class I | | | 20,326,344 | | | | 130,739,804 | | |
| Reinvestment of distributions—Class II | | | 30,259 | | | | 313,903 | | |
| Payment for shares redeemed—Class I | | | (487,295,515 | ) | | | (1,034,053,034 | ) | |
| Payment for shares redeemed—Class II | | | (1,739,977 | ) | | | (5,433,570 | ) | |
| Redemption fees—Class I | | | 156,041 | | | | 430,656 | | |
| Redemption fees—Class II | | | 376 | | | | 1,355 | | |
Net decrease in net assets from Fund
share transactions | | | (74,244,431 | ) | | | (304,178,452 | ) | |
| Total increase (decrease) in net assets | | | 360,362,428 | | | | (470,114,942 | ) | |
| Net assets: | |
| Beginning of period | | | 3,152,382,814 | | | | 3,622,497,756 | | |
| End of period | | $ | 3,512,745,242 | | | $ | 3,152,382,814 | | |
| Undistributed net investment income | | $ | 5,272,226 | | | $ | 16,252,360 | | |
| Fund Share Transactions—Class I: | |
| Shares sold | | | 10,572,941 | | | | 22,827,276 | | |
| Shares issued in reinvestment of dividends | | | 560,727 | | | | 5,145,211 | | |
| Less shares redeemed | | | (13,055,464 | ) | | | (39,216,734 | ) | |
| Net decrease in shares outstanding | | | (1,921,796 | ) | | | (11,244,247 | ) | |
| Fund Share Transactions—Class II: | |
| Shares sold | | | 25,085 | | | | 70,339 | | |
| Shares issued in reinvestment of dividends | | | 833 | | | | 12,339 | | |
| Less shares redeemed | | | (48,634 | ) | | | (200,080 | ) | |
| Net decrease in shares outstanding | | | (22,716 | ) | | | (117,402 | ) | |
THE OAKMARK FUNDS
64
| | | Oakmark Select Fund | |
| | | Six Months Ended
March 31, 2010 (Unaudited) | | Year Ended
September 30, 2009 | |
| From Operations: | |
| Net investment income | | $ | 7,457,580 | | | $ | 12,483,550 | | |
| Net realized gain (loss) | | | 67,307,181 | | | | 16,602,590 | | |
| Net change in unrealized appreciation (depreciation) | | | 245,130,775 | | | | 127,889,641 | | |
| Net increase in net assets from operations | | | 319,895,536 | | | | 156,975,781 | | |
| Distributions to shareholders from: | |
| Net investment income—Class I | | | (7,132,188 | ) | | | (28,952,323 | ) | |
| Net investment income—Class II | | | (19,757 | ) | | | (126,188 | ) | |
| Total distributions to shareholders | | | (7,151,945 | ) | | | (29,078,511 | ) | |
| From Fund share transactions: | |
| Proceeds from shares sold—Class I | | | 200,068,517 | | | | 270,845,580 | | |
| Proceeds from shares sold—Class II | | | 1,047,696 | | | | 1,984,081 | | |
| Reinvestment of distributions—Class I | | | 6,851,239 | | | | 27,926,539 | | |
| Reinvestment of distributions—Class II | | | 13,852 | | | | 63,894 | | |
| Payment for shares redeemed—Class I | | | (244,687,559 | ) | | | (721,496,614 | ) | |
| Payment for shares redeemed—Class II | | | (1,197,782 | ) | | | (8,267,436 | ) | |
| Redemption fees—Class I | | | 106,070 | | | | 414,153 | | |
| Redemption fees—Class II | | | 380 | | | | 1,807 | | |
Net decrease in net assets from Fund
share transactions | | | (37,797,587 | ) | | | (428,527,996 | ) | |
| Total increase (decrease) in net assets | | | 274,946,004 | | | | (300,630,726 | ) | |
| Net assets: | |
| Beginning of period | | | 2,273,405,606 | | | | 2,574,036,332 | | |
| End of period | | $ | 2,548,351,610 | | | $ | 2,273,405,606 | | |
| Undistributed net investment income | | $ | 550,468 | | | $ | 4,878,712 | | |
| Fund Share Transactions—Class I: | |
| Shares sold | | | 8,234,598 | | | | 15,736,623 | | |
| Shares issued in reinvestment of dividends | | | 288,230 | | | | 1,777,628 | | |
| Less shares redeemed | | | (10,074,571 | ) | | | (43,456,463 | ) | |
| Net decrease in shares outstanding | | | (1,551,743 | ) | | | (25,942,212 | ) | |
| Fund Share Transactions—Class II: | |
| Shares sold | | | 43,492 | | | | 115,311 | | |
| Shares issued in reinvestment of dividends | | | 582 | | | | 4,065 | | |
| Less shares redeemed | | | (50,534 | ) | | | (509,370 | ) | |
| Net decrease in shares outstanding | | | (6,460 | ) | | | (389,994 | ) | |
See accompanying Notes to Financial Statements.
THE OAKMARK FUNDS
65
THE OAKMARK FUNDS
Statements of Changes in Net Assets
| | | Oakmark
Equity and Income Fund | |
| | | Six Months Ended
March 31, 2010 (Unaudited) | | Year Ended
September 30, 2009 | |
| From Operations: | |
| Net investment income | | $ | 86,485,544 | | | $ | 205,052,676 | | |
| Net realized gain (loss) | | | 243,402,191 | | | | (810,231,732 | ) | |
| Net change in unrealized appreciation (depreciation) | | | 1,203,286,433 | | | | 829,750,677 | | |
| Net increase in net assets from operations | | | 1,533,174,168 | | | | 224,571,621 | | |
| Distributions to shareholders from: | |
| Net investment income—Class I | | | (176,400,939 | ) | | | (196,363,442 | ) | |
| Net investment income—Class II | | | (10,838,558 | ) | | | (12,072,699 | ) | |
| Net realized gain—Class I | | | 0 | | | | (292,455,172 | ) | |
| Net realized gain—Class II | | | 0 | | | | (23,185,484 | ) | |
| Total distributions to shareholders | | | (187,239,497 | ) | | | (524,076,797 | ) | |
| From Fund share transactions: | |
| Proceeds from shares sold—Class I | | | 2,800,018,950 | | | | 4,553,696,475 | | |
| Proceeds from shares sold—Class II | | | 238,672,366 | | | | 468,653,474 | | |
| Reinvestment of distributions—Class I | | | 167,328,651 | | | | 465,034,081 | | |
| Reinvestment of distributions—Class II | | | 9,545,348 | | | | 30,396,980 | | |
| Payment for shares redeemed—Class I | | | (1,193,657,174 | ) | | | (3,583,840,792 | ) | |
| Payment for shares redeemed—Class II | | | (165,835,368 | ) | | | (378,630,866 | ) | |
Net increase in net assets from Fund
share transactions | | | 1,856,072,773 | | | | 1,555,309,352 | | |
| Total increase in net assets | | | 3,202,007,444 | | | | 1,255,804,176 | | |
| Net assets: | |
| Beginning of period | | | 15,528,818,547 | | | | 14,273,014,371 | | |
| End of period | | $ | 18,730,825,991 | | | $ | 15,528,818,547 | | |
| Undistributed net investment income | | $ | 48,414,806 | | | $ | 139,130,487 | | |
| Fund Share Transactions—Class I: | |
| Shares sold | | | 108,935,352 | | | | 207,589,903 | | |
| Shares issued in reinvestment of dividends | | | 6,621,634 | | | | 21,781,456 | | |
| Less shares redeemed | | | (46,681,709 | ) | | | (164,669,008 | ) | |
| Net increase in shares outstanding | | | 68,875,277 | | | | 64,702,351 | | |
| Fund Share Transactions—Class II: | |
| Shares sold | | | 9,393,496 | | | | 21,325,989 | | |
| Shares issued in reinvestment of dividends | | | 379,386 | | | | 1,428,429 | | |
| Less shares redeemed | | | (6,499,945 | ) | | | (17,306,728 | ) | |
| Net increase in shares outstanding | | | 3,272,937 | | | | 5,447,690 | | |
THE OAKMARK FUNDS
66
| | | Oakmark
Global Fund | |
| | | Six Months Ended
March 31, 2010 (Unaudited) | | Year Ended
September 30, 2009 | |
| From Operations: | |
| Net investment income (loss) | | $ | (2,159,682 | ) | | $ | 10,590,906 | | |
| Net realized gain (loss) | | | (15,368,136 | ) | | | (196,701,663 | ) | |
| Net change in unrealized appreciation (depreciation) | | | 207,108,208 | | | | 143,211,113 | | |
| Net increase (decrease) in net assets from operations | | | 189,580,390 | | | | (42,899,644 | ) | |
| Distributions to shareholders from: | |
| Net investment income—Class I | | | (12,402,598 | ) | | | (64,685,003 | ) | |
| Net investment income—Class II | | | (272,894 | ) | | | (1,812,855 | ) | |
| Net realized gain—Class I | | | 0 | | | | (2,594,712 | ) | |
| Net realized gain—Class II | | | 0 | | | | (83,374 | ) | |
| Total distributions to shareholders | | | (12,675,492 | ) | | | (69,175,944 | ) | |
| From Fund share transactions: | |
| Proceeds from shares sold—Class I | | | 237,076,632 | | | | 287,084,767 | | |
| Proceeds from shares sold—Class II | | | 2,499,721 | | | | 5,216,475 | | |
| Reinvestment of distributions—Class I | | | 11,915,866 | | | | 64,695,585 | | |
| Reinvestment of distributions—Class II | | | 265,430 | | | | 1,830,946 | | |
| Payment for shares redeemed—Class I | | | (154,446,893 | ) | | | (512,253,586 | ) | |
| Payment for shares redeemed—Class II | | | (5,343,058 | ) | | | (8,715,081 | ) | |
| Redemption fees—Class I | | | 89,416 | | | | 262,503 | | |
| Redemption fees—Class II | | | 2,761 | | | | 8,345 | | |
Net increase (decrease) in net assets from Fund
share transactions | | | 92,059,875 | | | | (161,870,046 | ) | |
| Total increase (decrease) in net assets | | | 268,964,773 | | | | (273,945,634 | ) | |
| Net assets: | |
| Beginning of period | | | 1,730,265,246 | | | | 2,004,210,880 | | |
| End of period | | $ | 1,999,230,019 | | | $ | 1,730,265,246 | | |
| Undistributed net investment income (loss) | | $ | (2,989,043 | ) | | $ | 14,174,091 | | |
| Fund Share Transactions—Class I: | |
| Shares sold | | | 12,172,141 | | | | 18,845,160 | | |
| Shares issued in reinvestment of dividends | | | 623,215 | | | | 4,715,422 | | |
| Less shares redeemed | | | (7,930,847 | ) | | | (35,258,775 | ) | |
| Net increase (decrease) in shares outstanding | | | 4,864,509 | | | | (11,698,193 | ) | |
| Fund Share Transactions—Class II: | |
| Shares sold | | | 129,950 | | | | 358,217 | | |
| Shares issued in reinvestment of dividends | | | 14,126 | | | | 135,827 | | |
| Less shares redeemed | | | (281,725 | ) | | | (598,309 | ) | |
| Net decrease in shares outstanding | | | (137,649 | ) | | | (104,265 | ) | |
See accompanying Notes to Financial Statements.
THE OAKMARK FUNDS
67
THE OAKMARK FUNDS
Statements of Changes in Net Assets
| | | Oakmark
Global Select Fund | |
| | | Six Months Ended
March 31, 2010 (Unaudited) | | Year Ended
September 30, 2009 | |
| From Operations: | |
| Net investment income (loss) | | $ | (128,418 | ) | | $ | 1,832,904 | | |
| Net realized gain (loss) | | | 22,176,019 | | | | (18,437,462 | ) | |
| Net change in unrealized appreciation (depreciation) | | | 12,549,216 | | | | 65,481,056 | | |
| Net increase in net assets from operations | | | 34,596,817 | | | | 48,876,498 | | |
| Distributions to shareholders from: | |
| Net investment income—Class I | | | (1,100,573 | ) | | | (10,153,233 | ) | |
| Total distributions to shareholders | | | (1,100,573 | ) | | | (10,153,233 | ) | |
| From Fund share transactions: | |
| Proceeds from shares sold—Class I | | | 83,160,668 | | | | 74,545,401 | | |
| Reinvestment of distributions—Class I | | | 1,057,320 | | | | 8,870,711 | | |
| Payment for shares redeemed—Class I | | | (33,176,452 | ) | | | (88,825,014 | ) | |
| Redemption fees—Class I | | | 72,327 | | | | 90,792 | | |
Net increase (decrease) in net assets from Fund
share transactions | | | 51,113,863 | | | | (5,318,110 | ) | |
| Total increase in net assets | | | 84,610,107 | | | | 33,405,155 | | |
| Net assets: | |
| Beginning of period | | | 266,246,849 | | | | 232,841,694 | | |
| End of period | | $ | 350,856,956 | | | $ | 266,246,849 | | |
| Undistributed net investment income | | $ | 190,997 | | | $ | 1,840,311 | | |
| Fund Share Transactions—Class I: | |
| Shares sold | | | 8,351,320 | | | | 10,813,158 | | |
| Shares issued in reinvestment of dividends | | | 106,800 | | | | 1,377,440 | | |
| Less shares redeemed | | | (3,367,142 | ) | | | (12,573,902 | ) | |
| Net increase (decrease) in shares outstanding | | | 5,090,978 | | | | (383,304 | ) | |
THE OAKMARK FUNDS
68
| | | Oakmark
International Fund | |
| | | Six Months Ended
March 31, 2010 (Unaudited) | | Year Ended
September 30, 2009 | |
| From Operations: | |
| Net investment income | | $ | 5,879,233 | | | $ | 39,215,376 | | |
| Net realized gain (loss) | | | 56,199,498 | | | | (775,177,662 | ) | |
| Net change in unrealized appreciation (depreciation) | | | 392,822,639 | | | | 1,201,617,475 | | |
| Net increase in net assets from operations | | | 454,901,370 | | | | 465,655,189 | | |
| Distributions to shareholders from: | |
| Net investment income—Class I | | | (30,251,205 | ) | | | (299,576,482 | ) | |
| Net investment income—Class II | | | (813,198 | ) | | | (7,710,397 | ) | |
| Net realized gain—Class I | | | 0 | | | | (21,453,694 | ) | |
| Net realized gain—Class II | | | 0 | | | | (657,046 | ) | |
| Total distributions to shareholders | | | (31,064,403 | ) | | | (329,397,619 | ) | |
| From Fund share transactions: | |
| Proceeds from shares sold—Class I | | | 888,903,345 | | | | 1,090,830,667 | | |
| Proceeds from shares sold—Class II | | | 33,052,366 | | | | 35,647,741 | | |
| Reinvestment of distributions—Class I | | | 28,189,019 | | | | 294,321,631 | | |
| Reinvestment of distributions—Class II | | | 536,588 | | | | 4,861,449 | | |
| Payment for shares redeemed—Class I | | | (385,670,786 | ) | | | (1,230,588,646 | ) | |
| Payment for shares redeemed—Class II | | | (26,689,837 | ) | | | (62,999,921 | ) | |
| Redemption fees—Class I | | | 382,501 | | | | 423,456 | | |
| Redemption fees—Class II | | | 9,625 | | | | 12,713 | | |
Net increase in net assets from Fund
share transactions | | | 538,712,821 | | | | 132,509,090 | | |
| Total increase in net assets | | | 962,549,788 | | | | 268,766,660 | | |
| Net assets: | |
| Beginning of period | | | 4,153,224,509 | | | | 3,884,457,849 | | |
| End of period | | $ | 5,115,774,297 | | | $ | 4,153,224,509 | | |
| Undistributed net investment income | | $ | 13,774,245 | | | $ | 44,949,878 | | |
| Fund Share Transactions—Class I: | |
| Shares sold | | | 52,919,871 | | | | 86,532,075 | | |
| Shares issued in reinvestment of dividends | | | 1,700,182 | | | | 27,252,128 | | |
| Less shares redeemed | | | (23,204,516 | ) | | | (103,702,336 | ) | |
| Net increase in shares outstanding | | | 31,415,537 | | | | 10,081,867 | | |
| Fund Share Transactions—Class II: | |
| Shares sold | | | 1,950,363 | | | | 2,873,917 | | |
| Shares issued in reinvestment of dividends | | | 32,150 | | | | 447,235 | | |
| Less shares redeemed | | | (1,585,443 | ) | | | (5,151,939 | ) | |
| Net increase (decrease) in shares outstanding | | | 397,070 | | | | (1,830,787 | ) | |
See accompanying Notes to Financial Statements.
THE OAKMARK FUNDS
69
THE OAKMARK FUNDS
Statements of Changes in Net Assets
| | | Oakmark
International Small Cap Fund | |
| | | Six Months Ended
March 31, 2010 (Unaudited) | | Year Ended
September 30, 2009 | |
| From Operations: | |
| Net investment income | | $ | 2,005,629 | | | $ | 8,872,082 | | |
| Net realized gain (loss) | | | 20,175,533 | | | | (123,312,931 | ) | |
| Net change in unrealized appreciation (depreciation) | | | 63,904,754 | | | | 199,157,596 | | |
| Net increase in net assets from operations | | | 86,085,916 | | | | 84,716,747 | | |
| Distributions to shareholders from: | |
| Net investment income—Class I | | | (11,557,905 | ) | | | (47,097,607 | ) | |
| Net investment income—Class II | | | (11,218 | ) | | | (24,604 | ) | |
| Net realized gain—Class I | | | 0 | | | | (6,559,210 | ) | |
| Net realized gain—Class II | | | 0 | | | | (3,537 | ) | |
| Total distributions to shareholders | | | (11,569,123 | ) | | | (53,684,958 | ) | |
| From Fund share transactions: | |
| Proceeds from shares sold—Class I | | | 238,726,186 | | | | 272,684,138 | | |
| Proceeds from shares sold—Class II | | | 589,039 | | | | 654,499 | | |
| Reinvestment of distributions—Class I | | | 10,953,374 | | | | 51,693,701 | | |
| Reinvestment of distributions—Class II | | | 6,783 | | | | 17,043 | | |
| Payment for shares redeemed—Class I | | | (103,558,965 | ) | | | (251,181,117 | ) | |
| Payment for shares redeemed—Class II | | | (367,386 | ) | | | (195,669 | ) | |
| Redemption fees—Class I | | | 210,673 | | | | 281,121 | | |
| Redemption fees—Class II | | | 211 | | | | 176 | | |
Net increase in net assets from Fund
share transactions | | | 146,559,915 | | | | 73,953,892 | | |
| Total increase in net assets | | | 221,076,708 | | | | 104,985,681 | | |
| Net assets: | |
| Beginning of period | | | 768,825,114 | | | | 663,839,433 | | |
| End of period | | $ | 989,901,822 | | | $ | 768,825,114 | | |
| Undistributed net investment income | | $ | 213,316 | | | $ | 9,278,603 | | |
| Fund Share Transactions—Class I: | |
| Shares sold | | | 19,992,332 | | | | 32,249,686 | | |
| Shares issued in reinvestment of dividends | | | 934,588 | | | | 7,199,680 | | |
| Less shares redeemed | | | (8,706,884 | ) | | | (31,178,851 | ) | |
| Net increase in shares outstanding | | | 12,220,036 | | | | 8,270,515 | | |
| Fund Share Transactions—Class II: | |
| Shares sold | | | 48,916 | | | | 64,516 | | |
| Shares issued in reinvestment of dividends | | | 579 | | | | 2,374 | | |
| Less shares redeemed | | | (30,997 | ) | | | (19,870 | ) | |
| Net increase in shares outstanding | | | 18,498 | | | | 47,020 | | |
THE OAKMARK FUNDS
70
THE OAKMARK FUNDS
Notes to Financial Statements (Unaudited)
1. SIGNIFICANT ACCOUNTING POLICIES
The following are the significant accounting policies of Oakmark Fund ("Oakmark"), Oakmark Select Fund ("Select"), Oakmark Equity and Income Fund ("Equity and Income"), Oakmark Global Fund ("Global"), Oakmark Global Select Fund ("Global Select"), Oakmark International Fund ("International"), and Oakmark International Small Cap Fund ("Int'l Small Cap"), collectively referred to as "the Funds", each a series of Harris Associates Investment Trust (the "Trust"), a Massachusetts business trust, organized on February 1, 1991, which is registered as an open-end management investment company under the Investment Company Act of 1940. Each Fund, other than Select and Global Select, is diversified. These policies are in conformity with accounting principles generally accepted in the United States of America ("GAAP"). The presentation of financial statements in conformity with GAAP requires management to make estimates and assumptions that affect the reported amounts of assets and liabilities at the date of the financial statements and the reported amounts of revenues and expenses during the reporting period. Actual results could differ from those estimates and assumptions.
Class disclosure—
Each Fund offers two classes of shares: Class I Shares and Class II Shares. Class I Shares are offered to the general public. Class II Shares are offered to certain retirement plans such as 401(k) and profit sharing plans. Class II Shares pay a service fee at the annual rate of up to 0.25% of average net assets of Class II Shares of the Funds. This service fee is paid to a third-party administrator for performing the services associated with the administration of such retirement plans. Class I Shares do not have an associated service fee. Global Select Class II had no outstanding shares at March 31, 2010.
Income, realized and unrealized capital gains and losses, and expenses of the Funds not directly attributable to a specific class of shares are allocated to each class pro rata based on the relative net assets of each class. Transfer and dividend disbursing agent fees and other shareholder servicing fees are specific to each class.
Redemption fees—
Each Fund, except Equity and Income, imposes a short-term trading fee on redemptions of shares held for 90 days or less to offset two types of costs to the Fund caused by short-term trading: portfolio transaction and market impact costs associated with erratic redemption activity and administrative costs associated with processing redemptions. The fee is 2% of the redemption value and is deducted from either the redemption proceeds or from the balance in the account. The "first-in, first-out" ("FIFO") method is used to determine the holding period.
Security valuation—
The Funds' share prices or net asset values ("NAVs") are calculated as of the close of regular session trading (usually 4:00 pm Eastern time) on the New York Stock Exchange ("NYSE") on any day on which the NYSE is open for trading. Equity securities principally traded on securities exchanges in the United States and over-the-counter securities are valued at the last sales price or the official closing price on the day of valuation, or lacking any reported sales that day, at the most recent bid quotation. Securities traded on the NASDAQ National Market are valued at the NASDAQ Official Closing Price ("NOCP"), or lacking an NOCP, at the most recent bid quotation on the NASDAQ National Market. Equity securities principally traded on securities exchanges outside the United States shall be valued, depending on local convention or regulation, at the last sales price, the last bid or asked price, the mean between the last bid and asked prices, or the official closing price, or shall be based on a pricing composite as of the close of the regular trading hours on the appropriate exchange or other designated time. Debt obligations and money market instruments maturing in more than 60 days from the date of purchase are valued at the latest bid quotation or at an evaluated price provided by an independent professional pricing service. Debt obligations and money market instruments maturing in less than 61 days from the date of purchase are valued at amortized cost, which approximates market value. Options are valued at the last reported sales price on the day of valuation or, lacking any reported sale price on the valuation date, at the mean of the most recent bid and asked quotations or, if the mean is not available, at the most recent bid quotation.
Securities for which quotations are not readily available or securities that may have been affected by a significant event occurring between the close of a foreign market and the close of the NYSE are valued at fair values, determined by or under the direction of the pricing committee established by the Board of Trustees. A significant event may include the performance of U.S. markets since the close of foreign markets. The Funds may use a systematic fair valuation model provided by an independent professional pricing service to value foreign securities in order to adjust for stale pricing, which may occur between the close of certain foreign exchanges and the NYSE. At March 31, 2010 Equity and Income and Int'l Small Cap held securities for which market quotations were not readily available and which were valued by the pricing committee at a fair value determined in good faith in accordance with procedures established by the Boa rd of Trustees.
THE OAKMARK FUNDS
71
THE OAKMARK FUNDS
Notes to Financial Statements (Unaudited) (cont.)
Fair Value Measurement—
The Funds adopted Financial Accounting Standards Board ("FASB") Accounting Standards Codification ("ASC") Topic 820 ("Topic 820"), Fair Value Measurements and Disclosures, effective October 1, 2008. Under Topic 820, various inputs are used in determining the value of each Fund's investments. These inputs are prioritized into three broad levels as follows:
Level 1—quoted prices in active markets for identical securities
Level 2—other significant observable inputs (including quoted prices for similar investments, interest rates, prepayment speeds, credit risk, and others)
Level 3—significant unobservable inputs (including the Fund's own assumptions in determining the fair value of investments)
Observable inputs are those based on market data obtained from independent sources, and unobservable inputs reflect the Funds' own assumptions based on the best information available. The input levels are not necessarily an indication of risk or liquidity associated with investing in those securities.
In April 2009 the FASB issued FASB ASC Topic 820-10 ("Topic 820-10"). Topic 820-10 provides additional guidance for estimating fair value in accordance with Topic 820 when the volume and level of activity for the asset or liability have significantly decreased as well as guidance on identifying circumstances that indicate a transaction is not orderly. Topic 820-10 is effective for fiscal years and interim periods ending after June 15, 2009. The Funds have adopted this topic as of September 30, 2009.
The following is a summary of the inputs used as of March 31, 2010 in valuing each Fund's assets and liabilities. Except for the industries or investment types separately stated below, the total amounts for common stocks, fixed income and short term investments in the table below are presented by industry or investment type in each Fund's Schedule of Investments. Forward foreign currency contracts are presented by contract in the notes following this summary:
| | | Quoted Prices
in Active
Markets for
Identical
Assets
(Level 1) | | Other
Significant
Observable
Inputs
(level 2) | | Significant
Unobservable
Inputs
(Level 3) | |
| Oakmark | | | |
| Common Stocks | | $ | 3,322,239,755 | | | $ | 0 | | | $ | 0 | | |
| Short Term Investments | | | 0 | | | | 101,231,632 | | | | 0 | | |
| Total | | $ | 3,322,239,755 | | | $ | 101,231,632 | | | $ | 0 | | |
| Select | | | |
| Common Stocks | | $ | 2,420,543,708 | | | $ | 0 | | | $ | 0 | | |
| Short Term Investments | | | 0 | | | | 126,701,474 | | | | 0 | | |
| Total | | | 2,420,543,708 | | | $ | 126,701,474 | | | $ | 0 | | |
| Equity and Income | | | |
| Common Stocks - Packaged Food & Meats | | $ | 808,245,000 | | | $ | 467,891,104 | | | $ | 0 | | |
| Common Stocks - All Other | | | 10,875,139,698 | | | | 0 | | | | 0 | | |
| Fixed Income | | | 0 | | | | 4,494,627,287 | | | | 0 | | |
| Short Term Investments | | | 0 | | | | 2,147,391,657 | | | | 0 | | |
| Total | | $ | 11,683,384,698 | | | $ | 7,109,910,048 | | | $ | 0 | | |
| Global | | | |
| Common Stocks | | $ | 1,925,683,859 | | | $ | 0 | | | $ | 0 | | |
| Short Term Investments | | | 0 | | | | 69,456,930 | | | | 0 | | |
| Forward Foreign Currency Contracts - Assets | | | 9,892,673 | | | | 0 | | | | 0 | | |
| Forward Foreign Currency Contracts - Liabilities | | | (135,055 | ) | | | 0 | | | | 0 | | |
| Total | | $ | 1,935,441,477 | | | $ | 69,456,930 | | | $ | 0 | | |
THE OAKMARK FUNDS
72
THE OAKMARK FUNDS
Notes to Financial Statements (Unaudited) (cont.)
| | | Quoted Prices
in Active
Markets for
Identical
Assets
(Level 1) | | Other
Significant
Observable
Inputs
(level 2) | | Significant
Unobservable
Inputs
(Level 3) | |
| Global Select | | | |
| Common Stocks | | $ | 329,876,574 | | | $ | 0 | | | $ | 0 | | |
| Short Term Investments | | | 0 | | | | 18,088,991 | | | | 0 | | |
| Forward Foreign Currency Contracts - Assets | | | 1,302,934 | | | | 0 | | | | 0 | | |
| Forward Foreign Currency Contracts - Liabilities | | | (25,023 | ) | | | 0 | | | | 0 | | |
| Total | | $ | 331,154,485 | | | $ | 18,088,991 | | | $ | 0 | | |
| International | | | |
| Common Stocks | | $ | 4,867,109,917 | | | $ | 0 | | | $ | 0 | | |
| Short Term Investments | | | 0 | | | | 228,740,516 | | | | 0 | | |
| Forward Foreign Currency Contracts - Assets | | | 30,679,670 | | | | 0 | | | | 0 | | |
| Forward Foreign Currency Contracts - Liabilities | | | (470,366 | ) | | | 0 | | | | 0 | | |
| Total | | $ | 4,897,319,221 | | | $ | 228,740,516 | | | $ | 0 | | |
| Int'l Small Cap | | | |
| Common Stocks - Office Services & Supplies | | $ | 0 | | | $ | 32,478,281 | | | $ | 0 | | |
| Common Stocks - All Other | | | 903,794,451 | | | | 0 | | | | 0+ | | |
| Short Term Investments | | | 0 | | | | 50,219,460 | | | | 0 | | |
| Forward Foreign Currency Contracts - Assets | | | 6,049,257 | | | | 0 | | | | 0 | | |
| Forward Foreign Currency Contracts - Liabilities | | | (41,161 | ) | | | 0 | | | | 0 | | |
| Total | | $ | 909,802,547 | | | $ | 82,697,741 | | | $ | 0 | | |
+ During the period ended March 31, 2010 Int'l Small Cap received stock warrants as part of a corporate action for a security within the Broadcasting category. Initially the warrants were classified as Level 3 and valued at zero. During the period, the warrants began trading in an active market, were priced with quoted prices and were transferred to Level 1 where they remained at March 31, 2010. On September 30, 2009, Int'l Small Cap held a security classified as Level 3 within the Investment Banking and Brokerage category with a market value of zero. The market value of this holding remained at zero at March 31, 2010.
Foreign currency translation—
Certain Funds invest in foreign securities, which may involve a number of risk factors and special considerations not present with investments in securities of U.S. corporations. Values of investments and other assets and liabilities denominated in foreign currencies are translated into U.S. dollars at current exchange rates obtained by a recognized bank, dealer, or independent pricing service on the day of valuation. Purchases and sales of investments and dividend and interest income are converted at the prevailing rate of exchange on the respective dates of such transactions.
The Funds do not isolate that portion of the results of operations resulting from changes in foreign exchange rates on investments from the fluctuations arising from changes in market prices of securities held. Such fluctuations are included in net realized gain (loss) on securities and net change in unrealized appreciation (depreciation) on investments in the Statements of Operations. Net realized gains and losses on foreign currency transactions arising from the sale of foreign currencies, currency gains or losses realized between the trade and settlement dates on securities transactions and the difference between the amounts of dividends, interest, foreign withholding taxes and tax reclaims recorded and the U.S. dollar equivalent of the amounts actually received or paid are included in net realized gain (loss) on foreign currency transactions in the Statement of Operations. Unrealized gains and losses arising from changes in the fair value of assets and liabilities, other than investments in securities, resulting from changes in exchange rates are included in net change in unrealized appreciation (depreciation) on foreign currency translation in the Statements of Operations.
Forward foreign currency contracts—
Forward foreign currency contracts are agreements to exchange one currency for another at a future date and at a specified price. The Funds' transactions in forward foreign currency contracts are limited to transaction and portfolio hedging. The contractual amounts of forward foreign currency contracts do not necessarily represent the amounts potentially subject to risk. The measurement of the risks associated with these
THE OAKMARK FUNDS
73
THE OAKMARK FUNDS
Notes to Financial Statements (Unaudited) (cont.)
instruments is meaningful only when all related and offsetting transactions are considered and could exceed the net unrealized value shown in the tables below. Risks arise from the possible inability of counterparties to meet the terms of their contracts and from movements in currency values. Forward foreign currency contracts are valued at the current day's interpolated foreign exchange rates. Unrealized gain or loss on the contracts as measured by the difference between the forward foreign exchange rates at the dates of entry into the contracts and the forward rates at the end of the period is included in the Statements of Assets and Liabilities. Realized gains and losses and the net change in unrealized appreciation (depreciation) on forward foreign currency contracts for the period are included in the Statement of Operations.
The Funds have adopted FASB ASC Topic 815-10 ("Topic 815-10"). Topic 815-10, Disclosures about Derivative Instruments and Hedging Activities, was issued in March 2008 and is effective for fiscal years and interim periods beginning after November 15, 2008. At March 31, 2010 Global, Global Select, International, and Int'l Small Cap held forward foreign currency contracts, which are considered derivative instruments under Topic 815-10, as follows:
Oakmark Global Fund
| | | Contract
Amount | | Settlement
Date | | Valuation at
3/31/10 | | Unrealized
Appreciation/
(Depreciation) | |
| Foreign Currency Sold: | |
| Euro | | | 22,600,000 | | | 09/15/10 | | $ | 30,522,350 | | | $ | 2,496,250 | | |
| Euro | | | 9,800,000 | | | 10/25/10 | | | 13,234,747 | | | | 1,461,137 | | |
| Japanese Yen | | | 2,515,000,000 | | | 09/07/10 | | | 26,934,034 | | | | 346,582 | | |
| Japanese Yen | | | 470,000,000 | | | 11/16/10 | | | 5,038,089 | | | | 180,799 | | |
| Japanese Yen | | | 2,020,000,000 | | | 11/29/10 | | | 21,657,437 | | | | 1,450,196 | | |
| Japanese Yen | | | 3,330,000,000 | | | 03/01/11 | | | 35,765,814 | | | | 1,773,077 | | |
| Swiss Franc | | | 37,700,000 | | | 06/04/10 | | | 35,775,063 | | | | (135,055 | ) | |
| Swiss Franc | | | 29,200,000 | | | 09/24/10 | | | 27,738,414 | | | | 908,697 | | |
| Swiss Franc | | | 26,300,000 | | | 10/25/10 | | | 24,992,543 | | | | 1,275,935 | | |
| | | | | | | | | $ | 221,658,491 | | | $ | 9,757,618 | | |
During the period ended March 31, 2010 the proceeds from sales and cost of purchases of forward foreign currency contracts for Global were $106,829,775 and $70,658,610, respectively.
Oakmark Global Select Fund
| | | Contract
Amount | | Settlement
Date | | Valuation at
3/31/10 | | Unrealized
Appreciation/
(Depreciation) | |
| Euro | | | 3,210,000 | | | 09/15/10 | | $ | 4,335,254 | | | $ | 354,556 | | |
| Euro | | | 115,000 | | | 10/25/10 | | | 155,306 | | | | 17,146 | | |
| Japanese Yen | | | 192,000,000 | | | 09/07/10 | | | 2,056,197 | | | | 26,459 | | |
| Japanese Yen | | | 69,000,000 | | | 11/16/10 | | | 739,634 | | | | 26,543 | | |
| Japanese Yen | | | 213,000,000 | | | 11/29/10 | | | 2,283,680 | | | | 152,917 | | |
| Japanese Yen | | | 270,000,000 | | | 12/24/10 | | | 2,895,932 | | | | 100,406 | | |
| Japanese Yen | | | 590,000,000 | | | 03/01/11 | | | 6,336,886 | | | | 314,149 | | |
| Swiss Franc | | | 6,985,000 | | | 06/04/10 | | | 6,628,351 | | | | (25,023 | ) | |
| Swiss Franc | | | 3,750,000 | | | 09/24/10 | | | 3,562,296 | | | | 116,699 | | |
| Swiss Franc | | | 4,000,000 | | | 10/25/10 | | | 3,801,147 | | | | 194,059 | | |
| | | | | | | | | $ | 32,794,683 | | | $ | 1,277,911 | | |
During the period ended March 31, 2010 the proceeds from sales and cost of purchases of forward foreign currency contracts for Global Select were $17,017,804 and $7,988,206, respectively.
THE OAKMARK FUNDS
74
THE OAKMARK FUNDS
Notes to Financial Statements (Unaudited) (cont.)
Oakmark International Fund
| | | Contract
Amount | | Settlement
Date | | Valuation at
3/31/10 | | Unrealized
Appreciation/
(Depreciation) | |
| Euro | | | 81,600,000 | | | 09/15/10 | | $ | 110,204,592 | | | $ | 9,013,008 | | |
| Euro | | | 38,600,000 | | | 10/25/10 | | | 52,128,696 | | | | 5,755,092 | | |
| Japanese Yen | | | 4,600,000,000 | | | 09/07/10 | | | 49,263,045 | | | | 633,908 | | |
| Japanese Yen | | | 1,850,000,000 | | | 11/16/10 | | | 19,830,774 | | | | 711,657 | | |
| Japanese Yen | | | 4,500,000,000 | | | 11/29/10 | | | 48,246,766 | | | | 3,230,635 | | |
| Japanese Yen | | | 9,610,000,000 | | | 03/01/11 | | | 103,216,059 | | | | 5,116,899 | | |
| Swiss Franc | | | 131,300,000 | | | 06/04/10 | | | 124,595,909 | | | | (470,366 | ) | |
| Swiss Franc | | | 67,000,000 | | | 09/24/10 | | | 63,646,360 | | | | 2,085,024 | | |
| Swiss Franc | | | 85,200,000 | | | 10/25/10 | | | 80,964,436 | | | | 4,133,447 | | |
| | | | | | | | | $ | 652,096,637 | | | $ | 30,209,304 | | |
During the period ended March 31, 2010 the proceeds from sales and cost of purchases of forward foreign currency contracts for International were $323,334,461 and $179,526,093, respectively.
Oakmark Int'l Small Cap Fund
| | | Contract
Amount | | Settlement
Date | | Valuation at
3/31/10 | | Unrealized
Appreciation/
(Depreciation) | |
| Foreign Currency Sold: | |
| Euro | | | 12,500,000 | | | 09/15/10 | | $ | 16,881,831 | | | $ | 1,380,669 | | |
| Euro | | | 13,800,000 | | | 10/25/10 | | | 18,636,684 | | | | 2,057,520 | | |
| Japanese Yen | | | 822,000,000 | | | 09/07/10 | | | 8,803,092 | | | | 113,276 | | |
| Japanese Yen | | | 510,000,000 | | | 11/16/10 | | | 5,466,862 | | | | 196,187 | | |
| Japanese Yen | | | 1,063,000,000 | | | 11/29/10 | | | 11,396,958 | | | | 763,148 | | |
| Japanese Yen | | | 1,712,000,000 | | | 03/01/11 | | | 18,387,710 | | | | 911,564 | | |
| Swiss Franc | | | 11,490,000 | | | 06/04/10 | | | 10,903,328 | | | | (41,161 | ) | |
| Swiss Franc | | | 8,920,000 | | | 09/24/10 | | | 8,473,516 | | | | 277,588 | | |
| Swiss Franc | | | 7,200,000 | | | 10/25/10 | | | 6,842,065 | | | | 349,305 | | |
| | | | | | | | | $ | 105,792,046 | | | $ | 6,008,096 | | |
During the period ended March 31, 2010 the proceeds from sales and cost of purchases of forward foreign currency contracts for Int'l Small Cap were $65,008,003 and $26,943,179, respectively.
Security transactions and investment income—
Security transactions are accounted for on the trade date (date the order to buy or sell is executed) and dividend income is recorded on the ex-dividend date. Interest income and expenses are recorded on an accrual basis. Bond discount is accreted and premium is amortized over the expected life of each applicable security using the yield to maturity method. Withholding taxes and tax reclaims on foreign dividends have been provided for in accordance with the Funds' understanding of the applicable country's tax rules and rates. Net realized gains and losses on investments are determined by the specific identification method.
Short sales—
Each Fund may sell "short" a security it does not own in anticipation of a decline in the value of that security. When the Fund sells a security short, it must borrow the security sold short and deliver it to the broker-dealer through which it made the short sale. A gain, limited to the price
THE OAKMARK FUNDS
75
THE OAKMARK FUNDS
Notes to Financial Statements (Unaudited) (cont.)
at which the Fund sold the security short, or loss, unlimited in size, will be recognized upon the termination of the short sale. At March 31, 2010, none of the Funds had short sales.
Accounting for options—
When a Fund writes an option, the premium received by the Fund is recorded as a liability and is subsequently adjusted to the current market value of the option written. Premiums received from writing options that expire are recorded by the Fund on the expiration date as realized gains from option transactions. The difference between the premium and the amount paid on effecting a closing purchase transaction, including brokerage commissions, is also treated as a realized gain, or if the premium is less than the amount paid for the closing purchase transaction, as a realized loss. If a call option is exercised, the premium is added to the proceeds from the sale of the underlying security or currency in determining whether the Fund has realized a gain or a loss. If a put option is exercised, the premium reduces the cost basis of the security or currency purchased by the Fund. In writing an option, the Fund bears the market risk of an unfavorable change in the price of the security or currency underlying the written option. Exercise of an option written by the Fund could result in the Fund selling or buying a security or currency at a price different from the current market value. Options written by the Fund do not give rise to counterparty credit risk, as they obligate the Fund, not its counterparties, to perform.
When a Fund purchases an option, the premium paid by the Fund is recorded as an asset and is subsequently adjusted to the current value of the option purchased. Purchasing call options tends to increase the Fund's exposure to the underlying instrument. Purchasing put options tends to decrease the Fund's exposure to the underlying instrument. Premiums paid for purchasing options that expire are treated as realized losses. Premiums paid for purchasing options that are exercised or closed are added to the amounts paid or offset against the proceeds on the underlying security to determine the realized gain or loss. The risks associated with purchasing put and call options are potential loss of the premium paid and the failure of the counterparty to honor its obligation under the contract.
At March 31, 2010, the Funds had no outstanding options.
Committed line of credit—
The Trust has an unsecured committed line of credit (the "Facility") with State Street Bank and Trust Company ("State Street") in the amount of $450 million. Borrowings under that arrangement bear interest at 1.25% above the greater of the Federal Funds Effective Rate or LIBOR, as defined in the credit agreement. To maintain the Facility, an annualized commitment fee of 0.15% on the unused portion is charged to the Trust. Fees and interest expense, if any, related to the facility are included in other expenses in the Statements of Operations. There were no borrowings outstanding under the Facility at March 31, 2010.
Expense offset arrangement—
State Street serves as custodian of the Funds. State Street's fee may be reduced by credits that are an earnings allowance calculated on the average daily cash balances each Fund maintains with State Street. Credit balances used to reduce the Funds' custodian fees, if any, are reported as a reduction of total expenses in the Statements of Operations. During the period ended March 31, 2010, none of the Funds received an expense offset credit.
Repurchase agreements—
Each Fund may invest in repurchase agreements, which are short-term investments whereby the Fund acquires ownership of a debt security and the seller agrees to repurchase the security at a future date at a specified price.
The Funds' custodian receives delivery of the underlying securities collateralizing repurchase agreements. It is the Funds' policy that the value of the collateral be at least equal to 102% of the repurchase price, including interest. Harris Associates L.P. ("the Adviser") is responsible for determining that the value of the collateral is at all times at least equal to 102% of the repurchase price, including interest. Repurchase agreements could involve certain risks in the event of default or insolvency of the counterparty including possible delays or restrictions upon a Fund's ability to dispose of the underlying securities.
Security lending—
Each Fund, except Oakmark, may lend its portfolio securities to broker-dealers and banks. Any such loan must be continuously secured by collateral in cash, cash equivalents or U.S. Treasuries maintained on a current basis in an amount at least equal to the fair value of the securities loaned by the Fund. Collateral is marked to market and monitored daily. The Fund would continue to receive the equivalent of the interest or
THE OAKMARK FUNDS
76
THE OAKMARK FUNDS
Notes to Financial Statements (Unaudited) (cont.)
dividends paid by the issuer on the securities loaned, and would also receive an additional return that may be in the form of a fixed fee or a percentage of the earnings on the collateral. The Fund would have the right to call the loan and attempt to obtain the securities loaned at any time on notice of not more than five business days. In the event of bankruptcy or other default of the borrower, the Fund could experience delays in liquidating the loan collateral or recovering the loaned securities and incur expenses related to enforcing its rights. In addition, there could be a decline in the value of the collateral or in the fair value of the securities loaned while the Fund seeks to enforce its rights thereto and the Fund could experience subnormal levels of income or lack of access to income during that period.
At March 31, 2010, none of the Funds had securities on loan.
Restricted securities—
The following investments, the sales of which are restricted to qualified institutional buyers, have been valued according to the securities valuation procedures for debt obligations and money market instruments (as stated in the Security valuation section) since their acquisition dates. These securities are priced using market quotations or at amortized cost and there are no unrestricted securities with the same maturity dates and yields for the issuer.
At March 31, 2010, Equity and Income held the following restricted securities:
| Quantity | | Security
Name | | Acquisition
Date | | Carrying
Value | | Cost | | Value | | Percentage of
Net Assets | |
| $ | 3,000,000 | | | Sealed Air Corporation,
144A, 5.625% due
7/15/2013 | | 6/27/2003 | | | 105.6810 | | | | 100.68 | | | | 3,170,430 | | | | 0.02 | % | |
| | 3,740,000 | | | Sealed Air Corporation,
144A, 5.625% due
7/15/2013 | | 8/20/2003 | | | 105.6810 | | | | 96.41 | | | | 3,952,469 | | | | 0.02 | % | |
| | 300,000 | | | Sealed Air Corporation,
144A, 5.625% due
7/15/2013 | | 8/21/2003 | | | 105.6810 | | | | 96.79 | | | | 317,043 | | | | 0.00 | % | |
| | 11,700,000 | | | Sealed Air Corporation,
144A, 5.625% due
7/15/2013 | | 4/6/2004 | | | 105.6810 | | | | 103.31 | | | | 12,364,677 | | | | 0.07 | % | |
| | 50,000,000 | | | Johnson & Johnson,
144A, 0.09% due
4/12/2010 | | 1/6/2010 | | | 99.9967 | | | | 99.9760 | | | | 49,998,335 | | | | 0.27 | % | |
| | 25,000,000 | | | Johnson & Johnson,
144A, 0.17% due
5/3/2010 | | 11/9/2009 | | | 99.9903 | | | | 99.9174 | | | | 24,997,570 | | | | 0.13 | % | |
| | 30,000,000 | | | Medtronic, Inc.,
144A, 0.13% due
4/5/2010 | | 2/5/2010 | | | 99.9986 | | | | 99.9787 | | | | 29,999,566 | | | | 0.16 | % | |
| | 20,000,000 | | | Medtronic, Inc.,
144A, 0.16% due
4/21/2010 | | 3/16/2010 | | | 99.9911 | | | | 99.9840 | | | | 19,998,222 | | | | 0.11 | % | |
| | 18,000,000 | | | Microsoft Corp.,
144A, 0.16% due
4/14/2010 | | 11/23/2009 | | | 99.9961 | | | | 99.9369 | | | | 17,999,300 | | | | 0.10 | % | |
| | 5,000,000 | | | Microsoft Corp.,
144A, 0.13% due
4/21/2010 | | 3/22/2010 | | | 99.9928 | | | | 99.9892 | | | | 4,999,639 | | | | 0.03 | % | |
| | 4,000,000 | | | Microsoft Corp.,
144A, 0.13% due
4/21/2010 | | 3/23/2010 | | | 99.9928 | | | | 99.9895 | | | | 3,999,711 | | | | 0.02 | % | |
THE OAKMARK FUNDS
77
THE OAKMARK FUNDS
Notes to Financial Statements (Unaudited) (cont.)
| Quantity | | Security
Name | | Acquisition
Date | | Carrying
Value | | Cost | | Value | | Percentage of
Net Assets | |
| $ | 10,000,000 | | | Microsoft Corp.,
144A, 0.10% due
5/26/2010 | | 1/14/2010 | | | 99.9774 | | | | 99.9633 | | | | 9,997,744 | | | | 0.05 | % | |
| | 50,000,000 | | | Microsoft Corp.,
144A, 0.16% due
7/15/2010 | | 1/12/2010 | | | 99.9479 | | | | 99.9182 | | | | 49,973,940 | | | | 0.27 | % | |
| | 10,000,000 | | | Microsoft Corp.,
144A, 0.16% due
7/15/2010 | | 1/12/2010 | | | 99.9479 | | | | 99.9182 | | | | 9,994,788 | | | | 0.05 | % | |
| | 25,000,000 | | | Microsoft Corp.,
144A, 0.18% due
8/17/2010 | | 1/13/2010 | | | 99.9104 | | | | 99.8920 | | | | 24,977,605 | | | | 0.13 | % | |
| | 21,000,000 | | | Procter & Gamble
International Funding,
144A, 0.12% due
4/8/2010 | | 3/10/2010 | | | 99.9957 | | | | 99.9903 | | | | 20,999,090 | | | | 0.11 | % | |
| | 10,000,000 | | | Procter & Gamble
International Funding,
144A, 0.16% due
4/16/2010 | | 3/18/2010 | | | 99.9933 | | | | 99.9871 | | | | 9,999,333 | | | | 0.05 | % | |
| | 46,000,000 | | | Procter & Gamble
International Funding,
144A, 0.11% due
4/19/2010 | | 3/2/2010 | | | 99.9927 | | | | 99.9853 | | | | 45,996,627 | | | | 0.25 | % | |
| | 10,000,000 | | | Procter & Gamble
International Funding,
144A, 0.16% due
4/29/2010 | | 3/25/2010 | | | 99.9849 | | | | 99.9844 | | | | 9,998,489 | | | | 0.05 | % | |
| | 20,000,000 | | | Wal-Mart Stores, Inc.,
144A, 0.11% due
4/1/2010 | | 3/25/2010 | | | 100.0000 | | | | 99.9979 | | | | 20,000,000 | | | | 0.11 | % | |
| | 10,000,000 | | | WellPoint, Inc.,
144A, 0.25% due
4/28/2010 | | 3/25/2010 | | | 99.9813 | | | | 99.9764 | | | | 9,998,125 | | | | 0.05 | % | |
| | | | | | | | | | | | | | | | | | 383,732,703 | | | | 2.05 | % | |
Federal income taxes—
It is each Fund's policy to comply with the requirements of the Internal Revenue Code applicable to regulated investment companies and to distribute substantially all of its net taxable income, including any net realized gains on investments, to its shareholders. Therefore, no federal income tax provision is required.
The Funds implemented the provisions of the FASB ASC Topic 740 ("Topic 740") Accounting for Uncertainty in Income Taxes. This topic prescribes a recognition threshold and measurement attribute for the financial statement recognition and measurement of a tax position taken or expected to be taken in a tax return. It also provides guidance on de-recognition, classification, interest and penalties, accounting in interim periods, disclosure and transition. The implementation of Topic 740 resulted in no material liability for unrecognized tax benefits in the accompanying financial statements.
THE OAKMARK FUNDS
78
THE OAKMARK FUNDS
Notes to Financial Statements (Unaudited) (cont.)
2. TRANSACTIONS WITH AFFILIATES
Each Fund has an investment advisory agreement with the Adviser. For management services and facilities furnished, the Funds pay the Adviser monthly fees. Each fee is calculated on the total net assets as determined at the end of each preceding calendar month. Annual fee rates are as follows:
| Fund | | Advisory Fees | | Fund | | Advisory Fees | |
Oakmark
Select
Equity and Income
| | 1.00% up to $2 billion;
0.90% on the next $1 billion;
0.80% on the next $2 billion;
0.75% on the next $2.5 billion;
0.70% on the next $2.5 billion; and
0.65% over $10 billion
1.00% up to $1 billion;
0.95% on the next $500 million;
0.90% on the next $500 million;
0.85% on the next $500 million;
0.80% on the next $2.5 billion;
0.75% on the next $5 billion; and
0.725% over $10 billion
0.75% up to $5 billion;
0.70% on the next $2.5 billion;
0.675% on the next $2.5 billion;
0.65% on the next $2.5 billion;
0.60% on the next $3.5 billion;
0.585% on the next $5 billion;
0.5775% on the next $7 billion; and
0.5725% over $28 billion | | Global
Global Select
International
Int'l Small Cap
| | 1.00% up to $2 billion;
0.95% on the next $2 billion;
0.90% on the next $4 billion; and
0.875% over $8 billion
1.00% up to $2 billion;
0.95% on the next $1 billion;
0.875% on the next $4 billion; and
0.85% over $7 billion
1.00% up to $2 billion;
0.95% on the next $1 billion;
0.85% on the next $2 billion;
0.825% on the next $2.5 billion;
0.815% on the next $3.5 billion;
0.805% on the next $5.5 billion; and
0.80% ov er $16.5 billion
1.25% up to $500 million;
1.10% on the next $1 billion;
1.05% on the next $2 billion; and
1.025% over $3.5 billion
| |
|
The Adviser is contractually obligated through January 31, 2011 to reimburse each Fund Class to the extent, but only to the extent, that its annualized expenses (excluding taxes, interest, all commissions and other normal charges incident to the purchase and sale of portfolio securities, and extraordinary charges such as litigation costs, but including fees paid to the Adviser) exceed the percent set forth below of average daily net assets of the Fund Class.
| Fund | | Class I | | Class II | |
| Oakmark | | | 1.50 | % | | | 1.75 | % | |
| Select | | | 1.50 | | | | 1.75 | | |
| Equity and Income | | | 1.00 | | | | 1.25 | | |
| Global | | | 1.75 | | | | 2.00 | | |
| Global Select | | | 1.75 | | | | 2.00 | | |
| International | | | 2.00 | | | | 2.25 | | |
| Int'l Small Cap | | | 2.00 | | | | 2.25 | | |
The Adviser is entitled to recoup from any Fund Class, in any fiscal year through September 30, 2013, amounts reimbursed to that Fund Class, except to the extent that the Fund Class already has paid such recoupment to the Adviser or such recoupment would cause the annual ordinary operating expenses of a Fund Class for that fiscal year to exceed the applicable limit stated above. As of March 31, 2010 there were no amounts subject to recoupment.
The Adviser and the Funds have entered into agreements with financial intermediaries to provide recordkeeping, processing, shareholder communications and other services to customers of the intermediaries and have agreed to compensate the intermediaries for providing those services. Certain of those services would be provided by the Funds if the shares of those customers were registered directly with the Funds' transfer agent. Accordingly, the Funds pay a portion of the intermediary fees pursuant to an agreement with the Adviser, which calls for each Fund to pay
THE OAKMARK FUNDS
79
THE OAKMARK FUNDS
Notes to Financial Statements (Unaudited) (cont.)
a portion of the intermediary fees attributable to shares of the Fund held by the intermediary (which generally are a percentage of value of the shares held) not exceeding the lesser of 75% of the fees charged by the intermediary or what the Fund would have paid its transfer agent had each customer's shares been registered directly with the transfer agent instead of held through the intermediary. The Adviser pays the remainder of the fees. The fees incurred by the Funds are reflected as other shareholder servicing fees in the Statements of Operations.
The non-interested Trustees of the Trust may participate in the Trust's Deferred Compensation Plan for Independent Trustees. Participants in the plan may elect to defer all or a portion of their compensation. Amounts deferred are retained by the Trust and represent an unfunded obligation of the Trust. The value of a participant's deferral account is determined by reference to the change in value of Class I shares of one or more of the Funds or a money market fund as specified by the participant. Benefits would be payable after a stated number of years or retirement from the board. The accrued obligations of the Funds under the plan are reflected as deferred Trustee compensation in the Statements of Assets and Liabilities. The Trust pays the compensation of the Trustees other than those affiliated with the Adviser and all expenses incurred in connection with their services to the Trust. The Trust does not provide any pension or r etirement benefits to its Trustees.
The Funds reimburse the Adviser for a portion of the compensation paid to the Funds' Chief Compliance Officer (CCO). The CCO expenses incurred by the Funds are included in other expenses in the Statement of Operations.
3. FEDERAL INCOME TAXES
At March 31, 2010 cost of investments for federal income tax purposes and related composition of unrealized gains and losses for each Fund were as follows:
| Fund | | Cost of Investments
for Federal Income
Tax Purposes | | Gross Unrealized
Appreciation | | Gross Unrealized
(Depreciation) | | Net Unrealized
Appreciation
(Depreciation) | |
| Oakmark | | $ | 2,249,998,871 | | | $ | 1,173,472,516 | | | $ | 0 | | | $ | 1,173,472,516 | | |
| Select | | | 1,825,028,217 | | | | 798,814,244 | | | | (76,597,279 | ) | | | 722,216,965 | | |
| Equity and Income | | | 15,696,589,665 | | | | 3,159,359,967 | | | | (62,654,886 | ) | | | 3,096,705,081 | | |
| Global | | | 1,703,373,560 | | | | 379,499,060 | | | | (87,731,831 | ) | | | 291,767,229 | | |
| Global Select | | | 321,988,024 | | | | 40,848,366 | | | | (14,870,825 | ) | | | 25,977,541 | | |
| International | | | 4,451,465,504 | | | | 770,381,719 | | | | (125,996,790 | ) | | | 644,384,929 | | |
| Int'l Small Cap | | | 997,440,921 | | | | 119,836,310 | | | | (130,785,039 | ) | | | (10,948,729 | ) | |
For the six-month period ended March 31, 2010 the components of distributable earnings on a tax basis (excluding unrealized appreciation (depreciation)) were as follows:
| Fund | | Undistributed
Ordinary Income | | Undistributed Long-
Term Gain | | Total Distributable
Earnings | |
| Oakmark | | $ | 6,186,913 | | | $ | 0 | | | $ | 6,186,913 | | |
| Select | | | 1,354,006 | | | | 0 | | | | 1,354,006 | | |
| Equity and Income | | | 49,184,507 | | | | 0 | | | | 49,184,507 | | |
| Global | | | 7,964,271 | | | | 0 | | | | 7,964,271 | | |
| Global Select | | | 1,503,967 | | | | 0 | | | | 1,503,967 | | |
| International | | | 44,612,569 | | | | 0 | | | | 44,612,569 | | |
| Int'l Small Cap | | | 8,873,116 | | | | 0 | | | | 8,873,116 | | |
THE OAKMARK FUNDS
80
THE OAKMARK FUNDS
Notes to Financial Statements (Unaudited) (cont.)
During the six-month period ended March 31, 2010 and the year ended September 30, 2009 the tax character of distributions paid was as follows:
| | | Period ended
March 31, 2010 | | Year ended
September 30, 2009 | |
| Fund | | Distributions Paid
from Ordinary
Income | | Distributions Paid
from Long-Term
Capital Gain | | Distributions Paid
from Ordinary
Income | | Distributions Paid
from Long-Term
Capital Gain | |
| Oakmark | | $ | 21,191,514 | | | $ | 0 | | | $ | 42,797,994 | | | $ | 93,707,504 | | |
| Select | | | 7,151,945 | | | | 0 | | | | 29,078,511 | | | | 0 | | |
| Equity and Income | | | 187,239,497 | | | | 0 | | | | 208,469,706 | | | | 315,607,090 | | |
| Global | | | 12,675,492 | | | | 0 | | | | 69,175,944 | | | | 0 | | |
| Global Select | | | 1,100,573 | | | | 0 | | | | 10,153,233 | | | | 0 | | |
| International | | | 31,064,403 | | | | 0 | | | | 312,062,206 | | | | 17,335,413 | | |
| Int'l Small Cap | | | 11,569,123 | | | | 0 | | | | 48,127,188 | | | | 5,557,770 | | |
On March 31, 2010 the Funds had temporary book/tax differences in undistributed earnings that were primarily attributable to trustee deferred compensation expenses, passive foreign investment companies, foreign currency contracts, post October losses and deferrals of capital losses on wash sales. Temporary differences will reverse over time. The Funds have permanent differences in book/tax undistributed earnings primarily attributable to currency gains and losses and equalization debits. Permanent differences have been recorded in their respective component of the Analysis of Net Assets.
4. INVESTMENT TRANSACTIONS
For the six-month period ended March 31, 2010 transactions in investment securities (excluding short term and U.S. Government securities) were as follows (in thousands):
| | | Oakmark | | Select | | Equity and
Income | | Global | | Global
Select | | International | | Int'l
Small Cap | |
| Purchases | | $ | 332,223 | | | $ | 279,997 | | | $ | 2,098,345 | | | $ | 390,303 | | | $ | 126,384 | | | $ | 1,611,303 | | | $ | 367,694 | | |
| Proceeds from sales | | | 448,892 | | | | 317,953 | | | | 1,322,715 | | | | 323,567 | | | | 85,177 | | | | 1,128,420 | | | | 238,577 | | |
Purchases at cost and proceeds from sales (in thousands) of long-term U.S. Government securities for the six-month period ended March 31, 2010 were $3,222,273 and $3,455,963, respectively, for Equity and Income.
5. INVESTMENT IN AFFILIATED ISSUERS
An issuer in which a Fund's ownership represents 5% or more of the outstanding voting securities of the issuer is an affiliated issuer as defined under the Investment Company Act of 1940. A schedule of each Fund's investments in securities of affiliated issuers for the six months ended March 31, 2010 is set forth below:
Schedule of Transactions with Affiliated Issuers
Oakmark Equity and Income Fund
| Affiliates | | Shares Held | | Purchases
(Cost) | | Sales
(Proceeds) | | Dividend
Income | | Value
September 30,
2009 | | Value
March 31,
2010 | |
| Kirby Corp.+ | | | 2,809,900 | | | $ | 8,318,039 | | | $ | 0 | | | $ | 0 | | | $ | 94,255,518 | | | $ | 107,197,685 | | |
| Walter Energy, Inc. | | | 3,000,000 | | | | 0 | | | | 0 | | | | 600,000 | | | | 180,180,000 | | | | 276,810,000 | | |
Walter Investment
Management Corp. | | | 1,093,695 | | | | 0 | | | | 0 | | | | 1,093,695 | | | | 17,520,994 | | | | 17,499,120 | | |
| TOTALS | | | | | | $ | 8,318,039 | | | $ | 0 | | | $ | 1,693,695 | | | $ | 291,956,512 | | | $ | 401,506,805 | | |
THE OAKMARK FUNDS
81
THE OAKMARK FUNDS
Notes to Financial Statements (Unaudited) (cont.)
Schedule of Transactions with Affiliated Issuers
Oakmark International Fund
| Affiliates | | Shares Held | | Purchases
(Cost) | | Sales
(Proceeds) | | Dividend
Income | | Value
September 30,
2009 | | Value
March 31,
2010 | |
| Meitec Corp. | | | 2,475,100 | | | $ | 0 | | | $ | 0 | | | $ | 0 | | | $ | 42,021,416 | | | $ | 48,474,790 | | |
| Signet Jewelers, Ltd.+* | | | 4,211,600 | | | | 2,020,262 | | | | 14, 687,504 | | | | 0 | | | | 122,688,216 | | | | 136,203,144 | | |
| TOTALS | | | | $ | 2,020,262 | | | $ | 14,687,504 | | | $ | 0 | | | $ | 164,709,632 | | | $ | 184,677,934 | | |
Schedule of Transactions with Affiliated Issuers
Oakmark Int'l Small Cap Fund
| Affiliates | | Shares Held | | Purchases
(Cost) | | Sales
(Proceeds) | | Dividend
Income | | Value
September 30,
2009 | | Value
March 31,
2010 | |
| Alaska Milk Corp. | | | 56,360,000 | | | $ | 0 | | | $ | 0 | | | $ | 120,826 | | | $ | 6,304,517 | | | $ | 10,226,864 | | |
| Interpump Group SpA+ | | | 5,909,300 | | | | 8,919,971 | | | | 2,289,362 | | | | 0 | | | | 26,710,306 | | | | 29,172,013 | | |
Interpump Group SpA,
Warrants+ | | | 1,042,080 | | | | 0 | | | | 0 | | | | 0 | | | | 0 | | | | 379,317 | | |
| JJB Sports PLC+ | | | 50,389,541 | | | | 14,789,087 | | | | 2,519,843 | | | | 0 | | | | 9,239,736 | | | | 17,204,868 | | |
LSL Property
Services PLC+ | | | 5,681,723 | | | | 8,319,723 | | | | 12,910,685 | | | | 422,197 | | | | 24,329,944 | | | | 26,167,798 | | |
| Media Prima Berhad* | | | 31,962,400 | | | | 0 | | | | 5,523,518 | | | | 507,117 | | | | 19,865,381 | | | | 21,066,573 | | |
| Orbotech, Ltd.+ | | | 1,715,000 | | | | 6,204,200 | | | | 0 | | | | 0 | | | | 10,080,921 | | | | 18,573,450 | | |
| Pasona Group, Inc. | | | 23,842 | | | | 0 | | | | 0 | | | | 0 | | | | 17,583,027 | | | | 15,709,351 | | |
| Vitec Group PLC | | | 3,035,979 | | | | 0 | | | | 0 | | | | 0 | | | | 17,709,631 | | | | 18,658,736 | | |
| TOTALS | | | | | | $ | 38,232,981 | | | $ | 23,243,408 | | | $ | 1,050,140 | | | $ | 131,823,463 | | | $ | 157,158,970 | | |
+ Non-income producing security.
* Due to transactions during the period ended March 31, 2010 the company is no longer an affiliated security.
6. SUBSEQUENT EVENT
In accordance with the provisions set forth in FASB ASC Topic 855 Subsequent Events, adopted by the Funds as of June 30, 2009, management has evaluated the possibility of subsequent events existing in the Funds' financial statements. Management has determined that there are no material events that would require disclosure in the Funds' financial statements through the date of the publication of this report.
THE OAKMARK FUNDS
82
THE OAKMARK FUNDS
FINANCIAL HIGHLIGHTS
The following tables are intended to help you understand each Fund's financial performance during the last 5 years (or since it began operations, if less than five years). Certain information reflects financial results for a single Fund share. Total returns represent the rate you would have earned (or lost) on an investment, assuming reinvestment of all dividends and distributions. The information for the period ended March 31, 2010 is unaudited, and each Fund's financial statements is included in this report. Deloitte & Touche LLP, an independent registered public accounting firm, has audited the information for the fiscal years ended September 30, 2009, 2008, 2007, 2006, and 2005. For each year shown, all information is for the fiscal year ended September 30, unless otherwise noted.
THE OAKMARK FUNDS
83
OAKMARK FUND
Financial Highlights–Class I
For a share outstanding throughout each period
| | | Six Months Ended
March 31, 2010
(Unaudited) | | Year Ended
September 30,
2009 | | Year Ended
September 30,
2008 | | Year Ended
September 30,
2007 | | Year Ended
September 30,
2006 | | Year Ended
September 30,
2005 | |
| Net Asset Value, Beginning of Period | | $ | 34.55 | | | $ | 35.31 | | | $ | 47.28 | | | $ | 44.64 | | | $ | 40.75 | | | $ | 38.68 | | |
| Income From Investment Operations: | |
| Net Investment Income | | | 0.14 | | | | 0.29 | (a) | | | 0.52 | | | | 0.47 | (a) | | | 0.39 | (a) | | | 0.34 | | |
Net Gain (Loss) on Investments (both realized
and unrealized) | | | 4.88 | | | | 0.39 | | | | (8.51 | ) | | | 4.60 | | | | 3.85 | | | | 1.90 | | |
| Total From Investment Operations | | | 5.02 | | | | 0.68 | | | | (7.99 | ) | | | 5.07 | | | | 4.24 | | | | 2.24 | | |
| Less Distributions: | |
| From Net Investment Income | | | (0.23 | ) | | | (0.45 | ) | | | (0.56 | ) | | | (0.43 | ) | | | (0.35 | ) | | | (0.17 | ) | |
| From Capital Gains | | | 0.00 | | | | (0.99 | ) | | | (3.42 | ) | | | (2.00 | ) | | | 0.00 | | | | 0.00 | | |
| Total Distributions | | | (0.23 | ) | | | (1.44 | ) | | | (3.98 | ) | | | (2.43 | ) | | | (0.35 | ) | | | (0.17 | ) | |
| Redemption Fees | | | 0.00 | (b) | | | 0.00 | (b) | | | 0.00 | (b) | | | 0.00 | (b) | | | 0.00 | (b) | | | 0.00 | (b) | |
| Net Asset Value, End of Period | | $ | 39.34 | | | $ | 34.55 | | | $ | 35.31 | | | $ | 47.28 | | | $ | 44.64 | | | $ | 40.75 | | |
| Total Return | | | 14.59 | % | | | 3.38 | % | | | -18.14 | % | | | 11.51 | % | | | 10.46 | % | | | 5.79 | % | |
| Ratios/Supplemental Data: | |
| Net Assets, End of Period ($million) | | $ | 3,504.3 | | | $ | 3,144.2 | | | $ | 3,610.1 | | | $ | 5,656.9 | | | $ | 5,486.2 | | | $ | 6,340.4 | | |
| Ratio of Expenses to Average Net Assets* | | | 1.12 | %† | | | 1.23 | % | | | 1.10 | % | | | 1.01 | % | | | 1.05 | % | | | 1.03 | % | |
| Ratio of Net Investment Income to Average Net Assets | | | 0.81 | %† | | | 1.06 | % | | | 1.17 | % | | | 1.01 | % | | | 0.94 | % | | | 0.79 | % | |
| Portfolio Turnover Rate | | | 11 | % | | | 62 | % | | | 32 | % | | | 12 | % | | | 9 | % | | | 16 | % | |
Financial Highlights–Class II
For a share outstanding throughout each period
| | | Six Months Ended
March 31, 2010
(Unaudited) | | Year Ended
September 30,
2009 | | Year Ended
September 30,
2008 | | Year Ended
September 30,
2007 | | Year Ended
September 30,
2006 | | Year Ended
September 30,
2005 | |
| Net Asset Value, Beginning of Period | | $ | 34.56 | | | $ | 35.12 | | | $ | 46.97 | | | $ | 44.35 | | | $ | 40.51 | | | $ | 38.45 | | |
| Income From Investment Operations: | |
| Net Investment Income | | | 0.09 | (a) | | | 0.24 | (a) | | | 0.54 | | | | 0.32 | (a) | | | 0.25 | (a) | | | 0.26 | (a) | |
Net Gain (Loss) on Investments (both realized
and unrealized) | | | 4.88 | | | | 0.45 | | | | (8.64 | ) | | | 4.55 | | | | 3.82 | | | | 1.87 | | |
| Total From Investment Operations | | | 4.97 | | | | 0.69 | | | | (8.10 | ) | | | 4.87 | | | | 4.07 | | | | 2.13 | | |
| Less Distributions: | |
| From Net Investment Income | | | (0.16 | ) | | | (0.26 | ) | | | (0.33 | ) | | | (0.25 | ) | | | (0.23 | ) | | | (0.07 | ) | |
| From Capital Gains | | | 0.00 | | | | (0.99 | ) | | | (3.42 | ) | | | (2.00 | ) | | | 0.00 | | | | 0.00 | | |
| Total Distributions | | | (0.16 | ) | | | (1.25 | ) | | | (3.75 | ) | | | (2.25 | ) | | | (0.23 | ) | | | (0.07 | ) | |
| Redemption Fees | | | 0.00 | (b) | | | 0.00 | (b) | | | 0.00 | (b) | | | 0.00 | (b) | | | 0.00 | (b) | | | 0.00 | (b) | |
| Net Asset Value, End of Period | | $ | 39.37 | | | $ | 34.56 | | | $ | 35.12 | | | $ | 46.97 | | | $ | 44.35 | | | $ | 40.51 | | |
| Total Return | | | 14.42 | % | | | 3.22 | % | | | -18.44 | % | | | 11.11 | % | | | 10.08 | % | | | 5.55 | % | |
| Ratios/Supplemental Data: | |
| Net assets, end of period ($million) | | $ | 8.4 | | | $ | 8.2 | | | $ | 12.4 | | | $ | 29.1 | | | $ | 37.5 | | | $ | 43.7 | | |
| Ratio of Expenses to Average Net Assets* | | | 1.43 | %† | | | 1.44 | % | | | 1.47 | % | | | 1.36 | % | | | 1.40 | % | | | 1.26 | % | |
| Ratio of Net Investment Income to Average Net Assets | | | 0.49 | %† | | | 0.88 | % | | | 0.81 | % | | | 0.67 | % | | | 0.59 | % | | | 0.58 | % | |
| Portfolio Turnover Rate | | | 11 | % | | | 62 | % | | | 32 | % | | | 12 | % | | | 9 | % | | | 16 | % | |
† Data has been annualized.
* The ratio excludes expense offset arrangement.
(a) Computed using average shares outstanding throughout the period.
(b) Amount rounds to less than $0.01 per share.
THE OAKMARK FUNDS
84
OAKMARK SELECT FUND
Financial Highlights–Class I
For a share outstanding throughout each period
| | | Six Months Ended
March 31, 2010
(Unaudited) | | Year Ended
September 30,
2009 | | Year Ended
September 30,
2008 | | Year Ended
September 30,
2007 | | Year Ended
September 30,
2006 | | Year Ended
September 30,
2005 | |
| Net Asset Value, Beginning of Period | | $ | 22.68 | | | $ | 20.34 | | | $ | 33.05 | | | $ | 34.48 | | | $ | 33.44 | | | $ | 31.20 | | |
| Income From Investment Operations: | |
| Net Investment Income | | | 0.07 | | | | 0.11 | (a) | | | 0.35 | | | | 0.38 | (a) | | | 0.36 | (a) | | | 0.29 | | |
Net Gain (Loss) on Investments (both realized
and unrealized) | | | 3.15 | | | | 2.48 | | | | (9.63 | ) | | | 2.11 | | | | 2.76 | | | | 2.19 | | |
| Total From Investment Operations | | | 3.22 | | | | 2.59 | | | | (9.28 | ) | | | 2.49 | | | | 3.12 | | | | 2.48 | | |
| Less Distributions: | |
| From Net Investment Income | | | (0.07 | ) | | | (0.25 | ) | | | (0.32 | ) | | | (0.39 | ) | | | (0.29 | ) | | | (0.24 | ) | |
| From Capital Gains | | | 0.00 | | | | 0.00 | | | | (3.11 | ) | | | (3.53 | ) | | | (1.79 | ) | | | 0.00 | | |
| Total Distributions | | | (0.07 | ) | | | (0.25 | ) | | | (3.43 | ) | | | (3.92 | ) | | | (2.08 | ) | | | (0.24 | ) | |
| Redemption Fees | | | 0.00 | (b) | | | 0.00 | (b) | | | 0.00 | (b) | | | 0.00 | (b) | | | 0.00 | (b) | | | 0.00 | (b) | |
| Net Asset Value, End of Period | | $ | 25.83 | | | $ | 22.68 | | | $ | 20.34 | | | $ | 33.05 | | | $ | 34.48 | | | $ | 33.44 | | |
| Total Return | | | 14.23 | % | | | 13.30 | % | | | -30.43 | % | | | 7.00 | % | | | 9.58 | % | | | 7.98 | % | |
| Ratios/Supplemental Data: | |
| Net Assets, End of Period ($million) | | $ | 2,539.3 | | | $ | 2,265.3 | | | $ | 2,558.9 | | | $ | 5,397.4 | | | $ | 5,776.6 | | | $ | 5,908.0 | | |
| Ratio of Expenses to Average Net Assets* | | | 1.09 | %† | | | 1.19 | % | | | 1.08 | % | | | 0.97 | % | | | 0.99 | % | | | 1.00 | % | |
| Ratio of Net Investment Income to Average Net Assets | | | 0.63 | %† | | | 0.66 | % | | | 1.16 | % | | | 1.11 | % | | | 1.08 | % | | | 0.87 | % | |
| Portfolio Turnover Rate | | | 13 | % | | | 34 | % | | | 26 | % | | | 10 | % | | | 22 | % | | | 21 | % | |
Financial Highlights–Class II
For a share outstanding throughout each period
| | | Six Months Ended
March 31, 2010
(Unaudited) | | Year Ended
September 30,
2009 | | Year Ended
September 30,
2008 | | Year Ended
September 30,
2007 | | Year Ended
September 30,
2006 | | Year Ended
September 30,
2005 | |
| Net Asset Value, Beginning of Period | | $ | 22.70 | | | $ | 20.29 | | | $ | 32.82 | | | $ | 34.23 | | | $ | 33.24 | | | $ | 31.00 | | |
| Income From Investment Operations: | |
| Net Investment Income | | | 0.04 | (a) | | | 0.12 | (a) | | | 0.34 | | | | 0.27 | (a) | | | 0.26 | (a) | | | 0.21 | | |
Net Gain (Loss) on Investments (both realized
and unrealized) | | | 3.15 | | | | 2.49 | | | | (9.65 | ) | | | 2.09 | | | | 2.72 | | | | 2.18 | | |
| Total From Investment Operations | | | 3.19 | | | | 2.61 | | | | (9.31 | ) | | | 2.36 | | | | 2.98 | | | | 2.39 | | |
| Less Distributions: | |
| From Net Investment Income | | | (0.06 | ) | | | (0.20 | ) | | | (0.11 | ) | | | (0.24 | ) | | | (0.20 | ) | | | (0.15 | ) | |
| From Capital Gains | | | 0.00 | | | | 0.00 | | | | (3.11 | ) | | | (3.53 | ) | | | (1.79 | ) | | | 0.00 | | |
| Total Distributions | | | (0.06 | ) | | | (0.20 | ) | | | (3.22 | ) | | | (3.77 | ) | | | (1.99 | ) | | | (0.15 | ) | |
| Redemption Fees | | | 0.00 | (b) | | | 0.00 | (b) | | | 0.00 | (b) | | | 0.00 | (b) | | | 0.00 | (b) | | | 0.00 | (b) | |
| Net Asset Value, End of Period | | $ | 25.83 | | | $ | 22.70 | | | $ | 20.29 | | | $ | 32.82 | | | $ | 34.23 | | | $ | 33.24 | | |
| Total Return | | | 14.05 | % | | | 13.34 | % | | | -30.64 | % | | | 6.65 | % | | | 9.18 | % | | | 7.72 | % | |
| Ratios/Supplemental Data: | |
| Net assets, end of period ($million) | | $ | 9.0 | | | $ | 8.1 | | | $ | 15.1 | | | $ | 36.2 | | | $ | 68.1 | | | $ | 85.2 | | |
| Ratio of Expenses to Average Net Assets* | | | 1.37 | %† | | | 1.28 | % | | | 1.37 | % | | | 1.35 | % | | | 1.34 | % | | | 1.25 | % | |
| Ratio of Net Investment Income to Average Net Assets | | | 0.35 | %† | | | 0.72 | % | | | 0.88 | % | | | 0.79 | % | | | 0.78 | % | | | 0.65 | % | |
| Portfolio Turnover Rate | | | 13 | % | | | 34 | % | | | 26 | % | | | 10 | % | | | 22 | % | | | 21 | % | |
† Data has been annualized.
* The ratio excludes expense offset arrangement.
(a) Computed using average shares outstanding throughout the period.
(b) Amount rounds to less than $0.01 per share.
See accompanying Notes to Financial Statements.
THE OAKMARK FUNDS
85
OAKMARK EQUITY AND INCOME FUND
Financial Highlights–Class I
For a share outstanding throughout each period
| | | Six Months Ended
March 31, 2010
(Unaudited) | | Year Ended
September 30,
2009 | | Year Ended
September 30,
2008 | | Year Ended
September 30,
2007 | | Year Ended
September 30,
2006 | | Year Ended
September 30,
2005 | |
| Net Asset Value, Beginning of Period | | $ | 24.72 | | | $ | 25.57 | | | $ | 28.67 | | | $ | 26.49 | | | $ | 25.41 | | | $ | 23.12 | | |
| Income From Investment Operations: | |
| Net Investment Income | | | 0.13 | (a) | | | 0.35 | (a) | | | 0.53 | (a) | | | 0.58 | (a) | | | 0.44 | | | | 0.31 | | |
Net Gain (Loss) on Investments (both realized
and unrealized) | | | 2.18 | | | | (0.24 | ) | | | (1.52 | ) | | | 3.41 | | | | 1.18 | | | | 2.77 | | |
| Total From Investment Operations | | | 2.31 | | | | 0.11 | | | | (0.99 | ) | | | 3.99 | | | | 1.62 | | | | 3.08 | | |
| Less Distributions: | |
| From Net Investment Income | | | (0.29 | ) | | | (0.39 | ) | | | (0.60 | ) | | | (0.50 | ) | | | (0.34 | ) | | | (0.20 | ) | |
| From Capital Gains | | | 0.00 | | | | (0.57 | ) | | | (1.51 | ) | | | (1.31 | ) | | | (0.20 | ) | | | (0.59 | ) | |
| Total Distributions | | | (0.29 | ) | | | (0.96 | ) | | | (2.11 | ) | | | (1.81 | ) | | | (0.54 | ) | | | (0.79 | ) | |
| Redemption Fees | | | 0.00 | | | | 0.00 | | | | 0.00 | (b) | | | 0.00 | (b) | | | 0.00 | (b) | | | 0.00 | (b) | |
| Net Asset Value, End of Period | | $ | 26.74 | | | $ | 24.72 | | | $ | 25.57 | | | $ | 28.67 | | | $ | 26.49 | | | $ | 25.41 | | |
| Total Return | | | 9.43 | % | | | 1.02 | % | | | -3.85 | % | | | 15.77 | % | | | 6.51 | % | | | 13.65 | % | |
| Ratios/Supplemental Data: | |
| Net Assets, End of Period ($million) | | $ | 17,441.2 | | | $ | 14,418.4 | | | $ | 13,263.3 | | | $ | 12,489.5 | | | $ | 10,414.5 | | | $ | 9,223.2 | | |
| Ratio of Expenses to Average Net Assets* | | | 0.79 | %† | | | 0.85 | % | | | 0.81 | % | | | 0.83 | % | | | 0.86 | % | | | 0.89 | % | |
| Ratio of Net Investment Income to Average Net Assets | | | 1.05 | %† | | | 1.59 | % | | | 1.93 | % | | | 2.14 | % | | | 1.88 | % | | | 1.36 | % | |
| Portfolio Turnover Rate | | | 32 | % | | | 78 | %(c) | | | 65 | %(c) | | | 67 | % | | | 81 | % | | | 112 | % | |
Financial Highlights–Class II
For a share outstanding throughout each period
| | | Six Months Ended
March 31, 2010
(Unaudited) | | Year Ended
September 30,
2009 | | Year Ended
September 30,
2008 | | Year Ended
September 30,
2007 | | Year Ended
September 30,
2006 | | Year Ended
September 30,
2005 | |
| Net Asset Value, Beginning of Period | | $ | 24.57 | | | $ | 25.40 | | | $ | 28.50 | | | $ | 26.35 | | | $ | 25.29 | | | $ | 23.03 | | |
| Income From Investment Operations: | |
| Net Investment Income | | | 0.09 | | | | 0.28 | (a) | | | 0.43 | (a) | | | 0.48 | (a) | | | 0.35 | | | | 0.28 | | |
Net Gain (Loss) on Investments (both realized
and unrealized) | | | 2.18 | | | | (0.24 | ) | | | (1.51 | ) | | | 3.40 | | | | 1.19 | | | | 2.72 | | |
| Total From Investment Operations | | | 2.27 | | | | 0.04 | | | | (1.08 | ) | | | 3.88 | | | | 1.54 | | | | 3.00 | | |
| Less Distributions: | |
| From Net Investment Income | | | (0.23 | ) | | | (0.30 | ) | | | (0.51 | ) | | | (0.42 | ) | | | (0.28 | ) | | | (0.15 | ) | |
| From Capital Gains | | | 0.00 | | | | (0.57 | ) | | | (1.51 | ) | | | (1.31 | ) | | | (0.20 | ) | | | (0.59 | ) | |
| Total Distributions | | | (0.23 | ) | | | (0.87 | ) | | | (2.02 | ) | | | (1.73 | ) | | | (0.48 | ) | | | (0.74 | ) | |
| Redemption Fees | | | 0.00 | | | | 0.00 | | | | 0.00 | (b) | | | 0.00 | (b) | | | 0.00 | (b) | | | 0.00 | | |
| Net Asset Value, End of Period | | $ | 26.61 | | | $ | 24.57 | | | $ | 25.40 | | | $ | 28.50 | | | $ | 26.35 | | | $ | 25.29 | | |
| Total Return | | | 9.29 | % | | | 0.70 | % | | | -4.19 | % | | | 15.38 | % | | | 6.18 | % | | | 13.34 | % | |
| Ratios/Supplemental Data: | |
| Net assets, end of period ($million) | | $ | 1,289.6 | | | $ | 1,110.4 | | | $ | 1,009.7 | | | $ | 915.1 | | | $ | 718.1 | | | $ | 582.0 | | |
| Ratio of Expenses to Average Net Assets* | | | 1.09 | %† | | | 1.18 | % | | | 1.16 | % | | | 1.17 | % | | | 1.18 | % | | | 1.14 | % | |
| Ratio of Net Investment Income to Average Net Assets | | | 0.74 | %† | | | 1.26 | % | | | 1.59 | % | | | 1.82 | % | | | 1.57 | % | | | 1.11 | % | |
| Portfolio Turnover Rate | | | 32 | % | | | 78 | %(c) | | | 65 | %(c) | | | 67 | % | | | 81 | % | | | 112 | % | |
† Data has been annualized.
* The ratio excludes expense offset arrangement.
(a) Computed using average shares outstanding throughout the period.
(b) Amount rounds to less than $0.01 per share.
(c) The ratio excludes in-kind transactions.
THE OAKMARK FUNDS
86
OAKMARK GLOBAL FUND
Financial Highlights–Class I
For a share outstanding throughout each period
| | | Six Months Ended
March 31, 2010
(Unaudited) | | Year Ended
September 30,
2009 | | Year Ended
September 30,
2008 | | Year Ended
September 30,
2007 | | Year Ended
September 30,
2006 | | Year Ended
September 30,
2005 | |
| Net Asset Value, Beginning of Period | | $ | 18.94 | | | $ | 19.43 | | | $ | 28.08 | | | $ | 26.69 | | | $ | 23.91 | | | $ | 19.73 | | |
| Income From Investment Operations: | |
| Net Investment Income (Loss) | | | (0.02 | ) | | | 0.11 | | | | 0.25 | | | | 0.18 | (a) | | | 0.27 | | | | 0.17 | | |
Net Gain (Loss) on Investments (both realized
and unrealized) | | | 2.02 | | | | 0.13 | | | | (5.82 | ) | | | 5.06 | | | | 3.74 | | | | 4.48 | | |
| Total From Investment Operations | | | 2.00 | | | | 0.24 | | | | (5.57 | ) | | | 5.24 | | | | 4.01 | | | | 4.65 | | |
| Less Distributions: | |
| From Net Investment Income | | | (0.14 | ) | | | (0.70 | ) | | | (0.04 | ) | | | (0.31 | ) | | | (0.26 | ) | | | (0.10 | ) | |
| From Capital Gains | | | 0.00 | | | | (0.03 | ) | | | (3.04 | ) | | | (3.54 | ) | | | (0.97 | ) | | | (0.37 | ) | |
| Total Distributions | | | (0.14 | ) | | | (0.73 | ) | | | (3.08 | ) | | | (3.85 | ) | | | (1.23 | ) | | | (0.47 | ) | |
| Redemption Fees | | | 0.00 | (b) | | | 0.00 | (b) | | | 0.00 | (b) | | | 0.00 | (b) | | | 0.00 | (b) | | | 0.00 | (b) | |
| Net Asset Value, End of Period | | $ | 20.80 | | | $ | 18.94 | | | $ | 19.43 | | | $ | 28.08 | | | $ | 26.69 | | | $ | 23.91 | | |
| Total Return | | | 10.61 | % | | | 2.65 | % | | | -22.10 | % | | | 21.29 | % | | | 17.46 | % | | | 23.88 | % | |
| Ratios/Supplemental Data: | |
| Net Assets, End of Period ($million) | | $ | 1,942.3 | | | $ | 1,675.9 | | | $ | 1,946.6 | | | $ | 3,006.2 | | | $ | 2,282.2 | | | $ | 1,842.9 | | |
| Ratio of Expenses to Average Net Assets* | | | 1.15 | %† | | | 1.23 | % | | | 1.16 | % | | | 1.13 | % | | | 1.18 | % | | | 1.20 | % | |
Ratio of Net Investment Income (loss) to
Average Net Assets | | | (0.23 | )%† | | | 0.76 | % | | | 0.95 | % | | | 0.66 | % | | | 1.18 | % | | | 0.81 | % | |
| Portfolio Turnover Rate | | | 19 | % | | | 32 | % | | | 41 | % | | | 35 | % | | | 41 | % | | | 17 | % | |
Financial Highlights–Class II
For a share outstanding throughout each period
| | | Six Months Ended
March 31, 2010
(Unaudited) | | Year Ended
September 30,
2009 | | Year Ended
September 30,
2008 | | Year Ended
September 30,
2007 | | Year Ended
September 30,
2006 | | Year Ended
September 30,
2005 | |
| Net Asset Value, Beginning of Period | | $ | 18.58 | | | $ | 19.01 | | | $ | 27.62 | | | $ | 26.31 | | | $ | 23.63 | | | $ | 19.53 | | |
| Income From Investment Operations: | |
| Net Investment Income (Loss) | | | (0.07 | ) | | | 0.07 | (a) | | | 0.13 | | | | 0.07 | (a) | | | 0.18 | | | | 0.11 | | |
Net Gain (Loss) on Investments (both realized
and unrealized) | | | 2.00 | | | | 0.14 | | | | (5.69 | ) | | | 4.99 | | | | 3.69 | | | | 4.43 | | |
| Total From Investment Operations | | | 1.93 | | | | 0.21 | | | | (5.56 | ) | | | 5.06 | | | | 3.87 | | | | 4.54 | | |
| Less Distributions: | |
| From Net Investment Income | | | (0.09 | ) | | | (0.61 | ) | | | (0.01 | ) | | | (0.21 | ) | | | (0.22 | ) | | | (0.07 | ) | |
| From Capital Gains | | | 0.00 | | | | (0.03 | ) | | | (3.04 | ) | | | (3.54 | ) | | | (0.97 | ) | | | (0.37 | ) | |
| Total Distributions | | | (0.09 | ) | | | (0.64 | ) | | | (3.05 | ) | | | (3.75 | ) | | | (1.19 | ) | | | (0.44 | ) | |
| Redemption Fees | | | 0.00 | (b) | | | 0.00 | (b) | | | 0.00 | (b) | | | 0.00 | (b) | | | 0.00 | (b) | | | 0.00 | (b) | |
| Net Asset Value, End of Period | | $ | 20.42 | | | $ | 18.58 | | | $ | 19.01 | | | $ | 27.62 | | | $ | 26.31 | | | $ | 23.63 | | |
| Total Return | | | 10.46 | % | | | 2.43 | % | | | -22.46 | % | | | 20.82 | % | | | 17.01 | % | | | 23.53 | % | |
| Ratios/Supplemental Data: | |
| Net assets, end of period ($million) | | $ | 57.0 | | | $ | 54.4 | | | $ | 57.6 | | | $ | 90.3 | | | $ | 77.1 | | | $ | 58.6 | | |
| Ratio of Expenses to Average Net Assets* | | | 1.53 | %† | | | 1.54 | % | | | 1.57 | % | | | 1.53 | % | | | 1.56 | % | | | 1.45 | % | |
Ratio of Net Investment Income (loss) to
Average Net Assets | | | (0.61 | )%† | | | 0.46 | % | | | 0.54 | % | | | 0.25 | % | | | 0.80 | % | | | 0.63 | % | |
| Portfolio Turnover Rate | | | 19 | % | | | 32 | % | | | 41 | % | | | 35 | % | | | 41 | % | | | 17 | % | |
† Data has been annualized.
* The ratio excludes expense offset arrangement.
(a) Computed using average shares outstanding throughout the period.
(b) Amount rounds to less than $0.01 per share.
See accompanying Notes to Financial Statements.
THE OAKMARK FUNDS
87
OAKMARK GLOBAL SELECT FUND
Financial Highlights–Class I
For a share outstanding throughout each period
| | | Six Months Ended
March 31, 2010
(Unaudited) | | Year Ended
September 30,
2009 | | Year Ended
September 30,
2008 | | October 2, 2006
through
September 30, 2007 (a) | |
| Net Asset Value, Beginning of Period | | $ | 9.54 | | | $ | 8.23 | | | $ | 11.61 | | | $ | 10.00 | | |
| Income From Investment Operations: | |
| Net Investment Income (Loss) | | | (0.00 | )(b)(c) | | | 0.06 | | | | 0.14 | (b) | | | 0.12 | (b) | |
| Net Gain (Loss) on Investments (both realized and unrealized) | | | 1.13 | | | | 1.60 | | | | (3.07 | ) | | | 1.49 | | |
| Total From Investment Operations | | | 1.13 | | | | 1.66 | | | | (2.93 | ) | | | 1.61 | | |
| Less Distributions: | |
| From Net Investment Income | | | (0.04 | ) | | | (0.35 | ) | | | (0.02 | ) | | | (0.01 | ) | |
| From Capital Gains | | | 0.00 | | | | 0.00 | | | | (0.44 | ) | | | 0.00 | | |
| Total Distributions | | | (0.04 | ) | | | (0.35 | ) | | | (0.46 | ) | | | (0.01 | ) | |
| Redemption Fees | | | 0.00 | (c) | | | 0.00 | (c) | | | 0.01 | | | | 0.01 | | |
| Net Asset Value, End of Period | | $ | 10.63 | | | $ | 9.54 | | | $ | 8.23 | | | $ | 11.61 | | |
| Total Return | | | 11.86 | % | | | 22.24 | % | | | -25.95 | % | | | 16.23 | %² | |
| Ratios/Supplemental Data: | |
| Net Assets, End of Period ($million) | | $ | 350.9 | | | $ | 266.2 | | | $ | 232.8 | | | $ | 377.7 | | |
| Ratio of Expenses to Average Net Assets* | | | 1.27 | %† | | | 1.43 | % | | | 1.35 | % | | | 1.31 | %† | |
| Ratio of Net Investment Income (loss) to Average Net Assets | | | (0.09 | )%† | | | 0.88 | % | | | 1.41 | % | | | 1.01 | %† | |
| Portfolio Turnover Rate | | | 31 | % | | | 41 | % | | | 62 | % | | | 33 | %² | |
² Data has not been annualized.
† Data has been annualized.
* The ratio excludes expense offset arrangement.
(a) The date on which Fund shares were first offered for sale to the public was October 2, 2006.
(b) Computed using average shares outstanding throughout the period.
(c) Amount rounds to less than $0.01 per share.
THE OAKMARK FUNDS
88
OAKMARK INTERNATIONAL FUND
Financial Highlights–Class I
For a share outstanding throughout each period
| | | Six Months Ended
March 31, 2010
(Unaudited) | | Year Ended
September 30,
2009 | | Year Ended
September 30,
2008 | | Year Ended
September 30,
2007 | | Year Ended
September 30,
2006 | | Year Ended
September 30,
2005 | |
| Net Asset Value, Beginning of Period | | $ | 16.25 | | | $ | 15.71 | | | $ | 26.59 | | | $ | 26.83 | | | $ | 23.52 | | | $ | 18.98 | | |
| Income From Investment Operations: | |
| Net Investment Income | | | 0.02 | | | | 0.16 | (a) | | | 0.65 | | | | 0.43 | | | | 0.41 | | | | 0.27 | | |
Net Gain (Loss) on Investments (both realized
and unrealized) | | | 1.65 | | | | 1.87 | | | | (7.11 | ) | | | 3.25 | | | | 4.49 | | | | 4.59 | | |
| Total From Investment Operations | | | 1.67 | | | | 2.03 | | | | (6.46 | ) | | | 3.68 | | | | 4.90 | | | | 4.86 | | |
| Less Distributions: | |
| From Net Investment Income | | | (0.12 | ) | | | (1.39 | ) | | | (0.17 | ) | | | (0.44 | ) | | | (0.59 | ) | | | (0.27 | ) | |
| From Capital Gains | | | 0.00 | | | | (0.10 | ) | | | (4.25 | ) | | | (3.48 | ) | | | (1.00 | ) | | | (0.05 | ) | |
| Total Distributions | | | (0.12 | ) | | | (1.49 | ) | | | (4.42 | ) | | | (3.92 | ) | | | (1.59 | ) | | | (0.32 | ) | |
| Redemption Fees | | | 0.00 | (b) | | | 0.00 | (b) | | | 0.00 | (b) | | | 0.00 | (b) | | | 0.00 | (b) | | | 0.00 | (b) | |
| Net Asset Value, End of Period | | $ | 17.80 | | | $ | 16.25 | | | $ | 15.71 | | | $ | 26.59 | | | $ | 26.83 | | | $ | 23.52 | | |
| Total Return | | | 10.31 | % | | | 17.71 | % | | | -28.59 | % | | | 14.53 | % | | | 22.14 | % | | | 25.85 | % | |
| Ratios/Supplemental Data: | |
| Net Assets, End of Period ($million) | | $ | 4,990.8 | | | $ | 4,045.4 | | | $ | 3,753.6 | | | $ | 8,446.6 | | | $ | 7,200.5 | | | $ | 5,627.4 | | |
| Ratio of Expenses to Average Net Assets* | | | 1.08 | %† | | | 1.17 | % | | | 1.10 | % | | | 1.05 | % | | | 1.08 | % | | | 1.11 | % | |
| Ratio of Net Investment Income to Average Net Assets | | | 0.27 | %† | | | 1.32 | % | | | 2.32 | % | | | 1.65 | % | | | 1.80 | % | | | 1.32 | % | |
| Portfolio Turnover Rate | | | 26 | % | | | 53 | % | | | 41 | % | | | 50 | % | | | 37 | % | | | 14 | % | |
Financial Highlights–Class II
For a share outstanding throughout each period
| | | Six Months Ended
March 31, 2010
(Unaudited) | | Year Ended
September 30,
2009 | | Year Ended
September 30,
2008 | | Year Ended
September 30,
2007 | | Year Ended
September 30,
2006 | | Year Ended
September 30,
2005 | |
| Net Asset Value, Beginning of Period | | $ | 16.38 | | | $ | 15.55 | | | $ | 26.32 | | | $ | 26.61 | | | $ | 23.36 | | | $ | 18.86 | | |
| Income From Investment Operations: | |
| Net Investment Income (Loss) | | | (0.01 | )(a) | | | 0.14 | (a) | | | 0.39 | (a) | | | 0.35 | | | | 0.34 | | | | 0.22 | | |
Net Gain (Loss) on Investments (both realized
and unrealized) | | | 1.66 | | | | 1.96 | | | | (6.86 | ) | | | 3.19 | | | | 4.45 | | | | 4.55 | | |
| Total From Investment Operations | | | 1.65 | | | | 2.10 | | | | (6.47 | ) | | | 3.54 | | | | 4.79 | | | | 4.77 | | |
| Less Distributions: | |
| From Net Investment Income | | | (0.13 | ) | | | (1.17 | ) | | | (0.05 | ) | | | (0.35 | ) | | | (0.54 | ) | | | (0.22 | ) | |
| From Capital Gains | | | 0.00 | | | | (0.10 | ) | | | (4.25 | ) | | | (3.48 | ) | | | (1.00 | ) | | | (0.05 | ) | |
| Total Distributions | | | (0.13 | ) | | | (1.27 | ) | | | (4.30 | ) | | | (3.83 | ) | | | (1.54 | ) | | | (0.27 | ) | |
| Redemption Fees | | | 0.00 | (b) | | | 0.00 | (b) | | | 0.00 | (b) | | | 0.00 | (b) | | | 0.00 | (b) | | | 0.00 | | |
| Net Asset Value, End of Period | | $ | 17.90 | | | $ | 16.38 | | | $ | 15.55 | | | $ | 26.32 | | | $ | 26.61 | | | $ | 23.36 | | |
| Total Return | | | 10.10 | % | | | 17.70 | % | | | -28.91 | % | | | 14.04 | % | | | 21.71 | % | | | 25.50 | % | |
| Ratios/Supplemental Data: | |
| Net assets, end of period ($million) | | $ | 125.0 | | | $ | 107.8 | | | $ | 130.8 | | | $ | 586.9 | | | $ | 496.0 | | | $ | 362.9 | | |
| Ratio of Expenses to Average Net Assets* | | | 1.43 | %† | | | 1.32 | % | | | 1.52 | % | | | 1.44 | % | | | 1.47 | % | | | 1.38 | % | |
Ratio of Net Investment Income (loss) to
Average Net Assets | | | (0.09 | )%† | | | 1.15 | % | | | 1.96 | % | | | 1.31 | % | | | 1.43 | % | | | 1.08 | % | |
| Portfolio Turnover Rate | | | 26 | % | | | 53 | % | | | 41 | % | | | 50 | % | | | 37 | % | | | 14 | % | |
* The ratio excludes expense offset arrangement.
† Data has been annualized.
(a) Computed using average shares outstanding throughout the period.
(b) Amount rounds to less than $0.01 per share.
See accompanying Notes to Financial Statements.
THE OAKMARK FUNDS
89
OAKMARK INTERNATIONAL SMALL CAP FUND
Financial Highlights–Class I
For a share outstanding throughout each period
| | | Six Months Ended
March 31, 2010
(Unaudited) | | Year Ended
September 30,
2009 | | Year Ended
September 30,
2008 | | Year Ended
September 30,
2007 | | Year Ended
September 30,
2006 | | Year Ended
September 30,
2005 | |
| Net Asset Value, Beginning of Period | | $ | 11.51 | | | $ | 11.36 | | | $ | 23.19 | | | $ | 24.09 | | | $ | 22.79 | | | $ | 18.26 | | |
| Income From Investment Operations: | |
| Net Investment Income | | | 0.03 | (a) | | | 0.15 | (a) | | | 0.37 | | | | 0.32 | | | | 0.42 | | | | 0.20 | | |
Net Gain (Loss) on Investments (both realized
and unrealized) | | | 1.15 | | | | 1.06 | | | | (6.36 | ) | | | 2.77 | | | | 5.12 | | | | 4.98 | | |
| Total From Investment Operations | | | 1.18 | | | | 1.21 | | | | (5.99 | ) | | | 3.09 | | | | 5.54 | | | | 5.18 | | |
| Less Distributions: | |
| From Net Investment Income | | | (0.16 | ) | | | (0.93 | ) | | | (0.18 | ) | | | (0.56 | ) | | | (0.70 | ) | | | (0.27 | ) | |
| From Capital Gains | | | 0.00 | | | | (0.13 | ) | | | (5.66 | ) | | | (3.43 | ) | | | (3.54 | ) | | | (0.38 | ) | |
| Total Distributions | | | (0.16 | ) | | | (1.06 | ) | | | (5.84 | ) | | | (3.99 | ) | | | (4.24 | ) | | | (0.65 | ) | |
| Redemption Fees | | | 0.00 | (b) | | | 0.00 | (b) | | | 0.00 | (b) | | | 0.00 | (b) | | | 0.00 | (b) | | | 0.00 | (b) | |
| Net Asset Value, End of Period | | $ | 12.53 | | | $ | 11.51 | | | $ | 11.36 | | | $ | 23.19 | | | $ | 24.09 | | | $ | 22.79 | | |
| Total Return | | | 10.39 | % | | | 16.28 | % | | | -32.47 | % | | | 13.35 | % | | | 28.50 | % | | | 29.04 | % | |
| Ratios/Supplemental Data: | |
| Net Assets, End of Period ($million) | | $ | 988.8 | | | $ | 768.0 | | | $ | 663.6 | | | $ | 1,326.5 | | | $ | 1,274.5 | | | $ | 1,007.2 | | |
| Ratio of Expenses to Average Net Assets* | | | 1.37 | %† | | | 1.54 | % | | | 1.41 | % | | | 1.34 | % | | | 1.37 | % | | | 1.41 | % | |
| Ratio of Net Investment Income to Average Net Assets | | | 0.47 | %† | | | 1.77 | % | | | 2.17 | % | | | 1.19 | % | | | 1.73 | % | | | 0.96 | % | |
| Portfolio Turnover Rate | | | 29 | % | | | 46 | % | | | 50 | % | | | 57 | % | | | 44 | % | | | 47 | % | |
Financial Highlights–Class II
For a share outstanding throughout each period
| | | Six Months Ended
March 31, 2010
(Unaudited) | | Year Ended
September 30,
2009 | | Year Ended
September 30,
2008 | | Year Ended
September 30,
2007 | | Year Ended
September 30,
2006 | | Year Ended
September 30,
2005 | |
| Net Asset Value, Beginning of Period | | $ | 11.50 | | | $ | 11.33 | | | $ | 23.15 | | | $ | 24.05 | | | $ | 22.77 | | | $ | 18.25 | | |
| Income From Investment Operations: | |
| Net Investment Income | | | 0.01 | (a) | | | 0.14 | (a) | | | 0.47 | | | | 0.29 | | | | 0.41 | | | | 0.18 | | |
Net Gain (Loss) on Investments (both realized
and unrealized) | | | 1.15 | | | | 1.06 | | | | (6.48 | ) | | | 2.79 | | | | 5.10 | | | | 4.98 | | |
| Total From Investment Operations | | | 1.16 | | | | 1.20 | | | | (6.01 | ) | | | 3.08 | | | | 5.51 | | | | 5.16 | | |
| Less Distributions: | |
| From Net Investment Income | | | (0.16 | ) | | | (0.90 | ) | | | (0.15 | ) | | | (0.55 | ) | | | (0.69 | ) | | | (0.26 | ) | |
| From Capital Gains | | | 0.00 | | | | (0.13 | ) | | | (5.66 | ) | | | (3.43 | ) | | | (3.54 | ) | | | (0.38 | ) | |
| Total Distributions | | | (0.16 | ) | | | (1.03 | ) | | | (5.81 | ) | | | (3.98 | ) | | | (4.23 | ) | | | (0.64 | ) | |
| Redemption Fees | | | 0.00 | (b) | | | 0.00 | (b) | | | 0.00 | (b) | | | 0.00 | (b) | | | 0.00 | (b) | | | 0.00 | (b) | |
| Net Asset Value, End of Period | | $ | 12.50 | | | $ | 11.50 | | | $ | 11.33 | | | $ | 23.15 | | | $ | 24.05 | | | $ | 22.77 | | |
| Total Return | | | 10.16 | % | | | 16.08 | % | | | -32.63 | % | | | 13.29 | % | | | 28.33 | % | | | 28.94 | % | |
| Ratios/Supplemental Data: | |
| Net assets, end of period ($million) | | $ | 1.1 | | | $ | 0.8 | | | $ | 0.3 | | | $ | 0.9 | | | $ | 0.8 | | | $ | 0.6 | | |
| Ratio of Expenses to Average Net Assets* | | | 1.68 | %† | | | 1.71 | % | | | 1.54 | % | | | 1.43 | % | | | 1.47 | % | | | 1.49 | % | |
| Ratio of Net Investment Income to Average Net Assets | | | 0.17 | %† | | | 1.66 | % | | | 2.12 | % | | | 1.12 | % | | | 1.62 | % | | | 0.87 | % | |
| Portfolio Turnover Rate | | | 29 | % | | | 46 | % | | | 50 | % | | | 57 | % | | | 44 | % | | | 47 | % | |
* The ratio excludes expense offset arrangement.
† Data has been annualized.
(a) Computed using average shares outstanding throughout the period.
(b) Amount rounds to less than $0.01 per share.
THE OAKMARK FUNDS
90
DISCLOSURE REGARDING THE BOARD OF TRUSTEES'
OCTOBER 2009 APPROVAL OF INVESTMENT ADVISORY CONTRACTS
Each year, the Board of Trustees of the Oakmark Funds (the "Board"), including a majority of the independent Trustees, is required by the Investment Company Act of 1940 (the "1940 Act") to determine whether to continue each Fund's investment advisory agreement (each an "Agreement") with the Fund's investment adviser (the "Adviser"). The Board requests and receives from the Adviser a broad range of materials and information that are relevant to the Trustees' consideration of the Agreements, both throughout the year and especially in connection with its annual review of the Agreements. In addition, the Board retains an independent data provider to provide performance and expense information for each Fund and for comparable funds.
The Board's committee on contracts (the "Committee") leads the Board in its evaluation of the Agreements. The Committee is comprised entirely of trustees who are not "interested persons" of the Funds as defined in the 1940 Act ("Independent Trustees"), and more than 75% of the Board is comprised of Independent Trustees. During the last year, the Committee and the Board met numerous times to consider the Agreements. At each of those meetings, the Committee and the Board were advised by, and met in executive session with, their experienced independent legal counsel.
In connection with their consideration of each Agreement, the Committee and the Board considered, among other things: (i) the nature, quality and extent of the Adviser's services, (ii) the investment performance of the Fund, as well as performance information for comparable funds, (iii) the fees and other expenses paid by the Fund, as well as fee and expense information for comparable funds and separate accounts managed by the Adviser, (iv) the profitability of the Adviser and its affiliates from their relationship with the Fund, (v) whether economies of scale may be realized as the Fund grows and whether fee levels share with Fund investors economies of scale and (vi) other benefits to the Adviser from its relationship with the Fund.
At a meeting held on October 21, 2009, the Board, including all of the Independent Trustees, upon recommendation of the Committee, determined that the continuation of the Agreement for each Fund was in the best interest of the Fund and its shareholders, and approved the continuation of the Agreements through October 31, 2010. Below is a summary of the principal information considered by the Board as well as the Board's conclusions regarding various factors. In their deliberations, the Independent Trustees did not identify any single factor that was paramount or determinative, and each Independent Trustee may have weighed the information differently.
1. Nature, Extent and Quality of Services
The Board's consideration of the nature, extent and quality of the Adviser's services to the Funds took into account the knowledge gained from the Board's meetings with the Adviser throughout the year. In addition, the Board considered: the Adviser's long-term history of care and conscientiousness in the management of the Funds; the consistency of its investment approach; the background and experience of the Adviser's investment personnel responsible for managing the Funds; the Adviser's performance as administrator of the Funds; and favorable recognition of the Adviser and the Funds in the media and in industry publications. The Board also reviewed the Adviser's resources and key personnel involved in providing investment management services to the Funds, including the time that investment personnel devote to each Fund and the investment results produced as a result of the Adviser's in-house research. The Board also noted the significant pe rsonal investments that the Adviser's personnel have made in the Funds, which serve to further align the interests of the Adviser and its personnel with those of the Funds' shareholders. The Board concluded that the nature, extent and quality of the services provided by the Adviser to each Fund were appropriate and consistent with the Fund's Agreement and that each Fund was likely to continue to benefit from services provided under its Agreement with the Adviser.
2. Investment Performance of the Funds
The Board considered each Fund's investment performance over various time periods, including how the Fund performed compared to the performance of a group of comparable funds (the Fund's "Performance
THE OAKMARK FUNDS
91
Universe") selected by Lipper, Inc. ("Lipper"). Among the performance periods considered by the Board were those ended on April 30, 2009. Where available, the Board considered one-, three-, five- and ten-year performance.
Further detail considered by the Board regarding the investment performance of each Fund is set forth below:
Oakmark Fund. The Board considered that the Fund outperformed the annualized returns of its Performance Universe median during all periods presented.
Oakmark Select Fund. The Board considered that the Fund outperformed its Performance Universe median during the one- and ten-year periods, although it underperformed its Performance Universe median during the three- and five-year periods. The Board also noted that, while its focus continues to be on longer-term performance, the Fund placed in the first (highest) quintile of its Performance Universe for the one-year period and significantly outperformed its benchmark, the S&P 500 Index, from January 1 through September 30, 2009.
Oakmark Equity and Income Fund. The Board considered that the Fund outperformed the annualized returns of its Performance Universe median during all periods presented.
Oakmark Global Fund. The Board considered that the Fund outperformed the annualized returns of its Performance Universe median during all periods presented.
Oakmark Global Select Fund. Noting that the Fund commenced operations in October 2006, the Board considered that the Fund outperformed the annualized returns of its Performance Universe median during all periods presented.
Oakmark International Fund. The Board considered that the Fund outperformed the annualized returns of its Performance Universe median during all periods presented.
Oakmark International Small Cap Fund. The Board considered that the Fund outperformed the annualized returns of its Performance Universe median during the one- and ten-year periods, although it underperformed its Performance Universe median during the three- and five-year periods. The Board also noted that, while its focus continues to be on longer-term performance, the Fund placed in the first (highest) quintile of its Performance Universe for the one-year period and placed in the first or second quintile of its Performance Universe for the one-year period ended April 30 during six of the last ten years. The Board also considered that the Fund significantly outperformed its benchmark, the MSCI World ex U.S. Small Cap Index, from January 1 through September 30, 2009.
In addition to comparing each Fund's performance to that of its Performance Universe, the Board also considered the Fund's performance compared to that of its benchmark and other comparative data provided by Lipper, including each Fund's total return and performance relative to risk. After considering all of the information, the Board concluded that the Adviser was delivering performance for each Fund that was consistent with the long-term investment strategies being pursued by the Fund and that the Fund and its shareholders were benefiting from the Adviser's investment management of the Fund
3. Costs of Services Provided and Profits Realized by the Adviser
Using information provided by Lipper, the Board evaluated each Fund's advisory fee compared to the advisory fee for other mutual funds comparable in size, character and investment strategy (the "Expense Group"), and each Fund's expense ratio compared to that of the Expense Group.
The Board also reviewed the Adviser's advisory fees for its institutional separate account clients and for its subadvised funds (for which the Adviser provides portfolio management services only). The Board noted the Adviser's explanation that, although in most instances, the fees paid by those other clients were lower than the fees paid by the Funds, the differences reflected the Adviser's significantly greater level of responsibilities and broader scope of services regarding the Funds, and the more extensive regulatory obligations and risks associated with managing the Funds.
The Board also considered the Adviser's costs in serving as the Fund's investment adviser and manager, including costs associated with technology, infrastructure and compliance necessary to manage the Funds.
THE OAKMARK FUNDS
92
The Board reviewed the Adviser's methodology for allocating costs among the Adviser's lines of business and among the Funds. The Board also considered information regarding the structure of the Adviser's compensation program for portfolio managers, analysts and certain other employees and the relationship of such compensation to the attraction and retention of quality personnel. Finally, the Board considered the Adviser's profitability analysis, as well as an Investment Management Industry Profitability Analysis prepared by Lipper. The Board examined the pre-tax profits realized by the Adviser and its affiliates from their relationship with each Fund, as presented in the Adviser's profitability analysis, as well as the financial condition of the Adviser.
Further detail considered by the Board regarding the management fee rate and expense ratio of each Fund is set forth below:
Oakmark Fund, Oakmark Select Fund, Oakmark Equity and Income Fund, and Oakmark Global Select Fund. The Board considered that each Fund's management fee rate and total expense ratio are higher than the respective medians of the Fund's Expense Group. The Board, in its consideration of those expenses, also took into account its review of each Fund's performance.
Oakmark International Fund, Oakmark Global Fund, and Oakmark International Small Cap Fund. The Board considered that each Fund's management fee rate is higher than the median of the Fund's Expense Group. The Board also noted, however, that each Fund's total expense ratio, which reflects the total fees paid by an investor, is lower than the median of the Fund's Expense Group.
After its review of all the matters addressed, including those outlined above, the Board concluded that the management fees paid by each Fund to the Adviser were reasonable in light of the services provided and that the profitability of the Adviser's relationship with the Funds appeared to be reasonable in relation to the services performed.
4. Economies of Scale and Fee Levels Reflecting Those Economies
The Board considered whether each Fund's management fee structure provides for a sharing with shareholders of potential economies of scale that may be realized by the Adviser. The Board reviewed each Agreement, which includes breakpoints that decrease the management fee rate as the Fund's assets increase. The Board concluded that the breakpoints in the fee schedule for each Fund allow shareholders to benefit from potential economies of scale that may be achieved by the Adviser.
5. Other Benefits Derived from the Relationship with the Funds
The Board also considered other benefits that accrue to the Adviser and its affiliates from their relationship with the Funds. The Board noted that an affiliate of the Adviser serves as the Funds' distributor, without compensation, pursuant to a written agreement the Board evaluates and approves annually.
The Board also considered the Adviser's use of a portion of the commissions paid by the Funds on their portfolio brokerage transactions to obtain research products and services benefiting the Funds and/or other clients of the Adviser and considered the Adviser's assertion that its use of "soft" commission dollars to obtain research products and services was consistent with regulatory requirements.
After full consideration of the above factors, as well as other factors that were instructive in evaluating the Agreements, the Board, including all of the Independent Trustees, concluded that approval of the continuation of each Agreement was in the best interests of the Fund and its shareholders. On October 21, 2009, the Board continued each Agreement.
THE OAKMARK FUNDS
93
Reporting to Shareholders. The Funds reduce the number of duplicate prospectuses, annual and semi-annual reports your household receives by sending only one copy of each to those addresses shared by two or more accounts. Call the Funds at 1-800-OAKMARK to request individual copies of these documents. The Funds will begin sending individual copies thirty days after receiving your request.
For a prospectus and more information about The Oakmark Funds, including management fees and expenses and the special risks of investing, please visit oakmark.com or call 1-800-OAKMARK (1-800-625-6275). Please read the prospectus carefully before investing. An investor should consider a fund's investment objectives, risks, and charges and expenses carefully before investing. This and other information about The Oakmark Funds are contained in the Funds' prospectus.
The discussion of the Funds' investments and investment strategy (including current investment themes, the portfolio managers' research and investment process, and portfolio characteristics) represents the Funds' investments and the views of the portfolio managers and Harris Associates L.P., the Funds' investment adviser, at the time of this report, and are subject to change without notice.
The performance data quoted represents past performance. The performance information for the Funds does not reflect the imposition of a 2% redemption fee on shares of all Funds, other than Oakmark Equity & Income Fund, redeemed within 90 days. If reflected, the fee would reduce the performance quoted. Past performance is no guarantee of future results. The investment return and principal value will fluctuate so that an investor's shares, when redeemed, may be worth more or less than their original cost. Current performance may be lower or higher than the performance data quoted. Average annual total return measures annualized change, while total return measures aggregate change. To obtain current month end performance data, visit oakmark.com.
Current and future portfolio holdings are subject to risk.
Investing in value stocks presents the risk that value stocks may fall out of favor with investors and underperform growth stocks during given periods.
Because Oakmark Select Fund and Oakmark Global Select Fund are non-diversified, the performance of each holding will have a greater impact on each Fund's total return, and may make the Funds' returns more volatile than a more diversified fund.
Oakmark Equity and Income Fund may invest in medium- and lower-quality debt securities that have higher yield potential but present greater investment and credit risk than higher-quality securities, which may result in greater volatility in the Fund's net asset value. An economic downturn could severely disrupt the market in medium or lower grade debt securities and adversely affect the value of outstanding bonds and the ability of the issuers to pay interest or repay principal.
Investing in foreign securities represents risks which in some ways may be greater than in U.S. investments. Those risks include: currency fluctuation; different regulation, accounting standards, trading practices and levels of available information; generally higher transaction costs; and political risks.
The stocks of smaller companies often involve more risk than the stocks of larger companies. Stocks of small companies tend to be more volatile and have a smaller public market than stocks of larger companies. Small companies may have a shorter history of operations than larger companies, may not have as great an ability to raise additional capital and may have a less diversified product line, making them more susceptible to market pressure.
1. Total return includes change in share prices and in each case includes reinvestment of any dividends and capital gain distributions.
2. Portfolio holdings are subject to change without notice and are not intended as recommendations of individual stocks.
3. EPS refers to Earnings Per Share and is calculated by dividing total earnings by the number of shares outstanding.
4. The S&P 500 Index is a broad market-weighted average of U.S. blue-chip companies. This index is unmanaged and investors cannot actually make investments in this index.
5. The Dow Jones Industrial Average is an unmanaged index that includes only 30 big companies. This index is unmanaged and investors cannot invest directly in this index.
THE OAKMARK FUNDS
94
6. The Lipper Large Cap Value Fund Index is an equally weighted index of the largest 30 funds within the large cap value funds investment objective as defined by Lipper Inc. The index is adjusted for the reinvestment of capital gains and income dividends. This index is unmanaged and investors cannot invest directly in this index.
7. The Lipper Multi-Cap Value Funds Index tracks the results of the 30 largest mutual funds in the Lipper Multi-Cap Value Funds category. This index is unmanaged and investors cannot invest directly in this index.
8. The Lipper Balanced Fund Index measures the performance of the 30 largest U.S. balanced funds tracked by Lipper. This index is unmanaged and investors cannot invest directly in this index.
9. The Barclays Capital U.S. Government/Credit Index measures performance of U.S. dollar denominated U.S. Treasuries, government-related, and investment grade U.S. corporate securities that have a remaining maturity of greater than or equal to 1 year. In addition, the securities have $250 million or more of outstanding face value, and must be fixed rate and non-convertible.
10. Lauricella, Tom. "When a Little Greece Goes a Long Way." http://online.wsj.com/article/ SB10001424052748704197104575051170792661344.html. February 8, 2010.
11. Gordon, Michael. "Risk-free status of government bonds comes under scrutiny" http://www.ft.com/home/us. January 7. 2010.
12. The MSCI World Index is a free float-adjusted market capitalization weighted index that is designed to measure the equity market performance of developed markets. The MSCI World Index currently consists of the following 23 developed market country indices: Australia, Austria, Belgium, Canada, Denmark, Finland, France, Germany, Greece, Hong Kong, Ireland, Italy, Japan, Netherlands, New Zealand, Norway, Portugal, Singapore, Spain, Sweden, Switzerland, the United Kingdom, and the United States. This index is unmanaged and investors cannot invest directly in this index.
13. The Lipper Global Fund Index is an unmanaged index of the 30 largest funds, based on total year-end net asset value, in the Global fund category, which consists of funds that invest at least 25% in securities traded outside of the United States. It assumes the reinvestment of dividends and capital gains and does not include any management fees or expenses. This index is unmanaged and investors cannot actually make investments in this index.
14. The MSCI World Index ex U.S. is a free float-adjusted market capitalization weighted index that is designed to measure the equity market performance of developed markets. The MSCI World Index currently consists of the following 22 developed market country indices: Australia, Austria, Belgium, Canada, Denmark, Finland, France, Germany, Greece, Hong Kong, Ireland, Italy, Japan, Netherlands, New Zealand, Norway, Portugal, Singapore, Spain, Sweden, Switzerland, and the United Kingdom. This index is unmanaged and investors cannot invest directly in this index.
15. The MSCI EAFE Index (Europe, Australasia, Far East) is a free float-adjusted market capitalization index that is designed to measure developed market equity performance, excluding the US & Canada. As of June 2006 the MSCI EAFE Index consisted of the following 21 developed market country indices: Australia, Austria, Belgium, Denmark, Finland, France, Germany, Greece, Hong Kong, Ireland, Italy, Japan, the Netherlands, New Zealand, Norway, Portugal, Singapore, Spain, Sweden, Switzerland and the United Kingdom. This index is unmanaged and investors cannot invest directly in this index.
16. The Lipper International Fund Index reflects the net asset value weighted total return of the 30 largest international equity funds. This index is unmanaged and investors cannot invest directly in this index.
17. The MSCI World ex U.S. Small Cap Index is a free float-adjusted market capitalization index that is designed to measure global developed market equity performance, excluding the U.S. The MSCI World ex U.S. Small Cap Index currently consists of 22 developed market country indices. The MSCI Small Cap Indices target 40% of the eligible Small Cap universe within each industry group, within each country. MSCI defines the Small Cap universe as all listed securities that have a market capitalization in the range of USD200-1,500 million. This index is unmanaged and investors cannot actually make investments in this index.
18. The Lipper International Small Cap Funds Index measures the performance of the 10 largest international small-cap funds tracked by Lipper. This index is unmanaged and investors cannot invest directly in this index.
OAKMARK, OAKMARK FUNDS, OAKMARK INTERNATIONAL, and OAKMARK and tree design are trademarks owned or registered by Harris Associates L.P. in the U.S. and/or other countries.
THE OAKMARK FUNDS
95
Oakmark Glossary
Book value – A company's common stock equity as it appears on a balance sheet, equal to total assets minus liabilities, preferred stock, and intangible assets such as goodwill. A company's book value often differs substantially from economic value, especially in industries such as media.
Business value/Intrinsic value – The perceived or estimated actual value of a security, as opposed to its current market price or book value. Business value can be evaluated based on what a knowledgeable buyer would pay for a business if the company were sold in its entirety.
Growth investing – Investors who look for companies based on whether the stock of a company is growing earnings and/or revenue faster than the industry as a whole or the overall market. Growth investors generally expect high rates of growth to persist, and the stock, in turn, to deliver returns exceeding the market's. A growth mutual fund is generally one that emphasizes stocks believed to offer above-average growth prospects, with less emphasis on the stock's current price than a value mutual fund would have.
M & A (Mergers & Acquisitions) – Merger: the combining of two or more entities into one, through a purchase acquisition or a pooling of interests. Acquisition: can also be called a takeover, and is defined as acquiring control of a corporation, called a target, by stock purchase or exchange, either hostile or friendly.
Market capitalization (market cap or cap) – The market price of an entire company on any given day, calculated by multiplying the number of shares outstanding by the price per share.
Momentum investing – Approach to investing based on the belief that stock price trends are likely to continue. Momentum investors tend to buy stocks that have been outperforming the market and to sell those stocks when their relative performance deteriorates. Momentum investors typically do not consider a company's underlying value or fundamentals in their investment decisions.
Multiple – A ratio used to measure a stock's valuation, usually greater than 1. Sometimes used to mean price/earnings ratio.
P/B or Price-to-Book Ratio – A stock's capitalization divided by its book value. The value is the same whether the calculation is done for the whole company or on a per-share basis.
P/E or Price-to-Earnings Ratio – The most common measure of a stock's valuation. It is equal to a stock's capitalization divided by its after-tax earnings over a 12-month period. The value is the same whether the calculation is done for the whole company or on a per-share basis. Equivalently, the cost an investor in a given stock must pay per dollar of current annual earnings. Also called earnings multiple.
Share repurchase – Program through which a corporation buys back its own shares in the open market, typically an indication that the corporation's management believes the stock price is undervalued.
Value investing – Investors who utilize valuation measures such as business value (including growth rate), price/earnings ratio, price/book ratio, and yield to gauge the attractiveness of a company. Managers who employ a value investment style believe that the true, underlying value of a company is not reflected in its current share price, and, over time, the price has potential to increase as the market recognizes the overall value of the business. Value stocks sell at relatively low prices in relation to their underlying business value, earnings, or book value.
Stocks become undervalued for a variety of reasons, including an overall market decline, or when a specific industry falls into disfavor and investors view all companies in that industry in the same light. Consequently, an individual company's stock price may fall, even though it may be only temporarily affected by the industry's problems and its underlying value has remained unchanged.
"x times earnings" (e.g. "12 times earnings") – Another way to express a stock's price-to-earnings (P/E) ratio. A stock with a P/E ratio of 12 sells at 12 times earnings.
THE OAKMARK FUNDS
96

(This page has been intentionally left blank.)
THE OAKMARK FUNDS
97

(This page has been intentionally left blank.)
THE OAKMARK FUNDS
98
THE OAKMARK FUNDS
Trustees and Officers
Trustees
Gary N. Wilner, M.D.—Chairman
Michael J. Friduss
Thomas H. Hayden
Christine M. Maki
John R. Raitt
Allan J. Reich
Steven S. Rogers
Burton W. Ruder
Peter S. Voss
Officers
John R. Raitt—President and Chief Executive Officer
Robert M. Levy—Executive Vice President
Henry R. Berghoef—Vice President
John N. Desmond—Vice President
Richard J. Gorman—Vice President, Chief Compliance
Off icer and Assistant Secretary
Kevin G. Grant—Vice President
David G. Herro—Vice President
John J. Kane—Treasurer
Clyde S. McGregor—Vice President
Michael J. Neary—Vice President
William C. Nygren—Vice President
Vineeta D. Raketich—Vice President
Janet L. Reali—Vice President and Secretary
Kristi L. Rowsell—Vice President and Principal Financial
Officer
Edward A. Studzinski—Vice President
Robert A. Taylor—Vice President
Andrew J. Tedeschi—Assistant Treasurer
Christopher P. Wright—Vice President
Other Information
Investment Adviser
Harris Associates L.P.
Two North LaSalle Street
Chicago, Illinois 60602-3790
Transfer Agent
Boston Financial Data Services, Inc.
Quincy, Massachusetts
Legal Counsel
K&L Gates LLP
Chicago, Illinois
Independent Registered Public
Accounting Firm
Deloitte & Touche LLP
Chicago, Illinois
For More Information
Please call 1-800-OAKMARK
(1-800-625-6275)
or 617-483-8327
Website
oakmark.com
To obtain a prospectus, an application or periodic reports, access our web site at oakmark.com, or call 1-800-OAKMARK (1-800-625-6275) or (617) 483-8327.
The Funds will file its complete schedule of portfolio holdings with the Securities and Exchange Commission (the "SEC") for the first and third quarters of each fiscal year on Form N-Q. The Funds' Forms N-Q are available on the SEC's website at www.sec.gov. The Funds' Forms N-Q may be reviewed and copied at the SEC's Public Reference Room in Washington, DC, and information on the operation of the Public Reference Room may be obtained by calling 1-800-SEC-0330.
A description of the policies and procedures the Funds use to determine how to vote proxies relating to portfolio securities is available without charge, upon request, by calling toll-free 1-800-625-6275; on the Funds' website at oakmark.com; and on the SEC's website at www.sec.gov.
No later than August 31 of each year, information regarding how the Adviser, on behalf of the Funds, voted proxies relating to the Funds' portfolio securities for the twelve months ended the preceding June 30 will be available through a link on the Funds' website at oakmark.com and on the SEC's website at www.sec.gov.
This report is submitted for the general information of the Funds' shareholders. The report is not authorized for distribution to prospective investors in the Funds unless it is accompanied or preceded by the Funds' currently effective prospectus.
No sales charge to the shareholder or to the new investor is made in offering the shares of the Funds, however, a shareholder may incur a 2% redemption fee on an exchange or redemption of shares redeemed within 90 days from any Fund other than Oakmark Equity & Income Fund.

1-800-OAKMARK
oakmark.com
The Oakmark Funds are distributed by Harris Associates Securities L.P., member FINRA. Date of first use: May 2010.
OAKMARK FUND CLASS II
THE VALUE OF A $10,000 INVESTMENT IN OAKMARK FUND FROM ITS
INCEPTION (4/5/01) TO PRESENT (3/31/10) AS COMPARED TO THE
STANDARD & POOR'S 500 INDEX (UNAUDITED)

Average Annual Total Returns
(as of 3/31/10)
| (Unaudited) | | 1-year | | 5-year | | Since
Inception
(4/5/01) | |
| Oakmark Fund (Class II) | | | 69.71 | % | | | 3.26 | % | | | 4.65 | % | |
| S&P 500 Index | | | 49.77 | % | | | 1.92 | % | | | 2.09 | % | |
The graph and table do not reflect the deduction of taxes that a shareholder would pay on fund distributions or the redemption of fund shares.
The expense ratio for Class II shares as of 9/30/09 was 1.44%.
The performance data quoted represents past performance. The above performance information does not reflect the imposition of a 2% redemption fee on shares held for 90 days or less. If reflected, the fee would reduce the performance quoted. Past performance does not guarantee future results. The investment return and principal value will fluctuate so that an investor's shares, when redeemed, may be worth more or less than their original cost. Current performance may be lower or higher than the performance data quoted. Average annual total return measures annualized change, while total return measures aggregate change. To obtain most recent month-end performance data, visit oakmark.com.
Harris Associates Securities L.P., member FINRA, May 2010
OAKMARK SELECT FUND CLASS II
THE VALUE OF A $10,000 INVESTMENT IN OAKMARK SELECT FUND FROM ITS
INCEPTION (12/31/99) TO PRESENT (3/31/10) AS COMPARED TO THE
STANDARD & POOR'S 500 INDEX (UNAUDITED)
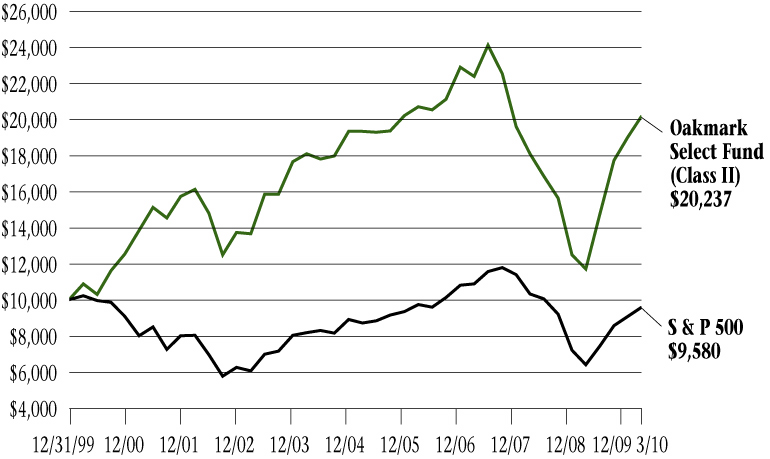
Average Annual Total Returns
(as of 3/31/10)
| (Unaudited) | | 1-year | | 5-year | | Since
Inception
(12/31/99) | |
| Oakmark Select Fund (Class II) | | | 72.60 | % | | | 0.87 | % | | | 7.12 | % | |
| S&P 500 Index | | | 49.77 | % | | | 1.92 | % | | | -0.42 | % | |
The graph and table do not reflect the deduction of taxes that a shareholder would pay on fund distributions or the redemption of fund shares.
The expense ratio for Class II shares as of 9/30/09 was 1.28%.
The performance data quoted represents past performance. The above performance information does not reflect the imposition of a 2% redemption fee on shares held for 90 days or less. If reflected, the fee would reduce the performance quoted. Past performance does not guarantee future results. The investment return and principal value will fluctuate so that an investor's shares, when redeemed, may be worth more or less than their original cost. Current performance may be lower or higher than the performance data quoted. Average annual total return measures annualized change, while total return measures aggregate change. To obtain most recent month-end performance data, visit oakmark.com.
Harris Associates Securities L.P., member FINRA, May 2010
OAKMARK EQUITY AND INCOME FUND CLASS II
THE VALUE OF A $10,000 INVESTMENT IN OAKMARK EQUITY AND INCOME
FUND FROM ITS INCEPTION (7/12/00) TO PRESENT (3/31/10) AS COMPARED TO
THE LIPPER BALANCED FUND INDEX (UNAUDITED)
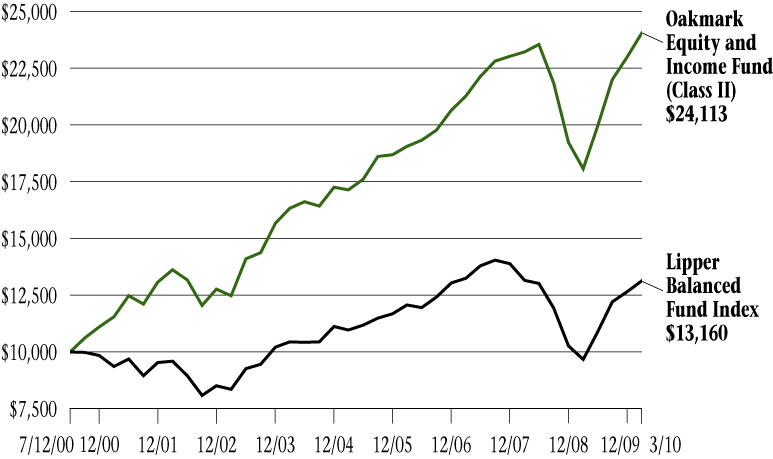
Average Annual Total Returns
(as of 3/31/10)
| (Unaudited) | | 1-year | | 5-year | | Since
Inception
(7/12/00) | |
| Oakmark Equity & Income Fund (Class II) | | | 33.13 | % | | | 7.02 | % | | | 9.48 | % | |
| Lipper Balanced Fund Index | | | 36.03 | % | | | 3.68 | % | | | 2.87 | % | |
The graph and table do not reflect the deduction of taxes that a shareholder would pay on fund distributions or the redemption of fund shares.
The expense ratio for Class II shares as of 9/30/09 was 1.18%.
The performance data quoted represents past performance. Past performance does not guarantee future results. The investment return and principal value will fluctuate so that an investor's shares, when redeemed, may be worth more or less than their original cost. Current performance may be lower or higher than the performance data quoted. Average annual total return measures annualized change, while total return measures aggregate change. To obtain most recent month-end performance data, visit oakmark.com.
Harris Associates Securities L.P., member FINRA, May 2010
OAKMARK GLOBAL FUND CLASS II
THE VALUE OF A $10,000 INVESTMENT IN OAKMARK GLOBAL FUND
FROM ITS INCEPTION (10/10/01) TO PRESENT (3/31/10) AS COMPARED TO THE
MSCI WORLD INDEX (UNAUDITED)

Average Annual Total Returns
(as of 3/31/10)
| (Unaudited) | | 1-year | | 5-year | | Since
Inception
(10/10/01) | |
| Oakmark Global Fund (Class II) | | | 72.75 | % | | | 6.18 | % | | | 12.59 | % | |
| MSCI World Index | | | 52.37 | % | | | 2.89 | % | | | 4.61 | % | |
The graph and table do not reflect the deduction of taxes that a shareholder would pay on fund distributions or the redemption of fund shares.
The expense ratio for Class II shares as of 9/30/09 was 1.54%.
The performance data quoted represents past performance. The above performance information does not reflect the imposition of a 2% redemption fee on shares held for 90 days or less. If reflected, the fee would reduce the performance quoted. Past performance does not guarantee future results. The investment return and principal value will fluctuate so that an investor's shares, when redeemed, may be worth more or less than their original cost. Current performance may be lower or higher than the performance data quoted. Average annual total return measures annualized change, while total return measures aggregate change. To obtain most recent month-end performance data, visit oakmark.com.
Harris Associates Securities L.P., member FINRA, May 2010
OAKMARK INTERNATIONAL FUND CLASS II
THE VALUE OF A $10,000 INVESTMENT IN OAKMARK INTERNATIONAL FUND
FROM ITS INCEPTION (11/4/99) TO PRESENT (3/31/10) AS COMPARED TO THE
MSCI WORLD EX U.S. INDEX (UNAUDITED)

Average Annual Total Returns
(as of 3/31/10)
| (Unaudited) | | 1-year | | 5-year | | Since
Inception
(11/4/99) | |
| Oakmark International Fund (Class II) | | | 81.62 | % | | | 6.83 | % | | | 8.68 | % | |
| MSCI World ex U.S. Index | | | 55.96 | % | | | 4.33 | % | | | 2.79 | % | |
The graph and table do not reflect the deduction of taxes that a shareholder would pay on fund distributions or the redemption of fund shares.
The expense ratio for Class II shares as of 9/30/09 was 1.32%.
The performance data quoted represents past performance. The above performance information does not reflect the imposition of a 2% redemption fee on shares held for 90 days or less. If reflected, the fee would reduce the performance quoted. Past performance does not guarantee future results. The investment return and principal value will fluctuate so that an investor's shares, when redeemed, may be worth more or less than their original cost. Current performance may be lower or higher than the performance data quoted. Average annual total return measures annualized change, while total return measures aggregate change. To obtain most recent month-end performance data, visit oakmark.com.
Harris Associates Securities L.P., member FINRA, May 2010
OAKMARK INTERNATIONAL
SMALL CAP FUND CLASS II
THE VALUE OF A $10,000 INVESTMENT IN OAKMARK INTERNATIONAL SMALL CAP FUND FROM ITS INCEPTION (1/8/01) TO PRESENT (3/31/10) AS COMPARED TO THE MSCI WORLD EX U.S. SMALL CAP AND THE MSCI WORLD EX U.S. INDEXES (UNAUDITED)†
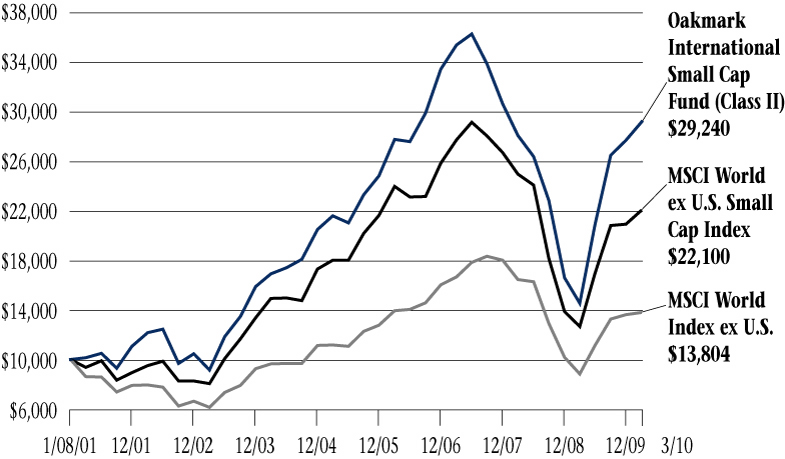
Average Annual Total Returns
(as of 3/31/10)
| (Unaudited) | | 1-year | | 5-year | | Since
Inception
(1/8/01) | |
| Oakmark International Small Cap Fund (Class II) | | | 100.76 | % | | | 6.21 | % | | | 12.33 | % | |
| MSCI World ex U.S. Small Cap Index | | | 74.54 | % | | | 4.13 | % | | | 8.98 | % | |
| MSCI World ex U.S. Index | | | 55.96 | % | | | 4.33 | % | | | 3.56 | % | |
The graph and table do not reflect the deduction of taxes that a shareholder would pay on fund distributions or the redemption of fund shares.
The expense ratio for Class II shares as of 9/30/09 was 1.71%.
The performance data quoted represents past performance. The above performance information does not reflect the imposition of a 2% redemption fee on shares held for 90 days or less. If reflected, the fee would reduce the performance quoted. Past performance does not guarantee future results. The investment return and principal value will fluctuate so that an investor's shares, when redeemed, may be worth more or less than their original cost. Current performance may be lower or higher than the performance data quoted. Average annual total return measures annualized change, while total return measures aggregate change. To obtain most recent month-end performance data, visit oakmark.com.
† Prior to January 1, 2009, the Fund's primary benchmark was the MSCI World ex U.S. Index, an unmanaged index that includes countries throughout the world, excluding the U.S., in proportion to world stock market capitalization. The Fund changed its primary benchmark because the MSCI World ex U.S. Small Cap Index reached its tenth anniversary on December 31, 2008 and now provides an historical perspective to make a more meaningful comparison given the small cap focus of the Fund.
Harris Associates Securities L.P., member FINRA, May 2010
FUND EXPENSES
A shareholder of each Fund incurs two types of costs: (1) transaction costs, such as redemption fees, and (2) ongoing costs, including investment advisory fees, transfer agent fees, and other fund expenses. The examples below are intended to help shareholders understand the ongoing cost (in dollars) of investing in each Fund and to compare these costs with the ongoing costs of investing in other funds.
Actual Expenses
The following table provides information about actual account values and actual fund expenses for Class II of each Fund. The table shows the expenses a Class II shareholder would have paid on a $1,000 investment in each Fund from October 1, 2009, to March 31, 2010, as well as how much a $1,000 investment would be worth at the close of the period, assuming actual fund returns and expenses. Class II shareholders can estimate expenses incurred for the period by dividing their account value at March 31, 2010, by $1,000 and multiplying the result by the number in the Expenses Paid During Period row as shown below.
Shares of all Funds, other than Oakmark Equity & Income Fund, invested for 90 days or less may be charged a 2% redemption fee. Please consult the Funds' prospectus at oakmark.com for more information.
| | | Oakmark
Fund | | Oakmark
Select Fund | | Oakmark
Equity and
Income Fund | | Oakmark
Global Fund | | Oakmark
International
Fund | | Oakmark
International
Small Cap
Fund | |
| Beginning Account Value | | $ | 1,000.00 | | | $ | 1,000.00 | | | $ | 1,000.00 | | | $ | 1,000.00 | | | $ | 1,000.00 | | | $ | 1,000.00 | | |
| Ending Account Value | | $ | 1,144.20 | | | $ | 1,140.50 | | | $ | 1,092.90 | | | $ | 1,104.60 | | | $ | 1,101.00 | | | $ | 1,101.60 | | |
| Expenses Paid During Period* | | $ | 7.64 | | | $ | 7.31 | | | $ | 5.69 | | | $ | 8.03 | | | $ | 7.49 | | | $ | 8.80 | | |
| Annualized Expense Ratio | | | 1.43 | % | | | 1.37 | % | | | 1.09 | % | | | 1.53 | % | | | 1.43 | % | | | 1.68 | % | |
* Expenses are equal to each Fund's annualized expense ratio for Class II, multiplied by the average account value over the period, multiplied by the number of days in the most recent fiscal half-year divided by 365 (to reflect the one-half year period).
Hypothetical Example for Comparison Purposes
The following table provides information about hypothetical account values and hypothetical expenses for Class II of each Fund based on actual expense ratios and an assumed rate of return of 5% per year before expenses, which are not the Funds' actual returns. The hypothetical account values and expenses may not be used to estimate the actual ending account balances or expenses shareholders paid for the period. Shareholders may use this information to compare the ongoing costs of investing in a Fund and other funds. To do so, compare this 5% hypothetical example with the 5% hypothetical examples that appear in the shareholder reports of the other funds.
Please note that the expenses shown in the table are meant to highlight your ongoing costs only and do not reflect any transaction costs, such as redemption fees. Therefore, the third line of the table is useful in comparing ongoing costs only, and will not help you determine the relative total costs of owning different funds. In addition, if these transaction costs were included, the total costs would have been higher.
| | | Oakmark
Fund | | Oakmark
Select Fund | | Oakmark
Equity and
Income Fund | | Oakmark
Global Fund | | Oakmark
International
Fund | | Oakmark
International
Small Cap
Fund | |
| Beginning Account Value | | $ | 1,000.00 | | | $ | 1,000.00 | | | $ | 1,000.00 | | | $ | 1,000.00 | | | $ | 1,000.00 | | | $ | 1,000.00 | | |
| Ending Account Value | | $ | 1,017.80 | | | $ | 1,018.10 | | | $ | 1,019.50 | | | $ | 1,017.30 | | | $ | 1,017.80 | | | $ | 1,016.55 | | |
| Expenses Paid During Period* | | $ | 7.19 | | | $ | 6.89 | | | $ | 5.49 | | | $ | 7.70 | | | $ | 7.19 | | | $ | 8.45 | | |
| Annualized Expense Ratio | | | 1.43 | % | | | 1.37 | % | | | 1.09 | % | | | 1.53 | % | | | 1.43 | % | | | 1.68 | % | |
* Expenses are equal to each Fund's annualized expense ratio for Class II, multiplied by the average account value over the period, multiplied by the number of days in the most recent fiscal half-year divided by 365 (to reflect the one-half year period).
Item 2. Code of Ethics.
Not required in this filing.
Item 3. Audit Committee Financial Expert.
Not required in this filing.
Item 4. Principal Accountant Fees and Services.
Not required in this filing.
Item 5. Audit Committee of Listed Registrants.
Not required in this filing.
Item 6. Investments.
(a) The Schedule of Investments in securities of unaffiliated issuers is included as part of the semi-annual report to shareholders filed under Item 1 of this Form.
(b) No disclosures are required by this Item 6(b).
Item 7. Disclosure of Proxy Voting Policies and Procedures for Closed-End Management Investment Companies.
Not applicable.
Item 8. Portfolio Managers of Closed-End Management Investment Companies.
Not applicable.
Item 9. Purchases of Equity Securities by Closed-End Management Investment Company and Affiliated Purchasers.
Not applicable.
Item 10. Submission of Matters to a Vote of Security Holders.
During the period covered by this report, no amendments were made to the procedures adopted in fiscal year 2007.
Item 11. Controls and Procedures.
(a) Based on an evaluation of the disclosure controls and procedures (as defined in Rule
30a-3(c) under the Investment Company Act of 1940, the “Disclosure Controls”), the Disclosure Controls are effectively designed to ensure that information required to be disclosed by the Registrant in this report is recorded, processed, summarized and reported within 90 days prior to the filing of this report, including ensuring that information required to be disclosed in this report is accumulated and communicated to the Registrant’s management, including the Registrant’s principal executive officer and principal financial officer, as appropriate to allow timely decisions regarding required disclosure.
(b) There were no changes in the Registrant’s internal controls over financial reporting (as defined in Rule 30a-3(d) under the Investment Company Act of 1940) that occurred during the Registrant’s second fiscal quarter of the time period covered by this report that has materially affected, or is reasonably likely to materially affect, the Registrant’s internal control over financial reporting.
Item 12. Exhibits.
(a) | (1) | Not required in this filing. |
| | |
| (2) | Certifications of John R. Raitt, Principal Executive Officer, and Kristi L. Rowsell, Principal Financial Officer, pursuant to Rule 30a-2(a) under the Investment Company Act of 1940 (17 CFR 270.30a-2(a)), attached hereto as Exhibits (a)(2)(i) and (a)(2)(ii). |
| | |
| (3) | Not applicable. |
| | |
(b) | | Certification of John R. Raitt, Principal Executive Officer and Kristi L. Rowsell, Principal Financial Officer, pursuant to Section 906 of the Sarbanes-Oxley Act of 2002, attached hereto as Exhibit (b). |
SIGNATURES
Pursuant to the requirements of the Securities Exchange Act of 1934 and the Investment Company Act of 1940, the Registrant has duly caused this report to be signed on its behalf by the undersigned, thereunto duly authorized.
Harris Associates Investment Trust
By: | /s/ John R. Raitt | |
| John R. Raitt | |
| Principal Executive Officer | |
Date: | May 21, 2010 | |
Pursuant to the requirements of the Securities Exchange Act of 1934 and the Investment Company Act of 1940, this report has been signed below by the following persons on behalf of the Registrant and in the capacities and on the dates indicated.
By: | /s/ John R. Raitt | |
| John R. Raitt | |
| Principal Executive Officer | |
Date: | May 21, 2010 | |
| | |
| | |
By: | /s/ Kristi L. Rowsell | |
| Kristi L. Rowsell | |
| Principal Financial Officer | |
Date: | May 21, 2010 | |