UNITED STATES
SECURITIES AND EXCHANGE COMMISSION
Washington, D.C. 20549
FORM N-CSR
CERTIFIED SHAREHOLDER REPORT OF REGISTERED
MANAGEMENT INVESTMENT COMPANIES
Investment Company Act file number | 811-06279 |
|
Harris Associates Investment Trust |
(Exact name of registrant as specified in charter) |
|
Two North La Salle Street, Suite 500 Chicago, Illinois | | 60602-3790 |
(Address of principal executive offices) | | (Zip code) |
|
Kristi L. Rowsell Harris Associates L.P. Two North La Salle Street, #500 Chicago, Illinois 60602 | Paulita A. Pike K&L Gates LLP Three First National Plaza, #3100 Chicago, Illinois 60602 |
(Name and address of agent for service) |
|
Registrant’s telephone number, including area code: | (312) 621-0600 | |
|
Date of fiscal year end: | 9/30/11 | |
|
Date of reporting period: | 3/31/11 | |
| | | | | | | | | |
Item 1. Reports to Shareholders.
SEMI-ANNUAL REPORT
MARCH 31, 2011
oakmark.com

Advised by Harris Associates L.P.
THE OAKMARK FUNDS
2011 Semi-Annual Report
| President's Letter | | | 1 | | |
|
| Summary Information | | | 2 | | |
|
| Fund Expenses | | | 4 | | |
|
| Commentary on Oakmark and Oakmark Select Funds | | | 6 | | |
|
| Oakmark Fund | |
|
| Letter from the Portfolio Managers | | | 8 | | |
|
| Schedule of Investments | | | 9 | | |
|
| Oakmark Select Fund | |
|
| Letter from the Portfolio Managers | | | 13 | | |
|
| Schedule of Investments | | | 14 | | |
|
| Oakmark Equity and Income Fund | |
|
| Letter from the Portfolio Managers | | | 16 | | |
|
| Schedule of Investments | | | 19 | | |
|
| Oakmark Global Fund | |
|
| Letter from the Portfolio Managers | | | 26 | | |
|
| Global Diversification Chart | | | 29 | | |
|
| Schedule of Investments | | | 30 | | |
|
| Oakmark Global Select Fund | |
|
| Letter from the Portfolio Managers | | | 35 | | |
|
| Global Diversification Chart | | | 37 | | |
|
| Schedule of Investments | | | 38 | | |
|
| Commentary on Oakmark International and International Small Cap Funds | | | 41 | | |
|
| Oakmark International Fund | |
|
| Letter from the Portfolio Managers | | | 43 | | |
|
| Global Diversification Chart | | | 45 | | |
|
| Schedule of Investments | | | 46 | | |
|
| Oakmark International Small Cap Fund | |
|
| Letter from the Portfolio Manager | | | 52 | | |
|
| Global Diversification Chart | | | 54 | | |
|
| Schedule of Investments | | | 55 | | |
|
| Financial Statements | |
|
| Statements of Assets and Liabilities | | | 62 | | |
|
| Statements of Operations | | | 64 | | |
|
| Statements of Changes in Net Assets | | | 66 | | |
|
| Notes to Financial Statements | | | 73 | | |
|
| Financial Highlights | | | 85 | | |
|
| Disclosure Regarding Investment Advisory Contract Approval | | | 93 | | |
|
| Oakmark Glossary | | | 98 | | |
|
| Trustees and Officers | | | 99 | | |
|
FORWARD-LOOKING STATEMENT DISCLOSURE
One of our most important responsibilities as mutual fund managers is to communicate with shareholders in an open and direct manner. Some of our comments in our letters to shareholders are based on current management expectations and are considered "forward-looking statements". Actual future results, however, may prove to be different from our expectations. You can identify forward-looking statements by words such as "estimate", "may", "will", "expect", "believe", "plan" and other similar terms. We cannot promise future returns. Our opinions are a reflection of our best judgment at the time this report is compiled, and we disclaim any obligation to update or alter forward-looking statements as a result of new information, future events, or otherwise.

IMPORTANT MESSAGE ABOUT
ELECTRONIC DELIVERY (E-DELIVERY) OF
OAKMARK REPORTS AND PROSPECTUSES
Kindly be advised that you may now sign up to receive email notification of reports and prospectuses at oakmark.com.
To enroll, please log into your account at oakmark.com and click "E-delivery Preferences" under the "My Account" tab.
You will receive notice to your email address that documents are available for viewing at oakmark.com. You will no longer receive paper versions of these documents.

(This page has been intentionally left blank.)
President's Letter
Dear Fellow Shareholders,
The Oakmark Funds posted strong returns this quarter, as the global markets continued their overall recovery. Four of our Funds have fully recovered their losses from the bear markets of 2008 and 2009 and have reached new highs in net asset value per share. Three Funds were within close reach of this mark as of the quarter end. As objective and disciplined investors, we achieved this by identifying what we saw as exceptional opportunities to buy high-quality companies at low valuations during this downturn while others may have stayed on the sidelines. Inflows to equity mutual funds are only now reaching more normal levels. Investors who reacted early should be quite happy.
As our Fund managers point out in their letters, the global macroeconomic environment is rarely tranquil, and current times are no exception. This past quarter was particularly troubled by turmoil in the Middle East and the horror of the earthquake, tsunami and potential nuclear disaster in Japan. Our managers address this situation in their commentaries, and we have also posted several relevant interviews and letters on our website, oakmark.com. We continue to emphasize our belief that superior long-term investment returns are best realized by focusing on a company's fundamentals. Nonetheless we also strive to determine how global events will affect a company's intrinsic business value and whether the market is pricing the company at a discount. Trusting this process requires discipline and patience, but we have found that market turmoil has often played to our strengths. We thank our shareholders for sharing this long-term perspective.
Kudos for Clyde McGregor
In March, Lipper named Clyde McGregor the inaugural winner of its Excellence in Fund Management Award. It is gratifying to see the mutual fund industry recognize what we know, as Oakmark shareholders, is a remarkable and consistent track record of successful investing. Clyde credits his co-managers and the research analysts at Harris Associates who identify—and also debate the merits of—each company in our portfolios. This collaboration between analysts and managers is yet another attribute of great leadership. Clyde is approaching his 30-year anniversary at Harris Associates, and he has served more than 15 years as an Oakmark fund manager. We congratulate him for this well-deserved honor.
E-Delivery of Reports is Available
Oakmark is pleased to announce that we will soon offer electronic delivery of shareholder reports and prospectuses as an alternative to sending booklets by mail. Starting in May, we will invite shareholders to come to Oakmark.com and select this feature for their accounts. When you log on to your account at Oakmark.com, you will see an invitation to register for e-mail notification to retrieve shareholder documents online. If you haven't already secured online access to your account, you may obtain this access by clicking the New User button under Account Access. In addition to the convenience of reviewing materials electronically, this feature will conserve environmental resources and deliver savings to the Funds by reducing print and mail expenses. E-Delivery will also help eliminate the delay that results from printing and mailing these materials. We endeavor to complete our reports as quickly as possible to inform you about your investments, and we hope you take advantage of this new service. We also encourage those who invest with us through financial intermediaries to register for E-Delivery; many intermediaries offer this feature to our clients.
Thank you for your continued investment and confidence in The Oakmark Funds. We welcome your comments and suggestions. You can reach us at ContactOakmark@Oakmark.com.
Kristi L. Rowsell
President of The Oakmark Funds
President of Harris Associates L.P.
March 31, 2011

1
THE OAKMARK FUNDS
Summary Information
Performance for Period
Ended March 31, 20111 | | Oakmark
Fund—Class I
(OAKMX) | | Oakmark
Select Fund—Class I
(OAKLX) | | Oakmark
Equity and Income
Fund—Class I
(OAKBX) | | Oakmark
Global Fund—Class I
(OAKGX) | |
| | 3 Months* | | | | 5.16 | % | | | 6.52 | % | | | 4.69 | % | | | 2.36 | % | |
| | 1 Year | | | | 11.07 | % | | | 13.43 | % | | | 9.49 | % | | | 11.07 | % | |
| Average Annual Total
Return for: | | | | | | | | | | | | | | | | | | |
| | 3 Year | | | | 7.50 | % | | | 8.28 | % | | | 4.48 | % | | | 3.55 | % | |
| | 5 Year | | | | 4.79 | % | | | 2.24 | % | | | 6.97 | % | | | 4.86 | % | |
| | 10 Year | | | | 5.51 | % | | | 5.41 | % | | | 8.87 | % | | | 12.08 | % | |
| | Since inception | | | 12.61%
(8/5/91) | | 12.64%
(11/1/96) | | 11.42%
(11/1/95) | | 11.59%
(8/4/99) | |
| Top Five Equity
Holdings as of
March 31, 20112
Company and % of Total
Net Assets | | | Comcast Corp.,
Class A 2.4%
Texas Instruments,
Inc. 2.2%
TE Connectivity, Ltd. 2.2%
Capital One
Financial Corp. 2.1%
Viacom, Inc.,
Class B 2.1% | | Discovery
Communications Inc.,
Class C 7.9%
TE Connectivity, Ltd. 6.1%
Liberty Media
Holding Corp. -
Interactive, Class A 6.0%
Comcast Corp.,
Class A 5.2%
Texas Instruments,
Inc. 4.9% | | Cenovus Energy, Inc. 4.1%
Nestle SA 3.1%
General Dynamics
Corp. 3.0%
Apache Corp. 2.9%
Diageo PLC 2.5% | | Snap-on, Inc. 4.8%
Oracle Corp. 4.5%
Laboratory Corp. of
America Holdings 4.2%
Daiwa Securities
Group, Inc. 3.8%
Square Enix
Holdings Co., Ltd. 3.5% | |
| Sector
Allocation as of
March 31, 2011
Sector and % of
Long-Term Investments at Fair Value | | | Consumer
Discretionary 26.9%
Information
Technology 24.8%
Financials 14.5%
Health Care 11.7%
Industrials 9.9%
Consumer Staples 7.6%
Energy 4.6% | | Consumer
Discretionary 36.2%
Information
Technology 28.1%
Financials 12.4%
Energy 9.8%
Health Care 8.6%
Utilities 4.9% | | U.S. Government
Securities 24.6%
Industrials 14.9%
Health Care 14.7%
Consumer Staples 13.2%
Energy 11.5%
Consumer
Discretionary 8.1%
Information
Technology 5.8%
Financials 4.0%
Materials 2.9%
Foreign Government
Securities 0.3% | | Information
Technology 34.0%
Industrials 16.8%
Financials 15.4%
Consumer
Discretionary 11.0%
Health Care 9.4%
Materials 5.5%
Consumer Staples 5.3%
Energy 2.6% | |
Past Performance is no guarantee of future results. The performance data quoted represents past performance. Current performance may be lower or higher than the performance data quoted. The investment return and principal value vary so that an investor's shares when redeemed may be worth more or less than the original cost. The performance of the Funds does not reflect the 2% redemption fee imposed on shares redeemed within 90 days of purchase with the exception of The Oakmark Equity & Income Fund which does not impose a redemption fee. To obtain the most recent month-end performance data, visit oakmark.com.
* Not annualized
THE OAKMARK FUNDS
2
Performance for Period
Ended March 31, 20111 | | Oakmark
Global Select
Fund—Class I
(OAKWX) | | Oakmark
International
Fund—Class I
(OAKIX) | | Oakmark
International
Small Cap Fund—Class I
(OAKEX) | |
| | 3 Months* | | | | 5.15 | % | | | 2.27 | % | | | 2.09 | % | |
| | 1 Year | | | | 9.75 | % | | | 12.44 | % | | | 17.73 | % | |
| Average Annual Total
Return for: | | | | | | | | | | | | | | |
| | 3 Year | | | | 10.80 | % | | | 7.16 | % | | | 7.06 | % | |
| | 5 Year | | | | N/A | | | | 5.25 | % | | | 4.51 | % | |
| | 10 Year | | | | N/A | | | | 9.77 | % | | | 13.19 | % | |
| | Since inception | | | 5.86%
(10/2/06) | | 10.91%
(9/30/92) | | 11.37%
(11/1/95) | |
| Top Five Equity
Holdings as of
March 31, 20112
Company and % of Total
Net Assets | | | ROHM Co., Ltd. 6.5%
Toyota Motor Corp. 6.3%
Diageo PLC 5.7%
G4S PLC 5.4%
SAP AG 5.2% | | Daiwa Securities
Group, Inc. 3.5%
Credit Suisse Group 3.3%
ROHM Co., Ltd. 3.0%
Toyota Motor Corp. 3.0%
Canon, Inc. 2.9% | | Julius Baer Group,
Ltd. 3.5%
Square Enix
Holdings Co., Ltd. 3.4%
Hirose Electric Co.,
Ltd. 3.0%
Goodman Fielder,
Ltd. 3.0%
Primary Health
Care, Ltd. 3.0% | |
| Sector
Allocation as of
March 31, 2011
Sector and % of
Long-Term Investments at Fair Value | | | Information
Technology 34.6%
Consumer
Discretionary 20.4%
Financials 14.4%
Consumer Staples 10.7%
Industrials 10.5%
Energy 5.0%
Health Care 4.4% | | Financials 23.3%
Consumer
Discretionary 17.7%
Industrials 17.0%
Consumer Staples 13.7%
Information
Technology 12.1%
Health Care 8.2%
Materials 8.0% | | Industrials 27.0%
Consumer
Discretionary 19.8%
Information
Technology 17.8%
Financials 11.9%
Consumer Staples 9.7%
Materials 8.1%
Health Care 5.7% | |
As of 9/30/10, the expense ratio for Class I shares was 1.11% for Oakmark Fund, 1.08% for Oakmark Select Fund, 0.79% for Oakmark Equity and Income Fund, 1.15% for Oakmark Global Fund, 1.29% for Oakmark Global Select Fund, 1.08% for Oakmark International Fund and 1.38% for Oakmark International Small Cap Fund.
THE OAKMARK FUNDS
3
FUND EXPENSES
A shareholder of each Fund incurs two types of costs: (1) transaction costs, such as redemption fees, and (2) ongoing costs, including investment advisory fees, transfer agent fees and other fund expenses. The examples below are intended to help shareholders understand the ongoing cost (in dollars) of investing in each Fund and to compare these costs with the ongoing costs of investing in other funds.
Actual Expenses
The following table provides information about actual account values and actual fund expenses for Class I Shares of each Fund. The table shows the expenses a Class I shareholder would have paid on a $1,000 investment in each Fund from October 1, 2010 to March 31, 2011, as well as how much a $1,000 investment would be worth at the close of the period, assuming actual fund returns and expenses. A Class I shareholder can estimate expenses incurred for the period by dividing the account value at March 31, 2011, by $1,000 and multiplying the result by the number in the Expenses Paid During Period row as shown below.
Shares of all Funds, other than Oakmark Equity and Income Fund, invested for 90 days or less may be charged a 2% redemption fee. Please consult the Funds' prospectus at oakmark.com for more information.
| | | Oakmark Fund | | Oakmark Select Fund | | Oakmark Equity and Income Fund | | Oakmark Global Fund | | Oakmark Global Select Fund | | Oakmark International Fund | | Oakmark International Small Cap Fund | |
Beginning
Account
Value | | $ | 1,000.00 | | | $ | 1,000.00 | | | $ | 1,000.00 | | | $ | 1,000.00 | | | $ | 1,000.00 | | | $ | 1,000.00 | | | $ | 1,000.00 | | |
Ending
Account
Value | | $ | 1,139.10 | | | $ | 1,142.80 | | | $ | 1,124.80 | | | $ | 1,133.00 | | | $ | 1,149.40 | | | $ | 1,100.90 | | | $ | 1,133.00 | | |
Expenses
Paid
During
Period* | | $ | 5.60 | | | $ | 5.72 | | | $ | 4.08 | | | $ | 6.01 | | | $ | 6.64 | | | $ | 5.39 | | | $ | 7.18 | | |
Annualized
Expense
Ratio | | | 1.05 | % | | | 1.07 | % | | | 0.77 | % | | | 1.13 | % | | | 1.24 | % | | | 1.03 | % | | | 1.35 | % | |
* Expenses are equal to each Fund's annualized expense ratio for Class I Shares, multiplied by the average account value over the period, multiplied by the number of days in the most recent fiscal half-year divided by 365 (to reflect the one-half year period).
THE OAKMARK FUNDS
4
Hypothetical Example for Comparison Purposes
The following table provides information about hypothetical account values and hypothetical expenses for Class I Shares of each Fund based on actual expense ratios and an assumed rate of return of 5% per year before expenses, which are not the Funds' actual returns. The hypothetical account values and expenses may not be used to estimate the actual ending account balances or expenses shareholders paid for the period. Shareholders may use this information to compare the ongoing costs of investing in a Fund and other funds. To do so, compare this 5% hypothetical example with the 5% hypothetical examples that appear in the shareholder reports of the other funds.
Please note that the expenses shown in the table are meant to highlight your ongoing costs only and do not reflect any transaction costs, such as redemption fees. Therefore, the third line of the table is useful in comparing ongoing costs only and will not help you determine the relative total costs of owning different funds. In addition, if these transaction costs were included, the total costs would have been higher.
| | | Oakmark Fund | | Oakmark Select Fund | | Oakmark Equity and Income Fund | | Oakmark Global Fund | | Oakmark Global Select Fund | | Oakmark International Fund | | Oakmark International Small Cap Fund | |
Beginning
Account
Value | | $ | 1,000.00 | | | $ | 1,000.00 | | | $ | 1,000.00 | | | $ | 1,000.00 | | | $ | 1,000.00 | | | $ | 1,000.00 | | | $ | 1,000.00 | | |
Ending
Account
Value | | $ | 1,019.70 | | | $ | 1,019.60 | | | $ | 1,021.09 | | | $ | 1,019.30 | | | $ | 1,018.75 | | | $ | 1,019.80 | | | $ | 1,018.20 | | |
Expenses
Paid
During
Period* | | $ | 5.29 | | | $ | 5.39 | | | $ | 3.88 | | | $ | 5.69 | | | $ | 6.24 | | | $ | 5.19 | | | $ | 6.79 | | |
Annualized
Expense
Ratio | | | 1.05 | % | | | 1.07 | % | | | 0.77 | % | | | 1.13 | % | | | 1.24 | % | | | 1.03 | % | | | 1.35 | % | |
* Expenses are equal to each Fund's annualized expense ratio for Class I Shares, multiplied by the average account value over the period, multiplied by the number of days in the most recent fiscal half-year divided by 365 (to reflect the one-half year period).
THE OAKMARK FUNDS
5
OAKMARK AND OAKMARK SELECT FUNDS
At Oakmark, we are long-term investors. We attempt to identify growing businesses that are managed to benefit their shareholders. We will purchase stock in those businesses only when priced substantially below our estimate of intrinsic value. After purchase, we patiently wait for the gap between stock price and intrinsic value to close.
 "Making mistakes was acceptable. Failure to learn from them was not."
- Jonah Keri, The Extra 2%3
I enjoy reading books about successful organizations. I like to see how their methods overlap with ours and the companies we have investments in. I also like seeing what they do differently than we do to get ideas for how we can improve. While we have learned some things from studying other successful investment firms, I find we learn more from comparisons to non-investment companies. And given my non-work interests, I especially enjoy the comparisons to successful sports organizations. Several years ago I wrote about one such book, Moneyball by Michael Lewis, that examined how baseball's Oakland A's had applied a value-investing discipline to their investments in baseball players. Developing a better understanding of how some obscure statistics translated into runs scored allowed a small-market team like the A's to play competitively against teams that had payrolls multiples of their size.
Another successful small-market MLB team, the Tampa Bay Rays, is the subject of Jonah Keri's new book, The Extra 2%—How Wall Street Strategies Took a Major League Baseball Team from Worst to First. The book chronicles events leading up to Tampa Bay getting a major-league team in 1998. It then examines a decade of frustration as Tampa finished in last place in nine of its first 10 seasons. Following the sale of the franchise to new owners, the team went from last place in 2007 to American League champions in 2008, and in 2010 the team again beat the Yankees and Red Sox to win the AL East Division. Though the Rays were not as forthcoming with the baseball particulars that led to their success as the A's had been, I found the comments about organizational management to be especially insightful.
The original owner of the Tampa Bay Rays was a businessman who profited handsomely from leading several successful turnarounds of industrial companies. He made companies run much more efficiently by cutting expenses while boosting productivity. That skill proved less than helpful in launching a baseball team, which is effectively an entertainment company. In the Oakmark Fund we own ITW Industries, an industrial conglomerate. I think the management of ITW is as good as any industrial company management. We also own Discovery Communications, a cable-TV networks company. I think the Discovery management is as good as any management in the entertainment industry. However, if we switched the management teams and put the ITW managers in charge of Discovery and vice-versa, I'm not sure either management would succeed.
At various times, maximizing the value of a company might mean acquiring or disposing of business segments, improving profit margins, boosting sales or maximizing the value of the cash it generates. Often it is some combination. I think the failing of the original Tampa Bay management is a good reminder that when we refer to a company as having "good management," we really mean that we believe the managers have the skills needed for the challenges their specific company faces. For all of our holdings, we have made the judgment that the current management teams are suited to the current needs of each respective business.
After nearly a decade of disappointing results, Tampa Bay's team was sold to—and run by—a trio of ex-Wall Street guys who had no experience in managing professional sports teams. What they did have was an extensive background in statistical analysis. As Keri explains in The Extra 2%: "Sternberg, Silverman, and Friedman made a commitment from the start to track the effectiveness of their decision making. Draft picks would need to be scrutinized several years out, to see how the scouting staff could have done better. Ditto for trades, business partnerships, ticket sales strategies, and other decisions. Making mistakes was acceptable. Failure to learn from those mistakes was not." It is surprising to me how few companies rigorously analyze the results of their past decisions. Through that analysis, good companies can learn from their mistakes and constantly improve their processes. At Oakmark, we try to invest only with managements that we believe will be that self-reflective, and we strive to be equally thoughtful when we review our past investment decisions.
The Rays' new manager, Joe Maddon, was also key to the turnaround. Like his bosses, Maddon was a hard worker and an analyst of statistics. He toiled for 30 years as a minor-league manager and major-league assistant before getting the Rays prize. Given the track record of the Rays to that point, one wondered whether or not it was a prize worth winning. Maddon told the press, "When it comes down to individual effort, it takes absolutely zero talent, zero, to try hard and play hard every day. I'm okay with physical mistakes, with mental mistakes, I'm accepting of all that. The part I'm not accepting of is that part you can
OAKMARK AND OAKMARK SELECT FUNDS
6
control. And that's your effort. You just can't pick and choose when you put your effort out there. It has to be all the time." (I hope the Cubs' new manager demands the same!)
One of the reasons I enjoy comparing baseball to investing is because of their similarities. In baseball, the best teams lose more than a third of their games and endure extended losing streaks. The best hitters generate far more outs than hits. Applying high levels of talent and effort doesn't eliminate all the bad outcomes in baseball. Similar to the Rays, we always expect a high level of effort from our analysts, regardless of how the stock market is behaving. But that alone doesn't guarantee success. I've said before that investing is an endeavor where lack of effort or talent will eventually lead to disappointing results, but even consistently high levels of effort and talent will fail to produce consistently good short-term results. There is no magic formula that allows for winning every day. As I wrote in last quarter's report, despite achieving very good performance in the past decade, the Oakmark Fund either lost money or failed to outperform up markets by more than a percentage point in 80% of the quarters. We know what it's like to play the game hard but still go hitless.
In both baseball and investing, even the best performers experience bad short-term outcomes, and that invites second-guessing. And in both cases, long-term success requires having the discipline to stick with a good process even as it produces bad day-to-day results over a short period. The Rays' EVP of baseball operations, Andrew Friedman, said of the turnaround season, "People ask all the time what our expectations were. We don't get caught up in those things because we are so caught up in process. We believe, with the right process, good things will happen. I felt like we would score more runs than we allowed. What that meant, we weren't really sure." I think I've used almost those same words. "At Oakmark we believe we have a process in place that will result in us choosing more stocks that go up than down, and the magnitude of our winners should exceed that of our losers. What that means for any given quarter, I don't know."
The author Keri writes, "When self-confidence, an even-keeled personality, a nose for analysis, and job security come together, you get coaches and managers willing to make decisions that fly in the face of conventional wisdom." I believe that success in almost any endeavor requires having the freedom to think differently than others do. Like the Rays, we encourage unconventional thinking. "Trust the process," Maddon told himself, "and success will never be a surprise." At Oakmark we strive to maintain an environment where our investment professionals trust our process. Our analysts know that they won't be rewarded or penalized based just on short-term stock price movements, but rather on how well they followed our process. When we make mistakes, we try to identify them as quickly as possible in order to limit their damage and then we go back to see if we can improve our process to reduce the chance of a recurrence.
Just like the Tampa Bay Rays, we strive to get the right investment professionals on our team. We believe that self-confidence and an even-keeled personality are requirements for success in sports and in investing. So is passion. In investing, that passion has to be for analysis. We hire team-oriented individuals, and we especially like team-sports participants who didn't have the talent to fully quench their drive for success through sports. We believe the Oakmark process and our team of analysts give us an important competitive advantage. Several of our analysts compete quite successfully in fantasy baseball and football leagues. Our shareholders are fortunate that those analysts didn't have the talent to play those sports for real.
William C. Nygren, CFA
Portfolio Manager
oakmx@oakmark.com
oaklx@oakmark.com
March 31, 2011
OAKMARK AND OAKMARK SELECT FUNDS
7
OAKMARK FUND
Report from Bill Nygren and Kevin Grant, Portfolio Managers


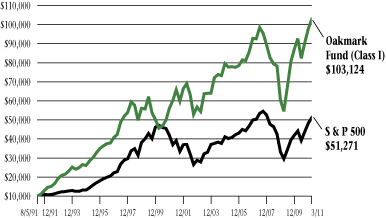
THE VALUE OF A $10,000 INVESTMENT IN OAKMARK FUND FROM ITS INCEPTION (8/5/91) TO PRESENT (3/31/11) AS COMPARED TO THE STANDARD & POOR'S 500 INDEX4 (UNAUDITED)
| | | | | Average Annual Total Returns
(as of 3/31/11) | |
| (Unaudited) | | Total Return
Last 3 Months* | | 1-year | | 5-year | | 10-year | | Since
Inception
(8/5/91) | |
| Oakmark Fund (Class I) | | | 5.16 | % | | | 11.07 | % | | | 4.79 | % | | | 5.51 | % | | | 12.61 | % | |
| S&P 500 Index | | | 5.92 | % | | | 15.65 | % | | | 2.62 | % | | | 3.29 | % | | | 8.67 | % | |
| Dow Jones Average5 | | | 7.07 | % | | | 16.51 | % | | | 4.87 | % | | | 4.73 | % | | | 10.00 | % | |
Lipper Large Cap
Value Index6 | | | 5.86 | % | | | 13.14 | % | | | 1.80 | % | | | 3.31 | % | | | 8.30 | % | |
The graph and table do not reflect the deduction of taxes that a shareholder would pay on Fund distributions or the redemption of Fund shares.
The expense ratio for Class I shares as of 9/30/10 was 1.11%
Past Performance is no guarantee of future results. The performance data quoted represents past performance. Current performance may be lower or higher than the performance data quoted. The investment return and principal value vary so that an investor's shares when redeemed may be worth more or less than the original cost. The performance of the Fund does not reflect the 2% redemption fee imposed on shares redeemed within 90 days of purchase. To obtain the most recent month-end performance data, visit oakmark.com.
* Not annualized
The Oakmark Fund increased in value by 5% for the three months ended March 31, 2011. Though good as an absolute return, our return slightly trailed the S&P 500 gain of 6%.
The biggest reason we didn't quite keep up with the S&P was the strength of the energy sector. During the quarter, the price of oil increased by 17% (West Texas) or 24% (North Sea Brent), depending on which measure one uses. Commodity businesses, understandably, tend to perform quite well when the commodity they sell experiences such a price spike. For the quarter, the average energy stock increased two to three times as much as the S&P did, and our portfolio wasn't as heavily weighted in those stocks. We don't believe this higher price of oil reflects a long-term market-clearing price and, for that reason, we value oil stocks using an assumption that oil prices will fall. In our valuations, most oil companies are priced less attractively than other businesses are, and we are comfortable continuing to own just the few we have.
Returns of individual stocks in the portfolio followed the typical pattern for successful quarters—more winners than losers, and gains of greater magnitude than losses. The Fund had 18 double-digit gains and only two double-digit losses. The biggest losses were suffered by Cisco Systems (-15%) and Best Buy (-16%). Both reported disappointing operating results, and we are revisiting our long-term forecasts. In both cases, we believe that the stocks remain attractive.
On the positive side we had seven stocks that gained more than our largest loser lost: DirecTV (+17%), Viacom (+18%), Cenovus (+19%), EnCana (+19%), Capital One (+22%), Harley Davidson (+23%) and H&R Block (+42%). Block had been one of our weakest stocks in previous quarters, but snapped back nicely as early tax results exceeded expectations and lingering subprime mortgage losses remained trivial.
During the quarter, we neither added any new positions nor eliminated any positions that were owned at the end of 2010. However, we did receive one new security via corporate action: Huntington Ingalls Industries was spun off from Northrop Grumman. Our numbers showed Huntington trading at a substantial premium when comparing its total capitalization (including debt) to the pretax, pre-interest cash flow it generates. For that reason, we sold our shares in Huntington and used the proceeds to increase our Northrop position. In addition to Northrop, we also added substantially to our positions in Unilever, Aflac and FedEx.
Thank you for your continuing support.
William C. Nygren, CFA
Portfolio Manager
oakmx@oakmark.com | | Kevin G. Grant, CFA
Portfolio Manager
oakmx@oakmark.com | |
|
March 31, 2011
OAKMARK FUND
8
OAKMARK FUND
Schedule of Investments—March 31, 2011 (Unaudited)
Name | |
Shares Held | |
Value | |
| Common Stocks—94.7% | |
| Advertising—1.8% | |
| Omnicom Group, Inc. | | | 1,516,254 | | | $ | 74,387,421 | | |
| Aerospace & Defense—3.5% | |
| Northrop Grumman Corp. | | | 1,240,000 | | | | 77,760,400 | | |
| The Boeing Co. | | | 900,000 | | | | 66,537,000 | | |
| | | | 144,297,400 | | |
| Air Freight & Logistics—1.5% | |
| FedEx Corp. | | | 660,000 | | | | 61,743,000 | | |
| Asset Management & Custody Banks—3.6% | |
| State Street Corp. | | | 1,660,000 | | | | 74,600,400 | | |
| Bank of New York Mellon Corp. | | | 2,489,630 | | | | 74,365,248 | | |
| | | | 148,965,648 | | |
| Broadcasting—1.4% | |
| Discovery Communications, Inc., Class C (a) | | | 1,700,140 | | | | 59,861,930 | | |
| Cable & Satellite—4.1% | |
| Comcast Corp., Class A | | | 4,220,000 | | | | 97,988,400 | | |
| DIRECTV, Class A (a) | | | 1,499,155 | | | | 70,160,454 | | |
| | | | 168,148,854 | | |
| Catalog Retail—2.0% | |
| Liberty Media Corp. - Interactive, Class A (a) | | | 5,205,000 | | | | 83,488,200 | | |
| Communications Equipment—1.2% | |
| Cisco Systems, Inc. | | | 2,950,000 | | | | 50,592,500 | | |
| Computer & Electronics Retail—1.5% | |
| Best Buy Co., Inc. | | | 2,110,000 | | | | 60,599,200 | | |
| Computer Hardware—3.7% | |
| Apple, Inc. (a) | | | 220,000 | | | | 76,659,000 | | |
| Dell, Inc. (a) | | | 5,120,000 | | | | 74,291,200 | | |
| | | | 150,950,200 | | |
| Consumer Finance—2.1% | |
| Capital One Financial Corp. | | | 1,694,800 | | | | 88,061,808 | | |
| Data Processing & Outsourced Services—4.8% | |
| MasterCard, Inc., Class A | | | 300,000 | | | | 75,516,000 | | |
| Automatic Data Processing, Inc. | | | 1,275,000 | | | | 65,420,250 | | |
| Western Union Co. | | | 2,690,000 | | | | 55,871,300 | | |
| | | | 196,807,550 | | |
OAKMARK FUND
9
OAKMARK FUND
Schedule of Investments—March 31, 2011 (Unaudited) cont.
Name | |
Shares Held | |
Value | |
| Common Stocks—94.7% (cont.) | |
| Department Stores—1.6% | |
| Kohl's Corp. | | | 1,211,900 | | | $ | 64,279,176 | | |
| Distillers & Vintners—1.7% | |
| Diageo PLC (b) | | | 896,000 | | | | 68,293,120 | | |
| Diversified Banks—1.8% | |
| Wells Fargo & Co. | | | 2,400,000 | | | | 76,080,000 | | |
| Drug Retail—1.9% | |
| Walgreen Co. | | | 1,965,000 | | | | 78,875,100 | | |
| Electronic Manufacturing Services—2.2% | |
| TE Connectivity, Ltd. (c) | | | 2,629,500 | | | | 91,559,190 | | |
| Health Care Equipment—4.9% | |
| Medtronic, Inc. | | | 2,100,000 | | | | 82,635,000 | | |
| Covidien PLC (c) | | | 1,540,000 | | | | 79,987,600 | | |
| Baxter International, Inc. | | | 750,000 | | | | 40,327,500 | | |
| | | | 202,950,100 | | |
| Home Improvement Retail—1.9% | |
| The Home Depot, Inc. | | | 2,131,500 | | | | 78,993,390 | | |
| Housewares & Specialties—1.8% | |
| Fortune Brands, Inc. | | | 1,220,000 | | | | 75,505,800 | | |
| Hypermarkets & Super Centers—1.6% | |
| Wal-Mart Stores, Inc. | | | 1,270,000 | | | | 66,103,500 | | |
| Industrial Conglomerates—3.0% | |
| Tyco International, Ltd. (c) | | | 1,600,000 | | | | 71,632,000 | | |
| 3M Co. | | | 540,000 | | | | 50,490,000 | | |
| | | | 122,122,000 | | |
| Industrial Machinery—1.4% | |
| Illinois Tool Works, Inc. | | | 1,075,000 | | | | 57,749,000 | | |
| Integrated Oil & Gas—3.2% | |
| Cenovus Energy, Inc. (c) | | | 1,930,000 | | | | 76,003,400 | | |
| Exxon Mobil Corp. | | | 660,000 | | | | 55,525,800 | | |
| | | | 131,529,200 | | |
| Internet Software & Services—1.9% | |
| eBay, Inc. (a) | | | 2,540,000 | | | | 78,841,600 | | |
OAKMARK FUND
10
OAKMARK FUND
Schedule of Investments—March 31, 2011 (Unaudited) cont.
Name | |
Shares Held | |
Value | |
| Common Stocks—94.7% (cont.) | |
| Life & Health Insurance—1.5% | |
| Aflac, Inc. | | | 1,200,000 | | | $ | 63,336,000 | | |
| Motorcycle Manufacturers—1.8% | |
| Harley-Davidson, Inc. | | | 1,712,000 | | | | 72,742,880 | | |
| Movies & Entertainment—4.6% | |
| Viacom, Inc., Class B | | | 1,839,745 | | | | 85,584,938 | | |
| Time Warner, Inc. | | | 1,942,566 | | | | 69,349,606 | | |
| The Walt Disney Co. | | | 850,000 | | | | 36,626,500 | | |
| | | | 191,561,044 | | |
| Oil & Gas Exploration & Production—1.1% | |
| Encana Corp. (c) | | | 1,340,000 | | | | 46,270,200 | | |
| Other Diversified Financial Services—2.9% | |
| JPMorgan Chase & Co. | | | 1,630,000 | | | | 75,143,000 | | |
| Bank of America Corp. | | | 3,471,000 | | | | 46,268,430 | | |
| | | | 121,411,430 | | |
| Packaged Foods & Meats—2.0% | |
| Unilever PLC (b) | | | 2,100,000 | | | | 64,302,000 | | |
| H.J. Heinz Co. | | | 400,000 | | | | 19,528,000 | | |
| | | | 83,830,000 | | |
| Pharmaceuticals—6.2% | |
| Bristol-Myers Squibb Co. | | | 2,650,000 | | | | 70,039,500 | | |
| Merck & Co., Inc. | | | 2,071,535 | | | | 68,381,370 | | |
| GlaxoSmithKline PLC (b) | | | 1,565,000 | | | | 60,111,650 | | |
| Johnson & Johnson | | | 980,000 | | | | 58,065,000 | | |
| | | | 256,597,520 | | |
| Property & Casualty Insurance—1.7% | |
| Allstate Corp. | | | 2,200,000 | | | | 69,916,000 | | |
| Restaurants—1.6% | |
| McDonald's Corp. | | | 869,000 | | | | 66,122,210 | | |
| Semiconductor Equipment—2.1% | |
| Applied Materials, Inc. | | | 5,450,000 | | | | 85,129,000 | | |
| Semiconductors—4.1% | |
| Texas Instruments, Inc. | | | 2,650,000 | | | | 91,584,000 | | |
| Intel Corp. | | | 3,850,000 | | | | 77,654,500 | | |
| | | | 169,238,500 | | |
OAKMARK FUND
11
OAKMARK FUND
Schedule of Investments—March 31, 2011 (Unaudited) cont.
Name | | Shares Held/
Par Value | |
Value | |
| Common Stocks—94.7% (cont.) | |
| Specialized Consumer Services—1.4% | |
| H&R Block, Inc. | | | 3,428,600 | | | $ | 57,394,764 | | |
| Systems Software—3.6% | |
| Oracle Corp. | | | 2,450,000 | | | | 81,756,500 | | |
| Microsoft Corp. | | | 2,650,000 | | | | 67,204,000 | | |
| | | | 148,960,500 | | |
| Total Common Stocks (Cost: $2,617,659,879) | | | | $ | 3,913,294,935 | | |
| Short Term Investment—5.4% | |
| Repurchase Agreement—5.4% | |
Fixed Income Clearing Corp. Repurchase Agreement,
0.05% dated 3/31/2011 due 4/1/2011,
repurchase price $221,440,087, collateralized by
a Federal Home Loan Bank Bond, with
a rate of 1.375%, with a maturity of 6/8/2012, and
with a fair value plus accrued interest of $96,425,000,
and by Federal Home Loan Mortgage Corp. Bonds,
with rates from 1.750% - 5.125%, with maturities
from 6/15/2012 - 7/15/2012 and with an aggregate
fair value plus accrued interest of $87,946,688 and by
a Federal National Mortgage Association Bond,
with a rate of 0.500%, with a maturity of 10/30/2012,
and with a fair value plus accrued interest of $17,478,125,
and by a United States Treasury Note, with a rate of
0.750%, with a maturity of 5/31/2012, and with a
fair value plus accrued interest of $24,024,219
(Cost: $221,439,779) | | $ | 221,439,779 | | | | 221,439,779 | | |
| Total Short Term Investment (Cost: $221,439,779) | | | | $ | 221,439,779 | | |
| Total Investments (Cost: $2,839,099,658)—100.1% | | | | | 4,134,734,714 | | |
| Liabilities In Excess Of Other Assets—(0.1)% | | | | | (2,980,714 | ) | |
| Total Net Assets—100% | | | | $ | 4,131,754,000 | | |
(a) Non-income producing security.
(b) Represents a Sponsored American Depositary Receipt.
(c) Represents a foreign domiciled corporation.
See accompanying Notes to Financial Statements.
OAKMARK FUND
12
OAKMARK SELECT FUND
Report from Bill Nygren and Henry Berghoef, Portfolio Managers


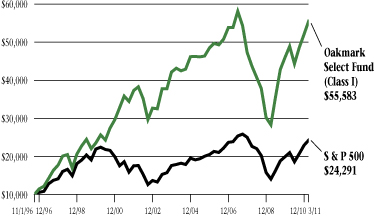
THE VALUE OF A $10,000 INVESTMENT IN OAKMARK SELECT FUND FROM ITS INCEPTION (11/1/96) TO PRESENT (3/31/11) AS COMPARED TO THE STANDARD & POOR'S 500 INDEX4 (UNAUDITED)
| | | | | Average Annual Total Returns
(as of 3/31/11) | |
| (Unaudited) | | Total Return
Last 3 Months* | | 1-year | | 5-year | | 10-year | | Since
Inception
(11/1/96) | |
Oakmark Select Fund
(Class I) | | | 6.52 | % | | | 13.43 | % | | | 2.24 | % | | | 5.41 | % | | | 12.64 | % | |
| S&P 500 Index | | | 5.92 | % | | | 15.65 | % | | | 2.62 | % | | | 3.29 | % | | | 6.35 | % | |
Lipper Multi-Cap
Value Index7 | | | 6.95 | % | | | 15.37 | % | | | 1.27 | % | | | 4.53 | % | | | 6.66 | % | |
The graph and table do not reflect the deduction of taxes that a shareholder would pay on Fund distributions or the redemption of Fund shares.
The expense ratio for Class I shares as of 9/30/10 was 1.08%
Past Performance is no guarantee of future results. The performance data quoted represents past performance. Current performance may be lower or higher than the performance data quoted. The investment return and principal value vary so that an investor's shares when redeemed may be worth more or less than the original cost. The performance of the Fund does not reflect the 2% redemption fee imposed on shares redeemed within 90 days of purchase. To obtain the most recent month-end performance data, visit oakmark.com.
* Not annualized
The Oakmark Select Fund increased in value by 7% for the quarter ended March 31, 2011. That was a good return for just three months, and it also exceeded the 6% return achieved by the S&P 500.
Fourteen of the Fund's holdings increased by more than 5%, and only one lost that much. Best Buy was that one, falling 16% after also being one of our poor performers in the prior quarter. The company has strung together several months of disappointing sales. The bulls believe that the stock, now selling at eight to nine times projected earnings (compared to about 13 times for the S&P 500), has gone from undervalued to greatly undervalued. The bears believe Best Buy is a disadvantaged competitor to Wal-Mart and Amazon. We agree with the bulls and believe that even if Best Buy loses market share, it can use excess capital to repurchase shares, which would allow the company to achieve above-average per-share earnings growth.
On the positive side of the portfolio, we had five stocks that gained more than Best Buy lost: DirecTV (+17%), Calpine and Cenovus (+19% each), Capital One (+22%) and the best performer, H&R Block (+42%).
Block has appeared on our "Biggest Loser" list several times in the past year, but unlike the TV show, that's not the goal. Investors have been concerned about lingering liabilities from the Option One subprime mortgage business that Block shut down in 2007, as well as regulatory efforts to stop refund anticipation loans (RALs) and the growing trend of taxpayers preparing their returns online. We believe that online preparers are largely converts from pen-and-paper preparation, that RALs are a very small part of Block's income, and that the mortgage liabilities are not going to spiral out of control. One of the few positives in acknowledging that one is a subprime lender is that, unlike the so-called prime lenders, the buyers of Block's mortgages can't now come back claiming they were shocked to discover the loans were indeed subprime. During the quarter, Block reported good early-season tax results and also reported another quarter of relatively small mortgage losses. We think Block's new management is doing a terrific job.
During the quarter, we sold our Western Union shares to fund a purchase of MasterCard. We believe MasterCard, which has been achieving strong revenue and earnings growth, will continue to benefit from the global trend in spending toward using plastic instead of paper.
William C. Nygren, CFA
Portfolio Manager
oaklx@oakmark.com | | Henry R. Berghoef, CFA
Portfolio Manager
oaklx@oakmark.com | |
|
March 31, 2011
OAKMARK SELECT FUND
13
OAKMARK SELECT FUND
Schedule of Investments—March 31, 2011 (Unaudited)
Name | |
Shares Held | |
Value | |
| Common Stocks—95.0% | |
| Broadcasting—7.9% | |
| Discovery Communications, Inc., Class C (a) | | | 6,009,500 | | | $ | 211,594,495 | | |
| Cable & Satellite—9.2% | |
| Comcast Corp., Class A | | | 5,950,000 | | | | 138,159,000 | | |
| DIRECTV, Class A (a) | | | 2,297,949 | | | | 107,544,014 | | |
| | | | 245,703,014 | | |
| Catalog Retail—6.0% | |
| Liberty Media Corp. - Interactive, Class A (a) | | | 10,000,000 | | | | 160,400,000 | | |
| Computer & Electronics Retail—3.2% | |
| Best Buy Co., Inc. | | | 3,000,000 | | | | 86,160,000 | | |
| Computer Hardware—3.9% | |
| Dell, Inc. (a) | | | 7,113,000 | | | | 103,209,630 | | |
| Consumer Finance—4.4% | |
| Capital One Financial Corp. | | | 2,250,000 | | | | 116,910,000 | | |
| Data Processing & Outsourced Services—3.8% | |
| MasterCard, Inc., Class A | | | 400,000 | | | | 100,688,000 | | |
| Electronic Manufacturing Services—6.1% | |
| TE Connectivity, Ltd. (b) | | | 4,667,838 | | | | 162,534,119 | | |
| Health Care Equipment—4.1% | |
| Medtronic, Inc. | | | 2,800,000 | | | | 110,180,000 | | |
| Independent Power Producers & Energy Traders—4.7% | |
| Calpine Corp. (a) | | | 7,854,600 | | | | 124,652,502 | | |
| Integrated Oil & Gas—4.8% | |
| Cenovus Energy, Inc. (b) | | | 3,224,800 | | | | 126,992,624 | | |
| Internet Software & Services—4.2% | |
| eBay, Inc. (a) | | | 3,650,000 | | | | 113,296,000 | | |
| Movies & Entertainment—4.0% | |
| Time Warner, Inc. | | | 2,960,666 | | | | 105,695,776 | | |
| Oil & Gas Exploration & Production—4.5% | |
| Newfield Exploration Co. (a) | | | 1,580,000 | | | | 120,095,800 | | |
OAKMARK SELECT FUND
14
OAKMARK SELECT FUND
Schedule of Investments—March 31, 2011 (Unaudited) cont.
Name | | Shares Held/
Par Value | |
Value | |
| Common Stocks—95.0% (cont.) | |
| Other Diversified Financial Services—7.4% | |
| JPMorgan Chase & Co. | | | 2,494,000 | | | $ | 114,973,400 | | |
| Bank of America Corp. | | | 6,195,100 | | | | 82,580,683 | | |
| | | | 197,554,083 | | |
| Pharmaceuticals—4.1% | |
| Bristol-Myers Squibb Co. | | | 4,110,200 | | | | 108,632,586 | | |
| Semiconductors—8.7% | |
| Texas Instruments, Inc. | | | 3,800,000 | | | | 131,328,000 | | |
| Intel Corp. | | | 5,047,000 | | | | 101,797,990 | | |
| | | | 233,125,990 | | |
| Specialized Consumer Services—4.0% | |
| H&R Block, Inc. | | | 6,469,600 | | | | 108,301,104 | | |
| Total Common Stocks (Cost: $1,769,044,490) | | | | $ | 2,535,725,723 | | |
| Short Term Investment—4.4% | |
| Repurchase Agreement—4.4% | |
Fixed Income Clearing Corp. Repurchase
Agreement, 0.05% dated 3/31/2011 due 4/1/2011,
repurchase price $117,210,898, collateralized by
a Federal Home Loan Mortgage Corp. Bond, with
a rate of 4.500%, with a maturity of 7/15/2013,
and with a fair value plus accrued interest
of $119,558,106, (Cost: $117,210,735) | | $ | 117,210,735 | | | | 117,210,735 | | |
| Total Short Term Investment (Cost: $117,210,735) | | | | $ | 117,210,735 | | |
| Total Investments (Cost: $1,886,255,225)—99.4% | | | | | 2,652,936,458 | | |
| Other Assets In Excess Of Liabilities—0.6% | | | | | 16,068,287 | | |
| Total Net Assets—100% | | | | $ | 2,669,004,745 | | |
(a) Non-income producing security.
(b) Represents a foreign domiciled corporation.
See accompanying Notes to Financial Statements.
OAKMARK SELECT FUND
15
OAKMARK EQUITY AND INCOME FUND
Report from Clyde S. McGregor and Edward A. Studzinski, Portfolio Managers


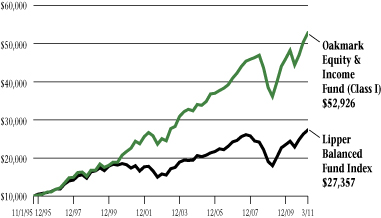
THE VALUE OF A $10,000 INVESTMENT IN OAKMARK EQUITY AND INCOME FUND FROM ITS INCEPTION (11/1/95) TO PRESENT (3/31/11) AS COMPARED TO THE LIPPER BALANCED FUND INDEX8 (UNAUDITED)
| | | | | Average Annual Total Returns
(as of 3/31/11) | |
| (Unaudited) | | Total Return
Last 3 Months* | | 1-year | | 5-year | | 10-year | | Since
Inception
(11/1/95) | |
Oakmark Equity &
Income Fund (Class I) | | | 4.69 | % | | | 9.49 | % | | | 6.97 | % | | | 8.87 | % | | | 11.42 | % | |
Lipper Balanced
Fund Index | | | 3.90 | % | | | 11.96 | % | | | 4.04 | % | | | 4.64 | % | | | 6.75 | % | |
| S&P 500 Index4 | | | 5.92 | % | | | 15.65 | % | | | 2.62 | % | | | 3.29 | % | | | 7.37 | % | |
Barclays Capital
U.S. Govt./Credit9 | | | 0.28 | % | | | 5.26 | % | | | 5.83 | % | | | 5.53 | % | | | 6.02 | % | |
The graph and table do not reflect the deduction of taxes that a shareholder would pay on Fund distributions or the redemption of Fund shares.
The expense ratio for Class I shares as of 9/30/10 was 0.79%
Past Performance is no guarantee of future results. The performance data quoted represents past performance. Current performance may be lower or higher than the performance data quoted. The investment return and principal value vary so that an investor's shares when redeemed may be worth more or less than the original cost. To obtain the most recent month-end performance data, visit oakmark.com.
* Not annualized
Quarter Review
We are happy to report a return to the Equity and Income Fund in the March quarter almost identical to that which we reported last year at this time. Similar to one year ago, the Fund's 5% return slightly bested the 4% number that Lipper Analytics reported for its Balanced Fund Index. Once again, the Fund's equities provided the bulk of the return, gaining nearly 7% in the period. Fixed-income investments recorded positive but minimal returns. For the first six months of the Fund's fiscal year, the comparative numbers are 12% for the Fund and 10% for the Lipper Balanced Fund Index. Always of greatest importance is the comparison for the annualized rates of return since the Fund's inception in 1995: 11% for the Fund versus 7% for the Lipper Balanced Fund Index.
It is somewhat curious that investment outcomes have been so similar for the first quarters of the past two years. The problems that we highlighted in our letter to shareholders one year ago still persist, in particular the financial distress in countries on the European periphery (Portugal, Ireland, Greece and Spain). And, of course, all readers will be well aware of the March quarter's world-changing events. Despite the world's tragedies and problems, many businesses continue to add value, and increasing stock prices reflect this reality.
The recent quarter's leading contributors to the Fund's return were Cenovus Energy, Rockwell Automation, Concho Resources, United Health and ITT. While this is a more eclectic winner's list than often emerges, the one commonality is that two of the top three contributors are oil/gas exploration and development concerns. This probably does not surprise anyone who has purchased gasoline recently. As we have often written, when we buy shares of a commodity producer, we attempt to do so at a share price that gives us free optionality. What this means is that we wish to own the company's shares at a valuation that would be attractive if the price of the commodity it produces never changed from the moment of our purchase. The markets occasionally afford us such opportunities, and they often prove to be rewarding for our shareholders (examples of this include the Fund's previous history with Burlington Resources and XTO Energy).
Cenovus is one of the leading participants in what is probably the largest petrocarbon resource deposit located in a friendly, stable country. Extracting oil from Alberta, Canada's oil sands is expensive, so Cenovus' shares generally benefit more from rising oil prices than most other energy producers. In contrast, Concho Resources concentrates on exploiting old fields in the continental U.S. Techniques used decades ago in oil/gas exploration could only remove a modest percentage of the underground resource. Today's techniques allow for additional oil/gas recovery with considerably lessened dry-hole risk.
OAKMARK EQUITY AND INCOME FUND
16
Leaving energy, Rockwell Automation, which manufactures devices such as variable-speed motor controls and programmable logic controllers, and ITT, a diversified manufacturer of products for the water and defense industries, both appear to have benefited from the renaissance in U.S. industrial production. Finally, United Health's shares have risen as investors appear to be reassessing last year's health-care legislation. We always state that we will consider investing in any legal industry as long as the valuation opportunity is compelling. Heretofore we had avoided the managed-care industry, but share-price declines in the sector and uncertainty from 2010's health-care bill offered an attractive entry point for purchasing United Health shares.
The quarter's largest detractors were Cisco Systems, Microsoft, Nestle, Boston Scientific and Scripps Network Interactive. We clearly have covered ourselves with something other than glory with our investments in large-capitalization technology companies. Cisco continues to suffer profit-margin erosion because of price pressure from newly invigorated competitors. Microsoft's problems appear to be more strategic, and we exited the stock. The actual price declines for Nestle, Boston Scientific and Scripps were modest. The earthquakes in New Zealand and Japan have increased volatility in the shares of PartnerRe, a Bermuda-based reinsurance company. While the company will likely have to make significant payouts to its clients, the long-term impact on business value is less clear.
We kept the Fund's equity allocation fairly constant in the quarter, but we continued to reduce the fixed-income allocation. The biggest change was a reduction in inflation-indexed securities (TIPS), which resulted when we did not replace a significant January maturity. The fixed-income duration remained flat at just over two years, meaning that this portion of the portfolio should have little sensitivity to interest-rate movement. We continue to believe that fixed-income investments are riskier than normal. Some readers may be familiar with Pimco's Bill Gross and his critique of U.S. Treasury issues. We agree with Gross that unless entitlement spending patterns change substantially, the long-term outlook for government debt is unpleasant. Accordingly, we have oriented the Fund to an above-normal equity allocation and a below-normal fixed-income commitment.
Transaction Activity
Although we kept the equity allocation fairly constant during the quarter, we were quite active overall. We eliminated eight holdings, initiated two new positions and added to holdings that began the quarter with small position sizes.
Beginning with the sales, we have already discussed Microsoft, and Del Monte was bought out during the quarter. Diebold, Kirby, Rockwell Collins and Weight Watchers International either exceeded, met or approached our sell targets. We sold Unilever (Great Britain shares) to reduce the Fund's sensitivity to commodity prices. We sold Covidien to reduce our large weighting in health care. These holdings were all profitable for the Fund. Weight Watchers was a particularly outstanding holding, more than doubling in price in only one year's time.
Our two new purchases were Pepsico and Range Resources. Pepsico is probably well-known to most shareholders, although the fact that the company is more of a food business (Frito-Lay) than a beverage business is often overlooked. Sluggish beverage growth in North America has helped to constrain the share price for the past year. Rising commodity prices have also reduced investor enthusiasm for the company. We believe that the share price more than discounts the headwinds facing Pepsico. We also like what we view as management's shareholder-friendly orientation. Range Resources is an exploration and production company focused on natural gas, mostly in Appalachia and the Southwestern U.S. In our opinion, Range's operating and finding costs are well below average, and the company shows rapid growth in production as well as proven reserves. We believe that at our purchase price, the stock traded at a substantial discount to the company's asset value net of debt.
Risk On/Risk Off?
The Equity and Income Fund's managers have both worked in the investment industry for many decades, so we both should be at the point in our careers where dubious financial-industry innovations no longer surprise us. Such an assumption, however, would be incorrect.
For the past few quarters we have repeatedly read that the daily outcomes in the securities markets are the result of the "Risk On/Risk Off" trade, wherein investors (sic?) react to the most recent news by buying equities/selling bonds (Risk On) or the reverse (Risk Off). As value investors we think this is pure nonsense. A single day's events and data rarely affect the ability of a business to generate free-cash flow over the long term, and it is that sustained free-cash flow that we deem most important for investments. That said, we believe it is advantageous for us to have these Risk On/Risk Off traders in the market. They treat equities like commodities, using stocks to express a short-term belief about the market. It appears that their security selections have no foundation in fundamental business value. They are more than happy to sell when stocks are cheap or buy when they are expensive, as long as they can express their near-term market opinion. It is this sort of market action that makes it possible for value investors like us to prosper. If stock prices perfectly predicted the value of every business, value investors would be unemployed, so let's hear it for the Risk On/Risk Off trade!
The recent quarter has certainly demonstrated just how dangerous the world can be, and shareholders have expressed interest in the portfolio effects from these events. Turning first to the Middle East and North Africa, our work suggests that the portfolio has had little direct exposure to the turmoil there. One possible exception is our stake in Apache, the diversified energy company that has significant investments in western Egypt. However, this area has not seen any disruption to date. The widespread efforts to effect government change have also caused oil prices to increase. While a negative for economic activity in total, rising oil prices have helped the Fund's six energy-industry investments.
OAKMARK EQUITY AND INCOME FUND
17
In contrast, the impact from Japan's great earthquake will be felt across more companies and industries. The first Fund holding to disclose a problem was Texas Instruments, which has several Japanese factories. The company estimates that it could take approximately six months for its operations to return to normal there. We have already mentioned PartnerRe, the reinsurance company, in the opening section. TE Connectivity, the new name for Tyco Electronics, expects some setbacks in its sales pattern, especially in relation to the automotive industry. No doubt other companies will soon make similar announcements. We do not expect the cumulative economic effects from these events to significantly change our understanding of these companies' intrinsic values. We do send our best wishes and hopes for all who have been or remain in harm's way and look forward to more peaceful times.
We thank our shareholders for entrusting us with their assets. As always, we invite your questions and comments.
Clyde S. McGregor, CFA
Portfolio Manager
oakbx@oakmark.com | | Edward A. Studzinski, CFA
Portfolio Manager
oakbx@oakmark.com | |
|
March 31, 2011
OAKMARK EQUITY AND INCOME FUND
18
OAKMARK EQUITY AND INCOME FUND
Schedule of Investments—March 31, 2011 (Unaudited)
Name | |
Shares Held | |
Value | |
| Common Stocks—67.9% | |
| Aerospace & Defense—9.6% | |
| General Dynamics Corp. | | | 8,100,000 | | | $ | 620,136,000 | | |
| ITT Corp. | | | 8,000,000 | | | | 480,400,000 | | |
| L-3 Communications Holdings, Inc. | | | 5,400,000 | | | | 422,874,000 | | |
| Goodrich Corp. | | | 4,293,700 | | | | 367,240,161 | | |
| Teledyne Technologies, Inc. (a) | | | 1,097,314 | | | | 56,742,107 | | |
| | | | 1,947,392,268 | | |
| Apparel Retail—1.8% | |
| The TJX Cos., Inc. | | | 6,000,000 | | | | 298,380,000 | | |
| Foot Locker, Inc. | | | 3,000,000 | | | | 59,160,000 | | |
| | | | 357,540,000 | | |
| Application Software—0.2% | |
| Mentor Graphics Corp. (a) | | | 3,173,749 | | | | 46,431,948 | | |
| Broadcasting—1.7% | |
| Scripps Networks Interactive, Inc., Class A | | | 7,000,000 | | | | 350,630,000 | | |
| Catalog Retail—0.1% | |
| HSN, Inc. (a) | | | 724,470 | | | | 23,204,774 | | |
| Communications Equipment—0.7% | |
| Cisco Systems, Inc. | | | 8,100,000 | | | | 138,915,000 | | |
| Arris Group, Inc. (a) | | | 552,700 | | | | 7,041,398 | | |
| | | | 145,956,398 | | |
| Construction Materials—0.5% | |
| Martin Marietta Materials, Inc. | | | 1,215,528 | | | | 108,996,396 | | |
| Data Processing & Outsourced Services—1.8% | |
| MasterCard, Inc., Class A | | | 796,358 | | | | 200,459,236 | | |
| Broadridge Financial Solutions, Inc. (b) | | | 6,900,000 | | | | 156,561,000 | | |
| | | | 357,020,236 | | |
| Distillers & Vintners—2.5% | |
| Diageo PLC (c) | | | 6,665,100 | | | | 508,013,922 | | |
| Diversified Metals & Mining—2.0% | |
| Walter Energy, Inc. (b) | | | 3,000,000 | | | | 406,290,000 | | |
| Drug Retail—1.4% | |
| CVS Caremark Corp. | | | 8,500,000 | | | | 291,720,000 | | |
| Electrical Components & Equipment—1.7% | |
| Rockwell Automation Inc. | | | 3,609,600 | | | | 341,648,640 | | |
OAKMARK EQUITY AND INCOME FUND
19
OAKMARK EQUITY AND INCOME FUND
Schedule of Investments—March 31, 2011 (Unaudited) cont.
Name | |
Shares Held | |
Value | |
| Common Stocks—67.9% (cont.) | |
| Electronic Manufacturing Services—0.8% | |
| TE Connectivity, Ltd. (d) | | | 4,444,202 | | | $ | 154,747,113 | | |
| Health Care Distributors—0.1% | |
| PharMerica Corp. (a) (b) | | | 1,810,000 | | | | 20,706,400 | | |
| Health Care Equipment—7.7% | |
| Hospira, Inc. (a) | | | 8,000,000 | | | | 441,600,000 | | |
| Varian Medical Systems, Inc. (a) | | | 5,700,000 | | | | 385,548,000 | | |
| Boston Scientific Corp. (a) | | | 42,073,500 | | | | 302,508,465 | | |
| CR Bard, Inc. | | | 1,990,241 | | | | 197,650,834 | | |
| Kinetic Concepts, Inc. (a) | | | 2,500,000 | | | | 136,050,000 | | |
| Steris Corp. | | | 2,873,300 | | | | 99,243,782 | | |
| | | | 1,562,601,081 | | |
| Health Care Services—2.7% | |
| Laboratory Corp. of America Holdings (a) | | | 4,935,000 | | | | 454,661,550 | | |
| Omnicare, Inc. | | | 3,400,000 | | | | 101,966,000 | | |
| | | | 556,627,550 | | |
| Home Furnishings—0.9% | |
| Mohawk Industries, Inc. (a) | | | 2,500,000 | | | | 152,875,000 | | |
| Leggett & Platt, Inc. | | | 1,327,656 | | | | 32,527,572 | | |
| | | | 185,402,572 | | |
| Home Improvement Retail—2.1% | |
| The Home Depot, Inc. | | | 11,500,000 | | | | 426,190,000 | | |
| Industrial Machinery—2.2% | |
| Flowserve Corp. | | | 2,200,000 | | | | 283,360,000 | | |
| Pentair, Inc. | | | 4,200,000 | | | | 158,718,000 | | |
| | | | 442,078,000 | | |
| Integrated Oil & Gas—4.1% | |
| Cenovus Energy, Inc. (d) | | | 21,100,000 | | | | 830,918,000 | | |
| Life Sciences Tools & Services—0.4% | |
| PerkinElmer, Inc. | | | 3,500,000 | | | | 91,945,000 | | |
| Managed Health Care—2.2% | |
| UnitedHealth Group, Inc. | | | 10,000,000 | | | | 452,000,000 | | |
| Mortgage REITs—0.1% | |
| Walter Investment Management Corp. | | | 1,035,000 | | | | 16,694,550 | | |
| Office Services & Supplies—0.1% | |
| Mine Safety Appliances Co. | | | 300,000 | | | | 11,001,000 | | |
OAKMARK EQUITY AND INCOME FUND
20
OAKMARK EQUITY AND INCOME FUND
Schedule of Investments—March 31, 2011 (Unaudited) cont.
Name | | Shares Held/
Par Value | |
Value | |
| Common Stocks—67.9% (cont.) | |
| Oil & Gas Drilling—0.4% | |
| Patterson-UTI Energy, Inc. | | | 2,600,000 | | | $ | 76,414,000 | | |
| Oil & Gas Exploration & Production—6.0% | |
| Apache Corp. | | | 4,530,000 | | | | 593,067,600 | | |
| Concho Resources, Inc. (a) | | | 3,750,000 | | | | 402,375,000 | | |
| Range Resources Corp. | | | 2,480,000 | | | | 144,980,800 | | |
| Ultra Petroleum Corp. (a) | | | 1,775,000 | | | | 87,418,750 | | |
| | | | 1,227,842,150 | | |
| Packaged Foods & Meats—5.2% | |
| Nestle SA (c) (e) | | | 10,905,500 | | | | 625,125,071 | | |
| Sara Lee Corp. | | | 24,500,000 | | | | 432,915,000 | | |
| | | | 1,058,040,071 | | |
| Reinsurance—1.5% | |
| PartnerRe, Ltd. (b) (d) | | | 3,900,000 | | | | 309,036,000 | | |
| Semiconductors—1.7% | |
| Texas Instruments, Inc. | | | 10,300,000 | | | | 355,968,000 | | |
| Soft Drinks—1.2% | |
| PepsiCo., Inc. | | | 3,932,000 | | | | 253,260,120 | | |
| Specialized Finance—2.0% | |
| CME Group, Inc. | | | 1,323,677 | | | | 399,154,799 | | |
| Specialty Stores—0.8% | |
| Tractor Supply Co. | | | 2,734,600 | | | | 163,693,156 | | |
| Tobacco—1.7% | |
| Philip Morris International, Inc. | | | 5,150,000 | | | | 337,994,500 | | |
| Total Common Stocks (Cost: $9,883,340,823) | | | | $ | 13,817,158,644 | | |
| Fixed Income—23.3% | |
| Asset Backed Securities—0.1% | |
| Airlines—0.1% | |
Delta Air Lines Series 2001-1 Class A-2 Pass Through Trust,
7.111%, due 3/18/2013 | | $ | 14,160,000 | | | $ | 14,584,800 | | |
| Convertible Debt—0.3% | |
| Health Care Equipment—0.3% | |
| Medtronic, Inc., 1.50%, due 4/15/2011 | | | 52,493,000 | | | | 52,493,000 | | |
OAKMARK EQUITY AND INCOME FUND
21
OAKMARK EQUITY AND INCOME FUND
Schedule of Investments—March 31, 2011 (Unaudited) cont.
Name | | Par Value | |
Value | |
| Fixed Income—23.3% (cont.) | |
| Corporate Bonds—0.2% | |
| Paper Packaging—0.1% | |
| Sealed Air Corp., 144A, 5.625%, due 7/15/2013 (f) | | $ | 18,740,000 | | | $ | 19,642,631 | | |
| Property & Casualty Insurance—0.0%(g) | |
| OneBeacon US Holdings, Inc., 5.875%, due 5/15/2013 | | | 10,000,000 | | | | 10,750,000 | | |
| Semiconductor Equipment—0.1% | |
| ASML Holding NV, 5.75%, due 6/13/2017 | | EUR | 9,660,000 | | | | 14,377,939 | | |
| Total Corporate Bonds (Cost: $36,262,666) | | | | $ | 44,770,570 | | |
| Government and Agency Securities—22.7% | |
| Canadian Government Bonds—0.2% | |
| Canadian Government Bond, 4.25%, due 12/1/2021 | | CAD | 35,446,000 | | | $ | 49,051,122 | | |
| New Zealand Government Bonds—0.1% | |
New Zealand Government Bond, 6.00%,
due 11/15/2011 | | NZD | 20,000,000 | | | | 15,579,544 | | |
| U.S. Government Agencies—4.2% | |
Federal National Mortgage Association, 0.273%,
due 11/23/2012 (h) | | $ | 100,000,000 | | | | 100,039,600 | | |
Federal Home Loan Mortgage Corp., 0.27%,
due 10/12/2012 (h) | | | 95,400,000 | | | | 95,425,758 | | |
| Federal Farm Credit Bank, 0.144%, due 2/22/2012 (h) | | | 93,700,000 | | | | 93,645,841 | | |
Federal National Mortgage Association, 0.273%,
due 8/23/2012 (h) | | | 80,000,000 | | | | 80,040,480 | | |
| Federal Farm Credit Bank, 0.276%, due 10/12/2012 (h) | | | 78,500,000 | | | | 78,534,226 | | |
| Federal Farm Credit Bank, 0.28%, due 11/5/2012 (h) | | | 50,000,000 | | | | 50,020,900 | | |
| Federal Farm Credit Bank, 0.23%, due 8/20/2012 (h) | | | 47,700,000 | | | | 47,691,176 | | |
| Federal Farm Credit Bank, 0.308%, due 6/26/2013 (h) | | | 42,950,000 | | | | 42,984,360 | | |
| Federal Farm Credit Bank, 0.298%, due 4/26/2013 (h) | | | 42,900,000 | | | | 42,931,832 | | |
| Federal Farm Credit Bank, 3.875%, due 11/13/2012 | | | 38,645,000 | | | | 40,617,402 | | |
| Federal Farm Credit Bank, 0.31%, due 12/6/2013 (h) | | | 28,500,000 | | | | 28,499,145 | | |
Federal Home Loan Mortgage Corp., 0.13%,
due 1/13/2012 (h) | | | 23,850,000 | | | | 23,834,211 | | |
| Federal Farm Credit Bank, 0.266%, due 6/12/2013 (h) | | | 23,720,000 | | | | 23,713,762 | | |
| Federal Farm Credit Bank, 0.294%, due 12/20/2013 (h) | | | 18,500,000 | | | | 18,493,414 | | |
| Federal Home Loan Bank, 1.25%, due 3/30/2015 (i) | | | 12,200,000 | | | | 12,251,972 | | |
| Federal Farm Credit Bank, 0.252%, due 4/12/2012 (h) | | | 11,400,000 | | | | 11,401,835 | | |
| Federal Farm Credit Bank, 3.85%, due 2/11/2015 | | | 9,415,000 | | | | 10,095,563 | | |
OAKMARK EQUITY AND INCOME FUND
22
OAKMARK EQUITY AND INCOME FUND
Schedule of Investments—March 31, 2011 (Unaudited) cont.
Name | | Par Value | |
Value | |
| Fixed Income—23.3% (cont.) | |
| U.S. Government Agencies—4.2% (cont.) | |
Federal Home Loan Mortgage Corp., 0.75%,
due 7/29/2013 (i) | | $ | 9,500,000 | | | $ | 9,503,173 | | |
Federal National Mortgage Association, 0.65%,
due 8/16/2013 (i) | | | 9,500,000 | | | | 9,502,736 | | |
Federal National Mortgage Association, 1.25%,
due 8/10/2015 (i) | | | 9,500,000 | | | | 9,480,782 | | |
| Federal Home Loan Bank, 2.00%, due 12/24/2014 (i) | | | 5,500,000 | | | | 5,591,746 | | |
Federal National Mortgage Association, 1.00%,
due 8/25/2015 (i) | | | 5,000,000 | | | | 5,002,175 | | |
Federal National Mortgage Association, 1.00%,
due 8/25/2014 (i) | | | 5,000,000 | | | | 4,971,075 | | |
| Federal Home Loan Bank, 2.00%, due 9/16/2015 (i) | | | 4,700,000 | | | | 4,773,602 | | |
Federal National Mortgage Association, 2.00%,
due 3/30/2016 (i) | | | 4,700,000 | | | | 4,737,581 | | |
| Federal Home Loan Bank, 1.375%, due 9/16/2013 (i) | | | 4,700,000 | | | | 4,720,078 | | |
Federal National Mortgage Association, 2.00%,
due 3/26/2015 (i) | | | 4,600,000 | | | | 4,701,034 | | |
Federal National Mortgage Association, 1.25%,
due 8/6/2015 (i) | | | 4,500,000 | | | | 4,503,515 | | |
| | | | 867,708,974 | | |
| U.S. Government Bonds—0.6% | |
United States Treasury Bond, 2.50%, due 1/15/2029 ,
Inflation Indexed | | | 102,557,000 | | | | 116,169,801 | | |
| U.S. Government Notes—17.6% | |
United States Treasury Note, 1.375%, due 7/15/2018 ,
Inflation Indexed | | | 510,550,000 | | | | 543,616,281 | | |
United States Treasury Note, 1.25%, due 7/15/2020 ,
Inflation Indexed | | | 504,825,000 | | | | 521,349,942 | | |
| United States Treasury Note, 2.875%, due 1/31/2013 | | | 483,005,000 | | | | 502,381,712 | | |
United States Treasury Note, 2.125%, due 1/15/2019 ,
Inflation Indexed | | | 384,588,750 | | | | 429,146,818 | | |
| United States Treasury Note, 1.125%, due 6/15/2013 | | | 250,000,000 | | | | 251,230,000 | | |
| United States Treasury Note, 0.375%, due 8/31/2012 | | | 125,000,000 | | | | 124,790,000 | | |
| United States Treasury Note, 1.50%, due 7/15/2012 | | | 100,000,000 | | | | 101,367,200 | | |
| United States Treasury Note, 1.375%, due 10/15/2012 | | | 100,000,000 | | | | 101,226,600 | | |
| United States Treasury Note, 1.375%, due 11/15/2012 | | | 100,000,000 | | | | 101,226,600 | | |
| United States Treasury Note, 1.375%, due 9/15/2012 | | | 100,000,000 | | | | 101,222,700 | | |
| United States Treasury Note, 1.375%, due 5/15/2012 | | | 100,000,000 | | | | 101,113,300 | | |
| United States Treasury Note, 1.125%, due 12/15/2012 | | | 100,000,000 | | | | 100,789,100 | | |
| United States Treasury Note, 1.00%, due 4/30/2012 | | | 100,000,000 | | | | 100,691,000 | | |
| United States Treasury Note, 1.00%, due 3/31/2012 | | | 100,000,000 | | | | 100,668,000 | | |
OAKMARK EQUITY AND INCOME FUND
23
OAKMARK EQUITY AND INCOME FUND
Schedule of Investments—March 31, 2011 (Unaudited) cont.
Name | | Par Value | |
Value | |
| Fixed Income—23.3% (cont.) | |
| U.S. Government Notes—17.6% (cont.) | |
| United States Treasury Note, 1.00%, due 12/31/2011 | | $ | 100,000,000 | | | $ | 100,554,700 | | |
| United States Treasury Note, 0.875%, due 2/29/2012 | | | 100,000,000 | | | | 100,523,000 | | |
| United States Treasury Note, 0.875%, due 1/31/2012 | | | 100,000,000 | | | | 100,496,100 | | |
| United States Treasury Note, 0.625%, due 6/30/2012 | | | 100,000,000 | | | | 100,258,000 | | |
| | | | 3,582,651,053 | | |
Total Government and Agency Securities
(Cost: $4,544,683,700) | | | | $ | 4,631,160,494 | | |
| Total Fixed Income (Cost: $4,648,227,208) | | | | $ | 4,743,008,864 | | |
| Short Term Investments—9.5% | |
| Canadian Treasury Bills—2.9% | |
Canadian Treasury Bills, 1.12% - 1.42%,
due 6/9/2011 - 3/15/2012 (j) (Cost: $570,736,574) | | CAD | 575,000,000 | | | $ | 587,885,250 | | |
| Commercial Paper—1.7% | |
American Honda Finance Corp., 0.22%,
due 5/16/2011 (j) | | $ | 50,000,000 | | | | 49,983,965 | | |
BP Capital Markets PLC 144A, 0.23% - 0.24%,
due 5/27/2011 - 5/31/2011 (f) (j) | | | 66,500,000 | | | | 66,471,238 | | |
| Johnson & Johnson, 144A, 0.17%, due 4/21/2011 (f) (j) | | | 100,000,000 | | | | 99,991,830 | | |
| Toyota Motor Credit Corp., 0.16%, due 4/28/2011 (j) | | | 100,000,000 | | | | 99,988,000 | | |
Wellpoint, Inc. 144A, 0.26% - 0.32%,
due 4/12/2011 - 5/10/2011 (f) (j) | | | 30,000,000 | | | | 29,993,961 | | |
| Total Commercial Paper (Cost: $346,434,129) | | | | | 346,428,994 | | |
| U.S. Government Notes—1.5% | |
United States Treasury Notes, 0.28% - 0.32%,
due 9/30/2011 - 11/30/2011(j) | | | 300,000,000 | | | | 301,210,900 | | |
| Total U.S. Government Notes (Cost: $301,055,835) | | | | | 301,210,900 | | |
OAKMARK EQUITY AND INCOME FUND
24
OAKMARK EQUITY AND INCOME FUND
Schedule of Investments—March 31, 2011 (Unaudited) cont.
Name | | Par Value | |
Value | |
| Short Term Investments—9.5% (cont.) | |
| Repurchase Agreement—3.4% | |
Fixed Income Clearing Corp. Repurchase Agreement,
0.05% dated 3/31/2011 due 4/1/2011, repurchase
price $699,172,225, collateralized by a Federal
Home Loan Bank Bond, with a rate of 1.750%,
with a maturity of 12/14/2012, and with a fair
value plus accrued interest of $306,750,000 and by a
Federal Home Loan Mortgage Corp. Bond, with
a rate of 4.500%, with a maturity of 7/15/2013, and
with a fair value plus accrued interest of $1,672,825 and
by Federal National Mortgage Association Bonds,
with rates from 0.375% - 4.000%, with maturities from
10/30/2012 - 6/24/2013, and with an aggregate fair
value plus accrued interest of $404,733,006
(Cost: $699,171,254) | | $ | 699,171,254 | | | $ | 699,171,254 | | |
| Total Short Term Investments (Cost: $1,917,397,792) | | | | $ | 1,934,696,398 | | |
| Total Investments (Cost: $16,448,965,823)—100.7% | | | | | 20,494,863,906 | | |
| Liabilities In Excess Of Other Assets—(0.7)% | | | | | (136,160,600 | ) | |
| Total Net Assets—100% | | | | $ | 20,358,703,306 | | |
(a) Non-income producing security.
(b) See Note 5 in the Notes to the Financial Statements regarding investments in affiliated issuers.
(c) Represents a Sponsored American Depositary Receipt.
(d) Represents a foreign domiciled corporation.
(e) Fair value is determined in good faith in accordance with procedures established by the Board of Trustees.
(f) See Note 1 in the Notes to Financial Statements regarding restricted securities exempt from registration pursuant to Rule 144A under the Securities Act of 1933. These securities may be resold only in transactions exempt from registration, normally to qualified institutional buyers.
(g) Amount rounds to less than 0.1%
(h) Floating Rate Note. Rate shown is as of March 31, 2011.
(i) Step-Coupon.
(j) The rate shown represents the annualized yield at the time of purchase; not a coupon rate.
Key to abbreviations:
CAD: Canadian Dollar
EUR: Euro
NZD: New Zealand Dollar
See accompanying Notes to Financial Statements.
OAKMARK EQUITY AND INCOME FUND
25
OAKMARK GLOBAL FUND
Report from Clyde S. McGregor and Robert A. Taylor, Portfolio Managers


THE VALUE OF A $10,000 INVESTMENT IN OAKMARK GLOBAL FUND FROM ITS INCEPTION (8/4/99) TO PRESENT (3/31/11) AS COMPARED TO THE MSCI WORLD INDEX10 (UNAUDITED)
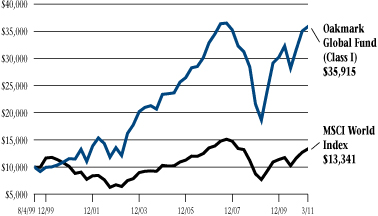
| | | | | Average Annual Total Returns
(as of 3/31/11) | |
| (Unaudited) | | Total Return
Last 3 Months* | | 1-year | | 5-year | | 10-year | | Since
Inception
(8/4/99) | |
Oakmark Global
Fund (Class I) | | | 2.36 | % | | | 11.07 | % | | | 4.86 | % | | | 12.08 | % | | | 11.59 | % | |
| MSCI World | | | 4.80 | % | | | 13.45 | % | | | 2.08 | % | | | 4.21 | % | | | 2.50 | % | |
| Lipper Global Fund Index11 | | | 4.88 | % | | | 15.18 | % | | | 3.04 | % | | | 5.08 | % | | | 4.24 | % | |
The graph and table do not reflect the deduction of taxes that a shareholder would pay on Fund distributions or the redemption of Fund shares.
The expense ratio for Class I shares as of 9/30/10 was 1.15%
Past Performance is no guarantee of future results. The performance data quoted represents past performance. Current performance may be lower or higher than the performance data quoted. The investment return and principal value vary so that an investor's shares when redeemed may be worth more or less than the original cost. The performance of the Fund does not reflect the 2% redemption fee imposed on shares redeemed within 90 days of purchase. To obtain the most recent month-end performance data, visit oakmark.com.
* Not annualized
Quarter Review
After two consecutive strong quarters for the Oakmark Global Fund, the March quarter, although positive, proved to be a struggle. The Fund's three-month return was 2%, which compared to the nearly 5% that the MSCI World Index gained in the period. The return for the Lipper Global Fund Index was 5%. For the first six months of the Fund's fiscal year, the returns are 13% for the Global Fund, 14% for the MSCI World Index and 14% for the Lipper Global Fund Index. As always, we are most pleased to report the Fund's 12% compound annualized rate of return since inception.
The Fund's investments in Italy, Ireland and Germany were among the top contributors to the Fund's return in the quarter. Investments in Japan and Australia lost money in the period, and returns for U.S. holdings, while positive, were a significant drag on results relative to the MSCI World Index. Bulgari (Italy) was the lead contributor to return, as the company agreed to its acquisition by LVMH at a substantial premium. SAP (Germany) and Oracle (U.S.), competitors in enterprise software, both benefited from strength in that sector. Covidien (Ireland) enjoyed positive momentum as the health-care sector rebounded. Broad strength in the global industrial economy boosted the business and shares of Snap-on (U.S.).
It is quite understandable that the list of detractors includes two Japanese concerns—in fact, it would not have been surprising had Japanese companies completely populated that list. Both Canon and Daiwa Securities likely will suffer impacts of uncertain duration because of the tragic events of early March, but we do not expect the diminution of their business value to be permanent. New purchase Cisco Systems (U.S.) surprised investors (including us) with the details in its quarterly report. In particular, the company showed deteriorating profit margins, apparently the result of increased competition in several key markets. Primary Health Care (Australia) continues to struggle with pricing in its home market. Shares of Julius Baer (Switzerland) gave back some ground after a strong run.
For the fiscal six months, Italy, France and the U.K. were the leading contributors while Japan and Australia were among the top detractors to the Fund's return relative to the MSCI World Index. Spain was the only country to produce a small loss in the portfolio. The U.S. produced four
OAKMARK GLOBAL FUND
26
of the top five performers (Snap-on, Oracle, Sara Lee and Laboratory Corporation of America), with Italy's Bulgari the fifth. Square Enix (Japan), Cisco, Discovery Communications (U.S.), Canon and Credit Suisse (Switzerland) detracted from six-month return.
Portfolio Activity
The Oakmark Global Fund typically contains approximately 40 different equity holdings. During the March quarter, the Fund was fortunate to have 5% of its holdings (two issues, actually) attract takeover offers. We always attempt to invest in equities at prices we believe are well below the issuing company's intrinsic value per share. When an acquirer agrees with our assessment and offers a premium price for our holding, first we celebrate and then we get to the task of understanding how the acquisition price adds to our understanding of true business value in that industry.
Last quarter, we wrote about our experience with Del Monte and how the acquisition price for that company challenged our framework for valuing packaged-food products. Both deals this quarter challenge our thinking, but in opposite directions.
Sanofi-Aventis has agreed to acquire Fund holding Genzyme at a price that falls short of what we had calculated using our methodology for valuing biotechnology companies. We are grateful for the rapid increase in share price that Genzyme experienced for the Fund, but will continue to evaluate what the valuation implied in the takeover price means for similar businesses.
In contrast, the acquisition price for Italy's Bulgari exceeded our expectations for that business by close to 10%. Although, at first blush, the headline multiple of 25 times 2011 estimated operating profits appears to be quite high, we believe the price validates our belief that a rational investor would understand current earnings to be below trend. Weak consumer spending has depressed Bulgari's sales, turning the company's operating leverage negative. We initiated our position in Bulgari in July 2002—another period of depressed consumer activity, as consumers retrenched following 9/11. During the time we held the stock, Bulgari gave our shareholders a 17% annualized return, which compares favorably to the Fund's return of almost 12% and the MSCI World's return of less than 8%. We thank both Bulgari's and Genzyme's management teams for doing their best to represent their shareholders' interests in these negotiations.
We chose to sell both Genzyme and Bulgari before their tender offers became effective. Our only new purchase in the quarter was Cisco Systems. Cisco dominates the market for Internet protocol-based networking equipment, providing routers and switches used to direct data, voice and video traffic. Other products include remote access servers, IP telephony equipment, optical networking components, Internet conferencing systems, set-top boxes, and network service and security systems. Cisco sells primarily to large enterprises and telecommunications service providers, but it also targets small businesses and consumers with products such as routers, modems and home network management software. As noted in the beginning of this report, Cisco's shares have performed poorly since our purchase, but we remain confident in the long-term value of its franchise.
Japan
As we write this report, three weeks have passed since Japan's earthquake and tsunami occurred, and we still face uncertainties as we wait for more clarity at the Fukushima Daiichi nuclear plant. As someone who was in Tokyo on the day of the quake and tsunami, I (Rob) can tell you that I shared the fear that gripped the country as the ground shook and newscasters broadcast that a 30-foot wall of water was set to strike the coast only 30 minutes later. On behalf of the partners and employees at Harris Associates L.P., your managers would like to convey our deepest condolences to the people of Japan as they contend with their worst national disaster in generations.
Coverage of this disaster has been extensive, so we will not review the actual events. But we do think it is important to separate broader fears from business fundamentals, given that a significant portion of our portfolio is invested in Japanese-listed companies.
1. Nomura Securities estimates that electricity supply could fall about 5% to 10% short of demand because of power outages in the tsunami-affected areas during the 12 months ending March 31, 2012. A 10% shortfall could cause a 4.7% drop in pretax profits for all Japanese companies. Since new capacity likely will eventually make up for this shortfall, we think the 7% drop in the Topix12 (Japanese stock market index) from March 10 to April 1 seems excessive (never mind the almost 18% drop from March 10 to March 15), especially since we viewed Japanese companies, in general, to be inexpensive even before the quake.
2. It doesn't appear to us that the natural disaster has had a meaningful impact on the global economy. The Global PMI (purchasing managers' index) through the end of March remains strong at 55.8 (the level of 50 attempts to separate expansion from contraction). This reading is
OAKMARK GLOBAL FUND
27
consistent with global industrial production expanding by 5% to 6%; it would be higher excluding Japan.
3. Some of the reporting on radiation appears exaggerated. We are not nuclear experts and realize the situation remains unstable, but understandable concerns may be amplified by sensationalized headlines. For example, a March 31 headline in the Wall Street Journal read "Radiation Traces Found in U.S. Milk," but the article ends by saying "These findings are a miniscule amount compared to what people experience every day."13
4. Other than Daiwa Securities (3.8% holding in the Fund) and Meitec (0.5%), the Fund's other Japanese holdings have substantial non-Japanese revenues, profits and production capacity.
We cannot predict when the Japanese supply chain and electric capacity will return to full strength, just like we could not predict when developed economies would begin to grow again after the Great Recession but we don't think the Japanese economy is permanently impaired.
More importantly, we cannot predict how the stock market will react to shocks, whether natural or manmade. As always, we will focus on the intrinsic value of individual companies. In times of uncertainty, we have to return to our view that the fundamentals that drive intrinsic value do not emerge or disappear in one month, one quarter or even one year. Rather, we believe intrinsic value is determined by the present value of all future cash flows. We don't pretend that corporate earnings will be unaffected by rolling blackouts, supply chain issues, lower consumer consumption or a strong yen. We just view these as temporary factors and not secular trends that impair long-term fundamentals.
While Mr. Market focuses on the short term, positive secular changes continue and are being overlooked. Recently, Canon's management team held a meeting with analysts to give a mid-term outlook for their business. Management described margins and profitability that exceeded our forecasts, even with the yen at stronger levels than what we view as normal. In addition, management reiterated that excess capital will be returned to shareholders via dividends and share repurchases. Two days before the earthquake, Toyota announced a new mid-term plan focused on emerging-market growth, improved customer satisfaction and solid profitability. These initiatives reaffirm our mid-term outlook for Toyota's profitability and returns. Equally important is Toyota's plan to improve the speed of and accountability for decision-making by reducing the size of its board of directors from 27 members to 11. Honda has followed suit by cutting its board from 20 to 12 members. In a consensus-driven culture like Japan's, we expect other companies to follow the positive steps taken by these influential blue-chip companies to enhance shareholder value.
Currency Hedges
Because we believe the U.S. dollar remains undervalued relative to other currencies held in the Fund, we continue to hedge some of the Fund's currency exposure. At the recent quarter-end, we hedged approximately 53% of the Fund's Swiss franc, 56% of the Australian dollar and 53% of the Japanese yen exposure. We added a new hedge to our Swedish holdings and ended the quarter with 25% of the Fund's Swedish krona exposure hedged.
Please feel free to contact us with your questions or comments. Thank you for being our partners in the Oakmark Global Fund.
Clyde S. McGregor, CFA
Portfolio Manager
oakgx@oakmark.com | | Robert A. Taylor, CFA
Portfolio Manager
oakgx@oakmark.com | |
|
March 31, 2011
OAKMARK GLOBAL FUND
28
OAKMARK GLOBAL FUND
Global Diversification—March 31, 2011 (Unaudited)
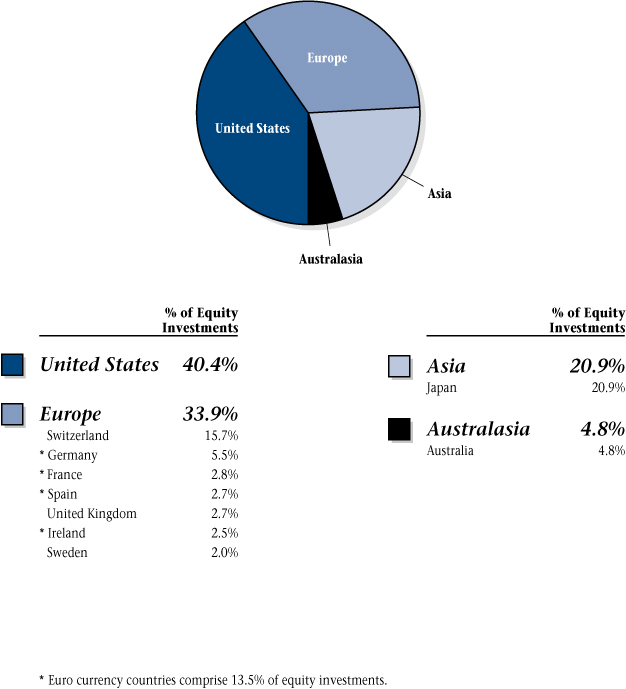
OAKMARK GLOBAL FUND
29
OAKMARK GLOBAL FUND
Schedule of Investments—March 31, 2011 (Unaudited)
| Name | | Description | | Shares Held | | Value | |
| Common Stocks—99.0% | |
| Apparel, Accessories & Luxury Goods—1.0% | |
Cie Financiere
Richemont
SA (Switzerland) | | Manufacturer & Retailer of
Luxury Goods | | | 425,000 | | | $ | 24,546,816 | | |
| Application Software—2.3% | |
| SAP AG (Germany) | | Develops Business Software | | | 979,000 | | | | 59,937,331 | | |
| Asset Management & Custody Banks—3.4% | |
Julius Baer Group, Ltd.
(Switzerland) | | Asset Management | | | 2,025,000 | | | | 87,878,606 | | |
| Automobile Manufacturers—4.2% | |
| Toyota Motor Corp. (Japan) | | Automobile Manufacturer | | | 1,888,500 | | | | 76,057,646 | | |
Daimler AG Registered
(Germany) | | Automobile Manufacturer | | | 439,000 | | | | 31,014,205 | | |
| | | | 107,071,851 | | |
| Broadcasting—3.8% | |
Discovery
Communications, Inc.,
Class C (United States) (a) | | Media Management &
Network Services | | | 1,768,250 | | | | 62,260,082 | | |
Societe Television
Francaise 1 (France) | | Broadcasting & Cable TV | | | 1,847,200 | | | | 33,914,257 | | |
| | | | 96,174,339 | | |
| Building Products—2.0% | |
Assa Abloy AB, Class B
(Sweden) | | Develops, Designs &
Manufactures Security Locks | | | 1,806,000 | | | | 51,931,906 | | |
| Communications Equipment—2.5% | |
Cisco Systems, Inc.
(United States) | | Data Networking Products | | | 3,656,500 | | | | 62,708,975 | | |
| Construction Materials—1.3% | |
Holcim, Ltd.
(Switzerland) | | Produces & Markets Ready-Mixed
Concrete, Cement, Clinker &
Admixtures | | | 447,000 | | | | 33,677,082 | | |
| Data Processing & Outsourced Services—2.2% | |
MasterCard, Inc., Class A
(United States) | | Transaction Processing Services | | | 222,900 | | | | 56,108,388 | | |
OAKMARK GLOBAL FUND
30
OAKMARK GLOBAL FUND
Schedule of Investments—March 31, 2011 (Unaudited) cont.
| Name | | Description | | Shares Held | | Value | |
| Common Stocks—99.0% (cont.) | |
| Distillers & Vintners—2.6% | |
Diageo PLC
(United Kingdom) | | Beverages, Wines & Spirits
Manufacturer | | | 3,545,000 | | | $ | 67,389,599 | | |
| Diversified Banks—2.7% | |
Banco Santander SA
(Spain) | | Retail, Commercial & Private
Banking & Asset Management
Services | | | 6,007,026 | | | | 69,739,755 | | |
| Diversified Capital Markets—5.3% | |
Credit Suisse Group
(Switzerland) | | Wealth Management &
Investment Banking | | | 1,954,900 | | | | 83,069,948 | | |
| UBS AG (Switzerland) (a) | | Wealth Management &
Investment Banking | | | 2,903,620 | | | | 52,097,613 | | |
| | | | 135,167,561 | | |
| Electronic Components—4.4% | |
Hirose Electric Co., Ltd.
(Japan) | | Develops & Sells Electronic
Equipment | | | 714,500 | | | | 76,964,655 | | |
| OMRON Corp. (Japan) | | Component, Equipment &
System Manufacturer | | | 1,285,500 | | | | 36,132,472 | | |
| | | | 113,097,127 | | |
| Electronic Manufacturing Services—2.5% | |
TE Connectivity, Ltd.
(Switzerland) | | Electronic Equipment,
Instruments & Components | | | 1,812,000 | | | | 63,093,840 | | |
| Fertilizers & Agricultural Chemicals—2.1% | |
Incitec Pivot, Ltd.
(Australia) | | Fertilizer Manufacturer &
Supplier | | | 11,993,300 | | | | 53,714,804 | | |
| Health Care Equipment—2.4% | |
| Covidien PLC (Ireland) | | Health Care Equipment & Supplies | | | 1,197,600 | | | | 62,203,344 | | |
| Health Care Services—6.8% | |
Laboratory Corp. of
America Holdings
(United States) (a) | | Medical Laboratory &
Testing Services | | | 1,165,900 | | | | 107,414,367 | | |
Primary Health Care, Ltd.
(Australia) | | Health Care Service Provider | | | 19,937,000 | | | | 68,052,040 | | |
| | | | 175,466,407 | | |
OAKMARK GLOBAL FUND
31
OAKMARK GLOBAL FUND
Schedule of Investments—March 31, 2011 (Unaudited) cont.
| Name | | Description | | Shares Held | | Value | |
| Common Stocks—99.0% (cont.) | |
| Home Entertainment Software—3.5% | |
Square Enix Holdings
Co., Ltd. (Japan) | | Develops & Sells Entertainment
Software for Video Game Consoles | | | 5,150,100 | | | $ | 89,405,439 | | |
| Human Resource & Employment Services—2.1% | |
| Adecco SA (Switzerland) | | Temporary Employment Services | | | 814,700 | | | | 53,574,175 | | |
| Industrial Conglomerates—1.9% | |
| Rheinmetall AG (Germany) | | Automotive Pump Manufacturer | | | 573,300 | | | | 47,505,731 | | |
| Industrial Machinery—4.8% | |
Snap-on, Inc.
(United States) | | Tool & Equipment Manufacturer | | | 2,064,300 | | | | 123,981,858 | | |
| Investment Banking & Brokerage—3.8% | |
Daiwa Securities
Group, Inc. (Japan) | | Stock Broker | | | 21,384,000 | | | | 98,204,953 | | |
| Movies & Entertainment—2.0% | |
Live Nation
Entertainment, Inc.
(United States) (a) | | Live Events Producer, Operator, &
Promoter | | | 5,134,632 | | | | 51,346,320 | | |
| Office Electronics—4.3% | |
| Canon, Inc. (Japan) | | Computers & Information | | | 1,658,200 | | | | 72,164,992 | | |
| Neopost SA (France) | | Mailroom Equipment Supplier | | | 428,650 | | | | 37,548,495 | | |
| | | | 109,713,487 | | |
| Oil & Gas Exploration & Production—2.6% | |
Apache Corp.
(United States) | | Oil & Natural Gas Exploration &
Production | | | 508,100 | | | | 66,520,452 | | |
| Packaged Foods & Meats—2.6% | |
Sara Lee Corp.
(United States) | | Manufactures & Markets Brand
Name Products for Consumers
Worldwide | | | 3,814,900 | | | | 67,409,283 | | |
| Railroads—2.4% | |
Union Pacific Corp.
(United States) | | Rail Transportation Provider | | | 635,400 | | | | 62,478,882 | | |
OAKMARK GLOBAL FUND
32
OAKMARK GLOBAL FUND
Schedule of Investments—March 31, 2011 (Unaudited) cont.
| Name | | Description | | Shares Held | | Value | |
| Common Stocks—99.0% (cont.) | | | |
| Research & Consulting Services—3.4% | | | |
Equifax, Inc.
| |
| (United States) | | Information Management, | | | |
| |
| | Transaction Processing, | | | |
| |
| | Direct Marketing & Customer | | | |
| |
| | Relationship Management | | | 1,899,500 | | | $ | 73,795,575 | | |
| Meitec Corp. (Japan) | | Software Engineering Services | | | 664,000 | | | | 13,283,193 | | |
| | | | 87,078,768 | | |
| Semiconductor Equipment—2.2% | | | |
Applied Materials, Inc.
(United States) | | Develops, Manufactures, Markets &
Services Semiconductor Wafer
Fabrication Equipment | | | 3,575,500 | | | | 55,849,310 | | |
| Semiconductors—5.3% | | | |
| ROHM Co., Ltd. (Japan) | | Integrated Circuits & Semiconductor
Devices Manufacturer | | | 1,109,000 | | | | 69,462,491 | | |
| Intel Corp. (United States) | | Computer Component
Manufacturer & Designer | | | 3,314,800 | | | | 66,859,516 | | |
| | | | 136,322,007 | | |
| Specialty Chemicals—2.0% | | | |
International Flavors &
Fragrances, Inc.
(United States) | | Manufactures Flavors & Fragrance
Products | | | 817,000 | | | | 50,899,100 | | |
| Systems Software—4.6% | | | |
Oracle Corp.
(United States) | | Software Services | | | 3,491,900 | | | | 116,524,703 | | |
| Total Common Stocks (Cost: $2,059,056,222) | | | | | | $ | 2,536,722,199 | | |
OAKMARK GLOBAL FUND
33
OAKMARK GLOBAL FUND
Schedule of Investments—March 31, 2011 (Unaudited) cont.
| Name | | Par Value | | Value | |
| Short Term Investment—1.5% | |
| Repurchase Agreement—1.5% | |
Fixed Income Clearing Corp. Repurchase Agreement,
0.05% dated 3/31/2011 due 4/1/2011, repurchase
price $38,450,621, collateralized by a Federal National
Mortgage Association Bond, with a rate of 0.800%,
with a maturity of 11/18/2013, and with a fair value
plus accrued interest of $39,223,713 (Cost: $38,450,568) | | $ | 38,450,568 | | | $ | 38,450,568 | | |
| Total Short Term Investment (Cost: $38,450,568) | | | | $ | 38,450,568 | | |
| Total Investments (Cost: $2,097,506,790)—100.5% | | | | | 2,575,172,767 | | |
| Foreign Currencies (Cost: $883,469)—0.0% (b) | | | | | 880,442 | | |
| Liabilities In Excess Of Other Assets—(0.5)% | | | | | (12,816,930 | ) | |
| Total Net Assets—100% | | | | $ | 2,563,236,279 | | |
(a) Non-income producing security.
(b) Amount rounds to less than 0.1%
See accompanying Notes to Financial Statements.
OAKMARK GLOBAL FUND
34
OAKMARK GLOBAL SELECT FUND
Report from Bill Nygren and David Herro, Portfolio Managers


THE VALUE OF A $10,000 INVESTMENT IN OAKMARK GLOBAL SELECT FUND FROM ITS INCEPTION (10/2/06) TO PRESENT (3/31/11) AS COMPARED TO THE MSCI WORLD INDEX10 (UNAUDITED)
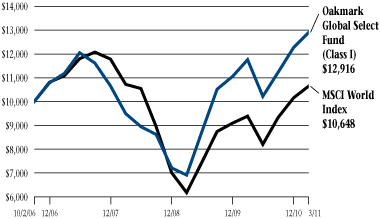
| | | Total Returns
(as of 3/31/11) | |
| (Unaudited) | | Last 3 Months* | | 1-year | | Average Annual
Total Return
Since Inception
(10/2/06) | |
Oakmark Global
Select Fund (Class I) | | | 5.15 | % | | | 9.75 | % | | | 5.86 | % | |
| MSCI World | | | 4.80 | % | | | 13.45 | % | | | 1.41 | % | |
| Lipper Global Fund Index11 | | | 4.88 | % | | | 15.18 | % | | | 2.78 | % | |
The graph and table do not reflect the deduction of taxes that a shareholder would pay on Fund distributions or the redemption of Fund shares.
The expense ratio for Class I shares as of 9/30/10 was 1.29%
Past Performance is no guarantee of future results. The performance data quoted represents past performance. Current performance may be lower or higher than the performance data quoted. The investment return and principal value vary so that an investor's shares when redeemed may be worth more or less than the original cost. The performance of the Fund does not reflect the 2% redemption fee imposed on shares redeemed within 90 days of purchase. To obtain the most recent month-end performance data, visit oakmark.com.
* Not annualized
The Oakmark Global Select Fund returned 5% for the quarter ended March 31, 2011, compared to the MSCI World Index, which also returned 5% for the same period. Since inception, the Fund has returned an average of 6% per year, outperforming the MSCI World Index, which has averaged 1% per year over the same period.
One of the top contributors to performance for the quarter was SAP, a global software manufacturer based in Germany that returned 20%. In January, SAP reported better-than-expected 2010 results. SAP's core business—software and software-related services—grew 10% and overall group revenue grew 11%. A significant factor in our investment thesis is margin improvement, which management continues to deliver on. Both gross margin and operating margin increased in 2010. We believe management has proven to be good stewards of capital over time and SAP is a business with great economics that provides valuable solutions to its customer base and generates strong cash flow.
Another top contributor to performance was Capital One Financial, a U.S.-based diversified banking group, which returned 22%. Improved profitability has been aided by rapidly declining card charge-offs approaching levels not seen since the mid-2000s. These reduced credit costs added over $5 to per-share earnings in 2010 and similar effects are expected in 2011. Reduced charge-offs help highlight what we see as the company's strong underwriting culture and risk-averse management style. We believe Capital One will begin to experience loan growth in the low single digits due to greater demand and reduced charge-offs, as well as improved back-office management.
The largest detractor from performance for the quarter was U.S.-based electronics retailer Best Buy, which fell 16%. Shares declined amid continued concerns that consumers are becoming more price-sensitive and moving to competitors such as Wal-Mart and Amazon. The next few quarters look challenging, as the TV innovation cycle has paused and consumers remain more focused on price. However, to address increased competition from low-priced retailers, Best Buy plans to expand the inventory it offers online to make online price comparison easier for consumers. During the quarter, Best Buy reported same-store sales down 5% for 4Q10, but profitability was better than expected due to stronger
OAKMARK GLOBAL SELECT FUND
35
gross margins and tighter cost controls. We think margins will continue to benefit from the company's shift to small-box mobile stores, which sell high-demand items like smartphones and tablets. Management has indicated that it will open only six to eight new big-box stores in 2011 (compared to 30 in 2010). We believe Best Buy remains a solid investment opportunity, especially at its current price of just 4x 2012 EBIT.
Another top detractor for the quarter was Daiwa Securities Group. Like the vast majority of Japan-based firms, Daiwa's stock price declined in March. We acknowledge that the company's operations will likely continue to be disrupted in the near term. However, because we don't believe the company's underlying fundamentals have changed, our long-term view of Daiwa's intrinsic value remains intact.
During the quarter, we eliminated our positions in Bank of America and Television-Francaise 1 and used the proceeds to purchase Danone, the French-based manufacturer of popular food brands such as Dannon and Evian. We also purchased Tyco Electronics, an electronics component and network solutions company. In March, Tyco Electronics changed its name to TE Connectivity.
We continue to defensively hedge the Fund's currency exposures. At quarter-end, approximately 53% of the Fund's Japanese yen and 53% of the Fund's Swiss franc exposures were hedged.
We thank you for your continued confidence and support.
William C. Nygren, CFA
Portfolio Manager
oakwx@oakmark.com | | David G. Herro, CFA
Portfolio Manager
oakwx@oakmark.com | |
|
March 31, 2011
OAKMARK GLOBAL SELECT FUND
36
OAKMARK GLOBAL SELECT FUND
Global Diversification—March 31, 2011 (Unaudited)

OAKMARK GLOBAL SELECT FUND
37
OAKMARK GLOBAL SELECT FUND
Schedule of Investments—March 31, 2011 (Unaudited)
| Name | | Description | | Shares Held | | Value | |
| Common Stocks—94.7% | |
| Application Software—5.3% | |
| SAP AG (Germany) | | Develops Business Software | | | 381,000 | | | $ | 23,325,969 | | |
| Automobile Manufacturers—6.3% | |
Toyota Motor Corp.
(Japan) | | Automobile Manufacturer | | | 691,000 | | | | 27,829,406 | | |
| Cable & Satellite—4.5% | |
Comcast Corp., Class A
(United States) | | Cable Communication Networks
Provider | | | 864,000 | | | | 20,062,080 | | |
| Catalog Retail—4.5% | |
Liberty Media Corp. -
Interactive, Class A
(United States) (a) | | Home & Internet Shopping
Online Travel | | | 1,260,000 | | | | 20,210,400 | | |
| Computer & Electronics Retail—4.0% | |
Best Buy Co., Inc.
(United States) | | Computer & Electronics Retailer | | | 615,000 | | | | 17,662,800 | | |
| Computer Hardware—3.8% | |
| Dell, Inc. (United States) (a) | | Technology Products & Services | | | 1,178,000 | | | | 17,092,780 | | |
| Consumer Finance—4.0% | |
Capital One Financial
Corp. (United States) | | Credit Card Products & Services
Provider | | | 340,000 | | | | 17,666,400 | | |
| Distillers & Vintners—5.7% | |
Diageo PLC
(United Kingdom) | | Beverages, Wines & Spirits
Manufacturer | | | 1,341,000 | | | | 25,492,088 | | |
| Diversified Capital Markets—4.7% | |
| UBS AG (Switzerland) (a) | | Wealth Management &
Investment Banking | | | 1,166,000 | | | | 20,920,718 | | |
| Electronic Manufacturing Services—4.5% | |
TE Connectivity, Ltd.
(Switzerland) | | Electronic Equipment,
Instruments & Components | | | 578,800 | | | | 20,153,816 | | |
| Health Care Equipment—4.2% | |
Medtronic, Inc.
(United States) | | Develops Therapeutic & Diagnostic
Medical Products | | | 470,000 | | | | 18,494,500 | | |
OAKMARK GLOBAL SELECT FUND
38
OAKMARK GLOBAL SELECT FUND
Schedule of Investments—March 31, 2011 (Unaudited) cont.
| Name | | Description | | Shares Held | | Value | |
| Common Stocks—94.7% (cont.) | |
| Human Resource & Employment Services—4.6% | |
| Adecco SA (Switzerland) | | Temporary Employment Services | | | 310,000 | | | $ | 20,385,411 | | |
| Integrated Oil & Gas—4.7% | |
Cenovus Energy, Inc.
(Canada) | | Integrated Oil Company | | | 535,000 | | | | 21,068,300 | | |
| Internet Software & Services—4.2% | |
eBay, Inc.
(United States) (a) | | Online Trading Community &
Secure Online Payment Services | | | 600,000 | | | | 18,624,000 | | |
| Investment Banking & Brokerage—5.0% | |
Daiwa Securities
Group, Inc. (Japan) | | Stock Broker | | | 4,803,000 | | | | 22,057,538 | | |
| Packaged Foods & Meats—4.4% | |
| Danone (France) | | Food Products | | | 299,500 | | | | 19,565,079 | | |
| Security & Alarm Services—5.4% | |
| G4S PLC (United Kingdom) | | Security Services | | | 5,840,000 | | | | 23,927,208 | | |
| Semiconductors—14.9% | |
| ROHM Co., Ltd. (Japan) | | Integrated Circuits &
Semiconductor Devices
Manufacturer | | | 458,000 | | | | 28,686,944 | | |
Texas Instruments, Inc.
(United States) | | Designs & Supplies Digital Signal
Processing & Analog
Technologies | | | 550,000 | | | | 19,008,000 | | |
| Intel Corp. (United States) | | Computer Component
Manufacturer & Designer | | | 922,000 | | | | 18,596,740 | | |
| | | | 66,291,684 | | |
| Total Common Stocks (Cost: $381,821,116) | | | | | | $ | 420,830,177 | | |
OAKMARK GLOBAL SELECT FUND
39
OAKMARK GLOBAL SELECT FUND
Schedule of Investments—March 31, 2011 (Unaudited) cont.
| Name | | Par Value | | Value | |
| Short Term Investment—6.3% | |
| Repurchase Agreement—6.3% | |
Fixed Income Clearing Corp. Repurchase Agreement,
0.05% dated 3/31/2011 due 4/1/2011, repurchase
price $28,039,709, collateralized by a Federal National
Mortgage Association Bond, with a rate of 0.800%,
with a maturity of 11/18/2013, and with a fair value
plus accrued interest of $28,604,538 (Cost: $28,039,670) | | $ | 28,039,670 | | | $ | 28,039,670 | | |
| Total Short Term Investment (Cost: $28,039,670) | | | | $ | 28,039,670 | | |
| Total Investments (Cost: $409,860,786)—101.0% | | | | | 448,869,847 | | |
| Liabilities In Excess of Other Assets—(1.0)% | | | | | (4,337,446 | ) | |
| Total Net Assets—100% | | | | $ | 444,532,401 | | |
(a) Non-income producing security.
See accompanying Notes to Financial Statements.
OAKMARK GLOBAL SELECT FUND
40
OAKMARK INTERNATIONAL AND
OAKMARK INTERNATIONAL SMALL CAP FUNDS
 Fellow Shareholders,
The first quarter of 2011 was once again marked both by global equity-market volatility and uncertainty driven largely by macro factors. Despite this, both the Oakmark International Fund and International Small Cap Fund earned positive returns for the quarter, though both Funds slightly lagged their peers and respective indices. (Go to oakmark.com/
performance to view performance for The Oakmark Funds.)
Macro Events/Micro Opportunity
The new year brought a degree of optimism as a result of strong economic growth in the emerging markets, as well as recovery in the developed world. Indeed, the world's largest economy, the USA, began to perk up as much of the uncertainty surrounding economic and tax policy vanished after the midterm elections and a two-year political deal on tax policy was approved by Congress. Europe and Japan were more of a mixed bag. Parts of southern Europe, the U.K. and Ireland had to deal with their own fiscal messes, while Germany and Scandinavia experienced robust economic conditions. Even Japan, the world's third-largest economy, seemed to be bouncing off the bottom with a modest economic recovery accelerating as we moved deeper into 2011.
While the quarter started on an optimistic note, macro storms soon rolled in. First, political instability in the Middle East, instigated by the "Facebook" generation, hit numerous countries, toppling regimes in Egypt and Tunisia. In other areas like Libya, Bahrain and even Syria, the leaders appear to be on the ropes. Meanwhile, Saudi Arabia, the most strategically important nation, has experienced only minor disquiet, though there are fears that this too is a nation that could succumb to disorder despite what appears to be widespread internal respect for its king. Keep in mind that the world consumes around 85 million barrels of oil a day, of which 8 million to 10 million are produced by Saudi Arabia.
In March, just as events in Libya accelerated, Japan was hit by a double-barreled natural disaster. We are all aware by now of the death and destruction caused by the monstrous earthquake and the tsunami that followed. Rob Taylor, co-manager of Oakmark International, and analyst Eric Liu were in Japan at the time and luckily both made it back safe and sound. The problems with the Fukushima nuclear plant and the destruction of some infrastructure have meant a fairly major disruption to the world's global supply chain, as many key components for the IT and auto industries are sourced from Japan.
So just when things were fairly positive for the globe, here comes a powerful 1-2 punch. This is already on top of U.S. and European PIIGS (Portugal, Italy, Ireland, Greece and Spain) fiscal fears.
How can we as investors cope?
First, we must accept the fact that periods of long-term macro tranquility are actually quite rare. I started in the investment business in 1986. In 1987 there was a global stock market crash. In fact, the Hong Kong market was hit so hard that it was closed for days before it regrouped and reopened. In the early '90s, there was the first Gulf War, followed by Latin America's "Tequila Crisis" in 1994. The next couple of years were fairly quiet, but then came the Asian Crisis in 1997, followed by a full-blown panic in most emerging markets by mid-1998. Asia began to slowly recover in 1999, but then in 2000, the tech bubble popped and in 2001 came the terrorist attacks of 9/11.
Incidentally, despite all of the macro disturbances in the 1990s, the MSCI World Index10 managed an average annual return of 12% in that decade.
Second, we believe that one needs to stay focused on the micro and company valuation.
It is the MICRO that counts!
We have a consistent approach to the integration of macro events: Determine how the event impacts a specific company's value over the long term, if at all, and make adjustments to specific business valuations, if needed. Recall that we value a business based on the present value of ALL future cash flows. Because the stock market reacts mostly to short-term information flows, we seek to exploit market inefficiency.
As an example, because Japanese stocks have been extremely low-priced (pre-disaster) and the quality of these businesses has been improving, we have been increasing our weight in Japanese stocks in both strategies. Pre-disaster, on average, Japanese companies were trading at around 1x book value, whereas the rest of the world was over 2x book. Post-disaster, Japanese share prices are selling at even lower valuations. We acknowledge that in the short term, the disaster might have a negative impact on earnings and cash generation of certain Japanese
OAKMARK INTERNATIONAL AND OAKMARK INTERNATIONAL SMALL CAP FUNDS
41
companies. However, we do not think, at this stage, that there has been any real, significant, long-term or structural value destruction of those Japanese companies in which we are invested. As a result, we sought to take advantage of Mr. Market's short-termism by increasing our exposure to many of our Japanese holdings.
As we continue through 2011, we remain optimistic about our portfolios based on muted equity-market valuations and a continued belief that, despite the current macroeconomic disturbances, there exists a favorable atmosphere for corporate profitability. We continue to be thankful for your continued confidence and support.
David G. Herro, CFA
Portfolio Manager
oakix@oakmark.com
oakex@oakmark.com
March 31, 2011
OAKMARK INTERNATIONAL AND OAKMARK INTERNATIONAL SMALL CAP FUNDS
42
OAKMARK INTERNATIONAL FUND
Report from David G. Herro and Robert A. Taylor, Portfolio Managers


THE VALUE OF A $10,000 INVESTMENT IN OAKMARK INTERNATIONAL FUND FROM ITS INCEPTION (9/30/92) TO PRESENT (3/31/11) AS COMPARED TO THE MSCI WORLD EX U.S. INDEX14 (UNAUDITED)
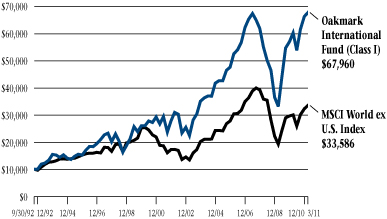
| | | | | Average Annual Total Returns
(as of 3/31/11) | |
| (Unaudited) | | Total Return
Last 3 Months* | | 1-year | | 5-year | | 10-year | | Since
Inception
(9/30/92) | |
Oakmark International
Fund (Class I) | | | 2.27 | % | | | 12.44 | % | | | 5.25 | % | | | 9.77 | % | | | 10.91 | % | |
| MSCI World ex U.S. | | | 3.82 | % | | | 11.61 | % | | | 1.99 | % | | | 5.96 | % | | | 6.77 | % | |
| MSCI EAFE15 | | | 3.37 | % | | | 10.42 | % | | | 1.30 | % | | | 5.39 | % | | | 6.39 | % | |
Lipper International
Fund Index16 | | | 3.29 | % | | | 12.57 | % | | | 2.75 | % | | | 6.50 | % | | | 7.75 | % | |
The graph and table do not reflect the deduction of taxes that a shareholder would pay on Fund distributions or the redemption of Fund shares.
The expense ratio for Class I shares as of 9/30/10 was 1.08%
Past Performance is no guarantee of future results. The performance data quoted represents past performance. Current performance may be lower or higher than the performance data quoted. The investment return and principal value vary so that an investor's shares when redeemed may be worth more or less than the original cost. The performance of the Fund does not reflect the 2% redemption fee imposed on shares redeemed within 90 days of purchase. To obtain the most recent month-end performance data, visit oakmark.com.
* Not annualized
The Oakmark International Fund returned 2% for the quarter ended March 31, 2011, trailing the MSCI World ex U.S. Index, which returned 4% over the same period. Since its inception in September 1992, the Fund has returned an average of 11% per year, outperforming the MSCI World ex U.S. Index, which has averaged 7% per year over the same period.
One of the top contributors to performance for the quarter was SAP, a global software manufacturer based in Germany, which returned 20%. In January, SAP reported better-than-expected 2010 results. Its core business, software and software-related services, grew 10% and overall group revenue grew 11%. A significant factor in our investment thesis is margin improvement, which management continues to deliver on. Both gross margin and operating margin increased in 2010, and management believes it can continue to deliver double-digit growth as well as margin improvement. Management has proven to be good stewards of capital, and we think SAP provides valuable solutions to its customer base and generates strong cash flow.
The largest detractor from performance was Japan-based Canon, a professional and consumer imaging-solutions company that fell 16% during the quarter. Shares reacted negatively to worse-than-expected fourth-quarter results, which were hurt by the stronger yen, losses in Canon's optical-equipment division and declines in laser-printer sales. Despite the weak results, Canon announced that it would issue its standard dividend, maintaining its policy to consistently return cash to shareholders even during times of depressed earnings. We find that a shareholder-focused management team is still somewhat rare in Japan (although this is improving), and we commend Canon's management for its shareholder focus. We continue to believe Canon will provide positive returns for our shareholders.
Another large detractor from performance during the quarter was Bank of Ireland. Ireland's financial environment remains challenging. At the end of March, the Irish Central Bank (CBI) issued the results of stress tests that confirmed banking institutions needed to raise additional capital. In particular, the CBI reported that Bank of Ireland needed to raise 5.2 billion euros in capital to meet both the minimum Core Tier 1 ratio for 2011-2013 and the Core Tier 1 ratio under the
OAKMARK INTERNATIONAL FUND
43
adverse-stress scenario. However, Bank of Ireland's management believes the adverse-stress scenario reflects unlikely conditions, and that the bank will exceed both minimum requirements. The government will provide a large portion of the needed capital, but by our estimates, the government will still own less than 50% of the bank. This will leave Bank of Ireland as the only exchange-listed bank in the country not controlled by the government. The Irish government has indicated that, after various restructurings and mergers, the market will consist of only two banks—Allied Irish Bank and Bank of Ireland. The diminished banking system and reduced competition should lead to higher profitability during more normal economic conditions. It will take time for the economic environment to improve in Ireland, but in our view, Bank of Ireland will emerge on top.
We sold KT&G from the Fund during the quarter and purchased three new names: Hennes & Mauritz (H&M), a Swedish fashion retailer and designer; Secom, a Japanese security services provider; and Tesco, a U.K.-based food retailer that also has operations in continental Europe, Asia and the U.S. Another addition to the Fund during the quarter was Aperam, a global stainless-steel manufacturer that was spun off from Fund holding ArcelorMittal.
We continue to believe many global currencies are overvalued compared to the U.S. dollar and continue to defensively hedge the Fund's currency exposure. The Swiss franc and Japanese yen hedges remained relatively unchanged from last quarter at 49% and 52%, respectively. We increased our Australian dollar hedge to 65% and initiated a 24% hedge of the Swedish krona.
Short-term fluctuations in the market create opportunities for us to invest in foreign companies that we believe have fallen out of favor in the marketplace. We continue to focus on finding what we think are attractive, undervalued companies with management teams focused on building shareholder value. We thank you for your continued support!
David G. Herro, CFA
Portfolio Manager
oakix@oakmark.com | | Robert A. Taylor, CFA
Portfolio Manager
oakix@oakmark.com | |
|
March 31, 2011
OAKMARK INTERNATIONAL FUND
44
OAKMARK INTERNATIONAL FUND
Global Diversification—March 31, 2011 (Unaudited)
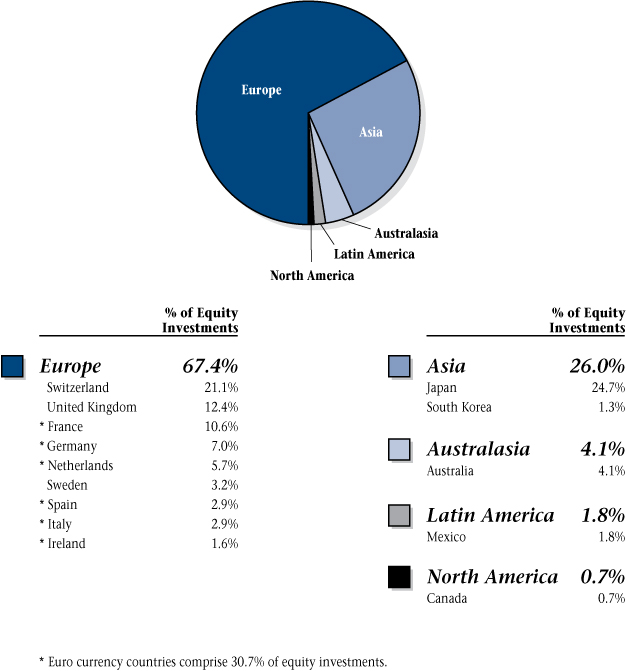
OAKMARK INTERNATIONAL FUND
45
OAKMARK INTERNATIONAL FUND
Schedule of Investments—March 31, 2011 (Unaudited)
| Name | | Description | | Shares Held | | Value | |
| Common Stocks—96.7% | |
| Advertising—1.9% | |
Publicis Groupe SA
(France) | | Advertising & Media Services | | | 2,691,000 | | | $ | 150,926,531 | | |
| Aerospace & Defense—0.6% | |
BAE Systems PLC
(United Kingdom) | | Develops, Delivers & Supports
Advanced Aerospace & Defense
Systems | | | 8,866,000 | | | | 46,209,974 | | |
| Apparel Retail—0.6% | |
Hennes & Mauritz
AB (H&M) - Class B
(Sweden) | | Designs & Retails Fashion | | | 1,418,000 | | | | 47,087,691 | | |
| Apparel, Accessories & Luxury Goods—0.8% | |
Cie Financiere Richemont
SA (Switzerland) | | Manufacturer & Retailer of
Luxury Goods | | | 1,192,700 | | | | 68,887,028 | | |
| Application Software—2.7% | |
| SAP AG (Germany) | | Develops Business Software | | | 3,592,000 | | | | 219,913,069 | | |
| Asset Management & Custody Banks—0.2% | |
Schroders PLC
(United Kingdom) | | International Asset Management | | | 680,600 | | | | 18,953,959 | | |
| Automobile Manufacturers—6.6% | |
Toyota Motor Corp.
(Japan) | | Automobile Manufacturer | | | 6,119,000 | | | | 246,437,244 | | |
Honda Motor Co., Ltd.
(Japan) | | Automobile & Motorcycle
Manufacturer | | | 4,976,000 | | | | 186,943,977 | | |
Daimler AG Registered
(Germany) | | Automobile Manufacturer | | | 1,511,000 | | | | 106,748,208 | | |
| | | | 540,129,429 | | |
| Brewers—2.9% | |
Heineken Holdings NV
(Netherlands) | | Produces Beers, Spirits, Wines &
Soft Drinks | | | 3,000,000 | | | | 144,214,212 | | |
Foster's Group, Ltd.
(Australia) | | Manufactures & Markets
Alcoholic & Non-Alcoholic
Beverages | | | 15,916,000 | | | | 94,166,702 | | |
| | | | 238,380,914 | | |
OAKMARK INTERNATIONAL FUND
46
OAKMARK INTERNATIONAL FUND
Schedule of Investments—March 31, 2011 (Unaudited) cont.
| Name | | Description | | Shares Held | | Value | |
| Common Stocks—96.7% (cont.) | |
| Broadcasting—2.5% | |
Societe Television
Francaise 1 (France) | | Broadcasting & Cable TV | | | 5,973,193 | | | $ | 109,666,739 | | |
Grupo Televisa SA
(Mexico) (a) (b) | | Television Production &
Broadcasting | | | 3,886,000 | | | | 95,323,580 | | |
| | | | 204,990,319 | | |
| Building Products—3.3% | |
Assa Abloy AB, Class B
(Sweden) | | Develops, Designs &
Manufactures Security Locks | | | 7,111,000 | | | | 204,478,287 | | |
Geberit AG, Registered
Shares (Switzerland) | | Building Products | | | 283,100 | | | | 61,643,985 | | |
| | | | 266,122,272 | | |
| Construction Materials—1.6% | |
| Holcim, Ltd. (Switzerland) | | Produces & Markets Ready-Mixed
Concrete, Cement, Clinker &
Admixtures | | | 1,760,000 | | | | 132,598,802 | | |
| Distillers & Vintners—2.8% | |
Diageo PLC
(United Kingdom) | | Beverages, Wines & Spirits
Manufacturer | | | 11,986,000 | | | | 227,850,983 | | |
| Diversified Banks—10.4% | |
| BNP Paribas (France) | | Commercial Bank | | | 3,135,000 | | | | 229,299,110 | | |
| Banco Santander SA (Spain) | | Retail, Commercial & Private
Banking & Asset Management
Services | | | 19,666,000 | | | | 228,316,313 | | |
| Intesa Sanpaolo SPA (Italy) | | Banking & Financial Services | | | 77,025,500 | | | | 227,927,111 | | |
Sumitomo Mitsui Financial
Group, Inc. (Japan) | | Commercial Bank | | | 3,525,500 | | | | 109,604,989 | | |
| Bank of Ireland (Ireland) (a) | | Commercial Bank | | | 178,940,000 | | | | 55,790,606 | | |
| | | | 850,938,129 | | |
| Diversified Capital Markets—5.6% | |
Credit Suisse Group
(Switzerland) | | Wealth Management &
Investment Banking | | | 6,332,000 | | | | 269,066,913 | | |
| UBS AG (Switzerland) (a) | | Wealth Management &
Investment Banking | | | 10,509,000 | | | | 188,555,602 | | |
| | | | 457,622,515 | | |
OAKMARK INTERNATIONAL FUND
47
OAKMARK INTERNATIONAL FUND
Schedule of Investments—March 31, 2011 (Unaudited) cont.
| Name | | Description | | Shares Held | | Value | |
| Common Stocks—96.7% (cont.) | |
| Diversified Chemicals—1.0% | |
Akzo Nobel NV
(Netherlands) | | Produces & Markets Chemicals,
Coatings & Paints | | | 1,192,000 | | | $ | 81,897,347 | | |
| Diversified Support Services—1.3% | |
| Brambles, Ltd. (Australia) | | Provides Pallet & Plastic
Container Pooling Services | | | 14,002,000 | | | | 102,539,391 | | |
| Electronic Components—1.9% | |
| OMRON Corp. (Japan) | | Component, Equipment &
System Manufacturer | | | 5,360,300 | | | | 150,665,802 | | |
| Food Retail—1.4% | |
Koninklijke Ahold NV
(Netherlands) | | Retails Health & Beauty Supplies,
Prescriptions Drugs, Wine &
Liquor | | | 7,521,000 | | | | 100,917,109 | | |
Tesco PLC
(United Kingdom) | | Food Retailer | | | 2,451,500 | | | | 14,983,565 | | |
| | | | 115,900,674 | | |
| Health Care Equipment—2.5% | |
| Olympus Corp. (Japan) | | Optoelectronic Products
Manufacturer | | | 7,221,500 | | | | 200,896,261 | | |
| Human Resource & Employment Services—1.9% | |
| Adecco SA (Switzerland) | | Temporary Employment Services | | | 2,312,200 | | | | 152,048,862 | | |
| Industrial Machinery—1.4% | |
| Vallourec SA (France) | | Steel Alloy & Tubing Manufacturer | | | 1,023,300 | | | | 114,799,428 | | |
| Investment Banking & Brokerage—3.5% | |
Daiwa Securities
Group, Inc. (Japan) | | Stock Broker | | | 61,401,400 | | | | 281,982,866 | | |
| Marine—1.6% | |
Kuehne + Nagel
International AG
(Switzerland) | | Sea, Land & Rail Freight
Transportation Businesses | | | 956,000 | | | | 133,746,325 | | |
| Multi-line Insurance—2.8% | |
Allianz SE Registered
(Germany) | | Insurance, Banking & Financial
Services | | | 1,629,000 | | | | 228,622,425 | | |
| Office Electronics—2.9% | |
| Canon, Inc. (Japan) | | Computers & Information | | | 5,485,400 | | | | 238,725,030 | | |
OAKMARK INTERNATIONAL FUND
48
OAKMARK INTERNATIONAL FUND
Schedule of Investments—March 31, 2011 (Unaudited) cont.
| Name | | Description | | Shares Held | | Value | |
| Common Stocks—96.7% (cont.) | |
| Packaged Foods & Meats—4.2% | |
| Nestle SA (Switzerland) | | Food & Beverage Manufacturer | | | 3,156,000 | | | $ | 180,907,349 | | |
| Danone (France) | | Food Products | | | 2,532,000 | | | | 165,404,943 | | |
| | | | 346,312,292 | | |
| Paper Packaging—1.5% | |
| Amcor, Ltd. (Australia) | | Packaging & Related Services | | | 16,916,000 | | | | 123,529,243 | | |
| Pharmaceuticals—5.4% | |
Roche Holding AG
(Switzerland) | | Develops & Manufactures
Pharmaceutical & Diagnostic
Products | | | 1,224,000 | | | | 174,838,105 | | |
| Novartis AG (Switzerland) | | Pharmaceuticals | | | 2,493,000 | | | | 135,221,840 | | |
GlaxoSmithKline PLC
(United Kingdom) | | Pharmaceuticals | | | 6,970,000 | | | | 133,001,184 | | |
| | | | 443,061,129 | | |
| Publishing—2.4% | |
Reed Elsevier PLC
(United Kingdom) | | Publisher & Information Provider | | | 16,307,000 | | | | 141,262,248 | | |
Thomson Reuters Corp.
(Canada) | | Electronic Information &
Solutions Company | | | 1,471,400 | | | | 57,748,087 | | |
| | | | 199,010,335 | | |
| Research & Consulting Services—1.5% | |
Experian Group, Ltd.
(Ireland) | | Credit & Marketing Services | | | 5,567,500 | | | | 68,950,244 | | |
| Meitec Corp. (Japan) (c) | | Software Engineering Services | | | 2,475,100 | | | | 49,513,903 | | |
| | | | 118,464,147 | | |
| Restaurants—0.8% | |
| Sodexo (France) | | Food & Facilities Management
Services | | | 935,800 | | | | 68,339,870 | | |
| Security & Alarm Services—4.0% | |
| G4S PLC (United Kingdom) | | Security Services | | | 48,804,000 | | | | 199,956,071 | | |
Secom Co., Ltd. (Japan)
| | On-Line Centralized Security
Services, Home Security
Systems, & Home Medical
Services | | | 2,782,000 | | | $ | 129,267,011 | | |
| | | | 329,223,082 | | |
OAKMARK INTERNATIONAL FUND
49
OAKMARK INTERNATIONAL FUND
Schedule of Investments—March 31, 2011 (Unaudited) cont.
| Name | | Description | | Shares Held | | Value | |
| Common Stocks—96.7% (cont.) | |
| Semiconductors—4.3% | |
| ROHM Co., Ltd. (Japan) | | Integrated Circuits & | | | |
| |
| | | | | Semiconductor Devices | | | |
| |
| | | | | Manufacturer | | | 3,958,200 | | | $ | 247,922,842 | | |
Samsung Electronics
Co., Ltd. (South Korea) | | Consumer & Industrial Electronic
Equipment Manufacturer | | | 119,700 | | | | 101,700,533 | | |
| | | | 349,623,375 | | |
| Soft Drinks—0.6% | |
Fomento Economico
Mexicano S.A.B. de C.V.
(Mexico) (b) | | Beverage Company | | | 810,900 | | | | 47,599,830 | | |
| Specialty Chemicals—2.0% | |
| Givaudan SA (Switzerland) | | Manufactures & Markets
Fragrances | | | 162,800 | | | | 163,686,228 | | |
| Specialty Stores—1.4% | |
Signet Jewelers, Ltd.
(United Kingdom) (a) | | Jewelry Retailer | | | 2,475,690 | | | | 113,931,254 | | |
| Steel—1.6% | |
| ArcelorMittal (Netherlands) | | Manufactures Steel | | | 3,314,600 | | | | 119,902,391 | | |
| Aperam (Netherlands) | | Manufactures Steel | | | 165,730 | | | | 6,658,634 | | |
| | | | 126,561,025 | | |
| Tobacco—1.3% | |
Japan Tobacco, Inc.
(Japan) | | Manufactures & Sells Tobacco,
Food, & Pharmaceutical
Products | | | 29,300 | | | | 105,850,565 | | |
| Trading Companies & Distributors—1.0% | |
Wolseley PLC
(United Kingdom) (a) | | Distributes Building Materials &
Lumber Products | | | 2,441,580 | | | | 82,213,224 | | |
| Total Common Stocks (Cost: $6,855,719,610) | | | | | | $ | 7,889,841,625 | | |
OAKMARK INTERNATIONAL FUND
50
OAKMARK INTERNATIONAL FUND
Schedule of Investments—March 31, 2011 (Unaudited) cont.
| Name | | Par Value | | Value | |
| Repurchase Agreement—3.8% | |
Fixed Income Clearing Corp. Repurchase Agreement,
0.05% dated 3/31/2011 due 4/1/2011, repurchase
price $312,457,885, collateralized by a Federal Home
Loan Mortgage Corp. Bond, with a rate of 4.500%,
with a maturity of 7/15/2013, and with a fair value
plus accrued interest of $21,306,794 and by Federal
National Mortgage Association Bonds, with rates
from 0.800% - 4.625%, with maturities from
10/15/2013 - 11/18/2013, and with an aggregate
fair value plus accrued interest of $297,404,819
(Cost: $312,457,451) | | $ | 312,457,451 | | | $ | 312,457,451 | | |
| Total Short Term Investment (Cost: $312,457,451) | | | | $ | 312,457,451 | | |
| Total Investments (Cost: $7,168,177,061)—100.5% | | | | | 8,202,299,076 | | |
| Foreign Currencies (Cost: $5,492,360)—0.1% | | | | | 5,487,374 | | |
| Liabilities In Excess of Other Assets—(0.6)% | | | | | (47,682,681 | ) | |
| Total Net Assets—100% | | | | $ | 8,160,103,769 | | |
(a) Non-income producing security.
(b) Represents a Sponsored American Depositary Receipt.
(c) See Note 5 in the Notes to the Financial Statements regarding investments in affiliated issuers.
| Short Term Investment—3.8% | |
See accompanying Notes to Financial Statements.
OAKMARK INTERNATIONAL FUND
51
OAKMARK INTERNATIONAL
SMALL CAP FUND
Report from David G. Herro, Portfolio Manager

THE VALUE OF A $10,000 INVESTMENT IN OAKMARK INTERNATIONAL SMALL CAP FUND FROM 3/31/01 TO PRESENT (3/31/11) AS COMPARED TO THE MSCI WORLD EX U.S. SMALL CAP INDEX17
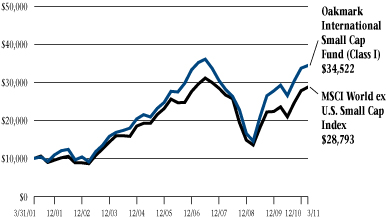
| | | | | Average Annual Total Returns
(as of 3/31/11) | |
| (Unaudited) | | Total Return
Last 3 Months* | | 1-year | | 5-year | | 10-year | | Since
Inception
(11/1/95) | |
Oakmark International
Small Cap Fund
(Class I) | | | 2.09 | % | | | 17.73 | % | | | 4.51 | % | | | 13.19 | % | | | 11.37 | % | |
MSCI World ex U.S.
Small Cap | | | 3.29 | % | | | 22.00 | % | | | 2.35 | % | | | 11.16 | % | | | N/A | | |
| MSCI World ex U.S.14 | | | 3.82 | % | | | 11.61 | % | | | 1.99 | % | | | 5.96 | % | | | 5.77 | % | |
Lipper International
Small Cap Index18 | | | 2.43 | % | | | 21.74 | % | | | 3.60 | % | | | 11.05 | % | | | N/A | | |
The graph and table do not reflect the deduction of taxes that a shareholder would pay on Fund distributions or the redemption of Fund shares.
The expense ratio for Class I shares as of 9/30/10 was 1.38%
Past Performance is no guarantee of future results. The performance data quoted represents past performance. Current performance may be lower or higher than the performance data quoted. The investment return and principal value vary so that an investor's shares when redeemed may be worth more or less than the original cost. The performance of the Fund does not reflect the 2% redemption fee imposed on shares redeemed within 90 days of purchase. To obtain the most recent month-end performance data, visit oakmark.com.
* Not annualized
The Oakmark International Small Cap Fund returned 2% for the quarter ended March 31, 2011, compared to the MSCI World ex U.S. Small Cap Index, which returned 3%. For the past 10 years, the Fund has earned an annualized rate of return of 13%, compared to the MSCI World ex U.S. Small Cap Index, which has returned 11% for the same period.
The top-performing stock in the Fund this quarter was Italian jeweler and luxury goods retailer Bulgari. On March 7, French luxury group LVMH announced its intention to acquire Bulgari. After securing the Bulgari-Trapani family's 50.4% stake, LVMH made an offer for the remaining shares at 12.25 euros per share, a premium of approximately 61% to the pre-offer closing share price of 7.6 euros on March 4 and slightly above our estimate of intrinsic value. The takeover will allow LVMH to double the size of its watches and jewelry unit. Bulgari's current CEO, Francesco Trapani, will remain in a leadership role with LVMH, and Trapani family members no longer active in the company will exit the business. The acquisition announcement provided us with an opportunity to sell our Bulgari shares and redeploy the proceeds into other holdings. We also sold our holdings in Rexel and Beter Bed.
The largest detractor to performance this quarter was Primary Health Care, an Australian operator of medical centers, pathology labs and diagnostic-imaging sites whose clinics conduct more than six million appointments per year. In February, Primary Health released lackluster first-half financial results. Revenues across the firm were flat and only slightly exceeded those of the same period last year. The pathology unit (the firm's largest source of sales) suffered due to recently imposed Medicare rebate cuts, and margins were hurt by deregulation of pathology collection centers. However, because the firm gained market share, volumes were up almost 5%. Management is optimistic about pathology volumes and patient trends, and expects better results in the second half of the year. Additionally, Primary Health opened one new medical center, bringing its total to 54, and the company expects to open two more centers by the end of the fiscal year. Although the pathology unit is struggling, the diagnostic-imaging unit's restructuring continues, and management believes the company's margins and returns will improve by slowing the
OAKMARK INTERNATIONAL SMALL CAP FUND
52
medical-center expansion and focusing on filling excess capacity. The market is concerned about additional changes to pathology reimbursement, but we believe the stock is significantly undervalued and thus attractive even after accounting for potential changes. However, we have adjusted our sell target downward to reflect the market's difficulties and the company's disappointing earnings result.
We added two securities to the Fund this quarter, both previous Fund holdings—Kimberly Clark de Mexico, the manufacturer of diapers and bathroom tissues; and Britvic, the U.K. soft drinks and juices bottler.
Kimberly Clark's stock price decreased following a disappointing 2010 earnings report. The primary issues for the company have been raw-material inflation, slowing volume growth in a difficult consumer environment in Mexico, and competitors that were slow to follow Kimberly Clark's price increases in diapers and tissue. While we continue to carefully monitor these issues, our research indicates that these concerns appear to be shorter-term in nature. Management, in our opinion, has proven to be excellent operators and extremely good allocators of capital: Historically, it has returned over 100% of free-cash flow to shareholders via dividends and buybacks. Kimberly Clark is the dominant provider of consumer-based paper products in Mexico, and its price dip provided us with the opportunity to purchase shares in the company.
Britvic's share price suffered after the company indicated that fiscal year 2011 results would be worse than expected due to higher raw-material costs. Again, we believe the market has overemphasized short-term earnings and ignored Britvic's tremendously strong franchise. In addition, the company is innovative, its sales volumes remain healthy and management has indicated it will cut costs further. For these reasons, we reinitiated a position in the company.
Because we believe the U.S. dollar remains weak relative to other currencies held in the Fund, we continue to hedge some of the Fund's currency exposure. At the recent quarter-end, approximately 52% of the Fund's Swiss franc, 54% of the Australian dollar and 51% of the Japanese yen exposures were hedged. We added a new hedge to our Swedish holdings and ended the quarter with 26% of Swedish krona exposure hedged.
We thank you for your continued confidence and support.
David G. Herro, CFA
Portfolio Manager
oakex@oakmark.com | |
|
March 31, 2011
OAKMARK INTERNATIONAL SMALL CAP FUND
53
OAKMARK INTERNATIONAL SMALL CAP FUND
Global Diversification—March 31, 2011 (Unaudited)

OAKMARK INTERNATIONAL SMALL CAP FUND
54
OAKMARK INTERNATIONAL SMALL CAP FUND
Schedule of Investments—March 31, 2011 (Unaudited)
| Name | | Description | | Shares Held | | Value | |
| Advertising—2.8% | |
| Asatsu-DK, Inc. (Japan) | | Advertising Services Provider | | | 1,107,700 | | | $ | 29,670,059 | | |
Aegis Group PLC
(United Kingdom) | | Media Services Provider | | | 7,316,200 | | | | 16,771,661 | | |
| | | | 46,441,720 | | |
| Air Freight & Logistics—1.2% | |
Freightways, Ltd.
(New Zealand) (b) | | Express Package Services | | | 7,915,800 | | | | 19,689,602 | | |
| Airport Services—2.4% | |
BBA Aviation PLC
(United Kingdom) | | Flight Support & Aftermarket
Services & Systems Provider | | | 12,534,764 | | | | 40,859,980 | | |
| Application Software—1.6% | |
| NSD Co., Ltd. (Japan) (b) | | Develops Computer Software | | | 2,753,500 | | | | 27,475,415 | | |
| Asset Management & Custody Banks—7.9% | |
Julius Baer Group, Ltd.
(Switzerland) | | Asset Management | | | 1,349,400 | | | | 58,559,699 | | |
| MLP AG (Germany) | | Asset Management | | | 4,488,600 | | | | 41,545,267 | | |
| Azimut Holding SPA (Italy) | | Investment Management Services | | | 2,858,800 | | | | 31,966,254 | | |
| | | | 132,071,220 | | |
| Auto Parts & Equipment—4.0% | |
Nifco, Inc (Japan)
| | Manufactures Synthetic Resinous
Fasteners & Plastic Components
For Automobiles & Home
Electronic Appliances | | | 1,435,000 | | | | 34,365,473 | | |
Toyota Industries Corp.
(Japan) | | Assembles Motor Vehicles &
Manufactures Automotive Parts | | | 1,057,400 | | | | 31,983,871 | | |
| | | | 66,349,344 | | |
| Broadcasting—2.5% | |
Ten Network Holdings,
Ltd. (Australia) | | Operates Commercial Television
Stations | | | 22,207,500 | | | | 29,976,270 | | |
Media Prima Berhad
(Malaysia) | | Film Producer & Sports Promoter | | | 12,880,000 | | | | 10,929,129 | | |
Media Prima Berhad,
Warrants (Malaysia) (a) | | Film Producer & Sports Promoter | | | 1,058,457 | | | | 331,996 | | |
| | | | 41,237,395 | | |
OAKMARK INTERNATIONAL SMALL CAP FUND
55
OAKMARK INTERNATIONAL SMALL CAP FUND
Schedule of Investments—March 31, 2011 (Unaudited) cont.
| Name | | Description | | Shares Held | | Value | |
| Common Stocks—94.0% (cont.) | |
| Building Products—1.6% | |
Kaba Holding AG
(Switzerland) | | Provides Mechanical & Electronic
Security Systems | | | 62,900 | | | $ | 26,228,307 | | |
| Computer Hardware—0.7% | |
Wincor Nixdorf AG
(Germany) | | Banking Machines & Cash
Registers Manufacturer | | | 155,100 | | | | 12,557,610 | | |
| Construction & Engineering—2.1% | |
Wavin NV
(Netherlands) (a) | | Manufacturers Plastic Pipe
Systems | | | 2,317,000 | | | | 35,791,796 | | |
| Construction & Farm Machinery & Heavy Trucks—0.8% | |
Bucher Industries AG
(Switzerland) Manufactures Food Processing
Machinery, Vehicles, & | |
Hydraulic Components | | | 58,900 | | | | 13,466,521 | | |
| Construction Materials—2.1% | |
Titan Cement Co. SA
(Greece) | | Cement & Building Materials
Producer & Distributor | | | 1,430,800 | | | | 35,728,584 | | |
| Data Processing & Outsourced Services—0.5% | |
| TKC Corp. (Japan) | | Accounting, Tax & Law Database
Consulting Services | | | 448,400 | | | | 9,126,487 | | |
| Department Stores—2.6% | |
Myer Holdings, Ltd.
(Australia) | | Department Store Operator | | | 13,330,300 | | | | 44,260,097 | | |
| Diversified Support Services—1.5% | |
gategroup Holding AG
(Switzerland) (a) | | Airlines Service Provider | | | 474,700 | | | | 24,988,291 | | |
| Drug Retail—3.8% | |
Sugi Holdings Co., Ltd.
(Japan) | | Drug Store Operator | | | 1,630,300 | | | | 37,807,750 | | |
Matsumotokiyoshi
Holdings Co., Ltd.
(Japan) | | Drug Store Operator | | | 1,292,200 | | | | 25,151,140 | | |
| | | | 62,958,890 | | |
OAKMARK INTERNATIONAL SMALL CAP FUND
56
OAKMARK INTERNATIONAL SMALL CAP FUND
Schedule of Investments—March 31, 2011 (Unaudited) cont.
| Name | | Description | | Shares Held | | Value | |
| Common Stocks—94.0% (cont.) | |
| Electrical Components & Equipment—3.4% | |
| Nexans SA (France) | | Manufactures Cables | | | 408,000 | | | $ | 39,023,890 | | |
| Prysmian SpA (Italy) | | Develops, Designs, Produces,
Supplies & Installs Cable | | | 830,400 | | | | 17,817,394 | | |
| | | | 56,841,284 | | |
| Electronic Components—3.0% | |
Hirose Electric Co., Ltd.
(Japan) | | Develops & Sells Electronic
Equipment | | | 473,500 | | | | 51,004,568 | | |
| Electronic Equipment & Instruments—2.2% | |
| Orbotech, Ltd. (Israel) (a) (b) | | Optical Inspection Systems | | | 2,927,800 | | | | 37,592,952 | | |
| Fertilizers & Agricultural Chemicals—2.4% | |
Incitec Pivot, Ltd.
(Australia) | | Fertilizer Manufacturer & Supplier | | | 9,002,200 | | | | 40,318,462 | | |
| Health Care Services—3.0% | |
Primary Health Care, Ltd.
(Australia) | | Health Care Service Provider | | | 14,708,900 | | | | 50,206,684 | | |
| Health Care Supplies—2.4% | |
| Ansell, Ltd. (Australia) | | Manufactures Latex | | | 2,902,000 | | | | 40,582,753 | | |
| Home Entertainment Software—3.4% | |
Square Enix Holdings Co.,
Ltd. (Japan) | | Develops & Sells Entertainment
Software for Video Game
Consoles | | | 3,305,200 | | | | 57,378,081 | | |
| Home Furnishing Retail—1.2% | |
Fourlis Holdings SA
(Greece) | | Wholesales Electric & Electronic
Appliances | | | 2,351,100 | | | | 19,991,865 | | |
| Home Improvement Retail—1.6% | |
Carpetright PLC
(United Kingdom) | | Carpet Retailer | | | 2,440,500 | | | | 26,641,902 | | |
| Household Products—0.2% | |
Kimberly-Clark de Mexico
S.A.B. de C.V. (Mexico) | | Hygiene Products Manufacturer,
Marketer & Distributor | | | 419,400 | | | | 2,598,672 | | |
| Human Resource & Employment Services—2.5% | |
Pasona Group, Inc.
(Japan) (b) | | Placement Service Provider | | | 31,234 | | | | 26,622,873 | | |
OAKMARK INTERNATIONAL SMALL CAP FUND
57
OAKMARK INTERNATIONAL SMALL CAP FUND
Schedule of Investments—March 31, 2011 (Unaudited) cont.
| Name | | Description | | Shares Held | | Value | |
| Common Stocks—94.0% (cont.) | |
| Human Resource & Employment Services—2.5% (cont.) | |
Brunel International NV
| |
| (Netherlands) | | Recruitment, Temporary | | | |
| |
| | | | | Employment, Secondment & | | | |
| |
| | | | | Contracting Services | | | 310,952 | | | $ | 14,639,423 | | |
| | | | 41,262,296 | | |
| Industrial Conglomerates—1.6% | |
| Rheinmetall AG (Germany) | | Automotive Pump Manufacturer | | | 332,000 | | | | 27,510,732 | | |
| Industrial Machinery—5.3% | |
Interpump Group SpA
(Italy) (b) | | Pump & Piston Manufacturer | | | 3,379,200 | | | | 28,662,167 | | |
| Duerr AG (Germany) (a) | | Automotive Industry Machinery
Manufacturer | | | 691,800 | | | | 22,990,815 | | |
Bobst Group AG
(Switzerland) (a) | | Manufactures Printing Presses &
Packaging Producing Machinery | | | 333,226 | | | | 15,255,474 | | |
Burckhardt Compression
Holding AG (Switzerland) | | Manufactures Reciprocating
Compressors | | | 41,358 | | | | 13,024,280 | | |
| GEA Group AG (Germany) | | Engineering Services Provider | | | 257,000 | | | | 8,464,479 | | |
Interpump Group SpA,
Warrants (Italy) (a) (b) | | Pump & Piston Manufacturer | | | 848,916 | | | | 950,436 | | |
| | | | 89,347,651 | | |
| Investment Banking & Brokerage—0.8% | |
Ichiyoshi Securities Co.,
Ltd. (Japan) | | Stock Broker | | | 2,057,800 | | | | 13,977,603 | | |
D. Carnegie & Co. AB
(Sweden) (a) (c) | | Diversified Financials Services | | | 2,314,000 | | | | 0 | | |
| | | | 13,977,603 | | |
| IT Consulting & Other Services—2.8% | |
| Atea ASA (Norway) | | Management & IT Consulting
Services | | | 2,315,900 | | | | 26,068,401 | | |
| Alten, Ltd. (France) | | Consulting & Engineering Services | | | 542,441 | | | | 20,456,360 | | |
| | | | 46,524,761 | | |
| Motorcycle Manufacturers—1.9% | |
Yamaha Motor Co., Ltd.
(Japan) (a) | | Motorcycle Manufacturer | | | 1,797,000 | | | | 31,368,646 | | |
OAKMARK INTERNATIONAL SMALL CAP FUND
58
OAKMARK INTERNATIONAL SMALL CAP FUND
Schedule of Investments—March 31, 2011 (Unaudited) cont.
| Name | | Description | | Shares Held | | Value | |
| Common Stocks—94.0% (cont.) | |
| Office Electronics—1.6% | |
| Neopost SA (France) | | Mailroom Equipment Supplier | | | 298,528 | | | $ | 26,150,186 | | |
| Packaged Foods & Meats—4.4% | |
Goodman Fielder, Ltd.
(Australia) | | Produces Food Products | | | 39,558,000 | | | | 50,327,672 | | |
Binggrae Co., Ltd.
(South Korea) | | Dairy Products Manufacturer | | | 255,800 | | | | 15,110,844 | | |
Alaska Milk Corp.
(Philippines) | | Milk Producer | | | 30,330,300 | | | | 8,735,685 | | |
| | | | 74,174,201 | | |
| Photographic Products—1.7% | |
Vitec Group PLC
(United Kingdom) (b) | | Photo Equipment & Supplies | | | 3,035,979 | | | | 29,246,241 | | |
| Real Estate Services—2.4% | |
LSL Property Services PLC
(United Kingdom) (b) | | Residential Property Service
Provider | | | 10,375,000 | | | | 40,776,737 | | |
| Research & Consulting Services—1.3% | |
| Bureau Veritas SA (France) | | Provides Consulting Services | | | 204,000 | | | | 16,022,403 | | |
| Cision AB (Sweden) (a) | | Business & Communication
Intelligence | | | 6,278,200 | | | | 5,371,169 | | |
| | | | 21,393,572 | | |
| Soft Drinks—0.8% | |
Britvic PLC
(United Kingdom) | | Soft Drink Manufacturer &
Marketer | | | 2,025,500 | | | | 12,851,003 | | |
| Specialty Chemicals—3.1% | |
Taiyo Ink Manufacturing
Co., Ltd. (Japan) | | Manufactures & Sells Resist Inks | | | 937,700 | | | | 28,859,245 | | |
| Sika AG (Switzerland) | | Manufactures Construction
Materials | | | 9,280 | | | | 22,348,786 | | |
| | | | 51,208,031 | | |
| Specialty Stores—0.4% | |
JJB Sports PLC
(United Kingdom) (a) (b) | | Sportswear & Sports Equipment
Retailer | | | 12,691,446 | | | | 6,107,882 | | |
JJB Sports PLC, Warrants
(United Kingdom) (a) (b) | | Sportswear & Sports Equipment
Retailer | | | 2,474,255 | | | | 0 | | |
| | | | 6,107,882 | | |
OAKMARK INTERNATIONAL SMALL CAP FUND
59
OAKMARK INTERNATIONAL SMALL CAP FUND
Schedule of Investments—March 31, 2011 (Unaudited) cont.
| Name | | Description | | Shares Held/
Par Value | | Value | |
| Common Stocks—94.0% (cont.) | |
| Systems Software—0.8% | |
Exact Holding NV
(Netherlands) | | Develops & Markets Business
Software | | | 414,287 | | | $ | 13,131,102 | | |
| Trading Companies & Distributors—1.7% | |
Bunzl PLC
(United Kingdom) | | Outsourcing Solutions & Service
Oriented Distribution | | | 1,751,500 | | | | 20,918,624 | | |
Travis Perkins PLC
(United Kingdom) | | Distributes Construction &
Building Trade Industries,
Timber, Plumbing & Heating
Materials | | 461,000 | | | 7,513,684 | | |
| | | | 28,432,308 | | |
| Total Common Stocks (Cost: $1,448,483,297) | | | | | | $ | 1,575,851,434 | | |
| Short Term Investment—5.3% | |
| Repurchase Agreement—5.3% | |
Fixed Income Clearing Corp. Repurchase Agreement,
0.05% dated 3/31/2011 due 4/1/2011, repurchase
price $89,516,196, collateralized by a Federal Home
Loan Bank Bond, with a rate of 0.800%, with a
maturity of 11/18/2013, and with a fair value plus
accrued interest of $4,796,550, and by a Federal
National Mortgage Association Bond, with a rate
of 0.800%, with a maturity of 11/18/2013, and
with a fair value plus accrued interest of $86,510,681
(Cost: $89,516,072) | | $ | 89,516,072 | | | $ | 89,516,072 | | |
| Total Short Term Investment (Cost: $89,516,072) | | | | $ | 89,516,072 | | |
| Total Investments (Cost: $1,537,999,369)—99.3% | | | | | 1,665,367,506 | | |
| Foreign Currencies (Cost: $838,262)—0.1% | | | | | 842,239 | | |
| Other Assets In Excess of Liabilities—0.6% | | | | | 9,696,388 | | |
| Total Net Assets—100% | | | | $ | 1,675,906,133 | | |
(a) Non-income producing security.
(b) See Note 5 in the Notes to the Financial Statements regarding investments in affiliated issuers.
(c) Fair value is determined in good faith in accordance with procedures established by the Board of Trustees.
See accompanying Notes to Financial Statements.
OAKMARK INTERNATIONAL SMALL CAP FUND
60

(This page has been intentionally left blank.)
THE OAKMARK FUNDS
61
THE OAKMARK FUNDS
Statements of Assets and Liabilities—March 31, 2011 (Unaudited)
| | | | | Oakmark
Fund | | Oakmark
Select
Fund | | Oakmark
Equity and
Income Fund | | Oakmark
Global
Fund | | Oakmark
Global Select
Fund | | Oakmark
International
Fund | | Oakmark
International
Small Cap Fund | |
| Assets | |
| Investments in unaffiliated securities, at value | | | (a) | | | $ | 4,134,734,714 | | | $ | 2,652,936,458 | | | $ | 19,602,270,506 | | | $ | 2,575,172,767 | | | $ | 448,869,847 | | | $ | 8,152,785,173 | | | $ | 1,477,855,804 | | |
| Investments in affiliated securities, at value | | | (b) | | | | 0 | | | | 0 | | | | 892,593,400 | | | | 0 | | | | 0 | | | | 49,513,903 | | | | 187,511,702 | | |
| Foreign currency, at value | | | (c) | | | | 0 | | | | 0 | | | | 0 | | | | 880,442 | | | | 0 | | | | 5,487,374 | | | | 842,239 | | |
| Receivable for: | |
| Securities sold | | | | | | | 6,903,372 | | | | 13,132,131 | | | | 178,447,205 | | | | 9,541,910 | | | | 8,965 | | | | 16,820,377 | | | | 4,221,855 | | |
| Fund shares sold | | | | | | | 9,507,216 | | | | 2,914,243 | | | | 35,014,692 | | | | 5,090,167 | | | | 2,713,912 | | | | 40,048,142 | | | | 19,327,201 | | |
| Dividends and interest (Net of foreign tax withheld) | | | | | | | 7,679,603 | | | | 2,954,669 | | | | 36,582,628 | | | | 6,042,514 | | | | 960,466 | | | | 27,823,123 | | | | 9,002,867 | | |
| Tax reclaim | | | | | | | 0 | | | | 0 | | | | 0 | | | | 1,737,296 | | | | 227,812 | | | | 9,730,327 | | | | 1,095,446 | | |
| Total receivables | | | | | 24,090,191 | | | | 19,001,043 | | | | 250,044,525 | | | | 22,411,887 | | | | 3,911,155 | | | | 94,421,969 | | | | 33,647,369 | | |
| Other assets | | | | | 41,704 | | | | 36,532 | | | | 116,724 | | | | 34,908 | | | | 25,990 | | | | 71,029 | | | | 30,546 | | |
| Total assets | | | | $ | 4,158,866,609 | | | $ | 2,671,974,033 | | | $ | 20,745,025,155 | | | $ | 2,598,500,004 | | | $ | 452,806,992 | | | $ | 8,302,279,448 | | | $ | 1,699,887,660 | | |
| Liabilities and Net Assets | |
| Payable for: | |
| Securities purchased | | | | | | $ | 22,690,169 | | | $ | 0 | | | $ | 228,373,491 | | | $ | 15,009,296 | | | $ | 5,989,967 | | | $ | 69,888,013 | | | $ | 5,798,809 | | |
| Fund shares redeemed | | | | | | | 2,123,519 | | | | 1,217,154 | | | | 150,813,476 | | | | 1,221,213 | | | | 209,910 | | | | 10,405,062 | | | | 1,227,948 | | |
| Forward foreign currency contracts | | | | | | | 0 | | | | 0 | | | | 0 | | | | 17,819,764 | | | | 1,862,300 | | | | 59,230,198 | | | | 16,123,487 | | |
| Investment advisory fee | | | | | | | 101,869 | | | | 68,216 | | | | 359,048 | | | | 68,543 | | | | 11,929 | | | | 192,642 | | | | 49,742 | | |
| Other shareholder servicing fees | | | | | | | 420,499 | | | | 261,213 | | | | 3,241,434 | | | | 239,795 | | | | 35,306 | | | | 842,154 | | | | 62,880 | | |
| Transfer and dividend disbursing agent fees | | | | | | | 363,770 | | | | 221,808 | | | | 464,915 | | | | 143,092 | | | | 42,856 | | | | 241,983 | | | | 66,247 | | |
| Trustee fees | | | | | | | 4,800 | | | | 4,919 | | | | 17,609 | | | | 2,835 | | | | 2,658 | | | | 6,062 | | | | 1,501 | | |
| Deferred trustee compensation | | | | | | | 1,007,411 | | | | 887,027 | | | | 867,498 | | | | 420,390 | | | | 13,235 | | | | 699,706 | | | | 402,261 | | |
| Other | | | | | | | 400,572 | | | | 308,951 | | | | 2,184,378 | | | | 338,797 | | | | 106,430 | | | | 669,859 | | | | 248,652 | | |
| Total liabilities | | | | | 27,112,609 | | | | 2,969,288 | | | | 386,321,849 | | | | 35,263,725 | | | | 8,274,591 | | | | 142,175,679 | | | | 23,981,527 | | |
| Net assets applicable to Fund shares outstanding | | | | $ | 4,131,754,000 | | | $ | 2,669,004,745 | | | $ | 20,358,703,306 | | | $ | 2,563,236,279 | | | $ | 444,532,401 | | | $ | 8,160,103,769 | | | $ | 1,675,906,133 | | |
| Analysis of Net Assets | |
| Paid in capital | | | | | | $ | 2,820,489,911 | | | $ | 1,813,722,605 | | | $ | 16,214,135,776 | | | $ | 2,313,752,551 | | | $ | 428,607,404 | | | $ | 7,815,563,509 | | | $ | 1,596,828,621 | | |
Accumulated undistributed net realized gain (loss) on investments, forward
contracts, short sales and foreign currency transactions | | | | | | | 7,747,180 | | | | 88,568,656 | | | | (24,925,637 | ) | | | (221,711,162 | ) | | | (23,055,040 | ) | | | (674,380,182 | ) | | | (38,268,168 | ) | |
Net unrealized appreciation on investments, forward contracts and
foreign currency translation | | | | | | | 1,295,637,551 | | | | 766,685,531 | | | | 4,045,977,495 | | | | 460,080,784 | | | | 37,167,946 | | | | 975,645,470 | | | | 111,365,194 | | |
| Accumulated undistributed net investment income | | | | | | | 7,879,358 | | | | 27,953 | | | | 123,515,672 | | | | 11,114,106 | | | | 1,812,091 | | | | 43,274,972 | | | | 5,980,486 | | |
| Net assets applicable to Fund shares outstanding | | | | $ | 4,131,754,000 | | | $ | 2,669,004,745 | | | $ | 20,358,703,306 | | | $ | 2,563,236,279 | | | $ | 444,532,401 | | | $ | 8,160,103,769 | | | $ | 1,675,906,133 | | |
| Price of Shares | |
| Net asset value per share: Class I | | | | $ | 43.43 | | | $ | 29.24 | | | $ | 29.04 | | | $ | 23.01 | | | $ | 11.64 | | | $ | 19.85 | | | $ | 14.67 | | |
| Class I—Net assets | | | | $ | 4,107,810,854 | | | $ | 2,659,773,547 | | | $ | 18,964,732,358 | | | $ | 2,510,132,798 | | | $ | 444,532,401 | | | $ | 7,946,936,160 | | | $ | 1,673,858,735 | | |
| Class I—Shares outstanding (Unlimited shares authorized) | | | | | | | 94,590,983 | | | | 90,949,596 | | | | 653,157,444 | | | | 109,089,716 | | | | 38,187,348 | | | | 400,302,527 | | | | 114,115,691 | | |
| Net asset value per share: Class II | | | | $ | 43.43 | | | $ | 29.21 | | | $ | 28.88 | | | $ | 22.58 | | | $ | 0 | | | $ | 19.96 | | | $ | 14.63 | | |
| Class II—Net assets | | | | $ | 23,943,146 | | | $ | 9,231,198 | | | $ | 1,393,970,948 | | | $ | 53,103,481 | | | $ | 0 | | | $ | 213,167,609 | | | $ | 2,047,398 | | |
| Class II—Shares outstanding (Unlimited shares authorized) | | | | | | | 551,250 | | | | 316,048 | | | | 48,265,474 | | | | 2,351,590 | | | | 0 | | | | 10,681,532 | | | | 139,948 | | |
| (a) Identified cost of investments in unaffiliated securities | | | | | | $ | 2,839,099,658 | | | $ | 1,886,255,225 | | | $ | 15,932,830,849 | | | $ | 2,097,506,790 | | | $ | 409,860,786 | | | $ | 7,096,793,505 | | | $ | 1,304,926,370 | | |
| (b) Identified cost of investments in affiliated securities | | | | | | | 0 | | | | 0 | | | | 516,134,974 | | | | 0 | | | | 0 | | | | 71,383,556 | | | | 233,072,999 | | |
| (c) Identified cost of foreign currency | | | | | | | 0 | | | | 0 | | | | 0 | | | | 883,469 | | | | 0 | | | | 5,492,360 | | | | 838,262 | | |
THE OAKMARK FUNDS
62
See accompanying Notes to Financial Statements.
THE OAKMARK FUNDS
63
THE OAKMARK FUNDS
Statements of Operations—March 31, 2011 (Unaudited)
| | | Oakmark
Fund | | Oakmark
Select
Fund | | Oakmark
Equity and
Income Fund | | Oakmark
Global
Fund | |
| Investment Income: | |
| Dividends from unaffiliated securities | | $ | 33,638,701 | | | $ | 15,870,777 | | | $ | 88,765,313 | | | $ | 14,972,620 | | |
| Dividends from affiliated securities | | | 0 | | | | 0 | | | | 2,797,500 | | | | 0 | | |
| Interest income | | | 108,104 | | | | 66,581 | | | | 56,200,855 | | | | 36,759 | | |
| Security lending income | | | 0 | | | | 44,702 | | | | 0 | | | | 71,720 | | |
| Foreign taxes withheld | | | (191,365 | ) | | | (207,472 | ) | | | (1,304,626 | ) | | | (527,931 | ) | |
| Total investment income | | | 33,555,440 | | | | 15,774,588 | | | | 146,459,042 | | | | 14,553,168 | | |
| Expenses: | |
| Investment advisory fee | | | 17,374,556 | | | | 11,851,839 | | | | 63,726,438 | | | | 11,501,039 | | |
| Transfer and dividend disbursing agent fees | | | 569,560 | | | | 335,175 | | | | 753,378 | | | | 223,292 | | |
| Other shareholder servicing fees | | | 1,186,589 | | | | 878,710 | | | | 8,333,218 | | | | 856,755 | | |
| Service fee—Class II | | | 11,650 | | | | 10,715 | | | | 1,574,522 | | | | 65,340 | | |
| Reports to shareholders | | | 173,780 | | | | 114,071 | | | | 540,002 | | | | 120,113 | | |
| Custody and accounting fees | | | 161,488 | | | | 113,940 | | | | 972,201 | | | | 329,099 | | |
| Registration and blue sky expenses | | | 68,078 | | | | 38,276 | | | | 183,940 | | | | 57,696 | | |
| Trustees fees | | | 197,770 | | | | 173,666 | | | | 338,233 | | | | 117,456 | | |
| Legal fees | | | 28,648 | | | | 24,914 | | | | 80,366 | | | | 23,351 | | |
| Audit fees | | | 17,014 | | | | 14,460 | | | | 57,210 | | | | 13,462 | | |
| Other | | | 143,732 | | | | 134,427 | | | | 315,089 | | | | 130,108 | | |
| Total expenses | | | 19,932,865 | | | | 13,690,193 | | | | 76,874,597 | | | | 13,437,711 | | |
| Net Investment Income (Loss) | | | 13,622,575 | | | | 2,084,395 | | | | 69,584,445 | | | | 1,115,457 | | |
| Net realized and unrealized gain (loss): | |
| Net realized gain (loss) on: | |
| Unaffiliated investments | | | 16,042,337 | | | | 99,029,007 | | | | 382,359,419 | | | | 69,128,504 | | |
| Affiliated investments | | | 0 | | | | 0 | | | | (390,579 | ) | | | 0 | | |
| Forward foreign currency contracts | | | 0 | | | | 0 | | | | 0 | | | | (4,976,961 | ) | |
| Foreign currency transactions | | | (240 | ) | | | (438 | ) | | | (861,539 | ) | | | 752,293 | | |
| Net realized gain | | | 16,042,097 | | | | 99,028,569 | | | | 381,107,301 | | | | 64,903,836 | | |
| Net change in unrealized appreciation (depreciation) on: | |
| Investments | | | 451,269,235 | | | | 237,690,262 | | | | 1,813,739,516 | | | | 222,370,369 | | |
| Forward foreign currency contracts | | | 0 | | | | 0 | | | | 0 | | | | (5,755,796 | ) | |
| Foreign currency translation | | | 3,038 | | | | 5,290 | | | | 24,863 | | | | (485,825 | ) | |
| Net change in unrealized appreciation (depreciation) | | | 451,272,273 | | | | 237,695,552 | | | | 1,813,764,379 | | | | 216,128,748 | | |
| Net realized and unrealized gain | | | 467,314,370 | | | | 336,724,121 | | | | 2,194,871,680 | | | | 281,032,584 | | |
| Net increase in net assets resulting from operations | | $ | 480,936,945 | | | $ | 338,808,516 | | | $ | 2,264,456,125 | | | $ | 282,148,041 | | |
THE OAKMARK FUNDS
64
| | | Oakmark
Global Select
Fund | | Oakmark
International
Fund | | Oakmark
International
Small Cap Fund | |
| Investment Income: | |
| Dividends from unaffiliated securities | | $ | 2,076,434 | | | $ | 59,764,255 | | | $ | 12,755,212 | | |
| Dividends from affiliated securities | | | 0 | | | | 721,297 | | | | 2,418,185 | | |
| Interest income | | | 8,978 | | | | 162,756 | | | | 42,193 | | |
| Security lending income | | | 7,185 | | | | 0 | | | | 51,208 | | |
| Foreign taxes withheld | | | (66,823 | ) | | | (3,995,547 | ) | | | (1,180,956 | ) | |
| Total investment income | | | 2,025,774 | | | | 56,652,761 | | | | 14,085,842 | | |
| Expenses: | |
| Investment advisory fee | | | 1,849,056 | | | | 30,339,851 | | | | 8,265,402 | | |
| Transfer and dividend disbursing agent fees | | | 71,095 | | | | 440,136 | | | | 123,238 | | |
| Other shareholder servicing fees | | | 146,208 | | | | 2,854,135 | | | | 693,594 | | |
| Service fee—Class II | | | 0 | | | | 188,164 | | | | 1,759 | | |
| Reports to shareholders | | | 29,243 | | | | 249,936 | | | | 120,187 | | |
| Custody and accounting fees | | | 47,598 | | | | 1,309,183 | | | | 404,949 | | |
| Registration and blue sky expenses | | | 45,471 | | | | 199,909 | | | | 65,225 | | |
| Trustees fees | | | 54,571 | | | | 190,972 | | | | 106,276 | | |
| Legal fees | | | 17,795 | | | | 34,824 | | | | 19,862 | | |
| Audit fees | | | 9,012 | | | | 24,113 | | | | 11,460 | | |
| Other | | | 86,522 | | | | 175,406 | | | | 105,405 | | |
| Total expenses | | | 2,356,571 | | | | 36,006,629 | | | | 9,917,357 | | |
| Net Investment Income (Loss) | | | (330,797 | ) | | | 20,646,132 | | | | 4,168,485 | | |
| Net realized and unrealized gain (loss): | |
| Net realized gain (loss) on: | |
| Unaffiliated investments | | | 20,032,441 | | | | 230,814,206 | | | | 71,603,417 | | |
| Affiliated investments | | | 0 | | | | 0 | | | | 5,556,016 | | |
| Forward foreign currency contracts | | | (996,309 | ) | | | (10,623,123 | ) | | | (1,013,597 | ) | |
| Foreign currency transactions | | | 21,610 | | | | 1,629,094 | | | | 138,061 | | |
| Net realized gain | | | 19,057,742 | | | | 221,820,177 | | | | 76,283,897 | | |
| Net change in unrealized appreciation (depreciation) on: | |
| Investments | | | 29,981,505 | | | | 394,806,764 | | | | 103,559,082 | | |
| Forward foreign currency contracts | | | 73,104 | | | | (26,903,523 | ) | | | (9,225,445 | ) | |
| Foreign currency translation | | | (7,168 | ) | | | (1,805,034 | ) | | | 19,873 | | |
| Net change in unrealized appreciation (depreciation) | | | 30,047,441 | | | | 366,098,207 | | | | 94,353,510 | | |
| Net realized and unrealized gain | | | 49,105,183 | | | | 587,918,384 | | | | 170,637,407 | | |
| Net increase in net assets resulting from operations | | $ | 48,774,386 | | | $ | 608,564,516 | | | $ | 174,805,892 | | |
See accompanying Notes to Financial Statements.
THE OAKMARK FUNDS
65
THE OAKMARK FUNDS
Statements of Changes in Net Assets
| | | Oakmark Fund | |
| | | Six Months Ended
March 31, 2011 (Unaudited) | | Year Ended
September 30, 2010 | |
| From Operations: | |
| Net investment income | | $ | 13,622,575 | | | $ | 21,857,679 | | |
| Net realized gain (loss) | | | 16,042,097 | | | | 423,954,723 | | |
| Net change in unrealized appreciation (depreciation) | | | 451,272,273 | | | | (81,870,354 | ) | |
| Net increase in net assets from operations | | | 480,936,945 | | | | 363,942,048 | | |
| Distributions to shareholders from: | |
| Net investment income—Class I | | | (22,582,755 | ) | | | (21,156,850 | ) | |
| Net investment income—Class II | | | (34,133 | ) | | | (34,759 | ) | |
| Total distributions to shareholders | | | (22,616,888 | ) | | | (21,191,609 | ) | |
| From Fund share transactions: | |
| Proceeds from shares sold—Class I | | | 504,131,726 | | | | 799,975,316 | | |
| Proceeds from shares sold—Class II | | | 16,478,454 | | | | 2,866,848 | | |
| Reinvestment of distributions—Class I | | | 21,103,478 | | | | 20,326,440 | | |
| Reinvestment of distributions—Class II | | | 26,751 | | | | 30,259 | | |
| Payment for shares redeemed—Class I | | | (294,027,274 | ) | | | (887,527,212 | ) | |
| Payment for shares redeemed—Class II | | | (2,778,929 | ) | | | (2,885,222 | ) | |
| Redemption fees—Class I | | | 154,804 | | | | 423,673 | | |
| Redemption fees—Class II | | | 540 | | | | 1,038 | | |
Net increase (decrease) in net assets from Fund
share transactions | | | 245,089,550 | | | | (66,788,860 | ) | |
| Total increase in net assets | | | 703,409,607 | | | | 275,961,579 | | |
| Net assets: | |
| Beginning of period | | | 3,428,344,393 | | | | 3,152,382,814 | | |
| End of period | | $ | 4,131,754,000 | | | $ | 3,428,344,393 | | |
| Undistributed net investment income | | $ | 7,879,358 | | | $ | 16,873,911 | | |
| Fund Share Transactions—Class I: | |
| Shares sold | | | 12,038,218 | | | | 21,386,897 | | |
| Shares issued in reinvestment of dividends | | | 514,343 | | | | 560,729 | | |
| Less shares redeemed | | | (7,100,852 | ) | | | (23,800,270 | ) | |
| Net increase (decrease) in shares outstanding | | | 5,451,709 | | | | (1,852,644 | ) | |
| Fund Share Transactions—Class II: | |
| Shares sold | | | 381,263 | | | | 77,551 | | |
| Shares issued in reinvestment of dividends | | | 652 | | | | 833 | | |
| Less shares redeemed | | | (66,106 | ) | | | (79,105 | ) | |
| Net increase (decrease) in shares outstanding | | | 315,809 | | | | (721 | ) | |
THE OAKMARK FUNDS
66
| | | Oakmark Select Fund | |
| | | Six Months Ended
March 31, 2011 (Unaudited) | | Year Ended
September 30, 2010 | |
| From Operations: | |
| Net investment income | | $ | 2,084,395 | | | $ | 5,386,140 | | |
| Net realized gain (loss) | | | 99,028,569 | | | | 240,500,877 | | |
| Net change in unrealized appreciation (depreciation) | | | 237,695,552 | | | | 51,224,765 | | |
| Net increase in net assets from operations | | | 338,808,516 | | | | 297,111,782 | | |
| Distributions to shareholders from: | |
| Net investment income—Class I | | | (5,174,454 | ) | | | (7,132,187 | ) | |
| Net investment income—Class II | | | 0 | | | | (19,757 | ) | |
| Total distributions to shareholders | | | (5,174,454 | ) | | | (7,151,944 | ) | |
| From Fund share transactions: | |
| Proceeds from shares sold—Class I | | | 146,533,460 | | | | 326,985,097 | | |
| Proceeds from shares sold—Class II | | | 1,722,703 | | | | 2,299,260 | | |
| Reinvestment of distributions—Class I | | | 5,035,031 | | | | 6,851,237 | | |
| Reinvestment of distributions—Class II | | | 0 | | | | 13,852 | | |
| Payment for shares redeemed—Class I | | | (232,205,791 | ) | | | (480,569,972 | ) | |
| Payment for shares redeemed—Class II | | | (1,962,888 | ) | | | (3,028,895 | ) | |
| Redemption fees—Class I | | | 68,528 | | | | 262,444 | | |
| Redemption fees—Class II | | | 235 | | | | 938 | | |
Net decrease in net assets from Fund
share transactions | | | (80,808,722 | ) | | | (147,186,039 | ) | |
| Total increase in net assets | | | 252,825,340 | | | | 142,773,799 | | |
| Net assets: | |
| Beginning of period | | | 2,416,179,405 | | | | 2,273,405,606 | | |
| End of period | | $ | 2,669,004,745 | | | $ | 2,416,179,405 | | |
| Undistributed net investment income | | $ | 27,953 | | | $ | 3,118,450 | | |
| Fund Share Transactions—Class I: | |
| Shares sold | | | 5,206,899 | | | | 13,275,352 | | |
| Shares issued in reinvestment of dividends | | | 184,908 | | | | 288,230 | | |
| Less shares redeemed | | | (8,364,636 | ) | | | (19,511,099 | ) | |
| Net decrease in shares outstanding | | | (2,972,829 | ) | | | (5,947,517 | ) | |
| Fund Share Transactions—Class II: | |
| Shares sold | | | 61,863 | | | | 93,422 | | |
| Shares issued in reinvestment of dividends | | | 0 | | | | 582 | | |
| Less shares redeemed | | | (71,329 | ) | | | (124,689 | ) | |
| Net decrease in shares outstanding | | | (9,466 | ) | | | (30,685 | ) | |
See accompanying Notes to Financial Statements.
THE OAKMARK FUNDS
67
THE OAKMARK FUNDS
Statements of Changes in Net Assets
| | | Oakmark
Equity and Income Fund | |
| | | Six Months Ended
March 31, 2011 (Unaudited) | | Year Ended
September 30, 2010 | |
| From Operations: | |
| Net investment income | | $ | 69,584,445 | | | $ | 178,887,020 | | |
| Net realized gain (loss) | | | 381,107,301 | | | | 477,150,561 | | |
| Net change in unrealized appreciation (depreciation) | | | 1,813,764,379 | | | | 337,786,901 | | |
| Net increase in net assets from operations | | | 2,264,456,125 | | | | 993,824,482 | | |
| Distributions to shareholders from: | |
| Net investment income—Class I | | | (145,543,265 | ) | | | (176,400,765 | ) | |
| Net investment income—Class II | | | (6,971,784 | ) | | | (10,838,558 | ) | |
| Total distributions to shareholders | | | (152,515,049 | ) | | | (187,239,323 | ) | |
| From Fund share transactions: | |
| Proceeds from shares sold—Class I | | | 1,657,984,497 | | | | 4,697,621,034 | | |
| Proceeds from shares sold—Class II | | | 207,407,779 | | | | 443,828,203 | | |
| Reinvestment of distributions—Class I | | | 137,138,045 | | | | 167,328,478 | | |
| Reinvestment of distributions—Class II | | | 6,154,812 | | | | 9,545,348 | | |
| Payment for shares redeemed—Class I | | | (1,787,198,361 | ) | | | (3,036,467,956 | ) | |
| Payment for shares redeemed—Class II | | | (238,595,418 | ) | | | (353,387,937 | ) | |
Net increase (decrease) in net assets from Fund
share transactions | | | (17,108,646 | ) | | | 1,928,467,170 | | |
| Total increase in net assets | | | 2,094,832,430 | | | | 2,735,052,329 | | |
| Net assets: | |
| Beginning of period | | | 18,263,870,876 | | | | 15,528,818,547 | | |
| End of period | | $ | 20,358,703,306 | | | $ | 18,263,870,876 | | |
| Undistributed net investment income | | $ | 123,515,672 | | | $ | 151,497,569 | | |
| Fund Share Transactions—Class I: | |
| Shares sold | | | 59,834,021 | | | | 181,801,022 | | |
| Shares issued in reinvestment of dividends | | | 4,990,467 | | | | 6,621,627 | | |
| Less shares redeemed | | | (64,572,009 | ) | | | (118,848,582 | ) | |
| Net increase in shares outstanding | | | 252,479 | | | | 69,574,067 | | |
| Fund Share Transactions—Class II: | |
| Shares sold | | | 7,570,595 | | | | 17,409,772 | | |
| Shares issued in reinvestment of dividends | | | 224,956 | | | | 379,386 | | |
| Less shares redeemed | | | (8,663,806 | ) | | | (13,851,751 | ) | |
| Net increase (decrease) in shares outstanding | | | (868,255 | ) | | | 3,937,407 | | |
THE OAKMARK FUNDS
68
| | | Oakmark
Global Fund | |
| | | Six Months Ended
March 31, 2011 (Unaudited) | | Year Ended
September 30, 2010 | |
| From Operations: | |
| Net investment income | | $ | 1,115,457 | | | $ | 9,808,309 | | |
| Net realized gain (loss) | | | 64,903,836 | | | | (5,918,406 | ) | |
| Net change in unrealized appreciation (depreciation) | | | 216,128,748 | | | | 147,375,842 | | |
| Net increase in net assets from operations | | | 282,148,041 | | | | 151,265,745 | | |
| Distributions to shareholders from: | |
| Net investment income—Class I | | | (9,073,144 | ) | | | (12,402,598 | ) | |
| Net investment income—Class II | | | (7,416 | ) | | | (272,894 | ) | |
| Total distributions to shareholders | | | (9,080,560 | ) | | | (12,675,492 | ) | |
| From Fund share transactions: | |
| Proceeds from shares sold—Class I | | | 403,749,677 | | | | 523,823,054 | | |
| Proceeds from shares sold—Class II | | | 2,518,249 | | | | 4,050,063 | | |
| Reinvestment of distributions—Class I | | | 8,471,575 | | | | 11,915,866 | | |
| Reinvestment of distributions—Class II | | | 7,229 | | | | 265,430 | | |
| Payment for shares redeemed—Class I | | | (200,696,869 | ) | | | (315,022,656 | ) | |
| Payment for shares redeemed—Class II | | | (6,390,503 | ) | | | (11,794,654 | ) | |
| Redemption fees—Class I | | | 180,930 | | | | 225,364 | | |
| Redemption fees—Class II | | | 4,098 | | | | 6,446 | | |
Net increase in net assets from Fund
share transactions | | | 207,844,386 | | | | 213,468,913 | | |
| Total increase in net assets | | | 480,911,867 | | | | 352,059,166 | | |
| Net assets: | |
| Beginning of period | | | 2,082,324,412 | | | | 1,730,265,246 | | |
| End of period | | $ | 2,563,236,279 | | | $ | 2,082,324,412 | | |
| Undistributed net investment income | | $ | 11,114,106 | | | $ | 17,645,912 | | |
| Fund Share Transactions—Class I: | |
| Shares sold | | | 18,127,922 | | | | 26,687,553 | | |
| Shares issued in reinvestment of dividends | | | 380,745 | | | | 623,215 | | |
| Less shares redeemed | | | (9,084,604 | ) | | | (16,141,166 | ) | |
| Net increase in shares outstanding | | | 9,424,063 | | | | 11,169,602 | | |
| Fund Share Transactions—Class II: | |
| Shares sold | | | 114,397 | | | | 208,798 | | |
| Shares issued in reinvestment of dividends | | | 330 | | | | 14,126 | | |
| Less shares redeemed | | | (290,925 | ) | | | (622,786 | ) | |
| Net decrease in shares outstanding | | | (176,198 | ) | | | (399,862 | ) | |
See accompanying Notes to Financial Statements.
THE OAKMARK FUNDS
69
THE OAKMARK FUNDS
Statements of Changes in Net Assets
| | | Oakmark
Global Select Fund | |
| | | Six Months Ended
March 31, 2011 (Unaudited) | | Year Ended
September 30, 2010 | |
| From Operations: | |
| Net investment income (loss) | | $ | (330,797 | ) | | $ | 1,254,195 | | |
| Net realized gain (loss) | | | 19,057,742 | | | | 25,351,257 | | |
| Net change in unrealized appreciation (depreciation) | | | 30,047,441 | | | | (9,893,538 | ) | |
| Net increase in net assets from operations | | | 48,774,386 | | | | 16,711,914 | | |
| Distributions to shareholders from: | |
| Net investment income—Class I | | | (809,546 | ) | | | (1,100,573 | ) | |
| Total distributions to shareholders | | | (809,546 | ) | | | (1,100,573 | ) | |
| From Fund share transactions: | |
| Proceeds from shares sold—Class I | | | 107,722,892 | | | | 129,543,242 | | |
| Reinvestment of distributions—Class I | | | 751,763 | | | | 1,057,320 | | |
| Payment for shares redeemed—Class I | | | (41,887,501 | ) | | | (82,661,825 | ) | |
| Redemption fees—Class I | | | 33,996 | | | | 149,484 | | |
Net increase in net assets from Fund
share transactions | | | 66,621,150 | | | | 48,088,221 | | |
| Total increase in net assets | | | 114,585,990 | | | | 63,699,562 | | |
| Net assets: | |
| Beginning of period | | | 329,946,411 | | | | 266,246,849 | | |
| End of period | | $ | 444,532,401 | | | $ | 329,946,411 | | |
| Undistributed net investment income | | $ | 1,812,091 | | | $ | 2,660,282 | | |
| Fund Share Transactions—Class I: | |
| Shares sold | | | 9,340,633 | | | | 12,903,259 | | |
| Shares issued in reinvestment of dividends | | | 68,342 | | | | 106,800 | | |
| Less shares redeemed | | | (3,728,273 | ) | | | (8,410,465 | ) | |
| Net increase in shares outstanding | | | 5,680,702 | | | | 4,599,594 | | |
THE OAKMARK FUNDS
70
| | | Oakmark
International Fund | |
| | | Six Months Ended
March 31, 2011 (Unaudited) | | Year Ended
September 30, 2010 | |
| From Operations: | |
| Net investment income | | $ | 20,646,132 | | | $ | 57,742,571 | | |
| Net realized gain (loss) | | | 221,820,177 | | | | 258,754,397 | | |
| Net change in unrealized appreciation (depreciation) | | | 366,098,207 | | | | 263,515,765 | | |
| Net increase in net assets from operations | | | 608,564,516 | | | | 580,012,733 | | |
| Distributions to shareholders from: | |
| Net investment income—Class I | | | (53,192,511 | ) | | | (30,251,205 | ) | |
| Net investment income—Class II | | | (937,788 | ) | | | (813,198 | ) | |
| Total distributions to shareholders | | | (54,130,299 | ) | | | (31,064,403 | ) | |
| From Fund share transactions: | |
| Proceeds from shares sold—Class I | | | 2,232,983,318 | | | | 2,132,370,087 | | |
| Proceeds from shares sold—Class II | | | 86,470,214 | | | | 76,521,263 | | |
| Reinvestment of distributions—Class I | | | 48,812,222 | | | | 28,189,018 | | |
| Reinvestment of distributions—Class II | | | 580,260 | | | | 536,588 | | |
| Payment for shares redeemed—Class I | | | (583,226,840 | ) | | | (1,034,936,877 | ) | |
| Payment for shares redeemed—Class II | | | (33,852,925 | ) | | | (52,444,514 | ) | |
| Redemption fees—Class I | | | 479,299 | | | | 977,761 | | |
| Redemption fees—Class II | | | 12,777 | | | | 25,062 | | |
Net increase in net assets from Fund
share transactions | | | 1,752,258,325 | | | | 1,151,238,388 | | |
| Total increase in net assets | | | 2,306,692,542 | | | | 1,700,186,718 | | |
| Net assets: | |
| Beginning of period | | | 5,853,411,227 | | | | 4,153,224,509 | | |
| End of period | | $ | 8,160,103,769 | | | $ | 5,853,411,227 | | |
| Undistributed net investment income | | $ | 43,274,972 | | | $ | 85,753,168 | | |
| Fund Share Transactions—Class I: | |
| Shares sold | | | 113,974,896 | | | | 125,216,209 | | |
| Shares issued in reinvestment of dividends | | | 2,534,383 | | | | 1,700,182 | | |
| Less shares redeemed | | | (30,163,135 | ) | | | (61,953,135 | ) | |
| Net increase in shares outstanding | | | 86,346,144 | | | | 64,963,256 | | |
| Fund Share Transactions—Class II: | |
| Shares sold | | | 4,383,710 | | | | 4,470,636 | | |
| Shares issued in reinvestment of dividends | | | 29,941 | | | | 32,150 | | |
| Less shares redeemed | | | (1,731,632 | ) | | | (3,087,224 | ) | |
| Net increase in shares outstanding | | | 2,682,019 | | | | 1,415,562 | | |
See accompanying Notes to Financial Statements.
THE OAKMARK FUNDS
71
THE OAKMARK FUNDS
Statements of Changes in Net Assets
| | | Oakmark
International Small Cap Fund | |
| | | Six Months Ended
March 31, 2011 (Unaudited) | | Year Ended
September 30, 2010 | |
| From Operations: | |
| Net investment income | | $ | 4,168,485 | | | $ | 9,752,864 | | |
| Net realized gain (loss) | | | 76,283,897 | | | | 64,192,435 | | |
| Net change in unrealized appreciation (depreciation) | | | 94,353,510 | | | | 60,599,100 | | |
| Net increase in net assets from operations | | | 174,805,892 | | | | 134,544,399 | | |
| Distributions to shareholders from: | |
| Net investment income—Class I | | | (8,015,010 | ) | | | (11,557,905 | ) | |
| Net investment income—Class II | | | (4,287 | ) | | | (11,218 | ) | |
| Total distributions to shareholders | | | (8,019,297 | ) | | | (11,569,123 | ) | |
| From Fund share transactions: | |
| Proceeds from shares sold—Class I | | | 481,492,618 | | | | 531,405,341 | | |
| Proceeds from shares sold—Class II | | | 872,358 | | | | 1,158,779 | | |
| Reinvestment of distributions—Class I | | | 7,375,297 | | | | 10,953,374 | | |
| Reinvestment of distributions—Class II | | | 1,630 | | | | 6,783 | | |
| Payment for shares redeemed—Class I | | | (198,906,002 | ) | | | (216,310,867 | ) | |
| Payment for shares redeemed—Class II | | | (451,535 | ) | | | (683,491 | ) | |
| Redemption fees—Class I | | | 84,891 | | | | 319,527 | | |
| Redemption fees—Class II | | | 96 | | | | 349 | | |
Net increase in net assets from Fund
share transactions | | | 290,469,353 | | | | 326,849,795 | | |
| Total increase in net assets | | | 457,255,948 | | | | 449,825,071 | | |
| Net assets: | |
| Beginning of period | | | 1,218,650,185 | | | | 768,825,114 | | |
| End of period | | $ | 1,675,906,133 | | | $ | 1,218,650,185 | | |
| Undistributed net investment income | | $ | 5,980,486 | | | $ | 10,706,834 | | |
| Fund Share Transactions—Class I: | |
| Shares sold | | | 34,339,046 | | | | 43,865,444 | | |
| Shares issued in reinvestment of dividends | | | 528,316 | | | | 934,588 | | |
| Less shares redeemed | | | (14,240,057 | ) | | | (18,014,230 | ) | |
| Net increase in shares outstanding | | | 20,627,305 | | | | 26,785,802 | | |
| Fund Share Transactions—Class II: | |
| Shares sold | | | 61,486 | | | | 95,271 | | |
| Shares issued in reinvestment of dividends | | | 117 | | | | 580 | | |
| Less shares redeemed | | | (32,196 | ) | | | (57,214 | ) | |
| Net increase in shares outstanding | | | 29,407 | | | | 38,637 | | |
THE OAKMARK FUNDS
72
THE OAKMARK FUNDS
Notes to Financial Statements (Unaudited)
1. SIGNIFICANT ACCOUNTING POLICIES
The following are the significant accounting policies of Oakmark Fund ("Oakmark"), Oakmark Select Fund ("Select"), Oakmark Equity and Income Fund ("Equity and Income"), Oakmark Global Fund ("Global"), Oakmark Global Select Fund ("Global Select"), Oakmark International Fund ("International"), and Oakmark International Small Cap Fund ("Int'l Small Cap"), collectively referred to as the "Funds," each a series of Harris Associates Investment Trust (the "Trust"), a Massachusetts business trust, organized on February 1, 1991, which is registered as an open-end management investment company under the Investment Company Act of 1940. Each Fund, other than Select and Global Select, is diversified. The following policies are in conformity with accounting principles generally accepted in the United States of America ("GAAP"). The presentation of financial statements in conformity with GAAP requires management to make estimates and assumptions that affect the reported amounts of assets and liabilities at the date of the financial statements and the reported amounts of revenues and expenses during the reporting period. Actual results could differ from those estimates and assumptions.
Class disclosure—
Each Fund offers two classes of shares: Class I Shares and Class II Shares. Class I Shares are offered to the general public. Class II Shares are offered to certain retirement plans such as 401(k) and profit sharing plans. Class II Shares pay a service fee at the annual rate of up to 0.25% of average net assets of Class II Shares of the Funds. This service fee is paid to a third-party administrator for performing the services associated with the administration of such retirement plans. Class I Shares do not have an associated service fee. Global Select Class II had no outstanding shares at March 31, 2011.
Income, realized and unrealized capital gains and losses, and expenses of the Funds not directly attributable to a specific class of shares are allocated to each class pro rata based on the relative net assets of each class. Transfer and dividend disbursing agent fees and other shareholder servicing fees are specific to each class.
Redemption fees—
Each Fund, except Equity and Income, imposes a short-term trading fee on redemptions of shares held for 90 days or less to offset two types of costs to the Fund caused by short-term trading: portfolio transaction and market impact costs associated with erratic redemption activity and administrative costs associated with processing redemptions. The fee is 2% of the redemption value and is deducted from either the redemption proceeds or from the balance in the account. The "first-in, first-out" ("FIFO") method is used to determine the holding period. The Funds may approve the waiver of redemption fees on certain types of accounts held through intermediaries, pursuant to the Funds' policies and procedures.
Security valuation—
The Funds' share prices or net asset values ("NAVs") are calculated as of the close of regular session trading (usually 4:00 pm Eastern time) on the New York Stock Exchange ("NYSE") on any day on which the NYSE is open for trading. Equity securities principally traded on securities exchanges in the United States and over-the-counter securities are valued at the last sales price or the official closing price on the day of valuation, or lacking any reported sales that day, at the most recent bid quotation. Securities traded on the NASDAQ National Market are valued at the NASDAQ Official Closing Price ("NOCP"), or lacking an NOCP, at the most recent bid quotation on the NASDAQ National Market. Equity securities principally traded on securities exchanges outside the United States shall be valued, depending on local convention or regulation, at the last sales price, the last bid or asked price, the mean between the last bid and asked prices, or the official closing price, or shall be based on a pricing composite as of the close of the regular trading hours on the appropriate exchange or other designated time. Debt obligations and money market instruments maturing in more than 60 days from the date of purchase are valued at the latest bid quotation or at an evaluated price provided by an independent professional pricing service. Debt obligations and money market instruments maturing in less than 61 days from the date of purchase are valued at amortized cost, which approximates fair value. Options are valued at the last reported sales price on the day of valuation or, lacking any reported sale price on the valuation date, at the mean of the most recent bid and asked quotations or, if the mean is not available, at the most recent bid quotation.
Securities for which quotations are not readily available or securities that may have been affected by a significant event occurring between the close of a foreign market and the close of the NYSE are valued at fair value, determined by or under the direction of the pricing committee established by the Board of Trustees. A significant event may include the performance of U.S. markets since the close of foreign markets. The Funds may use a systematic fair valuation model provided by an independent professional pricing service to value foreign securities in order to adjust for stale pricing, which may occur between the close of certain foreign exchanges and the close of the NYSE. At March 31, 2011 Equity and Income and Int'l Small Cap held securities for which market quotations were not readily available and which were valued by the pricing committee at a fair value determined in good faith in accordance with procedures established by the Board of Trustees.
THE OAKMARK FUNDS
73
THE OAKMARK FUNDS
Notes to Financial Statements (Unaudited) (cont.)
Fair value measurement—
Various inputs are used in determining the value of each Fund's investments. These inputs are prioritized into three broad levels as follows:
Level 1—quoted prices in active markets for identical securities
Level 2—other significant observable inputs (including quoted prices for similar investments, interest rates, prepayment speeds, credit risk, and others)
Level 3—significant unobservable inputs (including the Fund's own assumptions in determining the fair value of investments)
Observable inputs are those based on market data obtained from independent sources, and unobservable inputs reflect the Funds' own assumptions based on the best information available. The input levels are not necessarily an indication of risk or liquidity associated with investing in those securities.
There were no significant transfers between level 1 and level 2 securities at the period ended March 31, 2011.
The following is a summary of the inputs used as of March 31, 2011 in valuing each Fund's assets and liabilities. Except for the industries or investment types separately stated below, the total amounts for common stocks, fixed-income and short-term investments in the table below are presented by industry or investment type in each Fund's Schedule of Investments. Forward foreign currency contracts are presented by contract in the notes following the below summary:
| | | Quoted Prices
in Active
Markets for
Identical
Assets
(Level 1) | | Other
Significant
Observable
Inputs
(Level 2) | | Significant
Unobservable
Inputs
(Level 3) | |
| Oakmark | | | | | | | | | | | | | |
| Common Stocks | | $ | 3,913,294,935 | | | $ | 0 | | | $ | 0 | | |
| Short Term Investments | | | 0 | | | | 221,439,779 | | | | 0 | | |
| Total | | $ | 3,913,294,935 | | | $ | 221,439,779 | | | $ | 0 | | |
| Select | | | | | | | | | | | | | |
| Common Stocks | | $ | 2,535,725,723 | | | $ | 0 | | | $ | 0 | | |
| Short Term Investments | | | 0 | | | | 117,210,735 | | | | 0 | | |
| Total | | $ | 2,535,725,723 | | | $ | 117,210,735 | | | $ | 0 | | |
| Equity and Income | | | | | | | | | | | | | |
| Common Stocks - Packaged Food & Meats | | $ | 0 | | | $ | 625,125,071 | | | $ | 0 | | |
| Common Stocks - All Other | | | 13,192,033,573 | | | | 0 | | | | 0 | | |
| Fixed Income | | | 0 | | | | 4,743,008,864 | | | | 0 | | |
| Short Term Investments | | | 0 | | | | 1,934,696,398 | | | | 0 | | |
| Total | | $ | 13,192,033,573 | | | $ | 7,302,830,333 | | | $ | 0 | | |
| Global | | | | | | | | | | | | | |
| Common Stocks | | $ | 2,536,722,199 | | | $ | 0 | | | $ | 0 | | |
| Short Term Investments | | | 0 | | | | 38,450,568 | | | | 0 | | |
| Forward Foreign Currency Contracts - Assets | | | 0 | | | | 3,817,377 | | | | 0 | | |
| Forward Foreign Currency Contracts - Liabilities | | | 0 | | | | (21,637,141 | ) | | | 0 | | |
| Total | | $ | 2,536,722,199 | | | $ | 20,630,804 | | | $ | 0 | | |
| Global Select | | | | | | | | | | | | | |
| Common Stocks | | $ | 420,830,177 | | | $ | 0 | | | $ | 0 | | |
| Short Term Investments | | | 0 | | | | 28,039,670 | | | | 0 | | |
| Forward Foreign Currency Contracts - Assets | | | 0 | | | | 942,675 | | | | 0 | | |
| Forward Foreign Currency Contracts - Liabilities | | | 0 | | | | (2,804,975 | ) | | | 0 | | |
| Total | | $ | 420,830,177 | | | $ | 26,177,370 | | | $ | 0 | | |
THE OAKMARK FUNDS
74
THE OAKMARK FUNDS
Notes to Financial Statements (Unaudited) (cont.)
| | | Quoted Prices
in Active
Markets for
Identical
Assets
(Level 1) | | Other
Significant
Observable
Inputs
(Level 2) | | Significant
Unobservable
Inputs
(Level 3) | |
| International | | | | | | | | | | | | | |
| Common Stocks | | $ | 7,889,841,625 | | | $ | 0 | | | $ | 0 | | |
| Short Term Investments | | | 0 | | | | 312,457,451 | | | | 0 | | |
| Forward Foreign Currency Contracts - Assets | | | 0 | | | | 15,414,073 | | | | 0 | | |
| Forward Foreign Currency Contracts - Liabilities | | | 0 | | | | (74,644,271 | ) | | | 0 | | |
| Total | | $ | 7,889,841,625 | | | $ | 253,227,253 | | | $ | 0 | | |
| Int'l Small Cap+ | | | | | | | | | | | | | |
| Common Stocks | | $ | 1,575,851,434 | | | $ | 0 | | | $ | 0 | + | |
| Short Term Investments | | | 0 | | | | 89,516,072 | | | | 0 | | |
| Forward Foreign Currency Contracts - Assets | | | 0 | | | | 3,091,134 | | | | 0 | | |
| Forward Foreign Currency Contracts - Liabilities | | | 0 | | | | (19,214,621 | ) | | | 0 | | |
| Total | | $ | 1,575,851,434 | | | $ | 73,392,585 | | | $ | 0 | | |
+ On September 30, 2010, Int'l Small Cap held a security classified as Level 3 within the Investment Banking and Brokerage category with a fair value of zero. For the 6-month period ending March 31, 2011, the Funds had no purchases or sales of Level 3 securities. The fair value of this holding remained at zero at March 31, 2011.
Foreign currency translation—
Certain Funds invest in foreign securities, which may involve a number of risk factors and special considerations not present with investments in securities of U.S. corporations. Values of investments and other assets and liabilities denominated in foreign currencies are translated into U.S. dollars at current exchange rates obtained by a recognized bank, dealer, or independent pricing service on the day of valuation. Purchases and sales of investments and dividend and interest income are converted at the prevailing rate of exchange on the respective dates of such transactions.
The Funds do not isolate that portion of the results of operations resulting from changes in foreign exchange rates on investments from the fluctuations arising from changes in market prices of securities held. Such fluctuations are included in net realized gain (loss) on investments and net change in unrealized appreciation (depreciation) on investments in the Statements of Operations. Net realized gains and losses on foreign currency transactions arising from the sale of foreign currencies, currency gains or losses realized between the trade and settlement dates on securities transactions and the difference between the amounts of dividends, interest, foreign withholding taxes and tax reclaims recorded and the U.S. dollar equivalent of the amounts actually received or paid are included in net realized gain (loss) on foreign currency transactions in the Statement of Operations. Unrealized gains and losses arising from changes in the fair value of assets and liabilities, other than investments in securities, resulting from changes in exchange rates are included in net change in unrealized appreciation (depreciation) on foreign currency translation in the Statements of Operations.
Forward foreign currency contracts—
Forward foreign currency contracts are agreements to exchange one currency for another at a future date and at a specified price. The Funds' transactions in forward foreign currency contracts are limited to transaction and portfolio hedging. The contractual amounts of forward foreign currency contracts do not necessarily represent the amounts potentially subject to risk. The measurement of the risks associated with these instruments is meaningful only when all related and offsetting transactions are considered and could exceed the net unrealized value shown in the tables below. Risks arise from the possible inability of counterparties to meet the terms of their contracts and from movements in currency values. Forward foreign currency contracts are valued at the current day's interpolated foreign exchange rates. Unrealized gain or loss on the contracts as measured by the difference between the forward foreign exchange rates at the dates of entry into the contracts and the forward rates at the end of the period is included in the Statements of Assets and Liabilities. Realized gains and losses and the net change in unrealized appreciation (depreciation) on forward foreign currency contracts for the period are included in the Statement of Operations.
At March 31, 2011 Global, Global Select, International, and Int'l Small Cap held forward foreign currency contracts, each whose counterparty is State Street Corporation, which are considered derivative instruments under FASB ASC Topic 815-10, as follows:
THE OAKMARK FUNDS
75
THE OAKMARK FUNDS
Notes to Financial Statements (Unaudited) (cont.)
Oakmark Global Fund
| | | Contract
Amount | | Settlement
Date | | Valuation at
3/31/11 | | Unrealized
Appreciation/
(Depreciation) | |
| Foreign Currency Sold: | |
| Australian Dollar | | | 6,480,000 | | | 08/12/11 | | $ | 6,590,596 | | | $ | (957,856 | ) | |
| Australian Dollar | | | 7,700,000 | | | 09/12/11 | | | 7,801,101 | | | | (1,039,192 | ) | |
| Australian Dollar | | | 12,620,000 | | | 09/16/11 | | | 12,779,317 | | | | (1,088,103 | ) | |
| Australian Dollar | | | 39,950,000 | | | 09/21/11 | | | 40,429,104 | | | | (1,720,443 | ) | |
| Japanese Yen | | | 940,000,000 | | | 07/01/11 | | | 11,308,780 | | | | (617,364 | ) | |
| Japanese Yen | | | 2,130,000,000 | | | 07/20/11 | | | 25,630,741 | | | | (1,114,448 | ) | |
| Japanese Yen | | | 1,480,000,000 | | | 08/03/11 | | | 17,811,984 | | | | (639,224 | ) | |
| Japanese Yen | | | 2,260,000,000 | | | 08/15/11 | | | 27,203,087 | | | | (599,202 | ) | |
| Japanese Yen | | | 4,450,000,000 | | | 09/07/11 | | | 53,577,593 | | | | (503,468 | ) | |
| Japanese Yen | | | 2,060,000,000 | | | 09/16/11 | | | 24,804,747 | | | | 384,170 | | |
| Japanese Yen | | | 10,129,000,000 | | | 09/21/11 | | | 121,971,627 | | | | 3,433,207 | | |
| Swedish Krona | | | 82,690,000 | | | 12/21/11 | | | 12,899,832 | | | | (175,649 | ) | |
| Swiss Franc | | | 96,900,000 | | | 06/15/11 | | | 105,560,730 | | | | (4,583,632 | ) | |
| Swiss Franc | | | 23,700,000 | | | 07/06/11 | | | 25,822,000 | | | | (3,380,944 | ) | |
| Swiss Franc | | | 20,500,000 | | | 07/19/11 | | | 22,338,017 | | | | (2,557,818 | ) | |
| Swiss Franc | | | 20,800,000 | | | 08/03/11 | | | 22,667,878 | | | | (2,659,798 | ) | |
| | | | | | | $ | 539,197,134 | | | $ | (17,819,764 | ) | |
During the period ended March 31, 2011 the proceeds from forward foreign currency contracts opened for Global were $281,658,907 and the cost to close contracts was $76,291,103.
Oakmark Global Select Fund
| | | Contract
Amount | | Settlement
Date | | Valuation at
3/31/11 | | Unrealized
Appreciation/
(Depreciation) | |
| Foreign Currency Bought: | |
| Swiss Franc | | | 6,000,000 | | | 06/15/11 | | $ | 6,536,268 | | | $ | 427,533 | | |
| | | | | | | $ | 6,536,268 | | | $ | 427,533 | | |
| Foreign Currency Sold: | |
| Japanese Yen | | | 280,000,000 | | | 07/20/11 | | $ | 3,369,299 | | | $ | (146,500 | ) | |
| Japanese Yen | | | 176,000,000 | | | 08/03/11 | | | 2,118,182 | | | | (76,016 | ) | |
| Japanese Yen | | | 315,000,000 | | | 08/15/11 | | | 3,791,581 | | | | (83,517 | ) | |
| Japanese Yen | | | 435,000,000 | | | 09/07/11 | | | 5,237,360 | | | | (49,216 | ) | |
| Japanese Yen | | | 120,000,000 | | | 09/16/11 | | | 1,444,937 | | | | 22,379 | | |
| Japanese Yen | | | 2,020,000,000 | | | 09/21/11 | | | 24,324,483 | | | | 492,763 | | |
| Japanese Yen | | | 118,000,000 | | | 07/01/11 | | | 1,419,613 | | | | (77,499 | ) | |
| Swiss Franc | | | 14,850,000 | | | 06/15/11 | | | 16,177,263 | | | | (878,003 | ) | |
| Swiss Franc | | | 4,260,000 | | | 07/06/11 | | | 4,641,423 | | | | (607,714 | ) | |
| Swiss Franc | | | 3,600,000 | | | 07/19/11 | | | 3,922,774 | | | | (449,178 | ) | |
| Swiss Franc | | | 3,420,000 | | | 08/03/11 | | | 3,727,122 | | | | (437,332 | ) | |
| | | | | | | $ | 70,174,037 | | | $ | (2,289,833 | ) | |
During the period ended March 31, 2011 the proceeds from forward foreign currency contracts opened for Global Select were $34,575,046 and the cost to close contracts was $20,747,623.
THE OAKMARK FUNDS
76
THE OAKMARK FUNDS
Notes to Financial Statements (Unaudited) (cont.)
Oakmark International Fund
| | | Contract
Amount | | Settlement
Date | | Valuation at
3/31/11 | | Unrealized
Appreciation/
(Depreciation) | |
| Foreign Currency Sold: | |
| Australian Dollar | | | 20,800,000 | | | 08/12/11 | | $ | 21,155,000 | | | $ | (3,083,960 | ) | |
| Australian Dollar | | | 15,200,000 | | | 09/12/11 | | | 15,399,576 | | | | (2,051,392 | ) | |
| Australian Dollar | | | 36,400,000 | | | 09/16/11 | | | 36,859,519 | | | | (3,108,040 | ) | |
| Australian Dollar | | | 136,400,000 | | | 09/21/11 | | | 138,035,790 | | | | (5,763,026 | ) | |
| Japanese Yen | | | 3,600,000,000 | | | 07/01/11 | | | 43,310,221 | | | | (2,364,372 | ) | |
| Japanese Yen | | | 5,650,000,000 | | | 07/20/11 | | | 67,987,646 | | | | (2,956,166 | ) | |
| Japanese Yen | | | 5,250,000,000 | | | 08/03/11 | | | 63,184,402 | | | | (2,267,516 | ) | |
| Japanese Yen | | | 8,450,000,000 | | | 08/15/11 | | | 101,710,657 | | | | (2,240,380 | ) | |
| Japanese Yen | | | 10,900,000,000 | | | 09/07/11 | | | 131,235,002 | | | | (1,233,213 | ) | |
| Japanese Yen | | | 7,900,000,000 | | | 09/16/11 | | | 95,125,000 | | | | 1,473,273 | | |
| Japanese Yen | | | 42,700,000,000 | | | 09/21/11 | | | 514,185,850 | | | | 13,940,800 | | |
| Swedish Krona | | | 388,300,000 | | | 12/21/11 | | | 60,575,701 | | | | (784,407 | ) | |
| Swiss Franc | | | 541,500,000 | | | 06/15/11 | | | 589,898,198 | | | | (20,981,397 | ) | |
| Swiss Franc | | | 79,000,000 | | | 07/06/11 | | | 86,073,334 | | | | (11,269,812 | ) | |
| Swiss Franc | | | 68,000,000 | | | 07/19/11 | | | 74,096,836 | | | | (8,484,470 | ) | |
| Swiss Franc | | | 63,000,000 | | | 08/03/11 | | | 68,657,517 | | | | (8,056,120 | ) | |
| | | | | | | $ | 2,107,490,249 | | | $ | (59,230,198 | ) | |
During the period ended March 31, 2011 the proceeds from forward foreign currency contracts opened for International were $1,280,889,843 and the cost to close contracts was $282,480,182.
Oakmark Int'l Small Cap Fund
| | | Contract
Amount | | Settlement
Date | | Valuation at
3/31/11 | | Unrealized
Appreciation/
(Depreciation) | |
| Foreign Currency Sold: | |
| Australian Dollar | | | 8,525,000 | | | 08/12/11 | | $ | 8,670,499 | | | $ | (1,263,979 | ) | |
| Australian Dollar | | | 7,100,000 | | | 09/12/11 | | | 7,193,223 | | | | (958,216 | ) | |
| Australian Dollar | | | 16,710,000 | | | 09/16/11 | | | 16,920,950 | | | | (1,402,103 | ) | |
| Australian Dollar | | | 103,350,000 | | | 09/21/11 | | | 104,589,435 | | | | (4,333,269 | ) | |
| Japanese Yen | | | 1,265,000,000 | | | 07/01/11 | | | 15,218,730 | | | | (830,814 | ) | |
| Japanese Yen | | | 1,040,000,000 | | | 07/20/11 | | | 12,514,540 | | | | (544,144 | ) | |
| Japanese Yen | | | 938,000,000 | | | 08/03/11 | | | 11,288,947 | | | | (405,130 | ) | |
| Japanese Yen | | | 1,620,000,000 | | | 08/15/11 | | | 19,499,558 | | | | (429,517 | ) | |
| Japanese Yen | | | 2,270,000,000 | | | 09/07/11 | | | 27,330,592 | | | | (256,825 | ) | |
| Japanese Yen | | | 1,850,000,000 | | | 09/16/11 | | | 22,276,108 | | | | 345,007 | | |
| Japanese Yen | | | 8,150,000,000 | | | 09/21/11 | | | 98,140,859 | | | | 2,746,127 | | |
| Swedish Krona | | | 8,921,000 | | | 12/21/11 | | | 1,391,697 | | | | (19,205 | ) | |
| Swiss Franc | | | 5,700,000 | | | 06/06/11 | | | 6,209,110 | | | | (1,220,487 | ) | |
| Swiss Franc | | | 38,100,000 | | | 06/15/11 | | | 41,505,302 | | | | (2,316,604 | ) | |
THE OAKMARK FUNDS
77
THE OAKMARK FUNDS
Notes to Financial Statements (Unaudited) (cont.)
| | | Contract
Amount | | Settlement
Date | | Valuation at
3/31/11 | | Unrealized
Appreciation/
(Depreciation) | |
| Swiss Franc | | | 17,600,000 | | | 07/06/11 | | $ | 19,175,831 | | | $ | (2,510,743 | ) | |
| Swiss Franc | | | 10,350,000 | | | 07/19/11 | | | 11,277,974 | | | | (1,291,386 | ) | |
| Swiss Franc | | | 11,200,000 | | | 08/03/11 | | | 12,205,781 | | | | (1,432,199 | ) | |
| | | | | | | $ | 435,409,136 | | | $ | (16,123,487 | ) | |
During the period ended March 31, 2011 the proceeds from forward foreign currency contracts opened for Int'l Small Cap were $254,258,745 and the cost to close contracts was $54,776,647.
Security transactions and investment income—
Security transactions are accounted for on the trade date (date the order to buy or sell is executed) and dividend income is recorded on the ex-dividend date. Interest income and expenses are recorded on an accrual basis. Bond discount is accreted and premium is amortized over the expected life of each applicable security using the yield to maturity method. Withholding taxes and tax reclaims on foreign dividends have been provided for in accordance with the Funds' understanding of the applicable country's tax rules and rates. Net realized gains and losses on investments are determined by the specific identification method.
Short sales—
Each Fund may sell a security it does not own in anticipation of a decline in the fair value of that security. When a Fund sells a security short, it must borrow the security sold short and deliver it to the broker-dealer through which it made the short sale. A gain, limited to the price at which the Fund sold the security short, or loss, unlimited in size, will be recognized upon the termination of the short sale. At March 31, 2011, none of the Funds had short sales.
Accounting for options—
When a Fund writes an option, the premium received by the Fund is recorded as a liability and is subsequently adjusted to the current fair value of the option written. Premiums received from writing options that expire are recorded by the Fund on the expiration date as realized gains from option transactions. The difference between the premium and the amount paid on effecting a closing purchase transaction, including brokerage commissions, is also treated as a realized gain, or if the premium is less than the amount paid for the closing purchase transaction, as a realized loss. If a call option is exercised, the premium is added to the proceeds from the sale of the underlying security or currency in determining whether the Fund has realized a gain or a loss. If a put option is exercised, the premium reduces the cost basis of the security or currency purchased by the Fund. In writing an option, the Fund bears the market risk of an unfavorable change in the price of the security or currency underlying the written option. Exercise of an option written by the Fund could result in the Fund selling or buying a security or currency at a price different from the current fair value. Options written by the Fund do not give rise to counterparty credit risk, as they obligate the Fund, not its counterparties, to perform.
When a Fund purchases an option, the premium paid by the Fund is recorded as an asset and is subsequently adjusted to the current fair value of the option purchased. Purchasing call options tends to increase the Fund's exposure to the underlying instrument. Purchasing put options tends to decrease the Fund's exposure to the underlying instrument. Premiums paid for purchasing options that expire are treated as realized losses. Premiums paid for purchasing options that are exercised or closed are added to the amounts paid or offset against the proceeds on the underlying security to determine the realized gain or loss. The risks associated with purchasing put and call options are potential loss of the premium paid and, in the instances of OTC derivatives, the failure of the counterparty to honor its obligation under the contract.
At March 31, 2011, the Funds had no outstanding options.
Committed line of credit—
The Trust has an unsecured committed line of credit (the "Facility") with State Street Bank and Trust Company ("State Street") in the amount of $500 million. Borrowings under that arrangement bear interest at 1.25% above the greater of the Federal Funds Effective Rate or LIBOR, as defined in the credit agreement. To maintain the Facility, an annualized commitment fee of 0.125% on the unused portion is charged to the Trust. Fees and interest expense, if any, related to the Facility are included in other expenses in the Statements of Operations. There were no borrowings under the Facility during the six months ended March 31, 2011.
THE OAKMARK FUNDS
78
THE OAKMARK FUNDS
Notes to Financial Statements (Unaudited) (cont.)
Expense offset arrangement—
State Street serves as custodian of the Funds. State Street's fee may be reduced by credits that are an earnings allowance calculated on the average daily cash balances each Fund maintains with State Street. Credit balances used to reduce the Funds' custodian fees, if any, are reported as a reduction of total expenses in the Statements of Operations. During the period ended March 31, 2011, none of the Funds received an expense offset credit.
Repurchase agreements—
Each Fund may invest in repurchase agreements, which are short-term investments whereby the Fund acquires ownership of a debt security and the seller agrees to repurchase the security at a future date at a specified price.
The Funds' custodian receives delivery of the underlying securities collateralizing repurchase agreements. It is the Funds' policy that the value of the collateral be at least equal to 102% of the repurchase price, including interest. Harris Associates L.P. (the "Adviser") is responsible for determining that the value of the collateral is at all times at least equal to 102% of the repurchase price, including interest. Repurchase agreements could involve certain risks in the event of default or insolvency of the counterparty including possible delays or restrictions upon a Fund's ability to dispose of the underlying securities.
Security lending—
Each Fund, except Oakmark, may lend its portfolio securities to broker-dealers and banks. Any such loan must be continuously secured by collateral in cash, cash equivalents or U.S. Treasuries maintained on a current basis in an amount at least equal to the fair value of the securities loaned by the Fund. Collateral is marked to market and monitored daily. The Fund would continue to receive the equivalent of the interest or dividends paid by the issuer on the securities loaned, and would also receive an additional return that may be in the form of a fixed fee or a percentage of the earnings on the collateral. The Fund would have the right to call the loan and attempt to obtain the securities loaned at any time on notice of not more than five business days. In the event of bankruptcy or other default of the borrower, the Fund could experience delays in liquidating the loan collateral or recovering the loaned securities and incur expenses related to enforcing its rights. In addition, there could be a decline in the value of the collateral or in the fair value of the securities loaned while the Fund seeks to enforce its rights thereto and the Fund could experience subnormal levels of income or lack of access to income during that period.
At March 31, 2011 none of the Funds had securities on loan.
Restricted securities—
The following investments, the sales of which are restricted to qualified institutional buyers, have been valued according to the securities valuation procedures for debt obligations and money market instruments (as stated in the Security valuation section) since their acquisition dates. These securities are priced using market quotations or at amortized cost and there are no unrestricted securities with the same maturity dates and yields for the issuer.
At March 31, 2011, Equity and Income held the following restricted securities:
| Par | | Security
Name | | Acquisition
Date | | Carrying
Value | | Original
Cost | | Value | | Percentage of
Net Assets | |
| $ | 3,000,000 | | | Sealed Air Corporation,
144A, 5.625% due
7/15/2013 | | 6/27/2003 | | $ | 104.8166 | | | $ | 100.68 | | | $ | 3,144,498 | | | | 0.02 | % | |
| | 3,740,000 | | | Sealed Air Corporation,
144A, 5.625% due
7/15/2013 | | 8/20/2003 | | | 104.8166 | | | | 96.41 | | | | 3,920,141 | | | | 0.02 | % | |
| | 300,000 | | | Sealed Air Corporation,
144A, 5.625% due
7/15/2013 | | 8/21/2003 | | | 104.8166 | | | | 96.79 | | | | 314,450 | | | | 0.00 | % | |
| | 11,700,000 | | | Sealed Air Corporation,
144A, 5.625% due
7/15/2013 | | 4/6/2004 | | | 104.8166 | | | | 103.31 | | | | 12,263,542 | | | | 0.07 | % | |
THE OAKMARK FUNDS
79
THE OAKMARK FUNDS
Notes to Financial Statements (Unaudited) (cont.)
| Par | | Security
Name | | Acquisition
Date | | Carrying
Value | | Original
Cost | | Value | | Percentage of
Net Assets | |
| $ | 47,000,000 | | | BP Capital Markets PLC,
144A, 0.23% due
5/27/2011 | | 3/10/2011 | | $ | 99.9579 | | | $ | 99.9642 | | | $ | 46,980,204 | | | | 0.23 | % | |
| | 19,500,000 | | | BP Capital Markets PLC,
144A, 0.24% due
5/31/2011 | | 3/10/2011 | | | 99.9540 | | | | 99.9600 | | | | 19,491,034 | | | | 0.10 | % | |
| | 100,000,000 | | | Johnson & Johnson,
144A, 0.17% due
4/21/2011 | | 2/12011 | | | 99.9918 | | | | 99.9918 | | | | 99,991,830 | | | | 0.49 | % | |
| | 10,000,000 | | | WellPoint, Inc.,
144A, 0.26% due
4/12/2011 | | 3/10/2011 | | | 99.9921 | | | | 99.9921 | | | | 9,999,205 | | | | 0.05 | % | |
| | 10,000,000 | | | WellPoint, Inc.,
144A, 0.27%
due 4/25/2011 | | 3/10/2011 | | | 99.9820 | | | | 99.9820 | | | | 9,998,200 | | | | 0.05 | % | |
| | 10,000,000 | | | WellPoint, Inc.,
144A, 0.32%
due 5/10/2011 | | 3/10/2011 | | | 99.9656 | | | | 99.9653 | | | | 9,996,556 | | | | 0.05 | % | |
| | | | | | | | | | | | | $ | 216,099,660 | | | | 1.08 | % | |
Federal income taxes—
It is each Fund's policy to comply with the requirements of the Internal Revenue Code applicable to regulated investment companies and to distribute substantially all of its net taxable income, including any net realized gains on investments, to its shareholders. Therefore, no federal income tax provision is required. There is no material liability for unrecognized tax benefits in the accompanying financial statements. Generally, each of the tax years in the four-year period ended September 30, 2010 remains subject to examination by taxing authorities.
2. TRANSACTIONS WITH AFFILIATES
Each Fund has an investment advisory agreement with the Adviser. For management services and facilities furnished, the Adviser receives from each Fund a monthly fee based on that Fund's net assets at the end of the preceding month. Annual fee rates are as follows:
| Fund | | Advisory Fees | | Fund | | Advisory Fees | |
Oakmark
Select
| | 1.00% up to $2 billion;
0.90% on the next $1 billion;
0.80% on the next $2 billion;
0.75% on the next $2.5 billion;
0.70% on the next $2.5 billion; and
0.65% over $10 billion
1.00% up to $1 billion;
0.95% on the next $500 million;
0.90% on the next $500 million;
0.85% on the next $500 million;
0.80% on the next $2.5 billion;
0.75% on the next $5 billion; and
0.725% over $10 billion
| | Global
Global Select
International
| | 1.00% up to $2 billion;
0.95% on the next $2 billion;
0.90% on the next $4 billion; and
0.875% over $8 billion
1.00% up to $2 billion;
0.95% on the next $1 billion;
0.875% on the next $4 billion; and
0.85% over $7 billion
1.00% up to $2 billion;
0.95% on the next $1 billion;
0.85% on the next $2 billion;
0.825% on the next $2.5 billion;
0.815% on the next $3.5 billion;
0.805% on the next $5.5 billion; and
0.80% over $16.5 billion | |
|
THE OAKMARK FUNDS
80
THE OAKMARK FUNDS
Notes to Financial Statements (Unaudited) (cont.)
| Fund | | Advisory Fees | | Fund | | Advisory Fees | |
Equity and Income
| | 0.75% up to $5 billion;
0.70% on the next $2.5 billion;
0.675% on the next $2.5 billion;
0.65% on the next $2.5 billion; | | Int'l Small Cap
| | 1.25% up to $500 million;
1.10% on the next $1 billion;
1.05% on the next $2 billion; and
1.025% over $3.5 billion
0.60% on the next $3.5 billion;
0.585% on the next $5 billion;
0.5775% on the next $7 billion; and
0.5725% over $28 billion | |
|
The Adviser is contractually obligated through January 31, 2012 to reimburse each Fund Class to the extent, but only to the extent, that its annualized expenses (excluding taxes, interest, all commissions and other normal charges incident to the purchase and sale of portfolio securities, and extraordinary charges such as litigation costs, but including fees paid to the Adviser) exceed the percent set forth below of average daily net assets of the Fund Class.
| Fund | | Class I | | Class II | |
| Oakmark | | | 1.50 | % | | | 1.75 | % | |
| Select | | | 1.50 | | | | 1.75 | | |
| Equity and Income | | | 1.00 | | | | 1.25 | | |
| Global | | | 1.75 | | | | 2.00 | | |
| Global Select | | | 1.75 | | | | 2.00 | | |
| International | | | 2.00 | | | | 2.25 | | |
| Int'l Small Cap | | | 2.00 | | | | 2.25 | | |
The Adviser is entitled to recoup from any Fund Class, in any fiscal year through September 30, 2014, amounts reimbursed to that Fund Class, except to the extent that the Fund Class already has paid such recoupment to the Adviser or such recoupment would cause the annual ordinary operating expenses of a Fund Class for that fiscal year to exceed the applicable limit stated above. As of March 31, 2011 there were no amounts subject to recoupment.
The Adviser and the Funds have entered into agreements with financial intermediaries to provide recordkeeping, processing, shareholder communications and other services to customers of the intermediaries and have agreed to compensate the intermediaries for providing those services. Certain of those services would be provided by the Funds if the shares of those customers were registered directly with the Funds' transfer agent. Accordingly, the Funds pay a portion of the intermediary fees pursuant to an agreement with the Adviser, which calls for each Fund to pay a portion of the intermediary fees attributable to shares of the Fund held by the intermediary (which generally are a percentage of value of the shares held) not exceeding the lesser of 75% of the fees charged by the intermediary or what the Fund would have paid its transfer agent had each customer's shares been registered directly with the transfer agent instead of held through the intermediary. The Adviser pays the remainder of the fees. The fees incurred by the Funds are reflected as other shareholder servicing fees in the Statements of Operations.
The non-interested Trustees of the Trust may participate in the Trust's Deferred Compensation Plan for Independent Trustees. Participants in the plan may elect to defer all or a portion of their compensation. Amounts deferred are retained by the Trust and represent an unfunded obligation of the Trust. The value of a participant's deferral account is determined by reference to the change in value of Class I shares of one or more of the Funds or a money market fund as specified by the participant. Benefits would be payable after a stated number of years or retirement from the board. The accrued obligations of the Funds under the plan are reflected as deferred Trustee compensation in the Statements of Assets and Liabilities. The Trust pays the compensation of the Trustees other than those affiliated with the Adviser and all expenses incurred in connection with their services to the Trust. The Trust does not provide any pension or retirement benefits to its Trustees.
The Funds reimburse the Adviser for a portion of the compensation paid to the Funds' Chief Compliance Officer ("CCO"). The CCO expenses incurred by the Funds are included in other expenses in the Statement of Operations.
THE OAKMARK FUNDS
81
THE OAKMARK FUNDS
Notes to Financial Statements (Unaudited) (cont.)
3. FEDERAL INCOME TAXES
At March 31, 2011 the cost of investments for federal income tax purposes and related composition of unrealized gains and losses for each Fund were as follows:
| Fund | | Cost of Investments
for Federal Income
Tax Purposes | | Gross Unrealized
Appreciation | | Gross Unrealized
(Depreciation) | | Net Unrealized
Appreciation
(Depreciation) | |
| Oakmark | | $ | 2,843,268,735 | | | $ | 1,309,760,687 | | | $ | (18,294,708 | ) | | $ | 1,291,465,979 | | |
| Select | | | 1,886,934,251 | | | | 839,202,184 | | | | (73,199,977 | ) | | | 766,002,207 | | |
| Equity and Income | | | 16,448,965,834 | | | | 4,084,185,509 | | | | (38,287,437 | ) | | | 4,045,898,072 | | |
| Global | | | 2,100,769,773 | | | | 608,289,641 | | | | (133,886,647 | ) | | | 474,402,994 | | |
| Global Select | | | 411,686,402 | | | | 59,589,140 | | | | (22,405,695 | ) | | | 37,183,445 | | |
| International | | | 7,229,677,067 | | | | 1,208,565,867 | | | | (235,943,858 | ) | | | 972,622,009 | | |
| Int'l Small Cap | | | 1,553,259,057 | | | | 243,223,624 | | | | (131,115,175 | ) | | | 112,108,449 | | |
For the six-month period ended March 31, 2011 the components of distributable earnings on a tax basis (excluding unrealized appreciation (depreciation)) were as follows:
| Fund | | Undistributed
Ordinary Income | | Undistributed Long-
Term Gain | | Total Distributable
Earnings | |
| Oakmark | | $ | 8,872,940 | | | $ | 11,916,257 | | | $ | 20,789,197 | | |
| Select | | | 900,956 | | | | 89,247,682 | | | | 90,148,638 | | |
| Equity and Income | | | 124,353,312 | | | | 0 | | | | 124,353,312 | | |
| Global | | | 0 | | | | 0 | | | | 0 | | |
| Global Select | | | 0 | | | | 0 | | | | 0 | | |
| International | | | 0 | | | | 0 | | | | 0 | | |
| Int'l Small Cap | | | 0 | | | | 0 | | | | 0 | | |
During the six-month period ended March 31, 2011 and the year ended September 30, 2010 the tax character of distributions paid was as follows:
| | | Period Ended
March 31, 2011 | | Year Ended
September 30, 2010 | |
| Fund | | Distributions Paid
from Ordinary
Income | | Distributions Paid
from Long-Term
Capital Gain | | Distributions Paid
from Ordinary
Income | | Distributions Paid
from Long-Term
Capital Gain | |
| Oakmark | | $ | 22,616,888 | | | $ | 0 | | | $ | 21,191,609 | | | $ | 0 | | |
| Select | | | 5,174,454 | | | | 0 | | | | 7,151,944 | | | | 0 | | |
| Equity and Income | | | 152,515,049 | | | | 0 | | | | 187,239,323 | | | | 0 | | |
| Global | | | 9,080,560 | | | | 0 | | | | 12,675,492 | | | | 0 | | |
| Global Select | | | 809,546 | | | | 0 | | | | 1,100,573 | | | | 0 | | |
| International | | | 54,130,299 | | | | 0 | | | | 31,064,403 | | | | 0 | | |
| Int'l Small Cap | | | 8,019,297 | | | | 0 | | | | 11,569,123 | | | | 0 | | |
On March 31, 2011 the Funds had temporary book/tax differences in undistributed earnings that were primarily attributable to trustee deferred compensation expenses, passive foreign investment companies, foreign currency contracts, post October currency loss deferrals and deferrals of capital losses on wash sales. Temporary differences will reverse over time. The Funds have permanent differences in book/tax undistributed earnings primarily attributable to currency gains and losses. Permanent differences have been recorded in their respective component of the Analysis of Net Assets.
THE OAKMARK FUNDS
82
THE OAKMARK FUNDS
Notes to Financial Statements (Unaudited) (cont.)
4. INVESTMENT TRANSACTIONS
For the six-month period ended March 31, 2011 transactions in investment securities (excluding short term and U.S. Government securities) were as follows (in thousands):
| | | Oakmark | | Select | | Equity and
Income | | Global | | Global
Select | | International | | Int'l
Small Cap | |
| Purchases | | $ | 252,092 | | | $ | 103,785 | | | $ | 3,372,320 | | | $ | 468,089 | | | $ | 123,856 | | | $ | 2,754,106 | | | $ | 509,543 | | |
| Proceeds from sales | | | 57,547 | | | | 208,988 | | | | 3,568,820 | | | | 246,237 | | | | 72,786 | | | | 1,070,596 | | | | 270,234 | | |
Purchases at cost and proceeds from sales (in thousands) of long-term U.S. Government securities for the six-month period ended March 31, 2011 were $2,136,110 and $2,883,608, respectively, for Equity and Income.
5. INVESTMENT IN AFFILIATED ISSUERS
An issuer in which a Fund's ownership represents 5% or more of the outstanding voting securities of the issuer is an affiliated issuer as defined under the Investment Company Act of 1940. A schedule of each Fund's investments in securities of affiliated issuers for the quarter ended March 31, 2011 is set forth below:
Schedule of Transactions with Affiliated Issuers
Oakmark Equity and Income Fund
| Affiliates | | Shares Held | | Purchases
(Cost) | | Sales
(Proceeds) | | Dividend
Income | | Value
September 30,
2010 | | Value
March 31,
2011 | |
Broadridge Financial
Solutions, Inc. | | | 6,900,000 | | | $ | 3,422,010 | | | $ | 0 | | | $ | 2,047,500 | | | $ | 154,372,500 | | | $ | 156,561,000 | | |
| PartnerRe, Ltd. | | | 3,900,000 | | | | 0 | | | | 0 | | | | 0 | | | | 312,702,000 | | | | 309,036,000 | | |
| PharMerica Corp. (a) | | | 1,810,000 | | | | 12,268,897 | | | | 1,228,132 | | | | 0 | | | | 6,575,986 | | | | 20,706,400 | | |
| Walter Energy, Inc. | | | 3,000,000 | | | | 0 | | | | 0 | | | | 750,000 | | | | 243,870,000 | | | | 406,290,000 | | |
| TOTALS | | | | $ | 15,690,907 | | | $ | 1,228,132 | | | $ | 2,797,500 | | | $ | 717,520,486 | | | $ | 892,593,400 | | |
Schedule of Transactions with Affiliated Issuers
Oakmark International Fund
| Affiliates | | Shares Held | | Purchases
(Cost) | | Sales
(Proceeds) | | Dividend
Income | | Value
September 30,
2010 | | Value
March 31,
2011 | |
| Meitec Corp. | | | 2,475,100 | | | $ | 0 | | | $ | 0 | | | $ | 721,297 | | | $ | 45,985,626 | | | $ | 49,513,903 | | |
| TOTALS | | | | $ | 0 | | | $ | 0 | | | $ | 721,297 | | | $ | 45,985,626 | | | $ | 49,513,903 | | |
THE OAKMARK FUNDS
83
THE OAKMARK FUNDS
Notes to Financial Statements (Unaudited) (cont.)
Schedule of Transactions with Affiliated Issuers
Oakmark International Small Cap Fund
| Affiliates | | Shares Held | | Purchases
(Cost) | | Sales
(Proceeds) | | Dividend
Income | | Value
September 30,
2010 | | Value
March 31,
2011 | |
| Freightways, Ltd. | | | 7,915,800 | | | $ | 0 | | | $ | 0 | | | $ | 498,854 | | | $ | 17,133,075 | | | $ | 19,689,602 | | |
| Interpump Group SpA (b) | | | 3,379,200 | | | | 0 | | | | 14,678,655 | | | | 0 | | | | 33,048,030 | | | | 28,662,167 | | |
Interpump Group SpA,
Warrants (a) (b) | | | 848,916 | | | | 0 | | | | 176,495 | | | | 0 | | | | 951,813 | | | | 950,436 | | |
| JJB Sports PLC (a) | | | 12,691,446 | | | | 4,973,397 | | | | 0 | | | | 0 | | | | 8,424,985 | | | | 6,107,882 | | |
JJB Sports PLC,
Warrants (a) | | | 2,474,255 | | | | 0 | | | | 0 | | | | 0 | | | | 0 | | | | 0 | | |
LSL Property
Services PLC (b) | | | 10,375,000 | | | | 10,941,037 | | | | 0 | | | | 983,164 | | | | 27,485,666 | | | | 40,776,737 | | |
| NSD Co., Ltd. | | | 2,753,500 | | | | 12,056,418 | | | | 0 | | | | 936,167 | | | | 18,857,189 | | | | 27,475,415 | | |
| Orbotech, Ltd. (a) | | | 2,927,800 | | | | 11,676,835 | | | | 2,324,099 | | | | 0 | | | | 19,401,120 | | | | 37,592,952 | | |
| Pasona Group, Inc. | | | 31,234 | | | | 3,266,926 | | | | 0 | | | | 0 | | | | 19,023,364 | | | | 26,622,873 | | |
| Vitec Group PLC | | | 3,035,979 | | | | 0 | | | | 0 | | | | 0 | | | | 24,036,857 | | | | 29,246,241 | | |
| TOTALS | | | | $ | 42,914,613 | | | $ | 17,179,249 | | | $ | 2,418,185 | | | $ | 168,362,099 | | | $ | 217,124,305 | | |
(a) Non-income producing security.
(b) Due to transactions during the period ended March 31, 2011, the company is no longer an affiliated security.
6. SUBSEQUENT EVENTS
Management has evaluated the possibility of subsequent events existing in the Funds' financial statements. Management has determined that there are no material events that would require disclosure in the Funds' financial statements through the date of the publication of this report.
THE OAKMARK FUNDS
84
THE OAKMARK FUNDS
FINANCIAL HIGHLIGHTS
The following tables are intended to help you understand each Fund's financial performance during the last 5 years (or since it began operations, if less than five years). Certain information reflects financial results for a single Fund share. Total returns represent the rate a shareholder would have earned (or lost) on an investment, assuming reinvestment of all dividends and distributions. The information for the period ended March 31, 2011 is unaudited, and each Fund's financial statements is included in this report. Deloitte & Touche LLP, an independent registered public accounting firm, has audited the information for the fiscal years ended September 30, 2010, 2009, 2008, 2007, and 2006. For each year shown, all information is for the fiscal year ended September 30, unless otherwise noted.
THE OAKMARK FUNDS
85
OAKMARK FUND
Financial Highlights–Class I
For a share outstanding throughout each period
| | | Six Months Ended
March 31, 2011
(Unaudited) | | Year Ended
September 30,
2010 | | Year Ended
September 30,
2009 | | Year Ended
September 30,
2008 | | Year Ended
September 30,
2007 | | Year Ended
September 30,
2006 | |
| Net Asset Value, Beginning of Period | | $ | 38.36 | | | $ | 34.55 | | | $ | 35.31 | | | $ | 47.28 | | | $ | 44.64 | | | $ | 40.75 | | |
| Income From Investment Operations: | |
| Net Investment Income | | | 0.15 | (a) | | | 0.24 | | | | 0.29 | (a) | | | 0.52 | | | | 0.47 | (a) | | | 0.39 | (a) | |
Net Gain (Loss) on Investments (both realized
and unrealized) | | | 5.17 | | | | 3.80 | | | | 0.39 | | | | (8.51 | ) | | | 4.60 | | | | 3.85 | | |
| Total From Investment Operations | | | 5.32 | | | | 4.04 | | | | 0.68 | | | | (7.99 | ) | | | 5.07 | | | | 4.24 | | |
| Less Distributions: | |
| From Net Investment Income | | | (0.25 | ) | | | (0.23 | ) | | | (0.45 | ) | | | (0.56 | ) | | | (0.43 | ) | | | (0.35 | ) | |
| From Capital Gains | | | 0.00 | | | | 0.00 | | | | (0.99 | ) | | | (3.42 | ) | | | (2.00 | ) | | | 0.00 | | |
| Total Distributions | | | (0.25 | ) | | | (0.23 | ) | | | (1.44 | ) | | | (3.98 | ) | | | (2.43 | ) | | | (0.35 | ) | |
| Redemption Fees | | | 0.00 | (b) | | | 0.00 | (b) | | | 0.00 | (b) | | | 0.00 | (b) | | | 0.00 | (b) | | | 0.00 | (b) | |
| Net Asset Value, End of Period | | $ | 43.43 | | | $ | 38.36 | | | $ | 34.55 | | | $ | 35.31 | | | $ | 47.28 | | | $ | 44.64 | | |
| Total Return | | | 13.91 | % | | | 11.74 | % | | | 3.38 | % | | | -18.14 | % | | | 11.51 | % | | | 10.46 | % | |
| Ratios/Supplemental Data: | |
| Net Assets, End of Period ($million) | | $ | 4,107.8 | | | $ | 3,419.3 | | | $ | 3,144.2 | | | $ | 3,610.1 | | | $ | 5,656.9 | | | $ | 5,486.2 | | |
| Ratio of Expenses to Average Net Assets* | | | 1.05 | %† | | | 1.11 | % | | | 1.23 | % | | | 1.10 | % | | | 1.01 | % | | | 1.05 | % | |
| Ratio of Net Investment Income to Average Net Assets | | | 0.72 | %† | | | 0.65 | % | | | 1.06 | % | | | 1.17 | % | | | 1.01 | % | | | 0.94 | % | |
| Portfolio Turnover Rate | | | 2 | % | | | 24 | % | | | 62 | % | | | 32 | % | | | 12 | % | | | 9 | % | |
Financial Highlights–Class II
For a share outstanding throughout each period
| | | Six Months Ended
March 31, 2011
(Unaudited) | | Year Ended
September 30,
2010 | | Year Ended
September 30,
2009 | | Year Ended
September 30,
2008 | | Year Ended
September 30,
2007 | | Year Ended
September 30,
2006 | |
| Net Asset Value, Beginning of Period | | $ | 38.32 | | | $ | 34.56 | | | $ | 35.12 | | | $ | 46.97 | | | $ | 44.35 | | | $ | 40.51 | | |
| Income From Investment Operations: | |
| Net Investment Income | | | 0.11 | (a) | | | 0.13 | | | | 0.24 | (a) | | | 0.54 | | | | 0.32 | (a) | | | 0.25 | (a) | |
Net Gain (Loss) on Investments (both realized
and unrealized) | | | 5.14 | | | | 3.79 | | | | 0.45 | | | | (8.64 | ) | | | 4.55 | | | | 3.82 | | |
| Total From Investment Operations | | | 5.25 | | | | 3.92 | | | | 0.69 | | | | (8.10 | ) | | | 4.87 | | | | 4.07 | | |
| Less Distributions: | |
| From Net Investment Income | | | (0.14 | ) | | | (0.16 | ) | | | (0.26 | ) | | | (0.33 | ) | | | (0.25 | ) | | | (0.23 | ) | |
| From Capital Gains | | | 0.00 | | | | 0.00 | | | | (0.99 | ) | | | (3.42 | ) | | | (2.00 | ) | | | 0.00 | | |
| Total Distributions | | | (0.14 | ) | | | (0.16 | ) | | | (1.25 | ) | | | (3.75 | ) | | | (2.25 | ) | | | (0.23 | ) | |
| Redemption Fees | | | 0.00 | (b) | | | 0.00 | (b) | | | 0.00 | (b) | | | 0.00 | (b) | | | 0.00 | (b) | | | 0.00 | (b) | |
| Net Asset Value, End of Period | | $ | 43.43 | | | $ | 38.32 | | | $ | 34.56 | | | $ | 35.12 | | | $ | 46.97 | | | $ | 44.35 | | |
| Total Return | | | 13.72 | % | | | 11.37 | % | | | 3.22 | % | | | -18.44 | % | | | 11.11 | % | | | 10.08 | % | |
| Ratios/Supplemental Data: | |
| Net Assets, End of Period ($million) | | $ | 23.9 | | | $ | 9.0 | | | $ | 8.2 | | | $ | 12.4 | | | $ | 29.1 | | | $ | 37.5 | | |
| Ratio of Expenses to Average Net Assets* | | | 1.35 | %† | | | 1.42 | % | | | 1.44 | % | | | 1.47 | % | | | 1.36 | % | | | 1.40 | % | |
| Ratio of Net Investment Income to Average Net Assets | | | 0.52 | %† | | | 0.34 | % | | | 0.88 | % | | | 0.81 | % | | | 0.67 | % | | | 0.59 | % | |
| Portfolio Turnover Rate | | | 2 | % | | | 24 | % | | | 62 | % | | | 32 | % | | | 12 | % | | | 9 | % | |
* The ratio excludes expense offset arrangement.
† Data has been annualized.
(a) Computed using average shares outstanding throughout the period.
(b) Amount rounds to less than $0.01 per share.
THE OAKMARK FUNDS
86
OAKMARK SELECT FUND
Financial Highlights–Class I
For a share outstanding throughout each period
| | | Six Months Ended
March 31, 2011
(Unaudited) | | Year Ended
September 30,
2010 | | Year Ended
September 30,
2009 | | Year Ended
September 30,
2008 | | Year Ended
September 30,
2007 | | Year Ended
September 30,
2006 | |
| Net Asset Value, Beginning of Period | | $ | 25.64 | | | $ | 22.68 | | | $ | 20.34 | | | $ | 33.05 | | | $ | 34.48 | | | $ | 33.44 | | |
| Income From Investment Operations: | |
| Net Investment Income | | | 0.02 | (a) | | | 0.06 | (a) | | | 0.11 | (a) | | | 0.35 | | | | 0.38 | (a) | | | 0.36 | (a) | |
Net Gain (Loss) on Investments (both realized
and unrealized) | | | 3.64 | | | | 2.97 | | | | 2.48 | | | | (9.63 | ) | | | 2.11 | | | | 2.76 | | |
| Total From Investment Operations | | | 3.66 | | | | 3.03 | | | | 2.59 | | | | (9.28 | ) | | | 2.49 | | | | 3.12 | | |
| Less Distributions: | |
| From Net Investment Income | | | (0.06 | ) | | | (0.07 | ) | | | (0.25 | ) | | | (0.32 | ) | | | (0.39 | ) | | | (0.29 | ) | |
| From Capital Gains | | | 0.00 | | | | 0.00 | | | | 0.00 | | | | (3.11 | ) | | | (3.53 | ) | | | (1.79 | ) | |
| Total Distributions | | | (0.06 | ) | | | (0.07 | ) | | | (0.25 | ) | | | (3.43 | ) | | | (3.92 | ) | | | (2.08 | ) | |
| Redemption Fees | | | 0.00 | (b) | | | 0.00 | (b) | | | 0.00 | (b) | | | 0.00 | (b) | | | 0.00 | (b) | | | 0.00 | (b) | |
| Net Asset Value, End of Period | | $ | 29.24 | | | $ | 25.64 | | | $ | 22.68 | | | $ | 20.34 | | | $ | 33.05 | | | $ | 34.48 | | |
| Total Return | | | 14.28 | % | | | 13.39 | % | | | 13.30 | % | | | -30.43 | % | | | 7.00 | % | | | 9.58 | % | |
| Ratios/Supplemental Data: | |
| Net Assets, End of Period ($million) | | $ | 2,659.8 | | | $ | 2,407.8 | | | $ | 2,265.3 | | | $ | 2,558.9 | | | $ | 5,397.4 | | | $ | 5,776.6 | | |
| Ratio of Expenses to Average Net Assets* | | | 1.07 | %† | | | 1.08 | % | | | 1.19 | % | | | 1.08 | % | | | 0.97 | % | | | 0.99 | % | |
| Ratio of Net Investment Income to Average Net Assets | | | 0.16 | %† | | | 0.22 | % | | | 0.66 | % | | | 1.16 | % | | | 1.11 | % | | | 1.08 | % | |
| Portfolio Turnover Rate | | | 4 | % | | | 25 | % | | | 34 | % | | | 26 | % | | | 10 | % | | | 22 | % | |
Financial Highlights–Class II
For a share outstanding throughout each period
| | | Six Months Ended
March 31, 2011
(Unaudited) | | Year Ended
September 30,
2010 | | Year Ended
September 30,
2009 | | Year Ended
September 30,
2008 | | Year Ended
September 30,
2007 | | Year Ended
September 30,
2006 | |
| Net Asset Value, Beginning of Period | | $ | 25.59 | | | $ | 22.70 | | | $ | 20.29 | | | $ | 32.82 | | | $ | 34.23 | | | $ | 33.24 | | |
| Income From Investment Operations: | |
| Net Investment Income (Loss) | | | (0.02 | )(a) | | | (0.02 | )(a) | | | 0.12 | (a) | | | 0.34 | | | | 0.27 | (a) | | | 0.26 | (a) | |
Net Gain (Loss) on Investments (both realized
and unrealized) | | | 3.64 | | | | 2.97 | | | | 2.49 | | | | (9.65 | ) | | | 2.09 | | | | 2.72 | | |
| Total From Investment Operations | | | 3.62 | | | | 2.95 | | | | 2.61 | | | | (9.31 | ) | | | 2.36 | | | | 2.98 | | |
| Less Distributions: | |
| From Net Investment Income | | | 0.00 | | | | (0.06 | ) | | | (0.20 | ) | | | (0.11 | ) | | | (0.24 | ) | | | (0.20 | ) | |
| From Capital Gains | | | 0.00 | | | | 0.00 | | | | 0.00 | | | | (3.11 | ) | | | (3.53 | ) | | | (1.79 | ) | |
| Total Distributions | | | 0.00 | | | | (0.06 | ) | | | (0.20 | ) | | | (3.22 | ) | | | (3.77 | ) | | | (1.99 | ) | |
| Redemption Fees | | | 0.00 | (b) | | | 0.00 | (b) | | | 0.00 | (b) | | | 0.00 | (b) | | | 0.00 | (b) | | | 0.00 | (b) | |
| Net Asset Value, End of Period | | $ | 29.21 | | | $ | 25.59 | | | $ | 22.70 | | | $ | 20.29 | | | $ | 32.82 | | | $ | 34.23 | | |
| Total Return | | | 14.15 | % | | | 12.99 | % | | | 13.34 | % | | | -30.64 | % | | | 6.65 | % | | | 9.18 | % | |
| Ratios/Supplemental Data: | |
| Net Assets, End of Period ($million) | | $ | 9.2 | | | $ | 8.3 | | | $ | 8.1 | | | $ | 15.1 | | | $ | 36.2 | | | $ | 68.1 | | |
| Ratio of Expenses to Average Net Assets* | | | 1.39 | %† | | | 1.39 | % | | | 1.28 | % | | | 1.37 | % | | | 1.35 | % | | | 1.34 | % | |
Ratio of Net Investment Income (loss) to
Average Net Assets | | | (0.16 | )%† | | | (0.08 | )% | | | 0.72 | % | | | 0.88 | % | | | 0.79 | % | | | 0.78 | % | |
| Portfolio Turnover Rate | | | 4 | % | | | 25 | % | | | 34 | % | | | 26 | % | | | 10 | % | | | 22 | % | |
* The ratio excludes expense offset arrangement.
† Data has been annualized.
(a) Computed using average shares outstanding throughout the period.
(b) Amount rounds to less than $0.01 per share.
See accompanying Notes to Financial Statements.
THE OAKMARK FUNDS
87
OAKMARK EQUITY AND INCOME FUND
Financial Highlights–Class I
For a share outstanding throughout each period
| | | Six Months Ended
March 31, 2011
(Unaudited) | | Year Ended
September 30,
2010 | | Year Ended
September 30,
2009 | | Year Ended
September 30,
2008 | | Year Ended
September 30,
2007 | | Year Ended
September 30,
2006 | |
| Net Asset Value, Beginning of Period | | $ | 26.03 | | | $ | 24.72 | | | $ | 25.57 | | | $ | 28.67 | | | $ | 26.49 | | | $ | 25.41 | | |
| Income From Investment Operations: | |
| Net Investment Income | | | 0.10 | | | | 0.27 | (a) | | | 0.35 | (a) | | | 0.53 | (a) | | | 0.58 | (a) | | | 0.44 | | |
Net Gain (Loss) on Investments (both realized
and unrealized) | | | 3.13 | | | | 1.33 | | | | (0.24 | ) | | | (1.52 | ) | | | 3.41 | | | | 1.18 | | |
| Total From Investment Operations | | | 3.23 | | | | 1.60 | | | | 0.11 | | | | (0.99 | ) | | | 3.99 | | | | 1.62 | | |
| Less Distributions: | |
| From Net Investment Income | | | (0.22 | ) | | | (0.29 | ) | | | (0.39 | ) | | | (0.60 | ) | | | (0.50 | ) | | | (0.34 | ) | |
| From Capital Gains | | | 0.00 | | | | 0.00 | | | | (0.57 | ) | | | (1.51 | ) | | | (1.31 | ) | | | (0.20 | ) | |
| Total Distributions | | | (0.22 | ) | | | (0.29 | ) | | | (0.96 | ) | | | (2.11 | ) | | | (1.81 | ) | | | (0.54 | ) | |
| Redemption Fees | | | 0.00 | | | | 0.00 | | | | 0.00 | | | | 0.00 | (b) | | | 0.00 | (b) | | | 0.00 | (b) | |
| Net Asset Value, End of Period | | $ | 29.04 | | | $ | 26.03 | | | $ | 24.72 | | | $ | 25.57 | | | $ | 28.67 | | | $ | 26.49 | | |
| Total Return | | | 12.48 | % | | | 6.52 | % | | | 1.02 | % | | | -3.85 | % | | | 15.77 | % | | | 6.51 | % | |
| Ratios/Supplemental Data: | |
| Net Assets, End of Period ($million) | | $ | 18,964.7 | | | $ | 16,993.7 | | | $ | 14,418.4 | | | $ | 13,263.3 | | | $ | 12,489.5 | | | $ | 10,414.5 | | |
| Ratio of Expenses to Average Net Assets* | | | 0.77 | %† | | | 0.79 | % | | | 0.85 | % | | | 0.81 | % | | | 0.83 | % | | | 0.86 | % | |
| Ratio of Net Investment Income to Average Net Assets | | | 0.74 | %† | | | 1.04 | % | | | 1.59 | % | | | 1.93 | % | | | 2.14 | % | | | 1.88 | % | |
| Portfolio Turnover Rate | | | 31 | % | | | 91 | % | | | 78 | %(c) | | | 65 | %(c) | | | 67 | % | | | 81 | % | |
Financial Highlights–Class II
For a share outstanding throughout each period
| | | Six Months Ended
March 31, 2011
(Unaudited) | | Year Ended
September 30,
2010 | | Year Ended
September 30,
2009 | | Year Ended
September 30,
2008 | | Year Ended
September 30,
2007 | | Year Ended
September 30,
2006 | |
| Net Asset Value, Beginning of Period | | $ | 25.85 | | | $ | 24.57 | | | $ | 25.40 | | | $ | 28.50 | | | $ | 26.35 | | | $ | 25.29 | | |
| Income From Investment Operations: | |
| Net Investment Income | | | 0.06 | (a) | | | 0.18 | | | | 0.28 | (a) | | | 0.43 | (a) | | | 0.48 | (a) | | | 0.35 | | |
Net Gain (Loss) on Investments (both realized
and unrealized) | | | 3.11 | | | | 1.33 | | | | (0.24 | ) | | | (1.51 | ) | | | 3.40 | | | | 1.19 | | |
| Total From Investment Operations | | | 3.17 | | | | 1.51 | | | | 0.04 | | | | (1.08 | ) | | | 3.88 | | | | 1.54 | | |
| Less Distributions: | |
| From Net Investment Income | | | (0.14 | ) | | | (0.23 | ) | | | (0.30 | ) | | | (0.51 | ) | | | (0.42 | ) | | | (0.28 | ) | |
| From Capital Gains | | | 0.00 | | | | 0.00 | | | | (0.57 | ) | | | (1.51 | ) | | | (1.31 | ) | | | (0.20 | ) | |
| Total Distributions | | | (0.14 | ) | | | (0.23 | ) | | | (0.87 | ) | | | (2.02 | ) | | | (1.73 | ) | | | (0.48 | ) | |
| Redemption Fees | | | 0.00 | | | | 0.00 | | | | 0.00 | | | | 0.00 | (b) | | | 0.00 | (b) | | | 0.00 | (b) | |
| Net Asset Value, End of Period | | $ | 28.88 | | | $ | 25.85 | | | $ | 24.57 | | | $ | 25.40 | | | $ | 28.50 | | | $ | 26.35 | | |
| Total Return | | | 12.30 | % | | | 6.17 | % | | | 0.70 | % | | | -4.19 | % | | | 15.38 | % | | | 6.18 | % | |
| Ratios/Supplemental Data: | |
| Net Assets, End of Period ($million) | | $ | 1,394.0 | | | $ | 1,270.1 | | | $ | 1,110.4 | | | $ | 1,009.7 | | | $ | 915.1 | | | $ | 718.1 | | |
| Ratio of Expenses to Average Net Assets* | | | 1.08 | %† | | | 1.12 | % | | | 1.18 | % | | | 1.16 | % | | | 1.17 | % | | | 1.18 | % | |
| Ratio of Net Investment Income to Average Net Assets | | | 0.44 | %† | | | 0.71 | % | | | 1.26 | % | | | 1.59 | % | | | 1.82 | % | | | 1.57 | % | |
| Portfolio Turnover Rate | | | 31 | % | | | 91 | % | | | 78 | %(c) | | | 65 | %(c) | | | 67 | % | | | 81 | % | |
* The ratio excludes expense offset arrangement.
† Data has been annualized.
(a) Computed using average shares outstanding throughout the period.
(b) Amount rounds to less than $0.01 per share.
(c) The ratio excludes in-kind transactions.
THE OAKMARK FUNDS
88
OAKMARK GLOBAL FUND
Financial Highlights–Class I
For a share outstanding throughout each period
| | Six Months Ended
March 31, 2011
(Unaudited) | | Year Ended
September 30,
2010 | | Year Ended
September 30,
2009 | | Year Ended
September 30,
2008 | | Year Ended
September 30,
2007 | | Year Ended
September 30,
2006 | |
| Net Asset Value, Beginning of Period | | $ | 20.39 | | | $ | 18.94 | | | $ | 19.43 | | | $ | 28.08 | | | $ | 26.69 | | | $ | 23.91 | | |
| Income From Investment Operations: | |
| Net Investment Income | | | 0.01 | (a) | | | 0.10 | | | | 0.11 | | | | 0.25 | | | | 0.18 | (a) | | | 0.27 | | |
Net Gain (Loss) on Investments (both realized
and unrealized) | | | 2.70 | | | | 1.49 | | | | 0.13 | | | | (5.82 | ) | | | 5.06 | | | | 3.74 | | |
| Total From Investment Operations | | | 2.71 | | | | 1.59 | | | | 0.24 | | | | (5.57 | ) | | | 5.24 | | | | 4.01 | | |
| Less Distributions: | |
| From Net Investment Income | | | (0.09 | ) | | | (0.14 | ) | | | (0.70 | ) | | | (0.04 | ) | | | (0.31 | ) | | | (0.26 | ) | |
| From Capital Gains | | | 0.00 | | | | 0.00 | | | | (0.03 | ) | | | (3.04 | ) | | | (3.54 | ) | | | (0.97 | ) | |
| Total Distributions | | | (0.09 | ) | | | (0.14 | ) | | | (0.73 | ) | | | (3.08 | ) | | | (3.85 | ) | | | (1.23 | ) | |
| Redemption Fees | | | 0.00 | (b) | | | 0.00 | (b) | | | 0.00 | (b) | | | 0.00 | (b) | | | 0.00 | (b) | | | 0.00 | (b) | |
| Net Asset Value, End of Period | | $ | 23.01 | | | $ | 20.39 | | | $ | 18.94 | | | $ | 19.43 | | | $ | 28.08 | | | $ | 26.69 | | |
| Total Return | | | 13.30 | % | | | 8.43 | % | | | 2.65 | % | | | -22.10 | % | | | 21.29 | % | | | 17.46 | % | |
| Ratios/Supplemental Data: | |
| Net Assets, End of Period ($million) | | $ | 2,510.1 | | | $ | 2,031.8 | | | $ | 1,675.9 | | | $ | 1,946.6 | | | $ | 3,006.2 | | | $ | 2,282.2 | | |
| Ratio of Expenses to Average Net Assets* | | | 1.13 | %† | | | 1.15 | % | | | 1.23 | % | | | 1.16 | % | | | 1.13 | % | | | 1.18 | % | |
| Ratio of Net Investment Income to Average Net Assets | | | 0.10 | %† | | | 0.53 | % | | | 0.76 | % | | | 0.95 | % | | | 0.66 | % | | | 1.18 | % | |
| Portfolio Turnover Rate | | | 11 | % | | | 37 | % | | | 32 | % | | | 41 | % | | | 35 | % | | | 41 | % | |
Financial Highlights–Class II
For a share outstanding throughout each period
| | | Six Months Ended
March 31, 2011
(Unaudited) | | Year Ended
September 30,
2010 | | Year Ended
September 30,
2009 | | Year Ended
September 30,
2008 | | Year Ended
September 30,
2007 | | Year Ended
September 30,
2006 | |
| Net Asset Value, Beginning of Period | | $ | 19.97 | | | $ | 18.58 | | | $ | 19.01 | | | $ | 27.62 | | | $ | 26.31 | | | $ | 23.63 | | |
| Income From Investment Operations: | |
| Net Investment Income (Loss) | | | (0.03 | )(a) | | | 0.00 | (b) | | | 0.07 | (a) | | | 0.13 | | | | 0.07 | (a) | | | 0.18 | | |
Net Gain (Loss) on Investments (both realized
and unrealized) | | | 2.64 | | | | 1.48 | | | | 0.14 | | | | (5.69 | ) | | | 4.99 | | | | 3.69 | | |
| Total From Investment Operations | | | 2.61 | | | | 1.48 | | | | 0.21 | | | | (5.56 | ) | | | 5.06 | | | | 3.87 | | |
| Less Distributions: | |
| From Net Investment Income | | | 0.00 | (b) | | | (0.09 | ) | | | (0.61 | ) | | | (0.01 | ) | | | (0.21 | ) | | | (0.22 | ) | |
| From Capital Gains | | | 0.00 | | | | 0.00 | | | | (0.03 | ) | | | (3.04 | ) | | | (3.54 | ) | | | (0.97 | ) | |
| Total Distributions | | | 0.00 | (b) | | | (0.09 | ) | | | (0.64 | ) | | | (3.05 | ) | | | (3.75 | ) | | | (1.19 | ) | |
| Redemption Fees | | | 0.00 | (b) | | | 0.00 | (b) | | | 0.00 | (b) | | | 0.00 | (b) | | | 0.00 | (b) | | | 0.00 | (b) | |
| Net Asset Value, End of Period | | $ | 22.58 | | | $ | 19.97 | | | $ | 18.58 | | | $ | 19.01 | | | $ | 27.62 | | | $ | 26.31 | | |
| Total Return | | | 13.09 | % | | | 8.02 | % | | | 2.43 | % | | | -22.46 | % | | | 20.82 | % | | | 17.01 | % | |
| Ratios/Supplemental Data: | |
| Net Assets, End of Period ($million) | | $ | 53.1 | | | $ | 50.5 | | | $ | 54.4 | | | $ | 57.6 | | | $ | 90.3 | | | $ | 77.1 | | |
| Ratio of Expenses to Average Net Assets* | | | 1.50 | %† | | | 1.54 | % | | | 1.54 | % | | | 1.57 | % | | | 1.53 | % | | | 1.56 | % | |
| Ratio of Net Investment Income (loss) to Average Net Assets | | | (0.30 | )%† | | | 0.09 | % | | | 0.46 | % | | | 0.54 | % | | | 0.25 | % | | | 0.80 | % | |
| Portfolio Turnover Rate | | | 11 | % | | | 37 | % | | | 32 | % | | | 41 | % | | | 35 | % | | | 41 | % | |
* The ratio excludes expense offset arrangement.
† Data has been annualized.
(a) Computed using average shares outstanding throughout the period.
(b) Amount rounds to less than $0.01 per share.
See accompanying Notes to Financial Statements.
THE OAKMARK FUNDS
89
OAKMARK GLOBAL SELECT FUND
Financial Highlights–Class I
For a share outstanding throughout each period
| | | Six Months Ended
March 31, 2011
(Unaudited) | | Year Ended
September 30,
2010 | | Year Ended
September 30,
2009 | | Year Ended
September 30,
2008 | | October 2, 2006
through
September 30, 2007 (a) | |
| Net Asset Value, Beginning of Period | | $ | 10.15 | | | $ | 9.54 | | | $ | 8.23 | | | $ | 11.61 | | | $ | 10.00 | | |
| Income From Investment Operations: | |
| Net Investment Income (Loss) | | | (0.02 | ) | | | 0.04 | | | | 0.06 | | | | 0.14 | (b) | | | 0.12 | (b) | |
| Net Gain (Loss) on Investments (both realized and unrealized) | | | 1.53 | | | | 0.61 | | | | 1.60 | | | | (3.07 | ) | | | 1.49 | | |
| Total From Investment Operations | | | 1.51 | | | | 0.65 | | | | 1.66 | | | | (2.93 | ) | | | 1.61 | | |
| Less Distributions: | |
| From Net Investment Income | | | (0.02 | ) | | | (0.04 | ) | | | (0.35 | ) | | | (0.02 | ) | | | (0.01 | ) | |
| From Capital Gains | | | 0.00 | | | | 0.00 | | | | 0.00 | | | | (0.44 | ) | | | 0.00 | | |
| Total Distributions | | | (0.02 | ) | | | (0.04 | ) | | | (0.35 | ) | | | (0.46 | ) | | | (0.01 | ) | |
| Redemption Fees | | | 0.00 | (c) | | | 0.00 | (c) | | | 0.00 | (c) | | | 0.01 | | | | 0.01 | | |
| Net Asset Value, End of Period | | $ | 11.64 | | | $ | 10.15 | | | $ | 9.54 | | | $ | 8.23 | | | $ | 11.61 | | |
| Total Return | | | 14.94 | % | | | 6.81 | % | | | 22.24 | % | | | -25.95 | % | | | 16.23 | %? | |
| Ratios/Supplemental Data: | |
| Net Assets, End of Period ($million) | | $ | 444.5 | | | $ | 329.9 | | | $ | 266.2 | | | $ | 232.8 | | | $ | 377.7 | | |
| Ratio of Expenses to Average Net Assets* | | | 1.24 | %† | | | 1.29 | % | | | 1.43 | % | | | 1.35 | % | | | 1.31 | %† | |
| Ratio of Net Investment Income (loss) to Average Net Assets | | | (0.17 | )%† | | | 0.40 | % | | | 0.88 | % | | | 1.41 | % | | | 1.01 | %† | |
| Portfolio Turnover Rate | | | 20 | % | | | 50 | % | | | 41 | % | | | 62 | % | | | 33 | %? | |
? Data has not been annualized.
† Data has been annualized.
* The ratio excludes expense offset arrangement.
(a) The date on which Fund shares were first offered for sale to the public was October 2, 2006.
(b) Computed using average shares outstanding throughout the period.
(c) Amount rounds to less than $0.01 per share.
THE OAKMARK FUNDS
90
OAKMARK INTERNATIONAL FUND
Financial Highlights–Class I
For a share outstanding throughout each period
| | | Six Months Ended
March 31, 2011
(Unaudited) | | Year Ended
September 30,
2010 | | Year Ended
September 30,
2009 | | Year Ended
September 30,
2008 | | Year Ended
September 30,
2007 | | Year Ended
September 30,
2006 | |
| Net Asset Value, Beginning of Period | | $ | 18.18 | | | $ | 16.25 | | | $ | 15.71 | | | $ | 26.59 | | | $ | 26.83 | | | $ | 23.52 | | |
| Income From Investment Operations: | |
| Net Investment Income | | | 0.06 | (a) | | | 0.20 | (a) | | | 0.16 | (a) | | | 0.65 | | | | 0.43 | | | | 0.41 | | |
Net Gain (Loss) on Investments (both realized
and unrealized) | | | 1.77 | | | | 1.85 | | | | 1.87 | | | | (7.11 | ) | | | 3.25 | | | | 4.49 | | |
| Total From Investment Operations | | | 1.83 | | | | 2.05 | | | | 2.03 | | | | (6.46 | ) | | | 3.68 | | | | 4.90 | | |
| Less Distributions: | |
| From Net Investment Income | | | (0.16 | ) | | | (0.12 | ) | | | (1.39 | ) | | | (0.17 | ) | | | (0.44 | ) | | | (0.59 | ) | |
| From Capital Gains | | | 0.00 | | | | 0.00 | | | | (0.10 | ) | | | (4.25 | ) | | | (3.48 | ) | | | (1.00 | ) | |
| Total Distributions | | | (0.16 | ) | | | (0.12 | ) | | | (1.49 | ) | | | (4.42 | ) | | | (3.92 | ) | | | (1.59 | ) | |
| Redemption Fees | | | 0.00 | (b) | | | 0.00 | (b) | | | 0.00 | (b) | | | 0.00 | (b) | | | 0.00 | (b) | | | 0.00 | (b) | |
| Net Asset Value, End of Period | | $ | 19.85 | | | $ | 18.18 | | | $ | 16.25 | | | $ | 15.71 | | | $ | 26.59 | | | $ | 26.83 | | |
| Total Return | | | 10.09 | % | | | 12.67 | % | | | 17.71 | % | | | -28.59 | % | | | 14.53 | % | | | 22.14 | % | |
| Ratios/Supplemental Data: | |
| Net Assets, End of Period ($million) | | $ | 7,946.9 | | | $ | 5,707.4 | | | $ | 4,045.4 | | | $ | 3,753.6 | | | $ | 8,446.6 | | | $ | 7,200.5 | | |
| Ratio of Expenses to Average Net Assets* | | | 1.03 | %† | | | 1.08 | % | | | 1.17 | % | | | 1.10 | % | | | 1.05 | % | | | 1.08 | % | |
| Ratio of Net Investment Income to Average Net Assets | | | 0.60 | %† | | | 1.21 | % | | | 1.32 | % | | | 2.32 | % | | | 1.65 | % | | | 1.80 | % | |
| Portfolio Turnover Rate | | | 16 | % | | | 51 | % | | | 53 | % | | | 41 | % | | | 50 | % | | | 37 | % | |
Financial Highlights–Class II
For a share outstanding throughout each period
| | | Six Months Ended
March 31, 2011
(Unaudited) | | Year Ended
September 30,
2010 | | Year Ended
September 30,
2009 | | Year Ended
September 30,
2008 | | Year Ended
September 30,
2007 | | Year Ended
September 30,
2006 | |
| Net Asset Value, Beginning of Period | | $ | 18.25 | | | $ | 16.38 | | | $ | 15.55 | | | $ | 26.32 | | | $ | 26.61 | | | $ | 23.36 | | |
| Income From Investment Operations: | |
| Net Investment Income | | | 0.03 | (a) | | | 0.14 | (a) | | | 0.14 | (a) | | | 0.39 | (a) | | | 0.35 | | | | 0.34 | | |
Net Gain (Loss) on Investments (both realized
and unrealized) | | | 1.79 | | | | 1.86 | | | | 1.96 | | | | (6.86 | ) | | | 3.19 | | | | 4.45 | | |
| Total From Investment Operations | | | 1.82 | | | | 2.00 | | | | 2.10 | | | | (6.47 | ) | | | 3.54 | | | | 4.79 | | |
| Less Distributions: | |
| From Net Investment Income | | | (0.11 | ) | | | (0.13 | ) | | | (1.17 | ) | | | (0.05 | ) | | | (0.35 | ) | | | (0.54 | ) | |
| From Capital Gains | | | 0.00 | | | | 0.00 | | | | (0.10 | ) | | | (4.25 | ) | | | (3.48 | ) | | | (1.00 | ) | |
| Total Distributions | | | (0.11 | ) | | | (0.13 | ) | | | (1.27 | ) | | | (4.30 | ) | | | (3.83 | ) | | | (1.54 | ) | |
| Redemption Fees | | | 0.00 | (b) | | | 0.00 | (b) | | | 0.00 | (b) | | | 0.00 | (b) | | | 0.00 | (b) | | | 0.00 | (b) | |
| Net Asset Value, End of Period | | $ | 19.96 | | | $ | 18.25 | | | $ | 16.38 | | | $ | 15.55 | | | $ | 26.32 | | | $ | 26.61 | | |
| Total Return | | | 9.97 | % | | | 12.26 | % | | | 17.70 | % | | | -28.91 | % | | | 14.04 | % | | | 21.71 | % | |
| Ratios/Supplemental Data: | |
| Net Assets, End of Period ($million) | | $ | 213.2 | | | $ | 146.0 | | | $ | 107.8 | | | $ | 130.8 | | | $ | 586.9 | | | $ | 496.0 | | |
| Ratio of Expenses to Average Net Assets* | | | 1.34 | %† | | | 1.45 | % | | | 1.32 | % | | | 1.52 | % | | | 1.44 | % | | | 1.47 | % | |
| Ratio of Net Investment Income to Average Net Assets | | | 0.31 | %† | | | 0.83 | % | | | 1.15 | % | | | 1.96 | % | | | 1.31 | % | | | 1.43 | % | |
| Portfolio Turnover Rate | | | 16 | % | | | 51 | % | | | 53 | % | | | 41 | % | | | 50 | % | | | 37 | % | |
* The ratio excludes expense offset arrangement.
† Data has been annualized.
(a) Computed using average shares outstanding throughout the period.
(b) Amount rounds to less than $0.01 per share.
See accompanying Notes to Financial Statements.
THE OAKMARK FUNDS
91
OAKMARK INTERNATIONAL SMALL CAP FUND
Financial Highlights–Class I
For a share outstanding throughout each period
| | | Six Months Ended
March 31, 2011
(Unaudited) | | Year Ended
September 30,
2010 | | Year Ended
September 30,
2009 | | Year Ended
September 30,
2008 | | Year Ended
September 30,
2007 | | Year Ended
September 30,
2006 | |
| Net Asset Value, Beginning of Period | | $ | 13.02 | | | $ | 11.51 | | | $ | 11.36 | | | $ | 23.19 | | | $ | 24.09 | | | $ | 22.79 | | |
| Income From Investment Operations: | |
| Net Investment Income | | | 0.04 | (a) | | | 0.12 | (a) | | | 0.15 | (a) | | | 0.37 | | | | 0.32 | | | | 0.42 | | |
Net Gain (Loss) on Investments (both realized
and unrealized) | | | 1.69 | | | | 1.55 | | | | 1.06 | | | | (6.36 | ) | | | 2.77 | | | | 5.12 | | |
| Total From Investment Operations | | | 1.73 | | | | 1.67 | | | | 1.21 | | | | (5.99 | ) | | | 3.09 | | | | 5.54 | | |
| Less Distributions: | |
| From Net Investment Income | | | (0.08 | ) | | | (0.16 | ) | | | (0.93 | ) | | | (0.18 | ) | | | (0.56 | ) | | | (0.70 | ) | |
| From Capital Gains | | | 0.00 | | | | 0.00 | | | | (0.13 | ) | | | (5.66 | ) | | | (3.43 | ) | | | (3.54 | ) | |
| Total Distributions | | | (0.08 | ) | | | (0.16 | ) | | | (1.06 | ) | | | (5.84 | ) | | | (3.99 | ) | | | (4.24 | ) | |
| Redemption Fees | | | 0.00 | (b) | | | 0.00 | (b) | | | 0.00 | (b) | | | 0.00 | (b) | | | 0.00 | (b) | | | 0.00 | (b) | |
| Net Asset Value, End of Period | | $ | 14.67 | | | $ | 13.02 | | | $ | 11.51 | | | $ | 11.36 | | | $ | 23.19 | | | $ | 24.09 | | |
| Total Return | | | 13.30 | % | | | 14.70 | % | | | 16.28 | % | | | -32.47 | % | | | 13.35 | % | | | 28.50 | % | |
| Ratios/Supplemental Data: | |
| Net Assets, End of Period ($million) | | $ | 1,673.9 | | | $ | 1,217.2 | | | $ | 768.0 | | | $ | 663.6 | | | $ | 1,326.5 | | | $ | 1,274.5 | | |
| Ratio of Expenses to Average Net Assets* | | | 1.35 | %† | | | 1.38 | % | | | 1.54 | % | | | 1.41 | % | | | 1.34 | % | | | 1.37 | % | |
| Ratio of Net Investment Income to Average Net Assets | | | 0.57 | %† | | | 1.02 | % | | | 1.77 | % | | | 2.17 | % | | | 1.19 | % | | | 1.73 | % | |
| Portfolio Turnover Rate | | | 19 | % | | | 54 | % | | | 46 | % | | | 50 | % | | | 57 | % | | | 44 | % | |
Financial Highlights–Class II
For a share outstanding throughout each period
| | | Six Months Ended
March 31, 2011
(Unaudited) | | Year Ended
September 30,
2010 | | Year Ended
September 30,
2009 | | Year Ended
September 30,
2008 | | Year Ended
September 30,
2007 | | Year Ended
September 30,
2006 | |
| Net Asset Value, Beginning of Period | | $ | 12.97 | | | $ | 11.50 | | | $ | 11.33 | | | $ | 23.15 | | | $ | 24.05 | | | $ | 22.77 | | |
| Income From Investment Operations: | |
| Net Investment Income | | | 0.02 | (a) | | | 0.09 | (a) | | | 0.14 | (a) | | | 0.47 | | | | 0.29 | | | | 0.41 | | |
Net Gain (Loss) on Investments (both realized
and unrealized) | | | 1.68 | | | | 1.54 | | | | 1.06 | | | | (6.48 | ) | | | 2.79 | | | | 5.10 | | |
| Total From Investment Operations | | | 1.70 | | | | 1.63 | | | | 1.20 | | | | (6.01 | ) | | | 3.08 | | | | 5.51 | | |
| Less Distributions: | |
| From Net Investment Income | | | (0.04 | ) | | | (0.16 | ) | | | (0.90 | ) | | | (0.15 | ) | | | (0.55 | ) | | | (0.69 | ) | |
| From Capital Gains | | | 0.00 | | | | 0.00 | | | | (0.13 | ) | | | (5.66 | ) | | | (3.43 | ) | | | (3.54 | ) | |
| Total Distributions | | | (0.04 | ) | | | (0.16 | ) | | | (1.03 | ) | | | (5.81 | ) | | | (3.98 | ) | | | (4.23 | ) | |
| Redemption Fees | | | 0.00 | (b) | | | 0.00 | (b) | | | 0.00 | (b) | | | 0.00 | (b) | | | 0.00 | (b) | | | 0.00 | (b) | |
| Net Asset Value, End of Period | | $ | 14.63 | | | $ | 12.97 | | | $ | 11.50 | | | $ | 11.33 | | | $ | 23.15 | | | $ | 24.05 | | |
| Total Return | | | 13.11 | % | | | 14.30 | % | | | 16.08 | % | | | -32.63 | % | | | 13.29 | % | | | 28.33 | % | |
| Ratios/Supplemental Data: | |
| Net Assets, End of Period ($million) | | $ | 2.0 | | | $ | 1.4 | | | $ | 0.8 | | | $ | 0.3 | | | $ | 0.9 | | | $ | 0.8 | | |
| Ratio of Expenses to Average Net Assets* | | | 1.62 | %† | | | 1.72 | % | | | 1.71 | % | | | 1.54 | % | | | 1.43 | % | | | 1.47 | % | |
| Ratio of Net Investment Income to Average Net Assets | | | 0.34 | %† | | | 0.74 | % | | | 1.66 | % | | | 2.12 | % | | | 1.12 | % | | | 1.62 | % | |
| Portfolio Turnover Rate | | | 19 | % | | | 54 | % | | | 46 | % | | | 50 | % | | | 57 | % | | | 44 | % | |
* The ratio excludes expense offset arrangement.
† Data has been annualized.
(a) Computed using average shares outstanding throughout the period.
(b) Amount rounds to less than $0.01 per share.
THE OAKMARK FUNDS
92
DISCLOSURE REGARDING THE BOARD OF TRUSTEES' OCTOBER 2010 APPROVAL OF INVESTMENT ADVISORY CONTRACTS AS APPROVED APRIL 27, 2011
Each year, the Board of Trustees of the Oakmark Funds (the "Board"), including a majority of the independent Trustees, is required by the Investment Company Act of 1940 (the "1940 Act") to determine whether to continue each Fund's investment advisory agreement (each an "Agreement") with the Fund's investment adviser (the "Adviser"). The Board requests and receives from the Adviser a broad range of materials and information that are relevant to the Trustees' consideration of the Agreements, both throughout the year and especially in connection with its annual review of the Agreements. In addition, the Board retains an independent data provider to provide performance and expense information for each Fund and for comparable funds.
The Board's committee on contracts (the "Committee") leads the Board in its evaluation of the Agreements. The Committee is comprised entirely of trustees who are not "interested persons" of the Funds as defined in the 1940 Act ("Independent Trustees"), and more than 75% of the Board is comprised of Independent Trustees. During the last year, the Committee and the Board met numerous times to consider the Agreements. At each of those meetings, the Committee and the Board were advised by, and met in executive session with, their experienced independent legal counsel.
In connection with their consideration of each Agreement, the Committee and the Board considered, among other things: (i) the nature, quality and extent of the Adviser's services, (ii) the investment performance of each Fund, as well as performance information for comparable funds, (iii) the fees and other expenses paid by each Fund, as well as fee and expense information for comparable funds and separate accounts managed by the Adviser, (iv) the profitability of the Adviser and its affiliates from their relationship with each Fund, (v) whether economies of scale may be realized as the Funds grow and whether fee levels share with Fund investors economies of scale and (vi) other benefits to the Adviser from its relationship with each Fund.
At a meeting held on October 20, 2010, the Board, including all of the Independent Trustees, upon recommendation of the Committee, determined that the continuation of the Agreement for each Fund was in the best interest of the Fund and its shareholders, and approved the continuation of the Agreements through October 31, 2011. Below is a summary of the principal information considered by the Board as well as the Board's conclusions regarding various factors. In their deliberations, the Independent Trustees did not identify any single factor that was paramount or determinative, and each Independent Trustee may have weighed the information differently.
1. Nature, Extent and Quality of Services
The Board's consideration of the nature, extent and quality of the Adviser's services to the Funds took into account the knowledge the Board gained during meetings with the Adviser throughout the year. In addition, the Board considered: the Adviser's long-term history of care and conscientiousness in the management of the Funds; the consistency of its investment approach; the background and experience of the Adviser's investment personnel responsible for managing the Funds; the Adviser's performance as administrator of the Funds; the Adviser's comprehensive compliance program; and the favorable recognition of the Adviser and the Funds in the media and in industry publications. The Board also reviewed the Adviser's resources and key personnel involved in providing investment management services to the Funds, including the time that investment personnel devoted to each Fund and the investment results produced as a result of the Adviser's in-house research. The Board also noted the significant personal investments that the Adviser's personnel have made in the Funds, which serve to further align the interests of the Adviser and its personnel with those of the Funds' shareholders. The Board concluded that the nature, extent and quality of the services provided by the Adviser to each Fund were appropriate and consistent with the Fund's Agreement and that each Fund was likely to continue to benefit from services provided under its Agreement with the Adviser.
2. Investment Performance of the Funds
The Board considered each Fund's investment performance over various time periods, including how the Fund performed compared to the performance of a group of comparable funds (the Fund's "Performance Universe") selected by Lipper, Inc. ("Lipper"). Among the performance periods considered by the Board
THE OAKMARK FUNDS
93
were those ended on May 31, 2010. Where available, the Board considered one-, three-, five- and ten-year performance.
Further detail considered by the Board regarding the investment performance of each Fund is set forth below:
Oakmark Fund. The Board considered that the Fund outperformed the annualized returns of its Performance Universe median during all periods presented.
Oakmark Select Fund. The Board considered that the Fund outperformed the annualized returns of its Performance Universe median during all periods presented.
Oakmark Equity and Income Fund. Noting that its focus continues to be on longer-term performance, the Board considered that the Fund outperformed the annualized returns of its Performance Universe median during the three-, five- and ten-year periods, although it underperformed the Performance Universe median during the one-year period. The Board also took into account the Adviser's assertion that the Fund's risk profile generally is more conservative than many of its peers, which may result in relative underperformance during periods of exceptionally high returns in the equity markets.
Oakmark Global Fund. The Board considered that the Fund outperformed the annualized returns of its Performance Universe median during all periods presented.
Oakmark Global Select Fund. Noting that the Fund commenced operations in October 2006, the Board considered that the Fund outperformed the annualized returns of its Performance Universe median during all periods presented.
Oakmark International Fund. The Board considered that the Fund outperformed the annualized returns of its Performance Universe median during all periods presented.
Oakmark International Small Cap Fund. The Board considered that the Fund outperformed the annualized returns of its Performance Universe median during all periods presented.
In addition to comparing each Fund's performance to that of its Performance Universe, the Board also considered each Fund's performance compared to that of its benchmark and other comparative data provided by Lipper, including each Fund's total return and performance relative to risk. After considering all of this information, the Board concluded that the Adviser was delivering performance for each Fund that was consistent with the long-term investment strategies being pursued by the Fund, and that the Fund and its shareholders were benefiting from the Adviser's investment management of the Fund.
3. Costs of Services Provided and Profits Realized by the Adviser
Using information provided by Lipper, the Board evaluated each Fund's advisory fee compared to the advisory fee for other mutual funds comparable in size, character and investment strategy (the "Expense Group"), and each Fund's expense ratio compared to that of the Expense Group.
The Board also reviewed the Adviser's advisory fees for comparable institutional separate account clients and subadvised funds (for which the Adviser provides portfolio management services only). The Board noted the Adviser's explanation that, although in most instances, the fees paid by those other clients were lower than the fees paid by the Funds, the differences reflected the Adviser's significantly greater level of responsibilities and broader scope of services regarding the Funds, and the more extensive regulatory obligations and risks associated with managing the Funds.
The Board also considered the Adviser's costs in serving as the Fund's investment adviser and manager, including costs associated with technology, infrastructure and compliance necessary to manage the Funds. The Board reviewed the Adviser's methodology for allocating costs among the Adviser's lines of business and among the Funds. The Board also considered information regarding the structure of the Adviser's compensation program for portfolio managers, analysts and certain other employees and the relationship of such compensation to the Adviser's ability to attract and retain quality personnel. Finally, the Board considered the Adviser's profitability analysis, as well as an Investment Management Industry Profitability Analysis prepared by Lipper. The Board examined the pre-tax profits realized by the Adviser and its affiliates
THE OAKMARK FUNDS
94
from their relationship with each Fund, as presented in the profitability analyses, as well as the financial condition of the Adviser.
Further detail considered by the Board regarding the management fee rate and expense ratio of each Fund is set forth below:
Oakmark Fund, Oakmark Select Fund, Oakmark Equity and Income Fund, Oakmark Global Select Fund and Oakmark International Small Cap Fund. The Board considered that each Fund's management fee rate and total expense ratio are higher than the respective medians of the Fund's Expense Group. The Board, in its consideration of those expenses, also took into account its review of each Fund's performance.
Oakmark Global Fund. The Board considered that the Fund's management fee rate is higher than the median of the Fund's Expense Group. The Board noted, however, that the Fund's total expense ratio, which reflects the total fees paid by an investor, is lower than the median of the Fund's Expense Group.
Oakmark International Fund. The Board considered that the Fund's management fee rate is at the median of the Fund's Expense Group. The Board also noted, however, that the Fund's total expense ratio, which reflects the total fees paid by an investor, is lower than the median of the Fund's Expense Group
After its review of all the matters addressed, including those outlined above, the Board concluded that the management fees paid by each Fund to the Adviser were reasonable in light of the services provided, and that the profitability of the Adviser's relationship with the Funds appeared to be reasonable in relation to the services performed.
4. Economies of Scale and Fee Levels Reflecting Those Economies
The Board considered whether each Fund's management fee structure provides for a sharing with shareholders of potential economies of scale that may be realized by the Adviser. The Board reviewed each Agreement, which includes breakpoints that decrease the management fee rate as a Fund's assets increase. The Board concluded that the breakpoints in the fee schedule for each Fund allow shareholders to benefit from potential economies of scale that may be achieved by the Adviser.
5. Other Benefits Derived from the Relationship with the Funds
The Board also considered other benefits that accrue to the Adviser and its affiliates from their relationship with the Funds. The Board noted that an affiliate of the Adviser serves as the Funds' distributor, without compensation, pursuant to a written agreement the Board evaluates annually.
The Board also considered the Adviser's use of a portion of the commissions paid by the Funds on their portfolio brokerage transactions to obtain research products and services benefiting the Funds and/or other clients of the Adviser and considered the Adviser's assertion that its use of "soft" commission dollars to obtain research products and services was consistent with regulatory requirements.
After full consideration of the above factors, as well as other factors that were instructive in evaluating the Agreements, the Board, including all of the Independent Trustees, concluded that approval of the continuation of each Agreement was in the best interests of the Fund and its shareholders. On October 20, 2010, the Board continued each Agreement.
THE OAKMARK FUNDS
95
Reporting to Shareholders. The Funds reduce the number of duplicate prospectuses, annual and semi-annual reports your household receives by sending only one copy of each to those addresses shared by two or more accounts. Call the Funds at 1-800-OAKMARK to request individual copies of these documents. The Funds will begin sending individual copies thirty days after receiving your request.
For a prospectus and more information about The Oakmark Funds, including management fees and expenses and the special risks of investing, please visit oakmark.com or call 1-800-OAKMARK (1-800-625-6275). Please read the prospectus carefully before investing. An investor should consider a fund's investment objectives, risks, and charges and expenses carefully before investing. This and other information about The Oakmark Funds are contained in the Funds' prospectus.
The discussion of the Funds' investments and investment strategy (including current investment themes, the portfolio managers' research and investment process, and portfolio characteristics) represents the Funds' investments and the views of the portfolio managers and Harris Associates L.P., the Funds' investment adviser, at the time of this letter, and are subject to change without notice.
Past Performance is no guarantee of future results. The performance data quoted represents past performance. Current performance may be lower or higher than the performance data quoted. The investment return and principal value vary so that an investor's shares when redeemed may be worth more or less than the original cost. The performance of the Funds does not reflect the 2% redemption fee imposed on shares redeemed within 90 days of purchase with the exception of The Oakmark Equity & Income Fund which does not impose a redemption fee. To obtain the most recent month-end performance data, visit oakmark.com.
Current and future portfolio holdings are subject to risk.
Investing in value stocks presents the risk that value stocks may fall out of favor with investors and underperform growth stocks during given periods.
Because both Oakmark Select Fund and Oakmark Global Select Fund are non-diversified, the performance of each holding in those Funds will have a greater impact on the Funds' total returns, and may make the Funds' returns more volatile than a more diversified fund.
The Oakmark Equity and Income Fund closed to certain new investors as of 5/13/10.
Oakmark Equity and Income Fund may invest in medium- and lower-quality debt securities that have higher yield potential but present greater investment and credit risk than higher-quality securities. These risks may result in greater share price volatility. An economic downturn could severely disrupt the market in medium- or lower-grade debt securities and adversely affect the value of outstanding bonds and the ability of the issuers to repay principal and interest.
Investing in foreign securities presents risks that in some ways may be greater than in U.S. investments. Those risks include: currency fluctuation; different regulation, accounting standards, trading practices and levels of available information; generally higher transaction costs; and political risks.
The stocks of smaller companies often involve more risk than the stocks of larger companies. Stocks of small companies tend to be more volatile and have a smaller public market than stocks of larger companies. Small companies may have a shorter history of operations than larger companies, may not have as great an ability to raise additional capital and may have a less diversified product line, making them more susceptible to market pressure.
Endnotes:
1. Total return includes change in share prices and in each case includes reinvestment of any dividends and capital gain distributions.
2. Portfolio holdings are subject to change without notice and are not intended as recommendations of individual stocks.
3. Keri, Jonah. The Extra 2%—How Wall Street Strategies Took a Major League Baseball Team from Worst to First. ESPN, March 8, 2011.
THE OAKMARK FUNDS
96
4. The S&P 500 Total Return Index is a broad market-weighted average of U.S. blue-chip companies. This index is unmanaged and investors cannot invest directly in this index.
5. The Dow Jones Industrial Average is an index that includes only 30 U.S. blue-chip companies. This index is unmanaged and investors cannot invest directly in this index.
6. The Lipper Large Cap Value Fund Index is an equally weighted index of the largest 30 funds within the large cap value funds investment objective as defined by Lipper Inc. The index is adjusted for the reinvestment of capital gains and income dividends. This index is unmanaged and investors cannot invest directly in this index.
7. The Lipper Multi-Cap Value Funds Index tracks the results of the 30 largest mutual funds in the Lipper Multi-Cap Value Funds category. This index is unmanaged and investors cannot invest directly in this index.
8. The Lipper Balanced Fund Index measures the performance of the 30 largest U.S. balanced funds tracked by Lipper. This index is unmanaged and investors cannot invest directly in this index.
9. The Barclays Capital U.S. Government / Credit Bond Index is a benchmark index made up of the Barclays Capital U.S. Government and U.S. Corporate Bond indices, including U.S. government Treasury and agency securities as well as corporate and Yankee bonds. This index is unmanaged and investors cannot invest directly in this index.
10. The MSCI World Index (Net) is a free float-adjusted market capitalization weighted index that is designed to measure the global equity market performance of developed markets. This benchmark calculates reinvested dividends net of withholding taxes using Luxembourg tax rates. This index is unmanaged and investors cannot invest directly in this index.
11. The Lipper Global Fund Index measures the performance of the 30 largest mutual funds that invest in securities throughout the world. This index is unmanaged and investors cannot invest directly in this index.
12. The Japanese TOPIX Index is an index that measures stock prices on the Tokyo Stock Exchange (TSE). This capitalization-weighted index lists all firms that are considered to be under the 'first section' on the TSE, which groups all of the large firms on the exchange into one pool. This index is unmanaged and investors cannot actually make investments in this index.
13. Power, Stephen. "Radiation Traces Found in U.S. Milk."
http://online.wsj.com/article/SB10001424052748703806304576233221749626458.html?mod=WSJ_WSJ_News_BlogsModule. March 31, 2011.
14. The MSCI World ex U.S. Index (Net) is a free float-adjusted market capitalization index that is designed to measure international developed market equity performance, excluding the U.S. This benchmark calculates reinvested dividends net of withholding taxes using Luxembourg tax rates. This index is unmanaged and investors cannot invest directly in this index.
15. The MSCI EAFE (Europe, Australasia, Far East) Index (Net) is a free float-adjusted market capitalization index that is designed to measure the international equity market performance of developed markets, excluding the US & Canada. This benchmark calculates reinvested dividends net of withholding taxes using Luxembourg tax rates. This index is unmanaged and investors cannot invest directly in this index.
16. The Lipper International Fund Index reflects the net asset value weighted total return of the 30 largest international equity funds. This index is unmanaged and investors cannot invest directly in this index.
17. The MSCI World ex U.S. Small Cap Index (Net) is a free float-adjusted market capitalization index that is designed to measure global developed market equity performance, excluding the U.S. The MSCI Small Cap Indices target 40% of the eligible Small Cap universe within each industry group, within each country. MSCI defines the Small Cap universe as all listed securities that have a market capitalization in the range of USD200-1,500 million. This benchmark calculates reinvested dividends net of withholding taxes using Luxembourg tax rates. This index is unmanaged and investors cannot invest directly in this index.
18. The Lipper International Small Cap Funds Index measures the performance of the 10 largest international small-cap funds tracked by Lipper. This index is unmanaged and investors cannot invest directly in this index.
OAKMARK, OAKMARK FUNDS, OAKMARK INTERNATIONAL, and OAKMARK and tree design are trademarks owned or registered by Harris Associates L.P. in the U.S. and/or other countries.
THE OAKMARK FUNDS
97
Oakmark Glossary
Book value – A company's common stock equity as it appears on a balance sheet, equal to total assets minus liabilities, preferred stock, and intangible assets such as goodwill. A company's book value often differs substantially from economic value, especially in industries such as media.
Business value/Intrinsic value – The perceived or estimated actual value of a security, as opposed to its current market price or book value. Business value can be evaluated based on what a knowledgeable buyer would pay for a business if the company were sold in its entirety.
Growth investing – Investors who look for companies based on whether the stock of a company is growing earnings and/or revenue faster than the industry as a whole or the overall market. Growth investors generally expect high rates of growth to persist, and the stock, in turn, to deliver returns exceeding the market's return. A growth mutual fund is generally one that emphasizes stocks believed to offer above-average growth prospects, with less emphasis on the stock's current price than a value mutual fund would have.
M & A (Mergers & Acquisitions) – Merger: the combining of two or more entities into one, through a purchase acquisition or a pooling of interests. Acquisition: can also be called a takeover, and is defined as acquiring control of a corporation, called a target, by stock purchase or exchange, either hostile or friendly.
Market capitalization (market cap or cap) – The market price of an entire company on any given day, calculated by multiplying the number of shares outstanding by the price per share.
Momentum investing – Approach to investing based on the belief that stock price trends are likely to continue. Momentum investors tend to buy stocks that have been outperforming the market and to sell those stocks when their relative performance deteriorates. Momentum investors typically do not consider a company's underlying value or fundamentals in their investment decisions.
Multiple – A ratio used to measure a stock's valuation, usually greater than 1. Sometimes used to mean price/earnings ratio.
P/B or Price-to-Book Ratio – A stock's capitalization divided by its book value. The value is the same whether the calculation is done for the whole company or on a per-share basis.
P/E or Price-to-Earnings Ratio – The most common measure of a stock's valuation. It is equal to a stock's capitalization divided by its after-tax earnings over a 12-month period. The value is the same whether the calculation is done for the whole company or on a per-share basis. Equivalently, the cost an investor in a given stock must pay per dollar of current annual earnings. Also called earnings multiple.
Share repurchase – Program through which a corporation buys back its own shares in the open market, typically an indication that the corporation's management believes the stock price is undervalued.
Value investing – Investors who utilize valuation measures such as business value (including growth rate), price/earnings ratio, price/book ratio, and yield to gauge the attractiveness of a company. Managers who employ a value investment style believe that the true, underlying value of a company is not reflected in its current share price, and, over time, the price has potential to increase as the market recognizes the overall value of the business. Value stocks sell at relatively low prices in relation to their underlying business value, earnings, or book value.
Stocks become undervalued for a variety of reasons, including an overall market decline, or when a specific industry falls into disfavor and investors view all companies in that industry in the same light. Consequently, an individual company's stock price may fall, even though it may be only temporarily affected by the industry's problems and its underlying value has remained unchanged.
"x times earnings" (e.g. "12 times earnings") – Another way to express a stock's price-to-earnings (P/E) ratio. A stock with a P/E ratio of 12 sells at 12 times earnings.
THE OAKMARK FUNDS
98
THE OAKMARK FUNDS
Trustees and Officers
Trustees
Gary N. Wilner, M.D.—Chairman
Michael J. Friduss
Thomas H. Hayden
Christine M. Maki
Allan J. Reich
Steven S. Rogers
Kristi L. Rowsell
Burton W. Ruder
Peter S. Voss
Officers
Kristi L. Rowsell—President and Principal Executive Officer
Robert M. Levy—Executive Vice President
Henry R. Berghoef—Vice President
John N. Desmond—Vice President
Richard J. Gorman—Vice President, Chief Compliance
Officer and Assistant Secretary
Kevin G. Grant—Vice President
Thomas E. Herman—Chief Financial Officer and
Principal Financial Officer
David G. Herro—Vice President
John J. Kane—Treasurer
Clyde S. McGregor—Vice President
Michael J. Neary—Vice President
William C. Nygren—Vice President
John R. Raitt—Vice President
Vineeta D. Raketich—Vice President
Janet L. Reali—Vice President and Secretary
Edward A. Studzinski—Vice President
Robert A. Taylor—Vice President
Andrew J. Tedeschi—Assistant Treasurer
Christopher P. Wright—Vice President
Other Information
Investment Adviser
Harris Associates L.P.
Two North LaSalle Street
Chicago, Illinois 60602-3790
Transfer Agent
Boston Financial Data Services, Inc.
Quincy, Massachusetts
Legal Counsel
K&L Gates LLP
Chicago, Illinois
Independent Registered Public
Accounting Firm
Deloitte & Touche LLP
Chicago, Illinois
For More Information
Please call 1-800-OAKMARK
(1-800-625-6275)
or 617-483-8327
Website
oakmark.com
To obtain a prospectus, a new account application, forms or periodic reports, access our web site at oakmark.com, or call 1-800-OAKMARK (1-800-625-6275) or (617) 483-8327.
The Funds will file its complete schedule of portfolio holdings with the Securities and Exchange Commission (the "SEC") for the first and third quarters of each fiscal year on Form N-Q. The Funds' Forms N-Q are available on the SEC's website at www.sec.gov. The Funds' Forms N-Q may be reviewed and copied at the SEC's Public Reference Room in Washington, DC, and information on the operation of the Public Reference Room may be obtained by calling 1-800-SEC-0330.
A description of the policies and procedures the Funds use to determine how to vote proxies relating to portfolio securities is available without charge, upon request, by calling toll-free 1-800-625-6275; on the Funds' website at oakmark.com; and on the SEC's website at www.sec.gov.
No later than August 31 of each year, information regarding how the Adviser, on behalf of the Funds, voted proxies relating to the Funds' portfolio securities for the twelve months ended the preceding June 30 will be available through a link on the Funds' website at oakmark.com and on the SEC's website at www.sec.gov.
This report is submitted for the general information of the Funds' shareholders. The report is not authorized for distribution to prospective investors in the Funds unless it is accompanied or preceded by the Funds' currently effective prospectus.
No sales charge to the shareholder or to the new investor is made in offering the shares of the Funds, however, a shareholder may incur a 2% redemption fee on an exchange or redemption of shares redeemed within 90 days of purchase from any Fund other than Oakmark Equity & Income Fund.

1-800-OAKMARK
oakmark.com
The Oakmark Funds are distributed by Harris Associates Securities L.P., member FINRA. Date of first use: May 2011.
OAKMARK FUND CLASS II
THE VALUE OF A $10,000 INVESTMENT IN OAKMARK FUND FROM ITS
INCEPTION (4/5/01) TO PRESENT (3/31/11) AS COMPARED TO THE
STANDARD & POOR'S 500 INDEX (UNAUDITED)
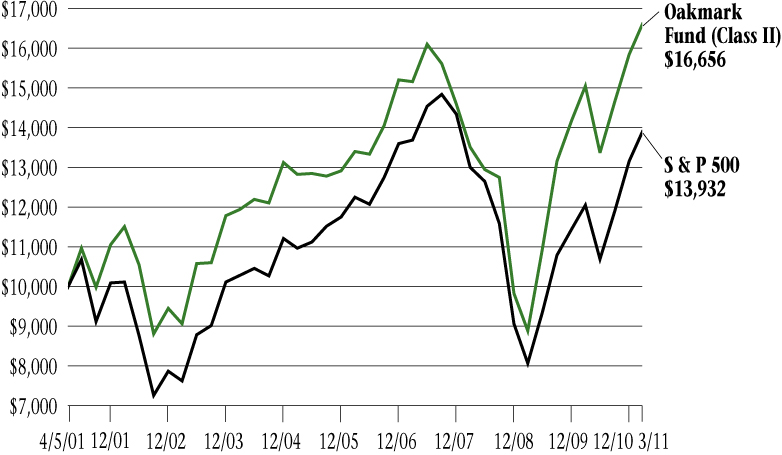
Average Annual Total Returns
(as of 3/31/11)
| (Unaudited) | | 1-year | | 5-year | | Since
Inception
(4/5/01) | |
| Oakmark Fund (Class II) | | | 10.69 | % | | | 4.46 | % | | | 5.24 | % | |
| S&P 500 Index | | | 15.65 | % | | | 2.62 | % | | | 3.38 | % | |
The graph and table do not reflect the deduction of taxes that a shareholder would pay on fund distributions or the redemption of fund shares.
The expense ratio for Class II shares as of 9/30/10 was 1.42%.
The performance data quoted represents past performance. The above performance information does not reflect the imposition of a 2% redemption fee on shares held for 90 days or less. If reflected, the fee would reduce the performance quoted. Past performance does not guarantee future results. The investment return and principal value will fluctuate so that an investor's shares, when redeemed, may be worth more or less than their original cost. Current performance may be lower or higher than the performance data quoted. Average annual total return measures annualized change, while total return measures aggregate change. To obtain most recent month-end performance data, visit oakmark.com.
The S&P 500 Total Return Index is a broad market-weighted average of U.S. blue-chip companies. This index is unmanaged and investors cannot invest directly in this index.
Harris Associates Securities L.P., member FINRA, June 2011
OAKMARK SELECT FUND CLASS II
THE VALUE OF A $10,000 INVESTMENT IN OAKMARK SELECT FUND FROM ITS
INCEPTION (12/31/99) TO PRESENT (3/31/11) AS COMPARED TO THE
STANDARD & POOR'S 500 INDEX (UNAUDITED)
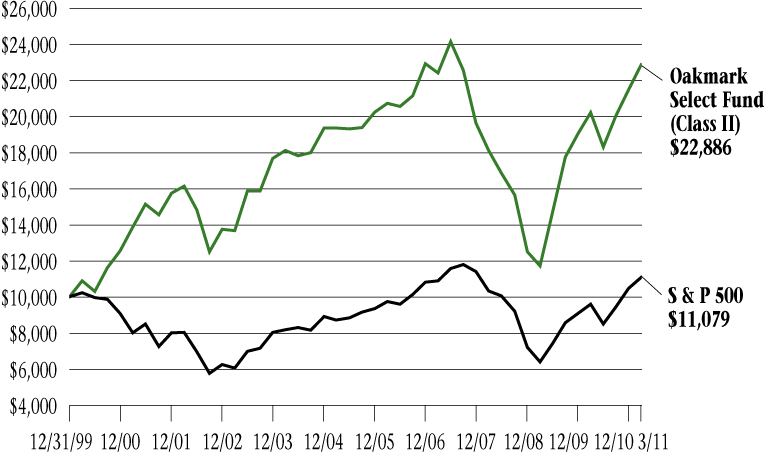
Average Annual Total Returns
(as of 3/31/11)
| (Unaudited) | | 1-year | | 5-year | | 10-year | | Since
Inception
(12/31/99) | |
| Oakmark Select Fund (Class II) | | | 13.09 | % | | | 1.98 | % | | | 5.13 | % | | | 7.64 | % | |
| S&P 500 Index | | | 15.65 | % | | | 2.62 | % | | | 3.29 | % | | | 0.92 | % | |
The graph and table do not reflect the deduction of taxes that a shareholder would pay on fund distributions or the redemption of fund shares.
The expense ratio for Class II shares as of 9/30/10 was 1.39%.
The performance data quoted represents past performance. The above performance information does not reflect the imposition of a 2% redemption fee on shares held for 90 days or less. If reflected, the fee would reduce the performance quoted. Past performance does not guarantee future results. The investment return and principal value will fluctuate so that an investor's shares, when redeemed, may be worth more or less than their original cost. Current performance may be lower or higher than the performance data quoted. Average annual total return measures annualized change, while total return measures aggregate change. To obtain most recent month-end performance data, visit oakmark.com.
The S&P 500 Total Return Index is a broad market-weighted average of U.S. blue-chip companies. This index is unmanaged and investors cannot invest directly in this index.
Harris Associates Securities L.P., member FINRA, June 2011
OAKMARK EQUITY AND INCOME FUND CLASS II
THE VALUE OF A $10,000 INVESTMENT IN OAKMARK EQUITY AND INCOME
FUND FROM ITS INCEPTION (7/12/00) TO PRESENT (3/31/11) AS COMPARED TO
THE LIPPER BALANCED FUND INDEX (UNAUDITED)

Average Annual Total Returns
(as of 3/31/11)
| (Unaudited) | | 1-year | | 5-year | | 10-year | | Since
Inception
(7/13/00) | |
Oakmark Equity & Income Fund
(Class II) | | | 9.09 | % | | | 6.61 | % | | | 8.57 | % | | | 9.44 | % | |
| Lipper Balanced Fund Index | | | 11.96 | % | | | 4.04 | % | | | 4.64 | % | | | 3.68 | % | |
The graph and table do not reflect the deduction of taxes that a shareholder would pay on fund distributions or the redemption of fund shares.
The expense ratio for Class II shares as of 9/30/10 was 1.12%.
The performance data quoted represents past performance. Past performance does not guarantee future results. The investment return and principal value will fluctuate so that an investor's shares, when redeemed, may be worth more or less than their original cost. Current performance may be lower or higher than the performance data quoted. Average annual total return measures annualized change, while total return measures aggregate change. To obtain most recent month-end performance data, visit oakmark.com.
The Lipper Balanced Fund Index measures the performance of the 30 largest U.S. balanced funds tracked by Lipper. This index is unmanaged and investors cannot invest directly in this index.
Harris Associates Securities L.P., member FINRA, June 2011
OAKMARK GLOBAL FUND CLASS II
THE VALUE OF A $10,000 INVESTMENT IN OAKMARK GLOBAL FUND
FROM ITS INCEPTION (10/10/01) TO PRESENT (3/31/11) AS COMPARED TO THE
MSCI WORLD INDEX (UNAUDITED)
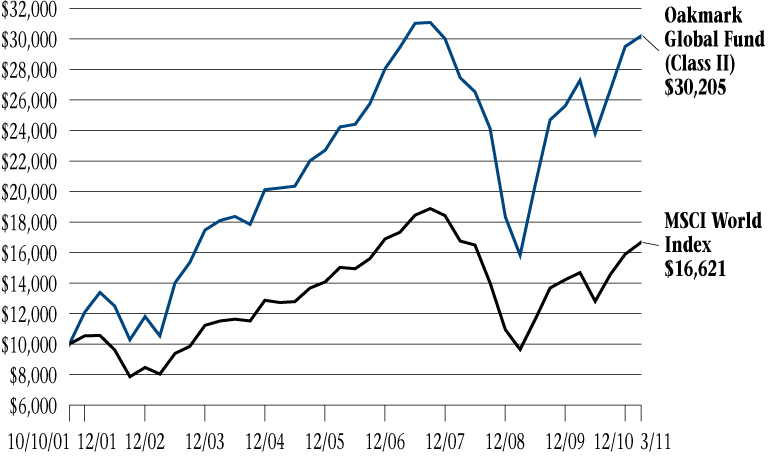
Average Annual Total Returns
(as of 3/31/11)
| (Unaudited) | | 1-year | | 5-year | | Since
Inception
(10/10/01) | |
| Oakmark Global Fund (Class II) | | | 10.59 | % | | | 4.48 | % | | | 12.38 | % | |
| MSCI World Index | | | 13.45 | % | | | 2.08 | % | | | 5.51 | % | |
The graph and table do not reflect the deduction of taxes that a shareholder would pay on fund distributions or the redemption of fund shares.
The expense ratio for Class II shares as of 9/30/10 was 1.54%.
The performance data quoted represents past performance. The above performance information does not reflect the imposition of a 2% redemption fee on shares held for 90 days or less. If reflected, the fee would reduce the performance quoted. Past performance does not guarantee future results. The investment return and principal value will fluctuate so that an investor's shares, when redeemed, may be worth more or less than their original cost. Current performance may be lower or higher than the performance data quoted. Average annual total return measures annualized change, while total return measures aggregate change. To obtain most recent month-end performance data, visit oakmark.com.
The MSCI World Index (Net) is a free float-adjusted market capitalization weighted index that is designed to measure the global equity market performance of developed markets. This benchmark calculates reinvested dividends net of withholding taxes using Luxembourg tax rates. This index is unmanaged and investors cannot invest directly in this index.
Harris Associates Securities L.P., member FINRA, June 2011
OAKMARK INTERNATIONAL FUND CLASS II
THE VALUE OF A $10,000 INVESTMENT IN OAKMARK INTERNATIONAL FUND
FROM ITS INCEPTION (11/4/99) TO PRESENT (3/31/11) AS COMPARED TO THE
MSCI WORLD EX U.S. INDEX (UNAUDITED)
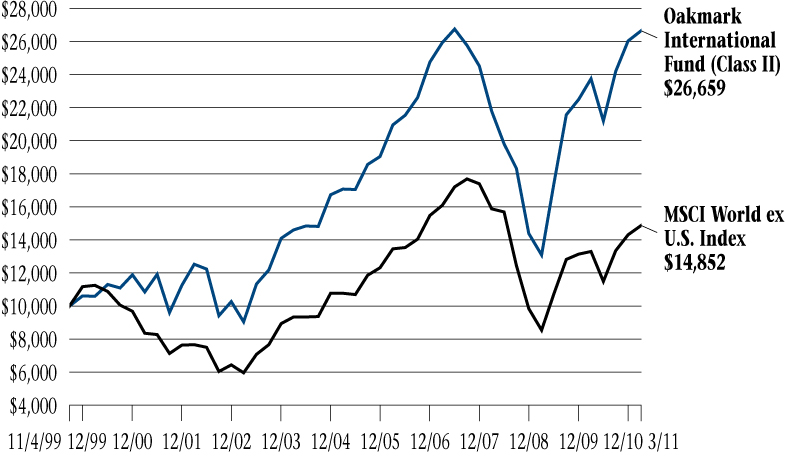
Average Annual Total Returns
(as of 3/31/11)
| (Unaudited) | | 1-year | | 5-year | | 10-year | | Since
Inception
(11/4/99) | |
| Oakmark International Fund (Class II) | | | 12.12 | % | | | 4.93 | % | | | 9.42 | % | | | 8.98 | % | |
| MSCI World ex U.S. Index | | | 11.61 | % | | | 1.99 | % | | | 5.96 | % | | | 3.53 | % | |
The graph and table do not reflect the deduction of taxes that a shareholder would pay on fund distributions or the redemption of fund shares.
The expense ratio for Class II shares as of 9/30/10 was 1.45%.
The performance data quoted represents past performance. The above performance information does not reflect the imposition of a 2% redemption fee on shares held for 90 days or less. If reflected, the fee would reduce the performance quoted. Past performance does not guarantee future results. The investment return and principal value will fluctuate so that an investor's shares, when redeemed, may be worth more or less than their original cost. Current performance may be lower or higher than the performance data quoted. Average annual total return measures annualized change, while total return measures aggregate change. To obtain most recent month-end performance data, visit oakmark.com.
The MSCI World ex U.S. Index (Net) is a free float-adjusted market capitalization index that is designed to measure international developed market equity performance, excluding the U.S. This benchmark calculates reinvested dividends net of withholding taxes using Luxembourg tax rates. This index is unmanaged and investors cannot invest directly in this index.
Harris Associates Securities L.P., member FINRA, June 2011
OAKMARK INTERNATIONAL
SMALL CAP FUND CLASS II
THE VALUE OF A $10,000 INVESTMENT IN OAKMARK INTERNATIONAL SMALL CAP FUND FROM ITS INCEPTION (1/8/01) TO PRESENT (3/31/11) AS COMPARED TO THE MSCI WORLD EX U.S. SMALL CAP INDEX (UNAUDITED)

Average Annual Total Returns
(as of 3/31/11)
| (Unaudited) | | 1-year | | 5-year | | 10-year | | Since
Inception
(1/8/01) | |
Oakmark International Small Cap Fund
(Class II) | | | 17.36 | % | | | 4.29 | % | | | 12.97 | % | | | 12.82 | % | |
| MSCI World ex U.S. Small Cap Index | | | 22.00 | % | | | 2.35 | % | | | 11.16 | % | | | 10.19 | % | |
The graph and table do not reflect the deduction of taxes that a shareholder would pay on fund distributions or the redemption of fund shares.
The expense ratio for Class II shares as of 9/30/10 was 1.72%.
The performance data quoted represents past performance. The above performance information does not reflect the imposition of a 2% redemption fee on shares held for 90 days or less. If reflected, the fee would reduce the performance quoted. Past performance does not guarantee future results. The investment return and principal value will fluctuate so that an investor's shares, when redeemed, may be worth more or less than their original cost. Current performance may be lower or higher than the performance data quoted. Average annual total return measures annualized change, while total return measures aggregate change. To obtain most recent month-end performance data, visit oakmark.com.
The MSCI World ex U.S. Small Cap Index (Net) is a free float-adjusted market capitalization index that is designed to measure global developed market equity performance, excluding the U.S. The MSCI Small Cap Indices target 40% of the eligible Small Cap universe within each industry group, within each country. MSCI defines the Small Cap universe as all listed securities that have a market capitalization in the range of USD200-1,500 million. This benchmark calculates reinvested dividends net of withholding taxes using Luxembourg tax rates. This index is unmanaged and investors cannot invest directly in this index.
Harris Associates Securities L.P., member FINRA, June 2011
FUND EXPENSES
A shareholder of each Fund incurs two types of costs: (1) transaction costs, such as redemption fees, and (2) ongoing costs, including investment advisory fees, transfer agent fees, and other fund expenses. The examples below are intended to help shareholders understand the ongoing cost (in dollars) of investing in each Fund and to compare these costs with the ongoing costs of investing in other funds.
Actual Expenses
The following table provides information about actual account values and actual fund expenses for Class II Shares of each Fund. The table shows the expenses a Class II shareholder would have paid on a $1,000 investment in each Fund from October 1, 2010 to March 31, 2011, as well as how much a $1,000 investment would be worth at the close of the period, assuming actual fund returns and expenses. Class II shareholders can estimate expenses incurred for the period by dividing their account value at March 31, 2011 by $1,000 and multiplying the result by the number in the Expenses Paid During Period row as shown below.
Shares of all Funds, other than Oakmark Equity & Income Fund, invested for 90 days or less may be charged a 2% redemption fee. Please consult the Funds' prospectus at oakmark.com for more information.
| | | Oakmark
Fund | | Oakmark
Select Fund | | Oakmark
Equity and
Income Fund | | Oakmark
Global Fund | | Oakmark
International
Fund | | Oakmark
International
Small Cap
Fund | |
| Beginning Account Value | | $ | 1,000.00 | | | $ | 1,000.00 | | | $ | 1,000.00 | | | $ | 1,000.00 | | | $ | 1,000.00 | | | $ | 1,000.00 | | |
| Ending Account Value | | $ | 1,137.20 | | | $ | 1,141.50 | | | $ | 1,123.00 | | | $ | 1,130.90 | | | $ | 1,099.70 | | | $ | 1,131.10 | | |
| Expenses Paid During Period* | | $ | 7.19 | | | $ | 7.42 | | | $ | 5.72 | | | $ | 7.97 | | | $ | 7.01 | | | $ | 8.61 | | |
| Annualized Expense Ratio | | | 1.35 | % | | | 1.39 | % | | | 1.08 | % | | | 1.50 | % | | | 1.34 | % | | | 1.62 | % | |
* Expenses are equal to each Fund's annualized expense ratio for Class II, multiplied by the average account value over the period, multiplied by the number of days in the most recent fiscal half-year divided by 365 (to reflect the one-half year period).
Hypothetical Example for Comparison Purposes
The following table provides information about hypothetical account values and hypothetical expenses for Class II Shares of each Fund based on actual expense ratios and an assumed rate of return of 5% per year before expenses, which are not the Funds' actual returns. The hypothetical account values and expenses may not be used to estimate the actual ending account balances or expenses shareholders paid for the period. Shareholders may use this information to compare the ongoing costs of investing in a Fund and other funds. To do so, compare this 5% hypothetical example with the 5% hypothetical examples that appear in the shareholder reports of the other funds.
Please note that the expenses shown in the table are meant to highlight your ongoing costs only and do not reflect any transaction costs, such as redemption fees. Therefore, the third line of the table is useful in comparing ongoing costs only, and will not help you determine the relative total costs of owning different funds. In addition, if these transaction costs were included, the total costs would have been higher.
| | | Oakmark
Fund | | Oakmark
Select Fund | | Oakmark
Equity and
Income Fund | | Oakmark
Global Fund | | Oakmark
International
Fund | | Oakmark
International
Small Cap
Fund | |
| Beginning Account Value | | $ | 1,000.00 | | | $ | 1,000.00 | | | $ | 1,000.00 | | | $ | 1,000.00 | | | $ | 1,000.00 | | | $ | 1,000.00 | | |
| Ending Account Value | | $ | 1,018.20 | | | $ | 1,018.00 | | | $ | 1,019.55 | | | $ | 1,017.45 | | | $ | 1,018.25 | | | $ | 1,016.85 | | |
| Expenses Paid During Period* | | $ | 6.79 | | | $ | 6.99 | | | $ | 5.44 | | | $ | 7.54 | | | $ | 6.74 | | | $ | 8.15 | | |
| Annualized Expense Ratio | | | 1.35 | % | | | 1.39 | % | | | 1.08 | % | | | 1.50 | % | | | 1.34 | % | | | 1.62 | % | |
* Expenses are equal to each Fund's annualized expense ratio for Class II, multiplied by the average account value over the period, multiplied by the number of days in the most recent fiscal half-year divided by 365 (to reflect the one-half year period).
Item 2. Code of Ethics.
Not required in this filing.
Item 3. Audit Committee Financial Expert.
Not required in this filing.
Item 4. Principal Accountant Fees and Services.
Not required in this filing.
Item 5. Audit Committee of Listed Registrants.
Not required in this filing.
Item 6. Investments.
(a) The Schedule of Investments in securities of unaffiliated issuers is included as part of the semi-annual report to shareholders filed under Item 1 of this Form.
(b) No disclosures are required by this Item 6(b).
Item 7. Disclosure of Proxy Voting Policies and Procedures for Closed-End Management Investment Companies.
Not applicable.
Item 8. Portfolio Managers of Closed-End Management Investment Companies.
Not applicable.
Item 9. Purchases of Equity Securities by Closed-End Management Investment Company and Affiliated Purchasers.
Not applicable.
Item 10. Submission of Matters to a Vote of Security Holders.
During the period covered by this report, no amendments were made to the procedures adopted in fiscal year 2007.
Item 11. Controls and Procedures.
(a) Based on an evaluation of the disclosure controls and procedures (as defined in Rule
30a-3(c) under the Investment Company Act of 1940, the “Disclosure Controls”), the Disclosure Controls are effectively designed to ensure that information required to be disclosed by the Registrant in this report is recorded, processed, summarized and reported within 90 days prior to the filing of this report, including ensuring that information required to be disclosed in this report is accumulated and communicated to the Registrant’s management, including the Registrant’s principal executive officer and principal financial officer, as appropriate to allow timely decisions regarding required disclosure.
(b) There were no changes in the Registrant’s internal controls over financial reporting (as defined in Rule 30a-3(d) under the Investment Company Act of 1940) that occurred during the Registrant’s second fiscal quarter of the time period covered by this report that has materially affected, or is reasonably likely to materially affect, the Registrant’s internal control over financial reporting.
Item 12. Exhibits.
(a) | (1) | Not required in this filing. |
| | |
| (2) | Certifications of Kristi L. Rowsell, Principal Executive Officer, and Thomas E. Herman, Principal Financial Officer, pursuant to Rule 30a-2(a) under the Investment Company Act of 1940 (17 CFR 270.30a-2(a)), attached hereto as Exhibits (a)(2)(i) and (a)(2)(ii). |
| | |
| (3) | Not applicable. |
| | |
(b) | | Certifications of Kristi L. Rowsell, Principal Executive Officer, and Thomas E. Herman, Principal Financial Officer, pursuant to Section 906 of the Sarbanes-Oxley Act of 2002, attached hereto as Exhibit (b). |
SIGNATURES
Pursuant to the requirements of the Securities Exchange Act of 1934 and the Investment Company Act of 1940, the Registrant has duly caused this report to be signed on its behalf by the undersigned, thereunto duly authorized.
Harris Associates Investment Trust
By: | /s/ Kristi L. Rowsell | |
| Kristi L. Rowsell | |
| Principal Executive Officer | |
Date: | May 26, 2011 | |
Pursuant to the requirements of the Securities Exchange Act of 1934 and the Investment Company Act of 1940, this report has been signed below by the following persons on behalf of the Registrant and in the capacities and on the dates indicated.
By: | /s/ Kristi L. Rowsell | |
| Kristi L. Rowsell | |
| Principal Executive Officer | |
Date: | May 26, 2011 | |
| | |
| | |
By: | /s/ Thomas E. Herman | |
| Thomas E. Herman | |
| Principal Financial Officer | |
Date: | May 26, 2011 | |