UNITED STATES
SECURITIES AND EXCHANGE COMMISSION
Washington, D.C. 20549
FORM N-CSR
CERTIFIED SHAREHOLDER REPORT OF REGISTERED
MANAGEMENT INVESTMENT COMPANIES
Investment Company Act file number | 811-06279 |
|
Harris Associates Investment Trust |
(Exact name of registrant as specified in charter) |
|
Two North La Salle Street, Suite 500 Chicago, Illinois | | 60602-3790 |
(Address of principal executive offices) | | (Zip code) |
|
Kristi L. Rowsell Harris Associates L.P. Two North La Salle Street, #500 Chicago, Illinois 60602 | Paulita A. Pike K&L Gates LLP Three First National Plaza, #3100 Chicago, Illinois 60602 |
(Name and address of agent for service) |
|
Registrant’s telephone number, including area code: | (312) 621-0600 | |
|
Date of fiscal year end: | 9/30/14 | |
|
Date of reporting period: | 3/31/14 | |
| | | | | | | | | |
Item 1. Reports to Shareholders.

THE OAKMARK FUNDS
SEMI-ANNUAL REPORT | MARCH 31, 2014
OAKMARK FUND
OAKMARK SELECT FUND
OAKMARK EQUITY AND INCOME FUND
OAKMARK GLOBAL FUND
OAKMARK GLOBAL SELECT FUND
OAKMARK INTERNATIONAL FUND
OAKMARK INTERNATIONAL SMALL CAP FUND
The Oakmark Funds
2014 Semi-Annual Report
TABLE OF CONTENTS
President's Letter | | | 1 | | |
Fund Expenses | | | 3 | | |
Oakmark Fund | |
Summary Information | | | 4 | | |
Portfolio Manager Commentary | | | 5 | | |
Schedule of Investments | | | 6 | | |
Oakmark Select Fund | |
Summary Information | | | 8 | | |
Portfolio Manager Commentary | | | 9 | | |
Schedule of Investments | | | 10 | | |
Oakmark Equity and Income Fund | |
Summary Information | | | 12 | | |
Portfolio Manager Commentary | | | 13 | | |
Schedule of Investments | | | 15 | | |
Oakmark Global Fund | |
Summary Information | | | 20 | | |
Portfolio Manager Commentary | | | 21 | | |
Schedule of Investments | | | 23 | | |
Oakmark Global Select Fund | |
Summary Information | | | 26 | | |
Portfolio Manager Commentary | | | 27 | | |
Schedule of Investments | | | 28 | | |
Oakmark International Fund | |
Summary Information | | | 30 | | |
Portfolio Manager Commentary | | | 31 | | |
Schedule of Investments | | | 32 | | |
Oakmark International Small Cap Fund | |
Summary Information | | | 36 | | |
Portfolio Manager Commentary | | | 37 | | |
Schedule of Investments | | | 38 | | |
Financial Statements | |
Statements of Assets and Liabilities | | | 40 | | |
Statements of Operations | | | 42 | | |
Statements of Changes in Net Assets | | | 44 | | |
Notes to Financial Statements | | | 51 | | |
Financial Highlights | | | 65 | | |
Disclosure Regarding Investment Advisory
Contract Approval | | | 72 | | |
Disclosures and Endnotes | | | 75 | | |
Trustees and Officers | | | 76 | | |
FORWARD-LOOKING STATEMENT DISCLOSURE
One of our most important responsibilities as mutual fund managers is to communicate with shareholders in an open and direct manner. Some of our comments in our letters to shareholders are based on current management expectations and are considered "forward-looking statements." Actual future results, however, may prove to be different from our expectations. You can identify forward-looking statements by words such as "estimate", "may", "will", "expect", "believe",
"plan" and other similar terms. We cannot promise future returns. Our opinions are a reflection of our best judgment at the time this report is compiled, and we disclaim any obligation to update or alter forward-looking statements as a result of new information, future events, or otherwise.
THE OAKMARK FUNDS
The Oakmark Funds March 31, 2014
President's Letter

Dear Fellow Shareholders,
The markets provided modest positive returns to shareholders during the first quarter of 2014. It is nice to see that investors reacted with relative calm to geopolitical events this quarter, showing a notable resiliency compared to recent years. The U.S. economy is growing moderately, as are corporate earnings, and unemployment levels are slowly continuing to fall. Communications from our new Federal Reserve Chairman reflect a commitment to keeping interest rates low while executing a gentle retreat in quantitative easing. Investors appear more confident that equities are the best asset class for delivering long-term returns.
High Frequency Trading Debate
Michael Lewis published a book last week called Flash Boys that is attracting much media attention to high-frequency trading ("HFT") in the stock markets. It is fascinating to see the spotlight return to this topic. One will recall that the Securities and Exchange Commission spent considerable time researching whether and how the "flash crash" of 2010 was affected by HFT. Computer-based trading and technology failures severely hurt Knight Capital and, separately, the Facebook IPO in the summer of 2012, prompting another discussion of how to manage the vulnerabilities introduced by the speed and capacity of computerized trading. Now, Michael Lewis describes how fast data feeds and special exchange order types have enabled HFT computers to execute trades in microseconds and get ahead of other market participants. The debates between certain exchange participants and Mr. Lewis are becoming highly charged but, indeed, informative. We think it is good that discussions about these issues are putting the spotlight on market health and functionality.
Over the years the traders at Harris Associates have worked diligently to navigate a technologically advanced landscape of broker algorithms, liquidity sources and evolving market structure. The tools they have cultivated assist us in accessing the additional liquidity in electronic markets without revealing too much about the nature of our trades. We think the customizations we've implemented, including using price limits and minimum fill quantities, as well as accessing dark pools and block trading venues, have helped reduce our exposure to predatory HFT strategies. We regularly review broker algorithms, order routing data and venue performance so that we can constantly adjust and improve how our orders are handled. Although we can never be perfectly insulated from HFT exposure, our practices appear to help. We believe our trading costs compare favorably to other investment managers. In fact, in December 2013, Institutional Investor's Transaction Cost Analysis survey1 ranked Harris Associates sixth overall in the Elkins/McSherry universe of asset management firms for exhibiting trading costs below market averages.
We welcome the chance for market participants to gain a better understanding and to have access to more transparency regarding trading behavior. However, let's remember two important elements of context—one applicable to all investors and one especially to Oakmark shareholders. All investors have benefited from the narrower spreads and enormous drop in commissions that markets have seen over the past decade. Trading commissions that once cost seven to ten cents per share—or more—can now be as low as fractions of a penny. The proliferation of algorithmic trading models and dozens of alternative trading venues has made trade execution hugely competitive, delivering benefits to all who own stocks. For shareholders in The Oakmark Funds, note that we are not
oakmark.com 1
The Oakmark Funds March 31, 2014
President's Letter (continued)
actively trading in and out of stocks in your portfolios. Our portfolio turnover is relatively low, implying that we typically hold securities for years at a time. Further, our interest in a company's stock is not driven by trading dynamics. We look for stocks trading at a substantial discount to our estimate of intrinsic value. Our focus on identifying a stock's true economic value and our willingness to patiently own it until that value is realized means that the penny-perfect purchase or sale price does not contribute meaningfully to the total return of the stock for our shareholders. We do, however, eagerly follow all developments in the trading arena, such as broker behavior and technological tools. This is part of good stewardship of shareholder assets. But in our view, market phenomena such as HFT are unlikely to contribute to or detract meaningfully from our success.
Lipper Awards for 2014*
In March, Lipper awarded The Oakmark Funds the "Best Equity Large Fund Group" for 2014. We are pleased to be recognized for our achievements amongst the competitive landscape represented by our peers. Also, The Oakmark Global Fund was recognized by Lipper for excellence in its category for the ten-year period.
We are grateful to receive industry accolades and are even more thankful for your continued trust in The Oakmark Funds. Please email us with your questions and comments at ContactOakmark@Oakmark.com.
* The Oakmark Family of Funds was named Lipper's Best Equity Large Fund Group, an award designed to recognize fund families with strong track records across all of their funds. Oakmark was ranked first out of 46 eligible fund groups due to the performance of all seven of its underlying funds. Each fund group must have at least three funds in Lipper's general U.S.-stock category, one world (global and international), one mixed-asset/balanced (stocks and bonds), two taxable bond and one tax-exempt bond fund. Eligibility requires that the fund group have at least five U.S. fund portfolios and each have at least 36 months of performance history ending at November of the evaluation year. Lipper's Large Fund Group classification is comprised of fund managers with assets under management of $50.7 billion or more as of 11/30/13.
The Oakmark Global Fund won an award in Lipper's Global Multi-Cap Core Funds category for the 10-year period. The Oakmark Global Fund, managed by Clyde McGregor and Rob Taylor, follows Harris Associates' value-oriented process to find opportunities across the globe. The fund was recognized for its consistent, risk-adjusted performance over the long term.
The Lipper Fund Awards are presented annually by Lipper, a mutual fund rating and research firm, to honor funds that it believes have excelled in providing superior performance relative to peers around the world. The awards are part of the broader Thomson Reuters Awards for Excellence program. More information about the Lipper Fund Awards is available at http://excellence.thomsonreuters.com/award/lipper.
2 THE OAKMARK FUNDS
Fund Expenses (Unaudited)
A shareholder of each Fund incurs ongoing costs, including investment advisory fees, transfer agent fees and other Fund expenses. The examples below are intended to help shareholders understand the ongoing costs (in dollars) of investing in each Fund and to compare these costs with the ongoing costs of investing in other funds.
The following table provides information about actual account values and actual Fund expenses as well as hypothetical account values and hypothetical fund expenses for shares of each Fund.
ACTUAL EXPENSES
The following table shows the expenses a shareholder would have paid on a $1,000 investment in each Fund from October 1, 2013 to March 31, 2014, as well as how much a $1,000 investment would be worth at the close of the period, assuming actual Fund returns and expenses. A shareholder can estimate expenses incurred for the period by dividing the account value at March 31, 2014, by $1,000 and multiplying the result by the number in the "Actual—Expenses Paid During Period" column shown below.
Shares of Oakmark International Small Cap Fund, invested for 90 days or less, may be charged a 2% redemption fee upon redemption. Please consult the Funds' prospectus at oakmark.com for more information.
HYPOTHETICAL EXAMPLE FOR COMPARISON PURPOSES
The following table provides information about hypothetical account values and hypothetical expenses for shares of each Fund based on actual expense ratios and an assumed rate of return of 5% per year before expenses, which are not the Funds' actual returns. The hypothetical account values and expenses may not be used to estimate the actual ending account balances or actual expenses shareholders paid for the period. Shareholders may use this information to compare the ongoing costs of investing in a Fund and other funds. To do so, compare this 5% hypothetical example with the 5% hypothetical examples that appear in the shareholder reports of the other funds.
Please note that the expenses shown in the table are meant to highlight your ongoing costs only and do not reflect any transaction costs, such as redemption fees. Therefore, the "Hypothetical—Expenses Paid During Period" column of the table is useful in comparing ongoing costs only and will not help you determine the relative total costs of owning different funds. If these transaction costs were included, the total costs would have been higher.
| | |
| |
ACTUAL | | HYPOTHETICAL
(5% annual return
before expenses) | |
| |
| | Beginning
Account Value
(10/1/13) | | Ending
Account Value
(3/31/14) | | Expenses
Paid During
Period* | | Ending
Account Value
(3/31/14) | | Expenses
Paid During
Period* | | Annualized
Expense
Ratio | |
Oakmark Fund | |
Class I | | $ | 1,000.00 | | | $ | 1,141.20 | | | $ | 4.75 | | | $ | 1,020.49 | | | $ | 4.48 | | | | 0.89 | % | |
Class II | | $ | 1,000.00 | | | $ | 1,139.30 | | | $ | 6.51 | | | $ | 1,018.85 | | | $ | 6.14 | | | | 1.22 | % | |
Oakmark Select Fund | |
Class I | | $ | 1,000.00 | | | $ | 1,174.60 | | | $ | 5.31 | | | $ | 1,020.04 | | | $ | 4.94 | | | | 0.98 | % | |
Class II | | $ | 1,000.00 | | | $ | 1,172.60 | | | $ | 6.93 | | | $ | 1,018.55 | | | $ | 6.44 | | | | 1.28 | % | |
Oakmark Equity and Income Fund | |
Class I | | $ | 1,000.00 | | | $ | 1,090.10 | | | $ | 3.96 | | | $ | 1,021.14 | | | $ | 3.83 | | | | 0.76 | % | |
Class II | | $ | 1,000.00 | | | $ | 1,088.20 | | | $ | 5.57 | | | $ | 1,019.60 | | | $ | 5.39 | | | | 1.07 | % | |
Oakmark Global Fund | |
Class I | | $ | 1,000.00 | | �� | $ | 1,078.30 | | | $ | 5.80 | | | $ | 1,019.35 | | | $ | 5.64 | | | | 1.12 | % | |
Class II | | $ | 1,000.00 | | | $ | 1,076.40 | | | $ | 7.45 | | | $ | 1,017.75 | | | $ | 7.24 | | | | 1.44 | % | |
Oakmark Global Select Fund | |
Class I | | $ | 1,000.00 | | | $ | 1,093.70 | | | $ | 5.90 | | | $ | 1,019.30 | | | $ | 5.69 | | | | 1.13 | % | |
Oakmark International Fund | |
Class I | | $ | 1,000.00 | | | $ | 1,054.00 | | | $ | 4.92 | | | $ | 1,020.14 | | | $ | 4.84 | | | | 0.96 | % | |
Class II | | $ | 1,000.00 | | | $ | 1,052.00 | | | $ | 6.70 | | | $ | 1,018.40 | | | $ | 6.59 | | | | 1.31 | % | |
Oakmark International Small Cap Fund | |
Class I | | $ | 1,000.00 | | | $ | 1,055.70 | | | $ | 6.77 | | | $ | 1,018.35 | | | $ | 6.64 | | | | 1.32 | % | |
Class II | | $ | 1,000.00 | | | $ | 1,053.80 | | | $ | 8.14 | | | $ | 1,017.00 | | | $ | 8.00 | | | | 1.59 | % | |
* Expenses for each share class is equal to the annualized expense ratio, multiplied by the average account value over the period, multiplied by the number of days in the most recent half-year divided by 365 (to reflect one-half year period)
oakmark.com 3
Oakmark Fund March 31, 2014
Summary Information
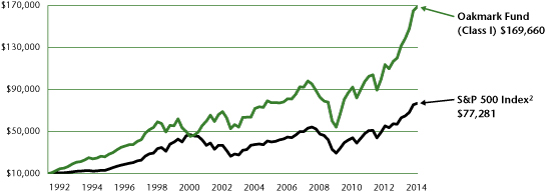
VALUE OF A $10,000 INVESTMENT
Since Inception - 08/05/91 (Unaudited)
PERFORMANCE
| | | | | Average Annual Total Returns (as of 03/31/14)3 | |
| (Unaudited) | | Total Return
Last 3 Months | | 1-year | | 3-year | | 5-year | | 10-year | | Since
Inception
(08/05/91) | |
Oakmark Fund (Class I) | | | 2.31 | % | | | 28.18 | % | | | 18.05 | % | | | 25.46 | % | | | 8.90 | % | | | 13.31 | % | |
S&P 500 Index | | | 1.81 | % | | | 21.86 | % | | | 14.66 | % | | | 21.16 | % | | | 7.42 | % | | | 9.45 | % | |
Dow Jones Industrial Average4 | | | -0.15 | % | | | 15.66 | % | | | 13.05 | % | | | 19.85 | % | | | 7.47 | % | | | 10.40 | % | |
Lipper Large Cap Value Funds Index5 | | | 2.30 | % | | | 22.52 | % | | | 13.44 | % | | | 19.85 | % | | | 6.83 | % | | | 8.97 | % | |
The graph and table above do not reflect the deduction of taxes that a shareholder would pay on Fund distributions or the redemption of Fund shares.
Past Performance is no guarantee of future results. Performance data quoted represents past performance. Current performance may be lower or higher than the performance data quoted. The investment return and principal value vary so that an investor's shares when redeemed may be worth more or less than the original cost. To obtain the most recent month-end performance, please visit oakmark.com.
TOP TEN EQUITY HOLDINGS6 | | % of Net Assets | |
Bank of America Corp. | | | 3.1 | | |
Oracle Corp. | | | 2.2 | | |
Capital One Financial Corp. | | | 2.2 | | |
Apache Corp. | | | 2.1 | | |
DIRECTV | | | 2.1 | | |
UnitedHealth Group, Inc. | | | 2.1 | | |
Medtronic, Inc. | | | 2.1 | | |
TE Connectivity, Ltd. | | | 2.1 | | |
FedEx Corp. | | | 2.1 | | |
American International Group, Inc. | | | 2.1 | | |
SECTOR ALLOCATION | | % of Net Assets | |
Financials | | | 23.6 | | |
Information Technology | | | 20.0 | | |
Consumer Discretionary | | | 15.9 | | |
Industrials | | | 10.0 | | |
Energy | | | 8.9 | | |
Health Care | | | 7.9 | | |
Consumer Staples | | | 6.4 | | |
Short-Term Investments and Other | | | 7.3 | | |
FUND STATISTICS | |
Ticker | | OAKMX | |
Inception | | 08/05/91 | |
Number of Equity Holdings | | 59 | |
Net Assets | | $13.3 billion | |
Benchmark | | S&P 500 Index | |
Weighted Average Market Cap | | $99.9 billion | |
Median Market Cap | | $50.6 billion | |
Portfolio Turnover (for the 6-months ended 03/31/14) | | 4% | |
Expense Ratio - Class I (as of 09/30/13) | | 0.95% | |
4 THE OAKMARK FUNDS
Oakmark Fund March 31, 2014
Portfolio Manager Commentary


The Oakmark Fund increased 2% in the first quarter, fractionally exceeding the S&P 5002 gain, which also rounded to 2%. For the first half of our fiscal year Oakmark Fund was up 14%, compared to 13% for the S&P 500. Additionally, the Fund ended the quarter at an all-time high price. Because our goal is to increase the capital of our shareholders, we are always pleased to report new highs.
After such a strong year for equities in 2013, we are not surprised to see returns moderate as we move into 2014. Stocks certainly aren't as cheap as they were a year ago, but we are still finding attractive companies to add to the portfolio. At Oakmark, we're big fans of the Chicago Blackhawks, so as we approach playoff time, we start to think about some of the best hockey clichés. One of our favorites is, "a two-goal lead is the worst lead in hockey." While we are amused by the fragile logic of this statement, we appreciate the simple message that in a fast-paced, competitive environment, you can't sit on a lead. At Oakmark, we have an amazing team of research analysts who have remained diligent in uncovering attractive investment opportunities. As you will see below, we added four companies to the portfolio during the first quarter that we think are high-quality and attractively priced.
The best performing stock in the quarter was Forest Labs, up 54%. Forest has been an incredibly successful investment for the Oakmark Fund, and we offer our congratulations to the company's board and management team for maximizing per-share value for shareholders. It has only been one year since we first wrote about our purchase of Forest Labs, and since then, the share price has increased 149%. Please refer to the Oakmark Select commentary for a more detailed description of our tax-efficient sale strategy for Forest. Another top performer was our largest position, Bank of America. We still think the financial services sector is attractively valued, and with Bank of America, we are pleased to see investors recognize better visibility of higher future earnings and an enhanced capacity to return excess capital to shareholders. Our worst performer was General Motors, down 15%, due to what we believe was the market's overreaction to GM's handling of a recent product recall. We eliminated our position in Merck as the shares appreciated to our estimate of fair value.
Citigroup Inc. (C-$48)
Like its universal bank peers, we think Citigroup is significantly undervalued relative to its normalized earnings power. Unlike its peers, however, it has two hidden sources of value, neither of which is reflected in GAAP earnings: a deferred tax asset and a larger base of excess capital that is growing at a rapid rate. We have long admired Citigroup's global franchise and its growth potential. One of Citigroup's key competitive advantages is its unique global reach. Citigroup has more than twice as many country banking licenses and direct local payment network connections as its closest competitor. As a result, we think
Citigroup is uniquely positioned to offer corporate clients more visibility into their asset, liability and currency exposures, but requires fewer resources to manage the relationship. We would be remiss not to mention Citigroup's recent Fed stress test results. Although the qualitative results were disappointing, its quantitative stress test results confirm our analysis that the company has significantly more excess capital than its peers. We expect this capital to eventually benefit shareholders either through capital return or smart balance sheet growth.
Diageo PLC (DEO-$125)
Diageo is the world's largest spirits manufacturer. Diageo has a portfolio of spirits brands that is among the best in the industry, including a leading scotch franchise that is nearly impossible to replicate. These strong brands are supported by the company's global scale, which allows for meaningful efficiencies in manufacturing, distribution and marketing. As a result of these advantages, we believe Diageo will maintain its excellent competitive position. At the same time, revenues have grown consistently for years due to a combination of pricing power and emerging markets exposure, and this growth should continue for the foreseeable future. We believe this well-managed company is selling at a large discount to intrinsic value. Further, Diageo has a dividend yield of 2.5%.
General Mills, Inc. (GIS-$52)
We believe General Mills is a high quality, well-managed packaged foods company with exposure to fast-growing product categories. The company has an impressive track record of stable earnings growth, and it has consistently returned most of its strong free cash flow to shareholders in the form of share repurchases and dividends. We think revenue and margins will continue to grow, primarily driven by its international business. The company has an attractive global cereal joint venture with Nestle, which often gets overlooked by investors. With consistent profit growth and a shrinking share base, we like its prospects for per-share value growth. In addition, General Mills has a dividend yield of 3.2%.
Sanofi (SNY-$52)
Sanofi is a pharmaceutical company with a good mix of durable businesses with strong growth characteristics. The company has a strong franchise in diabetes treatments, maintaining dominant market share in this rapidly growing category. Sanofi is a leading player in emerging markets, where sales growth rates are twice that of the overall pharmaceutical market. Sanofi is also a leader in vaccines, and they have a strong footprint in over-the-counter products. We think that margins and profitability should improve as the company leverages fixed R&D spending and enforces good cost controls. The company's balance sheet has more cash than debt, and the shares sell at a substantial discount to our estimate of intrinsic value. Moreover, Sanofi has a dividend yield of 3.7%.
oakmark.com 5
Oakmark Fund March 31, 2014 (Unaudited)
Schedule of Investments (in thousands)
| | | Shares | | Value | |
C0OMMON STOCKS - 93.8% | |
FINANCIALS - 23.6% | |
DIVERSIFIED FINANCIALS - 8.7% | |
Capital One Financial Corp.
Consumer Finance | | | 3,753 | | | $ | 289,566 | | |
Franklin Resources, Inc.
Asset Management & Custody Banks | | | 5,040 | | | | 273,067 | | |
State Street Corp.
Asset Management & Custody Banks | | | 3,000 | | | | 208,650 | | |
The Goldman Sachs Group, Inc.
Investment Banking & Brokerage | | | 1,213 | | | | 198,750 | | |
Bank of New York Mellon Corp.
Asset Management & Custody Banks | | | 5,560 | | | | 196,200 | | |
| | | | | | 1,166,233 | | |
BANKS - 8.2% | |
Bank of America Corp.
Diversified Banks | | | 23,950 | | | | 411,940 | | |
JPMorgan Chase & Co.
Diversified Banks | | | 4,495 | | | | 272,891 | | |
Wells Fargo & Co.
Diversified Banks | | | 4,820 | | | | 239,747 | | |
Citigroup, Inc.
Diversified Banks | | | 3,600 | | | | 171,360 | | |
| | | | | | 1,095,938 | | |
INSURANCE - 6.7% | |
American International Group, Inc.
Multi-line Insurance | | | 5,495 | | | | 274,805 | | |
Aon PLC (b)
Insurance Brokers | | | 2,500 | | | | 210,700 | | |
Principal Financial Group, Inc.
Life & Health Insurance | | | 4,429 | | | | 203,704 | | |
Aflac, Inc.
Life & Health Insurance | | | 3,210 | | | | 202,358 | | |
| | | | | | 891,567 | | |
| | | | | | 3,153,738 | | |
INFORMATION TECHNOLOGY - 20.0% | |
SOFTWARE & SERVICES - 9.5% | |
Oracle Corp.
Systems Software | | | 7,330 | | | | 299,870 | | |
Microsoft Corp.
Systems Software | | | 5,920 | | | | 242,661 | | |
MasterCard, Inc., Class A
Data Processing & Outsourced Services | | | 3,130 | | | | 233,811 | | |
Google, Inc., Class A (a)
Internet Software & Services | | | 196 | | | | 218,444 | | |
Visa, Inc., Class A
Data Processing & Outsourced Services | | | 740 | | | | 159,736 | | |
Automatic Data Processing, Inc.
Data Processing & Outsourced Services | | | 1,430 | | | | 110,482 | | |
| | | | | | 1,265,004 | | |
| | | Shares | | Value | |
TECHNOLOGY HARDWARE & EQUIPMENT - 5.5% | |
TE Connectivity, Ltd. (b)
Electronic Manufacturing Services | | | 4,686 | | | $ | 282,122 | | |
QUALCOMM, Inc.
Communications Equipment | | | 3,050 | | | | 240,523 | | |
Apple, Inc.
Technology Hardware, Storage & Peripherals | | | 401 | | | | 215,233 | | |
| | | | | | 737,878 | | |
SEMICONDUCTORS & SEMICONDUCTOR EQUIPMENT - 5.0% | |
Intel Corp.
Semiconductors | | | 10,050 | | | | 259,391 | | |
Texas Instruments, Inc.
Semiconductors | | | 5,465 | | | | 257,675 | | |
Applied Materials, Inc.
Semiconductor Equipment | | | 7,160 | | | | 146,207 | | |
| | | | | | 663,273 | | |
| | | | | | 2,666,155 | | |
CONSUMER DISCRETIONARY - 15.9% | |
MEDIA - 5.3% | |
DIRECTV (a)
Cable & Satellite | | | 3,739 | | | | 285,746 | | |
Omnicom Group, Inc.
Advertising | | | 3,171 | | | | 230,233 | | |
Comcast Corp., Class A
Cable & Satellite | | | 3,940 | | | | 192,115 | | |
| | | | | | 708,094 | | |
RETAILING - 4.5% | |
Liberty Interactive Corp., Class A (a)
Catalog Retail | | | 8,570 | | | | 247,406 | | |
The Home Depot, Inc.
Home Improvement Retail | | | 2,957 | | | | 233,948 | | |
Kohl's Corp.
Department Stores | | | 2,042 | | | | 115,980 | | |
| | | | | | 597,334 | | |
AUTOMOBILES & COMPONENTS - 4.3% | |
Delphi Automotive PLC (b)
Auto Parts & Equipment | | | 3,984 | | | | 270,354 | | |
General Motors Co.
Automobile Manufacturers | | | 6,800 | | | | 234,056 | | |
Harley-Davidson, Inc.
Motorcycle Manufacturers | | | 1,102 | | | | 73,404 | | |
| | | | | | 577,814 | | |
CONSUMER SERVICES - 1.8% | |
McDonald's Corp.
Restaurants | | | 2,389 | | | | 234,194 | | |
| | | | | | 2,117,436 | | |
See accompanying Notes to Financial Statements.
6 THE OAKMARK FUNDS
Oakmark Fund March 31, 2014 (Unaudited)
Schedule of Investments (in thousands) (continued)
| | | Shares | | Value | |
COMMON STOCKS - 93.8% (continued) | |
INDUSTRIALS - 10.0% | |
CAPITAL GOODS - 6.7% | |
Illinois Tool Works, Inc.
Industrial Machinery | | | 3,060 | | | $ | 248,870 | | |
Parker Hannifin Corp.
Industrial Machinery | | | 1,875 | | | | 224,456 | | |
3M Co.
Industrial Conglomerates | | | 1,643 | | | | 222,890 | | |
Cummins, Inc.
Construction Machinery & Heavy Trucks | | | 1,380 | | | | 205,606 | | |
| | | | | | 901,822 | | |
TRANSPORTATION - 3.3% | |
FedEx Corp.
Air Freight & Logistics | | | 2,100 | | | | 278,376 | | |
Union Pacific Corp.
Railroads | | | 850 | | | | 159,511 | | |
| | | | | | 437,887 | | |
| | | | | | 1,339,709 | | |
HEALTH CARE - 9.0% | |
HEALTH CARE EQUIPMENT & SERVICES - 6.6% | |
UnitedHealth Group, Inc.
Managed Health Care | | | 3,460 | | | | 283,686 | | |
Medtronic, Inc.
Health Care Equipment | | | 4,585 | | | | 282,161 | | |
Covidien PLC (b)
Health Care Equipment | | | 2,708 | | | | 199,471 | | |
Baxter International, Inc.
Health Care Equipment | | | 1,623 | | | | 119,420 | | |
| | | | | | 884,738 | | |
PHARMACEUTICALS, BIOTECHNOLOGY & LIFE SCIENCES - 2.4% | |
Forest Laboratories, Inc. (a)
Pharmaceuticals | | | 1,950 | | | $ | 179,927 | | |
Sanofi (c)
Pharmaceuticals | | | 2,600 | | | | 135,928 | | |
| | | | | | 315,855 | | |
| | | | | | 1,200,593 | | |
ENERGY - 8.9% | |
Apache Corp.
Oil & Gas Exploration & Production | | | 3,450 | | | | 286,177 | | |
Halliburton Co.
Oil & Gas Equipment & Services | | | 3,950 | | | | 232,615 | | |
Exxon Mobil Corp.
Integrated Oil & Gas | | | 2,167 | | | | 211,673 | | |
National Oilwell Varco, Inc.
Oil & Gas Equipment & Services | | | 2,700 | | | | 210,249 | | |
Devon Energy Corp.
Oil & Gas Exploration & Production | | | 2,002 | | | | 133,994 | | |
Cenovus Energy, Inc. (b)
Integrated Oil & Gas | | | 3,930 | | | | 113,813 | | |
| | | | | | 1,188,521 | | |
| | | Shares | | Value | |
CONSUMER STAPLES - 6.4% | |
FOOD, BEVERAGE & TOBACCO - 5.3% | |
Diageo PLC (c)
Distillers & Vintners | | | 1,950 | | | $ | 242,950 | | |
Unilever PLC (c)
Packaged Foods & Meats | | | 5,083 | | | | 217,451 | | |
Nestle SA (c)
Packaged Foods & Meats | | | 1,800 | | | | 135,396 | | |
General Mills, Inc.
Packaged Foods & Meats | | | 2,173 | | | | 112,611 | | |
| | | | | | 708,408 | | |
FOOD & STAPLES RETAILING - 1.1% | |
Wal-Mart Stores, Inc.
Hypermarkets & Super Centers | | | 1,965 | | | | 150,185 | | |
| | | | | | 858,593 | | |
TOTAL COMMON STOCKS - 93.8%
(COST $8,014,352) | | | | | 12,524,745 | | |
COMMON STOCK SOLD SHORT - (1.1)% | |
HEALTH CARE - (1.1)% | |
PHARMACEUTICALS, BIOTECHNOLOGY & LIFE SCIENCES - (1.1)% | |
Actavis, Inc. | | | (693 | ) | | | (142,654 | ) | |
Pharmaceuticals | |
TOTAL COMMON STOCKS SOLD SHORT - (1.1%)
(PROCEEDS $(142,674)) | | | | | (142,654 | ) | |
| | | Par Value | | Value | |
SHORT TERM INVESTMENTS - 6.9% | |
REPURCHASE AGREEMENT - 5.4% | |
Fixed Income Clearing Corp. Repurchase
Agreement, 0.00% dated 03/31/14 due
04/01/14, repurchase price $714,513,
collateralized by Freddie Mac Discount
Notes, 0.000%, 12/02/14 - 12/04/14,
aggregate value plus accrued interest of
$668,833, by a United States Treasury
Note, 0.375%, due 11/15/14, value plus
accrued interest of $59,975 (Cost:
$714,513) | | | 714,513 | | | | 714,513 | | |
U.S. GOVERNMENT BILLS - 1.5% | |
United States Treasury Bills,
0.05%, due 04/17/14 - 04/24/14 (d)
(Cost $199,995) | | | 200,000 | | | | 199,995 | | |
TOTAL SHORT TERM INVESTMENTS - 6.9%
(COST $914,508) | | | | | 914,508 | | |
TOTAL INVESTMENTS - 99.6%
(COST $8,786,186) | | | | | 13,296,599 | | |
Other Assets In Excess of Liabilities - 0.4% | | | | | 50,559 | | |
TOTAL NET ASSETS - 100.0% | | | | $ | 13,347,158 | | |
(a) Non-income producing security
(b) Foreign domiciled corporation
(c) Sponsored American Depositary Receipt
(d) The rate shown represents the annualized yield at the time of purchase; not a coupon rate.
See accompanying Notes to Financial Statements.
oakmark.com 7
Oakmark Select Fund March 31, 2014
Summary Information
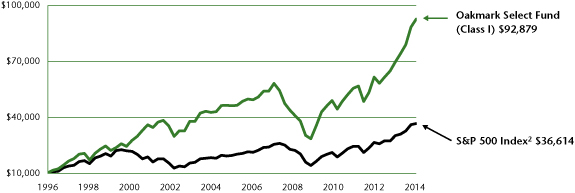
VALUE OF A $10,000 INVESTMENT
Since Inception - 11/01/96 (Unaudited)
PERFORMANCE
| | | | | Average Annual Total Returns (as of 03/31/14)3 | |
| (Unaudited) | | Total Return
Last 3 Months | | 1-year | | 3-year | | 5-year | | 10-year | | Since
Inception
(11/01/96) | |
Oakmark Select Fund (Class I) | | | 4.84 | % | | | 33.12 | % | | | 18.67 | % | | | 26.80 | % | | | 7.95 | % | | | 13.66 | % | |
S&P 500 Index | | | 1.81 | % | | | 21.86 | % | | | 14.66 | % | | | 21.16 | % | | | 7.42 | % | | | 7.74 | % | |
Lipper Multi-Cap Value Funds Index7 | | | 2.46 | % | | | 22.95 | % | | | 13.22 | % | | | 20.54 | % | | | 6.77 | % | | | 7.76 | % | |
The graph and table do not reflect the deduction of taxes that a shareholder would pay on Fund distributions or the redemption of Fund shares.
Past performance is no guarantee of future results. Performance data quoted represents past performance. Current performance may be lower or higher than the performance data quoted. The investment return and principal value vary so that an investor's shares when redeemed may be worth more or less than the original cost. To obtain the most recent month-end performance data, visit oakmark.com.
TOP TEN EQUITY HOLDINGS6 | | % of Net Assets | |
TRW Automotive Holdings Corp. | | | 7.9 | | |
TE Connectivity, Ltd. | | | 6.5 | | |
Bank of America Corp. | | | 6.1 | | |
Capital One Financial Corp. | | | 5.5 | | |
Apache Corp. | | | 5.4 | | |
Medtronic, Inc. | | | 5.2 | | |
DIRECTV | | | 5.0 | | |
American International Group, Inc. | | | 4.9 | | |
MasterCard, Inc., Class A | | | 4.9 | | |
JPMorgan Chase & Co. | | | 4.8 | | |
FUND STATISTICS | | | |
Ticker | | OAKLX | |
Inception | | 11/01/96 | |
Number of Equity Holdings | | 20 | |
Net Assets | | $4.8 billion | |
Benchmark | | S&P 500 Index | |
Weighted Average Market Cap | | $67.8 billion | |
Median Market Cap | | $39.1 billion | |
Portfolio Turnover (for the 6-months ended 03/31/14) | | 19% | |
Expense Ratio - Class I (as of 09/30/13) | | 1.01% | |
SECTOR ALLOCATION | | % of Net Assets | |
Financials | | | 29.5 | | |
Consumer Discretionary | | | 20.2 | | |
Information Technology | | | 19.2 | | |
Energy | | | 6.9 | | |
Industrials | | | 6.6 | | |
Health Care | | | 5.2 | | |
Utilities | | | 4.3 | | |
Short-Term Investments and Other | | | 8.1 | | |
8 THE OAKMARK FUNDS
Oakmark Select Fund March 31, 2014
Portfolio Manager Commentary


William C. Nygren, CFA
Portfolio Manager
oaklx@oakmark.com
Anthony P. Coniaris, CFA
Portfolio Manager
oaklx@oakmark.com
Win Murray
Portfolio Manager
oaklx@oakmark.com
For the quarter, the Oakmark Select Fund gained 5%, compared to 2% for the S&P 500 Index2. We are pleased to report the Fund ended the quarter at a new all-time high NAV, meaning that as of 03/31/14, all current Select shareholders have unrealized gains in their holdings. These strong absolute and relative results were due in large part to Forest Laboratories (Forest) agreeing to be acquired by Actavis Plc in the quarter. Our relatively large exposure to auto-related cyclicals and financials continued to benefit our results. The largest detractors were MasterCard, Kennametal and FedEx. As discussed below, we eliminated our positions in Forest, Texas Instruments (TI) and Newfield Exploration, and we established new positions in Franklin Resources and CBRE Group (CBRE).
After returning 40% last quarter, Forest returned another 52% in the first quarter as the company agreed to be acquired by Actavis for both cash and stock. We believe the acquisition price was full and fair. While our investment thesis—that Forest's new drug launches would be successful and leverage the company's expenses—did not have the chance to transpire, we are more than pleased that the stock price reached our estimated value in short order. It's not uncommon for the management of companies in transition to resist being acquired before their strategies to create value are fully realized. We applaud the leaders at Forest for their willingness to pull forward this value, even if it denied them the personal satisfaction of seeing their efforts realized in the coming years. We believe this could serve as a lesson for the leadership of other public companies. If someone wants to pay a fair price on a risk-adjusted basis for 'what could be' in your business, you owe it to your shareholders to realize this value so that they can recycle their capital into other attractively valued investments.
At Oakmark, active management means more than just stock selection—it also involves maximizing after-tax returns and managing risk in special situations. As a case in point, we sold our Forest position in a tax-efficient manner throughout the quarter as our shares became long term holdings for tax purposes. To reduce our risk while we sold our shares, we established a short position in Actavis in proportion to the stock component of the transaction. This position was then reduced commensurate with our Forest stake until it was fully eliminated, thereby generating only long-term capital gains. We were comfortable with hedging the stock portion of our Forest position because of our belief that Actavis equity was selling closer to fair value. And unlike that of most acquirers, Actavis'
stock price rose meaningfully upon announcement of the transaction and in the days thereafter. Logic follows that Actavis shares were more likely to fall if the deal was scuttled by another bidder or some other unforeseen reason, thus providing an unusually effective hedge.
We also eliminated the remainder of our investment in TI as the final tranche of shares went long term. TI offers another example of a management team that we believe puts its shareholders first in a situation where many do not. Since its acquisition of National Semiconductor in 2011, TI has been generously returning excess capital to shareholders while maintaining a prudent, but not lazy, balance sheet. This likely contributed to their shares approaching our estimate of fair value. Many large technology companies today simply grow their already immense cash positions and offer little insight into their plans for distributing that excess capital. We believe TI set a terrific example for other companies in the technology sector. Finally, we also sold Newfield Exploration after we came to believe that its effort to transition the company to liquids was a low-return proposition that would limit its ability to grow per-share value.
We established a position in Franklin Resources, one of the world's largest global mutual fund companies, with leading products in both equities and fixed income. For starters, we believe asset management is an attractive business and Franklin has a history of strong fund performance across various asset classes and geographies. The company is selling for less than 14x our estimate of this year's EPS8 and just over 11x adjusting for net cash and securities. In our view, this is a cheap price for a well-run company in such an attractive industry. Management has historically returned capital to shareholders through stock buybacks and dividends, and with insiders owning 35% of outstanding shares, we expect Franklin to continue to be good stewards of shareholders' capital.
As the largest commercial real estate brokerage and property management company in the U.S., CBRE has the geographic reach, scale and breadth of services that very few competitors in this fragmented industry can match. Bundling its services across the globe has led to share gains, which we believe will continue. While certain business lines are more volatile, related commercial real estate activity metrics are improving. At the same time, an increasing proportion of the company's profits are coming from more stable fee-based revenues. Management has a good track record, and we believe this growing company is selling for a substantial discount to value.
oakmark.com 9
Oakmark Select Fund March 31, 2014 (Unaudited)
Schedule of Investments (in thousands)
| | | Shares | | Value | |
COMMON STOCKS - 91.9% | |
FINANCIALS - 29.5% | |
BANKS - 10.9% | |
Bank of America Corp.
Diversified Banks | | | 17,100 | | | $ | 294,120 | | |
JPMorgan Chase & Co.
Diversified Banks | | | 3,800 | | | | 230,698 | | |
| | | | | | 524,818 | | |
DIVERSIFIED FINANCIALS - 9.6% | |
Capital One Financial Corp.
Consumer Finance | | | 3,450 | | | | 266,202 | | |
Franklin Resources, Inc.
Asset Management & Custody Banks | | | 3,700 | | | | 200,466 | | |
| | | | | | 466,668 | | |
INSURANCE - 4.9% | |
American International Group, Inc.
Multi-line Insurance | | | 4,705 | | | | 235,307 | | |
REAL ESTATE - 4.1% | |
CBRE Group, Inc., Class A (a)
Real Estate Services | | | 7,200 | | | | 197,485 | | |
| | | | | | 1,424,278 | | |
CONSUMER DISCRETIONARY - 20.2% | |
AUTOMOBILES & COMPONENTS - 7.9% | |
TRW Automotive Holdings Corp. (a)
Auto Parts & Equipment | | | 4,650 | | | | 379,533 | | |
MEDIA - 7.6% | |
DIRECTV (a)
Cable & Satellite | | | 3,148 | | | | 240,566 | | |
Comcast Corp., Class A
Cable & Satellite | | | 2,650 | | | | 129,214 | | |
| | | | | | 369,780 | | |
RETAILING - 4.7% | |
Liberty Interactive Corp., Class A (a)
Catalog Retail | | | 7,800 | | | | 225,186 | | |
| | | | | | 974,499 | | |
INFORMATION TECHNOLOGY - 19.2% | |
SOFTWARE & SERVICES - 9.3% | |
MasterCard, Inc., Class A
Data Processing & Outsourced Services | | | 3,150 | | | | 235,305 | | |
Oracle Corp.
Systems Software | | | 5,200 | | | | 212,732 | | |
| | | | | | 448,037 | | |
TECHNOLOGY HARDWARE & EQUIPMENT - 6.5% | |
TE Connectivity, Ltd. (b)
Electronic Manufacturing Services | | | 5,194 | | | | 312,727 | | |
SEMICONDUCTORS & SEMICONDUCTOR EQUIPMENT - 3.4% | |
Intel Corp.
Semiconductors | | | 6,447 | | | | 166,397 | | |
| | | | | | 927,161 | | |
| | | Shares | | Value | |
ENERGY - 6.9% | |
Apache Corp.
Oil & Gas Exploration & Production | | | 3,130 | | | $ | 259,634 | | |
Cenovus Energy, Inc. (b)
Integrated Oil & Gas | | | 2,499 | | | | 72,363 | | |
| | | | | | 331,997 | | |
INDUSTRIALS - 6.6% | |
TRANSPORTATION - 4.0% | |
FedEx Corp.
Air Freight & Logistics | | | 1,450 | | | | 192,212 | | |
CAPITAL GOODS - 2.6% | |
Kennametal, Inc.
Industrial Machinery | | | 2,902 | | | | 128,556 | | |
| | | | | | 320,768 | | |
HEALTH CARE - 5.2% | |
HEALTH CARE EQUIPMENT & SERVICES - 5.2% | |
Medtronic, Inc.
Health Care Equipment | | | 4,100 | | | | 252,314 | | |
UTILITIES - 4.3% | |
Calpine Corp. (a) | | | 10,004 | | | | 209,192 | | |
Independent Power Producers & Energy Traders | |
TOTAL COMMON STOCKS - 91.9%
(COST $2,694,543) | | | | | 4,440,209 | | |
| | | Par Value | | Value | |
SHORT TERM INVESTMENTS - 7.7% | |
REPURCHASE AGREEMENT - 7.7% | |
Fixed Income Clearing Corp. Repurchase
Agreement, 0.00% dated 03/31/14
due 04/01/14, repurchase price
$369,621, collateralized by United States
Treasury Notes, 1.375% - 1.750%,
due 09/30/18 - 10/31/18, aggregate
value plus accrued interest of $377,017
(Cost: $369,621) | | | 369,621 | | | | 369,621 | | |
TOTAL SHORT TERM INVESTMENTS - 7.7%
(COST $369,621) | | | | | 369,621 | | |
TOTAL INVESTMENTS - 99.6%
(COST $3,064,164) | | | | | 4,809,830 | | |
Other Assets In Excess of Liabilities - 0.4% | | | | | 19,851 | | |
TOTAL NET ASSETS - 100.0% | | | | $ | 4,829,681 | | |
(a) Non-income producing security
(b) Foreign domiciled corporation
See accompanying Notes to Financial Statements.
10 THE OAKMARK FUNDS

This page intentionally left blank.
oakmark.com 11
Oakmark Equity and Income Fund March 31, 2014
Summary Information
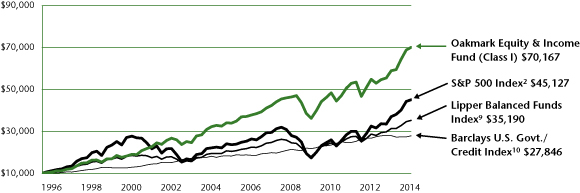
VALUE OF A $10,000 INVESTMENT
Since Inception - 11/01/95 (Unaudited)
PERFORMANCE
| | | | | Average Annual Total Returns (as of 03/31/14)3 | |
| (Unaudited) | | Total Return
Last 3 Months | | 1-year | | 3-year | | 5-year | | 10-year | | Since
Inception
(11/01/95) | |
Oakmark Equity & Income Fund (Class I) | | | 1.78 | % | | | 19.10 | % | | | 9.85 | % | | | 14.15 | % | | | 8.10 | % | | | 11.16 | % | |
Lipper Balanced Funds Index | | | 1.82 | % | | | 12.44 | % | | | 8.76 | % | | | 14.40 | % | | | 6.13 | % | | | 7.07 | % | |
S&P 500 Index | | | 1.81 | % | | | 21.86 | % | | | 14.66 | % | | | 21.16 | % | | | 7.42 | % | | | 8.53 | % | |
Barclays U.S. Govt./Credit Index | | | 1.98 | % | | | -0.26 | % | | | 4.21 | % | | | 5.07 | % | | | 4.41 | % | | | 5.72 | % | |
The graph and table above do not reflect the deduction of taxes that a shareholder would pay on Fund distributions or the redemption of Fund shares.
Past Performance is no guarantee of future results. Performance data quoted represents past performance. Current performance may be lower or higher than the performance data quoted. The investment return and principal value vary so that an investor's shares when redeemed may be worth more or less than the original cost. To obtain the most recent month-end performance, please visit oakmark.com.
TOP TEN EQUITY HOLDINGS6 | | % of Net Assets | |
Oracle Corp. | | | 3.5 | | |
Bank of America Corp. | | | 3.2 | | |
General Motors Co. | | | 3.0 | | |
Dover Corp. | | | 2.7 | | |
FedEx Corp. | | | 2.6 | | |
Nestle SA | | | 2.5 | | |
National Oilwell Varco | | | 2.5 | | |
UnitedHealth Group, Inc. | | | 2.5 | | |
Baker Hughes, Inc. | | | 2.4 | | |
Philip Morris International, Inc. | | | 2.4 | | |
FUND STATISTICS | |
Ticker | | OAKBX | |
Inception | | 11/01/95 | |
Number of Equity Holdings | | 44 | |
Net Assets | | $20.6 billion | |
Benchmark | | Lipper Balanced Funds Index | |
Weighted Average Market Cap | | $66.0 billion | |
Median Market Cap | | $18.3 billion | |
Portfolio Turnover (for the 6-months ended 03/31/14) | | 9% | |
Expense Ratio - Class I (as of 09/30/13) | | 0.77% | |
SECTOR ALLOCATION | | % of Net Assets | |
Equity Investments | |
Industrials | | | 13.5 | | |
Consumer Discretionary | | | 10.7 | | |
Financials | | | 10.4 | | |
Consumer Staples | | | 9.4 | | |
Information Technology | | | 8.9 | | |
Energy | | | 7.0 | | |
Health Care | | | 5.5 | | |
Total Equity Investments | | | 65.4 | | |
Fixed Income Investments | |
Government and Agency Securities | | | 8.9 | | |
Corporate Bonds | | | 2.9 | | |
Asset Backed Securities | | | 0.1 | | |
Total Fixed Income Investments | | | 11.9 | | |
Short-Term Investments and Other | | | 22.7 | | |
12 THE OAKMARK FUNDS
Oakmark Equity and Income Fund March 31, 2014
Portfolio Manager Commentary


Clyde S. McGregor, CFA
Portfolio Manager
oakbx@oakmark.com
M. Colin Hudson, CFA
Portfolio Manager
oakbx@oakmark.com
Matthew A. Logan, CFA
Portfolio Manager
oakbx@oakmark.com
Edward J. Wojciechowski, CFA
Portfolio Manager
oakbx@oakmark.com
Off Target
Former Federal Reserve Chairman Paul Volcker has remarked that the only useful financial innovation over the past few decades is the ATM. While we have a slightly less extreme view, we are sympathetic to his point and are naturally suspect of new financial products and services. A recent "innovation" about which some of our shareholders have asked is the "target-date fund." A target-date fund is a mutual fund that automatically changes its asset allocation over time using a preset "glide path" such that the stock allocation is steadily reduced while the fixed income allocation is increased. The purpose of this is to automate the conventional wisdom that says investors should reduce their equity exposure as they age. We won't challenge this conventional wisdom (though some studies suggest that investors should actually increase their equity allocation throughout retirement), but we are concerned with its incorporation into the target-date model.
In our view, the problem is that a rigid adherence to a "glide path" might be prudent much of the time, but it's not prudent all of the time. Mindlessly shifting from stocks to bonds over time using a static plan fails to account for just how dynamic the world is. Bonds aren't inherently less risky than stocks, and stocks aren't inherently higher returning than bonds. It all depends on price. And as recent experience has shown, prices change a lot. During the tech bubble of the late 1990s, the S&P 500 was priced so high that the return over the next decade was actually lower than that provided by bonds. Conversely, at the start of last year when interest rates were near record lows, bonds not only were priced to offer paltry returns relative to equities, but they also presented considerable risk, as a modest rise in rates would lower the value of bonds and more than offset the income earned.
It's not just this problematic passive approach to asset allocation that concerns us. We are also concerned that target-date funds emphasize asset allocation to the point of distracting investors from focusing on the performance of the assets within the allocation. Investors should pay close attention to the composition of a target-date fund, as the whole will perform no better than the weighted average of the parts (i.e., the equity "sleeve" and the fixed income "sleeve").
Unlike target-date funds, the Oakmark Equity and Income Fund has a flexible asset allocation policy (equities can range from 40% to 75% of the Fund, while fixed income and cash can vary between 25% and 60%); a relentless focus on security selection within each asset class (with a long record of outstanding equity performance); its managers' interests are aligned with shareholders through sizeable personal investments (not typically found in target-date funds); and the Fund's expense ratio
is 15% lower than that of the average target-date fund (based on Morningstar's analysis of the 2012 average). We believe these factors are critical advantages over target-date funds and that they will help us achieve our goal of producing competitive absolute returns over the long run for our shareholders.
Quarter Review
During the quarter, the S&P 5002 was up a modest 2%. While that result hardly seems noteworthy, underlying it was a reasonable amount of volatility, including intra-quarter swings in excess of 5% due largely to geopolitical concerns. As one would expect in this environment, fixed income securities did well. Over this time period, the Equity & Income Fund returned 2%, which was in line with the Lipper Balanced Fund Index's9 return of 2%.
Top contributors to the Fund's return this quarter were Baker Hughes, General Dynamics, Bank of America, Oracle and UnitedHealth Group, while detractors included General Motors, MasterCard, FedEx, Scripps Network and Philip Morris International. Based solely on the individual stock's total return, Ultra Petroleum, Baker Hughes, Bruker, General Dynamics and HNI led the pack with Blount, General Motors, Atlas Air, Scripps Networks and MasterCard bringing up the rear. In the case of both lists, the causes of the stand-out performances were stock specific with no overarching investment themes of note.
GM is one laggard worth touching on, given its size in the portfolio. After advancing sharply in 2013, GM shares fell early in the quarter after management projected 2014 earnings that were lower than many investors were expecting, largely as a result of transient factors. Shares were further pressured in the quarter after it came to light that GM potentially mishandled a recall of discontinued models. While we obviously aren't pleased with either development, we believe GM's low valuation (its shares trade at just seven times consensus estimates for next year's earnings) more than compensates for these issues, and we remain comfortable with it being a top holding of the Fund.
Transaction Activity
After spending much of 2013 with an equity weighting near the Fund's prospectus maximum of 75%, we have moved the equity allocation down to 65%. Following last year's strong upward move in the market, we believe valuations are generally less attractive on a risk-adjusted basis, and we are therefore finding more stocks meeting our sell criteria than our buy criteria.
The Fund eliminated six positions this quarter: three that worked out well (Cimarex Energy, Concho Resources and Crane) and three that didn't (Encana, Hospira and Quest Diagnostics). Cimarex and Concho are oil and gas companies where the Fund invested with what we believe are strong management
oakmark.com 13
Oakmark Equity and Income Fund March 31, 2014
Portfolio Manager Commentary (continued)
teams for long-term and highly successful investments. We would like to thank both management teams for their contributions to the Fund's returns. The last winner—and in this case the least (in terms of weightings)—is Crane. Crane was purchased with the idea that its transition from a holding company with a collection of high quality, niche businesses to a fully integrated, operations-focused business would result in high returns, improved margins and a better stock price. Almost immediately upon initiating a position, the market came to similar conclusions, and we were unable to establish a meaningful position.
Hospira was a longtime holding of the Fund, tracing its roots back to the Fund's investment in Abbott Laboratories, which spun-off Hospira ten years ago. Over the past few years, the company suffered from numerous manufacturing quality issues that caused us to lower our appraisal of value. After management made considerable progress remedying those issues, the stock approached our new, lower sell target, and we exited the position. In the case of Encana and Quest Diagnostics, fundamental underperformance caused us to reexamine our investment cases. We have discussed Encana in previous letters, but a combination of significant management changes, pipeline politics and the exploding growth of North American shale gas production caused us to redeploy the money elsewhere. With Quest, its weakening market share and tougher industry conditions caused us to reduce our exposure to this industry.
We added two new stocks of significance to the portfolio: Knowles and Wells Fargo. With Knowles, a supplier of acoustic solutions to mobile phone makers and hearing aid manufacturers, we didn't buy the shares on the open market, but rather received them through a tax-free spinoff from longtime Oakmark Equity and Income Fund holding Dover Corporation. Even though Dover prides itself on being a diversified industrial company with businesses ranging from drilling equipment for oil and gas companies to refrigerators for retailers, the company decided Knowles could best create shareholder value as a standalone company. Knowles has grown rapidly over the years as consumers demand higher acoustic features in each new generation of smartphones and hearing aids, and we expect this trend to continue, which should drive above average top-line growth. Aided by their Dover experience, Knowles' management team should, in our view, continue to operate the business well and allocate capital wisely.
Our other material addition, Wells Fargo, is the second-largest deposit bank in the United States, holding over 10% of the nation's deposits. We think Wells Fargo has one of the best franchises in retail banking, driven by high local market shares and a relentless focus on cross-selling other banking products like mortgages and credit cards, which increases customer "stickiness." Due to its low-cost deposit base and strong management team, Wells Fargo has earned consistently high returns on equity and, through its purchase of Wachovia (a geographically complementary bank), it was one of the few financial companies able to take advantage of the financial crisis to grow its earning power per share. We believe that its significant capital base and relatively simple business model should enable Wells Fargo to continue to produce strong results.
We thank our shareholders for their support and welcome their questions and comments.
14 THE OAKMARK FUNDS
Oakmark Equity and Income Fund March 31, 2014 (Unaudited)
Schedule of Investments (in thousands)
| | | Shares | | Value | |
COMMON STOCKS - 65.4% | |
INDUSTRIALS - 13.5% | |
CAPITAL GOODS - 8.8% | |
Dover Corp.
Industrial Machinery | | | 6,744 | | | $ | 551,332 | | |
General Dynamics Corp.
Aerospace & Defense | | | 4,226 | | | | 460,279 | | |
Rockwell Automation Inc.
Electrical Components & Equipment | | | 2,620 | | | | 326,259 | | |
Parker Hannifin Corp.
Industrial Machinery | | | 2,122 | | | | 254,079 | | |
Illinois Tool Works, Inc.
Industrial Machinery | | | 2,498 | | | | 203,195 | | |
Blount International, Inc. (a)
Industrial Machinery | | | 2,263 | | | | 26,935 | | |
| | | | | | 1,822,079 | | |
TRANSPORTATION - 4.4% | |
FedEx Corp.
Air Freight & Logistics | | | 4,016 | | | | 532,382 | | |
Union Pacific Corp.
Railroads | | | 1,846 | | | | 346,327 | | |
Atlas Air Worldwide Holdings, Inc. (a)
Air Freight & Logistics | | | 800 | | | | 28,216 | | |
| | | | | | 906,925 | | |
COMMERCIAL & PROFESSIONAL SERVICES - 0.3% | |
Herman Miller, Inc.
Office Services & Supplies | | | 1,402 | | | | 45,033 | | |
HNI Corp.
Office Services & Supplies | | | 198 | | | | 7,246 | | |
| | | | | | 52,279 | | |
| | | | | | 2,781,283 | | |
CONSUMER DISCRETIONARY - 10.7% | |
AUTOMOBILES & COMPONENTS - 6.8% | |
General Motors Co.
Automobile Manufacturers | | | 18,122 | | | | 623,759 | | |
BorgWarner, Inc.
Auto Parts & Equipment | | | 6,457 | | | | 396,936 | | |
Lear Corp. (b)
Auto Parts & Equipment | | | 4,424 | | | | 370,349 | | |
| | | | | | 1,391,044 | | |
RETAILING - 2.3% | |
Foot Locker, Inc. (b)
Apparel Retail | | | 7,711 | | | | 362,253 | | |
HSN, Inc.
Catalog Retail | | | 1,937 | | | | 115,706 | | |
| | | | | | 477,959 | | |
MEDIA - 1.4% | |
Scripps Networks Interactive, Inc., Class A
Broadcasting | | | 3,831 | | | | 290,841 | | |
| | | Shares | | Value | |
CONSUMER DURABLES & APPAREL - 0.2% | |
Carter's, Inc.
Apparel, Accessories & Luxury Goods | | | 664 | | | $ | 51,583 | | |
| | | | | | 2,211,427 | | |
FINANCIALS - 10.4% | |
BANKS - 5.2% | |
Bank of America Corp.
Diversified Banks | | | 38,426 | | | | 660,926 | | |
Wells Fargo & Co.
Diversified Banks | | | 4,326 | | | | 215,175 | | |
U.S. Bancorp
Diversified Banks | | | 4,461 | | | | 191,191 | | |
| | | | | | 1,067,292 | | |
DIVERSIFIED FINANCIALS - 3.1% | |
TD Ameritrade Holding Corp.
Investment Banking & Brokerage | | | 12,006 | | | | 407,618 | | |
Bank of New York Mellon Corp.
Asset Management & Custody Banks | | | 6,851 | | | | 241,770 | | |
| | | | | | 649,388 | | |
INSURANCE - 2.1% | |
Principal Financial Group, Inc.
Life & Health Insurance | | | 5,061 | | | | 232,769 | | |
Aflac, Inc.
Life & Health Insurance | | | 3,130 | | | | 197,334 | | |
| | | | | | 430,103 | | |
| | | | | | 2,146,783 | | |
CONSUMER STAPLES - 9.4% | |
FOOD, BEVERAGE & TOBACCO - 7.3% | |
Nestle SA (c)
Packaged Foods & Meats | | | 6,956 | | | | 523,238 | | |
Philip Morris International, Inc.
Tobacco | | | 5,915 | | | | 484,253 | | |
Diageo PLC (c)
Distillers & Vintners | | | 3,883 | | | | 483,833 | | |
| | | | | | 1,491,324 | | |
FOOD & STAPLES RETAILING - 2.1% | |
CVS Caremark Corp.
Drug Retail | | | 5,842 | | | | 437,306 | | |
| | | | | | 1,928,630 | | |
INFORMATION TECHNOLOGY - 8.9% | |
SOFTWARE & SERVICES - 6.4% | |
Oracle Corp.
Systems Software | | | 17,795 | | | | 727,993 | | |
MasterCard, Inc., Class A
Data Processing & Outsourced Services | | | 5,350 | | | | 399,614 | | |
Broadridge Financial Solutions, Inc.
Data Processing & Outsourced Services | | | 5,082 | | | | 188,753 | | |
| | | | | | 1,316,360 | | |
See accompanying Notes to Financial Statements.
oakmark.com 15
Oakmark Equity and Income Fund March 31, 2014 (Unaudited)
Schedule of Investments (in thousands) (continued)
| | | Shares | | Value | |
COMMON STOCKS - 65.4% (continued) | |
INFORMATION TECHNOLOGY - 8.9% (continued) | |
TECHNOLOGY HARDWARE & EQUIPMENT - 2.5% | |
TE Connectivity, Ltd. (d)
Electronic Manufacturing Services | | | 6,797 | | | $ | 409,223 | | |
Knowles Corp. (a)
Electronic Components | | | 3,372 | | | | 106,456 | | |
| | | | | | 515,679 | | |
| | | | | | 1,832,039 | | |
ENERGY - 7.0% | |
National Oilwell Varco, Inc.
Oil & Gas Equipment & Services | | | 6,662 | | | | 518,789 | | |
Baker Hughes, Inc.
Oil & Gas Equipment & Services | | | 7,487 | | | | 486,785 | | |
Devon Energy Corp.
Oil & Gas Exploration & Production | | | 3,749 | | | | 250,901 | | |
Ultra Petroleum Corp. (a)
Oil & Gas Exploration & Production | | | 5,117 | | | | 137,604 | | |
Rowan Cos. PLC (a)
Oil & Gas Drilling | | | 1,555 | | | | 52,372 | | |
| | | | | | 1,446,451 | | |
HEALTH CARE - 5.5% | |
HEALTH CARE EQUIPMENT & SERVICES - 5.1% | |
UnitedHealth Group, Inc.
Managed Health Care | | | 6,246 | | | | 512,072 | | |
Omnicare, Inc.
Health Care Services | | | 4,720 | | | | 281,666 | | |
Laboratory Corp. of America Holdings (a)
Health Care Services | | | 1,430 | | | | 140,470 | | |
Varian Medical Systems, Inc. (a)
Health Care Equipment | | | 1,390 | | | | 116,722 | | |
| | | | | | 1,050,930 | | |
PHARMACEUTICALS, BIOTECHNOLOGY & LIFE SCIENCES - 0.4% | |
Bruker Corp. (a)
Life Sciences Tools & Services | | | 3,130 | | | | 71,321 | | |
| | | | | | 1,122,251 | | |
TOTAL COMMON STOCKS - 65.4%
(COST $8,247,576) | | | | | 13,468,864 | | |
| | | Par Value | | Value | |
FIXED INCOME - 11.9% | |
GOVERNMENT AND AGENCY SECURITIES - 8.9% | |
U.S. GOVERNMENT NOTES - 7.8% | |
1.375%, due 07/15/18, Inflation Indexed | | | 540,629 | | | | 586,582 | | |
1.25%, due 07/15/20, Inflation Indexed | | | 534,568 | | | | 576,080 | | |
2.125%, due 01/15/19, Inflation Indexed | | | 217,199 | | | | 242,550 | | |
1.00%, due 09/30/16 | | | 199,380 | | | | 201,000 | | |
| | | | | | 1,606,212 | | |
| | | Par Value | | Value | |
U.S. GOVERNMENT AGENCIES - 0.9% | |
Federal Home Loan Bank,
1.65%, due 07/18/19 | | | 29,550 | | | $ | 28,934 | | |
Federal Home Loan Bank,
1.00%, due 03/26/19 | | | 26,350 | | | | 26,143 | | |
Federal National Mortgage Association,
1.25%, due 09/27/18 | | | 24,680 | | | | 24,255 | | |
Federal Home Loan Mortgage Corp.,
2.50%, due 10/17/19 | | | 23,850 | | | | 24,076 | | |
Federal Home Loan Mortgage Corp.,
1.50%, due 02/28/19 | | | 21,750 | | | | 21,619 | | |
Federal National Mortgage Association,
1.125%, due 07/18/18 | | | 9,825 | | | | 9,834 | | |
Federal Home Loan Bank,
0.625%, due 02/14/19 | | | 9,400 | | | | 9,385 | | |
Federal Home Loan Bank,
1.625%, due 02/21/19 | | | 9,400 | | | | 9,354 | | |
Federal National Mortgage Association,
1.00%, due 01/30/20 | | | 9,525 | | | | 9,228 | | |
Federal Home Loan Bank,
1.00%, due 03/27/23 | | | 6,500 | | | | 6,418 | | |
Federal Home Loan Bank,
1.00%, due 04/15/20 | | | 6,500 | | | | 6,391 | | |
| | | | | | 175,637 | | |
CANADIAN GOVERNMENT BONDS - 0.2% | |
4.25%, due 12/01/21,
Inflation Indexed | | CAD | 36,936 | | | | 43,943 | | |
Total Government and Agency Securities
(Cost $1,723,430) | | | | | 1,825,792 | | |
CORPORATE BONDS - 2.9% | |
Kinetic Concepts, Inc.,
10.50%, due 11/01/18 | | | 47,940 | | | | 55,071 | | |
General Motors Co., 144A,
4.875%, due 10/02/23 (e) | | | 41,400 | | | | 42,435 | | |
Fifth & Pacific Cos., Inc.,
10.50%, due 04/15/19 | | | 34,403 | | | | 36,338 | | |
Delphi Corp.,
6.125%, due 05/15/21 | | | 32,016 | | | | 35,618 | | |
Omnicare, Inc.,
7.75%, due 06/01/20 | | | 31,448 | | | | 34,593 | | |
Credit Suisse Group AG, 144A,
7.50%, due 12/31/49 (e) (f) | | | 30,000 | | | | 32,587 | | |
Omnicom Group, Inc.,
3.625%, due 05/01/22 | | | 30,425 | | | | 30,215 | | |
General Motors Co., 144A,
3.50%, due 10/02/18 (e) | | | 29,525 | | | | 30,079 | | |
CVS Caremark Corp.,
4.00%, due 12/05/23 | | | 29,325 | | | | 29,962 | | |
The William Carter Co., 144A,
5.25%, due 08/15/21 (e) | | | 28,002 | | | | 28,807 | | |
Denbury Resources, Inc.,
8.25%, due 02/15/20 | | | 21,771 | | | | 23,676 | | |
Triumph Group, Inc.,
8.625%, due 07/15/18 | | | 21,000 | | | | 22,260 | | |
Penn National Gaming, Inc., 144A,
5.875%, due 11/01/21 (e) | | | 20,000 | | | | 19,650 | | |
The Manitowoc Co., Inc.,
8.50%, due 11/01/20 | | | 17,075 | | | | 19,167 | | |
See accompanying Notes to Financial Statements.
16 THE OAKMARK FUNDS
Oakmark Equity and Income Fund March 31, 2014 (Unaudited)
Schedule of Investments (in thousands) (continued)
| | | Par Value | | Value | |
FIXED INCOME - 11.9% (continued) | |
CORPORATE BONDS - 2.9% (continued) | |
DIRECTV Holdings LLC / DIRECTV
Financing Co., Inc.,
5.00%, due 03/01/21 | | | 16,710 | | | $ | 17,966 | | |
Kinetic Concepts, Inc.,
12.50%, due 11/01/19 | | | 14,360 | | | | 16,693 | | |
GLP Capital, LP / GLP Financing II,
Inc., 144A,
5.375%, due 11/01/23 (e) | | | 12,000 | | | | 12,330 | | |
Howard Hughes Corp., 144A,
6.875%, due 10/01/21 (e) | | | 10,000 | | | | 10,800 | | |
Live Nation Entertainment, Inc., 144A,
7.00%, due 09/01/20 (e) | | | 9,605 | | | | 10,505 | | |
GLP Capital, LP / GLP Financing II, Inc., 144A,
4.875%, due 11/01/20 (e) | | | 10,000 | | | | 10,262 | | |
Six Flags Entertainment Corp., 144A,
5.25%, due 01/15/21 (e) | | | 9,970 | | | | 10,045 | | |
Health Net, Inc.,
6.375%, due 06/01/17 | | | 8,680 | | | | 9,440 | | |
Concho Resources, Inc.,
5.50%, due 10/01/22 | | | 6,980 | | | | 7,277 | | |
Activision Blizzard, Inc., 144A,
5.625%, due 09/15/21 (e) | | | 5,875 | | | | 6,286 | | |
Activision Blizzard, Inc., 144A,
6.125%, due 09/15/23 (e) | | | 5,505 | | | | 5,994 | | |
Scotiabank Peru SA, 144A,
4.50%, due 12/13/27 (e) (f) | | | 6,000 | | | | 5,490 | | |
Serta Simmons Holdings LLC, 144A,
8.125%, due 10/01/20 (e) | | | 4,990 | | | | 5,483 | | |
Quest Diagnostics, Inc.,
4.70%, due 04/01/21 | | | 5,128 | | | | 5,450 | | |
GLP Capital, LP / GLP Financing II, Inc., 144A,
4.375%, due 11/01/18 (e) | | | 5,000 | | | | 5,131 | | |
Walter Energy, Inc.,
9.875%, due 12/15/20 | | | 5,390 | | | | 3,544 | | |
Walter Energy, Inc.,
8.50%, due 04/15/21 | | | 5,000 | | | | 3,150 | | |
Quiksilver, Inc. / QS Wholesale, Inc., 144A,
7.875%, due 08/01/18 (e) | | | 2,000 | | | | 2,175 | | |
Quiksilver, Inc. / QS Wholesale, Inc.,
10.00%, due 08/01/20 | | | 1,000 | | | | 1,138 | | |
Post Holdings, Inc.,
7.375%, due 02/15/22 | | | 1,000 | | | | 1,075 | | |
Post Holdings, Inc., 144A,
6.75%, due 12/01/21 (e) | | | 1,000 | | | | 1,059 | | |
Foot Locker, Inc.,
8.50%, due 01/15/22 (b) | | | 395 | | | | 470 | | |
CNO Financial Group, Inc., 144A,
6.375%, due 10/01/20 (e) | | | 250 | | | | 266 | | |
Hologic, Inc.,
6.25%, due 08/01/20 | | | 250 | | | | 264 | | |
Tempur Sealy International, Inc.,
6.875%, due 12/15/20 | | | 100 | | | | 109 | | |
Total Corporate Bonds (Cost $578,309) | | | | | 592,860 | | |
| | | Par Value | | Value | |
ASSET BACKED SECURITIES - 0.1% | |
Cabela's Master Credit Card Trust, 144A,
0.705%, due 10/15/19 (e) (f)
(Cost $11,450) | | | 11,450 | | | $ | 11,533 | | |
CONVERTIBLE BOND - 0.0%(g) | |
Live Nation Entertainment, Inc.,
2.875%, due 07/15/27
(Cost $834) | | | 828 | | | | 841 | | |
TOTAL FIXED INCOME - 11.9%
(COST $2,314,023) | | | | | 2,431,026 | | |
SHORT TERM INVESTMENTS - 22.4% | |
COMMERCIAL PAPER - 15.8% | |
Toyota Motor Credit Corp.,
0.08% - 0.16%,
due 04/02/14 - 06/20/14 (h) | | | 1,200,000 | | | | 1,199,855 | | |
MetLife, Inc., 144A, 0.10% - 0.15%,
due 04/07/14 - 06/18/14 (e) (h) | | | 523,000 | | | | 522,938 | | |
BMW US Capital LLC, 144A,
0.09% - 0.11%,
due 04/10/14 - 06/17/14 (e) (h) | | | 480,700 | | | | 480,603 | | |
Philip Morris International, Inc., 144A,
0.10% - 0.14%,
due 04/17/14 - 05/15/14 (e) (h) | | | 249,900 | | | | 249,879 | | |
J.P. Morgan Securities LLC, 0.28% - 0.33%,
due 06/16/14 - 08/01/14 (h) | | | 175,000 | | | | 174,896 | | |
Kellogg Co., 144A, 0.13% - 0.20%,
due 04/03/14 - 06/05/14 (e) (h) | | | 163,916 | | | | 163,868 | | |
State Street Corp., 0.13% - 0.14%,
due 05/12/14 - 06/12/14 (h) | | | 150,000 | | | | 149,969 | | |
General Mills Inc., 144A, 0.10%,
due 04/01/14 - 04/04/14 (e) (h) | | | 135,000 | | | | 135,000 | | |
BP Capital Markets PLC, 144A,
0.09% - 0.11%,
due 04/14/14 (e) (h) | | | 78,000 | | | | 77,997 | | |
Wellpoint, Inc., 144A, 0.18% - 0.25%,
due 04/04/14 - 05/06/14 (e) (h) | | | 50,000 | | | | 49,995 | | |
Chevron Corp., 144A, 0.07%,
due 04/01/14 (e) (h) | | | 30,800 | | | | 30,800 | | |
J.P. Morgan Securities LLC, 144A,
0.18% - 0.30%,
due 05/27/14 - 06/19/14 (e) (h) | | | 30,000 | | | | 29,988 | | |
Total Commercial Paper (Cost $3,265,760) | | | | | 3,265,788 | | |
See accompanying Notes to Financial Statements.
oakmark.com 17
Oakmark Equity and Income Fund March 31, 2014 (Unaudited)
Schedule of Investments (in thousands) (continued)
| | | Par Value | | Value | |
SHORT TERM INVESTMENTS - 22.4% (continued) | |
REPURCHASE AGREEMENT - 4.6% | |
Fixed Income Clearing Corp. Repurchase
Agreement, 0.00% dated 03/31/14 due
04/01/14, repurchase price $954,800,
collateralized by a Federal Home Loan
Bank Bond, 0.150%, due 03/30/15,
value plus accrued interest of $150,750,
by a Freddie Mac Discount Note, 0.000%,
due 12/04/14, value plus accrued interest
of $329,917, by a United States Treasury
Bill, 0.000%, due 02/05/15, value plus
accrued interest of $20,979, by United States
Treasury Notes, 0.375% - 4.125%,
due 01/31/15 - 06/30/15, aggregate
value plus accrued interest of $472,252
(Cost: $954,800) | | | 954,800 | | | $ | 954,800 | | |
CORPORATE BONDS - 2.0% | |
Capital One Financial Corp.,
2.13%, due 07/15/14 | | | 75,095 | | | | 75,440 | | |
Citigroup, Inc.,
5.00%, due 09/15/14 | | | 53,700 | | | | 54,740 | | |
Capital One Financial Corp.,
7.38%, due 05/23/14 | | | 46,941 | | | | 47,391 | | |
DIRECTV Holdings LLC / DIRECTV
Financing Co., Inc.,
4.75%, due 10/01/14 | | | 45,459 | | | | 46,348 | | |
Merrill Lynch & Co., Inc.,
5.45%, due 07/15/14 | | | 43,637 | | | | 44,250 | | |
Ford Motor Credit Co. LLC,
3.88%, due 01/15/15 | | | 31,481 | | | | 32,233 | | |
The Goldman Sachs Group, Inc.,
6.00%, due 05/01/14 | | | 26,678 | | | | 26,801 | | |
Ford Motor Credit Co. LLC,
8.00%, due 06/01/14 | | | 24,073 | | | | 24,366 | | |
Anheuser-Busch InBev Worldwide, Inc.,
1.50%, due 07/14/14 | | | 18,200 | | | | 18,251 | | |
BP Capital Markets PLC,
3.63%, due 05/08/14 | | | 14,500 | | | | 14,549 | | |
United Parcel Service, Inc.,
3.88%, due 04/01/14 | | | 13,075 | | | | 13,075 | | |
ConocoPhillips,
4.60%, due 01/15/15 | | | 10,826 | | | | 11,176 | | |
International Lease Finance Corp.,
5.65%, due 06/01/14 | | | 5,425 | | | | 5,460 | | |
Total Corporate Bonds
(Cost $414,132) | | | | | 414,080 | | |
TOTAL SHORT TERM INVESTMENTS - 22.4%
(COST $4,634,692) | | | | | 4,634,668 | | |
TOTAL INVESTMENTS - 99.7%
(COST $15,196,291) | | | | | 20,534,558 | | |
Foreign Currencies (Cost $0) - 0.0% (g) | | | | | 0 | (i) | |
Other Assets In Excess of Liabilities - 0.3% | | | | | 61,757 | | |
NET ASSETS - 100.0% | | | | $ | 20,596,315 | | |
(a) Non-income producing security
(b) See Note 5 in the Notes to Financial Statements regarding investments in affiliated issuers.
(c) Sponsored American Depositary Receipt
(d) Foreign domiciled corporation
(e) See Note 1 in the Notes to Financial Statements regarding restricted securities. These securities may be resold subject to restrictions on resale under federal securities law.
(f) Floating Rate Note. Rate shown is as of March 31, 2014.
(g) Amount rounds to less than 0.1%.
(h) The rate shown represents the annualized yield at the time of purchase; not a coupon rate.
(i) Amount rounds to less than $1,000.
Key to Abbreviations:
CAD Canadian Dollar
See accompanying Notes to Financial Statements.
18 THE OAKMARK FUNDS

This page intentionally left blank.
oakmark.com 19
Oakmark Global Fund March 31, 2014
Summary Information
VALUE OF A $10,000 INVESTMENT
Since Inception - 08/04/99 (Unaudited)

PERFORMANCE
| | | | Average Annual Total Returns (as of 03/31/14)3 | |
| (Unaudited) | | Total Return
Last 3 Months | | 1-year | | 3-year | | 5-year | | 10-year | | Since
Inception
(08/04/99) | |
Oakmark Global Fund (Class I) | | | 1.69 | % | | | 25.78 | % | | | 12.25 | % | | | 22.18 | % | | | 9.22 | % | | | 11.73 | % | |
MSCI World Index | | | 1.26 | % | | | 19.07 | % | | | 10.23 | % | | | 18.28 | % | | | 6.83 | % | | | 4.04 | % | |
Lipper Global Funds Index12 | | | 1.75 | % | | | 19.41 | % | | | 8.38 | % | | | 17.06 | % | | | 6.92 | % | | | 5.07 | % | |
The graph and table do not reflect the deduction of taxes that a shareholder would pay on Fund distributions or the redemption of Fund shares.
Past performance is no guarantee of future results. Performance data quoted represents past performance. Current performance may be lower or higher than the performance data quoted. The investment return and principal value vary so that an investor's shares when redeemed may be worth more or less than the original cost. To obtain the most recent month-end performance data, visit oakmark.com.
TOP TEN EQUITY HOLDINGS6 | | % of Net Assets | |
Oracle Corp. | | | 5.3 | | |
Credit Suisse Group | | | 5.0 | | |
Julius Baer Group, Ltd. | | | 3.7 | | |
CNH Industrial N.V. | | | 3.6 | | |
TE Connectivity, Ltd. | | | 3.6 | | |
General Motors Co. | | | 3.4 | | |
MasterCard, Inc., Class A | | | 3.3 | | |
Union Pacific Corp. | | | 3.0 | | |
Bank of America Corp. | | | 3.0 | | |
Fugro N.V. | | | 3.0 | | |
FUND STATISTICS | |
Ticker | | OAKGX | |
Inception | | 08/04/99 | |
Number of Equity Holdings | | 43 | |
Net Assets | | $3.4 billion | |
Benchmark | | MSCI World Index | |
Weighted Average Market Cap | | $60.9 billion | |
Median Market Cap | | $24.7 billion | |
Portfolio Turnover (for the 6-months ended 03/31/14) | | 17% | |
Expense Ratio - Class I (as of 09/30/13) | | 1.13% | |
SECTOR ALLOCATION | | % of Net Assets | |
Information Technology | | | 23.4 | | |
Financials | | | 18.6 | | |
Industrials | | | 16.7 | | |
Consumer Discretionary | | | 12.3 | | |
Materials | | | 7.5 | | |
Consumer Staples | | | 7.3 | | |
Energy | | | 7.2 | | |
Health Care | | | 5.9 | | |
Short-Term Investments and Other | | | 1.1 | | |
GEOGRAPHIC ALLOCATION | |
| | | % of Equity | |
North America | | | 42.5 | | |
United States | | | 42.5 | | |
Europe | | | 39.8 | | |
Switzerland | | | 20.3 | | |
Netherlands* | | | 7.8 | | |
U.K. | | | 4.7 | | |
Germany* | | | 4.4 | | |
France* | | | 2.6 | | |
| | | % of Equity | |
Asia | | | 14.9 | | |
Japan | | | 12.4 | | |
South Korea | | | 2.5 | | |
Australasia | | | 2.8 | | |
Australia | | | 2.8 | | |
* Euro currency countries comprise 14.8% of equity investments
20 THE OAKMARK FUNDS
Oakmark Global Fund March 31, 2014
Portfolio Manager Commentary


Clyde S. McGregor, CFA
Portfolio Manager
oakgx@oakmark.com
Robert A. Taylor, CFA
Portfolio Manager
oakgx@oakmark.com
Quarter Review
The Financial Times service Ignites recently surveyed professional investors regarding the importance of macro forecasting to their investment process. "Macro is very important" proved to be the dominant answer. For these macro thinkers, the recent quarter may have been unusually challenging. If a macro investor had known that the quarter would include the Crimea annexation and the West's response, turmoil in important emerging markets (e.g., Thailand, Turkey, South Africa, Egypt and Venezuela), continuation of the tragic civil war in Syria and tepid economic growth in developed economies, we suspect that this investor would have forecasted significant market declines, particularly given 2013's strong market performance. As it happened, however, global stock prices experienced short bouts of volatility, but the quarter ended with modest gains.
During the most recent quarter the Oakmark Global Fund, which is not managed by macro investors, gained 2%. The MSCI World Index's11 return approached 1%, while the Lipper Global Fund Index12 returned 2% during the same time period. For the first six months of the Fund's fiscal year, the returns are 8% for the Fund, 9% for the MSCI World Index and 9% for the Lipper Global Fund Index. Since inception in 1999, the Fund has achieved a compound annual rate of return of 12%, which compares to 4% for the MSCI World Index and 5% for the Lipper Global Fund Index.
The countries that contributed most to the Fund's return this quarter were Switzerland, the U.S. and Germany. The countries that detracted most from the Fund's return were Japan, the U.K. and France. The five largest contributors to the Fund's return in the quarter were Incitec Pivot (Australia), Oracle (U.S.), Rheinmetall (Germany), Union Pacific (U.S.) and TE Connectivity (Switzerland). The Fund holdings that detracted most were General Motors (U.S.), MasterCard (U.S.), Julius Baer Group (Switzerland), Daiwa Securities Group (Japan) and FedEx (U.S.).
For the fiscal six months, the U.S., Germany and Switzerland contributed the most to investment return, while Japan was the only detractor. Oracle (U.S.), Bank of America (U.S.), Daimler (Germany), Union Pacific (U.S.) and FedEx (U.S.) contributed most to fiscal six-month return, while CNH Industrial (Netherlands), Toyota Motor (Japan), Julius Baer Group (Switzerland), Hirose Electric (Japan) and Itron (U.S.) detracted most.
Portfolio Activity
Investors will recall that U.S. markets performed particularly well in 2013, as did the Global Fund's holdings. Given our value investing philosophy, it should come as no surprise that we reduced the weight of U.S. holdings in the portfolio during the previous quarter. However, we did this without eliminating any holdings. As individual issues approach their sell targets, our practice is to reduce their portfolio weight in favor of those
opportunities that we find more compelling. Remember that the Fund's guidelines are broad: the U.S. (or international) weight can range between 25% and 75% of the portfolio. Therefore, we have considerable flexibility to invest wherever we believe we are finding the best values. Also, your managers' economic interests are aligned with Fund shareholders because we have substantial personal investments in the Global Fund.
Relative to the MSCI World Index, this reduction in the Fund's U.S. weight increased its relative dispersion. The Fund is also underweight the MSCI in the U.K. and France, and it has no exposure to several other countries with index representation (e.g., Canada). Switzerland continues to be the largest overweight versus the index by a substantial margin. Larger Swiss companies typically generate the majority of their revenues outside of their relatively small home country. For several years the Swiss franc has been very strong, and this has reduced the apparent value of foreign-sourced profits when translated back to francs. We believe that this has helped to create the opportunity to purchase shares of well-managed Swiss-domiciled companies at attractive prices.
We initiated two new positions during the quarter, Citigroup (U.S.) and Samsung (Korea), which increased the number of Fund holdings to 43. The Fund went more than eight years without owning shares of a U.S. banking institution until the purchase of Bank of America last fall. We have found that in the aftermath of the 2008 financial crisis the Federal Reserve created an environment in which the financial industry could rebuild its capital position so that it now offers attractive risk-adjusted investing opportunities. Aside from an attractive valuation, our thesis for investing in Citigroup rests on the company's franchise, management and capital position. With its ability to bank and process payments across more countries than its competitors, Citi's global consumer banking franchise is second to none. Furthermore, in times of economic or political stress in emerging markets, Citigroup is seen as a relatively safe haven locally. In 2013 Michael Corbat became the new CEO of Citigroup, and we find him rational, realistic and respected within the organization. We calculate that Citi has meaningful excess capital, which—combined with its significant deferred tax assets—should give management various options to increase shareholder value. Finally, we note that Citi also has a substantial private banking unit, much of which services the owners and managers of its corporate clients. Late in the quarter the Federal Reserve announced that Citi had failed its latest stress test because of process (rather than capital or liquidity) issues. The stock price dropped following this announcement, giving us the opportunity to build our position at a desirable price.
Samsung Electronics is a new addition for the quarter, but it is not a new name for long-term holders of the Fund. We last owned Samsung in mid-2007, but sold the position when the
oakmark.com 21
Oakmark Global Fund March 31, 2014
Portfolio Manager Commentary (continued)
shock from the Lehman Brothers collapse gripped global markets, making other names more attractive. Incredibly, we are able to buy Samsung today at a larger discount to our estimate of intrinsic value than we did over five years ago, even though the stock has performed well since that time. We believe that this is due to faster than expected growth of sales and profits in the mobile phone business, along with the dramatic change in the competitive landscape of the memory business. The former has strengthened Samsung's balance sheet, moving the company from a small net debt to a sizable net cash position. The latter means the normal profitability from the memory business should surpass what we've experienced in the past. Samsung is the market leader for DRAM chips, holding nearly 50% of the total market share in all DRAM chips and over 60% market share in higher quality DRAM chips, such as those used in mobile communication devices. Samsung also leads the market in NAND chip production, commanding approximately 40% share. We are well aware of the inherent difficulties of choosing a winner in the mobile handset business, so we incorporated a stress test into our analysis of Samsung that included a downside scenario. Given that Samsung performed solidly on those measures and that we are only paying 4x cashflow, 1x book value and 65% of sales, we believe that the risk/reward of owning Samsung is once again attractive.
Currency Hedges
Global currencies were relatively stable during the quarter, but we continue to believe some currencies are overvalued. As a result, we defensively hedged a portion of the Fund's currency exposure. Approximately 28% of the Australian dollar and 37% of the Swiss franc were hedged at quarter-end.
Thank you for being our partners in the Oakmark Global Fund. Please feel free to contact us with your questions or comments.
22 THE OAKMARK FUNDS
Oakmark Global Fund March 31, 2014 (Unaudited)
Schedule of Investments (in thousands)
| | | Shares | | Value | |
COMMON STOCKS - 98.9% | |
INFORMATION TECHNOLOGY - 23.4% | |
SOFTWARE & SERVICES - 8.6% | |
Oracle Corp. (United States)
Systems Software | | | 4,379 | | | $ | 179,149 | | |
MasterCard, Inc., Class A (United States)
Data Processing & Outsourced Services | | | 1,510 | | | | 112,774 | | |
| | | | | | 291,923 | | |
TECHNOLOGY HARDWARE & EQUIPMENT - 8.3% | |
TE Connectivity, Ltd. (Switzerland)
Electronic Manufacturing Services | | | 2,025 | | | | 121,937 | | |
Canon, Inc. (Japan)
Technology Hardware, Storage & Peripherals | | | 2,752 | | | | 85,075 | | |
Hirose Electric Co., Ltd. (Japan)
Electronic Components | | | 341 | | | | 46,779 | | |
Itron, Inc. (United States) (a)
Electronic Equipment & Instruments | | | 777 | | | | 27,604 | | |
| | | | | | 281,395 | | |
SEMICONDUCTORS & SEMICONDUCTOR EQUIPMENT - 6.5% | |
Samsung Electronics Co., Ltd. (South Korea)
Semiconductors | | | 66 | | | | 82,830 | | |
Applied Materials, Inc. (United States)
Semiconductor Equipment | | | 3,640 | | | | 74,323 | | |
Intel Corp. (United States)
Semiconductors | | | 2,548 | | | | 65,753 | | |
| | | | | | 222,906 | | |
| | | | | | 796,224 | | |
FINANCIALS - 18.6% | |
DIVERSIFIED FINANCIALS - 13.6% | |
Credit Suisse Group (Switzerland)
Diversified Capital Markets | | | 5,299 | | | | 171,378 | | |
Julius Baer Group, Ltd. (Switzerland)
Asset Management & Custody Banks | | | 2,854 | | | | 126,665 | | |
Franklin Resources, Inc. (United States)
Asset Management & Custody Banks | | | 1,597 | | | | 86,520 | | |
Daiwa Securities Group, Inc. (Japan)
Investment Banking & Brokerage | | | 9,125 | | | | 79,390 | | |
| | | | | | 463,953 | | |
BANKS - 5.0% | |
Bank of America Corp. (United States)
Diversified Banks | | | 5,908 | | | | 101,623 | | |
Citigroup, Inc. (United States)
Diversified Banks | | | 1,405 | | | | 66,864 | | |
| | | | | | 168,487 | | |
| | | | | | 632,440 | | |
| | | Shares | | Value | |
INDUSTRIALS - 16.7% | |
TRANSPORTATION - 7.9% | |
Union Pacific Corp. (United States)
Railroads | | | 542 | | | $ | 101,655 | | |
FedEx Corp. (United States)
Air Freight & Logistics | | | 745 | | | | 98,699 | | |
Kuehne + Nagel International AG (Switzerland)
Marine | | | 477 | | | | 66,800 | | |
| | | | | | 267,154 | | |
CAPITAL GOODS - 7.8% | |
CNH Industrial N.V. (Netherlands) (a)
Construction Machinery & Heavy Trucks | | | 10,648 | | | | 122,410 | | |
Rheinmetall AG (Germany)
Industrial Conglomerates | | | 836 | | | | 58,774 | | |
Smiths Group PLC (UK)
Industrial Conglomerates | | | 1,698 | | | | 36,010 | | |
Koninklijke Philips NV (Netherlands)
Industrial Conglomerates | | | 765 | | | | 26,876 | | |
Travis Perkins PLC (UK)
Trading Companies & Distributors | | | 674 | | | | 21,185 | | |
| | | | | | 265,255 | | |
COMMERCIAL & PROFESSIONAL SERVICES - 1.0% | |
Adecco SA (Switzerland)
Human Resource & Employment Services | | | 424 | | | | 35,267 | | |
| | | | | | 567,676 | | |
CONSUMER DISCRETIONARY - 12.3% | |
AUTOMOBILES & COMPONENTS - 10.7% | |
General Motors Co. (United States)
Automobile Manufacturers | | | 3,322 | | | | 114,347 | | |
Toyota Motor Corp. (Japan)
Automobile Manufacturers | | | 1,702 | | | | 96,081 | | |
Daimler AG (Germany)
Automobile Manufacturers | | | 944 | | | | 89,220 | | |
Yamaha Motor Co., Ltd. (Japan)
Motorcycle Manufacturers | | | 3,901 | | | | 62,174 | | |
| | | | | | 361,822 | | |
MEDIA - 1.6% | |
Live Nation Entertainment, Inc.
(United States) (a)
Movies & Entertainment | | | 2,551 | | | | 55,479 | | |
| | | | | | 417,301 | | |
MATERIALS - 7.5% | |
Holcim, Ltd. (Switzerland)
Construction Materials | | | 1,208 | | | | 100,007 | | |
Incitec Pivot, Ltd. (Australia)
Diversified Chemicals | | | 34,508 | | | | 94,729 | | |
Kansai Paint Co., Ltd. (Japan)
Specialty Chemicals | | | 3,362 | | | | 48,043 | | |
Akzo Nobel NV (Netherlands)
Specialty Chemicals | | | 177 | | | | 14,402 | | |
| | | | | | 257,181 | | |
See accompanying Notes to Financial Statements.
oakmark.com 23
Oakmark Global Fund March 31, 2014 (Unaudited)
Schedule of Investments (in thousands) (continued)
| | | Shares | | Value | |
COMMON STOCKS - 98.9% (continued) | |
CONSUMER STAPLES - 7.3% | |
FOOD, BEVERAGE & TOBACCO - 7.3% | |
Diageo PLC (UK)
Distillers & Vintners | | | 3,232 | | | $ | 100,272 | | |
Danone SA (France)
Packaged Foods & Meats | | | 1,238 | | | | 87,552 | | |
Nestle SA (Switzerland)
Packaged Foods & Meats | | | 810 | | | | 60,968 | | |
| | | | | | 248,792 | | |
ENERGY - 7.2% | |
Fugro NV (Netherlands)
Oil & Gas Equipment & Services | | | 1,641 | | | | 100,920 | | |
National Oilwell Varco, Inc. (United States)
Oil & Gas Equipment & Services | | | 1,120 | | | | 87,199 | | |
Cimarex Energy Co. (United States)
Oil & Gas Exploration & Production | | | 460 | | | | 54,751 | | |
Devon Energy Corp. (United States)
Oil & Gas Exploration & Production | | | 25 | | | | 1,673 | | |
| | | | | | 244,543 | | |
HEALTH CARE - 5.9% | |
HEALTH CARE EQUIPMENT & SERVICES - 5.9% | |
Tenet Healthcare Corp. (United States) (a)
Health Care Facilities | | | 1,958 | | | | 83,842 | | |
Health Net, Inc. (United States) (a)
Managed Health Care | | | 1,997 | | | | 67,922 | | |
Laboratory Corp. of America Holdings
(United States) (a)
Health Care Services | | | 499 | | | | 48,997 | | |
| | | | | | 200,761 | | |
TOTAL COMMON STOCKS - 98.9%
(COST $2,589,895) | | | | | 3,364,918 | | |
| | | Par Value | | Value | |
SHORT TERM INVESTMENT - 1.4% | |
REPURCHASE AGREEMENT - 1.4% | |
Fixed Income Clearing Corp. Repurchase
Agreement, 0.00% dated 03/31/14
due 04/01/14, repurchase price $46,297,
collateralized by a Federal Home Loan
Mortgage Corp. Bond, 5.250%,
due 04/18/16, value plus accrued
interest of $47,225
(Cost: $46,297) | | | 46,297 | | | | 46,297 | | |
TOTAL SHORT TERM INVESTMENTS - 1.4%
(COST $46,297) | | | | | 46,297 | | |
TOTAL INVESTMENTS - 100.3%
(COST $2,636,192) | | | | | 3,411,215 | | |
Foreign Currencies (Cost $1,528) - 0.0% (b) | | | | | 1,522 | | |
Liabilities In Excess of Other Assets - (0.3)% | | | | | (11,511 | ) | |
TOTAL NET ASSETS - 100.0% | | | | $ | 3,401,226 | | |
(a) Non-income producing security
(b) Amount rounds to less than 0.1%.
See accompanying Notes to Financial Statements.
24 THE OAKMARK FUNDS

This page intentionally left blank.
oakmark.com 25
Oakmark Global Select Fund March 31, 2014
Summary Information
VALUE OF A $10,000 INVESTMENT
Since Inception - 10/02/06 (Unaudited)
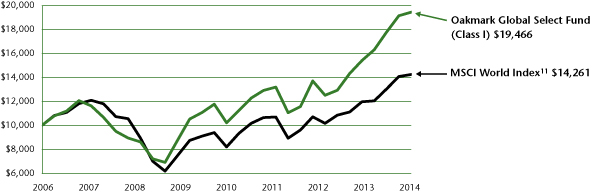
PERFORMANCE
| | | | | Average Annual Total Returns (as of 03/31/14)3 | |
| (Unaudited) | | Total Return
Last 3 Months | | 1-year | | 3-year | | 5-year | | Since
Inception
(10/02/06) | |
Oakmark Global Select Fund (Class I) | | | 1.51 | % | | | 26.24 | % | | | 14.65 | % | | | 23.08 | % | | | 9.30 | % | |
MSCI World Index | | | 1.26 | % | | | 19.07 | % | | | 10.23 | % | | | 18.28 | % | | | 4.85 | % | |
Lipper Global Funds Index12 | | | 1.75 | % | | | 19.41 | % | | | 8.38 | % | | | 17.06 | % | | | 4.98 | % | |
The graph and table do not reflect the deduction of taxes that a shareholder would pay on Fund distributions or the redemption of Fund shares.
Past performance is no guarantee of future results. Performance data quoted represents past performance. Current performance may be lower or higher than the performance data quoted. The investment return and principal value vary so that an investor's shares when redeemed may be worth more or less than the original cost. To obtain the most recent month-end performance data, visit oakmark.com.
TOP TEN EQUITY HOLDINGS6 | | % of Net Assets | |
CNH Industrial N.V. | | | 5.7 | | |
Kering | | | 5.5 | | |
Diageo PLC | | | 5.1 | | |
Credit Suisse Group | | | 5.0 | | |
Daiwa Securities Group, Inc. | | | 5.0 | | |
Canon, Inc. | | | 4.9 | | |
Danone | | | 4.9 | | |
Oracle Corp. | | | 4.9 | | |
JPMorgan Chase, & Co. | | | 4.7 | | |
DIRECTV | | | 4.7 | | |
FUND STATISTICS | |
Ticker | | OAKWX | |
Inception | | 10/02/06 | |
Number of Equity Holdings | | 20 | |
Net Assets | | $1.8 billion | |
Benchmark | | MSCI World Index | |
Weighted Average Market Cap | | $69.2 billion | |
Median Market Cap | | $44.4 billion | |
Portfolio Turnover (for the 6-months ended 03/31/14) | | 6% | |
Expense Ratio - Class I (as of 09/30/13) | | 1.15% | |
SECTOR ALLOCATION | | % of Net Assets | |
Financials | | | 28.5 | | |
Consumer Discretionary | | | 19.1 | | |
Information Technology | | | 18.6 | | |
Industrials | | | 14.8 | | |
Consumer Staples | | | 10.0 | | |
Health Care | | | 4.7 | | |
Short-Term Investments and Other | | | 4.3 | | |
GEOGRAPHIC ALLOCATION | |
| | | % of Equity | |
North America | | | 48.5 | | |
United States | | | 48.5 | | |
Europe | | | 41.2 | | |
Switzerland | | | 14.6 | | |
France* | | | 10.9 | | |
Netherlands* | | | 6.0 | | |
U.K. | | | 5.3 | | |
Germany* | | | 4.4 | | |
| | | % of Equity | |
Asia | | | 10.3 | | |
Japan | | | 10.3 | | |
* Euro currency countries comprise 21.3% of equity investments
26 THE OAKMARK FUNDS
Oakmark Global Select Fund March 31, 2014
Portfolio Manager Commentary


William C. Nygren, CFA
Portfolio Manager
oakwx@oakmark.com
David G. Herro, CFA
Portfolio Manager
oakwx@oakmark.com
The Oakmark Global Select Fund returned 2% for the quarter ended March 31, 2014, outperforming the MSCI World Index's11 1% return. For the first six months of this fiscal year, the Fund was up 9%, in line with the MSCI World Index. The Fund has returned an average of 9% per year since its inception in October 2006, outperforming the MSCI World Index's annualized gain of 5% over the same period.
Bank of America was the top contributor for the quarter, returning 11%. The company's most recent quarterly earnings report demonstrated continued progress toward achieving management's expense reduction targets, driven in large part by declines in the cost of servicing its "legacy" mortgages. As management executes on its plan, investors have increasingly recognized the normalized earning power of Bank of America. We believe the combination of further operational improvements and the company's plan to return capital to shareholders—through its recently increased dividend and additional repurchase authorization—will lead to continued gains in the stock.
Daiwa Securities, Japan's second-largest broker, was the largest detractor for the quarter, falling 12%. Daiwa's stock price was negatively impacted by general Japanese market weakness during the first quarter. FedEx was another detractor for the quarter, falling 8%. FedEx reported weak third quarter numbers, which were significantly skewed by unusually severe weather and the company's widely reported difficulties during the holiday season. Despite the issues with inclement weather, FedEx's ground segment grew nicely; its volume and price grew 8% and 2%, respectively. However, in spite of this performance, the segment's margins trailed last year's, primarily because of hub/network expansion costs. In our view, this expansion will allow for rapid growth and share gains and is, therefore, worth the short-term costs. Finally, we believe FedEx remains focused on its shareholders and on returning capital via stock buybacks. During the most recent quarter, it repurchased approximately $2.7 billion of stock, and since its stock-repurchasing program began in October 2013, the company has repurchased 25 million—or 8%—of its outstanding shares. We expect further buybacks with 15 million shares left under the current authorization.
Geographically, 48% of the Fund's holdings were invested in U.S.-domiciled companies as of March 31, while approximately 42% were allocated to equities in Europe and 10% to equities in Japan.
Global currencies were relatively stable during the quarter, but we continue to believe some currencies are overvalued. As a result, we defensively hedged a portion of the Fund's currency exposure. Approximately 36% of the Swiss franc was hedged at quarter end.
We would like to thank our shareholders for continuing to support us and our value investing philosophy. We believe we have built a portfolio of high quality companies that will provide our shareholders with attractive returns over the long term.
oakmark.com 27
Oakmark Global Select Fund March 31, 2014 (Unaudited)
Schedule of Investments (in thousands)
| | | Shares | | Value | |
COMMON STOCKS - 95.7% | |
FINANCIALS - 28.5% | |
DIVERSIFIED FINANCIALS - 14.6% | |
Credit Suisse Group (Switzerland)
Diversified Capital Markets | | | 2,732 | | | $ | 88,364 | | |
Daiwa Securities Group, Inc. (Japan)
Investment Banking & Brokerage | | | 10,116 | | | | 88,012 | | |
Capital One Financial Corp. (United States)
Consumer Finance | | | 1,047 | | | | 80,787 | | |
| | | | | | 257,163 | | |
BANKS - 9.3% | |
JPMorgan Chase & Co. (United States)
Diversified Banks | | | 1,372 | | | | 83,294 | | |
Bank of America Corp. (United States)
Diversified Banks | | | 4,770 | | | | 82,044 | | |
| | | | | | 165,338 | | |
INSURANCE - 4.6% | |
American International Group, Inc.
(United States)
Multi-line Insurance | | | 1,627 | | | | 81,366 | | |
| | | | | | 503,867 | | |
CONSUMER DISCRETIONARY - 19.1% | |
CONSUMER DURABLES & APPAREL - 5.5% | |
Kering (France)
Apparel, Accessories & Luxury Goods | | | 476 | | | | 97,147 | | |
MEDIA - 4.7% | |
DIRECTV (United States) (a)
Cable & Satellite | | | 1,087 | | | | 83,068 | | |
RETAILING - 4.7% | |
Liberty Interactive Corp., Class A
(United States) (a)
Catalog Retail | | | 2,855 | | | | 82,424 | | |
AUTOMOBILES & COMPONENTS - 4.2% | |
Daimler AG (Germany)
Automobile Manufacturers | | | 781 | | | | 73,818 | | |
| | | | | | 336,457 | | |
INFORMATION TECHNOLOGY - 18.6% | |
TECHNOLOGY HARDWARE & EQUIPMENT - 9.4% | |
Canon, Inc. (Japan)
Technology Hardware, Storage & Peripherals | | | 2,808 | | | | 86,825 | | |
TE Connectivity, Ltd. (Switzerland)
Electronic Manufacturing Services | | | 1,324 | | | | 79,712 | | |
| | | | | | 166,537 | | |
SOFTWARE & SERVICES - 4.9% | |
Oracle Corp. (United States)
Systems Software | | | 2,095 | | | | 85,706 | | |
SEMICONDUCTORS & SEMICONDUCTOR EQUIPMENT - 4.3% | |
Intel Corp. (United States)
Semiconductors | | | 2,922 | | | | 75,417 | | |
| | | | | | 327,660 | | |
| | | Shares | | Value | |
INDUSTRIALS - 14.8% | |
TRANSPORTATION - 9.1% | |
FedEx Corp. (United States)
Air Freight & Logistics | | | 616 | | | $ | 81,657 | | |
Kuehne + Nagel International AG (Switzerland)
Marine | | | 562 | | | | 78,596 | | |
| | | | | | 160,253 | | |
CAPITAL GOODS - 5.7% | |
CNH Industrial N.V. (Netherlands) (a)
Construction Machinery & Heavy Trucks | | | 8,798 | | | | 101,148 | | |
| | | | | | 261,401 | | |
CONSUMER STAPLES - 10.0% | |
FOOD, BEVERAGE & TOBACCO - 10.0% | |
Diageo PLC (UK)
Distillers & Vintners | | | 2,885 | | | | 89,503 | | |
Danone SA (France)
Packaged Foods & Meats | | | 1,226 | | | | 86,675 | | |
| | | | | | 176,178 | | |
HEALTH CARE - 4.7% | |
HEALTH CARE EQUIPMENT & SERVICES - 4.7% | |
Medtronic, Inc. (United States)
Health Care Equipment | | | 1,349 | | | | 83,017 | | |
TOTAL COMMON STOCKS - 95.7%
(COST $1,381,483) | | | | | 1,688,580 | | |
| | | Par Value | | Value | |
SHORT TERM INVESTMENTS - 4.5% | |
REPURCHASE AGREEMENT - 4.5% | |
Fixed Income Clearing Corp. Repurchase
Agreement, 0.00% dated 03/31/14
due 04/01/14, repurchase price $79,842,
collateralized by a United States Treasury
Note, 1.500%, due 06/30/16, value plus
accrued interest of $81,439
(Cost: $79,842) | | | 79,842 | | | | 79,842 | | |
TOTAL SHORT TERM INVESTMENTS - 4.5%
(COST $79,842) | | | | | 79,842 | | |
TOTAL INVESTMENTS - 100.2%
(COST $1,461,325) | | | | | 1,768,422 | | |
Foreign Currencies (Cost $1,222) - 0.1% | | | | | 1,217 | | |
Liabilities In Excess of Other Assets - (0.3)% | | | | | (4,174 | ) | |
TOTAL NET ASSETS - 100.0% | | | | $ | 1,765,465 | | |
(a) Non-income producing security
See accompanying Notes to Financial Statements.
28 THE OAKMARK FUNDS

This page intentionally left blank.
oakmark.com 29
Oakmark International Fund March 31, 2014
Summary Information
VALUE OF A $10,000 INVESTMENT
Since Inception - 09/30/92 (Unaudited)
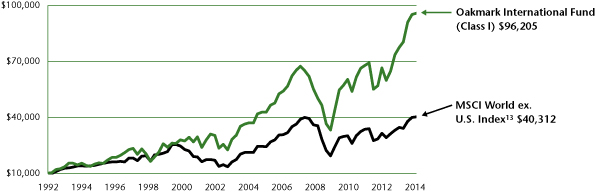
PERFORMANCE
| | | | | Average Annual Total Returns (as of 03/31/14)3 | |
| (Unaudited) | | Total Return
Last 3 Months | | 1-year | | 3-year | | 5-year | | 10-year | | Since
Inception
(09/30/92) | |
Oakmark International Fund (Class I) | | | 0.80 | % | | | 23.75 | % | | | 12.28 | % | | | 23.73 | % | | | 10.20 | % | | | 11.10 | % | |
MSCI World ex U.S. Index | | | 0.75 | % | | | 16.46 | % | | | 6.27 | % | | | 15.88 | % | | | 6.71 | % | | | 6.70 | % | |
MSCI EAFE Index14 | | | 0.66 | % | | | 17.56 | % | | | 7.21 | % | | | 16.02 | % | | | 6.53 | % | | | 6.50 | % | |
Lipper International Funds Index15 | | | 0.42 | % | | | 17.22 | % | | | 6.46 | % | | | 16.39 | % | | | 7.09 | % | | | 7.57 | % | |
The graph and table above do not reflect the deduction of taxes that a shareholder would pay on Fund distributions or the redemption of Fund shares.
Past Performance is no guarantee of future results. Performance data quoted represents past performance. Current performance may be lower or higher than the performance data quoted. The investment return and principal value vary so that an investor's shares when redeemed may be worth more or less than the original cost. To obtain the most recent month-end performance, please visit oakmark.com.
TOP TEN EQUITY HOLDINGS6 | | % of Net Assets | |
Credit Suisse Group | | | 5.1 | | |
Allianz SE | | | 3.5 | | |
Kering | | | 3.1 | | |
Diageo PLC | | | 3.0 | | |
CNH Industrial N.V. | | | 2.9 | | |
Toyota Motor Corp. | | | 2.9 | | |
Tesco PLC | | | 2.8 | | |
Honda Motor Co. | | | 2.8 | | |
Canon, Inc. | | | 2.7 | | |
Richemont SA | | | 2.7 | | |
FUND STATISTICS | |
Ticker | | OAKIX | |
Inception | | 09/30/92 | |
Number of Equity Holdings | | 56 | |
Net Assets | | $31.2 billion | |
Benchmark | | MSCI World ex U.S. Index | |
Weighted Average Market Cap | | $59.6 billion | |
Median Market Cap | | $27.3 billion | |
Portfolio Turnover (for the 6-months ended 03/31/14) | | 18% | |
Expense Ratio - Class I (as of 09/30/13) | | 0.98% | |
SECTOR ALLOCATION | | % of Net Assets | |
Financials | | | 22.8 | | |
Consumer Discretionary | | | 22.8 | | |
Consumer Staples | | | 15.7 | | |
Industrials | | | 15.5 | | |
Information Technology | | | 7.3 | | |
Materials | | | 6.3 | | |
Health Care | | | 4.8 | | |
Short-Term Investments and Other | | | 4.8 | | |
GEOGRAPHIC ALLOCATION | |
| | | % of Equity | |
Europe | | | 77.8 | | |
Switzerland | | | 19.3 | | |
France* | | | 16.1 | | |
U.K. | | | 15.1 | | |
Germany* | | | 10.8 | | |
Netherlands* | | | 7.5 | | |
Sweden | | | 4.4 | | |
Ireland* | | | 2.6 | | |
Italy* | | | 2.0 | | |
| | | % of Equity | |
Asia | | | 16.2 | | |
Japan | | | 13.5 | | |
South Korea | | | 2.7 | | |
Australasia | | | 4.6 | | |
Australia | | | 4.6 | | |
North America | | | 0.8 | | |
Canada | | | 0.8 | | |
Middle East | | | 0.6 | | |
Israel | | | 0.6 | | |
* Euro currency countries comprise 39.0% of equity investments
30 THE OAKMARK FUNDS
Oakmark International Fund March 31, 2014
Portfolio Manager Commentary


David G. Herro, CFA
Portfolio Manager
oakix@oakmark.com
Robert A. Taylor, CFA
Portfolio Manager
oakix@oakmark.com
The Oakmark International Fund returned 1% for the quarter ended March 31, 2014, slightly outperforming the MSCI World ex U.S. Index. For the first six months of the Fund's fiscal year, the Fund returned 5%, which underperformed the MSCI World ex U.S. Index's13 6% return. Most importantly, the Fund has returned an average of 11% per year since its inception in September 1992, outperforming the MSCI World ex U.S. Index, which has averaged 7% per year over the same period.
Intesa Sanpaolo, an Italian retail and commercial bank, was the top contributor to performance for the quarter, returning 37%. Since September 2013, Intesa has returned 64%. Though we still believe the stock to be undervalued, we trimmed our holdings as the gap between price and our estimation of value significantly narrowed. During the quarter, management released a new 2017 business plan that we found very positive. Management has committed to return EUR 10 billion to shareholders via dividends over the next four years. This constitutes a cumulative payout ratio in excess of 70%. Even with this return of capital to shareholders, Intesa will be over-capitalized compared to Basel III requirements, leaving the door open for additional capital returns. Additionally, management plans to increase investments in fee-based businesses, including asset management and insurance. We believe management has a solid plan and that this investment will continue to provide value for our shareholders.
Another top contributor was AMP, the leading independent wealth management company in Australia and New Zealand, which returned 20%. AMP's fiscal year end results revealed that the growth in assets under management exceeded expectations. Although its Wealth Protection division continues to face challenges, the company's actions on claims management are beginning to show positive results. Additionally, management remains diligent on cost discipline and has brought controllable costs down 2.6% for the group, despite cost inflation of 2.5-3%. Management continues to return capital to shareholders via dividends and has recently committed to a share repurchase program in order to neutralize its dividend reinvestment program. Finally, we believe AMP is well positioned to benefit from expected increases in retirement savings and wage growth in Australia.
The largest detractor for the quarter was Honda Motor, the Japanese automobile manufacturer, which fell 14%. Honda has reported weaker than expected operating margins since the Civic redesign mishap. A mere 18 months after it launched a major redesign, Honda rushed a refresh of the Civic in order to address concerns with materials and quality. To ensure that the Accord's redesign did not suffer the same fate, Honda ordered changes to the new Accord's power train and engine late in the development cycle, which negatively affected margins. We expect Honda's mid-term margins to continue to feel pressure but do not believe this will damage the company's long-term prospects.
During the quarter we sold our positions of FANUC and Signet Jewelers as they approached our estimate of fair value. We did not add any new names to the Fund during the quarter.
Our geographical composition changed slightly over the past quarter. Our European holdings decreased to approximately 77%, and our Japan holdings increased to approximately 14%. The remaining positions are in Australia, North America (Canada), South Korea and the Middle East.
Global currencies were relatively stable during the quarter, but we continue to believe some currencies are overvalued. As a result, we defensively hedged a portion of the Fund's currency exposure. Approximately 32% of the Australian dollar, 36% of the Swiss franc and 26% of the Swedish krona were hedged at quarter end.
We continue to adhere to a long-term value philosophy that has enabled us to build a portfolio of high quality names trading at discounts to our estimate of intrinsic value. We thank you, our shareholders, for your continued support.
oakmark.com 31
Oakmark International Fund March 31, 2014 (Unaudited)
Schedule of Investments (in thousands)
| | | Shares | | Value | |
COMMON STOCKS - 95.2% | |
FINANCIALS - 22.8% | |
DIVERSIFIED FINANCIALS - 8.8% | |
Credit Suisse Group (Switzerland)
Diversified Capital Markets | | | 48,730 | | | $ | 1,575,912 | | |
Daiwa Securities Group, Inc. (Japan)
Investment Banking & Brokerage | | | 87,280 | | | | 759,361 | | |
Schroders PLC (UK)
Asset Management & Custody Banks | | | 9,805 | | | | 424,683 | | |
Schroders PLC, Non-Voting (UK)
Asset Management & Custody Banks | | | 31 | | | | 1,053 | | |
| | | | | | 2,761,009 | | |
INSURANCE - 7.5% | |
Allianz SE (Germany)
Multi-line Insurance | | | 6,502 | | | | 1,099,049 | | |
AMP, Ltd. (Australia)
Life & Health Insurance | | | 146,519 | | | | 676,690 | | |
Willis Group Holdings PLC (UK) (b)
Insurance Brokers | | | 12,722 | | | | 561,409 | | |
| | | | | | 2,337,148 | | |
BANKS - 6.5% | |
BNP Paribas SA (France)
Diversified Banks | | | 9,851 | | | | 759,845 | | |
Lloyds Banking Group PLC (UK) (a)
Diversified Banks | | | 545,417 | | | | 678,786 | | |
Intesa Sanpaolo SPA (Italy)
Diversified Banks | | | 169,696 | | | | 575,103 | | |
| | | | | | 2,013,734 | | |
| | | | | | 7,111,891 | | |
CONSUMER DISCRETIONARY - 22.8% | |
AUTOMOBILES & COMPONENTS - 11.1% | |
Toyota Motor Corp. (Japan)
Automobile Manufacturers | | | 16,038 | | | | 905,286 | | |
Honda Motor Co., Ltd. (Japan)
Automobile Manufacturers | | | 24,414 | | | | 859,566 | | |
Bayerische Motoren Werke (BMW) AG
(Germany)
Automobile Manufacturers | | | 6,536 | | | | 824,912 | | |
Daimler AG (Germany)
Automobile Manufacturers | | | 8,626 | | | | 815,078 | | |
Continental AG (Germany)
Auto Parts & Equipment | | | 255 | | | | 61,187 | | |
| | | | | | 3,466,029 | | |
CONSUMER DURABLES & APPAREL - 8.9% | |
Kering (France)
Apparel, Accessories & Luxury Goods | | | 4,677 | | | | 953,926 | | |
Cie Financiere Richemont SA (Switzerland)
Apparel, Accessories & Luxury Goods | | | 8,874 | | | | 847,160 | | |
LVMH Moet Hennessy Louis Vuitton SA (France)
Apparel, Accessories & Luxury Goods | | | 4,120 | | | | 748,937 | | |
Christian Dior SA (France)
Apparel, Accessories & Luxury Goods | | | 1,093 | | | | 210,381 | | |
| | | | | | 2,760,404 | | |
| | | Shares | | Value | |
MEDIA - 1.8% | |
Thomson Reuters Corp. (Canada)
Publishing | | | 7,116 | | | $ | 243,240 | | |
WPP PLC (UK)
Advertising | | | 7,622 | | | | 157,180 | | |
Publicis Groupe SA (France)
Advertising | | | 1,616 | | | | 146,023 | | |
| | | | | | 546,443 | | |
RETAILING - 1.0% | |
Hennes & Mauritz AB (H&M) - Class B
(Sweden)
Apparel Retail | | | 7,687 | | | | 327,796 | | |
| | | | | | 7,100,672 | | |
CONSUMER STAPLES - 15.7% | |
FOOD, BEVERAGE & TOBACCO - 12.0% | |
Diageo PLC (UK)
Distillers & Vintners | | | 29,863 | | | | 926,519 | | |
Danone SA (France)
Packaged Foods & Meats | | | 11,955 | | | | 845,367 | | |
Pernod Ricard SA (France)
Distillers & Vintners | | | 6,592 | | | | 767,361 | | |
Nestle SA (Switzerland)
Packaged Foods & Meats | | | 8,617 | | | | 648,643 | | |
Heineken Holdings NV (Netherlands)
Brewers | | | 8,545 | | | | 551,674 | | |
| | | | | | 3,739,564 | | |
FOOD & STAPLES RETAILING - 3.7% | |
Tesco PLC (UK)
Food Retail | | | 174,742 | | | | 860,564 | | |
Koninklijke Ahold NV (Netherlands)
Food Retail | | | 15,502 | | | | 311,368 | | |
| | | | | | 1,171,932 | | |
| | | | | | 4,911,496 | | |
INDUSTRIALS - 15.5% | |
CAPITAL GOODS - 9.1% | |
CNH Industrial N.V. (Netherlands) (a)
Construction Machinery & Heavy Trucks | | | 79,722 | | | | 916,523 | | |
SKF AB (Sweden) (c)
Industrial Machinery | | | 20,938 | | | | 536,032 | | |
Atlas Copco AB, Series B (Sweden)
Industrial Machinery | | | 16,344 | | | | 447,475 | | |
Smiths Group PLC (UK)
Industrial Conglomerates | | | 17,521 | | | | 371,551 | | |
Koninklijke Philips NV (Netherlands)
Industrial Conglomerates | | | 8,752 | | | | 307,511 | | |
Schindler Holding AG (Switzerland)
Industrial Machinery | | | 1,054 | | | | 155,393 | | |
Wolseley PLC (UK)
Trading Companies & Distributors | | | 1,010 | | | | 57,445 | | |
Geberit AG (Switzerland)
Building Products | | | 94 | | | | 30,684 | | |
| | | | | | 2,822,614 | | |
See accompanying Notes to Financial Statements.
32 THE OAKMARK FUNDS
Oakmark International Fund March 31, 2014 (Unaudited)
Schedule of Investments (in thousands) (continued)
| | | Shares | | Value | |
COMMON STOCKS - 95.2% (continued) | |
INDUSTRIALS - 15.5% (continued) | |
COMMERCIAL & PROFESSIONAL SERVICES - 4.1% | |
Experian Group, Ltd. (Ireland)
Research & Consulting Services | | | 43,208 | | | $ | 778,687 | | |
Adecco SA (Switzerland)
Human Resource & Employment Services | | | 3,714 | | | | 308,984 | | |
Secom Co., Ltd. (Japan)
Security & Alarm Services | | | 1,950 | | | | 112,313 | | |
Meitec Corp. (Japan) (b)
Research & Consulting Services | | | 2,612 | | | | 74,142 | | |
| | | | | | 1,274,126 | | |
TRANSPORTATION - 2.3% | |
Kuehne + Nagel International AG
(Switzerland)
Marine | | | 5,222 | | | | 730,726 | | |
| | | | | | 4,827,466 | | |
INFORMATION TECHNOLOGY - 7.3% | |
TECHNOLOGY HARDWARE & EQUIPMENT - 2.8% | |
Canon, Inc. (Japan)
Technology Hardware, Storage & Peripherals | | | 27,639 | | | | 854,476 | | |
OMRON Corp. (Japan)
Electronic Components | | | 571 | | | | 23,567 | | |
| | | | | | 878,043 | | |
SEMICONDUCTORS & SEMICONDUCTOR EQUIPMENT - 2.6% | |
Samsung Electronics Co., Ltd. (South Korea)
Semiconductors | | | 629 | | | | 794,104 | | |
SOFTWARE & SERVICES - 1.9% | |
SAP AG (Germany)
Application Software | | | 5,070 | | | | 410,428 | | |
Check Point Software Technologies, Ltd.
(Israel) (a)
Systems Software | | | 2,851 | | | | 192,813 | | |
| | | | | | 603,241 | | |
| | | | | | 2,275,388 | | |
MATERIALS - 6.3% | |
Holcim, Ltd. (Switzerland)
Construction Materials | | | 10,104 | | | | 836,652 | | |
Orica, Ltd. (Australia) (b)
Commodity Chemicals | | | 34,085 | | | | 691,641 | | |
Givaudan SA (Switzerland)
Specialty Chemicals | | | 198 | | | | 305,418 | | |
Akzo Nobel NV (Netherlands)
Specialty Chemicals | | | 1,645 | | | | 134,261 | | |
| | | | | | 1,967,972 | | |
| | | Shares | | Value | |
HEALTH CARE - 4.8% | |
PHARMACEUTICALS, BIOTECHNOLOGY & LIFE SCIENCES - 3.5% | |
GlaxoSmithKline PLC (UK)
Pharmaceuticals | | | 16,507 | | | $ | 437,978 | | |
Sanofi (France)
Pharmaceuticals | | | 3,307 | | | | 344,800 | | |
Novartis AG (Switzerland)
Pharmaceuticals | | | 3,419 | | | | 290,023 | | |
| | | | | | 1,072,801 | | |
HEALTH CARE EQUIPMENT & SERVICES - 1.3% | |
Olympus Corp. (Japan) (a)
Health Care Equipment | | | 12,970 | | | | 413,431 | | |
| | | | | | 1,486,232 | | |
TOTAL COMMON STOCKS - 95.2%
(COST $25,465,436) | | | | | 29,681,117 | | |
| | | Par Value | | Value | |
SHORT TERM INVESTMENTS - 4.4% | |
REPURCHASE AGREEMENT - 2.1% | |
Fixed Income Clearing Corp. Repurchase
Agreement, 0.00% dated 03/31/14
due 04/01/14, repurchase price $657,305,
collateralized by a Federal Home Loan
Bank Bond, 0.170% due 08/01/14,
value plus accrued interest of $104,821,
by Freddie Mac Discount Notes, 0.000%
due 08/05/14 - 08/06/14, aggregate value
plus accrued interest of $270,000, by a
United States Treasury Bill, 0.000%
due 08/14/14, value plus accrued interest
of $29,985, by United States Treasury Notes,
0.250% - 0.375% due 08/31/14 - 11/15/14,
aggregate value plus accrued interest of
$265,650 (Cost: $657,305) | | | 657,305 | | | | 657,305 | | |
U.S. GOVERNMENT BILLS - 1.6% | |
United States Treasury Bills,
0.03% - 0.07%,
due 04/03/14 - 04/24/14
(Cost $499,990) | | | 500,000 | | | | 499,990 | | |
COMMERCIAL PAPER - 0.7% | |
J.P. Morgan Securities LLC, 144A,
0.28% - 0.33%,
due 06/19/14 - 07/17/14 (d) (e)
(Cost $199,852) | | | 200,000 | | | | 199,898 | | |
TOTAL SHORT TERM INVESTMENTS - 4.4%
(COST $1,357,147) | | | | | 1,357,193 | | |
See accompanying Notes to Financial Statements.
oakmark.com 33
Oakmark International Fund March 31, 2014 (Unaudited)
Schedule of Investments (in thousands) (continued)
| | | Par Value | | Value | |
TOTAL INVESTMENTS - 99.6%
(COST $26,822,583) | | | | $ | 31,038,310 | | |
Foreign Currencies (Cost $13,406) - 0.0% (f) | | | | | 13,362 | | |
Other Assets In Excess of Liabilities - 0.4% | | | | | 124,524 | | |
| TOTAL NET ASSETS - 100.0% | | | | $ | 31,176,196 | | |
(a) Non-income producing security
(b) See Note 5 in the Notes to Financial Statements regarding investments in affiliated issuers.
(c) A portion of the security out on loan.
(d) The rate shown represents the annualized yield at the time of purchase; not a coupon rate.
(e) See Note 1 in the Notes to Financial Statements regarding restricted securities. These securities may be resold subject to restrictions on resale under federal securities law.
(f) Amount rounds to less than 0.1%.
See accompanying Notes to Financial Statements.
34 THE OAKMARK FUNDS

This page intentionally left blank.
oakmark.com 35
Oakmark International Small Cap Fund March 31, 2014
Summary Information
VALUE OF A $10,000 INVESTMENT
Since 03/31/04 (Unaudited)
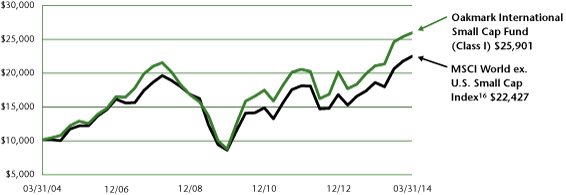
PERFORMANCE
| | | | | Average Annual Total Returns (as of 03/31/14)3 | |
| (Unaudited) | | Total Return
Last 3 Months | | 1-year | | 3-year | | 5-year | | 10-year | | Since
Inception
(11/01/95) | |
Oakmark International Small Cap Fund (Class I) | | | 2.26 | % | | | 23.33 | % | | | 8.16 | % | | | 24.57 | % | | | 9.98 | % | | | 10.84 | % | |
MSCI World ex U.S. Small Cap Index | | | 3.45 | % | | | 21.12 | % | | | 7.54 | % | | | 21.51 | % | | | 8.41 | % | | | N/A | | |
MSCI World ex U.S. Index13 | | | 0.75 | % | | | 16.46 | % | | | 6.27 | % | | | 15.88 | % | | | 6.71 | % | | | 5.85 | % | |
Lipper International Small Cap Funds Index17 | | | 2.49 | % | | | 22.33 | % | | | 9.72 | % | | | 22.51 | % | | | 10.06 | % | | | N/A | | |
The graph and table do not reflect the deduction of taxes that a shareholder would pay on Fund distributions or the redemption of Fund shares.
Past performance is no guarantee of future results. Performance data quoted represents past performance. Current performance may be lower or higher than the performance data quoted. The investment return and principal value vary so that an investor's shares when redeemed may be worth more or less than the original cost. The performance of the Fund does not reflect the 2% redemption fee imposed on shares redeemed within 90 days of purchase. To obtain the most recent month-end performance data, visit oakmark.com.
TOP TEN EQUITY HOLDINGS6 | | % of Net Assets | |
Julius Baer Group, Ltd. | | | 3.8 | | |
Sugi Holdings Co., Ltd. | | | 3.2 | | |
Kaba Holding AG | | | 3.0 | | |
DGB Financial Group, Inc. | | | 2.8 | | |
Incitec Pivot, Ltd. | | | 2.7 | | |
MTU Aero Engines AG | | | 2.7 | | |
Fugro N.V. | | | 2.7 | | |
Totvs SA | | | 2.7 | | |
Atea ASA | | | 2.7 | | |
Premier Farnell PLC | | | 2.5 | | |
SECTOR ALLOCATION | | % of Net Assets | |
Industrials | | | 29.7 | | |
Information Technology | | | 16.4 | | |
Financials | | | 12.0 | | |
Consumer Discretionary | | | 11.9 | | |
Consumer Staples | | | 9.6 | | |
Materials | | | 5.6 | | |
Energy | | | 4.2 | | |
Health Care | | | 3.7 | | |
Short-Term Investments and Other | | | 6.9 | | |
FUND STATISTICS | |
Ticker | | OAKEX | |
Inception | | 11/01/95 | |
Number of Equity Holdings | | 58 | |
Net Assets | | $2.9 billion | |
Benchmark | | MSCI World ex U.S. Small Cap Index | |
Weighted Average Market Cap | | $3.1 billion | |
Median Market Cap | | $2.1 billion | |
Portfolio Turnover (for the 6-months ended 03/31/14) | | 18% | |
Expense Ratio - Class I (as of 09/30/13) | | 1.35% | |
GEOGRAPHIC ALLOCATION | |
| | | % of Equity | |
Europe | | | 58.8 | | |
Switzerland | | | 16.0 | | |
U.K. | | | 13.7 | | |
France* | | | 6.9 | | |
Germany* | | | 6.0 | | |
Italy* | | | 5.9 | | |
Netherlands* | | | 3.1 | | |
Norway | | | 2.9 | | |
Finland* | | | 2.3 | | |
Denmark | | | 1.5 | | |
Greece* | | | 0.3 | | |
Sweden | | | 0.2 | | |
| | % of Equity | |
Asia | | | 22.5 | | |
Japan | | | 15.3 | | |
South Korea | | | 5.5 | | |
Hong Kong | | | 1.7 | | |
Australasia | | | 12.3 | | |
Australia | | | 11.2 | | |
New Zealand | | | 1.1 | | |
Latin America | | | 2.9 | | |
Brazil | | | 2.9 | | |
Middle East | | | 1.8 | | |
Israel | | | 1.8 | | |
North America | | | 1.7 | | |
United States | | | 1.4 | | |
Canada | | | 0.3 | | |
* Euro currency countries comprise 24.5% of equity investments
36 THE OAKMARK FUNDS
Oakmark International Small Cap Fund March 31, 2014
Portfolio Manager Commentary


David G. Herro, CFA
Portfolio Manager
oakex@oakmark.com
Michael L. Manelli, CFA
Portfolio Manager
oakex@oakmark.com
The Oakmark International Small Cap Fund returned 2.3% for the quarter ended March 31, 2014, underperforming the MSCI World ex U.S. Small Cap Index16, which returned 3.5% for the same period. Holdings in Japan contributed most to the Fund's quarterly return, while Swiss and Australian names were the largest detractors.
The top contributing stock for the quarter was French company Altran Technologies. Altran provides a range of outsourced consulting services, categorized into four main areas: information systems, mechanical engineering, systems engineering and managing product lifecycles. Altran's fiscal 2013 revenues increased a modest 2% year-over-year, which was in line with our expectations; however, revenue trends accelerated during the second half of 2013, positioning the company for better growth in 2014. More importantly, Altran continues to improve how it uses its employees. Its invoicing rates improved in the 4th quarter up from the prior year's 4th quarter period, and they surpassed 86% in November for the first time. Higher invoicing rates are necessary for Altran to narrow the gap between its margins and the margins of its best-in-class peers. Assuming these positive trends continue in 2014, we expect Altran will report another year of margin improvement.
A large detractor from the Fund's performance for the past quarter was Hengdeli Holdings, the large luxury watch retailer in the greater China region. The company recently reported weaker than expected results due to lower demand for luxury watches in China and Hong Kong in 2013. After reporting a number of years of double-digit growth, the luxury watch market was flat year-over-year in 2013. This slowdown is a result of a government crack-down on gifting as well as weakening macro trends in China. While the high end of the market remains under pressure, demand seems to be improving in the mid-end segment, where Hengdeli is more heavily exposed. We believe that Hengdeli's results will begin to improve when demand in China recovers more broadly, which we expect to occur within the next few years as a result of the significant wealth creation still occurring in China today.
Portfolio Activity
We added a new Japanese security to the Fund this quarter, Hakuhodo DY Holdings, Japan's second-largest advertising agency. Hakuhodo has offices in more than 15 countries, including approximately 14% of the market share of Japan. It consists of three advertising businesses that offer a wide range of services to client advertisers and media companies. During the quarter, we sold Square Enix Holdings, Takata, and NORMA Group.
Geographically, we ended the quarter with 21% of our holdings in Asia, 55% in Europe and 11% in Australasia. The remaining positions are in North America, Latin America and the Middle East.
Because we continue to believe that some global currencies are overvalued, we maintained hedge positions on four currency exposures. At the recent quarter end, we had hedged 26% of the Fund's Australian dollar, 42% of the Norwegian krone, 36% of the Swiss franc and 16% of the Swedish krona exposures.
Our team continues to focus on finding attractive, undervalued international companies with management teams dedicated to building shareholder value. We thank you for your support.
oakmark.com 37
Oakmark International Small Cap Fund March 31, 2014 (Unaudited)
Schedule of Investments (in thousands)
| | | Shares | | Value | |
COMMON STOCKS - 93.1% | |
INDUSTRIALS - 29.7% | |
CAPITAL GOODS - 17.0% | |
MTU Aero Engines AG (Germany)
Aerospace & Defense | | | 846 | | | $ | 78,578 | | |
Sulzer AG (Switzerland)
Industrial Machinery | | | 509 | | | | 69,914 | | |
Konecranes OYJ (Finland) (b)
Industrial Machinery | | | 1,901 | | | | 60,566 | | |
Morgan Advanced Materials PLC (UK)
Industrial Machinery | | | 9,879 | | | | 58,975 | | |
Rheinmetall AG (Germany)
Industrial Conglomerates | | | 724 | | | | 50,925 | | |
Saft Groupe SA (France) (c)
Electrical Components & Equipment | | | 1,380 | | | | 48,228 | | |
Prysmian SpA (Italy)
Electrical Components & Equipment | | | 1,305 | | | | 32,461 | | |
Bucher Industries AG (Switzerland)
Construction Machinery & Heavy Trucks | | | 88 | | | | 29,971 | | |
Travis Perkins PLC (UK)
Trading Companies & Distributors | | | 883 | | | | 27,746 | | |
Interpump Group SpA (Italy)
Industrial Machinery | | | 1,344 | | | | 20,705 | | |
Wajax Corp. (Canada)
Trading Companies & Distributors | | | 263 | | | | 8,702 | | |
| | | | | | 486,771 | | |
COMMERCIAL & PROFESSIONAL SERVICES - 7.9% | |
Kaba Holding AG (Switzerland)
Security & Alarm Services | | | 181 | | | | 86,567 | | |
Michael Page International PLC (UK)
Human Resource & Employment Services | | | 7,509 | | | | 61,439 | | |
gategroup Holding AG (Switzerland) (a) (c)
Diversified Support Services | | | 1,640 | | | | 48,235 | | |
SThree PLC (UK)
Human Resource & Employment Services | | | 2,961 | | | | 19,744 | | |
Cision AB (Sweden)
Research & Consulting Services | | | 628 | | | | 5,917 | | |
Randstad Holding N.V. (Netherlands)
Human Resource & Employment Services | | | 75 | | | | 4,415 | | |
| | | | | | 226,317 | | |
TRANSPORTATION - 4.8% | |
Panalpina Welttransport Holding AG
(Switzerland)
Air Freight & Logistics | | | 300 | | | | 46,037 | | |
DSV AS (Denmark)
Trucking | | | 1,284 | | | | 41,429 | | |
Freightways, Ltd. (New Zealand)
Air Freight & Logistics | | | 7,133 | | | | 29,962 | | |
BBA Aviation PLC (UK)
Airport Services | | | 3,994 | | | | 22,096 | | |
| | | | | | 139,524 | | |
| | | | | | 852,612 | | |
| | | Shares | | Value | |
INFORMATION TECHNOLOGY - 16.4% | |
SOFTWARE & SERVICES - 10.4% | |
Totvs SA (Brazil)
Systems Software | | | 4,932 | | | $ | 77,388 | | |
Atea ASA (Norway) (c)
IT Consulting & Other Services | | | 6,963 | | | | 76,461 | | |
Altran Technologies SA (France) (a)
IT Consulting & Other Services | | | 4,429 | | | | 50,079 | | |
Alten, Ltd. (France)
IT Consulting & Other Services | | | 798 | | | | 42,838 | | |
Capcom Co., Ltd. (Japan)
Home Entertainment Software | | | 1,652 | | | | 31,342 | | |
Oracle Corp. Japan (Japan)
Systems Software | | | 430 | | | | 19,458 | | |
| | | | | | 297,566 | | |
TECHNOLOGY HARDWARE & EQUIPMENT - 6.0% | |
Premier Farnell PLC (UK)
Technology Distributors | | | 18,390 | | | | 71,711 | | |
Hirose Electric Co., Ltd. (Japan)
Electronic Components | | | 388 | | | | 53,360 | | |
Orbotech, Ltd. (Israel) (a) (c)
Electronic Equipment & Instruments | | | 3,155 | | | | 48,552 | | |
| | | | | | 173,623 | | |
| | | | | | 471,189 | | |
FINANCIALS - 12.0% | |
BANKS - 5.2% | |
DGB Financial Group, Inc. (South Korea)
Regional Banks | | | 5,557 | | | | 80,398 | | |
BS Financial Group, Inc. (South Korea)
Regional Banks | | | 4,773 | | | | 67,484 | | |
| | | | | | 147,882 | | |
DIVERSIFIED FINANCIALS - 4.9% | |
Julius Baer Group, Ltd. (Switzerland)
Asset Management & Custody Banks | | | 2,459 | | | | 109,097 | | |
MLP AG (Germany)
Asset Management & Custody Banks | | | 4,568 | | | | 30,330 | | |
| | | | | | 139,427 | | |
REAL ESTATE - 1.9% | |
LSL Property Services PLC (UK) (c)
Real Estate Services | | | 7,720 | | | | 55,957 | | |
| | | | | | 343,266 | | |
CONSUMER DISCRETIONARY - 11.9% | |
AUTOMOBILES & COMPONENTS - 5.3% | |
Yamaha Motor Co., Ltd. (Japan)
Motorcycle Manufacturers | | | 4,081 | | | | 65,035 | | |
Nifco, Inc. (Japan)
Auto Parts & Equipment | | | 1,765 | | | | 49,862 | | |
Autoliv, Inc. (United States)
Auto Parts & Equipment | | | 364 | | | | 36,517 | | |
| | | | | | 151,414 | | |
See accompanying Notes to Financial Statements.
38 THE OAKMARK FUNDS
Oakmark International Small Cap Fund March 31, 2014 (Unaudited)
Schedule of Investments (in thousands) (continued)
| | | Shares | | Value | |
Common Stocks - 93.1% (continued) | |
CONSUMER DISCRETIONARY - 11.9% (continued) | |
RETAILING - 4.6% | |
Myer Holdings, Ltd. (Australia)
Department Stores | | | 25,834 | | | $ | 53,428 | | |
Hengdeli Holdings, Ltd. (Hong Kong)
Specialty Stores | | | 234,425 | | | | 45,033 | | |
Carpetright PLC (UK) (a)
Home Improvement Retail | | | 3,168 | | | | 31,823 | | |
| | | | | | 130,284 | | |
MEDIA - 1.4% | |
Asatsu-DK, Inc. (Japan)
Advertising | | | 1,405 | | | | 29,025 | | |
Hakuhodo DY Holdings, Inc. (Japan)
Advertising | | | 1,589 | | | | 11,086 | | |
| | | | | | 40,111 | | |
CONSUMER DURABLES & APPAREL - 0.6% | |
Vitec Group PLC (UK) (c)
Consumer Electronics | | | 1,745 | | | | 17,778 | | |
| | | | | | 339,587 | | |
CONSUMER STAPLES - 9.6% | |
FOOD, BEVERAGE & TOBACCO - 6.4% | |
Treasury Wine Estates, Ltd. (Australia)
Distillers & Vintners | | | 19,798 | | | | 64,813 | | |
Davide Campari-Milano SPA (Italy)
Distillers & Vintners | | | 7,371 | | | | 60,421 | | |
Goodman Fielder, Ltd. (Australia) (c)
Packaged Foods & Meats | | | 100,890 | | | | 57,543 | | |
| | | | | | 182,777 | | |
FOOD & STAPLES RETAILING - 3.2% | |
Sugi Holdings Co., Ltd. (Japan)
Drug Retail | | | 2,077 | | | | 92,260 | | |
| | | | | | 275,037 | | |
MATERIALS - 5.6% | |
Incitec Pivot, Ltd. (Australia)
Diversified Chemicals | | | 28,737 | | | | 78,886 | | |
Kansai Paint Co., Ltd. (Japan)
Specialty Chemicals | | | 3,662 | | | | 52,332 | | |
Sika AG (Switzerland)
Specialty Chemicals | | | 4 | | | | 17,302 | | |
Titan Cement Co. SA (Greece) (a)
Construction Materials | | | 229 | | | | 8,021 | | |
Nihon Parkerizing Co., Ltd. (Japan)
Specialty Chemicals | | | 179 | | | | 4,130 | | |
| | | | | | 160,671 | | |
| | | Shares | | Value | |
ENERGY - 4.2% | |
Fugro NV (Netherlands)
Oil & Gas Equipment & Services | | | 1,266 | | | $ | 77,817 | | |
CGG (France) (a)
Oil & Gas Equipment & Services | | | 2,643 | | | | 42,380 | | |
| | | | | | 120,197 | | |
HEALTH CARE - 3.7% | |
HEALTH CARE EQUIPMENT & SERVICES - 3.0% | |
Primary Health Care, Ltd. (Australia)
Health Care Services | | | 9,937 | | | | 43,405 | | |
Amplifon S.p.A. (Italy)
Health Care Distributors | | | 6,356 | | | | 42,821 | | |
| | | | | | 86,226 | | |
PHARMACEUTICALS, BIOTECHNOLOGY & LIFE SCIENCES - 0.7% | |
Tecan Group AG (Switzerland)
Life Sciences Tools & Services | | | 173 | | | | 20,755 | | |
| | | | | | 106,981 | | |
TOTAL COMMON STOCKS - 93.1%
(COST $2,269,458) | | | | | 2,669,540 | | |
| | | Par Value | | Value | |
SHORT TERM INVESTMENTS - 6.8% | |
REPURCHASE AGREEMENT - 6.8% | |
Fixed Income Clearing Corp. Repurchase
Agreement, 0.00% dated 03/31/14
due 04/01/14, repurchase price $195,971,
collateralized by Federal Home Loan
Mortgage Corp. Bonds 0.500% - 5.250%,
due 04/18/16 - 04/29/16, aggregate
value plus accrued interest of $123,569
a Federal National Mortgage Association
Bond 0.520% due 05/20/16, value plus
accrued interest of $20,050, by a
United States Treasury Note, 1.500%,
due 06/30/16, value plus accrued
interest of $56,276 (Cost: $195,971) | | | 195,971 | | | | 195,971 | | |
TOTAL SHORT TERM INVESTMENTS - 6.8%
(COST $195,971) | | | | | 195,971 | | |
TOTAL INVESTMENTS - 99.9%
(COST $2,465,429) | | | | | 2,865,511 | | |
Foreign Currencies (Cost $0) - 0.0% (d) | | | | | 0 | (e) | |
Other Assets In Excess of Liabilities - 0.1% | | | | | 3,410 | | |
TOTAL NET ASSETS - 100.0% | | | | $ | 2,868,921 | | |
(a) Non-income producing security
(b) A portion of the security out on loan.
(c) See Note 5 in Notes to Financial Statements regarding investments in affiliated issuers.
(d) Amount rounds to less than 0.1%.
(e) Amount rounds to less than $1,000.
See accompanying Notes to Financial Statements.
oakmark.com 39
The Oakmark Funds
Statements of Assets and Liabilities—March 31, 2014 (Unaudited)
(in thousands except per share amounts)
| | Oakmark
Fund | | Oakmark
Select
Fund | | Oakmark
Equity and
Income Fund | | Oakmark
Global
Fund | |
Assets | |
Investments in unaffiliated securities, at value (a) | | $ | 13,439,253 | | | $ | 4,809,830 | | | $ | 19,801,486 | | | $ | 3,411,215 | | |
Investments in affiliated securities, at value (b) | | | 0 | | | | 0 | | | | 733,072 | | | | 0 | | |
Foreign currency, at value (c) | | | 0 | | | | 0 | | | | 0 | (e) | | | 1,522 | | |
Receivable for: | |
Securities sold | | | 292,480 | | | | 18,267 | | | | 20,188 | | | | 31,071 | | |
Fund shares sold | | | 39,417 | | | | 13,320 | | | | 21,951 | | | | 6,504 | | |
Dividends and interest from unaffiliated securities (Net of foreign tax withheld) | | | 10,766 | | | | 1,804 | | | | 39,834 | | | | 5,098 | | |
Dividends and interest from affiliated securities (Net of foreign tax withheld) | | | 0 | | | | 0 | | | | 7 | | | | 0 | | |
Forward foreign currency contracts | | | 0 | | | | 0 | | | | 0 | | | | 1,655 | | |
Tax reclaim from unaffiliated securities | | | 0 | | | | 0 | | | | 3,431 | | | | 1,123 | | |
Tax reclaim from affiliated securities | | | 0 | | | | 0 | | | | 0 | | | | 0 | | |
Total receivables | | | 342,663 | | | | 33,391 | | | | 85,411 | | | | 45,451 | | |
Other assets | | | 62 | | | | 42 | | | | 91 | | | | 38 | | |
Total assets | | $ | 13,781,978 | | | $ | 4,843,263 | | | $ | 20,620,060 | | | $ | 3,458,226 | | |
Liabilities and Net Assets | |
Payable for: | |
Securities purchased | | $ | 181,444 | | | $ | 9,486 | | | $ | 0 | | | $ | 53,787 | | |
Fund shares redeemed | | | 105,921 | | | | 1,894 | | | | 16,343 | | | | 1,717 | | |
Forward foreign currency contracts | | | 0 | | | | 0 | | | | 0 | | | | 0 | | |
Investment advisory fee | | | 798 | | | | 330 | | | | 1,085 | | | | 262 | | |
Other shareholder servicing fees | | | 1,672 | | | | 311 | | | | 2,931 | | | | 315 | | |
Transfer and dividend disbursing agent fees | | | 231 | | | | 109 | | | | 222 | | | | 102 | | |
Trustee fees | | | 0 | (e) | | | 0 | (e) | | | 2 | | | | 0 | (e) | |
Deferred trustee compensation | | | 1,254 | | | | 1,104 | | | | 1,080 | | | | 523 | | |
Securities sold short, at value (d) | | | 142,654 | | | | 0 | | | | 0 | | | | 0 | | |
Other | | | 846 | | | | 348 | | | | 2,082 | | | | 294 | | |
Total liabilities | | | 434,820 | | | | 13,582 | | | | 23,745 | | | | 57,000 | | |
Net assets applicable to Fund shares outstanding | | $ | 13,347,158 | | | $ | 4,829,681 | | | $ | 20,596,315 | | | $ | 3,401,226 | | |
Analysis of Net Assets | |
Paid in capital | | $ | 8,606,883 | | | $ | 2,691,882 | | | $ | 14,086,516 | | | $ | 2,573,587 | | |
Accumulated undistributed net realized gain (loss) on investments,
forward contracts, short sales and foreign currency transactions | | | 210,092 | | | | 393,223 | | | | 1,143,753 | | | | 63,395 | | |
Net unrealized appreciation on investments, forward contracts,
short sales and foreign currency translation | | | 4,510,418 | | | | 1,745,669 | | | | 5,338,262 | | | | 776,687 | | |
Accumulated undistributed net investment income
(Distributions in excess of net investment income) | | | 19,765 | | | | (1,093 | ) | | | 27,784 | | | | (12,443 | ) | |
Net assets applicable to Fund shares outstanding | | $ | 13,347,158 | | | $ | 4,829,681 | | | $ | 20,596,315 | | | $ | 3,401,226 | | |
Price of Shares | |
Net asset value, offering and redemption price per share: Class I | | $ | 65.10 | | | $ | 42.00 | | | $ | 33.23 | | | $ | 30.66 | | |
Class I—Net assets | | $ | 13,218,790 | | | $ | 4,812,395 | | | $ | 19,390,274 | | | $ | 3,358,259 | | |
Class I—Shares outstanding (Unlimited shares authorized) | | | 203,065 | | | | 114,580 | | | | 583,481 | | | | 109,518 | | |
Net asset value, offering and redemption price per share: Class II | | $ | 64.93 | | | $ | 41.69 | (f) | | $ | 33.04 | | | $ | 29.93 | (f) | |
Class II—Net assets | | $ | 128,368 | | | $ | 17,286 | | | $ | 1,206,041 | | | $ | 42,967 | | |
Class II—Shares outstanding (Unlimited shares authorized) | | | 1,977 | | | | 415 | | | | 36,497 | | | | 1,436 | | |
| (a) Identified cost of investments in unaffiliated securities | | $ | 8,928,860 | | | $ | 3,064,164 | | | $ | 14,799,589 | | | $ | 2,636,192 | | |
| (b) Identified cost of investments in affiliated securities | | | 0 | | | | 0 | | | | 396,702 | | | | 0 | | |
| (c) Identified cost of foreign currency | | | 0 | | | | 0 | | | | 0 | (e) | | | 1,528 | | |
| (d) Identified proceeds of investments from securities sold short | | $ | 142,674 | | | $ | 0 | | | $ | 0 | | | $ | 0 | | |
| (e) Amount rounds to less than $1,000. | | | | | | | | | | | | | | | | | |
| (f) Net assets have been rounded for presentation purposes. The net asset value per share is as reported on March 31, 2014. | | | | | | | | | | | | | | | | | |
See accompanying Notes to Financial Statements.
40 THE OAKMARK FUNDS
| | | Oakmark
Global Select
Fund | | Oakmark
International
Fund | | Oakmark
International
Small Cap Fund | |
Assets | |
Investments in unaffiliated securities, at value (a) | | $ | 1,768,422 | | | $ | 29,711,118 | | | $ | 2,530,535 | | |
Investments in affiliated securities, at value (b) | | | 0 | | | | 1,327,192 | | | | 334,976 | | |
Foreign currency, at value (c) | | | 1,217 | | | | 13,362 | | | | 0 | (e) | |
Receivable for: | |
Securities sold | | | 0 | | | | 34,393 | | | | 3,292 | | |
Fund shares sold | | | 5,078 | | | | 130,940 | | | | 20,264 | | |
Dividends and interest from unaffiliated securities (Net of foreign tax withheld) | | | 2,089 | | | | 115,386 | | | | 11,381 | | |
Dividends and interest from affiliated securities (Net of foreign tax withheld) | | | 0 | | | | 4,684 | | | | 1,722 | | |
Forward foreign currency contracts | | | 775 | | | | 6,883 | | | | 0 | | |
Tax reclaim from unaffiliated securities | | | 654 | | | | 15,929 | | | | 1,414 | | |
Tax reclaim from affiliated securities | | | 0 | | | | 54 | | | | 0 | | |
Total receivables | | | 8,596 | | | | 308,269 | | | | 38,073 | | |
Other assets | | | 33 | | | | 106 | | | | 46 | | |
Total assets | | $ | 1,778,268 | | | $ | 31,360,047 | | | $ | 2,903,630 | | |
Liabilities and Net Assets | |
Payable for: | |
Securities purchased | | $ | 11,282 | | | $ | 160,223 | | | $ | 31,135 | | |
Fund shares redeemed | | | 1,038 | | | | 14,792 | | | | 1,223 | | |
Forward foreign currency contracts | | | 0 | | | | 0 | | | | 746 | | |
Investment advisory fee | | | 135 | | | | 2,040 | | | | 238 | | |
Other shareholder servicing fees | | | 124 | | | | 3,532 | | | | 519 | | |
Transfer and dividend disbursing agent fees | | | 45 | | | | 314 | | | | 65 | | |
Trustee fees | | | 0 | (e) | | | 5 | | | | 2 | | |
Deferred trustee compensation | | | 17 | | | | 871 | | | | 501 | | |
Securities sold short, at value (d) | | | 0 | | | | 0 | | | | 0 | | |
Other | | | 162 | | | | 2,074 | | | | 280 | | |
Total liabilities | | | 12,803 | | | | 183,851 | | | | 34,709 | | |
Net assets applicable to Fund shares outstanding | | $ | 1,765,465 | | | $ | 31,176,196 | | | $ | 2,868,921 | | |
Analysis of Net Assets | |
Paid in capital | | $ | 1,438,479 | | | $ | 26,126,663 | | | $ | 2,409,906 | | |
Accumulated undistributed net realized gain (loss) on investments,
forward contracts, short sales and foreign currency transactions | | | 19,903 | | | | 820,562 | | | | 66,804 | | |
Net unrealized appreciation on investments, forward contracts,
short sales and foreign currency translation | | | 307,875 | | | | 4,223,450 | | | | 399,512 | | |
Accumulated undistributed net investment income
(Distributions in excess of net investment income) | | | (792 | ) | | | 5,521 | | | | (7,301 | ) | |
Net assets applicable to Fund shares outstanding | | $ | 1,765,465 | | | $ | 31,176,196 | | | $ | 2,868,921 | | |
Price of Shares | |
Net asset value, offering and redemption price per share: Class I | | $ | 16.76 | | | $ | 26.53 | | | $ | 17.67 | | |
Class I—Net assets | | $ | 1,765,465 | | | $ | 30,648,238 | | | $ | 2,865,436 | | |
Class I—Shares outstanding (Unlimited shares authorized) | | | 105,321 | | | | 1,155,274 | | | | 162,197 | | |
Net asset value, offering and redemption price per share: Class II | | $ | 0 | | | $ | 26.65 | | | $ | 17.56 | (f) | |
Class II—Net assets | | $ | 0 | | | $ | 527,958 | | | $ | 3,485 | | |
Class II—Shares outstanding (Unlimited shares authorized) | | | 0 | | | | 19,810 | | | | 198 | | |
| (a) Identified cost of investments in unaffiliated securities | | $ | 1,461,325 | | | $ | 25,499,955 | | | $ | 2,186,188 | | |
| (b) Identified cost of investments in affiliated securities | | | 0 | | | | 1,322,628 | | | | 279,241 | | |
| (c) Identified cost of foreign currency | | | 1,222 | | | | 13,406 | | | | 0 | (e) | |
| (d) Identified proceeds of investments from securities sold short | | $ | 0 | | | $ | 0 | | | $ | 0 | | |
| (e) Amount rounds to less than $1,000. | | | | | | | | | | | | | |
| (f) Net assets have been rounded for presentation purposes. The net asset value per share is as reported on March 31, 2014. | | | | | | | | | | | | | |
oakmark.com 41
The Oakmark Funds
Statements of Operations—March 31, 2014 (Unaudited)
(in thousands)
| | | Oakmark
Fund | | Oakmark
Select
Fund | | Oakmark
Equity and
Income Fund | | Oakmark
Global
Fund | |
Investment Income: | |
Dividends from unaffiliated securities | | $ | 94,686 | | | $ | 22,213 | | | $ | 99,951 | | | $ | 18,690 | | |
Dividends from affiliated securities | | | 0 | | | | 0 | | | | 4,721 | | | | 0 | | |
Interest income from unaffiliated securities | | | 10 | | | | 0 | | | | 30,965 | | | | 0 | | |
Interest income from affiliated securities | | | 0 | | | | 0 | | | | 15 | | | | 0 | | |
Security lending income | | | 0 | | | | 69 | | | | 65 | | | | 20 | | |
Foreign taxes withheld | | | (275 | ) | | | (210 | ) | | | 0 | | | | (683 | ) | |
Total investment income | | | 94,421 | | | | 22,072 | | | | 135,717 | | | | 18,027 | | |
Expenses: | |
Investment advisory fee | | | 45,842 | | | | 19,007 | | | | 66,290 | | | | 15,566 | | |
Transfer and dividend disbursing agent fees | | | 666 | | | | 290 | | | | 525 | | | | 292 | | |
Other shareholder servicing fees | | | 5,298 | | | | 1,395 | | | | 7,451 | | | | 1,146 | | |
Service fee—Class II | | | 148 | | | | 18 | | | | 1,540 | | | | 48 | | |
Reports to shareholders | | | 366 | | | | 137 | | | | 443 | | | | 93 | | |
Custody and accounting fees | | | 271 | | | | 112 | | | | 488 | | | | 317 | | |
Registration and blue sky expenses | | | 415 | | | | 117 | | | | 234 | | | | 119 | | |
Trustees fees | | | 219 | | | | 165 | | | | 261 | | | | 115 | | |
Legal fees | | | 30 | | | | 21 | | | | 43 | | | | 18 | | |
Audit fees | | | 22 | | | | 13 | | | | 34 | | | | 25 | | |
Interest expense | | | 0 | | | | 2 | | | | 0 | | | | 0 | | |
Other | | | 165 | | | | 120 | | | | 235 | | | | 116 | | |
Total expenses | | | 53,442 | | | | 21,397 | | | | 77,544 | | | | 17,855 | | |
Net Investment Income | | $ | 40,979 | | | $ | 675 | | | $ | 58,173 | | | $ | 172 | | |
Net realized and unrealized gain (loss): | |
Net realized gain (loss) on: | |
Unaffiliated investments | | | 222,184 | | | | 400,729 | | | | 1,215,300 | | | | 133,615 | | |
Affiliated investments | | | 0 | | | | 0 | | | | 0 | | | | 0 | | |
Unaffiliated in-kind transactions | | | 0 | | | | 0 | | | | 0 | | | | 0 | | |
Affiliated in-kind transactions | | | 0 | | | | 0 | | | | 0 | | | | 0 | | |
Securities sold short | | | (3,073 | ) | | | (3,582 | ) | | | 0 | | | | 0 | | |
Forward foreign currency contracts | | | 0 | | | | 0 | | | | 0 | | | | (2,529 | ) | |
Foreign currency transactions | | | 0 | (a) | | | 0 | (a) | | | (250 | ) | | | 68 | | |
Written options | | | (394 | ) | | | (611 | ) | | | 0 | | | | 0 | | |
Net realized gain | | | 218,717 | | | | 396,536 | | | | 1,215,050 | | | | 131,154 | | |
Net change in unrealized appreciation (depreciation) on: | |
Unaffiliated investments | | | 1,290,589 | | | | 300,952 | | | | 299,703 | | | | 105,516 | | |
Affiliated investments | | | 0 | | | | 0 | | | | 154,310 | | | | 0 | | |
Securities sold short | | | 20 | | | | 0 | | | | 0 | | | | 0 | | |
Forward foreign currency contracts | | | 0 | | | | 0 | | | | 0 | (a) | | | 1,376 | | |
Foreign currency translation | | | 3 | | | | 1 | | | | (13 | ) | | | (64 | ) | |
Net change in unrealized appreciation (depreciation) | | | 1,290,612 | | | | 300,953 | | | | 454,000 | | | | 106,828 | | |
Net realized and unrealized gain | | | 1,509,329 | | | | 697,489 | | | | 1,669,050 | | | | 237,982 | | |
Net increase in net assets resulting from operations | | $ | 1,550,308 | | | $ | 698,164 | | | $ | 1,727,223 | | | $ | 238,154 | | |
(a) Amount rounds to less than $1,000.
See accompanying Notes to Financial Statements.
42 THE OAKMARK FUNDS
| | | Oakmark
Global Select
Fund | | Oakmark
International
Fund | | Oakmark
International
Small Cap Fund | |
Investment Income: | |
Dividends from unaffiliated securities | | $ | 9,683 | | | $ | 231,905 | | | $ | 21,558 | | |
Dividends from affiliated securities | | | 0 | | | | 24,516 | | | | 6,185 | | |
Interest income from unaffiliated securities | | | 0 | | | | 248 | | | | 0 | | |
Interest income from affiliated securities | | | 0 | | | | 0 | | | | 0 | | |
Security lending income | | | 53 | | | | 1,740 | | | | 442 | | |
Foreign taxes withheld | | | (428 | ) | | | (15,015 | ) | | | (3,104 | ) | |
Total investment income | | | 9,308 | | | | 243,394 | | | | 25,081 | | |
Expenses: | |
Investment advisory fee | | | 7,122 | | | | 114,138 | | | | 13,631 | | |
Transfer and dividend disbursing agent fees | | | 109 | | | | 1,142 | | | | 171 | | |
Other shareholder servicing fees | | | 504 | | | | 11,813 | | | | 1,549 | | |
Service fee—Class II | | | 0 | | | | 535 | | | | 4 | | |
Reports to shareholders | | | 38 | | | | 769 | | | | 128 | | |
Custody and accounting fees | | | 129 | | | | 4,287 | | | | 506 | | |
Registration and blue sky expenses | | | 154 | | | | 998 | | | | 125 | | |
Trustees fees | | | 67 | | | | 284 | | | | 112 | | |
Legal fees | | | 15 | | | | 48 | | | | 18 | | |
Audit fees | | | 14 | | | | 57 | | | | 22 | | |
Interest expense | | | 0 | | | | 0 | | | | 0 | | |
Other | | | 102 | | | | 259 | | | | 108 | | |
Total expenses | | | 8,254 | | | | 134,330 | | | | 16,374 | | |
Net Investment Income | | $ | 1,054 | | | $ | 109,064 | | | $ | 8,707 | | |
Net realized and unrealized gain (loss): | |
Net realized gain (loss) on: | |
Unaffiliated investments | | | 26,236 | | | | 1,154,732 | | | | 103,130 | | |
Affiliated investments | | | 0 | | | | (9,067 | ) | | | (849 | ) | |
Unaffiliated in-kind transactions | | | 0 | | | | 59,819 | | | | 0 | | |
Affiliated in-kind transactions | | | 0 | | | | 1,446 | | | | 0 | | |
Securities sold short | | | 0 | | | | 0 | | | | 0 | | |
Forward foreign currency contracts | | | (3,004 | ) | | | (10,401 | ) | | | 6,747 | | |
Foreign currency transactions | | | 59 | | | | (967 | ) | | | (145 | ) | |
Written options | | | 0 | | | | 0 | | | | 0 | | |
Net realized gain | | | 23,291 | | | | 1,195,562 | | | | 108,883 | | |
Net change in unrealized appreciation (depreciation) on: | |
Unaffiliated investments | | | 100,160 | | | | 63,037 | | | | 5,816 | | |
Affiliated investments | | | 0 | | | | 67,896 | | | | 23,114 | | |
Securities sold short | | | 0 | | | | 0 | | | | 0 | | |
Forward foreign currency contracts | | | 1,924 | | | | (4,311 | ) | | | (8,135 | ) | |
Foreign currency translation | | | (50 | ) | | | (469 | ) | | | 133 | | |
Net change in unrealized appreciation (depreciation) | | | 102,034 | | | | 126,153 | | | | 20,928 | | |
Net realized and unrealized gain | | | 125,325 | | | | 1,321,715 | | | | 129,811 | | |
Net increase in net assets resulting from operations | | $ | 126,379 | | | $ | 1,430,779 | | | $ | 138,518 | | |
oakmark.com 43
The Oakmark Funds
Statements of Changes in Net Assets
(in thousands)
| | | Oakmark Fund | |
| | | Six Months Ended
March 31, 2014
(Unaudited) | | Year Ended
September 30, 2013 | |
From Operations: | |
Net investment income | | $ | 40,979 | | | $ | 67,589 | | |
Net realized gain (loss) | | | 218,717 | | | | 551,614 | | |
Net change in unrealized appreciation (depreciation) | | | 1,290,612 | | | | 1,432,261 | | |
Net increase in net assets from operations | | | 1,550,308 | | | | 2,051,464 | | |
Distributions to shareholders from: | |
Net investment income—Class I | | | (58,384 | ) | | | (54,716 | ) | |
Net investment income—Class II | | | (403 | ) | | | (236 | ) | |
Net realized gain—Class I | | | (472,633 | ) | | | (218,081 | ) | |
Net realized gain—Class II | | | (4,832 | ) | | | (1,251 | ) | |
Total distributions to shareholders | | | (536,252 | ) | | | (274,284 | ) | |
From Fund share transactions: | |
Proceeds from shares sold—Class I | | | 2,417,771 | | | | 3,641,054 | | |
Proceeds from shares sold—Class II | | | 42,466 | | | | 59,463 | | |
Reinvestment of distributions—Class I | | | 485,482 | | | | 253,015 | | |
Reinvestment of distributions—Class II | | | 4,114 | | | | 1,033 | | |
Payment for shares redeemed—Class I | | | (1,098,063 | ) | | | (1,988,190 | ) | |
Payment for shares redeemed—Class II | | | (21,493 | ) | | | (15,531 | ) | |
Net increase in net assets from Fund share transactions | | | 1,830,277 | | | | 1,950,844 | | |
Total increase in net assets | | | 2,844,333 | | | | 3,728,024 | | |
Net assets: | |
Beginning of period | | | 10,502,825 | | | | 6,774,801 | | |
End of period | | $ | 13,347,158 | | | $ | 10,502,825 | | |
Accumulated undistributed net investment income | | $ | 19,765 | | | $ | 44,545 | | |
Fund Share Transactions—Class I: | |
Shares sold | | | 38,412 | | | | 67,775 | | |
Shares issued in reinvestment of dividends | | | 7,819 | | | | 5,282 | | |
Less shares redeemed | | | (17,446 | ) | | | (36,378 | ) | |
Net increase in shares outstanding | | | 28,785 | | | | 36,679 | | |
Fund Share Transactions—Class II: | |
Shares sold | | | 677 | | | | 1,104 | | |
Shares issued in reinvestment of dividends | | | 66 | | | | 21 | | |
Less shares redeemed | | | (340 | ) | | | (290 | ) | |
Net increase in shares outstanding | | | 403 | | | | 835 | | |
See accompanying Notes to Financial Statements.
44 THE OAKMARK FUNDS
The Oakmark Funds
Statements of Changes in Net Assets (continued)
(in thousands)
| | | Oakmark Select Fund | |
| | | Six Months Ended
March 31, 2014
(Unaudited) | | Year Ended
September 30, 2013 | |
From Operations: | |
Net investment income | | $ | 675 | | | $ | 3,843 | | |
Net realized gain (loss) | | | 396,536 | | | | 275,803 | | |
Net change in unrealized appreciation (depreciation) | | | 300,953 | | | | 601,838 | | |
Net increase in net assets from operations | | | 698,164 | | | | 881,484 | | |
Distributions to shareholders from: | |
Net investment income—Class I | | | (4,243 | ) | | | (2,753 | ) | |
Net realized gain—Class I | | | (224,067 | ) | | | (288,202 | ) | |
Net realized gain—Class II | | | (788 | ) | | | (1,091 | ) | |
Total distributions to shareholders | | | (229,098 | ) | | | (292,046 | ) | |
From Fund share transactions: | |
Proceeds from shares sold—Class I | | | 547,670 | | | | 877,926 | | |
Proceeds from shares sold—Class II | | | 3,538 | | | | 9,007 | | |
Reinvestment of distributions—Class I | | | 198,995 | | | | 254,534 | | |
Reinvestment of distributions—Class II | | | 526 | | | | 622 | | |
Payment for shares redeemed—Class I | | | (346,290 | ) | | | (804,315 | ) | |
Payment for shares redeemed—Class II | | | (3,446 | ) | | | (8,914 | ) | |
Net increase in net assets from Fund share transactions | | | 400,993 | | | | 328,860 | | |
Total increase in net assets | | | 870,059 | | | | 918,298 | | |
Net assets: | |
Beginning of period | | | 3,959,622 | | | | 3,041,324 | | |
End of period | | $ | 4,829,681 | | | $ | 3,959,622 | | |
Accumulated undistributed net investment income (loss) | | $ | (1,093 | ) | | $ | 945 | | |
Fund Share Transactions—Class I: | |
Shares sold | | | 13,625 | | | | 26,233 | | |
Shares issued in reinvestment of dividends | | | 5,088 | | | | 8,384 | | |
Less shares redeemed | | | (8,655 | ) | | | (23,787 | ) | |
Net increase in shares outstanding | | | 10,058 | | | | 10,830 | | |
Fund Share Transactions—Class II: | |
Shares sold | | | 88 | | | | 271 | | |
Shares issued in reinvestment of dividends | | | 14 | | | | 21 | | |
Less shares redeemed | | | (87 | ) | | | (260 | ) | |
Net increase in shares outstanding | | | 15 | | | | 32 | | |
See accompanying Notes to Financial Statements.
oakmark.com 45
The Oakmark Funds
Statements of Changes in Net Assets (continued)
(in thousands)
| | | Oakmark Equity and Income Fund | |
| | | Six Months Ended
March 31, 2014
(Unaudited) | | Year Ended
September 30, 2013 | |
From Operations: | |
Net investment income | | $ | 58,173 | | | $ | 164,625 | | |
Net realized gain (loss) | | | 1,215,050 | | | | 1,688,704 | | |
Net change in unrealized appreciation (depreciation) | | | 454,000 | | | | 1,216,404 | | |
Net increase in net assets from operations | | | 1,727,223 | | | | 3,069,733 | | |
Distributions to shareholders from: | |
Net investment income—Class I | | | (90,716 | ) | | | (164,075 | ) | |
Net investment income—Class II | | | (1,788 | ) | | | (7,829 | ) | |
Net realized gain—Class I | | | (1,391,333 | ) | | | (430,958 | ) | |
Net realized gain—Class II | | | (91,024 | ) | | | (31,084 | ) | |
Total distributions to shareholders | | | (1,574,861 | ) | | | (633,946 | ) | |
From Fund share transactions: | |
Proceeds from shares sold—Class I | | | 1,579,734 | | | | 2,256,227 | | |
Proceeds from shares sold—Class II | | | 119,217 | | | | 210,649 | | |
Reinvestment of distributions—Class I | | | 1,394,591 | | | | 562,268 | | |
Reinvestment of distributions—Class II | | | 83,122 | | | | 34,450 | | |
Payment for shares redeemed—Class I | | | (1,948,448 | ) | | | (4,763,063 | ) | |
Payment for shares redeemed—Class II | | | (218,200 | ) | | | (479,308 | ) | |
Net increase (decrease) in net assets from Fund share transactions | | | 1,010,016 | | | | (2,178,777 | ) | |
Total increase in net assets | | | 1,162,378 | | | | 257,010 | | |
Net assets: | |
Beginning of period | | | 19,433,937 | | | | 19,176,927 | | |
End of period | | $ | 20,596,315 | | | $ | 19,433,937 | | |
Accumulated undistributed net investment income | | $ | 27,784 | | | $ | 86,444 | | |
Fund Share Transactions—Class I: | |
Shares sold | | | 47,833 | | | | 74,037 | | |
Shares issued in reinvestment of dividends | | | 43,472 | | | | 19,805 | | |
Less shares redeemed | | | (58,996 | ) | | | (157,552 | ) | |
Net increase (decrease) in shares outstanding | | | 32,309 | | | | (63,710 | ) | |
Fund Share Transactions—Class II: | |
Shares sold | | | 3,634 | | | | 7,025 | | |
Shares issued in reinvestment of dividends | | | 2,603 | | | | 1,219 | | |
Less shares redeemed | | | (6,642 | ) | | | (15,913 | ) | |
Net decrease in shares outstanding | | | (405 | ) | | | (7,669 | ) | |
See accompanying Notes to Financial Statements.
46 THE OAKMARK FUNDS
The Oakmark Funds
Statements of Changes in Net Assets (continued)
(in thousands)
| | | Oakmark Global Fund | |
| | | Six Months Ended
March 31, 2014
(Unaudited) | | Year Ended
September 30, 2013 | |
From Operations: | |
Net investment income | | $ | 172 | | | $ | 17,958 | | |
Net realized gain (loss) | | | 131,154 | | | | 232,367 | | |
Net change in unrealized appreciation (depreciation) | | | 106,828 | | | | 535,743 | | |
Net increase in net assets from operations | | | 238,154 | | | | 786,068 | | |
Distributions to shareholders from: | |
Net investment income—Class I | | | (77,230 | ) | | | (33,109 | ) | |
Net investment income—Class II | | | (893 | ) | | | (430 | ) | |
Net realized gain—Class I | | | (56,046 | ) | | | 0 | | |
Net realized gain—Class II | | | (740 | ) | | | 0 | | |
Total distributions to shareholders | | | (134,909 | ) | | | (33,539 | ) | |
From Fund share transactions: | |
Proceeds from shares sold—Class I | | | 617,383 | | | | 638,657 | | |
Proceeds from shares sold—Class II | | | 5,884 | | | | 5,701 | | |
Reinvestment of distributions—Class I | | | 124,277 | | | | 30,952 | | |
Reinvestment of distributions—Class II | | | 1,513 | | | | 402 | | |
Payment for shares redeemed—Class I | | | (365,664 | ) | | | (593,418 | ) | |
Payment for shares redeemed—Class II | | | (4,725 | ) | | | (11,347 | ) | |
Redemption fees—Class I | | | 0 | | | | 0 | (a) | |
Redemption fees—Class II | | | 0 | | | | 0 | (a) | |
Net increase in net assets from Fund share transactions | | | 378,668 | | | | 70,947 | | |
Total increase in net assets | | | 481,913 | | | | 823,476 | | |
Net assets: | |
Beginning of period | | | 2,919,313 | | | | 2,095,837 | | |
End of period | | $ | 3,401,226 | | | $ | 2,919,313 | | |
Accumulated undistributed net investment income (loss) | | $ | (12,443 | ) | | $ | 50,077 | | |
Fund Share Transactions—Class I: | |
Shares sold | | | 20,487 | | | | 24,401 | | |
Shares issued in reinvestment of dividends | | | 4,256 | | | | 1,363 | | |
Less shares redeemed | | | (12,203 | ) | | | (24,162 | ) | |
Net increase in shares outstanding | | | 12,540 | | | | 1,602 | | |
Fund Share Transactions—Class II: | |
Shares sold | | | 201 | | | | 221 | | |
Shares issued in reinvestment of dividends | | | 53 | | | | 18 | | |
Less shares redeemed | | | (160 | ) | | | (463 | ) | |
Net increase (decrease) in shares outstanding | | | 94 | | | | (224 | ) | |
(a) Amount rounds to less than $1,000.
See accompanying Notes to Financial Statements.
oakmark.com 47
The Oakmark Funds
Statements of Changes in Net Assets (continued)
(in thousands)
| | | Oakmark Global Select Fund | |
| | | Six Months Ended
March 31, 2014
(Unaudited) | | Year Ended
September 30, 2013 | |
From Operations: | |
Net investment income | | $ | 1,054 | | | $ | 8,181 | | |
Net realized gain (loss) | | | 23,291 | | | | 48,723 | | |
Net change in unrealized appreciation (depreciation) | | | 102,034 | | | | 183,532 | | |
Net increase in net assets from operations | | | 126,379 | | | | 240,436 | | |
Distributions to shareholders from: | |
Net investment income—Class I | | | (11,545 | ) | | | (7,715 | ) | |
Net realized gain—Class I | | | (22,884 | ) | | | (4,628 | ) | |
Total distributions to shareholders | | | (34,429 | ) | | | (12,343 | ) | |
From Fund share transactions: | |
Proceeds from shares sold—Class I | | | 673,655 | | | | 531,364 | | |
Reinvestment of distributions—Class I | | | 28,754 | | | | 10,639 | | |
Payment for shares redeemed—Class I | | | (188,657 | ) | | | (166,160 | ) | |
Net increase in net assets from Fund share transactions | | | 513,752 | | | | 375,843 | | |
Total increase in net assets | | | 605,702 | | | | 603,936 | | |
Net assets: | |
Beginning of period | | | 1,159,763 | | | | 555,827 | | |
End of period | | $ | 1,765,465 | | | $ | 1,159,763 | | |
Accumulated undistributed net investment income (loss) | | $ | (792 | ) | | $ | 10,490 | | |
Fund Share Transactions—Class I: | |
Shares sold | | | 41,380 | | | | 37,392 | | |
Shares issued in reinvestment of dividends | | | 1,796 | | | | 865 | | |
Less shares redeemed | | | (11,662 | ) | | | (12,176 | ) | |
Net increase in shares outstanding | | | 31,514 | | | | 26,081 | | |
See accompanying Notes to Financial Statements.
48 THE OAKMARK FUNDS
The Oakmark Funds
Statements of Changes in Net Assets (continued)
(in thousands)
| | | Oakmark International Fund | |
| | | Six Months Ended
March 31, 2014
(Unaudited) | | Year Ended
September 30, 2013 | |
From Operations: | |
Net investment income | | $ | 109,064 | | | $ | 236,944 | | |
Net realized gain (loss) | | | 1,195,562 | | | | 905,068 | | |
Net change in unrealized appreciation (depreciation) | | | 126,153 | | | | 3,668,131 | | |
Net increase in net assets from operations | | | 1,430,779 | | | | 4,810,143 | | |
Distributions to shareholders from: | |
Net investment income—Class I | | | (443,291 | ) | | | (218,798 | ) | |
Net investment income—Class II | | | (6,083 | ) | | | (4,980 | ) | |
Net realized gain—Class I | | | (298,172 | ) | | | 0 | | |
Net realized gain—Class II | | | (4,929 | ) | | | 0 | | |
Total distributions to shareholders | | | (752,475 | ) | | | (223,778 | ) | |
From Fund share transactions: | |
Proceeds from shares sold—Class I | | | 7,697,996 | | | | 12,816,063 | | |
Proceeds from shares sold—Class II | | | 197,346 | | | | 188,732 | | |
Reinvestment of distributions—Class I | | | 596,808 | | | | 199,670 | | |
Reinvestment of distributions—Class II | | | 7,279 | | | | 3,133 | | |
Payment for shares redeemed—Class I | | | (2,198,563 | ) | | | (2,612,687 | ) | |
Payment for shares redeemed—Class II | | | (75,806 | ) | | | (143,384 | ) | |
Net increase in net assets from Fund share transactions | | | 6,225,060 | | | | 10,451,527 | | |
Total increase in net assets | | | 6,903,364 | | | | 15,037,892 | | |
Net assets: | |
Beginning of period | | | 24,272,832 | | | | 9,234,940 | | |
End of period | | $ | 31,176,196 | | | $ | 24,272,832 | | |
Accumulated undistributed net investment income | | $ | 5,521 | | | $ | 352,716 | | |
Fund Share Transactions—Class I: | |
Shares sold | | | 293,316 | | | | 549,644 | | |
Shares issued in reinvestment of dividends | | | 23,358 | | | | 9,899 | | |
Less shares redeemed | | | (84,033 | ) | | | (115,610 | ) | |
Net increase in shares outstanding | | | 232,641 | | | | 443,933 | | |
Fund Share Transactions—Class II: | |
Shares sold | | | 7,508 | | | | 8,312 | | |
Shares issued in reinvestment of dividends | | | 283 | | | | 154 | | |
Less shares redeemed | | | (2,875 | ) | | | (6,372 | ) | |
Net increase in shares outstanding | | | 4,916 | | | | 2,094 | | |
See accompanying Notes to Financial Statements.
oakmark.com 49
The Oakmark Funds
Statements of Changes in Net Assets (continued)
(in thousands)
| | | Oakmark International Small Cap Fund | |
| | | Six Months Ended
March 31, 2014
(Unaudited) | | Year Ended
September 30, 2013 | |
From Operations: | |
Net investment income | | $ | 8,707 | | | $ | 22,209 | | |
Net realized gain (loss) | | | 108,883 | | | | 104,169 | | |
Net change in unrealized appreciation (depreciation) | | | 20,928 | | | | 414,142 | | |
Net increase in net assets from operations | | | 138,518 | | | | 540,520 | | |
Distributions to shareholders from: | |
Net investment income—Class I | | | (77,487 | ) | | | (24,448 | ) | |
Net investment income—Class II | | | (104 | ) | | | (36 | ) | |
Total distributions to shareholders | | | (77,591 | ) | | | (24,484 | ) | |
From Fund share transactions: | |
Proceeds from shares sold—Class I | | | 762,350 | | | | 544,646 | | |
Proceeds from shares sold—Class II | | | 970 | | | | 1,226 | | |
Reinvestment of distributions—Class I | | | 68,648 | | | | 21,893 | | |
Reinvestment of distributions—Class II | | | 38 | | | | 14 | | |
Payment for shares redeemed—Class I | | | (280,932 | ) | | | (353,631 | ) | |
Payment for shares redeemed—Class II | | | (1,062 | ) | | | (1,233 | ) | |
Redemption fees—Class I | | | 399 | | | | 212 | | |
Redemption fees—Class II | | | 1 | | | | 0 | (a) | |
Net increase in net assets from Fund share transactions | | | 550,412 | | | | 213,127 | | |
Total increase in net assets | | | 611,339 | | | | 729,163 | | |
Net assets: | |
Beginning of period | | | 2,257,582 | | | | 1,528,419 | | |
End of period | | $ | 2,868,921 | | | $ | 2,257,582 | | |
Accumulated undistributed net investment income (loss) | | $ | (7,301 | ) | | $ | 53,186 | | |
Fund Share Transactions—Class I: | |
Shares sold | | | 44,058 | | | | 36,156 | | |
Shares issued in reinvestment of dividends | | | 4,096 | | | | 1,601 | | |
Less shares redeemed | | | (16,312 | ) | | | (24,243 | ) | |
Net increase in shares outstanding | | | 31,842 | | | | 13,514 | | |
Fund Share Transactions—Class II: | |
Shares sold | | | 56 | | | | 82 | | |
Shares issued in reinvestment of dividends | | | 2 | | | | 1 | | |
Less shares redeemed | | | (62 | ) | | | (84 | ) | |
Net decrease in shares outstanding | | | (4 | ) | | | (1 | ) | |
(a) Amount rounds to less than $1,000.
See accompanying Notes to Financial Statements.
50 THE OAKMARK FUNDS
The Oakmark Funds
Notes to Financial Statements
1. SIGNIFICANT ACCOUNTING POLICIES
The following are the significant accounting policies of Oakmark Fund ("Oakmark"), Oakmark Select Fund ("Select"), Oakmark Equity and Income Fund ("Equity and Income"), Oakmark Global Fund ("Global"), Oakmark Global Select Fund ("Global Select"), Oakmark International Fund ("International"), and Oakmark International Small Cap Fund ("Int'l Small Cap"), collectively referred to as the "Funds," each a series of Harris Associates Investment Trust (the "Trust"), a Massachusetts business trust, organized on February 1, 1991, which is registered as an open-end management investment company under the Investment Company Act of 1940, as amended (the "1940 Act"). Each Fund, other than Select and Global Select, is diversified in accordance with the 1940 Act. The following policies are in conformity with accounting principles generally accepted in the United States of America ("GAAP"). The presentation of financial statements in conformity with GAAP requires management to make estimates and assumptions that affect the reported amounts of assets and liabilities at the date of the financial statements and the reported amounts of revenues and expenses during the reporting period. Actual results could differ from those estimates and assumptions.
Class disclosure
Each Fund offers two classes of shares: Class I Shares and Class II Shares. Class I Shares are offered to the general public. Class II Shares are offered to certain retirement plans such as 401(k) and profit sharing plans. Class II Shares pay a service fee at the annual rate of up to 0.25% of average net assets of Class II Shares of the Funds. This service fee is paid to a third-party administrator for performing the services associated with the administration of such retirement plans. Class I Shares do not have such an associated service fee. Global Select had no outstanding Class II shares during the six-month period ended March 31, 2014.
Income, realized and unrealized capital gains and losses, and expenses of the Funds not directly attributable to a specific class of shares are allocated to each class pro rata based on the relative net assets of each class. Transfer and dividend disbursing agent fees and other shareholder servicing fees are specific to each class.
Redemption fees
Int'l Small Cap imposes a short-term trading fee on redemptions of shares held for 90 days or less to help offset two types of costs to the Fund caused by abusive trading: portfolio transaction and market impact costs associated with erratic redemption activity and administrative costs associated with processing redemptions. The fee is paid to the Fund and is 2% of the redemption value and is deducted from either the redemption proceeds or from the balance in the account. The "first-in, first-out" ("FIFO") method is used to determine the holding period. The Funds may approve the waiver of redemption fees on certain types of accounts held through intermediaries, pursuant to the Funds' policies and procedures.
Security valuation
The Funds' share prices or net asset values ("NAVs") are calculated as of the close of regular session trading (usually 4:00 pm Eastern time) on the New York Stock Exchange ("NYSE") on any day on which the NYSE is open for trading. Equity securities principally traded on securities exchanges in the United States and over-the-counter securities are valued at the last sales price or the official closing price on the day of valuation, or lacking any reported sales that day, at the most recent bid quotation. Securities traded on the NASDAQ National Market are valued at the NASDAQ Official Closing Price ("NOCP"), or lacking an NOCP, at the most recent bid quotation on the NASDAQ National Market. Equity securities principally traded on securities exchanges outside the United States are valued, depending on local convention or regulation, at the last sales price, the last bid or asked price, the mean between the last bid and asked prices, or the official closing price, or are based on a pricing composite as of the close of the regular trading hours on the appropriate exchange or other designated time. Each long-term debt instrument is valued at the latest bid quotation or an evaluated price provided by an independent pricing service. The pricing service may use standard inputs such as benchmark yields, reported trades, broker/dealer quotes, issuer spreads, two-sided markets, benchmark securities, bids, offers, and reference data including market research publications. For certain security types additional inputs may be used or some of the standard inputs may not be applicable. Additionally, the pricing service monitors market indicators and industry and economic events, which may serve as a trigger to gather and possibly use additional market data. Each short-term debt instrument (i.e., debt instruments whose maturities or expiration dates at the time of acquisition are one year or less) or money market instrument maturing in 61 days or more from the date of valuation is valued at the latest bid quotation or an evaluated price provided by an independent pricing service. Each short-term instrument maturing in 60 days or less from the date of valuation is valued at amortized cost, which approximates market value. Options are valued at the last reported sales price on the day of valuation or, lacking any reported sale price on the valuation date, at the mean of the most recent bid and asked quotations or, if the mean is not available, at the most recent bid quotation.
Securities for which quotations are not readily available or securities that may have been affected by a significant event occurring between the close of a foreign market and the close of the NYSE are valued at fair value, determined by or under the direction of the pricing committee authorized by the Board of Trustees. A significant event may include the performance of U.S. markets since the close of foreign markets. The Funds may use a systematic fair valuation model provided by an independent pricing service to value foreign securities in order to adjust local closing prices for information or events that may occur between the close of certain foreign exchanges and the close of the NYSE.
Fair value measurement
Various inputs are used in determining the value of each Fund's investments. These inputs are prioritized into three broad levels as follows:
Level 1—quoted prices in active markets for identical securities
oakmark.com 51
The Oakmark Funds
Notes to Financial Statements (continued)
Level 2—other significant observable inputs (including quoted prices for similar investments, interest rates, prepayment speeds, credit risk, and others)
Level 3—significant unobservable inputs (including the Funds' own assumptions in determining the fair value of investments)
Observable inputs are those based on market data obtained from independent sources, and unobservable inputs reflect the Funds' own assumptions based on the best information available. The input levels are not necessarily an indication of risk or liquidity associated with investing in those securities.
The Funds recognize transfers between level 1 and 2 at the end of the reporting cycle. At March 31, 2014 there were no transfers between levels.
The following is a summary of the inputs used as of March 31, 2014 in valuing each Fund's assets and liabilities. Except for the industries or investment types separately stated below, the total amounts for common stocks, fixed-income and short-term investments in the table below are presented by industry or investment type in each Fund's Schedule of Investments. Information on forward foreign currency contracts is presented by contract in the notes following the below summary:
(in thousands) | | Quoted Prices
in Active
Markets for
Identical
Assets
(Level 1) | | Other
Significant
Observable
Inputs
(Level 2) | | Significant
Unobservable
Inputs
(Level 3) | |
| | | Oakmark | | | |
Common Stocks | | $ | 12,524,745 | | | $ | 0 | | | $ | 0 | | |
Common Stock Sold Short | | | (142,654 | ) | | | 0 | | | | 0 | | |
Short Term Investments | | | 0 | | | | 914,508 | | | | 0 | | |
Total | | $ | 12,382,091 | | | $ | 914,508 | | | $ | 0 | | |
| | | Select | | | |
Common Stocks | | $ | 4,440,209 | | | $ | 0 | | | $ | 0 | | |
Short Term Investments | | | 0 | | | | 369,621 | | | | 0 | | |
Total | | $ | 4,440,209 | | | $ | 369,621 | | | $ | 0 | | |
| | | Equity and Income | | | |
Common Stocks | | $ | 13,468,864 | | | $ | 0 | | | $ | 0 | | |
Government and Agency Securities | | | 0 | | | | 1,825,792 | | | | 0 | | |
Corporate Bonds | | | 0 | | | | 592,860 | | | | 0 | | |
Asset Backed Securities | | | 0 | | | | 11,533 | | | | 0 | | |
Convertible Bonds | | | 0 | | | | 841 | | | | 0 | | |
Short Term Investments | | | 0 | | | | 4,634,668 | | | | 0 | | |
Total | | $ | 13,468,864 | | | $ | 7,065,694 | | | $ | 0 | | |
| | | Global | | | |
Common Stocks | | $ | 3,364,918 | | | $ | 0 | | | $ | 0 | | |
Short Term Investments | | | 0 | | | | 46,297 | | | | 0 | | |
Forward Foreign Currency Contracts—Assets | | | 0 | | | | 2,697 | | | | 0 | | |
Forward Foreign Currency Contracts—Liabilities | | | 0 | | | | (1,042 | ) | | | 0 | | |
Total | | $ | 3,364,918 | | | $ | 47,952 | | | $ | 0 | | |
| | | Global Select | | | |
Common Stocks | | $ | 1,688,580 | | | $ | 0 | | | $ | 0 | | |
Short Term Investments | | | 0 | | | | 79,842 | | | | 0 | | |
Forward Foreign Currency Contracts—Assets | | | 0 | | | | 775 | | | | 0 | | |
Total | | $ | 1,688,580 | | | $ | 80,617 | | | $ | 0 | | |
52 THE OAKMARK FUNDS
The Oakmark Funds
Notes to Financial Statements (continued)
(in thousands) | | Quoted Prices
in Active
Markets for
Identical
Assets
(Level 1) | | Other
Significant
Observable
Inputs
(Level 2) | | Significant
Unobservable
Inputs
(Level 3) | |
| | | International | | | |
Common Stocks | | $ | 29,681,117 | | | $ | 0 | | | $ | 0 | | |
Short Term Investments | | | 0 | | | | 1,357,193 | | | | 0 | | |
Forward Foreign Currency Contracts—Assets | | | 0 | | | | 27,851 | | | | 0 | | |
Forward Foreign Currency Contracts—Liabilities | | | 0 | | | | (20,968 | ) | | | 0 | | |
Total | | $ | 29,681,117 | | | $ | 1,364,076 | | | $ | 0 | | |
| | | Int'l Small Cap | | | |
Common Stocks | | $ | 2,669,540 | | | $ | 0 | | | $ | 0 | | |
Short Term Investments | | | 0 | | | | 195,971 | | | | 0 | | |
Forward Foreign Currency Contracts—Assets | | | 0 | | | | 2,262 | | | | 0 | | |
Forward Foreign Currency Contracts—Liabilities | | | 0 | | | | (3,008 | ) | | | 0 | | |
Total | | $ | 2,669,540 | | | $ | 195,225 | | | $ | 0 | | |
Offsetting assets and liabilities
During the current reporting period, the Funds adopted the new disclosure requirements under Accounting Standards Update No. 2011-11 "Disclosures about Offsetting Assets and Liabilities" ("ASU 2011-11"), issued by the Financial Accounting Standards Board. ASU 2011-11 requires entities to disclose gross and net information about instruments and transactions eligible for offset on the Statement of Assets and Liabilities, and disclose instruments and transactions subject to master netting or similar agreements. This disclosure is limited to derivative instruments, repurchase and reverse repurchase agreements, and securities borrowing and lending transactions.
At period end, certain Funds held open forward foreign currency contracts that were subject to a foreign exchange settlement and netting agreement with the same counterparty. The agreement includes provisions for general obligations, representations and certain events of default or termination. The agreement includes provisions for netting arrangements that may reduce credit risk and counterparty risk associated with relevant transactions, in the event a counterparty fails to meet its obligations. The net recognized assets or liabilities related to open forward foreign currency contracts are presented in the Statements of Assets and Liabilities. The gross recognized assets (appreciation) and liabilities (depreciation) by contract are presented in the table included in the Forward foreign currency contracts section of Note 1 to Financial Statements.
At period end, each of the Funds held investments in repurchase agreements. The gross value of these investments and the value of the related collateral are presented in each Fund's Schedule of Investments. The value of the related collateral for each Fund exceeded the value of the repurchase agreements held at period end.
The value of the securities on loan and the value of the related collateral as of period end, if any, are included in the Securities lending section of Note 1 to Financial Statements. The value of the related collateral for each applicable Fund exceeded the value of the securities on loan at period end.
Foreign currency translations
Certain Funds invest in foreign securities, which may involve a number of risk factors and special considerations not present with investments in securities of U.S. corporations. Values of investments and other assets and liabilities denominated in foreign currencies are translated into U.S. dollars at current exchange rates obtained by a recognized bank, dealer, or independent pricing service on the day of valuation. Purchases and sales of investments and dividend and interest income are converted at the prevailing rate of exchange on the respective dates of such transactions.
The Funds do not isolate that portion of the results of operations resulting from changes in foreign exchange rates on investments from the fluctuations arising from changes in market prices of securities held. Such fluctuations are included in net realized gain (loss) on investments and net change in unrealized appreciation (depreciation) on investments in the Statements of Operations. Net realized gains and losses on foreign currency transactions arising from the sale of foreign currencies, currency gains or losses realized between the trade and settlement dates on securities transactions and the difference between the amounts of dividends, interest and tax reclaims recorded and the U.S. dollar equivalent of the amounts actually received or paid are included in net realized gain (loss) on foreign currency transactions in the Statements of Operations. Unrealized gains and losses arising from changes in the fair value of assets and liabilities, other than investments in securities, resulting from changes in exchange rates are included in net change in unrealized appreciation (depreciation) on foreign currency translation in the Statements of Operations.
Forward foreign currency contracts
Forward foreign currency contracts are agreements to exchange one currency for another at a future date and at a specified price. The Funds' transactions in forward foreign currency contracts are limited to transaction and portfolio hedging. The contractual amounts of forward foreign currency contracts do not necessarily represent the amounts potentially subject to risk. The
oakmark.com 53
The Oakmark Funds
Notes to Financial Statements (continued)
measurement of the risks associated with these instruments is meaningful only when all related and offsetting transactions are considered and could exceed the net unrealized value shown in the tables below. Risks arise from the possible inability of counterparties to meet the terms of their contracts and from movements in currency values. Forward foreign currency contracts are valued at the current day's interpolated foreign exchange rates. Unrealized gain or loss on the contracts as measured by the difference between the forward foreign exchange rates at the dates of entry into the contracts and the forward rates at the end of the period is included in the Statements of Assets and Liabilities. Realized gains and losses and the net change in unrealized appreciation (depreciation) on forward foreign currency contracts for the period are included in the Statements of Operations.
At March 31, 2014 Global, Global Select, International, and Int'l Small Cap held forward foreign currency contracts, which are considered derivative instruments, each whose counterparty is State Street Bank and Trust Company ("State Street"), as follows (in thousands):
Global
| | | Local
Contract
Amount | | Settlement
Date | | Valuation at
3/31/14 | | Unrealized
Appreciation/
(Depreciation) | |
| | | Foreign Currency Sold: | |
Australian Dollar | | | 28,600 | | | 09/17/14 | | $ | 26,213 | | | $ | (1,042 | ) | |
Swiss Franc | | | 184,500 | | | 12/17/14 | | | 209,250 | | | | 2,697 | | |
| | | | | | | $ | 235,463 | | | $ | 1,655 | | |
During the period ended March 31, 2014 the proceeds from forward foreign currency contracts opened for Global were $299,387 and the cost to close or settle contracts was $287,586 (in thousands).
Global Select
| | | Local
Contract
Amount | | Settlement
Date | | Valuation at
3/31/14 | | Unrealized
Appreciation/
(Depreciation) | |
| | | Foreign Currency Sold: | |
Swiss Franc | | | 53,000 | | | 12/17/14 | | $ | 60,110 | | | $ | 775 | | |
| | | | | | | $ | 60,110 | | | $ | 775 | | |
During the period ended March 31, 2014 the proceeds from forward foreign currency contracts opened for Global Select were $83,728 and the cost to close or settle contracts was $77,551 (in thousands).
International
| | | Local
Contract
Amount | | Settlement
Date | | Valuation at
3/31/14 | | Unrealized
Appreciation/
(Depreciation) | |
| | | Foreign Currency Bought: | | | |
Swedish Krona | | | 350,000 | | | 06/18/14 | | $ | 54,010 | | | $ | 630 | | |
| | | | | | | $ | 54,010 | | | $ | 630 | | |
| | | Foreign Currency Sold: | | | |
Australian Dollar | | | 473,600 | | | 09/17/14 | | $ | 434,076 | | | $ | (17,261 | ) | |
Swedish Krona | | | 2,100,000 | | | 06/18/14 | | | 324,063 | | | | (3,707 | ) | |
Swedish Krona | | | 442,000 | | | 06/18/14 | | | 68,208 | | | | 322 | | |
Swiss Franc | | | 1,840,000 | | | 12/17/14 | | | 2,086,829 | | | | 26,899 | | |
| | | | | | | $ | 2,913,176 | | | $ | 6,253 | | |
During the period ended March 31, 2014 the proceeds from forward foreign currency contracts opened for International were $3,298,356 and the cost to close or settle contracts was $2,398,430 (in thousands).
54 THE OAKMARK FUNDS
The Oakmark Funds
Notes to Financial Statements (continued)
Int'l Small Cap
| | | Local
Contract
Amount | | Settlement
Date | | Valuation at
3/31/14 | | Unrealized
Appreciation/
(Depreciation) | |
| | | Foreign Currency Bought: | | | |
Swedish Krona | | | 2,550 | | | 06/18/14 | | $ | 394 | | | $ | 5 | | |
| | | | | | | $ | 394 | | | $ | 5 | | |
| | | Foreign Currency Sold: | | | |
Australian Dollar | | | 82,200 | | | 09/17/14 | | $ | 75,340 | | | $ | (2,996 | ) | |
Norwegian Krone | | | 194,200 | | | 06/18/14 | | | 32,334 | | | | 275 | | |
Swedish Krona | | | 7,000 | | | 06/18/14 | | | 1,080 | | | | (12 | ) | |
Swedish Krona | | | 1,780 | | | 06/18/14 | | | 275 | | | | 1 | | |
Swiss Franc | | | 135,500 | | | 12/17/14 | | | 153,677 | | | | 1,981 | | |
| | | | | | | $ | 262,706 | | | $ | (751 | ) | |
During the period ended March 31, 2014 the proceeds from forward foreign currency contracts opened for Int'l Small Cap were $296,495 and the cost to close or settle contracts was $242,747 (in thousands).
Security transactions and investment income
Security transactions are accounted for on the trade date (date the order to buy or sell is executed), and dividend income is recorded on the ex-dividend date, except that certain dividends from foreign securities are recorded as soon as the information becomes available after the ex-dividend date. Interest income and expenses are recorded on an accrual basis. Discount is accreted and premium is amortized on long-term fixed income securities using the yield-to-maturity method. Withholding taxes and tax reclaims on foreign dividends have been provided for in accordance with the Funds' understanding of the applicable country's tax rules and rates. Net realized gains and losses on investments are determined by the specific identification method.
Short sales
Each Fund may sell a security it does not own in anticipation of a decline in the fair value of that security. When a Fund sells a security short, it must borrow the security sold short and deliver it to the broker-dealer through which it made the short sale. A gain, limited to the price at which the Fund sold the security short, or loss, unlimited in size, will be recognized upon the termination of the short sale. At March 31, 2014 Oakmark had an open short sale.
When-issued or delayed-delivery securities
Each Fund may purchase securities on a when-issued or delayed-delivery basis. Although the payment and interest terms of these securities are established at the time a Fund enters into the commitment, the securities may be delivered and paid for a month or more after the date of purchase, when their value may have changed. A Fund makes such commitments only with the intention of actually acquiring the securities, but may sell the securities before the settlement date if the Adviser deems it advisable for investment reasons.
Accounting for options
When a Fund writes an option, the premium received by the Fund is recorded as a liability and is subsequently adjusted to the current fair value of the option written. Premiums received from writing options that expire are recorded by the Fund on the expiration date as realized gains from option transactions. The difference between the premium and the amount paid on effecting a closing purchase transaction, including brokerage commissions, is also treated as a realized gain, or if the premium is less than the amount paid for the closing purchase transaction, as a realized loss. If a call option is exercised, the premium is added to the proceeds from the sale of the underlying security or currency in determining whether the Fund has realized a gain or a loss. If a put option is exercised, the premium reduces the cost basis of the security or currency purchased by the Fund. In writing an option, the Fund bears the market risk of an unfavorable change in the price of the security or currency underlying the written option. Exercise of an option written by the Fund could result in the Fund selling or buying a security or currency at a price different from the current fair value. Options written by the Fund do not give rise to counterparty credit risk, as they obligate the Fund, not its counterparties, to perform.
When a Fund purchases an option, the premium paid by the Fund is recorded as an asset and is subsequently adjusted to the current fair value of the option purchased. Purchasing call options tends to increase the Fund's exposure to the underlying instrument. Purchasing put options tends to decrease the Fund's exposure to the underlying instrument. Premiums paid for purchasing options that expire are treated as realized losses. Premiums paid for purchasing options that are exercised or closed are added to the amounts paid or offset against the proceeds on the underlying security to determine the realized gain or loss. The risks associated with purchasing put and call options are potential loss of the premium paid and, in the instances of OTC derivatives, the failure of the counterparty to honor its obligation under the contract.
oakmark.com 55
The Oakmark Funds
Notes to Financial Statements (continued)
Transactions in written option contracts during the period ended March 31, 2014 for Oakmark and Select are as follows:
Oakmark
| | | Number of Contracts | | Premiums | |
Options outstanding at September 30, 2013 | | | 0 | | | $ | 0 | | |
Options written | | | 200 | | | | 56,419 | | |
Options bought back | | | (200 | ) | | | (56,419 | ) | |
Options outstanding at March 31, 2014 | | | 0 | | | $ | 0 | | |
Select
| | | Number of Contracts | | Premiums | |
Options outstanding at September 30, 2013 | | | 0 | | | $ | 0 | | |
Options written | | | 310 | | | | 87,455 | | |
Options bought back | | | (310 | ) | | | (87,455 | ) | |
Options outstanding at March 31, 2014 | | | 0 | | | $ | 0 | | |
Committed line of credit
The Trust has an unsecured committed line of credit (the "Facility") with State Street in the amount of $500 million. Borrowings under that arrangement bear interest at 1.25% above the greater of the Federal Funds Effective Rate or LIBOR, as defined in the credit agreement. To maintain the Facility, an annualized commitment fee of 0.08% on the unused portion is charged to the Trust. Fees and interest expense, if any, related to the Facility are included in other expenses in the Statements of Operations. There were no borrowings under the Facility during the period ended March 31, 2014.
Expense offset arrangement
State Street serves as custodian of the Funds. State Street's fee may be reduced by credits that are an earnings allowance calculated on the average daily cash balances each Fund maintains with State Street. Credit balances used to reduce the Funds' custodian fees, if any, are reported as a reduction of total expenses in the Statements of Operations. During the period ended March 31, 2014 none of the Funds received an expense offset credit.
Repurchase agreements
Each Fund may invest in repurchase agreements, which are short-term investments whereby the Fund acquires ownership of a debt security and the seller agrees to repurchase the security at a future date at a specified price.
The Funds' custodian receives delivery of the underlying securities collateralizing repurchase agreements. It is the Funds' policy that the value of the collateral be at least equal to 102% of the repurchase price, including interest. Harris Associates L.P. (the "Adviser") is responsible for determining that the value of the collateral is at all times at least equal to 102% of the repurchase price, including interest. Repurchase agreements could involve certain risks in the event of default or insolvency of the counterparty, including possible delays or restrictions upon a Fund's ability to dispose of the underlying securities.
Security lending
Each Fund, except Oakmark, may lend its portfolio securities to broker-dealers and banks. Any such loan must be continuously secured by collateral in cash, cash equivalents or U.S. Treasurys maintained on a current basis in an amount at least equal to the fair value of the securities loaned by the Fund. Collateral is marked to market and monitored daily. The Fund continues to receive the equivalent of the interest or dividends paid by the issuer on the securities loaned and also receives an additional return that may be in the form of a fixed fee or a percentage of the earnings on the collateral. The Fund has the right to call the loan and attempt to obtain the securities loaned at any time on notice of not more than five business days. In the event of bankruptcy or other default of the borrower, the Fund could experience delays in liquidating the loan collateral or recovering the loaned securities and incur expenses related to enforcing its rights. In addition, there could be a decline in the value of the collateral or in the fair value of the securities loaned while the Fund seeks to enforce its rights thereto, and the Fund could experience subnormal levels of income or lack of access to income during that period.
At March 31, 2014 International and Int'l Small Cap had securities on loan with a value of $322,612,323, and $23,309,867 respectively, and held as collateral for the loans U.S. Treasury securities with a value of $350,759,466 and $24,479,766 respectively.
Restricted securities
The following investments, the sales of which are subject to restrictions on resale under federal securities laws, have been valued in good faith according to the securities valuation procedures established by the Board of Trustees (as stated in the Security valuation section) since their acquisition dates.
56 THE OAKMARK FUNDS
The Oakmark Funds
Notes to Financial Statements (continued)
At March 31, 2014 Equity and Income and International held the following restricted securities:
Equity and Income
Par Value
(000) | | Security
Name | | Acquisition
Date | | Carrying
Value | | Original
Cost | | Value
(000) | | Percentage of
Net Assets | |
$ | 2,925 | | | Activision Blizzard, Inc., 144A,
5.625%, due 09/15/21 | | 01/31/14 | | $ | 107.0000 | | | $ | 103.7500 | | | $ | 3,130 | | | | 0.02 | % | |
| | 1,950 | | | Activision Blizzard, Inc., 144A,
5.625%, due 09/15/21 | | 01/31/14 | | | 107.0000 | | | | 103.7500 | | | | 2,086 | | | | 0.01 | % | |
| | 1,000 | | | Activision Blizzard, Inc., 144A,
5.625%, due 09/15/21 | | 09/12/13 | | | 107.0000 | | | | 100.0000 | | | | 1,070 | | | | 0.01 | % | |
| | 2,505 | | | Activision Blizzard, Inc., 144A,
6.125%, due 09/15/23 | | 02/06/14 | | | 108.8750 | | | | 104.7500 | | | | 2,727 | | | | 0.01 | % | |
| | 2,000 | | | Activision Blizzard, Inc., 144A,
6.125%, due 09/15/23 | | 09/17/13 | | | 108.8750 | | | | 101.6250 | | | | 2,178 | | | | 0.01 | % | |
| | 1,000 | | | Activision Blizzard, Inc., 144A,
6.125%, due 09/15/23 | | 09/12/13 | | | 108.8750 | | | | 100.0000 | | | | 1,089 | | | | 0.01 | % | |
| | 40,000 | | | BMW US Capital LLC, 144A,
0.11%, due 06/09/14 | | 03/14/14 | | | 99.9650 | | | | 99.9734 | | | | 39,986 | | | | 0.20 | % | |
| | 40,000 | | | BMW US Capital LLC, 144A,
0.11%, due 06/17/14 | | 03/14/14 | | | 99.9593 | | | | 99.9710 | | | | 39,984 | | | | 0.20 | % | |
| | 35,000 | | | BMW US Capital LLC, 144A,
0.11%, due 06/04/14 | | 03/12/14 | | | 99.9684 | | | | 99.9743 | | | | 34,989 | | | | 0.17 | % | |
| | 35,000 | | | BMW US Capital LLC, 144A,
0.10%, due 06/11/14 | | 03/13/14 | | | 99.9636 | | | | 99.9750 | | | | 34,987 | | | | 0.17 | % | |
| | 30,000 | | | BMW US Capital LLC, 144A,
0.10%, due 04/11/14 | | 02/11/14 | | | 99.9972 | | | | 99.9836 | | | | 29,999 | | | | 0.15 | % | |
| | 30,000 | | | BMW US Capital LLC, 144A,
0.11%, due 06/02/14 | | 03/14/14 | | | 99.9697 | | | | 99.9756 | | | | 29,991 | | | | 0.15 | % | |
| | 25,000 | | | BMW US Capital LLC, 144A,
0.09%, due 04/10/14 | | 02/20/14 | | | 99.9978 | | | | 99.9878 | | | | 24,999 | | | | 0.12 | % | |
| | 25,000 | | | BMW US Capital LLC, 144A,
0.11%, due 04/15/14 | | 01/21/14 | | | 99.9957 | | | | 99.9743 | | | | 24,999 | | | | 0.12 | % | |
| | 25,000 | | | BMW US Capital LLC, 144A,
0.11%, due 04/16/14 | | 01/21/14 | | | 99.9954 | | | | 99.9740 | | | | 24,999 | | | | 0.12 | % | |
| | 25,000 | | | BMW US Capital LLC, 144A,
0.10%, due 05/08/14 | | 02/25/14 | | | 99.9897 | | | | 99.9800 | | | | 24,998 | | | | 0.12 | % | |
| | 23,000 | | | BMW US Capital LLC, 144A,
0.11%, due 06/10/14 | | 03/14/14 | | | 99.9643 | | | | 99.9731 | | | | 22,992 | | | | 0.11 | % | |
| | 20,000 | | | BMW US Capital LLC, 144A,
0.10%, due 04/11/14 | | 02/11/14 | | | 99.9972 | | | | 99.9836 | | | | 19,999 | | | | 0.10 | % | |
| | 20,000 | | | BMW US Capital LLC, 144A,
0.10%, due 04/14/14 | | 02/11/14 | | | 99.9964 | | | | 99.9828 | | | | 19,999 | | | | 0.10 | % | |
| | 20,000 | | | BMW US Capital LLC, 144A,
0.10%, due 04/15/15 | | 02/11/14 | | | 99.9961 | | | | 99.9825 | | | | 19,999 | | | | 0.10 | % | |
| | 20,000 | | | BMW US Capital LLC, 144A,
0.11%, due 05/14/14 | | 02/26/14 | | | 99.9869 | | | | 99.9765 | | | | 19,997 | | | | 0.10 | % | |
| | 17,500 | | | BMW US Capital LLC, 144A,
0.11%, due 06/10/14 | | 03/11/14 | | | 99.9643 | | | | 99.9722 | | | | 17,494 | | | | 0.09 | % | |
| | 15,000 | | | BMW US Capital LLC, 144A,
0.11%, due 04/14/14 | | 01/31/14 | | | 99.9960 | | | | 99.9777 | | | | 14,999 | | | | 0.07 | % | |
| | 13,000 | | | BMW US Capital LLC, 144A,
0.11%, due 05/22/14 | | 02/28/14 | | | 99.9844 | | | | 99.9746 | | | | 12,998 | | | | 0.06 | % | |
| | 12,000 | | | BMW US Capital LLC, 144A,
0.11%, due 05/12/14 | | 02/28/14 | | | 99.9875 | | | | 99.9777 | | | | 11,998 | | | | 0.06 | % | |
| | 10,200 | | | BMW US Capital LLC, 144A,
0.10%, due 06/06/14 | | 03/11/14 | | | 99.9671 | | | | 99.9758 | | | | 10,197 | | | | 0.05 | % | |
| | 50,000 | | | BP Capital Markets PLC, 144A,
0.11%, due 04/14/14 | | 03/17/14 | | | 99.9962 | | | | 99.9918 | | | | 49,998 | | | | 0.24 | % | |
| | 28,000 | | | BP Capital Markets PLC, 144A
0.09%, due 4/14/14 | | 03/24/14 | | | 99.9968 | | | | 99.9948 | | | | 27,999 | | | | 0.14 | % | |
oakmark.com 57
The Oakmark Funds
Notes to Financial Statements (continued)
Par Value
(000) | | Security
Name | | Acquisition
Date | | Carrying
Value | | Original
Cost | | Value
(000) | | Percentage of
Net Assets | |
$ | 11,450 | | | Cabela's Master Credit Card Trust,
144A, 0.705%, due 10/15/19 | | 10/20/11 | | $ | 100.7239 | | | $ | 100.0000 | | | $ | 11,533 | | | | 0.06 | % | |
| | 30,800 | | | Chevron Corp., 144A,
0.07%, due 04/01/2014 | | 02/12/14 | | | 100.0000 | | | | 99.9907 | | | | 30,800 | | | | 0.15 | % | |
| | 250 | | | CNO Financial Group, Inc., 144A,
6.375%, due 10/01/20 | | 09/20/12 | | | 106.5000 | | | | 100.0000 | | | | 266 | | | | 0.00 | %* | |
| | 30,000 | | | Credit Suisse Group AG, 144A,
7.50%, due 12/31/49 | | 12/04/13 | | | 108.6250 | | | | 100.0000 | | | | 32,587 | | | | 0.16 | % | |
| | 30,000 | | | General Mills Inc., 144A,
0.10%, due 04/03/14 | | 03/27/14 | | | 99.9994 | | | | 99.9981 | | | | 30,000 | | | | 0.15 | % | |
| | 25,000 | | | General Mills Inc., 144A,
0.10%, due 04/01/14 | | 03/25/14 | | | 100.0000 | | | | 99.9981 | | | | 25,000 | | | | 0.12 | % | |
| | 25,000 | | | General Mills Inc., 144A,
0.10%, due 04/02/14 | | 03/26/14 | | | 99.9997 | | | | 99.9981 | | | | 25,000 | | | | 0.12 | % | |
| | 20,000 | | | General Mills Inc., 144A,
0.10%, due 04/01/14 | | 03/25/14 | | | 100.0000 | | | | 99.9981 | | | | 20,000 | | | | 0.10 | % | |
| | 20,000 | | | General Mills Inc., 144A,
0.10%, due 04/03/14 | | 03/27/14 | | | 99.9994 | | | | 99.9981 | | | | 20,000 | | | | 0.10 | % | |
| | 15,000 | | | General Mills Inc., 144A,
0.10%, due 04/04/14 | | 03/28/14 | | | 99.9992 | | | | 99.9981 | | | | 15,000 | | | | 0.07 | % | |
| | 34,400 | | | General Motors Co., 144A,
4.875%, due 10/02/23 | | 09/24/13 | | | 102.5000 | | | | 100.0000 | | | | 35,260 | | | | 0.17 | % | |
| | 5,000 | | | General Motors Co., 144A,
4.875%, due 10/02/23 | | 09/25/13 | | | 102.5000 | | | | 99.0000 | | | | 5,125 | | | | 0.03 | % | |
| | 2,000 | | | General Motors Co., 144A,
4.875%, due 10/02/23 | | 09/30/13 | | | 102.5000 | | | | 97.5000 | | | | 2,050 | | | | 0.01 | % | |
| | 29,525 | | | General Motors Co., 144A,
3.50%, due 10/02/18 | | 09/24/13 | | | 101.8750 | | | | 100.0000 | | | | 30,079 | | | | 0.15 | % | |
| | 10,000 | | | GLP Capital, LP / GLP Financing II, Inc.,
144A, 5.375%, due 11/01/23 | | 10/23/13 | | | 102.7500 | | | | 100.0000 | | | | 10,275 | | | | 0.05 | % | |
| | 2,000 | | | GLP Capital, LP / GLP Financing II, Inc.,
144A, 5.375%, due 11/01/23 | | 11/26/13 | | | 102.7500 | | | | 98.2500 | | | | 2,055 | | | | 0.01 | % | |
| | 10,000 | | | GLP Capital, LP / GLP Financing II, Inc.,
144A 4.875%, due 11/01/20 | | 10/23/13 | | | 102.6250 | | | | 100.0000 | | | | 10,262 | | | | 0.05 | % | |
| | 5,000 | | | GLP Capital, LP / GLP Financing II, Inc.,
144A, 4.375%, due 11/01/18 | | 10/23/13 | | | 102.6250 | | | | 100.0000 | | | | 5,131 | | | | 0.02 | % | |
| | 10,000 | | | Howard Hughes Corp., 144A,
6.875%, due 10/01/21 | | 09/27/13 | | | 108.0000 | | | | 100.0000 | | | | 10,800 | | | | 0.05 | % | |
| | 25,000 | | | J.P. Morgan Securities LLC, 144A,
0.30%, due 06/19/14 | | 12/19/13 | | | 99.9578 | | | | 99.8492 | | | | 24,989 | | | | 0.12 | % | |
| | 5,000 | | | J.P. Morgan Securities LLC, 144A,
0.18%, 05/27/14 | | 12/27/13 | | | 99.9720 | | | | 99.9245 | | | | 4,999 | | | | 0.02 | % | |
| | 50,000 | | | Kellogg Co., 144A,
0.20%, due 05/23/14 | | 03/07/14 | | | 99.9711 | | | | 99.9589 | | | | 49,986 | | | | 0.24 | % | |
| | 35,000 | | | Kellogg Co., 144A,
0.20%, due 06/05/14 | | 03/12/14 | | | 99.9494 | | | | 99.9528 | | | | 34,982 | | | | 0.17 | % | |
| | 25,000 | | | Kellogg Co., 144A,
0.20%, due 05/28/14 | | 03/11/14 | | | 99.9683 | | | | 99.9572 | | | | 24,992 | | | | 0.12 | % | |
| | 17,000 | | | Kellogg Co., 144A,
0.13%, due 04/03/14 | | 03/24/14 | | | 99.9993 | | | | 99.9964 | | | | 17,000 | | | | 0.08 | % | |
| | 17,000 | | | Kellogg Co., 144A,
0.20% due 05/23/14 | | 03/10/02 | | | 99.9711 | | | | 99.9589 | | | | 16,995 | | | | 0.08 | % | |
| | 10,300 | | | Kellogg Co., 144A,
0.20%, due 05/23/14 | | 03/19/14 | | | 99.9711 | | | | 99.9639 | | | | 10,297 | | | | 0.05 | % | |
| | 9,616 | | | Kellogg Co., 144A,
0.15% due 04/03/14 | | 03/19/14 | | | 99.9992 | | | | 99.9938 | | | | 9,616 | | | | 0.05 | % | |
| | 9,605 | | | Live Nation Entertainment, Inc., 144A,
7.000%, due 09/01/20 | | 08/15/12 | | | 109.3750 | | | | 100.0000 | | | | 10,505 | | | | 0.05 | % | |
| | 59,000 | | | MetLife, Inc., 144A,
0.12%, due 05/19/14 | | 03/03/14 | | | 99.9840 | | | | 99.9743 | | | | 58,991 | | | | 0.29 | % | |
58 THE OAKMARK FUNDS
The Oakmark Funds
Notes to Financial Statements (continued)
Par Value
(000) | | Security
Name | | Acquisition
Date | | Carrying
Value | | Original
Cost | | Value
(000) | | Percentage of
Net Assets | |
$ | 50,000 | | | MetLife, Inc., 144A,
0.12%, due 04/07/14 | | 01/29/14 | | $ | 99.9980 | | | $ | 99.9773 | | | $ | 49,999 | | | | 0.24 | % | |
| | 50,000 | | | MetLife, Inc., 144A,
0.10%, due 04/23/14 | | 03/18/14 | | | 99.9939 | | | | 99.9900 | | | | 49,997 | | | | 0.24 | % | |
| | 50,000 | | | MetLife, Inc., 144A,
0.12%, due 05/28/14 | | 03/19/14 | | | 99.9810 | | | | 99.9767 | | | | 49,991 | | | | 0.24 | % | |
| | 27,000 | | | MetLife, Inc., 144A,
0.14%, due 06/18/14 | | 03/03/14 | | | 99.9636 | | | | 99.9584 | | | | 26,990 | | | | 0.13 | % | |
| | 25,000 | | | MetLife, Inc., 144A,
0.11%, due 04/08/14 | | 01/24/14 | | | 99.9979 | | | | 99.9774 | | | | 24,999 | | | | 0.12 | % | |
| | 25,000 | | | MetLife, Inc., 144A,
0.11%, due 04/08/14 | | 01/30/14 | | | 99.9979 | | | | 99.9792 | | | | 24,999 | | | | 0.12 | % | |
| | 25,000 | | | MetLife, Inc., 144A,
0.11%, due 04/09/14 | | 01/30/14 | | | 99.9976 | | | | 99.9789 | | | | 24,999 | | | | 0.12 | % | |
| | 25,000 | | | MetLife, Inc., 144A,
0.11%, due 04/29/14 | | 03/10/14 | | | 99.9914 | | | | 99.9847 | | | | 24,998 | | | | 0.12 | % | |
| | 25,000 | | | MetLife, Inc., 144A,
0.11%, due 05/07/14 | | 03/25/14 | | | 99.9890 | | | | 99.9869 | | | | 24,997 | | | | 0.12 | % | |
| | 25,000 | | | MetLife, Inc., 144A,
0.11%, due 05/27/14 | | 03/24/14 | | | 99.9829 | | | | 99.9804 | | | | 24,996 | | | | 0.12 | % | |
| | 25,000 | | | MetLife, Inc., 144A,
0.11%, due 05/27/14 | | 03/26/14 | | | 99.9829 | | | | 99.9811 | | | | 24,996 | | | | 0.12 | % | |
| | 23,000 | | | MetLife, Inc., 144A,
0.11%, due 05/07/14 | | 03/20/14 | | | 99.9890 | | | | 99.9853 | | | | 22,998 | | | | 0.11 | % | |
| | 20,000 | | | MetLife, Inc., 144A,
0.12%, due 06/03/14 | | 03/19/14 | | | 99.9714 | | | | 99.9747 | | | | 19,994 | | | | 0.10 | % | |
| | 18,000 | | | MetLife, Inc., 144A,
0.15%, due 05/05/14 | | 12/31/13 | | | 99.9858 | | | | 99.9479 | | | | 17,997 | | | | 0.09 | % | |
| | 16,000 | | | MetLife, Inc., 144A,
0.11%, due 05/12/14 | | 03/03/14 | | | 99.9875 | | | | 99.9786 | | | | 15,998 | | | | 0.08 | % | |
| | 10,000 | | | MetLife, Inc., 144A,
0.12% due 04/07/14 | | 01/21/14 | | | 99.9980 | | | | 99.9747 | | | | 10,000 | | | | 0.05 | % | |
| | 10,000 | | | Penn National Gaming, Inc., 144A,
5.875%, due 11/01/21 | | 10/21/13 | | | 98.2500 | | | | 100.0000 | | | | 9,825 | | | | 0.05 | % | |
| | 2,455 | | | Penn National Gaming, Inc., 144A,
5.875%, due 11/01/21 | | 02/25/14 | | | 98.2500 | | | | 97.7500 | | | | 2,412 | | | | 0.01 | % | |
| | 2,445 | | | Penn National Gaming, Inc., 144A,
5.875%, due 11/01/21 | | 02/24/14 | | | 98.2500 | | | | 97.7500 | | | | 2,402 | | | | 0.01 | % | |
| | 2,000 | | | Penn National Gaming, Inc., 144A,
5.875%, due 11/01/21 | | 11/08/13 | | | 98.2500 | | | | 99.0000 | | | | 1,965 | | | | 0.01 | % | |
| | 1,595 | | | Penn National Gaming, Inc., 144A,
5.875%, due 11/01/21 | | 02/28/14 | | | 98.2500 | | | | 97.7500 | | | | 1,567 | | | | 0.01 | % | |
| | 950 | | | Penn National Gaming, Inc., 144A,
5.875%, due 11/01/21 | | 02/26/14 | | | 98.2500 | | | | 97.7500 | | | | 934 | | | | 0.00 | %* | |
| | 555 | | | Penn National Gaming, Inc., 144A,
5.875%, due 11/01/21 | | 02/06/14 | | | 98.2500 | | | | 96.0000 | | | | 545 | | | | 0.00 | %* | |
| | 50,000 | | | Philip Morris International, Inc., 144A,
0.13%, due 05/01/14 | | 02/10/14 | | | 99.9892 | | | | 99.9711 | | | | 49,995 | | | | 0.24 | % | |
| | 27,000 | | | Philip Morris International, Inc., 144A,
0.10% due 05/15/14 | | 02/18/14 | | | 99.9878 | | | | 99.9761 | | | | 26,997 | | | | 0.13 | % | |
| | 25,000 | | | Philip Morris International, Inc.,
144A, 0.13%, due 04/17/14 | | 01/22/14 | | | 99.9942 | | | | 99.9693 | | | | 24,999 | | | | 0.12 | % | |
| | 25,000 | | | Philip Morris International, Inc., 144A,
0.13%, due 04/21/14 | | 01/22/14 | | | 99.9928 | | | | 99.9679 | | | | 24,998 | | | | 0.12 | % | |
| | 25,000 | | | Philip Morris International, Inc., 144A,
0.13% due 04/22/14 | | 01/22/14 | | | 99.9924 | | | | 99.9675 | | | | 24,998 | | | | 0.12 | % | |
| | 25,000 | | | Philip Morris International, Inc., 144A,
0.13%, due 04/24/14 | | 02/04/14 | | | 99.9917 | | | | 99.9715 | | | | 24,998 | | | | 0.12 | % | |
| | 25,000 | | | Philip Morris International, Inc., 144A,
0.13%, due 04/25/14 | | 02/14/14 | | | 99.9913 | | | | 99.9747 | | | | 24,998 | | | | 0.12 | % | |
oakmark.com 59
The Oakmark Funds
Notes to Financial Statements (continued)
Par Value
(000) | | Security
Name | | Acquisition
Date | | Carrying
Value | | Original
Cost | | Value
(000) | | Percentage of
Net Assets | |
$ | 25,000 | | | Philip Morris International, Inc., 144A,
0.13%, due 04/30/14 | | 02/04/14 | | $ | 99.9895 | | | $ | 99.9693 | | | $ | 24,997 | | | | 0.12 | % | |
| | 22,900 | | | Philip Morris International, Inc., 144A,
0.14%, due 04/17/14 | | 01/31/14 | | | 99.9938 | | | | 99.9704 | | | | 22,899 | | | | 0.11 | % | |
| | 1,000 | | | Post Holdings, Inc., 144A,
6.75%, due 12/01/12 | | 03/12/14 | | | 105.8750 | | | | 105.7500 | | | | 1,059 | | | | 0.01 | % | |
| | 2,000 | | | Quiksilver, Inc. / QS Wholesale, Inc.,
144A, 7.875%, due 08/01/18 | | 07/11/13 | | | 108.7500 | | | | 99.4830 | | | | 2,175 | | | | 0.01 | % | |
| | 6,000 | | | Scotiabank Peru SA, 144A,
4.50%, due 12/13/27 | | 12/06/12 | | | 91.5000 | | | | 100.0000 | | | | 5,490 | | | | 0.03 | % | |
| | 2,725 | | | Serta Simmons Holdings LLC, 144A,
8.125%, due 10/01/20 | | 09/27/12 | | | 109.8750 | | | | 99.8750 | | | | 2,994 | | | | 0.01 | % | |
| | 2,265 | | | Serta Simmons Holdings LLC, 144A,
8.125%, due 10/01/20 | | 09/26/12 | | | 109.8750 | | | | 99.0000 | | | | 2,489 | | | | 0.01 | % | |
| | 6,820 | | | Six Flags Entertainment Corp., 144A,
5.25%, due 01/15/21 | | 12/11/12 | | | 100.7500 | | | | 100.0000 | | | | 6,871 | | | | 0.03 | % | |
| | 3,150 | | | Six Flags Entertainment Corp., 144A,
5.25%, due 01/15/21 | | 12/11/12 | | | 100.7500 | | | | 101.0000 | | | | 3,174 | | | | 0.02 | % | |
| | 25,000 | | | Wellpoint, Inc., 144A
0.25%, due 04/04/14 | | 01/06/14 | | | 99.9979 | | | | 99.9389 | | | | 24,999 | | | | 0.12 | % | |
| | 25,000 | | | Wellpoint, Inc., 144A,
0.18%, due 05/06/14 | | 03/13/14 | | | 99.9825 | | | | 99.9730 | | | | 24,996 | | | | 0.12 | % | |
| | 7,000 | | | The William Carter Co., 144A,
5.25%, due 08/15/21 | | 08/15/13 | | | 102.8750 | | | | 101.0000 | | | | 7,201 | | | | 0.03 | % | |
| | 7,000 | | | The William Carter Co., 144A,
5.25%, due 08/15/21 | | 09/10/13 | | | 102.8750 | | | | 100.2500 | | | | 7,201 | | | | 0.03 | % | |
| | 5,502 | | | The William Carter Co., 144A,
5.25%, due 08/15/21 | | 08/14/13 | | | 102.8750 | | | | 101.2500 | | | | 5,660 | | | | 0.03 | % | |
| | 5,000 | | | The William Carter Co., 144A,
5.25%, due 08/15/21 | | 08/13/13 | | | 102.8750 | | | | 101.2500 | | | | 5,144 | | | | 0.02 | % | |
| | 2,000 | | | The William Carter Co., 144A,
5.25%, due 08/15/21 | | 08/12/13 | | | 102.8750 | | | | 101.3750 | | | | 2,058 | | | | 0.01 | % | |
| | 1,400 | | | The William Carter Co., 144A,
5.25%, due 08/15/21 | | 08/26/13 | | | 102.8750 | | | | 100.5000 | | | | 1,440 | | | | 0.01 | % | |
| | 100 | | | The William Carter Co., 144A,
5.25%, due 08/15/21 | | 09/10/13 | | | 102.8750 | | | | 100.0000 | | | | 103 | | | | 0.00 | %* | |
| | | | | | | | | | | $ | 1,966,986 | | | | 9.55 | % | |
International
Par Value
(000) | | Security
Name | | Acquisition
Date | | Carrying
Value | | Original
Cost | | Value
(000) | | Percentage of
Net Assets | |
$ | 100 | | | J.P. Morgan Securities LLC, 144A,
0.28%, due 06/26/14 | | 12/26/13 | | $ | 99.9524 | | | $ | 99.8592 | | | $ | 99,952 | | | | 0.32 | % | |
| | 50 | | | J.P. Morgan Securities LLC, 144A,
0.30%, due 06/19/14 | | 12/19/13 | | | 99.9578 | | | | 99.8492 | | | | 49,979 | | | | 0.16 | % | |
| | 50 | | | J.P. Morgan Securities LLC, 144A,
0.33%, due 07/17/14 | | 12/19/13 | | | 99.9328 | | | | 99.8142 | | | | 49,967 | | | | 0.16 | % | |
| | | | | | | | | | | $ | 199,898 | | | | 0.64 | % | |
* Amount rounds to less than 0.01%
Federal income taxes
It is each Fund's policy to comply with the requirements of the Internal Revenue Code applicable to regulated investment companies and to distribute substantially all of its net taxable income, including any net realized gains on investments, to its shareholders. Therefore, no federal income tax provision is required. There is no material liability for unrecognized tax benefits in the accompanying financial statements. Generally, each of the tax years in the four-year period ended September 30, 2013 remains subject to examination by taxing authorities.
60 THE OAKMARK FUNDS
The Oakmark Funds
Notes to Financial Statements (continued)
2. TRANSACTIONS WITH AFFILIATES
Each Fund has an investment advisory agreement with the Adviser. For management services and facilities furnished, the Adviser receives from each Fund a monthly fee based on that Fund's net assets at the end of the preceding month. Annual fee rates are as follows:
Fund | | Advisory Fees | |
Oakmark | | 1.00% up to $2 billion;
0.90% on the next $1 billion;
0.80% on the next $2 billion;
0.75% on the next $2.5 billion;
0.675% on the next $2.5 billion;
0.625% on the next $2.5 billion; and
0.620% over $12.5 billion | |
Select | | 1.00% up to $1 billion;
0.95% on the next $500 million;
0.90% on the next $500 million;
0.85% on the next $500 million;
0.80% on the next $2.5 billion;
0.75% on the next $5 billion; and
0.725% over $10 billion | |
Equity and Income | | 0.75% up to $5 billion;
0.70% on the next $2.5 billion;
0.675% on the next $2.5 billion;
0.65% on the next $2.5 billion;
0.60% on the next $3.5 billion;
0.585% on the next $5 billion;
0.5775% on the next $7 billion; and
0.5725% over $28 billion | |
Fund | | Advisory Fees | |
Global | | 1.00% up to $2 billion;
0.95% on the next $2 billion;
0.90% on the next $4 billion; and
0.875% over $8 billion | |
Global Select | | 1.00% up to $2 billion;
0.95% on the next $1 billion;
0.875% on the next $4 billion; and
0.85% over $7 billion | |
International | | 1.00% up to $2 billion;
0.95% on the next $1 billion;
0.85% on the next $2 billion;
0.825% on the next $2.5 billion;
0.815% on the next $3.5 billion;
0.805% on the next $5.5 billion;
0.80% on the next $6.5 billion; and
0.795% over $23 billion | |
Int'l Small Cap | | 1.25% up to $500 million;
1.10% on the next $1 billion;
1.05% on the next $2 billion;
1.025% on the next $1.5 billion; and
1.00% over $5 billion | |
The Adviser is contractually obligated through January 31, 2015 to reimburse each Fund Class to the extent, but only to the extent, that its annualized expenses (excluding taxes, interest, all commissions and other normal charges incident to the purchase and sale of portfolio securities, and extraordinary charges such as litigation costs, but including fees paid to the Adviser) exceed the percent set forth below of average daily net assets of each Fund Class.
Fund | | Class I | | Class II | |
Oakmark | | | 1.50 | % | | | 1.75 | % | |
Select | | | 1.50 | | | | 1.75 | | |
Equity and Income | | | 1.00 | | | | 1.25 | | |
Global | | | 1.75 | | | | 2.00 | | |
Global Select | | | 1.75 | | | | 2.00 | | |
International | | | 2.00 | | | | 2.25 | | |
Int'l Small Cap | | | 2.00 | | | | 2.25 | | |
The Adviser is entitled to recoup from any Fund Class, in any fiscal year through September 30, 2018, amounts reimbursed to that Fund Class, except to the extent that the Fund Class already has paid such recoupment to the Adviser or such recoupment would cause the annual ordinary operating expenses of a Fund Class for that fiscal year to exceed the applicable limit stated above. As of March 31, 2014 there were no amounts subject to recoupment.
The Adviser and the Funds have entered into agreements with financial intermediaries to provide recordkeeping, processing, shareholder communications and other services to customers of the intermediaries and have agreed to compensate the intermediaries for providing those services. Certain of those services would be provided by the Funds if the shares of those customers were registered directly with the Funds' transfer agent. Accordingly, the Funds pay a portion of the intermediary fees pursuant to an agreement with the Adviser that calls for each Fund to pay a portion of the intermediary fees attributable to shares of the Fund held by the intermediary (which generally are a percentage of value of the shares held) not exceeding the lesser of 75% of the fees charged by the intermediary or what the Fund would have paid its transfer agent had each customer's shares been registered directly with the transfer agent instead of held through the intermediary. The Adviser pays the remainder of the fees. The fees incurred by the Funds are reflected as other shareholder servicing fees in the Statements of Operations.
The Independent Trustees of the Trust may participate in the Trust's Deferred Compensation Plan for Independent Trustees. Participants in the plan may elect to defer all or a portion of their compensation. Amounts deferred are retained by the Trust and represent an unfunded obligation of the Trust. The value of a participant's deferral account is determined by reference to the change in value of Class I shares of one or more of the Funds or a money market fund as specified by the participant. Benefits would be payable after a stated number of years or retirement from the Board of Trustees. The accrued obligations of the Funds
oakmark.com 61
The Oakmark Funds
Notes to Financial Statements (continued)
under the plan are reflected as deferred Trustee compensation in the Statements of Assets and Liabilities. The change in the accrued obligations for the period is included in Trustees fees in the Statements of Operations. The Trust pays the compensation of the Trustees other than those affiliated with the Adviser and all expenses incurred in connection with their services to the Trust. The Trust does not provide any pension or retirement benefits to its Trustees.
The Funds reimburse the Adviser for a portion of the compensation paid to the Funds' Chief Compliance Officer ("CCO"). The CCO expenses incurred by the Funds are included in other expenses in the Statements of Operations.
3. FEDERAL INCOME TAXES
At March 31, 2014 the cost of investments for federal income tax purposes and related composition of unrealized gains and losses for each Fund were as follows (in thousands):
Fund | | Cost of Investments
for Federal Income
Tax Purposes | | Gross Unrealized
Appreciation | | Gross Unrealized
(Depreciation) | | Net Unrealized
Appreciation
(Depreciation) | |
Oakmark | | $ | 8,797,960 | | | $ | 4,510,520 | | | $ | (11,881 | ) | | $ | 4,498,639 | | |
Select | | | 3,064,164 | | | | 1,755,992 | | | | (10,326 | ) | | | 1,745,666 | | |
Equity and Income | | | 15,196,290 | | | | 5,361,287 | | | | (23,019 | ) | | | 5,338,268 | | |
Global | | | 2,647,787 | | | | 781,176 | | | | (17,748 | ) | | | 763,428 | | |
Global Select | | | 1,462,567 | | | | 310,124 | | | | (4,269 | ) | | | 305,855 | | |
International | | | 26,949,136 | | | | 4,369,094 | | | | (279,920 | ) | | | 4,089,174 | | |
Int'l Small Cap | | | 2,488,526 | | | | 468,247 | | | | (91,262 | ) | | | 376,985 | | |
At March 31, 2014 the components of distributable earnings on a tax basis (excluding unrealized appreciation (depreciation)) were as follows (in thousands):
| | | Undistributed
Ordinary Income | | Undistributed Long-
Term Gain | | Total Distributable
Earnings | |
Oakmark | | $ | 21,029 | | | $ | 221,867 | | | $ | 242,896 | | |
Select | | | 0 | | | | 393,222 | | | | 393,222 | | |
Equity and Income | | | 68,759 | | | | 1,103,831 | | | | 1,172,590 | | |
Global | | | 4,786 | | | | 59,978 | | | | 64,764 | | |
Global Select | | | 8,823 | | | | 12,323 | | | | 21,146 | | |
International | | | 304,516 | | | | 655,960 | | | | 960,476 | | |
Int'l Small Cap | | | 1,606 | | | | 80,734 | | | | 82,340 | | |
During the six-month period ended March 31, 2014 and the year ended September 30, 2013 the tax character of distributions paid was as follows (in thousands):
| | | Period Ended
March 31, 2014 | | Year Ended
September 30, 2013 | |
Fund | | Distributions Paid
from Ordinary
Income | | Distributions Paid
from Long-Term
Capital Gain | | Distributions Paid
from Ordinary
Income | | Distributions Paid
from Long-Term
Capital Gain | |
Oakmark | | $ | 73,945 | | | $ | 462,307 | | | $ | 54,952 | | | $ | 219,332 | | |
Select | | | 2,388 | | | | 226,710 | | | | 2,753 | | | | 289,293 | | |
Equity and Income | | | 92,503 | | | | 1,482,358 | | | | 171,904 | | | | 462,042 | | |
Global | | | 78,123 | | | | 56,786 | | | | 33,539 | | | | 0 | | |
Global Select | | | 11,545 | | | | 22,884 | | | | 7,715 | | | | 4,628 | | |
International | | | 449,374 | | | | 303,101 | | | | 223,778 | | | | 0 | | |
Int'l Small Cap | | | 77,591 | | | | 0 | | | | 24,484 | | | | 0 | | |
On March 31, 2014 the Funds had temporary book/tax differences in undistributed earnings that were primarily attributable to trustee deferred compensation expenses, passive foreign investment companies, foreign currency contracts and deferrals of capital losses on wash sales. Temporary differences will reverse over time. The Funds have permanent differences in book/tax undistributed earnings primarily attributable to currency gains and losses, equalization debits, passive foreign investment companies, distribution re-designations, and in-kind transactions gains and losses. Permanent differences have been recorded in their respective component of the Analysis of Net Assets.
62 THE OAKMARK FUNDS
The Oakmark Funds
Notes to Financial Statements (continued)
4. INVESTMENT TRANSACTIONS
For the six-month period ended March 31, 2014 transactions in investment securities (excluding short-term and U.S. Government securities) were as follows (in thousands):
| | | Oakmark | | Select | | Equity and
Income | | Global | | Global
Select | | International | | Int'l
Small Cap | |
Purchases | | $ | 1,575,691 | | | $ | 766,183 | | | $ | 1,349,177 | | | $ | 783,388 | | | $ | 540,581 | | | $ | 10,060,631 | | | $ | 837,933 | | |
Proceeds from sales | | | 429,143 | | | | 797,728 | | | | 3,594,088 | | | | 534,611 | | | | 80,743 | | | | 4,737,921 | | | | 420,496 | | |
Purchases at cost and proceeds from sales (in thousands) of long-term U.S. Government securities for the six-month period ended March 31, 2014 were $103,567 and $135,535, respectively, for Equity and Income.
For the six-month period ended March 31, 2014 the proceeds from in-kind sales including short-term securities (in thousands) were $142,021 for International. The table above excludes such in-kind transactions. Gains and losses on in-kind transactions are not taxable for federal income tax purposes.
5. INVESTMENT IN AFFILIATED ISSUERS
Each of the companies listed below was considered to be an affiliate of a Fund because that Fund owned 5% or more of the company's voting securities during all or part of the six-month period ended March 31, 2014. Purchase and sale transactions and dividend and interest income earned during the period on these securities are set forth below (in thousands):
Schedule of Transactions with Affiliated Issuers
Equity and Income
Affiliates | | Shares Held/
Par Value | | Purchases
(Cost) | | Sales
(Proceeds) | | Dividend
Income | | Interest
Income | | Value
September 30,
2013 | | Value
March 31,
2014 | |
Foot Locker, Inc. | | | 7,711 | | | $ | 0 | | | $ | 0 | | | $ | 3,084 | | | $ | 0 | | | $ | 261,705 | | | $ | 362,253 | | |
Foot Locker, Inc., 8.50%, due 01/15/22 | | | 395 | | | | 458 | | | | 0 | | | | 0 | | | | 15 | | | | 0 | | | | 470 | | |
Lear Corp. | | | 4,424 | | | | 0 | | | | 0 | | | | 1,637 | | | | 0 | | | | 316,601 | | | | 370,349 | | |
TOTALS | | | | $ | 458 | | | $ | 0 | | | $ | 4,721 | | | $ | 15 | | | $ | 578,306 | | | $ | 733,072 | | |
Schedule of Transactions with Affiliated Issuers
International
Affiliates | | Shares Held | | Purchases
(Cost) | | Sales
(Proceeds) | | Dividend
Income | | Value
September 30,
2013 | | Value
March 31,
2014 | |
Meitec Corp. | | | 2,612 | | | $ | 0 | | | $ | 5,268 | | | $ | 1,036 | | | $ | 80,693 | | | $ | 74,142 | | |
Orica, Ltd. | | | 34,085 | | | | 108,841 | | | | 40,041 | | | | 16,083 | | | | 572,490 | | | | 691,641 | | |
Willis Group Holdings PLC | | | 12,722 | | | | 12,458 | | | | 2,638 | | | | 7,397 | | | | 541,829 | | | | 561,409 | | |
TOTALS | | | | $ | 121,299 | | | $ | 47,947 | | | $ | 24,516 | | | $ | 1,195,012 | | | $ | 1,327,192 | | |
oakmark.com 63
The Oakmark Funds
Notes to Financial Statements (continued)
Schedule of Transactions with Affiliated Issuers
Int'l Small Cap
Affiliates | | Shares Held | | Purchases
(Cost) | | Sales
(Proceeds) | | Dividend
Income | | Value
September 30,
2013 | | Value
March 31,
2014 | |
Atea ASA | | | 6,963 | | | $ | 9,829 | | | $ | 0 | | | $ | 4,361 | | | $ | 63,525 | | | $ | 76,461 | | |
gategroup Holding AG (a) | | | 1,640 | | | | 0 | | | | 0 | | | | 0 | | | | 41,984 | | | | 48,235 | | |
Goodman Fielder, Ltd. | | | 100,890 | | | | 5,642 | | | | 0 | | | | 903 | | | | 60,489 | | | | 57,543 | | |
LSL Property Services PLC | | | 7,720 | | | | 12,605 | | | | 0 | | | | 921 | | | | 44,805 | | | | 55,957 | | |
Orbotech, Ltd. (a) | | | 3,155 | | | | 0 | | | | 4,808 | | | | 0 | | | | 41,972 | | | | 48,552 | | |
Saft Groupe SA | | | 1,380 | | | | 1,382 | | | | 0 | | | | 0 | | | | 36,977 | | | | 48,228 | | |
Vitec Group PLC (b) | | | 1,745 | | | | 0 | | | | 5,085 | | | | 0 | | | | 24,417 | | | | 17,778 | | |
TOTALS | | | | $ | 29,458 | | | $ | 9,893 | | | $ | 6,185 | | | $ | 314,169 | | | $ | 352,754 | | |
(a) Non-income producing security.
(b) Due to transactions during the six-month period ended March 31, 2014, the company is no longer an affiliate.
6. SUBSEQUENT EVENTS
Management has evaluated the possibility of subsequent events existing in the Funds' financial statements. Management has determined that there are no material events that would require adjustment or disclosure in the Funds' financial statements through the date of the publication of this report.
64 THE OAKMARK FUNDS
Financial Highlights–Class I
For a share outstanding throughout each period
| | | Six Months Ended
March 31, 2014 | | Year Ended September 30 | |
| | | (Unaudited) | | 2013 | | 2012 | | 2011 | | 2010 | | 2009 | |
Net Asset Value, Beginning of Period | | $ | 59.73 | | | $ | 48.97 | | | $ | 37.87 | | | $ | 38.36 | | | $ | 34.55 | | | $ | 35.31 | | |
Income From Investment Operations: | |
Net Investment Income | | | 0.20 | | | | 0.42 | (a) | | | 0.36 | (a) | | | 0.34 | (a) | | | 0.24 | | | | 0.29 | (a) | |
Net Gain (Loss) on Investments
(both realized and unrealized) | | | 8.09 | | | | 12.22 | | | | 11.09 | | | | (0.58 | ) | | | 3.80 | | | | 0.39 | | |
Total From Investment Operations | | | 8.29 | | | | 12.64 | | | | 11.45 | | | | (0.24 | ) | | | 4.04 | | | | 0.68 | | |
Less Distributions: | |
From Net Investment Income | | | (0.32 | ) | | | (0.38 | ) | | | (0.35 | ) | | | (0.25 | ) | | | (0.23 | ) | | | (0.45 | ) | |
From Capital Gains | | | (2.60 | ) | | | (1.50 | ) | | | 0.00 | | | | 0.00 | | | | 0.00 | | | | (0.99 | ) | |
Total Distributions | | | (2.92 | ) | | | (1.88 | ) | | | (0.35 | ) | | | (0.25 | ) | | | (0.23 | ) | | | (1.44 | ) | |
Redemption Fees | | | 0.00 | | | | 0.00 | | | | 0.00 | (b) | | | 0.00 | (b) | | | 0.00 | (b) | | | 0.00 | (b) | |
Net Asset Value, End of Period | | $ | 65.10 | | | $ | 59.73 | | | $ | 48.97 | | | $ | 37.87 | | | $ | 38.36 | | | $ | 34.55 | | |
Total Return | | | 14.12 | % | | | 26.75 | % | | | 30.43 | % | | | -0.67 | % | | | 11.74 | % | | | 3.38 | % | |
Ratios/Supplemental Data: | |
Net Assets, End of Period ($million) | | $ | 13,218.8 | | | $ | 10,409.0 | | | $ | 6,738.7 | | | $ | 4,512.5 | | | $ | 3,419.3 | | | $ | 3,144.2 | | |
Ratio of Expenses to Average Net Assets | | | 0.89 | %† | | | 0.95 | % | | | 1.03 | % | | | 1.04 | % | | | 1.11 | % | | | 1.23 | % | |
Ratio of Net Investment Income to
Average Net Assets | | | 0.69 | %† | | | 0.78 | % | | | 0.81 | % | | | 0.82 | % | | | 0.65 | % | | | 1.06 | % | |
Portfolio Turnover Rate | | | 4 | % | | | 19 | % | | | 27 | % | | | 18 | % | | | 24 | % | | | 62 | % | |
Financial Highlights–Class II
For a share outstanding throughout each period
| | | Six Months Ended
March 31, 2014 | | Year Ended September 30 | |
| | | (Unaudited) | | 2013 | | 2012 | | 2011 | | 2010 | | 2009 | |
Net Asset Value, Beginning of Period | | $ | 59.58 | | | $ | 48.89 | | | $ | 37.78 | | | $ | 38.32 | | | $ | 34.56 | | | $ | 35.12 | | |
Income From Investment Operations: | |
Net Investment Income | | | 0.09 | | | | 0.27 | (a) | | | 0.24 | (a) | | | 0.19 | (a) | | | 0.13 | | | | 0.24 | (a) | |
Net Gain (Loss) on Investments
(both realized and unrealized) | | | 8.08 | | | | 12.20 | | | | 11.09 | | | | (0.59 | ) | | | 3.79 | | | | 0.45 | | |
Total From Investment Operations | | | 8.17 | | | | 12.47 | | | | 11.33 | | | | (0.40 | ) | | | 3.92 | | | | 0.69 | | |
Less Distributions: | |
From Net Investment Income | | | (0.22 | ) | | | (0.28 | ) | | | (0.22 | ) | | | (0.14 | ) | | | (0.16 | ) | | | (0.26 | ) | |
From Capital Gains | | | (2.60 | ) | | | (1.50 | ) | | | 0.00 | | | | 0.00 | | | | 0.00 | | | | (0.99 | ) | |
Total Distributions | | | (2.82 | ) | | | (1.78 | ) | | | (0.22 | ) | | | (0.14 | ) | | | (0.16 | ) | | | (1.25 | ) | |
Redemption Fees | | | 0.00 | | | | 0.00 | | | | 0.00 | (b) | | | 0.00 | (b) | | | 0.00 | (b) | | | 0.00 | (b) | |
Net Asset Value, End of Period | | $ | 64.93 | | | $ | 59.58 | | | $ | 48.89 | | | $ | 37.78 | | | $ | 38.32 | | | $ | 34.56 | | |
Total Return | | | 13.93 | % | | | 26.41 | % | | | 30.11 | % | | | -1.07 | % | | | 11.37 | % | | | 3.22 | % | |
Ratios/Supplemental Data: | |
Net Assets, End of Period ($million) | | $ | 128.4 | | | $ | 93.8 | | | $ | 36.1 | | | $ | 24.7 | | | $ | 9.0 | | | $ | 8.2 | | |
Ratio of Expenses to Average Net Assets | | | 1.22 | %† | | | 1.23 | % | | | 1.30 | % | | | 1.45 | % | | | 1.42 | % | | | 1.44 | % | |
Ratio of Net Investment Income to
Average Net Assets | | | 0.36 | %† | | | 0.49 | % | | | 0.54 | % | | | 0.44 | % | | | 0.34 | % | | | 0.88 | % | |
Portfolio Turnover Rate | | | 4 | % | | | 19 | % | | | 27 | % | | | 18 | % | | | 24 | % | | | 62 | % | |
† Data has been annualized.
(a) Computed using average shares outstanding throughout the period.
(b) Amount rounds to less than $0.01 per share.
oakmark.com 65
Financial Highlights–Class I
For a share outstanding throughout each period
| | | Six Months Ended
March 31, 2014 | | Year Ended September 30 | |
| | | (Unaudited) | | 2013 | | 2012 | | 2011 | | 2010 | | 2009 | |
Net Asset Value, Beginning of Period | | $ | 37.74 | | | $ | 32.33 | | | $ | 25.50 | | | $ | 25.64 | | | $ | 22.68 | | | $ | 20.34 | | |
Income From Investment Operations: | |
Net Investment Income | | | 0.01 | | | | 0.04 | | | | 0.04 | | | | 0.04 | (a) | | | 0.06 | (a) | | | 0.11 | (a) | |
Net Gain (Loss) on Investments
(both realized and unrealized) | | | 6.42 | | | | 8.40 | | | | 6.85 | | | | (0.12 | ) | | | 2.97 | | | | 2.48 | | |
Total From Investment Operations | | | 6.43 | | | | 8.44 | | | | 6.89 | | | | (0.08 | ) | | | 3.03 | | | | 2.59 | | |
Less Distributions: | |
From Net Investment Income | | | (0.04 | ) | | | (0.03 | ) | | | (0.06 | ) | | | (0.06 | ) | | | (0.07 | ) | | | (0.25 | ) | |
From Capital Gains | | | (2.13 | ) | | | (3.00 | ) | | | 0.00 | | | | 0.00 | | | | 0.00 | | | | 0.00 | | |
Total Distributions | | | (2.17 | ) | | | (3.03 | ) | | | (0.06 | ) | | | (0.06 | ) | | | (0.07 | ) | | | (0.25 | ) | |
Redemption Fees | | | 0.00 | | | | 0.00 | | | | 0.00 | (b) | | | 0.00 | (b) | | | 0.00 | (b) | | | 0.00 | (b) | |
Net Asset Value, End of Period | | $ | 42.00 | | | $ | 37.74 | | | $ | 32.33 | | | $ | 25.50 | | | $ | 25.64 | | | $ | 22.68 | | |
Total Return | | | 17.46 | % | | | 28.40 | % | | | 27.05 | % | | | -0.34 | % | | | 13.39 | % | | | 13.30 | % | |
Ratios/Supplemental Data: | |
Net Assets, End of Period ($million) | | $ | 4,812.4 | | | $ | 3,944.6 | | | $ | 3,029.5 | | | $ | 2,266.7 | | | $ | 2,407.8 | | | $ | 2,265.3 | | |
Ratio of Expenses to Average Net Assets | | | 0.98 | %† | | | 1.01 | % | | | 1.05 | % | | | 1.07 | % | | | 1.08 | % | | | 1.19 | % | |
Ratio of Net Investment Income to
Average Net Assets | | | 0.03 | %† | | | 0.11 | % | | | 0.11 | % | | | 0.15 | % | | | 0.22 | % | | | 0.66 | % | |
Portfolio Turnover Rate | | | 19 | % | | | 24 | % | | | 32 | % | | | 16 | % | | | 25 | % | | | 34 | % | |
Financial Highlights–Class II
For a share outstanding throughout each period
| | | Six Months Ended
March 31, 2014 | | Year Ended September 30 | |
| | | (Unaudited) | | 2013 | | 2012 | | 2011 | | 2010 | | 2009 | |
Net Asset Value, Beginning of Period | | $ | 37.50 | | | $ | 32.21 | | | $ | 25.43 | | | $ | 25.59 | | | $ | 22.70 | | | $ | 20.29 | | |
Income From Investment Operations: | |
Net Investment Income (Loss) | | | (0.06 | ) | | | (0.11 | ) | | | (0.06 | )(a) | | | (0.05 | )(a) | | | (0.02 | )(a) | | | 0.12 | (a) | |
Net Gain (Loss) on Investments
(both realized and unrealized) | | | 6.38 | | | | 8.40 | | | | 6.84 | | | | (0.11 | ) | | | 2.97 | | | | 2.49 | | |
Total From Investment Operations | | | 6.32 | | | | 8.29 | | | | 6.78 | | | | (0.16 | ) | | | 2.95 | | | | 2.61 | | |
Less Distributions: | |
From Net Investment Income | | | 0.00 | | | | 0.00 | | | | 0.00 | | | | 0.00 | | | | (0.06 | ) | | | (0.20 | ) | |
From Capital Gains | | | (2.13 | ) | | | (3.00 | ) | | | 0.00 | | | | 0.00 | | | | 0.00 | | | | 0.00 | | |
Total Distributions | | | (2.13 | ) | | | (3.00 | ) | | | 0.00 | | | | 0.00 | | | | (0.06 | ) | | | (0.20 | ) | |
Redemption Fees | | | 0.00 | | | | 0.00 | | | | 0.00 | (b) | | | 0.00 | (b) | | | 0.00 | (b) | | | 0.00 | (b) | |
Net Asset Value, End of Period | | $ | 41.69 | | | $ | 37.50 | | | $ | 32.21 | | | $ | 25.43 | | | $ | 25.59 | | | $ | 22.70 | | |
Total Return | | | 17.26 | % | | | 27.99 | % | | | 26.66 | % | | | -0.63 | % | | | 12.99 | % | | | 13.34 | % | |
Ratios/Supplemental Data: | |
Net Assets, End of Period ($million) | | $ | 17.3 | | | $ | 15.0 | | | $ | 11.8 | | | $ | 8.0 | | | $ | 8.3 | | | $ | 8.1 | | |
Ratio of Expenses to Average Net Assets | | | 1.28 | %† | | | 1.33 | % | | | 1.36 | % | | | 1.38 | % | | | 1.39 | % | | | 1.28 | % | |
Ratio of Net Investment Income (Loss) to
Average Net Assets | | | (0.27 | )%† | | | (0.21 | )% | | | (0.21 | )% | | | (0.16 | )% | | | (0.08 | )% | | | 0.72 | % | |
Portfolio Turnover Rate | | | 19 | % | | | 24 | % | | | 32 | % | | | 16 | % | | | 25 | % | | | 34 | % | |
† Data has been annualized.
(a) Computed using average shares outstanding throughout the period.
(b) Amount rounds to less than $0.01 per share.
66 THE OAKMARK FUNDS
Oakmark Equity and Income Fund
Financial Highlights–Class I
For a share outstanding throughout each period
| | | Six Months Ended
March 31, 2014 | | Year Ended September 30 | |
| | | (Unaudited) | | 2013 | | 2012 | | 2011 | | 2010 | | 2009 | |
Net Asset Value, Beginning of Period | | $ | 33.06 | | | $ | 29.09 | | | $ | 25.62 | | | $ | 26.03 | | | $ | 24.72 | | | $ | 25.57 | | |
Income From Investment Operations: | |
Net Investment Income | | | 0.10 | | | | 0.28 | | | | 0.25 | | | | 0.26 | | | | 0.27 | (a) | | | 0.35 | (a) | |
Net Gain (Loss) on Investments
(both realized and unrealized) | | | 2.79 | | | | 4.68 | | | | 4.07 | | | | (0.45 | ) | | | 1.33 | | | | (0.24 | ) | |
Total From Investment Operations | | | 2.89 | | | | 4.96 | | | | 4.32 | | | | (0.19 | ) | | | 1.60 | | | | 0.11 | | |
Less Distributions: | |
From Net Investment Income | | | (0.17 | ) | | | (0.27 | ) | | | (0.38 | ) | | | (0.22 | ) | | | (0.29 | ) | | | (0.39 | ) | |
From Capital Gains | | | (2.55 | ) | | | (0.72 | ) | | | (0.47 | ) | | | 0.00 | | | | 0.00 | | | | (0.57 | ) | |
Total Distributions | | | (2.72 | ) | | | (0.99 | ) | | | (0.85 | ) | | | (0.22 | ) | | | (0.29 | ) | | | (0.96 | ) | |
Net Asset Value, End of Period | | $ | 33.23 | | | $ | 33.06 | | | $ | 29.09 | | | $ | 25.62 | | | $ | 26.03 | | | $ | 24.72 | | |
Total Return | | | 9.01 | % | | | 17.63 | % | | | 17.19 | % | | | -0.77 | % | | | 6.52 | % | | | 1.02 | % | |
Ratios/Supplemental Data: | |
Net Assets, End of Period ($million) | | $ | 19,390.3 | | | $ | 18,222.5 | | | $ | 17,889.0 | | | $ | 16,441.0 | | | $ | 16,993.7 | | | $ | 14,418.4 | | |
Ratio of Expenses to Average Net Assets | | | 0.76 | %† | | | 0.77 | % | | | 0.78 | % | | | 0.77 | % | | | 0.79 | % | | | 0.85 | % | |
Ratio of Net Investment Income to
Average Net Assets | | | 0.60 | %† | | | 0.89 | % | | | 0.84 | % | | | 0.93 | % | | | 1.04 | % | | | 1.59 | % | |
Portfolio Turnover Rate | | | 9 | % | | | 25 | %(b) | | | 29 | % | | | 47 | % | | | 91 | % | | | 78 | %(b) | |
Financial Highlights–Class II
For a share outstanding throughout each period
| | | Six Months Ended
March 31, 2014 | | Year Ended September 30 | |
| | | (Unaudited) | | 2013 | | 2012 | | 2011 | | 2010 | | 2009 | |
Net Asset Value, Beginning of Period | | $ | 32.83 | | | $ | 28.90 | | | $ | 25.45 | | | $ | 25.85 | | | $ | 24.57 | | | $ | 25.40 | | |
Income From Investment Operations: | |
Net Investment Income | | | 0.05 | | | | 0.17 | | | | 0.15 | | | | 0.17 | | | | 0.18 | | | | 0.28 | (a) | |
Net Gain (Loss) on Investments
(both realized and unrealized) | | | 2.76 | | | | 4.66 | | | | 4.05 | | | | (0.43 | ) | | | 1.33 | | | | (0.24 | ) | |
Total From Investment Operations | | | 2.81 | | | | 4.83 | | | | 4.20 | | | | (0.26 | ) | | | 1.51 | | | | 0.04 | | |
Less Distributions: | |
From Net Investment Income | | | (0.05 | ) | | | (0.18 | ) | | | (0.28 | ) | | | (0.14 | ) | | | (0.23 | ) | | | (0.30 | ) | |
From Capital Gains | | | (2.55 | ) | | | (0.72 | ) | | | (0.47 | ) | | | 0.00 | | | | 0.00 | | | | (0.57 | ) | |
Total Distributions | | | (2.60 | ) | | | (0.90 | ) | | | (0.75 | ) | | | (0.14 | ) | | | (0.23 | ) | | | (0.87 | ) | |
Net Asset Value, End of Period | | $ | 33.04 | | | $ | 32.83 | | | $ | 28.90 | | | $ | 25.45 | | | $ | 25.85 | | | $ | 24.57 | | |
Total Return | | | 8.82 | % | | | 17.23 | % | | | 16.82 | % | | | -1.04 | % | | | 6.17 | % | | | 0.70 | % | |
Ratios/Supplemental Data: | |
Net Assets, End of Period ($million) | | $ | 1,206.0 | | | $ | 1,211.4 | | | $ | 1,288.0 | | | $ | 1,212.2 | | | $ | 1,270.1 | | | $ | 1,110.4 | | |
Ratio of Expenses to Average Net Assets | | | 1.07 | %† | | | 1.10 | % | | | 1.09 | % | | | 1.09 | % | | | 1.12 | % | | | 1.18 | % | |
Ratio of Net Investment Income to
Average Net Assets | | | 0.28 | %† | | | 0.56 | % | | | 0.53 | % | | | 0.61 | % | | | 0.71 | % | | | 1.26 | % | |
Portfolio Turnover Rate | | | 9 | % | | | 25 | %(b) | | | 29 | % | | | 47 | % | | | 91 | % | | | 78 | %(b) | |
† Data has been annualized.
(a) Computed using average shares outstanding throughout the period.
(b) The ratio excludes in-kind transactions.
oakmark.com 67
Financial Highlights–Class I
For a share outstanding throughout each period
| | | Six Months Ended
March 31, 2014 | | Year Ended September 30 | |
| | | (Unaudited) | | 2013 | | 2012 | | 2011 | | 2010 | | 2009 | |
Net Asset Value, Beginning of Period | | $ | 29.70 | | | $ | 21.63 | | | $ | 18.81 | | | $ | 20.39 | | | $ | 18.94 | | | $ | 19.43 | | |
Income From Investment Operations: | |
Net Investment Income | | | 0.00 | (a)(b) | | | 0.21 | | | | 0.20 | | | | 0.16 | (a) | | | 0.10 | | | | 0.11 | | |
Net Gain (Loss) on Investments
(both realized and unrealized) | | | 2.26 | | | | 8.23 | | | | 2.62 | | | | (1.65 | ) | | | 1.49 | | | | 0.13 | | |
Total From Investment Operations | | | 2.26 | | | | 8.44 | | | | 2.82 | | | | (1.49 | ) | | | 1.59 | | | | 0.24 | | |
Less Distributions: | |
From Net Investment Income | | | (0.75 | ) | | | (0.37 | ) | | | 0.00 | | | | (0.09 | ) | | | (0.14 | ) | | | (0.70 | ) | |
From Capital Gains | | | (0.55 | ) | | | 0.00 | | | | 0.00 | | | | 0.00 | | | | 0.00 | | | | (0.03 | ) | |
Total Distributions | | | (1.30 | ) | | | (0.37 | ) | | | 0.00 | | | | (0.09 | ) | | | (0.14 | ) | | | (0.73 | ) | |
Redemption Fees | | | 0.00 | | | | 0.00 | (b) | | | 0.00 | (b) | | | 0.00 | (b) | | | 0.00 | (b) | | | 0.00 | (b) | |
Net Asset Value, End of Period | | $ | 30.66 | | | $ | 29.70 | | | $ | 21.63 | | | $ | 18.81 | | | $ | 20.39 | | | $ | 18.94 | | |
Total Return | | | 7.83 | % | | | 39.55 | % | | | 14.99 | % | | | -7.38 | % | | | 8.43 | % | | | 2.65 | % | |
Ratios/Supplemental Data: | |
Net Assets, End of Period ($million) | | $ | 3,358.3 | | | $ | 2,880.4 | | | $ | 2,062.8 | | | $ | 1,816.9 | | | $ | 2,031.8 | | | $ | 1,675.9 | | |
Ratio of Expenses to Average Net Assets | | | 1.12 | %† | | | 1.13 | % | | | 1.16 | % | | | 1.16 | % | | | 1.15 | % | | | 1.23 | % | |
Ratio of Net Investment Income to
Average Net Assets | | | 0.01 | %† | | | 0.75 | % | | | 0.91 | % | | | 0.70 | % | | | 0.53 | % | | | 0.76 | % | |
Portfolio Turnover Rate | | | 17 | % | | | 45 | %(c) | | | 26 | % | | | 29 | %(c) | | | 37 | % | | | 32 | % | |
Financial Highlights–Class II
For a share outstanding throughout each period
| | | Six Months Ended
March 31, 2014 | | Year Ended September 30 | |
| | | (Unaudited) | | 2013 | | 2012 | | 2011 | | 2010 | | 2009 | |
Net Asset Value, Beginning of Period | | $ | 28.98 | | | $ | 21.11 | | | $ | 18.42 | | | $ | 19.97 | | | $ | 18.58 | | | $ | 19.01 | | |
Income From Investment Operations: | |
Net Investment Income (Loss) | | | (0.05 | )(a) | | | 0.03 | | | | 0.11 | (a) | | | 0.06 | (a) | | | 0.00 | (b) | | | 0.07 | (a) | |
Net Gain (Loss) on Investments
(both realized and unrealized) | | | 2.21 | | | | 8.14 | | | | 2.58 | | | | (1.61 | ) | | | 1.48 | | | | 0.14 | | |
Total From Investment Operations | | | 2.16 | | | | 8.17 | | | | 2.69 | | | | (1.55 | ) | | | 1.48 | | | | 0.21 | | |
Less Distributions: | |
From Net Investment Income | | | (0.66 | ) | | | (0.30 | ) | | | 0.00 | | | | 0.00 | (b) | | | (0.09 | ) | | | (0.61 | ) | |
From Capital Gains | | | (0.55 | ) | | | 0.00 | | | | 0.00 | | | | 0.00 | | | | 0.00 | | | | (0.03 | ) | |
Total Distributions | | | (1.21 | ) | | | (0.30 | ) | | | 0.00 | | | | 0.00 | (b) | | | (0.09 | ) | | | (0.64 | ) | |
Redemption Fees | | | 0.00 | | | | 0.00 | (b) | | | 0.00 | (b) | | | 0.00 | (b) | | | 0.00 | (b) | | | 0.00 | (b) | |
Net Asset Value, End of Period | | $ | 29.93 | | | $ | 28.98 | | | $ | 21.11 | | | $ | 18.42 | | | $ | 19.97 | | | $ | 18.58 | | |
Total Return | | | 7.64 | % | | | 39.11 | % | | | 14.60 | % | | | -7.75 | % | | | 8.02 | % | | | 2.43 | % | |
Ratios/Supplemental Data: | |
Net Assets, End of Period ($million) | | $ | 43.0 | | | $ | 38.9 | | | $ | 33.1 | | | $ | 36.6 | | | $ | 50.5 | | | $ | 54.4 | | |
Ratio of Expenses to Average Net Assets | | | 1.44 | %† | | | 1.48 | % | | | 1.50 | % | | | 1.55 | % | | | 1.54 | % | | | 1.54 | % | |
Ratio of Net Investment Income (Loss) to
Average Net Assets | | | (0.31 | )%† | | | 0.40 | % | | | 0.55 | % | | | 0.27 | % | | | 0.09 | % | | | 0.46 | % | |
Portfolio Turnover Rate | | | 17 | % | | | 45 | %(c) | | | 26 | % | | | 29 | %(c) | | | 37 | % | | | 32 | % | |
† Data has been annualized.
(a) Computed using average shares outstanding throughout the period.
(b) Amount rounds to less than $0.01 per share.
(c) The ratio excludes in-kind transactions.
68 THE OAKMARK FUNDS
Oakmark Global Select Fund
Financial Highlights–Class I
For a share outstanding throughout each period
| | | Six Months Ended
March 31, 2014 | | Year Ended September 30 | |
| | | (Unaudited) | | 2013 | | 2012 | | 2011 | | 2010 | | 2009 | |
Net Asset Value, Beginning of Period | | $ | 15.71 | | | $ | 11.65 | | | $ | 9.96 | | | $ | 10.15 | | | $ | 9.54 | | | $ | 8.23 | | |
Income From Investment Operations: | |
Net Investment Income | | | 0.00 | (a) | | | 0.14 | | | | 0.09 | | | | 0.02 | | | | 0.04 | | | | 0.06 | | |
Net Gain (Loss) on Investments
(both realized and unrealized) | | | 1.46 | | | | 4.18 | | | | 1.60 | | | | (0.19 | ) | | | 0.61 | | | | 1.60 | | |
Total From Investment Operations | | | 1.46 | | | | 4.32 | | | | 1.69 | | | | (0.17 | ) | | | 0.65 | | | | 1.66 | | |
Less Distributions: | |
From Net Investment Income | | | (0.14 | ) | | | (0.16 | ) | | | 0.00 | | | | (0.02 | ) | | | (0.04 | ) | | | (0.35 | ) | |
From Capital Gains | | | (0.27 | ) | | | (0.10 | ) | | | 0.00 | | | | 0.00 | | | | 0.00 | | | | 0.00 | | |
Total Distributions | | | (0.41 | ) | | | (0.26 | ) | | | 0.00 | | | | (0.02 | ) | | | (0.04 | ) | | | (0.35 | ) | |
Redemption Fees | | | 0.00 | | | | 0.00 | | | | 0.00 | (a) | | | 0.00 | (a) | | | 0.00 | (a) | | | 0.00 | (a) | |
Net Asset Value, End of Period | | $ | 16.76 | | | $ | 15.71 | | | $ | 11.65 | | | $ | 9.96 | | | $ | 10.15 | | | $ | 9.54 | | |
Total Return | | | 9.37 | % | | | 37.69 | % | | | 16.97 | % | | | -1.65 | % | | | 6.81 | % | | | 22.24 | % | |
Ratios/Supplemental Data: | |
Net Assets, End of Period ($million) | | $ | 1,765.5 | | | $ | 1,159.8 | | | $ | 555.8 | | | $ | 422.0 | | | $ | 329.9 | | | $ | 266.2 | | |
Ratio of Expenses to Average Net Assets | | | 1.13 | %† | | | 1.15 | % | | | 1.23 | % | | | 1.24 | % | | | 1.29 | % | | | 1.43 | % | |
Ratio of Net Investment Income to
Average Net Assets | | | 0.14 | %† | | | 1.01 | % | | | 0.72 | % | | | 0.33 | % | | | 0.40 | % | | | 0.88 | % | |
Portfolio Turnover Rate | | | 6 | % | | | 36 | % | | | 36 | % | | | 49 | % | | | 50 | % | | | 41 | % | |
† Data has been annualized.
(a) Amount rounds to less than $0.01 per share.
oakmark.com 69
Oakmark International Fund
Financial Highlights–Class I
For a share outstanding throughout each period
| | | Six Months Ended
March 31, 2014 | | Year Ended September 30 | |
| | | (Unaudited) | | 2013 | | 2012 | | 2011 | | 2010 | | 2009 | |
Net Asset Value, Beginning of Period | | $ | 25.89 | | | $ | 18.79 | | | $ | 16.13 | | | $ | 18.18 | | | $ | 16.25 | | | $ | 15.71 | | |
Income From Investment Operations: | |
Net Investment Income | | | 0.10 | (a) | | | 0.28 | | | | 0.34 | (a) | | | 0.31 | (a) | | | 0.20 | (a) | | | 0.16 | (a) | |
Net Gain (Loss) on Investments
(both realized and unrealized) | | | 1.27 | | | | 7.26 | | | | 2.45 | | | | (2.20 | ) | | | 1.85 | | | | 1.87 | | |
Total From Investment Operations | | | 1.37 | | | | 7.54 | | | | 2.79 | | | | (1.89 | ) | | | 2.05 | | | | 2.03 | | |
Less Distributions: | |
From Net Investment Income | | | (0.44 | ) | | | (0.44 | ) | | | (0.13 | ) | | | (0.16 | ) | | | (0.12 | ) | | | (1.39 | ) | |
From Capital Gains | | | (0.29 | ) | | | 0.00 | | | | 0.00 | | | | 0.00 | | | | 0.00 | | | | (0.10 | ) | |
Total Distributions | | | (0.73 | ) | | | (0.44 | ) | | | (0.13 | ) | | | (0.16 | ) | | | (0.12 | ) | | | (1.49 | ) | |
Redemption Fees | | | 0.00 | | | | 0.00 | | | | 0.00 | (b) | | | 0.00 | (b) | | | 0.00 | (b) | | | 0.00 | (b) | |
Net Asset Value, End of Period | | $ | 26.53 | | | $ | 25.89 | | | $ | 18.79 | | | $ | 16.13 | | | $ | 18.18 | | | $ | 16.25 | | |
Total Return | | | 5.40 | % | | | 40.79 | % | | | 17.40 | % | | | -10.54 | % | | | 12.67 | % | | | 17.71 | % | |
Ratios/Supplemental Data: | |
Net Assets, End of Period ($million) | | $ | 30,648.2 | | | $ | 23,886.0 | | | $ | 8,993.6 | | | $ | 6,920.8 | | | $ | 5,707.4 | | | $ | 4,045.4 | | |
Ratio of Expenses to Average Net Assets | | | 0.96 | %† | | | 0.98 | % | | | 1.06 | % | | | 1.06 | % | | | 1.08 | % | | | 1.17 | % | |
Ratio of Net Investment Income to
Average Net Assets | | | 0.79 | %† | | | 1.58 | % | | | 1.90 | % | | | 1.63 | % | | | 1.21 | % | | | 1.32 | % | |
Portfolio Turnover Rate | | | 18 | %(c) | | | 37 | %(c) | | | 38 | % | | | 45 | % | | | 51 | % | | | 53 | % | |
Financial Highlights–Class II
For a share outstanding throughout each period
| | | Six Months Ended
March 31, 2014 | | Year Ended September 30 | |
| | | (Unaudited) | | 2013 | | 2012 | | 2011 | | 2010 | | 2009 | |
Net Asset Value, Beginning of Period | | $ | 25.98 | | | $ | 18.86 | | | $ | 16.18 | | | $ | 18.25 | | | $ | 16.38 | | | $ | 15.55 | | |
Income From Investment Operations: | |
Net Investment Income | | | 0.06 | (a) | | | 0.27 | (a) | | | 0.27 | | | | 0.24 | (a) | | | 0.14 | (a) | | | 0.14 | (a) | |
Net Gain (Loss) on Investments
(both realized and unrealized) | | | 1.26 | | | | 7.23 | | | | 2.47 | | | | (2.20 | ) | | | 1.86 | | | | 1.96 | | |
Total From Investment Operations | | | 1.32 | | | | 7.50 | | | | 2.74 | | | | (1.96 | ) | | | 2.00 | | | | 2.10 | | |
Less Distributions: | |
From Net Investment Income | | | (0.36 | ) | | | (0.38 | ) | | | (0.06 | ) | | | (0.11 | ) | | | (0.13 | ) | | | (1.17 | ) | |
From Capital Gains | | | (0.29 | ) | | | 0.00 | | | | 0.00 | | | | 0.00 | | | | 0.00 | | | | (0.10 | ) | |
Total Distributions | | | (0.65 | ) | | | (0.38 | ) | | | (0.06 | ) | | | (0.11 | ) | | | (0.13 | ) | | | (1.27 | ) | |
Redemption Fees | | | 0.00 | | | | 0.00 | | | | 0.00 | (b) | | | 0.00 | (b) | | | 0.00 | (b) | | | 0.00 | (b) | |
Net Asset Value, End of Period | | $ | 26.65 | | | $ | 25.98 | | | $ | 18.86 | | | $ | 16.18 | | | $ | 18.25 | | | $ | 16.38 | | |
Total Return | | | 5.20 | % | | | 40.31 | % | | | 16.99 | % | | | -10.85 | % | | | 12.26 | % | | | 17.70 | % | |
Ratios/Supplemental Data: | |
Net Assets, End of Period ($million) | | $ | 528.0 | | | $ | 386.9 | | | $ | 241.4 | | | $ | 204.0 | | | $ | 146.0 | | | $ | 107.8 | | |
Ratio of Expenses to Average Net Assets | | | 1.31 | %† | | | 1.34 | % | | | 1.39 | % | | | 1.45 | % | | | 1.45 | % | | | 1.32 | % | |
Ratio of Net Investment Income to
Average Net Assets | | | 0.45 | %† | | | 1.20 | % | | | 1.55 | % | | | 1.26 | % | | | 0.83 | % | | | 1.15 | % | |
Portfolio Turnover Rate | | | 18 | %(c) | | | 37 | %(c) | | | 38 | % | | | 45 | % | | | 51 | % | | | 53 | % | |
† Data has been annualized.
(a) Computed using average shares outstanding throughout the period.
(b) Amount rounds to less than $0.01 per share.
(c) The ratio excludes in-kind transactions.
70 THE OAKMARK FUNDS
Oakmark International Small Cap Fund
Financial Highlights–Class I
For a share outstanding throughout each period
| | | Six Months Ended
March 31, 2014 | | Year Ended September 30 | |
| | | (Unaudited) | | 2013 | | 2012 | | 2011 | | 2010 | | 2009 | |
Net Asset Value, Beginning of Period | | $ | 17.29 | | | $ | 13.06 | | | $ | 11.56 | | | $ | 13.02 | | | $ | 11.51 | | | $ | 11.36 | | |
Income From Investment Operations: | |
Net Investment Income | | | 0.06 | (a) | | | 0.18 | | | | 0.20 | | | | 0.15 | (a) | | | 0.12 | (a) | | | 0.15 | (a) | |
Net Gain (Loss) on Investments
(both realized and unrealized) | | | 0.87 | | | | 4.26 | | | | 1.32 | | | | (1.53 | ) | | | 1.55 | | | | 1.06 | | |
Total From Investment Operations | | | 0.93 | | | | 4.44 | | | | 1.52 | | | | (1.38 | ) | | | 1.67 | | | | 1.21 | | |
Less Distributions: | |
From Net Investment Income | | | (0.55 | ) | | | (0.21 | ) | | | (0.02 | ) | | | (0.08 | ) | | | (0.16 | ) | | | (0.93 | ) | |
From Capital Gains | | | 0.00 | | | | 0.00 | | | | 0.00 | (b) | | | 0.00 | | | | 0.00 | | | | (0.13 | ) | |
Total Distributions | | | (0.55 | ) | | | (0.21 | ) | | | (0.02 | ) | | | (0.08 | ) | | | (0.16 | ) | | | (1.06 | ) | |
Redemption Fees | | | 0.00 | (b) | | | 0.00 | (b) | | | 0.00 | (b) | | | 0.00 | (b) | | | 0.00 | (b) | | | 0.00 | (b) | |
Net Asset Value, End of Period | | $ | 17.67 | | | $ | 17.29 | | | $ | 13.06 | | | $ | 11.56 | | | $ | 13.02 | | | $ | 11.51 | | |
Total Return | | | 5.57 | % | | | 34.42 | % | | | 13.15 | % | | | -10.72 | % | | | 14.70 | % | | | 16.28 | % | |
Ratios/Supplemental Data: | |
Net Assets, End of Period ($million) | | $ | 2,865.4 | | | $ | 2,254.1 | | | $ | 1,525.8 | | | $ | 1,328.4 | | | $ | 1,217.2 | | | $ | 768.0 | | |
Ratio of Expenses to Average Net Assets | | | 1.32 | %† | | | 1.35 | % | | | 1.41 | % | | | 1.38 | % | | | 1.38 | % | | | 1.54 | % | |
Ratio of Net Investment Income to
Average Net Assets | | | 0.70 | %† | | | 1.23 | % | | | 1.54 | % | | | 1.10 | % | | | 1.02 | % | | | 1.77 | % | |
Portfolio Turnover Rate | | | 18 | % | | | 50 | % | | | 33 | % | | | 46 | % | | | 54 | % | | | 46 | % | |
Financial Highlights–Class II
For a share outstanding throughout each period
| | | Six Months Ended
March 31, 2014 | | Year Ended September 30 | |
| | | (Unaudited) | | 2013 | | 2012 | | 2011 | | 2010 | | 2009 | |
Net Asset Value, Beginning of Period | | $ | 17.17 | | | $ | 12.98 | | | $ | 11.50 | | | $ | 12.97 | | | $ | 11.50 | | | $ | 11.33 | | |
Income From Investment Operations: | |
Net Investment Income | | | 0.03 | (a) | | | 0.13 | (a) | | | 0.17 | (a) | | | 0.12 | (a) | | | 0.09 | (a) | | | 0.14 | (a) | |
Net Gain (Loss) on Investments
(both realized and unrealized) | | | 0.87 | | | | 4.24 | | | | 1.31 | | | | (1.55 | ) | | | 1.54 | | | | 1.06 | | |
Total From Investment Operations | | | 0.90 | | | | 4.37 | | | | 1.48 | | | | (1.43 | ) | | | 1.63 | | | | 1.20 | | |
Less Distributions: | |
From Net Investment Income | | | (0.51 | ) | | | (0.18 | ) | | | 0.00 | | | | (0.04 | ) | | | (0.16 | ) | | | (0.90 | ) | |
From Capital Gains | | | 0.00 | | | | 0.00 | | | | 0.00 | (b) | | | 0.00 | | | | 0.00 | | | | (0.13 | ) | |
Total Distributions | | | (0.51 | ) | | | (0.18 | ) | | | 0.00 | (b) | | | (0.04 | ) | | | (0.16 | ) | | | (1.03 | ) | |
Redemption Fees | | | 0.00 | (b) | | | 0.00 | (b) | | | 0.00 | (b) | | | 0.00 | (b) | | | 0.00 | (b) | | | 0.00 | (b) | |
Net Asset Value, End of Period | | $ | 17.56 | | | $ | 17.17 | | | $ | 12.98 | | | $ | 11.50 | | | $ | 12.97 | | | $ | 11.50 | | |
Total Return | | | 5.38 | % | | | 34.04 | % | | | 12.90 | % | | | -11.09 | % | | | 14.30 | % | | | 16.08 | % | |
Ratios/Supplemental Data: | |
Net Assets, End of Period ($million) | | $ | 3.5 | | | $ | 3.5 | | | $ | 2.6 | | | $ | 1.9 | | | $ | 1.4 | | | $ | 0.8 | | |
Ratio of Expenses to Average Net Assets | | | 1.59 | %† | | | 1.64 | % | | | 1.69 | % | | | 1.72 | % | | | 1.72 | % | | | 1.71 | % | |
Ratio of Net Investment Income to
Average Net Assets | | | 0.33 | %† | | | 0.90 | % | | | 1.34 | % | | | 0.85 | % | | | 0.74 | % | | | 1.66 | % | |
Portfolio Turnover Rate | | | 18 | % | | | 50 | % | | | 33 | % | | | 46 | % | | | 54 | % | | | 46 | % | |
† Data has been annualized.
(a) Computed using average shares outstanding throughout the period.
(b) Amount rounds to less than $0.01 per share.
oakmark.com 71
The Oakmark Funds Disclosure Regarding The Board of Trustees' October 2013 Approval of Investment Advisory Contracts As Approved April 16, 2014
Each year, the Board of Trustees of the Oakmark Funds (the "Board"), including a majority of the independent Trustees, is required by the Investment Company Act of 1940 (the "1940 Act") to determine whether to continue each Fund's investment advisory agreement (each an "Agreement") with the Fund's investment adviser (the "Adviser"). The Board requests and receives from the Adviser a broad range of materials and information that are relevant to the Trustees' consideration of the Agreements, both throughout the year and especially in connection with its annual review of the Agreements. In addition, the Board retains an independent data provider to provide performance and expense information for each Fund and for comparable funds.
The Board's committee on contracts (the "Committee") leads the Board in its evaluation of the Agreements. The Committee is comprised entirely of trustees who are not "interested persons" of the Funds as defined in the 1940 Act ("Independent Trustees"), and more than 75% of the Board is comprised of Independent Trustees. During the last year, the Committee and the Board met numerous times to consider the Agreements. At each of those meetings, the Committee and the Board were advised by, and met in executive session with, their experienced independent legal counsel.
In connection with their consideration of each Agreement, the Committee and the Board considered, among other things: (i) the nature, quality and extent of the Adviser's services, (ii) the investment performance of each Fund, as well as performance information for comparable funds, (iii) the fees and other expenses paid by each Fund, as well as fee and expense information for comparable funds and separate accounts managed by the Adviser, (iv) the profitability of the Adviser and its affiliates from their relationship with each Fund, (v) whether economies of scale may be realized as the Funds grow and whether fee levels share with Fund investors economies of scale and (vi) other benefits to the Adviser from its relationship with each Fund.
At a meeting held on October 16, 2013, the Board, including all of the Independent Trustees, upon recommendation of the Committee, determined that the continuation of the Agreement for each Fund was in the best interest of the Fund and its shareholders, and approved the continuation of the Agreements through October 31, 2014. Below is a summary of the principal information considered by the Board as well as the Board's conclusions regarding various factors. In their deliberations, the Independent Trustees did not identify any single factor that was paramount or determinative, and each Independent Trustee may have weighed the information differently.
1. Nature, Extent and Quality of Services
The Board's consideration of the nature, extent and quality of the Adviser's services to the Funds took into account the knowledge the Board gained during meetings with the Adviser throughout the year. In addition, the Board considered: the Adviser's long-term history of care and conscientiousness in the management of the Funds; the consistency of its investment approach; the background and experience of the Adviser's investment personnel responsible for managing the Funds; the Adviser's performance as administrator of the Funds; the Adviser's comprehensive compliance program; and the favorable recognition of the Adviser and the Funds in the media and in industry publications. The Board also reviewed the Adviser's resources and key personnel involved in providing investment management services to the Funds, including the time that investment personnel devoted to each Fund and the investment results produced as a result of the Adviser's in-house research. The Board also noted the significant personal investments that the Adviser's personnel have made in the Funds, which serve to further align the interests of the Adviser and its personnel with those of the Funds' shareholders. The Board concluded that the nature, extent and quality of the services provided by the Adviser to each Fund were appropriate and consistent with the Fund's Agreement and that each Fund was likely to continue to benefit from services provided under its Agreement with the Adviser.
2. Investment Performance of the Funds
The Board considered each Fund's investment performance over various time periods, including how the Fund performed compared to the performance of a group of comparable funds (the Fund's "Performance Universe") selected by Lipper, Inc. ("Lipper"). Among the performance periods considered by the Board were those ended on April 30, 2013. Where available, the Board considered one-, three-, five- and ten-year performance.
Further detail considered by the Board regarding the investment performance of each Fund is set forth below:
Oakmark Fund. The Board considered that the Fund outperformed the annualized returns of its Universe Median during all periods presented.
Oakmark Select Fund. The Board considered that the Fund outperformed the annualized returns of its Universe Median during the three-, five- and ten-year periods, but underperformed the annualized returns of its Universe Median for the one-year period.
Oakmark Equity and Income Fund. Noting that its focus continues to be on longer-term performance, the Board considered that the Fund outperformed the annualized returns of its Universe Median during the ten-year period, although it underperformed the Universe Median during the one-, three-, and five-year periods. The Board also took into account the Adviser's assertion that the Fund's more conservative equity and bond positioning relative to its benchmark index muted performance over the past 24 months.
Oakmark Global Fund. The Board considered that the Fund outperformed the annualized returns of its Universe Median during all periods presented.
Oakmark Global Select Fund. Noting that the Fund commenced operations in October 2006, the Board considered that the Fund outperformed the annualized returns of its Universe Median during all periods presented.
72 THE OAKMARK FUNDS
Oakmark International Fund. The Board considered that the Fund outperformed the annualized returns of its Universe Median during all periods presented.
Oakmark International Small Cap Fund. Noting that its focus continues to be on longer-term performance, the Board considered that the Fund outperformed the annualized returns of its Universe Median during the five- and ten-year periods, though it underperformed the Universe Median during the one- and three-year periods.
In addition to comparing each Fund's performance to that of its Performance Universe, the Board also considered each Fund's performance compared to that of its benchmark and other comparative data provided by Lipper, including each Fund's total return and performance relative to risk. After considering all of this information, the Board concluded that the Adviser was delivering performance for each Fund that was consistent with the long-term investment strategies being pursued by the Fund, and that the Fund and its shareholders were benefiting from the Adviser's investment management of the Fund
3. Costs of Services Provided and Profits Realized by the Adviser
Using information provided by Lipper, the Board evaluated each Fund's advisory fee compared to the advisory fee for other mutual funds comparable in size, character and investment strategy (the "Expense Group"), and each Fund's expense ratio compared to that of the Expense Group.
The Board also reviewed the Adviser's advisory fees for comparable institutional separate account clients and subadvised funds (for which the Adviser provides portfolio management services only). The Board noted the Adviser's explanation that, although in most instances, the fees paid by those other clients were lower than the fees paid by the Funds, the differences reflected the Adviser's significantly greater level of responsibilities and broader scope of services regarding the Funds, and the more extensive regulatory obligations and risks associated with managing the Funds.
The Board also considered the Adviser's costs in serving as the Fund's investment adviser and manager, including costs associated with technology, infrastructure and compliance necessary to manage the Funds. The Board reviewed the Adviser's methodology for allocating costs among the Adviser's lines of business and among the Funds. The Board also considered information regarding the structure of the Adviser's compensation program for portfolio managers, analysts and certain other employees and the relationship of such compensation to the Adviser's ability to attract and retain quality personnel. Finally, the Board considered the Adviser's profitability analysis, as well as an Investment Management Industry Profitability Analysis prepared by Lipper. The Board examined the pre-tax profits realized by the Adviser and its affiliates from their relationship with each Fund, as presented in the profitability analyses, as well as the financial condition of the Adviser.
Further detail considered by the Board regarding the management fee rate and expense ratio of each Fund is set forth below:
Oakmark Fund. The Board considered that the Fund's management fee rate and total expense ratio are higher than the respective medians of the Fund's Expense Group. The Board, in its consideration of expenses, took into account its review of the Fund's performance. The Board also noted that, in response to Board negotiations with the Adviser, the Adviser agreed to an additional breakpoint for the Oakmark Fund to reduce the Adviser's fees on assets over $12.5 billion to 0.62% of such assets.
Oakmark Select Fund and Oakmark International Small Cap Fund. The Board considered that each Fund's management fee rate and total expense ratio are higher than the respective medians of the Fund's Expense Group. The Board, in its consideration of expenses, also took into account its review of each Fund's performance.
Oakmark Equity and Income Fund, Oakmark Global Fund and Oakmark Global Select Fund. The Board considered that each Fund's management fee rate is higher than the median of the Fund's Expense Group. The Board noted, however, that each Fund's total expense ratio, which reflects the total fees paid by an investor, is lower than the median of each Fund's Expense Group.
Oakmark International Fund. The Board considered that the Fund's management fee is equal to the median of the Fund's Expense Group and the total expense ratio, which reflects the total fees paid by an investor, is lower than the median of the Fund's Expense Group. The Board also noted that, in response to Board negotiations with the Adviser, the Adviser agreed to an additional breakpoint for the Oakmark International Fund to reduce the Adviser's fees on assets over $23 billion to 0.795% of such assets.
After its review of all the matters addressed, including those outlined above, the Board concluded that the management fees paid by each Fund to the Adviser were reasonable in light of the services provided, and that the profitability of the Adviser's relationship with the Funds appeared to be reasonable in relation to the services performed.
4. Economies of Scale and Fee Levels Reflecting Those Economies
The Board considered whether each Fund's management fee structure provides for a sharing with shareholders of potential economies of scale that may be realized by the Adviser. The Board reviewed each Agreement, which includes breakpoints that decrease the management fee rate as a Fund's assets increase. The Board also considered that it and the Adviser had agreed to additional breakpoints in the Agreements for Oakmark Fund and Oakmark International Fund. The Board concluded that the breakpoints in the fee schedule for each Fund allow shareholders to benefit from potential economies of scale that may be achieved by the Adviser.
oakmark.com 73
5. Other Benefits Derived from the Relationship with the Funds
The Board also considered other benefits that accrue to the Adviser and its affiliates from their relationship with the Funds. The Board noted that an affiliate of the Adviser serves as the Funds' distributor, without compensation, pursuant to a written agreement the Board evaluates annually.
The Board also considered the Adviser's use of a portion of the commissions paid by the Funds on their portfolio brokerage transactions to obtain research products and services benefiting the Funds and/or other clients of the Adviser and considered the Adviser's assertion that its use of "soft" commission dollars to obtain research products and services was consistent with regulatory requirements.
After full consideration of the above factors, as well as other factors that were instructive in evaluating the Agreements, the Board, including all of the Independent Trustees, concluded that approval of the continuation of each Agreement was in the best interests of the Fund and its shareholders. On October 16, 2013, the Board continued each Agreement.
74 THE OAKMARK FUNDS
Disclosures and Endnotes
Reporting to Shareholders. The Funds reduce the number of duplicate prospectuses, annual and semi-annual reports your household receives by sending only one copy of each to those addresses shared by two or more accounts. Call the Funds at 1-800-OAKMARK to request individual copies of these documents. The Funds will begin sending individual copies thirty days after receiving your request.
Before investing in any Oakmark Fund, you should carefully consider the Fund's investment objectives, risks, management fees and other expenses. This and other important information is contained in the Funds' prospectus and a Fund's summary prospectus. Please read the prospectus and summary prospectus carefully before investing. For more information, please visit oakmark.com or call 1-800-OAKMARK (625-6275).
The discussion of the Funds' investments and investment strategy (including current investment themes, the portfolio managers' research and investment process, and portfolio characteristics) represents the Funds' investments and the views of the portfolio managers and Harris Associates L.P., the Funds' investment adviser, at the time of this report, and are subject to change without notice.
Endnotes:
1. Ben Baris, Institutional Investor December 2013 / January 2014. "Transaction Cost Analysis, Shaving Pennies Amid the Boom". The Transaction Cost Analysis survey conducted by Elkins/McSherry compared investment firms' trading costs relative to the volume-weighted average price, based on a universe of approximately 1,400 managers.
2. The S&P 500 Total Return Index is a market capitalization-weighted index of 500 large-capitalization stocks commonly used to represent the U.S. equity market. All returns reflect reinvested dividends and capital gains distributions. This index is unmanaged and investors cannot invest directly in this index.
3. Total return includes change in share prices and in each case includes reinvestment of any dividends and capital gain distributions.
4. The Dow Jones Industrial Average is an index that includes only 30 U.S. blue-chip companies. This index is unmanaged and investors cannot invest directly in this index.
5. The Lipper Large Cap Value Funds Index is an equally-weighted index of the largest 30 funds within the large cap value funds investment objective as defined by Lipper Inc. The index is adjusted for the reinvestment of capital gains and income dividends. This index is unmanaged and investors cannot invest directly in this index.
6. Portfolio holdings are subject to change without notice and are not intended as recommendations of individual stocks.
7. The Lipper Multi-Cap Value Funds Index tracks the results of the 30 largest mutual funds in the Lipper Multi-Cap Value Funds category. This index is unmanaged and investors cannot invest directly in this index.
8. EPS refers to Earnings Per Share and is calculated by dividing total earnings by the number of shares outstanding.
9. The Lipper Balanced Funds Index measures the performance of the 30 largest U.S. balanced funds tracked by Lipper. This index is unmanaged and investors cannot invest directly in this index.
10. The Barclays U.S. Government / Credit Index is a benchmark index made up of the Barclays U.S. Government and U.S. Corporate Bond indices, including U.S. government Treasury and agency securities as well as corporate and Yankee bonds. This index is unmanaged and investors cannot invest directly in this index.
11. The MSCI World Index (Net) is a free float-adjusted market capitalization weighted index that is designed to measure the global equity market performance of developed markets. This benchmark calculates reinvested dividends net of withholding taxes using Luxembourg tax rates. This index is unmanaged and investors cannot invest directly in this index.
12. The Lipper Global Funds Index measures the performance of the 30 largest mutual funds that invest in securities throughout the world. This index is unmanaged and investors cannot invest directly in this index.
13. The MSCI World ex U.S. Index (Net) is a free float-adjusted market capitalization index that is designed to measure international developed market equity performance, excluding the U.S. This benchmark calculates reinvested dividends net of withholding taxes using Luxembourg tax rates. This index is unmanaged and investors cannot invest directly in this index.
14. The MSCI EAFE (Europe, Australasia, Far East) Index (Net) is a free float-adjusted market capitalization index that is designed to measure the international equity market performance of developed markets, excluding the US & Canada. This benchmark calculates reinvested dividends net of withholding taxes using Luxembourg tax rates. This index is unmanaged and investors cannot invest directly in this index.
15. The Lipper International Funds Index reflects the net asset value weighted total return of the 30 largest international equity funds. This index is unmanaged and investors cannot invest directly in this index.
16. The MSCI World ex U.S. Small Cap Index (Net) is a free float-adjusted market capitalization index that is designed to measure global developed market equity performance, excluding the U.S. The MSCI Small Cap Indices target 40% of the eligible Small Cap universe within each industry group, within each country. MSCI defines the Small Cap universe as all listed securities that have a market capitalization in the range of USD200-1,500 million. This benchmark calculates reinvested dividends net of withholding taxes using Luxembourg tax rates. This index is unmanaged and investors cannot invest directly in this index.
17. The Lipper International Small Cap Funds Index measures the performance of the 10 largest international small-cap funds tracked by Lipper. This index is unmanaged and investors cannot invest directly in this index.
OAKMARK, OAKMARK FUNDS, OAKMARK INTERNATIONAL, and OAKMARK and tree design are trademarks owned or registered by Harris Associates L.P. in the U.S. and/or other countries.
oakmark.com 75
The Oakmark Funds
Trustees and Officers
Trustees
Allan J. Reich—Chairman
Michael J. Friduss
Thomas H. Hayden
Christine M. Maki
Laurence C. Morse, Ph. D.
Steven S. Rogers
Kristi L. Rowsell
Burton W. Ruder
Peter S. Voss
Officers
Kristi L. Rowsell—President and Principal Executive Officer
Robert M. Levy—Executive Vice President
Judson H. Brooks—Vice President
Anthony P. Coniaris—Vice President
Richard J. Gorman—Vice President, Chief Compliance
Officer, Anti-Money Laundering Officer and Assistant Secretary
Kevin G. Grant—Vice President
Thomas E. Herman—Principal Financial Officer
David G. Herro—Vice President
M. Colin Hudson—Vice President
John J. Kane—Treasurer
Matthew A. Logan—Vice President
Michael L. Manelli—Vice President
Clyde S. McGregor—Vice President
Thomas W. Murray—Vice President
Michael J. Neary—Vice President
William C. Nygren—Vice President
Vineeta D. Raketich—Vice President
Janet L. Reali—Vice President, Secretary and Chief Legal Officer
Robert A. Taylor—Vice President
Andrew J. Tedeschi—Assistant Treasurer
Edward J. Wojciechowski—Vice President
Randall T. Zipfel—Vice President
Other Information
Investment Adviser
Harris Associates L.P.
Two North LaSalle Street
Chicago, Illinois 60602-3790
Transfer Agent
Boston Financial Data Services, Inc.
Quincy, Massachusetts
Legal Counsel
K&L Gates LLP
Chicago, Illinois
Independent Registered Public Accounting Firm
Deloitte & Touche LLP
Chicago, Illinois
Contact Us
Please call 1-800-OAKMARK
(1-800-625-6275)
or 617-483-8327
Website
oakmark.com
To obtain a prospectus, an application or periodic reports, access our web site at oakmark.com, or call 1-800-OAKMARK (625-6275) or (617) 483-8327.
Each Fund will file its complete schedule of portfolio holdings with the Securities and Exchange Commission ("SEC") for the first and third quarters of each fiscal year on Form N-Q. The Funds' Forms N-Q's are available on the SEC's website at www.sec.gov. The Funds' Forms N-Q may be reviewed and copied at the SEC's Public Reference Room in Washington, DC, and information on the operation of the Public Reference Room may be obtained by calling 1-800-SEC-0330.
A description of the policies and procedures the Funds use to determine how to vote proxies relating to portfolio securities is available without charge, upon request, by calling toll-free 1-800-625-6275; on the Funds' website at oakmark.com; and on the Securities and Exchange Commission's website at www.sec.gov.
No later than August 31 of each year, information regarding how the Adviser, on behalf of the Funds, voted proxies relating to the Funds' portfolio securities for the twelve months ended the preceding June 30 will be available through a link on the Funds' website at oakmark.com and on the SEC's website at www.sec.gov.
This report is submitted for the general information of the shareholders of the Funds. The report is not authorized for distribution to prospective investors in the Funds unless it is accompanied or preceded by a currently effective prospectus of the Funds.
No sales charge to the shareholder or to the new investor is made in offering the shares of the Funds; however, a shareholder of the Oakmark International Small Cap Fund may incur a 2% redemption fee on an exchange or redemption of Class I Shares and Class II Shares held for 90 days or less.
76 THE OAKMARK FUNDS


THE VALUE OF A $10,000 INVESTMENT IN OAKMARK FUND FROM ITS
INCEPTION (04/05/01) TO PRESENT (03/31/14) AS COMPARED TO THE
STANDARD & POOR'S 500 INDEX (UNAUDITED)

Average Annual Total Returns
(as of 03/31/14)
| (Unaudited) | | 1-year | | 5-year | | 10-year | | Since
Inception
(04/05/01) | |
Oakmark Fund (Class II) | | | 27.77 | % | | | 25.09 | % | | | 8.57 | % | | | 7.99 | % | |
S&P 500 Index | | | 21.86 | % | | | 21.16 | % | | | 7.42 | % | | | 5.88 | % | |
The graph and table do not reflect the deduction of taxes that a shareholder would pay on fund distributions or the redemption of fund shares.
The expense ratio for Class II shares as of 09/30/13 was 1.23%.
The performance data quoted represents past performance. Past performance does not guarantee future results. The investment return and principal value will fluctuate so that an investor's shares, when redeemed, may be worth more or less than their original cost. Current performance may be lower or higher than the performance data quoted. Average annual total return measures annualized change, while total return measures aggregate change. To obtain the most recent month-end performance data, visit oakmark.com.
The S&P 500 Total Return Index is a broad market-weighted average of U.S. blue-chip companies. This index is unmanaged and investors cannot invest directly in this index.
Harris Associates Securities L.P., member FINRA, May 2014
OAKMARK SELECT FUND CLASS II
THE VALUE OF A $10,000 INVESTMENT IN OAKMARK SELECT FUND FROM ITS
INCEPTION (12/31/99) TO PRESENT (03/31/14) AS COMPARED TO THE
STANDARD & POOR'S 500 INDEX (UNAUDITED)
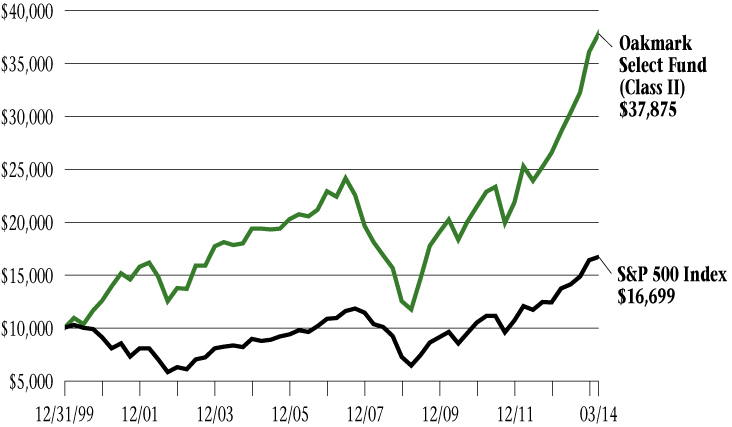
Average Annual Total Returns
(as of 03/31/14)
| (Unaudited) | | 1-year | | 5-year | | 10-year | | Since
Inception
(12/31/99) | |
Oakmark Select Fund (Class II) | | | 32.69 | % | | | 26.43 | % | | | 7.66 | % | | | 9.80 | % | |
S&P 500 Index | | | 21.86 | % | | | 21.16 | % | | | 7.42 | % | | | 3.66 | % | |
The graph and table do not reflect the deduction of taxes that a shareholder would pay on fund distributions or the redemption of fund shares.
The expense ratio for Class II shares as of 09/30/13 was 1.33%.
The performance data quoted represents past performance. Past performance does not guarantee future results. The investment return and principal value will fluctuate so that an investor's shares, when redeemed, may be worth more or less than their original cost. Current performance may be lower or higher than the performance data quoted. Average annual total return measures annualized change, while total return measures aggregate change. To obtain the most recent month-end performance data, visit oakmark.com.
The S&P 500 Total Return Index is a broad market-weighted average of U.S. blue-chip companies. This index is unmanaged and investors cannot invest directly in this index.
Harris Associates Securities L.P., member FINRA, May 2014
OAKMARK EQUITY AND INCOME FUND CLASS II
THE VALUE OF A $10,000 INVESTMENT IN OAKMARK EQUITY AND INCOME
FUND FROM ITS INCEPTION (07/12/00) TO PRESENT (03/31/14) AS COMPARED TO
THE LIPPER BALANCED FUND INDEX (UNAUDITED)
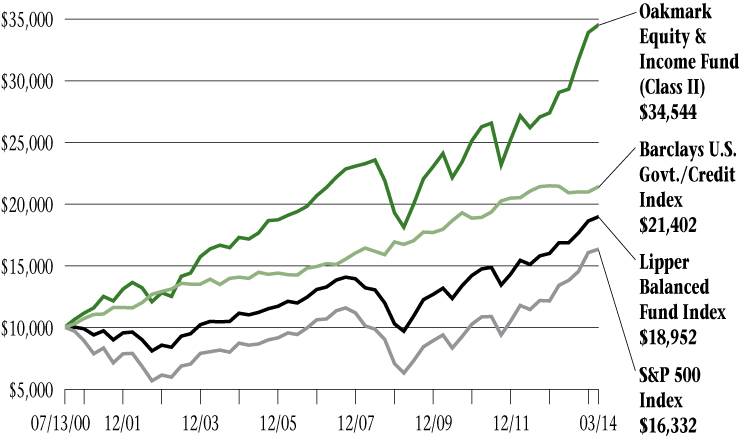
Average Annual Total Returns
(as of 03/31/14)
| (Unaudited) | | 1-year | | 5-year | | 10-year | | Since
Inception
(07/13/00) | |
Oakmark Equity & Income Fund
(Class II) | | | 18.69 | % | | | 13.78 | % | | | 7.76 | % | | | 9.46 | % | |
Lipper Balanced Fund Index | | | 12.44 | % | | | 14.40 | % | | | 6.13 | % | | | 4.77 | % | |
S&P 500 Index | | | 21.86 | % | | | 21.16 | % | | | 7.42 | % | | | 3.64 | % | |
Barclays U.S. Govt./Credit Index | | | -0.26 | % | | | 5.07 | % | | | 4.41 | % | | | 5.70 | % | |
The graph and table do not reflect the deduction of taxes that a shareholder would pay on fund distributions or the redemption of fund shares.
The expense ratio for Class II shares as of 09/30/13 was 1.10%.
The performance data quoted represents past performance. Past performance does not guarantee future results. The investment return and principal value will fluctuate so that an investor's shares, when redeemed, may be worth more or less than their original cost. Current performance may be lower or higher than the performance data quoted. Average annual total return measures annualized change, while total return measures aggregate change. To obtain the most recent month-end performance data, visit oakmark.com.
The Lipper Balanced Fund Index measures the performance of the 30 largest U.S. balanced funds tracked by Lipper. This index is unmanaged and investors cannot invest directly in this index.
Harris Associates Securities L.P., member FINRA, May 2014
OAKMARK GLOBAL FUND CLASS II
THE VALUE OF A $10,000 INVESTMENT IN OAKMARK GLOBAL FUND
FROM ITS INCEPTION (10/10/01) TO PRESENT (03/31/14) AS COMPARED TO THE
MSCI WORLD INDEX (UNAUDITED)
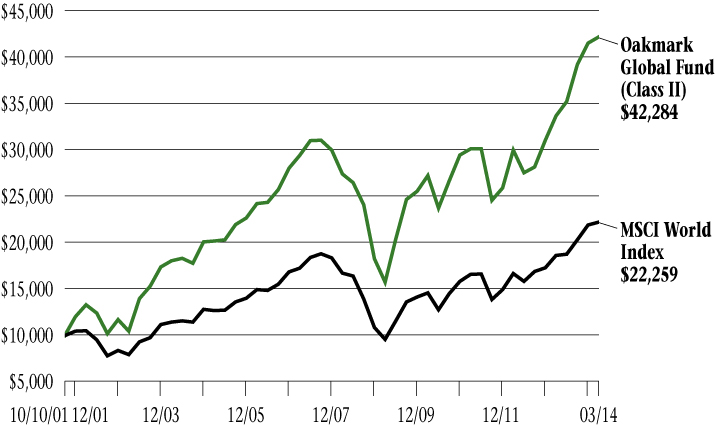
Average Annual Total Returns
(as of 03/31/14)
(Unaudited) | | 1-year | | 5-year | | 10-year | | Since
Inception
(10/10/01) | |
Oakmark Global Fund (Class II) | | | 25.38 | % | | | 21.74 | % | | | 8.85 | % | | | 12.26 | % | |
MSCI World Index | | | 19.07 | % | | | 18.28 | % | | | 6.83 | % | | | 6.63 | % | |
The graph and table do not reflect the deduction of taxes that a shareholder would pay on fund distributions or the redemption of fund shares.
The expense ratio for Class II shares as of 09/30/13 was 1.48%.
The performance data quoted represents past performance. Past performance does not guarantee future results. The investment return and principal value will fluctuate so that an investor's shares, when redeemed, may be worth more or less than their original cost. Current performance may be lower or higher than the performance data quoted. Average annual total return measures annualized change, while total return measures aggregate change. To obtain the most recent month-end performance data, visit oakmark.com.
The MSCI World Index (Net) is a free float-adjusted market capitalization weighted index that is designed to measure the global equity market performance of developed markets. This benchmark calculates reinvested dividends net of withholding taxes using Luxembourg tax rates. This index is unmanaged and investors cannot invest directly in this index.
Harris Associates Securities L.P., member FINRA, May 2014
OAKMARK INTERNATIONAL FUND CLASS II
THE VALUE OF A $10,000 INVESTMENT IN OAKMARK INTERNATIONAL FUND
FROM ITS INCEPTION (11/04/99) TO PRESENT (03/31/14) AS COMPARED TO THE
MSCI WORLD EX U.S. INDEX (UNAUDITED)

Average Annual Total Returns
(as of 03/31/14)
| (Unaudited) | | 1-year | | 5-year | | 10-year | | Since
Inception
(11/04/99) | |
Oakmark International Fund (Class II) | | | 23.27 | % | | | 23.31 | % | | | 9.84 | % | | | 9.57 | % | |
MSCI World ex U.S. Index | | | 16.46 | % | | | 15.88 | % | | | 6.71 | % | | | 4.10 | % | |
The graph and table do not reflect the deduction of taxes that a shareholder would pay on fund distributions or the redemption of fund shares.
The expense ratio for Class II shares as of 09/30/13 was 1.34%.
The performance data quoted represents past performance. Past performance does not guarantee future results. The investment return and principal value will fluctuate so that an investor's shares, when redeemed, may be worth more or less than their original cost. Current performance may be lower or higher than the performance data quoted. Average annual total return measures annualized change, while total return measures aggregate change. To obtain the most recent month-end performance data, visit oakmark.com.
The MSCI World ex U.S. Index (Net) is a free float-adjusted market capitalization index that is designed to measure international developed market equity performance, excluding the U.S. This benchmark calculates reinvested dividends net of withholding taxes using Luxembourg tax rates. This index is unmanaged and investors cannot invest directly in this index.
Harris Associates Securities L.P., member FINRA, May 2014
OAKMARK INTERNATIONAL
SMALL CAP FUND CLASS II
THE VALUE OF A $10,000 INVESTMENT IN OAKMARK INTERNATIONAL SMALL CAP FUND FROM ITS INCEPTION (01/08/01) TO PRESENT (03/31/14) AS COMPARED TO THE MSCI WORLD EX U.S. SMALL CAP INDEX (UNAUDITED)
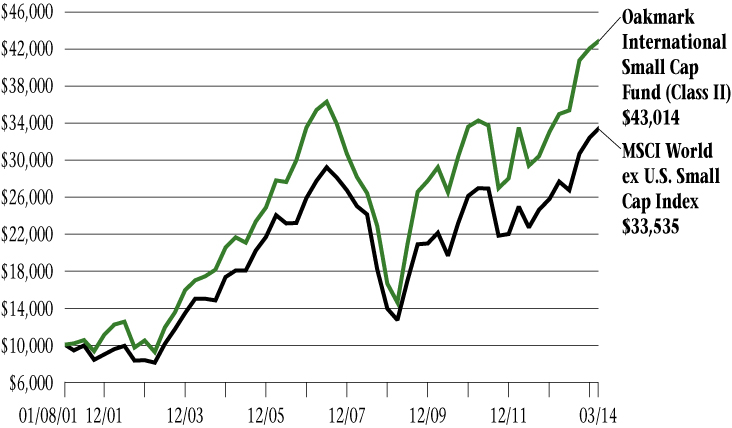
Average Annual Total Returns
(as of 03/31/14)
| (Unaudited) | | 1-year | | 5-year | | 10-year | | Since
Inception
(01/8/01) | |
Oakmark International Small Cap Fund
(Class II) | | | 22.84 | % | | | 24.18 | % | | | 9.76 | % | | | 11.66 | % | |
MSCI World ex U.S. Small Cap Index | | | 21.12 | % | | | 21.51 | % | | | 8.41 | % | | | 9.58 | % | |
The graph and table do not reflect the deduction of taxes that a shareholder would pay on fund distributions or the redemption of fund shares.
The expense ratio for Class II shares as of 09/30/13 was 1.64%.
The performance data quoted represents past performance. The above performance information does not reflect the imposition of a 2% redemption fee on shares held for 90 days or less. If reflected, the fee would reduce the performance quoted. Past performance does not guarantee future results. The investment return and principal value will fluctuate so that an investor's shares, when redeemed, may be worth more or less than their original cost. Current performance may be lower or higher than the performance data quoted. Average annual total return measures annualized change, while total return measures aggregate change. To obtain the most recent month-end performance data, visit oakmark.com.
The MSCI World ex U.S. Small Cap Index (Net) is a free float-adjusted market capitalization index that is designed to measure global developed market equity performance, excluding the U.S. The MSCI Small Cap Indices target 40% of the eligible Small Cap universe within each industry group, within each country. MSCI defines the Small Cap universe as all listed securities that have a market capitalization in the range of USD200-1,500 million. This benchmark calculates reinvested dividends net of withholding taxes using Luxembourg tax rates. This index is unmanaged and investors cannot invest directly in this index.
Harris Associates Securities L.P., member FINRA, May 2014
Item 2. Code of Ethics.
Not required in this filing.
Item 3. Audit Committee Financial Expert.
Not required in this filing.
Item 4. Principal Accountant Fees and Services.
Not required in this filing.
Item 5. Audit Committee of Listed Registrants.
Not required in this filing.
Item 6. Investments.
(a) The Schedule of Investments in securities of unaffiliated issuers is included as part of the semi-annual report to shareholders filed under Item 1 of this Form.
(b) No disclosures are required by this Item 6(b).
Item 7. Disclosure of Proxy Voting Policies and Procedures for Closed-End Management Investment Companies.
Not applicable.
Item 8. Portfolio Managers of Closed-End Management Investment Companies.
Not applicable.
Item 9. Purchases of Equity Securities by Closed-End Management Investment Company and Affiliated Purchasers.
Not applicable.
Item 10. Submission of Matters to a Vote of Security Holders.
During the period covered by this report, no amendments were made to the procedures adopted in fiscal year 2007.
Item 11. Controls and Procedures.
(a) Based on an evaluation of the disclosure controls and procedures (as defined in Rule
30a-3(c) under the Investment Company Act of 1940, the “Disclosure Controls”), the Disclosure Controls are effectively designed to ensure that information required to be disclosed by the Registrant in this report is recorded, processed, summarized and reported within 90 days prior to the filing of this report, including ensuring that information required to be disclosed in this report is accumulated and communicated to the Registrant’s management, including the Registrant’s principal executive officer and principal financial officer, as appropriate to allow timely decisions regarding required disclosure.
(b) There were no changes in the Registrant’s internal controls over financial reporting (as defined in Rule 30a-3(d) under the Investment Company Act of 1940) that occurred during the Registrant’s second fiscal quarter of the time period covered by this report that has materially affected, or is reasonably likely to materially affect, the Registrant’s internal control over financial reporting.
Item 12. Exhibits.
(a) | (1) | Not required in this filing. |
| | |
| (2) | Certifications of Kristi L. Rowsell, Principal Executive Officer, and Thomas E. Herman, Principal Financial Officer, pursuant to Rule 30a-2(a) under the Investment Company Act of 1940 (17 CFR 270.30a-2(a)), attached hereto as Exhibits (a)(2)(i) and (a)(2)(ii). |
| | |
| (3) | Not applicable. |
| | |
(b) | | Certifications of Kristi L. Rowsell, Principal Executive Officer and Thomas E. Herman, Principal Financial Officer, pursuant to Section 906 of the Sarbanes-Oxley Act of 2002, attached hereto as Exhibit (b). |
SIGNATURES
Pursuant to the requirements of the Securities Exchange Act of 1934 and the Investment Company Act of 1940, the Registrant has duly caused this report to be signed on its behalf by the undersigned, thereunto duly authorized.
Harris Associates Investment Trust
By: | /s/ Kristi L. Rowsell | |
| Kristi L. Rowsell | |
| Principal Executive Officer | |
Date: | May 28, 2014 | |
Pursuant to the requirements of the Securities Exchange Act of 1934 and the Investment Company Act of 1940, this report has been signed below by the following persons on behalf of the Registrant and in the capacities and on the dates indicated.
By: | /s/ Kristi L. Rowsell | |
| Kristi L. Rowsell | |
| Principal Executive Officer | |
Date: | May 28, 2014 | |
| | |
| | |
By: | /s/ Thomas E. Herman | |
| Thomas E. Herman | |
| Principal Financial Officer | |
Date: | May 28, 2014 | |