UNITED STATES
SECURITIES AND EXCHANGE COMMISSION
Washington, D.C. 20549
FORM N-CSR
CERTIFIED SHAREHOLDER REPORT OF REGISTERED
MANAGEMENT INVESTMENT COMPANIES
Investment Company Act file number | 811-06279 |
|
Harris Associates Investment Trust |
(Exact name of registrant as specified in charter) |
|
111 South Wacker Drive, Suite 4600 Chicago, Illinois | | 60606-4319 |
(Address of principal executive offices) | | (Zip code) |
| | | |
Kristi L. Rowsell
Harris Associates L.P.
111 South Wacker Drive, Suite 4600
Chicago, Illinois 60606-4319 | Ndenisarya M. Bregasi, Esq.
K&L Gates LLP
1601 K Street, N.W.
Washington, D.C. 20006-1600 |
|
(Name and address of agent for service) |
|
Registrant’s telephone number, including area code: | (312) 646-3600 | |
|
Date of fiscal year end: | 09/30/17 | |
|
Date of reporting period: | 03/31/17 | |
| | | | | | |
Item 1. Reports to Shareholders.
OAKMARK FUNDS
SEMI-ANNUAL REPORT | MARCH 31, 2017
OAKMARK FUND
OAKMARK SELECT FUND
OAKMARK EQUITY AND INCOME FUND
OAKMARK GLOBAL FUND
OAKMARK GLOBAL SELECT FUND
OAKMARK INTERNATIONAL FUND
OAKMARK INTERNATIONAL SMALL CAP FUND

Oakmark Funds
2017 Semi-Annual Report
TABLE OF CONTENTS
Fund Expenses | | | 1 | | |
Commentary on Oakmark and Oakmark Select Funds | | | 2 | | |
Oakmark Fund | |
Summary Information | | | 4 | | |
Portfolio Manager Commentary | | | 5 | | |
Schedule of Investments | | | 6 | | |
Oakmark Select Fund | |
Summary Information | | | 8 | | |
Portfolio Manager Commentary | | | 9 | | |
Schedule of Investments | | | 10 | | |
Oakmark Equity and Income Fund | |
Summary Information | | | 12 | | |
Portfolio Manager Commentary | | | 13 | | |
Schedule of Investments | | | 15 | | |
Oakmark Global Fund | |
Summary Information | | | 22 | | |
Portfolio Manager Commentary | | | 23 | | |
Schedule of Investments | | | 24 | | |
Oakmark Global Select Fund | |
Summary Information | | | 26 | | |
Portfolio Manager Commentary | | | 27 | | |
Schedule of Investments | | | 28 | | |
Oakmark International Fund | |
Summary Information | | | 30 | | |
Portfolio Manager Commentary | | | 31 | | |
Schedule of Investments | | | 32 | | |
Oakmark International Small Cap Fund | |
Summary Information | | | 34 | | |
Portfolio Manager Commentary | | | 35 | | |
Schedule of Investments | | | 36 | | |
Financial Statements | |
Statements of Assets and Liabilities | | | 38 | | |
Statements of Operations | | | 40 | | |
Statements of Changes in Net Assets | | | 42 | | |
Notes to Financial Statements | | | 49 | | |
Financial Highlights | | | 60 | | |
Disclosure Regarding Investment Advisory
Agreements Approval | | | 68 | | |
Disclosures and Endnotes | | | 71 | | |
Trustees and Officers | | | 73 | | |
FORWARD-LOOKING STATEMENT DISCLOSURE
One of our most important responsibilities as mutual fund managers is to communicate with shareholders in an open and direct manner. Some of our comments in our letters to shareholders are based on current management expectations and are considered "forward-looking statements." Actual future results, however, may prove to be different from our expectations. You can identify forward-looking statements by words such as "estimate", "may", "will", "expect", "believe",
"plan" and other similar terms. We cannot promise future returns. Our opinions are a reflection of our best judgment at the time this report is compiled, and we disclaim any obligation to update or alter forward-looking statements as a result of new information, future events, or otherwise.
Oakmark.com

This page intentionally left blank.
OAKMARK FUNDS
Fund Expenses (Unaudited)
A shareholder of each Fund incurs ongoing costs, including investment advisory fees, transfer agent fees and other Fund expenses. The examples below are intended to help shareholders understand the ongoing costs (in dollars) of investing in each Fund and to compare these costs with the ongoing costs of investing in other funds.
The following table provides information about actual account values and actual Fund expenses as well as hypothetical account values and hypothetical fund expenses for shares of each Fund.
ACTUAL EXPENSES
The following table shows the expenses a shareholder would have paid on a $1,000 investment in each Fund from October 1, 20161 to March 31, 2017, as well as how much a $1,000 investment would be worth at the close of the period, assuming actual Fund returns and expenses. A shareholder can estimate expenses incurred for the period by dividing the account value at March 31, 2017, by $1,000 and multiplying the result by the number in the "Actual—Expenses Paid During Period" column shown below.
Shares of Oakmark International Small Cap Fund, invested for 90 days or less, may be charged a 2% redemption fee upon redemption. Please consult the Funds' prospectus at Oakmark.com for more information.
HYPOTHETICAL EXAMPLE FOR COMPARISON PURPOSES
The following table provides information about hypothetical account values and hypothetical expenses for shares of each Fund based on actual expense ratios and an assumed rate of return of 5% per year before expenses, which are not the Funds' actual returns. The hypothetical account values and expenses may not be used to estimate the actual ending account balances or actual expenses shareholders paid for the period. Shareholders may use this information to compare the ongoing costs of investing in a Fund and other funds. To do so, compare this 5% hypothetical example with the 5% hypothetical examples that appear in the shareholder reports of the other funds.
Please note that the expenses shown in the table are meant to highlight your ongoing costs only and do not reflect any transaction costs, such as redemption fees. Therefore, the "Hypothetical—Expenses Paid During Period" column of the table is useful in comparing ongoing costs only and will not help you determine the relative total costs of owning different funds. If these transaction costs were included, the total costs would have been higher.
| | | | ACTUAL | | HYPOTHETICAL
(5% annual return
before expenses) | | | |
| | Beginning
Account Value
(10/1/161) | | Ending
Account Value
(3/31/17) | | Expenses
Paid During
Period | | Ending
Account Value
(3/31/17) | | Expenses
Paid During
Period2 | | Annualized
Expense
Ratio | |
Oakmark Fund | |
Investor Class | | $ | 1,000.00 | | | $ | 1,127.50 | | | $ | 4.613 | | | $ | 1,020.59 | | | $ | 4.38 | | | | 0.87 | % | |
Advisor Class | | $ | 1,000.00 | | | $ | 1,058.40 | | | $ | 2.424 | | | $ | 1,021.39 | | | $ | 3.58 | | | | 0.71 | % | |
Institutional Class | | $ | 1,000.00 | | | $ | 1,058.30 | | | $ | 2.394 | | | $ | 1,021.44 | | | $ | 3.53 | | | | 0.70 | % | |
Service Class | | $ | 1,000.00 | | | $ | 1,125.70 | | | $ | 6.253 | | | $ | 1,019.05 | | | $ | 5.94 | | | | 1.18 | % | |
Oakmark Select Fund | |
Investor Class | | $ | 1,000.00 | | | $ | 1,136.10 | | | $ | 5.173 | | | $ | 1,020.09 | | | $ | 4.89 | | | | 0.97 | % | |
Advisor Class | | $ | 1,000.00 | | | $ | 1,058.00 | | | $ | 2.804 | | | $ | 1,020.84 | | | $ | 4.13 | | | | 0.82 | % | |
Institutional Class | | $ | 1,000.00 | | | $ | 1,058.00 | | | $ | 2.734 | | | $ | 1,020.94 | | | $ | 4.03 | | | | 0.80 | % | |
Service Class | | $ | 1,000.00 | | | $ | 1,134.30 | | | $ | 6.863 | | | $ | 1,018.50 | | | $ | 6.49 | | | | 1.29 | % | |
Oakmark Equity and Income Fund | |
Investor Class | | $ | 1,000.00 | | | $ | 1,093.30 | | | $ | 4.073 | | | $ | 1,021.04 | | | $ | 3.93 | | | | 0.78 | % | |
Advisor Class | | $ | 1,000.00 | | | $ | 1,057.70 | | | $ | 2.084 | | | $ | 1,021.89 | | | $ | 3.07 | | | | 0.61 | % | |
Institutional Class | | $ | 1,000.00 | | | $ | 1,057.70 | | | $ | 2.054 | | | $ | 1,021.94 | | | $ | 3.02 | | | | 0.60 | % | |
Service Class | | $ | 1,000.00 | | | $ | 1,091.30 | | | $ | 5.793 | | | $ | 1,019.40 | | | $ | 5.59 | | | | 1.11 | % | |
Oakmark Global Fund | |
Investor Class | | $ | 1,000.00 | | | $ | 1,158.00 | | | $ | 6.243 | | | $ | 1,019.15 | | | $ | 5.84 | | | | 1.16 | % | |
Advisor Class | | $ | 1,000.00 | | | $ | 1,109.80 | | | $ | 3.464 | | | $ | 1,020.00 | | | $ | 4.99 | | | | 0.99 | % | |
Institutional Class | | $ | 1,000.00 | | | $ | 1,109.80 | | | $ | 3.434 | | | $ | 1,020.04 | | | $ | 4.94 | | | | 0.98 | % | |
Service Class | | $ | 1,000.00 | | | $ | 1,155.90 | | | $ | 7.953 | | | $ | 1,017.55 | | | $ | 7.44 | | | | 1.48 | % | |
Oakmark Global Select Fund | |
Investor Class | | $ | 1,000.00 | | | $ | 1,136.90 | | | $ | 6.073 | | | $ | 1,019.25 | | | $ | 5.74 | | | | 1.14 | % | |
Advisor Class | | $ | 1,000.00 | | | $ | 1,086.60 | | | $ | 3.424 | | | $ | 1,020.00 | | | $ | 4.99 | | | | 0.99 | % | |
Institutional Class | | $ | 1,000.00 | | | $ | 1,086.60 | | | $ | 3.354 | | | $ | 1,020.09 | | | $ | 4.89 | | | | 0.97 | % | |
Oakmark International Fund | |
Investor Class | | $ | 1,000.00 | | | $ | 1,164.50 | | | $ | 5.183 | | | $ | 1,020.14 | | | $ | 4.84 | | | | 0.96 | % | |
Advisor Class | | $ | 1,000.00 | | | $ | 1,132.10 | | | $ | 2.864 | | | $ | 1,020.89 | | | $ | 4.08 | | | | 0.81 | % | |
Institutional Class | | $ | 1,000.00 | | | $ | 1,132.10 | | | $ | 2.764 | | | $ | 1,021.04 | | | $ | 3.93 | | | | 0.78 | % | |
Service Class | | $ | 1,000.00 | | | $ | 1,162.70 | | | $ | 6.693 | | | $ | 1,018.75 | | | $ | 6.24 | | | | 1.24 | % | |
Oakmark International Small Cap Fund | |
Investor Class | | $ | 1,000.00 | | | $ | 1,112.40 | | | $ | 7.273 | | | $ | 1,018.05 | | | $ | 6.94 | | | | 1.38 | % | |
Advisor Class | | $ | 1,000.00 | | | $ | 1,131.40 | | | $ | 4.174 | | | $ | 1,019.05 | | | $ | 5.94 | | | | 1.18 | % | |
Institutional Class | | $ | 1,000.00 | | | $ | 1,131.40 | | | $ | 4.064 | | | $ | 1,019.20 | | | $ | 5.79 | | | | 1.15 | % | |
Service Class | | $ | 1,000.00 | | | $ | 1,110.50 | | | $ | 8.953 | | | $ | 1,016.45 | | | $ | 8.55 | | | | 1.70 | % | |
1 The beginning date for the Advisor Class and Institutional Class is November 30, 2016, the inception date.
2 Hypothetical expenses for each share class are equal to the Annualized Expense Ratio, multiplied by the average account value over the period, multiplied by 182 and divided by 365 (to reflect one-half year period)
3 Actual expenses are calculated using the Annualized Expense Ratio, multiplied by the average account value over the period, multiplied by 182 and divided by 365 (to reflect one-half year period)
4 Actual expenses are calculated using the Annualized Expense Ratio, multiplied by the average account value over the period, multiplied by 121 and divided by 365 (to reflect inception date through 3/31/17 period)
Oakmark.com 1
Oakmark and Oakmark Select Funds March 31, 2017
Portfolio Manager Commentary

William C. Nygren, CFA
Portfolio Manager
oakmx@oakmark.com
oaklx@oakmark.com
oakwx@oakmark.com
At Oakmark, we are long-term investors. We attempt to identify growing businesses that are managed to benefit their shareholders. We will purchase stock in those businesses only when priced substantially below our estimate of intrinsic value. After purchase, we patiently wait for the gap between stock price and intrinsic value to close.
"Oh Lord, it's hard to be humble, when you're perfect in every way."
-It's Hard To Be Humble by Mac Davis, 1974
What Makes a Good Oakmark Analyst?
March is one of my favorite months. The darkness of Chicago's winter slowly lifts as each day gets a little bit warmer and longer. Baseball spring training gets into full speed, and fans from every team can believe that this is their year. College basketball's tournament, March Madness, is perhaps the most exciting tournament in sports. The games are always full of irony as invariably the slowest paced teams frustrate the run-and-gun teams. Or, as happened this year, the worst free-throw shooting team in the tournament, my Wisconsin Badgers, couldn't intentionally miss a free throw with four seconds left, instead allowing Florida to set up a game winning three-pointer. In so many games we see teams' greatest strengths become weaknesses, and weaknesses become strengths.
I also like March because it is the month I get to speak to investment students at my alma mater's Applied Securities Analysis Program and Bruce Greenwald's value investing program at Columbia. Typical topics include how I got interested in investing, my education and career path, and what makes Oakmark unique. Without fail, the aspiring investment professionals will eventually ask about the characteristics we look for when we hire analysts at Oakmark or, more generally, "What do you think makes a good investment analyst?" Perhaps the answer might give some insight into how we think at Oakmark.
When I served as director of research, I used to joke that every analyst search we conducted started with the same list of requirements: "High GPA from a good university, a major in finance or accounting, intuitive math skills, strong oral and written communication ability, three to five years' related work experience, intense competitive drive, and activities demonstrating leadership. MBA or CFA required." Yet almost every hire was somewhat outside that box. We hired some analysts with low GPAs, some with different degrees and some from second-tier colleges. We hired some with over 10 years' experience, and others with no experience at all. Some had neither an MBA nor a CFA. What we realized was that our search criteria, though representative of our typical hires, was not really defining the candidates we were looking for. Those criteria defined the candidates most investment firms are looking for, but didn't at all get to what makes Oakmark unique.
Team Player
There are three additional characteristics that we believe are necessary to succeed at Oakmark that we either don't think we can teach or don't want to teach, so we require them to be present before we hire an analyst. First is being a team player. At many investment firms, analysts have a one-on-one
relationship with portfolio managers. They develop their stock recommendations and present them to a portfolio manager who decides whether or not the stocks will be purchased. If analysts pick good stocks, they will be paid well and their careers will progress. In that setup, it doesn't really matter whether the analyst is a team player or not. Oakmark is different.
Oakmark analysts succeed by helping the team succeed. Yes, we expect them to find good stocks to purchase, but that effort is collaborative. An analyst who begins working on a new buy idea seeks input from the rest of the investment team before the idea is finalized. When the work is presented, it is the job of every investment professional at our company to attempt to find flaws that would prevent us from investing. Throughout the time we hold a stock, the analysts will challenge each other as to whether or not our sell target correctly incorporates all the new information we've seen subsequent to our purchase. When the stock is sold, it is treated as a victory for the team if it went up, and a team defeat if it did not. We all understand that we do well financially when our shareholders do well financially. That's in part because a major factor in our compensation review is how well an analyst helps improve the team's stock selection.
We know that anyone who puts their personal success over Oakmark's success will not last long at our company. So, we look for clues in resumes such as a history of playing team sports or other activities where accomplishments by a group are more important than by an individual. We know that we can't teach someone how to be a team player.
Value Investor
More than 30 years ago, Warren Buffett wrote an article that has become a value investing classic: The Superinvestors of Graham and Doddsville (Fall 1984, Hermes—the Columbia Business School Magazine)1. If you haven't read it, or haven't read it recently, it is well worth the time. In that article, Buffett explained the futility of trying to convert investors to a value investing philosophy:
"It is extraordinary to me that the idea of buying dollar bills for 40c takes immediately with people or it doesn't take at all. It's like an inoculation. If it doesn't grab a person right away, I find you can talk to him for years, and show him records, and it just doesn't make any difference. They just don't seem able to grasp the concept, simple as it is...I've never seen anyone who became a gradual convert over a ten-year period to this approach. It doesn't seem to be a matter of I.Q. or academic training. It is instant recognition or it is nothing."
We 100% agree with Buffett. Everything we do at Oakmark is based on value investing. We don't know how to teach someone how to think like a value investor. You can't succeed at Oakmark without practicing value investing. Therefore, we will
See accompanying Disclosures and Endnotes on page 71.
2 OAKMARK FUNDS
Oakmark and Oakmark Select Funds March 31, 2017
Portfolio Manager Commentary (continued)
only hire analysts who have developed a value philosophy prior to joining our team.
Humility
There are some characteristics for successful analysts that are simple "more is better" traits. Intelligence, curiosity, communication skills—all are "more is better." Then you have the continuums where, like NCAA basketball teams, a strength carried to the extreme becomes a weakness. We want discipline, but we also want creativity. We demand patience, but don't want stubbornness. We want thoroughness, but require decisions based on incomplete information. Success requires striking an appropriate balance between these traits that sound like opposites. Being at one extreme or the other is a recipe for failure.
One of the most important continuums for us is confidence versus humility. It is especially important for a value investor to have the confidence to take a position when the vast majority of investors are on the opposing side. But without humility, one loses the ability to admit a mistake. I'm reminded of the early 1980's TV show Happy Days with the super-cool Fonzie who could never say the words "I was wrong." Fonzie would have been an awful investor.
In a book many in our research department have enjoyed, Superforecasting: The Art and Science of Prediction, Philip Tetlock and Dan Gardner state:
"The humility required for good judgment is not self-doubt—the sense that you are untalented, unintelligent, or unworthy. It is intellectual humility. It is a recognition that reality is profoundly complex, that seeing things clearly is a constant struggle, when it can be done at all, and that human judgment must therefore be riddled with mistakes."
What we are looking for in Oakmark analysts is confidence paired with the humility to remain open to evidence that shows they are wrong.
One of my investing heroes, former hedge fund pioneer Michael Steinhardt, said, "The balance between confidence and humility is best learned through extensive experience and mistakes."2 Unlike being a team player or a value investor, with time, almost every investor develops humility. But it is an expensive lesson to learn. We want analysts who developed their humility by losing money somewhere else.
I can't count the number of resumes I've seen or conversations I've had with students where they excitedly state that their personal portfolio returned "X" percent last year. And of course, "X" is always some number that is astoundingly high relative to the market or to Oakmark returns. That record is almost always accompanied by scorn for "incompetent" professional investors and the offer to teach us the secrets of their success. I smile as I mentally mark off the box "needs to be humbled by losing money." Then I wish them great success in their job search and suggest they check back with us in a few years.
See accompanying Disclosures and Endnotes on page 71.
Oakmark.com 3
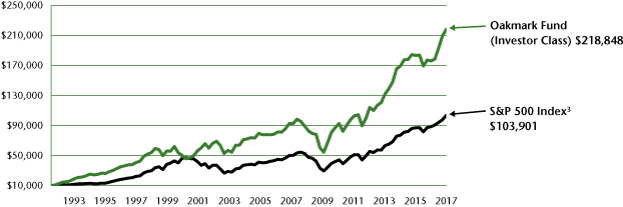
Oakmark Fund March 31, 2017
Summary Information
VALUE OF A $10,000 INVESTMENT
Since Inception - 08/05/91 (Unaudited)
PERFORMANCE
| | | | | Average Annual Total Returns (as of 03/31/17) | | | |
(Unaudited) | | Total Return
Last 3 Months | | 1-year | | 3-year | | 5-year | | 10-year | | Since
Inception | | Inception
Date | |
Oakmark Fund (Investor Class) | | | 4.11 | % | | | 23.99 | % | | | 8.86 | % | | | 13.88 | % | | | 8.97 | % | | | 12.78 | % | | 08/05/91 | |
S&P 500 Index | | | 6.07 | % | | | 17.17 | % | | | 10.37 | % | | | 13.30 | % | | | 7.51 | % | | | 9.55 | % | | | |
Dow Jones Industrial Average4 | | | 5.19 | % | | | 19.91 | % | | | 10.61 | % | | | 12.15 | % | | | 8.10 | % | | | 10.43 | % | | | |
Lipper Large Cap Value Fund Index5 | | | 3.58 | % | | | 19.53 | % | | | 8.01 | % | | | 12.24 | % | | | 5.83 | % | | | 8.86 | % | | | |
Oakmark Fund (Advisor Class) | | | 4.15 | % | | | N/A | | | | N/A | | | | N/A | | | | N/A | | | | 5.84 | %* | | 11/30/16 | |
Oakmark Fund (Institutional Class) | | | 4.15 | % | | | N/A | | | | N/A | | | | N/A | | | | N/A | | | | 5.83 | %* | | 11/30/16 | |
Oakmark Fund (Service Class) | | | 4.04 | % | | | 23.62 | % | | | 8.51 | % | | | 13.53 | % | | | 8.63 | % | | | 8.09 | % | | 04/05/01 | |
The graph and table above do not reflect the deduction of taxes that a shareholder would pay on Fund distributions or the redemption of Fund shares.
* Returns Since Inception for the Advisor Class and the Institutional Class are not annualized.
Past performance is no guarantee of future results. The performance data quoted represents past performance. Current performance may be lower or higher than the performance data quoted. Total return includes change in share prices and, in each case, includes reinvestment of dividends and capital gain distributions. The investment return and principal value vary so that an investor's shares when redeemed may be worth more or less than the original cost. To obtain the most recent month-end performance, please visit Oakmark.com.
TOP TEN EQUITY HOLDINGS6 | | % of Net Assets | |
Citigroup, Inc. | | | 3.4 | | |
Alphabet Inc., Class C | | | 3.2 | | |
Apple, Inc. | | | 2.7 | | |
Bank of America Corp. | | | 2.7 | | |
Visa, Inc., Class A | | | 2.6 | | |
American International Group, Inc. | | | 2.5 | | |
General Electric Co. | | | 2.5 | | |
MasterCard, Inc., Class A | | | 2.5 | | |
JPMorgan Chase & Co. | | | 2.4 | | |
Texas Instruments, Inc. | | | 2.4 | | |
FUND STATISTICS | |
Ticker* | | OAKMX | |
Inception* | | 08/05/1991 | |
Number of Equity Holdings | | 50 | |
Net Assets | | $17.1 billion | |
Benchmark | | S&P 500 Index | |
Weighted Average Market Cap | | $133.7 billion | |
Median Market Cap | | $50.5 billion | |
Portfolio Turnover (for the 6-months ended 03/31/17) | | 11% | |
Expense Ratio - Investor Class (as of 09/30/16)* | | 0.89% | |
* This information is related to the Investor Class. Please visit Oakmark.com for information related to the Advisor, Institutional and Service Classes.
SECTOR ALLOCATION | | % of Net Assets | |
Financials | | | 27.1 | | |
Information Technology | | | 25.1 | | |
Consumer Discretionary | | | 13.5 | | |
Industrials | | | 11.0 | | |
Consumer Staples | | | 6.3 | | |
Energy | | | 6.1 | | |
Health Care | | | 6.0 | | |
Short-Term Investments and Other | | | 4.9 | | |
See accompanying Disclosures and Endnotes on page 71.
4 OAKMARK FUNDS
Oakmark Fund March 31, 2017
Portfolio Manager Commentary


William C. Nygren, CFA
Portfolio Manager
oakmx@oakmark.com
Kevin Grant, CFA
Portfolio Manager
oakmx@oakmark.com
The Oakmark Fund increased 4.1% in the first quarter of 2017, hitting an all-time high adjusted NAV for the third quarter in a row. The Oakmark Fund lagged behind the S&P 500's3 strong 6.1% gain. Although the S&P 500 also hit new highs during the first quarter, the momentum from January and February faded in March as concerns grew over the Trump administration's plans for healthcare reform, new infrastructure spending and tax reform. Oil commodity prices also weakened in March, which hurt the performance of our energy holdings during the quarter, but we believe supply-and-demand dynamics will lead to higher commodity price trends over the long term. The information technology sector was especially strong during the first quarter, with the NASDAQ7 Index gaining 10.1%. In addition, the information technology sector has provided the highest contribution to return of the Oakmark Fund over the past three years, with several holdings returning more than 20% annually (Apple, Microsoft and Texas Instruments).
Our best contributing sectors for the first quarter were information technology and consumer staples. Apple and Unilever were the best individual performers, up 25% and 22%, respectively, and the information technology sector as a whole returned 8%. Our lowest contributing sectors for the quarter were energy and consumer discretionary. Our worst individual securities for the quarter were Apache and Anadarko. During the quarter, we added new positions in Chesapeake Energy, Delphi Automotive and Moody's (see below). We eliminated positions in Halliburton and Sanofi. Halliburton was sold when it reached our estimate of intrinsic value, and Sanofi was sold because we believed we had higher-conviction, higher-return options within the healthcare sector.
Chesapeake Energy Corp. (CHK-$6)
The downturn in oil and gas prices since late 2014 has created an opportunity to buy well-managed exploration and production companies at discounted values. We believe Chesapeake Energy is among the best managed oil and gas companies and is trading well below the value of its assets. The company has sizeable acreage holdings across the U.S., and its management is focused on developing these assets in a cost-effective and high-return manner. The team has successfully navigated the commodity price downturn while prioritizing the interests of equity holders, and we expect this shareholder-friendly team will continue to create value in an improving commodity price environment. With the enterprise trading at a substantial discount to our estimate of asset value, we believe Chesapeake is an attractive holding.
Delphi Automotive PLC (DLPH-$80)
Delphi is an automobile parts supplier that is well positioned for the secular trends that will continue to drive the auto industry. We believe Delphi will benefit from increasing
governmental regulations for safety, fuel efficiency and emissions control, as well as rapidly growing consumer demand for vehicle connectivity. Since Delphi's initial public offering in 2010, we find the company has generated robust sales and earnings growth along with ample free cash flow. Despite strong fundamental performance, the stock trades at a discount to the market P/E8 as well as our estimate of intrinsic value due to concerns about the U.S. auto cycle, short term uncertainty in China and an uncharacteristic downward revision to earnings guidance in 2016. We believe these headwinds will prove temporary and that the company's performance will improve.
Moody's Corp. (MCO-$112)
Moody's provides essential information to the world's capital markets. We have a long history with Moody's, dating back to the 1990s when it was a part of Dun & Bradstreet. The stock briefly traded for less than 17x 2018 earnings estimates because investors feared that rising interest rates and changing tax policies would depress debt issuance. Although such events would likely result in slower growth in the short term, we believe the company's long-term prospects remain compelling. Bonds issued with a Moody's rating pay meaningfully lower interest rates than those without a Moody's rating, and the price paid to Moody's is much lower than the interest savings the issuer realizes. We believe this will create consistent demand for bond ratings as debt markets grow. Management is cognizant of the value that the Moody's rating provides, and they are able to steadily raise prices year after year. In our view, Moody's is a great business with growing profits, run by a management team we've known and respected for years, and the shares trade at a price that is well below our estimate of intrinsic value.
See accompanying Disclosures and Endnotes on page 71.
Oakmark.com 5
Oakmark Fund March 31, 2017 (Unaudited)
Schedule of Investments (in thousands)
| | | Shares | | Value | |
COMMON STOCKS - 95.1% | |
FINANCIALS - 27.1% | |
DIVERSIFIED FINANCIALS - 10.4% | |
Capital One Financial Corp. | | | 4,463 | | | $ | 386,746 | | |
State Street Corp. | | | 4,700 | | | | 374,167 | | |
Ally Financial, Inc. | | | 17,435 | | | | 354,453 | | |
Bank of New York Mellon Corp. | | | 6,320 | | | | 298,476 | | |
The Goldman Sachs Group, Inc. | | | 1,105 | | | | 253,841 | | |
Moody's Corp. | | | 1,000 | | | | 112,040 | | |
| | | | | | 1,779,723 | | |
BANKS - 10.1% | |
Citigroup, Inc. | | | 9,630 | | | | 576,066 | | |
Bank of America Corp. | | | 19,300 | | | | 455,287 | | |
JPMorgan Chase & Co. | | | 4,715 | | | | 414,166 | | |
Wells Fargo & Co. | | | 5,110 | | | | 284,423 | | |
| | | | | | 1,729,942 | | |
INSURANCE - 6.6% | |
American International Group, Inc. | | | 6,980 | | | | 435,762 | | |
Aflac, Inc. | | | 4,910 | | | | 355,582 | | |
Aon PLC | | | 2,790 | | | | 331,145 | | |
| | | | | | 1,122,489 | | |
| | | | | | 4,632,154 | | |
INFORMATION TECHNOLOGY - 25.1% | |
SOFTWARE & SERVICES - 14.1% | |
Alphabet, Inc., Class C (a) | | | 651 | | | | 540,256 | | |
Visa, Inc., Class A | | | 5,085 | | | | 451,904 | | |
MasterCard, Inc., Class A | | | 3,770 | | | | 424,012 | | |
Oracle Corp. | | | 8,765 | | | | 391,007 | | |
Automatic Data Processing, Inc. | | | 3,420 | | | | 350,174 | | |
Microsoft Corp. | | | 3,890 | | | | 256,195 | | |
| | | | | | 2,413,548 | | |
SEMICONDUCTORS & SEMICONDUCTOR EQUIPMENT - 6.2% | |
Texas Instruments, Inc. | | | 5,120 | | | | 412,467 | | |
Intel Corp. | | | 10,155 | | | | 366,291 | | |
QUALCOMM, Inc. | | | 4,745 | | | | 272,078 | | |
| | | | | | 1,050,836 | | |
TECHNOLOGY HARDWARE & EQUIPMENT - 4.8% | |
Apple, Inc. | | | 3,187 | | | | 457,845 | | |
TE Connectivity, Ltd. | | | 4,936 | | | | 367,952 | | |
| | | | | | 825,797 | | |
| | | | | | 4,290,181 | | |
CONSUMER DISCRETIONARY - 13.5% | |
AUTOMOBILES & COMPONENTS - 5.2% | |
Fiat Chrysler Automobiles N.V. (a) | | | 23,160 | | | | 253,140 | | |
General Motors Co. | | | 6,850 | | | | 242,216 | | |
Harley-Davidson, Inc. | | | 3,502 | | | | 211,871 | | |
Delphi Automotive PLC | | | 2,200 | | | | 177,078 | | |
| | | | | | 884,305 | | |
| | | Shares | | Value | |
MEDIA - 2.7% | |
Comcast Corp., Class A | | | 6,638 | | | $ | 249,537 | | |
News Corp., Class A | | | 16,691 | | | | 216,979 | | |
| | | | | | 466,516 | | |
RETAILING - 2.5% | |
Liberty Interactive Corp. QVC Group,
Class A (a) | | | 10,891 | | | | 218,036 | | |
AutoNation, Inc. (a) | | | 4,900 | | | | 207,221 | | |
| | | | | | 425,257 | | |
CONSUMER DURABLES & APPAREL - 1.7% | |
Whirlpool Corp. | | | 1,730 | | | | 296,401 | | |
CONSUMER SERVICES - 1.4% | |
MGM Resorts International | | | 8,400 | | | | 230,160 | | |
| | | | | | 2,302,639 | | |
INDUSTRIALS - 11.0% | |
CAPITAL GOODS - 8.7% | |
General Electric Co. | | | 14,250 | | | | 424,650 | | |
Parker-Hannifin Corp. | | | 2,439 | | | | 391,062 | | |
Cummins, Inc. | | | 2,320 | | | | 350,784 | | |
Caterpillar, Inc. | | | 3,500 | | | | 324,660 | | |
| | | | | | 1,491,156 | | |
TRANSPORTATION - 2.3% | |
FedEx Corp. | | | 1,980 | | | | 386,397 | | |
| | | | | | 1,877,553 | | |
CONSUMER STAPLES - 6.3% | |
FOOD, BEVERAGE & TOBACCO - 4.1% | |
Diageo PLC (b) | | | 3,100 | | | | 358,298 | | |
Nestle SA (b) | | | 4,565 | | | | 351,049 | | |
| | | | | | 709,347 | | |
HOUSEHOLD & PERSONAL PRODUCTS - 2.2% | |
Unilever PLC (b) | | | 7,563 | | | | 373,158 | | |
| | | | | | 1,082,505 | | |
ENERGY - 6.1% | |
Apache Corp. | | | 7,440 | | | | 382,335 | | |
Anadarko Petroleum Corp. | | | 5,100 | | | | 316,200 | | |
National Oilwell Varco, Inc. | | | 5,429 | | | | 217,645 | | |
Chesapeake Energy Corp. (a) | | | 20,000 | | | | 118,800 | | |
| | | | | | 1,034,980 | | |
HEALTH CARE - 6.0% | |
HEALTH CARE EQUIPMENT & SERVICES - 6.0% | |
UnitedHealth Group, Inc. | | | 2,195 | | | | 360,002 | | |
Baxter International, Inc. | | | 5,300 | | | | 274,858 | | |
HCA Holdings, Inc. (a) | | | 2,216 | | | | 197,157 | | |
Medtronic PLC | | | 2,440 | | | | 196,567 | | |
| | | | | | 1,028,584 | | |
TOTAL COMMON STOCKS - 95.1%
(COST $10,212,030) | | | | | 16,248,596 | | |
See accompanying Notes to Financial Statements.
6 OAKMARK FUNDS
Oakmark Fund March 31, 2017 (Unaudited)
Schedule of Investments (in thousands) (continued)
| | | Par Value | | Value | |
SHORT TERM INVESTMENTS - 4.9% | |
U.S. GOVERNMENT BILL - 4.1% | |
United States Treasury Bills,
0.66% - 0.75%, due
04/06/17 - 04/27/17 (c)
(Cost $699,806) | | $ | 700,000 | | | $ | 699,806 | | |
REPURCHASE AGREEMENT - 0.8% | |
Fixed Income Clearing Corp. Repurchase
Agreement, 0.22% dated 03/31/17 due
04/03/17, repurchase price $142,700
collateralized by a United States Treasury
Note, 2.250%, due 01/31/24, value
plus accrued interest of $145,553
(Cost: $142,698) | | | 142,698 | | | | 142,698 | | |
TOTAL SHORT TERM INVESTMENTS - 4.9%
(COST $842,504) | | | | | 842,504 | | |
TOTAL INVESTMENTS - 100.0%
(COST $11,054,534) | | | | | 17,091,100 | | |
Foreign Currencies (Cost $0) - 0.0% (d) | | | | | 0 | (e) | |
Other Assets In Excess of Liabilities - 0.0% (d) | | | | | 3,948 | | |
TOTAL NET ASSETS - 100.0% | | | | $ | 17,095,048 | | |
(a) Non-income producing security
(b) Sponsored American Depositary Receipt
(c) The rate shown represents the annualized yield at the time of purchase; not a coupon rate.
(d) Amount rounds to less than 0.1%.
(e) Amount rounds to less than $1,000.
See accompanying Notes to Financial Statements.
Oakmark.com 7
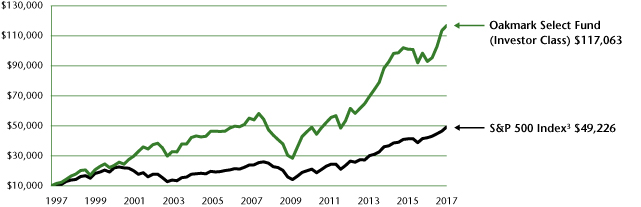
Oakmark Select Fund March 31, 2017
Summary Information
VALUE OF A $10,000 INVESTMENT
Since Inception - 11/01/96 (Unaudited)
PERFORMANCE
| | | | | Average Annual Total Returns (as of 03/31/17) | | | |
(Unaudited) | | Total Return
Last 3 Months | | 1-year | | 3-year | | 5-year | | 10-year | | Since
Inception | | Inception
Date | |
Oakmark Select Fund (Investor Class) | | | 3.00 | % | | | 25.76 | % | | | 8.02 | % | | | 13.70 | % | | | 8.05 | % | | | 12.81 | % | | 11/01/96 | |
S&P 500 Index | | | 6.07 | % | | | 17.17 | % | | | 10.37 | % | | | 13.30 | % | | | 7.51 | % | | | 8.12 | % | | | |
Lipper Multi-Cap Value Fund Index9 | | | 3.25 | % | | | 18.83 | % | | | 7.14 | % | | | 11.96 | % | | | 5.41 | % | | | 7.67 | % | | | |
Oakmark Select Fund (Advisor Class) | | | 3.04 | % | | | N/A | | | | N/A | | | | N/A | | | | N/A | | | | 5.80 | %* | | 11/30/16 | |
Oakmark Select Fund (Institutional Class) | | | 3.04 | % | | | N/A | | | | N/A | | | | N/A | | | | N/A | | | | 5.80 | %* | | 11/30/16 | |
Oakmark Select Fund (Service Class) | | | 2.89 | % | | | 25.36 | % | | | 7.68 | % | | | 13.33 | % | | | 7.75 | % | | | 9.43 | % | | 12/31/99 | |
The graph and table do not reflect the deduction of taxes that a shareholder would pay on Fund distributions or the redemption of Fund shares.
* Returns Since Inception for the Advisor Class and the Institutional Class are not annualized.
Past performance is no guarantee of future results. The performance data quoted represents past performance. Current performance may be lower or higher than the performance data quoted. Total return includes change in share prices and, in each case, includes reinvestment of dividends and capital gain distributions. The investment return and principal value vary so that an investor's shares when redeemed may be worth more or less than the original cost. To obtain the most recent month-end performance, please visit Oakmark.com.
TOP TEN EQUITY HOLDINGS6 | | % of Net Assets | |
Alphabet Inc., Class C | | | 8.0 | | |
CBRE Group, Inc., Class A | | | 7.0 | | |
TE Connectivity, Ltd. | | | 6.0 | | |
General Electric Co. | | | 5.5 | | |
Citigroup, Inc. | | | 5.5 | | |
Fiat Chrysler Automobiles N.V. | | | 4.9 | | |
MGM Resorts International | | | 4.8 | | |
Apache Corp. | | | 4.6 | | |
MasterCard, Inc., Class A | | | 4.6 | | |
Harley-Davidson, Inc. | | | 4.5 | | |
FUND STATISTICS | |
Ticker* | | OAKLX | |
Inception* | | 11/01/96 | |
Number of Equity Holdings | | 20 | |
Net Assets | | $5.8 billion | |
Benchmark | | S&P 500 Index | |
Weighted Average Market Cap | | $128.1 billion | |
Median Market Cap | | $34.2 billion | |
Portfolio Turnover (for the 6-months ended 03/31/17) | | 9% | |
Expense Ratio - Investor Class (as of 09/30/16)* | | 0.98% | |
* This information is related to the Investor Class. Please visit Oakmark.com for information related to the Advisor, Institutional and Service Classes.
SECTOR ALLOCATION | | % of Net Assets | |
Financials | | | 29.8 | | |
Information Technology | | | 25.5 | | |
Consumer Discretionary | | | 17.1 | | |
Energy | | | 8.7 | | |
Real Estate | | | 7.0 | | |
Industrials | | | 5.5 | | |
Short-Term Investments and Other | | | 6.4 | | |
See accompanying Disclosures and Endnotes on page 71.
8 OAKMARK FUNDS
Oakmark Select Fund March 31, 2017
Portfolio Manager Commentary


William C. Nygren, CFA
Portfolio Manager
oaklx@oakmark.com
Anthony P. Coniaris, CFA
Portfolio Manager
oaklx@oakmark.com
Win Murray
Portfolio Manager
oaklx@oakmark.com
For the quarter, the Oakmark Select Fund increased 3.0%, compared to a 6.1% gain for the S&P 500 Index3. While good on an absolute basis, we aren't satisfied by the relative return this quarter, but understand that our investment process of buying companies that have a clear path to per-share value growth, that are run by strong management teams, and that trade at significant discounts to intrinsic value works well on average and over time, but not necessarily every quarter.
Nearly half of the underperformance relative to the S&P 500 came from our two energy holdings as oil and gas prices pulled back somewhat during the quarter. The three largest detractors—Apache (–19%), Chesapeake Energy (–15%) and General Electric (–5%)—all have direct or indirect exposure to oil and gas prices. Energy price volatility notwithstanding, the fundamentals of all three companies are largely tracking with our expectations. Furthermore, recent oil and gas property transactions confirm our belief that Apache and Chesapeake Energy are trading at substantial discounts to fair value, and in the case of Chesapeake, insiders have been buying stock. We added to the Fund's holdings in both Chesapeake and Apache during the quarter.
The three largest contributors to performance were Fiat Chrysler (+20%), CBRE Group (+10%) and Oracle (+16%). There was no identifiable catalyst for the performance at Fiat or CBRE beyond these well-run companies continuing to demonstrate good fundamentals. Often times, this is enough for stocks that are just too cheap. Oracle's latest earnings report showed continued progress managing its transition to more of a cloud-based software model. This strong performance was consistent with our expectations, but appeared to have positively surprised others.
There were no new additions or deletions from the portfolio in the quarter. We added significantly to our MGM investment after what we believe was an overreaction to its earnings release, and we trimmed JPMorgan and Bank of America after continued strong price performance had somewhat narrowed their discounts to value.
Thank you for your continued investment in the Fund.
See accompanying Disclosures and Endnotes on page 71.
Oakmark.com 9
Oakmark Select Fund March 31, 2017 (Unaudited)
Schedule of Investments (in thousands)
| | | Shares | | Value | |
COMMON STOCKS - 93.6% | |
FINANCIALS - 29.8% | |
BANKS - 13.4% | |
Citigroup, Inc. | | | 5,312 | | | $ | 317,764 | | |
Bank of America Corp. | | | 9,901 | | | | 233,555 | | |
JPMorgan Chase & Co. | | | 2,568 | | | | 225,573 | | |
| | | | | | 776,892 | | |
INSURANCE - 8.6% | |
FNF Group | | | 6,446 | | | | 251,015 | | |
American International Group, Inc. | | | 3,995 | | | | 249,420 | | |
| | | | | | 500,435 | | |
DIVERSIFIED FINANCIALS - 7.8% | |
Ally Financial, Inc. | | | 11,500 | | | | 233,795 | | |
Capital One Financial Corp. | | | 2,485 | | | | 215,342 | | |
| | | | | | 449,137 | | |
| | | | | | 1,726,464 | | |
INFORMATION TECHNOLOGY - 25.5% | |
SOFTWARE & SERVICES - 16.9% | |
Alphabet, Inc., Class C (a) | | | 557 | | | | 461,774 | | |
MasterCard, Inc., Class A | | | 2,359 | | | | 265,317 | | |
Oracle Corp. | | | 5,567 | | | | 248,344 | | |
| | | | | | 975,435 | | |
TECHNOLOGY HARDWARE & EQUIPMENT - 6.0% | |
TE Connectivity, Ltd. | | | 4,623 | | | | 344,640 | | |
SEMICONDUCTORS & SEMICONDUCTOR EQUIPMENT - 2.6% | |
Intel Corp. | | | 4,237 | | | | 152,829 | | |
| | | | | | 1,472,904 | | |
CONSUMER DISCRETIONARY - 17.1% | |
AUTOMOBILES & COMPONENTS - 9.4% | |
Fiat Chrysler Automobiles N.V. (a) | | | 26,134 | | | | 285,645 | | |
Harley-Davidson, Inc. | | | 4,300 | | | | 260,150 | | |
| | | | | | 545,795 | | |
CONSUMER SERVICES - 4.8% | |
MGM Resorts International | | | 10,100 | | | | 276,740 | | |
RETAILING - 2.9% | |
Liberty Interactive Corp. QVC Group, Class A (a) | | | 8,459 | | | | 169,347 | | |
| | | | | | 991,882 | | |
ENERGY - 8.7% | |
Apache Corp. | | | 5,221 | | | | 268,307 | | |
Chesapeake Energy Corp. (a) | | | 39,840 | | | | 236,652 | | |
| | | | | | 504,959 | | |
| | | Shares | | Value | |
REAL ESTATE - 7.0% | |
CBRE Group, Inc., Class A (a) | | | 11,648 | | | $ | 405,217 | | |
INDUSTRIALS - 5.5% | |
CAPITAL GOODS - 5.5% | |
General Electric Co. | | | 10,718 | | | | 319,396 | | |
TOTAL COMMON STOCKS - 93.6%
(COST $3,492,371) | | | | | 5,420,822 | | |
| | | Par Value | | Value | |
SHORT TERM INVESTMENTS - 6.3% | |
U.S. GOVERNMENT BILL - 4.3% | |
United States Treasury Bills,
0.66% - 0.75%, due
04/06/17 - 04/27/17 (b)
(Cost $249,919) | | $ | 250,000 | | | | 249,919 | | |
REPURCHASE AGREEMENT - 2.0% | |
Fixed Income Clearing Corp. Repurchase
Agreement, 0.22% dated 03/31/17 due
04/03/17, repurchase price $114,715
collateralized by United States
Treasury Notes, 2.000% - 2.125%, due
05/15/25 - 08/15/25, value plus
accrued interest of $117,009
(Cost: $114,713) | | | 114,713 | | | | 114,713 | | |
TOTAL SHORT TERM INVESTMENTS - 6.3%
(COST $364,632) | | | | | 364,632 | | |
TOTAL INVESTMENTS - 99.9%
(COST $3,857,003) | | | | | 5,785,454 | | |
Other Assets In Excess of Liabilities - 0.1% | | | | | 4,423 | | |
TOTAL NET ASSETS - 100.0% | | | | $ | 5,789,877 | | |
(a) Non-income producing security
(b) The rate shown represents the annualized yield at the time of purchase; not a coupon rate.
See accompanying Notes to Financial Statements.
10 OAKMARK FUNDS

This page intentionally left blank.
Oakmark.com 11
Oakmark Equity and Income Fund March 31, 2017
Summary Information
VALUE OF A $10,000 INVESTMENT
Since Inception - 11/01/95 (Unaudited)

PERFORMANCE
| | | | | Average Annual Total Returns (as of 03/31/17) | | | |
(Unaudited) | | Total Return
Last 3 Months | | 1-year | | 3-year | | 5-year | | 10-year | | Since
Inception | | Inception
Date | |
Oakmark Equity and Income Fund (Investor Class) | | | 4.14 | % | | | 14.68 | % | | | 5.02 | % | | | 8.16 | % | | | 6.73 | % | | | 10.28 | % | | 11/01/95 | |
Lipper Balanced Fund Index | | | 4.15 | % | | | 10.22 | % | | | 5.39 | % | | | 7.56 | % | | | 5.28 | % | | | 6.84 | % | | | |
S&P 500 Index | | | 6.07 | % | | | 17.17 | % | | | 10.37 | % | | | 13.30 | % | | | 7.51 | % | | | 8.79 | % | | | |
Barclays U.S. Govt./Credit Index | | | 0.96 | % | | | 0.54 | % | | | 2.69 | % | | | 2.46 | % | | | 4.34 | % | | | 5.29 | % | | | |
Oakmark Equity and Income Fund (Advisor Class) | | | 4.17 | % | | | N/A | | | | N/A | | | | N/A | | | | N/A | | | | 5.77 | %* | | 11/30/16 | |
Oakmark Equity and Income Fund (Institutional Class) | | | 4.17 | % | | | N/A | | | | N/A | | | | N/A | | | | N/A | | | | 5.77 | %* | | 11/30/16 | |
Oakmark Equity and Income Fund (Service Class) | | | 4.06 | % | | | 14.36 | % | | | 4.69 | % | | | 7.82 | % | | | 6.39 | % | | | 8.59 | % | | 07/12/00 | |
The graph and table above do not reflect the deduction of taxes that a shareholder would pay on Fund distributions or the redemption of Fund shares.
* Returns Since Inception for the Advisor Class and the Institutional Class are not annualized.
Past performance is no guarantee of future results. The performance data quoted represents past performance. Current performance may be lower or higher than the performance data quoted. Total return includes change in share prices and, in each case, includes reinvestment of dividends and capital gain distributions. The investment return and principal value vary so that an investor's shares when redeemed may be worth more or less than the original cost. To obtain the most recent month-end performance, please visit Oakmark.com.
TOP TEN EQUITY HOLDINGS6 | | % of Net Assets | |
Bank of America Corp. | | | 4.7 | | |
General Motors Co. | | | 4.4 | | |
TE Connectivity, Ltd. | | | 3.2 | | |
Oracle Corp. | | | 3.1 | | |
Nestlé ADR | | | 2.9 | | |
Dover Corp. | | | 2.7 | | |
Foot Locker, Inc. | | | 2.6 | | |
MasterCard, Inc., Class A | | | 2.5 | | |
CVS Health Corp. | | | 2.4 | | |
UnitedHealth Group, Inc. | | | 2.3 | | |
FUND STATISTICS | |
Ticker* | | OAKBX | |
Inception* | | 11/01/95 | |
Number of Equity Holdings | | 42 | |
Net Assets | | $16.4 billion | |
Benchmark | | Lipper Balanced Funds Index | |
Weighted Average Market Cap | | $85.1 billion | |
Median Market Cap | | $16.9 billion | |
Portfolio Turnover (for the 6-months ended 03/31/17) | | 9% | |
Expense Ratio - Investor Class (as of 09/30/16)* | | 0.79% | |
* This information is related to the Investor Class. Please visit Oakmark.com for information related to the Advisor, Institutional and Service Classes.
SECTOR ALLOCATION | | % of Net Assets | |
Equity Investments | |
Financials | | | 15.9 | | |
Consumer Discretionary | | | 11.6 | | |
Consumer Staples | | | 9.1 | | |
Information Technology | | | 8.9 | | |
Industrials | | | 6.4 | | |
Health Care | | | 4.0 | | |
Energy | | | 2.6 | | |
Real Estate | | | 1.5 | | |
Materials | | | 0.9 | | |
Total Equity Investments | | | 60.9 | | |
Fixed Income Investments | |
Corporate Bonds | | | 13.6 | | |
Government and Agency Securities | | | 9.0 | | |
Convertible Bonds | | | 0.1 | | |
Total Fixed Income Investments | | | 22.7 | | |
Short-Term Investments and Other | | | 16.4 | | |
See accompanying Disclosures and Endnotes on page 71.
12 OAKMARK FUNDS
Oakmark Equity and Income Fund March 31, 2017
Portfolio Manager Commentary


Clyde S. McGregor, CFA
Portfolio Manager
oakbx@oakmark.com
M. Colin Hudson, CFA
Portfolio Manager
oakbx@oakmark.com
Edward J. Wojciechowski, CFA
Portfolio Manager
oakbx@oakmark.com
The U.S. equity markets (as defined by the S&P 5003) have continued their post-election ascent, increasing 11.4% since November 8, 2016, and 6.1% in the first quarter of 2017. Against this backdrop, the Fund's equity performance has done particularly well, returning 17.1% and 6.8% over those respective time periods. These results raise the questions: how did we call the Trump presidency (considered a low probability event at the time), and what did we do to prepare the portfolio for it? In short, the answers are: we didn't, and nothing. At Harris Associates, we are long-term, bottom-up value investors; therefore, short-term events and macroeconomic considerations don't tend to play a major role in our decision making process. In fact, we have half-jokingly suggested that had we known the outcome of the election in advance, we may not have positioned the portfolio as well.
Still, we believe that the Fund's performance last quarter can be attributed to more than just luck. We seek to populate the portfolio with high-quality, growing companies that are trading at significant discounts to their intrinsic values and that are run by management teams that think and act like owners. By doing so, we believe we set the Fund's investors up for long-term success. Although we are never sure what exactly will cause the gap between price and value to narrow, we are generally confident that it will occur over time. In this case, the recent upward move seems to be explained by the anticipation of economically stimulative policies, such as tax cuts and an easier regulatory environment, as well as improved economic indicators, such as the Purchasing Managers' Index (PMI) and consumer confidence. While we are not going to try to predict what the next four years will hold, we believe that our group of well-managed, attractively valued companies should fare well.
For the quarter, the Equity & Income Fund earned 4.1%, which compares to 4.2% for the Lipper Balanced Fund Index10, the Fund's performance benchmark. The largest contributors to performance were Oracle, Philip Morris International, Bank of America, TE Connectivity and MasterCard, while the largest detractors were TD Ameritrade, Baker Hughes, Herman Miller, Arconic and Manitowoc. The lack of a common theme or discernable pattern amongst the winners and losers is illustrative of our bottom-up approach—the movements were mostly attributable to company-specific factors rather than overarching macroeconomic developments.
Transaction Activity
We added one new position and exited three holdings during the period. We purchased Arconic after it separated from Alcoa and became an independent public company. Arconic designs and manufactures lightweight metal parts and components that are used within the aerospace, building and construction, transportation, and other industries. Its largest division, Engineered
Products and Solutions, accounts for approximately half of the firm's profits and is considered the "crown jewel" of the company. This segment has a similar product portfolio to Precision Castparts, a previous Fund holding that was acquired by Warren Buffett's Berkshire Hathaway in 2016. We believe Arconic's long-term revenue outlook is bright. It should benefit from the secular trend toward more lightweight platforms in both the commercial aerospace and automotive industries as well as market share gains within these end markets. Moreover, we expect Arconic's operating margins to expand considerably as reductions in corporate overhead, sourcing and plant optimization are met with increases in capacity utilization. Given our favorable long-term outlook for many of its end markets, the durability of its underlying business segments and its valuation discount relative to precedent transactions, we believe Arconic represents an attractive investment opportunity.
We sold three positions, all of which performed well over the past year and exceeded their sell targets. Although it is always bittersweet to sell a business that possesses strong fundamentals, is run by capable managers and has outperformed our expectations, doing so is critical to our investment process. We often explain to management teams that they should cheer for the day when we sell their stock as that usually means the company is doing well and that the consensus opinion is that leadership is doing a good job. They should be less excited when we take an initial position because this usually indicates some industry or company-specific problem that is dampening enthusiasm for the stock.
The Fund's 2017 "graduating class" to date includes Comerica, Reinsurance Group of America and Rockwell Automation. We purchased Comerica in the first quarter of 2016 when other investors were worried about the company's energy loans, as well as the impact of low interest rates, both of which we thought were overstated. As energy fears subsided and interest rates started to increase, Comerica's stock price more than doubled and approached our view of the company's fair value. We added Reinsurance Group of America to the portfolio in 2014 when worries about low interest rates and lingering fears about the company's underperforming small Australian business drove the stock below book value. The Australian underwriting problem proved to be temporary, interest rates increased and the stock valuation quickly rebounded to a more appropriate multiple of tangible book. In terms of Rockwell Automation, this was the second time we bought the stock, and the purchase worked out well again. We initially purchased Rockwell in 2009 as the world's economy and Rockwell's fundamentals were suffering from the effects of the Global Financial Crisis. We have always admired the company's strong position in factory automation along with its smart management team, so we believed that business fundamentals would rebound as the
See accompanying Disclosures and Endnotes on page 71.
Oakmark.com 13
Oakmark Equity and Income Fund March 31, 2017
Portfolio Manager Commentary (continued)
economy improved. Business fundamentals have indeed improved materially, as reflected by the stock price's nearly fivefold increase.
The big news in the fixed income market over the past quarter was that the Federal Reserve raised short-term interest rates for the third time this decade. The amount was only 25 basis points; however, the Fed also indicated that it would likely increase rates several more times this year. Longer-term Treasury interest rates initially increased in anticipation of this move but ultimately ended the quarter fairly close to where they started. We took advantage of that brief opening, though, to modestly add to our longer dated Treasury position. On the corporate side, investment grade credit spreads have continued to tighten and are near a decade low, providing a challenging backdrop in which to find fixed income securities that we find attractive. Still, we purchased a few securities of high yield companies in which Harris Associates has large equity positions. We know these businesses and management teams well, and we believe they offer attractive spreads. Even with the addition of some longer dated treasuries and corporates this quarter, the duration of our fixed income holdings remains relatively short, which we've done to protect against rising interest rates.
As always, we thank our shareholders for entrusting their assets to the Fund and welcome your questions or comments.
See accompanying Disclosures and Endnotes on page 71.
14 OAKMARK FUNDS
Oakmark Equity and Income Fund March 31, 2017 (Unaudited)
Schedule of Investments (in thousands)
| | | Shares | | Value | |
COMMON STOCKS - 60.9% | |
FINANCIALS - 15.9% | |
BANKS - 7.9% | |
Bank of America Corp. | | | 32,674 | | | $ | 770,780 | | |
Citigroup, Inc. | | | 5,165 | | | | 308,964 | | |
Wells Fargo & Co. | | | 2,471 | | | | 137,519 | | |
U.S. Bancorp | | | 1,574 | | | | 81,051 | | |
| | | | | | 1,298,314 | | |
DIVERSIFIED FINANCIALS - 4.8% | |
Bank of New York Mellon Corp. | | | 5,171 | | | | 244,229 | | |
TD Ameritrade Holding Corp. | | | 5,529 | | | | 214,864 | | |
Ally Financial, Inc. | | | 9,973 | | | | 202,741 | | |
State Street Corp. | | | 1,551 | | | | 123,491 | | |
| | | | | | 785,325 | | |
INSURANCE - 3.2% | |
Principal Financial Group, Inc. | | | 4,377 | | | | 276,232 | | |
FNF Group | | | 6,360 | | | | 247,651 | | |
| | | | | | 523,883 | | |
| | | | | | 2,607,522 | | |
CONSUMER DISCRETIONARY - 11.6% | |
AUTOMOBILES & COMPONENTS - 7.0% | |
General Motors Co. | | | 20,307 | | | | 718,069 | | |
BorgWarner, Inc. | | | 5,914 | | | | 247,146 | | |
Lear Corp. | | | 1,316 | | | | 186,381 | | |
| | | | | | 1,151,596 | | |
RETAILING - 2.9% | |
Foot Locker, Inc. | | | 5,783 | | | | 432,596 | | |
HSN, Inc. | | | 1,034 | | | | 38,347 | | |
| | | | | | 470,943 | | |
CONSUMER DURABLES & APPAREL - 1.3% | |
Kate Spade & Co. (a) (b) | | | 6,869 | | | | 159,564 | | |
Carter's, Inc. | | | 664 | | | | 59,654 | | |
| | | | | | 219,218 | | |
CONSUMER SERVICES - 0.4% | |
MGM Resorts International | | | 2,351 | | | | 64,424 | | |
| | | | | | 1,906,181 | | |
CONSUMER STAPLES - 9.1% | |
FOOD, BEVERAGE & TOBACCO - 6.8% | |
Nestle SA (c) | | | 6,207 | | | | 477,280 | | |
Philip Morris International, Inc. | | | 3,092 | | | | 349,053 | | |
Diageo PLC (c) | | | 2,441 | | | | 282,182 | | |
| | | | | | 1,108,515 | | |
FOOD & STAPLES RETAILING - 2.3% | |
CVS Health Corp. | | | 4,911 | | | | 385,541 | | |
| | | | | | 1,494,056 | | |
| | | Shares | | Value | |
INFORMATION TECHNOLOGY - 8.9% | |
SOFTWARE & SERVICES - 5.6% | |
Oracle Corp. | | | 11,522 | | | $ | 513,987 | | |
MasterCard, Inc., Class A | | | 3,602 | | | | 405,151 | | |
| | | | | | 919,138 | | |
TECHNOLOGY HARDWARE & EQUIPMENT - 3.3% | |
TE Connectivity, Ltd. | | | 7,122 | | | | 530,968 | | |
| | | | | | 1,450,106 | | |
INDUSTRIALS - 6.4% | |
CAPITAL GOODS - 5.0% | |
Dover Corp. | | | 5,513 | | | | 442,938 | | |
Oshkosh Corp. | | | 1,566 | | | | 107,378 | | |
Flowserve Corp. | | | 2,179 | | | | 105,530 | | |
Arconic, Inc. | | | 3,221 | | | | 84,836 | | |
WESCO International, Inc. (a) | | | 682 | | | | 47,405 | | |
The Manitowoc Co., Inc. (a) | | | 6,243 | | | | 35,584 | | |
| | | | | | 823,671 | | |
TRANSPORTATION - 1.2% | |
Union Pacific Corp. | | | 1,769 | | | | 187,373 | | |
COMMERCIAL & PROFESSIONAL SERVICES - 0.2% | |
Herman Miller, Inc. | | | 1,246 | | | | 39,307 | | |
| | | | | | 1,050,351 | | |
HEALTH CARE - 4.0% | |
HEALTH CARE EQUIPMENT & SERVICES - 3.4% | |
UnitedHealth Group, Inc. | | | 2,261 | | | | 370,899 | | |
HCA Holdings, Inc. (a) | | | 2,186 | | | | 194,505 | | |
| | | | | | 565,404 | | |
PHARMACEUTICALS, BIOTECHNOLOGY & LIFE SCIENCES - 0.6% | |
VWR Corp. (a) | | | 3,233 | | | | 91,159 | | |
| | | | | | 656,563 | | |
ENERGY - 2.6% | |
Baker Hughes, Inc. | | | 3,820 | | | | 228,487 | | |
National Oilwell Varco, Inc. | | | 4,865 | | | | 195,034 | | |
| | | | | | 423,521 | | |
REAL ESTATE - 1.5% | |
Jones Lang LaSalle, Inc. | | | 1,204 | | | | 134,146 | | |
Gaming and Leisure Properties, Inc. | | | 1,833 | | | | 61,245 | | |
The Howard Hughes Corp. (a) | | | 429 | | | | 50,284 | | |
| | | | | | 245,675 | | |
MATERIALS - 0.9% | |
Glencore PLC | | | 35,440 | | | | 139,048 | | |
TOTAL COMMON STOCKS - 60.9%
(COST $5,657,008) | | | | | 9,973,023 | | |
See accompanying Notes to Financial Statements.
Oakmark.com 15
Oakmark Equity and Income Fund March 31, 2017 (Unaudited)
Schedule of Investments (in thousands) (continued)
| | | Par Value | | Value | |
FIXED INCOME - 22.7% | |
CORPORATE BONDS - 13.6% | |
FINANCIALS - 4.1% | |
Aflac, Inc.
2.875%, due 10/15/26 | | $ | 980 | | | $ | 945 | | |
Ally Financial, Inc.
4.75%, due 09/10/18 | | | 4,743 | | | | 4,873 | | |
American Express Credit Corp.
2.60%, due 09/14/20 | | | 2,945 | | | | 2,976 | | |
1.875%, due 11/05/18 | | | 4,915 | | | | 4,923 | | |
American International Group, Inc.
3.30%, due 03/01/21 | | | 14,665 | | | | 14,935 | | |
Aon Corp.
5.00%, due 09/30/20 | | | 14,745 | | | | 15,947 | | |
Bank of America Corp.
4.45%, due 03/03/26 | | | 5,000 | | | | 5,128 | | |
1.95%, due 05/12/18 | | | 31,675 | | | | 31,745 | | |
2.151%, due 11/09/20 | | | 6,970 | | | | 6,907 | | |
Berkshire Hathaway, Inc.
2.75%, due 03/15/23 | | | 4,915 | | | | 4,916 | | |
Capital One Bank USA NA
2.15%, due 11/21/18 | | | 3,768 | | | | 3,775 | | |
Capital One NA
2.35%, due 08/17/18 | | | 5,000 | | | | 5,031 | | |
Capital One NA/Mclean VA
1.85%, due 09/13/19 | | | 39,255 | | | | 38,891 | | |
Citigroup, Inc.
1.70%, due 04/27/18 | | | 29,020 | | | | 29,032 | | |
3.40%, due 05/01/26 | | | 15,000 | | | | 14,615 | | |
6.125%, due 11/21/17 | | | 10,180 | | | | 10,469 | | |
2.45%, due 01/10/20 | | | 19,910 | | | | 19,995 | | |
4.05%, due 07/30/22 | | | 13,338 | | | | 13,890 | | |
2.05%, due 12/07/18 | | | 2,098 | | | | 2,102 | | |
CNO Financial Group, Inc.
4.50%, due 05/30/20 | | | 9,830 | | | | 10,149 | | |
5.25%, due 05/30/25 | | | 5,895 | | | | 6,046 | | |
Credit Suisse Group AG, 144A
6.25% (d) (e) (f) | | | 7,000 | | | | 7,111 | | |
| 7.50% (d) (e) (f) | | | 30,000 | | | | 32,508 | | |
Credit Suisse Group Funding Guernsey, Ltd.
3.125%, due 12/10/20 | | | 25,000 | | | | 25,139 | | |
3.80%, due 06/09/23 | | | 14,750 | | | | 14,810 | | |
Credit Suisse New York
1.75%, due 01/29/18 | | | 24,700 | | | | 24,718 | | |
E*TRADE Financial Corp.
4.625%, due 09/15/23 | | | 7,865 | | | | 8,058 | | |
5.375%, due 11/15/22 | | | 24,308 | | | | 25,463 | | |
Fidelity National Financial, Inc.
6.60%, due 05/15/17 | | | 6,446 | | | | 6,480 | | |
Goldman Sachs Group, Inc.
2.625%, due 04/25/21 | | | 2,000 | | | | 1,995 | | |
JPMorgan Chase & Co.
1.70%, due 03/01/18 | | | 21,596 | | | | 21,601 | | |
2.972%, due 01/15/23 | | | 29,765 | | | | 29,741 | | |
2.273%, due 10/24/23 (e) | | | 19,910 | | | | 20,367 | | |
JPMorgan Chase Bank NA
1.521%, due 06/14/17 (e) | | | 19,750 | | | | 19,762 | | |
Moody's Corp.
4.50%, due 09/01/22 | | | 9,820 | | | | 10,512 | | |
5.50%, due 09/01/20 | | | 3,780 | | | | 4,138 | | |
| | | Par Value | | Value | |
MSCI, Inc., 144A
5.75%, due 08/15/25 (d) | | $ | 2,950 | | | $ | 3,134 | | |
5.25%, due 11/15/24 (d) | | | 9,905 | | | | 10,425 | | |
4.75%, due 08/01/26 (d) | | | 5,925 | | | | 5,984 | | |
Principal Life Global Funding II, 144A
2.15%, due 01/10/20 (d) | | | 19,910 | | | | 19,900 | | |
2.375%, due 11/21/21 (d) | | | 6,970 | | | | 6,853 | | |
Reinsurance Group of America, Inc.
3.95%, due 09/15/26 | | | 4,905 | | | | 4,947 | | |
S&P Global, Inc.
2.50%, due 08/15/18 | | | 1,970 | | | | 1,986 | | |
4.00%, due 06/15/25 | | | 17,150 | | | | 17,627 | | |
3.30%, due 08/14/20 | | | 1,970 | | | | 2,013 | | |
4.40%, due 02/15/26 | | | 1,970 | | | | 2,091 | | |
S&P Global, Inc., 144A
2.95%, due 01/22/27 (d) | | | 9,810 | | | | 9,255 | | |
2.50%, due 08/15/18 (d) | | | 1,267 | | | | 1,277 | | |
The Bear Stearns Cos. LLC
4.65%, due 07/02/18 | | | 8,205 | | | | 8,487 | | |
The Goldman Sachs Group, Inc.
2.55%, due 10/23/19 | | | 980 | | | | 989 | | |
1.72%, due 05/22/17 (e) | | | 5,000 | | | | 5,004 | | |
2.30%, due 12/13/19 | | | 6,970 | | | | 6,974 | | |
2.875%, due 02/25/21 | | | 1,000 | | | | 1,006 | | |
2.789%, due 10/28/27 (e) | | | 2,975 | | | | 3,062 | | |
2.35%, due 11/15/21 | | | 14,616 | | | | 14,315 | | |
Voya Financial, Inc.
3.65%, due 06/15/26 | | | 1,960 | | | | 1,931 | | |
Wachovia Corp.
5.75%, due 02/01/18 | | | 1,197 | | | | 1,235 | | |
Wells Fargo & Co.
3.069%, due 01/24/23 | | | 14,930 | | | | 15,021 | | |
2.269%, due 10/31/23 (e) | | | 8,603 | | | | 8,761 | | |
Wells Fargo Bank NA
1.80%, due 11/28/18 | | | 9,900 | | | | 9,913 | | |
2.15%, due 12/06/19 | | | 9,900 | | | | 9,933 | | |
| | | | | | 671,816 | | |
CONSUMER DISCRETIONARY - 2.9% | |
1011778 BC ULC /
New Red Finance, Inc., 144A
6.00%, due 04/01/22 (d) | | | 29,500 | | | | 30,606 | | |
BorgWarner, Inc.
4.625%, due 09/15/20 | | | 10,810 | | | | 11,556 | | |
CCO Holdings LLC / CCO Holdings
Capital Corp., 144A
5.125%, due 05/01/27 (d) | | | 250 | | | | 251 | | |
Dana, Inc.
6.00%, due 09/15/23 | | | 3,925 | | | | 4,092 | | |
Dollar General Corp.
4.125%, due 07/15/17 | | | 17,095 | | | | 17,233 | | |
Dollar Tree, Inc.
5.75%, due 03/01/23 | | | 2,950 | | | | 3,142 | | |
5.25%, due 03/01/20 | | | 1,000 | | | | 1,030 | | |
EMI Music Publishing Group North
America Holdings, Inc., 144A
7.625%, due 06/15/24 (d) | | | 4,910 | | | | 5,352 | | |
Expedia, Inc.
5.00%, due 02/15/26 | | | 28,360 | | | | 30,310 | | |
Foot Locker, Inc.
8.50%, due 01/15/22 | | | 4,340 | | | | 5,105 | | |
See accompanying Notes to Financial Statements.
16 OAKMARK FUNDS
Oakmark Equity and Income Fund March 31, 2017 (Unaudited)
Schedule of Investments (in thousands) (continued)
| | | Par Value | | Value | |
FIXED INCOME - 22.7% (continued) | |
CORPORATE BONDS - 13.6% (continued) | |
General Motors Co.
3.50%, due 10/02/18 | | $ | 29,525 | | | $ | 30,173 | | |
4.875%, due 10/02/23 | | | 41,400 | | | | 44,170 | | |
General Motors Financial Co., Inc.
3.10%, due 01/15/19 | | | 4,915 | | | | 4,994 | | |
International Game Technology PLC, 144A
5.625%, due 02/15/20 (d) | | | 9,800 | | | | 10,241 | | |
6.25%, due 02/15/22 (d) | | | 14,800 | | | | 15,799 | | |
6.50%, due 02/15/25 (d) | | | 19,600 | | | | 20,874 | | |
KFC Holding Co. / Pizza Hut Holdings LLC /
Taco Bell of America LLC, 144A
5.00%, due 06/01/24 (d) | | | 1,000 | | | | 1,021 | | |
5.25%, due 06/01/26 (d) | | | 1,000 | | | | 1,018 | | |
Lear Corp.
4.75%, due 01/15/23 | | | 17,411 | | | | 18,035 | | |
5.375%, due 03/15/24 | | | 7,372 | | | | 7,779 | | |
Live Nation Entertainment, Inc., 144A
5.375%, due 06/15/22 (d) | | | 2,000 | | | | 2,080 | | |
4.875%, due 11/01/24 (d) | | | 14,935 | | | | 14,935 | | |
Omnicom Group, Inc.
3.625%, due 05/01/22 | | | 30,425 | | | | 31,473 | | |
6.25%, due 07/15/19 | | | 2,950 | | | | 3,219 | | |
Penn National Gaming, Inc., 144A
5.625%, due 01/15/27 (d) | | | 6,970 | | | | 6,918 | | |
Penske Truck Leasing Co., LP /
PTL Finance Corp., 144A
3.75%, due 05/11/17 (d) | | | 4,920 | | | | 4,931 | | |
Scientific Games International, Inc.
10.00%, due 12/01/22 | | | 19,665 | | | | 20,968 | | |
Scientific Games International, Inc., 144A
7.00%, due 01/01/22 (d) | | | 8,875 | | | | 9,474 | | |
Scripps Networks Interactive, Inc.
2.80%, due 06/15/20 | | | 3,930 | | | | 3,971 | | |
Sirius XM Radio, Inc., 144A
5.25%, due 08/15/22 (d) | | | 8,895 | | | | 9,195 | | |
Six Flags Entertainment Corp., 144A
5.25%, due 01/15/21 (d) | | | 9,970 | | | | 10,251 | | |
Tempur Sealy International, Inc.
5.50%, due 06/15/26 | | | 1,965 | | | | 1,937 | | |
The Gap, Inc.
5.95%, due 04/12/21 | | | 1,965 | | | | 2,109 | | |
The Priceline Group, Inc.
3.60%, due 06/01/26 | | | 14,730 | | | | 14,634 | | |
The William Carter Co.
5.25%, due 08/15/21 | | | 36,132 | | | | 37,158 | | |
Toyota Motor Credit Corp.
1.45%, due 01/12/18 | | | 29,495 | | | | 29,490 | | |
Tribune Media Co.
5.875%, due 07/15/22 | | | 1,000 | | | | 1,043 | | |
Wolverine World Wide, Inc., 144A
5.00%, due 09/01/26 (d) | | | 6,870 | | | | 6,458 | | |
Yum! Brands, Inc.
3.875%, due 11/01/23 | | | 6,329 | | | | 6,187 | | |
| | | | | | 479,212 | | |
HEALTH CARE - 1.6% | |
Abbott Laboratories
2.35%, due 11/22/19 | | | 14,935 | | | | 14,997 | | |
2.90%, due 11/30/21 | | | 14,935 | | | | 15,000 | | |
| | | Par Value | | Value | |
AbbVie, Inc.
1.80%, due 05/14/18 | | $ | 4,937 | | | $ | 4,943 | | |
Actavis Funding SCS
1.30%, due 06/15/17 | | | 7,727 | | | | 7,726 | | |
Anthem, Inc.
5.875%, due 06/15/17 | | | 22,388 | | | | 22,583 | | |
1.875%, due 01/15/18 | | | 4,200 | | | | 4,203 | | |
Centene Corp.
4.75%, due 05/15/22 | | | 20,084 | | | | 20,636 | | |
CHS/Community Health Systems, Inc.
8.00%, due 11/15/19 | | | 2,940 | | | | 2,885 | | |
6.875%, due 02/01/22 | | | 3,920 | | | | 3,371 | | |
Express Scripts Holding Co.
3.30%, due 02/25/21 | | | 4,915 | | | | 5,000 | | |
HCA, Inc.
3.75%, due 03/15/19 | | | 3,965 | | | | 4,054 | | |
5.00%, due 03/15/24 | | | 7,465 | | | | 7,829 | | |
4.25%, due 10/15/19 | | | 1,990 | | | | 2,060 | | |
McKesson Corp.
1.40%, due 03/15/18 | | | 22,100 | | | | 22,047 | | |
Medtronic, Inc.
1.50%, due 03/15/18 | | | 2,950 | | | | 2,951 | | |
Quest Diagnostics, Inc.
4.70%, due 04/01/21 | | | 5,128 | | | | 5,510 | | |
Quintiles IMS, Inc., 144A
5.00%, due 10/15/26 (d) | | | 7,800 | | | | 7,829 | | |
St Jude Medical LLC
2.00%, due 09/15/18 | | | 13,485 | | | | 13,501 | | |
Thermo Fisher Scientific, Inc.
3.00%, due 04/15/23 | | | 1,970 | | | | 1,952 | | |
Universal Health Services, Inc., 144A
5.00%, due 06/01/26 (d) | | | 12,805 | | | | 13,157 | | |
4.75%, due 08/01/22 (d) | | | 22,300 | | | | 22,913 | | |
3.75%, due 08/01/19 (d) | | | 6,970 | | | | 7,057 | | |
Zimmer Biomet Holdings, Inc.
1.45%, due 04/01/17 | | | 37,671 | | | | 37,671 | | |
2.00%, due 04/01/18 | | | 1,815 | | | | 1,818 | | |
3.15%, due 04/01/22 | | | 3,810 | | | | 3,824 | | |
| | | | | | 255,517 | | |
REAL ESTATE - 1.5% | |
CBRE Services, Inc.
4.875%, due 03/01/26 | | | 19,665 | | | | 20,463 | | |
5.00%, due 03/15/23 | | | 25,239 | | | | 26,252 | | |
5.25%, due 03/15/25 | | | 24,930 | | | | 26,458 | | |
GLP Capital, LP / GLP Financing II, Inc.
4.375%, due 11/01/18 | | | 14,975 | | | | 15,368 | | |
5.375%, due 04/15/26 | | | 3,925 | | | | 4,053 | | |
4.375%, due 04/15/21 | | | 1,965 | | | | 2,019 | | |
4.875%, due 11/01/20 | | | 10,000 | | | | 10,467 | | |
5.375%, due 11/01/23 | | | 12,000 | | | | 12,720 | | |
MGM Growth Properties Operating Partnership,
LP / MGP Finance Co-Issuer, Inc. REIT
5.625%, due 05/01/24 | | | 2,945 | | | | 3,107 | | |
Omega Healthcare Investors, Inc.
4.375%, due 08/01/23 | | | 14,625 | | | | 14,822 | | |
5.875%, due 03/15/24 | | | 39,292 | | | | 40,541 | | |
Omega Healthcare Investors, Inc. REIT
5.25%, due 01/15/26 | | | 9,835 | | | | 10,268 | | |
The Howard Hughes Corp., 144A
5.375%, due 03/15/25 (d) | | | 11,945 | | | | 11,825 | | |
See accompanying Notes to Financial Statements.
Oakmark.com 17
Oakmark Equity and Income Fund March 31, 2017 (Unaudited)
Schedule of Investments (in thousands) (continued)
| | | Par Value | | Value | |
FIXED INCOME - 22.7% (continued) | |
CORPORATE BONDS - 13.6% (continued) | |
Ventas Realty LP / Ventas Capital Corp. REIT
2.00%, due 02/15/18 | | $ | 15,876 | | | $ | 15,899 | | |
Ventas Realty, LP REIT
3.50%, due 02/01/25 | | | 1,000 | | | | 979 | | |
3.125%, due 06/15/23 | | | 2,490 | | | | 2,458 | | |
Weyerhaeuser Co. REIT
6.95%, due 08/01/17 | | | 22,722 | | | | 23,067 | | |
| | | | | | 240,766 | | |
INFORMATION TECHNOLOGY - 1.3% | |
Activision Blizzard, Inc., 144A
6.125%, due 09/15/23 (d) | | | 20,525 | | | | 22,218 | | |
Avnet, Inc.
3.75%, due 12/01/21 | | | 2,985 | | | | 3,019 | | |
4.875%, due 12/01/22 | | | 5,290 | | | | 5,557 | | |
Broadcom Corp. / Broadcom Cayman
Finance, Ltd., 144A
2.375%, due 01/15/20 (d) | | | 9,955 | | | | 9,954 | | |
3.625%, due 01/15/24 (d) | | | 9,955 | | | | 10,028 | | |
3.00%, due 01/15/22 (d) | | | 14,930 | | | | 14,911 | | |
CDW LLC / CDW Finance Corp.
5.00%, due 09/01/23 | | | 6,965 | | | | 7,043 | | |
5.00%, due 09/01/25 | | | 9,955 | | | | 10,154 | | |
CommScope Technologies LLC,
144A 5.00%, due 03/15/27 (d) | | | 10,945 | | | | 10,928 | | |
Diamond 1 Finance Corp. /
Diamond 2 Finance Corp., 144A
4.42%, due 06/15/21 (d) | | | 2,940 | | | | 3,075 | | |
5.45%, due 06/15/23 (d) | | | 14,725 | | | | 15,888 | | |
eBay, Inc.
2.50%, due 03/09/18 | | | 2,945 | | | | 2,967 | | |
Electronic Arts, Inc.
3.70%, due 03/01/21 | | | 14,740 | | | | 15,300 | | |
4.80%, due 03/01/26 | | | 19,655 | | | | 21,256 | | |
2.75%, due 03/15/20 | | | 19,660 | | | | 19,888 | | |
Lam Research Corp.
2.80%, due 06/15/21 | | | 4,910 | | | | 4,928 | | |
Symantec Corp., 144A
5.00%, due 04/15/25 (d) | | | 1,000 | | | | 1,025 | | |
Tyco Electronics Group SA
6.55%, due 10/01/17 | | | 21,061 | | | | 21,573 | | |
3.70%, due 02/15/26 | | | 9,830 | | | | 10,045 | | |
| | | | | | 209,757 | | |
CONSUMER STAPLES - 0.8% | |
CVS Health Corp.
2.25%, due 08/12/19 | | | 2,884 | | | | 2,903 | | |
4.75%, due 12/01/22 | | | 6,880 | | | | 7,467 | | |
5.00%, due 12/01/24 | | | 6,880 | | | | 7,528 | | |
4.00%, due 12/05/23 | | | 18,198 | | | | 19,111 | | |
Kraft Heinz Foods Co.
2.00%, due 07/02/18 | | | 34,173 | | | | 34,258 | | |
Kraft Heinz Foods Co., 144A
4.875%, due 02/15/25 (d) | | | 6,260 | | | | 6,692 | | |
| | | Par Value | | Value | |
Mead Johnson Nutrition Co.
4.125%, due 11/15/25 | | $ | 13,955 | | | $ | 14,621 | | |
3.00%, due 11/15/20 | | | 6,885 | | | | 7,018 | | |
Mondelez International Holdings
Netherlands BV, 144A
1.625%, due 10/28/19 (d) | | | 7,764 | | | | 7,647 | | |
2.00%, due 10/28/21 (d) | | | 8,585 | | | | 8,261 | | |
Post Holdings, Inc., 144A
7.75%, due 03/15/24 (d) | | | 500 | | | | 551 | | |
5.50%, due 03/01/25 (d) | | | 500 | | | | 502 | | |
5.75%, due 03/01/27 (d) | | | 500 | | | | 499 | | |
5.00%, due 08/15/26 (d) | | | 2,000 | | | | 1,915 | | |
Smithfield Foods, Inc., 144A
2.70%, due 01/31/20 (d) | | | 6,420 | | | | 6,416 | | |
3.35%, due 02/01/22 (d) | | | 4,975 | | | | 4,968 | | |
4.25%, due 02/01/27 (d) | | | 995 | | | | 1,007 | | |
| | | | | | 131,364 | | |
ENERGY - 0.7% | |
Chevron Corp.
1.365%, due 03/02/18 | | | 9,835 | | | | 9,829 | | |
Concho Resources, Inc.
5.50%, due 10/01/22 | | | 6,980 | | | | 7,216 | | |
ConocoPhillips Co.
4.20%, due 03/15/21 | | | 4,915 | | | | 5,241 | | |
National Oilwell Varco, Inc.
1.35%, due 12/01/17 | | | 9,844 | | | | 9,817 | | |
Oceaneering International, Inc.
4.65%, due 11/15/24 | | | 5,895 | | | | 5,934 | | |
Peabody Securities Finance Corp., 144A
6.00%, due 03/31/22 (d) | | | 500 | | | | 497 | | |
6.375%, due 03/31/25 (d) | | | 500 | | | | 497 | | |
Schlumberger Holdings Corp., 144A
1.90%, due 12/21/17 (d) | | | 4,915 | | | | 4,924 | | |
2.35%, due 12/21/18 (d) | | | 14,740 | | | | 14,838 | | |
4.00%, due 12/21/25 (d) | | | 9,830 | | | | 10,245 | | |
Ultra Petroleum Corp., 144A
6.125%, due 10/01/24 (d) (g) | | | 19,665 | | | | 13,962 | | |
5.75%, due 12/15/18 (d) (g) | | | 37,809 | | | | 26,466 | | |
| | | | | | 109,466 | | |
INDUSTRIALS - 0.4% | |
Arconic, Inc.
6.75%, due 07/15/18 | | | 11,456 | | | | 12,075 | | |
IHS Markit, Ltd., 144A
4.75%, due 02/15/25 (d) | | | 100 | | | | 103 | | |
Manitowoc Foodservice, Inc.
9.50%, due 02/15/24 | | | 4,915 | | | | 5,664 | | |
Pentair Finance SA
2.90%, due 09/15/18 | | | 21,630 | | | | 21,848 | | |
Stanley Black & Decker, Inc.
2.451%, due 11/17/18 | | | 6,875 | | | | 6,947 | | |
The Manitowoc Co., Inc., 144A
12.75%, due 08/15/21 (d) | | | 4,420 | | | | 5,006 | | |
WESCO Distribution, Inc.
5.375%, due 06/15/24 | | | 13,675 | | | | 14,017 | | |
| | | | | | 65,660 | | |
See accompanying Notes to Financial Statements.
18 OAKMARK FUNDS
Oakmark Equity and Income Fund March 31, 2017 (Unaudited)
Schedule of Investments (in thousands) (continued)
| | | Par Value | | Value | |
FIXED INCOME - 22.7% (continued) | |
CORPORATE BONDS - 13.6% (continued) | |
TELECOMMUNICATION SERVICES - 0.2% | |
AT&T, Inc.
5.00%, due 03/01/21 | | $ | 16,710 | | | $ | 18,028 | | |
Level 3 Financing, Inc.
5.125%, due 05/01/23 | | | 6,895 | | | | 7,050 | | |
Zayo Group LLC / Zayo Capital, Inc.
6.00%, due 04/01/23 | | | 14,745 | | | | 15,575 | | |
| | | | | | 40,653 | | |
MATERIALS - 0.1% | |
Glencore Canada Corp.
5.50%, due 06/15/17 | | | 25,290 | | | | 25,475 | | |
Total Corporate Bonds
(Cost $2,205,906) | | | | | 2,229,686 | | |
GOVERNMENT AND AGENCY SECURITIES - 9.0% | |
U.S. GOVERNMENT NOTES - 8.8% | |
U.S. Government Notes
1.25%, due 07/15/20 | | | 467,369 | | | | 494,543 | | |
1.375%, due 07/15/18 | | | 422,777 | | | | 437,283 | | |
2.125%, due 01/15/19 | | | 225,469 | | | | 237,180 | | |
1.75%, due 03/31/22 | | | 74,645 | | | | 73,951 | | |
1.25%, due 11/30/18 | | | 73,725 | | | | 73,774 | | |
1.875%, due 11/30/21 | | | 49,785 | | | | 49,726 | | |
2.125%, due 01/31/21 | | | 24,570 | | | | 24,906 | | |
1.75%, due 10/31/20 | | | 24,570 | | | | 24,624 | | |
0.75%, due 06/30/17 | | | 24,585 | | | | 24,579 | | |
| | | | | | 1,440,566 | | |
U.S. GOVERNMENT AGENCIES - 0.2% | |
Federal National Mortgage Association,
1.25%, due 09/27/18 | | | 24,680 | | | | 24,687 | | |
Federal Farm Credit Banks,
1.68%, due 08/16/21 | | | 17,165 | | | | 16,887 | | |
| | | | | | 41,574 | | |
Total Government and Agency Securities
(Cost $1,434,998) | | | | | 1,482,140 | | |
CONVERTIBLE BOND - 0.1% | |
Chesapeake Energy Corp., 144A,
5.50%, due 09/15/26 (d)
(Cost $14,445) | | | 14,915 | | | | 15,446 | | |
TOTAL FIXED INCOME - 22.7%
(COST $3,655,349) | | | | | 3,727,272 | | |
SHORT TERM INVESTMENTS - 16.5% | |
COMMERCIAL PAPER - 11.5% | |
MetLife Short Term Funding LLC, 144A,
0.71% - 1.05%,
due 04/03/17 - 06/15/17 (d) (h) | | | 447,000 | | | | 446,627 | | |
Toyota Motor Credit Corp., 0.76% - 0.98%,
due 04/04/17 - 05/10/17 (h) | | | 248,800 | | | | 248,672 | | |
Kellogg Co., 144A, 1.01% - 1.04%,
due 04/03/17 - 04/07/17 (d) (h) | | | 105,350 | | | | 105,339 | | |
General Mills, Inc., 144A, 0.90% - 1.15%,
due 04/05/17 - 05/12/17 (d) (h) | | | 352,644 | | | | 352,505 | | |
| | | Par Value | | Value | |
Schlumberger Holdings Corp., 144A,
1.07% - 1.22%,
due 04/25/17 - 06/02/17 (d) (h) | | $ | 100,750 | | | $ | 100,609 | | |
BMW US Capital LLC, 144A, 0.77% - 0.83%,
due 04/06/17 - 04/21/17 (d) (h) | | | 132,490 | | | | 132,465 | | |
Kraft Food Group, Inc., 144A, 1.07% - 1.33%,
due 04/03/17 - 05/01/17 (d) (h) | | | 294,750 | | | | 294,620 | | |
Anthem, Inc., 144A, 0.98% - 1.22%,
due 04/10/17 - 05/09/17 (d) (h) | | | 186,500 | | | | 186,377 | | |
American Honda Finance Corp.,
0.88%, due 04/18/17 (h) | | | 16,000 | | | | 15,993 | | |
Total Commercial Paper (Cost $1,883,209) | | | | | 1,883,207 | | |
REPURCHASE AGREEMENT - 2.7% | |
Fixed Income Clearing Corp. Repurchase
Agreement, 0.22% dated 03/31/17 due
04/03/17, repurchase price $442,678,
collateralized by United States Treasury
Notes, 2.000% - 2.125%, due 02/15/25 -
05/15/25, aggregate value plus accrued
interest of $451,524 (Cost: $442,670) | | | 442,670 | | | | 442,670 | | |
U.S. GOVERNMENT BILL - 1.8% | |
United States Treasury Bills,
0.66% - 0.72%,
due 04/20/17 - 08/17/17
(Cost $299,464) | | | 300,000 | | | | 299,367 | | |
CORPORATE BONDS - 0.5% | |
FINANCIALS - 0.3% | |
Bank of America Corp.,
1.70%, due 08/25/17 | | | 41,521 | | | | 41,585 | | |
MATERIALS - 0.1% | |
Glencore Finance Canada, Ltd., 144A,
2.70%, due 10/25/17 (d) | | | 14,930 | | | | 14,990 | | |
ENERGY - 0.1% | |
Cameron International Corp.,
1.40%, due 06/15/17 | | | 6,970 | | | | 6,973 | | |
HEALTH CARE - 0.0% (i) | |
Amgen, Inc.,
5.85%, due 06/01/17 | | | 4,330 | | | | 4,359 | | |
CONSUMER STAPLES - 0.0% (i) | |
Kraft Heinz Foods Co.,
2.25%, due 06/05/17 | | | 4,030 | | | | 4,037 | | |
CONSUMER DISCRETIONARY - 0.0% (i) | |
Newell Brands, Inc.,
2.05%, due 12/01/17 | | | 3,735 | | | | 3,747 | | |
Total Corporate Bonds (Cost $75,671) | | | | | 75,691 | | |
TOTAL SHORT TERM INVESTMENTS - 16.5%
(COST $2,701,014) | | | | | 2,700,935 | | |
TOTAL INVESTMENTS - 100.1%
(COST $12,013,371) | | | | | 16,401,230 | | |
Liabilities In Excess of Other Assets - (0.1)% | | | | | (17,909 | ) | |
NET ASSETS - 100.0% | | | | $ | 16,383,321 | | |
See accompanying Notes to Financial Statements.
Oakmark.com 19
Oakmark Equity and Income Fund March 31, 2017 (Unaudited)
Schedule of Investments (in thousands) (continued)
(a) Non-income producing security
(b) See Note 5 in the Notes to Financial Statements regarding investments in affiliated issuers.
(c) Sponsored American Depositary Receipt
(d) See Note 1 in the Notes to Financial Statements regarding restricted securities. These securities may be resold subject to restrictions on resale under federal securities law.
(e) Floating Rate Note. Rate shown is as of March 31, 2017.
(f) Security is perpetual and has no stated maturity date.
(g) Security is in default.
(h) The rate shown represents the annualized yield at the time of purchase; not a coupon rate.
(i) Amount rounds to less than 0.1%.
Abbreviations:
REIT: Real Estate Investment Trust
See accompanying Notes to Financial Statements.
20 OAKMARK FUNDS

This page intentionally left blank.
Oakmark.com 21
Oakmark Global Fund March 31, 2017
Summary Information
VALUE OF A $10,000 INVESTMENT
Since Inception - 08/04/99 (Unaudited)
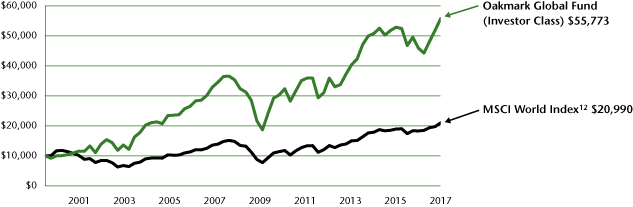
PERFORMANCE
| | | | | Average Annual Total Returns (as of 03/31/17) | | | |
(Unaudited) | | Total Return
Last 3 Months | | 1-year | | 3-year | | 5-year | | 10-year | | Since
Inception | | Inception
Date | |
Oakmark Global Fund (Investor Class) | | | 7.59 | % | | | 21.42 | % | | | 3.16 | % | | | 9.22 | % | | | 4.90 | % | | | 10.22 | % | | 08/04/99 | |
MSCI World Index | | | 6.38 | % | | | 14.77 | % | | | 5.52 | % | | | 9.37 | % | | | 4.21 | % | | | 4.29 | % | | | |
Lipper Global Fund Index13 | | | 6.95 | % | | | 16.30 | % | | | 5.12 | % | | | 8.91 | % | | | 4.16 | % | | | 5.08 | % | | | |
Oakmark Global Fund (Advisor Class) | | | 7.62 | % | | | N/A | | | | N/A | | | | N/A | | | | N/A | | | | 10.98 | %* | | 11/30/16 | |
Oakmark Global Fund (Institutional Class) | | | 7.62 | % | | | N/A | | | | N/A | | | | N/A | | | | N/A | | | | 10.98 | %* | | 11/30/16 | |
Oakmark Global Fund (Service Class) | | | 7.49 | % | | | 21.02 | % | | | 2.78 | % | | | 8.84 | % | | | 4.53 | % | | | 10.35 | % | | 10/10/01 | |
The graph and table do not reflect the deduction of taxes that a shareholder would pay on Fund distributions or the redemption of Fund shares.
* Returns Since Inception for the Advisor Class and the Institutional Class are not annualized.
Past performance is no guarantee of future results. The performance data quoted represents past performance. Current performance may be lower or higher than the performance data quoted. Total return includes change in share prices and, in each case, includes reinvestment of dividends and capital gain distributions. The investment return and principal value vary so that an investor's shares when redeemed may be worth more or less than the original cost. To obtain the most recent month-end performance, please visit Oakmark.com.
TOP TEN EQUITY HOLDINGS6 | | % of Net Assets | |
Credit Suisse Group AG | | | 4.7 | | |
| CNH Industrial NV | | | 4.7 | | |
Lloyds Banking Group PLC | | | 4.6 | | |
Allianz SE | | | 4.4 | | |
Bank of America Corp. | | | 4.4 | | |
TE Connectivity, Ltd. | | | 4.3 | | |
Daimler AG | | | 4.1 | | |
Alphabet Inc., Class C | | | 4.0 | | |
General Motors Co. | | | 4.0 | | |
Citigroup, Inc. | | | 3.8 | | |
FUND STATISTICS | |
Ticker* | | OAKGX | |
Inception* | | 08/04/99 | |
Number of Equity Holdings | | 36 | |
Net Assets | | $2.6 billion | |
Benchmark | | MSCI World Index | |
Weighted Average Market Cap | | $83.9 billion | |
Median Market Cap | | $28.2 billion | |
Portfolio Turnover (for the 6-months ended 03/31/17) | | 13% | |
Expense Ratio - Investor Class (as of 09/30/16)* | | 1.17% | |
* This information is related to the Investor Class. Please visit Oakmark.com for information related to the Advisor, Institutional and Service Classes.
SECTOR ALLOCATION | | % of Net Assets | |
Financials | | | 26.2 | | |
Information Technology | | | 22.5 | | |
Consumer Discretionary | | | 21.6 | | |
Industrials | | | 15.5 | | |
Materials | | | 5.2 | | |
Consumer Staples | | | 2.3 | | |
Energy | | | 1.9 | | |
Health Care | | | 1.2 | | |
Short-Term Investments and Other | | | 3.6 | | |
GEOGRAPHIC ALLOCATION | |
| | | % of Equity | |
North America | | | 43.3 | | |
United States | | | 43.3 | | |
Europe | | | 41.6 | | |
United Kingdom | | | 15.0 | | |
Germany* | | | 13.0 | | |
Switzerland | | | 12.2 | | |
Netherlands* | | | 1.4 | | |
| | | % of Equity | |
Asia | | | 9.3 | | |
Japan | | | 5.8 | | |
China | | | 2.7 | | |
South Korea | | | 0.8 | | |
Australasia | | | 3.2 | | |
Australia | | | 3.2 | | |
Latin America | | | 2.6 | | |
Mexico | | | 2.6 | | |
* Euro currency countries comprise 14.4% of equity investments
See accompanying Disclosures and Endnotes on page 71.
22 OAKMARK FUNDS
Oakmark Global Fund March 31, 2017
Portfolio Manager Commentary


David G. Herro, CFA
Portfolio Manager
oakgx@oakmark.com
Clyde S. McGregor, CFA
Portfolio Manager
oakgx@oakmark.com
Anthony P. Coniaris, CFA
Portfolio Manager
oakgx@oakmark.com
Jason E. Long, CFA
Portfolio Manager
oakgx@oakmark.com
Although the Oakmark Global Fund's 7.6% absolute return this quarter was nearly identical to last quarter's, the drivers of performance broadened to include more relative contribution from the Fund's large international weighting and was less driven by the financials sector, though it still contributed nicely. While we are pleased with the back-to-back 7.6% quarterly returns, please understand that high-single-digit quarterly returns are more the exception than the rule. In the meantime, we trust that you appreciate the performance as much as we do, as fellow shareholders in the Fund.
For the quarter ending March 31, as outlined above, the Oakmark Global Fund returned 7.6%, compared to the 6.4% return of the MSCI World Index12 and 7.0% return of the Lipper Global Fund Index13. Since its inception in 1999, the Fund has achieved a compound annual rate of return of 10.2%, which also compares favorably to the 4.3% return of the MSCI World Index and 5.1% return of the Lipper Global Fund Index.
Holdings in the United States, the United Kingdom and Switzerland contributed most to the Fund's performance while holdings in the Netherlands, Japan and China contributed least to its return. The three strongest individual contributors to the Fund's performance were CNH Industrial (+11%), Grupo Televisa (+24%) and Allianz (+12%). All of these remain significant holdings due to the still meaningful upside to our estimate of value. The largest detractors for the past quarter were Toyota Motor (–7%), CarMax (–8%) and Itron (–3%).
We initiated two new positions during the quarter (Wirecard and Arconic) and eliminated one (Omron).
Wirecard is a vertically integrated online payment services provider, primarily operating in Europe and South Asia. The majority of the activities are online, which allows for attractive growth opportunities as credit card penetration increases and as e-commerce displaces in-store purchases. As one of the leading players in the industry, Wirecard benefits from significant scale and network effects that allow it to provide an increasingly superior value proposition to its clients (i.e., a virtuous cycle effect). We find Wirecard's management team has added tremendous value for shareholders via its strategic and operational prowess, and the large insider ownership (CEO owns 7%) creates significant alignment with minority shareholders. Wirecard trades at a meaningful discount to both our fundamentally driven intrinsic value as well as recent private market transactions, and we took advantage of the short-term price weakness to initiate a position.
We purchased shares of Arconic after it separated from Alcoa and became an independent public company. We believe Arconic represents an attractive investment opportunity given our favorable long-term outlook for many of its end markets, the durability of its underlying business segments, and its discount relative to precedent acquisition activity. Arconic designs and manufactures lightweight metal parts and components that are used within the aerospace, building and construction, transportation, and other industries. Its largest division, Engineered Products and Solutions, accounts for approximately half of the firm's profits and is considered the "crown jewel" of the company. This segment has a similar product portfolio to Precision Castparts, which was acquired by Warren Buffett's Berkshire Hathaway in 2016. We believe Arconic's long-term revenue outlook is bright. It should benefit from the trend toward more lightweight platforms in both the commercial aerospace and automotive industries. Moreover, we expect Arconic's operating margins to expand considerably as the company reduces overhead and increases plant capacity utilization.
We eliminated our position in Omron as its share price approached our intrinsic value estimate, and we allocated the capital to investment opportunities that we believe offer superior risk-return profiles.
The Fund remains significantly underweight the U.S. due to relative valuation, which is probably not much of a surprise given the recent year's performance. The U.K., Switzerland and Germany remain our largest country overweights relative to the global indexes. As always, this country positioning is driven by our bottom-up stock selection process and can diverge greatly from an index. This is not because we simply believe different is good. Rather, we build portfolios in the same manner we would manage our personal capital. We seek to maximize after-tax returns over a multi-year time horizon by concentrating our investments in the most undervalued businesses with clear paths to growing per share values, managed by capable and properly motivated management teams.
We continue to believe the Swiss franc and Australian dollar are overvalued versus the U.S. dollar. As a result, we defensively hedged a portion of the Fund's exposure. Approximately 11% of the Swiss franc and 10% of the Australian dollar exposures were hedged at quarter end.
Thank you for being our partners in the Oakmark Global Fund. Please feel free to contact us with your questions or comments.
See accompanying Disclosures and Endnotes on page 71.
Oakmark.com 23
Oakmark Global Fund March 31, 2017 (Unaudited)
Schedule of Investments (in thousands)
| | | Shares | | Value | |
COMMON STOCKS - 96.4% | |
FINANCIALS - 26.2% | |
BANKS - 12.8% | |
Lloyds Banking Group PLC
(United Kingdom) | | | 144,399 | | | $ | 119,985 | | |
Bank of America Corp. (United States) | | | 4,829 | | | | 113,911 | | |
Citigroup, Inc. (United States) | | | 1,652 | | | | 98,841 | | |
| | | | | | 332,737 | | |
DIVERSIFIED FINANCIALS - 9.0% | |
Credit Suisse Group AG (Switzerland) | | | 8,135 | | | | 121,016 | | |
Julius Baer Group, Ltd. (Switzerland) | | | 1,546 | | | | 77,148 | | |
Daiwa Securities Group, Inc. (Japan) | | | 5,638 | | | | 34,329 | | |
| | | | | | 232,493 | | |
INSURANCE - 4.4% | |
Allianz SE (Germany) | | | 623 | | | | 115,378 | | |
| | | | | | 680,608 | | |
INFORMATION TECHNOLOGY - 22.5% | |
SOFTWARE & SERVICES - 14.8% | |
Alphabet, Inc., Class C (United States) (a) | | | 126 | | | | 104,573 | | |
MasterCard, Inc., Class A (United States) | | | 755 | | | | 84,949 | | |
Oracle Corp. (United States) | | | 1,763 | | | | 78,639 | | |
Baidu, Inc. (China) (a) (b) | | | 385 | | | | 66,351 | | |
Wirecard AG (Germany) | | | 900 | | | | 49,852 | | |
| | | | | | 384,364 | | |
TECHNOLOGY HARDWARE & EQUIPMENT - 7.7% | |
TE Connectivity, Ltd. (United States) | | | 1,491 | | | | 111,154 | | |
Itron, Inc. (United States) (a) | | | 628 | | | | 38,120 | | |
Hirose Electric Co., Ltd. (Japan) | | | 214 | | | | 29,574 | | |
Samsung Electronics Co., Ltd. (South Korea) | | | 11 | | | | 19,729 | | |
| | | | | | 198,577 | | |
| | | | | | 582,941 | | |
CONSUMER DISCRETIONARY - 21.6% | |
AUTOMOBILES & COMPONENTS - 11.2% | |
Daimler AG (Germany) | | | 1,446 | | | | 106,777 | | |
General Motors Co. (United States) | | | 2,919 | | | | 103,212 | | |
Toyota Motor Corp. (Japan) | | | 1,511 | | | | 82,009 | | |
| | | | | | 291,998 | | |
MEDIA - 6.6% | |
Grupo Televisa SAB (Mexico) (b) | | | 2,537 | | | | 65,817 | | |
The Interpublic Group of Cos., Inc.
(United States) | | | 2,626 | | | | 64,530 | | |
Live Nation Entertainment, Inc.
(United States) (a) | | | 1,339 | | | | 40,669 | | |
| | | | | | 171,016 | | |
CONSUMER DURABLES & APPAREL - 2.0% | |
Cie Financiere Richemont SA (Switzerland) | | | 644 | | | | 50,953 | | |
RETAILING - 1.8% | |
CarMax, Inc. (United States) (a) | | | 788 | | | | 46,677 | | |
| | | | | | 560,644 | | |
| | | Shares | | Value | |
INDUSTRIALS - 15.5% | |
CAPITAL GOODS - 13.6% | |
CNH Industrial N.V. (United Kingdom) | | | 12,534 | | | $ | 120,878 | | |
Travis Perkins PLC (United Kingdom) | | | 3,906 | | | | 74,100 | | |
USG Corp. (United States) (a) | | | 1,767 | | | | 56,181 | | |
MTU Aero Engines AG (Germany) | | | 412 | | | | 53,573 | | |
Koninklijke Philips N.V. (Netherlands) | | | 1,133 | | | | 36,416 | | |
Arconic, Inc. (United States) | | | 468 | | | | 12,314 | | |
| | | | | | 353,462 | | |
TRANSPORTATION - 1.9% | |
Union Pacific Corp. (United States) | | | 457 | | | | 48,406 | | |
| | | | | | 401,868 | | |
MATERIALS - 5.2% | |
Incitec Pivot, Ltd. (Australia) | | | 27,550 | | | | 79,141 | | |
LafargeHolcim, Ltd. (Switzerland) | | | 949 | | | | 56,085 | | |
| | | | | | 135,226 | | |
CONSUMER STAPLES - 2.3% | |
FOOD, BEVERAGE & TOBACCO - 2.3% | |
Diageo PLC (United Kingdom) | | | 2,095 | | | | 59,938 | | |
ENERGY - 1.9% | |
National Oilwell Varco, Inc. (United States) | | | 1,251 | | | | 50,137 | | |
HEALTH CARE - 1.2% | |
HEALTH CARE EQUIPMENT & SERVICES - 1.2% | |
Tenet Healthcare Corp. (United States) (a) | | | 1,729 | | | | 30,622 | | |
TOTAL COMMON STOCKS - 96.4%
(COST $1,902,155) | | | | | 2,501,984 | | |
| | | Par Value | | Value | |
SHORT TERM INVESTMENT - 2.5% | |
REPURCHASE AGREEMENT - 2.5% | |
Fixed Income Clearing Corp. Repurchase
Agreement, 0.22% dated 03/31/17 due
04/03/17, repurchase price $63,009,
collateralized by a United States
Treasury Note, 2.125%, due 05/15/25,
value plus accrued interest of
$64,271 (Cost: $63,008) | | $ | 63,008 | | | | 63,008 | | |
TOTAL SHORT TERM INVESTMENTS - 2.5%
(COST $63,008) | | | | | 63,008 | | |
TOTAL INVESTMENTS - 98.9%
(COST $1,965,163) | | | | | 2,564,992 | | |
Foreign Currencies (Cost $0) - 0.0% (c) | | | | | 0 | (d) | |
Other Assets In Excess of Liabilities - 1.1% | | | | | 29,826 | | |
TOTAL NET ASSETS - 100.0% | | | | $ | 2,594,818 | | |
(a) Non-income producing security
(b) Sponsored American Depositary Receipt
(c) Amount rounds to less than 0.1%.
(d) Amount rounds to less than $1,000.
See accompanying Notes to Financial Statements.
24 OAKMARK FUNDS

This page intentionally left blank.
Oakmark.com 25
Oakmark Global Select Fund March 31, 2017
Summary Information
VALUE OF A $10,000 INVESTMENT
Since Inception - 10/02/06 (Unaudited)

PERFORMANCE
| | | | | Average Annual Total Returns (as of 03/31/17) | | | |
(Unaudited) | | Total Return
Last 3 Months | | 1-year | | 3-year | | 5-year | | 10-year | | Since
Inception | | Inception
Date | |
Oakmark Global Select Fund (Investor Class) | | | 5.83 | % | | | 20.96 | % | | | 6.19 | % | | | 11.19 | % | | | 7.61 | % | | | 8.40 | % | | 10/02/06 | |
MSCI World Index | | | 6.38 | % | | | 14.77 | % | | | 5.52 | % | | | 9.37 | % | | | 4.21 | % | | | 5.04 | % | | | |
Lipper Global Fund Index13 | | | 6.95 | % | | | 16.30 | % | | | 5.12 | % | | | 8.91 | % | | | 4.16 | % | | | 5.02 | % | | | |
Oakmark Global Select Fund (Advisor Class) | | | 5.95 | % | | | N/A | | | | N/A | | | | N/A | | | | N/A | | | | 8.66 | %* | | 11/30/16 | |
Oakmark Global Select Fund (Institutional Class) | | | 5.95 | % | | | N/A | | | | N/A | | | | N/A | | | | N/A | | | | 8.66 | %* | | 11/30/16 | |
The graph and table do not reflect the deduction of taxes that a shareholder would pay on Fund distributions or the redemption of Fund shares.
* Returns Since Inception for the Advisor Class and the Institutional Class are not annualized.
Past performance is no guarantee of future results. The performance data quoted represents past performance. Current performance may be lower or higher than the performance data quoted. Total return includes change in share prices and, in each case, includes reinvestment of dividends and capital gain distributions. The investment return and principal value vary so that an investor's shares when redeemed may be worth more or less than the original cost. To obtain the most recent month-end performance, please visit Oakmark.com.
TOP TEN EQUITY HOLDINGS6 | | % of Net Assets | |
Lloyds Banking Group PLC | | | 6.7 | | |
Daimler AG | | | 6.3 | | |
| CNH Industrial NV | | | 6.0 | | |
Alphabet Inc., Class C | | | 5.8 | | |
Credit Suisse Group AG | | | 5.5 | | |
Bank of America Corp. | | | 5.2 | | |
TE Connectivity, Ltd. | | | 5.2 | | |
Citigroup, Inc. | | | 5.1 | | |
Danone SA | | | 4.9 | | |
Diageo PLC | | | 4.8 | | |
FUND STATISTICS | |
Ticker* | | OAKWX | |
Inception* | | 10/02/06 | |
Number of Equity Holdings | | 20 | |
Net Assets | | $2.4 billion | |
Benchmark | | MSCI World Index | |
Weighted Average Market Cap | | $113.6 billion | |
Median Market Cap | | $52.0 billion | |
Portfolio Turnover (for the 6-months ended 03/31/17) | | 25% | |
Expense Ratio - Investor Class (as of 09/30/16)* | | 1.15% | |
* This information is related to the Investor Class. Please visit Oakmark.com for information related to the Advisor, Institutional and Service Classes.
SECTOR ALLOCATION | | % of Net Assets | |
Financials | | | 28.0 | | |
Information Technology | | | 20.2 | | |
Industrials | | | 14.9 | | |
Consumer Discretionary | | | 12.8 | | |
Consumer Staples | | | 9.7 | | |
Materials | | | 4.6 | | |
Energy | | | 4.1 | | |
Short-Term Investments and Other | | | 5.7 | | |
GEOGRAPHIC ALLOCATION | |
| | | % of Equity | |
Europe | | | 52.5 | | |
Switzerland | | | 20.1 | | |
United Kingdom | | | 18.5 | | |
France* | | | 7.2 | | |
Germany* | | | 6.7 | | |
| | | % of Equity | |
North America | | | 47.5 | | |
United States | | | 47.5 | | |
* Euro currency countries comprise 13.9% of equity investments
See accompanying Disclosures and Endnotes on page 71.
26 OAKMARK FUNDS
Oakmark Global Select Fund March 31, 2017
Portfolio Manager Commentary


William C. Nygren, CFA
Portfolio Manager
oakwx@oakmark.com
David G. Herro, CFA
Portfolio Manager
oakwx@oakmark.com
Anthony P. Coniaris, CFA
Portfolio Manager
oakwx@oakmark.com
Eric Liu, CFA
Portfolio Manager
oakwx@oakmark.com
The Oakmark Global Select Fund returned 5.8% for the quarter ended March 31, 2017, compared to the MSCI World Index's12 6.4% return. Most importantly, the Fund has returned an average of 8.4% per year since its inception in October 2006, outperforming the MSCI World Index's annualized gain of 5.0% over the same period.
Richemont, the world's second-biggest luxury goods company, was the largest contributor to performance for the quarter, returning 19%. Investors reacted positively to the company's third-quarter sales update, which showed the first period of growth since the first half of 2015. Much of the improvement was driven by a recovery in greater China (PRC, Hong Kong and Macau), where demand appears to be normalizing following two-plus years of contraction after a government crackdown on gifting reduced demand for luxury watches. With the number of millionaires globally growing at a healthy rate and Richemont's ownership of one of the most valuable portfolios of luxury brands, including Cartier, Van Cleef and Piaget, we believe Richemont continues to be an attractive investment for our shareholders.
Apache, a U.S.-based leading oil and gas exploration and production company, was the largest detractor for the quarter, declining 19%. Shares reacted negatively to the company's 2017 production guidance, which was below expectations despite increased capital spending. Volumes are expected to decline in the first half of 2017 due to temporary maintenance as well as the lagging impact of capital expenditure reductions in 2016. However, production is expected to improve in the second half of 2017 primarily due to growth from the company's new oil and gas discovery (Alpine High) in the Permian Basin. In addition, the management team is focused on maximizing shareholder value through lean operations and careful capital allocation. Although Apache's near-term operating environment may be challenging, we believe its long-term prospects are promising and that the company is well positioned to benefit from an eventual recovery in oil prices.
During the quarter, we sold our position in Samsung Electronics and purchased shares of Willis Towers Watson. Samsung's stock price has performed well recently due to strong results from the company's memory business. Although Samsung remains well positioned, we decided to reinvest the proceeds into more attractive opportunities. Willis Towers Watson is the product of the 2016 merger between Willis Group and Towers Watson. At the time of the merger, Willis was the third-largest insurance broker in the world, operating in approximately 120 countries, while Towers Watson was a leading provider of risk management and
consulting services. We believe the combined group will be able to offer an enhanced value proposition to its clients and also generate significant operational and tax-related synergies. Given that the stock currently trades at 11x forward operating earnings and that the company produces a healthy free cash flow yield, we find that Willis Towers Watson has an attractive risk-reward profile.
Geographically, 47% of the Fund's holdings were invested in U.S.-domiciled companies as of March 31, while approximately 53% were allocated to equities in Europe.
We continue to believe the Swiss franc is overvalued versus the U.S. dollar. As a result, we defensively hedged a portion of the Fund's exposure. Approximately 10% of the Swiss franc exposure was hedged at quarter end.
We thank you, our shareholders, for your continued support and confidence.
See accompanying Disclosures and Endnotes on page 71.
Oakmark.com 27
Oakmark Global Select Fund March 31, 2017 (Unaudited)
Schedule of Investments (in thousands)
| | | Shares | | Value | |
COMMON STOCKS - 94.3% | |
FINANCIALS - 28.0% | |
BANKS - 16.9% | |
Lloyds Banking Group PLC
(United Kingdom) | | | 190,718 | | | $ | 158,472 | | |
Bank of America Corp. (United States) | | | 5,237 | | | | 123,541 | | |
Citigroup, Inc. (United States) | | | 2,036 | | | | 121,793 | | |
| | | | | | 403,806 | | |
INSURANCE - 5.6% | |
American International Group, Inc.
(United States) | | | 1,647 | | | | 102,823 | | |
Willis Towers Watson PLC (United States) | | | 227 | | | | 29,674 | | |
| | | | | | 132,497 | | |
DIVERSIFIED FINANCIALS - 5.5% | |
Credit Suisse Group AG (Switzerland) | | | 8,758 | | | | 130,274 | | |
| | | | | | 666,577 | | |
INFORMATION TECHNOLOGY - 20.2% | |
SOFTWARE & SERVICES - 15.0% | |
Alphabet, Inc., Class C (United States) (a) | | | 166 | | | | 138,018 | | |
Oracle Corp. (United States) | | | 2,450 | | | | 109,295 | | |
MasterCard, Inc., Class A (United States) | | | 972 | | | | 109,287 | | |
| | | | | | 356,600 | | |
TECHNOLOGY HARDWARE & EQUIPMENT - 5.2% | |
TE Connectivity, Ltd. (United States) | | | 1,654 | | | | 123,298 | | |
| | | | | | 479,898 | | |
INDUSTRIALS - 14.9% | |
CAPITAL GOODS - 10.7% | |
CNH Industrial N.V. (United Kingdom) | | | 14,782 | | | | 142,557 | | |
General Electric Co. (United States) | | | 3,750 | | | | 111,750 | | |
| | | | | | 254,307 | | |
TRANSPORTATION - 4.2% | |
Kuehne + Nagel International AG
(Switzerland) | | | 716 | | | | 101,119 | | |
| | | | | | 355,426 | | |
CONSUMER DISCRETIONARY - 12.8% | |
CONSUMER DURABLES & APPAREL - 6.5% | |
Cie Financiere Richemont SA (Switzerland) | | | 1,388 | | | | 109,782 | | |
Kering (France) | | | 180 | | | | 46,427 | | |
| | | | | | 156,209 | | |
AUTOMOBILES & COMPONENTS - 6.3% | |
Daimler AG (Germany) | | | 2,025 | | | | 149,483 | | |
| | | | | | 305,692 | | |
CONSUMER STAPLES - 9.7% | |
FOOD, BEVERAGE & TOBACCO - 9.7% | |
Danone SA (France) | | | 1,704 | | | | 115,924 | | |
Diageo PLC (United Kingdom) | | | 3,970 | | | | 113,587 | | |
| | | | | | 229,511 | | |
| | | Shares | | Value | |
MATERIALS - 4.6% | |
LafargeHolcim, Ltd. (Switzerland) | | | 1,860 | | | $ | 109,958 | | |
ENERGY - 4.1% | |
Apache Corp. (United States) | | | 1,890 | | | | 97,127 | | |
TOTAL COMMON STOCKS - 94.3%
(COST $1,926,449) | | | | | 2,244,189 | | |
| | | Par Value | | Value | |
SHORT TERM INVESTMENTS - 5.8% | |
REPURCHASE AGREEMENT - 5.8% | |
Fixed Income Clearing Corp. Repurchase
Agreement, 0.22% dated 03/31/17 due
04/03/17, repurchase price $138,487,
collateralized by United States Treasury
Notes, 2.000% - 2.250%, due
11/15/24 - 02/15/25, and by a
United States Treasury Inflation Indexed
Note, 0.250%, due 01/15/25, aggregate
value plus accrued interest of
$141,257 (Cost: $138,485) | | $ | 138,485 | | | | 138,485 | | |
TOTAL SHORT TERM INVESTMENTS - 5.8%
(COST $138,485) | | | | | 138,485 | | |
TOTAL INVESTMENTS - 100.1%
(COST $2,064,934) | | | | | 2,382,674 | | |
Foreign Currencies (Cost $0) - 0.0% (b) | | | | | 0 | (c) | |
Liabilities In Excess of Other Assets - (0.1)% | | | | | (1,293 | ) | |
TOTAL NET ASSETS - 100.0% | | | | $ | 2,381,381 | | |
(a) Non-income producing security
(b) Amount rounds to less than 0.1%.
(c) Amount rounds to less than $1,000.
See accompanying Notes to Financial Statements.
28 OAKMARK FUNDS

This page intentionally left blank.
Oakmark.com 29
Oakmark International Fund March 31, 2017
Summary Information
VALUE OF A $10,000 INVESTMENT
Since Inception - 09/30/92 (Unaudited)

PERFORMANCE
| | | | | Average Annual Total Returns (as of 03/31/17) | | | |
(Unaudited) | | Total Return
Last 3 Months | | 1-year | | 3-year | | 5-year | | 10-year | | Since
Inception | | Inception
Date | |
Oakmark International Fund (Investor Class) | | | 9.43 | % | | | 21.68 | % | | | 2.15 | % | | | 8.98 | % | | | 4.59 | % | | | 9.97 | % | | 09/30/92 | |
MSCI World ex U.S. Index | | | 6.81 | % | | | 11.93 | % | | | 0.35 | % | | | 5.38 | % | | | 1.13 | % | | | 5.90 | % | | | |
MSCI EAFE Index15 | | | 7.25 | % | | | 11.67 | % | | | 0.50 | % | | | 5.83 | % | | | 1.05 | % | | | 5.75 | % | | | |
Lipper International Fund Index16 | | | 8.10 | % | | | 11.70 | % | | | 1.13 | % | | | 6.01 | % | | | 1.86 | % | | | 6.76 | % | | | |
Oakmark International Fund (Advisor Class) | | | 9.47 | % | | | N/A | | | | N/A | | | | N/A | | | | N/A | | | | 13.21 | %* | | 11/30/16 | |
Oakmark International Fund (Institutional Class) | | | 9.47 | % | | | N/A | | | | N/A | | | | N/A | | | | N/A | | | | 13.21 | %* | | 11/30/16 | |
Oakmark International Fund (Service Class) | | | 9.37 | % | | | 21.29 | % | | | 1.79 | % | | | 8.61 | % | | | 4.25 | % | | | 8.19 | % | | 11/04/99 | |
The graph and table above do not reflect the deduction of taxes that a shareholder would pay on Fund distributions or the redemption of Fund shares.
* Returns Since Inception for the Advisor Class and the Institutional Class are not annualized.
Past performance is no guarantee of future results. The performance data quoted represents past performance. Current performance may be lower or higher than the performance data quoted. Total return includes change in share prices and, in each case, includes reinvestment of dividends and capital gain distributions. The investment return and principal value vary so that an investor's shares when redeemed may be worth more or less than the original cost. To obtain the most recent month-end performance, please visit Oakmark.com.
TOP TEN EQUITY HOLDINGS6 | | % of Net Assets | |
Glencore PLC | | | 3.9 | | |
Lloyds Banking Group PLC | | | 3.6 | | |
BNP Paribas SA | | | 3.6 | | |
Allianz SE | | | 3.5 | | |
Intesa Sanpaolo SpA | | | 3.5 | | |
Credit Suisse Group AG | | | 3.3 | | |
Daimler AG | | | 3.2 | | |
| CNH Industrial NV | | | 3.1 | | |
Hennes & Mauritz AB (H&M), Class B | | | 2.8 | | |
Honda Motor Co., Ltd. | | | 2.3 | | |
FUND STATISTICS | |
Ticker* | | OAKIX | |
Inception* | | 09/30/92 | |
Number of Equity Holdings | | 61 | |
Net Assets | | $29.8 billion | |
Benchmark | | MSCI World ex U.S. Index | |
Weighted Average Market Cap | | $44.0 billion | |
Median Market Cap | | $25.3 billion | |
Portfolio Turnover (for the 6-months ended 03/31/17) | | 22% | |
Expense Ratio - Investor Class (as of 09/30/16)* | | 1.00% | |
* This information is related to the Investor Class. Please visit Oakmark.com for information related to the Advisor, Institutional and Service Classes.
SECTOR ALLOCATION | | % of Net Assets | |
Financials | | | 29.6 | | |
Consumer Discretionary | | | 26.7 | | |
Industrials | | | 19.1 | | |
Materials | | | 7.7 | | |
Consumer Staples | | | 5.8 | | |
Information Technology | | | 5.1 | | |
Health Care | | | 1.1 | | |
Short-Term Investments and Other | | | 4.9 | | |
GEOGRAPHIC ALLOCATION | |
| | | % of Equity | |
Europe | | | 77.1 | | |
United Kingdom | | | 16.8 | | |
France* | | | 16.4 | | |
Switzerland | | | 15.8 | | |
Germany* | | | 11.0 | | |
Sweden | | | 6.4 | | |
Netherlands* | | | 4.9 | | |
Italy* | | | 4.7 | | |
Ireland* | | | 1.1 | | |
Asia | | | 15.2 | | |
Japan | | | 7.9 | | |
Indonesia | | | 2.0 | | |
China | | | 2.0 | | |
| | | % of Equity | |
Asia (cont'd) | | | 15.2 | | |
India | | | 1.1 | | |
Hong Kong | | | 1.1 | | |
South Korea | | | 0.8 | | |
Taiwan | | | 0.3 | | |
Australasia | | | 3.5 | | |
Australia | | | 3.5 | | |
Latin America | | | 2.1 | | |
Mexico | | | 2.1 | | |
North America | | | 2.0 | | |
United States | | | 2.0 | | |
Middle East | | | 0.1 | | |
Israel | | | 0.1 | | |
* Euro currency countries comprise 38.1% of equity investments
See accompanying Disclosures and Endnotes on page 71.
30 OAKMARK FUNDS
Oakmark International Fund March 31, 2017
Portfolio Manager Commentary


David G. Herro, CFA
Portfolio Manager
oakix@oakmark.com
Michael L. Manelli, CFA
Portfolio Manager
oakix@oakmark.com
The Oakmark International Fund returned 9.4% for the quarter ended March 31, 2017, outperforming the MSCI World ex U.S. Index14, which returned 6.8% over the same period. Most importantly, the Fund has returned an average of 10.0% per year since its inception in September 1992, outperforming the MSCI World ex U.S. Index, which has averaged 5.9% per year over the same period.
Glencore, one of the world's largest mining companies and commodities traders, was the top contributor to performance again this quarter, returning 14%. Glencore reported full-year 2016 operating profit of $10.3 billion, which exceeded our estimates by approximately 5%. Improved profitability was driven by solid performance in both the Industrial and Marketing segments. In January, we met with CEO Ivan Glasenberg, who remains optimistic about copper prices given steady demand and deteriorating supply. In addition, Glencore officially completed its debt reduction plan in 2016, and its net debt declined by $14.1 billion over the last 18 months—a remarkable achievement that reflects management's decisive action. As the company's balance sheet health has improved, so has its generation of free cash flow, which will largely be returned to shareholders. Management plans to return at least $1 billion to shareholders in 2017 via dividends. We believe management is working to enhance shareholder value, and our investment thesis remains intact.
H&M, a global fashion designer and retailer, was the largest detractor for the quarter, declining 8%. As we anticipated, higher-than-normal inventory levels in the first quarter led to increased markdowns and lower margins. While H&M has started to see an improvement in a number of markets, including China, its performance in the U.S. and Central/Southern Europe remains weak. However, the company is taking definitive steps to improve results and increase its profitability. Last year, a new management team revised the company's growth targets to focus more on comparable and profitable growth. Also it recently announced the launch of the Arket brand, a higher priced concept that will offer classic garments for women, men and children, as well as home furnishings. We support this move as the company has been successful with its other lines, including & Other Stories and COS. We believe that H&M's substantial investments over the past few years will soon bear fruit and that the gross margin headwinds facing the company will also abate. For these reasons, we continue to believe that H&M provides good investment value and that it will reward shareholders in the long term.
During the quarter, we sold our position in Nomura Holdings and added two new names to the portfolio: Publicis Group (France), a leading global advertising and media services company, and Volvo (Sweden), the world's second-largest truck manufacturer.
Geographically, we ended the quarter with 77% of our holdings in Europe, 8% in Japan and 4% in Australia. The remaining positions are in Mexico, the U.S., Indonesia, China, India, Hong Kong, South Korea, Taiwan and Israel.
We continue to believe the Swiss franc and Australian dollar are overvalued versus the U.S. dollar. As a result, we defensively hedged a portion of the Fund's exposure. Approximately 10% of the Swiss franc and 10% of the Australian dollar exposures were hedged at quarter end.
We continue to focus on finding what we believe are attractive, undervalued international companies with management teams focused on building shareholder value. We thank you for your support.
See accompanying Disclosures and Endnotes on page 71.
Oakmark.com 31
Oakmark International Fund March 31, 2017 (Unaudited)
Schedule of Investments (in thousands)
| | | Shares | | Value | |
COMMON STOCKS - 95.1% | |
FINANCIALS - 29.6% | |
BANKS - 13.9% | |
Lloyds Banking Group PLC (United Kingdom) | | | 1,282,004 | | | $ | 1,065,247 | | |
BNP Paribas SA (France) | | | 15,891 | | | | 1,058,352 | | |
Intesa Sanpaolo SpA (Italy) | | | 381,251 | | | | 1,035,506 | | |
Bank Mandiri Persero Tbk PT (Indonesia) | | | 652,075 | | | | 572,532 | | |
Royal Bank of Scotland Group PLC
(United Kingdom) (a) | | | 140,225 | | | | 425,341 | | |
| | | | | | 4,156,978 | | |
DIVERSIFIED FINANCIALS - 10.2% | |
Credit Suisse Group AG (Switzerland) | | | 67,038 | | | | 997,220 | | |
EXOR N.V. (Netherlands) (b) | | | 12,780 | | | | 660,980 | | |
AMP, Ltd. (Australia) | | | 145,462 | | | | 575,667 | | |
Schroders PLC (United Kingdom) | | | 11,263 | | | | 427,568 | | |
Daiwa Securities Group, Inc. (Japan) | | | 60,278 | | | | 367,041 | | |
Schroders PLC, Non-Voting (United Kingdom) | | | 31 | | | | 866 | | |
| | | | | | 3,029,342 | | |
INSURANCE - 5.5% | |
Allianz SE (Germany) | | | 5,663 | | | | 1,049,051 | | |
Willis Towers Watson PLC (United States) | | | 4,433 | | | | 580,213 | | |
| | | | | | 1,629,264 | | |
| | | | | | 8,815,584 | | |
CONSUMER DISCRETIONARY - 26.7% | |
AUTOMOBILES & COMPONENTS - 12.8% | |
Daimler AG (Germany) | | | 12,836 | | | | 947,608 | | |
Honda Motor Co., Ltd. (Japan) | | | 22,653 | | | | 681,837 | | |
Toyota Motor Corp. (Japan) | | | 11,726 | | | | 636,394 | | |
Continental AG (Germany) | | | 2,815 | | | | 617,037 | | |
Bayerische Motoren Werke AG (Germany) | | | 5,577 | | | | 508,700 | | |
Valeo SA (France) | | | 6,439 | | | | 428,854 | | |
| | | | | | 3,820,430 | | |
CONSUMER DURABLES & APPAREL - 6.7% | |
Cie Financiere Richemont SA (Switzerland) | | | 6,877 | | | | 543,773 | | |
Swatch Group AG, Bearer Shares (Switzerland) | | | 1,283 | | | | 459,562 | | |
LVMH Moet Hennessy Louis Vuitton SA (France) | | | 1,693 | | | | 371,712 | | |
Kering (France) | | | 1,245 | | | | 322,120 | | |
Prada SpA (Italy) | | | 67,541 | | | | 283,756 | | |
| | | | | | 1,980,923 | | |
MEDIA - 3.4% | |
Grupo Televisa SAB (Mexico) (c) | | | 22,830 | | | | 592,213 | | |
Publicis Groupe SA (France) | | | 5,550 | | | | 387,840 | | |
WPP PLC (United Kingdom) | | | 2,134 | | | | 46,849 | | |
| | | | | | 1,026,902 | | |
RETAILING - 2.8% | |
Hennes & Mauritz AB (H&M) - Class B
(Sweden) | | | 32,554 | | | | 831,946 | | |
| | | Shares | | Value | |
CONSUMER SERVICES - 1.0% | |
Melco Crown Entertainment, Ltd.
(Hong Kong) (c) | | | 16,188 | | | $ | 300,132 | | |
| | | | | | 7,960,333 | | |
INDUSTRIALS - 19.1% | |
CAPITAL GOODS - 13.3% | |
CNH Industrial N.V. (United Kingdom) (b) | | | 94,700 | | | | 913,273 | | |
Safran SA (France) | | | 7,303 | | | | 545,585 | | |
SKF AB, Class B (Sweden) (b) | | | 23,339 | | | | 461,801 | | |
Koninklijke Philips N.V. (Netherlands) | | | 13,358 | | | | 429,363 | | |
Ashtead Group PLC (United Kingdom) | | | 19,135 | | | | 396,299 | | |
Volvo AB, Class B (Sweden) | | | 26,601 | | | | 392,748 | | |
Meggitt PLC (United Kingdom) (b) | | | 42,083 | | | | 234,791 | | |
Smiths Group PLC (United Kingdom) | | | 11,152 | | | | 226,220 | | |
Atlas Copco AB, Series B (Sweden) | | | 4,404 | | | | 139,977 | | |
Komatsu, Ltd. (Japan) | | | 4,940 | | | | 128,742 | | |
Wolseley PLC (United Kingdom) | | | 1,659 | | | | 104,325 | | |
| | | | | | 3,973,124 | | |
COMMERCIAL & PROFESSIONAL SERVICES - 4.1% | |
Bureau Veritas SA (France) (b) | | | 24,739 | | | | 521,891 | | |
G4S PLC (United Kingdom) (b) | | | 95,612 | | | | 364,528 | | |
Experian PLC (Ireland) | | | 15,561 | | | | 317,406 | | |
| | | | | | 1,203,825 | | |
TRANSPORTATION - 1.7% | |
Kuehne + Nagel International AG (Switzerland) | | | 3,598 | | | | 508,208 | | |
| | | | | | 5,685,157 | | |
MATERIALS - 7.7% | |
Glencore PLC (Switzerland) | | | 295,610 | | | | 1,159,814 | | |
LafargeHolcim, Ltd. (Switzerland) | | | 9,541 | | | | 563,887 | | |
Orica, Ltd. (Australia) (b) | | | 30,997 | | | | 416,797 | | |
Akzo Nobel NV (Netherlands) | | | 1,757 | | | | 145,660 | | |
| | | | | | 2,286,158 | | |
CONSUMER STAPLES - 5.8% | |
FOOD, BEVERAGE & TOBACCO - 5.8% | |
Danone SA (France) | | | 8,244 | | | | 560,748 | | |
Diageo PLC (United Kingdom) | | | 19,218 | | | | 549,812 | | |
Pernod Ricard SA (France) | | | 3,102 | | | | 367,004 | | |
Nestle SA (Switzerland) | | | 3,199 | | | | 245,437 | | |
| | | | | | 1,723,001 | | |
INFORMATION TECHNOLOGY - 5.1% | |
SOFTWARE & SERVICES - 3.0% | |
Baidu, Inc. (China) (a) (c) | | | 3,241 | | | | 559,086 | | |
Infosys, Ltd. (India) (c) | | | 19,890 | | | | 314,257 | | |
Check Point Software Technologies, Ltd.
(Israel) (a) | | | 217 | | | | 22,226 | | |
| | | | | | 895,569 | | |
TECHNOLOGY HARDWARE & EQUIPMENT - 1.4% | |
Samsung Electronics Co., Ltd. (South Korea) | | | 131 | | | | 241,134 | | |
OMRON Corp. (Japan) | | | 3,872 | | | | 169,889 | | |
| | | | | | 411,023 | | |
See accompanying Notes to Financial Statements.
32 OAKMARK FUNDS
Oakmark International Fund March 31, 2017 (Unaudited)
Schedule of Investments (in thousands) (continued)
| | | Shares | | Value | |
COMMON STOCKS - 95.1% (continued) | |
INFORMATION TECHNOLOGY - 5.1% (continued) | |
SEMICONDUCTORS & SEMICONDUCTOR EQUIPMENT - 0.7% | |
ASML Holding NV (Netherlands) | | | 1,159 | | | $ | 153,775 | | |
Taiwan Semiconductor Manufacturing
Co., Ltd. (Taiwan) | | | 12,074 | | | | 75,207 | | |
| | | | | | 228,982 | | |
| | | | | | 1,535,574 | | |
HEALTH CARE - 1.1% | |
HEALTH CARE EQUIPMENT & SERVICES - 0.9% | |
Olympus Corp. (Japan) | | | 6,849 | | | | 263,289 | | |
PHARMACEUTICALS, BIOTECHNOLOGY & LIFE SCIENCES - 0.2% | |
Sanofi (France) | | | 839 | | | | 75,694 | | |
| | | | | | 338,983 | | |
TOTAL COMMON STOCKS - 95.1%
(COST $24,722,085) | | | | | 28,344,790 | | |
| | | Par Value | | Value | |
SHORT TERM INVESTMENTS - 4.3% | |
REPURCHASE AGREEMENT - 3.0% | |
Fixed Income Clearing Corp. Repurchase
Agreement, 0.22% dated 03/31/17 due
04/03/17, repurchase price $877,873,
collateralized by United States
Treasury Notes, 2.250% - 2.375%,
due 01/31/24 - 11/15/24, aggregate
value plus accrued interest of
$895,414 (Cost: $877,857) | | $ | 877,857 | | | | 877,857 | | |
COMMERCIAL PAPER - 1.3% | |
American Honda Finance Corp.,
0.84%, due 04/05/17 (d) | | | 100,000 | | | | 99,991 | | |
Toyota Motor Credit Corp.,
0.87% - 0.91%, due 04/13/17 -
04/20/17 (d) | | | 100,000 | | | | 99,962 | | |
J.P. Morgan Securities LLC,
0.92%, due 05/02/17 (d) | | | 100,000 | | | | 99,921 | | |
BMW US Capital LLC, 144A,
0.77%, due 04/24/17 (d) (e) | | | 50,000 | | | | 49,976 | | |
John Deere Capital Co., 144A,
0.91%, due 04/21/17 (d) (e) | | | 50,000 | | | | 49,975 | | |
Total Commercial Paper (Cost $399,825) | | | | | 399,825 | | |
TOTAL SHORT TERM INVESTMENTS - 4.3%
(COST $1,277,682) | | | | | 1,277,682 | | |
TOTAL INVESTMENTS - 99.4%
(COST $25,999,767) | | | | | 29,622,472 | | |
Foreign Currencies (Cost $25,628) - 0.1% | | | | | 25,604 | | |
Other Assets In Excess of Liabilities - 0.5% | | | | | 151,088 | | |
TOTAL NET ASSETS - 100.0% | | | | $ | 29,799,164 | | |
(a) Non-income producing security
(b) See Note 5 in the Notes to Financial Statements regarding investments in affiliated issuers.
(c) Sponsored American Depositary Receipt
(d) The rate shown represents the annualized yield at the time of purchase; not a coupon rate.
(e) See Note 1 in the Notes to Financial Statements regarding restricted securities. These securities may be resold subject to restrictions on resale under federal securities law.
See accompanying Notes to Financial Statements.
Oakmark.com 33
Oakmark International Small Cap Fund March 31, 2017
Summary Information
VALUE OF A $10,000 INVESTMENT
Since 03/31/07 (Unaudited)
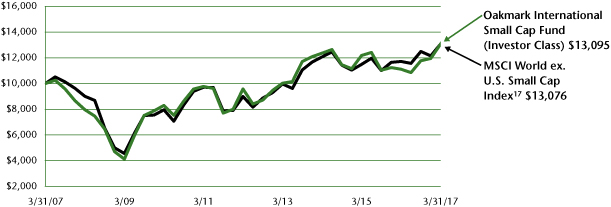
PERFORMANCE
| | | | | Average Annual Total Returns (as of 03/31/17) | | | |
(Unaudited) | | Total Return
Last 3 Months | | 1-year | | 3-year | | 5-year | | 10-year | | Since
Inception | | Inception
Date | |
Oakmark International Small Cap Fund (Investor Class) | | | 9.59 | % | | | 17.83 | % | | | 1.93 | % | | | 6.45 | % | | | 2.73 | % | | | 9.55 | % | | 11/01/95 | |
MSCI World ex U.S. Small Cap Index | | | 7.61 | % | | | 11.58 | % | | | 2.70 | % | | | 7.78 | % | | | 2.72 | % | | | N/A | | | | |
MSCI World ex U.S. Index14 | | | 6.81 | % | | | 11.93 | % | | | 0.35 | % | | | 5.38 | % | | | 1.13 | % | | | 5.06 | % | | | |
Lipper International Small Cap Fund Index18 | | | 8.70 | % | | | 9.99 | % | | | 2.23 | % | | | 8.25 | % | | | 3.39 | % | | | N/A | | | | |
Oakmark International Small Cap Fund (Advisor Class) | | | 9.65 | % | | | N/A | | | | N/A | | | | N/A | | | | N/A | | | | 13.14 | %* | | 11/30/16 | |
Oakmark International Small Cap Fund (Institutional Class) | | | 9.65 | % | | | N/A | | | | N/A | | | | N/A | | | | N/A | | | | 13.14 | %* | | 11/30/16 | |
Oakmark International Small Cap Fund (Service Class) | | | 9.49 | % | | | 17.42 | % | | | 1.65 | % | | | 6.15 | % | | | 2.45 | % | | | 9.74 | % | | 01/08/01 | |
The graph and table do not reflect the deduction of taxes that a shareholder would pay on Fund distributions or the redemption of Fund shares.
* Returns Since Inception for the Advisor Class and the Institutional Class are not annualized.
Past performance is no guarantee of future results. The performance data quoted represents past performance. Current performance may be lower or higher than the performance data quoted. Total return includes change in share prices and, in each case, includes reinvestment of dividends and capital gain distributions. The investment return and principal value vary so that an investor's shares when redeemed may be worth more or less than the original cost. The performance of the Fund does not reflect the 2% redemption fee imposed on shares redeemed within 90 days of purchase. To obtain the most recent month-end performance, please visit Oakmark.com.
TOP TEN EQUITY HOLDINGS6 | | % of Net Assets | |
IWG plc | | | 4.4 | | |
BNK Financial Group, Inc. | | | 3.6 | | |
Incitec Pivot, Ltd. | | | 3.6 | | |
Julius Baer Group, Ltd. | | | 3.5 | | |
Konecranes Plc | | | 3.3 | | |
Azimut Holding SPA | | | 3.3 | | |
Sugi Holdings Co., Ltd. | | | 3.2 | | |
Melco International Development, Ltd. | | | 3.2 | | |
Atea ASA | | | 3.1 | | |
DGB Financial Group, Inc. | | | 2.9 | | |
FUND STATISTICS | |
Ticker* | | OAKEX | |
Inception* | | 11/01/95 | |
Number of Equity Holdings | | 56 | |
Net Assets | | $2.6 billion | |
Benchmark | | MSCI World ex U.S. Small Cap Index | |
Weighted Average Market Cap | | $3.5 billion | |
Median Market Cap | | $2.7 billion | |
Portfolio Turnover (for the 6-months ended 03/31/17) | | 18% | |
Expense Ratio - Investor Class (as of 09/30/16)* | | 1.38% | |
* This information is related to the Investor Class. Please visit Oakmark.com for information related to the Advisor, Institutional and Service Classes.
SECTOR ALLOCATION | | % of Net Assets | |
Industrials | | | 37.5 | | |
Financials | | | 19.1 | | |
Information Technology | | | 11.9 | | |
Consumer Discretionary | | | 8.1 | | |
Materials | | | 6.4 | | |
Health Care | | | 4.8 | | |
Consumer Staples | | | 3.2 | | |
Real Estate | | | 2.0 | | |
Telecommunication Services | | | 1.7 | | |
Short Term Investments and Other | | | 5.3 | | |
GEOGRAPHIC ALLOCATION | |
| | | % of Equity | |
Europe | | | 60.5 | | |
United Kingdom | | | 16.9 | | |
Switzerland | | | 14.7 | | |
Finland* | | | 7.3 | | |
Italy* | | | 4.2 | | |
Germany* | | | 3.9 | | |
Norway | | | 3.3 | | |
Spain* | | | 2.6 | | |
France* | | | 2.5 | | |
Netherlands* | | | 2.0 | | |
Denmark | | | 1.9 | | |
Greece* | | | 1.2 | | |
Asia | | | 21.2 | | |
Japan | | | 7.8 | | |
| | | % of Equity | |
Asia (cont'd) | | | 21.2 | | |
South Korea | | | 6.9 | | |
Hong Kong | | | 4.6 | | |
Indonesia | | | 1.7 | | |
China | | | 0.2 | | |
Australasia | | | 10.8 | | |
Australia | | | 7.9 | | |
New Zealand | | | 2.9 | | |
North America | | | 4.6 | | |
Canada | | | 3.3 | | |
United States | | | 1.3 | | |
Latin America | | | 2.9 | | |
Brazil | | | 2.1 | | |
Mexico | | | 0.8 | | |
* Euro currency countries comprise 23.7% of equity investments
See accompanying Disclosures and Endnotes on page 71.
34 OAKMARK FUNDS
Oakmark International Small Cap Fund March 31, 2017
Portfolio Manager Commentary


David G. Herro, CFA
Portfolio Manager
oakex@oakmark.com
Michael L. Manelli, CFA
Portfolio Manager
oakex@oakmark.com
Justin D. Hance, CFA
Portfolio Manager
oakex@oakmark.com
The Oakmark International Small Cap Fund returned 9.6% for the quarter ended March 31, 2017, outperforming the MSCI World ex U.S. Small Cap Index17, which returned 7.6% for the same period. Since the Fund's inception in November 1995, it has returned an average of 9.6%, annualized.
The top-performing stock for the quarter was IWG (formerly known as Regus). IWG is a global flexible workplace provider whose network includes almost 3,000 locations across 900 cities in over 100 countries. IWG's share price reacted favorably after the release of the company's fiscal year 2016 earnings results in late February. The company reported 5% constant currency revenue growth, which was admittedly a little bit weaker than we had expected, but was more than offset by a 13% constant currency decline in overhead expense. This cost cutting was achieved even as the company expanded its network by 6%—a further illustration of IWG's excellent progress in restructuring its cost base. The company's strong operating leverage produced robust free cash flow and a material improvement in return on invested capital. We expect these trends to continue as management further rationalizes its overhead expenses while it increases the mix of capital contributions from third parties. These partnering relationships enable IWG to grow in a capital light manner while further reinforcing its significant scale advantage. (IWG has almost 20 times as many locations as the number two player in the industry.) While IWG's shares performed quite strongly in the first quarter, we see substantial upside from current levels and the company remains a significant holding in the portfolio.
The Fund's largest detractor for the quarter was SKY Network Television. Based in New Zealand, SKY Network Television provides pay-television services, with content ranging from news and sports to movies and pay-per-view events. SKY Network Television's fiscal first-half earnings were largely in line with analysts' expectations. However, news that the New Zealand Commerce Commission would not clear the company's proposed merger with Vodafone New Zealand weighed on SKY's share price in February and disappointed investors, including us, who believed the merger would benefit shareholders. Although we have reduced our estimate of SKY's intrinsic value, we continue to remain shareholders, as we believe its standalone business is still trading at a large discount to the company's true worth.
We initiated three new positions in the Fund this quarter: Megacable Holdings, Wirecard and Howden Joinery Group. Megacable Holdings is the second-largest cable provider in Mexico and the last remaining independent cable company of its size in the country. Based in Germany, Wirecard provides outsourcing and white label solutions for electronic payment transactions. Howden Joinery Group is the leading supplier of kitchens in the U.K., controlling 25% of the total market share.
We eliminated our positions in Ferrari (Italy) and Interpump Group (Italy) during the quarter.
Geographically, we ended the quarter with 21% of our holdings in Asia, 60% in Europe and the U.K., and 11% in Australasia. The remaining positions are 5% in North America (Canada and the U.S.) and 3% in Latin America (Brazil and Mexico).
We still maintain hedge positions on two of the Fund's currency exposures. As of the quarter end, the Australian dollar hedge was 9% and the Swiss franc exposure was hedged 10%.
Thank you for your continued confidence and support.
See accompanying Disclosures and Endnotes on page 71.
Oakmark.com 35
Oakmark International Small Cap Fund March 31, 2017 (Unaudited)
Schedule of Investments (in thousands)
| | | Shares | | Value | |
COMMON STOCKS - 94.7% | |
INDUSTRIALS - 37.5% | |
CAPITAL GOODS - 17.1% | |
Konecranes OYJ (Finland) | | | 2,454 | | | $ | 87,170 | | |
Travis Perkins PLC (United Kingdom) | | | 3,382 | | | | 64,155 | | |
MTU Aero Engines AG (Germany) | | | 467 | | | | 60,716 | | |
Metso OYJ (Finland) | | | 1,669 | | | | 50,524 | | |
Morgan Advanced Materials PLC
(United Kingdom) | | | 10,926 | | | | 42,435 | | |
Sulzer AG (Switzerland) | | | 373 | | | | 39,002 | | |
Bucher Industries AG (Switzerland) | | | 119 | | | | 34,766 | | |
Howden Joinery Group PLC (United Kingdom) | | | 4,351 | | | | 23,640 | | |
Wajax Corp. (Canada) (a) | | | 1,071 | | | | 18,442 | | |
Finning International, Inc. (Canada) | | | 859 | | | | 16,052 | | |
dormakaba Holding AG (Switzerland) | | | 11 | | | | 9,002 | | |
Melrose Industries PLC (United Kingdom) | | | 1,252 | | | | 3,498 | | |
| | | | | | 449,402 | | |
COMMERCIAL & PROFESSIONAL SERVICES - 16.1% | |
IWG PLC (Switzerland) | | | 29,106 | | | | 116,329 | | |
Pagegroup PLC (United Kingdom) | | | 12,480 | | | | 66,906 | | |
Applus Services SA (Spain) | | | 5,431 | | | | 65,272 | | |
Mitie Group PLC (United Kingdom) (a) | | | 18,037 | | | | 50,146 | | |
Randstad Holding N.V. (Netherlands) | | | 791 | | | | 45,645 | | |
SThree PLC (United Kingdom) | | | 6,352 | | | | 25,048 | | |
ALS, Ltd. (Australia) | | | 5,210 | | | | 24,439 | | |
Hays PLC (United Kingdom) | | | 10,913 | | | | 21,467 | | |
Brunel International N.V. (Netherlands) | | | 194 | | | | 3,153 | | |
Cleanaway Waste Management, Ltd. (Australia) | | | 2,774 | | | | 2,544 | | |
| | | | | | 420,949 | | |
TRANSPORTATION - 4.3% | |
DSV AS (Denmark) | | | 924 | | | | 47,822 | | |
Panalpina Welttransport Holding AG
(Switzerland) | | | 255 | | | | 30,759 | | |
Freightways, Ltd. (New Zealand) | | | 5,201 | | | | 27,308 | | |
BBA Aviation PLC (United Kingdom) | | | 1,945 | | | | 7,421 | | |
| | | | | | 113,310 | | |
| | | | | | 983,661 | | |
FINANCIALS - 19.1% | |
DIVERSIFIED FINANCIALS - 12.6% | |
Julius Baer Group, Ltd. (Switzerland) | | | 1,830 | | | | 91,334 | | |
Azimut Holding SPA (Italy) | | | 4,913 | | | | 85,594 | | |
Aberdeen Asset Management PLC
(United Kingdom) | | | 19,264 | | | | 63,889 | | |
Element Fleet Management Corp. (Canada) | | | 5,028 | | | | 46,541 | | |
EFG International AG (Switzerland) | | | 6,938 | | | | 43,012 | | |
| | | | | | 330,370 | | |
BANKS - 6.5% | |
BNK Financial Group, Inc. (South Korea) | | | 11,642 | | | | 95,570 | | |
DGB Financial Group, Inc. (South Korea) | | | 7,824 | | | | 75,908 | | |
| | | | | | 171,478 | | |
| | | | | | 501,848 | | |
| | | Shares | | Value | |
INFORMATION TECHNOLOGY - 11.9% | |
SOFTWARE & SERVICES - 8.0% | |
Atea ASA (Norway) (a) (b) | | | 6,922 | | | $ | 81,426 | | |
Totvs SA (Brazil) | | | 5,886 | | | | 52,172 | | |
Otsuka Corp. (Japan) | | | 733 | | | | 39,784 | | |
Wirecard AG (Germany) | | | 665 | | | | 36,808 | | |
| | | | | | 210,190 | | |
TECHNOLOGY HARDWARE & EQUIPMENT - 3.9% | |
Ingenico Group SA (France) | | | 647 | | | | 61,029 | | |
Hirose Electric Co., Ltd. (Japan) | | | 303 | | | | 41,913 | | |
| | | | | | 102,942 | | |
| | | | | | 313,132 | | |
CONSUMER DISCRETIONARY - 8.1% | |
MEDIA - 3.6% | |
SKY Network Television, Ltd. (New Zealand) | | | 16,365 | | | | 44,971 | | |
Hakuhodo DY Holdings, Inc. (Japan) | | | 2,461 | | | | 29,182 | | |
Megacable Holdings SAB de CV (Mexico) | | | 5,044 | | | | 19,550 | | |
| | | | | | 93,703 | | |
CONSUMER SERVICES - 3.1% | |
Melco International Development, Ltd.
(Hong Kong) | | | 46,834 | | | | 82,681 | | |
RETAILING - 1.2% | |
Hengdeli Holdings, Ltd. (Hong Kong) (b) | | | 201,901 | | | | 30,396 | | |
CONSUMER DURABLES & APPAREL - 0.2% | |
Cosmo Lady China Holdings Co., Ltd.
(China) | | | 17,876 | | | | 5,359 | | |
| | | | | | 212,139 | | |
MATERIALS - 6.4% | |
Incitec Pivot, Ltd. (Australia) | | | 32,665 | | | | 93,834 | | |
Outotec OYJ (Finland) (b) | | | 7,201 | | | | 43,674 | | |
Titan Cement Co. SA (Greece) | | | 1,222 | | | | 31,163 | | |
| | | | | | 168,671 | | |
HEALTH CARE - 4.8% | |
HEALTH CARE EQUIPMENT & SERVICES - 3.6% | |
Primary Health Care, Ltd. (Australia) | | | 23,696 | | | | 64,631 | | |
Amplifon S.p.A. (Italy) | | | 1,480 | | | | 17,836 | | |
Ansell, Ltd. (Australia) | | | 621 | | | | 11,426 | | |
| | | | | | 93,893 | | |
PHARMACEUTICALS, BIOTECHNOLOGY & LIFE SCIENCES - 1.2% | |
QIAGEN N.V. (United States) (b) | | | 1,115 | | | | 32,302 | | |
| | | | | | 126,195 | | |
CONSUMER STAPLES - 3.2% | |
FOOD & STAPLES RETAILING - 3.2% | |
Sugi Holdings Co., Ltd. (Japan) | | | 1,814 | | | | 83,253 | | |
REAL ESTATE - 2.0% | |
LSL Property Services PLC (United Kingdom) (a) | | | 10,413 | | | | 27,268 | | |
Countrywide PLC (United Kingdom) (a) | | | 12,249 | | | | 23,942 | | |
| | | | | | 51,210 | | |
See accompanying Notes to Financial Statements.
36 OAKMARK FUNDS
Oakmark International Small Cap Fund March 31, 2017 (Unaudited)
Schedule of Investments (in thousands) (continued)
| | | Shares | | Value | |
COMMON STOCKS - 94.7% (continued) | |
TELECOMMUNICATION SERVICES - 1.7% | |
Tower Bersama Infrastructure Tbk PT
(Indonesia) | | | 105,627 | | | $ | 43,200 | | |
TOTAL COMMON STOCKS - 94.7%
(COST $2,423,317) | | | | | 2,483,309 | | |
| | | Par Value | | Value | |
SHORT TERM INVESTMENTS - 4.8% | |
REPURCHASE AGREEMENT - 4.8% | |
Fixed Income Clearing Corp. Repurchase
Agreement, 0.22% dated 03/31/17 due
04/03/17, repurchase price $125,679,
collateralized by a United States
Treasury Note, 2.125%, due 05/15/25,
value plus accrued interest of
$128,191 (Cost: $125,677) | | $ | 125,677 | | | | 125,677 | | |
TOTAL SHORT TERM INVESTMENTS - 4.8%
(COST $125,677) | | | | | 125,677 | | |
TOTAL INVESTMENTS - 99.5%
(COST $2,548,994) | | | | | 2,608,986 | | |
Foreign Currencies (Cost $21) - 0.0% (c) | | | | | 21 | | |
Other Assets In Excess of Liabilities - 0.5% | | | | | 12,733 | | |
TOTAL NET ASSETS - 100.0% | | | | $ | 2,621,740 | | |
(a) See Note 5 in the Notes to Financial Statements regarding investments in affiliated issuers.
(b) Non-income producing security
(c) Amount rounds to less than 0.1%.
See accompanying Notes to Financial Statements.
Oakmark.com 37
Oakmark Funds
Statements of Assets and Liabilities—March 31, 2017 (Unaudited)
(in thousands except per share amounts)
| | | Oakmark
Fund | | Oakmark
Select
Fund | | Oakmark
Equity and
Income Fund | | Oakmark
Global
Fund | |
Assets | |
Investments in unaffiliated securities, at value (a) | | $ | 17,091,100 | | | $ | 5,785,454 | | | $ | 16,241,666 | | | $ | 2,564,992 | | |
Investments in affiliated securities, at value (b) | | | 0 | | | | 0 | | | | 159,564 | | | | 0 | | |
Foreign currency, at value (c) | | | 0 | (d) | | | 0 | | | | 0 | | | | 0 | (d) | |
Receivable for: | |
Securities sold | | | 11,791 | | | | 0 | | | | 0 | | | | 23,249 | | |
Fund shares sold | | | 27,482 | | | | 7,112 | | | | 11,688 | | | | 1,653 | | |
Dividends and interest from unaffiliated securities (Net of foreign tax withheld) | | | 14,641 | | | | 2,573 | | | | 33,755 | | | | 6,994 | | |
Dividends and interest from affiliated securities (Net of foreign tax withheld) | | | 0 | | | | 0 | | | | 0 | | | | 0 | | |
Tax reclaim from unaffiliated securities | | | 5,425 | | | | 28 | | | | 13,896 | | | | 4,161 | | |
Tax reclaim from affiliated securities | | | 0 | | | | 0 | | | | 0 | | | | 0 | | |
Total receivables | | | 59,339 | | | | 9,713 | | | | 59,339 | | | | 36,057 | | |
Other assets | | | 87 | | | | 51 | | | | 91 | | | | 42 | | |
Total assets | | $ | 17,150,526 | | | $ | 5,795,218 | | | $ | 16,460,660 | | | $ | 2,601,091 | | |
Liabilities and Net Assets | |
Payable for: | |
Securities purchased | | $ | 30,047 | | | $ | 0 | | | $ | 0 | | | $ | 2,475 | | |
Fund shares redeemed | | | 17,790 | | | | 2,099 | | | | 69,316 | | | | 1,480 | | |
Forward foreign currency contracts | | | 0 | | | | 0 | | | | 0 | | | | 599 | | |
Investment advisory fee | | | 1,574 | | | | 603 | | | | 1,298 | | | | 326 | | |
Other shareholder servicing fees | | | 3,584 | | | | 1,111 | | | | 4,440 | | | | 558 | | |
Transfer and dividend disbursing agent fees | | | 229 | | | | 123 | | | | 168 | | | | 71 | | |
Trustee fees | | | 9 | | | | 5 | | | | 10 | | | | 4 | | |
Deferred trustee compensation | | | 1,160 | | | | 1,021 | | | | 999 | | | | 484 | | |
Other | | | 1,085 | | | | 379 | | | | 1,108 | | | | 276 | | |
Total liabilities | | | 55,478 | | | | 5,341 | | | | 77,339 | | | | 6,273 | | |
Net assets applicable to Fund shares outstanding | | $ | 17,095,048 | | | $ | 5,789,877 | | | $ | 16,383,321 | | | $ | 2,594,818 | | |
Analysis of Net Assets | |
Paid in capital | | $ | 10,577,404 | | | $ | 3,635,405 | | | $ | 11,286,132 | | | $ | 1,975,634 | | |
Accumulated undistributed net realized gain (loss) | | | 470,178 | | | | 226,968 | | | | 708,064 | | | | 23,750 | | |
Net unrealized appreciation (depreciation) | | | 6,036,566 | | | | 1,928,451 | | | | 4,387,859 | | | | 598,966 | | |
Accumulated undistributed (over distributed) net investment income | | | 10,900 | | | | (947 | ) | | | 1,266 | | | | (3,532 | ) | |
Net assets applicable to Fund shares outstanding | | $ | 17,095,048 | | | $ | 5,789,877 | | | $ | 16,383,321 | | | $ | 2,594,818 | | |
Price of Shares | |
Net asset value, offering and redemption price per share: Investor Class (e) | | $ | 75.46 | | | $ | 44.33 | | | $ | 31.68 | | | $ | 30.19 | | |
Investor Class—Net assets | | $ | 15,574,548 | | | $ | 4,774,785 | | | $ | 14,801,955 | | | $ | 2,282,853 | | |
Investor Class—Shares outstanding (Unlimited shares authorized) | | | 206,384 | | | | 107,710 | | | | 467,194 | | | | 75,623 | | |
Net asset value, offering and redemption price per share: Advisor Class (f) | | $ | 75.52 | | | $ | 44.36 | | | $ | 31.70 | | | $ | 30.21 | | |
Advisor Class—Net Assets | | $ | 1,038,960 | | | $ | 536,091 | | | $ | 655,077 | | | $ | 133,834 | | |
Advisor Class—Shares outstanding (Unlimited shares authorized) | | | 13,758 | | | | 12,086 | | | | 20,663 | | | | 4,430 | | |
Net asset value, offering and redemption price per share: Institutional Class (f) | | $ | 75.51 | (g) | | $ | 44.36 | | | $ | 31.70 | | | $ | 30.21 | | |
Institutional Class—Net Assets | | $ | 320,646 | | | $ | 449,431 | | | $ | 252,341 | | | $ | 154,119 | �� | |
Institutional Class—Shares outstanding (Unlimited shares authorized) | | | 4,246 | | | | 10,132 | | | | 7,960 | | | | 5,101 | | |
Net asset value, offering and redemption price per share: Service Class (h) | | $ | 75.21 | (g) | | $ | 43.79 | (g) | | $ | 31.51 | | | $ | 29.41 | (g) | |
Service Class—Net assets | | $ | 160,894 | | | $ | 29,570 | | | $ | 673,948 | | | $ | 24,012 | | |
Service Class—Shares outstanding (Unlimited shares authorized) | | | 2,139 | | | | 675 | | | | 21,390 | | | | 816 | | |
| (a) Identified cost of investments in unaffiliated securities | | $ | 11,054,534 | | | $ | 3,857,003 | | | $ | 11,878,229 | | | $ | 1,965,163 | | |
| (b) Identified cost of investments in affiliated securities | | | 0 | | | | 0 | | | | 135,142 | | | | 0 | | |
| (c) Identified cost of foreign currency | | | 0 | (d) | | | 0 | | | | 0 | | | | 0 | (d) | |
| (d) Amount rounds to less than $1,000. | | | | | | | | | | | | | | | | | |
| (e) Formerly Class I shares. | | | | | | | | | | | | | | | | | |
| (f) Commenced operations on 11/30/2016. | | | | | | | | | | | | | | | | | |
| (g) Net assets have been rounded for presentation purposes. The net asset value per share shown is as reported on March 31, 2017. | | | | | | | | | | | | | | | | | |
| (h) Formerly Class II shares. | | | | | | | | | | | | | | | | | |
| (i) The redemption price per share does not reflect a 2% redemption fee on redemptions of shares held for 90 days or less. | | | | | | | | | | | | | | | | | |
See accompanying Notes to Financial Statements.
38 OAKMARK FUNDS
| | | Oakmark
Global Select
Fund | | Oakmark
International
Fund | | Oakmark
International
Small Cap Fund | |
Assets | |
Investments in unaffiliated securities, at value (a) | | $ | 2,382,674 | | | $ | 26,048,411 | | | $ | 2,407,762 | | |
Investments in affiliated securities, at value (b) | | | 0 | | | | 3,574,061 | | | | 201,224 | | |
Foreign currency, at value (c) | | | 0 | (d) | | | 25,604 | | | | 21 | | |
Receivable for: | |
Securities sold | | | 0 | | | | 65,818 | | | | 8,352 | | |
Fund shares sold | | | 10,514 | | | | 141,901 | | | | 4,980 | | |
Dividends and interest from unaffiliated securities (Net of foreign tax withheld) | | | 8,203 | | | | 89,298 | | | | 9,242 | | |
Dividends and interest from affiliated securities (Net of foreign tax withheld) | | | 0 | | | | 17,678 | | | | 989 | | |
Tax reclaim from unaffiliated securities | | | 4,849 | | | | 40,323 | | | | 3,777 | | |
Tax reclaim from affiliated securities | | | 0 | | | | 335 | | | | 0 | | |
Total receivables | | | 23,566 | | | | 355,353 | | | | 27,340 | | |
Other assets | | | 41 | | | | 118 | | | | 42 | | |
Total assets | | $ | 2,406,281 | | | $ | 30,003,547 | | | $ | 2,636,389 | | |
Liabilities and Net Assets | |
Payable for: | |
Securities purchased | | $ | 19,340 | | | $ | 161,466 | | | $ | 10,444 | | |
Fund shares redeemed | | | 4,125 | | | | 24,167 | | | | 1,351 | | |
Forward foreign currency contracts | | | 392 | | | | 6,908 | | | | 974 | | |
Investment advisory fee | | | 289 | | | | 2,884 | | | | 364 | | |
Other shareholder servicing fees | | | 454 | | | | 6,287 | | | | 600 | | |
Transfer and dividend disbursing agent fees | | | 29 | | | | 245 | | | | 51 | | |
Trustee fees | | | 4 | | | | 8 | | | | 4 | | |
Deferred trustee compensation | | | 15 | | | | 805 | | | | 463 | | |
Other | | | 252 | | | | 1,613 | | | | 398 | | |
Total liabilities | | | 24,900 | | | | 204,383 | | | | 14,649 | | |
Net assets applicable to Fund shares outstanding | | $ | 2,381,381 | | | $ | 29,799,164 | | | $ | 2,621,740 | | |
Analysis of Net Assets | |
Paid in capital | | $ | 1,965,095 | | | $ | 27,679,731 | | | $ | 2,571,288 | | |
Accumulated undistributed net realized gain (loss) | | | 93,638 | | | | (1,604,893 | ) | | | 742 | | |
Net unrealized appreciation (depreciation) | | | 317,103 | | | | 3,612,809 | | | | 59,024 | | |
Accumulated undistributed (over distributed) net investment income | | | 5,545 | | | | 111,517 | | | | (9,314 | ) | |
Net assets applicable to Fund shares outstanding | | $ | 2,381,381 | | | $ | 29,799,164 | | | $ | 2,621,740 | | |
Price of Shares | |
Net asset value, offering and redemption price per share: Investor Class (e) | | $ | 17.79 | | | $ | 24.84 | | | $ | 16.00 | (i) | |
Investor Class—Net assets | | $ | 2,150,692 | | | $ | 27,708,924 | | | $ | 2,375,724 | | |
Investor Class—Shares outstanding (Unlimited shares authorized) | | | 120,873 | | | | 1,115,480 | | | | 148,455 | | |
Net asset value, offering and redemption price per share: Advisor Class (f) | | $ | 17.81 | | | $ | 24.86 | | | $ | 16.02 | (i) | |
Advisor Class—Net Assets | | $ | 79,094 | | | $ | 541,638 | | | $ | 40,163 | | |
Advisor Class—Shares outstanding (Unlimited shares authorized) | | | 4,442 | | | | 21,787 | | | | 2,507 | | |
Net asset value, offering and redemption price per share: Institutional Class (f) | | $ | 17.81 | | | $ | 24.86 | | | $ | 16.02 | (i) | |
Institutional Class—Net Assets | | $ | 151,595 | | | $ | 1,010,008 | | | $ | 204,234 | | |
Institutional Class—Shares outstanding (Unlimited shares authorized) | | | 8,514 | | | | 40,626 | | | | 12,751 | | |
Net asset value, offering and redemption price per share: Service Class (h) | | $ | 0 | | | $ | 24.98 | | | $ | 15.92 | (g)(i) | |
Service Class—Net assets | | $ | 0 | | | $ | 538,594 | | | $ | 1,619 | | |
Service Class—Shares outstanding (Unlimited shares authorized) | | | 0 | | | | 21,561 | | | | 102 | | |
| (a) Identified cost of investments in unaffiliated securities | | $ | 2,064,934 | | | $ | 22,152,541 | | | $ | 2,273,134 | | |
| (b) Identified cost of investments in affiliated securities | | | 0 | | | | 3,847,226 | | | | 275,860 | | |
| (c) Identified cost of foreign currency | | | 0 | (d) | | | 25,628 | | | | 21 | | |
| (d) Amount rounds to less than $1,000. | | | | | | | | | | | | | |
| (e) Formerly Class I shares. | | | | | | | | | | | | | |
| (f) Commenced operations on 11/30/2016. | | | | | | | | | | | | | |
| (g) Net assets have been rounded for presentation purposes. The net asset value per share shown is as reported on March 31, 2017. | | | | | | | | | | | | | |
| (h) Formerly Class II shares. | | | | | | | | | | | | | |
| (i) The redemption price per share does not reflect a 2% redemption fee on redemptions of shares held for 90 days or less. | | | | | | | | | | | | | |
Oakmark.com 39
Oakmark Funds
Statements of Operations—March 31, 2017 (Unaudited)
(in thousands)
| | | Oakmark
Fund | | Oakmark
Select
Fund | | Oakmark
Equity and
Income Fund | | Oakmark
Global
Fund | |
Investment Income: | |
Dividends from unaffiliated securities | | $ | 134,320 | | | $ | 35,445 | | | $ | 91,958 | | | $ | 17,435 | | |
Dividends from affiliated securities | | | 0 | | | | 0 | | | | 0 | | | | 0 | | |
Interest income from unaffiliated securities | | | 5,788 | | | | 361 | | | | 66,889 | | | | 30 | | |
Security lending income | | | 0 | | | | 0 | | | | 0 | | | | 0 | | |
Foreign taxes withheld | | | 0 | | | | 0 | | | | 0 | | | | (1,151 | ) | |
Total investment income | | | 140,108 | | | | 35,806 | | | | 158,847 | | | | 16,314 | | |
Expenses: | |
Investment advisory fee | | | 58,511 | | | | 23,076 | | | | 55,105 | | | | 12,123 | | |
Transfer and dividend disbursing agent fees | | | 515 | | | | 281 | | | | 371 | | | | 141 | | |
Other shareholder servicing fees | | | 11,338 | | | | 3,403 | | | | 12,784 | | | | 1,900 | | |
Service fee—Service Class (a) | | | 224 | | | | 44 | | | | 943 | | | | 33 | | |
Reports to shareholders | | | 615 | | | | 145 | | | | 354 | | | | 112 | | |
Custody and accounting fees | | | 228 | | | | 111 | | | | 245 | | | | 172 | | |
Registration and blue sky expenses | | | 171 | | | | 122 | | | | 129 | | | | 81 | | |
Trustees fees | | | 333 | | | | 246 | | | | 315 | | | | 150 | | |
Legal fees | | | 204 | | | | 118 | | | | 208 | | | | 96 | | |
Audit and tax services fees | | | 26 | | | | 13 | | | | 27 | | | | 17 | | |
Other | | | 244 | | | | 163 | | | | 253 | | | | 130 | | |
Total expenses | | | 72,409 | | | | 27,722 | | | | 70,734 | | | | 14,955 | | |
Advisory fee waiver | | | (2,917 | ) | | | (1,697 | ) | | | (6,689 | ) | | | (613 | ) | |
Net expenses | | | 69,492 | | | | 26,025 | | | | 64,045 | | | | 14,342 | | |
Net Investment Income | | $ | 70,616 | | | $ | 9,781 | | | $ | 94,802 | | | $ | 1,972 | | |
Net realized and unrealized gain (loss): | |
Net realized gain (loss) on: | |
Unaffiliated investments | | | 505,789 | | | | 228,041 | | | | 707,812 | | | | 46,321 | | |
Affiliated investments | | | 0 | | | | 0 | | | | 0 | | | | 0 | | |
Forward foreign currency contracts | | | 0 | | | | 0 | | | | 0 | | | | 4,204 | | |
Foreign currency transactions | | | 0 | | | | 0 | | | | 0 | | | | (482 | ) | |
Written options | | | 1,035 | | | | 0 | | | | 0 | | | | 0 | | |
Net realized gain (loss) | | | 506,824 | | | | 228,041 | | | | 707,812 | | | | 50,043 | | |
Net change in unrealized appreciation (depreciation) on: | |
Unaffiliated investments | | | 1,322,813 | | | | 436,186 | | | | 617,239 | | | | 309,761 | | |
Affiliated investments | | | 0 | | | | 0 | | | | 24,422 | | | | 0 | | |
Forward foreign currency contracts | | | 0 | | | | 0 | | | | 0 | | | | (37 | ) | |
Foreign currency translation | | | 0 | | | | 0 | | | | 0 | | | | (95 | ) | |
Net change in unrealized appreciation (depreciation) | | | 1,322,813 | | | | 436,186 | | | | 641,661 | | | | 309,629 | | |
Net realized and unrealized gain | | | 1,829,637 | | | | 664,227 | | | | 1,349,473 | | | | 359,672 | | |
Net increase (decrease) in net assets resulting from operations | | $ | 1,900,253 | | | $ | 674,008 | | | $ | 1,444,275 | | | $ | 361,644 | | |
| (a) Formerly Class II shares. | | | | | | | | | | | | | | | | | |
See accompanying Notes to Financial Statements.
40 OAKMARK FUNDS
| | | Oakmark
Global Select
Fund | | Oakmark
International
Fund | | Oakmark
International
Small Cap Fund | |
Investment Income: | |
Dividends from unaffiliated securities | | $ | 18,351 | | | $ | 192,152 | | | $ | 26,070 | | |
Dividends from affiliated securities | | | 0 | | | | 27,771 | | | | 4,981 | | |
Interest income from unaffiliated securities | | | 56 | | | | 1,501 | | | | 48 | | |
Security lending income | | | 11 | | | | 469 | | | | 69 | | |
Foreign taxes withheld | | | (1,348 | ) | | | (18,364 | ) | | | (3,051 | ) | |
Total investment income | | | 17,070 | | | | 203,529 | | | | 28,117 | | |
Expenses: | |
Investment advisory fee | | | 10,767 | | | | 105,853 | | | | 13,012 | | |
Transfer and dividend disbursing agent fees | | | 46 | | | | 518 | | | | 75 | | |
Other shareholder servicing fees | | | 1,589 | | | | 19,696 | | | | 2,053 | | |
Service fee—Service Class (a) | | | 0 | | | | 653 | | | | 2 | | |
Reports to shareholders | | | 68 | | | | 951 | | | | 237 | | |
Custody and accounting fees | | | 141 | | | | 1,974 | | | | 361 | | |
Registration and blue sky expenses | | | 119 | | | | 345 | | | | 86 | | |
Trustees fees | | | 80 | | | | 338 | | | | 147 | | |
Legal fees | | | 94 | | | | 285 | | | | 97 | | |
Audit and tax services fees | | | 10 | | | | 39 | | | | 11 | | |
Other | | | 135 | | | | 322 | | | | 127 | | |
Total expenses | | | 13,049 | | | | 130,974 | | | | 16,208 | | |
Advisory fee waiver | | | (609 | ) | | | (5,695 | ) | | | 0 | | |
Net expenses | | | 12,440 | | | | 125,279 | | | | 16,208 | | |
Net Investment Income | | $ | 4,630 | | | $ | 78,250 | | | $ | 11,909 | | |
Net realized and unrealized gain (loss): | |
Net realized gain (loss) on: | |
Unaffiliated investments | | | 107,592 | | | | (348,698 | ) | | | 12,308 | | |
Affiliated investments | | | 0 | | | | (92,692 | ) | | | (1,101 | ) | |
Forward foreign currency contracts | | | 4,139 | | | | 36,511 | | | | 3,593 | | |
Foreign currency transactions | | | (93 | ) | | | (7,326 | ) | | | (558 | ) | |
Written options | | | 0 | | | | 0 | | | | 0 | | |
Net realized gain (loss) | | | 111,638 | | | | (412,205 | ) | | | 14,242 | | |
Net change in unrealized appreciation (depreciation) on: | |
Unaffiliated investments | | | 162,566 | | | | 3,626,698 | | | | 214,890 | | |
Affiliated investments | | | 0 | | | | 691,676 | | | | 13,763 | | |
Forward foreign currency contracts | | | (155 | ) | | | (1,884 | ) | | | 128 | | |
Foreign currency translation | | | (105 | ) | | | (995 | ) | | | 224 | | |
Net change in unrealized appreciation (depreciation) | | | 162,306 | | | | 4,315,495 | | | | 229,005 | | |
Net realized and unrealized gain | | | 273,944 | | | | 3,903,290 | | | | 243,247 | | |
Net increase (decrease) in net assets resulting from operations | | $ | 278,574 | | | $ | 3,981,540 | | | $ | 255,156 | | |
| (a) Formerly Class II shares. | | | | | | | | | | | | | |
Oakmark.com 41
Oakmark Funds
Statements of Changes in Net Assets
(in thousands)
| | | Oakmark Fund | |
| | | Six Months Ended
March 31, 2017
(Unaudited) | | Year Ended
September 30, 2016 | |
From Operations: | |
Net investment income | | $ | 70,616 | | | $ | 179,991 | | |
Net realized gain (loss) | | | 506,824 | | | | 252,726 | | |
Net change in unrealized appreciation (depreciation) | | | 1,322,813 | | | | 1,565,243 | | |
Net increase in net assets from operations | | | 1,900,253 | | | | 1,997,960 | | |
Distributions to shareholders from: | |
Net investment income—Investor Class | | | (164,699 | ) | | | (159,195 | ) | |
Net investment income—Service Class | | | (1,209 | ) | | | (1,174 | ) | |
Net realized gain—Investor Class | | | (235,492 | ) | | | (79,584 | ) | |
Net realized gain—Service Class | | | (2,593 | ) | | | (942 | ) | |
Total distributions to shareholders | | | (403,993 | ) | | | (240,895 | ) | |
From Fund share transactions: | |
Proceeds from shares sold—Investor Class | | | 2,035,008 | | | | 2,555,808 | | |
Proceeds from shares sold—Advisor Class | | | 1,026,375 | | | | 0 | | |
Proceeds from shares sold—Institutional Class | | | 328,245 | | | | 0 | | |
Proceeds from shares sold—Service Class | | | 15,318 | | | | 27,881 | | |
Reinvestment of distributions—Investor Class | | | 373,326 | | | | 225,429 | | |
Reinvestment of distributions—Service Class | | | 2,466 | | | | 1,424 | | |
Payment for shares redeemed—Investor Class | | | (2,910,869 | ) | | | (6,324,990 | ) | |
Payment for shares redeemed—Advisor Class | | | (18,200 | ) | | | 0 | | |
Payment for shares redeemed—Institutional Class | | | (16,074 | ) | | | 0 | | |
Payment for shares redeemed—Service Class | | | (50,028 | ) | | | (68,784 | ) | |
Net increase (decrease) in net assets from Fund share transactions | | | 785,567 | | | | (3,583,232 | ) | |
Total increase (decrease) in net assets | | | 2,281,827 | | | | (1,826,167 | ) | |
Net assets: | |
Beginning of period | | | 14,813,221 | | | | 16,639,388 | | |
End of period | | $ | 17,095,048 | | | $ | 14,813,221 | | |
Accumulated undistributed net investment income | | $ | 10,900 | | | $ | 136,566 | | |
Fund Share Transactions—Investor Class: | |
Shares sold | | | 27,996 | | | | 40,701 | | |
Shares issued in reinvestment of dividends | | | 5,290 | | | | 3,589 | | |
Less shares redeemed | | | (39,932 | ) | | | (101,179 | ) | |
Net decrease in shares outstanding | | | (6,646 | ) | | | (56,889 | ) | |
Fund Share Transactions—Advisor Class: | |
Shares sold | | | 14,002 | | | | 0 | | |
Less shares redeemed | | | (244 | ) | | | 0 | | |
Net increase in shares outstanding | | | 13,758 | | | | 0 | | |
Fund Share Transactions—Institutional Class: | |
Shares sold | | | 4,460 | | | | 0 | | |
Less shares redeemed | | | (214 | ) | | | 0 | | |
Net increase in shares outstanding | | | 4,246 | | | | 0 | | |
Fund Share Transactions—Service Class: | |
Shares sold | | | 212 | | | | 447 | | |
Shares issued in reinvestment of dividends | | | 35 | | | | 23 | | |
Less shares redeemed | | | (701 | ) | | | (1,086 | ) | |
Net decrease in shares outstanding | | | (454 | ) | | | (616 | ) | |
See accompanying Notes to Financial Statements.
42 OAKMARK FUNDS
Oakmark Funds
Statements of Changes in Net Assets (continued)
(in thousands)
| | | Oakmark Select Fund | |
| | | Six Months Ended
March 31, 2017
(Unaudited) | | Year Ended
September 30, 2016 | |
From Operations: | |
Net investment income | | $ | 9,781 | | | $ | 48,544 | | |
Net realized gain (loss) | | | 228,041 | | | | 278,880 | | |
Net change in unrealized appreciation (depreciation) | | | 436,186 | | | | 231,611 | | |
Net increase in net assets from operations | | | 674,008 | | | | 559,035 | | |
Distributions to shareholders from: | |
Net investment income—Investor Class | | | (48,511 | ) | | | (17,524 | ) | |
Net investment income—Service Class | | | (203 | ) | | | 0 | | |
Net realized gain—Investor Class | | | (203,667 | ) | | | 0 | | |
Net realized gain—Service Class | | | (1,343 | ) | | | 0 | | |
Total distributions to shareholders | | | (253,724 | ) | | | (17,524 | ) | |
From Fund share transactions: | |
Proceeds from shares sold—Investor Class | | | 670,505 | | | | 713,145 | | |
Proceeds from shares sold—Advisor Class | | | 536,609 | | | | 0 | | |
Proceeds from shares sold—Institutional Class | | | 445,602 | | | | 0 | | |
Proceeds from shares sold—Service Class | | | 5,680 | | | | 5,874 | | |
Reinvestment of distributions—Investor Class | | | 229,106 | | | | 15,156 | | |
Reinvestment of distributions—Service Class | | | 1,255 | | | | 0 | | |
Payment for shares redeemed—Investor Class | | | (1,484,942 | ) | | | (1,802,497 | ) | |
Payment for shares redeemed—Advisor Class | | | (10,077 | ) | | | 0 | | |
Payment for shares redeemed—Institutional Class | | | (6,849 | ) | | | 0 | | |
Payment for shares redeemed—Service Class | | | (14,641 | ) | | | (11,904 | ) | |
Net increase (decrease) in net assets from Fund share transactions | | | 372,248 | | | | (1,080,226 | ) | |
Total increase (decrease) in net assets | | | 792,532 | | | | (538,715 | ) | |
Net assets: | |
Beginning of period | | | 4,997,345 | | | | 5,536,060 | | |
End of period | | $ | 5,789,877 | | | $ | 4,997,345 | | |
Accumulated undistributed net investment income (loss) | | $ | (947 | ) | | $ | 38,900 | | |
Fund Share Transactions—Investor Class: | |
Shares sold | | | 15,457 | | | | 18,889 | | |
Shares issued in reinvestment of dividends | | | 5,507 | | | | 392 | | |
Less shares redeemed | | | (34,330 | ) | | | (47,664 | ) | |
Net decrease in shares outstanding | | | (13,366 | ) | | | (28,383 | ) | |
Fund Share Transactions—Advisor Class: | |
Shares sold | | | 12,315 | | | | 0 | | |
Less shares redeemed | | | (229 | ) | | | 0 | | |
Net increase in shares outstanding | | | 12,086 | | | | 0 | | |
Fund Share Transactions—Institutional Class: | |
Shares sold | | | 10,289 | | | | 0 | | |
Less shares redeemed | | | (157 | ) | | | 0 | | |
Net increase in shares outstanding | | | 10,132 | | | | 0 | | |
Fund Share Transactions—Service Class: | |
Shares sold | | | 132 | | | | 160 | | |
Shares issued in reinvestment of dividends | | | 30 | | | | 0 | | |
Less shares redeemed | | | (344 | ) | | | (316 | ) | |
Net decrease in shares outstanding | | | (182 | ) | | | (156 | ) | |
See accompanying Notes to Financial Statements.
Oakmark.com 43
Oakmark Funds
Statements of Changes in Net Assets (continued)
(in thousands)
| | | Oakmark Equity and Income Fund | |
| | | Six Months Ended
March 31, 2017
(Unaudited) | | Year Ended
September 30, 2016 | |
From Operations: | |
Net investment income | | $ | 94,802 | | | $ | 204,843 | | |
Net realized gain (loss) | | | 707,812 | | | | 466,672 | | |
Net change in unrealized appreciation (depreciation) | | | 641,661 | | | | 501,016 | | |
Net increase in net assets from operations | | | 1,444,275 | | | | 1,172,531 | | |
Distributions to shareholders from: | |
Net investment income—Investor Class | | | (231,364 | ) | | | (188,041 | ) | |
Net investment income—Service Class | | | (8,692 | ) | | | (5,787 | ) | |
Net realized gain—Investor Class | | | (393,093 | ) | | | (852,456 | ) | |
Net realized gain—Service Class | | | (18,736 | ) | | | (42,531 | ) | |
Total distributions to shareholders | | | (651,885 | ) | | | (1,088,815 | ) | |
From Fund share transactions: | |
Proceeds from shares sold—Investor Class | | | 963,380 | | | | 1,367,059 | | |
Proceeds from shares sold—Advisor Class | | | 651,759 | | | | 0 | | |
Proceeds from shares sold—Institutional Class | | | 262,111 | | | | 0 | | |
Proceeds from shares sold—Service Class | | | 49,968 | | | | 109,340 | | |
Reinvestment of distributions—Investor Class | | | 587,326 | | | | 979,322 | | |
Reinvestment of distributions—Service Class | | | 24,677 | | | | 42,857 | | |
Payment for shares redeemed—Investor Class | | | (2,846,535 | ) | | | (4,342,391 | ) | |
Payment for shares redeemed—Advisor Class | | | (16,800 | ) | | | 0 | | |
Payment for shares redeemed—Institutional Class | | | (17,021 | ) | | | 0 | | |
Payment for shares redeemed—Service Class | | | (179,871 | ) | | | (314,226 | ) | |
Net decrease in net assets from Fund share transactions | | | (521,006 | ) | | | (2,158,039 | ) | |
Total increase (decrease) in net assets | | | 271,384 | | | | (2,074,323 | ) | |
Net assets: | |
Beginning of period | | | 16,111,937 | | | | 18,186,260 | | |
End of period | | $ | 16,383,321 | | | $ | 16,111,937 | | |
Accumulated undistributed net investment income | | $ | 1,266 | | | $ | 170,714 | | |
Fund Share Transactions—Investor Class: | |
Shares sold | | | 31,135 | | | | 47,194 | | |
Shares issued in reinvestment of dividends | | | 19,722 | | | | 34,435 | | |
Less shares redeemed | | | (92,461 | ) | | | (149,324 | ) | |
Net decrease in shares outstanding | | | (41,604 | ) | | | (67,695 | ) | |
Fund Share Transactions—Advisor Class: | |
Shares sold | | | 21,200 | | | | 0 | | |
Less shares redeemed | | | (537 | ) | | | 0 | | |
Net increase in shares outstanding | | | 20,663 | | | | 0 | | |
Fund Share Transactions—Institutional Class: | |
Shares sold | | | 8,507 | | | | 0 | | |
Less shares redeemed | | | (547 | ) | | | 0 | | |
Net increase in shares outstanding | | | 7,960 | | | | 0 | | |
Fund Share Transactions—Service Class: | |
Shares sold | | | 1,629 | | | | 3,800 | | |
Shares issued in reinvestment of dividends | | | 832 | | | | 1,514 | | |
Less shares redeemed | | | (5,882 | ) | | | (10,780 | ) | |
Net decrease in shares outstanding | | | (3,421 | ) | | | (5,466 | ) | |
See accompanying Notes to Financial Statements.
44 OAKMARK FUNDS
Oakmark Funds
Statements of Changes in Net Assets (continued)
(in thousands)
| | | Oakmark Global Fund | |
| | | Six Months Ended
March 31, 2017
(Unaudited) | | Year Ended
September 30, 2016 | |
From Operations: | |
Net investment income | | $ | 1,972 | | | $ | 30,666 | | |
Net realized gain (loss) | | | 50,043 | | | | (10,417 | ) | |
Net change in unrealized appreciation (depreciation) | | | 309,629 | | | | 44,378 | | |
Net increase in net assets from operations | | | 361,644 | | | | 64,627 | | |
Distributions to shareholders from: | |
Net investment income—Investor Class | | | (26,172 | ) | | | (33,772 | ) | |
Net investment income—Service Class | | | (208 | ) | | | (216 | ) | |
Net realized gain—Investor Class | | | 0 | | | | (51,276 | ) | |
Net realized gain—Service Class | | | 0 | | | | (556 | ) | |
Total distributions to shareholders | | | (26,380 | ) | | | (85,820 | ) | |
From Fund share transactions: | |
Proceeds from shares sold—Investor Class | | | 187,644 | | | | 280,750 | | |
Proceeds from shares sold—Advisor Class | | | 131,870 | | | | 0 | | |
Proceeds from shares sold—Institutional Class | | | 148,795 | | | | 0 | | |
Proceeds from shares sold—Service Class | | | 1,467 | | | | 3,638 | | |
Reinvestment of distributions—Investor Class | | | 24,367 | | | | 79,112 | | |
Reinvestment of distributions—Service Class | | | 188 | | | | 685 | | |
Payment for shares redeemed—Investor Class | | | (575,412 | ) | | | (960,631 | ) | |
Payment for shares redeemed—Advisor Class | | | (5,965 | ) | | | 0 | | |
Payment for shares redeemed—Institutional Class | | | (1,231 | ) | | | 0 | | |
Payment for shares redeemed—Service Class | | | (6,672 | ) | | | (10,906 | ) | |
Net decrease in net assets from Fund share transactions | | | (94,949 | ) | | | (607,352 | ) | |
Total increase (decrease) in net assets | | | 240,315 | | | | (628,545 | ) | |
Net assets: | |
Beginning of period | | | 2,354,503 | | | | 2,983,048 | | |
End of period | | $ | 2,594,818 | | | $ | 2,354,503 | | |
Accumulated undistributed net investment income (loss) | | $ | (3,532 | ) | | $ | 17,461 | | |
Fund Share Transactions—Investor Class: | |
Shares sold | | | 6,565 | | | | 11,000 | | |
Shares issued in reinvestment of dividends | | | 899 | | | | 2,932 | | |
Less shares redeemed | | | (20,190 | ) | | | (37,591 | ) | |
Net decrease in shares outstanding | | | (12,726 | ) | | | (23,659 | ) | |
Fund Share Transactions—Advisor Class: | |
Shares sold | | | 4,634 | | | | 0 | | |
Less shares redeemed | | | (204 | ) | | | 0 | | |
Net increase in shares outstanding | | | 4,430 | | | | 0 | | |
Fund Share Transactions—Institutional Class: | |
Shares sold | | | 5,143 | | | | 0 | | |
Less shares redeemed | | | (42 | ) | | | 0 | | |
Net increase in shares outstanding | | | 5,101 | | | | 0 | | |
Fund Share Transactions—Service Class: | |
Shares sold | | | 53 | | | | 147 | | |
Shares issued in reinvestment of dividends | | | 7 | | | | 26 | | |
Less shares redeemed | | | (241 | ) | | | (435 | ) | |
Net decrease in shares outstanding | | | (181 | ) | | | (262 | ) | |
See accompanying Notes to Financial Statements.
Oakmark.com 45
Oakmark Funds
Statements of Changes in Net Assets (continued)
(in thousands)
| | | Oakmark Global Select Fund | |
| | | Six Months Ended
March 31, 2017
(Unaudited) | | Year Ended
September 30, 2016 | |
From Operations: | |
Net investment income | | $ | 4,630 | | | $ | 23,550 | | |
Net realized gain (loss) | | | 111,638 | | | | (7,516 | ) | |
Net change in unrealized appreciation (depreciation) | | | 162,306 | | | | 165,683 | | |
Net increase in net assets from operations | | | 278,574 | | | | 181,717 | | |
Distributions to shareholders from: | |
Net investment income—Investor Class | | | (21,509 | ) | | | (17,056 | ) | |
Net realized gain—Investor Class | | | 0 | | | | (100,960 | ) | |
Total distributions to shareholders | | | (21,509 | ) | | | (118,016 | ) | |
From Fund share transactions: | |
Proceeds from shares sold—Investor Class | | | 287,801 | | | | 649,482 | | |
Proceeds from shares sold—Advisor Class | | | 77,857 | | | | 0 | | |
Proceeds from shares sold—Institutional Class | | | 147,762 | | | | 0 | | |
Reinvestment of distributions—Investor Class | | | 19,755 | | | | 105,015 | | |
Payment for shares redeemed—Investor Class | | | (444,301 | ) | | | (814,528 | ) | |
Payment for shares redeemed—Advisor Class | | | (1,062 | ) | | | 0 | | |
Payment for shares redeemed—Institutional Class | | | (561 | ) | | | 0 | | |
Net increase (decrease) in net assets from Fund share transactions | | | 87,251 | | | | (60,031 | ) | |
Total increase in net assets | | | 344,316 | | | | 3,670 | | |
Net assets: | |
Beginning of period | | | 2,037,065 | | | | 2,033,395 | | |
End of period | | $ | 2,381,381 | | | $ | 2,037,065 | | |
Accumulated undistributed net investment income | | $ | 5,545 | | | $ | 21,991 | | |
Fund Share Transactions—Investor Class: | |
Shares sold | | | 16,875 | | | | 42,869 | | |
Shares issued in reinvestment of dividends | | | 1,219 | | | | 6,815 | | |
Less shares redeemed | | | (26,062 | ) | | | (54,704 | ) | |
Net decrease in shares outstanding | | | (7,968 | ) | | | (5,020 | ) | |
Fund Share Transactions—Advisor Class: | |
Shares sold | | | 4,503 | | | | 0 | | |
Less shares redeemed | | | (61 | ) | | | 0 | | |
Net increase in shares outstanding | | | 4,442 | | | | 0 | | |
Fund Share Transactions—Institutional Class: | |
Shares sold | | | 8,545 | | | | 0 | | |
Less shares redeemed | | | (31 | ) | | | 0 | | |
Net increase in shares outstanding | | | 8,514 | | | | 0 | | |
See accompanying Notes to Financial Statements.
46 OAKMARK FUNDS
Oakmark Funds
Statements of Changes in Net Assets (continued)
(in thousands)
| | | Oakmark International Fund | |
| | | Six Months Ended
March 31, 2017
(Unaudited) | | Year Ended
September 30, 2016 | |
From Operations: | |
Net investment income | | $ | 78,250 | | | $ | 434,720 | | |
Net realized gain (loss) | | | (412,205 | ) | | | (889,754 | ) | |
Net change in unrealized appreciation (depreciation) | | | 4,315,495 | | | | 2,039,296 | | |
Net increase in net assets from operations | | | 3,981,540 | | | | 1,584,262 | | |
Distributions to shareholders from: | |
Net investment income—Investor Class | | | (361,117 | ) | | | (585,096 | ) | |
Net investment income—Service Class | | | (6,151 | ) | | | (10,674 | ) | |
Net realized gain—Investor Class | | | 0 | | | | (688,352 | ) | |
Net realized gain—Service Class | | | 0 | | | | (15,185 | ) | |
Total distributions to shareholders | | | (367,268 | ) | | | (1,299,307 | ) | |
From Fund share transactions: | |
Proceeds from shares sold—Investor Class | | | 5,314,911 | | | | 6,945,769 | | |
Proceeds from shares sold—Advisor Class | | | 515,463 | | | | 0 | | |
Proceeds from shares sold—Institutional Class | | | 977,623 | | | | 0 | | |
Proceeds from shares sold—Service Class | | | 61,842 | | | | 173,213 | | |
Reinvestment of distributions—Investor Class | | | 301,316 | | | | 1,064,599 | | |
Reinvestment of distributions—Service Class | | | 4,068 | | | | 16,780 | | |
Payment for shares redeemed—Investor Class | | | (4,645,350 | ) | | | (10,927,323 | ) | |
Payment for shares redeemed—Advisor Class | | | (7,798 | ) | | | 0 | | |
Payment for shares redeemed—Institutional Class | | | (14,279 | ) | | | 0 | | |
Payment for shares redeemed—Service Class | | | (132,916 | ) | | | (222,233 | ) | |
Net increase (decrease) in net assets from Fund share transactions | | | 2,374,880 | | | | (2,949,195 | ) | |
Total increase (decrease) in net assets | | | 5,989,152 | | | | (2,664,240 | ) | |
Net assets: | |
Beginning of period | | | 23,810,012 | | | | 26,474,252 | | |
End of period | | $ | 29,799,164 | | | $ | 23,810,012 | | |
Accumulated undistributed net investment income | | $ | 111,517 | | | $ | 432,465 | | |
Fund Share Transactions—Investor Class: | |
Shares sold | | | 228,986 | | | | 338,391 | | |
Shares issued in reinvestment of dividends | | | 13,822 | | | | 50,146 | | |
Less shares redeemed | | | (201,821 | ) | | | (528,385 | ) | |
Net increase (decrease) in shares outstanding | | | 40,987 | | | | (139,848 | ) | |
Fund Share Transactions—Advisor Class: | |
Shares sold | | | 22,113 | | | | 0 | | |
Less shares redeemed | | | (326 | ) | | | 0 | | |
Net increase in shares outstanding | | | 21,787 | | | | 0 | | |
Fund Share Transactions—Institutional Class: | |
Shares sold | | | 41,221 | | | | 0 | | |
Less shares redeemed | | | (595 | ) | | | 0 | | |
Net increase in shares outstanding | | | 40,626 | | | | 0 | | |
Fund Share Transactions—Service Class: | |
Shares sold | | | 2,655 | | | | 8,292 | | |
Shares issued in reinvestment of dividends | | | 185 | | | | 787 | | |
Less shares redeemed | | | (5,763 | ) | | | (10,719 | ) | |
Net decrease in shares outstanding | | | (2,923 | ) | | | (1,640 | ) | |
See accompanying Notes to Financial Statements.
Oakmark.com 47
Oakmark Funds
Statements of Changes in Net Assets (continued)
(in thousands)
| | | Oakmark International Small Cap Fund | |
| | | Six Months Ended
March 31, 2017
(Unaudited) | | Year Ended
September 30, 2016 | |
From Operations: | |
Net investment income | | $ | 11,909 | | | $ | 77,687 | | |
Net realized gain (loss) | | | 14,242 | | | | 18,367 | | |
Net change in unrealized appreciation (depreciation) | | | 229,005 | | | | 56,716 | | |
Net increase in net assets from operations | | | 255,156 | | | | 152,770 | | |
Distributions to shareholders from: | |
Net investment income—Investor Class | | | (56,204 | ) | | | (68,535 | ) | |
Net investment income—Service Class | | | (35 | ) | | | (38 | ) | |
Net realized gain—Investor Class | | | (13,930 | ) | | | (67,833 | ) | |
Net realized gain—Service Class | | | (10 | ) | | | (44 | ) | |
Total distributions to shareholders | | | (70,179 | ) | | | (136,450 | ) | |
From Fund share transactions: | |
Proceeds from shares sold—Investor Class | | | 332,339 | | | | 557,728 | | |
Proceeds from shares sold—Advisor Class | | | 37,826 | | | | 0 | | |
Proceeds from shares sold—Institutional Class | | | 197,486 | | | | 0 | | |
Proceeds from shares sold—Service Class | | | 468 | | | | 312 | | |
Reinvestment of distributions—Investor Class | | | 65,293 | | | | 123,630 | | |
Reinvestment of distributions—Service Class | | | 32 | | | | 48 | | |
Payment for shares redeemed—Investor Class | | | (559,823 | ) | | | (1,184,763 | ) | |
Payment for shares redeemed—Advisor Class | | | (1,230 | ) | | | 0 | | |
Payment for shares redeemed—Institutional Class | | | (1,827 | ) | | | 0 | | |
Payment for shares redeemed—Service Class | | | (490 | ) | | | (830 | ) | |
Redemption fees—Investor Class | | | 57 | | | | 297 | | |
Redemption fees—Institutional Class | | | 0 | (a) | | | 0 | | |
Redemption fees—Service Class | | | 0 | (a) | | | 0 | (a) | |
Net increase (decrease) in net assets from Fund share transactions | | | 70,131 | | | | (503,578 | ) | |
Total increase (decrease) in net assets | | | 255,108 | | | | (487,258 | ) | |
Net assets: | |
Beginning of period | | | 2,366,632 | | | | 2,853,890 | | |
End of period | | $ | 2,621,740 | | | $ | 2,366,632 | | |
Accumulated undistributed net investment income | | $ | (9,314 | ) | | $ | 47,973 | | |
Fund Share Transactions—Investor Class: | |
Shares sold | | | 21,867 | | | | 39,793 | | |
Shares issued in reinvestment of dividends | | | 4,598 | | | | 8,875 | | |
Less shares redeemed | | | (37,360 | ) | | | (84,318 | ) | |
Net decrease in shares outstanding | | | (10,895 | ) | | | (35,650 | ) | |
Fund Share Transactions—Advisor Class: | |
Shares sold | | | 2,589 | | | | 0 | | |
Less shares redeemed | | | (82 | ) | | | 0 | | |
Net increase in shares outstanding | | | 2,507 | | | | 0 | | |
Fund Share Transactions—Institutional Class: | |
Shares sold | | | 12,867 | | | | 0 | | |
Less shares redeemed | | | (116 | ) | | | 0 | | |
Net increase in shares outstanding | | | 12,751 | | | | 0 | | |
Fund Share Transactions—Service Class: | |
Shares sold | | | 32 | | | | 22 | | |
Shares issued in reinvestment of dividends | | | 2 | | | | 3 | | |
Less shares redeemed | | | (33 | ) | | | (57 | ) | |
Net increase (decrease) in shares outstanding | | | 1 | | | | (32 | ) | |
(a) Amount rounds to less than $1,000.
See accompanying Notes to Financial Statements.
48 OAKMARK FUNDS
Oakmark Funds
Notes to Financial Statements
1. SIGNIFICANT ACCOUNTING POLICIES
Organization
The following are the significant accounting policies of Oakmark Fund ("Oakmark"), Oakmark Select Fund ("Select"), Oakmark Equity and Income Fund ("Equity and Income"), Oakmark Global Fund ("Global"), Oakmark Global Select Fund ("Global Select"), Oakmark International Fund ("International"), and Oakmark International Small Cap Fund ("Int'l Small Cap"), collectively referred to as the "Funds," each a series of Harris Associates Investment Trust (the "Trust"), a Massachusetts business trust, organized on February 1, 1991, which is registered as an open-end management investment company under the Investment Company Act of 1940, as amended (the "1940 Act") and accordingly follows the investment company accounting and reporting guidance of the Financial Accounting Standards Board ("FASB") Accounting Standards Codification Topic 946 Financial Services—Investment Companies. Each Fund, other than Select and Global Select, is diversified in accordance with the 1940 Act. The following policies are in conformity with accounting principles generally accepted in the United States of America ("GAAP"). The presentation of financial statements in conformity with GAAP requires management to make estimates and assumptions that affect the reported amounts of assets and liabilities at the date of the financial statements and the reported amounts of revenues and expenses during the reporting period. Actual results could differ from those estimates and assumptions.
Class disclosure
Each Fund offers four classes of shares: Investor Class (formerly Class I) Shares, Advisor Class Shares, Institutional Class Shares, and Service Class (formerly Class II) Shares. Investor Class, Advisor Class and Institutional Class Shares are offered for purchase directly from the Funds and through certain intermediaries who have entered into an agreement with the Funds' distributor and/or Harris Associates L.P., investment adviser to the Funds (the "Adviser"). Service Class (formerly Class II) Shares are offered to certain retirement plans such as 401(k) and profit sharing plans. Service Class Shares pay a service fee at the annual rate of up to 0.25% of the average net assets of Service Class Shares of the Funds. This service fee is paid to a third-party administrator for performing the services associated with the administration of such retirement plans. Global Select had no outstanding Service Class Shares during the six-month period ended March 31, 2017.
Income, realized and unrealized capital gains and losses, and expenses of the Funds not directly attributable to a specific class of shares are allocated to each class pro rata based on the relative net assets of each class. Transfer and dividend disbursing agent fees, other shareholder servicing fees and reports to shareholders expenses are specific to each class.
Redemption fees
Int'l Small Cap imposes a short-term trading fee on redemptions of shares held for 90 days or less to help offset two types of costs to the Fund caused by abusive trading: portfolio transaction and market impact costs associated with erratic redemption activity and administrative costs associated with processing redemptions. The fee is paid to the Fund and is 2% of the redemption value and is deducted from either the redemption proceeds or from the balance in the account. The "first-in, first-out" ("FIFO") method is used to determine the holding period. The Fund may approve the waiver of redemption fees on certain types of accounts held through intermediaries, pursuant to the Fund's policies and procedures. Redemption fees collected by the Fund, if any, are included in the Statements of Changes in Net Assets.
Security valuation
The Funds' share prices or net asset values ("NAVs") are calculated as of the close of regular session trading (usually 4:00 pm Eastern time) on the New York Stock Exchange ("NYSE") on any day on which the NYSE is open for trading. Equity securities principally traded on securities exchanges in the United States and over-the-counter securities are valued at the last sales price or the official closing price on the day of valuation, or lacking any reported sales that day, at the most recent bid quotation. Securities traded on the NASDAQ National Market System are valued at the NASDAQ Official Closing Price ("NOCP"), or lacking an NOCP, at the most recent bid quotation on the NASDAQ National Market System. Equity securities principally traded on securities exchanges outside the United States are valued, depending on local convention or regulation, at the last sales price, the last bid or asked price, the mean between the last bid and asked prices, or the official closing price, or are based on a pricing composite as of the close of the regular trading hours on the appropriate exchange or other designated time. Each long-term debt instrument is valued at the latest bid quotation or an evaluated price provided by an independent pricing service. The pricing service may use standard inputs such as benchmark yields, reported trades, broker/dealer quotes, issuer spreads, two-sided markets, benchmark securities, bids, offers, and reference data including market research publications. For certain security types additional inputs may be used or some of the standard inputs may not be applicable. Additionally, the pricing service monitors market indicators and industry and economic events, which may serve as a trigger to gather and possibly use additional market data. Each short-term debt instrument (i.e., debt instruments whose maturities or expiration dates at the time of acquisition are one year or less) or money market instrument maturing in 61 days or more from the date of valuation is valued at the latest bid quotation or an evaluated price provided by an independent pricing service. Each short-term instrument maturing in 60 days or less from the date of valuation is valued at amortized cost, which approximates market value. Options are valued at the mean of the most recent bid and asked quotations.
Securities for which quotations are not readily available or securities that may have been affected by a significant event occurring between the close of a foreign market and the close of the NYSE are valued at fair value, determined by or under the direction of the pricing committee authorized by the Board of Trustees. A significant event may include the performance of U.S. markets since the close of foreign markets. The Funds may use a systematic fair valuation model provided by an independent pricing service to value foreign securities in order to adjust local closing prices for information or events that may occur between the close of certain foreign exchanges and the close of the NYSE.
Oakmark.com 49
Oakmark Funds
Notes to Financial Statements (continued)
Fair value measurement
Various inputs are used in determining the value of each Fund's investments. These inputs are prioritized into three broad levels as follows:
Level 1—quoted prices in active markets for identical securities
Level 2—other significant observable inputs (including quoted prices for similar investments, interest rates, prepayment speeds, credit risk, and others)
Level 3—significant unobservable inputs (including the Adviser's own assumptions in determining the fair value of investments)
Observable inputs are those based on market data obtained from independent sources, and unobservable inputs reflect the Adviser's assumptions based on the best information available. The input levels are not necessarily an indication of risk or liquidity associated with investing in those securities.
The Funds recognize transfers between level 1 and level 2 at the end of the reporting cycle. At March 31, 2017, there were no transfers between level 1 and level 2 securities.
The following is a summary of the inputs used as of March 31, 2017 in valuing each Fund's assets and liabilities. Except for the industries or investment types separately stated below, the total amounts for common stocks, fixed-income and short-term investments in the table below are presented by industry or investment type in each Fund's Schedule of Investments. Information on forward foreign currency contracts is presented by contract in the notes following the below summary:
(in thousands) | | Quoted Prices
in Active
Markets for
Identical
Assets
(Level 1) | | Other
Significant
Observable
Inputs
(Level 2) | | Significant
Unobservable
Inputs
(Level 3) | |
Oakmark | | | | | | | | | | | | | |
Common Stocks | | $ | 16,248,596 | | | $ | 0 | | | $ | 0 | | |
Short Term Investments | | | 0 | | | | 842,504 | | | | 0 | | |
Total | | $ | 16,248,596 | | | $ | 842,504 | | | $ | 0 | | |
Select | | | | | | | | | | | | | |
Common Stocks | | $ | 5,420,822 | | | $ | 0 | | | $ | 0 | | |
Short Term Investments | | | 0 | | | | 364,632 | | | | 0 | | |
Total | | $ | 5,420,822 | | | $ | 364,632 | | | $ | 0 | | |
Equity and Income | | | | | | | | | | | | | |
Common Stocks | | $ | 9,973,023 | | | $ | 0 | | | $ | 0 | | |
Government and Agency Securities | | | 0 | | | | 1,482,140 | | | | 0 | | |
Corporate Bonds | | | 0 | | | | 2,229,686 | | | | 0 | | |
Convertible Bonds | | | 0 | | | | 15,446 | | | | 0 | | |
Short Term Investments | | | 0 | | | | 2,700,935 | | | | 0 | | |
Total | | $ | 9,973,023 | | | $ | 6,428,207 | | | $ | 0 | | |
Global | | | | | | | | | | | | | |
Common Stocks | | $ | 2,501,984 | | | $ | 0 | | | $ | 0 | | |
Short Term Investments | | | 0 | | | | 63,008 | | | | 0 | | |
Forward Foreign Currency Contracts - Liabilities | | | 0 | | | | (599 | ) | | | 0 | | |
Total | | $ | 2,501,984 | | | $ | 62,409 | | | $ | 0 | | |
Global Select | | | | | | | | | | | | | |
Common Stocks | | $ | 2,244,189 | | | $ | 0 | | | $ | 0 | | |
Short Term Investments | | | 0 | | | | 138,485 | | | | 0 | | |
Forward Foreign Currency Contracts - Liabilities | | | 0 | | | | (392 | ) | | | 0 | | |
Total | | $ | 2,244,189 | | | $ | 138,093 | | | $ | 0 | | |
50 OAKMARK FUNDS
Oakmark Funds
Notes to Financial Statements (continued)
(in thousands) | | Quoted Prices
in Active
Markets for
Identical
Assets
(Level 1) | | Other
Significant
Observable
Inputs
(Level 2) | | Significant
Unobservable
Inputs
(Level 3) | |
International | | | | | | | | | | | | | |
Common Stocks | | $ | 28,344,790 | | | $ | 0 | | | $ | 0 | | |
Short Term Investments | | | 0 | | | | 1,277,682 | | | | 0 | | |
Forward Foreign Currency Contracts - Liabilities | | | 0 | | | | (6,908 | ) | | | 0 | | |
Total | | $ | 28,344,788 | | | $ | 1,270,774 | | | $ | 0 | | |
Int'l Small Cap | | | | | | | | | | | | | |
Common Stocks | | $ | 2,483,309 | | | $ | 0 | | | $ | 0 | | |
Short Term Investments | | | 0 | | | | 125,677 | | | | 0 | | |
Forward Foreign Currency Contracts - Liabilities | | | 0 | | | | (974 | ) | | | 0 | | |
Total | | $ | 2,483,309 | | | $ | 124,703 | | | $ | 0 | | |
Offsetting assets and liabilities
Accounting Standards Codification 210 requires entities to disclose gross and net information about instruments and transactions eligible for offset on the Statement of Assets and Liabilities, and disclose instruments and transactions subject to master netting or similar agreements. This disclosure is limited to derivative instruments, repurchase and reverse repurchase agreements, and securities borrowing and lending transactions.
At March 31, 2017 certain Funds held open forward foreign currency contracts that were subject to a foreign exchange settlement and netting agreement with the same counterparty. The agreement includes provisions for general obligations, representations and certain events of default or termination. The agreement includes provisions for netting arrangements that may reduce credit risk and counterparty risk associated with relevant transactions, in the event a counterparty fails to meet its obligations. The net recognized assets or liabilities related to open forward foreign currency contracts are presented in the Statements of Assets and Liabilities. The gross recognized assets (appreciation) and liabilities (depreciation) by contract are presented in the table included in the Forward foreign currency contracts section of Note 1 to Financial Statements.
At March 31, 2017 each Fund held investments in repurchase agreements. The gross value of these investments and the value of the related collateral are presented in each Fund's Schedule of Investments. The value of the related collateral for each Fund exceeded the value of the repurchase agreements held at period end.
The value of the securities on loan and the value of the related collateral as of period end, if any, are included in the Securities lending section of Note 1 to Financial Statements.
Foreign currency translations
Certain Funds invest in foreign securities, which may involve a number of risk factors and special considerations not present with investments in securities of U.S. corporations. Values of investments and other assets and liabilities denominated in foreign currencies are translated into U.S. dollars at current exchange rates obtained by a recognized bank, dealer, or independent pricing service on the day of valuation. Purchases and sales of investments and dividend and interest income are converted at the prevailing rate of exchange on the respective dates of such transactions.
The Funds do not isolate that portion of the results of operations resulting from changes in foreign exchange rates on investments from the fluctuations arising from changes in market prices of securities held. Such fluctuations are included in net realized gain (loss) on investments and net change in unrealized appreciation (depreciation) on investments in the Statements of Operations. Net realized gains and losses on foreign currency transactions arising from the sale of foreign currencies, currency gains or losses realized between the trade and settlement dates on securities transactions and the difference between the amounts of dividends, interest and tax reclaims recorded and the U.S. dollar equivalent of the amounts actually received or paid are included in net realized gain (loss) on foreign currency transactions in the Statements of Operations. Unrealized gains and losses arising from changes in the fair value of assets and liabilities, other than investments in securities, resulting from changes in exchange rates are included in net change in unrealized appreciation (depreciation) on foreign currency translation in the Statements of Operations.
Forward foreign currency contracts
Forward foreign currency contracts are agreements to exchange one currency for another at a future date and at a specified price. Each of the Funds' transactions in forward foreign currency contracts were used for transaction or portfolio hedging. The contractual amounts of forward foreign currency contracts do not necessarily represent the amounts potentially subject to risk. The measurement of the risks associated with these instruments is meaningful only when all related and offsetting transactions are considered and could exceed the net unrealized value shown in the tables below. Risks arise from the possible inability of counterparties
Oakmark.com 51
Oakmark Funds
Notes to Financial Statements (continued)
to meet the terms of their contracts and from movements in currency values. Forward foreign currency contracts are valued at the current day's interpolated foreign exchange rates. Unrealized gain or loss on the contracts as measured by the difference between the forward foreign exchange rates at the dates of entry into the contracts and the forward rates at the end of the period is included in the Statements of Assets and Liabilities. Realized gains and losses and the net change in unrealized appreciation (depreciation) on forward foreign currency contracts for the period are included in the Statements of Operations.
At March 31, 2017 Global, Global Select, International, and Int'l Small Cap held non-collateralized, forward foreign currency contracts, which are considered derivative instruments, each of whose counterparty is State Street Bank and Trust Company ("State Street"), as follows (in thousands):
Global
| | | Local
Contract
Amount | | Settlement
Date | | Valuation at
3/31/17 | | Unrealized
Appreciation/
(Depreciation) | |
Foreign Currency Sold: | | | | | | | | | | | | | |
Australian Dollar | | | 10,005 | | | 06/21/17 | | $ | 7,632 | | | $ | (318 | ) | |
Swiss Franc | | | 32,712 | | | 09/20/17 | | | 33,036 | | | | (281 | ) | |
| | | | | | | $ | 40,668 | | | $ | (599 | ) | |
During the period ended March 31, 2017 the notional value of forward foreign currency contracts opened for Global were $40,069 and the notional value of settled contracts was $91,204 (in thousands).
Global Select
| | | Local
Contract
Amount | | Settlement
Date | | Valuation at
3/31/17 | | Unrealized
Appreciation/
(Depreciation) | |
Foreign Currency Sold: | | | | | | | | | |
Swiss Franc | | | 45,595 | | | 09/20/17 | | $ | 46,047 | | | $ | (392 | ) | |
| | | | | | | $ | 46,047 | | | $ | (392 | ) | |
During the period ended March 31, 2017 the notional value of forward foreign currency contracts opened for Global Select were $45,655 and the notional value of settled contracts was $85,365 (in thousands).
International
| | | Local
Contract
Amount | | Settlement
Date | | Valuation at
3/31/17 | | Unrealized
Appreciation/
(Depreciation) | |
Foreign Currency Sold: | | | | | | | | | | | | | |
Australian Dollar | | | 128,544 | | | 06/21/17 | | $ | 98,057 | | | $ | (4,081 | ) | |
Swiss Franc | | | 328,863 | | | 09/20/17 | | | 332,122 | | | | (2,827 | ) | |
| | | | | | | $ | 430,179 | | | $ | (6,908 | ) | |
During the period ended March 31, 2017 the notional value of forward foreign currency contracts opened for International were $423,271 and the notional value of settled contracts was $826,275 (in thousands).
Int'l Small Cap
| | | Local
Contract
Amount | | Settlement
Date | | Valuation at
3/31/17 | | Unrealized
Appreciation/
(Depreciation) | |
Foreign Currency Sold: | | | | | | | | | | | | | |
Australian Dollar | | | 23,836 | | | 06/21/17 | | $ | 18,183 | | | $ | (757 | ) | |
Swiss Franc | | | 25,316 | | | 09/20/17 | | | 25,567 | | | | (217 | ) | |
| | | | | | | $ | 43,750 | | | $ | (974 | ) | |
During the period ended March 31, 2017 the notional value of forward foreign currency contracts opened for Int'l Small Cap were $42,775 and the notional value of settled contracts was $93,650 (in thousands).
52 OAKMARK FUNDS
Oakmark Funds
Notes to Financial Statements (continued)
Security transactions and investment income
Security transactions are accounted for on the trade date (date the order to buy or sell is executed), and dividend income is recorded on the ex-dividend date, except that certain dividends from foreign securities are recorded as soon as the information becomes available after the ex-dividend date. Interest income and expenses are recorded on an accrual basis. Discount is accreted and premium is amortized on long-term fixed income securities using the yield-to-maturity method. Withholding taxes and tax reclaims on foreign dividends have been provided for in accordance with the Funds' understanding of the applicable country's tax rules and rates. Net realized gains and losses on investments are determined by the specific identification method.
Short sales
Each Fund may sell a security it does not own in anticipation of a decline in the fair value of that security. When a Fund sells a security short, it must borrow the security sold short and deliver it to the broker-dealer through which it made the short sale. A gain, limited to the price at which the Fund sold the security short, or loss, unlimited in size, will be recognized upon the termination of the short sale. Each Fund may sell shares of when-issued securities. Typically, a Fund sells when-issued securities when a company announces a spin-off or re-organization, and the post-spin-off or post-re-organization shares begin trading on a when-issued basis prior to the effective date of the corporate action. A sale of a when-issued security is treated as a short sale for accounting purposes. After the effective date, when shares of the new company are received, any shares sold on a when-issued basis will be delivered to the counterparty. At March 31, 2017 none of the Funds had short sales.
When-issued or delayed-delivery securities
Each Fund may purchase securities on a when-issued or delayed-delivery basis. Although the payment and interest terms of these securities are established at the time a Fund enters into the commitment, the securities may be delivered and paid for a month or more after the date of purchase, when their value may have changed. A Fund makes such commitments only with the intention of actually acquiring the securities, but may sell the securities before the settlement date if the Adviser deems it advisable for investment reasons. At March 31, 2017 none of the Funds held when-issued securities.
Accounting for options
When a Fund writes an option, the premium received by the Fund is recorded as a liability and is subsequently adjusted to the current fair value of the option written. Premiums received from writing options that expire are recorded by the Fund on the expiration date as realized gains from option transactions. The difference between the premium and the amount paid on effecting a closing purchase transaction, including brokerage commissions, is also treated as a realized gain, or if the premium is less than the amount paid for the closing purchase transaction, as a realized loss. If a call option is exercised, the premium is added to the proceeds from the sale of the underlying security or currency in determining whether the Fund has realized a gain or a loss. If a put option is exercised, the premium reduces the cost basis of the security or currency purchased by the Fund. In writing an option, the Fund bears the market risk of an unfavorable change in the price of the security or currency underlying the written option. As the writer of a covered call option on a security, a Fund foregoes, during the option's life, the opportunity to profit from increases in the market value of the security covering the call option above the sum of the premium and the exercise price of the call. Exercise of an option written by the Fund could result in the Fund selling or buying a security or currency at a price different from the current fair value. Options written by the Fund do not give rise to counterparty credit risk, as they obligate the Fund, not its counterparties, to perform.
When a Fund purchases an option, the premium paid by the Fund is recorded as an asset and is subsequently adjusted to the current fair value of the option purchased. Purchasing call options tends to increase the Fund's exposure to the underlying instrument. Purchasing put options tends to decrease the Fund's exposure to the underlying instrument. Premiums paid for purchasing options that expire are treated as realized losses. Premiums paid for purchasing options that are exercised or closed are added to the amounts paid or offset against the proceeds on the underlying security to determine the realized gain or loss. The risks associated with purchasing put and call options are potential loss of the premium paid and, in the instances of OTC derivatives, the failure of the counterparty to honor its obligation under the contract.
Oakmark used options written for tax management purposes during the period ended March 31, 2017, as follows (in thousands).
Oakmark
| | | Number of
Contracts | | Premiums | |
Options outstanding at September 30, 2016 | | | 0 | | | $ | 0 | | |
Options written | | | 7 | | | | 1,035 | | |
Options exercised | | | (7 | ) | | | (1,035 | ) | |
Options outstanding at March 31, 2017 | | | 0 | | | $ | 0 | | |
Credit facility
The Trust has a $200 million committed unsecured line of credit and a $300 million uncommitted unsecured discretionary demand line of credit (the "Facility") with State Street. Borrowings under the facility bear interest at 1.25% above the greater of the Federal Funds Effective Rate or LIBOR, as defined in the credit agreement. To maintain the Facility, an annualized commitment fee of 0.20% on the unused committed portion is charged to the Trust. Fees and interest expense, if any, related to the Facility are included in other expenses in the Statements of Operations. There were no borrowings under the Facility during the period ended March 31, 2017.
Oakmark.com 53
Oakmark Funds
Notes to Financial Statements (continued)
Expense offset arrangement
State Street serves as custodian of the Funds. State Street's fee may be reduced by credits that are an earnings allowance calculated on the average daily cash balances each Fund maintains with State Street. Credit balances used to reduce the Funds' custodian fees, if any, are reported as a reduction of total expenses in the Statements of Operations. During the period ended March 31, 2017 none of the Funds received an expense offset credit.
Repurchase agreements
Each Fund may invest in repurchase agreements, which are short-term investments whereby the Fund acquires ownership of a debt security and the seller agrees to repurchase the security at a future date at a specified price.
The Funds' custodian receives delivery of the underlying securities collateralizing repurchase agreements. It is the Funds' policy that the value of the collateral be at least equal to 102% of the repurchase price, including interest. The Adviser is responsible for determining that the value of the collateral is at all times at least equal to 102% of the repurchase price, including interest. Repurchase agreements could involve certain risks in the event of default or insolvency of the counterparty, including possible delays or restrictions upon a Fund's ability to dispose of the underlying securities. At March 31, 2017 all of the Funds held repurchase agreements.
Security lending
Each Fund, may lend its portfolio securities to broker-dealers and banks. Any such loan must be continuously secured by collateral in cash, cash equivalents or U.S. Treasury or agency securities maintained on a current basis in an amount at least equal to the fair value of the securities loaned by a Fund. The Fund would continue to receive the equivalent of the interest or dividends paid by the issuer on the securities loaned, and would also receive an additional return that may be in the form of a fixed fee or a percentage of the earnings on the collateral. The Fund has the right to call the loan and attempt to obtain the securities loaned at any time on notice of not more than five business days. In the event of bankruptcy or other default of the borrower, the Fund could experience delays in liquidating the loan collateral or recovering the loaned securities and incur expenses related to enforcing its rights. There could also be a decline in the value of the collateral or in the fair value of the securities loaned while the Fund seeks to enforce its rights thereto, and the Fund could experience subnormal levels of income or lack of access to income during that period. A Fund may not exercise proxy voting rights for a security that is on loan if it is unable to recall the security prior to the record date. The Trust, on behalf of the Funds, has entered into an agreement with State Street to serve as its agent for the purpose of lending securities and maintaining the collateral account. Security lending income, if any, net of any fees retained by the securities lending agent, is included in the Statement of Operations.
At March 31, 2017 none of the Funds had securities on loan.
Interfund lending
Pursuant to an exemptive order issued by the SEC, the Funds may participate in an interfund lending program. This program provides an alternative credit facility that allows the Funds to lend money to, and borrow money from, each other for temporary purposes (an "Interfund Loan"). All Interfund Loans are subject to conditions pursuant to the SEC exemptive order designed to ensure fair and equitable treatment of participating Funds. Any Interfund Loan would consist only of uninvested cash reserves that the lending Fund otherwise would invest in short-term repurchase agreements or other short-term instruments. There were no Interfund Loans during the period ended March 31, 2017.
Restricted securities
Each Fund may invest in restricted securities, which generally are considered illiquid, but such illiquid securities may not comprise more than 15% of the value of a Fund's net assets at the time of investment. The following investments, the sales of which are subject to restrictions on resale under federal securities laws, have been valued in good faith according to the securities valuation procedures established by the Board of Trustees (as stated in the Security valuation section) since their acquisition dates.
At March 31, 2017 Equity and Income and International held the following restricted securities:
Equity and Income
Par Value
(000) | | Security
Name | | Acquisition
Date | | Cost
(000) | | Value
(000) | | Percentage of
Net Assets | |
$ | 29,500 | | | 1011778 BC ULC / New Red Finance, Inc. | | 09/24/14 | | $ | 29,500 | | | $ | 30,606 | | | | 0.19 | % | |
| | 20,525 | | | Activision Blizzard, Inc. | | 09/12/13 - 11/13/15 | | | 21,795 | | | | 22,218 | | | | 0.14 | % | |
| | 186,500 | | | Anthem, Inc. | | 02/14/17 - 03/17/17 | | | 186,377 | | | | 186,377 | | | | 1.14 | % | |
| | 132,490 | | | BMW US Capital LLC | | 03/06/17 - 03/31/17 | | | 132,465 | | | | 132,465 | | | | 0.81 | % | |
| | 34,840 | | | Broadcom Corp. / Broadcom Cayman
Finance, Ltd. | | 01/11/17 | | | 34,750 | | | | 34,893 | | | | 0.21 | % | |
| | 250 | | | CCO Holdings LLC / CCO Holdings Capital Corp. | | 03/09/17 | | | 248 | | | | 251 | | | | 0.00 | % | |
| | 14,915 | | | Chesapeake Energy Corp. | | 09/30/16 | | | 14,445 | | | | 15,446 | | | | 0.09 | % | |
| | 10,945 | | | CommScope Technologies LLC | | 03/13/17 | | | 10,785 | | | | 10,928 | | | | 0.07 | % | |
54 OAKMARK FUNDS
Oakmark Funds
Notes to Financial Statements (continued)
Par Value
(000) | | Security
Name | | Acquisition
Date | | Cost
(000) | | Value
(000) | | Percentage of
Net Assets | |
$ | 37,000 | | | Credit Suisse Group AG | | 12/04/13 - 06/11/14 | | $ | 37,000 | | | $ | 39,619 | | | | 0.24 | % | |
| | 17,665 | | | Diamond 1 Finance Corp. / Diamond 2
Finance Corp. | | 05/17/16 | | | 17,658 | | | | 18,963 | | | | 0.12 | % | |
| | 4,910 | | | EMI Music Publishing Group North America
Holdings, Inc. | | 05/26/16 | | | 4,910 | | | | 5,352 | | | | 0.03 | % | |
| | 352,644 | | | General Mills, Inc. | | 03/02/17 - 03/28/17 | | | 352,505 | | | | 352,505 | | | | 2.15 | % | |
| | 14,930 | | | Glencore Finance Canada, Ltd. | | 03/24/17 | | | 14,994 | | | | 14,990 | | | | 0.09 | % | |
| | 100 | | | IHS Markit, Ltd. | | 02/06/17 | | | 100 | | | | 103 | | | | 0.00 | % | |
| | 44,200 | | | International Game Technology PLC | | 02/09/15 | | | 44,211 | | | | 46,914 | | | | 0.29 | % | |
| | 2,000 | | | KFC Holding Co. / Pizza Hut Holdings
LLC / Taco Bell of America LLC | | 06/02/16 | | | 2,000 | | | | 2,039 | | | | 0.01 | % | |
| | 105,350 | | | Kellogg Co. | | 03/17/17 - 03/23/17 | | | 105,339 | | | | 105,339 | | | | 0.64 | % | |
| | 294,750 | | | Kraft Food Group, Inc. | | 02/28/17 - 03/28/17 | | | 294,620 | | | | 294,620 | | | | 1.80 | % | |
| | 6,260 | | | Kraft Heinz Foods Co. | | 02/17/16 - 02/23/16 | | | 6,690 | | | | 6,692 | | | | 0.04 | % | |
| | 16,935 | | | Live Nation Entertainment, Inc. | | 08/15/12 - 10/26/16 | | | 16,935 | | | | 17,015 | | | | 0.10 | % | |
| | 18,780 | | | MSCI, Inc. | | 08/10/15 - 09/01/16 | | | 18,915 | | | | 19,543 | | | | 0.12 | % | |
| | 447,000 | | | MetLife Short Term Funding LLC | | 02/15/17 - 03/31/17 | | | 446,628 | | | | 446,627 | | | | 2.73 | % | |
| | 16,349 | | | Mondelez International Holdings
Netherlands BV | | 01/03/17 - 01/25/17 | | | 15,848 | | | | 15,908 | | | | 0.10 | % | |
| | 1,000 | | | Peabody Securities Finance Corp. | | 02/09/17 | | | 1,000 | | | | 994 | | | | 0.01 | % | |
| | 6,970 | | | Penn National Gaming, Inc. | | 01/17/17 | | | 6,970 | | | | 6,918 | | | | 0.04 | % | |
| | 4,920 | | | Penske Truck Leasing Co., LP / PTL Finance Corp. | | 06/16/15 | | | 4,931 | | | | 4,931 | | | | 0.03 | % | |
| | 3,500 | | | Post Holdings, Inc. | | 03/12/14 - 02/09/17 | | | 3,500 | | | | 3,467 | | | | 0.02 | % | |
| | 26,880 | | | Principal Life Global Funding II | | 11/14/16 - 01/03/17 | | | 26,834 | | | | 26,753 | | | | 0.16 | % | |
| | 7,800 | | | Quintiles IMS, Inc. | | 09/14/16 | | | 7,807 | | | | 7,829 | | | | 0.05 | % | |
| | 11,077 | | | S&P Global, Inc. | | 09/19/16 - 01/19/17 | | | 11,006 | | | | 10,532 | | | | 0.06 | % | |
| | 130,235 | | | Schlumberger Holdings Corp. | | 12/10/15 - 03/01/17 | | | 130,087 | | | | 130,616 | | | | 0.80 | % | |
| | 8,875 | | | Scientific Games International, Inc. | | 11/14/14 | | | 8,992 | | | | 9,474 | | | | 0.06 | % | |
| | 8,895 | | | Sirius XM Radio, Inc. | | 03/04/15 - 03/26/15 | | | 9,322 | | | | 9,195 | | | | 0.06 | % | |
| | 9,970 | | | Six Flags Entertainment Corp. | | 12/11/12 | | | 9,986 | | | | 10,251 | | | | 0.06 | % | |
| | 12,390 | | | Smithfield Foods, Inc. | | 01/25/17 - 02/14/17 | | | 12,391 | | | | 12,391 | | | | 0.08 | % | |
| | 1,000 | | | Symantec Corp. | | 02/07/17 | | | 1,000 | | | | 1,025 | | | | 0.01 | % | |
| | 11,945 | | | The Howard Hughes Corp. | | 03/03/17 | | | 11,945 | | | | 11,825 | | | | 0.07 | % | |
| | 4,420 | | | The Manitowoc Co., Inc. | | 02/08/16 | | | 4,412 | | | | 5,006 | | | | 0.03 | % | |
| | 57,474 | | | Ultra Petroleum Corp. | | 04/11/14 - 10/28/14 | | | 57,994 | | | | 40,428 | | | | 0.25 | % | |
| | 42,075 | | | Universal Health Services, Inc. | | 01/14/16 - 11/09/16 | | | 42,317 | | | | 43,127 | | | | 0.26 | % | |
| | 6,870 | | | Wolverine World Wide, Inc. | | 09/16/16 - 09/17/16 | | | 6,870 | | | | 6,458 | | | | 0.04 | % | |
| | | | | | | | | $ | 2,160,633 | | | $ | 13.20 | % | |
International
Par Value
(000) | | Security
Name | | Acquisition
Date | | Cost
(000) | | Value
(000) | | Percentage of
Net Assets | |
$ | 50,000 | | | BMW US Capital LLC | | 02/22/17 | | $ | 49,976 | | | $ | 49,976 | | | | 0.17 | % | |
| | 50,000 | | | John Deere Capital Co. | | 03/23/17 | | | 49,975 | | | | 49,975 | | | | 0.17 | % | |
| | | | | | | | | $ | 99,951 | | | | 0.34 | % | |
Federal income taxes
It is each Fund's policy to comply with the requirements of the Internal Revenue Code applicable to regulated investment companies and to distribute substantially all of its net taxable income, including any net realized gains on investments, to its shareholders. Therefore, no federal income tax provision is required. There is no material liability for unrecognized tax benefits in the accompanying financial statements. Generally, each of the tax years in the four-year period ended September 30, 2016 remains subject to examination by taxing authorities.
Oakmark.com 55
Oakmark Funds
Notes to Financial Statements (continued)
2. TRANSACTIONS WITH AFFILIATES
Each Fund has an investment advisory agreement with the Adviser. For management services and facilities furnished, the Adviser receives from each Fund a monthly fee based on that Fund's net assets at the end of the preceding month. Annual fee rates are as follows:
Fund | | Advisory Fees | |
Oakmark
| | 1.00% up to $2 billion;
0.90% on the next $1 billion;
0.80% on the next $2 billion;
0.75% on the next $2.5 billion;
0.675% on the next $2.5 billion;
0.625% on the next $2.5 billion;
0.620% on the next $12.5 billion;
0.615% on the next $10.0 billion; and
0.610% over $35.0 billion | |
Select
| | 1.00% up to $1 billion;
0.95% on the next $500 million;
0.90% on the next $500 million;
0.85% on the next $500 million;
0.80% on the next $2.5 billion;
0.75% on the next $5 billion; and
0.725% over $10 billion | |
Equity and Income
| | 0.75% up to $5 billion;
0.70% on the next $2.5 billion;
0.675% on the next $2.5 billion;
0.65% on the next $2.5 billion;
0.60% on the next $3.5 billion;
0.585% on the next $5 billion;
0.5775% on the next $7 billion; and
0.5725% over $28 billion | |
Fund | | Advisory Fees | |
Global
| | 1.00% up to $2 billion;
0.95% on the next $2 billion;
0.90% on the next $4 billion; and
0.875% over $8 billion | |
Global Select
| | 1.00% up to $2 billion;
0.95% on the next $1 billion;
0.875% on the next $4 billion; and
0.85% over $7 billion | |
International
| | 1.00% up to $2 billion;
0.95% on the next $1 billion;
0.85% on the next $2 billion;
0.825% on the next $2.5 billion;
0.815% on the next $3.5 billion;
0.805% on the next $5.5 billion;
0.80% on the next $6.5 billion;
0.795% on the next $7 billion;
0.790% on the next $5 billion; and
0.785% over $35 billion | |
Int'l Small Cap
| | 1.25% up to $500 million;
1.10% on the next $1 billion;
1.05% on the next $2 billion;
1.025% on the next $1.5 billion; and
1.00% over $5 billion | |
Effective November 1, 2016 and continuing through January 28, 2018, the Adviser has contractually agreed to waive the advisory fee otherwise payable to it by the following percentages with respect to each Fund: 0.04% for Oakmark; 0.07% for Select; 0.10% for Equity and Income; 0.06% for Global; 0.07% for Global Select; and 0.05% for International. When determining whether a Fund's total expenses exceed the additional contractual expense cap described below, a Fund's net advisory fee, reflecting application of the advisory fee waiver, will be used to calculate a Fund's total expenses. The Adviser is not entitled to collect on or make a claim for waived fees that are the subject of this undertaking at any time in the future. This arrangement may only be modified or amended with approval from a Fund and the Adviser.
The Adviser is contractually obligated through January 28, 2018 to reimburse each Fund Class to the extent, but only to the extent, that its annualized expenses (excluding taxes, interest, all commissions and other normal charges incident to the purchase and sale of portfolio securities, and extraordinary charges such as litigation costs, but including fees paid to the Adviser) exceed the percent set forth below of average daily net assets of each Fund Class.
Fund | | Investor
Class | | Advisor
Class | | Institutional
Class | | Service
Class | |
Oakmark | | | 1.50 | % | | | 1.40 | % | | | 1.30 | % | | | 1.75 | % | |
Select | | | 1.50 | | | | 1.40 | | | | 1.30 | | | | 1.75 | | |
Equity and Income | | | 1.00 | | | | 0.90 | | | | 0.80 | | | | 1.25 | | |
Global | | | 1.75 | | | | 1.65 | | | | 1.55 | | | | 2.00 | | |
Global Select | | | 1.75 | | | | 1.65 | | | | 1.55 | | | | 2.00 | | |
International | | | 2.00 | | | | 1.90 | | | | 1.80 | | | | 2.25 | | |
Int'l Small Cap | | | 2.00 | | | | 1.90 | | | | 1.80 | | | | 2.25 | | |
The Adviser is entitled to recoup from any Fund Class, in any fiscal year through September 30, 2020, amounts reimbursed to that Fund Class, except to the extent that the Fund Class already has paid such recoupment to the Adviser or such recoupment would cause the annual ordinary operating expenses of a Fund Class for that fiscal year to exceed the applicable limit stated above. As of March 31, 2017 there were no amounts subject to recoupment.
The Adviser and the Funds have entered into agreements with financial intermediaries to provide recordkeeping, processing, shareholder communications and other services to customers of the intermediaries and have agreed to compensate the intermediaries for providing those services. Certain of those services would be provided by the Funds if the shares of those customers were
56 OAKMARK FUNDS
Oakmark Funds
Notes to Financial Statements (continued)
registered directly with the Funds' transfer agent. Accordingly, the Funds pay a portion of the intermediary fees pursuant to an agreement with the Adviser and the Adviser pays the remainder of the fees. The fees incurred by the Funds are reflected as other shareholder servicing fees in the Statements of Operations.
The Independent Trustees of the Trust may participate in the Trust's Deferred Compensation Plan for Independent Trustees. Participants in the plan may elect to defer all or a portion of their compensation. Amounts deferred are retained by the Trust and represent an unfunded obligation of the Trust. The value of a participant's deferral account is determined by reference to the change in value of Investor Class shares of one or more of the Funds or a money market fund as specified by the participant. Benefits would be payable after a stated number of years or retirement from the Board of Trustees. The accrued obligations of the Funds under the plan are reflected as deferred Trustee compensation in the Statements of Assets and Liabilities. The change in the accrued obligations for the period is included in Trustees fees in the Statements of Operations. The Trust pays the compensation of the Trustees other than those affiliated with the Adviser and all expenses incurred in connection with their services to the Trust. The Trust does not provide any pension or retirement benefits to its Trustees.
The Funds reimburse the Adviser for a portion of the compensation paid to the Funds' Chief Compliance Officer ("CCO"). The CCO expenses incurred by the Funds are included in other expenses in the Statements of Operations.
3. FEDERAL INCOME TAXES
At March 31, 2017 the cost of investments for federal income tax purposes and related composition of unrealized gains and losses for each Fund were as follows (in thousands):
Fund | | Cost of Investments
for Federal Income
Tax Purposes | | Gross Unrealized
Appreciation | | Gross Unrealized
(Depreciation) | | Net Unrealized
Appreciation
(Depreciation) | |
Oakmark | | $ | 11,091,166 | | | $ | 6,090,386 | | | $ | (90,452 | ) | | $ | 5,999,934 | | |
Select | | | 3,862,145 | | | | 1,923,309 | | | | 0 | | | | 1,923,309 | | |
Equity and Income | | | 12,013,150 | | | | 4,420,018 | | | | (31,938 | ) | | | 4,388,080 | | |
Global | | | 1,991,714 | | | | 603,982 | | | | (30,704 | ) | | | 573,278 | | |
Global Select | | | 2,073,092 | | | | 359,238 | | | | (49,656 | ) | | | 309,582 | | |
International | | | 26,499,105 | | | | 4,008,061 | | | | (884,694 | ) | | | 3,123,367 | | |
Int'l Small Cap | | | 2,573,492 | | | | 283,264 | | | | (247,770 | ) | | | 35,494 | | |
At March 31, 2017 Global Select had used capital loss deferrals in the current year of $2,969 (in thousands).
At March 31, 2017 the components of distributable earnings on a tax basis (excluding unrealized appreciation (depreciation)) were as follows (in thousands):
| | | Undistributed
Ordinary Income | | Undistributed Long-
Term Gain | | Total Distributable
Earnings | |
Oakmark | | $ | 57,979 | | | $ | 460,869 | | | $ | 518,848 | | |
Select | | | 600 | | | | 231,546 | | | | 232,146 | | |
Equity and Income | | | 11,025 | | | | 700,546 | | | | 711,571 | | |
Global | | | 5,124 | | | | 41,507 | | | | 46,631 | | |
Global Select | | | 5,177 | | | | 101,796 | | | | 106,973 | | |
International | | | 105,329 | | | | 0 | | | | 105,329 | | |
Int'l Small Cap | | | 7,171 | | | | 8,241 | | | | 15,412 | | |
During the six-month period ended March 31, 2017 and the year ended September 30, 2016 the tax character of distributions paid was as follows (in thousands):
| | Period Ended
March 31, 2017 | | Year Ended
September 30, 2016 | |
Fund | | Distributions Paid
from Ordinary
Income | | Distributions Paid
from Long-Term
Capital Gain | | Distributions Paid
from Ordinary
Income | | Distributions Paid
from Long-Term
Capital Gain | |
Oakmark | | $ | 165,908 | | | $ | 238,085 | | | $ | 160,369 | | | $ | 80,526 | | |
Select | | | 52,606 | | | | 201,118 | | | | 17,524 | | | | 0 | | |
Equity and Income | | | 240,056 | | | | 411,829 | | | | 193,828 | | | | 894,987 | | |
Global | | | 23,006 | | | | 3,374 | | | | 33,988 | | | | 51,832 | | |
Global Select | | | 21,509 | | | | 0 | | | | 17,056 | | | | 100,960 | | |
International | | | 367,268 | | | | 0 | | | | 595,770 | | | | 703,537 | | |
Int'l Small Cap | | | 56,239 | | | | 13,940 | | | | 68,573 | | | | 67,877 | | |
Oakmark.com 57
Oakmark Funds
Notes to Financial Statements (continued)
On March 31, 2017 the Funds had temporary book/tax differences in undistributed earnings that were primarily attributable to trustee deferred compensation expenses, passive foreign investment companies, foreign currency contracts and deferrals of capital losses on wash sales. Temporary differences will reverse over time. The Funds have permanent differences in book/tax undistributed earnings primarily attributable to currency gains and losses, equalization debits, passive foreign investment companies, and distribution re-designations. Permanent differences have been recorded in their respective component of the Analysis of Net Assets.
4. INVESTMENT TRANSACTIONS
For the six-month period ended March 31, 2017 transactions in investment securities (excluding short-term and U.S. Government securities) were as follows (in thousands):
| | | Oakmark | | Select | | Equity &
Income | | Global | | Global
Select | | International | | Int'l
Small Cap | |
Purchases | | $ | 1,961,198 | | | $ | 446,668 | | | $ | 1,078,712 | | | $ | 319,750 | | | $ | 541,415 | | | $ | 6,908,206 | | | $ | 414,399 | | |
Proceeds from sales | | | 1,694,789 | | | | 459,925 | | | | 2,250,558 | | | | 478,160 | | | | 514,607 | | | | 5,525,524 | | | | 452,294 | | |
Purchases at cost and proceeds from sales (in thousands) of long-term U.S. Government securities for the period ended March 31, 2017 were $122,953 and $0, respectively, for Equity and Income.
5. INVESTMENTS IN AFFILIATED ISSUERS
Each of the companies listed below was considered to be an affiliate of a Fund because that Fund owned 5% or more of the company's voting securities during all or part of the six-month period ended March 31, 2017. Purchase and sale transactions and dividend and interest income earned during the period on these securities are set forth below (in thousands):
Equity and Income
Affiliates | | Shares
Held | | Purchases
(Cost) | | Sales
(Proceeds) | | Dividend
Income | | Value
September 30,
2016 | | Value
March 31,
2017 | |
Kate Spade & Co. | | | 6,869 | | | $ | 18,130 | | | $ | 0 | | | $ | 0 | | | $ | 98,018 | | | $ | 159,564 | | |
TOTALS | | | | $ | 18,130 | | | $ | 0 | | | $ | 0 | | | $ | 98,018 | | | $ | 159,564 | | |
International
Affiliates | | Shares
Held | | Purchases
(Cost) | | Sales
(Proceeds) | | Dividend
Income | | Value
September 30,
2016 | | Value
March 31,
2017 | |
Bureau Veritas SA | | | 24,739 | | | $ | 152,958 | | | $ | 0 | | | $ | 0 | | | $ | 362,020 | | | $ | 521,891 | | |
CNH Industrial N.V. | | | 94,700 | | | | 0 | | | | 3,676 | | | | 0 | | | | 681,094 | | | | 913,273 | | |
EXOR N.V. | | | 12,780 | | | | 2 | | | | 58,583 | | | | 0 | | | | 569,299 | | | | 660,980 | | |
G4S PLC | | | 95,612 | | | | 0 | | | | 3,627 | | | | 0 | | | | 285,936 | | | | 364,528 | | |
Meggitt PLC | | | 42,083 | | | | 25,994 | | | | 0 | | | | 5,429 | | | | 218,144 | | | | 234,791 | | |
Orica, Ltd. | | | 30,997 | | | | 7,931 | | | | 85,798 | | | | 7,932 | | | | 424,067 | | | | 416,797 | | |
| SKF AB, Class B | | | 23,339 | | | | 22,878 | | | | 31,857 | | | | 14,410 | | | | 408,295 | | | | 461,801 | | |
TOTALS | | | | $ | 209,763 | | | $ | 183,541 | | | $ | 27,771 | | | $ | 2,948,855 | | | $ | 3,574,061 | | |
Int'l Small Cap
Affiliates | | Shares
Held | | Purchases
(Cost) | | Sales
(Proceeds) | | Dividend
Income | | Value
September 30,
2016 | | Value
March 31,
2017 | |
Atea ASA | | | 6,922 | | | $ | 0 | | | $ | 4,213 | | | $ | 2,905 | | | $ | 74,190 | | | $ | 81,426 | | |
Countrywide PLC | | | 12,249 | | | | 2,353 | | | | 0 | | | | 0 | | | | 31,259 | | | | 23,942 | | |
LSL Property Services PLC | | | 10,413 | | | | 0 | | | | 0 | | | | 820 | | | | 28,817 | | | | 27,268 | | |
Mitie Group PLC | | | 18,037 | | | | 2,018 | | | | 0 | | | | 853 | | | | 42,748 | | | | 50,146 | | |
Wajax Corp. | | | 1,071 | | | | 0 | | | | 1,118 | | | | 403 | | | | 12,508 | | | | 18,442 | | |
TOTALS | | | | $ | 4,371 | | | $ | 5,331 | | | $ | 4,981 | | | $ | 189,522 | | | $ | 201,224 | | |
6. SUBSEQUENT EVENTS
Management has evaluated the possibility of subsequent events existing in the Funds' financial statements. Management has determined that there are no material events that would require adjustment or disclosure in the Funds' financial statements through the date of the publication of this report.
58 OAKMARK FUNDS

This page intentionally left blank.
Oakmark.com 59
Oakmark Funds
Financial Highlights
For a share outstanding throughout each period
| | | | | Income from Investment Operations: | | Less Distributions: | | | | | | Ratios/Supplemental Data: | | | |
| | | Net Asset
Value,
Beginning of
Period | | Net
Investment
Income | | Net Gain
(Loss) on
Investments
(both
realized and
unrealized) | | Total From
Investment
Operations | | Dividends
From Net
Investment
Income | | Distributions
From
Capital
Gains | | Total
Distributions | | Redemption
Fees | | Net Asset
Value,
End of
Period | | Total
Return | | Net Assets,
End of
Period
($million) | | Ratio of
Expenses
to Average
Net Assets | | Ratio of
Net
Expenses
to Average
Net Assets | | Ratio of
Net
Investment
Income to
Average
Net Assets | | Portfolio
Turnover
Rate | |
Oakmark Fund | |
Investor Class(a) | |
10/1/17-3/31/17+ | | $ | 68.70 | | | | 0.32 | | | | 8.31 | | | | 8.63 | | | | (0.77 | ) | | | (1.10 | ) | | | (1.87 | ) | | | 0.00 | | | $ | 75.46 | | | | 12.75 | % | | $ | 15,574.5 | | | | 0.90 | %† | | | 0.87 | %† | | | 0.88 | %† | | | 11 | % | |
9/30/16 | | $ | 60.93 | | | | 0.82 | | | | 7.85 | | | | 8.67 | | | | (0.60 | ) | | | (0.30 | ) | | | (0.90 | ) | | | 0.00 | | | $ | 68.70 | | | | 14.36 | % | | $ | 14,636.0 | | | | 0.89 | % | | | 0.89 | % | | | 1.14 | % | | | 20 | % | |
9/30/15 | | $ | 68.46 | | | | 0.59 | | | | (3.57 | ) | | | (2.98 | ) | | | (0.42 | ) | | | (4.13 | ) | | | (4.55 | ) | | | 0.00 | | | $ | 60.93 | | | | -4.87 | % | | $ | 16,445.0 | | | | 0.85 | %(b) | | | 0.85 | %(b) | | | 0.92 | % | | | 33 | % | |
9/30/14 | | $ | 59.73 | | | | 0.43 | | | | 11.22 | | | | 11.65 | | | | (0.32 | ) | | | (2.60 | ) | | | (2.92 | ) | | | 0.00 | | | $ | 68.46 | | | | 20.01 | % | | $ | 16,489.4 | | | | 0.87 | % | | | 0.87 | % | | | 0.76 | % | | | 25 | % | |
9/30/13 | | $ | 48.97 | | | | 0.42 | (c) | | | 12.22 | | | | 12.64 | | | | (0.38 | ) | | | (1.50 | ) | | | (1.88 | ) | | | 0.00 | | | $ | 59.73 | | | | 26.75 | % | | $ | 10,409.0 | | | | 0.95 | % | | | 0.95 | % | | | 0.78 | % | | | 19 | % | |
9/30/12 | | $ | 37.87 | | | | 0.36 | (c) | | | 11.09 | | | | 11.45 | | | | (0.35 | ) | | | 0.00 | | | | (0.35 | ) | | | 0.00 | (d) | | $ | 48.97 | | | | 30.43 | % | | $ | 6,738.7 | | | | 1.03 | % | | | 1.03 | % | | | 0.81 | % | | | 27 | % | |
Advisor Class(e) | |
11/30/17-3/31/17+ | | $ | 71.35 | | | | 0.12 | | | | 4.05 | | | | 4.17 | | | | 0.00 | | | | 0.00 | | | | 0.00 | | | | 0.00 | | | $ | 75.52 | | | | 5.84 | % | | $ | 1,039.0 | | | | 0.76 | %† | | | 0.71 | %† | | | 0.89 | %† | | | 11 | % | |
Institutional Class(e) | |
11/30/17-3/31/17+ | | $ | 71.35 | | | | 0.13 | | | | 4.03 | | | | 4.16 | | | | 0.00 | | | | 0.00 | | | | 0.00 | | | | 0.00 | | | $ | 75.51 | | | | 5.83 | % | | $ | 320.6 | | | | 0.74 | %† | | | 0.70 | %† | | | 0.99 | %† | | | 11 | % | |
Service Class(f) | |
10/1/17-3/31/17+ | | $ | 68.34 | | | | 0.20 | (c) | | | 8.28 | | | | 8.48 | | | | (0.51 | ) | | | (1.10 | ) | | | (1.61 | ) | | | 0.00 | | | $ | 75.21 | | | | 12.57 | % | | $ | 160.9 | | | | 1.22 | %† | | | 1.18 | %† | | | 0.57 | %† | | | 11 | % | |
9/30/16 | | $ | 60.59 | | | | 0.59 | | | | 7.83 | | | | 8.42 | | | | (0.37 | ) | | | (0.30 | ) | | | (0.67 | ) | | | 0.00 | | | $ | 68.34 | | | | 14.00 | % | | $ | 177.2 | | | | 1.21 | % | | | 1.21 | % | | | 0.86 | % | | | 20 | % | |
9/30/15 | | $ | 68.18 | | | | 0.38 | (c) | | | (3.56 | ) | | | (3.18 | ) | | | (0.28 | ) | | | (4.13 | ) | | | (4.41 | ) | | | 0.00 | | | $ | 60.59 | | | | -5.19 | % | | $ | 194.4 | | | | 1.19 | %(b) | | | 1.19 | %(b) | | | 0.57 | % | | | 33 | % | |
9/30/14 | | $ | 59.58 | | | | 0.23 | | | | 11.19 | | | | 11.42 | | | | (0.22 | ) | | | (2.60 | ) | | | (2.82 | ) | | | 0.00 | | | $ | 68.18 | | | | 19.64 | % | | $ | 170.7 | | | | 1.18 | % | | | 1.18 | % | | | 0.45 | % | | | 25 | % | |
9/30/13 | | $ | 48.89 | | | | 0.27 | (c) | | | 12.20 | | | | 12.47 | | | | (0.28 | ) | | | (1.50 | ) | | | (1.78 | ) | | | 0.00 | | | $ | 59.58 | | | | 26.41 | % | | $ | 93.8 | | | | 1.23 | % | | | 1.23 | % | | | 0.49 | % | | | 19 | % | |
9/30/12 | | $ | 37.78 | | | | 0.24 | (c) | | | 11.09 | | | | 11.33 | | | | (0.22 | ) | | | 0.00 | | | | (0.22 | ) | | | 0.00 | (d) | | $ | 48.89 | | | | 30.11 | % | | $ | 36.1 | | | | 1.30 | % | | | 1.30 | % | | | 0.54 | % | | | 27 | % | |
+ | | Unaudited. | |
† | | Data has been annualized. | |
(a) | | Formerly Class I shares. | |
(b) | | Includes interest expense that amounts to less than 0.01%. | |
(c) | | Computed using average shares outstanding throughout the period. | |
(d) | | Amount rounds to less than $0.01 per share. | |
(e) | | Commenced on 11/30/2016. | |
(f) | | Formerly Class II shares. | |
Oakmark Select Fund | |
Investor Class(a) | |
10/1/17-3/31/17+ | | $ | 40.99 | | | | 0.08 | (b) | | | 5.36 | | | | 5.44 | | | | (0.40 | ) | | | (1.70 | ) | | | (2.10 | ) | | | 0.00 | | | $ | 44.33 | | | | 13.61 | % | | $ | 4,774.8 | | | | 1.03 | %† | | | 0.97 | %† | | | 0.35 | %† | | | 9 | % | |
9/30/16 | | $ | 36.79 | | | | 0.39 | | | | 3.93 | | | | 4.32 | | | | (0.12 | ) | | | 0.00 | | | | (0.12 | ) | | | 0.00 | | | $ | 40.99 | | | | 11.76 | % | | $ | 4,962.7 | | | | 0.98 | % | | | 0.98 | % | | | 0.92 | % | | | 38 | % | |
9/30/15 | | $ | 44.71 | | | | 0.08 | (b) | | | (2.60 | ) | | | (2.52 | ) | | | 0.00 | | | | (5.40 | ) | | | (5.40 | ) | | | 0.00 | | | $ | 36.79 | | | | -6.75 | % | | $ | 5,499.3 | | | | 0.95 | % | | | 0.95 | % | | | 0.20 | % | | | 46 | % | |
9/30/14 | | $ | 37.74 | | | | (0.00 | )(c) | | | 9.14 | | | | 9.14 | | | | (0.04 | ) | | | (2.13 | ) | | | (2.17 | ) | | | 0.00 | | | $ | 44.71 | | | | 25.03 | % | | $ | 6,238.8 | | | | 0.95 | % | | | 0.95 | % | | | (0.03 | )% | | | 37 | % | |
9/30/13 | | $ | 32.33 | | | | 0.04 | | | | 8.40 | | | | 8.44 | | | | (0.03 | ) | | | (3.00 | ) | | | (3.03 | ) | | | 0.00 | | | $ | 37.74 | | | | 28.40 | % | | $ | 3,944.6 | | | | 1.01 | % | | | 1.01 | % | | | 0.11 | % | | | 24 | % | |
9/30/12 | | $ | 25.50 | | | | 0.04 | | | | 6.85 | | | | 6.89 | | | | (0.06 | ) | | | 0.00 | | | | (0.06 | ) | | | 0.00 | (c) | | $ | 32.33 | | | | 27.05 | % | | $ | 3,029.5 | | | | 1.05 | % | | | 1.05 | % | | | 0.11 | % | | | 32 | % | |
Advisor Class(d) | |
11/30/17-3/31/17+ | | $ | 41.93 | | | | 0.07 | (b) | | | 2.36 | | | | 2.43 | | | | 0.00 | | | | 0.00 | | | | 0.00 | | | | 0.00 | | | $ | 44.36 | | | | 5.80 | % | | $ | 536.1 | | | | 0.89 | %† | | | 0.82 | %† | | | 0.47 | %† | | | 9 | % | |
Institutional Class(d) | |
11/30/17-3/31/17+ | | $ | 41.93 | | | | 0.07 | (b) | | | 2.36 | | | | 2.43 | | | | 0.00 | | | | 0.00 | | | | 0.00 | | | | 0.00 | | | $ | 44.36 | | | | 5.80 | % | | $ | 449.4 | | | | 0.88 | %† | | | 0.80 | %† | | | 0.51 | %† | | | 9 | % | |
Service Class(e) | |
10/1/17-3/31/17+ | | $ | 40.44 | | | | 0.01 | (b) | | | 5.30 | | | | 5.31 | | | | (0.26 | ) | | | (1.70 | ) | | | (1.96 | ) | | | 0.00 | | | $ | 43.79 | | | | 13.43 | % | | $ | 29.6 | | | | 1.35 | %† | | | 1.29 | %† | | | 0.03 | %† | | | 9 | % | |
9/30/16 | | $ | 36.31 | | | | 0.23 | (b) | | | 3.90 | | | | 4.13 | | | | 0.00 | | | | 0.00 | | | | 0.00 | | | | 0.00 | | | $ | 40.44 | | | | 11.37 | % | | $ | 34.6 | | | | 1.32 | % | | | 1.32 | % | | | 0.62 | % | | | 38 | % | |
9/30/15 | | $ | 44.32 | | | | (0.05 | )(b) | | | (2.56 | ) | | | (2.61 | ) | | | 0.00 | | | | (5.40 | ) | | | (5.40 | ) | | | 0.00 | | | $ | 36.31 | | | | -7.04 | % | | $ | 36.8 | | | | 1.27 | % | | | 1.27 | % | | | (0.12 | )% | | | 46 | % | |
9/30/14 | | $ | 37.50 | | | | (0.18 | ) | | | 9.13 | | | | 8.95 | | | | 0.00 | | | | (2.13 | ) | | | (2.13 | ) | | | 0.00 | | | $ | 44.32 | | | | 24.66 | % | | $ | 24.4 | | | | 1.23 | % | | | 1.23 | % | | | (0.30 | )% | | | 37 | % | |
9/30/13 | | $ | 32.21 | | | | (0.11 | ) | | | 8.40 | | | | 8.29 | | | | 0.00 | | | | (3.00 | ) | | | (3.00 | ) | | | 0.00 | | | $ | 37.50 | | | | 27.99 | % | | $ | 15.0 | | | | 1.33 | % | | | 1.33 | % | | | (0.21 | )% | | | 24 | % | |
9/30/12 | | $ | 25.43 | | | | (0.06 | )(b) | | | 6.84 | | | | 6.78 | | | | 0.00 | | | | 0.00 | | | | 0.00 | | | | 0.00 | (c) | | $ | 32.21 | | | | 26.66 | % | | $ | 11.8 | | | | 1.36 | % | | | 1.36 | % | | | (0.21 | )% | | | 32 | % | |
+ | | Unaudited. | |
† | | Data has been annualized. | |
(a) | | Formerly Class I shares. | |
(b) | | Computed using average shares outstanding throughout the period. | |
(c) | | Amount rounds to less than $0.01 per share. | |
(d) | | Commenced on 11/30/2016. | |
(e) | | Formerly Class II shares. | |
60 OAKMARK FUNDS
Oakmark.com 61
Oakmark Funds
Financial Highlights
For a share outstanding throughout each period
| | | | | Income from Investment Operations: | | Less Distributions: | | | | | | Ratios/Supplemental Data: | | | |
| | | Net Asset
Value,
Beginning of
Period | | Net
Investment
Income | | Net Gain
(Loss) on
Investments
(both
realized and
unrealized) | | Total From
Investment
Operations | | Dividends
From Net
Investment
Income | | Distributions
From
Capital
Gains | | Total
Distributions | | Redemption
Fees | | Net Asset
Value,
End of
Period | | Total
Return | | Net Assets,
End of
Period
($million) | | Ratio of
Expenses
to Average
Net Assets | | Ratio of
Net
Expenses
to Average
Net Assets | | Ratio of
Net
Investment
Income to
Average
Net Assets | | Portfolio
Turnover
Rate | |
Oakmark Equity and Income Fund | |
Investor Class(a) | |
10/1/17-3/31/17+ | | $ | 30.20 | | | | 0.19 | | | | 2.55 | | | | 2.74 | | | | (0.47 | ) | | | (0.79 | ) | | | (1.26 | ) | | | 0.00 | | | $ | 31.68 | | | | 9.33 | % | | $ | 14,802.0 | | | | 0.86 | %† | | | 0.78 | %† | | | 1.18 | %† | | | 9 | % | |
9/30/16 | | $ | 29.98 | | | | 0.36 | (b) | | | 1.73 | | | | 2.09 | | | | (0.34 | ) | | | (1.53 | ) | | | (1.87 | ) | | | 0.00 | | | $ | 30.20 | | | | 7.34 | % | | $ | 15,367.7 | | | | 0.79 | % | | | 0.79 | % | | | 1.22 | % | | | 18 | % | |
9/30/15 | | $ | 33.65 | | | | 0.36 | | | | (1.04 | ) | | | (0.68 | ) | | | (0.27 | ) | | | (2.72 | ) | | | (2.99 | ) | | | 0.00 | | | $ | 29.98 | | | | -2.53 | % | | $ | 17,285.5 | | | | 0.75 | % | | | 0.75 | % | | | 1.06 | % | | | 25 | % | |
9/30/14 | | $ | 33.06 | | | | 0.29 | | | | 3.02 | | | | 3.31 | | | | (0.17 | ) | | | (2.55 | ) | | | (2.72 | ) | | | 0.00 | | | $ | 33.65 | | | | 10.39 | % | | $ | 19,392.7 | | | | 0.74 | % | | | 0.74 | % | | | 0.85 | % | | | 18 | % | |
9/30/13 | | $ | 29.09 | | | | 0.28 | | | | 4.68 | | | | 4.96 | | | | (0.27 | ) | | | (0.72 | ) | | | (0.99 | ) | | | 0.00 | | | $ | 33.06 | | | | 17.63 | % | | $ | 18,222.5 | | | | 0.77 | % | | | 0.77 | % | | | 0.89 | % | | | 25 | %(c) | |
9/30/12 | | $ | 25.62 | | | | 0.25 | | | | 4.07 | | | | 4.32 | | | | (0.38 | ) | | | (0.47 | ) | | | (0.85 | ) | | | 0.00 | | | $ | 29.09 | | | | 17.19 | % | | $ | 17,889.0 | | | | 0.78 | % | | | 0.78 | % | | | 0.84 | % | | | 29 | % | |
Advisor Class(d) | |
11/30/17-3/31/17+ | | $ | 29.97 | | | | 0.07 | | | | 1.66 | | | | 1.73 | | | | 0.00 | | | | 0.00 | | | | 0.00 | | | | 0.00 | | | $ | 31.70 | | | | 5.77 | % | | $ | 655.1 | | | | 0.71 | %† | | | 0.61 | %† | | | 1.33 | %† | | | 9 | % | |
Institutional Class(d) | |
11/30/17-3/31/17+ | | $ | 29.97 | | | | 0.07 | | | | 1.66 | | | | 1.73 | | | | 0.00 | | | | 0.00 | | | | 0.00 | | | | 0.00 | | | $ | 31.70 | | | | 5.77 | % | | $ | 252.3 | | | | 0.70 | %† | | | 0.60 | %† | | | 1.38 | %† | | | 9 | % | |
Service Class(e) | |
10/1/17-3/31/17+ | | $ | 30.00 | | | | 0.13 | (b) | | | 2.54 | | | | 2.67 | | | | (0.37 | ) | | | (0.79 | ) | | | (1.16 | ) | | | 0.00 | | | $ | 31.51 | | | | 9.13 | % | | $ | 673.9 | | | | 1.19 | %† | | | 1.11 | %† | | | 0.84 | %† | | | 9 | % | |
9/30/16 | | $ | 29.75 | | | | 0.26 | (b) | | | 1.73 | | | | 1.99 | | | | (0.21 | ) | | | (1.53 | ) | | | (1.74 | ) | | | 0.00 | | | $ | 30.00 | | | | 7.02 | % | | $ | 744.2 | | | | 1.10 | % | | | 1.10 | % | | | 0.90 | % | | | 18 | % | |
9/30/15 | | $ | 33.41 | | | | 0.25 | | | | (1.03 | ) | | | (0.78 | ) | | | (0.16 | ) | | | (2.72 | ) | | | (2.88 | ) | | | 0.00 | | | $ | 29.75 | | | | -2.84 | % | | $ | 900.7 | | | | 1.09 | % | | | 1.09 | % | | | 0.71 | % | | | 25 | % | |
9/30/14 | | $ | 32.83 | | | | 0.18 | (b) | | | 3.00 | | | | 3.18 | | | | (0.05 | ) | | | (2.55 | ) | | | (2.60 | ) | | | 0.00 | | | $ | 33.41 | | | | 10.04 | % | | $ | 1,157.2 | | | | 1.05 | % | | | 1.05 | % | | | 0.54 | % | | | 18 | % | |
9/30/13 | | $ | 28.90 | | | | 0.17 | | | | 4.66 | | | | 4.83 | | | | (0.18 | ) | | | (0.72 | ) | | | (0.90 | ) | | | 0.00 | | | $ | 32.83 | | | | 17.23 | % | | $ | 1,211.4 | | | | 1.10 | % | | | 1.10 | % | | | 0.56 | % | | | 25 | %(c) | |
9/30/12 | | $ | 25.45 | | | | 0.15 | | | | 4.05 | | | | 4.20 | | | | (0.28 | ) | | | (0.47 | ) | | | (0.75 | ) | | | 0.00 | | | $ | 28.90 | | | | 16.82 | % | | $ | 1,288.0 | | | | 1.09 | % | | | 1.09 | % | | | 0.53 | % | | | 29 | % | |
+ | | Unaudited. | |
† | | Data has been annualized. | |
(a) | | Formerly Class I shares. | |
(b) | | Computed using average shares outstanding throughout the period. | |
(c) | | The ratio excludes in-kind transactions. | |
(d) | | Commenced on 11/30/2016. | |
(e) | | Formerly Class II shares. | |
Oakmark Global Fund | |
Investor Class(a) | |
10/1/17-3/31/17+ | | $ | 26.36 | | | | 0.01 | | | | 4.12 | | | | 4.13 | | | | (0.30 | ) | | | 0.00 | | | | (0.30 | ) | | | 0.00 | | | $ | 30.19 | | | | 15.80 | % | | $ | 2,282.9 | | | | 1.21 | %† | | | 1.16 | %† | | | 0.13 | %† | | | 13 | % | |
9/30/16 | | $ | 26.34 | | | | 0.32 | | | | 0.48 | | | | 0.80 | | | | (0.31 | ) | | | (0.47 | ) | | | (0.78 | ) | | | 0.00 | | | $ | 26.36 | | | | 2.93 | % | | $ | 2,328.9 | | | | 1.17 | % | | | 1.17 | % | | | 1.14 | % | | | 32 | % | |
9/30/15 | | $ | 30.34 | | | | 0.25 | (c) | | | (2.16 | ) | | | (1.91 | ) | | | (0.35 | ) | | | (1.74 | ) | | | (2.09 | ) | | | 0.00 | | | $ | 26.34 | | | | -6.92 | % | | $ | 2,950.8 | | | | 1.12 | % | | | 1.12 | % | | | 0.86 | % | | | 36 | % | |
9/30/14 | | $ | 29.70 | | | | 0.23 | (c) | | | 1.71 | | | | 1.94 | | | | (0.75 | ) | | | (0.55 | ) | | | (1.30 | ) | | | 0.00 | | | $ | 30.34 | | | | 6.70 | % | | $ | 3,503.8 | | | | 1.11 | % | | | 1.11 | % | | | 0.76 | % | | | 31 | % | |
9/30/13 | | $ | 21.63 | | | | 0.21 | | | | 8.23 | | | | 8.44 | | | | (0.37 | ) | | | 0.00 | | | | (0.37 | ) | | | 0.00 | (b) | | $ | 29.70 | | | | 39.55 | % | | $ | 2,880.4 | | | | 1.13 | % | | | 1.13 | % | | | 0.75 | % | | | 45 | %(d) | |
9/30/12 | | $ | 18.81 | | | | 0.20 | | | | 2.62 | | | | 2.82 | | | | 0.00 | | | | 0.00 | | | | 0.00 | | | | 0.00 | (b) | | $ | 21.63 | | | | 14.99 | % | | $ | 2,062.8 | | | | 1.16 | % | | | 1.16 | % | | | 0.91 | % | | | 26 | % | |
Advisor Class(e) | |
11/30/17-3/31/17+ | | $ | 27.22 | | | | 0.06 | (c) | | | 2.93 | | | | 2.99 | | | | 0.00 | | | | 0.00 | | | | 0.00 | | | | 0.00 | | | $ | 30.21 | | | | 10.98 | % | | $ | 133.8 | | | | 1.05 | %† | | | 0.99 | %† | | | 0.59 | %† | | | 13 | % | |
Institutional Class(e) | |
11/30/17-3/31/17+ | | $ | 27.22 | | | | 0.06 | | | | 2.93 | | | | 2.99 | | | | 0.00 | | | | 0.00 | | | | 0.00 | | | | 0.00 | | | $ | 30.21 | | | | 10.98 | % | | $ | 154.1 | | | | 1.03 | %† | | | 0.98 | %† | | | 1.22 | %† | | | 13 | % | |
Service Class(f) | |
10/1/17-3/31/17+ | | $ | 25.65 | | | | (0.19 | ) | | | 4.17 | | | | 3.98 | | | | (0.22 | ) | | | 0.00 | | | | (0.22 | ) | | | 0.00 | | | $ | 29.41 | | | | 15.59 | % | | $ | 24.0 | | | | 1.53 | %† | | | 1.48 | %† | | | (0.20 | )%† | | | 13 | % | |
9/30/16 | | $ | 25.62 | | | | 0.21 | (c) | | | 0.47 | | | | 0.68 | | | | (0.18 | ) | | | (0.47 | ) | | | (0.65 | ) | | | 0.00 | | | $ | 25.65 | | | | 2.60 | % | | $ | 25.6 | | | | 1.50 | % | | | 1.50 | % | | | 0.82 | % | | | 32 | % | |
9/30/15 | | $ | 29.57 | | | | 0.13 | (c) | | | (2.10 | ) | | | (1.97 | ) | | | (0.24 | ) | | | (1.74 | ) | | | (1.98 | ) | | | 0.00 | | | $ | 25.62 | | | | -7.33 | % | | $ | 32.3 | | | | 1.52 | % | | | 1.52 | % | | | 0.46 | % | | | 36 | % | |
9/30/14 | | $ | 28.98 | | | | 0.13 | (c) | | | 1.67 | | | | 1.80 | | | | (0.66 | ) | | | (0.55 | ) | | | (1.21 | ) | | | 0.00 | | | $ | 29.57 | | | | 6.35 | % | | $ | 41.8 | | | | 1.45 | % | | | 1.45 | % | | | 0.42 | % | | | 31 | % | |
9/30/13 | | $ | 21.11 | | | | 0.03 | | | | 8.14 | | | | 8.17 | | | | (0.30 | ) | | | 0.00 | | | | (0.30 | ) | | | 0.00 | (b) | | $ | 28.98 | | | | 39.11 | % | | $ | 38.9 | | | | 1.48 | % | | | 1.48 | % | | | 0.40 | % | | | 45 | %(d) | |
9/30/12 | | $ | 18.42 | | | | 0.11 | (c) | | | 2.58 | | | | 2.69 | | | | 0.00 | | | | 0.00 | | | | 0.00 | | | | 0.00 | (b) | | $ | 21.11 | | | | 14.60 | % | | $ | 33.1 | | | | 1.50 | % | | | 1.50 | % | | | 0.55 | % | | | 26 | % | |
+ | | Unaudited. | |
† | | Data has been annualized. | |
(a) | | Formerly Class I shares. | |
(b) | | Amount rounds to less than $0.01 per share. | |
(c) | | Computed using average shares outstanding throughout the period. | |
(d) | | The ratio excludes in-kind transactions. | |
(e) | | Commenced on 11/30/2016. | |
(f) | | Formerly Class II shares. | |
62 OAKMARK FUNDS
Oakmark.com 63
Oakmark Funds
Financial Highlights
For a share outstanding throughout each period
| | | | | Income from Investment Operations: | | Less Distributions: | | | | | | Ratios/Supplemental Data: | | | |
| | | Net Asset
Value,
Beginning of
Period | | Net
Investment
Income | | Net Gain
(Loss) on
Investments
(both
realized and
unrealized) | | Total From
Investment
Operations | | Dividends
From Net
Investment
Income | | Distributions
From
Capital
Gains | | Total
Distributions | | Redemption
Fees | | Net Asset
Value,
End of
Period | | Total
Return | | Net Assets,
End of
Period
($million) | | Ratio of
Expenses
to Average
Net Assets | | Ratio of
Net
Expenses
to Average
Net Assets | | Ratio of
Net
Investment
Income to
Average
Net Assets | | Portfolio
Turnover
Rate | |
Oakmark Global Select Fund | |
Investor Class(a) | |
10/1/16-3/31/17+ | | $ | 15.81 | | | | 0.04 | | | | 2.11 | | | | 2.15 | | | | (0.17 | ) | | | 0.00 | | | | (0.17 | ) | | | 0.00 | | | $ | 17.79 | | | | 13.69 | % | | $ | 2,150.7 | | | | 1.20 | %† | | | 1.14 | %† | | | 0.38 | %† | | | 25 | % | |
9/30/16 | | $ | 15.19 | | | | 0.18 | | | | 1.31 | | | | 1.49 | | | | (0.13 | ) | | | (0.74 | ) | | | (0.87 | ) | | | 0.00 | | | $ | 15.81 | | | | 9.92 | % | | $ | 2,037.1 | | | | 1.15 | % | | | 1.15 | % | | | 1.12 | % | | | 17 | % | |
9/30/15 | | $ | 16.63 | | | | 0.12 | | | | (0.65 | ) | | | (0.53 | ) | | | (0.14 | ) | | | (0.77 | ) | | | (0.91 | ) | | | 0.00 | | | $ | 15.19 | | | | -3.44 | % | | $ | 2,033.4 | | | | 1.13 | % | | | 1.13 | % | | | 0.70 | % | | | 48 | % | |
9/30/14 | | $ | 15.71 | | | | 0.12 | | | | 1.21 | | | | 1.33 | | | | (0.14 | ) | | | (0.27 | ) | | | (0.41 | ) | | | 0.00 | | | $ | 16.63 | | | | 8.52 | % | | $ | 1,937.3 | | | | 1.13 | % | | | 1.13 | % | | | 0.92 | % | | | 24 | % | |
9/30/13 | | $ | 11.65 | | | | 0.14 | | | | 4.18 | | | | 4.32 | | | | (0.16 | ) | | | (0.10 | ) | | | (0.26 | ) | | | 0.00 | | | $ | 15.71 | | | | 37.69 | % | | $ | 1,159.8 | | | | 1.15 | % | | | 1.15 | % | | | 1.01 | % | | | 36 | % | |
9/30/12 | | $ | 9.96 | | | | 0.09 | | | | 1.60 | | | | 1.69 | | | | 0.00 | | | | 0.00 | | | | 0.00 | | | | 0.00 | (b) | | $ | 11.65 | | | | 16.97 | % | | $ | 555.8 | | | | 1.23 | % | | | 1.23 | % | | | 0.72 | % | | | 36 | % | |
Advisor Class(c) | |
11/30/17-3/31/17+ | | $ | 16.39 | | | | 0.04 | | | | 1.38 | | | | 1.42 | | | | 0.00 | | | | 0.00 | | | | 0.00 | | | | 0.00 | | | $ | 17.81 | | | | 8.66 | % | | $ | 79.1 | | | | 1.06 | %† | | | 0.99 | %† | | | 1.48 | %† | | | 25 | % | |
Institutional Class(c) | |
11/30/17-3/31/17+ | | $ | 16.39 | | | | 0.04 | | | | 1.38 | | | | 1.42 | | | | 0.00 | | | | 0.00 | | | | 0.00 | | | | 0.00 | | | $ | 17.81 | | | | 8.66 | % | | $ | 151.6 | | | | 1.04 | %† | | | 0.97 | %† | | | 1.47 | %† | | | 25 | % | |
+ | | Unaudited. | |
† | | Data has been annualized. | |
(a) | | Formerly Class I shares. | |
(b) | | Amount rounds to less than $0.01 per share. | |
(c) | | Commenced on 11/30/2016. | |
Oakmark International Fund | |
Investor Class(a) | |
10/1/17-3/31/17 | | $ | 21.66 | | | | 0.07 | | | | 3.45 | | | | 3.52 | | | | (0.34 | ) | | | 0.00 | | | | (0.34 | ) | | | 0.00 | | | $ | 24.84 | | | | 16.45 | % | | $ | 27,708.9 | | | | 1.01 | %† | | | 0.96 | %† | | | 0.58 | %† | | | 22 | % | |
9/30/16 | | $ | 21.34 | | | | 0.36 | (b) | | | 1.04 | | | | 1.40 | | | | (0.50 | ) | | | (0.58 | ) | | | (1.08 | ) | | | 0.00 | | | $ | 21.66 | | | | 6.66 | % | | $ | 23,277.7 | | | | 1.00 | % | | | 1.00 | % | | | 1.72 | % | | | 44 | % | |
9/30/15 | | $ | 25.01 | | | | 0.46 | | | | (2.55 | ) | | | (2.09 | ) | | | (0.51 | ) | | | (1.07 | ) | | | (1.58 | ) | | | 0.00 | | | $ | 21.34 | | | | -8.98 | % | | $ | 25,915.2 | | | | 0.95 | % | | | 0.95 | % | | | 1.81 | % | | | 48 | % | |
9/30/14 | | $ | 25.89 | | | | 0.46 | (b) | | | (0.61 | ) | | | (0.15 | ) | | | (0.44 | ) | | | (0.29 | ) | | | (0.73 | ) | | | 0.00 | | | $ | 25.01 | | | | -0.64 | % | | $ | 29,759.6 | | | | 0.95 | % | | | 0.95 | % | | | 1.76 | % | | | 39 | %(c) | |
9/30/13 | | $ | 18.79 | | | | 0.28 | | | | 7.26 | | | | 7.54 | | | | (0.44 | ) | | | 0.00 | | | | (0.44 | ) | | | 0.00 | | | $ | 25.89 | | | | 40.79 | % | | $ | 23,886.0 | | | | 0.98 | % | | | 0.98 | % | | | 1.58 | % | | | 37 | %(c) | |
9/30/12 | | $ | 16.13 | | | | 0.34 | (b) | | | 2.45 | | | | 2.79 | | | | (0.13 | ) | | | 0.00 | | | | (0.13 | ) | | | 0.00 | (d) | | $ | 18.79 | | | | 17.40 | % | | $ | 8,993.6 | | | | 1.06 | % | | | 1.06 | % | | | 1.90 | % | | | 38 | % | |
Advisor Class(e) | |
11/30/17-3/31/17+ | | $ | 21.96 | | | | 0.04 | | | | 2.86 | | | | 2.90 | | | | 0.00 | | | | 0.00 | | | | 0.00 | | | | 0.00 | | | $ | 24.86 | | | | 13.21 | % | | $ | 541.6 | | | | 0.86 | %† | | | 0.81 | %† | | | 1.75 | %† | | | 22 | % | |
Institutional Class(e) | |
11/30/17-3/31/17+ | | $ | 21.96 | | | | 0.06 | | | | 2.84 | | | | 2.90 | | | | 0.00 | | | | 0.00 | | | | 0.00 | | | | 0.00 | | | $ | 24.86 | | | | 13.21 | % | | $ | 1,010.0 | | | | 0.83 | %† | | | 0.78 | %† | | | 2.28 | %† | | | 22 | % | |
Service Class(f) | |
10/1/17-3/31/17 | | $ | 21.74 | | | | 0.03 | (b) | | | 3.47 | | | | 3.50 | | | | (0.26 | ) | | | 0.00 | | | | (0.26 | ) | | | 0.00 | | | $ | 24.98 | | | | 16.27 | % | | $ | 538.6 | | | | 1.29 | %† | | | 1.24 | %† | | | 0.24 | %† | | | 22 | % | |
9/30/16 | | $ | 21.40 | | | | 0.29 | (b) | | | 1.04 | | | | 1.33 | | | | (0.41 | ) | | | (0.58 | ) | | | (0.99 | ) | | | 0.00 | | | $ | 21.74 | | | | 6.32 | % | | $ | 532.3 | | | | 1.34 | % | | | 1.34 | % | | | 1.38 | % | | | 44 | % | |
9/30/15 | | $ | 25.07 | | | | 0.36 | (b) | | | (2.55 | ) | | | (2.19 | ) | | | (0.41 | ) | | | (1.07 | ) | | | (1.48 | ) | | | 0.00 | | | $ | 21.40 | | | | -9.31 | % | | $ | 559.1 | | | | 1.33 | % | | | 1.33 | % | | | 1.48 | % | | | 48 | % | |
9/30/14 | | $ | 25.98 | | | | 0.37 | (b) | | | (0.63 | ) | | | (0.26 | ) | | | (0.36 | ) | | | (0.29 | ) | | | (0.65 | ) | | | 0.00 | | | $ | 25.07 | | | | -1.04 | % | | $ | 538.9 | | | | 1.33 | % | | | 1.33 | % | | | 1.40 | % | | | 39 | %(c) | |
9/30/13 | | $ | 18.86 | | | | 0.27 | (b) | | | 7.23 | | | | 7.50 | | | | (0.38 | ) | | | 0.00 | | | | (0.38 | ) | | | 0.00 | | | $ | 25.98 | | | | 40.31 | % | | $ | 386.9 | | | | 1.34 | % | | | 1.34 | % | | | 1.20 | % | | | 37 | %(c) | |
9/30/12 | | $ | 16.18 | | | | 0.27 | | | | 2.47 | | | | 2.74 | | | | (0.06 | ) | | | 0.00 | | | | (0.06 | ) | | | 0.00 | (d) | | $ | 18.86 | | | | 16.99 | % | | $ | 241.4 | | | | 1.39 | % | | | 1.39 | % | | | 1.55 | % | | | 38 | % | |
+ | | Unaudited. | |
† | | Data has been annualized. | |
(a) | | Formerly Class I shares. | |
(b) | | Computed using average shares outstanding throughout the period. | |
(c) | | The ratio excludes in-kind transactions. | |
(d) | | Amount rounds to less than $0.01 per share. | |
(e) | | Commenced on 11/30/2016. | |
(f) | | Formerly Class II shares. | |
64 OAKMARK FUNDS
Oakmark.com 65
Oakmark Funds
Financial Highlights
For a share outstanding throughout each period
| | | | | Income from Investment Operations: | | Less Distributions: | | | | | | Ratios/Supplemental Data: | | | |
| | | Net Asset
Value,
Beginning of
Period | | Net
Investment
Income | | Net Gain
(Loss) on
Investments
(both
realized and
unrealized) | | Total From
Investment
Operations | | Dividends
From Net
Investment
Income | | Distributions
From
Capital
Gains | | Total
Distributions | | Redemption
Fees | | Net Asset
Value,
End of
Period | | Total
Return | | Net Assets,
End of
Period
($million) | | Ratio of
Expenses
to Average
Net Assets | | Ratio of
Net
Expenses
to Average
Net Assets | | Ratio of
Net
Investment
Income to
Average
Net Assets | | Portfolio
Turnover
Rate | |
Oakmark International Small Cap Fund | |
Investor Class(a) | |
10/1/17-3/31/17+ | | $ | 14.84 | | | | 0.08 | | | | 1.53 | | | | 1.61 | | | | (0.36 | ) | | | (0.09 | ) | | | (0.45 | ) | | | 0.00 | (b) | | $ | 16.00 | | | | 11.24 | % | | $ | 2,375.7 | | | | 1.38 | %† | | | 1.38 | %† | | | 1.00 | %† | | | 18 | % | |
9/30/16 | | $ | 14.63 | | | | 0.42 | (c) | | | 0.51 | | | | 0.93 | | | | (0.36 | ) | | | (0.36 | ) | | | (0.72 | ) | | | 0.00 | (b) | | $ | 14.84 | | | | 6.66 | % | | $ | 2,365.1 | | | | 1.38 | % | | | 1.38 | % | | | 2.97 | % | | | 38 | % | |
9/30/15 | | $ | 16.38 | | | | 0.19 | (c) | | | (0.78 | ) | | | (0.59 | ) | | | (0.26 | ) | | | (0.90 | ) | | | (1.16 | ) | | | 0.00 | (b) | | $ | 14.63 | | | | -3.70 | % | | $ | 2,852.0 | | | | 1.35 | % | | | 1.35 | % | | | 1.18 | % | | | 46 | % | |
9/30/14 | | $ | 17.29 | | | | 0.17 | | | | (0.53 | ) | | | (0.36 | ) | | | (0.55 | ) | | | 0.00 | | | | (0.55 | ) | | | 0.00 | (b) | | $ | 16.38 | | | | -2.14 | % | | $ | 2,910.0 | | | | 1.31 | % | | | 1.31 | % | | | 1.07 | % | | | 38 | % | |
9/30/13 | | $ | 13.06 | | | | 0.18 | | | | 4.26 | | | | 4.44 | | | | (0.21 | ) | | | 0.00 | | | | (0.21 | ) | | | 0.00 | (b) | | $ | 17.29 | | | | 34.42 | % | | $ | 2,254.1 | | | | 1.35 | % | | | 1.35 | % | | | 1.23 | % | | | 50 | % | |
9/30/12 | | $ | 11.56 | | | | 0.20 | | | | 1.32 | | | | 1.52 | | | | (0.02 | ) | | | 0.00 | (b) | | | (0.02 | ) | | | 0.00 | (b) | | $ | 13.06 | | | | 13.15 | % | | $ | 1,525.8 | | | | 1.41 | % | | | 1.41 | % | | | 1.54 | % | | | 33 | % | |
Advisor Class(d) | |
11/30/17-3/31/17+ | | $ | 14.16 | | | | 0.01 | | | | 1.85 | | | | 1.86 | | | | 0.00 | | | | 0.00 | | | | 0.00 | | | | 0.00 | | | $ | 16.02 | | | | 13.14 | % | | $ | 40.2 | | | | 1.18 | %† | | | 1.18 | %† | | | 0.94 | %† | | | 18 | % | |
Institutional Class(d) | |
11/30/17-3/31/17+ | | $ | 14.16 | | | | 0.03 | | | | 1.83 | | | | 1.86 | | | | 0.00 | | | | 0.00 | | | | 0.00 | | | | 0.00 | (b) | | $ | 16.02 | | | | 13.14 | % | | $ | 204.2 | | | | 1.15 | %† | | | 1.15 | %† | | | 1.57 | %† | | | 18 | % | |
Service Class(e) | |
10/1/17-3/31/17+ | | $ | 14.75 | | | | 0.05 | (c) | | | 1.53 | | | | 1.58 | | | | (0.32 | ) | | | (0.09 | ) | | | (0.41 | ) | | | 0.00 | (b) | | $ | 15.92 | | | | 11.05 | % | | $ | 1.6 | | | | 1.70 | %† | | | 1.70 | %† | | | 0.69 | %† | | | 18 | % | |
9/30/16 | | $ | 14.53 | | | | 0.38 | (c) | | | 0.51 | | | | 0.89 | | | | (0.31 | ) | | | (0.36 | ) | | | (0.67 | ) | | | 0.00 | (b) | | $ | 14.75 | | | | 6.39 | % | | $ | 1.5 | | | | 1.69 | % | | | 1.69 | % | | | 2.69 | % | | | 38 | % | |
9/30/15 | | $ | 16.26 | | | | 0.13 | (c) | | | (0.77 | ) | | | (0.64 | ) | | | (0.19 | ) | | | (0.90 | ) | | | (1.09 | ) | | | 0.00 | (b) | | $ | 14.53 | | | | -4.00 | % | | $ | 1.9 | | | | 1.62 | % | | | 1.62 | % | | | 0.85 | % | | | 46 | % | |
9/30/14 | | $ | 17.17 | | | | 0.14 | | | | (0.54 | ) | | | (0.40 | ) | | | (0.51 | ) | | | 0.00 | | | | (0.51 | ) | | | 0.00 | (b) | | $ | 16.26 | | | | -2.42 | % | | $ | 3.3 | | | | 1.62 | % | | | 1.62 | % | | | 0.70 | % | | | 38 | % | |
9/30/13 | | $ | 12.98 | | | | 0.13 | (c) | | | 4.24 | | | | 4.37 | | | | (0.18 | ) | | | 0.00 | | | | (0.18 | ) | | | 0.00 | (b) | | $ | 17.17 | | | | 34.04 | % | | $ | 3.5 | | | | 1.64 | % | | | 1.64 | % | | | 0.90 | % | | | 50 | % | |
9/30/12 | | $ | 11.50 | | | | 0.17 | (c) | | | 1.31 | | | | 1.48 | | | | 0.00 | | | | 0.00 | (b) | | | 0.00 | (b) | | | 0.00 | (b) | | $ | 12.98 | | | | 12.90 | % | | $ | 2.6 | | | | 1.69 | % | | | 1.69 | % | | | 1.34 | % | | | 33 | % | |
+ | | Unaudited. | |
† | | Data has been annualized. | |
(a) | | Formerly Class I shares. | |
(b) | | Amount rounds to less than $0.01 per share. | |
(c) | | Computed using average shares outstanding throughout the period. | |
(d) | | Commenced on 11/30/2016. | |
(e) | | Formerly Class II shares. | |
66 OAKMARK FUNDS
Oakmark.com 67
The Oakmark Funds Disclosure Regarding The Board Of Trustees' October 2016 Approval Of Investment Advisory Agreements
On an annual basis, the Board of Trustees (the "Board") of the Oakmark Funds (the "Funds"), including a majority of the Trustees who are not "interested persons" of Harris Associates L.P., the Funds' investment adviser (the "Adviser") or the Funds ("Independent Trustees"), is required by the Investment Company Act of 1940 (the "1940 Act") to determine whether to continue each Fund's investment advisory agreement (each, an "Agreement," and collectively, the "Agreements") with the Adviser. At a meeting held on October 19, 2016, the Board, including all of the Independent Trustees, upon recommendation of the Board's Committee on Contracts (the "Committee"), determined that the continuation of the Agreement for each Fund was in the best interest of the Fund and its shareholders, and approved the continuation of the Agreements through October 31, 2017.
In evaluating the Agreements with respect to each Fund, the Board, including the Independent Trustees, reviewed materials provided by the Adviser in response to questions submitted by the Independent Trustees and counsel that is experienced in 1940 Act matters and that is independent of the Adviser ("Independent Counsel"), and met with senior representatives of the Adviser regarding its personnel, operations and financial condition as they relate to the Funds. In addition, the Board retained an independent data provider to provide performance and expense information for each Fund and for comparable funds.
The Committee leads the Board in its evaluation of the Agreements. The Committee is comprised entirely of Independent Trustees, and more than 75% of the Board is comprised of Independent Trustees. During the annual contract review, the Committee and the Board met multiple times to consider the Agreements and ensure that the Adviser had time to respond to questions from the Independent Trustees and that the Independent Trustees had time to consider those responses. In connection with its deliberations, the Board also considered a broad range of information relevant to the annual contract review that is provided to the Board (including its various standing committees) at meetings throughout the year, including investment performance reports and related portfolio information for each Fund, as well as periodic reports on, among other matters, pricing and valuation; brokerage and execution; compliance; and shareholder and other services provided by the Adviser and its affiliates.
Throughout the process, the Independent Trustees were advised by Independent Counsel and received from Independent Counsel a memorandum discussing the legal standards for their consideration of the proposed continuation of the Agreements. During the course of the year and during their deliberations regarding the annual contract review, the Committee and the Independent Trustees met with Independent Counsel separately from representatives of the Adviser.
In connection with their consideration of each Agreement, the Committee and the Board considered, among other things: (i) the nature, quality and extent of the Adviser's services, (ii) the investment performance of each Fund, as well as performance information for an appropriate market index and a peer group of other mutual funds, (iii) the fees and other expenses paid by each Fund, as well as fee and expense information for comparable funds and separate accounts managed by the Adviser, (iv) the profitability of the Adviser and its affiliates from their relationship with each Fund, (v) whether economies of scale may be realized as the Funds grow and whether fee levels reflect such potential economies of scale for the benefit of each Fund's shareholders, and (vi) other benefits to the Adviser that result from its relationship with each Fund.
Below is a summary of the principal information considered by the Board regarding various factors. In their deliberations, the Independent Trustees did not identify any single factor that was paramount or determinative, and each Independent Trustee may have weighed the information differently. The Board focused, among other things, on the overall costs and benefits of the Agreements to each Fund and, through the Funds, their shareholders.
1. Nature, Extent and Quality of Services
The Board's consideration of the nature, extent and quality of the Adviser's services to the Funds took into account the knowledge the Board gained during meetings with the Adviser throughout the year. In addition, the Board considered: the Adviser's long-term history of care and conscientiousness in the management of the Funds; the consistency of its investment approach; the qualifications, experience, and capabilities of, and the resources available to, the Adviser's investment and other personnel responsible for managing the Funds; the Adviser's performance as administrator of the Funds; and the Adviser's compliance program. The Board also reviewed the Adviser's resources and key personnel involved in providing investment management services to the Funds, including the time that investment personnel devoted to each Fund and the investment results produced as a result of the Adviser's in-house research.
The Board considered that, pursuant to each Agreement, the Adviser provides administrative services, including, among other things, oversight of shareholder communications, fund administration and accounting services, regulatory and legal obligation oversight, supervision of fund operations, and Board support. The Board also considered that the Adviser's responsibilities include daily management of investment, operational, enterprise, legal, regulatory and compliance risks as they relate to the Funds, and considered information regarding the Adviser's processes for managing risk. The Board also noted the significant personal investments that the Adviser's personnel have made in the Funds, which serve to further align the interests of the Adviser and its personnel with those of the Funds' shareholders.
The Board also considered the manner in which the Adviser addressed various non-routine matters that arose during the year, some of them a result of developments in the broader fund industry or the regulations governing it, and considered the overall performance of the Adviser in this context.
2. Investment Performance of the Funds
The Board considered each Fund's investment performance over various time periods, and the performance of a group of comparable funds pursuing broadly similar strategies with the same investment classification and/or objective as each Fund (the Fund's "Performance Universe") selected by Broadridge Financial Solutions, Inc. ("Broadridge"). Because the Committee commenced its review in June, the performance periods considered by the Board were those ended on April 30, 2016. Where available, the Board considered one-, three-, five-, and ten-year performance. The Board also considered updated performance information at its October meeting at which the Agreements were approved.
68 OAKMARK FUNDS
Further detail considered by the Board regarding the investment performance of each Fund is set forth below:
Oakmark Fund. The Board considered that the Oakmark Fund outperformed the median annualized returns of its respective Performance Universe during the three-, five- and ten-year periods ending April 30, 2016, but underperformed the median annualized return of its respective Performance Universe during the one-year period ending April 30, 2016.
Oakmark Select Fund. The Board considered that the Oakmark Select Fund outperformed the median annualized returns of its respective Performance Universe during the three-, five- and ten-year periods ending April 30, 2016, but underperformed the median annualized return of its respective Performance Universe during the one-year period ending April 30, 2016.
Oakmark Equity and Income Fund. The Board considered that the Oakmark Equity and Income Fund outperformed the median annualized returns of its respective Performance Universe during the three-, five-, and ten-year periods ending April 30, 2016, but underperformed the median annualized return of its respective Performance Universe during the one-year period ending April 30, 2016.
Oakmark Global Fund. The Board considered that the Oakmark Global Fund outperformed the median annualized returns of its respective Performance Universe during the five- and ten-year periods ending April 30, 2016, but underperformed the median annualized returns of its respective Performance Universe during the one- and three-year periods ending April 30, 2016.
Oakmark Global Select Fund. Noting that the Oakmark Global Select Fund commenced operations in October 2006, the Board considered that the Fund outperformed the median annualized returns of its respective Performance Universe during all periods presented.
Oakmark International Fund. The Board considered that the Oakmark International Fund outperformed the median annualized returns of its respective Performance Universe during the three-, five- and ten-year periods ending April 30, 2016, but underperformed the median annualized return of its respective Performance Universe during the one-year period ending April 30, 2016.
Oakmark International Small Cap Fund. The Board considered that the Oakmark International Small Cap Fund outperformed the median annualized return of its respective Performance Universe during the ten-year period ending April 30, 2016, but underperformed the median annualized returns of its respective Performance Universe during the one-, three-, and five-year periods ending April 30, 2016.
In addition to considering each Fund's performance as compared to that of its respective Performance Universe, the Board also considered each Fund's performance as compared to that of its benchmark and other comparative data provided by Broadridge, including each Fund's total return and performance relative to risk. In the case of those Funds that had underperformed their respective Performance Universe, the Board discussed with the Adviser each Fund's performance and considered that performance, especially short-term performance, is only one of the factors that it deems relevant to its consideration of a Fund's Agreements.
3. Costs of Services Provided and Profits Realized by the Adviser
Using information provided by Broadridge, the Board considered each Fund's management fee and the management fees for other mutual funds comparable in size, character and investment strategy to each Fund (the "Expense Group"), and considered each Fund's expense ratio and those of the Expense Group.
The Board also reviewed the Adviser's management fees for comparable institutional separate account clients and subadvised funds (for which the Adviser provides portfolio management services only). The Board considered the appropriateness and reasonableness of any differences between the fees charged to a Fund and any such comparable funds and/or separate accounts, including any breakpoints, and noted the Adviser's explanation that, although in most instances, the fees paid by those other clients were lower than the fees paid by the Funds, the differences reflected the Adviser's significantly greater level of responsibilities and broader scope of services regarding the Funds, and the more extensive regulatory obligations and the various risks (e.g., operational, enterprise, legal, regulatory, compliance) associated with managing the Funds. The Board noted that each Fund's management fee is a single fee that compensates the Adviser for its services as investment adviser and manager under the Agreements.
The Board also considered the Adviser's costs in serving as the Funds' investment adviser and manager, including costs associated with technology, infrastructure and compliance necessary to manage the Funds. The Board also considered information regarding the structure of the Adviser's compensation program for portfolio managers, analysts and certain other employees and the relationship of such compensation to the Adviser's ability to attract and retain quality personnel. The Board also considered fall-out benefits received by the Adviser or its affiliates from their relationship with each Fund. Finally, the Board considered the Adviser's profitability analysis, as well as an Investment Management Industry Profitability Analysis prepared by Broadridge and a report on the Adviser's profitability prepared by an independent consultant. The Board examined the pre-tax profits realized by the Adviser and its affiliates from their relationship with each Fund, as presented in the profitability analyses, as well as the financial condition of the Adviser. The Board reviewed the Adviser's methodology for allocating costs among the Adviser's lines of business and among the Funds, for purposes of calculating its profitability.
Further detail considered by the Board regarding the management fee rate and expense ratio of each Fund as of the conclusion of each Fund's last fiscal year end is set forth below:
Oakmark Fund, Oakmark Global Select Fund and Oakmark International Small Cap Fund. The Board considered that each Fund's management fee rate and total expense ratio are higher than the respective medians of each Fund's Expense Group.
Oakmark Equity and Income Fund, Oakmark Global Fund, Oakmark International Fund and Oakmark Select Fund. The Board considered that each Fund's management fee rate is higher than the median of each Fund's Expense Group. The Board noted, however, that each Fund's total expense ratio, which reflects the total fees paid by an investor, is lower than the median of each Fund's Expense Group.
Oakmark.com 69
4. Economies of Scale and Fee Levels Reflecting Those Economies
The Board considered whether each Fund's management fee structure reflects any potential economies of scale that may be realized by the Adviser for the benefit of each Fund's shareholders. The Board reviewed each Agreement, which includes breakpoints that decrease the management fee rate as Fund assets increase. The Board also considered that the Adviser has provided, at no added cost to the Funds, certain additional services that were required by new regulations or regulatory interpretations and/or requested by the Board.
5. Other Benefits Derived from the Relationship with the Funds
The Board also considered other benefits that accrue to the Adviser and its affiliates from their relationship with the Funds. The Board noted that an affiliate of the Adviser serves as the Funds' distributor, without compensation, pursuant to a written agreement the Board evaluates annually.
The Board also considered the Adviser's use of a portion of the commissions paid by the Funds on their portfolio brokerage transactions to obtain research products and services benefiting the Funds and/or other clients of the Adviser, and considered the Adviser's assertion that its use of "soft" commission dollars to obtain research products and services was consistent with regulatory requirements.
6. Conclusion
After full consideration of the above factors, as well as other factors that were instructive in evaluating the Agreements, the Board, including all of the Independent Trustees, concluded that approval of the continuation of each Agreement was in the best interests of the respective Fund and its shareholders. In reaching this determination, the Board considered that the nature, extent and quality of the services provided by the Adviser to each Fund were appropriate and consistent with the Fund's Agreement and that each Fund was likely to continue to benefit from services provided under its Agreement with the Adviser; that the Adviser was delivering performance for each Fund that was consistent with the long-term investment strategies being pursued by the Fund, and that the Fund and its shareholders were benefiting from the Adviser's investment management of the Fund; that the management fees paid by each Fund to the Adviser were reasonable in light of the services provided; that the breakpoints in the fee schedule for each Fund allow shareholders to benefit from potential economies of scale that may be achieved by the Adviser; that the profitability of the Adviser's relationship with the Funds appeared to be reasonable in relation to the services performed; and that the benefits accruing to the Adviser and its affiliates by virtue of their relationship with the Funds were reasonable in light of the costs and risks associated with providing the investment advisory and other services and the benefits accruing to each Fund. The Board's conclusions are based in part on its consideration of materials prepared in connection with the approval or continuance of the Agreements in prior years and on the Board's ongoing regular review of Fund performance and operations throughout the year, in addition to material prepared specifically for the most recent annual review of the Agreements.
70 OAKMARK FUNDS
Disclosures and Endnotes
Reporting to Shareholders. The Funds reduce the number of duplicate prospectuses, annual and semi-annual reports your household receives by sending only one copy of each to those addresses shared by two or more accounts. Call the Funds at 1-800-OAKMARK to request individual copies of these documents. The Funds will begin sending individual copies thirty days after receiving your request.
Before investing in any Oakmark Fund, you should carefully consider the Fund's investment objectives, risks, management fees and other expenses. This and other important information is contained in the Funds' prospectus and a Fund's summary prospectus. Please read the prospectus and summary prospectus carefully before investing. For more information, please visit Oakmark.com or call 1-800-OAKMARK (625-6275).
The discussion of the Funds' investments and investment strategy (including current investment themes, the portfolio managers' research and investment process, and portfolio characteristics) represents the Funds' investments and the views of the portfolio managers and Harris Associates L.P., the Funds' investment adviser, at the time of this report, and are subject to change without notice.
All Oakmark Funds: Investing in value stocks presents the risk that value stocks may fall out of favor with investors and underperform growth stocks during given periods.
Oakmark, Oakmark Equity and Income, Oakmark Global, Oakmark International and Oakmark International Small Cap Funds: The Funds' portfolios tend to be invested in a relatively small number of stocks. As a result, the appreciation or depreciation of any one security held will have a greater impact on the Funds' net asset value than it would if the Funds invest in a larger number of securities. Although that strategy has the potential to generate attractive returns over time, it also increases the Funds' volatility.
Oakmark Select Fund: The stocks of medium-sized companies tend to be more volatile than those of large companies and have underperformed the stocks of small and large companies during some periods.
Because the Oakmark Select and Oakmark Global Select Funds are non-diversified, the performance of each holding will have a greater impact on the Funds' total return, and may make the Fund's returns more volatile than a more diversified fund.
Oakmark Global, Oakmark Global Select, Oakmark International and Oakmark International Small Cap Funds: Investing in foreign securities presents risks which in some ways may be greater than U.S. investments. Those risks include: currency fluctuation; different regulation, accounting standards, trading practices and levels of available information; generally higher transaction costs; and political risks.
The percentages of hedge exposure for each foreign currency are calculated by dividing the market value of all same-currency forward contracts by the market value of the underlying equity exposure to that currency.
The Oakmark Equity and Income Fund invests in medium- and lower-quality debt securities that have higher yield potential but present greater investment and credit risk than higher-quality securities. These risks may result in greater share price volatility.
Oakmark International Small Cap Fund: The stocks of smaller companies often involve more risk than the stocks of larger companies. Stocks of small companies tend to be more volatile and have a smaller public market than stocks of larger companies.
Small companies may have a shorter history of operations than larger companies, may not have as great an ability to raise additional capital and may have a less diversified product line, making them more susceptible to market pressure.
Endnotes:
1. The referenced article may be found using the following web address: www.grahamanddoddsville.net/files/buffett__superinvestors_of_graham_and_doddsville.pdf
2. The quote by Michael Steinhardt is taken from Market Wizards: Interviews with Top Traders by Jack D. Schwager, 2013.
3. The S&P 500 Total Return Index is a market capitalization-weighted index of 500 large-capitalization stocks commonly used to represent the U.S. equity market. All returns reflect reinvested dividends and capital gains distributions. This index is unmanaged and investors cannot invest directly in this index.
4. The Dow Jones Industrial Average is an index that includes only 30 U.S. blue-chip companies. This index is unmanaged and investors cannot invest directly in this index.
5. The Lipper Large Cap Value Fund Index is an equally-weighted index of the largest 30 funds within the large cap value funds investment objective as defined by Lipper Inc. The index is adjusted for the reinvestment of capital gains and income dividends. This index is unmanaged and investors cannot invest directly in this index.
6. Portfolio holdings are subject to change without notice and are not intended as recommendations of individual stocks.
7. The NASDAQ Composite Index is a market-capitalization weighted index of the more than 3,000 common equities listed on the NASDAQ stock exchange. The types of securities in the index include American depositary receipts, common stocks, real estate investment trusts (REITs) and tracking stocks. The index includes all NASDAQ listed stocks that are not derivatives, preferred shares, funds, exchange-traded funds (ETFs) or debentures.
8. The Price-Earnings Ratio ("P/E") is the most common measure of the expensiveness of a stock.
9. The Lipper Multi-Cap Value Fund Index tracks the results of the 30 largest mutual funds in the Lipper Multi-Cap Value Funds category. This index is unmanaged and investors cannot invest directly in this index.
10. The Lipper Balanced Fund Index measures the performance of the 30 largest U.S. balanced funds tracked by Lipper. This index is unmanaged and investors cannot invest directly in this index.
11. The Barclays U.S. Government / Credit Index is a benchmark index made up of the Barclays U.S. Government and U.S. Corporate Bond indices, including U.S. government Treasury and agency securities as well as corporate and Yankee bonds. This index is unmanaged and investors cannot invest directly in this index.
12. The MSCI World Index (Net) is a free float-adjusted, market capitalization weighted index that is designed to measure the equity market performance of developed markets. This benchmark calculates reinvested dividends net of withholding taxes using Luxembourg tax rates. This index is unmanaged and investors cannot invest directly in this index.
Oakmark.com 71
Disclosures and Endnotes (continued)
13. The Lipper Global Fund Index measures the performance of the 30 largest mutual funds that invest in securities throughout the world. This index is unmanaged and investors cannot invest directly in this index.
14. The MSCI World ex U.S. Index (Net) is a free float-adjusted, market capitalization-weighted index that is designed to measure the equity market performance of developed markets, excluding the U.S. This benchmark calculates reinvested dividends net of withholding taxes using Luxembourg tax rates. This index is unmanaged and investors cannot invest directly in this index.
15. The MSCI EAFE (Europe, Australasia, Far East) Index (Net) is a free float-adjusted market capitalization index that is designed to measure the international equity market performance of developed markets, excluding the U.S. & Canada. This benchmark calculates reinvested dividends net of withholding taxes using Luxembourg tax rates. This index is unmanaged and investors cannot invest directly in this index.
16. The Lipper International Fund Index reflects the total return of the 30 largest international equity funds. This index is unmanaged and investors cannot invest directly in this index.
17. The MSCI World ex U.S. Small Cap Index (Net) is a free float-adjusted market capitalization-weighted index that is designed to measure the equity market performance of developed markets, excluding the U.S. The MSCI Small Cap Indices target 40% of the eligible Small Cap universe within each industry group, within each country. MSCI defines the Small Cap universe as all listed securities that have a market capitalization in the range of USD200-1,500 million. This benchmark calculates reinvested dividends net of withholding taxes using Luxembourg tax rates. This index is unmanaged and investors cannot invest directly in this index.
18. The Lipper International Small Cap Fund Index measures the performance of the 10 largest international small-cap funds tracked by Lipper. This index is unmanaged and investors cannot invest directly in this index.
OAKMARK, OAKMARK FUNDS, OAKMARK INTERNATIONAL, and OAKMARK and tree design are trademarks owned or registered by Harris Associates L.P. in the U.S. and/or other countries.
72 OAKMARK FUNDS
Oakmark Funds
Trustees and Officers
Trustees
Allan J. Reich—Chair
Thomas H. Hayden
Christine M. Maki
Laurence C. Morse, Ph. D.
Mindy M. Posoff
Steven S. Rogers
Kristi L. Rowsell
Peter S. Voss
Officers
Kristi L. Rowsell—President and Principal Executive Officer
Anthony P. Coniaris—Executive Vice President
Kevin G. Grant—Executive Vice President
Judson H. Brooks—Vice President
Megan J. Claucherty—Vice President
Richard J. Gorman—Vice President, Chief Compliance
Officer, Anti-Money Laundering Officer and Assistant Secretary
Justin D. Hance—Vice President
David G. Herro—Vice President
M. Colin Hudson—Vice President
John J. Kane—Vice President, Principal Financial Officer,
Treasurer
Chris W. Keller—Vice President
Eric Liu—Vice President
Jason E. Long—Vice President
Michael L. Manelli—Vice President
Clyde S. McGregor—Vice President
Ian J. McPheron—Vice President and Chief Legal Officer
Thomas W. Murray—Vice President
Michael J. Neary—Vice President
William C. Nygren—Vice President
Vineeta D. Raketich—Vice President
Andrew J. Tedeschi—Vice President, Assistant Treasurer
Zachary D. Weber—Vice President
Edward J. Wojciechowski—Vice President
Other Information
Investment Adviser
Harris Associates L.P.
111 S. Wacker Drive
Chicago, Illinois 60606-4319
Transfer Agent
Boston Financial Data Services, Inc.
Quincy, Massachusetts
Legal Counsel
K&L Gates LLP
Washington, D.C.
Independent Registered Public Accounting Firm
Deloitte & Touche LLP
Chicago, Illinois
Contact Us
Please call 1-800-OAKMARK
(1-800-625-6275)
or 617-483-8327
Website
Oakmark.com
Twitter
@HarrisOakmark
To obtain a prospectus, an application or periodic reports, access our website at Oakmark.com, or call 1-800-OAKMARK (625-6275) or (617) 483-8327.
Each Fund will file its complete schedule of portfolio holdings with the Securities and Exchange Commission ("SEC") for the first and third quarters of each fiscal year on Form N-Q. The Funds' Form N-Qs are available on the SEC's website at www.sec.gov. The Funds' Form N-Qs may be reviewed and copied at the SEC's Public Reference Room in Washington, DC, and information on the operation of the Public Reference Room may be obtained by calling 1-800-SEC-0330.
A description of the policies and procedures the Funds use to determine how to vote proxies relating to portfolio securities is available without charge, upon request, by calling toll-free 1-800-625-6275; on the Funds' website at Oakmark.com; and on the SEC's website at www.sec.gov.
No later than August 31 of each year, information regarding how the Adviser, on behalf of the Funds, voted proxies relating to the Funds' portfolio securities for the twelve months ended the preceding June 30 will be available through a link on the Funds' website at Oakmark.com and on the SEC's website at www.sec.gov.
This report is submitted for the general information of the shareholders of the Funds. The report is not authorized for distribution to prospective investors in the Funds unless it is accompanied or preceded by a currently effective prospectus of the Funds.
No sales charge to the shareholder or to the new investor is made in offering the shares of the Funds; however, a shareholder of the Oakmark International Small Cap Fund may incur a 2% redemption fee on an exchange or redemption of shares held for 90 days or less.
Oakmark.com 73


Item 2. Code of Ethics.
Not required in this filing.
Item 3. Audit Committee Financial Expert.
Not required in this filing.
Item 4. Principal Accountant Fees and Services.
Not required in this filing.
Item 5. Audit Committee of Listed Registrants.
Not applicable.
Item 6. Investments.
(a) The Schedule of Investments in securities of unaffiliated issuers as of the close of the reporting period is included as part of the semi-annual report to shareholders filed under Item 1 of this Form.
(b) Not applicable.
Item 7. Disclosure of Proxy Voting Policies and Procedures for Closed-End Management Investment Companies.
Not applicable.
Item 8. Portfolio Managers of Closed-End Management Investment Companies.
Not applicable.
Item 9. Purchases of Equity Securities by Closed-End Management Investment Company and Affiliated Purchasers.
Not applicable.
Item 10. Submission of Matters to a Vote of Security Holders.
During the period covered by this report, no material changes were made to the procedures by which shareholders may recommend nominees to the Registrant’s board of trustees.
Item 11. Controls and Procedures.
(a) Based on an evaluation of the Registrant’s disclosure controls and procedures (as defined in Rule 30a-3(c) under the Investment Company Act of 1940, the “Disclosure Controls”), the Disclosure Controls are effectively designed to ensure that information required to be disclosed by the Registrant in this report is recorded, processed, summarized, and reported within 90 days prior to the filing of this report, including ensuring that information required to be disclosed in this report is accumulated and communicated to the Registrant’s management, including the Registrant’s principal executive officer and principal financial officer, as appropriate to allow timely decisions regarding required disclosure.
(b) There were no changes in the Registrant’s internal controls over financial reporting (as defined in Rule 30a-3(d) under the Investment Company Act of 1940) that occurred during the Registrant’s second fiscal quarter of the time period covered by this report that has materially affected, or is reasonably likely to materially affect, the Registrant’s internal control over financial reporting.
Item 12. Exhibits.
(a)(1) Not required in this filing.
(2) Certifications of Kristi L. Rowsell, Principal Executive Officer, and John J. Kane, Principal Financial Officer, pursuant to Rule 30a-2(a) under the Investment Company Act of 1940 (17 CFR 270.30a-2), attached hereto as Exhibits (a)(2)(i) and (a)(2)(ii).
(3) Not applicable.
(b) Certification of Kristi L. Rowsell, Principal Executive Officer, and John J. Kane, Principal Financial Officer, pursuant to Section 906 of the Sarbanes-Oxley Act of 2002, attached hereto as Exhibit (b).
SIGNATURES
Pursuant to the requirements of the Securities Exchange Act of 1934 and the Investment Company Act of 1940, the Registrant has duly caused this report to be signed on its behalf by the undersigned, thereunto duly authorized.
Harris Associates Investment Trust
By: | /s/ Kristi L. Rowsell | |
| Kristi L. Rowsell | |
| Principal Executive Officer | |
| | |
Date: | May 26, 2017 | |
Pursuant to the requirements of the Securities Exchange Act of 1934 and the Investment Company Act of 1940, this report has been signed below by the following persons on behalf of the Registrant and in the capacities and on the dates indicated.
By: | /s/ Kristi L. Rowsell | |
| Kristi L. Rowsell | |
| Principal Executive Officer | |
| | |
Date: | May 26, 2017 | |
| | |
| | |
By: | /s/ John J. Kane | |
| John J. Kane | |
| Principal Financial Officer | |
| | |
Date: | May 26, 2017 | |