UNITED STATES
SECURITIES AND EXCHANGE COMMISSION
Washington, D.C. 20549
FORM N-CSR
CERTIFIED SHAREHOLDER REPORT OF REGISTERED
MANAGEMENT INVESTMENT COMPANIES
Investment Company Act file number: 811-06241
Loomis Sayles Funds II
(Exact name of Registrant as specified in charter)
888 Boylston Street, Suite 800
Boston, Massachusetts 02199-8197
(Address of principal executive offices) (Zip code)
Russell L. Kane, Esq.
Natixis Distribution, L.P.
888 Boylston Street, Suite 800
Boston, Massachusetts 02199-8197
(Name and address of agent for service)
Registrant’s telephone number, including area code: (617) 449-2822
Date of fiscal year end: December 31
Date of reporting period: December 31, 2020
Item 1. Reports to Stockholders.
The Registrant’s annual report transmitted to shareholders pursuant to Rule 30e-1 under the Investment Company Act of 1940 is as follows:


Annual Report
December 31, 2020
Loomis Sayles High Income Fund
Loomis Sayles Intermediate Municipal Bond Fund
Loomis Sayles International Growth Fund
Loomis Sayles Investment Grade Bond Fund
Loomis Sayles Strategic Alpha Fund
Loomis Sayles Strategic Income Fund
Table of Contents

LOOMIS SAYLES HIGH INCOME FUND
| | |
| |
| Managers | | Symbols |
| |
| Matthew J. Eagan, CFA® | | Class A NEFHX |
| |
| Brian P. Kennedy | | Class C NEHCX |
| |
| Elaine M. Stokes | | Class N LSHNX |
| |
| Todd P. Vandam, CFA® | | Class Y NEHYX |
| |
| Loomis, Sayles & Company, L.P. | | |
Investment Goal
The Fund seeks high current income plus the opportunity for capital appreciation to produce a high total return.
Market Conditions
The financial markets experienced significant volatility in 2020, as investors grappled with the persistent uncertainty surrounding Covid-19. The bulk of the market disruptions occurred in February and March, when world governments first aimed to contain the virus by locking down broad swaths of their economies. Higher-risk assets were hit hard in the ensuing selloff, while demand for “safe-haven” investments surged. The US Federal Reserve (Fed) sought to counter the extraordinary developments by cutting short-term interest rates to zero, reestablishing traditional quantitative easing (QE) through asset purchases in the Treasury and mortgage-backed securities markets, and establishing lending facilities which either have only been used during the Great Financial Crisis or were created for the first time in Fed history, such as the Corporate Credit facility. Aided by the $2.2 trillion stimulus package passed by the US Congress in late March, the Fed’s response fueled an impressive recovery in higher-risk assets from early spring onward. After pausing in the lead-up to the US elections, the rally gained steam in November thanks to the long-awaited headline that coronavirus vaccines would soon become available to the public. The markets took this as an indication that economic conditions could gradually return to normal in 2021, boosting sentiment into year-end.
US Treasurys were the primary beneficiaries of the first-quarter “flight to quality” and the Fed’s subsequent commitment to maintain its low-rate monetary policy indefinitely. Twelve-month returns were progressively higher along the yield curve (a curve that shows the relationship among bond yields across the maturity spectrum), with 30-year issues generating the largest gain.
Although investment-grade corporate bonds suffered a sharp downturn in the February-March selloff, the category finished as the top performing major segment of the fixed income market for the full, 12-month period. Corporates benefited from the gradual improvement in the credit outlook throughout the course of the year, together with rising demand for high-quality alternatives to low-yielding government debt.
High-yield bonds also delivered positive returns, although they were unable to keep pace with investment-grade corporates. The category was supported by hopes for an economic recovery and reduced investor risk aversion. Lower-quality debt was generally harder hit in the February-March downturn due low market liquidity, tempering its return for the full year. Nevertheless, yield spreads — the difference between yields on below investment-grade debt and Treasurys of similar maturities — finished the year close to where they stood in February prior to the selloff associated with Covid-19.
Securitized assets — including mortgage-backed securities (MBS), asset-backed securities (ABS), and commercial mortgage-backed securities (CMBS) — posted positive total returns but failed to keep pace with the broader US bond market. CMBS was the strongest performer in this segment despite concerns about the outlook for commercial real estate in the wake of the pandemic.
Performance Results
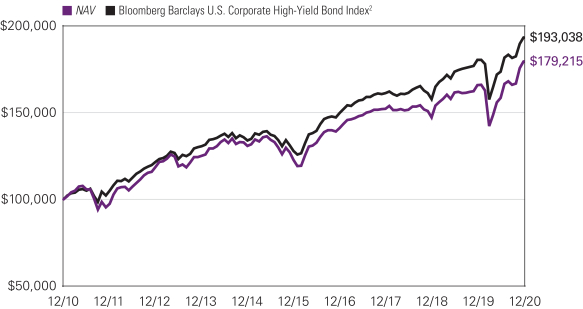
For the 12 months ended December 31, 2020, Class Y shares of the Loomis Sayles High Income Fund returned 8.19% at net asset value. The Fund outperformed its benchmark, the Bloomberg Barclays U.S. Corporate High-Yield Bond Index, which returned 7.11%.
Explanation of Fund Performance
The remarkable events of 2020 were dominated by the volatility created by the Covid-19 global pandemic. Fueled by extraordinary monetary and fiscal stimulus, markets came roaring back after a sharp selloff during the first quarter of the year, and continued to reach new highs as lockdowns eased and vaccine development progressed. This positive momentum was maintained throughout the final quarter of 2020 as a Covid vaccine was approved and distribution began. Security selection was the primary source of the Fund’s outperformance for the 12-month period. High yield and investment grade corporate credit positions were the largest positive contributors to relative return, aided by consumer cyclical and energy holdings. Exposures to the communications sector within high yield and capital goods sector within investment grade credit were also beneficial for performance.
An allocation to securitized assets detracted as this sector did not keep pace with high yield credit. Within convertible securities, selected energy and consumer non-cyclical holdings weighed on return.
1 |
Outlook
Looking ahead to the upcoming year, there are a number of structural economic factors in place that pose risks to our market outlook, including the ongoing impact of the pandemic, further delay in reaching a fiscal package and any resurgence of trade tensions between the US and China. That said, we are optimistic that economic conditions could continue to show improvement over the next year. This view is reflected in current market prices and appears to be shared by the consensus.
While the recent rise in coronavirus cases has led to renewed containment measures across the US, the likelihood of a vaccine has been priced into markets along with expectations for a fiscal package to arrive in the first quarter of the year. These measures help give us some confidence that the economic recovery could continue to show steady, if uneven, progress. GDP growth rebounded from the steep declines last year and we expect this trend to continue into 2021.
We anticipate limited changes in monetary policy, with the Fed likely maintaining its zero interest rate policy until at least 2023. The Fed has also indicated that full employment and longer-term inflation averages are additional factors in considering any future rate hikes. This accommodative stance should continue to boost investor confidence and demand for yield in a low global rate environment. In addition, we believe the overall health of the consumer, strong housing market and expected inventory rebuilding provide support to our outlook.
The credit markets have been progressing through the cycle,1 and we believe there are increasing signs of a shift towards recovery with corporate profits rebounding, easy monetary policy, balance sheet improvement and potential for large-scale vaccine distribution.
We have been maintaining a balance of liquidity, diversification and risk exposure in our portfolios. Within our credit allocation, we continue to focus on areas where we still see value based on our fundamental research. We are specifically focused on some of the sectors that were hardest hit by the pandemic including the transportation, recreational and hospitality industries. These areas of the economy include credits that have been cheap for their rating, have been able to access the capital markets for liquidity and are likely in a good position to benefit from the recovery.
Despite the higher valuations, we believe there are still selective opportunities in both the investment grade and high yield corporate sectors. Spreads have compressed but can potentially tighten further on improving fundamentals. We are selectively adding corporate credit, particularly in areas of the market that have lagged the recovery.
Our emerging market allocation largely represents US dollar-pay exposure to high quality securities with strong balance sheets and currently attractive real yields. We are holding little foreign currency but continue to evaluate opportunities in markets outside the US as we look for clarity on the outlook for global growth.
Market conditions in the past year have highlighted the notion that investors tend to overreact. The speed and severity of the recession and subsequent sharp rebound were unexpected, but also presented some favorable investment opportunities. These developments have served to reinforce our investment philosophy that markets are highly inefficient in the short term. We believe that we were able to capitalize on these developments in 2020 and that our portfolios are well-positioned to benefit from the expected economic growth and recovery in the new year.
| 1 | A credit cycle is a cyclical pattern that follows credit availability and corporate health. |
| 2
LOOMIS SAYLES HIGH INCOME FUND
Hypothetical Growth of $100,000 Investment in Class Y Shares3
December 31, 2010 through December 31, 2020
Average Annual Total Returns — December 31, 20203
| | | | | | | | | | | | | | | | | | | | | | | | |
| | | | | | |
| | | | | | | | | | | | | | | Express Ratios4 | |
| | | | | | | |
| | | 1 Year | | | 5 Years | | | 10 Years | | | Life of Class N | | | Gross | | | Net | |
| | | | | | | |
| Class Y (Inception 2/29/08) | | | | | | | | | | | | | | | | | | | | | | | | |
| NAV | | | 8.19 | % | | | 7.88 | % | | | 6.00 | % | | | — | % | | | 0.93 | % | | | 0.75 | % |
| | | | | | | |
| Class A (Inception 2/22/84) | | | | | | | | | | | | | | | | | | | | | | | | |
| NAV | | | 8.16 | | | | 7.59 | | | | 5.72 | | | | — | | | | 1.18 | | | | 1.00 | |
| With 4.25% Maximum Sales Charge | | | 3.53 | | | | 6.65 | | | | 5.27 | | | | — | | | | | | | | | |
| | | | | | | |
| Class C (Inception 3/2/98) | | | | | | | | | | | | | | | | | | | | | | | | |
| NAV | | | 7.30 | | | | 6.80 | | | | 4.96 | | | | — | | | | 1.93 | | | | 1.75 | |
| With CDSC1 | | | 6.30 | | | | 6.80 | | | | 4.96 | | | | — | | | | | | | | | |
| | | | | | | |
| Class N (Inception 11/30/16) | | | | | | | | | | | | | | | | | | | | | | | | |
| NAV | | | 8.48 | 5 | | | — | | | | — | | | | 6.49 | | | | 0.82 | | | | 0.70 | |
| | | | | | | |
| Comparative Performance | | | | | | | | | | | | | | | | | | | | | | | | |
| Bloomberg Barclays U.S. Corporate High-Yield Bond Index2 | | | 7.11 | | | | 8.59 | | | | 6.80 | | | | 6.86 | | | | | | | | | |
Performance data shown represents past performance and is no guarantee of, and not necessarily indicative of, future results. Total return and value will vary, and you may have a gain or loss when shares are sold. Current performance may be lower or higher than quoted. For most recent month-end performance, visit im.natixis.com/performance. Performance for other share classes will be greater or less than shown based on differences in fees and sales charges. You may not invest directly in an index. Performance for periods less than one year is cumulative, not annualized. Returns reflect changes in share price and reinvestment of dividends and capital gains, if any. The table(s) do not reflect taxes shareholders might owe on any fund distributions or when they redeem their shares.
| 1 | Class C shares performance assumes a 1% CDSC applied when you sell shares within one year of purchase. |
| 2 | The Bloomberg Barclays U.S. Corporate High-Yield Bond Index measures the market of USD-denominated, non-investment grade, fixed-rate, taxable corporate bonds. Securities are classified as high yield if the middle rating of Moody’s, Fitch, and S&P is Ba1/BB+/BB+ or below, excluding emerging market debt. The Bloomberg Barclays U.S. Corporate High-Yield Bond Index was created in 1986, with history backfilled to July 1, 1983, and rolls up into the Bloomberg Barclays U.S. Universal and Global High-Yield Indices. |
| 3 | Fund performance has been increased by fee waivers and/or expense reimbursements, if any, without which performance would have been lower. |
| 4 | Expense ratios are as shown in the Fund’s prospectus in effect as of the date of this report. The expense ratios for the current reporting period can be found in the Financial Highlights section of this report under Ratios to Average Net Assets. Net expenses reflect contractual expense limitations set to expire on 4/30/21. When a Fund’s expenses are below the limitation, gross and net expense ratios will be the same. See Note 6 of the Notes to Financial Statements for more information about the Fund’s expense limitations. |
| 5 | Generally accepted accounting principles require adjustments to be made to the net assets of the Fund for financial reporting purposes only, and as such, the total returns reflected above are different from the total returns reported in the financial highlights. The returns presented in the table above are what an investor would have actually experienced. |
3 |
LOOMIS SAYLES INTERMEDIATE MUNICIPAL BOND FUND
| | |
| |
| Managers | | Symbols |
| |
| Dawn Mangerson | | Class A MIMAX |
| |
| James Grabovac, CFA® | | Class C MIMCX |
| |
| Lawrence Jones | | Class Y MIMYX |
| |
| Loomis, Sayles & Company, L.P. | | |
Investment Goal
The Fund seeks a high level of federal tax-exempt current income, consistent with the preservation of capital.
Market Conditions
Capital markets concluded a tumultuous year producing positive returns across most asset classes. High-grade municipal yields declined between 70 and 90 basis points, with the largest declines occurring on the shorter end of the yield curve. The pandemic-induced market panic that occurred in March proved short-lived as a rapid and massive easing of monetary policy, combined with multiple rounds of fiscal relief, provided the medicine markets required to gain a foothold from the liquidity panic. Markets subsequently began their climb higher as the year progressed. Lower quality sectors of the municipal market underperformed higher quality, as participants weighed the continued impact of a deep recession caused by the necessity of shutting down large segments of the US and global economies. Recent economic improvement coincident with the approval and rollout of vaccines has increased optimism that the recession will end in 2021 and the path toward recovery will open. However, significant hurdles remain for large segments of the economy, and whether the severity of the pandemic will result in long-term or permanent changes in behavior continues to weigh on many sectors, including real estate related, mass transit, senior care and air travel, to note several. In addition, the disruption and dislocation in K-12 and higher education has been sharp, although federal aid has provided important support. Questions remain, however, about the evolution of the education sector and whether the steady expansion of higher education, in particular, has reached a secular peak in the US.
Performance Results
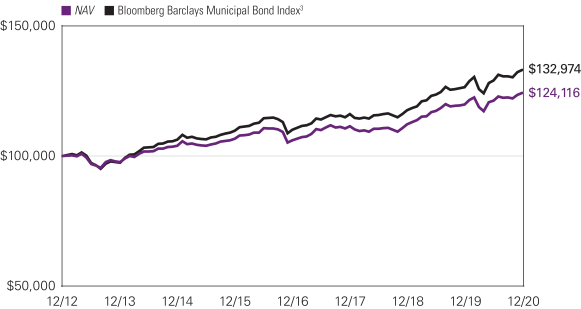
For the 12 months ended December 31, 2020, Class Y shares of the Loomis Sayles Intermediate Municipal Bond Fund returned 3.63% at net asset value. The Fund underperformed its benchmark, the Bloomberg Barclays Municipal Bond Index, which returned 5.21%.
Explanation of Fund Performance
Although the Fund produced a meaningfully positive return for the year, it underperformed its benchmark primarily due to yield curve posture, more specifically a 10.5% underweight to the longest portion of the yield curve (22 years and plus), which produced the greatest returns for the period. Additionally, overweight exposures to the higher education and hospital sectors hampered performance as spreads widened, while outperformance of the Fund’s allocations to the local general obligation, leasing and special tax sectors was additive to performance. Furthermore, underperformance in the Fund’s BBB-rated credits was a significant detractor from performance. With respect to state allocations, fund positioning in two of the largest states in the benchmark, California and New York, contributed positively; however, overall state exposure was a drag on performance.
Outlook
The economy and the markets withstood significant damage in the early stages of the pandemic and required unprecedented support from fiscal and monetary policymakers. The Federal Reserve has communicated clearly its intention to continue to keep the policy rate near the zero lower bound at least through this year and likely beyond. Sustaining an economic recovery is also expected to require continuing fiscal relief while the rollout of the vaccines continues and accelerates. We anticipate the new administration will attempt to bring both additional aid for state and local governments and an infrastructure package. We are hopeful that wide distribution of the vaccine alongside continued fiscal and monetary support will provide a glide path toward economic recovery. While we do not anticipate a significant rise in long-term interest rates, there could be modest upward pressure as the economic environment improves. Somewhat higher yields and an increase in municipal supply resulting from an infrastructure package would be welcome developments for municipal investors who have faced constrained supply and record low yields for most of the past year. Municipal investor appetite remains strong and we anticipate the market could absorb any increase in supply.
| 4
LOOMIS SAYLES INTERMEDIATE MUNICIPAL BOND FUND
Hypothetical Growth of $100,000 Investment in Class Y Shares1,4
December 31, 2012 (inception) through December 31, 2020
Average Annual Total Returns — December 31, 20204
| | | | | | | | | | | | | | | | | | | | |
| | | | | |
| | | | | | | | | | | | Expense Ratios5 | |
| | | | | | |
| | | 1 Year | | | 5 Years | | | Life of Fund | | | Gross | | | Net | |
| | | | | | |
| Class Y (Inception 12/31/12)1 | | | | | | | | | | | | | | | | | | | | |
| NAV | | | 3.63 | % | | | 3.08 | % | | | 2.74 | % | | | 1.61 | % | | | 0.46 | % |
| | | | | | |
| Class A (Inception 12/31/12)1 | | | | | | | | | | | | | | | | | | | | |
| NAV | | | 3.48 | | | | 2.83 | | | | 2.46 | | | | 1.85 | | | | 0.71 | |
| With 3.00% Maximum Sales Charge | | | 0.38 | | | | 2.21 | | | | 2.06 | | | | | | | | | |
| | | | | | |
| Class C (Inception 12/31/12)1 | | | | | | | | | | | | | | | | | | | | |
| NAV | | | 2.71 | | | | 2.06 | | | | 1.70 | | | | 2.61 | | | | 1.46 | |
| With CDSC2 | | | 1.71 | | | | 2.06 | | | | 1.70 | | | | | | | | | |
| | | | | | |
| Comparative Performance | | | | | | | | | | | | | | | | | | | | |
| Bloomberg Barclays Municipal Bond Index3 | | | 5.21 | | | | 3.91 | | | | 3.61 | | | | | | | | | |
Performance data shown represents past performance and is no guarantee of, and not necessarily indicative of, future results. Total return and value will vary, and you may have a gain or loss when shares are sold. Current performance may be lower or higher than quoted. For most recent month-end performance, visit im.natixis.com/performance. Performance for other share classes will be greater or less than shown based on differences in fees and sales charges. You may not invest directly in an index. Performance for periods less than one year is cumulative, not annualized. Returns reflect changes in share price and reinvestment of dividends and capital gains, if any. The table(s) do not reflect taxes shareholders might owe on any fund distributions or when they redeem their shares.
| 1 | December 31, 2012 represents the date shares were first registered for public sale under the Securities Act of 1933. November 16, 2012 represents commencement of operations for accounting and financial reporting purposes only. |
| 2 | Performance for Class C shares assumes a 1.00% contingent deferred sales charge (“CDSC”) applied when you sell shares within one year of purchase. |
| 3 | Bloomberg Barclays Municipal Bond Index is a market value-weighted index of investment-grade municipal bonds with maturities of one year or more. |
| 4 | Fund performance has been increased by fee waivers and/or expense reimbursements, if any, without which performance would have been lower. |
| 5 | Expense ratios are as shown in the Fund’s prospectus in effect as of the date of this report. The expense ratios for the current reporting period can be found in the Financial Highlights section of this report under Ratios to Average Net Assets. Net expenses reflect contractual expense limitations set to expire on 4/30/21. When a Fund’s expenses are below the limitation, gross and net expense ratios will be the same. See Note 6 of the Notes to Financial Statements for more information about the Fund’s expense limitations. |
5 |
LOOMIS SAYLES INTERNATIONAL GROWTH FUND
| | | | |
| | |
| Managers | | Symbols | | |
| | |
| Aziz V. Hamzaogullari, CFA® | | Class A | | LIGGX |
| | |
| Loomis, Sayles & Company, L.P. | | Class C | | LIGCX |
| | |
| | Class N | | LIGNX |
| | |
| | Class Y | | LIGYX |
Investment Goal
The Fund’s investment goal is long-term growth of capital.
Market Conditions
International equities moved modestly higher in the abbreviated reporting period that ran from December 15, 2020 to December 31, 2020. The market entered the period on a high note, having rallied significantly over the prior six weeks following the approval of a vaccine for Covid-19. The conclusion of the U.S. election provided a further boost to the markets in this time, as did the ongoing commitment of the world’s central banks to maintain their ultra-accommodative monetary policies indefinitely. The pace of the rally slowed in the final two weeks of the year, as investors paused to digest the previous gains and trading activity decelerated around the holidays. In addition, a number of European countries began to re-institute lockdown measures to combat rising cases of the coronavirus. The tone in the markets remained fairly positive, however, partially as a result of the passage of a long-awaited fiscal stimulus package in the United States. The upbeat close to the year allowed the major international indices to finish 2020 with double-digit Q4 returns despite the dramatic first-quarter selloff caused by Covid-19.
Performance Results
The Loomis Sayles International Growth Fund was launched on December 15, 2020. For the period ending December 31, 2020, Class Y shares of the Fund returned 1.38% at net asset value. The Fund underperformed its benchmark, the MSCI All Country World Index Ex USA Index, which returned 2.57%.
Explanation of Fund Performance
We are an active manager with a long-term, private equity approach to investing. Through our proprietary bottom-up research framework, we look to invest in those few high-quality businesses with sustainable competitive advantages and profitable growth when they trade at a significant discount to intrinsic value. Given the rare confluence of quality, growth, and valuation, we may study dozens of companies but may only invest in a select few businesses each year. We believe identifying those few businesses with these characteristics is an art, not a science. As a result of this rigorous approach, ours is a selective, high-conviction portfolio of typically 30-45 securities.
During the brief period, the Fund’s positions in Baidu, Vipshop, and Kweichow Moutai contributed the most to performance. Stock selection in the communication services and consumer staples sectors, as well as our allocation in the energy sector, contributed positively to relative performance. The Fund’s positions in Alibaba, Tencent, and Sodexo detracted the most from performance. Stock selection in the consumer discretionary and information technology sectors were the biggest detractors from relative performance.
Outlook
Our investment process is characterized by bottom-up fundamental research and a long-term investment time horizon. The nature of the process leads to a lower-turnover portfolio in which sector positioning is the result of stock selection. The Fund ended the year with overweight positions in the consumer staples, consumer discretionary, healthcare, communication services, and information technology sectors and was underweight in the industrials and energy sectors. We had no exposure to stocks in the financials, materials, utilities or real estate sectors. From a geographic standpoint we were overweight in emerging markets and North America and underweight in developed Asia and Europe. We remain committed to our long-term investment approach to invest in those few high-quality businesses with sustainable competitive advantages and profitable growth when they trade at a significant discount to intrinsic value.
| 6
LOOMIS SAYLES INTERNATIONAL GROWTH FUND
Top Ten Holdings as of December 31, 2020
| | | | | | | | |
| | |
| Security Name | | % of
Assets | |
| | 1 | | | MercadoLibre, Inc. | | | 7.69 | % |
| | 2 | | | Tencent Holdings Ltd. | | | 6.62 | |
| | 3 | | | Alibaba Group Holding Ltd., Sponsored ADR | | | 5.61 | |
| | 4 | | | Roche Holding AG | | | 5.51 | |
| | 5 | | | Novartis AG, (Registered) | | | 4.94 | |
| | 6 | | | Adyen NV | | | 4.89 | |
| | 7 | | | Kweichow Moutai Co. Ltd., Class A | | | 4.44 | |
| | 8 | | | FANUC Corp. | | | 4.22 | |
| | 9 | | | Ambev S.A., ADR | | | 3.90 | |
| | 10 | | | Baidu, Inc., Sponsored ADR | | | 3.65 | |
The portfolio is actively managed and holdings are subject to change. There is no guarantee the Fund continues to invest in the securities referenced. The holdings listed exclude any temporary cash investments.
Total Returns — December 31, 20203
| | | | | | | | | | | | |
| | | |
| | | | | | Expense Ratios4 | |
| | | | |
| | | Life of Fund | | | Gross | | | Net | |
| | | | |
| Class Y (Inception 12/15/20) | | | | | | | | | | | | |
| NAV | | | 1.38 | % | | | 22.50 | % | | | 0.95 | % |
| | | | |
| Class A (Inception 12/15/20) | | | | | | | | | | | | |
| NAV | | | 1.37 | | | | 22.75 | | | | 1.20 | |
| With 5.75% Maximum Sales Charge | | | -4.46 | | | | | | | | | |
| | | | |
| Class C (Inception 12/15/20) | | | | | | | | | | | | |
| NAV | | | 1.33 | | | | 23.50 | | | | 1.95 | |
| With CDSC1 | | | 0.33 | | | | | | | | | |
| | | | |
| Class N (Inception 12/15/20) | | | | | | | | | | | | |
| NAV | | | 1.38 | | | | 4.02 | | | | 0.90 | |
| | | | |
| Comparative Performance | | | | | | | | | | | | |
| MSCI ACWI ex USA Index2 | | | 2.39 | | | | | | | | | |
Performance data shown represents past performance and is no guarantee of, and not necessarily indicative of, future results. Total return and value will vary, and you may have a gain or loss when shares are sold. Current performance may be lower or higher than quoted. For most recent month-end performance, visit im.natixis.com. Performance for other share classes will be greater or less than shown based on differences in fees and sales charges. You may not invest directly in an index. Performance for periods less than one year is cumulative, not annualized. Returns reflect changes in share price and reinvestment of dividends and capital gains, if any. The table(s) do not reflect taxes shareholders might owe on any fund distributions or when they redeem their shares.
| 1 | Performance for Class C shares assumes a 1% contingent deferred sales charge (“CDSC”) applied when you sell shares within one year of purchase. |
| 2 | The MSCI ACWI ex USA Index captures large and mid cap representation across 22 of 23 Developed Markets (DM) countries (excluding the US) and 27 Emerging Markets (EM) countries. With 2,361 constituents, the index covers approximately 85% of the global equity opportunity set outside the US. |
| 3 | Fund performance has been increased by fee waivers and/or expense reimbursements, if any, without which performance would have been lower. |
| 4 | Expense ratios are as shown in the Fund’s prospectus in effect as of the date of this report. The expense ratios for the current reporting period can be found in the Financial Highlights section of this report under Ratios to Average Net Assets. Net expenses reflect contractual expense limitations set to expire on 4/30/22. When a Fund’s expenses are below the limitation, gross and net expense ratios will be the same. See Note 6 of the Notes to Financial Statements for more information about the Fund’s expense limitations. |
7 |
LOOMIS SAYLES INVESTMENT GRADE BOND FUND
| | | | |
| | |
| Managers | | Symbols | | |
| | |
| Matthew J. Eagan, CFA® | | Class A | | LIGRX |
| | |
| Brian P. Kennedy | | Class C | | LGBCX |
| | |
| Elaine M. Stokes | | Class N | | LGBNX |
| | |
| Loomis, Sayles & Company, L.P. | | Class Y | | LSIIX |
| | |
| | Admin Class | | LIGAX |
Investment Goal
The Fund seeks high total investment return through a combination of current income and capital appreciation.
Market Conditions
The financial markets experienced significant volatility in 2020, as investors grappled with the persistent uncertainty surrounding Covid-19. The bulk of the market disruptions occurred in February and March, when world governments first aimed to contain the virus by locking down broad swaths of their economies. Higher-risk assets were hit hard in the ensuing selloff, while demand for “safe-haven” investments surged. The US Federal Reserve (Fed) sought to counter the extraordinary developments by cutting short-term interest rates to zero, reestablishing traditional quantitative easing (QE) through asset purchases in the Treasury and mortgage-backed securities markets, and establishing lending facilities which either have only been used during the Great Financial Crisisor were created for the first time in Fed history, such as the Corporate Credit facility. Aided by the $2.2 trillion stimulus package passed by the US Congress in late March, the Fed’s response fueled an impressive recovery in higher-risk assets from early spring onward. After pausing in the lead-up to the US elections, the rally gained steam in November thanks to the long-awaited headline that coronavirus vaccines would soon become available to the public. The markets took this as an indication that economic conditions could gradually return to normal in 2021, boosting sentiment into year-end.
US Treasurys were the primary beneficiaries of the first-quarter “flight to quality” and the Fed’s subsequent commitment to maintain its low-rate monetary policy indefinitely. Twelve-month returns were progressively higher along the yield curve (a curve that shows the relationship among bond yields across the maturity spectrum), with 30-year issues generating the largest gain.
Although investment-grade corporate bonds suffered a sharp downturn in the February-March selloff, the category finished as the top performing major segment of the fixed income market for the full, 12-month period. Corporates benefited from the gradual improvement in the credit outlook throughout the course of the year, together with rising demand for high-quality alternatives to low-yielding government debt.
High-yield bonds also delivered positive returns, although they were unable to keep pace with investment-grade corporates. The category was supported by hopes for an economic recovery and reduced investor risk aversion. Lower-quality debt was generally harder hit in the February-March downturn due low market liquidity, tempering its return for the full year. Nevertheless, yield spreads — the difference between yields on below investment-grade debt and Treasurys of similar maturities — finished the year close to where they stood in February prior to the selloff associated with Covid-19.
Securitized assets — including mortgage-backed securities (MBS), asset-backed securities (ABS), and commercial mortgage-backed securities (CMBS) — posted positive total returns but failed to keep pace with the broader US bond market. CMBS was the strongest performer in this segment despite concerns about the outlook for commercial real estate in the wake of the pandemic.
Performance Results
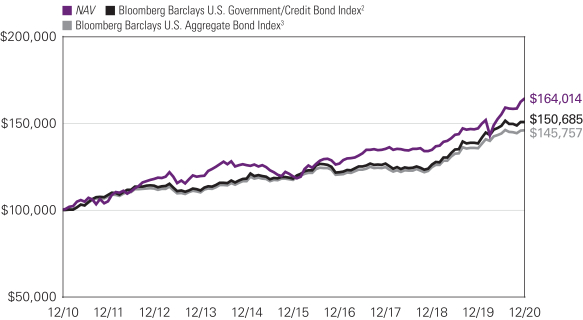
For the 12 months ended December 31, 2020, Class Y shares of the Loomis Sayles Investment Grade Bond Fund returned 11.68% at net asset value. The Fund outperformed its benchmark, the Bloomberg Barclays U.S. Government/Credit Bond Index, which returned 8.93%. The Fund also outperformed its secondary benchmark, the Bloomberg Barclays U.S. Aggregate Bond Index, which returned 7.51%.
Explanation of Fund Performance
The remarkable events of 2020 were dominated by the volatility created by the Covid-19 global pandemic. Fueled by extraordinary monetary and fiscal stimulus, markets came roaring back after a sharp selloff during the first quarter of the year, and continued to reach new highs as lockdowns eased and vaccine development progressed. This positive momentum was maintained throughout the final quarter of 2020 as a Covid vaccine was approved and distribution began. Security selection was the primary source of the Fund’s outperformance for the 12-month period. The Fund’s exposure to investment grade corporate credit was the largest contributor to relative return, aided by banking, communications and consumer non-cyclical holdings. An allocation to high yield corporate credit, particularly within the basic industry and energy sectors, was positive for performance as well. An underweight to US Treasuries was also beneficial as investors favored riskier asset classes given the improving economic outlook.
Exposure to securitized assets and defensive, reserve-like positions detracted as these did not keep pace with corporate credit.
| 8
LOOMIS SAYLES INVESTMENT GRADE BOND FUND
Outlook
Looking ahead to the upcoming year, there are a number of structural economic factors in place that pose risks to our market outlook, including the ongoing impact of the pandemic, further delay in reaching a fiscal package and any resurgence of trade tensions between the US and China. That said, we are optimistic that economic conditions could continue to show improvement over the next year. This view is reflected in current market prices and appears to be shared by the consensus.
While the recent rise in coronavirus cases has led to renewed containment measures across the US, the likelihood of a vaccine has been priced into markets along with expectations for a fiscal package to arrive in the first quarter of the year. These measures help give us some confidence that the economic recovery could continue to show steady, if uneven, progress. GDP growth rebounded from the steep declines last year and we expect this trend to continue into 2021.
We anticipate limited changes in monetary policy, with the Fed likely maintaining its zero interest rate policy until at least 2023. The Fed has also indicated that full employment and longer-term inflation averages are additional factors in considering any future rate hikes. This accommodative stance should continue to boost investor confidence and demand for yield in a low global rate environment. In addition, we believe the overall health of the consumer, strong housing market and expected inventory rebuilding provide support to our outlook.
The credit markets have been progressing through the cycle,1 and we believe there are increasing signs of a shift towards recovery with corporate profits rebounding, easy monetary policy, balance sheet improvement and potential for large-scale vaccine distribution.
We have been maintaining a balance of liquidity, diversification and risk exposure in our portfolios. Within our credit allocation, we continue to focus on areas where we still see value based on our fundamental research. We are specifically focused on some of the sectors that were hardest hit by the pandemic including the transportation, recreational and hospitality industries. These areas of the economy include credits that have been cheap for their rating, have been able to access the capital markets for liquidity and are likely in a good position to benefit from the recovery.
Despite the higher valuations, we believe there are still selective opportunities in both the investment grade and high yield corporate sectors. Spreads have compressed but can potentially tighten further on improving fundamentals. We are selectively adding corporate credit, particularly in areas of the market that have lagged the recovery.
Our emerging market allocation largely represents US dollar-pay exposure to high quality securities with strong balance sheets and currently attractive real yields. We are holding little foreign currency but continue to evaluate opportunities in markets outside the US as we look for clarity on the outlook for global growth.
Market conditions in the past year have highlighted the notion that investors tend to overreact. The speed and severity of the recession and subsequent sharp rebound were unexpected, but also presented some favorable investment opportunities. These developments have served to reinforce our investment philosophy that markets are highly inefficient in the short term. We believe that we were able to capitalize on these developments in 2020 and that our portfolios are well-positioned to benefit from the expected economic growth and recovery in the new year.
| 1 | A credit cycle is a cyclical pattern that follows credit availability and corporate health. |
9 |
LOOMIS SAYLES INVESTMENT GRADE BOND FUND
Hypothetical Growth of $100,000 Investment in Class Y Shares4
December 31, 2010 through December 31, 2020
Average Annual Total Returns — December 31, 20204
| | | | | | | | | | | | | | | | | | | | | | | | |
| | | | | | |
| | | | | | | | | | | | | | | Expense Ratios5 | |
| | | | | | | |
| | | 1 Year | | | 5 Years | | | 10 Years | | | Life of Class N | | | Gross | | | Net | |
| | | | | | | |
| Class Y (Inception 12/31/96) | | | | | | | | | | | | | | | | | | | | | | | | |
| NAV | | | 11.68 | % | | | 6.57 | % | | | 5.07 | % | | | — | % | | | 0.56 | % | | | 0.50 | % |
| | | | | | | |
| Class A (Inception 12/31/96) | | | | | | | | | | | | | | | | | | |
| NAV | | | 11.41 | | | | 6.31 | | | | 4.80 | | | | — | | | | 0.81 | | | | 0.75 | |
| With 4.25% Maximum Sales Charge | | | 6.70 | | | | 5.39 | | | | 4.35 | | | | — | | | | | | | | | |
| | | | | | | |
| Class C (Inception 9/12/03) | | | | | | | | | | | | | | | | | | | | | | | | |
| NAV | | | 10.61 | | | | 5.52 | | | | 4.02 | | | | — | | | | 1.56 | | | | 1.50 | |
| With CDSC1 | | | 9.61 | | | | 5.52 | | | | 4.02 | | | | — | | | | | | | | | |
| | | | | | | |
| Class N (Inception 2/1/13) | | | | | | | | | | | | | | | | | | | | | | | | |
| NAV | | | 11.74 | | | | 6.65 | | | | — | | | | 4.24 | | | | 0.47 | | | | 0.45 | |
| | | | | | | |
| Admin Class (Inception 2/1/10) | | | | | | | | | | | | | | | | | | | | | | | | |
| NAV | | | 11.17 | | | | 6.07 | | | | 4.56 | | | | — | | | | 1.06 | | | | 1.00 | |
| | | | | | | |
| Comparative Performance | | | | | | | | | | | | | | | | | | | | | | | | |
| Bloomberg Barclays U.S. Government/Credit Bond Index2 | | | 8.93 | | | | 4.98 | | | | 4.19 | | | | 3.70 | | | | | | | | | |
| Bloomberg Barclays U.S. Aggregate Bond Index3 | | | 7.51 | | | | 4.44 | | | | 3.84 | | | | 3.43 | | | | | | | | | |
Performance data shown represents past performance and is no guarantee of, and not necessarily indicative of, future results. Total return and value will vary, and you may have a gain or loss when shares are sold. Current performance may be lower or higher than quoted. For most recent month-end performance, visit im.natixis.com. Performance for other share classes will be greater or less than shown based on differences in fees and sales charges. You may not invest directly in an index. Performance for periods less than one year is cumulative, not annualized. Returns reflect changes in share price and reinvestment of dividends and capital gains, if any. The table(s) do not reflect taxes shareholders might owe on any fund distributions or when they redeem their shares.
| 1 | Performance for Class C shares assumes a 1% contingent deferred sales charge (“CDSC”) applied when you sell shares within one year of purchase. |
| 2 | The Bloomberg Barclays U.S. Government/Credit Bond Index is the non-securitized component of the U.S. Aggregate Index and was the first macro index launched by Barclays Capital. The U.S. Government/Credit Bond Index includes investment grade, US dollar denominated, fixed rate Treasuries (i.e., public obligations of the U.S. Treasury that have remaining maturities of more than one year), government-related issues (i.e., agency, sovereign, supranational, and local authority debt), and corporate securities. The U.S. Government/Credit Index was launched on January 1, 1979, with index history backfilled to 1973, and is a subset of the Bloomberg Barclays U.S. Aggregate Index. |
| 3 | The Bloomberg Barclays U.S. Aggregate Bond Index is a broad based index that covers the U.S.-dollar-denominated, investment-grade, fixed-rate, taxable bond market of SEC-registered securities. The index includes bonds from the U.S. Treasury, government-related, corporate, mortgage-backed securities, asset-backed securities, and collateralized mortgage-backed securities sectors. |
| 4 | Fund performance has been increased by fee waivers and/or expense reimbursements, if any, without which performance would have been lower. |
| 5 | Expense ratios are as shown in the Fund’s prospectus in effect as of the date of this report. The expense ratios for the current reporting period can be found in the Financial Highlights section of this report under Ratios to Average Net Assets. Net expenses reflect contractual expense limitations set to expire on 4/30/22. When a Fund’s expenses are below the limitation, gross and net expense ratios will be the same. See Note 6 of the Notes to Financial Statements for more information about the Fund’s expense limitations. |
| 10
LOOMIS SAYLES STRATEGIC ALPHA FUND
| | |
| |
| Managers | | Symbols |
| |
| Matthew J. Eagan, CFA® | | Class A LABAX |
| |
| Kevin P. Kearns* | | Class C LABCX |
| |
| Brian P. Kennedy** | | Class N LASNX |
| |
| Elaine M. Stokes** | | Class Y LASYX |
| |
| Todd P. Vandam, CFA® | | |
| |
| Loomis, Sayles & Company, L.P. | | |
| * | Effective January 8, 2021, Kevin P. Kearns no longer serves as portfolio manager of the Fund. |
| ** | Effective January 8, 2021, Brian P. Kennedy and Elaine M. Stokes will join the portfolio management team of the Fund. |
Investment Goal
The Fund seeks to provide an attractive absolute total return, complemented by prudent investment management designed to manage risks and protect investor capital. The secondary goal of the Fund is to achieve these returns with relatively low volatility.
Market Conditions
Although investment-grade corporate bonds suffered a sharp downturn in the February-March 2020 selloff, the category finished as the top performing major segment of the fixed income market for the full 12-month period. Corporates benefited from the gradual improvement in the credit outlook throughout the course of the year, together with rising demand for high-quality alternatives to low-yielding government debt.
High-yield bonds also delivered positive returns, although they were unable to keep pace with investment-grade corporates. The category was supported by hopes for an economic recovery and reduced investor risk aversion. Lower-quality debt was generally harder hit in the February-March downturn due to low market liquidity, tempering its return for the full year. Nevertheless, yield spreads (the yield differential provided by corporate issues relative to comparable maturity Treasuries) finished the year close to where they stood in February prior to the selloff associated with Covid-19.
Emerging market bonds, while performing poorly in the first quarter, rebounded to finish the year with a solid total return. The asset class was aided by the combination of gradually improving investor sentiment, robust growth in Asia, steadily improving commodity prices, and persistent weakness in the US dollar.
Performance Results
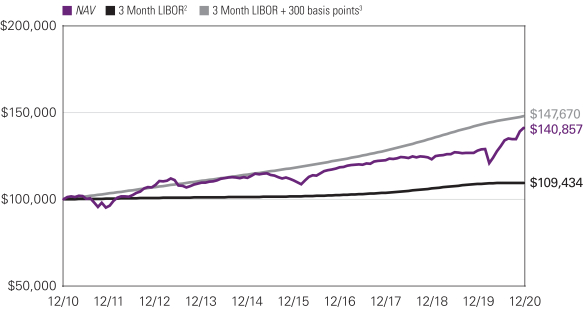
For the 12 months ended December 31, 2020, Class Y shares of the Loomis Sayles Strategic Alpha Fund returned 10.19% at net asset value. The Fund outperformed its benchmark, 3-Month LIBOR, which returned 0.66% for the period. The Fund follows an absolute return strategy and is not managed to an index.
Explanation of Fund Performance
Investment grade corporate credit made the largest positive contribution during the period as spreads narrowed. To support the flow of credit to households and businesses, the Federal Reserve (Fed) will likely continue to purchase Treasury securities. With the coronavirus continuing to spread and disrupt markets, the Fed has taken many additional measures to keep the economy afloat such as buying investment grade corporate bonds with the intent of providing a safety net to corporations and their employees. However, one of President Joe Biden’s campaign promises was to reverse the excesses of the Trump tax cuts for corporations, so whether this impacts the current assistance measures the Fed is providing remains to be seen. Within the portfolio, consumer, banking and communications names in particular were the strongest contributors to returns.
High yield corporate bonds bolstered return during the period. Consumer, communications and finance company names led contributions within the high yield allocation as spreads narrowed. A portion of our high yield exposure was expressed through being long the market with High Yield CDX (credit default swap index), where we took advantage of the relatively strong liquidity profile that this instrument provided during the sharp market correction that occurred in the first quarter of 2020. The position performed well during the rest of the year and contributed positively to the overall performance of the Fund. The use of credit default swap/CDX instruments provided individual name and broad index exposure, and as a result, the ability to access overall credit markets and express an investment view quickly and efficiently. High yield bonds have outperformed stocks during the past few economic recoveries, but that has not happened this time around. As noted, against the backdrop of the coronavirus pandemic the Fed intervened with interest rate cuts, to which high yield bonds responded favorably. During the final quarter of 2020, multiple pharmaceutical and biotech companies confirmed they would soon make a Covid-19 vaccine available (while awaiting FDA approval) and verified effectiveness rates in the 95% range. As
11 |
administration of the initial vaccines to healthcare workers and high risk individuals began, the resulting optimism fueled gains in the high yield bond market during the final quarter of 2020.
Emerging markets contributed to returns for the year with owned-no-guarantee oil securities in Mexico aiding performance the most. Since his inauguration in late 2018, Mexican President Andrés Manuel López Obrador has pledged to restore the dominance of local companies such as Pemex by reviving competition among energy companies and ending reforms that were implemented in 2013. Additionally, with the economy struggling due to the global pandemic, Mexico’s energy companies have worked hard to recover and build a solid future.
Currency positioning weighed on performance during the year as the dollar began 2020 as the world’s strongest currency only to see the coronavirus pandemic rock markets. A long forward position in the Norwegian krone particularly detracted. With the Fed’s extreme policy accommodation since late March the dollar has weakened against most major currencies. The US dollar is expected to continue to weaken in 2021 as Fed policies including historically low interest rates remain intact, the economy continues to repair and President Biden begins his first 100 days in office with less reliance on tariffs against China than his predecessor. The interest rate positioning was done using US Treasury futures, with gross notional exposure averaging approximately 10% of overall market value, to establish a duration underweight, which helped contribute positively to the overall performance of the Fund.
Our minimal allocation to bank loans hurt performance in 2020 with the energy sub-sector as the largest detractor. It should be noted that energy lending includes a wide range of financing activities with examples including oil and gas reserves, solar financing, solar farm financing, wind capital, wind farm financing, renewable and sustainable energy financing and biomass fuels financing. Furthermore, the Fed established the Primary Market Corporate Credit Facility for new bond and loan issuance to assist with the flow of credit to large employers impacted by the pandemic.
Outlook
Looking ahead to the upcoming year, there are a number of structural economic factors in place that pose risks to our market outlook, including the ongoing impact of the pandemic, potential delays in reaching agreement on further fiscal stimulus and any resurgence of trade tensions between the US and China. That said, we are optimistic that economic conditions could continue to show improvement over the next year. This view is reflected in current market prices and appears to be shared by the consensus.
We anticipate limited changes in monetary policy, with the Fed likely maintaining its zero interest rate stance until at least 2023. The Fed has also indicated that progress toward attaining full employment and longer-term inflation averages are additional factors in considering any future rate hikes. This accommodative stance should continue to boost investor confidence and demand for yield in a low global rate environment. In addition, we believe the overall health of the consumer, strong housing market and expected inventory rebuilding provide support to our outlook.
We have been maintaining a balance of liquidity, diversification and risk exposure. Within our credit allocation, we continue to focus on areas where we still see value based on our fundamental research. We are specifically focused on some of the sectors that were hardest hit by the pandemic including the transportation, recreation and hospitality industries. These areas of the economy include credits that we view as cheap for their rating, have been able to access the capital markets for liquidity and are likely in a good position to benefit from the recovery.
Despite their higher valuations, we believe there are still selective opportunities in both the investment grade and high yield corporate sectors. Spreads have compressed but can potentially tighten further on improving fundamentals. We are selectively adding corporate credit, particularly in areas of the market that have lagged the recovery.
Market conditions in the past year have highlighted the notion that investors tend to overreact. The speed and severity of the recession and subsequent sharp rebound were unexpected, but also presented some favorable investment opportunities. These developments have served to reinforce our belief that markets are highly inefficient in the short term. We believe that we were able to capitalize on these developments in 2020 and that the Fund is well-positioned to benefit from the expected economic growth and recovery in the new year.
Our emerging market allocation largely represents US dollar-pay exposure to high quality securities with strong balance sheets and currently attractive real yields. We are holding little foreign currency but continue to evaluate opportunities in markets outside the US as we look for clarity on the outlook for global growth.
| 12
LOOMIS SAYLES STRATEGIC ALPHA FUND
Hypothetical Growth of $100,000 Investment in Class Y Shares4
December 31, 2010 through December 31, 2020
Average Annual Total Returns — December 31, 20204
| | | | | | | | | | | | | | | | | | | | | | | | |
| | | | | | |
| | | | | | | | | | | | | | | Expense Ratios5 | |
| | | | | | | |
| | | 1 Year | | | 5 Years | | | 10 Years | | | Life of Class N | | | Gross | | | Net | |
| | | | | | | |
| Class Y (Inception 12/15/10) | | | | | | | | | | | | | | | | | | | | | | | | |
| NAV | | | 10.19 | % | | | 4.93 | % | | | 3.49 | % | | | — | % | | | 0.74 | % | | | 0.74 | % |
| | | | | | | |
| Class A (Inception 12/15/10) | | | | | | | | | | | | | | | | | | | | | | | | |
| NAV | | | 9.97 | | | | 4.67 | | | | 3.24 | | | | — | | | | 0.99 | | | | 0.99 | |
| With 4.25% Maximum Sales Charge | | | 5.30 | | | | 3.77 | | | | 2.79 | | | | — | | | | | | | | | |
| | | | | | | |
| Class C (Inception 12/15/10) | | | | | | | | | | | | | | | | | | | | | | | | |
| NAV | | | 9.12 | | | | 3.89 | | | | 2.46 | | | | — | | | | 1.74 | | | | 1.74 | |
| With CDSC1 | | | 8.12 | | | | 3.89 | | | | 2.46 | | | | — | | | | | | | | | |
| | | | | | | |
| Class N (Inception 5/1/17) | | | | | | | | | | | | | | | | | | | | | | | | |
| NAV | | | 10.36 | | | | — | | | | — | | | | 4.56 | | | | 0.67 | | | | 0.67 | |
| | | | | | | |
| Comparative Performance | | | | | | | | | | | | | | | | | | | | | | | | |
| 3-Month LIBOR2 | | | 0.66 | | | | 1.46 | | | | 0.89 | | | | 1.68 | | | | | | | | | |
| 3-Month LIBOR + 300 basis points3 | | | 3.66 | | | | 4.46 | | | | 3.89 | | | | 4.66 | | | | | | | | | |
Performance data shown represents past performance and is no guarantee of, and not necessarily indicative of, future results. Total return and value will vary, and you may have a gain or loss when shares are sold. Current performance may be lower or higher than quoted. For most recent month-end performance, visit im.natixis.com/performance. Performance for other share classes will be greater or less than shown based on differences in fees and sales charges. You may not invest directly in an index. Performance for periods less than one year is cumulative, not annualized. Returns reflect changes in share price and reinvestment of dividends and capital gains, if any. The table(s) do not reflect taxes shareholders might owe on any fund distributions or when they redeem their shares.
| 1 | Performance for Class C shares assumes a 1% contingent deferred sales charge (“CDSC”) applied when you sell shares within one year of purchase. |
| 2 | 3-Month LIBOR, or the London Interbank Offered Rate, represents the average rate at which a leading bank, for a given currency (in this case U.S. dollars), can obtain unsecured funding, and is representative of short-term interest rates. |
| 3 | 3-Month LIBOR + 300 basis points is created by adding 3.00% to the annual return of 3-Month LIBOR. The calculation is performed on a monthly basis and is subject to the effects of compounding. |
| 4 | Fund performance has been increased by fee waivers and/or expense reimbursements, if any, without which performance would have been lower. |
| 5 | Expense ratios are as shown in the Fund’s prospectus in effect as of the date of this report. The expense ratios for the current reporting period can be found in the Financial Highlights section of this report under Ratios to Average Net Assets. Net expenses reflect contractual expense limitations set to expire on 4/30/21. When a Fund’s expenses are below the limitation, gross and net expense ratios will be the same. See Note 6 of the Notes to Financial Statements for more information about the Fund’s expense limitations. |
13 |
LOOMIS SAYLES STRATEGIC INCOME FUND
| | | | |
| | |
| Managers | | Symbols | | |
| | |
| Matthew J. Eagan, CFA® | | Class A | | NEFZX |
| | |
| Daniel J. Fuss, CFA®, CIC* | | Class C | | NECZX |
| | |
| Brian P. Kennedy | | Class N | | NEZNX |
| | |
| Elaine M. Stokes | | Class Y | | NEZYX |
| | |
| Loomis, Sayles & Company, L.P. | | Admin Class | | NEZAX |
| * | Effective March 1, 2021, Dan Fuss no longer serves as portfolio manager of the Fund. |
Investment Goal
The Fund seeks high current income with a secondary objective of capital growth.
Market Conditions
Investors’ appetite for risk surged in the fourth quarter, which contributed to a broad range of nearly all positive returns across credit asset classes. In early November, investors were treated to the long-awaited news that coronavirus vaccines were effective and would soon become available to the public. The prospect of a gradual return to normal economic conditions in 2021 allowed market participants to look beyond recent adverse headlines, including the emergence of a new strain of the virus, ongoing Brexit negotiations, and a slowdown in the economic recovery. Investors instead were focused on and encouraged by the US Federal Reserve (Fed) statements indicating its intention to keep short-term interest rates near zero for a multiyear period. Not least, the resolution to the US election removed a factor that had weighed on sentiment in early autumn.
The developments mentioned above acted as a headwind for the Treasury market. While short-term yields were largely unchanged due to the steady outlook for Fed policy, longer-term yields rose (as prices fell). With Treasurys already having rallied significantly in the first nine months of the year, there was little room for further improvement — particularly in light of rising estimates for both economic growth and inflation in 2021. In addition, demand for “safe haven” assets was muted due to generally positive headlines.
Investment-grade corporate bonds delivered sizable outperformance in the quarter, closing out an impressive year. The combination of an improving credit outlook and stable Fed policy prompted investors to move further out on the risk spectrum in search of more attractive yields.
High yield corporate issues performed very well and finished as the best performing major segment of the bond market for the quarter. Yield spreads — the difference between yields on below investment-grade debt and Treasurys of similar maturities — declined to a level close to where they stood in February prior to the selloff associated with Covid-19.
Securitized assets — including mortgage-backed securities (MBS), asset-backed securities (ABS) and commercial mortgage-backed securities (CMBS) — outperformed Treasurys but trailed both corporates and high yield. The category benefited from the same search for yield that aided other credit-sensitive segments of the fixed-income market, with CMBS outpacing ABS and MBS, respectively.
Emerging market bonds also moved higher in the quarter, with the bulk of the gain occurring in November and December. The asset class made up all of the ground it lost in the February-March selloff, allowing it to finish the full year firmly in positive territory. Emerging-markets debt was boosted by the combination of the “risk-on” environment, rising commodity prices and the persistent weakness in the US dollar.
Performance Results1
For the three months ended December 31, 2020, Class Y shares of the Loomis Sayles Strategic Income Fund returned 5.44% at net asset value. The Fund outperformed its primary benchmark, the Bloomberg Barclays U.S. Aggregate Bond Index, which returned 0.67%.
Explanation of Fund Performance
Markets finished the year on a positive note as a Covid-19 vaccine was approved and distribution began on a global scale. Credit sectors continued to perform well under these conditions. The Fund’s exposure to high yield corporate credit was the biggest
| 1 | Effective December 2, 2020, the Board of Trustees approved a change in the fiscal year-end of the Fund from September 30 to December 31. The Fund performance provided in this section reflects the three-month fiscal period ended December 31, 2020. |
| 14
LOOMIS SAYLES STRATEGIC INCOME FUND
contributor to relative return, largely driven by consumer cyclical, energy, and finance company holdings. Exposure to non-US-dollar securities, particularly those denominated in the Mexican peso, helped performance during the period. Within equities, allocations to the communications, consumer non-cyclical and technology sectors generated positive relative performance as stock markets posted strong gains for the quarter.
The Fund’s longer-than-benchmark positioning with respect to duration (and corresponding interest rate sensitivity) within US Treasuries detracted from relative performance.
Outlook
Looking ahead to the upcoming year, there are a number of structural economic factors in place that pose risks to our market outlook, including the ongoing impact of the pandemic, further delay in reaching a fiscal package and any resurgence of trade tensions between the US and China. That said, we are optimistic that economic conditions could continue to show improvement over the next year. This view is reflected in current market prices and appears to be shared by the consensus.
While the recent rise in coronavirus cases has led to renewed containment measures across the US, the likelihood of a vaccine has been priced into markets along with expectations for a fiscal package to arrive in the first quarter of the year. These measures help give us some confidence that the economic recovery could continue to show steady, if uneven, progress. GDP growth rebounded from the steep declines last year and we expect this trend to continue into 2021.
We anticipate limited changes in monetary policy, with the Fed likely maintaining its zero interest rate policy until at least 2023. The Fed has also indicated that full employment and longer-term inflation averages are additional factors in considering any future rate hikes. This accommodative stance should continue to boost investor confidence and demand for yield in a low global rate environment. In addition, we believe the overall health of the consumer, strong housing market and expected inventory rebuilding provide support to our outlook.
The credit markets have been progressing through the cycle,2 and we believe there are increasing signs of a shift towards recovery with corporate profits rebounding, easy monetary policy, balance sheet improvement and potential for large-scale vaccine distribution.
We have been maintaining a balance of liquidity, diversification and risk exposure in our portfolios. Within our credit allocation, we continue to focus on areas where we still see value based on our fundamental research. We are specifically focused on some of the sectors that were hardest hit by the pandemic including the transportation, recreational and hospitality industries. These areas of the economy include credits that have been cheap for their rating, have been able to access the capital markets for liquidity and are likely in a good position to benefit from the recovery.
Despite the higher valuations, we believe there are still selective opportunities in both the investment grade and high yield corporate sectors. Spreads have compressed but can potentially tighten further on improving fundamentals. We are selectively adding corporate credit, particularly in areas of the market that have lagged the recovery.
Our emerging market allocation largely represents US dollar-pay exposure to high quality securities with strong balance sheets and currently attractive real yields. We are holding little foreign currency but continue to evaluate opportunities in markets outside the US as we look for clarity on the outlook for global growth.
Market conditions in the past year have highlighted the notion that investors tend to overreact. The speed and severity of the recession and subsequent sharp rebound were unexpected, but also presented some favorable investment opportunities. These developments have served to reinforce our investment philosophy that markets are highly inefficient in the short term. We believe that we were able to capitalize on these developments in 2020 and that our portfolios are well-positioned to benefit from the expected economic growth and recovery in the new year.
During periods in which the US dollar appreciates relative to foreign currencies, funds that hold non-US-dollar-denominated bonds may realize currency losses in connection with the maturity or sale of certain bonds. These losses impact a fund’s ordinary income distributions (to the extent that losses are not offset by realized currency gains within the fund’s fiscal year). A recognized currency loss, in accordance with federal tax rules, decreases the amount of ordinary income a fund has available to distribute, even though these bonds continue to generate coupon income.
Fund officers have analyzed the Fund’s current portfolio of investments, realized currency gains and losses, schedule of maturities, and the corresponding amounts of unrealized currency losses that may become realized during the 2021 fiscal year. This analysis is performed regularly to determine how realized currency losses will impact periodic ordinary income distributions for the Fund. Based on the limited foreign currency exposures held by the Fund on the most recent quarterly analysis (as of December 31, 2020), Fund
| 2 | A credit cycle is a cyclical pattern that follows credit availability and corporate health. |
15 |
officers do not anticipate realized currency losses will have an impact on the distributions in the 2021 fiscal year. This analysis is based on certain assumptions including, but not limited to, the level of foreign currency exchange rates, security prices, interest rates, the Fund adviser’s ability to manage realized currency losses, and the net asset level of the Fund. Changes to these assumptions could materially impact the analysis and the amounts of future Fund distributions. Fund officers will continue to monitor these amounts on a regular basis and take the necessary actions required to manage the Fund’s distributions to address realized currency losses while seeking to avoid a return of capital distribution.
Hypothetical Growth of $100,000 Investment in Class Y Shares4
December 31, 2010 through December 31, 2020
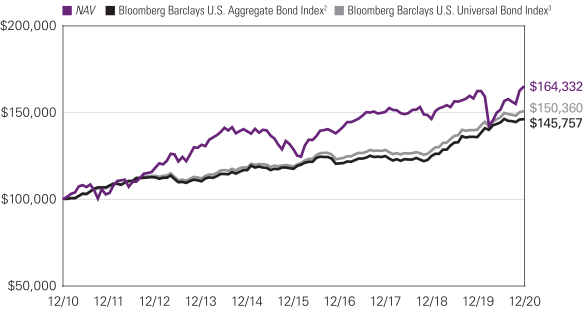
See notes to chart on page 17.
| 16
LOOMIS SAYLES STRATEGIC INCOME FUND
Average Annual Total Returns — December 31, 20204
| | | | | | | | | | | | | | | | | | | | | | | | | | | | |
| | | | | | | |
| | | | | | | | | | | | | | | | | | Expense Ratios5 | |
| | | | | | | | |
| | | 3 Months | | | 1 Year | | | 5 Years | | | 10 Years | | | Life of Class N | | | Gross | | | Net | |
| | | | | | | | |
| Class Y (Inception 12/1/99) | | | | | | | | | | | | | | | | | | | | | | | | | | | | |
| NAV | | | 5.44 | % | | | 1.40 | % | | | 5.04 | % | | | 5.09 | % | | | — | % | | | 0.71 | % | | | 0.71 | % |
| | | | | | | | |
| Class A (Inception 5/1/95) | | | | | | | | | | | | | | | | | | | | | | | | | | | | |
| NAV | | | 5.37 | | | | 1.15 | | | | 4.77 | | | | 4.83 | | | | — | | | | 0.96 | | | | 0.96 | |
| With 4.25% Maximum Sales Charge | | | 0.91 | | | | -3.14 | | | | 3.86 | | | | 4.37 | | | | — | | | | | | | | | |
| | | | | | | | |
| Class C (Inception 5/1/95) | | | | | | | | | | | | | | | | | | | | | | | | | | | | |
| NAV | | | 5.17 | | | | 0.38 | | | | 3.98 | | | | 4.04 | | | | — | | | | 1.71 | | | | 1.71 | |
| With CDSC1 | | | 4.17 | | | | -0.59 | | | | 3.98 | | | | 4.04 | | | | — | | | | | | | | | |
| | | | | | | | |
| Class N (Inception 2/1/13) | | | | | | | | | | | | | | | | | | | | | | | | | | | | |
| NAV | | | 5.39 | | | | 1.49 | | | | 5.12 | | | | — | | | | 4.04 | | | | 0.63 | | | | 0.63 | |
| | | | | | | | |
| Admin Class (Inception 2/1/10) | | | | | | | | | | | | | | | | | | | | | | | | | | | | |
| NAV | | | 5.24 | | | | 0.82 | | | | 4.52 | | | | 4.57 | | | | — | | | | 1.20 | | | | 1.20 | |
| | | | | | | | |
| Comparative Performance | | | | | | | | | | | | | | | | | | | | | | | | | | | | |
| Bloomberg Barclays U.S. Aggregate Bond Index2 | | | 0.67 | | | | 7.51 | | | | 4.44 | | | | 3.84 | | | | 3.43 | | | | | | | | | |
| Bloomberg Barclays U.S. Universal Bond Index3 | | | 1.29 | | | | 7.58 | | | | 4.87 | | | | 4.16 | | | | 3.70 | | | | | | | | | |
Performance data shown represents past performance and is no guarantee of, and not necessarily indicative of, future results. Total return and value will vary, and you may have a gain or loss when shares are sold. Current performance may be lower or higher than quoted. For most recent month-end performance, visit im.natixis.com. Performance for other share classes will be greater or less than shown based on differences in fees and sales charges. You may not invest directly in an index. Performance for periods less than one year is cumulative, not annualized. Returns reflect changes in share price and reinvestment of dividends and capital gains, if any. The table(s) do not reflect taxes shareholders might owe on any fund distributions or when they redeem their shares.
| 1 | Class C share performance assumes a 1% CDSC applied when you sell shares within one year of purchase. |
| 2 | The Bloomberg Barclays U.S. Aggregate Bond Index is an unmanaged index that covers the U.S.-dollar-denominated, investment-grade, fixed-rate, taxable bond market of SEC-registered securities. The index includes bonds from the Treasury, government-related, corporate, mortgage-backed securities, asset-backed securities, and collateralized mortgage-backed securities sectors. |
| 3 | The Bloomberg Barclays U.S. Universal Bond Index represents the union of the U.S. Aggregate Index, the U.S. High-Yield Corporate Index, the 144A Index, the Eurodollar Index, the Emerging Markets Index, and the non-ERISA portion of the CMBS Index. Municipal debt, private placements, and non-dollar-denominated issues are excluded from the Universal Bond Index. The only constituent of the index that includes floating-rate debt is the Emerging Markets Index. |
| 4 | Fund performance has been increased by fee waivers and/or expense reimbursements, if any, without which performance would have been lower. |
| 5 | Expense ratios are as shown in the Fund’s prospectus in effect as of the date of this report. The expense ratios for the current reporting period can be found in the Financial Highlights section of this report under Ratios to Average Net Assets. Net expenses reflect contractual expense limitations set to expire on 1/31/22. When a Fund’s expenses are below the limitation, gross and net expense ratios will be the same. See Note 5 of the Notes to Financial Statements for more information about the Fund’s expense limitations. |
17 |
ADDITIONAL INFORMATION
The views expressed in this report reflect those of the portfolio managers as of the dates indicated. The managers’ views are subject to change at any time without notice based on changes in market or other conditions. References to specific securities or industries should not be regarded as investment advice. Because the Funds are actively managed, there is no assurance that they will continue to invest in the securities or industries mentioned.
All investing involves risk, including the risk of loss. There is no assurance that any investment will meet its performance objectives or that losses will be avoided.
ADDITIONAL INDEX INFORMATION
This document may contain references to third party copyrights, indexes, and trademarks, each of which is the property of its respective owner. Such owner is not affiliated with Natixis Investment Managers or any of its related or affiliated companies (collectively “Natixis affiliates”) and does not sponsor, endorse or participate in the provision of any Natixis affiliates services, funds or other financial products.
The index information contained herein is derived from third parties and is provided on an “as is” basis. The user of this information assumes the entire risk of use of this information. Each of the third party entities involved in compiling, computing or creating index information, disclaims all warranties (including, without limitation, any warranties of originality, accuracy, completeness, timeliness, non-infringement, merchantability and fitness for a particular purpose) with respect to such information.
PROXY VOTING INFORMATION
A description of the Natixis Funds’ proxy voting policies and procedures is available without charge, upon request, by calling Natixis Funds at 800-225-5478; on Natixis Funds’ website at im.natixis.com; and on the Securities and Exchange Commission’s (SEC) website at www.sec.gov. Information regarding how Natixis Funds voted proxies relating to portfolio securities during the most recent 12-month period ended June 30 is available from Natixis Funds’ website and the SEC’s website.
QUARTERLY PORTFOLIO SCHEDULES
The Natixis Funds file a complete schedule of portfolio holdings with the SEC for the first and third quarters of each fiscal year as an exhibit to its reports on Form N-PORT. The Funds’ Form N-PORT reports are available on the SEC’s website at www.sec.gov. First and third quarter schedules of portfolio holdings are also available at im.natixis.com/funddocuments. A hard copy may be requested from the Fund at no charge by calling 800-225-5478.
CFA® and Chartered Financial Analyst® are registered trademarks owned by the CFA Institute.
| 18
UNDERSTANDING FUND EXPENSES
As a mutual fund shareholder, you incur different costs: transaction costs, including sales charges (loads) on purchases and contingent deferred sales charges on redemptions, and ongoing costs, including management fees, distribution and/or service fees (12b-1 fees), and other fund expenses. Certain exemptions may apply. These costs are described in more detail in the Funds’ prospectuses. The following examples are intended to help you understand the ongoing costs of investing in the Funds and help you compare these with the ongoing costs of investing in other mutual funds.
The first line in the table of each class of Fund shares shows the actual account values and actual Fund expenses you would have paid on a $1,000 investment in the Fund from July 1, 2020 through December 31, 2020. To estimate the expenses you paid over the period, simply divide your account value by $1,000 (for example $8,600 account value divided by $1,000 = 8.60) and multiply the result by the number in the Expenses Paid During Period column as shown for your class.
The second line in the table for each class of Fund shares provides information about hypothetical account values and hypothetical expenses based on the Fund’s actual expense ratios and an assumed rate of return of 5% per year before expenses, which is not the Fund’s actual return. The hypothetical account values and expenses may not be used to estimate the actual ending account balance or expenses you paid on your investment for the period. You may use this information to compare the ongoing costs of investing in each Fund and other funds. To do so, compare this 5% hypothetical example with the 5% hypothetical examples that appear in the shareholder reports of the other funds.
Please note that the expenses shown reflect ongoing costs only, and do not include any transaction costs, such as sales charges. Therefore, the second line in the table of each Fund is useful in comparing ongoing costs only, and will not help you determine the relative costs of owning different funds. If transaction costs were included, total costs would be higher.
| | | | | | | | | | | | |
| LOOMIS SAYLES HIGH INCOME FUND | | BEGINNING
ACCOUNT VALUE
7/1/2020 | | | ENDING
ACCOUNT VALUE
12/31/2020 | | | EXPENSES PAID
DURING PERIOD*
7/1/2020 – 12/31/2020 | |
| Class A | | | | | | | | | | | | |
| Actual | | | $1,000.00 | | | | $1,129.80 | | | | $5.35 | |
| Hypothetical (5% return before expenses) | | | $1,000.00 | | | | $1,020.11 | | | | $5.08 | |
| Class C | | | | | | | | | | | | |
| Actual | | | $1,000.00 | | | | $1,127.70 | | | | $9.36 | |
| Hypothetical (5% return before expenses) | | | $1,000.00 | | | | $1,016.34 | | | | $8.87 | |
| Class N | | | | | | | | | | | | |
| Actual | | | $1,000.00 | | | | $1,134.20 | | | | $3.76 | ** |
| Hypothetical (5% return before expenses) | | | $1,000.00 | | | | $1,021.62 | | | | $3.56 | |
| Class Y | | | | | | | | | | | | |
| Actual | | | $1,000.00 | | | | $1,131.60 | | | | $4.02 | |
| Hypothetical (5% return before expenses) | | | $1,000.00 | | | | $1,021.37 | | | | $3.81 | |
| * | Expenses are equal to the Fund’s annualized expense ratio (after waiver/reimbursement): 1.00%, 1.75%, 0.70% and 0.75% for Class A, C, N and Y Class, respectively, multiplied by the average account value over the period, multiplied by the number of days in the most recent fiscal half-year (184), divided by 366 (to reflect the half-year period). |
| ** | Generally accepted accounting principles require adjustments to be made to the net assets of the Fund at period end for financial reporting purposes. Amounts expressed in the table include the effect of such adjustments. |
19 |
| | | | | | | | | | | | |
| LOOMIS SAYLES INTERMEDIATE MUNICIPAL BOND FUND | | BEGINNING
ACCOUNT VALUE
7/1/2020 | | | ENDING
ACCOUNT VALUE
12/31/2020 | | | EXPENSES PAID
DURING PERIOD
7/1/2020 – 12/31/2020* | |
| Class A | | | | | | | | | | | | |
| Actual | | | $1,000.00 | | | | $1,022.00 | | | | $3.56 | |
| Hypothetical (5% return before expenses) | | | $1,000.00 | | | | $1,021.62 | | | | $3.56 | |
| Class C | | | | | | | | | | | | |
| Actual | | | $1,000.00 | | | | $1,018.20 | | | | $7.36 | |
| Hypothetical (5% return before expenses) | | | $1,000.00 | | | | $1,017.85 | | | | $7.35 | |
| Class Y | | | | | | | | | | | | |
| Actual | | | $1,000.00 | | | | $1,023.30 | | | | $2.29 | |
| Hypothetical (5% return before expenses) | | | $1,000.00 | | | | $1,022.87 | | | | $2.29 | |
| * | Expenses are equal to the Fund’s annualized expense ratio (after waiver/reimbursement): 0.70%, 1.45% and 0.45% for Class A, C and Y, respectively, multiplied by the average account value over the period, multiplied by the number of days in the most recent fiscal half-year (184), divided by 366 (to reflect the half-year period). |
| | | | | | | | | | | | |
| LOOMIS SAYLES INTERNATIONAL GROWTH FUND | | BEGINNING
ACCOUNT VALUE
7/1/20201 | | | ENDING
ACCOUNT VALUE
12/31/2020 | | | EXPENSES PAID
DURING PERIOD
7/1/20201 – 12/31/2020 | |
| Class A | | | | | | | | | | | | |
| Actual | | | $1,000.00 | | | | $1,013.70 | | | | $0.53 | 1 |
| Hypothetical (5% return before expenses) | | | $1,000.00 | | | | $1,019.10 | | | | $6.09 | * |
| Class C | | | | | | | | | | | | |
| Actual | | | $1,000.00 | | | | $1,013.30 | | | | $0.86 | 1 |
| Hypothetical (5% return before expenses) | | | $1,000.00 | | | | $1,015.33 | | | | $9.88 | * |
| Class N | | | | | | | | | | | | |
| Actual | | | $1,000.00 | | | | $1,013.80 | | | | $0.40 | 1 |
| Hypothetical (5% return before expenses) | | | $1,000.00 | | | | $1,020.61 | | | | $4.57 | * |
| Class Y | | | | | | | | | | | | |
| Actual | | | $1,000.00 | | | | $1,013.80 | | | | $0.42 | 1 |
| Hypothetical (5% return before expenses) | | | $1,000.00 | | | | $1,020.36 | | | | $4.82 | * |
| * | Expenses are equal to the Fund’s annualized expense ratio (after waiver/reimbursement): 1.20%, 1.95%, 0.90% and 0.95% for Class A, C, N and Y, respectively, multiplied by the average account value over the period, multiplied by the number of days in the most recent fiscal half-year (184), divided by 366 (to reflect the half-year period). |
| 1 | Fund commenced operations on December 15, 2020. Actual expenses are equal to the Fund’s annualized expense ratio (after waiver/reimbursement) of 1.20%, 1.95%, 0.90% and 0.95% for Class A, C, N and Y, respectively, multiplied by the average account value over the period, multiplied by the number of days in the most recent fiscal period (16), divided by 366 (to reflect the partial period). |
| 20
| | | | | | | | | | | | |
| LOOMIS SAYLES INVESTMENT GRADE BOND FUND | | BEGINNING
ACCOUNT VALUE
7/1/2020 | | | ENDING
ACCOUNT VALUE
12/31/2020 | | | EXPENSES PAID
DURING PERIOD*
7/1/2020 – 12/31/2020 | |
| Class A | | | | | | | | | | | | |
| Actual | | | $1,000.00 | | | | $1,056.30 | | | | $3.88 | |
| Hypothetical (5% return before expenses) | | | $1,000.00 | | | | $1,021.37 | | | | $3.81 | |
| Class C | | | | | | | | | | | | |
| Actual | | | $1,000.00 | | | | $1,052.80 | | | | $7.74 | |
| Hypothetical (5% return before expenses) | | | $1,000.00 | | | | $1,017.60 | | | | $7.61 | |
| Class N | | | | | | | | | | | | |
| Actual | | | $1,000.00 | | | | $1,057.90 | | | | $2.33 | |
| Hypothetical (5% return before expenses) | | | $1,000.00 | | | | $1,022.87 | | | | $2.29 | |
| Class Y | | | | | | | | | | | | |
| Actual | | | $1,000.00 | | | | $1,057.60 | | | | $2.59 | |
| Hypothetical (5% return before expenses) | | | $1,000.00 | | | | $1,022.62 | | | | $2.54 | |
| Admin Class | | | | | | | | | | | | |
| Actual | | | $1,000.00 | | | | $1,055.10 | | | | $5.17 | |
| Hypothetical (5% return before expenses) | | | $1,000.00 | | | | $1,020.11 | | | | $5.08 | |
| * | Expenses are equal to the Fund’s annualized expense ratio (after waiver/reimbursement): 0.75%, 1.50%, 0.45%, 0.50% and 1.00% for Class A, C, N, Y and Admin Class, respectively, multiplied by the average account value over the period, multiplied by the number of days in the most recent fiscal half-year (184), divided by 366 (to reflect the half-year period). |
| | | | | | | | | | | | |
| LOOMIS SAYLES STRATEGIC ALPHA FUND | | BEGINNING
ACCOUNT VALUE
7/1/2020 | | | ENDING
ACCOUNT VALUE
12/31/2020 | | | EXPENSES PAID
DURING PERIOD*
7/1/2020 – 12/31/2020 | |
| Class A | | | | | | | | | | | | |
| Actual | | | $1,000.00 | | | | $1,078.10 | | | | $5.17 | |
| Hypothetical (5% return before expenses) | | | $1,000.00 | | | | $1,020.16 | | | | $5.03 | |
| Class C | | | | | | | | | | | | |
| Actual | | | $1,000.00 | | | | $1,073.50 | | | | $9.02 | |
| Hypothetical (5% return before expenses) | | | $1,000.00 | | | | $1,016.44 | | | | $8.77 | |
| Class N | | | | | | | | | | | | |
| Actual | | | $1,000.00 | | | | $1,080.00 | | | | $3.56 | |
| Hypothetical (5% return before expenses) | | | $1,000.00 | | | | $1,021.72 | | | | $3.46 | |
| Class Y | | | | | | | | | | | | |
| Actual | | | $1,000.00 | | | | $1,079.70 | | | | $3.87 | |
| Hypothetical (5% return before expenses) | | | $1,000.00 | | | | $1,021.42 | | | | $3.76 | |
| * | Expenses are equal to the Fund’s annualized expense ratio: 0.99%, 1.73%, 0.68% and 0.74% for Class A, C, N and Y, respectively, multiplied by the average account value over the period, multiplied by the number of days in the most recent fiscal half-year (184), divided by 366 (to reflect the half-year period). |
21 |
| | | | | | | | | | | | |
| LOOMIS SAYLES STRATEGIC INCOME FUND | | BEGINNING
ACCOUNT VALUE
7/1/2020 | | | ENDING
ACCOUNT VALUE
12/31/2020 | | | EXPENSES PAID
DURING PERIOD*
7/1/2020 – 12/31/2020 | |
| Class A | | | | | | | | | | | | |
| Actual | | | $1,000.00 | | | | $1,084.90 | | | | $5.10 | |
| Hypothetical (5% return before expenses) | | | $1,000.00 | | | | $1,020.32 | | | | $4.94 | |
| Class C | | | | | | | | | | | | |
| Actual | | | $1,000.00 | | | | $1,080.90 | | | | $9.02 | |
| Hypothetical (5% return before expenses) | | | $1,000.00 | | | | $1,016.54 | | | | $8.74 | |
| Class N | | | | | | | | | | | | |
| Actual | | | $1,000.00 | | | | $1,086.10 | | | | $3.42 | |
| Hypothetical (5% return before expenses) | | | $1,000.00 | | | | $1,021.93 | | | | $3.31 | |
| Class Y | | | | | | | | | | | | |
| Actual | | | $1,000.00 | | | | $1,086.40 | | | | $3.79 | |
| Hypothetical (5% return before expenses) | | | $1,000.00 | | | | $1,021.58 | | | | $3.67 | |
| Admin Class | | | | | | | | | | | | |
| Actual | | | $1,000.00 | | | | $1,083.10 | | | | $6.41 | |
| Hypothetical (5% return before expenses) | | | $1,000.00 | | | | $1,019.06 | | | | $6.21 | |
| * | Expenses are equal to the Fund’s annualized expense ratio: 0.97%, 1.72%, 0.65%, 0.72% and 1.22% for Class A, C, N, Y and Admin Class, respectively, multiplied by the average account value over the period, multiplied by the number of days in the most recent fiscal half-year (184), divided by 365 (to reflect the half-year period). |
| 22
BOARD APPROVAL OF THE INITIAL ADVISORY AGREEMENT FOR LOOMIS SAYLES INTERNATIONAL GROWTH FUND
The Investment Company Act of 1940, as amended (the “1940 Act”), requires that both the full Board of Trustees of the Trust (the “Board”) and a majority of the Trustees who are not “interested persons” (as defined in the 1940 Act) of the Trust (the “Independent Trustees”), voting separately, initially approve any new investment advisory agreements for a registered investment company, including a newly formed fund such as the Loomis Sayles International Growth Fund (the “Fund”). The Trustees, including the Independent Trustees, unanimously approved, for an initial two-year term, the proposed investment advisory agreement (the “Agreement”) for the Fund at a meeting held on December 3, 2020.
In connection with this review, Fund management and other representatives of the Fund’s adviser, Loomis, Sayles & Company, L.P. (the “Adviser”), distributed to the Trustees materials including, among other items, information regarding (i) the Fund’s investment objective, strategies and risks, (ii) the proposed advisory fee and other expenses to be charged to the Fund, including information comparing the Fund’s expenses to those of peer groups and categories of funds and the proposed expense cap, (iii) the size, education and experience of the Adviser’s investment staff and the investment strategies proposed to be used in managing the Fund, (iv) proposed arrangements for the distribution of the Fund’s shares, (v) information about the Adviser’s performance, and (vi) the general economic outlook with particular emphasis on the asset management industry.
The Trustees also considered the fact that they oversee other funds advised by the Adviser as well as information about the Adviser they had received in connection with their oversight of those other funds. Because the Fund is newly formed and had not commenced operations at the time of the Trustees’ review, certain information, including data relating to Fund performance, was not available, and therefore could not be distributed to the Trustees. Throughout the process, the Trustees were afforded the opportunity to ask questions of, and request additional materials from, the Adviser.
In considering whether to initially approve the Agreement, the Board, including the Independent Trustees, did not identify any single factor as determinative. Individual Trustees may have evaluated the information presented differently from one another, giving different weights to various factors. Matters considered by the Trustees, including the Independent Trustees, in connection with their approval of the Agreement included, but were not limited to, the factors listed below.
The nature, extent and quality of the services to be provided to the Fund under the Agreement. The Trustees considered the nature, extent and quality of the services to be provided by the Adviser and its affiliates to the Fund and the resources to be dedicated to the Fund by the Adviser and its affiliates. The Trustees considered their experience with other funds advised by the Adviser, as well as the affiliation between the Adviser and Natixis Investment Managers, LLC (“Natixis Investment Managers”), whose affiliates provide investment advisory services to other funds in the same family of mutual funds. In this regard, the Trustees considered not only the advisory services proposed to be provided by the Adviser to the Fund, but also the monitoring and oversight services proposed to be provided by Natixis Advisors, L.P. (“Natixis Advisors”). They also considered the administrative and shareholder services proposed to be provided by Natixis Advisors and its affiliates to the Fund.
The Trustees also considered the benefits to shareholders of investing in a mutual fund that is part of a family of funds that offers shareholders the right to exchange shares of one type of fund for shares of another type of fund, and provides a variety of fund and shareholder services.
After reviewing these and related factors, the Trustees concluded, within the context of their overall conclusions regarding the Agreement, that the scope of the services to be provided to the Fund under the Agreement seemed consistent with the Fund’s operational requirements, and that the Adviser had the capabilities, resources and personnel necessary to provide the advisory services that would be required by the Fund. The Trustees determined that the nature, extent and quality of services proposed to be provided under the Agreement supported approval of the Agreement.
Investment performance of the Fund and the Adviser. Because the Fund had not yet commenced operations, performance information for the Fund was not considered; however, the Board considered the performance of other funds managed by the Adviser.
The Trustees also considered the Adviser’s performance and reputation generally, the performance of the fund family generally, and the historical responsiveness of the Adviser to Trustee concerns about performance and the willingness of the Adviser to take steps intended to improve performance.
After reviewing these and related factors, the Trustees concluded, within the context of their overall conclusions regarding the Agreement, that these relevant factors supported approval of the Agreement.
The costs of the services to be provided by the Adviser and profits to be realized by the Adviser and its affiliates from their respective relationships with the Fund. Although the Fund had not yet commenced operations at the time of the Trustees’ review of the Agreement, the Trustees reviewed information comparing the proposed advisory fees and estimated total expenses of the Fund with the fees and expenses of comparable funds identified by the Adviser, including information about how those funds were selected and information about differences in such fees. In evaluating the Fund’s proposed advisory fee, the Trustees also took into account the demands,
23 |
complexity and quality of the investment management of the Fund. The Trustees also noted that the Fund would have an expense cap in place. In addition, the Trustees considered information regarding the administrative and distribution fees to be paid by the Fund to the Adviser’s affiliates.
Because the Fund had not yet commenced operations, historical profitability information with respect to the Fund was not considered. However, the Trustees noted the information provided in court cases in which adviser profitability was an issue, the estimated expense level of the Fund, and that the Fund would be subject to an expense cap.
After reviewing these and related factors, the Trustees concluded, within the context of their overall conclusions regarding the Agreement, that the advisory fee and expenses proposed to be charged to the Fund were fair and reasonable, and supported the approval of the Agreement.
Economies of scale. The Trustees considered the extent to which the Adviser may realize economies of scale in the provision of services by the Adviser, and whether those economies could be shared with the Fund through breakpoints in its investment advisory fee or other means, such as expense caps. The Trustees noted that the Fund will be subject to an expense cap. After reviewing these and related factors, the Trustees concluded, within the context of their overall conclusions regarding the Agreement, that the extent to which economies of scale might be shared with the Fund supported the approval of the Agreement.
The Trustees also considered other factors, which included but were not limited to the following:
| • | | The compliance-related resources the Adviser and its affiliates would provide to the Fund. |
| • | | The nature, quality, cost and extent of administrative and shareholder services to be performed by the Adviser and its affiliates, both under the Agreement and under separate agreements covering administrative services. |
| • | | So-called “fallout benefits” to the Adviser and its affiliates, such as the engagement of affiliates of the Adviser to provide distribution and administrative services to the Fund, and the benefits of research made available to the Adviser by reason of brokerage commissions (if any) generated by the Fund’s securities transactions. The Trustees also considered the benefits to the parent company of Natixis Advisors from the retention of the Adviser. The Trustees considered the possible conflicts of interest associated with these fallout and other benefits, and the reporting, disclosure and other processes in place to disclose and monitor such possible conflicts of interest. |
Based on their evaluation of all factors that they deemed to be material, including those factors described above, and assisted by the advice of independent counsel, the Trustees, including the Independent Trustees, concluded that the Agreement should be approved.
| 24
Portfolio of Investments – as of December 31, 2020
Loomis Sayles High Income Fund
| | | | | | | | |
Principal
Amount | | | Description | | Value (†) | |
| | Bonds and Notes — 88.3% of Net Assets | |
| | Non-Convertible Bonds — 83.6% | |
| | | | ABS Home Equity — 0.3% | |
| $ | 205,000 | | | Credit Suisse Mortgage Trust, Series 2018-RPL8, Class A2, 4.164%, 7/25/2058, 144A(a) | | $ | 205,038 | |
| | 138,646 | | | DSLA Mortgage Loan Trust, Series 2005-AR5, Class 2A1A, 1-month LIBOR + 0.330%, 0.482%, 9/19/2045(b) | | | 104,068 | |
| | | | | | | | |
| | | | | | | 309,106 | |
| | | | | | | | |
| | | | Aerospace & Defense — 4.8% | |
| | 30,000 | | | Boeing Co. (The), 3.250%, 2/01/2035 | | | 30,765 | |
| | 155,000 | | | Boeing Co. (The), 3.375%, 6/15/2046 | | | 151,250 | |
| | 45,000 | | | Boeing Co. (The), 3.500%, 3/01/2039 | | | 45,526 | |
| | 20,000 | | | Boeing Co. (The), 3.550%, 3/01/2038 | | | 20,404 | |
| | 105,000 | | | Boeing Co. (The), 3.625%, 3/01/2048 | | | 105,867 | |
| | 30,000 | | | Boeing Co. (The), 3.650%, 3/01/2047 | | | 30,367 | |
| | 60,000 | | | Boeing Co. (The), 3.750%, 2/01/2050 | | | 62,748 | |
| | 5,000 | | | Boeing Co. (The), 3.825%, 3/01/2059 | | | 5,079 | |
| | 10,000 | | | Boeing Co. (The), 3.850%, 11/01/2048 | | | 10,315 | |
| | 15,000 | | | Boeing Co. (The), 3.900%, 5/01/2049 | | | 15,918 | |
| | 1,065,000 | | | Boeing Co. (The), 5.150%, 5/01/2030 | | | 1,288,918 | |
| | 10,000 | | | Boeing Co. (The), 5.705%, 5/01/2040 | | | 12,977 | |
| | 630,000 | | | Boeing Co. (The), 5.805%, 5/01/2050 | | | 868,231 | |
| | 50,000 | | | Boeing Co. (The), 5.930%, 5/01/2060 | | | 70,930 | |
| | 260,000 | | | Bombardier, Inc., 6.000%, 10/15/2022, 144A | | | 255,229 | |
| | 370,000 | | | Bombardier, Inc., 6.125%, 1/15/2023, 144A | | | 361,675 | |
| | 100,000 | | | Embraer Netherlands Finance BV, 5.050%, 6/15/2025 | | | 106,001 | |
| | 140,000 | | | Embraer Netherlands Finance BV, 5.400%, 2/01/2027 | | | 148,751 | |
| | 263,000 | | | Leonardo U.S. Holdings, Inc., 6.250%, 1/15/2040, 144A | | | 311,608 | |
| | 60,000 | | | Moog, Inc., 4.250%, 12/15/2027, 144A | | | 62,250 | |
| | 350,000 | | | Spirit AeroSystems, Inc., 4.600%, 6/15/2028 | | | 346,062 | |
| | 190,000 | | | Spirit AeroSystems, Inc., 7.500%, 4/15/2025, 144A | | | 203,775 | |
| | 100,000 | | | TransDigm, Inc., 5.500%, 11/15/2027 | | | 105,130 | |
| | 450,000 | | | TransDigm, Inc., 6.250%, 3/15/2026, 144A | | | 479,250 | |
| | 205,000 | | | TransDigm, Inc., 6.500%, 5/15/2025 | | | 210,637 | |
| | 70,000 | | | Wolverine Escrow LLC, 9.000%, 11/15/2026, 144A | | | 66,259 | |
| | | | | | | | |
| | | | | | | 5,375,922 | |
| | | | | | | | |
| | | | Airlines — 0.4% | | | | |
| | 30,000 | | | American Airlines Group, Inc., 5.000%, 6/01/2022, 144A | | | 26,970 | |
| | 160,000 | | | American Airlines, Inc., 11.750%, 7/15/2025, 144A | | | 184,520 | |
| | 200,000 | | | Delta Air Lines, Inc., 7.375%, 1/15/2026 | | | 228,461 | |
| | | | | | | | |
| | | | | | | 439,951 | |
| | | | | | | | |
| | | | Automotive — 4.4% | | | | |
| | 200,000 | | | Clarios Global LP/Clarios U.S. Finance Co., 8.500%, 5/15/2027, 144A | | | 217,282 | |
| | 75,000 | | | Dana Financing Luxembourg S.a.r.l., 5.750%, 4/15/2025, 144A | | | 77,813 | |
| | 1,510,000 | | | Ford Motor Co., 9.000%, 4/22/2025 | | | 1,851,275 | |
| | 1,170,000 | | | Ford Motor Credit Co. LLC, 4.000%, 11/13/2030 | | | 1,228,500 | |
| | 200,000 | | | Ford Motor Credit Co. LLC, 5.113%, 5/03/2029 | | | 222,740 | |
| | 555,000 | | | General Motors Co., 5.200%, 4/01/2045 | | | 674,007 | |
| | 150,000 | | | General Motors Co., 6.750%, 4/01/2046 | | | 216,111 | |
| | 105,000 | | | Goodyear Tire & Rubber Co. (The), 4.875%, 3/15/2027 | | | 107,362 | |
| | 115,000 | | | Goodyear Tire & Rubber Co. (The), 5.000%, 5/31/2026 | | | 117,012 | |
| | 40,000 | | | Meritor, Inc., 4.500%, 12/15/2028, 144A | | | 41,000 | |
| | 100,000 | | | PM General Purchaser LLC, 9.500%, 10/01/2028, 144A | | | 110,750 | |
| | | | Automotive — continued | | | | |
| 40,000 | | | Tenneco, Inc., 7.875%, 1/15/2029, 144A | | | 44,910 | |
| | | | | | | | |
| | | | | | | 4,908,762 | |
| | | | | | | | |
| | | | Banking — 1.0% | | | | |
| | 400,000 | | | Deutsche Bank AG, (fixed rate to 12/01/2027, variable rate thereafter), 4.875%, 12/01/2032 | | | 418,560 | |
| | 265,000 | | | Intesa Sanpaolo SpA, 5.710%, 1/15/2026, 144A | | | 303,317 | |
| | 400,000 | | | UniCredit SpA, (fixed rate to 6/30/2030, variable rate thereafter), 5.459%, 6/30/2035, 144A | | | 440,135 | |
| | | | | | | | |
| | | | | | | 1,162,012 | |
| | | | | | | | |
| | | | Building Materials — 1.8% | |
| | 20,000 | | | Boise Cascade Co., 4.875%, 7/01/2030, 144A | | | 21,650 | |
| | 265,000 | | | Builders FirstSource, Inc., 5.000%, 3/01/2030, 144A | | | 287,027 | |
| | 285,000 | | | Cemex SAB de CV, 5.200%, 9/17/2030, 144A | | | 312,502 | |
| | 430,000 | | | Cemex SAB de CV, 5.700%, 1/11/2025, 144A | | | 439,460 | |
| | 125,000 | | | Cornerstone Building Brands, Inc., 6.125%, 1/15/2029, 144A | | | 132,812 | |
| | 50,000 | | | CP Atlas Buyer, Inc., 7.000%, 12/01/2028, 144A | | | 52,000 | |
| | 240,000 | | | James Hardie International Finance DAC, 5.000%, 1/15/2028, 144A | | | 254,921 | |
| | 55,000 | | | LBM Acquisition LLC, 6.250%, 1/15/2029, 144A | | | 56,788 | |
| | 45,000 | | | Summit Materials LLC/Summit Materials Finance Corp., 5.250%, 1/15/2029, 144A | | | 47,250 | |
| | 165,000 | | | U.S. Concrete, Inc., 5.125%, 3/01/2029, 144A | | | 169,950 | |
| | 189,000 | | | U.S. Concrete, Inc., 6.375%, 6/01/2024 | | | 193,725 | |
| | 30,000 | | | White Cap Buyer LLC, 6.875%, 10/15/2028, 144A | | | 31,988 | |
| | | | | | | | |
| | | | | | | 2,000,073 | |
| | | | | | | | |
| | | | Cable Satellite — 5.4% | |
| | 210,000 | | | Altice Financing S.A., 5.000%, 1/15/2028, 144A | | | 215,173 | |
| | 80,000 | | | Block Communications, Inc., 4.875%, 3/01/2028, 144A | | | 82,400 | |
| | 1,310,000 | | | CCO Holdings LLC/CCO Holdings Capital Corp., 4.250%, 2/01/2031, 144A | | | 1,380,321 | |
| | 165,000 | | | CCO Holdings LLC/CCO Holdings Capital Corp., 4.500%, 5/01/2032, 144A | | | 176,174 | |
| | 835,000 | | | CCO Holdings LLC/CCO Holdings Capital Corp., 4.750%, 3/01/2030, 144A | | | 900,965 | |
| | 205,000 | | | Connect Finco S.a.r.l./Connect U.S. Finco LLC, 6.750%, 10/01/2026, 144A | | | 220,826 | |
| | 605,000 | | | CSC Holdings LLC, 4.125%, 12/01/2030, 144A | | | 632,588 | |
| | 650,000 | | | CSC Holdings LLC, 4.625%, 12/01/2030, 144A | | | 678,437 | |
| | 150,000 | | | DISH DBS Corp., 7.375%, 7/01/2028 | | | 159,750 | |
| | 290,000 | | | DISH DBS Corp., 7.750%, 7/01/2026 | | | 324,803 | |
| | 185,000 | | | Radiate Holdco LLC/Radiate Finance, Inc., 6.500%, 9/15/2028, 144A | | | 194,944 | |
| | 250,000 | | | Sirius XM Radio, Inc., 4.125%, 7/01/2030, 144A | | | 266,094 | |
| | 200,000 | | | ViaSat, Inc., 6.500%, 7/15/2028, 144A | | | 216,442 | |
| | 225,000 | | | Virgin Media Finance PLC, 5.000%, 7/15/2030, 144A | | | 233,437 | |
| | 200,000 | | | Ziggo BV, 4.875%, 1/15/2030, 144A | | | 210,204 | |
| | 201,000 | | | Ziggo BV, 5.500%, 1/15/2027, 144A | | | 209,794 | |
| | | | | | | | |
| | | | | | | 6,102,352 | |
| | | | | | | | |
| | | | Chemicals — 0.9% | |
| | 125,000 | | | Chemours Co. (The), 5.375%, 5/15/2027 | | | 133,125 | |
| | 330,000 | | | Hercules LLC, 6.500%, 6/30/2029 | | | 351,915 | |
| | 140,000 | | | Hexion, Inc., 7.875%, 7/15/2027, 144A | | | 149,800 | |
| | 20,000 | | | Methanex Corp., 5.250%, 12/15/2029 | | | 21,675 | |
| | 85,000 | | | Methanex Corp., 5.650%, 12/01/2044 | | | 91,163 | |
| | 185,000 | | | Olin Corp., 5.000%, 2/01/2030 | | | 197,025 | |
| | 65,000 | | | Olin Corp., 5.125%, 9/15/2027 | | | 67,999 | |
| | 5,000 | | | Olin Corp., 5.625%, 8/01/2029 | | | 5,431 | |
| | | | | | | | |
| | | | | | | 1,018,133 | |
| | | | | | | | |
See accompanying notes to financial statements.
25 |
Portfolio of Investments – as of December 31, 2020
Loomis Sayles High Income Fund – (continued)
| | | | | | | | |
Principal
Amount | | | Description | | Value (†) | |
| | | | Consumer Cyclical Services — 5.4% | |
| $ | 130,000 | | | ANGI Group LLC, 3.875%, 8/15/2028, 144A | | $ | 132,275 | |
| | 35,000 | | | Arches Buyer, Inc., 6.125%, 12/01/2028, 144A | | | 36,145 | |
| | 1,005,000 | | | Expedia Group, Inc., 3.250%, 2/15/2030 | | | 1,045,945 | |
| | 170,000 | | | Expedia Group, Inc., 4.625%, 8/01/2027, 144A | | | 189,934 | |
| | 405,000 | | | Expedia Group, Inc., 6.250%, 5/01/2025, 144A | | | 469,436 | |
| | 205,000 | | | Expedia Group, Inc., 7.000%, 5/01/2025, 144A | | | 225,953 | |
| | 420,000 | | | Prime Security Services Borrower LLC/Prime Finance, Inc., 6.250%, 1/15/2028, 144A | | | 450,908 | |
| | 10,000 | | | QVC, Inc., 4.450%, 2/15/2025 | | | 10,678 | |
| | 10,000 | | | QVC, Inc., 4.850%, 4/01/2024 | | | 10,775 | |
| | 185,000 | | | Realogy Group LLC/Realogy Co-Issuer Corp., 7.625%, 6/15/2025, 144A | | | 200,858 | |
| | 80,000 | | | Realogy Group LLC/Realogy Co-Issuer Corp., 9.375%, 4/01/2027, 144A | | | 88,600 | |
| | 240,000 | | | ServiceMaster Co. LLC (The), 7.450%, 8/15/2027 | | | 279,300 | |
| | 200,000 | | | Staples, Inc., 7.500%, 4/15/2026, 144A | | | 208,854 | |
| | 605,000 | | | Uber Technologies, Inc., 6.250%, 1/15/2028, 144A | | | 657,937 | |
| | 410,000 | | | Uber Technologies, Inc., 7.500%, 9/15/2027, 144A | | | 451,000 | |
| | 1,485,000 | | | Uber Technologies, Inc., 8.000%, 11/01/2026, 144A | | | 1,620,684 | |
| | | | | | | | |
| | | | | | | 6,079,282 | |
| | | | | | | | |
| | | | Consumer Products — 0.5% | |
| | 160,000 | | | Energizer Holdings, Inc., 4.375%, 3/31/2029, 144A | | | 165,683 | |
| | 115,000 | | | Mattel, Inc., 5.875%, 12/15/2027, 144A | | | 127,794 | |
| | 65,000 | | | Newell Brands, Inc., 4.875%, 6/01/2025 | | | 71,519 | |
| | 175,000 | | | Prestige Brands, Inc., 5.125%, 1/15/2028, 144A | | | 186,594 | |
| | | | | | | | |
| | | | | | | 551,590 | |
| | | | | | | | |
| | | | Diversified Manufacturing — 0.4% | |
| | 200,000 | | | Vertical U.S. Newco, Inc., 5.250%, 7/15/2027, 144A | | | 212,000 | |
| | 215,000 | | | WESCO Distribution, Inc., 7.250%, 6/15/2028, 144A | | | 244,517 | |
| | | | | | | | |
| | | | | | | 456,517 | |
| | | | | | | | |
| | | | Electric — 1.2% | |
| | 510,000 | | | Calpine Corp., 5.125%, 3/15/2028, 144A | | | 536,505 | |
| | 300,000 | | | FirstEnergy Transmission LLC, 5.450%, 7/15/2044, 144A | | | 380,659 | |
| | 140,000 | | | PG&E Corp., 5.000%, 7/01/2028 | | | 149,100 | |
| | 135,000 | | | PG&E Corp., 5.250%, 7/01/2030 | | | 148,500 | |
| | 110,000 | | | Talen Energy Supply LLC, 10.500%, 1/15/2026, 144A | | | 97,848 | |
| | | | | | | | |
| | | | | | | 1,312,612 | |
| | | | | | | | |
| | | | Environmental — 0.2% | |
| | 175,000 | | | GFL Environmental, Inc., 4.000%, 8/01/2028, 144A | | | 176,313 | |
| | | | | | | | |
| | | | Finance Companies — 3.4% | |
| | 180,000 | | | AerCap Ireland Capital DAC/AerCap Global Aviation Trust, 6.500%, 7/15/2025 | | | 215,181 | |
| | 355,000 | | | Aviation Capital Group LLC, 5.500%, 12/15/2024, 144A | | | 393,009 | |
| | 260,000 | | | Freedom Mortgage Corp., 7.625%, 5/01/2026, 144A | | | 275,002 | |
| | 170,000 | | | Navient Corp., 5.000%, 3/15/2027 | | | 171,488 | |
| | 250,000 | | | Navient Corp., 6.500%, 6/15/2022 | | | 264,560 | |
| | 400,000 | | | Navient Corp., 6.750%, 6/25/2025 | | | 435,000 | |
| | 460,000 | | | OneMain Finance Corp., 7.125%, 3/15/2026 | | | 543,950 | |
| | 170,000 | | | Provident Funding Associates LP/PFG Finance Corp., 6.375%, 6/15/2025, 144A | | | 174,250 | |
| | 490,000 | | | Quicken Loans LLC, 5.250%, 1/15/2028, 144A | | | 523,075 | |
| | 325,000 | | | Quicken Loans LLC/Quicken Loans Co-Issuer, Inc., 3.625%, 3/01/2029, 144A | | | 331,500 | |
| | 485,000 | | | Quicken Loans LLC/Quicken Loans Co-Issuer, Inc., 3.875%, 3/01/2031, 144A | | | 503,187 | |
| | | | | | | | |
| | | | | | | 3,830,202 | |
| | | | | | | | |
| | | | Financial Other — 1.6% | |
| 1,295,000 | | | Icahn Enterprises LP/Icahn Enterprises Finance Corp., 5.250%, 5/15/2027 | | | 1,388,240 | |
| | 225,000 | | | Nationstar Mortgage Holdings, Inc., 5.125%, 12/15/2030, 144A | | | 235,175 | |
| | 120,000 | | | Nationstar Mortgage Holdings, Inc., 6.000%, 1/15/2027, 144A | | | 127,350 | |
| | | | | | | | |
| | | | | | | 1,750,765 | |
| | | | | | | | |
| | | | Food & Beverage — 2.4% | |
| | 45,000 | | | Aramark Services, Inc., 4.750%, 6/01/2026 | | | 46,325 | |
| | 65,000 | | | Aramark Services, Inc., 5.000%, 2/01/2028, 144A | | | 68,494 | |
| | 230,000 | | | Aramark Services, Inc., 6.375%, 5/01/2025, 144A | | | 245,813 | |
| | 635,000 | | | Kraft Heinz Foods Co., 4.375%, 6/01/2046 | | | 684,320 | |
| | 320,000 | | | Kraft Heinz Foods Co., 4.875%, 10/01/2049, 144A | | | 373,319 | |
| | 180,000 | | | Kraft Heinz Foods Co., 5.000%, 6/04/2042 | | | 210,825 | |
| | 10,000 | | | Kraft Heinz Foods Co., 5.200%, 7/15/2045 | | | 11,891 | |
| | 75,000 | | | Kraft Heinz Foods Co., 5.500%, 6/01/2050, 144A | | | 94,481 | |
| | 120,000 | | | Performance Food Group, Inc., 5.500%, 10/15/2027, 144A | | | 126,600 | |
| | 270,000 | | | Pilgrim’s Pride Corp., 5.875%, 9/30/2027, 144A | | | 292,845 | |
| | 110,000 | | | Post Holdings, Inc., 5.500%, 12/15/2029, 144A | | | 120,038 | |
| | 335,000 | | | Post Holdings, Inc., 5.750%, 3/01/2027, 144A | | | 354,681 | |
| | 120,000 | | | TreeHouse Foods, Inc., 4.000%, 9/01/2028 | | | 124,125 | |
| | | | | | | | |
| | | | | | | 2,753,757 | |
| | | | | | | | |
| | | | Gaming — 3.2% | |
| | 375,000 | | | Boyd Gaming Corp., 4.750%, 12/01/2027 | | | 389,531 | |
| | 220,000 | | | Caesars Entertainment, Inc., 6.250%, 7/01/2025, 144A | | | 234,300 | |
| | 235,000 | | | Caesars Entertainment, Inc., 8.125%, 7/01/2027, 144A | | | 260,150 | |
| | 140,000 | | | Caesars Resort Collection LLC/CRC Finco, Inc., 5.250%, 10/15/2025, 144A | | | 141,483 | |
| | 100,000 | | | Caesars Resort Collection LLC/CRC Finco, Inc., 5.750%, 7/01/2025, 144A | | | 105,958 | |
| | 490,000 | | | International Game Technology PLC, 5.250%, 1/15/2029, 144A | | | 527,975 | |
| | 205,000 | | | MGM Growth Properties Operating Partnership LP/MGP Finance Co-Issuer, Inc., 4.500%, 1/15/2028 | | | 218,095 | |
| | 255,000 | | | MGM Resorts International, 5.500%, 4/15/2027 | | | 284,197 | |
| | 115,000 | | | Scientific Games International, Inc., 7.000%, 5/15/2028, 144A | | | 123,649 | |
| | 115,000 | | | Scientific Games International, Inc., 7.250%, 11/15/2029, 144A | | | 126,213 | |
| | 230,000 | | | Studio City Finance Ltd., 6.500%, 1/15/2028, 144A | | | 246,066 | |
| | 155,000 | | | VICI Properties LP/VICI Note Co., Inc., 4.125%, 8/15/2030, 144A | | | 163,623 | |
| | 370,000 | | | Wynn Las Vegas LLC/Wynn Las Vegas Capital Corp., 5.500%, 3/01/2025, 144A | | | 386,187 | |
| | 250,000 | | | Wynn Macau Ltd., 5.125%, 12/15/2029, 144A | | | 255,312 | |
| | 165,000 | | | Wynn Resorts Finance LLC/Wynn Resorts Capital Corp., 5.125%, 10/01/2029, 144A | | | 172,838 | |
| | | | | | | | |
| | | | | | | 3,635,577 | |
| | | | | | | | |
| | | | Government Owned – No Guarantee — 0.5% | |
| | 340,000 | | | Petroleos Mexicanos, 5.950%, 1/28/2031 | | | 339,150 | |
| | 280,000 | | | YPF S.A., 6.950%, 7/21/2027, 144A | | | 201,600 | |
| | | | | | | | |
| | | | | | | 540,750 | |
| | | | | | | | |
| | | | Healthcare — 4.8% | |
| | 235,000 | | | CHS/Community Health Systems, Inc., 6.000%, 1/15/2029, 144A | | | 253,861 | |
| | 440,000 | | | CHS/Community Health Systems, Inc., 5.625%, 3/15/2027, 144A | | | 473,110 | |
See accompanying notes to financial statements.
| 26
Portfolio of Investments – as of December 31, 2020
Loomis Sayles High Income Fund – (continued)
| | | | | | | | |
Principal
Amount | | | Description | | Value (†) | |
| | | | Healthcare — continued | |
| $ | 615,000 | | | CHS/Community Health Systems, Inc., 6.625%, 2/15/2025, 144A | | $ | 647,275 | |
| | 300,000 | | | CHS/Community Health Systems, Inc., 8.000%, 3/15/2026, 144A | | | 323,250 | |
| | 95,000 | | | CHS/Community Health Systems, Inc., 8.125%, 6/30/2024, 144A | | | 98,325 | |
| | 240,000 | | | DaVita, Inc., 3.750%, 2/15/2031, 144A | | | 243,686 | |
| | 155,000 | | | Encompass Health Corp., 4.500%, 2/01/2028 | | | 161,975 | |
| | 300,000 | | | Encompass Health Corp., 4.750%, 2/01/2030 | | | 321,375 | |
| | 170,000 | | | HCA, Inc., 7.050%, 12/01/2027 | | | 205,913 | |
| | 145,000 | | | HCA, Inc., 7.500%, 11/06/2033 | | | 201,550 | |
| | 515,000 | | | HCA, Inc., MTN, 7.750%, 7/15/2036 | | | 665,637 | |
| | 270,000 | | | LifePoint Health, Inc., 5.375%, 1/15/2029, 144A | | | 269,420 | |
| | 85,000 | | | MPH Acquisition Holdings LLC, 5.750%, 11/01/2028, 144A | | | 83,538 | |
| | 40,000 | | | Providence Service Corp. (The), 5.875%, 11/15/2025, 144A | | | 42,300 | |
| | 75,000 | | | RP Escrow Issuer LLC, 5.250%, 12/15/2025, 144A | | | 78,380 | |
| | 75,000 | | | Select Medical Corp., 6.250%, 8/15/2026, 144A | | | 80,769 | |
| | 100,000 | | | Surgery Center Holdings, Inc., 6.750%, 7/01/2025, 144A | | | 101,750 | |
| | 100,000 | | | Tenet Healthcare Corp., 4.625%, 6/15/2028, 144A | | | 104,750 | |
| | 685,000 | | | Tenet Healthcare Corp., 6.125%, 10/01/2028, 144A | | | 713,756 | |
| | 355,000 | | | Tenet Healthcare Corp., 6.250%, 2/01/2027, 144A | | | 376,300 | |
| | | | | | | | |
| | | | | | | 5,446,920 | |
| | | | | | | | |
| | | | Home Construction — 1.1% | |
| | 215,000 | | | Brookfield Residential Properties, Inc./Brookfield Residential U.S Corp., 4.875%, 2/15/2030, 144A | | | 222,268 | |
| | 1,200,000 | | | Corporacion GEO SAB de CV, 8.875%, 3/27/2022, 144A(c)(d)(e) | | | — | |
| | 100,000 | | | Empire Communities Corp., 7.000%, 12/15/2025, 144A | | | 105,386 | |
| | 230,000 | | | KB Home, 4.800%, 11/15/2029 | | | 252,425 | |
| | 165,000 | | | Mattamy Group Corp., 4.625%, 3/01/2030, 144A | | | 176,260 | |
| | 195,000 | | | Taylor Morrison Communities, Inc., 5.125%, 8/01/2030, 144A | | | 218,400 | |
| | 185,000 | | | Taylor Morrison Communities, Inc., 5.750%, 1/15/2028, 144A | | | 209,512 | |
| | 90,000 | | | TRI Pointe Group, Inc., 5.700%, 6/15/2028 | | | 101,610 | |
| | | | | | | | |
| | | | | | | 1,285,861 | |
| | | | | | | | |
| | | | Independent Energy — 5.5% | |
| | 35,000 | | | Antero Resources Corp., 8.375%, 7/15/2026, 144A | | | 35,724 | |
| | 190,000 | | | Apache Corp., 4.250%, 1/15/2030 | | | 199,500 | |
| | 105,000 | | | Apache Corp., 4.250%, 1/15/2044 | | | 103,596 | |
| | 115,000 | | | Ascent Resources Utica Holdings LLC/ARU Finance Corp., 7.000%, 11/01/2026, 144A | | | 108,963 | |
| | 195,000 | | | Centennial Resource Production LLC, 8.000%, 6/01/2025, 144A | | | 171,600 | |
| | 130,000 | | | Comstock Resources, Inc., 9.750%, 8/15/2026 | | | 140,075 | |
| | 185,000 | | | Continental Resources, Inc., 3.800%, 6/01/2024 | | | 191,033 | |
| | 30,000 | | | Continental Resources, Inc., 4.375%, 1/15/2028 | | | 30,756 | |
| | 160,000 | | | Continental Resources, Inc., 4.900%, 6/01/2044 | | | 158,242 | |
| | 50,000 | | | Continental Resources, Inc., 5.750%, 1/15/2031, 144A | | | 55,499 | |
| | 65,000 | | | Devon Energy Corp., 5.600%, 7/15/2041 | | | 79,494 | |
| | 30,000 | | | Endeavor Energy Resources LP/EER Finance, Inc., 5.500%, 1/30/2026, 144A | | | 30,785 | |
| | 50,000 | | | Endeavor Energy Resources LP/EER Finance, Inc., 6.625%, 7/15/2025, 144A | | | 53,500 | |
| | 5,000 | | | EQT Corp., 5.000%, 1/15/2029 | | | 5,272 | |
| | 55,000 | | | EQT Corp., 7.875%, 2/01/2025 | | | 62,631 | |
| | 225,000 | | | EQT Corp., 8.750%, 2/01/2030 | | | 275,625 | |
| | 85,000 | | | Leviathan Bond Ltd., 6.125%, 6/30/2025, 144A | | | 93,093 | |
| | | | Independent Energy — continued | |
| 125,000 | | | Leviathan Bond Ltd., 6.500%, 6/30/2027, 144A | | | 140,834 | |
| | 70,000 | | | Matador Resources Co., 5.875%, 9/15/2026 | | | 68,600 | |
| | 130,000 | | | MEG Energy Corp., 7.125%, 2/01/2027, 144A | | | 134,225 | |
| | 130,000 | | | Murphy Oil Corp., 6.375%, 12/01/2042 | | | 114,563 | |
| | 590,000 | | | Occidental Petroleum Corp., 2.900%, 8/15/2024 | | | 567,875 | |
| | 40,000 | | | Occidental Petroleum Corp., 3.000%, 2/15/2027 | | | 35,600 | |
| | 20,000 | | | Occidental Petroleum Corp., 3.400%, 4/15/2026 | | | 19,068 | |
| | 620,000 | | | Occidental Petroleum Corp., 3.500%, 6/15/2025 | | | 598,895 | |
| | 155,000 | | | Occidental Petroleum Corp., 3.500%, 8/15/2029 | | | 141,851 | |
| | 50,000 | | | Occidental Petroleum Corp., 4.100%, 2/15/2047 | | | 40,873 | |
| | 60,000 | | | Occidental Petroleum Corp., 4.200%, 3/15/2048 | | | 48,900 | |
| | 325,000 | | | Occidental Petroleum Corp., 4.400%, 8/15/2049 | | | 273,910 | |
| | 145,000 | | | Occidental Petroleum Corp., 5.550%, 3/15/2026 | | | 151,371 | |
| | 225,000 | | | Occidental Petroleum Corp., 5.875%, 9/01/2025 | | | 239,625 | |
| | 110,000 | | | Occidental Petroleum Corp., 8.500%, 7/15/2027 | | | 126,945 | |
| | 100,000 | | | Occidental Petroleum Corp., 8.875%, 7/15/2030 | | | 117,375 | |
| | 165,000 | | | Ovintiv Exploration, Inc., 5.375%, 1/01/2026 | | | 177,069 | |
| | 150,000 | | | Ovintiv, Inc., 6.500%, 8/15/2034 | | | 173,706 | |
| | 30,000 | | | Ovintiv, Inc., 6.625%, 8/15/2037 | | | 33,474 | |
| | 10,000 | | | Ovintiv, Inc., 7.375%, 11/01/2031 | | | 11,873 | |
| | 110,000 | | | Parsley Energy LLC/Parsley Finance Corp., 5.375%, 1/15/2025, 144A | | | 113,124 | |
| | 135,000 | | | Range Resources Corp., 9.250%, 2/01/2026 | | | 141,075 | |
| | 38,000 | | | Range Resources Corp., 5.000%, 3/15/2023 | | | 37,050 | |
| | 270,000 | | | Seven Generations Energy Ltd., 5.375%, 9/30/2025, 144A | | | 274,725 | |
| | 86,000 | | | SM Energy Co., 10.000%, 1/15/2025, 144A | | | 92,780 | |
| | 200,000 | | | Southwestern Energy Co., 6.450%, 1/23/2025 | | | 208,000 | |
| | 30,000 | | | Southwestern Energy Co., 7.500%, 4/01/2026 | | | 31,470 | |
| | 20,000 | | | Southwestern Energy Co., 7.750%, 10/01/2027 | | | 21,594 | |
| | 115,000 | | | Vine Oil & Gas LP/Vine Oil & Gas Finance Corp., 9.750%, 4/15/2023, 144A(f)(g) | | | 92,000 | |
| | 60,000 | | | WPX Energy, Inc., 5.250%, 10/15/2027 | | | 63,577 | |
| | 100,000 | | | WPX Energy, Inc., 5.875%, 6/15/2028 | | | 109,003 | |
| | | | | | | | |
| | | | | | | 6,196,418 | |
| | | | | | | | |
| | | | Industrial Other — 0.6% | |
| | 65,000 | | | Hillenbrand, Inc., 5.750%, 6/15/2025 | | | 70,200 | |
| | 445,000 | | | HTA Group Ltd. Co., 7.000%, 12/18/2025, 144A | | | 478,375 | |
| | 130,000 | | | Installed Building Products, Inc., 5.750%, 2/01/2028, 144A | | | 138,450 | |
| | | | | | | | |
| | | | | | | 687,025 | |
| | | | | | | | |
| | | | Integrated Energy — 0.6% | |
| | 30,000 | | | Cenovus Energy, Inc., 4.250%, 4/15/2027 | | | 32,761 | |
| | 20,000 | | | Cenovus Energy, Inc., 5.250%, 6/15/2037 | | | 22,642 | |
| | 110,000 | | | Cenovus Energy, Inc., 5.375%, 7/15/2025 | | | 124,019 | |
| | 200,000 | | | Cenovus Energy, Inc., 5.400%, 6/15/2047 | | | 234,781 | |
| | 200,000 | | | Geopark Ltd., 6.500%, 9/21/2024, 144A | | | 207,344 | |
| | | | | | | | |
| | | | | | | 621,547 | |
| | | | | | | | |
| | | | Leisure — 1.4% | |
| | 150,000 | | | Carnival Corp., 7.625%, 3/01/2026, 144A | | | 163,423 | |
| | 135,000 | | | Carnival Corp., 9.875%, 8/01/2027, 144A | | | 155,250 | |
| | 120,000 | | | Cedar Fair LP/Canada’s Wonderland Co./Magnum Management Corp., 5.375%, 6/01/2024 | | | 120,300 | |
| | 145,000 | | | Cedar Fair LP/Canada’s Wonderland Co./Magnum Management Corp., 6.500%, 10/01/2028, 144A | | | 157,238 | |
| | 110,000 | | | Live Nation Entertainment, Inc., 3.750%, 1/15/2028, 144A | | | 111,144 | |
| | 380,000 | | | Live Nation Entertainment, Inc., 4.750%, 10/15/2027, 144A | | | 389,470 | |
| | 175,000 | | | Royal Caribbean Cruises Ltd., 11.500%, 6/01/2025, 144A | | | 204,584 | |
See accompanying notes to financial statements.
27 |
Portfolio of Investments – as of December 31, 2020
Loomis Sayles High Income Fund – (continued)
| | | | | | | | |
Principal
Amount | | | Description | | Value (†) | |
| | | | Leisure — continued | |
| $ | 120,000 | | | Six Flags Entertainment Corp., 4.875%, 7/31/2024, 144A | | $ | 120,104 | |
| | 180,000 | | | Speedway Motorsports LLC/Speedway Funding II, Inc., 4.875%, 11/01/2027, 144A | | | 178,200 | |
| | | | | | | | |
| | | | | | | 1,599,713 | |
| | | | | | | | |
| | | | Lodging — 1.5% | |
| | 605,000 | | | Marriott Ownership Resorts, Inc., 4.750%, 1/15/2028 | | | 614,075 | |
| | 10,000 | | | Marriott Ownership Resorts, Inc., 6.125%, 9/15/2025, 144A | | | 10,650 | |
| | 130,000 | | | Marriott Ownership Resorts, Inc./ILG LLC, 6.500%, 9/15/2026 | | | 135,850 | |
| | 20,000 | | | Wyndham Destinations, Inc., 3.900%, 3/01/2023 | | | 20,400 | |
| | 570,000 | | | Wyndham Destinations, Inc., 4.625%, 3/01/2030, 144A | | | 602,775 | |
| | 235,000 | | | Wyndham Destinations, Inc., 6.625%, 7/31/2026, 144A | | | 269,075 | |
| | | | | | | | |
| | | | | | | 1,652,825 | |
| | | | | | | | |
| | | | Media Entertainment — 4.3% | |
| | 200,000 | | | Clear Channel International BV, 6.625%, 8/01/2025, 144A | | | 211,000 | |
| | 160,000 | | | Clear Channel Worldwide Holdings, Inc., 9.250%, 2/15/2024 | | | 162,000 | |
| | 255,000 | | | Diamond Sports Group LLC/Diamond Sports Finance Co., 5.375%, 8/15/2026, 144A | | | 207,187 | |
| | 180,000 | | | Diamond Sports Group LLC/Diamond Sports Finance Co., 6.625%, 8/15/2027, 144A | | | 108,900 | |
| | 265,000 | | | Gray Television, Inc., 4.750%, 10/15/2030, 144A | | | 269,969 | |
| | 260,000 | | | iHeartCommunications, Inc., 4.750%, 1/15/2028, 144A | | | 266,825 | |
| | 1,166,125 | | | iHeartCommunications, Inc., 8.375%, 5/01/2027 | | | 1,244,792 | |
| | 335,000 | | | Lamar Media Corp., 3.750%, 2/15/2028 | | | 344,279 | |
| | 235,000 | | | Meredith Corp., 6.875%, 2/01/2026 | | | 229,125 | |
| | 675,000 | | | Netflix, Inc., 4.875%, 6/15/2030, 144A | | | 776,250 | |
| | 105,000 | | | Nexstar Broadcasting, Inc., 5.625%, 7/15/2027, 144A | | | 112,481 | |
| | 190,000 | | | Nielsen Finance LLC/Nielsen Finance Co., 5.625%, 10/01/2028, 144A | | | 206,445 | |
| | 180,000 | | | Nielsen Finance LLC/Nielsen Finance Co., 5.875%, 10/01/2030, 144A | | | 203,666 | |
| | 120,000 | | | Outfront Media Capital LLC/Outfront Media Capital Corp., 4.625%, 3/15/2030, 144A | | | 122,657 | |
| | 35,000 | | | Outfront Media Capital LLC/Outfront Media Capital Corp., 6.250%, 6/15/2025, 144A | | | 36,925 | |
| | 170,000 | | | Terrier Media Buyer, Inc., 8.875%, 12/15/2027, 144A | | | 187,425 | |
| | 45,000 | | | Townsquare Media, Inc., 6.875%, 2/01/2026, 144A | | | 47,130 | |
| | 100,000 | | | Univision Communications, Inc., 6.625%, 6/01/2027, 144A | | | 107,405 | |
| | | | | | | | |
| | | | | | | 4,844,461 | |
| | | | | | | | |
| | | | Metals & Mining — 4.0% | |
| | 405,000 | | | ABJA Investment Co. Pte Ltd., 5.450%, 1/24/2028 | | | 426,501 | |
| | 210,000 | | | Alcoa Nederland Holding BV, 5.500%, 12/15/2027, 144A | | | 229,797 | |
| | 60,000 | | | Allegheny Technologies, Inc., 5.875%, 12/01/2027 | | | 63,150 | |
| | 175,000 | | | ArcelorMittal S.A., 7.000%, 3/01/2041 | | | 241,164 | |
| | 25,000 | | | Carpenter Technology Corp., 6.375%, 7/15/2028 | | | 27,589 | |
| | 285,000 | | | Cleveland-Cliffs, Inc., 9.875%, 10/17/2025, 144A | | | 335,231 | |
| | 265,000 | | | First Quantum Minerals Ltd., 6.500%, 3/01/2024, 144A | | | 272,287 | |
| | 845,000 | | | First Quantum Minerals Ltd., 6.875%, 3/01/2026, 144A | | | 880,912 | |
| | 255,000 | | | First Quantum Minerals Ltd., 6.875%, 10/15/2027, 144A | | | 276,675 | |
| | | | Metals & Mining — continued | |
| 210,000 | | | First Quantum Minerals Ltd., 7.500%, 4/01/2025, 144A | | | 218,663 | |
| | 190,000 | | | Freeport-McMoRan, Inc., 4.125%, 3/01/2028 | | | 199,263 | |
| | 340,000 | | | Freeport-McMoRan, Inc., 4.250%, 3/01/2030 | | | 366,350 | |
| | 20,000 | | | Freeport-McMoRan, Inc., 5.400%, 11/14/2034 | | | 25,025 | |
| | 60,000 | | | GrafTech Finance, Inc., 4.625%, 12/15/2028, 144A | | | 60,675 | |
| | 350,000 | | | Mineral Resources Ltd., 8.125%, 5/01/2027, 144A | | | 387,187 | |
| | 320,000 | | | Novelis Corp., 4.750%, 1/30/2030, 144A | | | 344,757 | |
| | 125,000 | | | United States Steel Corp., 6.250%, 3/15/2026 | | | 114,375 | |
| | 75,000 | | | United States Steel Corp., 6.875%, 8/15/2025 | | | 71,625 | |
| | | | | | | | |
| | | | | | | 4,541,226 | |
| | | | | | | | |
| | | | Midstream — 4.1% | |
| | 30,000 | | | Blue Racer Midstream LLC/Blue Racer Finance Corp., 7.625%, 12/15/2025, 144A | | | 31,950 | |
| | 80,000 | | | Buckeye Partners LP, 5.600%, 10/15/2044 | | | 76,900 | |
| | 55,000 | | | Buckeye Partners LP, 5.850%, 11/15/2043 | | | 54,117 | |
| | 40,000 | | | DCP Midstream Operating LP, 5.125%, 5/15/2029 | | | 44,365 | |
| | 230,000 | | | DCP Midstream Operating LP, 5.625%, 7/15/2027 | | | 254,992 | |
| | 185,000 | | | Energy Transfer Operating LP, 5.000%, 5/15/2050 | | | 200,335 | |
| | 5,000 | | | EnLink Midstream Partners LP, 5.450%, 6/01/2047 | | | 4,026 | |
| | 420,000 | | | EnLink Midstream Partners LP, 5.600%, 4/01/2044 | | | 337,050 | |
| | 110,000 | | | EQM Midstream Partners LP, 6.000%, 7/01/2025, 144A | | | 120,450 | |
| | 200,000 | | | EQM Midstream Partners LP, 6.500%, 7/01/2027, 144A | | | 225,207 | |
| | 80,000 | | | EQM Midstream Partners LP, Series 10Y, 5.500%, 7/15/2028 | | | 87,428 | |
| | 225,000 | | | Genesis Energy LP/Genesis Energy Finance Corp., 7.750%, 2/01/2028 | | | 215,438 | |
| | 105,000 | | | Harvest Midstream I LP, 7.500%, 9/01/2028, 144A | | | 111,694 | |
| | 665,000 | | | Hess Midstream Operations LP, 5.625%, 2/15/2026, 144A | | | 691,600 | |
| | 355,000 | | | New Fortress Energy, Inc., 6.750%, 9/15/2025, 144A | | | 377,074 | |
| | 105,000 | | | NGL Energy Partners LP/NGL Energy Finance Corp., 6.125%, 3/01/2025 | | | 66,544 | |
| | 145,000 | | | NuStar Logistics LP, 5.750%, 10/01/2025 | | | 154,425 | |
| | 115,000 | | | Sunoco Logistics Partners Operations LP, 5.400%, 10/01/2047 | | | 128,493 | |
| | 130,000 | | | Sunoco LP/Sunoco Finance Corp., 4.500%, 5/15/2029, 144A | | | 135,200 | |
| | 3,000 | | | Tallgrass Energy Partners LP/Tallgrass Energy Finance Corp., 5.500%, 9/15/2024, 144A | | | 3,053 | |
| | 5,000 | | | Tallgrass Energy Partners LP/Tallgrass Energy Finance Corp., 5.500%, 1/15/2028, 144A | | | 5,106 | |
| | 245,000 | | | Tallgrass Energy Partners LP/Tallgrass Energy Finance Corp., 6.000%, 3/01/2027, 144A | | | 253,881 | |
| | 255,000 | | | Targa Resources Partners LP/Targa Resources Partners Finance Corp., 5.500%, 3/01/2030 | | | 276,853 | |
| | 95,000 | | | Targa Resources Partners LP/Targa Resources Partners Finance Corp., 4.250%, 11/15/2023 | | | 95,475 | |
| | 155,000 | | | Targa Resources Partners LP/Targa Resources Partners Finance Corp., 4.875%, 2/01/2031, 144A | | | 168,886 | |
| | 200,000 | | | Western Midstream Operating LP, 5.050%, 2/01/2030 | | | 223,962 | |
| | 110,000 | | | Western Midstream Operating LP, 5.450%, 4/01/2044 | | | 111,240 | |
| | 105,000 | | | Western Midstream Operating LP, 6.250%, 2/01/2050 | | | 115,500 | |
| | | | | | | | |
| | | | | | | 4,571,244 | |
| | | | | | | | |
| | | | Non-Agency Commercial Mortgage-Backed Securities — 1.4% | |
| | 100,000 | | | CG-CCRE Commercial Mortgage Trust, Series 2014-FL2, Class COL1, 1-month LIBOR + 3.500%, 3.659%, 11/15/2031, 144A(b)(f)(g) | | | 70,471 | |
See accompanying notes to financial statements.
| 28
Portfolio of Investments – as of December 31, 2020
Loomis Sayles High Income Fund – (continued)
| | | | | | | | |
Principal
Amount | | | Description | | Value (†) | |
| | | | Non-Agency Commercial Mortgage-Backed Securities — continued | |
| $ | 225,000 | | | CG-CCRE Commercial Mortgage Trust, Series 2014-FL2, Class COL2, 1-month LIBOR + 4.500%, 4.659%, 11/15/2031, 144A(b)(f)(g) | | $ | 142,609 | |
| | 1,020,000 | | | Credit Suisse Mortgage Trust, Series 2014-USA, Class E, 4.373%, 9/15/2037, 144A(f)(g) | | | 746,845 | |
| | 380,000 | | | Starwood Retail Property Trust, Series 2014-STAR, Class D, 1-month LIBOR + 3.500%, 3.659%, 11/15/2027, 144A(b)(d)(e)(f) | | | 245,827 | |
| | 420,000 | | | Starwood Retail Property Trust, Series 2014-STAR, Class E, 1-month LIBOR + 4.400%, 4.559%, 11/15/2027, 144A(b)(d)(e)(f) | | | 144,277 | |
| | 60,000 | | | Wells Fargo Commercial Mortgage Trust, Series 2016-C36, Class C, 4.183%, 11/15/2059(a) | | | 43,273 | |
| | 130,000 | | | WFRBS Commercial Mortgage Trust, Series 2011-C3, Class D, 5.642%, 3/15/2044, 144A(a) | | | 60,620 | |
| | 80,000 | | | WFRBS Commercial Mortgage Trust, Series 2012-C10, Class C, 4.362%, 12/15/2045(a) | | | 49,100 | |
| | 125,000 | | | WFRBS Commercial Mortgage Trust, Series 2012-C7, Class E, 4.810%, 6/15/2045, 144A(a) | | | 55,467 | |
| | | | | | | | |
| | | | | | | 1,558,489 | |
| | | | | | | | |
| | | | Oil Field Services — 0.4% | |
| | 61,250 | | | Nabors Industries, Inc., 9.000%, 2/01/2025, 144A | | | 58,893 | |
| | 315,000 | | | Shelf Drilling Holdings Ltd., 8.250%, 2/15/2025, 144A | | | 144,900 | |
| | 198,900 | | | Transocean Guardian Ltd., 5.875%, 1/15/2024, 144A | | | 167,076 | |
| | 57,000 | | | Transocean Proteus Ltd., 6.250%, 12/01/2024, 144A | | | 53,509 | |
| | | | | | | | |
| | | | | | | 424,378 | |
| | | | | | | | |
| | | | Packaging — 1.4% | |
| | 570,000 | | | ARD Finance S.A., 7.250% PIK or 6.500% Cash, 6/30/2027, 144A(h) | | | 608,475 | |
| | 500,000 | | | Ardagh Packaging Finance PLC/Ardagh Holdings USA, Inc., 5.250%, 8/15/2027, 144A | | | 524,905 | |
| | 75,000 | | | Graham Packaging Co., Inc., 7.125%, 8/15/2028, 144A | | | 82,875 | |
| | 80,000 | | | Intelligent Packaging Ltd Finco, Inc./Intelligent Packaging Ltd. Co-Issuer LLC, 6.000%, 9/15/2028, 144A | | | 82,200 | |
| | 290,000 | | | Mauser Packaging Solutions Holding Co., 7.250%, 4/15/2025, 144A | | | 292,900 | |
| | | | | | | | |
| | | | | | | 1,591,355 | |
| | | | | | | | |
| | | | Pharmaceuticals — 3.5% | |
| | 725,000 | | | Bausch Health Cos., Inc., 5.250%, 1/30/2030, 144A | | | 761,250 | |
| | 430,000 | | | Bausch Health Cos., Inc., 5.250%, 2/15/2031, 144A | | | 449,230 | |
| | 155,000 | | | Catalent Pharma Solutions, Inc., 4.875%, 1/15/2026, 144A | | | 158,100 | |
| | 200,000 | | | Cheplapharm Arzneimittel GmbH, 5.500%, 1/15/2028, 144A | | | 207,902 | |
| | 195,000 | | | Endo Dac/Endo Finance LLC/Endo Finco, Inc., 6.000%, 6/30/2028, 144A | | | 165,750 | |
| | 170,000 | | | Jaguar Holding Co. II/PPD Development LP, 5.000%, 6/15/2028, 144A | | | 181,475 | |
| | 97,000 | | | Par Pharmaceutical, Inc., 7.500%, 4/01/2027, 144A | | | 105,245 | |
| | 320,000 | | | Teva Pharmaceutical Finance Netherlands III BV, 3.150%, 10/01/2026 | | | 307,603 | |
| | 1,845,000 | | | Teva Pharmaceutical Finance Netherlands III BV, 4.100%, 10/01/2046 | | | 1,642,050 | |
| | | | | | | | |
| | | | | | | 3,978,605 | |
| | | | | | | | |
| | | | Property & Casualty Insurance — 0.4% | |
| | 80,000 | | | AmWINS Group, Inc., 7.750%, 7/01/2026, 144A | | | 85,912 | |
| | 200,000 | | | Ardonagh Midco 2 PLC, 11.500%, 1/15/2027, 144A | | | 213,500 | |
| | | | Property & Casualty Insurance — continued | |
| 105,000 | | | AssuredPartners, Inc., 5.625%, 1/15/2029, 144A | | | 109,594 | |
| | | | | | | | |
| | | | | | | 409,006 | |
| | | | | | | | �� |
| | | | Refining — 0.5% | |
| | 50,000 | | | CVR Energy, Inc., 5.250%, 2/15/2025, 144A | | | 48,250 | |
| | 395,000 | | | Parkland Corp., 5.875%, 7/15/2027, 144A | | | 427,086 | |
| | 65,000 | | | PBF Holding Co. LLC/PBF Finance Corp., 6.000%, 2/15/2028 | | | 37,131 | |
| | 80,000 | | | PBF Holding Co. LLC/PBF Finance Corp., 9.250%, 5/15/2025, 144A | | | 78,872 | |
| | | | | | | | |
| | | | | | | 591,339 | |
| | | | | | | | |
| | | | REITs – Hotels — 0.3% | |
| | 75,000 | | | Service Properties Trust, 4.350%, 10/01/2024 | | | 74,062 | |
| | 240,000 | | | Service Properties Trust, 4.750%, 10/01/2026 | | | 237,000 | |
| | 65,000 | | | Service Properties Trust, 7.500%, 9/15/2025 | | | 74,901 | |
| | | | | | | | |
| | | | | | | 385,963 | |
| | | | | | | | |
| | | | REITs – Mortgage — 0.5% | |
| | 50,000 | | | Ladder Capital Finance Holdings LLLP/Ladder Capital Finance Corp., 4.250%, 2/01/2027, 144A | | | 49,125 | |
| | 540,000 | | | Ladder Capital Finance Holdings LLLP/Ladder Capital Finance Corp., 5.250%, 10/01/2025, 144A | | | 538,650 | |
| | 16,000 | | | Ladder Capital Finance Holdings LLLP/Ladder Capital Finance Corp., 5.875%, 8/01/2021, 144A | | | 16,000 | |
| | | | | | | | |
| | | | | | | 603,775 | |
| | | | | | | | |
| | | | REITs – Regional Malls — 0.2% | |
| | 175,000 | | | Brookfield Property REIT, Inc./BPR Cumulus LLC/BPR Nimbus LLC/GGSI Sellco LLC, 5.750%, 5/15/2026, 144A | | | 172,375 | |
| | | | | | | | |
| | | | Restaurants — 0.9% | |
| | 540,000 | | | 1011778 BC ULC/New Red Finance, Inc., 4.000%, 10/15/2030, 144A | | | 547,252 | |
| | 95,000 | | | Golden Nugget, Inc., 6.750%, 10/15/2024, 144A | | | 94,318 | |
| | 350,000 | | | Yum! Brands, Inc., 3.625%, 3/15/2031 | | | 353,791 | |
| | | | | | | | |
| | | | | | | 995,361 | |
| | | | | | | | |
| | | | Retailers — 1.4% | |
| | 75,000 | | | Asbury Automotive Group, Inc., 4.500%, 3/01/2028 | | | 78,188 | |
| | 83,000 | | | Asbury Automotive Group, Inc., 4.750%, 3/01/2030 | | | 89,017 | |
| | 370,000 | | | Carvana Co., 5.625%, 10/01/2025, 144A | | | 379,783 | |
| | 125,000 | | | Carvana Co., 5.875%, 10/01/2028, 144A | | | 129,695 | |
| | 35,000 | | | Group 1 Automotive, Inc., 4.000%, 8/15/2028, 144A | | | 36,077 | |
| | 50,000 | | | Ken Garff Automotive LLC, 4.875%, 9/15/2028, 144A | | | 52,000 | |
| | 140,000 | | | L Brands, Inc., 5.250%, 2/01/2028 | | | 146,101 | |
| | 75,000 | | | L Brands, Inc., 6.625%, 10/01/2030, 144A | | | 83,437 | |
| | 105,000 | | | L Brands, Inc., 6.750%, 7/01/2036 | | | 116,983 | |
| | 55,000 | | | L Brands, Inc., 6.875%, 11/01/2035 | | | 61,738 | |
| | 90,000 | | | Lithia Motors, Inc., 4.375%, 1/15/2031, 144A | | | 96,525 | |
| | 115,000 | | | Nordstrom, Inc., 5.000%, 1/15/2044 | | | 108,249 | |
| | 200,000 | | | PetSmart, Inc., 7.125%, 3/15/2023, 144A | | | 200,000 | |
| | 40,000 | | | PetSmart, Inc., 8.875%, 6/01/2025, 144A | | | 41,100 | |
| | | | | | | | |
| | | | | | | 1,618,893 | |
| | | | | | | | |
| | | | Supermarkets — 0.2% | |
| | 245,000 | | | Albertsons Cos., Inc./Safeway, Inc./New Albertsons LP/Albertsons LLC, 4.875%, 2/15/2030, 144A | | | 269,961 | |
| | | | | | | | |
| | | | Technology — 3.9% | |
| | 110,000 | | | BY Crown Parent LLC/BY Bond Finance, Inc., 4.250%, 1/31/2026, 144A | | | 112,750 | |
| | 145,000 | | | Camelot Finance S.A., 4.500%, 11/01/2026, 144A | | | 151,344 | |
| | 1,005,000 | | | CommScope Technologies LLC, 5.000%, 3/15/2027, 144A | | | 989,925 | |
See accompanying notes to financial statements.
29 |
Portfolio of Investments – as of December 31, 2020
Loomis Sayles High Income Fund – (continued)
| | | | | | | | |
Principal
Amount | | | Description | | Value (†) | |
| | | | Technology — continued | |
| $ | 86,000 | | | CommScope Technologies LLC, 6.000%, 6/15/2025, 144A | | $ | 87,935 | |
| | 405,000 | | | CommScope, Inc., 7.125%, 7/01/2028, 144A | | | 431,325 | |
| | 125,000 | | | Dell International LLC/EMC Corp., 8.350%, 7/15/2046, 144A | | | 189,102 | |
| | 465,000 | | | Iron Mountain, Inc., 4.875%, 9/15/2029, 144A | | | 490,575 | |
| | 80,000 | | | J2 Global, Inc., 4.625%, 10/15/2030, 144A | | | 84,400 | |
| | 95,000 | | | LogMeIn, Inc., 5.500%, 9/01/2027, 144A | | | 99,513 | |
| | 60,000 | | | NCR Corp., 5.000%, 10/01/2028, 144A | | | 63,300 | |
| | 70,000 | | | NCR Corp., 5.250%, 10/01/2030, 144A | | | 75,075 | |
| | 50,000 | | | NCR Corp., 8.125%, 4/15/2025, 144A | | | 55,682 | |
| | 260,000 | | | Open Text Holdings, Inc., 4.125%, 2/15/2030, 144A | | | 276,588 | |
| | 110,000 | | | Presidio Holdings, Inc., 4.875%, 2/01/2027, 144A | | | 116,686 | |
| | 110,000 | | | Presidio Holdings, Inc., 8.250%, 2/01/2028, 144A | | | 121,275 | |
| | 90,000 | | | Rackspace Technology Global, Inc., 5.375%, 12/01/2028, 144A | | | 94,293 | |
| | 65,000 | | | Sabre GLBL, Inc., 7.375%, 9/01/2025, 144A | | | 70,525 | |
| | 260,000 | | | Sabre GLBL, Inc., 9.250%, 4/15/2025, 144A | | | 309,400 | |
| | 15,000 | | | Science Applications International Corp., 4.875%, 4/01/2028, 144A | | | 15,900 | |
| | 90,000 | | | Sensata Technologies, Inc., 3.750%, 2/15/2031, 144A | | | 93,292 | |
| | 60,000 | | | Shift4 Payments LLC/Shift4 Payments Finance Sub, Inc., 4.625%, 11/01/2026, 144A | | | 62,400 | |
| | 210,000 | | | Veritas U.S., Inc./Veritas Bermuda Ltd., 7.500%, 9/01/2025, 144A | | | 215,512 | |
| | 105,000 | | | Xerox Holdings Corp., 5.000%, 8/15/2025, 144A | | | 111,748 | |
| | 105,000 | | | Xerox Holdings Corp., 5.500%, 8/15/2028, 144A | | | 111,421 | |
| | | | | | | | |
| | | | | | | 4,429,966 | |
| | | | | | | | |
| | | | Transportation Services — 0.2% | |
| | 185,000 | | | Avis Budget Car Rental LLC/Avis Budget Finance, Inc., 5.750%, 7/15/2027, 144A | | | 188,931 | |
| | | | | | | | |
| | | | Treasuries — 0.7% | |
| | 840,000 | | | U.S. Treasury Note, 1.125%, 8/31/2021 | | | 845,709 | |
| | | | | | | | |
| | | | Wireless — 0.9% | |
| | 440,000 | | | Altice France S.A., 5.125%, 1/15/2029, 144A | | | 455,400 | |
| | 505,000 | | | Kenbourne Invest S.A., 6.875%, 11/26/2024, 144A | | | 547,612 | |
| | | | | | | | |
| | | | | | | 1,003,012 | |
| | | | | | | | |
| | | | Wirelines — 1.1% | |
| | 200,000 | | | Cablevision Lightpath LLC, 5.625%, 9/15/2028, 144A | | | 209,250 | |
| | 25,000 | | | CenturyLink, Inc., 5.125%, 12/15/2026, 144A | | | 26,399 | |
| | 130,000 | | | Cincinnati Bell Telephone Co. LLC, 6.300%, 12/01/2028 | | | 137,872 | |
| | 225,000 | | | Telecom Italia Capital S.A., 6.375%, 11/15/2033 | | | 276,750 | |
| | 120,000 | | | Telecom Italia Capital S.A., 7.200%, 7/18/2036 | | | 161,900 | |
| | 130,000 | | | Uniti Group LP/Uniti Fiber Holdings, Inc./CSL Capital LLC, 7.875%, 2/15/2025, 144A | | | 139,647 | |
| | 235,000 | | | Uniti Group LP/Uniti Group Finance, Inc./CSL Capital LLC, 8.250%, 10/15/2023 | | | 236,763 | |
| | 100,000 | | | Windstream Escrow LLC/Windstream Escrow Finance Corp., 7.750%, 8/15/2028, 144A | | | 100,700 | |
| | | | | | | | |
| | | | | | | 1,289,281 | |
| | | | | | | | |
| | | | Total Non-Convertible Bonds
(Identified Cost $88,664,186) | | | 94,207,315 | |
| | | | | | | | |
| | | | | | | | |
| | Convertible Bonds — 4.7% | |
| | | | Airlines — 0.2% | |
| | 130,000 | | | Southwest Airlines Co., 1.250%, 5/01/2025 | | | 188,825 | |
| | | | | | | | |
| | | | Cable Satellite — 1.8% | |
| | 235,000 | | | DISH Network Corp., Zero Coupon, 12/15/2025, 144A | | | 236,112 | |
| | 1,615,000 | | | DISH Network Corp., 3.375%, 8/15/2026 | | | 1,539,469 | |
| | | | Cable Satellite — continued | |
| 240,000 | | | Liberty Media Corp., 0.500%, 12/01/2050, 144A | | | 255,751 | |
| | | | | | | | |
| | | | | | | 2,031,332 | |
| | | | | | | | |
| | | | Consumer Cyclical Services — 0.2% | |
| | 35,000 | | | Fiverr International Ltd., Zero Coupon, 11/01/2025, 144A | | | 42,242 | |
| | 140,000 | | | Uber Technologies, Inc., Zero Coupon, 12/15/2025, 144A | | | 143,225 | |
| | | | | | | | |
| | | | | | | 185,467 | |
| | | | | | | | |
| | | | Diversified Manufacturing — 0.1% | |
| | 160,000 | | | Greenbrier Cos., Inc. (The), 2.875%, 2/01/2024 | | | 161,675 | |
| | | | | | | | |
| | | | Healthcare — 0.5% | |
| | 180,000 | | | Integra LifeSciences Holdings Corp., 0.500%, 8/15/2025, 144A | | | 199,382 | |
| | 315,000 | | | Teladoc Health, Inc., 1.250%, 6/01/2027, 144A | | | 377,277 | |
| | | | | | | | |
| | | | | | | 576,659 | |
| | | | | | | | |
| | | | Industrial Other — 0.0% | |
| | 45,000 | | | Chegg, Inc., Zero Coupon, 9/01/2026, 144A | | | 50,320 | |
| | | | | | | | |
| | | | Oil Field Services — 0.1% | |
| | 150,000 | | | Oil States International, Inc., 1.500%, 2/15/2023 | | | 113,867 | |
| | | | | | | | |
| | | | Pharmaceuticals — 1.4% | |
| | 145,000 | | | Aerie Pharmaceuticals, Inc., 1.500%, 10/01/2024 | | | 132,956 | |
| | 185,000 | | | BioMarin Pharmaceutical, Inc., 0.599%, 8/01/2024 | | | 198,521 | |
| | 755,000 | | | BioMarin Pharmaceutical, Inc., 1.250%, 5/15/2027, 144A | | | 788,975 | |
| | 130,000 | | | Flexion Therapeutics, Inc., 3.375%, 5/01/2024 | | | 114,725 | |
| | 120,000 | | | Guardant Health, Inc., Zero Coupon, 11/15/2027, 144A | | | 140,403 | |
| | 150,000 | | | Neurocrine Biosciences, Inc., 2.250%, 5/15/2024 | | | 206,966 | |
| | | | | | | | |
| | | | | | | 1,582,546 | |
| | | | | | | | |
| | | | Technology — 0.4% | |
| | 95,000 | | | LivePerson, Inc., Zero Coupon, 12/15/2026, 144A | | | 103,771 | |
| | 55,000 | | | Lumentum Holdings, Inc., 0.500%, 12/15/2026 | | | 67,067 | |
| | 10,000 | | | Palo Alto Networks, Inc., 0.375%, 6/01/2025, 144A | | | 13,168 | |
| | 170,000 | | | Shift4 Payments, Inc., Zero Coupon, 12/15/2025, 144A | | | 207,449 | |
| | | | | | | | |
| | | | | | | 391,455 | |
| | | | | | | | |
| | | | Total Convertible Bonds
(Identified Cost $5,320,365) | | | 5,282,146 | |
| | | | | | | | |
| | | | Total Bonds and Notes
(Identified Cost $93,984,551) | | | 99,489,461 | |
| | | | | | | | |
| | | | | | | | |
| | Collateralized Loan Obligations — 0.4% | |
| | 250,000 | | | Carlyle Global Market Strategies CLO Ltd., Series 2015-2A, Class CR, 3-month LIBOR + 2.250%, 2.467%, 4/27/2027, 144A(b) | | | 241,429 | |
| | 250,000 | | | OZLM XXIII Ltd., Series 2019-23A, Class E, 3-month LIBOR + 6.800%, 7.037%, 4/15/2032, 144A(b) | | | 247,206 | |
| | | | | | | | |
| | | | Total Collateralized Loan Obligations
(Identified Cost $460,312) | | | 488,635 | |
| | | | | | | | |
| | | | | | | | |
| | Loan Participations — 0.2% | |
| | | | ABS Other — 0.2% | |
| | 294,855 | | | Harbour Aircraft Investments Ltd., Series 2017-1, Class C, 8.000%, 11/15/2037(d)(e)
(Identified Cost $294,231) | | | 161,345 | |
| | | | | | | | |
| | | | | | | | |
See accompanying notes to financial statements.
| 30
Portfolio of Investments – as of December 31, 2020
Loomis Sayles High Income Fund – (continued)
| | | | | | | | |
Shares | | | Description | | Value (†) | |
| | Preferred Stocks — 1.9% | |
| | | | Banking — 0.4% | |
| | 95 | | | Bank of America Corp., Series L, 7.250% | | $ | 144,265 | |
| | 197 | | | Wells Fargo & Co., Class A, Series L, 7.500% | | | 299,026 | |
| | | | | | | | |
| | | | | | | 443,291 | |
| | | | | | | | |
| | | | Electric — 0.1% | |
| | 2,008 | | | NextEra Energy, Inc., 5.279% | | | 102,087 | |
| | | | | | | | |
| | | | Energy — 0.0% | |
| | 137 | | | Chesapeake Energy Corp., 5.750%(d)(e)(f)(i) | | | — | |
| | 988 | | | Chesapeake Energy Corp., 5.750%(d)(e)(f)(i) | | | — | |
| | 20 | | | Chesapeake Energy Corp., 5.750%, 144A(d)(e)(f)(i) | | | — | |
| | | | | | | | |
| | | | | | | — | |
| | | | | | | | |
| | | | Food & Beverage — 1.2% | |
| | 13,040 | | | Bunge Ltd., 4.875% | | | 1,418,544 | |
| | | | | | | | |
| | | | Healthcare — 0.2% | |
| | 2,038 | | | Boston Scientific Corp., Series A, 5.500% | | | 223,303 | |
| | | | | | | | |
| | | | Total Preferred Stocks
(Identified Cost $2,796,913) | | | 2,187,225 | |
| | | | | | | | |
| | | | | | | | |
| | Common Stocks — 0.7% | |
| | | | Chemicals — 0.1% | |
| | 12,177 | | | Hexion Holdings Corp., Class B(i) | | | 157,449 | |
| | | | | | | | |
| | | | Energy Equipment & Services — 0.0% | |
| | 10,149 | | | McDermott International Ltd.(i) | | | 8,221 | |
| | | | | | | | |
| | | | Media — 0.3% | |
| | 41,970 | | | Clear Channel Outdoor Holdings, Inc.(i) | | | 69,250 | |
| | 17,204 | | | iHeartMedia, Inc., Class A(i) | | | 223,308 | |
| | | | | | | | |
| | | | | | | 292,558 | |
| | | | | | | | |
| | | | Oil, Gas & Consumable Fuels — 0.3% | |
| | 3,650 | | | Battalion Oil Corp.(i) | | | 30,295 | |
| | 10,363 | | | Whiting Petroleum Corp.(i) | | | 259,075 | |
| | | | | | | | |
| | | | | | | 289,370 | |
| | | | | | | | |
| | | | Total Common Stocks
(Identified Cost $2,139,376) | | | 747,598 | |
| | | | | | | | |
| | | | | | | | |
| | Other Investments — 0.1% | |
| | | | Aircraft ABS — 0.1% | |
| | 100 | | | ECAF I Blocker Ltd.(d)(e)(f)(j)
(Identified Cost $1,000,000) | | | 125,600 | |
| | | | | | | | |
| | | | | | | | |
| | Warrants — 0.0% | |
| | 20,319 | | | McDermott International Ltd., Expiration on 5/1/2024(d)(e)(i) | | | 19,303 | |
| | 22,577 | | | McDermott International Ltd., Expiration on 5/1/2024(d)(e)(i) | | | 12,643 | |
| | 466 | | | iHeartMedia, Inc., Expiration on 5/1/2039(d)(e)(i) | | | 6,049 | |
| | | | | | | | |
| | | | Total Warrants
(Identified Cost $38,915) | | | 37,995 | |
| | | | | | | | |
| | | | | | | | |
| | Short-Term Investments — 7.6% | |
| $ | 8,523,047 | | | Tri-Party Repurchase Agreement with Fixed Income Clearing Corporation, dated 12/31/2020 at 0.000% to be repurchased at $8,523,047 on 1/04/2021 collateralized by $8,349,100 U.S. Treasury Note,1.750% due 1/31/2023 valued at $8,693,582 including accrued interest (Note 2 of Notes to Financial Statements) (Identified Cost $8,523,047) | | | 8,523,047 | |
| | | | | | | | |
| | | | | | | | |
| | | | Total Investments — 99.2%
(Identified Cost $109,237,345) | | | 111,760,906 | |
| | | | Other assets less liabilities — 0.8% | | | 957,121 | |
| | | | | | | | |
| | | | Net Assets — 100.0% | | $ | 112,718,027 | |
| | | | | | | | |
| | | | | | | | |
| | (†) | | | See Note 2 of Notes to Financial Statements. | |
| | (a) | | | Variable rate security. The interest rate adjusts periodically based on; (i) changes in current interest rates and/or prepayments on underlying pools of assets, if applicable, (ii) reference to a base lending rate plus or minus a margin, and/or (iii) reference to a base lending rate adjusted by a multiplier and/or subject to certain floors or caps. Rate as of December 31, 2020 is disclosed. | |
| | (b) | | | Variable rate security. Rate as of December 31, 2020 is disclosed. | |
| | (c) | | | The issuer is in default with respect to interest and/or principal payments. Income is not being accrued. | |
| | (d) | | | Level 3 security. Value has been determined using significant unobservable inputs. See Note 3 of Notes to Financial Statements. | |
| | (e) | | | Fair valued by the Fund’s adviser. At December 31, 2020, the value of these securities amounted to $715,044 or 0.6% of net assets. See Note 2 of Notes to Financial Statements. | |
| | (f) | | | Illiquid security. (Unaudited) | | | | |
| | (g) | | | Securities classified as fair valued pursuant to the Fund’s pricing policies and procedures. At December 31, 2020, the value of these securities amounted to $1,051,925 or 0.9% of net assets. See Note 2 of Notes to Financial Statements. | |
| | (h) | | | Payment-in-kind security for which the issuer, at each interest payment date, may make interest payments in cash and/or additional principal. For the period ended December 31, 2020, interest payments were made in cash. | |
| | (i) | | | Non-income producing security. | | | | |
| | (j) | | | Securities subject to restriction on resale. At December 31, 2020, the restricted securities held by the Fund are as follows: | |
| | | | | |
| | | | | | | | | | | | | | |
| | | Acquisition
Date | | | Cost | | Value | | | % of
Net Assets | |
| ECAF I Blocker Ltd. | | | 12/20/2016 | | | $1,000,000 | | $ | 125,600 | | | | 0.1 | % |
| | | | | | |
| | | | | | |
| | 144A | | | All or a portion of these securities are exempt from registration under Rule 144A of the Securities Act of 1933. These securities may be resold in transactions exempt from registration, normally to qualified institutional buyers. At December 31, 2020, the value of Rule 144A holdings amounted to $60,735,106 or 53.9% of net assets. |
| | ABS | | | Asset-Backed Securities | | |
| | LIBOR | | | London Interbank Offered Rate | | |
| | MTN | | | Medium Term Note | | |
| | PIK | | | Payment-in-Kind | | |
| | REITs | | | Real Estate Investment Trusts | | |
See accompanying notes to financial statements.
31 |
Portfolio of Investments – as of December 31, 2020
Loomis Sayles High Income Fund – (continued)
Industry Summary at December 31, 2020
| | | | |
Cable Satellite | | | 7.2 | % |
Consumer Cyclical Services | | | 5.6 | |
Healthcare | | | 5.5 | |
Independent Energy | | | 5.5 | |
Pharmaceuticals | | | 4.9 | |
Aerospace & Defense | | | 4.8 | |
Automotive | | | 4.4 | |
Media Entertainment | | | 4.3 | |
Technology | | | 4.3 | |
Midstream | | | 4.1 | |
Metals & Mining | | | 4.0 | |
Food & Beverage | | | 3.6 | |
Finance Companies | | | 3.4 | |
Gaming | | | 3.2 | |
Other Investments, less than 2% each | | | 26.4 | |
Short-Term Investments | | | 7.6 | |
Collateralized Loan Obligations | | | 0.4 | |
| | | | |
Total Investments | | | 99.2 | |
Other assets less liabilities | | | 0.8 | |
| | | | |
Net Assets | | | 100.0 | % |
| | | | |
See accompanying notes to financial statements.
| 32
Portfolio of Investments – as of December 31, 2020
Loomis Sayles Intermediate Municipal Bond Fund
| | | | | | | | |
Principal
Amount | | | Description | | Value (†) | |
| | Bonds and Notes — 94.7% of Net Assets | |
| | Municipals — 94.7% | |
| | | | Arizona — 0.7% | |
| $ | 200,000 | | | City of Mesa, Excise Tax Revenue, 4.000%, 7/01/2037 | | $ | 246,546 | |
| | | | | | | | |
| | | | California — 3.3% | |
| | 1,000,000 | | | California State, GO, Various Purpose, Refunding, 4.000%, 3/01/2037 | | | 1,234,930 | |
| | | | | | | | |
| | | | Colorado — 6.2% | |
| | 260,000 | | | Colorado Springs Utilities System Revenue, Series B-2, 5.000%, 11/15/2033 | | | 292,581 | |
| | 400,000 | | | Denver City & County School District No. 1, GO, Prerefunded 12/01/2022@100, Series B, (State Aid Withholding), 5.000%, 12/01/2026 | | | 436,416 | |
| | 250,000 | | | Denver City & County, Airport System Revenue, Series A, AMT, 5.000%, 11/15/2030 | | | 309,107 | |
| | 500,000 | | | Regional Transportation District Sales Tax Revenue, Series A, 5.000%, 11/01/2028 | | | 662,730 | |
| | 500,000 | | | State of Colorado, Certificate of Participation, Series A, 4.000%, 12/15/2035 | | | 622,440 | |
| | | | | | | | |
| | | | | | | 2,323,274 | |
| | | | | | | | |
| | | | Delaware — 1.1% | |
| | 250,000 | | | University of Delaware, Revenue Bond, 5.000%, 11/01/2043 | | | 391,558 | |
| | | | | | | | |
| | | | Florida — 11.7% | |
| | 500,000 | | | Alachua County School Board, Certificate of Participation, (AGM Insured), 5.000%, 7/01/2028 | | | 638,540 | |
| | 340,000 | | | Bay County School Board, Certificate of Participation, Series A, (AGM Insured), 5.000%, 7/01/2033 | | | 441,398 | |
| | 230,000 | | | City of Cape Coral FL Utility Improvement Assessment, Various Areas, Water & Sewer Revenue, (AGM Insured), 3.000%, 9/01/2027 | | | 259,649 | |
| | 90,000 | | | City of Cape Coral FL Utility Improvement Assessment, Various Areas, Water & Sewer Revenue, (AGM Insured), 3.000%, 9/01/2028 | | | 102,538 | |
| | 200,000 | | | Clay County, Sales Surtax Revenue, 4.000%, 10/01/2039 | | | 236,154 | |
| | 225,000 | | | County of Collier FL Special Obligation, Revenue Bonds, Series A, 4.000%, 10/01/2036 | | | 280,501 | |
| | 500,000 | | | Fernandina Beach Utility System Revenue, Refunding, Series A, 5.000%, 9/01/2027 | | | 558,680 | |
| | 500,000 | | | Miami-Dade County FL Aviation Revenue, Refunding, Series A, 4.000%, 10/01/2039 | | | 596,420 | |
| | 400,000 | | | Sarasota County FL Utility System Revenue, 5.000%, 10/01/2023 | | | 452,364 | |
| | 225,000 | | | Sarasota County FL Utility System Revenue, Series A, 5.000%, 10/01/2027 | | | 293,353 | |
| | 400,000 | | | Volusia County Educational Facility Authority Revenue, Embry-Riddle Aeronautical University, Inc., Series B, 5.000%, 10/15/2025 | | | 478,508 | |
| | | | | | | | |
| | | | | | | 4,338,105 | |
| | | | | | | | |
| | | | Georgia — 3.1% | |
| | 650,000 | | | Georgia State Road & Tollway Authority, 5.000%, 6/01/2032 | | | 880,438 | |
| | 250,000 | | | Savannah Hospital Authority Revenue, St. Joseph’s/Candler Health System Obligated Group, Series A, 5.500%, 7/01/2027 | | | 277,620 | |
| | | | | | | | |
| | | | | | | 1,158,058 | |
| | | | | | | | |
| | | | Illinois — 3.1% | |
| 540,000 | | | Chicago Midway International Airport Revenue, Second Lien, Refunding, Series A, AMT, 5.000%, 1/01/2031 | | | 595,204 | |
| | 500,000 | | | Chicago O’Hare International Airport, Series C, AMT, 5.000%, 1/01/2046 | | | 563,705 | |
| | | | | | | | |
| | | | | | | 1,158,909 | |
| | | | | | | | |
| | | | Louisiana — 1.4% | |
| | 200,000 | | | New Orleans Aviation Board, General Airport Revenue, North Terminal Project, Series B, AMT, 5.000%, 1/01/2035 | | | 237,356 | |
| | 250,000 | | | New Orleans Aviation Board, General Airport Revenue, North Terminal Project, Series B, AMT, 5.000%, 1/01/2036 | | | 295,990 | |
| | | | | | | | |
| | | | | | | 533,346 | |
| | | | | | | | |
| | | | Maryland — 1.2% | |
| | 360,000 | | | Maryland Health & Higher Educational Facilities Authority, Series B2, 5.000%, 7/01/2045 | | | 447,782 | |
| | | | | | | | |
| | | | Massachusetts — 4.0% | |
| | 500,000 | | | Commonwealth of Massachusetts, GO, Series D, 5.000%, 7/01/2045 | | | 655,945 | |
| | 500,000 | | | Massachusetts State Development Finance Agency Revenue, Series P, 5.000%, 7/01/2050 | | | 825,975 | |
| | | | | | | | |
| | | | | | | 1,481,920 | |
| | | | | | | | |
| | | | Michigan — 2.0% | |
| | 600,000 | | | University of Michigan, 5.000%, 4/01/2032 | | | 733,506 | |
| | | | | | | | |
| | | | Nebraska — 0.9% | |
| | 250,000 | | | Douglas County Hospital Authority No. 2, Series A, 5.000%, 11/15/2030 | | | 339,020 | |
| | | | | | | | |
| | | | Nevada — 2.9% | |
| | 500,000 | | | City of Henderson, GO, Various Purpose, Refunding, 5.000%, 6/01/2026 | | | 580,485 | |
| | 240,000 | | | Las Vegas Convention & Visitors Authority, Refunding, Series C, 5.000%, 7/01/2032 | | | 264,986 | |
| | 200,000 | | | Washoe County School District, GO, Series A, 5.000%, 10/01/2025 | | | 242,060 | |
| | | | | | | | |
| | | | | | | 1,087,531 | |
| | | | | | | | |
| | | | New Jersey — 2.3% | |
| | 265,000 | | | New Jersey Health Care Facilities Financing Authority Revenue, Refunding, Virtua Health, Inc., 5.000%, 7/01/2023 | | | 295,870 | |
| | 500,000 | | | New Jersey State Turnpike Authority Revenue, Series A, 5.000%, 1/01/2032 | | | 568,865 | |
| | | | | | | | |
| | | | | | | 864,735 | |
| | | | | | | | |
| | | | New Mexico — 1.6% | |
| | 500,000 | | | New Mexico Hospital Equipment Loan Council Revenue, Presbyterian Healthcare Services Obligated Group, Refunding, 5.000%, 8/01/2031 | | | 588,865 | |
| | | | | | | | |
| | | | New York — 5.2% | |
| | 500,000 | | | Metropolitan Transportation Authority, Series D, 4.000%, 11/15/2032 | | | 537,250 | |
| | 500,000 | | | New York City Transitional Finance Authority Future Tax Secured Revenue, Series D, 4.000%, 11/01/2038 | | | 607,975 | |
| | 400,000 | | | New York City, GO, Series A1, 5.000%, 8/01/2030 | | | 547,064 | |
| | 200,000 | | | New York State Dormitory Authority, Series D, 4.000%, 2/15/2038 | | | 239,080 | |
| | | | | | | | |
| | | | | | | 1,931,369 | |
| | | | | | | | |
See accompanying notes to financial statements.
33 |
Portfolio of Investments – as of December 31, 2020
Loomis Sayles Intermediate Municipal Bond Fund – (continued)
| | | | | | | | |
Principal
Amount | | | Description | | Value (†) | |
| | | | North Carolina — 1.8% | |
| $ | 180,000 | | | Buncombe County, Limited Obligation, Revenue, Series A, 4.000%, 6/01/2034 | | $ | 223,720 | |
| | 400,000 | | | North Carolina Agricultural & Technical University System Revenue, Series A, 4.000%, 10/01/2045 | | | 437,592 | |
| | | | | | | | |
| | | | | | | 661,312 | |
| | | | | | | | |
| | | | North Dakota — 2.1% | |
| | 250,000 | | | City of West Fargo, GO, Refunding, Series A, 4.000%, 5/01/2026 | | | 290,960 | |
| | 350,000 | | | North Dakota Building Authority, Series A, 5.000%, 12/01/2030 | | | 482,542 | |
| | | | | | | | |
| | | | | | | 773,502 | |
| | | | | | | | |
| | | | Ohio — 4.7% | |
| | 500,000 | | | Columbus, GO, Various Purpose, Series A, 5.000%, 8/15/2023 | | | 562,590 | |
| | 500,000 | | | Hamilton County Hospital Facilities Revenue, UC Health Obligated Group, 5.000%, 2/01/2024 | | | 567,670 | |
| | 500,000 | | | Ohio State University (The), Series A, 5.000%, 12/01/2026 | | | 635,100 | |
| | | | | | | | |
| | | | | | | 1,765,360 | |
| | | | | | | | |
| | | | Oklahoma — 3.4% | |
| | 1,000,000 | | | Oklahoma Water Resources Board, Series A, 5.000%, 4/01/2027 | | | 1,282,650 | |
| | | | | | | | |
| | | | Oregon — 0.8% | |
| | 230,000 | | | Port of Portland, Airport Revenue, Portland International Airport, Series 25-B, 5.000%, 7/01/2028 | | | 292,404 | |
| | | | | | | | |
| | | | Pennsylvania — 0.8% | |
| | 270,000 | | | Allegheny County Higher Education Building Authority, Refunding, Series A, 5.000%, 3/01/2029 | | | 311,010 | |
| | | | | | | | |
| | | | Rhode Island — 1.5% | |
| | 500,000 | | | Rhode Island Clean Water Finance Agency Pollution Control Agency Revolving Fund-Pooled Loan, Series A, 5.000%, 10/01/2024 | | | 565,455 | |
| | | | | | | | |
| | | | Tennessee — 2.3% | |
| | 185,000 | | | Greeneville Health & Educational Facilities Board, Series A, 5.000%, 7/01/2028 | | | 234,286 | |
| | 500,000 | | | Metropolitan Government Nashville & Davidson County Health & Educational Facilities Board Revenue, Vanderbilt University Medical Center Obligated Group, Series A, 5.000%, 7/01/2030 | | | 602,885 | |
| | | | | | | | |
| | | | | | | 837,171 | |
| | | | | | | | |
| | | | Texas — 15.3% | |
| | 1,000,000 | | | Bexar County TX, GO, Series B, Prerefunded 6/15/2023@100, 5.000%, 6/15/2043 | | | 1,117,770 | |
| | 500,000 | | | Grand Parkway Transportation Corp, Series A, Prerefunded 10/01/2023@100, 5.500%, 4/01/2053 | | | 571,900 | |
| | 500,000 | | | Harris County Toll Road Authority (The), 4.000%, 8/15/2038 | | | 620,715 | |
| | 1,000,000 | | | Houston TX Combined Utility System Revenue, Refunding, Series A, (AGM Insured), Zero Coupon, 12/01/2025 | | | 971,210 | |
| | 300,000 | | | Lower Colorado River Authority, Refunding, 5.000%, 5/15/2030 | | | 395,004 | |
| | 500,000 | | | New Braunfels TX Utility System Revenue, 5.000%, 7/01/2029 | | | 653,100 | |
| | 400,000 | | | Tarrant County Cultural Education Facilities Finance Corp. Revenue, Methodist Hospitals of Dallas, 5.000%, 10/01/2024 | | | 449,864 | |
| | 250,000 | | | Texas City Independent School District, GO, (PSF-GTD), 4.000%, 8/15/2034 | | | 300,602 | |
| | | | Texas — continued | |
| 500,000 | | | Texas Public Finance Authority, Refunding, 4.000%, 2/01/2034 | | | 610,090 | |
| | | | | | | | |
| | | | | | | 5,690,255 | |
| | | | | | | | |
| | | | Utah — 2.2% | |
| | 500,000 | | | Utah County Hospital Revenue, IHC Health Services, Inc., Series A, 4.000%, 5/15/2043 | | | 601,085 | |
| | 180,000 | | | Utah Transit Authority Sales Tax Revenue, Series A, Prerefunded 06/15/2025@100, 5.000%, 6/15/2038 | | | 217,766 | |
| | | | | | | | |
| | | | | | | 818,851 | |
| | | | | | | | |
| | | | Virginia — 0.8% | |
| | 225,000 | | | Fairfax County, GO, Series A, 5.000%, 10/01/2034 | | | 305,159 | |
| | | | | | | | |
| | | | Washington — 7.6% | |
| | 750,000 | | | Auburn School District No. 408 of King & Pierce Counties, GO, (SCH BD GTY), 3.000%, 12/01/2035 | | | 871,380 | |
| | 500,000 | | | King County Public Hospital District No. 2, GO, Evergreen Healthcare, Series B, 5.000%, 12/01/2032 | | | 581,865 | |
| | 500,000 | | | Port of Seattle Revenue, AMT, 5.000%, 7/01/2029 | | | 547,245 | |
| | 500,000 | | | Snohomish County School District No. 15 Edmonds, GO, 5.000%, 12/01/2031 | | | 571,420 | |
| | 200,000 | | | State of Washington, GO, Series 2015-C, Class R, 5.000%, 7/01/2029 | | | 235,934 | |
| | | | | | | | |
| | | | | | | 2,807,844 | |
| | | | | | | | |
| | | | Wisconsin — 0.7% | |
| | 225,000 | | | Wisconsin Health & Educational Facilities Authority Revenue, Aspirus, Inc. Obligated Group, Refunding, Series A, 5.000%, 8/15/2031 | | | 258,075 | |
| | | | | | | | |
| | | | Total Bonds and Notes
(Identified Cost $33,626,252) | | | 35,228,502 | |
| | | | | | | | |
| | | | | | | | |
| | Short-Term Investments — 8.4% | | | | |
| | 1,100,000 | | | Northern Institutional Municipal Portfolio | | | 1,100,000 | |
| | 2,032,420 | | | Tri-Party Repurchase Agreement with Fixed Income Clearing Corporation, dated 12/31/2020 at 0.000% to be repurchased at $2,032,420 on 1/04/2021 collateralized by $2,003,700 U.S. Treasury Note, 1.500% due 2/28/2023 valued at $2,073,157 including accrued interest (Note 2 of Notes to Financial Statements) | | | 2,032,420 | |
| | | | | | | | |
| | | | Total Short-Term Investments
(Identified Cost $3,132,420) | | | 3,132,420 | |
| | | | | | | | |
| | | | | | | | |
| | | | Total Investments — 103.1%
(Identified Cost $36,758,672) | | | 38,360,922 | |
| | | | Other assets less liabilities — (3.1)% | | | (1,169,459 | ) |
| | | | | | | | |
| | | | Net Assets — 100.0% | | $ | 37,191,463 | |
| | | | | | | | |
| | | | | | | | |
| | (†) | | | See Note 2 of Notes to Financial Statements. | |
| | | | | | | | |
| | AGM | | | Assured Guaranty Municipal Corporation | |
| | AMT | | | Alternative Minimum Tax | |
| | GO | | | General Obligation | |
| | PSF-GTD | | | Permanent School Fund Guarantee Program | |
See accompanying notes to financial statements.
| 34
Portfolio of Investments – as of December 31, 2020
Loomis Sayles Intermediate Municipal Bond Fund – (continued)
Industry Summary at December 31, 2020
| | | | |
General Purpose Public Improvement | | | 18.4 | % |
Hospitals | | | 14.1 | |
Higher Education | | | 11.0 | |
Water and Sewer | | | 10.5 | |
Primary Secondary Education | | | 9.9 | |
Airports | | | 9.2 | |
Toll Roads, Streets & Highways | | | 7.1 | |
Mass Rapid Transportation | | | 3.9 | |
Pre-Refunded | | | 3.0 | |
Combined Utilities | | | 2.6 | |
Other Investments, less than 2% each | | | 5.0 | |
Short-Term Investments | | | 8.4 | |
| | | | |
Total Investments | | | 103.1 | |
Other assets less liabilities | | | (3.1 | ) |
| | | | |
Net Assets | | | 100.0 | % |
| | | | |
See accompanying notes to financial statements.
35 |
Portfolio of Investments – as of December 31, 2020
Loomis Sayles International Growth Fund
| | | | | | | | |
| Shares | | | Description | | Value (†) | |
| | Common Stocks — 98.7% of Net Assets | |
| | | | Argentina — 7.7% | |
| | 699 | | | MercadoLibre, Inc.(a) | | $ | 1,170,979 | |
| | | | | | | | |
| | | | Australia — 3.2% | |
| | 20,711 | | | WiseTech Global Ltd. | | | 492,201 | |
| | | | | | | | |
| | | | Belgium — 2.3% | |
| | 5,045 | | | Anheuser-Busch InBev S.A. | | | 351,973 | |
| | | | | | | | |
| | | | Brazil — 3.9% | |
| | 193,906 | | | Ambev S.A., ADR | | | 593,350 | |
| | | | | | | | |
| | | | China — 31.7% | |
| | 3,666 | | | Alibaba Group Holding Ltd., Sponsored ADR(a) | | | 853,189 | |
| | 2,568 | | | Baidu, Inc., Sponsored ADR(a) | | | 555,304 | |
| | 36,500 | | | Budweiser Brewing Co. APAC Ltd., 144A | | | 120,572 | |
| | 288,000 | | | Dali Foods Group Co. Ltd., 144A | | | 164,609 | |
| | 2,200 | | | Kweichow Moutai Co. Ltd., Class A | | | 676,137 | |
| | 14,000 | | | Tencent Holdings Ltd. | | | 1,007,353 | |
| | 14,862 | | | Trip.com Group Ltd., ADR(a) | | | 501,295 | |
| | 16,172 | | | Vipshop Holdings Ltd., ADR(a) | | | 454,595 | |
| | 8,688 | | | Yum China Holdings, Inc. | | | 495,998 | |
| | | | | | | | |
| | | | | | | 4,829,052 | |
| | | | | | | | |
| | | | Denmark — 2.4% | |
| | 5,161 | | | Novo Nordisk A/S, Class B | | | 360,027 | |
| | | | | | | | |
| | | | France — 4.2% | |
| | 1,556 | | | EssilorLuxottica S.A. | | | 242,479 | |
| | 4,630 | | | Sodexo S.A. | | | 391,576 | |
| | | | | | | | |
| | | | | | | 634,055 | |
| | | | | | | | |
| | | | Germany — 3.0% | |
| | 3,482 | | | SAP SE | | | 450,984 | |
| | | | | | | | |
| | | | Japan — 5.3% | |
| | 2,600 | | | FANUC Corp. | | | 641,807 | |
| | 3,500 | | | Unicharm Corp. | | | 165,991 | |
| | | | | | | | |
| | | | | | | 807,798 | |
| | | | | | | | |
| | | | Macau — 1.3% | |
| | 25,000 | | | Galaxy Entertainment Group Ltd. | | | 194,613 | |
| | | | | | | | |
| | | | Netherlands — 7.2% | |
| | 320 | | | Adyen NV, 144A(a) | | | 743,534 | |
| | 2,214 | | | NXP Semiconductors NV | | | 352,048 | |
| | | | | | | | |
| | | | | | | 1,095,582 | |
| | | | | | | | |
| | | | Switzerland — 15.4% | |
| | 1,069 | | | Kuehne & Nagel International AG, (Registered) | | | 242,576 | |
| | 4,275 | | | Nestle S.A., (Registered) | | | 505,353 | |
| | 7,982 | | | Novartis AG, (Registered) | | | 751,568 | |
| | 2,408 | | | Roche Holding AG | | | 838,703 | |
| | | | | | | | |
| | | | | | | 2,338,200 | |
| | | | | | | | |
| | | | United Kingdom — 9.8% | |
| | 4,043 | | | Diageo PLC | | | 159,977 | |
| | 11,162 | | | Experian PLC | | | 424,029 | |
| | 5,939 | | | Reckitt Benckiser Group PLC | | | 530,081 | |
| | 6,348 | | | Unilever PLC | | | 384,378 | |
| | | | | | | | |
| | | | | | | 1,498,465 | |
| | | | | | | | |
| | | | United States — 1.3% | |
| | 2,568 | | | Core Laboratories NV | | $ | 68,078 | |
| | 6,034 | | | Schlumberger NV | | | 131,722 | |
| | | | | | | | |
| | | | | | | 199,800 | |
| | | | | | | | |
| | | | Total Common Stocks
(Identified Cost $14,828,544) | | | 15,017,079 | |
| | | | | | | | |
| | | | | | | | |
| | | | Total Investments — 98.7%
(Identified Cost $14,828,544) | | | 15,017,079 | |
| | | | Other assets less liabilities — 1.3% | | | 202,753 | |
| | | | | | | | |
| | | | Net Assets — 100.0% | | $ | 15,219,832 | |
| | | | | | | | |
| | | | | | | | |
| | (†) | | | See Note 2 of Notes to Financial Statements. | |
| | (a) | | | Non-income producing security. | |
| | | | | |
| | 144A | | | All or a portion of these securities are exempt from registration under Rule 144A of the Securities Act of 1933. These securities may be resold in transactions exempt from registration, normally to qualified institutional buyers. At December 31, 2020, the value of Rule 144A holdings amounted to $1,028,715 or 6.8% of net assets. | |
| | ADR | | | An American Depositary Receipt is a certificate issued by a custodian bank representing the right to receive securities of the foreign issuer described. The values of ADRs may be significantly influenced by trading on exchanges not located in the United States. | |
Industry Summary at December 31, 2020
| | | | |
Internet & Direct Marketing Retail | | | 19.6 | % |
Pharmaceuticals | | | 12.9 | |
Beverages | | | 12.4 | |
Interactive Media & Services | | | 10.2 | |
Hotels, Restaurants & Leisure | | | 7.2 | |
Software | | | 6.2 | |
IT Services | | | 4.9 | |
Household Products | | | 4.6 | |
Food Products | | | 4.4 | |
Machinery | | | 4.2 | |
Professional Services | | | 2.8 | |
Personal Products | | | 2.5 | |
Semiconductors & Semiconductor Equipment | | | 2.3 | |
Other Investments, less than 2% each | | | 4.5 | |
| | | | |
Total Investments | | | 98.7 | |
Other assets less liabilities | | | 1.3 | |
| | | | |
Net Assets | | | 100.0 | % |
| | | | |
Currency Exposure Summary at December 31, 2020
| | | | |
United States Dollar | | | 34.0 | % |
Euro | | | 16.9 | |
Swiss Franc | | | 15.4 | |
Hong Kong Dollar | | | 9.8 | |
British Pound | | | 7.3 | |
Japanese Yen | | | 5.3 | |
Yuan Renminbi | | | 4.4 | |
Australian Dollar | | | 3.2 | |
Danish Krone | | | 2.4 | |
| | | | |
Total Investments | | | 98.7 | |
Other assets less liabilities | | | 1.3 | |
| | | | |
Net Assets | | | 100.0 | % |
| | | | |
See accompanying notes to financial statements.
| 36
Portfolio of Investments – as of December 31, 2020
Loomis Sayles Investment Grade Bond Fund
| | | | | | | | |
Principal
Amount | | | Description | | Value (†) | |
| | Bonds and Notes — 91.9% of Net Assets | |
| | Non-Convertible Bonds — 90.5% | |
| | | | ABS Car Loan — 6.3% | |
| $ | 13,891,077 | | | Ally Auto Receivables Trust, Series 2019-1, Class A3, 2.910%, 9/15/2023 | | $ | 14,119,821 | |
| | 7,865,000 | | | American Credit Acceptance Receivables Trust, Series 2019-3, Class D, 2.890%, 9/12/2025, 144A | | | 8,114,481 | |
| | 1,965,000 | | | AmeriCredit Automobile Receivables Trust, Series 2018-2, Class D, 4.010%, 7/18/2024 | | | 2,081,733 | |
| | 10,515,000 | | | AmeriCredit Automobile Receivables Trust, Series 2018-3, Class D, 4.040%, 11/18/2024 | | | 11,190,408 | |
| | 25,880,000 | | | AmeriCredit Automobile Receivables Trust, Series 2019-1, Class D, 3.620%, 3/18/2025 | | | 27,518,478 | |
| | 12,340,000 | | | AmeriCredit Automobile Receivables Trust, Series 2019-2, Class D, 2.990%, 6/18/2025 | | | 12,910,483 | |
| | 1,395,000 | | | AmeriCredit Automobile Receivables Trust, Series 2020-2, Class D, 2.130%, 3/18/2026 | | | 1,442,950 | |
| | 4,800,000 | | | Avis Budget Rental Car Funding AESOP LLC, Series 2020-2A, Class A, 2.020%, 2/20/2027, 144A | | | 4,879,800 | |
| | 3,650,000 | | | CarMax Auto Owner Trust, Series 2018-3, Class D, 3.910%, 1/15/2025 | | | 3,780,873 | |
| | 13,585,000 | | | CarMax Auto Owner Trust, Series 2019-1, Class D, 4.040%, 8/15/2025 | | | 14,278,817 | |
| | 5,811,000 | | | CarMax Auto Owner Trust, Series 2019-2, Class D, 3.410%, 10/15/2025 | | | 6,046,495 | |
| | 2,315,000 | | | CarMax Auto Owner Trust, Series 2019-3, Class D, 2.850%, 1/15/2026 | | | 2,393,911 | |
| | 4,625,000 | | | CarMax Auto Owner Trust, Series 2020-1, Class D, 2.640%, 7/15/2026 | | | 4,769,739 | |
| | 1,800,000 | | | Credit Acceptance Auto Loan Trust, Series 2017-3A, Class C, 3.480%, 10/15/2026, 144A | | | 1,815,489 | |
| | 23,320,000 | | | Credit Acceptance Auto Loan Trust, Series 2019-1A, Class C, 3.940%, 6/15/2028, 144A | | | 24,376,550 | |
| | 2,525,000 | | | Credit Acceptance Auto Loan Trust, Series 2020-2A, Class C, 2.730%, 11/15/2029, 144A | | | 2,570,632 | |
| | 275,000 | | | Credit Acceptance Auto Loan Trust, Series 2020-3A, Class C, 2.280%, 2/15/2030, 144A | | | 279,258 | |
| | 6,555,000 | | | Drive Auto Receivables Trust, Series 2018-5, Class D, 4.300%, 4/15/2026 | | | 6,920,566 | |
| | 16,395,000 | | | Drive Auto Receivables Trust, Series 2019-1, Class D, 4.090%, 6/15/2026 | | | 17,173,238 | |
| | 3,700,000 | | | Drive Auto Receivables Trust, Series 2019-2, Class D, 3.690%, 8/17/2026 | | | 3,891,092 | |
| | 10,760,000 | | | DT Auto Owner Trust, Series 2019-1A, Class D, 3.870%, 11/15/2024, 144A | | | 11,200,279 | |
| | 3,950,000 | | | DT Auto Owner Trust, Series 2019-2A, Class D, 3.480%, 2/18/2025, 144A | | | 4,080,619 | |
| | 3,400,000 | | | DT Auto Owner Trust, Series 2019-3A, Class D, 2.960%, 4/15/2025, 144A | | | 3,514,868 | |
| | 3,790,000 | | | First Investors Auto Owner Trust, Series 2019-1A, Class D, 3.550%, 4/15/2025, 144A | | | 3,937,650 | |
| | 4,610,000 | | | Flagship Credit Auto Trust, Series 2019-3, Class D, 2.860%, 12/15/2025, 144A | | | 4,803,669 | |
| | 30,600,000 | | | Ford Credit Auto Owner Trust, Series 2020-B, Class A3, 0.560%, 10/15/2024 | | | 30,736,078 | |
| | 15,340,000 | | | Ford Credit Auto Owner Trust, Series 2020-C, Class A3, 0.410%, 7/15/2025 | | | 15,397,405 | |
| | 8,555,000 | | | GLS Auto Receivables Trust, Series 2019-2A, Class C, 3.540%, 2/18/2025, 144A | | | 8,936,549 | |
| | | | ABS Car Loan — continued | |
| 10,962,227 | | | GM Financial Consumer Automobile Receivables Trust, Series 2019-1, Class A3, 2.970%, 11/16/2023 | | | 11,150,561 | |
| | 6,255,000 | | | GM Financial Consumer Automobile Receivables Trust, Series 2020-1, Class A3, 1.840%, 9/16/2024 | | | 6,390,602 | |
| | 1,400,000 | | | GMF Floorplan Owner Revolving Trust, Series 2020-1, Class C, 1.480%, 8/15/2025, 144A | | | 1,407,134 | |
| | 5,594,448 | | | Honda Auto Receivables Owner Trust, Series 2019-1, Class A3, 2.830%, 3/20/2023 | | | 5,689,587 | |
| | 6,655,000 | | | Nissan Auto Receivables Owner Trust, Series 2019-C, Class A3, 1.930%, 7/15/2024 | | | 6,790,729 | |
| | 18,955,000 | | | Nissan Auto Receivables Owner Trust, Series 2020-B, Class A3, 0.550%, 7/15/2024 | | | 19,036,639 | |
| | 12,815,000 | | | Santander Drive Auto Receivables Trust, Series 2020-1, Class D, 5.350%, 3/15/2028 | | | 14,279,063 | |
| | 27,665,000 | | | Santander Drive Auto Receivables Trust, Series 2019-1, Class D, 3.650%, 4/15/2025 | | | 28,854,816 | |
| | 6,995,000 | | | Santander Drive Auto Receivables Trust, Series 2019-2, Class D, 3.220%, 7/15/2025 | | | 7,274,339 | |
| | 8,455,000 | | | Santander Drive Auto Receivables Trust, Series 2019-3, Class D, 2.680%, 10/15/2025 | | | 8,689,844 | |
| | 2,900,000 | | | Santander Drive Auto Receivables Trust, Series 2020-2, Class D, 2.220%, 9/15/2026 | | | 2,987,386 | |
| | 15,495,000 | | | Westlake Automobile Receivables Trust, Series 2019-1A, Class D, 3.670%, 3/15/2024, 144A | | | 16,099,152 | |
| | | | | | | | |
| | | | | | | 381,811,783 | |
| | | | | | | | |
| | | | ABS Credit Card — 0.4% | |
| | 939,000 | | | American Express Credit Account Master Trust, Series 2018-8, Class A, 3.180%, 4/15/2024 | | | 958,370 | |
| | 8,000,000 | | | American Express Credit Account Master Trust, Series 2019-1, Class A, 2.870%, 10/15/2024 | | | 8,254,403 | |
| | 11,730,000 | | | Capital One Multi-Asset Execution Trust, Series 2019-A1, Class A1, 2.840%, 12/15/2024 | | | 12,073,149 | |
| | 1,690,000 | | | Citibank Credit Card Issuance Trust, Series 2016-A2, Class A2, 2.190%, 11/20/2023 | | | 1,719,359 | |
| | | | | | | | |
| | | | | | | 23,005,281 | |
| | | | | | | | |
| | | | ABS Home Equity — 5.3% | |
| | 15,451,000 | | | American Homes 4 Rent, Series 2015-SFR1, Class E, 5.639%, 4/17/2052, 144A | | | 17,191,637 | |
| | 2,663,718 | | | Bayview Opportunity Master Fund IVb Trust, Series 2019-RN4, Class A1, 3.278%, 10/28/2034, 144A(a) | | | 2,667,553 | |
| | 1,250,000 | | | Bayview Opportunity Master Fund IVb Trust, Series 2017-SPL4, Class B2, 4.750%, 1/28/2055, 144A(a) | | | 1,349,721 | |
| | 3,721,149 | | | Bayview Opportunity Master Fund V Trust, Series 2020-RN3, Class A1, 3.228%, 9/25/2035, 144A(a) | | | 3,756,034 | |
| | 4,014,499 | | | Brass PLC, Series 8A, Class A1, 3-month LIBOR + 0.700%, 0.921%, 11/16/2066, 144A(b) | | | 4,028,517 | |
| | 1,878,115 | | | Citigroup Mortgage Loan Trust, Series 2019-E, Class A1, 3.228%, 11/25/2070, 144A(a) | | | 1,887,212 | |
| | 435,538 | | | Citigroup Mortgage Loan Trust, Series 2018-A, Class A1, 4.000%, 1/25/2068, 144A(a) | | | 437,404 | |
| | 5,067,106 | | | Citigroup Mortgage Loan Trust, Series 2019-B, Class A1, 3.258%, 4/25/2066, 144A(a) | | | 5,171,935 | |
| | 6,382,230 | | | Citigroup Mortgage Loan Trust, Series 2019-RP1, Class A1, 3.500%, 1/25/2066, 144A(a) | | | 6,834,360 | |
See accompanying notes to financial statements.
37 |
Portfolio of Investments – as of December 31, 2020
Loomis Sayles Investment Grade Bond Fund – (continued)
| | | | | | | | |
Principal
Amount | | | Description | | Value (†) | |
| | | | ABS Home Equity — continued | |
| $ | 2,434,000 | | | CoreVest American Finance Trust, Series 2019-1, Class D, 4.818%, 3/15/2052, 144A | | $ | 2,673,381 | |
| | 5,373,048 | | | CoreVest American Finance Trust, Series 2019-3, Class A, 2.705%, 10/15/2052, 144A | | | 5,662,569 | |
| | 2,929,000 | | | CoreVest American Finance Trust, Series 2019-3, Class B, 3.163%, 10/15/2052, 144A | | | 3,036,834 | |
| | 1,259,000 | | | CoreVest American Finance Trust, Series 2020-2, Class C, 4.845%, 5/15/2052, 144A(a) | | | 1,440,341 | |
| | 4,584,871 | | | Credit Suisse Mortgage Trust, Series 2020-RPL3, Class A1, 2.691%, 3/25/2060, 144A(a) | | | 4,589,683 | |
| | 11,696,000 | | | FirstKey Homes Trust, Series 2020-SFR2, Class D, 1.968%, 10/19/2037, 144A | | | 11,529,962 | |
| | 3,083,000 | | | FirstKey Homes Trust, Series 2020-SRF1, Class D, 2.241%, 9/17/2025, 144A | | | 3,080,158 | |
| | 1,515,000 | | | FirstKey Homes Trust, Series 2020-SRF1, Class E, 2.791%, 8/17/2037, 144A | | | 1,543,771 | |
| | 7,581,441 | | | GCAT Trust, Series 2019-RPL1, Class A1, 2.650%, 10/25/2068, 144A(a) | | | 7,829,220 | |
| | 561,995 | | | Gosforth Funding PLC, Series 2018-1A, Class A1, 3-month LIBOR + 0.450%, 0.657%, 8/25/2060, 144A(b) | | | 562,027 | |
| | 2,782,767 | | | Home Partners of America Trust, Series 2019-1, Class D, 3.406%, 9/17/2039, 144A | | | 2,879,173 | |
| | 2,573,435 | | | Home Partners of America Trust, Series 2019-2, Class D, 3.121%, 10/19/2039, 144A | | | 2,671,812 | |
| | 3,050,000 | | | Invitation Homes Trust, Series 2018-SFR4, Class D, 1-month LIBOR + 1.650%, 1.803%, 1/17/2038, 144A(b) | | | 3,042,590 | |
| | 7,020,000 | | | Lanark Master Issuer PLC, Series 2019-2A, Class 1A, 2.710%, 12/22/2069, 144A(a) | | | 7,139,537 | |
| | 895,000 | | | Lanark Master Issuer PLC, Series 2020-1A, Class 1A, 2.277%, 12/22/2069, 144A(a) | | | 910,018 | |
| | 10,777,946 | | | Legacy Mortgage Asset Trust, Series 2019-GS7, Class A1, 3.250%, 11/25/2059, 144A(a) | | | 10,795,736 | |
| | 3,699,605 | | | Legacy Mortgage Asset Trust, Series 2019-GS3, Class A1, 3.750%, 4/25/2059, 144A(a) | | | 3,734,334 | |
| | 7,753,820 | | | Legacy Mortgage Asset Trust, Series 2020-GS1, Class A1, 2.882%, 10/25/2059, 144A(a) | | | 7,777,535 | |
| | 2,011,896 | | | Legacy Mortgage Asset Trust, Series 2020-GS5, Class A1, 3.250%, 6/25/2060, 144A | | | 2,026,201 | |
| | 1,467,786 | | | Mill City Mortgage Loan Trust, Series 2018-2, Class M1, 3.750%, 5/25/2058, 144A(a) | | | 1,604,542 | |
| | 2,744,944 | | | Mill City Mortgage Loan Trust, Series 2019-1, Class M1, 3.500%, 10/25/2069, 144A(a) | | | 3,015,590 | |
| | 4,206,586 | | | Mill City Mortgage Loan Trust, Series 2019-1, Class A1, 3.250%, 10/25/2069, 144A(a) | | | 4,439,117 | |
| | 10,204,144 | | | Mill City Mortgage Loan Trust, Series 2019-GS1, Class A1, 2.750%, 7/25/2059, 144A(a) | | | 10,604,872 | |
| | 5,520,124 | | | OSW Structured Asset Trust, Series 2020-RPL1, Class A1, 3.072%, 12/26/2059, 144A(a) | | | 5,593,316 | |
| | 2,738,349 | | | Preston Ridge Partners Mortgage LLC, Series 2019-3A, Class A1, 3.351%, 7/25/2024, 144A(a) | | | 2,744,084 | |
| | 4,650,969 | | | Preston Ridge Partners Mortgage LLC, Series 2019-4A, Class A1, 3.351%, 11/25/2024, 144A(a) | | | 4,658,648 | |
| | 16,495,761 | | | Preston Ridge Partners Mortgage LLC, Series 2020-1A, Class A1, 2.981%, 2/25/2025, 144A(a) | | | 16,532,565 | |
| | 2,105,741 | | | Preston Ridge Partners Mortgage LLC, Series 2020-2, Class A1, 3.671%, 8/25/2025, 144A(a) | | | 2,125,805 | |
| | | | ABS Home Equity — continued | |
| 6,828,234 | | | Preston Ridge Partners Mortgage LLC, Series 2020-3, Class A1, 2.857%, 9/25/2025, 144A(a) | | | 6,883,839 | |
| | 6,007,356 | | | Preston Ridge Partners Mortgage LLC, Series 2020-4, Class A1, 2.951%, 10/25/2025, 144A(a) | | | 6,030,282 | |
| | 13,032,522 | | | Preston Ridge Partners Mortgage LLC, Series 2020-5, Class A1, 3.104%, 11/25/2025, 144A(a) | | | 13,110,510 | |
| | 1,332,000 | | | Progress Residential Trust, Series 2018-SFR2, Class E, 4.656%, 8/17/2035, 144A | | | 1,354,463 | |
| | 2,290,000 | | | Progress Residential Trust, Series 2018-SFR3, Class D, 4.427%, 10/17/2035, 144A | | | 2,335,265 | |
| | 2,530,000 | | | Progress Residential Trust, Series 2018-SFR3, Class E, 4.873%, 10/17/2035, 144A | | | 2,589,330 | |
| | 2,830,000 | | | Progress Residential Trust, Series 2019-SFR1, Class D, 4.168%, 8/17/2035, 144A | | | 2,909,123 | |
| | 4,732,000 | | | Progress Residential Trust, Series 2019-SFR2, Class D, 3.794%, 5/17/2036, 144A | | | 4,883,396 | |
| | 1,690,000 | | | Progress Residential Trust, Series 2019-SFR2, Class E, 4.142%, 5/17/2036, 144A | | | 1,743,033 | |
| | 3,860,000 | | | Progress Residential Trust, Series 2019-SFR4, Class D, 3.136%, 10/17/2036, 144A | | | 3,982,042 | |
| | 155,000 | | | Progress Residential Trust, Series 2020-SFR2, Class C, 3.077%, 6/17/2037, 144A | | | 160,538 | |
| | 295,000 | | | Progress Residential Trust, Series 2020-SFR3, Class B, 1.495%, 10/17/2027, 144A | | | 295,009 | |
| | 1,818,000 | | | Progress Residential Trust, Series 2020-SFR3, Class E, 2.296%, 10/17/2027, 144A | | | 1,820,107 | |
| | 3,548,200 | | | RCO V Mortgage LLC, Series 2020-1, Class A1, 3.105%, 9/25/2025, 144A(a) | | | 3,554,415 | |
| | 1,828,293 | | | Sequoia Mortgage Trust, Series 2017-CH2, Class A1, 4.000%, 12/25/2047, 144A(a) | | | 1,882,318 | |
| | 3,216,191 | | | Sequoia Mortgage Trust, Series 2019-CH2, Class A1, 4.500%, 8/25/2049, 144A(a) | | | 3,298,789 | |
| | 4,930,000 | | | Towd Point Mortgage Trust, Series 2017-4, Class M2, 3.250%, 6/25/2057, 144A(a) | | | 5,218,344 | |
| | 6,390,000 | | | Towd Point Mortgage Trust, Series 2017-5, Class M2, 1-month LIBOR + 1.500%, 1.648%, 2/25/2057, 144A(b) | | | 6,422,315 | |
| | 1,362,493 | | | Towd Point Mortgage Trust, Series 2015-2, Class 1A13, 2.500%, 11/25/2060, 144A(a) | | | 1,365,627 | |
| | 716,300 | | | Towd Point Mortgage Trust, Series 2016-1, Class A1B, 2.750%, 2/25/2055, 144A(a) | | | 724,085 | |
| | 1,775,000 | | | Towd Point Mortgage Trust, Series 2018-4, Class A2, 3.000%, 6/25/2058, 144A(a) | | | 1,873,573 | |
| | 1,943,340 | | | Towd Point Mortgage Trust, Series 2018-5, Class M1, 3.250%, 7/25/2058, 144A(a) | | | 2,053,022 | |
| | 17,610,000 | | | Towd Point Mortgage Trust, Series 2019-2, Class M1, 3.750%, 12/25/2058, 144A(a) | | | 19,128,012 | |
| | 9,086,005 | | | Towd Point Mortgage Trust, Series 2019-4, Class A1, 2.900%, 10/25/2059, 144A(a) | | | 9,590,814 | |
| | 3,325,000 | | | Towd Point Mortgage Trust, Series 2020-1, Class A2B, 3.250%, 1/25/2060, 144A(a) | | | 3,518,668 | |
| | 3,950,000 | | | Tricon American Homes, Series 2020-SFR1, Class D, 2.548%, 7/17/2038, 144A | | | 4,018,043 | |
| | 2,575,000 | | | Tricon American Homes Trust, Series 2019-SFR1, Class D, 3.198%, 3/17/2038, 144A | | | 2,660,213 | |
| | 7,846,832 | | | Vericrest Opportunity Loan Trust, Series 2019-NPL8, Class A1A, 3.278%, 11/25/2049, 144A(a) | | | 7,850,371 | |
See accompanying notes to financial statements.
| 38
Portfolio of Investments – as of December 31, 2020
Loomis Sayles Investment Grade Bond Fund – (continued)
| | | | | | | | |
Principal
Amount | | | Description | | Value (†) | |
| | | | ABS Home Equity — continued | |
| $ | 8,273,283 | | | Vericrest Opportunity Loan Trust, Series 2019-NPL5, Class A1A, 3.352%, 9/25/2049, 144A(a) | | $ | 8,283,876 | |
| | 3,064,740 | | | Vericrest Opportunity Loan Trust, Series 2019-NPL9, Class A1A, 3.327%, 11/26/2049, 144A(a) | | | 3,073,516 | |
| | 6,408,731 | | | Vericrest Opportunity Loan Trust, Series 2020-NPL1, Class A1A, 3.228%, 1/25/2050, 144A(a) | | | 6,426,705 | |
| | 4,233,838 | | | Vericrest Opportunity Loan Trust, Series 2020-NPL2, Class A1A, 2.981%, 2/25/2050, 144A(a) | | | 4,237,149 | |
| | 210,423 | | | Vericrest Opportunity Loan Trust, Series 2020-NPL3, Class A1A, 2.981%, 2/25/2050, 144A(a) | | | 210,498 | |
| | | | | | | | |
| | | | | | | 321,055,084 | |
| | | | | | | | |
| | | | ABS Other — 3.0% | |
| | 8,378,088 | | | CLI Funding VI LLC, Series 2020-3A, Class A, 2.070%, 10/18/2045, 144A | | | 8,449,878 | |
| | 940,000 | | | Dell Equipment Finance Trust, Series 2020-2, Class C, 1.370%, 1/22/2024, 144A | | | 944,088 | |
| | 945,000 | | | Dell Equipment Finance Trust, Series 2020-2, Class D, 1.920%, 3/23/2026, 144A | | | 953,485 | |
| | 39,262,848 | | | FAN Engine Securitization Ltd., Series 2013-1A, Class 1A, 4.625%, 10/15/2043, 144A(c)(d)(e) | | | 21,594,566 | |
| | 12,067,388 | | | Horizon Aircraft Finance I Ltd., Series 2018-1, Class A, 4.458%, 12/15/2038, 144A | | | 11,656,177 | |
| | 2,833,211 | | | Horizon Aircraft Finance II Ltd., Series 2019-1, Class A, 3.721%, 7/15/2039, 144A | | | 2,733,228 | |
| | 1,975,000 | | | HPEFS Equipment Trust, Series 2019-1A, Class C, 2.490%, 9/20/2029, 144A | | | 2,013,799 | |
| | 3,645,000 | | | HPEFS Equipment Trust, Series 2020-1A, Class D, 2.260%, 2/20/2030, 144A | | | 3,680,276 | |
| | 1,980,000 | | | HPEFS Equipment Trust, Series 2020-2A, Class C, 2.000%, 7/22/2030, 144A | | | 2,020,917 | |
| | 7,423,807 | | | Kestrel Aircraft Funding Ltd., Series 2018-1A, Class A, 4.250%, 12/15/2038, 144A | | | 6,875,628 | |
| | 12,845,584 | | | MAPS Ltd., Series 2018-1A, Class A, 4.212%, 5/15/2043, 144A | | | 12,241,490 | |
| | 3,778,006 | | | MAPS Ltd., Series 2019-1A, Class A, 4.458%, 3/15/2044, 144A | | | 3,591,524 | |
| | 11,712,721 | | | Mariner Finance Issuance Trust, Series 2018-AA, Class A, 4.200%, 11/20/2030, 144A | | | 11,847,064 | |
| | 2,435,977 | | | Marlette Funding Trust, Series 2019-4A, Class A, 2.390%, 12/17/2029, 144A | | | 2,455,015 | |
| | 761,581 | | | Marlette Funding Trust, Series 2019-1A, Class A, 3.440%, 4/16/2029, 144A | | | 767,648 | |
| | 1,026,051 | | | MVW LLC, Series 2020-1A, Class C, 4.210%, 10/20/2037, 144A | | | 1,089,970 | |
| | 664,309 | | | MVW Owner Trust, Series 2019-1A, Class C, 3.330%, 11/20/2036, 144A | | | 676,120 | |
| | 8,040,000 | | | OneMain Financial Issuance Trust, Series 2019-1A, Class D, 4.220%, 2/14/2031, 144A | | | 8,307,794 | |
| | 4,675,000 | | | OneMain Financial Issuance Trust, Series 2020-1A, Class B, 4.830%, 5/14/2032, 144A | | | 5,000,324 | |
| | 6,585,000 | | | OneMain Financial Issuance Trust, Series 2020-2A, Class A, 1.750%, 9/14/2035, 144A | | | 6,692,105 | |
| | 15,252,711 | | | S-Jets Ltd., Series 2017-1, Class A, 3.967%, 8/15/2042, 144A | | | 14,800,385 | |
| | | | ABS Other — continued | |
| 740,000 | | | SLM Private Credit Student Loan Trust, Series 2003-C, Class A3, 28-day ARS, 3.630%, 9/15/2032(b) | | | 736,911 | |
| | 1,145,000 | | | SLM Private Credit Student Loan Trust, Series 2003-C, Class A4, 28-day ARS, 3.230%, 9/15/2032(b) | | | 1,140,221 | |
| | 13,765,000 | | | SoFi Consumer Loan Program Trust, Series 2019-1, Class C, 3.730%, 2/25/2028, 144A | | | 14,050,679 | |
| | 3,659,000 | | | SoFi Consumer Loan Program Trust, Series 2018-1, Class B, 3.650%, 2/25/2027, 144A | | | 3,764,066 | |
| | 6,720,000 | | | SoFi Consumer Loan Program Trust, Series 2018-4, Class C, 4.170%, 11/26/2027, 144A | | | 6,887,752 | |
| | 6,805,000 | | | SoFi Consumer Loan Program Trust, Series 2019-2, Class C, 3.460%, 4/25/2028, 144A | | | 6,969,995 | |
| | 12,755,000 | | | SoFi Consumer Loan Program Trust, Series 2019-3, Class C, 3.350%, 5/25/2028, 144A | | | 13,199,624 | |
| | 7,370,000 | | | SoFi Consumer Loan Program Trust, Series 2019-4, Class C, 2.840%, 8/25/2028, 144A | | | 7,574,282 | |
| | | | | | | | |
| | | | | | | 182,715,011 | |
| | | | | | | | |
| | | | ABS Student Loan — 1.0% | |
| | 6,356,550 | | | Commonbond Student Loan Trust, Series 2020-1, Class A, 1.690%, 10/25/2051, 144A | | | 6,402,192 | |
| | 7,045,987 | | | ELFI Graduate Loan Program LLC, Series 2019-A, Class A, 2.540%, 3/25/2044, 144A | | | 7,244,131 | |
| | 8,825,000 | | | Laurel Road Prime Student Loan Trust, Series 2020-A, Class A2FX, 1.400%, 11/25/2050, 144A | | | 8,866,084 | |
| | 615,000 | | | SLM Private Credit Student Loan Trust, Series 2003-A, Class A3, 28-day ARS, 3.180%, 6/15/2032(b) | | | 611,444 | |
| | 463,000 | | | SLM Private Credit Student Loan Trust, Series 2003-A, Class A4, 28-day ARS, 3.170%, 6/15/2032(b) | | | 460,323 | |
| | 905,000 | | | SLM Private Credit Student Loan Trust, Series 2003-B, Class A3, 3.200%, 3/15/2033(a) | | | 899,024 | |
| | 612,000 | | | SLM Private Credit Student Loan Trust, Series 2003-B, Class A4, 28-day ARS, 3.658%, 3/15/2033(b) | | | 607,959 | |
| | 2,500,000 | | | SMB Private Education Loan Trust, Series 2015-C, Class B, 3.500%, 9/15/2043, 144A | | | 2,618,560 | |
| | 565,000 | | | SMB Private Education Loan Trust, Series 2018-B, Class B, 4.000%, 7/15/2042, 144A | | | 601,064 | |
| | 1,525,000 | | | SMB Private Education Loan Trust, Series 2018-C, Class B, 4.000%, 11/17/2042, 144A | | | 1,607,817 | |
| | 10,051,750 | | | SMB Private Education Loan Trust, Series 2019-A, Class A2A, 3.440%, 7/15/2036, 144A | | | 10,637,861 | |
| | 16,265,000 | | | SMB Private Education Loan Trust, Series 2019-B, Class A2A, 2.840%, 6/15/2037, 144A | | | 17,174,986 | |
| | | | | | | | |
| | | | | | | 57,731,445 | |
| | | | | | | | |
| | | | ABS Whole Business — 1.2% | |
| | 10,006,577 | | | Adams Outdoor Advertising LP, Series 2018-1, Class A, 4.810%, 11/15/2048, 144A | | | 10,551,461 | |
| | 3,595,000 | | | Adams Outdoor Advertising LP, Series 2018-1, Class B, 5.653%, 11/15/2048, 144A | | | 3,802,433 | |
| | 13,288,050 | | | Coinstar Funding LLC, Series 2017-1A, Class A2, 5.216%, 4/25/2047, 144A | | | 12,959,447 | |
| | 7,205,788 | | | DB Master Finance LLC, Series 2019-1A, Class A23, 4.352%, 5/20/2049, 144A | | | 7,786,934 | |
| | 2,543,340 | | | Domino’s Pizza Master Issuer LLC, Series 2017-1A, Class A23, 4.118%, 7/25/2047, 144A | | | 2,724,680 | |
See accompanying notes to financial statements.
39 |
Portfolio of Investments – as of December 31, 2020
Loomis Sayles Investment Grade Bond Fund – (continued)
| | | | | | | | |
Principal
Amount | | | Description | | Value (†) | |
| | | | ABS Whole Business — continued | |
| $ | 5,191,503 | | | Domino’s Pizza Master Issuer LLC, Series 2018-1A, Class A2II, 4.328%, 7/25/2048, 144A | | $ | 5,642,748 | |
| | 4,073,850 | | | Domino’s Pizza Master Issuer LLC, Series 2019-1A, Class A2, 3.668%, 10/25/2049, 144A | | | 4,327,284 | |
| | 1,672,110 | | | Planet Fitness Master Issuer LLC, Series 2019-1A, Class A2, 3.858%, 12/05/2049, 144A | | | 1,576,900 | |
| | 17,404,950 | | | Stack Infrastructure Issuer LLC, Series 2019-1A, Class A2, 4.540%, 2/25/2044, 144A | | | 18,641,678 | |
| | 2,230,000 | | | Wingstop Funding LLC, Series 2020-1A, Class A2, 2.841%, 12/05/2050, 144A | | | 2,275,202 | |
| | | | | | | | |
| | | | | | | 70,288,767 | |
| | | | | | | | |
| | | | Aerospace & Defense — 3.6% | |
| | 13,620,000 | | | BAE Systems PLC, 3.400%, 4/15/2030, 144A | | | 15,429,757 | |
| | 3,780,000 | | | Boeing Co. (The), 2.250%, 6/15/2026 | | | 3,868,868 | |
| | 4,874,000 | | | Boeing Co. (The), 2.950%, 2/01/2030 | | | 5,040,983 | |
| | 655,000 | | | Boeing Co. (The), 3.100%, 5/01/2026 | | | 701,371 | |
| | 3,225,000 | | | Boeing Co. (The), 3.200%, 3/01/2029 | | | 3,404,420 | |
| | 2,036,000 | | | Boeing Co. (The), 3.250%, 2/01/2035 | | | 2,087,928 | |
| | 9,088,000 | | | Boeing Co. (The), 3.375%, 6/15/2046 | | | 8,868,140 | |
| | 1,427,000 | | | Boeing Co. (The), 3.500%, 3/01/2039 | | | 1,443,677 | |
| | 850,000 | | | Boeing Co. (The), 3.550%, 3/01/2038 | | | 867,163 | |
| | 3,564,000 | | | Boeing Co. (The), 3.625%, 3/01/2048 | | | 3,593,416 | |
| | 2,111,000 | | | Boeing Co. (The), 3.650%, 3/01/2047 | | | 2,136,835 | |
| | 14,352,000 | | | Boeing Co. (The), 3.750%, 2/01/2050 | | | 15,009,322 | |
| | 1,932,000 | | | Boeing Co. (The), 3.825%, 3/01/2059 | | | 1,962,548 | |
| | 3,241,000 | | | Boeing Co. (The), 3.850%, 11/01/2048 | | | 3,342,961 | |
| | 7,330,000 | | | Boeing Co. (The), 3.900%, 5/01/2049 | | | 7,778,684 | |
| | 4,795,000 | | | Boeing Co. (The), 3.950%, 8/01/2059 | | | 5,131,883 | |
| | 8,060,000 | | | Boeing Co. (The), 5.150%, 5/01/2030 | | | 9,754,627 | |
| | 5,676,000 | | | Boeing Co. (The), 5.705%, 5/01/2040 | | | 7,365,863 | |
| | 37,793,000 | | | Boeing Co. (The), 5.805%, 5/01/2050 | | | 52,084,236 | |
| | 8,696,000 | | | Boeing Co. (The), 5.930%, 5/01/2060 | | | 12,336,093 | |
| | 4,760,000 | | | Embraer Netherlands Finance BV, 5.050%, 6/15/2025 | | | 5,045,648 | |
| | 4,350,000 | | | Embraer Netherlands Finance BV, 5.400%, 2/01/2027 | | | 4,621,918 | |
| | 6,885,000 | | | Huntington Ingalls Industries, Inc., 3.844%, 5/01/2025 | | | 7,650,460 | |
| | 4,245,000 | | | Huntington Ingalls Industries, Inc., 4.200%, 5/01/2030 | | | 5,027,951 | |
| | 650,000 | | | Leonardo U.S. Holdings, Inc., 7.375%, 7/15/2039 | | | 840,281 | |
| | 1,335,000 | | | Spirit AeroSystems, Inc., 4.600%, 6/15/2028 | | | 1,319,981 | |
| | 29,075,000 | | | Textron, Inc., 3.000%, 6/01/2030 | | | 31,341,375 | |
| | | | | | | | |
| | | | | | | 218,056,389 | |
| | | | | | | | |
| | | | Airlines — 1.0% | |
| | 2,410,489 | | | Air Canada Pass Through Trust, Series 2013-1, Class B, 5.375%, 11/15/2022, 144A | | | 2,405,258 | |
| | 7,001,850 | | | American Airlines Pass Through Certificates, Series 2016-1, Class B, 5.250%, 7/15/2025 | | | 5,910,542 | |
| | 12,726,245 | | | American Airlines Pass Through Certificates, Series 2016-3, Class A, 3.250%, 4/15/2030 | | | 11,528,252 | |
| | 1,506,441 | | | American Airlines Pass Through Certificates, Series 2016-3, Class B, 3.750%, 4/15/2027 | | | 1,211,962 | |
| | 5,486,481 | | | American Airlines Pass Through Certificates, Series 2017-2, Class A, 3.600%, 4/15/2031 | | | 5,068,967 | |
| | 3,331,919 | | | American Airlines Pass Through Certificates, Series 2017-2, Class B, 3.700%, 4/15/2027 | | | 2,816,834 | |
| | 1,791,550 | | | American Airlines Pass Through Trust, Series 2015-2, Class B, 4.400%, 3/22/2025 | | | 1,377,344 | |
| | | | Airlines — continued | |
| 21,871,211 | | | American Airlines Pass Through Trust, Series 2019-1, Class B, 3.850%, 8/15/2029 | | | 18,364,381 | |
| | 6,523,391 | | | British Airways Pass Through Trust, Series 2019-1, Class A, 3.350%, 12/15/2030, 144A | | | 6,165,518 | |
| | 246,393 | | | Continental Airlines Pass Through Certificates, Series 2001-1, Class A-1, 6.703%, 12/15/2022 | | | 246,393 | |
| | 924,352 | | | Delta Air Lines Pass Through Trust, Series 2007-1, Class A, 6.821%, 2/10/2024 | | | 941,869 | |
| | 3,959,577 | | | Delta Air Lines Pass Through Trust, Series 2007-1, Class B, 8.021%, 2/10/2024 | | | 3,867,980 | |
| | 2,583,954 | | | United Airlines Pass Through Trust, Series 2018-1, Class A, 3.700%, 9/01/2031 | | | 2,452,215 | |
| | | | | | | | |
| | | | | | | 62,357,515 | |
| | | | | | | | |
| | | | Automotive — 2.0% | |
| | 18,836,000 | | | Cummins, Inc., 5.650%, 3/01/2098 | | | 27,680,444 | |
| | 5,274,000 | | | Cummins, Inc., 6.750%, 2/15/2027 | | | 6,683,596 | |
| | 8,176,000 | | | General Motors Co., 5.200%, 4/01/2045 | | | 9,929,151 | |
| | 27,915,000 | | | General Motors Co., 5.400%, 4/01/2048 | | | 35,154,208 | |
| | 640,000 | | | General Motors Co., 5.950%, 4/01/2049 | | | 865,549 | |
| | 9,600,000 | | | General Motors Co., 6.250%, 10/02/2043 | | | 12,950,107 | |
| | 95,000 | | | General Motors Co., 6.750%, 4/01/2046 | | | 136,870 | |
| | 24,360,000 | | | Volkswagen Group of America Finance LLC, 0.875%, 11/22/2023, 144A | | | 24,497,229 | |
| | 2,895,000 | | | Volkswagen Group of America Finance LLC, 3.350%, 5/13/2025, 144A | | | 3,182,633 | |
| | | | | | | | |
| | | | | | | 121,079,787 | |
| | | | | | | | |
| | | | Banking — 8.0% | |
| | 300,000 | | | Ally Financial, Inc., 3.875%, 5/21/2024 | | | 328,723 | |
| | 39,613,000 | | | Ally Financial, Inc., 4.625%, 3/30/2025 | | | 45,151,548 | |
| | 2,835,000 | | | Ally Financial, Inc., 5.750%, 11/20/2025 | | | 3,300,625 | |
| | 1,468,000 | | | Ally Financial, Inc., 8.000%, 11/01/2031 | | | 2,088,539 | |
| | 10,155,000 | | | Banco Santander Mexico S.A. Institucion de Banca Multiple Grupo Financiero Santander, 5.375%, 4/17/2025, 144A | | | 11,666,673 | |
| | 5,800,000 | | | Banco Santander S.A., 2.749%, 12/03/2030 | | | 5,978,216 | |
| | 49,304,000 | | | Bank of America Corp., (fixed rate to 12/20/2027, variable rate thereafter), 3.419%, 12/20/2028 | | | 55,691,042 | |
| | 100,000 | | | Bank of America Corp., MTN, 4.250%, 10/22/2026 | | | 117,297 | |
| | 25,627,000 | | | Bank of America Corp., Series L, MTN, 4.183%, 11/25/2027 | | | 29,729,519 | |
| | 4,287,000 | | | Barclays PLC, (fixed rate to 6/20/2029, variable rate thereafter), 5.088%, 6/20/2030 | | | 5,142,616 | |
| | 18,255,000 | | | Barclays PLC, (fixed rate to 9/23/2030, variable rate thereafter), 3.564%, 9/23/2035 | | | 19,780,023 | |
| | 3,335,000 | | | BBVA Bancomer S.A., 1.875%, 9/18/2025, 144A | | | 3,368,350 | |
| | 22,500,000 | | | BNP Paribas S.A., (fixed rate to 3/01/2028, variable rate thereafter), 4.375%, 3/01/2033, 144A | | | 25,780,055 | |
| | 460,000 | | | Capital One Financial Corp., 4.200%, 10/29/2025 | | | 525,187 | |
| | 1,230,000 | | | Citigroup, Inc., 4.125%, 7/25/2028 | | | 1,438,707 | |
| | 7,155,000 | | | Credit Agricole S.A., (fixed rate to 1/10/2028, variable rate thereafter), 4.000%, 1/10/2033, 144A | | | 7,987,126 | |
| | 14,200,000 | | | Danske Bank A/S, 5.375%, 1/12/2024, 144A | | | 16,019,873 | |
| | 3,390,000 | | | Danske Bank A/S, (fixed rate to 12/20/2024, variable rate thereafter), 3.244%, 12/20/2025, 144A | | | 3,627,615 | |
| | 2,640,000 | | | Deutsche Bank AG, (fixed rate to 12/01/2027, variable rate thereafter), 4.875%, 12/01/2032 | | | 2,762,496 | |
| | 9,260,000 | | | Deutsche Bank AG, (fixed rate to 9/18/2023, variable rate thereafter), 2.222%, 9/18/2024 | | | 9,526,121 | |
See accompanying notes to financial statements.
| 40
Portfolio of Investments – as of December 31, 2020
Loomis Sayles Investment Grade Bond Fund – (continued)
| | | | | | | | |
Principal
Amount | | | Description | | Value (†) | |
| | | | Banking — continued | |
| $ | 6,235,000 | | | Deutsche Bank AG, (fixed rate to 9/18/2030, variable rate thereafter), 3.547%, 9/18/2031 | | $ | 6,757,127 | |
| | 70,245,000 | | | JPMorgan Chase & Co., 4.125%, 12/15/2026 | | | 82,120,901 | |
| | 28,715,000 | | | JPMorgan Chase & Co., (fixed rate to 3/24/2030, variable rate thereafter), 4.493%, 3/24/2031 | | | 35,323,125 | |
| | 100,000 | | | KeyBank NA, 6.950%, 2/01/2028 | | | 130,314 | |
| | 1,845,000 | | | Morgan Stanley, GMTN, 4.350%, 9/08/2026 | | | 2,175,233 | |
| | 20,695,000 | | | Morgan Stanley, MTN, 4.100%, 5/22/2023 | | | 22,458,923 | |
| | 15,160,000 | | | Santander Holdings USA, Inc., 3.244%, 10/05/2026 | | | 16,464,056 | |
| | 20,295,000 | | | Societe Generale S.A., 4.250%, 4/14/2025, 144A | | | 22,383,355 | |
| | 11,950,000 | | | Societe Generale S.A., (fixed rate to 7/08/2030, variable rate thereafter), 3.653%, 7/08/2035, 144A | | | 12,940,548 | |
| | 16,790,000 | | | Standard Chartered PLC, (fixed rate to 11/18/2030, variable rate thereafter), 3.265%, 2/18/2036, 144A | | | 17,578,818 | |
| | 7,090,000 | | | Standard Chartered PLC, (fixed rate to 4/01/2030, variable rate thereafter), 4.644%, 4/01/2031, 144A | | | 8,576,770 | |
| | 3,865,000 | | | Synchrony Financial, 4.375%, 3/19/2024 | | | 4,255,237 | |
| | | | | | | | |
| | | | | | | 481,174,758 | |
| | | | | | | | |
| | | | Brokerage — 0.8% | |
| | 19,498,000 | | | Jefferies Group LLC, 6.250%, 1/15/2036 | | | 26,003,814 | |
| | 8,760,000 | | | Jefferies Group LLC, 6.450%, 6/08/2027 | | | 11,105,393 | |
| | 8,460,000 | | | Nasdaq, Inc., 0.445%, 12/21/2022 | | | 8,469,896 | |
| | | | | | | | |
| | | | | | | 45,579,103 | |
| | | | | | | | |
| | | | Building Materials — 1.1% | |
| | 16,180,000 | | | Cemex SAB de CV, 5.200%, 9/17/2030, 144A | | | 17,741,370 | |
| | 5,955,000 | | | Cemex SAB de CV, 5.450%, 11/19/2029, 144A | | | 6,550,560 | |
| | 1,665,000 | | | Cemex SAB de CV, 5.700%, 1/11/2025, 144A | | | 1,701,630 | |
| | 460,000 | | | Cemex SAB de CV, 7.750%, 4/16/2026, 144A | | | 485,070 | |
| | 3,285,000 | | | Ferguson Finance PLC, 3.250%, 6/02/2030, 144A | | | 3,663,132 | |
| | 23,975,000 | | | Owens Corning, 7.000%, 12/01/2036 | | | 34,182,443 | |
| | 2,655,000 | | | Vulcan Materials Co., 3.500%, 6/01/2030 | | | 3,049,564 | |
| | | | | | | | |
| | | | | | | 67,373,769 | |
| | | | | | | | |
| | | | Cable Satellite — 2.2% | |
| | 9,425,000 | | | CCO Holdings LLC/CCO Holdings Capital Corp., 4.250%, 2/01/2031, 144A | | | 9,930,934 | |
| | 2,826,000 | | | CCO Holdings LLC/CCO Holdings Capital Corp., 4.500%, 8/15/2030, 144A | | | 2,999,092 | |
| | 315,000 | | | CCO Holdings LLC/CCO Holdings Capital Corp., 4.500%, 5/01/2032, 144A | | | 336,332 | |
| | 550,000 | | | CCO Holdings LLC/CCO Holdings Capital Corp., 5.375%, 6/01/2029, 144A | | | 602,937 | |
| | 30,810,000 | | | Charter Communications Operating LLC/Charter Communications Operating Capital Corp., 4.800%, 3/01/2050 | | | 36,799,466 | |
| | 6,695,000 | | | Charter Communications Operating LLC/Charter Communications Operating Capital Corp., 5.750%, 4/01/2048 | | | 8,760,026 | |
| | 10,320,000 | | | Cox Communications, Inc., 4.500%, 6/30/2043, 144A | | | 12,982,106 | |
| | 5,820,000 | | | Cox Communications, Inc., 4.700%, 12/15/2042, 144A | | | 7,515,742 | |
| | 240,000 | | | CSC Holdings LLC, 5.750%, 1/15/2030, 144A | | | 263,100 | |
| | 2,360,000 | | | CSC Holdings LLC, 6.500%, 2/01/2029, 144A | | | 2,664,558 | |
| | 470,000 | | | Sirius XM Radio, Inc., 4.625%, 7/15/2024, 144A | | | 487,038 | |
| | 2,416,000 | | | Sirius XM Radio, Inc., 5.000%, 8/01/2027, 144A | | | 2,567,024 | |
| | 865,000 | | | Sirius XM Radio, Inc., 5.375%, 7/15/2026, 144A | | | 901,762 | |
| | 200,000 | | | Sirius XM Radio, Inc., 5.500%, 7/01/2029, 144A | | | 220,063 | |
| | | | Cable Satellite — continued | |
| 17,891,000 | | | Time Warner Cable LLC, 4.500%, 9/15/2042 | | | 20,964,618 | |
| | 15,815,000 | | | Time Warner Cable LLC, 5.500%, 9/01/2041 | | | 20,319,937 | |
| | 800,000 | | | Videotron Ltd., 5.000%, 7/15/2022 | | | 841,008 | |
| | 2,185,000 | | | Virgin Media Secured Finance PLC, 5.500%, 8/15/2026, 144A | | | 2,269,669 | |
| | 1,600,000 | | | Ziggo BV, 5.500%, 1/15/2027, 144A | | | 1,670,000 | |
| | | | | | | | |
| | | | | | | 133,095,412 | |
| | | | | | | | |
| | | | Chemicals — 1.2% | |
| | 8,285,000 | | | Braskem Netherlands Finance BV, 4.500%, 1/31/2030, 144A | | | 8,502,481 | |
| | 1,635,000 | | | Braskem Netherlands Finance BV, 5.875%, 1/31/2050, 144A | | | 1,690,198 | |
| | 27,205,000 | | | CF Industries, Inc., 4.500%, 12/01/2026, 144A | | | 32,231,319 | |
| | 3,740,000 | | | FMC Corp., 3.450%, 10/01/2029 | | | 4,257,741 | |
| | 2,075,000 | | | FMC Corp., 4.500%, 10/01/2049 | | | 2,690,320 | |
| | 8,145,000 | | | LYB International Finance III LLC, 4.200%, 10/15/2049 | | | 9,520,873 | |
| | 11,480,000 | | | Nutrition & Biosciences, Inc., 2.300%, 11/01/2030, 144A | | | 11,824,654 | |
| | | | | | | | |
| | | | | | | 70,717,586 | |
| | | | | | | | |
| | | | Collateralized Mortgage Obligations — 0.0% | |
| | 1,544,401 | | | New Residential Mortgage Loan Trust, Series 2020-NPL2, Class A1, 3.228%, 8/25/2060, 144A(a) | | | 1,556,848 | |
| | | | | | | | |
| | | | Consumer Cyclical Services — 1.9% | |
| | 20,300,000 | | | Amazon.com, Inc., 2.500%, 6/03/2050 | | | 21,062,685 | |
| | 9,850,000 | | | Booking Holdings, Inc., 4.500%, 4/13/2027 | | | 11,715,171 | |
| | 16,000,000 | | | Booking Holdings, Inc., 4.625%, 4/13/2030 | | | 19,881,266 | |
| | 1,205,000 | | | eBay, Inc., 4.000%, 7/15/2042 | | | 1,371,911 | |
| | 26,082,000 | | | Expedia Group, Inc., 3.250%, 2/15/2030 | | | 27,144,607 | |
| | 2,426,000 | | | Expedia Group, Inc., 3.800%, 2/15/2028 | | | 2,605,847 | |
| | 9,925,000 | | | Expedia Group, Inc., 4.625%, 8/01/2027, 144A | | | 11,088,806 | |
| | 5,385,000 | | | Expedia Group, Inc., 6.250%, 5/01/2025, 144A | | | 6,241,757 | |
| | 2,755,000 | | | Expedia Group, Inc., 7.000%, 5/01/2025, 144A | | | 3,036,593 | |
| | 4,402,000 | | | IHS Markit Ltd., 4.250%, 5/01/2029 | | | 5,347,814 | |
| | 6,030,000 | | | Uber Technologies, Inc., 6.250%, 1/15/2028, 144A | | | 6,557,625 | |
| | | | | | | | |
| | | | | | | 116,054,082 | |
| | | | | | | | |
| | | | Consumer Products — 0.2% | |
| | 7,458,000 | | | Hasbro, Inc., 6.600%, 7/15/2028 | | | 9,340,770 | |
| | 4,580,000 | | | Kimberly-Clark de Mexico SAB de CV, 2.431%, 7/01/2031, 144A | | | 4,731,232 | |
| | | | | | | | |
| | | | | | | 14,072,002 | |
| | | | | | | | |
| | | | Diversified Manufacturing — 0.5% | |
| | 13,920,000 | | | Carrier Global Corp., 2.722%, 2/15/2030 | | | 14,886,231 | |
| | 6,010,000 | | | General Electric Co., 3.625%, 5/01/2030 | | | 6,868,751 | |
| | 2,865,000 | | | General Electric Co., 4.350%, 5/01/2050 | | | 3,484,265 | |
| | 5,305,000 | | | General Electric Co., Series A, MTN, 3-month LIBOR + 0.300%, 0.537%, 5/13/2024(b) | | | 5,137,673 | |
| | | | | | | | |
| | | | | | | 30,376,920 | |
| | | | | | | | |
| | | | Electric — 3.2% | |
| | 7,435,000 | | | AES Corp. (The), 2.450%, 1/15/2031, 144A | | | 7,529,573 | |
| | 3,695,000 | | | AES Corp. (The), 3.950%, 7/15/2030, 144A | | | 4,176,865 | |
| | 17,820,017 | | | Alta Wind Holdings LLC, 7.000%, 6/30/2035, 144A | | | 20,941,627 | |
| | 14,855,000 | | | Calpine Corp., 3.750%, 3/01/2031, 144A | | | 14,711,352 | |
| | 13,025,000 | | | Enel Finance International NV, 6.000%, 10/07/2039, 144A | | | 18,583,781 | |
| | 9,007,000 | | | Enel Finance International NV, 6.800%, 9/15/2037, 144A | | | 13,255,491 | |
| | 21,030,000 | | | FirstEnergy Corp., Series C, 3.400%, 3/01/2050 | | | 20,143,226 | |
See accompanying notes to financial statements.
41 |
Portfolio of Investments – as of December 31, 2020
Loomis Sayles Investment Grade Bond Fund – (continued)
| | | | | | | | |
Principal
Amount | | | Description | | Value (†) | |
| | | | Electric — continued | |
| $ | 2,355,000 | | | IPALCO Enterprises, Inc., 4.250%, 5/01/2030, 144A | | $ | 2,718,694 | |
| | 9,641,000 | | | NRG Energy, Inc., 4.450%, 6/15/2029, 144A | | | 11,180,172 | |
| | 1,435,000 | | | NRG Energy, Inc., 5.250%, 6/15/2029, 144A | | | 1,578,500 | |
| | 4,437,000 | | | NRG Energy, Inc., 5.750%, 1/15/2028 | | | 4,847,423 | |
| | 8,915,000 | | | Pacific Gas & Electric Co., 3.500%, 8/01/2050 | | | 8,860,717 | |
| | 10,400,000 | | | Pacific Gas & Electric Co., 4.300%, 3/15/2045 | | | 11,088,069 | |
| | 1,250,000 | | | Pacific Gas & Electric Co., 4.950%, 7/01/2050 | | | 1,489,517 | |
| | 2,970,000 | | | Southern California Edison Co., 3.650%, 2/01/2050 | | | 3,373,363 | |
| | 850,000 | | | Southern California Edison Co., 4.000%, 4/01/2047 | | | 998,408 | |
| | 1,060,000 | | | Southern California Edison Co., Series C, 4.125%, 3/01/2048 | | | 1,263,278 | |
| | 40,595,000 | | | Vistra Operations Co. LLC, 3.700%, 1/30/2027, 144A | | | 44,763,549 | |
| | 1,105,000 | | | Vistra Operations Co. LLC, 4.300%, 7/15/2029, 144A | | | 1,254,201 | |
| | | | | | | | |
| | | | | | | 192,757,806 | |
| | | | | | | | |
| | | | Finance Companies — 2.2% | |
| | 1,245,000 | | | Air Lease Corp., 2.250%, 1/15/2023 | | | 1,278,265 | |
| | 23,900,000 | | | Air Lease Corp., 3.125%, 12/01/2030 | | | 24,879,409 | |
| | 2,235,000 | | | Air Lease Corp., 3.250%, 10/01/2029 | | | 2,362,058 | |
| | 10,270,000 | | | Air Lease Corp., 3.375%, 7/01/2025 | | | 11,044,337 | |
| | 345,000 | | | Air Lease Corp., 4.625%, 10/01/2028 | | | 396,313 | |
| | 8,426,000 | | | Air Lease Corp., MTN, 3.000%, 2/01/2030 | | | 8,650,126 | |
| | 12,430,000 | | | Aircastle Ltd., 4.125%, 5/01/2024 | | | 13,146,458 | |
| | 8,070,000 | | | Aircastle Ltd., 4.400%, 9/25/2023 | | | 8,551,453 | |
| | 8,160,000 | | | Aircastle Ltd., 5.000%, 4/01/2023 | | | 8,697,781 | |
| | 6,700,000 | | | Antares Holdings LP, 6.000%, 8/15/2023, 144A | | | 6,832,814 | |
| | 7,510,000 | | | Aviation Capital Group LLC, 5.500%, 12/15/2024, 144A | | | 8,314,077 | |
| | 9,530,000 | | | GE Capital Funding LLC, 4.400%, 5/15/2030, 144A | | | 11,234,236 | |
| | 3,460,000 | | | GE Capital International Funding Co. Unlimited Co., 4.418%, 11/15/2035 | | | 4,129,669 | |
| | 3,425,000 | | | Navient Corp., 5.000%, 3/15/2027 | | | 3,454,969 | |
| | 50,000 | | | Navient Corp., 5.875%, 10/25/2024 | | | 53,125 | |
| | 35,000 | | | Navient Corp., 6.500%, 6/15/2022 | | | 37,038 | |
| | 145,000 | | | Navient Corp., 6.750%, 6/15/2026 | | | 157,506 | |
| | 370,000 | | | Navient Corp., 7.250%, 9/25/2023 | | | 405,513 | |
| | 20,000 | | | Navient Corp., MTN, 6.125%, 3/25/2024 | | | 21,350 | |
| | 165,000 | | | Navient Corp., MTN, 7.250%, 1/25/2022 | | | 172,425 | |
| | 7,805,000 | | | Quicken Loans LLC, 5.250%, 1/15/2028, 144A | | | 8,331,837 | |
| | 3,645,000 | | | Quicken Loans LLC/Quicken Loans Co-Issuer, Inc., 3.625%, 3/01/2029, 144A | | | 3,717,900 | |
| | 4,955,000 | | | Quicken Loans LLC/Quicken Loans Co-Issuer, Inc., 3.875%, 3/01/2031, 144A | | | 5,140,813 | |
| | | | | | | | |
| | | | | | | 131,009,472 | |
| | | | | | | | |
| | | | Financial Other — 0.1% | |
| | 2,415,000 | | | Icahn Enterprises LP/Icahn Enterprises Finance Corp., 4.750%, 9/15/2024 | | | 2,508,581 | |
| | 3,182,000 | | | Icahn Enterprises LP/Icahn Enterprises Finance Corp., 5.250%, 5/15/2027 | | | 3,411,104 | |
| | | | | | | | |
| | | | | | | 5,919,685 | |
| | | | | | | | |
| | | | Food & Beverage — 2.6% | |
| | 2,040,000 | | | Anheuser-Busch Cos. LLC/Anheuser-Busch InBev Worldwide, Inc., 4.900%, 2/01/2046 | | | 2,652,470 | |
| | 14,470,000 | | | Anheuser-Busch InBev Worldwide, Inc., 4.500%, 6/01/2050 | | | 18,264,900 | |
| | 6,002,000 | | | Anheuser-Busch InBev Worldwide, Inc., 4.600%, 4/15/2048 | | | 7,594,939 | |
| | | | Food & Beverage — continued | |
| 15,285,000 | | | Fomento Economico Mexicano SAB de CV, 3.500%, 1/16/2050 | | | 17,009,067 | |
| | 4,910,000 | | | JBS USA LUX S.A./JBS USA Finance, Inc., 6.750%, 2/15/2028, 144A | | | 5,516,385 | |
| | 10,660,000 | | | JBS USA LUX S.A./JBS USA Food Co./JBS USA Finance, Inc., 5.500%, 1/15/2030, 144A | | | 12,245,782 | |
| | 25,875,000 | | | Kraft Heinz Foods Co., 4.375%, 6/01/2046 | | | 27,884,711 | |
| | 6,470,000 | | | NBM U.S Holdings, Inc., 7.000%, 5/14/2026, 144A | | | 7,044,277 | |
| | 9,535,000 | | | PepsiCo, Inc., 1.700%, 10/06/2021 | | | 9,626,525 | |
| | 45,980,000 | | | PepsiCo, Inc., 2.000%, 4/15/2021 | | | 46,145,795 | |
| | 1,920,000 | | | Smithfield Foods, Inc., 3.000%, 10/15/2030, 144A | | | 2,031,508 | |
| | | | | | | | |
| | | | | | | 156,016,359 | |
| | | | | | | | |
| | | | Government Owned – No Guarantee — 0.6% | |
| | 4,000,000 | | | Empresa de los Ferrocarriles del Estado, 3.068%, 8/18/2050, 144A | | | 3,893,560 | |
| | 8,080,000 | | | Equinor ASA, 3.700%, 4/06/2050 | | | 9,737,553 | |
| | 20,145,000 | | | Saudi Arabian Oil Co., 3.250%, 11/24/2050, 144A | | | 20,428,391 | |
| | | | | | | | |
| | | | | | | 34,059,504 | |
| | | | | | | | |
| | | | Government Sponsored — 0.1% | |
| | 6,130,000 | | | Petrobras Global Finance BV, 6.900%, 3/19/2049 | | | 7,769,775 | |
| | | | | | | | |
| | | | Health Insurance — 0.0% | |
| | 565,000 | | | Centene Corp., 4.625%, 12/15/2029 | | | 627,269 | |
| | | | | | | | |
| | | | Healthcare — 1.8% | |
| | 19,420,000 | | | Cigna Corp., 4.375%, 10/15/2028 | | | 23,472,700 | |
| | 1,261,000 | | | Cigna Corp., 7.875%, 5/15/2027 | | | 1,715,425 | |
| | 7,210,000 | | | CVS Health Corp., 3.250%, 8/15/2029 | | | 8,120,151 | |
| | 685,000 | | | Encompass Health Corp., 4.750%, 2/01/2030 | | | 733,806 | |
| | 8,810,000 | | | HCA, Inc., 4.125%, 6/15/2029 | | | 10,220,319 | |
| | 16,050,000 | | | HCA, Inc., 4.500%, 2/15/2027 | | | 18,669,390 | |
| | 22,730,000 | | | HCA, Inc., 5.250%, 6/15/2049 | | | 30,021,696 | |
| | 4,806,000 | | | HCA, Inc., 7.050%, 12/01/2027 | | | 5,821,267 | |
| | 1,592,000 | | | HCA, Inc., 7.500%, 11/06/2033 | | | 2,212,880 | |
| | 1,295,000 | | | HCA, Inc., 7.690%, 6/15/2025 | | | 1,554,000 | |
| | 2,480,000 | | | HCA, Inc., MTN, 7.580%, 9/15/2025 | | | 2,988,400 | |
| | 3,068,000 | | | HCA, Inc., MTN, 7.750%, 7/15/2036 | | | 3,965,390 | |
| | | | | | | | |
| | | | | | | 109,495,424 | |
| | | | | | | | |
| | | | Home Construction — 0.1% | |
| | 2,450,000 | | | Lennar Corp., 4.750%, 11/29/2027 | | | 2,895,410 | |
| | 560,000 | | | Lennar Corp., 4.875%, 12/15/2023 | | | 618,800 | |
| | 55,000 | | | Lennar Corp., 5.000%, 6/15/2027 | | | 64,763 | |
| | 2,755,000 | | | MDC Holdings, Inc., 6.000%, 1/15/2043 | | | 3,693,201 | |
| | | | | | | | |
| | | | | | | 7,272,174 | |
| | | | | | | | |
| | | | Independent Energy — 1.1% | |
| | 3,195,000 | | | Aker BP ASA, 3.000%, 1/15/2025, 144A | | | 3,353,116 | |
| | 9,925,000 | | | Aker BP ASA, 3.750%, 1/15/2030, 144A | | | 10,424,312 | |
| | 16,455,000 | | | Aker BP ASA, 4.000%, 1/15/2031, 144A | | | 17,824,841 | |
| | 9,310,000 | | | Continental Resources, Inc., 3.800%, 6/01/2024 | | | 9,613,599 | |
| | 10,475,000 | | | Hess Corp., 4.300%, 4/01/2027 | | | 11,548,398 | |
| | 4,675,000 | | | Leviathan Bond Ltd., 6.125%, 6/30/2025, 144A | | | 5,120,107 | |
| | 6,090,000 | | | Occidental Petroleum Corp., 5.550%, 3/15/2026 | | | 6,357,595 | |
| | | | | | | | |
| | | | | | | 64,241,968 | |
| | | | | | | | |
| | | | Integrated Energy — 0.9% | |
| | 52,303,000 | | | Shell International Finance BV, 1.875%, 5/10/2021 | | | 52,601,282 | |
| | | | | | | | |
| | | | Life Insurance — 3.7% | |
| | 5,653,000 | | | American International Group, Inc., 4.200%, 4/01/2028 | | | 6,710,829 | |
| | 21,550,000 | | | Athene Global Funding, 2.550%, 11/19/2030, 144A | | | 21,566,206 | |
See accompanying notes to financial statements.
| 42
Portfolio of Investments – as of December 31, 2020
Loomis Sayles Investment Grade Bond Fund – (continued)
| | | | | | | | |
Principal
Amount | | | Description | | Value (†) | |
| | | | Life Insurance — continued | |
| $ | 7,385,000 | | | Athene Holding Ltd., 3.500%, 1/15/2031 | | $ | 7,804,532 | |
| | 8,255,000 | | | CNO Financial Group, Inc., 5.250%, 5/30/2029 | | | 9,956,933 | |
| | 19,600,000 | | | Fidelity & Guaranty Life Holdings, Inc., 5.500%, 5/01/2025, 144A | | | 22,873,200 | |
| | 15,000,000 | | | Global Atlantic Fin Co., 8.625%, 4/15/2021, 144A | | | 15,252,351 | |
| | 2,565,000 | | | Massachusetts Mutual Life Insurance Co., 3.375%, 4/15/2050, 144A | | | 2,802,036 | |
| | 5,895,000 | | | Metropolitan Life Global Funding I, 3-month LIBOR + 0.230%, 0.460%, 1/08/2021, 144A(b) | | | 5,895,157 | |
| | 30,030,000 | | | Metropolitan Life Global Funding I, 3.375%, 1/11/2022, 144A | | | 30,923,307 | |
| | 9,063,000 | | | Mutual of Omaha Insurance Co., 6.800%, 6/15/2036, 144A | | | 12,158,037 | |
| | 26,914,000 | | | National Life Insurance Co., 10.500%, 9/15/2039, 144A(d)(e) | | | 46,341,871 | |
| | 5,760,000 | | | New York Life Insurance Co., 3.750%, 5/15/2050, 144A | | | 6,890,306 | |
| | 6,440,000 | | | NLV Financial Corp., 7.500%, 8/15/2033, 144A(d)(e) | | | 8,869,039 | |
| | 2,872,000 | | | Penn Mutual Life Insurance Co. (The), 6.650%, 6/15/2034, 144A | | | 3,683,134 | |
| | 14,489,000 | | | Penn Mutual Life Insurance Co. (The), 7.625%, 6/15/2040, 144A(d)(e) | | | 20,881,896 | |
| | | | | | | | |
| | | | | | | 222,608,834 | |
| | | | | | | | |
| | | | Local Authorities — 0.3% | |
| | 14,455,000 | | | Province of Quebec Canada, 0.600%, 7/23/2025 | | | 14,515,422 | |
| | | | | | | | |
| | | | Lodging — 0.0% | |
| | 1,795,000 | | | Marriott International, Inc., 4.625%, 6/15/2030 | | | 2,106,395 | |
| | | | | | | | |
| | | | Media Entertainment — 1.2% | |
| | 23,830,000 | | | Discovery Communications LLC, 4.650%, 5/15/2050 | | | 29,805,250 | |
| | 265,000 | | | iHeartCommunications, Inc., 4.750%, 1/15/2028, 144A | | | 271,956 | |
| | 3,225,000 | | | iHeartCommunications, Inc., 5.250%, 8/15/2027, 144A | | | 3,386,250 | |
| | 1,530,000 | | | iHeartCommunications, Inc., 6.375%, 5/01/2026 | | | 1,637,100 | |
| | 4,640,000 | | | iHeartCommunications, Inc., 8.375%, 5/01/2027 | | | 4,953,014 | |
| | 245,000 | | | Netflix, Inc., 4.875%, 4/15/2028 | | | 276,287 | |
| | 2,625,000 | | | Netflix, Inc., 4.875%, 6/15/2030, 144A | | | 3,018,750 | |
| | 870,000 | | | Netflix, Inc., 5.375%, 11/15/2029, 144A | | | 1,025,513 | |
| | 2,700,000 | | | ViacomCBS, Inc., 4.200%, 6/01/2029 | | | 3,229,800 | |
| | 3,010,000 | | | ViacomCBS, Inc., 4.200%, 5/19/2032 | | | 3,627,492 | |
| | 18,215,000 | | | ViacomCBS, Inc., 4.950%, 1/15/2031 | | | 22,862,158 | |
| | | | | | | | |
| | | | | | | 74,093,570 | |
| | | | | | | | |
| | | | Metals & Mining — 3.1% | |
| | 550,000 | | | Anglo American Capital PLC, 2.625%, 9/10/2030, 144A | | | 575,129 | |
| | 6,260,000 | | | Anglo American Capital PLC, 4.000%, 9/11/2027, 144A | | | 7,188,357 | |
| | 34,334,000 | | | Anglo American Capital PLC, 4.500%, 3/15/2028, 144A | | | 40,316,085 | |
| | 8,785,000 | | | Anglo American Capital PLC, 4.750%, 4/10/2027, 144A | | | 10,363,187 | |
| | 3,130,000 | | | Antofagasta PLC, 2.375%, 10/14/2030, 144A | | | 3,137,825 | |
| | 11,990,000 | | | ArcelorMittal S.A., 7.000%, 3/01/2041 | | | 16,523,163 | |
| | 5,890,000 | | | First Quantum Minerals Ltd., 6.875%, 10/15/2027, 144A | | | 6,390,650 | |
| | 2,930,000 | | | Freeport-McMoRan, Inc., 4.375%, 8/01/2028 | | | 3,113,125 | |
| | 1,975,000 | | | Freeport-McMoRan, Inc., 4.625%, 8/01/2030 | | | 2,167,563 | |
| | 5,760,000 | | | Freeport-McMoRan, Inc., 5.400%, 11/14/2034 | | | 7,207,200 | |
| | 1,770,000 | | | Freeport-McMoRan, Inc., 5.450%, 3/15/2043 | | | 2,203,650 | |
| | | | Metals & Mining — continued | |
| 7,688,000 | | | Glencore Funding LLC, 3.875%, 10/27/2027, 144A | | | 8,690,131 | |
| | 39,092,000 | | | Glencore Funding LLC, 4.000%, 3/27/2027, 144A | | | 44,220,182 | |
| | 11,700,000 | | | Glencore Funding LLC, 4.125%, 3/12/2024, 144A | | | 12,874,600 | |
| | 4,280,000 | | | Newcrest Finance Pty Ltd., 3.250%, 5/13/2030, 144A | | | 4,727,516 | |
| | 1,855,000 | | | Reliance Steel & Aluminum Co., 2.150%, 8/15/2030 | | | 1,905,873 | |
| | 395,000 | | | Steel Dynamics, Inc., 3.250%, 1/15/2031 | | | 441,707 | |
| | 14,125,000 | | | Steel Dynamics, Inc., 3.450%, 4/15/2030 | | | 15,989,320 | |
| | | | | | | | |
| | | | | | | 188,035,263 | |
| | | | | | | | |
| | | | Midstream — 2.5% | |
| | 22,495,000 | | | Cheniere Corpus Christi Holdings LLC, 3.700%, 11/15/2029 | | | 25,042,863 | |
| | 650,000 | | | DCP Midstream Operating LP, 6.450%, 11/03/2036, 144A | | | 702,000 | |
| | 7,000,000 | | | Energy Transfer Operating LP, 4.950%, 6/15/2028 | | | 8,068,299 | |
| | 36,405,000 | | | Energy Transfer Operating LP, 5.250%, 4/15/2029 | | | 42,504,951 | |
| | 1,435,000 | | | Gray Oak Pipeline LLC, 3.450%, 10/15/2027, 144A | | | 1,498,882 | |
| | 14,660,000 | | | Kinder Morgan Energy Partners LP, 3.500%, 9/01/2023 | | | 15,702,917 | |
| | 85,000 | | | Kinder Morgan Energy Partners LP, 5.000%, 8/15/2042 | | | 99,704 | |
| | 375,000 | | | Kinder Morgan, Inc., 5.050%, 2/15/2046 | | | 456,731 | |
| | 14,040,000 | | | MPLX LP, 4.250%, 12/01/2027 | | | 16,485,357 | |
| | 85,000 | | | NGPL PipeCo LLC, 7.768%, 12/15/2037, 144A | | | 114,918 | |
| | 225,000 | | | Plains All American Pipeline LP/PAA Finance Corp., 2.850%, 1/31/2023 | | | 232,991 | |
| | 2,890,000 | | | Plains All American Pipeline LP/PAA Finance Corp., 3.800%, 9/15/2030 | | | 3,106,897 | |
| | 7,365,000 | | | Plains All American Pipeline LP/PAA Finance Corp., 4.300%, 1/31/2043 | | | 7,246,418 | |
| | 6,870,000 | | | Plains All American Pipeline LP/PAA Finance Corp., 4.700%, 6/15/2044 | | | 7,123,565 | |
| | 620,000 | | | Plains All American Pipeline LP/PAA Finance Corp., 4.900%, 2/15/2045 | | | 658,003 | |
| | 12,445,000 | | | Sabine Pass Liquefaction LLC, 4.500%, 5/15/2030, 144A | | | 14,750,779 | |
| | 8,405,000 | | | Williams Cos., Inc. (The), 3.350%, 8/15/2022 | | | 8,741,480 | |
| | | | | | | | |
| | | | | | | 152,536,755 | |
| | | | | | | | |
| | | | Mortgage Related — 0.0% | |
| | 1,204 | | | FNMA, 6.000%, 7/01/2029 | | | 1,374 | |
| | | | | | | | |
| | | | Non-Agency Commercial Mortgage-Backed Securities — 0.8% | |
| | 1,410,000 | | | Commercial Mortgage Pass Through Certificates, Series 2012-CR3, Class AM, 3.416%, 10/15/2045, 144A | | | 1,430,032 | |
| | 785,000 | | | Commercial Mortgage Pass Through Certificates, Series 2012-LTRT, Class A2, 3.400%, 10/05/2030, 144A | | | 759,273 | |
| | 405,000 | | | Commercial Mortgage Trust, Series 2012-LC4, Class C, 5.535%, 12/10/2044(a) | | | 365,118 | |
| | 3,205,000 | | | Credit Suisse Commercial Mortgage Securities Corp., Series 2019-SKLZ, Class D, 1-month LIBOR + 3.600%, 3.759%, 1/15/2034, 144A(b) | | | 3,023,939 | |
| | 12,790,000 | | | Credit Suisse Mortgage Trust, Series 2014-USA, Class D, 4.373%, 9/15/2037, 144A | | | 10,558,657 | |
| | 5,095,000 | | | DBUBS Mortgage Trust, Series 2017-BRBK, Class D, 3.530%, 10/10/2034, 144A(a) | | | 5,327,230 | |
| | 9,406,000 | | | GS Mortgage Securities Corp. Trust, Series 2013-PEMB, Class D, 3.550%, 3/05/2033, 144A(a) | | | 7,584,087 | |
See accompanying notes to financial statements.
43 |
Portfolio of Investments – as of December 31, 2020
Loomis Sayles Investment Grade Bond Fund – (continued)
| | | | | | | | |
Principal
Amount | | | Description | | Value (†) | |
| | | | Non-Agency Commercial Mortgage-Backed Securities — continued | |
| $ | 2,390,000 | | | GS Mortgage Securities Corp. Trust, Series 2013-PEMB, Class A, 3.550%, 3/05/2033, 144A(a) | | $ | 2,308,024 | |
| | 3,094,000 | | | GS Mortgage Securities Trust, Series 2014-GC18, Class B, 4.885%, 1/10/2047(a) | | | 2,997,171 | |
| | 1,405,000 | | | Morgan Stanley Bank of America Merrill Lynch Trust, Series 2013-C12, Class C, 4.763%, 10/15/2046(a) | | | 1,257,334 | |
| | 3,989,000 | | | Morgan Stanley Capital I Trust, Series 2011-C2, Class B, 5.200%, 6/15/2044, 144A(a) | | | 3,978,486 | |
| | 3,456,000 | | | Morgan Stanley Capital I Trust, Series 2011-C2, Class E, 5.477%, 6/15/2044, 144A(a) | | | 2,122,142 | |
| | 6,706,000 | | | UBS-Barclays Commercial Mortgage Trust, Series 2012-C2, Class E, 4.888%, 5/10/2063, 144A(a)(d)(e) | | | 3,107,873 | |
| | 1,290,000 | | | WFRBS Commercial Mortgage Trust, Series 2014-C24, Class B, 4.204%, 11/15/2047(a) | | | 1,284,729 | |
| | 939,546 | | | WFRBS Commercial Mortgage Trust, Series 2011-C2, Class D, 5.523%, 2/15/2044, 144A(a) | | | 936,953 | |
| | 2,125,000 | | | WFRBS Commercial Mortgage Trust, Series 2011-C3, Class D, 5.642%, 3/15/2044, 144A(a) | | | 990,905 | |
| | 1,746,000 | | | WFRBS Commercial Mortgage Trust, Series 2012-C7, Class C, 4.810%, 6/15/2045(a) | | | 1,359,810 | |
| | 865,000 | | | WFRBS Commercial Mortgage Trust, Series 2012-C7, Class E, 4.810%, 6/15/2045, 144A(a) | | | 383,832 | |
| | | | | | | | |
| | | | | | | 49,775,595 | |
| | | | | | | | |
| | | | Paper — 0.6% | |
| | 10,460,000 | | | Suzano Austria GmbH, 3.750%, 1/15/2031 | | | 11,098,060 | |
| | 16,595,000 | | | Weyerhaeuser Co., 4.000%, 4/15/2030 | | | 19,652,196 | |
| | 2,745,000 | | | WRKCo, Inc., 3.000%, 6/15/2033 | | | 3,015,840 | |
| | | | | | | | |
| | | | | | | 33,766,096 | |
| | | | | | | | |
| | | | Pharmaceuticals — 1.5% | |
| | 8,370,000 | | | Merck & Co., Inc., 2.450%, 6/24/2050 | | | 8,666,038 | |
| | 2,459,000 | | | Mylan, Inc., 5.200%, 4/15/2048 | | | 3,201,276 | |
| | 9,724,000 | | | Mylan, Inc., 5.400%, 11/29/2043 | | | 12,942,897 | |
| | 3,100,000 | | | Perrigo Finance UnLtd. Co., 3.150%, 6/15/2030 | | | 3,313,145 | |
| | 980,000 | | | Teva Pharmaceutical Finance Co. LLC, 6.150%, 2/01/2036 | | | 1,041,250 | |
| | 9,335,000 | | | Teva Pharmaceutical Finance Netherlands III BV, 2.800%, 7/21/2023 | | | 9,236,142 | |
| | 15,105,000 | | | Teva Pharmaceutical Finance Netherlands III BV, 3.150%, 10/01/2026 | | | 14,519,832 | |
| | 6,270,000 | | | Teva Pharmaceutical Finance Netherlands III BV, 4.100%, 10/01/2046 | | | 5,580,300 | |
| | 12,646,000 | | | Utah Acquisition Sub, Inc., 5.250%, 6/15/2046 | | | 16,567,275 | |
| | 11,805,000 | | | Viatris, Inc., 4.000%, 6/22/2050, 144A | | | 13,524,846 | |
| | | | | | | | |
| | | | | | | 88,593,001 | |
| | | | | | | | |
| | | | Property & Casualty Insurance — 0.4% | |
| | 16,635,000 | | | Fidelity National Financial, Inc., 3.400%, 6/15/2030 | | | 18,268,093 | |
| | 2,740,000 | | | Fidelity National Financial, Inc., 5.500%, 9/01/2022 | | | 2,951,877 | |
| | 3,159,000 | | | Sirius International Group Ltd., 4.600%, 11/01/2026, 144A | | | 3,137,045 | |
| | 1,605,000 | | | Travelers Cos., Inc. (The), 2.550%, 4/27/2050 | | | 1,689,575 | |
| | | | | | | | |
| | | | | | | 26,046,590 | |
| | | | | | | | |
| | | | REITs – Health Care — 0.1% | |
| 5,972,000 | | | Welltower, Inc., 6.500%, 3/15/2041 | | | 8,349,736 | |
| | | | | | | | |
| | | | REITs – Regional Malls — 0.2% | |
| | 6,815,000 | | | Simon Property Group LP, 2.650%, 7/15/2030 | | | 7,223,046 | |
| | 4,945,000 | | | Simon Property Group LP, 3.800%, 7/15/2050 | | | 5,516,718 | |
| | | | | | | | |
| | | | | | | 12,739,764 | |
| | | | | | | | |
| | | | REITs – Shopping Centers — 0.1% | |
| | 2,280,000 | | | Brixmor Operating Partnership LP, 4.050%, 7/01/2030 | | | 2,616,926 | |
| | | | | | | | |
| | | | Restaurants — 0.1% | |
| | 2,375,000 | | | Yum! Brands, Inc., 4.750%, 1/15/2030, 144A | | | 2,604,188 | |
| | 1,890,000 | | | Yum! Brands, Inc., 7.750%, 4/01/2025, 144A | | | 2,093,175 | |
| | | | | | | | |
| | | | | | | 4,697,363 | |
| | | | | | | | |
| | | | Retailers — 1.1% | |
| | 1,960,000 | | | AutoNation, Inc., 4.750%, 6/01/2030 | | | 2,358,535 | |
| | 9,720,000 | | | AutoZone, Inc., 3.625%, 4/15/2025 | | | 10,887,990 | |
| | 14,585,000 | | | AutoZone, Inc., 4.000%, 4/15/2030 | | | 17,278,994 | |
| | 370,746 | | | CVS Pass-Through Trust, 5.773%, 1/10/2033, 144A | | | 436,064 | |
| | 392,236 | | | CVS Pass-Through Trust, 6.036%, 12/10/2028 | | | 453,339 | |
| | 11,141,351 | | | CVS Pass-Through Trust, Series 2013, 4.704%, 1/10/2036, 144A | | | 12,621,702 | |
| | 1,168,350 | | | CVS Pass-Through Trust, Series 2014, 4.163%, 8/11/2036, 144A | | | 1,279,694 | |
| | 5,620,000 | | | Dollar General Corp., 3.500%, 4/03/2030 | | | 6,451,605 | |
| | 8,064,000 | | | Marks & Spencer PLC, 7.125%, 12/01/2037, 144A | | | 9,014,101 | |
| | 3,755,000 | | | PVH Corp., 7.750%, 11/15/2023 | | | 4,399,658 | |
| | | | | | | | |
| | | | | | | 65,181,682 | |
| | | | | | | | |
| | | | Sovereigns — 0.5% | |
| | 30,040,000 | | | Mexico Government International Bond, 3.771%, 5/24/2061 | | | 31,398,108 | |
| | | | | | | | |
| | | | Supermarkets — 0.0% | |
| | 325,000 | | | Koninklijke Ahold Delhaize NV, 5.700%, 10/01/2040 | | | 465,625 | |
| | | | | | | | |
| | | | Technology — 4.8% | |
| | 27,985,000 | | | Avnet, Inc., 4.625%, 4/15/2026 | | | 31,676,746 | |
| | 1,300,000 | | | Broadcom Corp./Broadcom Cayman Finance Ltd., 3.500%, 1/15/2028 | | | 1,432,870 | |
| | 10,158,000 | | | Broadcom, Inc., 4.150%, 11/15/2030 | | | 11,760,549 | |
| | 17,895,000 | | | Broadcom, Inc., 4.300%, 11/15/2032 | | | 21,214,326 | |
| | 31,450,000 | | | Broadcom, Inc., 4.750%, 4/15/2029 | | | 37,511,104 | |
| | 12,400,000 | | | Broadcom, Inc., 5.000%, 4/15/2030 | | | 15,073,588 | |
| | 1,620,000 | | | CommScope Technologies LLC, 5.000%, 3/15/2027, 144A | | | 1,595,700 | |
| | 3,900,000 | | | CommScope, Inc., 6.000%, 3/01/2026, 144A | | | 4,109,040 | |
| | 3,950,000 | | | CommScope, Inc., 7.125%, 7/01/2028, 144A | | | 4,206,750 | |
| | 10,115,000 | | | Equinix, Inc., 2.150%, 7/15/2030 | | | 10,288,475 | |
| | 17,195,000 | | | Equinix, Inc., 3.200%, 11/18/2029 | | | 18,876,101 | |
| | 4,610,000 | | | Jabil, Inc., 3.000%, 1/15/2031 | | | 4,888,050 | |
| | 7,440,000 | | | Jabil, Inc., 4.700%, 9/15/2022 | | | 7,926,428 | |
| | 16,735,000 | | | KLA Corp., 5.650%, 11/01/2034 | | | 22,564,124 | |
| | 25,479,000 | | | Micron Technology, Inc., 4.663%, 2/15/2030 | | | 31,266,472 | |
| | 10,622,000 | | | Micron Technology, Inc., 5.327%, 2/06/2029 | | | 13,286,913 | |
| | 3,980,000 | | | NXP BV/NXP Funding LLC/NXP USA, Inc., 3.150%, 5/01/2027, 144A | | | 4,388,157 | |
| | 2,225,000 | | | NXP BV/NXP Funding LLC/NXP USA, Inc., 3.400%, 5/01/2030, 144A | | | 2,523,183 | |
| | 1,055,000 | | | Open Text Corp., 3.875%, 2/15/2028, 144A | | | 1,097,179 | |
| | 1,015,000 | | | Open Text Holdings, Inc., 4.125%, 2/15/2030, 144A | | | 1,079,757 | |
| | 25,480,000 | | | Oracle Corp., 3.600%, 4/01/2050 | | | 29,686,328 | |
See accompanying notes to financial statements.
| 44
Portfolio of Investments – as of December 31, 2020
Loomis Sayles Investment Grade Bond Fund – (continued)
| | | | | | | | |
Principal
Amount | | | Description | | Value (†) | |
| | | | Technology — continued | |
| $ | 970,000 | | | SS&C Technologies, Inc., 5.500%, 9/30/2027, 144A | | $ | 1,035,979 | |
| | 9,135,000 | | | Verisk Analytics, Inc., 4.125%, 3/15/2029 | | | 10,977,720 | |
| | | | | | | | |
| | | | | | | 288,465,539 | |
| | | | | | | | |
| | | | Transportation Services — 0.2% | |
| | 9,670,000 | | | Adani Ports & Special Economic Zone Ltd., 4.200%, 8/04/2027, 144A | | | 10,377,686 | |
| | | | | | | | |
| | | | Treasuries — 12.8% | |
| | 267,555,000 | | | U.S. Treasury Note, 0.125%, 4/30/2022 | | | 267,617,710 | |
| | 173,275,000 | | | U.S. Treasury Note, 0.125%, 6/30/2022 | | | 173,302,074 | |
| | 119,815,000 | | | U.S. Treasury Note, 0.125%, 12/31/2022 | | | 119,829,041 | |
| | 209,930,000 | | | U.S. Treasury Note, 0.375%, 3/31/2022 | | | 210,594,231 | |
| | | | | | | | |
| | | | | | | 771,343,056 | |
| | | | | | | | |
| | | | Wireless — 1.8% | |
| | 21,805,000 | | | American Tower Corp., 2.100%, 6/15/2030 | | | 22,380,814 | |
| | 2,295,000 | | | Crown Castle International Corp., 2.250%, 1/15/2031 | | | 2,380,692 | |
| | 3,725,000 | | | Crown Castle International Corp., 3.300%, 7/01/2030 | | | 4,169,314 | |
| | 22,660,000 | | | Crown Castle International Corp., 3.650%, 9/01/2027 | | | 25,582,808 | |
| | 6,615,000 | | | Crown Castle International Corp., 4.000%, 3/01/2027 | | | 7,597,027 | |
| | 730,000 | | | Crown Castle International Corp., 4.150%, 7/01/2050 | | | 884,643 | |
| | 610,000 | | | Sprint Capital Corp., 6.875%, 11/15/2028 | | | 804,273 | |
| | 1,545,000 | | | Sprint Corp., 7.250%, 9/15/2021 | | | 1,607,573 | |
| | 36,385,000 | | | T-Mobile USA, Inc., 3.875%, 4/15/2030, 144A | | | 42,141,107 | |
| | 980,000 | | | T-Mobile USA, Inc., 4.500%, 2/01/2026 | | | 1,001,888 | |
| | | | | | | | |
| | | | | | | 108,550,139 | |
| | | | | | | | |
| | | | Wirelines — 2.3% | |
| | 9,487,000 | | | AT&T, Inc., 3.500%, 9/15/2053, 144A | | | 9,500,924 | |
| | 364,000 | | | AT&T, Inc., 3.550%, 9/15/2055, 144A | | | 362,764 | |
| | 20,495,000 | | | AT&T, Inc., 3.650%, 6/01/2051 | | | 21,460,171 | |
| | 515,000 | | | AT&T, Inc., 3.650%, 9/15/2059, 144A | | | 520,015 | |
| | 3,245,000 | | | AT&T, Inc., 3.800%, 12/01/2057, 144A | | | 3,390,820 | |
| | 61,415,000 | | | AT&T, Inc., 4.300%, 2/15/2030 | | | 73,362,515 | |
| | 857,000 | | | Level 3 Financing, Inc., 4.625%, 9/15/2027, 144A | | | 895,081 | |
| | 20,585,000 | | | Telefonica Emisiones S.A., 5.520%, 3/01/2049 | | | 27,562,286 | |
| | | | | | | | |
| | | | | | | 137,054,576 | |
| | | | | | | | |
| | | | Total Non-Convertible Bonds
(Identified Cost $4,967,750,678) | | | 5,453,191,355 | |
| | | | | | | | |
| | | | | | | | |
| | Convertible Bonds — 1.3% | |
| | | | Airlines — 0.1% | |
| | 2,865,000 | | | Southwest Airlines Co., 1.250%, 5/01/2025 | | | 4,161,413 | |
| | | | | | | | |
| | | | Cable Satellite — 0.3% | |
| | 9,050,000 | | | DISH Network Corp., 2.375%, 3/15/2024 | | | 8,433,965 | |
| | 13,110,000 | | | DISH Network Corp., 3.375%, 8/15/2026 | | | 12,496,867 | |
| | | | | | | | |
| | | | | | | 20,930,832 | |
| | | | | | | | |
| | | | Consumer Cyclical Services — 0.1% | |
| | 3,845,000 | | | Uber Technologies, Inc., Zero Coupon, 12/15/2025, 144A | | | 3,933,584 | |
| | | | | | | | |
| | | | Diversified Manufacturing — 0.1% | |
| | 5,165,000 | | | Greenbrier Cos., Inc. (The), 2.875%, 2/01/2024 | | | 5,219,082 | |
| | | | | | | | |
| | | | Electric — 0.1% | |
| | 4,030,000 | | | NRG Energy, Inc., 2.750%, 6/01/2048 | | | 4,579,289 | |
| | | | | | | | |
| | | | Healthcare — 0.1% | |
| 6,355,000 | | | Teladoc Health, Inc., 1.250%, 6/01/2027, 144A | | | 7,611,414 | |
| | | | | | | | |
| | | | Pharmaceuticals — 0.4% | |
| | 5,120,000 | | | BioMarin Pharmaceutical, Inc., 0.599%, 8/01/2024 | | | 5,494,207 | |
| | 13,985,000 | | | BioMarin Pharmaceutical, Inc., 1.250%, 5/15/2027, 144A | | | 14,614,325 | |
| | 3,445,000 | | | Neurocrine Biosciences, Inc., 2.250%, 5/15/2024 | | | 4,753,318 | |
| | | | | | | | |
| | | | | | | 24,861,850 | |
| | | | | | | | |
| | | | Technology — 0.1% | |
| | 3,925,000 | | | Shift4 Payments, Inc., Zero Coupon, 12/15/2025, 144A | | | 4,789,618 | |
| | | | | | | | |
| | | | Total Convertible Bonds
(Identified Cost $72,996,585) | | | 76,087,082 | |
| | | | | | | | |
| | | | | | | | |
| | Municipals — 0.1% | |
| | | | Virginia — 0.1% | |
| | 7,515,000 | | | Tobacco Settlement Financing Corp., Series A-1, 6.706%, 6/01/2046
(Identified Cost $7,253,731) | | | 7,862,719 | |
| | | | | | | | |
| | | | Total Bonds and Notes
(Identified Cost $5,048,000,994) | | | 5,537,141,156 | |
| | | | | | | | |
| | | | | | | | |
| | Collateralized Loan Obligations — 3.8% | |
| | 14,785,000 | | | Alinea CLO Ltd., Series 2018-1A, Class B, 3-month LIBOR + 1.650%, 1.868%, 7/20/2031, 144A(b) | | | 14,768,250 | |
| | 5,715,000 | | | Allegro CLO I Ltd., Series 2013-1A, Class BR, 3-month LIBOR + 2.450%, 2.664%, 1/30/2026, 144A(b) | | | 5,714,024 | |
| | 4,650,000 | | | Allegro CLO VIII Ltd., Series 2018-2A, Class B1, 3-month LIBOR + 1.670%, 1.907%, 7/15/2031, 144A(b) | | | 4,560,214 | |
| | 4,075,000 | | | Ares XXXVII CLO Ltd., Series 2015-4A, Class A3R, 3-month LIBOR + 1.500%, 1.737%, 10/15/2030, 144A(b) | | | 4,044,116 | |
| | 2,774,916 | | | Atrium XII, Series 12A, Class AR, 3-month LIBOR + 0.830%, 1.046%, 4/22/2027, 144A(b) | | | 2,766,001 | |
| | 39,708 | | | Avery Point IV CLO Ltd., Series 2014-1A, Class AR, 3-month LIBOR + 1.100%, 1.315%, 4/25/2026, 144A(b) | | | 39,698 | |
| | 2,240,000 | | | Battalion CLO XIV Ltd., Series 2019-14A, Class B1, 3-month LIBOR + 2.100%, 2.318%, 4/20/2032, 144A(b) | | | 2,251,086 | |
| | 6,995,000 | | | Benefit Street Partners CLO VII Ltd., Series 2015-VIIA, Class BR, 3-month LIBOR + 1.550%, 1.768%, 7/18/2027, 144A(b) | | | 6,991,907 | |
| | 3,339,042 | | | Black Diamond CLO Ltd., Series 2013-1A, Class BR, 3-month LIBOR + 2.500%, 2.718%, 2/06/2026, 144A(b) | | | 3,336,061 | |
| | 2,525,000 | | | Canyon CLO Ltd., Series 2018-1A, Class B, 3-month LIBOR + 1.700%, 1.937%, 7/15/2031, 144A(b) | | | 2,508,040 | |
| | 6,500,000 | | | CIFC Funding Ltd., Series 2014-5A, Class BR2, 3-month LIBOR + 1.800%, 2.018%, 10/17/2031, 144A(b) | | | 6,536,477 | |
| | 2,331,808 | | | CVP Cascade CLO Ltd., Series 2014-2A, Class A1R, 3-month LIBOR + 1.200%, 1.418%, 7/18/2026, 144A(b) | | | 2,331,484 | |
| | 3,335,000 | | | Dryden 53 CLO Ltd., Series 2017-53A, Class B, 3-month LIBOR + 1.400%, 1.637%, 1/15/2031, 144A(b) | | | 3,287,643 | |
See accompanying notes to financial statements.
45 |
Portfolio of Investments – as of December 31, 2020
Loomis Sayles Investment Grade Bond Fund – (continued)
| | | | | | | | |
Principal
Amount | | | Description | | Value (†) | |
| | Collateralized Loan Obligations — continued | |
| $ | 1,030,000 | | | Dryden 86 CLO Ltd., Series 2020-86A, Class B, 3-month LIBOR + 2.200%, 2.434%, 7/17/2030, 144A(b) | | $ | 1,032,752 | |
| | 2,422,818 | | | Elevation CLO Ltd., Series 2015-4A, Class AR, 3-month LIBOR + 0.990%, 1.208%, 4/18/2027, 144A(b) | | | 2,422,819 | |
| | 1,150,351 | | | Flatiron CLO Ltd., Series 2015-1A, Class AR, 3-month LIBOR + 0.890%, 1.127%, 4/15/2027, 144A(b) | | | 1,150,010 | |
| | 5,405,000 | | | Goldentree Loan Management U.S CLO 3 Ltd., Series 2018-3A, Class B1, 3-month LIBOR + 1.550%, 1.768%, 4/20/2030, 144A(b) | | | 5,323,525 | |
| | 5,490,000 | | | Halcyon Loan Advisors Funding Ltd., Series 2014-3A, Class B1R, 3-month LIBOR + 1.700%, 1.916%, 10/22/2025, 144A(b) | | | 5,477,438 | |
| | 13,735,000 | | | Hayfin US XII Ltd, Series 2018-8A, Class B, 3-month LIBOR + 1.480%, 1.698%, 4/20/2031, 144A(b) | | | 13,520,575 | |
| | 1,000,000 | | | Jamestown CLO IX Ltd., Series 2016-9A, Class A2R, 3-month LIBOR + 1.850%, 2.068%, 10/20/2028, 144A(b) | | | 989,919 | |
| | 6,512,487 | | | Jamestown CLO VII Ltd., Series 2015-7A, Class A1R, 3-month LIBOR + 0.830%, 1.045%, 7/25/2027, 144A(b) | | | 6,481,260 | |
| | 417,434 | | | Limerock CLO III LLC, Series 2014-3A, Class A1R, 3-month LIBOR + 1.200%, 1.418%, 10/20/2026, 144A(b) | | | 417,406 | |
| | 4,475,000 | | | Madison Park Funding XII Ltd., Series 2014-12A, Class CR, 3-month LIBOR + 2.350%, 2.568%, 7/20/2026, 144A(b) | | | 4,468,264 | |
| | 13,180,000 | | | Madison Park Funding XIV Ltd., Series 2014-14A, Class BRR, 3-month LIBOR + 1.700%, 1.916%, 10/22/2030, 144A(b) | | | 13,081,487 | |
| | 2,770,000 | | | Madison Park Funding XVI Ltd., Series 2015-16A, Class A2R, 3-month LIBOR + 1.900%, 2.118%, 4/20/2026, 144A(b) | | | 2,767,326 | |
| | 1,450,000 | | | Marble Point CLO X Ltd., Series 2017-1A, Class B, 3-month LIBOR + 1.800%, 2.037%, 10/15/2030, 144A(b) | | | 1,427,720 | |
| | 7,275,000 | | | Marble Point CLO XIV Ltd., Series 2018-2A, Class A1, 3-month LIBOR + 1.330%, 1.548%, 1/20/2032, 144A(b) | | | 7,259,858 | |
| | 10,868,676 | | | Mountain View CLO X Ltd., Series 2015-10A, Class AR, 3-month LIBOR + 0.820%, 1.044%, 10/13/2027, 144A(b) | | | 10,807,743 | |
| | 14,755,000 | | | OCP CLO Ltd., Series 2020-8RA, Class A2, 3-month LIBOR + 1.550%, 0.000%, 1/17/2032, 144A(b)(c)(d)(e) | | | 14,755,000 | |
| | 8,816,295 | | | OCP CLO Ltd., Series 2015-10A, Class A1R, 3-month LIBOR + 0.820%, 1.035%, 10/26/2027, 144A(b) | | | 8,796,299 | |
| | 8,705,000 | | | OCP CLO Ltd., Series 2015-8A, Class A2AR, 3-month LIBOR + 1.450%, 1.668%, 4/17/2027, 144A(b) | | | 8,700,509 | |
| | 1,750,000 | | | OCP CLO Ltd., Series 2015-9A, Class BR, 3-month LIBOR + 1.750%, 1.987%, 7/15/2027, 144A(b) | | | 1,726,551 | |
| | 3,605,000 | | | OZLM XXIV Ltd., Series 2019-24A, Class A2A, 3-month LIBOR + 2.250%, 2.468%, 7/20/2032, 144A(b) | | | 3,617,731 | |
| | 1,551,988 | | | Palmer Square Loan Funding Ltd., Series 2020-3A, Class A1, 3-month LIBOR + 1.700%, 1.918%, 7/20/2028, 144A(b) | | | 1,560,907 | |
| | Collateralized Loan Obligations — continued | |
| 6,959,020 | | | Parallel Ltd., Series 2015-1A, Class AR, 3-month LIBOR + 0.850%, 1.068%, 7/20/2027, 144A(b) | | | 6,929,170 | |
| | 4,600,940 | | | Recette CLO Ltd., Series 2015-1A, Class AR, 3-month LIBOR + 0.920%, 1.138%, 10/20/2027, 144A(b) | | | 4,590,304 | |
| | 1,800,000 | | | Recette CLO Ltd., Series 2015-1A, Class BR, 3-month LIBOR + 1.300%, 1.518%, 10/20/2027, 144A(b) | | | 1,785,459 | |
| | 1,400,000 | | | Recette CLO Ltd., Series 2015-1A, Class CR, 3-month LIBOR + 1.700%, 1.918%, 10/20/2027, 144A(b) | | | 1,396,419 | |
| | 1,015,000 | | | Regatta XV Funding Ltd., Series 2018-4A, Class A2, 3-month LIBOR + 1.850%, 2.065%, 10/25/2031, 144A(b) | | | 1,008,954 | |
| | 3,870,013 | | | Venture XII CLO Ltd., Series 2012-12A, Class ARR, 3-month LIBOR + 0.800%, 1.024%, 2/28/2026, 144A(b) | | | 3,845,138 | |
| | 2,580,375 | | | Venture XX CLO Ltd., Series 2015-20A, Class AR, 3-month LIBOR + 0.820%, 1.057%, 4/15/2027, 144A(b) | | | 2,571,383 | |
| | 5,863,058 | | | Venture XXI CLO Ltd., Series 2015-21A, Class AR, 3-month LIBOR + 0.880%, 1.117%, 7/15/2027, 144A(b) | | | 5,857,202 | |
| | 6,235,000 | | | Voya CLO Ltd., Series 2018-3A, Class B, 3-month LIBOR + 1.650%, 1.887%, 10/15/2031, 144A(b) | | | 6,234,980 | |
| | 3,335,000 | | | Voya CLO Ltd., Series 2013-3A, Class A2RR, 3-month LIBOR + 1.700%, 1.918%, 10/18/2031, 144A(b) | | | 3,276,942 | |
| | 141,894 | | | Voya CLO Ltd., Series 2014-3A, Class A1R, 3-month LIBOR + 0.720%, 0.935%, 7/25/2026, 144A(b) | | | 141,452 | |
| | 14,756,924 | | | Zais CLO 6 Ltd., Series 2017-1A, Class A1, 3-month LIBOR + 1.370%, 1.607%, 7/15/2029, 144A(b) | | | 14,633,359 | |
| | | | | | | | |
| | | | Total Collateralized Loan Obligations
(Identified Cost $223,509,095) | | | 227,190,862 | |
| | | | | | | | |
| | | | | | | | |
| Shares | | | | | | |
| | Preferred Stocks — 0.9% | |
| | | | Banking — 0.5% | |
| | 8,763 | | | Bank of America Corp., Series L, 7.250% | | | 13,307,317 | |
| | 10,730 | | | Wells Fargo & Co., Class A, Series L, 7.500% | | | 16,287,067 | |
| | | | | | | | |
| | | | | | | 29,594,384 | |
| | | | | | | | |
| | | | Electric — 0.1% | |
| | 113,793 | | | NextEra Energy, Inc., 5.279% | | | 5,785,236 | |
| | | | | | | | |
| | | | Energy — 0.0% | |
| | 40,860 | | | Chesapeake Energy Corp., 5.000%(c)(d)(f)(g) | | | — | |
| | | | | | | | |
| | | | Food & Beverage — 0.2% | |
| | 138,889 | | | Bunge Ltd., 4.875% | | | 15,108,904 | |
| | | | | | | | |
| | | | Healthcare — 0.1% | |
| | 55,158 | | | Boston Scientific Corp., Series A, 5.500% | | | 6,043,662 | |
| | | | | | | | |
| | | | Total Preferred Stocks
(Identified Cost $54,907,364) | | | 56,532,186 | |
| | | | | | | | |
| | | | | | | | |
See accompanying notes to financial statements.
| 46
Portfolio of Investments – as of December 31, 2020
Loomis Sayles Investment Grade Bond Fund – (continued)
| | | | | | | | |
Principal
Amount | | | Description | | Value (†) | |
| | Short-Term Investments — 2.9% | |
| $ | 172,892,299 | | | Tri-Party Repurchase Agreement with Fixed Income Clearing Corporation, dated 12/31/2020 at 0.000% to be repurchased at $172,892,299 on 1/04/2021 collateralized by $176,350,201 U.S. Treasury Note, 0.125% due 12/31/2022 valued at $176,350,201 including accrued interest (Note 2 of Notes to Financial Statements) (Identified Cost $172,892,299) | | $ | 172,892,299 | |
| | | | | | | | |
| | | | | | | | |
| | | | Total Investments — 99.5%
(Identified Cost $5,499,309,752) | | | 5,993,756,503 | |
| | | | Other assets less liabilities — 0.5% | | | 31,005,541 | |
| | | | | | | | |
| | | | Net Assets — 100.0% | | $ | 6,024,762,044 | |
| | | | | | | | |
| | | | | | | | |
| | (†) | | | See Note 2 of Notes to Financial Statements. | |
| | (a) | | | Variable rate security. The interest rate adjusts periodically based on; (i) changes in current interest rates and/or prepayments on underlying pools of assets, if applicable, (ii) reference to a base lending rate plus or minus a margin, and/or (iii) reference to a base lending rate adjusted by a multiplier and/or subject to certain floors or caps. Rate as of December 31, 2020 is disclosed. | |
| | (b) | | | Variable rate security. Rate as of December 31, 2020 is disclosed. | |
| | (c) | | | Level 3 security. Value has been determined using significant unobservable inputs. See Note 3 of Notes to Financial Statements. | |
| | (d) | | | Illiquid security. (Unaudited) | |
| | (e) | | | Securities classified as fair valued pursuant to the Fund’s pricing policies and procedures. At December 31, 2020, the value of these securities amounted to $115,550,245 or 1.9% of net assets. See Note 2 of Notes to Financial Statements. | |
| | (f) | | | Non-income producing security. | |
| | (g) | | | Fair valued by the Fund’s adviser. At December 31, 2020, the value of this security amounted to $0. See Note 2 of Notes to Financial Statements. | |
| | | | | |
| | 144A | | | All or a portion of these securities are exempt from registration under Rule 144A of the Securities Act of 1933. These securities may be resold in transactions exempt from registration, normally to qualified institutional buyers. At December 31, 2020, the value of Rule 144A holdings amounted to $2,134,096,969 or 35.4% of net assets. | |
| | ABS | | | Asset-Backed Securities | |
| | ARS | | | Auction Rate Security | |
| | FNMA | | | Federal National Mortgage Association | |
| | GMTN | | | Global Medium Term Note | |
| | LIBOR | | | London Interbank Offered Rate | |
| | MTN | | | Medium Term Note | |
| | REITs | | | Real Estate Investment Trusts | |
| | SLM | | | Sallie Mae | |
Industry Summary at December 31, 2020
| | | | |
Treasuries | | | 12.8 | % |
Banking | | | 8.5 | |
ABS Car Loan | | | 6.3 | |
ABS Home Equity | | | 5.3 | |
Technology | | | 4.9 | |
Life Insurance | | | 3.7 | |
Aerospace & Defense | | | 3.6 | |
Electric | | | 3.4 | |
Metals & Mining | | | 3.1 | |
ABS Other | | | 3.0 | |
Food & Beverage | | | 2.8 | |
Cable Satellite | | | 2.5 | |
Midstream | | | 2.5 | |
Wirelines | | | 2.3 | |
Finance Companies | | | 2.2 | |
Healthcare | | | 2.0 | |
Automotive | | | 2.0 | |
Consumer Cyclical Services | | | 2.0 | |
Other Investments, less than 2% each | | | 19.9 | |
Collateralized Loan Obligations | | | 3.8 | |
Short-Term Investments | | | 2.9 | |
| | | | |
Total Investments | | | 99.5 | |
Other assets less liabilities | | | 0.5 | |
| | | | |
Net Assets | | | 100.0 | % |
| | | | |
See accompanying notes to financial statements.
47 |
Portfolio of Investments – as of December 31, 2020
Loomis Sayles Strategic Alpha Fund
| | | | | | | | |
Principal
Amount (‡) | | | Description | | Value (†) | |
| | Bonds and Notes — 70.4% of Net Assets | |
| | Non-Convertible Bonds — 67.5% | |
| | | | ABS Car Loan — 5.5% | |
| $ | 2,590,000 | | | American Credit Acceptance Receivables Trust, Series 2020-3, Class D, 2.400%, 6/15/2026, 144A | | $ | 2,686,433 | |
| | 2,660,000 | | | American Credit Acceptance Receivables Trust, Series 2020-4, Class D, 1.770%, 12/14/2026, 144A | | | 2,679,686 | |
| | 2,805,000 | | | AmeriCredit Automobile Receivables Trust, Series 2018-2, Class D, 4.010%, 7/18/2024(a) | | | 2,971,634 | |
| | 3,845,000 | | | AmeriCredit Automobile Receivables Trust, Series 2018-3, Class D, 4.040%, 11/18/2024(a) | | | 4,091,975 | |
| | 715,000 | | | AmeriCredit Automobile Receivables Trust, Series 2020-2, Class D, 2.130%, 3/18/2026 | | | 739,577 | |
| | 1,210,000 | | | Avid Automobile Receivables Trust, Series 2019-1, Class C, 3.140%, 7/15/2026, 144A(a) | | | 1,234,439 | |
| | 1,035,000 | | | Avid Automobile Receivables Trust, Series 2019-1, Class D, 4.030%, 7/15/2026, 144A | | | 1,041,627 | |
| | 845,000 | | | Avis Budget Rental Car Funding AESOP LLC, Series 2020-2A, Class B, 2.960%, 2/20/2027, 144A(a) | | | 865,693 | |
| | 1,785,000 | | | California Republic Auto Receivables Trust, Series 2018-1, Class D, 4.330%, 4/15/2025(a) | | | 1,856,740 | |
| | 135,000 | | | CarMax Auto Owner Trust, Series 2018-1, Class D, 3.370%, 7/15/2024(a) | | | 139,604 | |
| | 1,435,000 | | | CarMax Auto Owner Trust, Series 2018-2, Class D, 3.990%, 4/15/2025(a) | | | 1,486,236 | |
| | 1,125,000 | | | CarMax Auto Owner Trust, Series 2018-4, Class D, 4.150%, 4/15/2025 | | | 1,186,709 | |
| | 2,350,000 | | | CarMax Auto Owner Trust, Series 2019-1, Class D, 4.040%, 8/15/2025 | | | 2,470,020 | |
| | 525,000 | | | Credit Acceptance Auto Loan Trust, Series 2017-3A, Class C, 3.480%, 10/15/2026, 144A(a) | | | 529,518 | |
| | 1,205,000 | | | Credit Acceptance Auto Loan Trust, Series 2018-2A, Class C, 4.160%, 9/15/2027, 144A(a) | | | 1,236,340 | |
| | 4,745,000 | | | Credit Acceptance Auto Loan Trust, Series 2019-1A, Class C, 3.940%, 6/15/2028, 144A(a) | | | 4,959,980 | |
| | 1,180,000 | | | Credit Acceptance Auto Loan Trust, Series 2020-3A, Class C, 2.280%, 2/15/2030, 144A(a) | | | 1,198,271 | |
| | 195,000 | | | Drive Auto Receivables Trust, Series 2018-3, Class D, 4.300%, 9/16/2024(a) | | | 201,848 | |
| | 2,395,000 | | | Drive Auto Receivables Trust, Series 2018-5, Class D, 4.300%, 4/15/2026(a) | | | 2,528,567 | |
| | 1,330,000 | | | Drive Auto Receivables Trust, Series 2019-1, Class D, 4.090%, 6/15/2026(a) | | | 1,393,132 | |
| | 1,655,000 | | | DT Auto Owner Trust, Series 2019-2A, Class D, 3.480%, 2/18/2025, 144A(a) | | | 1,709,728 | |
| | 1,110,000 | | | DT Auto Owner Trust, Series 2020-3A, Class D, 1.840%, 6/15/2026, 144A | | | 1,130,596 | |
| | 1,265,000 | | | Exeter Automobile Receivables Trust, Series 2020-2A, Class D, 4.730%, 4/15/2026, 144A(a) | | | 1,374,245 | |
| | 800,000 | | | Exeter Automobile Receivables Trust, Series 2020-3A, Class C, 1.320%, 7/15/2025(a) | | | 804,167 | |
| | 635,000 | | | First Investors Auto Owner Trust , Series 2019-2A, Class D, 2.800%, 12/15/2025, 144A | | | 653,213 | |
| | 1,475,000 | | | First Investors Auto Owner Trust , Series 2019-2A, Class E, 3.880%, 1/15/2026, 144A | | | 1,507,764 | |
| | 3,305,000 | | | Flagship Credit Auto Trust, Series 2019-2, Class D, 3.530%, 5/15/2025, 144A(a) | | | 3,483,878 | |
| | | | ABS Car Loan — continued | |
| 1,165,822 | | | GLS Auto Receivables Trust, Series 2018-3A, Class B, 3.780%, 8/15/2023, 144A(a) | | | 1,184,845 | |
| | 5,030,000 | | | GLS Auto Receivables Trust, Series 2019-2A, Class C, 3.540%, 2/18/2025, 144A(a) | | | 5,254,335 | |
| | 4,540,000 | | | GLS Auto Receivables Trust, Series 2020-3A, Class C, 1.920%, 5/15/2025, 144A(a) | | | 4,630,877 | |
| | 2,590,000 | | | NextGear Floorplan Master Owner Trust, Series 2018-1A, Class A1, 1-month LIBOR + 0.640%, 0.799%, 2/15/2023, 144A(a)(b) | | | 2,591,183 | |
| | 910,000 | | | Prestige Auto Receivables Trust, Series 2019-1A, Class E, 3.900%, 5/15/2026, 144A | | | 937,299 | |
| | 3,210,000 | | | Santander Drive Auto Receivables Trust, Series 2020-1, Class D, 5.350%, 3/15/2028(a) | | | 3,576,730 | |
| | 4,140,000 | | | Santander Drive Auto Receivables Trust, Series 2019-2, Class D, 3.220%, 7/15/2025(a) | | | 4,305,327 | |
| | 1,140,000 | | | Santander Drive Auto Receivables Trust, Series 2020-2, Class D, 2.220%, 9/15/2026(a) | | | 1,174,352 | |
| | 353,000 | | | Tidewater Auto Receivables Trust, Series 2018-AA, Class D, 4.300%, 11/15/2024, 144A(a) | | | 361,226 | |
| | 1,675,000 | | | Westlake Automobile Receivables Trust, Series 2020-3A, Class D, 1.650%, 2/17/2026, 144A | | | 1,694,999 | |
| | | | | | | | |
| | | | | | | 71,872,793 | |
| | | | | | | | |
| | | | ABS Credit Card — 0.6% | |
| | 640,000 | | | Genesis Sales Finance Master Trust, Series 2019-AA, Class A, 4.680%, 8/20/2023, 144A(a) | | | 642,891 | |
| | 6,995,000 | | | World Financial Network Credit Card Master Trust, Series 2019-C, Class M, 2.710%, 7/15/2026(a) | | | 7,215,579 | |
| | | | | | | | |
| | | | | | | 7,858,470 | |
| | | | | | | | |
| | | | ABS Home Equity — 6.9% | |
| | 958,144 | | | Ajax Mortgage Loan Trust, Series 2017-B, Class A, 3.163%, 9/25/2056, 144A(a)(c) | | | 960,411 | |
| | 237,740 | | | Alternative Loan Trust, Series 2004-16CB, Class 1A1, 5.500%, 7/25/2034(a) | | | 245,319 | |
| | 270,396 | | | Alternative Loan Trust, Series 2004-16CB, Class 3A1, 5.500%, 8/25/2034(a) | | | 279,374 | |
| | 370,569 | | | Alternative Loan Trust, Series 2005-J1, Class 2A1, 5.500%, 2/25/2025 | | | 375,647 | |
| | 300,000 | | | American Homes 4 Rent, Series 2014-SFR2, Class D, 5.149%, 10/17/2036, 144A(a) | | | 327,540 | |
| | 2,170,000 | | | American Homes 4 Rent, Series 2014-SFR2, Class E, 6.231%, 10/17/2036, 144A(a) | | | 2,407,805 | |
| | 1,200,000 | | | American Homes 4 Rent, Series 2014-SFR3, Class E, 6.418%, 12/17/2036, 144A(a) | | | 1,344,685 | |
| | 3,138,000 | | | American Homes 4 Rent, Series 2015-SFR1, Class E, 5.639%, 4/17/2052, 144A(a) | | | 3,491,512 | |
| | 401,923 | | | Banc of America Alternative Loan Trust, Series 2003-8, Class 1CB1, 5.500%, 10/25/2033 | | | 403,783 | |
| | 421,987 | | | Banc of America Funding Trust, Series 2005-7, Class 3A1, 5.750%, 11/25/2035 | | | 458,427 | |
| | 219,940 | | | Banc of America Funding Trust, Series 2007-4, Class 5A1, 5.500%, 11/25/2034 | | | 220,138 | |
| | 1,506,179 | | | Bayview Opportunity Master Fund V Trust, Series 2020-RN3, Class A1, 3.228%, 9/25/2035, 144A(c) | | | 1,520,299 | |
| | 1,084,489 | | | Citigroup Mortgage Loan Trust, Series 2018-A, Class A1, 4.000%, 1/25/2068, 144A(c) | | | 1,089,136 | |
| | 2,564,531 | | | Citigroup Mortgage Loan Trust, Series 2018-C, Class A1, 4.125%, 3/25/2059, 144A(c) | | | 2,564,740 | |
See accompanying notes to financial statements.
| 48
Portfolio of Investments – as of December 31, 2020
Loomis Sayles Strategic Alpha Fund – (continued)
| | | | | | | | |
Principal
Amount (‡) | | | Description | | Value (†) | |
| | | | ABS Home Equity — continued | |
| $ | 1,984,376 | | | Citigroup Mortgage Loan Trust, Series 2019-B, Class A1, 3.258%, 4/25/2066, 144A(c) | | $ | 2,025,429 | |
| | 3,835,455 | | | Citigroup Mortgage Loan Trust, Series 2019-E, Class A1, 3.228%, 11/25/2070, 144A(a)(c) | | | 3,854,034 | |
| | 496,989 | | | Colony American Finance Ltd., Series 2016-1, Class C, 4.638%, 6/15/2048, 144A(a)(c) | | | 496,391 | |
| | 1,304,000 | | | Connecticut Avenue Securities Trust, Series 2020-R01, Class 1M2, 1-month LIBOR + 2.050%, 2.198%, 1/25/2040, 144A(b) | | | 1,297,090 | |
| | 1,830,000 | | | CoreVest American Finance Ltd., Series 2019-2, Class B, 3.424%, 6/15/2052, 144A(a) | | | 1,958,812 | |
| | 1,340,000 | | | Corevest American Finance Trust, Series 2020-4, Class C, 2.250%, 12/15/2052, 144A | | | 1,348,070 | |
| | 395,025 | | | Countrywide Alternative Loan Trust, Series 2003-22CB, Class 1A1, 5.750%, 12/25/2033(a) | | | 411,388 | |
| | 657,790 | | | Countrywide Alternative Loan Trust, Series 2004-J10, Class 2CB1, 6.000%, 9/25/2034 | | | 688,974 | |
| | 45,426 | | | Countrywide Home Loan Mortgage Pass Through Trust, Series 2004-HYB4, Class 2A1, 2.967%, 9/20/2034(a)(c) | | | 44,549 | |
| | 4,055,000 | | | Credit Suisse Mortgage Trust, Series 2018-RPL8, Class A2, 4.164%, 7/25/2058, 144A(c) | | | 4,055,750 | |
| | 2,479,844 | | | Credit Suisse Mortgage Trust, Series 2019-RP10, Class A1, 3.089%, 12/26/2059, 144A(c) | | | 2,486,691 | |
| | 1,844,656 | | | Credit Suisse Mortgage Trust, Series 2020-RPL3, Class A1, 2.691%, 3/25/2060, 144A(c) | | | 1,846,592 | |
| | 162,259 | | | CSFB Mortgage-Backed Pass-Through Certificates, Series 2003-27, Class 4A4, 5.750%, 11/25/2033(a) | | | 167,522 | |
| | 448,271 | | | DSLA Mortgage Loan Trust, Series 2005-AR5, Class 2A1A, 1-month LIBOR + 0.330%, 0.482%, 9/19/2045(b) | | | 336,473 | |
| | 1,236,688 | | | Dukinfield II PLC, Series 2, Class A, GBP 3-month LIBOR + 1.250%, 1.284%, 12/20/2052, (GBP)(a)(b) | | | 1,696,572 | |
| | 1,097,613 | | | Federal National Mortgage Association Connecticut Avenue Securities, Series 2017-C05, Class 1M2, 1-month LIBOR + 2.200%, 2.348%, 1/25/2030(b) | | | 1,096,226 | |
| | 1,715,000 | | | FirstKey Homes Trust, Series 2020-SFR1, Class E, 2.791%, 8/17/2037, 144A | | | 1,747,569 | |
| | 4,165,000 | | | FirstKey Homes Trust, Series 2020-SFR2, Class E, 2.668%, 10/19/2037, 144A | | | 4,153,530 | |
| | 112,468 | | | Freddie Mac Structured Agency Credit Risk Debt Notes, Series 2018-DNA1, Class M2, 1-month LIBOR + 1.800%, 1.948%, 7/25/2030(b) | | | 111,509 | |
| | 4,435,000 | | | GCAT LLC, Series 2020-4, Class A1, 2.611%, 12/25/2025, 144A(c) | | | 4,434,446 | |
| | 522,341 | | | IndyMac Index Mortgage Loan Trust, Series 2004-AR7, Class A5, 1-month LIBOR + 1.220%, 1.368%, 9/25/2034(b) | | | 491,994 | |
| | 2,245,066 | | | IndyMac Index Mortgage Loan Trust, Series 2006-AR2, Class 2A1, 1-month LIBOR + 0.420%, 0.568%, 2/25/2046(b) | | | 1,799,570 | |
| | 1,080,838 | | | JPMorgan Mortgage Trust, Series 2004-S1, Class 2A1, 6.000%, 9/25/2034 | | | 1,142,645 | |
| | 3,233,746 | | | Legacy Mortgage Asset Trust, Series 2018-GS2, Class A1, 4.000%, 4/25/2058, 144A(c) | | | 3,254,715 | |
| | 2,130,251 | | | Legacy Mortgage Asset Trust, Series 2019-GS3, Class A1, 3.750%, 4/25/2059, 144A(c) | | | 2,150,248 | |
| | 1,929,323 | | | Legacy Mortgage Asset Trust, Series 2020-GS1, Class A1, 2.882%, 10/25/2059, 144A(c) | | | 1,935,224 | |
| | 839,108 | | | Legacy Mortgage Asset Trust, Series 2020-GS5, Class A1, 3.250%, 6/25/2060, 144A | | | 845,074 | |
| | | | ABS Home Equity — continued | |
| 386,176 | | | Lehman XS Trust, Series 2006-2N, Class 1A1, 1-month LIBOR + 0.520%, 0.668%, 2/25/2046(b) | | | 346,437 | |
| | 181,107 | | | MASTR Adjustable Rate Mortgages Trust, Series 2004-4, Class 5A1, 3.375%, 5/25/2034(a)(c) | | | 181,345 | |
| | 253,435 | | | MASTR Alternative Loan Trust, Series 2003-9, Class 4A1, 5.250%, 11/25/2033(a) | | | 261,175 | |
| | 223,039 | | | MASTR Alternative Loan Trust, Series 2004-5, Class 1A1, 5.500%, 6/25/2034(a) | | | 229,357 | |
| | 282,721 | | | MASTR Alternative Loan Trust, Series 2004-5, Class 2A1, 6.000%, 6/25/2034(a) | | | 293,413 | |
| | 751,617 | | | MASTR Alternative Loan Trust, Series 2004-8, Class 2A1, 6.000%, 9/25/2034 | | | 777,126 | |
| | 43,190 | | | Merrill Lynch Mortgage Investors Trust, Series 2006-2, Class 2A, 2.403%, 5/25/2036(a)(c) | | | 43,338 | |
| | 368,514 | | | Morgan Stanley Mortgage Loan Trust, Series 2005-7, Class 4A2, 5.500%, 11/25/2035 | | | 325,623 | |
| | 753,969 | | | Morgan Stanley Mortgage Loan Trust, Series 2005-7, Class 7A5, 5.500%, 11/25/2035 | | | 750,279 | |
| | 1,565,673 | | | Preston Ridge Partners Mortgage LLC, Series 2019-4A, Class A1, 3.351%, 11/25/2024, 144A(c) | | | 1,568,258 | |
| | 3,395,174 | | | Preston Ridge Partners Mortgage LLC, Series 2020-1A, Class A1, 2.981%, 2/25/2025, 144A(a)(c) | | | 3,402,749 | |
| | 5,598,650 | | | Preston Ridge Partners Mortgage LLC, Series 2020-5, Class A1, 3.104%, 11/25/2025, 144A(c) | | | 5,632,153 | |
| | 564,000 | | | Progress Residential Trust, Series 2018-SFR2, Class E, 4.656%, 8/17/2035, 144A | | | 573,512 | |
| | 715,000 | | | Progress Residential Trust, Series 2018-SFR3, Class E, 4.873%, 10/17/2035, 144A | | | 731,767 | |
| | 2,398,000 | | | Progress Residential Trust, Series 2019-SFR1, Class E, 4.466%, 8/17/2035, 144A | | | 2,471,824 | |
| | 1,005,000 | | | Progress Residential Trust, Series 2019-SFR3, Class D, 2.871%, 9/17/2036, 144A | | | 1,019,101 | |
| | 785,000 | | | Progress Residential Trust, Series 2020-SFR3, Class E, 2.296%, 10/17/2027, 144A | | | 785,910 | |
| | 1,452,009 | | | RCO V Mortgage LLC, Series 2020-1, Class A1, 3.105%, 9/25/2025, 144A(c) | | | 1,454,553 | |
| | 2,589,997 | | | Structured Adjustable Rate Mortgage Loan Trust, Series 2005-14, Class A1, 1-month LIBOR + 0.310%, 0.458%, 7/25/2035(b) | | | 1,877,605 | |
| | 545,893 | | | Towd Point Mortgage Trust, Series 2015-2, Class 1A13, 2.500%, 11/25/2060, 144A(a)(c) | | | 547,149 | |
| | 1,040,000 | | | Tricon American Homes, Series 2020-SFR1, Class E, 3.544%, 7/17/2038, 144A | | | 1,074,409 | |
| | 1,170,000 | | | Tricon American Homes Trust, Series 2020-SFR2, Class E1, 2.730%, 11/17/2039, 144A | | | 1,158,375 | |
| | 3,231,004 | | | Vericrest Opportunity Loan Trust, Series 2019-NPL5, Class A1A, 3.352%, 9/25/2049, 144A(c) | | | 3,235,141 | |
| | 1,022,543 | | | Vericrest Opportunity Loan Trust, Series 2019-NPL9, Class A1A, 3.327%, 11/26/2049, 144A(c) | | | 1,025,471 | |
| | | | | | | | |
| | | | | | | 91,331,973 | |
| | | | | | | | |
| | | | ABS Other — 4.9% | |
| | 634,706 | | | Accelerated Assets LLC, Series 2018-1, Class B, 4.510%, 12/02/2033, 144A | | | 648,580 | |
| | 2,218,114 | | | AIM Aviation Finance Ltd., Series 2015-1A, Class B1, 5.072%, 2/15/2040, 144A(c) | | | 930,532 | |
| | 350,000 | | | Ascentium Equipment Receivables Trust, Series 2017-2A, Class C, 2.870%, 8/10/2022, 144A(a) | | | 355,614 | |
See accompanying notes to financial statements.
49 |
Portfolio of Investments – as of December 31, 2020
Loomis Sayles Strategic Alpha Fund – (continued)
| | | | | | | | |
Principal
Amount (‡) | | | Description | | Value (†) | |
| | | | ABS Other — continued | |
| $ | 937,398 | | | Blackbird Capital Aircraft Lease Securitization Ltd., Series 2016-1A, Class A, 4.213%, 12/16/2041, 144A(a)(c) | | $ | 893,373 | |
| | 1,266,094 | | | Blackbird Capital Aircraft Lease Securitization Ltd., Series 2016-1A, Class B, 5.682%, 12/16/2041, 144A(a)(c) | | | 1,102,680 | |
| | 250,000 | | | CCG Receivables Trust, Series 2018-1, Class C, 3.420%, 6/16/2025, 144A(a) | | | 252,501 | |
| | 580,000 | | | Chesapeake Funding II LLC, Series 2017-2A, Class D, 3.710%, 5/15/2029, 144A | | | 582,879 | |
| | 775,000 | | | Chesapeake Funding II LLC, Series 2017-4A, Class D, 3.260%, 11/15/2029, 144A | | | 785,742 | |
| | 790,000 | | | Chesapeake Funding II LLC, Series 2018-1A, Class C, 3.570%, 4/15/2030, 144A(a) | | | 806,406 | |
| | 2,125,000 | | | Chesapeake Funding II LLC, Series 2018-1A, Class D, 3.920%, 4/15/2030, 144A | | | 2,169,425 | |
| | 281,432 | | | Diamond Resorts Owner Trust, Series 2017-1A, Class C, 6.070%, 10/22/2029, 144A | | | 287,000 | |
| | 1,106,483 | | | Diamond Resorts Owner Trust, Series 2018-1, Class C, 4.530%, 1/21/2031, 144A | | | 1,132,694 | |
| | 1,513,262 | | | Diamond Resorts Owner Trust, Series 2019-1, Class B, 3.530%, 2/20/2032, 144A(a) | | | 1,550,105 | |
| | 3,100,000 | | | Fairstone Financial Issuance Trust I, Series 2019-1A, Class A, 3.948%, 3/21/2033, 144A, (CAD)(a) | | | 2,457,083 | |
| | 2,267,063 | | | GCA2014 Holdings Ltd., Series 2014-1, Class C, 6.000%, 1/05/2030, 144A(d)(e)(f)(g) | | | 765,157 | |
| | 1,027,860 | | | GCA2014 Holdings Ltd., Series 2014-1, Class D, 7.500%, 1/05/2030, 144A(d)(e)(f)(g) | | | 138,946 | |
| | 3,410,000 | | | GCA2014 Holdings Ltd., Series 2014-1, Class E, Zero Coupon, 1/05/2030, 144A(d)(e)(f)(g)(h) | | | — | |
| | 659,470 | | | Global Container Assets Ltd., Series 2015-1A, Class B, 4.500%, 2/05/2030, 144A(d)(e)(i) | | | 571,140 | |
| | 472,942 | | | Hilton Grand Vacations Trust, Series 2018-AA, Class C, 4.000%, 2/25/2032, 144A(a) | | | 493,047 | |
| | 4,460,362 | | | Horizon Aircraft Finance I Ltd., Series 2018-1, Class A, 4.458%, 12/15/2038, 144A(a) | | | 4,308,370 | |
| | 975,000 | | | HPEFS Equipment Trust, Series 2020-1A, Class D, 2.260%, 2/20/2030, 144A(a) | | | 984,436 | |
| | 5,900,000 | | | HPEFS Equipment Trust, Series 2020-2A, Class D, 2.790%, 7/22/2030, 144A(a) | | | 5,979,845 | |
| | 2,073,047 | | | Kestrel Aircraft Funding Ltd., Series 2018-1A, Class A, 4.250%, 12/15/2038, 144A(a) | | | 1,919,972 | |
| | 1,244,019 | | | MAPS Ltd., Series 2018-1A, Class A, 4.212%, 5/15/2043, 144A(a) | | | 1,185,515 | |
| | 1,712,048 | | | MAPS Ltd., Series 2018-1A, Class B, 5.193%, 5/15/2043, 144A | | | 1,422,198 | |
| | 472,165 | | | MVW LLC, Series 2020-1A, Class C, 4.210%, 10/20/2037, 144A | | | 501,579 | |
| | 464,106 | | | MVW Owner Trust, Series 2019-1A, Class C, 3.330%, 11/20/2036, 144A(a) | | | 472,358 | |
| | 3,120,000 | | | OneMain Financial Issuance Trust, Series 2015-3A, Class B, 4.160%, 11/20/2028, 144A(a) | | | 3,124,954 | |
| | 3,230,000 | | | OneMain Financial Issuance Trust, Series 2019-1A, Class D, 4.220%, 2/14/2031, 144A(a) | | | 3,337,584 | |
| | 1,110,000 | | | OneMain Financial Issuance Trust, Series 2020-1A, Class B, 4.830%, 5/14/2032, 144A(a) | | | 1,187,243 | |
| | 1,020,000 | | | OneMain Financial Issuance Trust, Series 2020-2A, Class C, 2.760%, 9/14/2035, 144A(a) | | | 1,044,272 | |
| | | | ABS Other — continued | |
| 3,980,000 | | | Republic Finance Issuance Trust, Series 2019-A, Class A, 3.430%, 11/22/2027, 144A(a) | | | 4,041,936 | |
| | 4,026,636 | | | S-Jets Ltd., Series 2017-1, Class A, 3.967%, 8/15/2042, 144A(a) | | | 3,907,224 | |
| | 3,718,000 | | | SCF Equipment Trust LLC, Series 2018-1A, Class C, 4.210%, 4/20/2027, 144A(a) | | | 3,747,422 | |
| | 523,313 | | | Sierra Timeshare Receivables Funding LLC, Series 2020-2A, Class C, 3.510%, 7/20/2037, 144A | | | 534,092 | |
| | 580,000 | | | SoFi Consumer Loan Program Trust, Series 2018-1, Class B, 3.650%, 2/25/2027, 144A(a) | | | 596,654 | |
| | 1,690,000 | | | SoFi Consumer Loan Program Trust, Series 2018-2, Class B, 3.790%, 4/26/2027, 144A(a) | | | 1,726,737 | |
| | 1,010,000 | | | SoFi Consumer Loan Program Trust, Series 2018-4, Class C, 4.170%, 11/26/2027, 144A(a) | | | 1,035,213 | |
| | 3,783,546 | | | SpringCastle America Funding LLC, Series 2020-AA, Class A, 1.970%, 9/25/2037, 144A(a) | | | 3,811,465 | |
| | 533,846 | | | Sprite Ltd., Series 2017-1, Class A, 4.250%, 12/15/2037, 144A | | | 503,875 | |
| | 1,021,957 | | | Sprite Ltd., Series 2017-1, Class B, 5.750%, 12/15/2037, 144A | | | 777,000 | |
| | 424,637 | | | Textainer Marine Containers VII Ltd., Series 2020-1A, Class A, 2.730%, 8/21/2045, 144A(a) | | | 436,300 | |
| | 1,037,652 | | | Wave LLC, Series 2017-1A, Class B, 5.682%, 11/15/2042, 144A | | | 821,590 | |
| | 809,466 | | | Willis Engine Structured Trust V, Series 2020-A, Class A, 3.228%, 3/15/2045, 144A(a) | | | 691,737 | |
| | | | | | | | |
| | | | | | | 64,022,475 | |
| | | | | | | | |
| | | | ABS Student Loan — 1.2% | |
| | 2,307,071 | | | Education Funding Trust, Series 2020-A, Class A, 2.790%, 7/25/2041, 144A(a) | | | 2,383,862 | |
| | 3,410,000 | | | Navient Private Education Refi Loan Trust, Series 2019-FA, Class B, 3.120%, 8/15/2068, 144A(a) | | | 3,510,926 | |
| | 1,035,000 | | | Navient Private Education Refi Loan Trust, Series 2018-A, Class B, 3.680%, 2/18/2042, 144A(a) | | | 1,056,393 | |
| | 695,000 | | | Navient Private Education Refi Loan Trust, Series 2019-GA, Class B, 3.080%, 10/15/2068, 144A(a) | | | 721,735 | |
| | 840,000 | | | Navient Private Education Refi Loan Trust, Series 2020-FA, Class B, 2.690%, 7/15/2069, 144A(a) | | | 847,502 | |
| | 639,000 | | | SLM Private Credit Student Loan Trust, Series 2003-A, Class A3, 28-day ARS, 3.180%, 6/15/2032(a)(b) | | | 635,305 | |
| | 1,814,000 | | | SLM Private Credit Student Loan Trust, Series 2003-B, Class A3, 3.200%, 3/15/2033(a)(c) | | | 1,802,022 | |
| | 195,000 | | | SLM Private Credit Student Loan Trust, Series 2003-B, Class A4, 28-day ARS, 3.658%, 3/15/2033(a)(b) | | | 193,712 | |
| | 800,000 | | | SMB Private Education Loan Trust, Series 2015-C, Class B, 3.500%, 9/15/2043, 144A(a) | | | 837,939 | |
| | 921,246 | | | SMB Private Education Loan Trust, Series 2017-B, Class A2B, 1-month LIBOR + 0.750%, 0.909%, 10/15/2035, 144A(a)(b) | | | 921,042 | |
See accompanying notes to financial statements.
| 50
Portfolio of Investments – as of December 31, 2020
Loomis Sayles Strategic Alpha Fund – (continued)
| | | | | | | | |
Principal
Amount (‡) | | | Description | | Value (†) | |
| | | | ABS Student Loan — continued | |
| $ | 190,000 | | | SMB Private Education Loan Trust, Series 2018-B, Class B, 4.000%, 7/15/2042, 144A(a) | | $ | 202,128 | |
| | 510,000 | | | SMB Private Education Loan Trust, Series 2018-C, Class B, 4.000%, 11/17/2042, 144A(a) | | | 537,696 | |
| | 569,421 | | | SoFi Professional Loan Program LLC, Series 2016-A, Class B, 3.570%, 1/26/2038, 144A(a) | | | 579,615 | |
| | 125,000 | | | SoFi Professional Loan Program LLC, Series 2016-C, Class B, 3.350%, 5/25/2037, 144A(a)(c) | | | 127,749 | |
| | 1,350,000 | | | SoFi Professional Loan Program Trust, Series 2020-A, Class BFX, 3.120%, 5/15/2046, 144A(a) | | | 1,395,108 | |
| | | | | | | | |
| | | | | | | 15,752,734 | |
| | | | | | | | |
| | | | ABS Whole Business — 1.8% | |
| | 4,170,205 | | | Adams Outdoor Advertising LP, Series 2018-1, Class A, 4.810%, 11/15/2048, 144A(a) | | | 4,397,283 | |
| | 982,538 | | | Arbys Funding LLC, Series 2020-1A, Class A2, 3.237%, 7/30/2050, 144A | | | 1,000,788 | |
| | 1,650,150 | | | Coinstar Funding LLC, Series 2017-1A, Class A2, 5.216%, 4/25/2047, 144A | | | 1,609,343 | |
| | 493,750 | | | DB Master Finance LLC, Series 2019-1A, Class A23, 4.352%, 5/20/2049, 144A | | | 533,571 | |
| | 2,821,730 | | | Domino’s Pizza Master Issuer LLC, Series 2017-1A, Class A23, 4.118%, 7/25/2047, 144A(a) | | | 3,022,919 | |
| | 1,165,000 | | | Hardee’s Funding LLC, Series 2020-1A, Class A2, 3.981%, 12/20/2050, 144A | | | 1,195,096 | |
| | 1,178,865 | | | Planet Fitness Master Issuer LLC, Series 2018-1A, Class A2I, 4.262%, 9/05/2048, 144A | | | 1,175,741 | |
| | 2,687,850 | | | Planet Fitness Master Issuer LLC, Series 2019-1A, Class A2, 3.858%, 12/05/2049, 144A | | | 2,534,804 | |
| | 2,562,150 | | | Stack Infrastructure Issuer LLC, Series 2019-1A, Class A2, 4.540%, 2/25/2044, 144A(a) | | | 2,744,206 | |
| | 3,341,650 | | | Wendy’s Funding LLC, Series 2018-1A, Class A2II, 3.884%, 3/15/2048, 144A(a) | | | 3,545,792 | |
| | 709,275 | | | Wendy’s Funding LLC, Series 2019-1A, Class A2II, 4.080%, 6/15/2049, 144A | | | 757,008 | |
| | 900,000 | | | Wingstop Funding LLC, Series 2020-1A, Class A2, 2.841%, 12/05/2050, 144A | | | 918,243 | |
| | | | | | | | |
| | | | | | | 23,434,794 | |
| | | | | | | | |
| | | | Aerospace & Defense — 3.1% | |
| | 1,635,000 | | | Boeing Co. (The), 2.250%, 6/15/2026 | | | 1,673,439 | |
| | 700,000 | | | Boeing Co. (The), 2.950%, 2/01/2030 | | | 723,982 | |
| | 70,000 | | | Boeing Co. (The), 3.100%, 5/01/2026 | | | 74,956 | |
| | 290,000 | | | Boeing Co. (The), 3.250%, 2/01/2035 | | | 297,396 | |
| | 1,065,000 | | | Boeing Co. (The), 3.375%, 6/15/2046 | | | 1,039,235 | |
| | 30,000 | | | Boeing Co. (The), 3.550%, 3/01/2038 | | | 30,606 | |
| | 90,000 | | | Boeing Co. (The), 3.625%, 3/01/2048 | | | 90,743 | |
| | 295,000 | | | Boeing Co. (The), 3.650%, 3/01/2047 | | | 298,610 | |
| | 2,135,000 | | | Boeing Co. (The), 3.750%, 2/01/2050 | | | 2,232,783 | |
| | 375,000 | | | Boeing Co. (The), 3.825%, 3/01/2059 | | | 380,929 | |
| | 325,000 | | | Boeing Co. (The), 3.850%, 11/01/2048 | | | 335,224 | |
| | 1,420,000 | | | Boeing Co. (The), 3.900%, 5/01/2049 | | | 1,506,921 | |
| | 575,000 | | | Boeing Co. (The), 3.950%, 8/01/2059 | | | 615,398 | |
| | 3,185,000 | | | Boeing Co. (The), 5.150%, 5/01/2030(a) | | | 3,854,651 | |
| | 1,105,000 | | | Boeing Co. (The), 5.705%, 5/01/2040 | | | 1,433,981 | |
| | 8,950,000 | | | Boeing Co. (The), 5.805%, 5/01/2050(a) | | | 12,334,398 | |
| | | | Aerospace & Defense — continued | |
| 1,685,000 | | | Boeing Co. (The), 5.930%, 5/01/2060 | | | 2,390,331 | |
| | 1,430,000 | | | Embraer Netherlands Finance BV, 5.050%, 6/15/2025 | | | 1,515,814 | |
| | 895,000 | | | Embraer Netherlands Finance BV, 5.400%, 2/01/2027 | | | 950,947 | |
| | 2,550,000 | | | Leonardo U.S. Holdings, Inc., 6.250%, 1/15/2040, 144A | | | 3,021,291 | |
| | 305,000 | | | Spirit AeroSystems, Inc., 4.600%, 6/15/2028 | | | 301,569 | |
| | 2,580,000 | | | Spirit AeroSystems, Inc., 7.500%, 4/15/2025, 144A | | | 2,767,050 | |
| | 3,010,000 | | | TransDigm, Inc., 6.250%, 3/15/2026, 144A | | | 3,205,650 | |
| | | | | | | | |
| | | | | | | 41,075,904 | |
| | | | | | | | |
| | | | Airlines — 0.5% | |
| | 6,644,106 | | | United Airlines Pass Through Trust, Series 2019-2, Class B, 3.500%, 11/01/2029(a) | | | 6,179,018 | |
| | | | | | | | |
| | | | Automotive — 2.0% | |
| | 1,775,000 | | | Allison Transmission, Inc., 3.750%, 1/30/2031, 144A | | | 1,816,047 | |
| | 2,960,000 | | | FCE Bank PLC, EMTN, 0.869%, 9/13/2021, (EUR) | | | 3,607,044 | |
| | 370,000 | | | FCE Bank PLC, EMTN, 1.134%, 2/10/2022, (EUR) | | | 450,881 | |
| | 1,580,000 | | | FCE Bank PLC, EMTN, 1.875%, 6/24/2021, (EUR) | | | 1,930,207 | |
| | 1,530,000 | | | Ford Motor Co., 8.500%, 4/21/2023 | | | 1,722,030 | |
| | 1,800,000 | | | Ford Motor Co., 9.000%, 4/22/2025 | | | 2,206,818 | |
| | 400,000 | | | Ford Motor Co., 9.625%, 4/22/2030 | | | 564,500 | |
| | 655,000 | | | Ford Motor Credit Co. LLC, 1.514%, 2/17/2023, (EUR) | | | 797,638 | |
| | 2,530,000 | | | General Motors Co., 5.400%, 4/01/2048 | | | 3,186,106 | |
| | 7,195,000 | | | General Motors Co., 5.950%, 4/01/2049(a) | | | 9,730,666 | |
| | | | | | | | |
| | | | | | | 26,011,937 | |
| | | | | | | | |
| | | | Banking — 2.6% | |
| | 345,000 | | | Ally Financial, Inc., 3.875%, 5/21/2024 | | | 378,032 | |
| | 325,000 | | | Ally Financial, Inc., 4.625%, 3/30/2025 | | | 370,440 | |
| | 2,000,000 | | | Ally Financial, Inc., 5.750%, 11/20/2025 | | | 2,328,483 | |
| | 44,570,000 | | | Banco Hipotecario S.A., Argentina Deposit Rates Badlar Pvt Banks + 4.000%, 35.750%, 11/07/2022, 144A, (ARS)(b) | | | 299,223 | |
| | 21,970,000 | | | Banco Macro S.A., 17.500%, 5/08/2022, 144A, (ARS) | | | 111,334 | |
| | 1,200,000 | | | Banco Santander S.A., 2.749%, 12/03/2030(a) | | | 1,236,872 | |
| | 4,460,000 | | | Barclays PLC, (fixed rate to 9/23/2030, variable rate thereafter), 3.564%, 9/23/2035(a) | | | 4,832,588 | |
| | 685,000 | | | BBVA Bancomer S.A., 1.875%, 9/18/2025, 144A(a) | | | 691,850 | |
| | 1,430,000 | | | Danske Bank A/S, (fixed rate to 12/20/2024, variable rate thereafter), 3.244%, 12/20/2025, 144A(a) | | | 1,530,233 | |
| | 1,265,000 | | | Deutsche Bank AG, (fixed rate to 9/18/2030, variable rate thereafter), 3.547%, 9/18/2031 | | | 1,370,933 | |
| | 6,690,000 | | | JPMorgan Chase & Co., (fixed rate to 3/24/2030, variable rate thereafter), 4.493%, 3/24/2031(a) | | | 8,229,556 | |
| | 5,195,000 | | | Societe Generale S.A., (fixed rate to 7/08/2030, variable rate thereafter), 3.653%, 7/08/2035, 144A(a) | | | 5,625,619 | |
| | 3,550,000 | | | Standard Chartered PLC, (fixed rate to 11/18/2030, variable rate thereafter), 3.265%, 2/18/2036, 144A(a) | | | 3,716,784 | |
| | 1,100,000 | | | Standard Chartered PLC, (fixed rate to 4/01/2030, variable rate thereafter), 4.644%, 4/01/2031, 144A(a) | | | 1,330,670 | |
| | 2,255,000 | | | UniCredit SpA, (fixed rate to 9/22/2025, variable rate thereafter), 2.569%, 9/22/2026, 144A | | | 2,301,577 | |
| | | | | | | | |
| | | | | | | 34,354,194 | |
| | | | | | | | |
See accompanying notes to financial statements.
51 |
Portfolio of Investments – as of December 31, 2020
Loomis Sayles Strategic Alpha Fund – (continued)
| | | | | | | | |
Principal
Amount (‡) | | | Description | | Value (†) | |
| | | | Building Materials — 0.9% | |
| $ | 1,915,000 | | | Builders FirstSource, Inc., 6.750%, 6/01/2027, 144A | | $ | 2,077,220 | |
| | 3,360,000 | | | Cemex SAB de CV, 5.200%, 9/17/2030, 144A | | | 3,684,240 | |
| | 1,725,000 | | | Cemex SAB de CV, 5.450%, 11/19/2029, 144A | | | 1,897,517 | |
| | 615,000 | | | Cemex SAB de CV, 5.700%, 1/11/2025, 144A | | | 628,530 | |
| | 210,000 | | | Cemex SAB de CV, 7.750%, 4/16/2026, 144A | | | 221,445 | |
| | 1,970,000 | | | Standard Industries, Inc., 4.375%, 7/15/2030, 144A | | | 2,107,368 | |
| | 805,000 | | | Vulcan Materials Co., 3.500%, 6/01/2030(a) | | | 924,632 | |
| | | | | | | | |
| | | | | | | 11,540,952 | |
| | | | | | | | |
| | | | Cable Satellite — 1.8% | |
| | 5,670,000 | | | CCO Holdings LLC/CCO Holdings Capital Corp., 4.250%, 2/01/2031, 144A | | | 5,974,366 | |
| | 1,585,000 | | | CCO Holdings LLC/CCO Holdings Capital Corp., 4.500%, 8/15/2030, 144A | | | 1,682,081 | |
| | 1,050,000 | | | CCO Holdings LLC/CCO Holdings Capital Corp., 4.500%, 5/01/2032, 144A | | | 1,121,106 | |
| | 310,000 | | | CCO Holdings LLC/CCO Holdings Capital Corp., 5.375%, 6/01/2029, 144A | | | 339,838 | |
| | 1,610,000 | | | CSC Holdings LLC, 4.125%, 12/01/2030, 144A | | | 1,683,416 | |
| | 2,710,000 | | | CSC Holdings LLC, 4.625%, 12/01/2030, 144A | | | 2,828,562 | |
| | 1,060,000 | | | CSC Holdings LLC, 6.500%, 2/01/2029, 144A | | | 1,196,793 | |
| | 265,000 | | | Sirius XM Radio, Inc., 4.625%, 7/15/2024, 144A | | | 274,606 | |
| | 1,355,000 | | | Sirius XM Radio, Inc., 5.000%, 8/01/2027, 144A | | | 1,439,701 | |
| | 485,000 | | | Sirius XM Radio, Inc., 5.375%, 7/15/2026, 144A | | | 505,613 | |
| | 110,000 | | | Sirius XM Radio, Inc., 5.500%, 7/01/2029, 144A | | | 121,034 | |
| | 1,660,000 | | | Virgin Media Finance PLC, 5.000%, 7/15/2030, 144A | | | 1,722,250 | |
| | 1,225,000 | | | Virgin Media Secured Finance PLC, 5.500%, 8/15/2026, 144A | | | 1,272,469 | |
| | 1,725,000 | | | Ziggo BV, 4.875%, 1/15/2030, 144A | | | 1,813,009 | |
| | 1,545,000 | | | Ziggo BV, 5.500%, 1/15/2027, 144A | | | 1,612,594 | |
| | | | | | | | |
| | | | | | | 23,587,438 | |
| | | | | | | | |
| | | | Chemicals — 0.4% | |
| | 1,910,000 | | | Braskem Netherlands Finance BV, 4.500%, 1/31/2030, 144A | | | 1,960,138 | |
| | 470,000 | | | Braskem Netherlands Finance BV, 5.875%, 1/31/2050, 144A | | | 485,867 | |
| | 2,305,000 | | | Nutrition & Biosciences, Inc., 2.300%, 11/01/2030, 144A | | | 2,374,201 | |
| | | | | | | | |
| | | | | | | 4,820,206 | |
| | | | | | | | |
| | | | Collateralized Mortgage Obligations — 0.1% | |
| | 695,432 | | | New Residential Mortgage Loan Trust, Series 2020-NPL2, Class A1, 3.228%, 8/25/2060, 144A(c) | | | 701,037 | |
| | | | | | | | |
| | | | Construction Machinery — 0.4% | |
| | 5,460,000 | | | United Rentals North America, Inc., 4.000%, 7/15/2030 | | | 5,746,650 | |
| | | | | | | | |
| | | | Consumer Cyclical Services — 2.5% | |
| | 3,325,000 | | | Booking Holdings, Inc., 4.625%, 4/13/2030(a) | | | 4,131,576 | |
| | 270,000 | | | eBay, Inc., 4.000%, 7/15/2042(a) | | | 307,399 | |
| | 6,190,000 | | | Expedia Group, Inc., 3.250%, 2/15/2030 | | | 6,442,187 | |
| | 730,000 | | | Expedia Group, Inc., 3.800%, 2/15/2028 | | | 784,117 | |
| | 1,375,000 | | | Expedia Group, Inc., 4.625%, 8/01/2027, 144A | | | 1,536,232 | |
| | 4,395,000 | | | Expedia Group, Inc., 6.250%, 5/01/2025, 144A | | | 5,094,247 | |
| | 2,250,000 | | | Expedia Group, Inc., 7.000%, 5/01/2025, 144A | | | 2,479,976 | |
| | 515,000 | | | Uber Technologies, Inc., 7.500%, 5/15/2025, 144A | | | 556,313 | |
| | 265,000 | | | Uber Technologies, Inc., 6.250%, 1/15/2028, 144A | | | 288,188 | |
| | 4,580,000 | | | Uber Technologies, Inc., 7.500%, 9/15/2027, 144A | | | 5,038,000 | |
| | 5,160,000 | | | Uber Technologies, Inc., 8.000%, 11/01/2026, 144A | | | 5,631,469 | |
| | | | | | | | |
| | | | | | | 32,289,704 | |
| | | | | | | | |
| | | | Consumer Products — 0.1% | |
| 930,000 | | | Kimberly-Clark de Mexico SAB de CV, 2.431%, 7/01/2031, 144A(a) | | | 960,709 | |
| | | | | | | | |
| | | | Diversified Manufacturing — 0.2% | |
| | 1,515,000 | | | General Electric Co., 3.625%, 5/01/2030(a) | | | 1,731,474 | |
| | 720,000 | | | General Electric Co., 4.350%, 5/01/2050(a) | | | 875,627 | |
| | | | | | | | |
| | | | | | | 2,607,101 | |
| | | | | | | | |
| | | | Electric — 2.0% | |
| | 965,000 | | | AES Corp. (The), 3.950%, 7/15/2030, 144A | | | 1,090,846 | |
| | 5,295,000 | | | Calpine Corp., 3.750%, 3/01/2031, 144A | | | 5,243,797 | |
| | 1,165,000 | | | Calpine Corp., 5.125%, 3/15/2028, 144A | | | 1,225,545 | |
| | 270,000 | | | IPALCO Enterprises, Inc., 4.250%, 5/01/2030, 144A | | | 311,697 | |
| | 480,000 | | | NRG Energy, Inc., 5.250%, 6/15/2029, 144A | | | 528,000 | |
| | 1,075,000 | | | NRG Energy, Inc., 5.750%, 1/15/2028 | | | 1,174,437 | |
| | 1,785,000 | | | Pacific Gas & Electric Co., 3.500%, 8/01/2050 | | | 1,774,131 | |
| | 2,135,000 | | | Pacific Gas & Electric Co., 4.300%, 3/15/2045 | | | 2,276,253 | |
| | 255,000 | | | Pacific Gas & Electric Co., 4.950%, 7/01/2050 | | | 303,862 | |
| | 605,000 | | | Southern California Edison Co., 3.650%, 2/01/2050(a) | | | 687,166 | |
| | 170,000 | | | Southern California Edison Co., 4.000%, 4/01/2047(a) | | | 199,682 | |
| | 215,000 | | | Southern California Edison Co., Series C, 4.125%, 3/01/2048(a) | | | 256,231 | |
| | 10,765,000 | | | Vistra Operations Co. LLC, 3.700%, 1/30/2027, 144A(a) | | | 11,870,418 | |
| | | | | | | | |
| | | | | | | 26,942,065 | |
| | | | | | | | |
| | | | Finance Companies — 4.2% | |
| | 905,000 | | | AerCap Ireland Capital DAC/AerCap Global Aviation Trust, 3.650%, 7/21/2027 | | | 983,439 | |
| | 2,430,000 | | | AerCap Ireland Capital DAC/AerCap Global Aviation Trust, 3.875%, 1/23/2028 | | | 2,617,304 | |
| | 2,745,000 | | | AerCap Ireland Capital DAC/AerCap Global Aviation Trust, 4.500%, 9/15/2023(a) | | | 2,976,191 | |
| | 1,140,000 | | | AerCap Ireland Capital DAC/AerCap Global Aviation Trust, 6.500%, 7/15/2025 | | | 1,362,812 | |
| | 5,165,000 | | | Air Lease Corp., 3.125%, 12/01/2030 | | | 5,376,659 | |
| | 2,755,000 | | | Air Lease Corp., 3.375%, 7/01/2025(a) | | | 2,962,722 | |
| | 6,000,000 | | | Aircastle Ltd., 4.250%, 6/15/2026(a) | | | 6,318,939 | |
| | 1,480,000 | | | Aviation Capital Group LLC, 5.500%, 12/15/2024, 144A | | | 1,638,460 | |
| | 5,205,000 | | | FS KKR Capital Corp., 3.400%, 1/15/2026 | | | 5,172,712 | |
| | 5,755,000 | | | GE Capital Funding LLC, 4.400%, 5/15/2030, 144A(a) | | | 6,784,158 | |
| | 90,000 | | | Navient Corp., 5.875%, 10/25/2024 | | | 95,625 | |
| | 5,000 | | | OneMain Finance Corp., 6.875%, 3/15/2025 | | | 5,806 | |
| | 1,595,000 | | | OneMain Finance Corp., 8.875%, 6/01/2025 | | | 1,804,344 | |
| | 4,160,000 | | | Owl Rock Capital Corp., 3.400%, 7/15/2026 | | | 4,219,565 | |
| | 5,865,000 | | | Quicken Loans LLC, 5.250%, 1/15/2028, 144A | | | 6,260,888 | |
| | 2,095,000 | | | Quicken Loans LLC/Quicken Loans Co-Issuer, Inc., 3.625%, 3/01/2029, 144A | | | 2,136,900 | |
| | 3,790,000 | | | Quicken Loans LLC/Quicken Loans Co-Issuer, Inc., 3.875%, 3/01/2031, 144A | | | 3,932,125 | |
| | | | | | | | |
| | | | | | | 54,648,649 | |
| | | | | | | | |
| | | | Financial Other — 0.4% | |
| | 2,595,000 | | | Icahn Enterprises LP/Icahn Enterprises Finance Corp., 4.750%, 9/15/2024 | | | 2,695,556 | |
| | 2,525,000 | | | Icahn Enterprises LP/Icahn Enterprises Finance Corp., 5.250%, 5/15/2027 | | | 2,706,800 | |
| | 485,000 | | | Icahn Enterprises LP/Icahn Enterprises Finance Corp., 6.250%, 5/15/2026 | | | 513,567 | |
| | | | | | | | |
| | | | | | | 5,915,923 | |
| | | | | | | | |
See accompanying notes to financial statements.
| 52
Portfolio of Investments – as of December 31, 2020
Loomis Sayles Strategic Alpha Fund – (continued)
| | | | | | | | |
Principal
Amount (‡) | | | Description | | Value (†) | |
| | | | Food & Beverage — 0.9% | |
| $ | 3,256,000 | | | Fomento Economico Mexicano SAB de CV, 3.500%, 1/16/2050(a) | | $ | 3,623,259 | |
| | 1,455,000 | | | Kraft Heinz Foods Co., 4.375%, 6/01/2046 | | | 1,568,010 | |
| | 2,305,000 | | | Kraft Heinz Foods Co., 4.875%, 10/01/2049, 144A | | | 2,689,067 | |
| | 715,000 | | | Kraft Heinz Foods Co., 5.000%, 6/04/2042 | | | 837,444 | |
| | 680,000 | | | Lamb Weston Holdings, Inc., 4.875%, 5/15/2028, 144A | | | 759,050 | |
| | 1,300,000 | | | NBM U.S Holdings, Inc., 7.000%, 5/14/2026, 144A | | | 1,415,388 | |
| | 1,135,000 | | | Post Holdings, Inc., 5.750%, 3/01/2027, 144A | | | 1,201,681 | |
| | 385,000 | | | Smithfield Foods, Inc., 3.000%, 10/15/2030, 144A | | | 407,360 | |
| | | | | | | | |
| | | | | | | 12,501,259 | |
| | | | | | | | |
| | | | Gaming — 0.2% | |
| | 2,670,000 | | | MGM Growth Properties Operating Partnership LP/MGP Finance Co-Issuer, Inc., 3.875%, 2/15/2029, 144A | | | 2,730,075 | |
| | | | | | | | |
| | | | Government Owned – No Guarantee — 1.8% | |
| | 4,801,000,000 | | | Financiera de Desarrollo Territorial S.A., 7.875%, 8/12/2024, 144A, (COP)(a) | | | 1,496,315 | |
| | 12,050,000 | | | Petroleos Mexicanos, 5.950%, 1/28/2031(a) | | | 12,019,875 | |
| | 5,290,000 | | | Petroleos Mexicanos, 6.625%, 6/15/2035(a) | | | 5,237,100 | |
| | 4,075,000 | | | Saudi Arabian Oil Co., 3.250%, 11/24/2050, 144A(a) | | | 4,132,325 | |
| | 1,770,000 | | | YPF S.A., 6.950%, 7/21/2027, 144A | | | 1,274,400 | |
| | | | | | | | |
| | | | | | | 24,160,015 | |
| | | | | | | | |
| | | | Government Sponsored — 0.1% | |
| | 950,000 | | | Petrobras Global Finance BV, 7.250%, 3/17/2044 | | | 1,225,500 | |
| | | | | | | | |
| | | | Health Insurance — 0.0% | |
| | 300,000 | | | Centene Corp., 4.625%, 12/15/2029 | | | 333,063 | |
| | | | | | | | |
| | | | Healthcare — 0.5% | |
| | 380,000 | | | Encompass Health Corp., 4.750%, 2/01/2030 | | | 407,075 | |
| | 3,240,000 | | | Hologic, Inc., 3.250%, 2/15/2029, 144A | | | 3,296,700 | |
| | 735,000 | | | IQVIA, Inc., 5.000%, 5/15/2027, 144A | | | 781,323 | |
| | 890,000 | | | Tenet Healthcare Corp., 4.625%, 6/15/2028, 144A | | | 932,275 | |
| | 340,000 | | | Tenet Healthcare Corp., 4.875%, 1/01/2026, 144A | | | 355,677 | |
| | 135,000 | | | Tenet Healthcare Corp., 5.125%, 5/01/2025 | | | 137,631 | |
| | 625,000 | | | Tenet Healthcare Corp., 6.125%, 10/01/2028, 144A | | | 651,238 | |
| | 255,000 | | | Tenet Healthcare Corp., 6.250%, 2/01/2027, 144A | | | 270,300 | |
| | | | | | | | |
| | | | | | | 6,832,219 | |
| | | | | | | | |
| | | | Home Construction — 0.1% | |
| | 1,361,000 | | | Lennar Corp., 4.750%, 11/29/2027 | | | 1,608,430 | |
| | 310,000 | | | Lennar Corp., 4.875%, 12/15/2023 | | | 342,550 | |
| | 30,000 | | | Lennar Corp., 5.000%, 6/15/2027 | | | 35,325 | |
| | | | | | | | |
| | | | | | | 1,986,305 | |
| | | | | | | | |
| | | | Independent Energy — 1.0% | |
| | 4,360,000 | | | Aker BP ASA, 3.750%, 1/15/2030, 144A | | | 4,579,345 | |
| | 1,670,000 | | | Aker BP ASA, 4.000%, 1/15/2031, 144A | | | 1,809,024 | |
| | 140,000 | | | EQT Corp., 5.000%, 1/15/2029 | | | 147,605 | |
| | 1,300,000 | | | Hess Corp., 5.600%, 2/15/2041 | | | 1,586,465 | |
| | 1,790,000 | | | Leviathan Bond Ltd., 6.125%, 6/30/2025, 144A | | | 1,960,426 | |
| | 1,295,000 | | | Leviathan Bond Ltd., 6.500%, 6/30/2027, 144A | | | 1,459,038 | |
| | 62,000 | | | Occidental Petroleum Corp., 2.700%, 2/15/2023 | | | 61,941 | |
| | 885,000 | | | Occidental Petroleum Corp., 2.900%, 8/15/2024 | | | 851,812 | |
| | | | Independent Energy — continued | |
| 340,000 | | | Occidental Petroleum Corp., 3.500%, 6/15/2025 | | | 328,426 | |
| | 75,000 | | | Occidental Petroleum Corp., 5.550%, 3/15/2026 | | | 78,295 | |
| | | | | | | | |
| | | | | | | 12,862,377 | |
| | | | | | | | |
| | | | Industrial Other — 0.4% | |
| | 4,365,000 | | | HTA Group Ltd. Co., 7.000%, 12/18/2025, 144A | | | 4,692,375 | |
| | | | | | | | |
| | | | Life Insurance — 1.3% | |
| | 5,240,000 | | | American International Group, Inc., 4.375%, 6/30/2050(a) | | | 6,861,089 | |
| | 1,530,000 | | | Athene Holding Ltd., 3.500%, 1/15/2031(a) | | | 1,616,917 | |
| | 1,110,000 | | | Global Atlantic Finance Co., 4.400%, 10/15/2029, 144A | | | 1,223,469 | |
| | 6,780,000 | | | New York Life Global Funding, 3-month LIBOR + 0.320%, 0.552%, 8/06/2021, 144A(a)(b) | | | 6,790,545 | |
| | | | | | | | |
| | | | | | | 16,492,020 | |
| | | | | | | | |
| | | | Local Authorities — 0.1% | |
| | 67,000,000 | | | Provincia de Buenos Aires, Argentina Deposit Rates Badlar Pvt Banks + 3.750%, 37.811%, 4/12/2025, 144A, (ARS)(b) | | | 349,793 | |
| | 216,360,000 | | | Provincia de Buenos Aires, Argentina Deposit Rates Badlar Pvt Banks + 3.830%, 34.187%, 5/31/2022, (ARS)(b) | | | 1,317,900 | |
| | | | | | | | |
| | | | | | | 1,667,693 | |
| | | | | | | | |
| | | | Lodging — 0.4% | |
| | 2,055,000 | | | Hilton Domestic Operating Co., Inc., 4.000%, 5/01/2031, 144A | | | 2,167,039 | |
| | 360,000 | | | Hyatt Hotels Corp., 5.375%, 4/23/2025 | | | 406,842 | |
| | 665,000 | | | Hyatt Hotels Corp., 5.750%, 4/23/2030 | | | 817,477 | |
| | 440,000 | | | Marriott International, Inc., Series EE, 5.750%, 5/01/2025 | | | 514,669 | |
| | 695,000 | | | Marriott International, Inc., 4.625%, 6/15/2030 | | | 815,568 | |
| | 735,000 | | | Wyndham Destinations, Inc., 6.625%, 7/31/2026, 144A | | | 841,575 | |
| | | | | | | | |
| | | | | | | 5,563,170 | |
| | | | | | | | |
| | | | Media Entertainment — 1.4% | |
| | 2,745,000 | | | Clear Channel Worldwide Holdings, Inc., 5.125%, 8/15/2027, 144A | | | 2,772,450 | |
| | 2,830,000 | | | iHeartCommunications, Inc., 4.750%, 1/15/2028, 144A | | | 2,904,287 | |
| | 2,400,000 | | | iHeartCommunications, Inc., 5.250%, 8/15/2027, 144A | | | 2,520,000 | |
| | 750,000 | | | iHeartCommunications, Inc., 6.375%, 5/01/2026 | | | 802,500 | |
| | 3,150,000 | | | iHeartCommunications, Inc., 8.375%, 5/01/2027 | | | 3,362,499 | |
| | 415,000 | | | Lamar Media Corp., 3.750%, 2/15/2028 | | | 426,496 | |
| | 825,000 | | | Lamar Media Corp., 4.000%, 2/15/2030 | | | 855,937 | |
| | 615,000 | | | Netflix, Inc., 4.875%, 4/15/2028 | | | 693,536 | |
| | 2,030,000 | | | Netflix, Inc., 4.875%, 6/15/2030, 144A | | | 2,334,500 | |
| | 490,000 | | | Netflix, Inc., 5.375%, 11/15/2029, 144A | | | 577,588 | |
| | 1,075,000 | | | Outfront Media Capital LLC/Outfront Media Capital Corp., 4.625%, 3/15/2030, 144A | | | 1,098,799 | |
| | | | | | | | |
| | | | | | | 18,348,592 | |
| | | | | | | | |
| | | | Metals & Mining — 1.5% | |
| | 2,655,000 | | | ABJA Investment Co. Pte Ltd., 5.450%, 1/24/2028 | | | 2,795,954 | |
| | 400,000 | | | ABJA Investment Co. Pte Ltd., 5.950%, 7/31/2024 | | | 428,412 | |
| | 690,000 | | | Antofagasta PLC, 2.375%, 10/14/2030, 144A(a) | | | 691,725 | |
| | 4,515,000 | | | First Quantum Minerals Ltd., 6.875%, 3/01/2026, 144A | | | 4,706,887 | |
| | 425,000 | | | First Quantum Minerals Ltd., 7.250%, 4/01/2023, 144A | | | 438,037 | |
| | 1,755,000 | | | First Quantum Minerals Ltd., 7.500%, 4/01/2025, 144A | | | 1,827,394 | |
See accompanying notes to financial statements.
53 |
Portfolio of Investments – as of December 31, 2020
Loomis Sayles Strategic Alpha Fund – (continued)
| | | | | | | | |
Principal
Amount (‡) | | | Description | | Value (†) | |
| | | | Metals & Mining — continued | |
| $ | 1,270,000 | | | Freeport-McMoRan, Inc., 4.375%, 8/01/2028 | | $ | 1,349,375 | |
| | 885,000 | | | Freeport-McMoRan, Inc., 4.625%, 8/01/2030 | | | 971,288 | |
| | 2,465,000 | | | Freeport-McMoRan, Inc., 5.400%, 11/14/2034 | | | 3,084,331 | |
| | 735,000 | | | Freeport-McMoRan, Inc., 5.450%, 3/15/2043 | | | 915,075 | |
| | 1,155,000 | | | Newcrest Finance Pty Ltd., 3.250%, 5/13/2030, 144A | | | 1,275,767 | |
| | 625,000 | | | Novelis Corp., 4.750%, 1/30/2030, 144A | | | 673,353 | |
| | 360,000 | | | Reliance Steel & Aluminum Co., 2.150%, 8/15/2030(a) | | | 369,873 | |
| | | | | | | | |
| | | | | | | 19,527,471 | |
| | | | | | | | |
| | | | Midstream — 0.9% | |
| | 5,460,000 | | | Cheniere Corpus Christi Holdings LLC, 3.700%, 11/15/2029 | | | 6,078,419 | |
| | 290,000 | | | Gray Oak Pipeline LLC, 3.450%, 10/15/2027, 144A | | | 302,910 | |
| | 300,000 | | | Kinder Morgan, Inc., 5.050%, 2/15/2046 | | | 365,385 | |
| | 3,745,000 | | | Sabine Pass Liquefaction LLC, 4.500%, 5/15/2030, 144A | | | 4,438,864 | |
| | 800,000 | | | Tennessee Gas Pipeline Co. LLC, 7.000%, 3/15/2027 | | | 998,250 | |
| | | | | | | | |
| | | | | | | 12,183,828 | |
| | | | | | | | |
| | | | Non-Agency Commercial Mortgage-Backed Securities — 3.4% | |
| | 2,995,000 | | | Barclays Commercial Mortgage Securities, Series 2020-BID, Class B, 1-month LIBOR + 2.540%, 2.699%, 10/15/2037, 144A(a)(b) | | | 2,995,932 | |
| | 4,565,000 | | | CFCRE Commercial Mortgage Trust, Series 2011-C1, Class D, 6.043%, 4/15/2044, 144A(a)(c) | | | 4,519,204 | |
| | 140,000 | | | Commercial Mortgage Trust, Series 2012-LC4, Class C, 5.535%, 12/10/2044(a)(c) | | | 126,214 | |
| | 790,000 | | | Credit Suisse Commercial Mortgage Securities Corp., Series 2019-SKLZ, Class D, 1-month LIBOR + 3.600%, 3.759%, 1/15/2034, 144A(b) | | | 745,370 | |
| | 5,680,000 | | | Credit Suisse Mortgage Trust, Series 2014-USA, Class E, 4.373%, 9/15/2037, 144A(e)(i) | | | 4,158,901 | |
| | 750,000 | | | DBUBS Mortgage Trust, Series 2017-BRBK, Class D, 3.530%, 10/10/2034, 144A(c) | | | 784,185 | |
| | 2,552,340 | | | DBUBS Mortgage Trust, Series 2011-LC1A, Class E, 5.565%, 11/10/2046, 144A(a)(c) | | | 2,552,704 | |
| | 3,195,000 | | | GS Mortgage Securities Corp. Trust, Series 2013-PEMB, Class D, 3.550%, 3/05/2033, 144A(c) | | | 2,576,138 | |
| | 2,170,000 | | | GS Mortgage Securities Trust, Series 2011-GC5, Class D, 5.388%, 8/10/2044, 144A(c)(e)(i) | | | 1,857,784 | |
| | 300,000 | | | GS Mortgage Securities Trust, Series 2014-GC18, Class B, 4.885%, 1/10/2047(a)(c) | | | 290,611 | |
| | 1,594,528 | | | Hospitality Mortgage Trust, Series 2019-HIT, Class C, 1-month LIBOR + 1.600%, 1.759%, 11/15/2036, 144A(a)(b) | | | 1,558,552 | |
| | 785,000 | | | Morgan Stanley Capital I Trust, Series 2011-C2, Class B, 5.200%, 6/15/2044, 144A(a)(c) | | | 782,931 | |
| | 1,570,000 | | | Morgan Stanley Capital I Trust, Series 2011-C2, Class D, 5.477%, 6/15/2044, 144A(c) | | | 1,366,809 | |
| | 2,515,000 | | | Morgan Stanley Capital I Trust, Series 2011-C2, Class E, 5.477%, 6/15/2044, 144A(c) | | | 1,544,325 | |
| | 2,706,718 | | | Motel 6 Trust, Series 2017-M6MZ, Class M, 1-month LIBOR + 6.927%, 7.085%, 8/15/2024, 144A(b) | | | 2,450,895 | |
| | 1,060,000 | | | Starwood Retail Property Trust, Series 2014-STAR, Class C, 1-month LIBOR + 2.750%, 2.909%, 11/15/2027, 144A(b)(d)(e)(g) | | | 769,163 | |
| | | | Non-Agency Commercial Mortgage-Backed Securities — continued | |
| 4,243,654 | | | Starwood Retail Property Trust, Series 2014-STAR, Class D, 1-month LIBOR + 3.500%, 3.659%, 11/15/2027, 144A(b)(d)(e)(g) | | | 2,745,280 | |
| | 3,575,000 | | | Starwood Retail Property Trust, Series 2014-STAR, Class E, 1-month LIBOR + 4.400%, 4.559%, 11/15/2027, 144A(b)(d)(e)(g) | | | 1,228,068 | |
| | 1,370,000 | | | UBS-Barclays Commercial Mortgage Trust, Series 2012-C2, Class E, 4.888%, 5/10/2063, 144A(c)(e)(i) | | | 634,922 | |
| | 440,000 | | | Wells Fargo Commercial Mortgage Trust, Series 2016-C36, Class C, 4.183%, 11/15/2059(a)(c) | | | 317,337 | |
| | 4,885,000 | | | Wells Fargo Commercial Mortgage Trust, Series 2019-JWDR, Class C, 3.038%, 9/15/2031, 144A(a)(c) | | | 4,748,083 | |
| | 789,118 | | | WFRBS Commercial Mortgage Trust, Series 2011-C2, Class D, 5.523%, 2/15/2044, 144A(a)(c) | | | 786,940 | |
| | 3,739,189 | | | WFRBS Commercial Mortgage Trust, Series 2011-C3, Class D, 5.642%, 3/15/2044, 144A(c) | | | 1,743,614 | |
| | 1,699,593 | | | WFRBS Commercial Mortgage Trust, Series 2011-C4, Class E, 5.193%, 6/15/2044, 144A(c) | | | 1,020,952 | |
| | 2,245,000 | | | WFRBS Commercial Mortgage Trust, Series 2012-C10, Class C, 4.362%, 12/15/2045(c) | | | 1,377,851 | |
| | 605,000 | | | WFRBS Commercial Mortgage Trust, Series 2012-C7, Class C, 4.810%, 6/15/2045(a)(c) | | | 471,183 | |
| | 975,000 | | | WFRBS Commercial Mortgage Trust, Series 2012-C7, Class E, 4.810%, 6/15/2045, 144A(c) | | | 432,644 | |
| | | | | | | | |
| | | | | | | 44,586,592 | |
| | | | | | | | |
| | | | Paper — 0.2% | |
| | 2,235,000 | | | Suzano Austria GmbH, 3.750%, 1/15/2031 | | | 2,371,335 | |
| | | | | | | | |
| | | | Pharmaceuticals — 1.3% | |
| | 645,000 | | | Perrigo Finance UnLtd. Co., 3.150%, 6/15/2030 | | | 689,348 | |
| | 1,665,000 | | | Teva Pharmaceutical Finance Netherlands II BV, 6.000%, 1/31/2025, (EUR) | | | 2,206,941 | |
| | 10,035,000 | | | Teva Pharmaceutical Finance Netherlands III BV, 4.100%, 10/01/2046 | | | 8,931,150 | |
| | 1,860,000 | | | Teva Pharmaceutical Finance Netherlands III BV, 7.125%, 1/31/2025 | | | 2,055,858 | |
| | 2,445,000 | | | Viatris, Inc., 4.000%, 6/22/2050, 144A | | | 2,801,207 | |
| | | | | | | | |
| | | | | | | 16,684,504 | |
| | | | | | | | |
| | | | REITs – Mortgage — 0.2% | |
| | 1,630,000 | | | Ladder Capital Finance Holdings LLLP/Ladder Capital Finance Corp., 4.250%, 2/01/2027, 144A | | | 1,601,475 | |
| | 1,065,000 | | | Ladder Capital Finance Holdings LLLP/Ladder Capital Finance Corp., 5.250%, 10/01/2025, 144A | | | 1,062,337 | |
| | | | | | | | |
| | | | | | | 2,663,812 | |
| | | | | | | | |
| | | | Restaurants — 0.9% | |
| | 435,000 | | | 1011778 B.C. ULC/New Red Finance, Inc., 3.875%, 1/15/2028, 144A | | | 441,860 | |
| | 5,765,000 | | | 1011778 B.C. ULC/New Red Finance, Inc., 4.375%, 1/15/2028, 144A | | | 5,937,950 | |
| | 2,115,000 | | | McDonald’s Corp., MTN, 3.625%, 9/01/2049(a) | | | 2,481,991 | |
| | 2,100,000 | | | Yum! Brands, Inc., 3.625%, 3/15/2031 | | | 2,122,743 | |
| | 920,000 | | | Yum! Brands, Inc., 4.750%, 1/15/2030, 144A | | | 1,008,780 | |
| | | | | | | | |
| | | | | | | 11,993,324 | |
| | | | | | | | |
See accompanying notes to financial statements.
| 54
Portfolio of Investments – as of December 31, 2020
Loomis Sayles Strategic Alpha Fund – (continued)
| | | | | | | | |
Principal
Amount (‡) | | | Description | | Value (†) | |
| | | | Retailers — 0.3% | |
| $ | 525,000 | | | AutoNation, Inc., 4.750%, 6/01/2030 | | $ | 631,750 | |
| | 1,325,000 | | | Carvana Co., 5.625%, 10/01/2025, 144A | | | 1,360,033 | |
| | 1,325,000 | | | Carvana Co., 5.875%, 10/01/2028, 144A | | | 1,374,767 | |
| | 400,000 | | | Dollar General Corp., 3.500%, 4/03/2030 | | | 459,189 | |
| | 420,000 | | | Lithia Motors, Inc., 4.375%, 1/15/2031, 144A | | | 450,450 | |
| | | | | | | | |
| | | | | | | 4,276,189 | |
| | | | | | | | |
| | | | Sovereigns — 0.5% | |
| | 6,270,000 | | | Mexico Government International Bond, 3.771%, 5/24/2061(a) | | | 6,553,467 | |
| | | | | | | | |
| | | | Supermarkets — 0.0% | |
| | 402,000 | | | Albertson’s Cos. LLC/Safeway, Inc./New Albertson’s LP/Albertson’s LLC, 5.750%, 3/15/2025 | | | 414,060 | |
| | | | | | | | |
| | | | Technology — 4.1% | |
| | 100,000 | | | Broadcom Corp./Broadcom Cayman Finance Ltd., 3.500%, 1/15/2028 | | | 110,221 | |
| | 475,000 | | | Broadcom, Inc., 4.150%, 11/15/2030 | | | 549,937 | |
| | 6,185,000 | | | Broadcom, Inc., 4.300%, 11/15/2032 | | | 7,332,250 | |
| | 6,220,000 | | | Broadcom, Inc., 4.750%, 4/15/2029 | | | 7,418,730 | |
| | 1,655,000 | | | Broadcom, Inc., 5.000%, 4/15/2030 | | | 2,011,838 | |
| | 1,650,000 | | | CDW LLC/CDW Finance Corp., 4.125%, 5/01/2025 | | | 1,726,197 | |
| | 1,615,000 | | | CommScope Technologies LLC, 5.000%, 3/15/2027, 144A | | | 1,590,775 | |
| | 2,070,000 | | | CommScope, Inc., 6.000%, 3/01/2026, 144A | | | 2,180,952 | |
| | 3,815,000 | | | CommScope, Inc., 7.125%, 7/01/2028, 144A | | | 4,062,975 | |
| | 3,610,000 | | | Equinix, Inc., 2.150%, 7/15/2030 | | | 3,671,912 | |
| | 375,000 | | | Equinix, Inc., 3.200%, 11/18/2029 | | | 411,662 | |
| | 1,365,000 | | | Gartner, Inc., 3.750%, 10/01/2030, 144A | | | 1,438,382 | |
| | 1,375,000 | | | Iron Mountain, Inc., 5.000%, 7/15/2028, 144A | | | 1,460,759 | |
| | 1,375,000 | | | Iron Mountain, Inc., 5.250%, 7/15/2030, 144A | | | 1,485,000 | |
| | 1,585,000 | | | Micron Technology, Inc., 4.663%, 2/15/2030 | | | 1,945,027 | |
| | 5,645,000 | | | Micron Technology, Inc., 5.327%, 2/06/2029 | | | 7,061,253 | |
| | 2,305,000 | | | MSCI, Inc., 3.625%, 9/01/2030, 144A | | | 2,408,725 | |
| | 1,660,000 | | | Nokia OYJ, EMTN, 2.000%, 3/11/2026, (EUR) | | | 2,101,452 | |
| | 575,000 | | | NXP BV/NXP Funding LLC/NXP USA, Inc., 3.150%, 5/01/2027, 144A | | | 633,967 | |
| | 330,000 | | | NXP BV/NXP Funding LLC/NXP USA, Inc., 3.400%, 5/01/2030, 144A | | | 374,225 | |
| | 570,000 | | | Open Text Corp., 3.875%, 2/15/2028, 144A | | | 592,789 | |
| | 530,000 | | | Open Text Holdings, Inc., 4.125%, 2/15/2030, 144A | | | 563,814 | |
| | 1,550,000 | | | Qorvo, Inc., 3.375%, 4/01/2031, 144A | | | 1,600,375 | |
| | 240,000 | | | Sabre GLBL, Inc., 9.250%, 4/15/2025, 144A | | | 285,600 | |
| | 535,000 | | | SS&C Technologies, Inc., 5.500%, 9/30/2027, 144A | | | 571,391 | |
| | | | | | | | |
| | | | | | | 53,590,208 | |
| | | | | | | | |
| | | | Transportation Services — 0.3% | |
| | 1,855,000 | | | Adani Ports & Special Economic Zone Ltd., 4.200%, 8/04/2027, 144A | | | 1,990,756 | |
| | 1,645,000 | | | GMR Hyderabad International Airport Ltd., 5.375%, 4/10/2024 | | | 1,670,020 | |
| | | | | | | | |
| | | | | | | 3,660,776 | |
| | | | | | | | |
| | | | Treasuries — 1.4% | |
| | 338,660,000 | | | Republic of South Africa Government Bond, Series 2037, 8.500%, 1/31/2037, (ZAR) | | | 19,071,493 | |
| | | | | | | | |
| | | | Wireless — 1.7% | |
| | 2,375,000 | | | American Tower Corp., 2.100%, 6/15/2030(a) | | | 2,437,718 | |
| | 5,430,000 | | | Crown Castle International Corp., 2.250%, 1/15/2031(a) | | | 5,632,748 | |
| | 3,769,000 | | | Kenbourne Invest S.A., 6.875%, 11/26/2024, 144A | | | 4,087,028 | |
| | | | Wireless — continued | |
| 225,000 | | | Millicom International Cellular S.A., 4.500%, 4/27/2031, 144A | | | 243,000 | |
| | 730,000 | | | Millicom International Cellular S.A., 5.125%, 1/15/2028, 144A | | | 775,917 | |
| | 330,000 | | | Sprint Capital Corp., 6.875%, 11/15/2028 | | | 435,099 | |
| | 6,700,000 | | | T-Mobile USA, Inc., 3.875%, 4/15/2030, 144A(a) | | | 7,759,940 | |
| | 550,000 | | | T-Mobile USA, Inc., 4.500%, 2/01/2026 | | | 562,284 | |
| | | | | | | | |
| | | | | | | 21,933,734 | |
| | | | | | | | |
| | | | Wirelines — 0.5% | |
| | 5,990,000 | | | AT&T, Inc., 3.650%, 6/01/2051(a) | | | 6,272,087 | |
| | 470,000 | | | Level 3 Financing, Inc., 4.625%, 9/15/2027, 144A | | | 490,885 | |
| | | | | | | | |
| | | | | | | 6,762,972 | |
| | | | | | | | |
| | | | Total Non-Convertible Bonds
(Identified Cost $864,134,736) | | | 887,323,154 | |
| | | | | | | | |
| | | | | | | | |
| | Convertible Bonds — 2.9% | |
| | | | Airlines — 0.1% | |
| | 1,050,000 | | | Southwest Airlines Co., 1.250%, 5/01/2025(a) | | | 1,525,125 | |
| | | | | | | | |
| | | | Cable Satellite — 1.1% | |
| | 1,635,000 | | | DISH Network Corp., Zero Coupon, 12/15/2025, 144A | | | 1,642,732 | |
| | 4,280,000 | | | DISH Network Corp., 2.375%, 3/15/2024 | | | 3,988,660 | |
| | 7,230,000 | | | DISH Network Corp., 3.375%, 8/15/2026 | | | 6,891,865 | |
| | 1,635,000 | | | Liberty Media Corp., 0.500%, 12/01/2050, 144A | | | 1,742,305 | |
| | | | | | | | |
| | | | | | | 14,265,562 | |
| | | | | | | | |
| | | | Consumer Cyclical Services — 0.1% | |
| | 1,670,000 | | | Uber Technologies, Inc., Zero Coupon, 12/15/2025, 144A | | | 1,708,475 | |
| | | | | | | | |
| | | | Diversified Manufacturing — 0.0% | |
| | 600,000 | | | Greenbrier Cos., Inc. (The), 2.875%, 2/01/2024 | | | 606,283 | |
| | | | | | | | |
| | | | Healthcare — 0.3% | |
| | 3,120,000 | | | Teladoc Health, Inc., 1.250%, 6/01/2027, 144A | | | 3,736,839 | |
| | | | | | | | |
| | | | Industrial Other — 0.0% | |
| | 530,000 | | | Chegg, Inc., Zero Coupon, 9/01/2026, 144A | | | 592,655 | |
| | | | | | | | |
| | | | Pharmaceuticals — 1.0% | |
| | 1,270,000 | | | BioMarin Pharmaceutical, Inc., 0.599%, 8/01/2024 | | | 1,362,821 | |
| | 7,130,000 | | | BioMarin Pharmaceutical, Inc., 1.250%, 5/15/2027, 144A | | | 7,450,850 | |
| | 855,000 | | | Guardant Health, Inc., Zero Coupon, 11/15/2027, 144A | | | 1,000,372 | |
| | 605,000 | | | Jazz Investments I Ltd., 2.000%, 6/15/2026, 144A | | | 787,319 | |
| | 1,840,000 | | | Neurocrine Biosciences, Inc., 2.250%, 5/15/2024 | | | 2,538,783 | |
| | | | | | | | |
| | | | | | | 13,140,145 | |
| | | | | | | | |
| | | | Technology — 0.3% | |
| | 785,000 | | | LivePerson, Inc., Zero Coupon, 12/15/2026, 144A | | | 857,476 | |
| | 470,000 | | | Lumentum Holdings, Inc., 0.500%, 12/15/2026 | | | 573,118 | |
| | 160,000 | | | Palo Alto Networks, Inc., 0.375%, 6/01/2025, 144A | | | 210,693 | |
| | 1,410,000 | | | Shift4 Payments, Inc., Zero Coupon, 12/15/2025, 144A | | | 1,720,601 | |
| | | | | | | | |
| | | | | | | 3,361,888 | |
| | | | | | | | |
| | | | Total Convertible Bonds
(Identified Cost $37,668,514) | | | 38,936,972 | |
| | | | | | | | |
| | | | | | | | |
| | | | Total Bonds and Notes
(Identified Cost $901,803,250) | | | 926,260,126 | |
| | | | | | | | |
| | | | | | | | |
See accompanying notes to financial statements.
55 |
Portfolio of Investments – as of December 31, 2020
Loomis Sayles Strategic Alpha Fund – (continued)
| | | | | | | | |
Principal
Amount (‡) | | | Description | | Value (†) | |
| | Senior Loans — 0.5% | |
| | | | Building Materials — 0.1% | |
| $ | 340,000 | | | CP Atlas Buyer, Inc., 2020 Delayed Draw Term Loan B2, 3-month LIBOR + 4.500%, 5.250%, 11/23/2027(b) | | $ | 340,425 | |
| | 1,020,000 | | | CP Atlas Buyer, Inc., 2020 Term Loan B1, 3-month LIBOR + 4.500%, 5.250%, 11/23/2027(b) | | | 1,021,275 | |
| | | | | | | | |
| | | | | | | 1,361,700 | |
| | | | | | | | |
| | | | Cable Satellite — 0.2% | |
| | 1,930,000 | | | Ziggo BV, 2019 EUR Term Loan H, 6-month EURIBOR + 3.000%, 3.000%, 1/31/2029, (EUR)(b) | | | 2,348,943 | |
| | | | | | | | |
| | | | Consumer Products — 0.1% | |
| | 1,195,000 | | | Weber-Stephen Products LLC, Term Loan B, 1-month LIBOR + 3.250%, 4.000%, 10/30/2027(b) | | | 1,195,597 | |
| | | | | | | | |
| | | | Restaurants — 0.1% | |
| | 1,380,000 | | | IRB Holding Corp., 2020 Fourth Amendment Incremental Term Loan, 12/15/2027(j) | | | 1,380,428 | |
| | | | | | | | |
| | | | Total Senior Loans
(Identified Cost $6,044,499) | | | 6,286,668 | |
| | | | | | | | |
| | | | | | | | |
| | Collateralized Loan Obligations — 5.3% | |
| | 1,740,000 | | | AGL CLO 3 Ltd., Series 2020-3A, Class D, 3-month LIBOR + 3.300%, 3.537%, 1/15/2033, 144A(b) | | | 1,696,637 | |
| | 1,350,000 | | | AGL CLO 3 Ltd., Series 2020-3A, Class C, 3-month LIBOR + 2.150%, 2.387%, 1/15/2033, 144A(a)(b) | | | 1,325,997 | |
| | 865,000 | | | Anchorage Capital CLO 9 Ltd., Series 2016-9A, Class DR, 3-month LIBOR + 4.000%, 4.237%, 7/15/2032, 144A(b) | | | 852,119 | |
| | 480,000 | | | Apidos CLO XX, Series 2015-20A, Class BRR, 3-month LIBOR + 1.950%, 2.180%, 7/16/2031, 144A(a)(b) | | | 469,056 | |
| | 3,175,000 | | | Apidos CLO XXIII, Series 2015-23A, Class CR, 3-month LIBOR + 2.000%, 2.237%, 4/15/2033, 144A(a)(b) | | | 3,089,848 | |
| | 2,940,000 | | | ARES XLIV CLO Ltd., Series 2017-44A, Class E, 3-month LIBOR + 8.050%, 8.287%, 10/15/2029, 144A(b) | | | 2,605,985 | |
| | 400,000 | | | Ballyrock CLO Ltd., Series 2018-1A, Class C, 3-month LIBOR + 3.150%, 3.368%, 4/20/2031, 144A(b) | | | 385,560 | |
| | 850,000 | | | Barings CLO Ltd., Series 2019-4A, Class C, 3-month LIBOR + 2.800%, 3.037%, 1/15/2033, 144A(a)(b) | | | 845,108 | |
| | 560,000 | | | Battalion CLO XIV Ltd., Series 2019-14A, Class E, 3-month LIBOR + 6.680%, 6.898%, 4/20/2032, 144A(b) | | | 540,644 | |
| | 500,000 | | | Battalion CLO XVI Ltd., Series 2019-16A, Class D, 3-month LIBOR + 4.360%, 4.578%, 12/19/2032, 144A(b) | | | 501,761 | |
| | 1,915,000 | | | BlueMountain CLO XXIV Ltd., Series 2019-24A, Class C, 3-month LIBOR + 2.700%, 2.918%, 4/20/2031, 144A(a)(b) | | | 1,923,306 | |
| | 915,000 | | | Bristol Park CLO Ltd., Series 2016-1A, Class CR, 3-month LIBOR + 1.950%, 2.187%, 4/15/2029, 144A(a)(b) | | | 905,844 | |
| | 455,000 | | | Burnham Park CLO Ltd., Series 2016-1A, Class CR, 3-month LIBOR + 2.150%, 2.368%, 10/20/2029, 144A(a)(b) | | | 442,394 | |
| | 400,000 | | | Carbone CLO Ltd., Series 2017-1A, Class B, 3-month LIBOR + 1.800%, 2.018%, 1/20/2031, 144A(a)(b) | | | 391,972 | |
| | Collateralized Loan Obligations — continued | |
| 1,575,000 | | | Carlyle Global Market Strategies CLO Ltd., Series 2015-2A, Class CR, 3-month LIBOR + 2.250%, 2.467%, 4/27/2027, 144A(b) | | | 1,521,004 | |
| | 500,000 | | | Catamaran CLO Ltd., Series 2013-1A, Class CR, 3-month LIBOR + 1.800%, 2.017%, 1/27/2028, 144A(a)(b) | | | 488,591 | |
| | 265,000 | | | CIFC Funding II Ltd., Series 2014-2RA, Class A3, 3-month LIBOR + 1.900%, 2.115%, 4/24/2030, 144A(a)(b) | | | 259,752 | |
| | 730,000 | | | CIFC Funding II Ltd., Series 2013-2A, Class A3LR, 3-month LIBOR + 1.950%, 2.168%, 10/18/2030, 144A(a)(b) | | | 719,159 | |
| | 2,410,000 | | | Cole Park CLO Ltd., Series 2015-1A, Class DR, 3-month LIBOR + 3.150%, 3.368%, 10/20/2028, 144A(b) | | | 2,374,684 | |
| | 875,000 | | | Dryden 45 Senior Loan Fund, Series 2016-45A, Class ER, 3-month LIBOR + 5.850%, 6.087%, 10/15/2030, 144A(b) | | | 834,730 | |
| | 250,000 | | | Dryden 64 CLO Ltd., Series 2018-64A, Class C, 3-month LIBOR + 1.750%, 1.968%, 4/18/2031, 144A(a)(b) | | | 234,030 | |
| | 615,000 | | | Dryden 80 CLO Ltd., Series 2019-80A, Class D1, 3-month LIBOR + 4.100%, 4.318%, 1/17/2033, 144A(b) | | | 618,001 | |
| | 300,000 | | | Dryden XXVI Senior Loan Fund, Series 2013-26A, Class CR, 3-month LIBOR + 1.8500%, 2.087%, 4/15/2029, 144A(a)(b) | | | 283,176 | |
| | 330,000 | | | Galaxy XXIX CLO Ltd., Series 2018-29A, Class D, 3-month LIBOR + 2.400%, 2.621%, 11/15/2026, 144A(b) | | | 322,036 | |
| | 1,405,000 | | | Galaxy XXVI CLO Ltd., Series 2018-26A, Class E, 3-month LIBOR + 5.850%, 6.063%, 11/22/2031, 144A(b) | | | 1,340,629 | |
| | 650,000 | | | Gilbert Park CLO Ltd., Series 2017-1A, Class D, 3-month LIBOR + 2.950%, 3.187%, 10/15/2030, 144A(b) | | | 643,904 | |
| | 320,000 | | | Goldentree Loan Management U.S. CLO 3 Ltd., Series 2018-3A, Class C, 3-month LIBOR + 1.900%, 2.118%, 4/20/2030, 144A(a)(b) | | | 311,631 | |
| | 990,000 | | | Hayfin US XII Ltd, Series 2019-2A, Class E, 3-month LIBOR + 6.900%, 7.118%, 7/20/2032, 144A(b) | | | 985,987 | |
| | 1,110,000 | | | LCM 30 Ltd., Series 30A, Class D, 3-month LIBOR + 3.750%, 3.968%, 4/20/2031, 144A(b) | | | 1,095,449 | |
| | 475,000 | | | Madison Park Funding XXXI Ltd., Series 2018-31A, Class C, 3-month LIBOR + 2.150%, 2.359%, 1/23/2031, 144A(a)(b) | | | 475,516 | |
| | 300,000 | | | Madison Park Funding XXXI Ltd., Series 2018-31A, Class D, 3-month LIBOR + 3.000%, 3.209%, 1/23/2031, 144A(b) | | | 299,996 | |
| | 3,300,000 | | | Neuberger Berman CLO Ltd., Series 2013-14A, Class CR2, 3-month LIBOR + 1.900%, 2.122%, 1/28/2030, 144A(a)(b) | | | 3,187,314 | |
| | 725,000 | | | Neuberger Berman Loan Advisers CLO Ltd., Series 2018-30A, Class E, 3-month LIBOR + 6.750%, 6.968%, 1/20/2031, 144A(b) | | | 712,977 | |
| | 2,100,000 | | | Oaktree CLO Ltd., Series 2019-4A, Class E, 3-month LIBOR + 7.230%, 7.448%, 10/20/2032, 144A(b) | | | 2,024,144 | |
| | 495,000 | | | Octagon Investment Partners 39 Ltd., Series 2018-3A, Class E, 3-month LIBOR + 5.750%, 5.968%, 10/20/2030, 144A(b) | | | 461,685 | |
See accompanying notes to financial statements.
| 56
Portfolio of Investments – as of December 31, 2020
Loomis Sayles Strategic Alpha Fund – (continued)
| | | | | | | | |
Principal
Amount (‡) | | | Description | | Value (†) | |
| | Collateralized Loan Obligations — continued | |
| $ | 1,420,000 | | | Octagon Investment Partners 40 Ltd., Series 2019-1A, Class D, 3-month LIBOR + 3.800%, 4.018%, 4/20/2031, 144A(b) | | $ | 1,424,201 | |
| | 920,000 | | | Octagon Investment Partners XXII Ltd., Series 2014-1A, Class CRR, 3-month LIBOR + 1.900%, 2.116%, 1/22/2030, 144A(a)(b) | | | 904,118 | |
| | 1,980,000 | | | OHA Credit Funding 3 Ltd., Series 2019-3A, Class E1, 3-month LIBOR + 5.000%, 5.218%, 7/20/2032, 144A(b) | | | 1,881,888 | |
| | 1,745,000 | | | OHA Credit Funding 5 Ltd., Series 2020-5A, Class C, 3-month LIBOR + 2.000%, 2.218%, 4/18/2033, 144A(a)(b) | | | 1,670,078 | |
| | 1,585,000 | | | OHA Credit Funding Ltd., Series 2019-4A, Class E, 3-month LIBOR + 6.100%, 6.316%, 10/22/2032, 144A(b) | | | 1,558,089 | |
| | 2,245,000 | | | OHA Loan Funding Ltd., Series 2013-1A, Class DR2, 3-month LIBOR + 3.050%, 3.259%, 7/23/2031, 144A(b) | | | 2,223,763 | |
| | 1,570,000 | | | OHA Loan Funding Ltd., Series 2016-1A, Class CR, 3-month LIBOR + 1.950%, 2.168%, 1/20/2033, 144A(a)(b) | | | 1,540,223 | |
| | 232,235 | | | OZLM XIII Ltd., Series 2015-13A, Class A1R, 3-month LIBOR + 1.080%, 1.294%, 7/30/2027, 144A(a)(b) | | | 231,692 | |
| | 2,070,000 | | | OZLM XXIII Ltd., Series 2019-23A, Class E, 3-month LIBOR + 6.800%, 7.037%, 4/15/2032, 144A(b) | | | 2,046,868 | |
| | 325,000 | | | Palmer Square CLO Ltd., Series 2015-1A, Class CR2, 3-month LIBOR + 3.150%, 3.363%, 5/21/2029, 144A(b) | | | 319,494 | |
| | 300,000 | | | Palmer Square CLO Ltd., Series 2015-2A, Class BR2, 3-month LIBOR + 1.950%, 2.168%, 7/20/2030, 144A(a)(b) | | | 295,398 | |
| | 2,610,000 | | | Parallel Ltd., Series 2017-1A, Class CR, 3-month LIBOR + 2.000%, 2.218%, 7/20/2029, 144A(a)(b) | | | 2,527,903 | |
| | 1,645,000 | | | Parallel Ltd., Series 2018-2A, Class B, 3-month LIBOR + 2.150%, 2.368%, 10/20/2031, 144A(a)(b) | | | 1,574,559 | |
| | 1,045,000 | | | Pikes Peak CLO 1, Series 2018-1A, Class D, 3-month LIBOR + 3.150%, 3.365%, 7/24/2031, 144A(b) | | | 1,012,184 | |
| | 3,885,000 | | | Pikes Peak CLO 3, Series 2019-3A, Class E, 3-month LIBOR + 6.860%, 7.075%, 4/25/2030, 144A(b) | | | 3,848,332 | |
| | 340,000 | | | Recette CLO LLC, Series 2015-1A, Class DR, 3-month LIBOR + 2.750%, 2.968%, 10/20/2027, 144A(a)(b) | | | 339,148 | |
| | 920,000 | | | Regatta XIII Funding Ltd., Series 2018-2A, Class C, 3-month LIBOR + 3.100%, 3.337%, 7/15/2031, 144A(b) | | | 908,529 | |
| | 2,565,000 | | | Rockford Tower CLO Ltd., Series 2017-2A, Class CR, 3-month LIBOR + 1.900%, 2.137%, 10/15/2029, 144A(a)(b) | | | 2,477,180 | |
| | 740,000 | | | Symphony CLO XX Ltd., Series 2018-20A, Class D, 3-month LIBOR + 3.8600%, 4.090%, 1/16/2032, 144A(b) | | | 739,890 | |
| | 920,000 | | | TCW CLO Ltd., Series 2018-1, Class D, 3-month LIBOR + 2.910%, 3.125%, 4/25/2031, 144A(b) | | | 913,096 | |
| | 1,030,000 | | | TICP CLO VII Ltd., Series 2017-7A, Class CR, 3-month LIBOR + 2.150%, 2.387%, 4/15/2033, 144A(a)(b) | | | 1,026,231 | |
| | 610,000 | | | TICP CLO XV Ltd., Series 2020-15A, Class C, 3-month LIBOR + 2.150%, 2.368%, 4/20/2033, 144A(a)(b) | | | 603,455 | |
| | Collateralized Loan Obligations — continued | |
| 895,000 | | | TRESTLES CLO II Ltd., Series 2018-2A, Class D, 3-month LIBOR + 5.750%, 5.965%, 7/25/2031, 144A(b) | | | 839,679 | |
| | 780,000 | | | VERDE CLO Ltd., Series 2019-1A, Class E, 3-month LIBOR + 6.900%, 7.137%, 4/15/2032, 144A(b) | | | 780,014 | |
| | 695,000 | | | Voya CLO Ltd, Series 2019-3A, Class D, 3-month LIBOR + 3.850%, 4.068%, 10/17/2032, 144A(b) | | | 694,988 | |
| | 2,435,000 | | | York CLO-7 Ltd., Series 2019-2A, Class D, 3-month LIBOR + 3.800%, 4.016%, 1/22/2033, 144A(b) | | | 2,442,912 | |
| | | | | | | | |
| | | | Total Collateralized Loan Obligations
(Identified Cost $66,196,676) | | | 69,994,538 | |
| | | | | | | | |
| | | | | | | | |
| | Loan Participations — 0.0% | |
| | | | ABS Other — 0.0% | |
| | 1,061,479 | | | Harbour Aircraft Investments Ltd., Series 2017-1, Class C, 8.000%, 11/15/2037 (d)(g)
(Identified Cost $1,059,231) | | | 580,841 | |
| | | | | | | | |
| | | | | | | | |
| Shares | | | | | | |
| | Common Stocks — 3.5% | |
| | | | Aerospace & Defense — 0.0% | |
| | 1,095 | | | Lockheed Martin Corp. | | | 388,703 | |
| | | | | | | | |
| | | | Air Freight & Logistics — 0.1% | |
| | 6,552 | | | Expeditors International of Washington, Inc. | | | 623,161 | |
| | 2,153 | | | United Parcel Service, Inc., Class B | | | 362,565 | |
| | | | | | | | |
| | | | | | | 985,726 | |
| | | | | | | | |
| | | | Airlines — 0.1% | |
| | 36,229 | | | Delta Air Lines, Inc. | | | 1,456,768 | |
| | | | | | | | |
| | | | Automobiles — 0.0% | |
| | 9,332 | | | General Motors Co. | | | 388,585 | |
| | | | | | | | |
| | | | Banks — 0.1% | |
| | 2,721 | | | Bank of America Corp. | | | 82,474 | |
| | 6,483 | | | Citigroup, Inc. | | | 399,742 | |
| | 3,927 | | | Fifth Third Bancorp | | | 108,267 | |
| | | | | | | | |
| | | | | | | 590,483 | |
| | | | | | | | |
| | | | Biotechnology — 0.0% | |
| | 1,446 | | | Amgen, Inc. | | | 332,464 | |
| | | | | | | | |
| | | | Building Products — 0.0% | |
| | 7,034 | | | Masco Corp. | | | 386,378 | |
| | | | | | | | |
| | | | Capital Markets — 0.1% | |
| | 537 | | | BlackRock, Inc. | | | 387,467 | |
| | 6,016 | | | Morgan Stanley | | | 412,277 | |
| | 1,221 | | | S&P Global, Inc. | | | 401,379 | |
| | 9,332 | | | Virtu Financial, Inc., Class A | | | 234,886 | |
| | | | | | | | |
| | | | | | | 1,436,009 | |
| | | | | | | | |
| | | | Chemicals — 0.1% | |
| | 138,555 | | | Hexion Holdings Corp., Class B(h) | | | 1,791,516 | |
| | | | | | | | |
| | | | Communications Equipment — 0.0% | |
| | 9,221 | | | Cisco Systems, Inc. | | | 412,640 | |
| | | | | | | | |
| | | | Construction Materials — 0.2% | |
| | 362,679 | | | Cemex SAB de CV, Sponsored ADR(h) | | | 1,875,050 | |
| | | | | | | | |
| | | | Diversified Telecommunication Services — 0.3% | |
| | 130,464 | | | AT&T, Inc. | | | 3,752,144 | |
| | 6,301 | | | Verizon Communications, Inc. | | | 370,184 | |
| | | | | | | | |
| | | | | | | 4,122,328 | |
| | | | | | | | |
See accompanying notes to financial statements.
57 |
Portfolio of Investments – as of December 31, 2020
Loomis Sayles Strategic Alpha Fund – (continued)
| | | | | | | | |
| Shares | | | Description | | Value (†) | |
| | | | Entertainment — 0.0% | |
| | 4,583 | | | Activision Blizzard, Inc. | | $ | 425,532 | |
| | | | | | | | |
| | | | Food & Staples Retailing — 0.1% | |
| | 1,056 | | | Costco Wholesale Corp. | | | 397,880 | |
| | 2,642 | | | Walmart, Inc. | | | 380,844 | |
| | | | | | | | |
| | | | | | | 778,724 | |
| | | | | | | | |
| | | | Health Care Equipment & Supplies — 0.0% | |
| | 3,209 | | | Abbott Laboratories | | | 351,353 | |
| | | | | | | | |
| | | | Health Care Providers & Services — 0.2% | |
| | 1,217 | | | Anthem, Inc. | | | 390,766 | |
| | 17,950 | | | CVS Health Corp. | | | 1,225,985 | |
| | 2,372 | | | HCA Healthcare, Inc. | | | 390,099 | |
| | 980 | | | Humana, Inc. | | | 402,065 | |
| | 1,135 | | | UnitedHealth Group, Inc. | | | 398,022 | |
| | | | | | | | |
| | | | | | | 2,806,937 | |
| | | | | | | | |
| | | | Hotels, Restaurants & Leisure — 0.1% | |
| | 1,699 | | | McDonald’s Corp. | | | 364,572 | |
| | 6,587 | | | Starbucks Corp. | | | 704,677 | |
| | | | | | | | |
| | | | | | | 1,069,249 | |
| | | | | | | | |
| | | | Household Durables — 0.0% | |
| | 5,277 | | | DR Horton, Inc. | | | 363,691 | |
| | | | | | | | |
| | | | Household Products — 0.1% | |
| | 7,192 | | | Procter & Gamble Co. (The) | | | 1,000,695 | |
| | | | | | | | |
| | | | Insurance — 0.1% | |
| | 3,654 | | | Allstate Corp. (The) | | | 401,684 | |
| | 8,421 | | | MetLife, Inc. | | | 395,366 | |
| | 3,965 | | | Progressive Corp. (The) | | | 392,059 | |
| | | | | | | | |
| | | | | | | 1,189,109 | |
| | | | | | | | |
| | | | Internet & Direct Marketing Retail — 0.1% | |
| | 305 | | | Booking Holdings, Inc.(h) | | | 679,317 | |
| | | | | | | | |
| | | | IT Services — 0.2% | |
| | 1,461 | | | Accenture PLC, Class A | | | 381,628 | |
| | 2,672 | | | Fidelity National Information Services, Inc. | | | 377,981 | |
| | 264 | | | Global Payments, Inc. | | | 56,871 | |
| | 3,048 | | | MasterCard, Inc., Class A | | | 1,087,953 | |
| | 2,990 | | | Visa, Inc., Class A | | | 654,003 | |
| | | | | | | | |
| | | | | | | 2,558,436 | |
| | | | | | | | |
| | | | Life Sciences Tools & Services — 0.0% | |
| | 840 | | | Thermo Fisher Scientific, Inc. | | | 391,255 | |
| | | | | | | | |
| | | | Machinery — 0.0% | |
| | 1,477 | | | Deere & Co. | | | 397,387 | |
| | | | | | | | |
| | | | Media — 0.1% | |
| | 7,845 | | | Comcast Corp., Class A | | | 411,078 | |
| | 6,485 | | | Interpublic Group of Cos., Inc. (The) | | | 152,527 | |
| | 3,741 | | | Nexstar Media Group, Inc., Class A | | | 408,480 | |
| | | | | | | | |
| | | | | | | 972,085 | |
| | | | | | | | |
| | | | Metals & Mining — 0.0% | |
| | 6,366 | | | Newmont Corp. | | | 381,260 | |
| | | | | | | | |
| | | | Multiline Retail — 0.1% | |
| | 1,834 | | | Dollar General Corp. | | | 385,690 | |
| | 2,196 | | | Target Corp. | | | 387,660 | |
| | | | | | | | |
| | | | | | | 773,350 | |
| | | | | | | | |
| | | | Oil, Gas & Consumable Fuels — 0.2% | |
| | 14,685 | | | California Resources Corp.(h) | | | 346,419 | |
| | 4,426 | | | Chevron Corp. | | | 373,776 | |
| | 11,580 | | | Enterprise Products Partners LP | | | 226,852 | |
| | 16,959 | | | MPLX LP | | | 367,162 | |
| | 26,879 | | | Western Midstream Partners LP | | | 371,468 | |
| | | | Oil, Gas & Consumable Fuels — continued | |
| | 32,298 | | | Whiting Petroleum Corp.(h) | | | 807,450 | |
| | | | | | | | |
| | | | | | | 2,493,127 | |
| | | | | | | | |
| | | | Personal Products — 0.1% | |
| | 2,679 | | | Estee Lauder Cos., Inc. (The), Class A | | | 713,123 | |
| | | | | | | | |
| | | | Pharmaceuticals — 0.2% | |
| | 6,247 | | | Bristol-Myers Squibb Co. | | | 387,502 | |
| | 2,270 | | | Eli Lilly & Co. | | | 383,267 | |
| | 10,856 | | | Johnson & Johnson | | | 1,708,517 | |
| | 4,613 | | | Merck & Co., Inc. | | | 377,343 | |
| | | | | | | | |
| | | | | | | 2,856,629 | |
| | | | | | | | |
| | | | REITs – Diversified — 0.0% | |
| | 1,535 | | | American Tower Corp. | | | 344,546 | |
| | | | | | | | |
| | | | REITs – Storage — 0.0% | |
| | 12,458 | | | Iron Mountain, Inc. | | | 367,262 | |
| | | | | | | | |
| | | | Road & Rail — 0.0% | |
| | 1,723 | | | Union Pacific Corp. | | | 358,763 | |
| | | | | | | | |
| | | | Semiconductors & Semiconductor Equipment — 0.3% | |
| | 4,431 | | | Applied Materials, Inc. | | | 382,395 | |
| | 4,241 | | | KLA Corp. | | | 1,098,037 | |
| | 798 | | | Lam Research Corp. | | | 376,871 | |
| | 734 | | | NVIDIA Corp. | | | 383,295 | |
| | 2,629 | | | QUALCOMM, Inc. | | | 400,502 | |
| | 1,528 | | | Teradyne, Inc. | | | 183,192 | |
| | 2,512 | | | Texas Instruments, Inc. | | | 412,295 | |
| | | | | | | | |
| | | | | | | 3,236,587 | |
| | | | | | | | |
| | | | Software — 0.1% | |
| | 1,063 | | | Intuit, Inc. | | | 403,781 | |
| | 1,782 | | | Microsoft Corp. | | | 396,353 | |
| | 18,912 | | | NortonLifeLock, Inc. | | | 392,991 | |
| | 6,073 | | | Oracle Corp. | | | 392,862 | |
| | | | | | | | |
| | | | | | | 1,585,987 | |
| | | | | | | | |
| | | | Specialty Retail — 0.1% | |
| | 3,762 | | | Best Buy Co., Inc. | | | 375,410 | |
| | 1,427 | | | Home Depot, Inc. (The) | | | 379,040 | |
| | 3,094 | | | L Brands, Inc. | | | 115,066 | |
| | 2,373 | | | Lowe’s Cos., Inc. | | | 380,890 | |
| | | | | | | | |
| | | | | | | 1,250,406 | |
| | | | | | | | |
| | | | Technology Hardware, Storage & Peripherals — 0.2% | |
| | 12,330 | | | Apple, Inc. | | | 1,636,067 | |
| | 16,147 | | | HP, Inc. | | | 397,055 | |
| | | | | | | | |
| | | | | | | 2,033,122 | |
| | | | | | | | |
| | | | Textiles, Apparel & Luxury Goods — 0.1% | |
| | 1,234 | | | LVMH Moet Hennessy Louis Vuitton SE | | | 772,485 | |
| | 2,696 | | | NIKE, Inc., Class B | | | 381,403 | |
| | | | | | | | |
| | | | | | | 1,153,888 | |
| | | | | | | | |
| | | | Tobacco — 0.1% | |
| | 8,707 | | | Altria Group, Inc. | | | 356,987 | |
| | 4,604 | | | Philip Morris International, Inc. | | | 381,165 | |
| | | | | | | | |
| | | | | | | 738,152 | |
| | | | | | | | |
| | | | Total Common Stocks
(Identified Cost $44,154,260) | | | 45,436,622 | |
| | | | | | | | |
| | | | | | | | |
| | Preferred Stocks — 1.4% | |
| | Convertible Preferred Stocks — 1.1% | |
| | | | Banking — 0.3% | |
| | 926 | | | Bank of America Corp., Series L, 7.250% | | | 1,406,205 | |
| | 2,053 | | | Wells Fargo & Co., Class A, Series L, 7.500% | | | 3,116,249 | |
| | | | | | | | |
| | | | | | | 4,522,454 | |
| | | | | | | | |
See accompanying notes to financial statements.
| ��58
Portfolio of Investments – as of December 31, 2020
Loomis Sayles Strategic Alpha Fund – (continued)
| | | | | | | | |
Shares | | | Description | | Value (†) | |
| | | | Electric — 0.1% | |
| | 23,032 | | | NextEra Energy, Inc., 5.279% | | $ | 1,170,947 | |
| | | | | | | | |
| | | | Energy — 0.0% | |
| | 1,714 | | | Chesapeake Energy Corp., 5.750%(d)(e)(g)(h) | | | — | |
| | | | | | | | |
| | | | Food & Beverage — 0.4% | |
| | 42,272 | | | Bunge Ltd., 4.875% | | | 4,598,518 | |
| | | | | | | | |
| | | | Healthcare — 0.3% | |
| | 29,421 | | | Boston Scientific Corp., Series A, 5.500% | | | 3,223,659 | |
| | | | | | | | |
| | | | Midstream — 0.0% | |
| | 2,329 | | | El Paso Energy Capital Trust I, 4.750% | | | 120,549 | |
| | | | | | | | |
| | | | Total Convertible Preferred Stocks
(Identified Cost $13,447,269) | | | 13,636,127 | |
| | | | | | | | |
| | | | | | | | |
| | Non-Convertible Preferred Stocks — 0.3% | |
| | | | Cable Satellite — 0.3% | |
| | 4,040,000 | | | NBCUniversal Enterprise, Inc., 5.250%, 144A(a) (Identified Cost $4,040,000) | | | 4,120,800 | |
| | | | | | | | |
| | | | Total Preferred Stocks
(Identified Cost $17,487,269) | | | 17,756,927 | |
| | | | | | | | |
| | | | | | | | |
Principal
Amount (‡) | | | | | | |
| | Other Investments — 0.1% | |
| | | | Aircraft ABS — 0.1% | |
| $ | 900 | | | ECAF I Blocker Ltd.(d)(e)(f)(g)
(Identified Cost $9,000,000) | | | 1,130,400 | |
| | | | | | | | |
| | Short-Term Investments — 16.0% | |
| 56,101,944 | | | Tri-Party Repurchase Agreement with Fixed Income Clearing Corporation, dated 12/31/2020 at 0.000% to be repurchased at $56,101,944 on 1/04/2021 collateralized by $55,014,900 U.S. Treasury Note 2.125% due 12/31/2022 valued at $57,224,079 including accrued interest (Note 2 of Notes to Financial Statements) | | | 56,101,944 | |
| | 25,330,000 | | | U.S. Treasury Bills, 0.094% - 0.129%, 10/07/2021(a)(k)(l) | | | 25,312,522 | |
| | 12,670,000 | | | U.S. Treasury Bills, 0.105% - 0.118%, 11/04/2021(k)(l)(m) | | | 12,660,237 | |
| | 24,695,000 | | | U.S. Treasury Bills, 0.113%, 9/09/2021(k) | | | 24,680,284 | |
| | 22,330,000 | | | U.S. Treasury Bills, 0.115%, 6/17/2021(a)(k) | | | 22,321,608 | |
| | 22,800,000 | | | U.S. Treasury Bills, 0.121%, 5/20/2021(k) | | | 22,793,002 | |
| | 22,840,000 | | | U.S. Treasury Bills, 0.135%, 7/15/2021(k) | | | 22,829,798 | |
| | 23,500,000 | | | U.S. Treasury Bills, 0.136%, 8/12/2021(k) | | | 23,487,578 | |
| | | | | | | | |
| | | | Total Short-Term Investments
(Identified Cost $210,153,754) | | | 210,186,973 | |
| | | | | | | | |
| | | | | | | | |
| | | | Total Investments — 97.2%
(Identified Cost $1,255,898,939) | | | 1,277,633,095 | |
| | | | Other assets less liabilities — 2.8% | | | 37,383,254 | |
| | | | | | | | |
| | | | Net Assets — 100.0% | | $ | 1,315,016,349 | |
| | | | | | | | |
| | | | | | | | | | | | | | | | | | | | | | | | |
Written Options — (0.0%) | |
| Description | | Expiration
Date | | | Exercise
Price | | | Shares(††) | | | Notional
Amount | | | Premiums
(Received) | | | Value (†) | |
| Options on Securities — (0.0%) | |
Abbott Laboratories, Call | | | 2/19/2021 | | | | 115.00 | | | | (1,200 | ) | | $ | (131,388 | ) | | $ | (2,193 | ) | | $ | (2,310 | ) |
Accenture PLC, Call | | | 2/19/2021 | | | | 280.00 | | | | (500 | ) | | | (130,605 | ) | | | (1,734 | ) | | | (975 | ) |
Activision Blizzard, Inc., Call | | | 2/19/2021 | | | | 95.00 | | | | (2,700 | ) | | | (250,695 | ) | | | (6,675 | ) | | | (10,058 | ) |
Anthem, Inc., Call | | | 2/19/2021 | | | | 340.00 | | | | (900 | ) | | | (288,981 | ) | | | (3,840 | ) | | | (6,435 | ) |
Applied Materials, Inc., Call | | | 2/19/2021 | | | | 97.50 | | | | (3,500 | ) | | | (302,050 | ) | | | (5,275 | ) | | | (4,270 | ) |
Bank of America Corp., Call | | | 2/19/2021 | | | | 32.00 | | | | (1,900 | ) | | | (57,589 | ) | | | (1,477 | ) | | | (1,453 | ) |
BlackRock, Inc., Call | | | 2/19/2021 | | | | 750.00 | | | | (300 | ) | | | (216,462 | ) | | | (3,900 | ) | | | (4,680 | ) |
Chevron Corp., Call | | | 2/19/2021 | | | | 95.00 | | | | (3,000 | ) | | | (253,350 | ) | | | (6,021 | ) | | | (3,765 | ) |
Cisco Systems, Inc., Call | | | 2/19/2021 | | | | 49.00 | | | | (5,500 | ) | | | (246,125 | ) | | | (2,459 | ) | | | (2,118 | ) |
Comcast Corp., Call | | | 2/19/2021 | | | | 55.00 | | | | (5,400 | ) | | | (282,960 | ) | | | (4,140 | ) | | | (5,508 | ) |
Deere & Co., Call | | | 2/19/2021 | | | | 290.00 | | | | (1,000 | ) | | | (269,050 | ) | | | (5,367 | ) | | | (4,075 | ) |
DR Horton, Inc., Call | | | 2/19/2021 | | | | 82.50 | | | | (3,600 | ) | | | (248,112 | ) | | | (5,877 | ) | | | (2,034 | ) |
Eli Lilly & Co., Call | | | 2/19/2021 | | | | 185.00 | | | | (1,500 | ) | | | (253,260 | ) | | | (4,333 | ) | | | (3,870 | ) |
Fidelity National Information Services, Inc., Call | | | 2/19/2021 | | | | 155.00 | | | | (1,800 | ) | | | (254,628 | ) | | | (2,683 | ) | | | (2,835 | ) |
Fifth Third Bancorp, Call | | | 2/19/2021 | | | | 30.00 | | | | (2,700 | ) | | | (74,439 | ) | | | (1,585 | ) | | | (1,620 | ) |
Global Payments, Inc., Call | | | 2/19/2021 | | | | 210.00 | | | | (100 | ) | | | (21,542 | ) | | | (797 | ) | | | (1,215 | ) |
HCA Healthcare, Inc., Call | | | 2/19/2021 | | | | 180.00 | | | | (1,600 | ) | | | (263,136 | ) | | | (5,387 | ) | | | (4,520 | ) |
HP, Inc., Call | | | 2/19/2021 | | | | 25.00 | | | | (4,800 | ) | | | (118,032 | ) | | | (3,970 | ) | | | (4,560 | ) |
Interpublic Group of Cos., Inc. (The), Call | | | 2/19/2021 | | | | 26.00 | | | | (4,500 | ) | | | (105,840 | ) | | | (1,967 | ) | | | (1,800 | ) |
Intuit, Inc., Call | | | 2/19/2021 | | | | 400.00 | | | | (600 | ) | | | (227,910 | ) | | | (4,609 | ) | | | (4,290 | ) |
Iron Mountain, Inc., Call | | | 2/19/2021 | | | | 32.50 | | | | (8,700 | ) | | | (256,476 | ) | | | (1,979 | ) | | | (1,957 | ) |
Johnson & Johnson, Call | | | 2/19/2021 | | | | 165.00 | | | | (1,200 | ) | | | (188,856 | ) | | | (3,213 | ) | | | (3,678 | ) |
KLA Corp., Call | | | 2/19/2021 | | | | 290.00 | | | | (1,000 | ) | | | (258,910 | ) | | | (5,267 | ) | | | (4,450 | ) |
L Brands, Inc., Call | | | 2/19/2021 | | | | 45.00 | | | | (1,800 | ) | | | (66,942 | ) | | | (2,479 | ) | | | (1,386 | ) |
Lam Research Corp., Call | | | 2/19/2021 | | | | 550.00 | | | | (500 | ) | | | (236,135 | ) | | | (4,983 | ) | | | (2,950 | ) |
Lockheed Martin Corp., Call | | | 2/19/2021 | | | | 375.00 | | | | (500 | ) | | | (177,490 | ) | | | (3,034 | ) | | | (2,650 | ) |
Masco Corp., Call | | | 2/19/2021 | | | | 60.00 | | | | (4,900 | ) | | | (269,157 | ) | | | (5,033 | ) | | | (3,308 | ) |
MasterCard, Inc., Call | | | 2/19/2021 | | | | 370.00 | | | | (500 | ) | | | (178,470 | ) | | | (2,359 | ) | | | (5,250 | ) |
Merck & Co., Inc., Call | | | 2/19/2021 | | | | 85.00 | | | | (1,800 | ) | | | (147,240 | ) | | | (1,687 | ) | | | (2,655 | ) |
MetLife, Inc., Call | | | 2/19/2021 | | | | 50.00 | | | | (4,200 | ) | | | (197,190 | ) | | | (3,143 | ) | | | (4,032 | ) |
See accompanying notes to financial statements.
59 |
Portfolio of Investments – as of December 31, 2020
Loomis Sayles Strategic Alpha Fund – (continued)
| | | | | | | | | | | | | | | | | | | | | | | | |
Written Options — continued | |
| Description | | Expiration
Date | | | Exercise
Price | | | Shares(††) | | | Notional
Amount | | | Premiums
(Received) | | | Value (†) | |
| Options on Securities — continued | |
Microsoft Corp., Call | | | 2/19/2021 | | | | 240.00 | | | | (1,000 | ) | | $ | (222,420 | ) | | $ | (4,667 | ) | | $ | (3,025 | ) |
Morgan Stanley, Call | | | 2/19/2021 | | | | 72.50 | | | | (2,400 | ) | | | (164,472 | ) | | | (4,649 | ) | | | (4,224 | ) |
Newmont Corp., Call | | | 2/19/2021 | | | | 70.00 | | | | (4,400 | ) | | | (263,516 | ) | | | (4,167 | ) | | | (2,398 | ) |
Nexstar Media Group, Inc., Call | | | 2/19/2021 | | | | 115.00 | | | | (2,200 | ) | | | (240,218 | ) | | | (2,810 | ) | | | (7,260 | ) |
NIKE, Inc., Call | | | 2/19/2021 | | | | 155.00 | | | | (1,300 | ) | | | (183,911 | ) | | | (3,655 | ) | | | (1,449 | ) |
NortonLifeLock, Inc., Call | | | 2/19/2021 | | | | 24.00 | | | | (9,400 | ) | | | (195,332 | ) | | | (4,297 | ) | | | (2,867 | ) |
NVIDIA Corp., Call | | | 2/19/2021 | | | | 620.00 | | | | (500 | ) | | | (261,100 | ) | | | (4,808 | ) | | | (2,663 | ) |
Oracle Corp., Call | | | 2/19/2021 | | | | 70.00 | | | | (3,000 | ) | | | (194,070 | ) | | | (2,571 | ) | | | (1,500 | ) |
Philip Morris International, Inc., Call | | | 2/19/2021 | | | | 90.00 | | | | (2,300 | ) | | | (190,417 | ) | | | (2,132 | ) | | | (1,587 | ) |
QUALCOMM, Inc., Call | | | 2/19/2021 | | | | 175.00 | | | | (1,300 | ) | | | (198,042 | ) | | | (2,324 | ) | | | (2,795 | ) |
Target Corp., Call | | | 2/19/2021 | | | | 185.00 | | | | (1,000 | ) | | | (176,530 | ) | | | (2,947 | ) | | | (3,575 | ) |
Teradyne, Inc., Call | | | 2/19/2021 | | | | 140.00 | | | | (1,000 | ) | | | (119,890 | ) | | | (1,954 | ) | | | (1,850 | ) |
Texas Instruments, Inc., Call | | | 2/19/2021 | | | | 180.00 | | | | (1,200 | ) | | | (196,956 | ) | | | (2,049 | ) | | | (2,178 | ) |
Thermo Fisher Scientific, Inc., Call | | | 2/19/2021 | | | | 490.00 | | | | (400 | ) | | | (186,312 | ) | | | (4,827 | ) | | | (4,040 | ) |
Union Pacific Corp., Call | | | 2/19/2021 | | | | 220.00 | | | | (1,000 | ) | | | (208,220 | ) | | | (3,238 | ) | | | (4,025 | ) |
United Parcel Service, Inc., Call | | | 2/19/2021 | | | | 195.00 | | | | (1,200 | ) | | | (202,080 | ) | | | (3,560 | ) | | | (1,476 | ) |
UnitedHealth Group, Inc., Call | | | 2/19/2021 | | | | 360.00 | | | | (600 | ) | | | (210,408 | ) | | | (3,520 | ) | | | (6,720 | ) |
Walmart, Inc., Call | | | 2/19/2021 | | | | 160.00 | | | | (1,300 | ) | | | (187,395 | ) | | | (2,492 | ) | | | (1,462 | ) |
| | | | | | | | | | | | | | | | | | | | | | | | |
Total | | | | | | | | | | | | | | | | | | $ | (168,133 | ) | | $ | (159,801 | ) |
| | | | | | | | | | | | | | | | | | | | | | | | |
| | | | | | | | | | | | | | |
| | (‡) | | | Principal Amount/Par Value stated in U.S. dollars unless otherwise noted. |
| | (†) | | | See Note 2 of Notes to Financial Statements. |
| | (††) | | | Options on securities are expressed as shares. |
| | (a) | | | Security (or a portion thereof) has been designated to cover the Fund’s obligations under open derivative contracts. |
| | (b) | | | Variable rate security. Rate as of December 31, 2020 is disclosed. |
| | (c) | | | Variable rate security. The interest rate adjusts periodically based on; (i) changes in current interest rates and/or prepayments on underlying pools of assets, if applicable, (ii) reference to a base lending rate plus or minus a margin, and/or (iii) reference to a base lending rate adjusted by a multiplier and/or subject to certain floors or caps. Rate as of December 31, 2020 is disclosed. |
| | (d) | | | Level 3 security. Value has been determined using significant unobservable inputs. See Note 3 of Notes to Financial Statements. |
| | (e) | | | Illiquid security. (Unaudited) |
| | (f) | | | Securities subject to restriction on resale. At December 31, 2020, the restricted securities held by the Fund are as follows: |
| | | | | | | | | | | | | | | | |
| | | Acquisition
Date | | | Cost | | | Value | | | % of Net
Assets | |
ECAF I Blocker Ltd. | | | 6/18/2015 | | | $ | 9,000,000 | | | $ | 1,130,400 | | | | 0.1 | % |
GCA2014 Holdings Ltd., Series 2014-1, Class C | | | 12/18/2014 | | | | 2,272,583 | | | | 765,157 | | | | 0.1 | % |
GCA2014 Holdings Ltd., Series 2014-1, Class D | | | 12/18/2014 | | | | 1,027,860 | | | | 138,946 | | | | Less than 0.1 | % |
GCA2014 Holdings Ltd., Series 2014-1, Class E | | | 12/18/2014 | | | | 2,657,606 | | | | — | | | | — | |
| | | | |
| | (g) | | | Fair valued by the Fund’s adviser. At December 31, 2020, the value of these securities amounted to $7,357,855 or 0.6% of net assets. See Note 2 of Notes to Financial Statements. |
| | (h) | | | Non-income producing security. |
| | (i) | | | Securities classified as fair valued pursuant to the Fund’s pricing policies and procedures. At December 31, 2020, the value of these securities amounted to $7,222,747 or 0.5% of net assets. See Note 2 of Notes to Financial Statements. |
| | (j) | | | Position is unsettled. Contract rate was not determined at December 31, 2020 and does not take effect until settlement date. Maturity date is not finalized until settlement date. |
| | (k) | | | Interest rate represents discount rate at time of purchase; not a coupon rate. |
| | (l) | | | The Fund’s investment in U.S. Government/Agency securities is comprised of various lots with differing discount rates. These separate investments, which have the same maturity date, have been aggregated for the purpose of presentation in the Portfolio of Investments. |
| | (m) | | | Security (or a portion thereof) has been pledged as collateral for open derivative contracts. |
| | | | |
| | 144A | | | All or a portion of these securities are exempt from registration under Rule 144A of the Securities Act of 1933. These securities may be resold in transactions exempt from registration, normally to qualified institutional buyers. At December 31, 2020, the value of Rule 144A holdings amounted to $612,228,021 or 46.6% of net assets. |
| | ABS | | | Asset-Backed Securities |
| | ADR | | | An American Depositary Receipt is a certificate issued by a custodian bank representing the right to receive securities of the foreign issuer described. The values of ADRs may be significantly influenced by trading on exchanges not located in the United States. |
| | ARS | | | Auction Rate Security |
| | EMTN | | | Euro Medium Term Note |
| | EURIBOR | | | Euro Interbank Offered Rate |
| | JIBAR | | | Johannesburg Interbank Agreed Rate |
| | LIBOR | | | London Interbank Offered Rate |
| | MTN | | | Medium Term Note |
| | REITs | | | Real Estate Investment Trusts |
| | SAFEX | | | South African Futures Exchange |
| | SLM | | | Sallie Mae |
| | ARS | | | Argentine Peso |
| | CAD | | | Canadian Dollar |
| | COP | | | Colombian Peso |
| | EUR | | | Euro |
| | GBP | | | British Pound |
| | ZAR | | | South African Rand |
See accompanying notes to financial statements.
| 60
Portfolio of Investments – as of December 31, 2020
Loomis Sayles Strategic Alpha Fund – (continued)
At December 31, 2020, the Fund had the following open bilateral credit default swap agreements:
Buy Protection
| | | | | | | | | | | | | | | | | | | | | | | | | | |
| Counterparty | | Reference Obligation | | (Pay)/
Receive
Fixed Rate1 | | | Expiration
Date | | | Notional
Value(‡) | | | Unamortized
Up Front
Premium
Paid/(Received) | | | Market Value | | | Unrealized
Appreciation
(Depreciation) | |
Barclays Bank PLC | | United Mexican States | | | (1.00 | %) | | | 12/20/2025 | | | | 21,525,000 | | | $ | 320,410 | | | $ | (205,829 | ) | | $ | (526,239 | ) |
| | | | | | | | | | | | | | | | | | | | | | | | | | |
At December 31, 2020, the Fund had the following open centrally cleared interest rate swap agreements:
| | | | | | | | | | | | | | | | | | | | | | | | |
Notional
Value | | Currency | | | Expiration Date | | | Fund Pays1 | | | Fund Receives1 | | | Market Value | | | Unrealized
Appreciation
(Depreciation)2 | |
330,000,000 | | | ZAR | | | | 5/07/2030 | | | | 7.580 | % | | | 3-month SAFEX-JIBAR | | | $ | (2,049,100 | ) | | $ | (2,050,576 | ) |
| | | | | | | | | | | | | | | | | | | | | | | | |
At December 31, 2020, the Fund had the following open centrally cleared credit default swap agreements:
Sell Protection
| | | | | | | | | | | | | | | | | | | | | | | | | | | | |
| Reference Obligation | | (Pay)/Receive
Fixed Rate | | | Expiration
Date | | | Implied Credit
Spread^ | | | Notional
Value(‡) | | | Unamortized
Up Front
Premium
Paid/(Received) | | | Market
Value | | | Unrealized
Appreciation
(Depreciation) | |
CDX.NA HY* Series 35 500, 5-Year | | | 5.00 | % | | | 12/20/2025 | | | | 2.94 | % | | | 86,880,000 | | | $ | 3,427,889 | | | $ | 8,223,433 | | | $ | 4,795,544 | |
| | | | | | | | | | | | | | | | | | | | | | | | | | | | |
| (‡) | Notional value stated in U.S. dollars unless otherwise noted. |
| 1 | Payments are made quarterly. |
| 2 | Differences between unrealized appreciation (depreciation) and market value, if any, are due to interest booked as part of the initial trades. |
| ^ | Implied credit spreads, represented in absolute terms, serve as an indicator of the current status of the payment/performance risk and represent the likelihood or risk of default for the credit derivative. The implied credit spread of a particular reference entity reflects the cost of buying/selling protection and may include upfront payments required to be made to enter into the agreement. Wider credit spreads represent a deterioration of the reference entity’s credit soundness and a greater likelihood or risk of default or other credit event occurring as defined under the terms of the agreement. |
| * | CDX.NA.HY is an index composed of North American high yield credit default swaps. |
At December 31, 2020, the Fund had the following open forward foreign currency contracts:
| | | | | | | | | | | | | | | | | | | | | | | | | | |
| Counterparty | | Delivery
Date | | | Currency
Bought/
Sold (B/S) | | Units of Currency | | | In Exchange
for | | | Notional
Value | | | Unrealized
Appreciation
(Depreciation) | |
Bank of America, N.A. | | | 1/25/2021 | | | CAD | | | S | | | | 3,020,000 | | | $ | 2,305,822 | | | $ | 2,372,755 | | | $ | (66,933 | ) |
Bank of America, N.A. | | | 1/25/2021 | | | EUR | | | S | | | | 1,665,000 | | | | 1,982,118 | | | | 2,035,059 | | | | (52,941 | ) |
Barclays Bank PLC | | | 1/25/2021 | | | EUR | | | S | | | | 1,955,000 | | | | 2,327,838 | | | | 2,389,513 | | | | (61,675 | ) |
Deutsche Bank AG | | | 1/29/2021 | | | GBP | | | S | | | | 1,400,000 | | | | 1,817,368 | | | | 1,914,873 | | | | (97,505 | ) |
HSBC Bank USA | | | 2/16/2021 | | | EUR | | | S | | | | 590,000 | | | | 695,334 | | | | 721,484 | | | | (26,150 | ) |
Morgan Stanley Capital Services, Inc. | | | 1/08/2021 | | | COP | | | B | | | | 4,872,711,000 | | | | 1,275,578 | | | | 1,426,646 | | | | 151,068 | |
Morgan Stanley Capital Services, Inc. | | | 1/08/2021 | | | COP | | | S | | | | 10,059,585,000 | | | | 2,606,920 | | | | 2,945,274 | | | | (338,354 | ) |
Morgan Stanley Capital Services, Inc. | | | 1/29/2021 | | | EUR | | | S | | | | 1,480,000 | | | | 1,815,057 | | | | 1,809,104 | | | | 5,953 | |
Morgan Stanley Capital Services, Inc. | | | 1/29/2021 | | | ZAR | | | S | | | | 315,790,000 | | | | 19,100,355 | | | | 21,416,247 | | | | (2,315,892 | ) |
Standard Chartered Bank | | | 1/04/2021 | | | EUR | | | B | | | | 5,280,000 | | | | 6,490,440 | | | | 6,450,312 | | | | (40,128 | ) |
Standard Chartered Bank | | | 1/04/2021 | | | EUR | | | S | | | | 5,280,000 | | | | 6,191,201 | | | | 6,450,312 | | | | (259,111 | ) |
Standard Chartered Bank | | | 4/06/2021 | | | EUR | | | S | | | | 5,280,000 | | | | 6,503,772 | | | | 6,463,671 | | | | 40,101 | |
| | | | | | | | | | | | | | | | | | | | | | | | | | |
Total | | | $ | (3,061,567 | ) |
| | | | | |
See accompanying notes to financial statements.
61 |
Portfolio of Investments – as of December 31, 2020
Loomis Sayles Strategic Alpha Fund – (continued)
At December 31, 2020, open short futures contracts were as follows:
| | | | | | | | | | | | | | | | | | | | |
| Financial Futures | | Expiration
Date | | | Contracts | | | Notional
Amount | | | Value | | | Unrealized
Appreciation
(Depreciation) | |
Ultra Long U.S. Treasury Bond | | | 3/22/2021 | | | | 182 | | | $ | 38,845,941 | | | $ | 38,868,375 | | | $ | (22,434 | ) |
| | | | | | | | | | | | | | | | | | | | |
Industry Summary at December 31, 2020
| | | | |
ABS Home Equity | | | 6.9 | % |
ABS Car Loan | | | 5.5 | |
ABS Other | | | 4.9 | |
Technology | | | 4.4 | |
Finance Companies | | | 4.2 | |
Non-Agency Commercial Mortgage-Backed Securities | | | 3.4 | |
Cable Satellite | | | 3.4 | |
Aerospace & Defense | | | 3.1 | |
Banking | | | 2.9 | |
Consumer Cyclical Services | | | 2.6 | |
Pharmaceuticals | | | 2.5 | |
Electric | | | 2.1 | |
Automotive | | | 2.0 | |
Other Investments, less than 2% each | | | 28.0 | |
Short-Term Investments | | | 16.0 | |
Collateralized Loan Obligations | | | 5.3 | |
| | | | |
Total Investments | | | 97.2 | |
Other assets less liabilities (including open written options, swap agreements, forward foreign currency and futures contracts) | | | 2.8 | |
| | | | |
Net Assets | | | 100.0 | % |
| | | | |
See accompanying notes to financial statements.
| 62
Portfolio of Investments – as of December 31, 2020
Loomis Sayles Strategic Income Fund
| | | | | | | | |
Principal
Amount (‡) | | | Description | | Value (†) | |
| | Bonds and Notes — 67.2% of Net Assets | |
| | Non-Convertible Bonds — 61.4% | |
| | | | ABS Home Equity — 0.1% | |
| $ | 8,377,805 | | | Legacy Mortgage Asset Trust, Series 2018-GS2, Class A1, 4.000%, 4/25/2058, 144A(a) | | $ | 8,432,129 | |
| | | | | | | | |
| | | | ABS Other — 0.2% | |
| | 23,436,010 | | | GCA2014 Holdings Ltd., Series 2014-1, Class C, 6.000%, 1/05/2030, 144A(b)(c)(d)(e) | | | 7,909,888 | |
| | 10,635,332 | | | GCA2014 Holdings Ltd., Series 2014-1, Class D, 7.500%, 1/05/2030, 144A(b)(c)(d)(e) | | | 1,437,684 | |
| | 42,000,000 | | | GCA2014 Holdings Ltd., Series 2014-1, Class E, Zero Coupon, 1/05/2030, 144A(b)(c)(d)(e)(f) | | | — | |
| | 5,623,618 | | | Global Container Assets Ltd., Series 2015-1A, Class B, 4.500%, 2/05/2030, 144A(b)(c)(g) | | | 4,870,390 | |
| | | | | | | | |
| | | | | | | 14,217,962 | |
| | | | | | | | |
| | | | Aerospace & Defense — 3.6% | |
| | 90,000 | | | Boeing Co. (The), 3.100%, 5/01/2026 | | | 96,372 | |
| | 380,000 | | | Boeing Co. (The), 3.250%, 2/01/2035 | | | 389,692 | |
| | 2,505,000 | | | Boeing Co. (The), 3.550%, 3/01/2038 | | | 2,555,581 | |
| | 3,280,000 | | | Boeing Co. (The), 3.600%, 5/01/2034 | | | 3,453,648 | |
| | 14,845,000 | | | Boeing Co. (The), 3.625%, 2/01/2031 | | | 16,246,087 | |
| | 1,995,000 | | | Boeing Co. (The), 3.625%, 3/01/2048 | | | 2,011,466 | |
| | 1,985,000 | | | Boeing Co. (The), 3.650%, 3/01/2047 | | | 2,009,293 | |
| | 1,385,000 | | | Boeing Co. (The), 3.750%, 2/01/2050 | | | 1,448,433 | |
| | 415,000 | | | Boeing Co. (The), 3.850%, 11/01/2048 | | | 428,056 | |
| | 12,949,000 | | | Boeing Co. (The), 3.950%, 8/01/2059 | | | 13,858,759 | |
| | 4,755,000 | | | Boeing Co. (The), 5.150%, 5/01/2030 | | | 5,754,746 | |
| | 30,413,000 | | | Boeing Co. (The), 5.805%, 5/01/2050 | | | 41,913,525 | |
| | 14,314,000 | | | Boeing Co. (The), 5.930%, 5/01/2060 | | | 20,305,753 | |
| | 2,535,000 | | | Bombardier, Inc., 7.450%, 5/01/2034, 144A | | | 2,217,187 | |
| | 3,145,000 | | | Embraer Netherlands Finance BV, 5.400%, 2/01/2027 | | | 3,341,594 | |
| | 9,576,000 | | | Leonardo U.S. Holdings, Inc., 6.250%, 1/15/2040, 144A | | | 11,345,836 | |
| | 8,815,000 | | | Leonardo U.S. Holdings, Inc., 7.375%, 7/15/2039, 144A | | | 11,395,503 | |
| | 5,310,000 | | | Textron Financial Corp., 3-month LIBOR + 1.735%, 1.956%, 2/15/2067, 144A(h) | | | 3,900,514 | |
| | 6,485,000 | | | TransDigm, Inc., 5.500%, 11/15/2027 | | | 6,817,681 | |
| | 24,513,000 | | | TransDigm, Inc., 6.500%, 7/15/2024 | | | 24,947,370 | |
| | 17,765,000 | | | TransDigm, Inc., 6.500%, 5/15/2025 | | | 18,253,537 | |
| | 370,000 | | | TransDigm, Inc., 7.500%, 3/15/2027 | | | 394,975 | |
| | 19,475,000 | | | TransDigm, Inc., 8.000%, 12/15/2025, 144A | | | 21,525,717 | |
| | | | | | | | |
| | | | | | | 214,611,325 | |
| | | | | | | | |
| | | | Airlines — 1.6% | |
| | 17,495,000 | | | Air Canada Pass Through Trust, Series 2020-2A, 5.250%, 10/01/2030, 144A | | | 18,527,030 | |
| | 240,000 | | | American Airlines Group, Inc., 3.750%, 3/01/2025, 144A | | | 185,587 | |
| | 20,000,000 | | | American Airlines Group, Inc., 5.000%, 6/01/2022, 144A | | | 17,980,200 | |
| | 1,506,441 | | | American Airlines Pass Through Certificates, Series 2016-3, Class B, 3.750%, 4/15/2027 | | | 1,211,962 | |
| | 872,770 | | | American Airlines Pass Through Certificates, Series 2017-2, Class B, 3.700%, 4/15/2027 | | | 737,848 | |
| | 146,817 | | | Continental Airlines Pass Through Certificates, Series 2001-1, Class A-1, 6.703%, 12/15/2022 | | | 146,817 | |
| | 26,975,000 | | | Mileage Plus Holdings LLC/Mileage Plus Intellectual Property Assets Ltd., 6.500%, 6/20/2027, 144A | | | 28,998,125 | |
| | | | Airlines — continued | |
| 120,264 | | | Northwest Airlines Pass Through Trust, Series 2002-1, Class G2, (MBIA Insured), 6.264%, 5/20/2023 | | | 121,614 | |
| | 25,085,000 | | | United Airlines Pass Through Trust, Series 2020-1, Class A, 5.875%, 4/15/2029 | | | 27,063,705 | |
| | | | | | | | |
| | | | | | | 94,972,888 | |
| | | | | | | | |
| | | | Automotive — 3.1% | |
| | 1,210,000 | | | Allison Transmission, Inc., 4.750%, 10/01/2027, 144A | | | 1,273,525 | |
| | 46,535,000 | | | Ford Motor Co., 4.750%, 1/15/2043 | | | 47,465,700 | |
| | 10,745,000 | | | Ford Motor Co., 5.291%, 12/08/2046 | | | 11,228,525 | |
| | 1,220,000 | | | Ford Motor Co., 6.625%, 2/15/2028 | | | 1,379,381 | |
| | 1,345,000 | | | Ford Motor Co., 7.500%, 8/01/2026 | | | 1,565,567 | |
| | 1,500,000 | | | Ford Motor Credit Co. LLC, 5.113%, 5/03/2029 | | | 1,670,550 | |
| | 5,000,000 | | | Ford Motor Credit Co. LLC, 5.125%, 6/16/2025 | | | 5,436,500 | |
| | 18,565,000 | | | Ford Motor Credit Co. LLC, 5.596%, 1/07/2022 | | | 19,190,269 | |
| | 2,845,000 | | | General Motors Co., 5.200%, 4/01/2045 | | | 3,455,044 | |
| | 2,120,000 | | | General Motors Co., 6.250%, 10/02/2043 | | | 2,859,815 | |
| | 62,220,000 | | | General Motors Financial Co., Inc., 3.600%, 6/21/2030 | | | 69,374,286 | |
| | 11,130,000 | | | Goodyear Tire & Rubber Co. (The), 4.875%, 3/15/2027 | | | 11,380,425 | |
| | 1,585,000 | | | Goodyear Tire & Rubber Co. (The), 5.000%, 5/31/2026 | | | 1,612,737 | |
| | 4,977,000 | | | Goodyear Tire & Rubber Co. (The), 7.000%, 3/15/2028 | | | 5,400,692 | |
| | | | | | | | |
| | | | | | | 183,293,016 | |
| | | | | | | | |
| | | | Banking — 5.1% | |
| | 6,000,000 | | | Ally Financial, Inc., 8.000%, 11/01/2031 | | | 8,807,220 | |
| | 11,000,000 | | | Banco Santander Mexico S.A. Institucion de Banca Multiple Grupo Financiero Santander, 5.375%, 4/17/2025, 144A | | | 12,637,460 | |
| | 9,275,000 | | | Bank of America Corp., (fixed rate to 10/24/2030, variable rate thereafter), MTN, 1.922%, 10/24/2031 | | | 9,397,621 | |
| | 983,000 | | | Bank of America Corp., (fixed rate to 12/20/2027, variable rate thereafter), 3.419%, 12/20/2028 | | | 1,110,342 | |
| | 8,355,000 | | | Bank of America Corp., (fixed rate to 4/29/2030, variable rate thereafter), 2.592%, 4/29/2031 | | | 8,954,541 | |
| | 5,895,000 | | | Bank of America Corp., (fixed rate to 7/23/2030, variable rate thereafter), MTN, 1.898%, 7/23/2031 | | | 5,955,961 | |
| | 265,000 | | | Bank of America Corp., MTN, 4.250%, 10/22/2026 | | | 310,836 | |
| | 7,045,000 | | | Bank of America Corp., Series L, MTN, 4.183%, 11/25/2027 | | | 8,172,804 | |
| | 31,380,000 | | | Barclays PLC, (fixed rate to 9/23/2030, variable rate thereafter), 3.564%, 9/23/2035 | | | 34,001,485 | |
| | 9,462,000 | | | BNP Paribas S.A., (fixed rate to 8/12/2030, variable rate thereafter), 2.588%, 8/12/2035, 144A | | | 9,646,509 | |
| | 26,680,000 | | | Citigroup, Inc., (fixed rate to 3/31/2030, variable rate thereafter), 4.412%, 3/31/2031 | | | 32,353,691 | |
| | 1,965,000 | | | Citigroup, Inc., (fixed rate to 6/03/2030, variable rate thereafter), 2.572%, 6/03/2031 | | | 2,094,415 | |
| | 3,450,000 | | | Cooperatieve Rabobank UA, 3.950%, 11/09/2022 | | | 3,662,661 | |
| | 1,995,000 | | | Credit Agricole S.A., 3.250%, 1/14/2030, 144A | | | 2,185,323 | |
| | 1,709,000 | | | Deutsche Bank AG, (fixed rate to 12/01/2027, variable rate thereafter), 4.875%, 12/01/2032 | | | 1,788,298 | |
See accompanying notes to financial statements.
63 |
Portfolio of Investments – as of December 31, 2020
Loomis Sayles Strategic Income Fund – (continued)
| | | | | | | | |
Principal
Amount (‡) | | | Description | | Value (†) | |
| | | | Banking — continued | |
| $ | 19,245,000 | | | Intesa Sanpaolo SpA, 5.017%, 6/26/2024, 144A | | $ | 21,055,530 | |
| | 5,531,000 | | | JPMorgan Chase & Co., (fixed rate to 10/15/2029, variable rate thereafter), 2.739%, 10/15/2030 | | | 6,014,038 | |
| | 18,750,000 | | | JPMorgan Chase & Co., (fixed rate to 11/19/2030, variable rate thereafter), 1.764%, 11/19/2031 | | | 18,927,875 | |
| | 30,335,000 | | | Morgan Stanley, (fixed rate to 2/13/2031, variable rate thereafter), MTN, 1.794%, 2/13/2032 | | | 30,551,898 | |
| | 36,195,000 | | | Morgan Stanley, GMTN, 4.350%, 9/08/2026 | | | 42,673,480 | |
| | 10,000,000 | | | Morgan Stanley, MTN, 6.250%, 8/09/2026 | | | 12,759,009 | |
| | 14,965,000 | | | Natwest Group PLC, (fixed rate to 8/28/2030, variable rate thereafter), 3.032%, 11/28/2035 | | | 15,458,396 | |
| | 13,520,000 | | | UniCredit SpA, (fixed rate to 6/30/2030, variable rate thereafter), 5.459%, 6/30/2035, 144A | | | 14,876,564 | |
| | | | | | | | |
| | | | | | | 303,395,957 | |
| | | | | | | | |
| | | | Brokerage — 0.8% | |
| | 14,755,000 | | | Jefferies Group LLC, 6.250%, 1/15/2036 | | | 19,678,238 | |
| | 15,215,000 | | | Jefferies Group LLC, 6.450%, 6/08/2027 | | | 19,288,647 | |
| | 7,155,000 | | | Owl Rock Technology Finance Corp., 4.750%, 12/15/2025, 144A | | | 7,471,572 | |
| | | | | | | | |
| | | | | | | 46,438,457 | |
| | | | | | | | |
| | | | Building Materials — 0.9% | |
| | 5,565,000 | | | American Woodmark Corp., 4.875%, 3/15/2026, 144A | | | 5,704,125 | |
| | 2,395,000 | | | Cemex SAB de CV, 5.200%, 9/17/2030, 144A | | | 2,626,118 | |
| | 19,041,000 | | | Cemex SAB de CV, 5.700%, 1/11/2025, 144A | | | 19,459,902 | |
| | 3,255,000 | | | JELD-WEN, Inc., 4.875%, 12/15/2027, 144A | | | 3,442,162 | |
| | 1,859,000 | | | Masco Corp., 6.500%, 8/15/2032 | | | 2,482,086 | |
| | 1,226,000 | | | Masco Corp., 7.750%, 8/01/2029 | | | 1,704,210 | |
| | 10,800,000 | | | Owens Corning, 7.000%, 12/01/2036 | | | 15,398,139 | |
| | | | | | | | |
| | | | | | | 50,816,742 | |
| | | | | | | | |
| | | | Cable Satellite — 2.0% | |
| | 4,360,000 | | | CCO Holdings LLC/CCO Holdings Capital Corp., 5.875%, 5/01/2027, 144A | | | 4,528,950 | |
| | 3,905,000 | | | Charter Communications Operating LLC/Charter Communications Operating Capital Corp., 2.800%, 4/01/2031 | | | 4,130,242 | |
| | 47,650,000 | | | Charter Communications Operating LLC/Charter Communications Operating Capital Corp., 3.700%, 4/01/2051 | | | 49,482,369 | |
| | 3,900,000 | | | Charter Communications Operating LLC/Charter Communications Operating Capital Corp., 5.125%, 7/01/2049 | | | 4,760,006 | |
| | 17,880,000 | | | CSC Holdings LLC, 5.375%, 2/01/2028, 144A | | | 19,086,900 | |
| | 17,679,000 | | | DISH DBS Corp., 5.875%, 11/15/2024 | | | 18,537,050 | |
| | 4,865,000 | | | DISH DBS Corp., 7.750%, 7/01/2026 | | | 5,448,849 | |
| | 4,835,000 | | | Time Warner Cable LLC, 4.500%, 9/15/2042 | | | 5,665,638 | |
| | 135,000 | | | Time Warner Cable LLC, 5.875%, 11/15/2040 | | | 180,193 | |
| | 5,530,000 | | | Ziggo BV, 5.500%, 1/15/2027, 144A | | | 5,771,937 | |
| | | | | | | | |
| | | | | | | 117,592,134 | |
| | | | | | | | |
| | | | Chemicals — 0.4% | |
| | 19,810,000 | | | Aruba Investments, Inc., 8.750%, 2/15/2023, 144A | | | 20,008,100 | |
| | 6,275,000 | | | Minerals Technologies, Inc., 5.000%, 7/01/2028, 144A | | | 6,572,058 | |
| | | | | | | | |
| | | | | | | 26,580,158 | |
| | | | | | | | |
| | | | Construction Machinery — 0.0% | |
| 1,310,000 | | | United Rentals North America, Inc., 4.875%, 1/15/2028 | | | 1,395,150 | |
| | | | | | | | |
| | | | Consumer Cyclical Services — 0.7% | |
| | 4,370,000 | | | Expedia Group, Inc., 3.250%, 2/15/2030 | | | 4,548,038 | |
| | 14,115,000 | | | Expedia Group, Inc., 3.800%, 2/15/2028 | | | 15,161,387 | |
| | 5,500,000 | | | ServiceMaster Co. LLC (The), 7.450%, 8/15/2027 | | | 6,400,625 | |
| | 7,180,000 | | | Uber Technologies, Inc., 6.250%, 1/15/2028, 144A | | | 7,808,250 | |
| | 9,375,000 | | | Uber Technologies, Inc., 7.500%, 9/15/2027, 144A | | | 10,312,500 | |
| | | | | | | | |
| | | | | | | 44,230,800 | |
| | | | | | | | |
| | | | Consumer Products — 0.3% | |
| | 11,880,000 | | | Avon Products, Inc., 8.950%, 3/15/2043 | | | 15,533,100 | |
| | 2,405,000 | | | Whirlpool Corp., 4.600%, 5/15/2050 | | | 3,111,914 | |
| | | | | | | | |
| | | | | | | 18,645,014 | |
| | | | | | | | |
| | | | Electric — 1.0% | |
| | 24,386,618 | | | Alta Wind Holdings LLC, 7.000%, 6/30/2035, 144A | | | 28,658,527 | |
| | 835,000 | | | Edison International, 4.950%, 4/15/2025 | | | 950,459 | |
| | 3,570,000 | | | Empresa Nacional de Electricidad S.A., 7.875%, 2/01/2027 | | | 4,241,155 | |
| | 4,365,000 | | | Pacific Gas & Electric Co., 3.500%, 8/01/2050 | | | 4,338,422 | |
| | 5,515,000 | | | Pacific Gas & Electric Co., 4.250%, 3/15/2046 | | | 5,920,592 | |
| | 7,435,000 | | | Pacific Gas & Electric Co., 4.300%, 3/15/2045 | | | 7,926,903 | |
| | 7,860,000 | | | Pacific Gas & Electric Co., 4.750%, 2/15/2044 | | | 8,830,822 | |
| | | | | | | | |
| | | | | | | 60,866,880 | |
| | | | | | | | |
| | | | Finance Companies — 6.4% | |
| | 4,665,000 | | | Air Lease Corp., 3.125%, 12/01/2030 | | | 4,856,169 | |
| | 1,020,000 | | | Antares Holdings LP, 6.000%, 8/15/2023, 144A | | | 1,040,219 | |
| | 20,000,000 | | | Antares Holdings LP, 8.500%, 5/18/2025, 144A | | | 21,559,852 | |
| | 40,505,000 | | | GE Capital Funding LLC, 4.550%, 5/15/2032, 144A | | | 48,610,784 | |
| | 11,150,000 | | | GE Capital International Funding Co. Unlimited Co., 4.418%, 11/15/2035 | | | 13,308,038 | |
| | 135,000 | | | Navient Corp., 5.000%, 3/15/2027 | | | 136,181 | |
| | 22,945,000 | | | Navient Corp., 5.500%, 1/25/2023 | | | 23,977,525 | |
| | 3,030,000 | | | Navient Corp., 5.875%, 10/25/2024 | | | 3,219,375 | |
| | 109,950(††) | | | Navient Corp., 6.000%, 12/15/2043 | | | 2,757,913 | |
| | 950,000 | | | Navient Corp., 6.750%, 6/15/2026 | | | 1,031,938 | |
| | 54,470,000 | | | Navient Corp., MTN, 5.625%, 8/01/2033 | | | 52,291,200 | |
| | 47,984,000 | | | Navient Corp., MTN, 6.125%, 3/25/2024 | | | 51,222,920 | |
| | 6,490,000 | | | Navient Corp., MTN, 7.250%, 1/25/2022 | | | 6,782,050 | |
| | 23,115,000 | | | OneMain Finance Corp., 6.875%, 3/15/2025 | | | 26,842,294 | |
| | 4,075,000 | | | OneMain Finance Corp., 7.125%, 3/15/2026 | | | 4,818,688 | |
| | 26,970,000 | | | OneMain Finance Corp., 7.750%, 10/01/2021 | | | 28,385,925 | |
| | 55,015,000 | | | OneMain Finance Corp., 8.250%, 10/01/2023 | | | 63,129,712 | |
| | 14,750,000 | | | Owl Rock Capital Corp., 4.250%, 1/15/2026 | | | 15,536,596 | |
| | 4,360,000 | | | Quicken Loans LLC, 5.250%, 1/15/2028, 144A | | | 4,654,300 | |
| | 2,455,000 | | | Quicken Loans LLC/Quicken Loans Co-Issuer, Inc., 3.625%, 3/01/2029, 144A | | | 2,504,100 | |
| | 7,325,000 | | | Quicken Loans LLC/Quicken Loans Co-Issuer, Inc., 3.875%, 3/01/2031, 144A | | | 7,599,687 | |
| | | | | | | | |
| | | | | | | 384,265,466 | |
| | | | | | | | |
| | | | Financial Other — 0.3% | |
| | 3,580,000 | | | Icahn Enterprises LP/Icahn Enterprises Finance Corp., 5.250%, 5/15/2027 | | | 3,837,760 | |
| | 11,820,000 | | | Nationstar Mortgage Holdings, Inc., 5.500%, 8/15/2028, 144A | | | 12,411,000 | |
| | | | | | | | |
| | | | | | | 16,248,760 | |
| | | | | | | | |
See accompanying notes to financial statements.
| 64
Portfolio of Investments – as of December 31, 2020
Loomis Sayles Strategic Income Fund – (continued)
| | | | | | | | |
Principal
Amount (‡) | | | Description | | Value (†) | |
| | | | Food & Beverage — 1.0% | |
| $ | 24,865,000 | | | Anheuser-Busch InBev Worldwide, Inc., 4.500%, 6/01/2050 | | $ | 31,386,091 | |
| | 28,650,000 | | | Kraft Heinz Foods Co., 4.375%, 6/01/2046 | | | 30,875,245 | |
| | | | | | | | |
| | | | | | | 62,261,336 | |
| | | | | | | | |
| | | | Gaming — 0.1% | |
| | 5,475,000 | | | International Game Technology PLC, 6.250%, 1/15/2027, 144A | | | 6,269,696 | |
| | | | | | | | |
| | | | Government Owned – No Guarantee — 0.6% | |
| | 6,535,000 | | | Pertamina Persero PT, 6.450%, 5/30/2044, 144A | | | 8,855,474 | |
| | 6,586,000 | | | Petroleos Mexicanos, 6.625%, 6/15/2035 | | | 6,520,140 | |
| | 12,239,000 | | | Petroleos Mexicanos, 6.950%, 1/28/2060 | | | 11,512,615 | |
| | 10,230,000 | | | Saudi Arabian Oil Co., 3.250%, 11/24/2050, 144A | | | 10,373,911 | |
| | | | | | | | |
| | | | | | | 37,262,140 | |
| | | | | | | | |
| | | | Government Sponsored — 0.4% | |
| | 16,800,000 | | | Petrobras Global Finance BV, 6.750%, 6/03/2050 | | | 20,874,000 | |
| | 2,525,000 | | | Petrobras Global Finance BV, 6.900%, 3/19/2049 | | | 3,200,437 | |
| | | | | | | | |
| | | | | | | 24,074,437 | |
| | | | | | | | |
| | | | Healthcare — 2.8% | |
| | 14,620,000 | | | HCA, Inc., 7.050%, 12/01/2027 | | | 17,708,475 | |
| | 24,215,000 | | | HCA, Inc., 7.500%, 11/06/2033 | | | 33,658,850 | |
| | 9,492,000 | | | HCA, Inc., MTN, 7.750%, 7/15/2036 | | | 12,268,410 | |
| | 19,785,000 | | | Tenet Healthcare Corp., 5.125%, 5/01/2025 | | | 20,170,610 | |
| | 19,895,000 | | | Tenet Healthcare Corp., 6.125%, 10/01/2028, 144A | | | 20,730,192 | |
| | 17,240,000 | | | Tenet Healthcare Corp., 6.750%, 6/15/2023 | | | 18,489,900 | |
| | 43,749,000 | | | Tenet Healthcare Corp., 6.875%, 11/15/2031 | | | 46,155,195 | |
| | | | | | | | |
| | | | | | | 169,181,632 | |
| | | | | | | | |
| | | | Home Construction — 1.4% | |
| | 47,260,000 | | | PulteGroup, Inc., 6.000%, 2/15/2035 | | | 64,259,422 | |
| | 13,190,000 | | | PulteGroup, Inc., 6.375%, 5/15/2033 | | | 18,071,619 | |
| | 195,000 | | | TRI Pointe Group, Inc./TRI Pointe Homes, Inc., 5.875%, 6/15/2024 | | | 212,842 | |
| | | | | | | | |
| | | | | | | 82,543,883 | |
| | | | | | | | |
| | | | Independent Energy — 2.4% | |
| | 2,685,000 | | | Aker BP ASA, 3.750%, 1/15/2030, 144A | | | 2,820,078 | |
| | 6,638,000 | | | Ascent Resources Utica Holdings LLC/ARU Finance Corp., 9.000%, 11/01/2027, 144A | | | 7,384,775 | |
| | 8,225,000 | | | Baytex Energy Corp., 5.625%, 6/01/2024, 144A | | | 5,658,142 | |
| | 39,985,000 | | | Chesapeake Energy Corp., 8.000%, 6/15/2027(c)(g)(i) | | | 1,799,325 | |
| | 15,215,000 | | | Continental Resources, Inc., 3.800%, 6/01/2024 | | | 15,711,161 | |
| | 1,091,000 | | | Continental Resources, Inc., 4.500%, 4/15/2023 | | | 1,124,930 | |
| | 2,340,000 | | | Diamondback Energy, Inc., 3.500%, 12/01/2029 | | | 2,499,859 | |
| | 11,535,000 | | | Hess Corp., 5.600%, 2/15/2041 | | | 14,076,823 | |
| | 550,000 | | | Leviathan Bond Ltd., 6.125%, 6/30/2025, 144A | | | 602,366 | |
| | 1,000,000 | | | Leviathan Bond Ltd., 6.500%, 6/30/2027, 144A | | | 1,126,670 | |
| | 7,644,000 | | | MEG Energy Corp., 7.000%, 3/31/2024, 144A | | | 7,720,440 | |
| | 17,908,000 | | | Mesquite Energy, Inc., 6.125%, 1/15/2023(c)(g)(i) | | | 80,228 | |
| | 9,520,000 | | | Mesquite Energy, Inc., 7.750%, 6/15/2021(c)(g)(i) | | | 11,234 | |
| | 540,000 | | | Occidental Petroleum Corp., 4.500%, 7/15/2044 | | | 465,302 | |
| | 32,720,000 | | | Occidental Petroleum Corp., 6.625%, 9/01/2030 | | | 35,525,740 | |
| | 2,390,000 | | | Pan American Energy LLC, 7.875%, 5/07/2021, 144A | | | 2,411,653 | |
| | | | Independent Energy — continued | |
| 4,850,000 | | | Parsley Energy LLC/Parsley Finance Corp., 4.125%, 2/15/2028, 144A | | | 5,092,500 | |
| | 2,055,000 | | | QEP Resources, Inc., 5.250%, 5/01/2023 | | | 2,162,887 | |
| | 14,852,000 | | | SM Energy Co., 10.000%, 1/15/2025, 144A | | | 16,022,932 | |
| | 1,110,000 | | | Southwestern Energy Co., 6.450%, 1/23/2025 | | | 1,154,400 | |
| | 14,955,000 | | | Vine Oil & Gas LP/Vine Oil & Gas Finance Corp., 8.750%, 4/15/2023, 144A(c)(g) | | | 11,814,450 | |
| | 2,530,000 | | | Vine Oil & Gas LP/Vine Oil & Gas Finance Corp., 9.750%, 4/15/2023, 144A(c)(g) | | | 2,024,000 | |
| | 6,145,000 | | | WPX Energy, Inc., 4.500%, 1/15/2030 | | | 6,513,700 | |
| | | | | | | | |
| | | | | | | 143,803,595 | |
| | | | | | | | |
| | | | Industrial Other — 0.0% | |
| | 1,200,000 | | | HTA Group Ltd. Co., 7.000%, 12/18/2025, 144A | | | 1,290,000 | |
| | | | | | | | |
| | | | Life Insurance — 1.4% | |
| | 3,575,000 | | | Brighthouse Financial, Inc., 4.700%, 6/22/2047 | | | 3,733,179 | |
| | 13,830,000 | | | Brighthouse Financial, Inc., 5.625%, 5/15/2030 | | | 17,072,872 | |
| | 15,000,000 | | | Global Atlantic Fin Co., 8.625%, 4/15/2021, 144A | | | 15,252,351 | |
| | 20,000,000 | | | National Life Insurance Co., 10.500%, 9/15/2039, 144A(c)(g) | | | 34,437,000 | |
| | 8,920,000 | | | NLV Financial Corp., 7.500%, 8/15/2033, 144A(c)(g) | | | 12,284,445 | |
| | 2,500,000 | | | Prudential Financial, Inc., MTN, 3.700%, 3/13/2051 | | | 3,005,350 | |
| | | | | | | | |
| | | | | | | 85,785,197 | |
| | | | | | | | |
| | | | Media Entertainment — 0.5% | |
| | 6,785,000 | | | Discovery Communications LLC, 4.000%, 9/15/2055, 144A | | | 7,594,440 | |
| | 4,635,000 | | | iHeartCommunications, Inc., 8.375%, 5/01/2027 | | | 4,947,677 | |
| | 2,475,000 | | | ViacomCBS, Inc., 4.375%, 3/15/2043 | | | 2,924,133 | |
| | 4,469,000 | | | ViacomCBS, Inc., 4.900%, 8/15/2044 | | | 5,573,614 | |
| | 4,600,000 | | | ViacomCBS, Inc., 4.950%, 5/19/2050 | | | 5,958,474 | |
| | | | | | | | |
| | | | | | | 26,998,338 | |
| | | | | | | | |
| | | | Metals & Mining — 1.2% | |
| | 2,795,000 | | | Anglo American Capital PLC, 2.625%, 9/10/2030, 144A | | | 2,922,699 | |
| | 25,271,000 | | | ArcelorMittal S.A., 7.000%, 3/01/2041 | | | 34,825,426 | |
| | 1,970,000 | | | Barrick North America Finance LLC, 5.750%, 5/01/2043 | | | 2,873,321 | |
| | 2,630,000 | | | First Quantum Minerals Ltd., 6.875%, 3/01/2026, 144A | | | 2,741,775 | |
| | 13,616,000 | | | First Quantum Minerals Ltd., 6.875%, 10/15/2027, 144A | | | 14,773,360 | |
| | 1,810,000 | | | First Quantum Minerals Ltd., 7.500%, 4/01/2025, 144A | | | 1,884,662 | |
| | 3,930,000 | | | Glencore Funding LLC, 2.500%, 9/01/2030, 144A | | | 4,016,696 | |
| | 2,730,000 | | | Kaiser Aluminum Corp., 6.500%, 5/01/2025, 144A | | | 2,921,100 | |
| | 7,180,000 | | | United States Steel Corp., 6.650%, 6/01/2037 | | | 6,031,200 | |
| | | | | | | | |
| | | | | | | 72,990,239 | |
| | | | | | | | |
| | | | Midstream — 0.4% | |
| | 13,667,000 | | | NGL Energy Partners LP/NGL Energy Finance Corp., 6.125%, 3/01/2025 | | | 8,661,461 | |
| | 505,000 | | | NGPL PipeCo LLC, 7.768%, 12/15/2037, 144A | | | 682,750 | |
| | 185,000 | | | Plains All American Pipeline LP/PAA Finance Corp., 4.300%, 1/31/2043 | | | 182,021 | |
| | 9,690,000 | | | Plains All American Pipeline LP/PAA Finance Corp., 4.700%, 6/15/2044 | | | 10,047,648 | |
| | 1,180,000 | | | Plains All American Pipeline LP/PAA Finance Corp., 4.900%, 2/15/2045 | | | 1,252,328 | |
See accompanying notes to financial statements.
65 |
Portfolio of Investments – as of December 31, 2020
Loomis Sayles Strategic Income Fund – (continued)
| | | | | | | | |
Principal
Amount (‡) | | | Description | | Value (†) | |
| | | | Midstream — continued | |
| $ | 11,980,000 | | | Summit Midstream Partners LP, Series A, (fixed rate to 12/15/2022, variable rate thereafter), 9.500%(c)(g)(i)(j) | | $ | 3,834,798 | |
| | | | | | | | |
| | | | | | | 24,661,006 | |
| | | | | | | | |
| | | | Oil Field Services — 0.6% | |
| | 2,080,000 | | | Shelf Drilling Holdings Ltd., 8.250%, 2/15/2025, 144A | | | 956,800 | |
| | 2,770,000 | | | Transocean, Inc., 7.500%, 4/15/2031 | | | 962,575 | |
| | 48,755,000 | | | Transocean, Inc., 11.500%, 1/30/2027, 144A | | | 34,859,825 | |
| | | | | | | | |
| | | | | | | 36,779,200 | |
| | | | | | | | |
| | | | Packaging — 0.2% | |
| | 8,750,000 | | | Owens-Brockway Glass Container, Inc., 6.625%, 5/13/2027, 144A | | | 9,471,875 | |
| | | | | | | | |
| | | | Paper — 0.8% | |
| | 15,225,000 | | | Georgia-Pacific LLC, 7.750%, 11/15/2029 | | | 22,522,805 | |
| | 4,865,000 | | | WestRock MWV LLC, 7.950%, 2/15/2031 | | | 6,946,205 | |
| | 8,750,000 | | | WestRock MWV LLC, 8.200%, 1/15/2030 | | | 12,469,479 | |
| | 2,840,000 | | | Weyerhaeuser Co., 6.950%, 10/01/2027 | | | 3,698,149 | |
| | | | | | | | |
| | | | | | | 45,636,638 | |
| | | | | | | | |
| | | | Property & Casualty Insurance — 0.8% | |
| | 12,510,000 | | | MBIA Insurance Corp., 3-month LIBOR + 11.260%, 11.497%, 1/15/2033, 144A(f)(h) | | | 4,378,500 | |
| | 1,500,000 | | | MGIC Investment Corp., 5.250%, 8/15/2028 | | | 1,605,000 | |
| | 14,480,000 | | | Nationwide Mutual Insurance Co., 4.350%, 4/30/2050, 144A | | | 17,009,976 | |
| | 20,810,000 | | | Radian Group, Inc., 6.625%, 3/15/2025 | | | 23,567,325 | |
| | | | | | | | |
| | | | | | | 46,560,801 | |
| | | | | | | | |
| | | | REITs – Diversified — 0.0% | |
| | 665,000 | | | iStar, Inc., 4.750%, 10/01/2024 | | | 673,313 | |
| | | | | | | | |
| | | | REITs – Hotels — 0.2% | |
| | 545,000 | | | Service Properties Trust, 3.950%, 1/15/2028 | | | 526,606 | |
| | 5,965,000 | | | Service Properties Trust, 4.350%, 10/01/2024 | | | 5,890,437 | |
| | 1,690,000 | | | Service Properties Trust, 4.500%, 6/15/2023 | | | 1,698,450 | |
| | 940,000 | | | Service Properties Trust, 4.650%, 3/15/2024 | | | 930,600 | |
| | 915,000 | | | Service Properties Trust, 4.750%, 10/01/2026 | | | 903,563 | |
| | 2,750,000 | | | Service Properties Trust, 4.950%, 2/15/2027 | | | 2,763,750 | |
| | | | | | | | |
| | | | | | | 12,713,406 | |
| | | | | | | | |
| | | | Retailers — 0.4% | |
| | 3,325,000 | | | Dillard’s, Inc., 7.000%, 12/01/2028 | | | 3,558,282 | |
| | 1,500,000 | | | Dillard’s, Inc., 7.750%, 7/15/2026 | | | 1,692,855 | |
| | 1,795,000 | | | Hanesbrands, Inc., 5.375%, 5/15/2025, 144A | | | 1,899,146 | |
| | 6,365,000 | | | Marks & Spencer PLC, 7.125%, 12/01/2037, 144A | | | 7,114,924 | |
| | 6,905,000 | | | Michaels Stores, Inc., 8.000%, 7/15/2027, 144A | | | 7,422,875 | |
| | | | | | | | |
| | | | | | | 21,688,082 | |
| | | | | | | | |
| | | | Sovereigns — 0.3% | |
| | 19,105,000 | | | Mexico Government International Bond, 3.771%, 5/24/2061 | | | 19,968,737 | |
| | | | | | | | |
| | | | Supermarkets — 0.1% | |
| | 1,840,000 | | | Albertson’s Cos. LLC/Safeway, Inc./New Albertson’s LP/Albertson’s LLC, 5.750%, 3/15/2025 | | | 1,895,200 | |
| | 2,290,000 | | | Safeway, Inc., 7.250%, 2/01/2031 | | | 2,681,201 | |
| | | | | | | | |
| | | | | | | 4,576,401 | |
| | | | | | | | |
| | | | Technology — 2.8% | |
| | 5,500,000 | | | Broadcom, Inc., 4.150%, 11/15/2030 | | | 6,367,692 | |
| | 23,110,000 | | | Broadcom, Inc., 4.300%, 11/15/2032 | | | 27,396,652 | |
| | 9,820,000 | | | Broadcom, Inc., 5.000%, 4/15/2030 | | | 11,937,309 | |
| | | | Technology — continued | |
| 15,295,000 | | | CommScope Technologies LLC, 5.000%, 3/15/2027, 144A | | | 15,065,575 | |
| | 23,345,000 | | | Iron Mountain, Inc., 4.875%, 9/15/2029, 144A | | | 24,628,975 | |
| | 9,350,000 | | | Jabil, Inc., 3.600%, 1/15/2030 | | | 10,404,820 | |
| | 8,250,000 | | | Jabil, Inc., 3.950%, 1/12/2028 | | | 9,330,113 | |
| | 15,170,000 | | | KLA Corp., 5.650%, 11/01/2034 | | | 20,454,004 | |
| | 26,380,000 | | | Microchip Technology, Inc., 0.972%, 2/15/2024, 144A | | | 26,444,573 | |
| | 3,145,000 | | | Micron Technology, Inc., 4.663%, 2/15/2030 | | | 3,859,377 | |
| | 3,970,000 | | | Micron Technology, Inc., 4.975%, 2/06/2026 | | | 4,692,355 | |
| | 3,800,000 | | | Micron Technology, Inc., 5.327%, 2/06/2029 | | | 4,753,368 | |
| | 105,000 | | | Samsung Electronics Co. Ltd., 7.700%, 10/01/2027, 144A | | | 127,119 | |
| | 1,829,000 | | | Seagate HDD Cayman, 4.091%, 6/01/2029, 144A | | | 1,958,950 | |
| | 1,688,000 | | | Seagate HDD Cayman, 4.875%, 6/01/2027 | | | 1,899,354 | |
| | | | | | | | |
| | | | | | | 169,320,236 | |
| | | | | | | | |
| | | | Transportation Services — 0.8% | |
| | 10,630,000 | | | Adani Ports & Special Economic Zone Ltd., 4.200%, 8/04/2027, 144A | | | 11,407,942 | |
| | 810,000 | | | Avis Budget Car Rental LLC/Avis Budget Finance, Inc., 5.750%, 7/15/2027, 144A | | | 822,150 | |
| | 10,503,000 | | | Fenix Marine Service Holdings Ltd., 8.000%, 1/15/2024(c)(g) | | | 9,511,517 | |
| | 20,980,000 | | | Penske Truck Leasing Co. LP/PTL Finance Corp., 4.000%, 7/15/2025, 144A | | | 23,791,635 | |
| | | | | | | | |
| | | | | | | 45,533,244 | |
| | | | | | | | |
| | | | Treasuries — 12.7% | |
| | 222,225,000 | | | U.S. Treasury Bond, 1.250%, 5/15/2050 | | | 201,599,742 | |
| | 224,690,000 | | | U.S. Treasury Bond, 1.375%, 8/15/2050 | | | 210,436,228 | |
| | 290,985,000 | | | U.S. Treasury Note, 0.125%, 11/30/2022 | | | 291,019,101 | |
| | 59,525,000 | | | U.S. Treasury Note, 0.125%, 12/31/2022 | | | 59,531,976 | |
| | | | | | | | |
| | | | | | | 762,587,047 | |
| | | | | | | | |
| | | | Wireless — 1.2% | |
| | 1,705,000 | | | American Tower Corp., 1.875%, 10/15/2030 | | | 1,719,870 | |
| | 1,255,000 | | | American Tower Corp., 2.100%, 6/15/2030 | | | 1,288,141 | |
| | 1,965,000 | | | American Tower Corp., 2.950%, 1/15/2051 | | | 1,969,688 | |
| | 7,885,000 | | | American Tower Corp., 3.100%, 6/15/2050 | | | 8,121,766 | |
| | 6,415,000 | | | Crown Castle International Corp., 2.250%, 1/15/2031 | | | 6,654,527 | |
| | 6,735,000 | | | Crown Castle International Corp., 3.250%, 1/15/2051 | | | 7,106,089 | |
| | 1,490,000 | | | Crown Castle International Corp., 3.300%, 7/01/2030 | | | 1,667,726 | |
| | 4,388,000 | | | IHS Netherlands Holdco BV, 8.000%, 9/18/2027, 144A | | | 4,734,169 | |
| | 2,115,000 | | | Millicom International Cellular S.A., 5.125%, 1/15/2028, 144A | | | 2,248,034 | |
| | 4,695,000 | | | Millicom International Cellular S.A., 6.250%, 3/25/2029, 144A | | | 5,281,875 | |
| | 26,485,000 | | | T-Mobile USA, Inc., 3.875%, 4/15/2030, 144A | | | 30,674,927 | |
| | | | | | | | |
| | | | | | | 71,466,812 | |
| | | | | | | | |
| | | | Wirelines — 1.8% | |
| | 18,163,000 | | | AT&T, Inc., 3.650%, 9/15/2059, 144A | | | 18,339,879 | |
| | 11,177,000 | | | AT&T, Inc., 3.800%, 12/01/2057, 144A | | | 11,679,259 | |
| | 1,240,000 | | | CenturyLink, Inc., 5.625%, 4/01/2025 | | | 1,337,650 | |
| | 350,000 | | | Cincinnati Bell Telephone Co. LLC, 6.300%, 12/01/2028 | | | 371,193 | |
| | 2,160,000 | | | Cincinnati Bell, Inc., 8.000%, 10/15/2025, 144A | | | 2,303,100 | |
| | 30,646,000 | | | Telecom Italia Capital S.A., 6.000%, 9/30/2034 | | | 37,329,586 | |
| | 16,440,000 | | | Telecom Italia Capital S.A., 6.375%, 11/15/2033 | | | 20,221,200 | |
See accompanying notes to financial statements.
| 66
Portfolio of Investments – as of December 31, 2020
Loomis Sayles Strategic Income Fund – (continued)
| | | | | | | | |
Principal
Amount (‡) | | | Description | | Value (†) | |
| | | | Wirelines — continued | |
| $ | 14,223,000 | | | Verizon Communications, Inc., 4.329%, 9/21/2028 | | $ | 17,100,597 | |
| | | | | | | | |
| | | | | | | 108,682,464 | |
| | | | | | | | |
| | | | Total Non-Convertible Bonds
(Identified Cost $3,578,126,472) | | | 3,678,782,593 | |
| | | | | | | | |
| | | | | | | | |
| | Convertible Bonds — 4.2% | |
| | | | Airlines — 0.2% | |
| | 6,970,000 | | | Southwest Airlines Co., 1.250%, 5/01/2025 | | | 10,123,925 | |
| | | | | | | | |
| | | | Cable Satellite — 2.5% | |
| | 14,660,000 | | | DISH Network Corp., 2.375%, 3/15/2024 | | | 13,662,091 | |
| | 143,750,000 | | | DISH Network Corp., 3.375%, 8/15/2026 | | | 137,027,050 | |
| | | | | | | | |
| | | | | | | 150,689,141 | |
| | | | | | | | |
| | | | Consumer Cyclical Services — 0.1% | |
| | 7,860,000 | | | Uber Technologies, Inc., Zero Coupon, 12/15/2025, 144A | | | 8,041,085 | |
| | | | | | | | |
| | | | Energy — 0.0% | |
| | 30,642,000 | | | Chesapeake Energy Corp., 5.500%, 9/15/2026(c)(g)(i) | | | 1,378,890 | |
| | | | | | | | |
| | | | Healthcare — 0.1% | |
| | 2,635,000 | | | Teladoc Health, Inc., 1.250%, 6/01/2027, 144A | | | 3,155,952 | |
| | | | | | | | |
| | | | Oil Field Services — 0.1% | |
| | 10,170,195 | | | Pioneer Energy Services Corp., 5.000% PIK or 5.000% Cash, 11/15/2025, 144A(b)(c)(d)(e)(k)(l) | | | 6,330,947 | |
| | | | | | | | |
| | | | Pharmaceuticals — 0.2% | |
| | 6,445,000 | | | BioMarin Pharmaceutical, Inc., 0.599%, 8/01/2024 | | | 6,916,047 | |
| | 2,155,000 | | | BioMarin Pharmaceutical, Inc., 1.250%, 5/15/2027, 144A | | | 2,251,975 | |
| | 1,545,000 | | | Neurocrine Biosciences, Inc., 2.250%, 5/15/2024 | | | 2,131,750 | |
| | | | | | | | |
| | | | | | | 11,299,772 | |
| | | | | | | | |
| | | | REITs – Diversified — 0.2% | |
| | 11,465,000 | | | iStar, Inc., 3.125%, 9/15/2022 | | | 13,490,086 | |
| | | | | | | | |
| | | | Technology — 0.8% | |
| | 10,415,000 | | | Booking Holdings, Inc., 0.900%, 9/15/2021 | | | 12,071,275 | |
| | 1,380,000 | | | Evolent Health, Inc., 3.500%, 12/01/2024, 144A | | | 1,573,776 | |
| | 7,290,000 | | | Nuance Communications, Inc., 1.250%, 4/01/2025 | | | 16,595,758 | |
| | 398,000 | | | Nuance Communications, Inc., 1.500%, 11/01/2035 | | | 851,640 | |
| | 17,000,000 | | | Western Digital Corp., 1.500%, 2/01/2024 | | | 16,897,080 | |
| | | | | | | | |
| | | | | | | 47,989,529 | |
| | | | | | | | |
| | | | Total Convertible Bonds
(Identified Cost $274,728,949) | | | 252,499,327 | |
| | | | | | | | |
| | | | | | | | |
| | Municipals — 1.6% | |
| | | | Illinois — 0.4% | |
| | 21,645,000 | | | State of Illinois, 5.100%, 6/01/2033 | | | 23,294,566 | |
| | | | | | | | |
| | | | Virginia — 1.2% | |
| | 68,005,000 | | | Tobacco Settlement Financing Corp., Series A-1, 6.706%, 6/01/2046 | | | 71,151,591 | |
| | | | | | | | |
| | | | Total Municipals
(Identified Cost $86,430,751) | | | 94,446,157 | |
| | | | | | | | |
| | | | | | | | |
| | | | Total Bonds and Notes
(Identified Cost $3,939,286,172) | | | 4,025,728,077 | |
| | | | | | | | |
| | Senior Loans — 0.5% | |
| | | | Chemicals — 0.1% | |
| 7,037,600 | | | Aruba Investments, Inc., 2020 2nd Lien Term Loan, 3-month LIBOR + 7.750%, 8.500%, 11/24/2028(h) | | | 7,037,600 | |
| | | | | | | | |
| | | | Construction Machinery — 0.2% | |
| | 18,538,000 | | | Onsite Rental Group Pty Ltd., Note, 6.100%, 10/26/2023(b)(c)(d)(e) | | | 9,862,216 | |
| | | | | | | | |
| | | | Independent Energy — 0.2% | |
| | 12,660,906 | | | Ascent Resources – Utica, 2020 Fixed 2nd Lien Term Loan, 11/01/2025(m) | | | 13,721,257 | |
| | | | | | | | |
| | | | Total Senior Loans
(Identified Cost $35,539,273) | | | 30,621,073 | |
| | | | | | | | |
| | | | | | | | |
| Shares | | | | | | |
| | Common Stocks — 11.8% | |
| | | | Aerospace & Defense — 0.0% | |
| | 7,475 | | | Lockheed Martin Corp. | | | 2,653,476 | |
| | | | | | | | |
| | | | Air Freight & Logistics — 0.0% | |
| | 15,186 | | | United Parcel Service, Inc., Class B | | | 2,557,322 | |
| | | | | | | | |
| | | | Beverages — 0.1% | |
| | 49,551 | | | Coca-Cola Co. (The) | | | 2,717,377 | |
| | | | | | | | |
| | | | Capital Markets — 0.1% | |
| | 3,804 | | | BlackRock, Inc. | | | 2,744,738 | |
| | 41,218 | | | Morgan Stanley | | | 2,824,670 | |
| | | | | | | | |
| | | | | | | 5,569,408 | |
| | | | | | | | |
| | | | Chemicals — 0.1% | |
| | 664,252 | | | Hexion Holdings Corp., Class B(f) | | | 8,588,778 | |
| | | | | | | | |
| | | | Communications Equipment — 0.0% | |
| | 58,584 | | | Cisco Systems, Inc. | | | 2,621,634 | |
| | | | | | | | |
| | | | Diversified Telecommunication Services — 3.8% | |
| | 7,868,481 | | | AT&T, Inc. | | | 226,297,514 | |
| | | | | | | | |
| | | | Electric Utilities — 0.1% | |
| | 29,485 | | | Duke Energy Corp. | | | 2,699,646 | |
| | 35,699 | | | NextEra Energy, Inc. | | | 2,754,178 | |
| | | | | | | | |
| | | | | | | 5,453,824 | |
| | | | | | | | |
| | | | Electronic Equipment, Instruments & Components — 1.6% | |
| | 2,575,992 | | | Corning, Inc. | | | 92,735,712 | |
| | | | | | | | |
| | | | Food & Staples Retailing — 0.0% | |
| | 18,218 | | | Walmart, Inc. | | | 2,626,125 | |
| | | | | | | | |
| | | | Health Care Equipment & Supplies — 0.0% | |
| | 24,421 | | | Abbott Laboratories | | | 2,673,855 | |
| | | | | | | | |
| | | | Health Care Providers & Services — 0.1% | |
| | 8,625 | | | Anthem, Inc. | | | 2,769,401 | |
| | 7,865 | | | UnitedHealth Group, Inc. | | | 2,758,098 | |
| | | | | | | | |
| | | | | | | 5,527,499 | |
| | | | | | | | |
| | | | Hotels, Restaurants & Leisure — 0.1% | |
| | 25,758 | | | Starbucks Corp. | | | 2,755,591 | |
| | | | | | | | |
| | | | Household Products — 0.0% | |
| | 19,142 | | | Procter & Gamble Co. (The) | | | 2,663,418 | |
| | | | | | | | |
| | | | Insurance — 0.1% | |
| | 27,418 | | | Progressive Corp. (The) | | | 2,711,092 | |
| | | | | | | | |
| | | | IT Services — 0.1% | |
| | 9,990 | | | Accenture PLC, Class A | | | 2,609,488 | |
| | 14,845 | | | Automatic Data Processing, Inc. | | | 2,615,689 | |
| | | | | | | | |
| | | | | | | 5,225,177 | |
| | | | | | | | |
See accompanying notes to financial statements.
67 |
Portfolio of Investments – as of December 31, 2020
Loomis Sayles Strategic Income Fund – (continued)
| | | | | | | | |
| Shares | | | Description | | Value (†) | |
| | | | Machinery — 0.0% | |
| | 9,825 | | | Deere & Co. | | $ | 2,643,416 | |
| | | | | | | | |
| | | | Media — 0.2% | |
| | 2,500,188 | | | Clear Channel Outdoor Holdings, Inc.(f) | | | 4,125,310 | |
| | 52,277 | | | Comcast Corp., Class A | | | 2,739,315 | |
| | 279,162 | | | iHeartMedia, Inc., Class A(f) | | | 3,623,523 | |
| | | | | | | | |
| | | | | | | 10,488,148 | |
| | | | | | | | |
| | | | Metals & Mining — 0.0% | |
| | 43,945 | | | Newmont Corp. | | | 2,631,866 | |
| | | | | | | | |
| | | | Oil Field Services — 0.0% | |
| | 60,638 | | | Pioneer Energy Services Corp.(b)(c)(d)(e)(f)(k) | | | — | |
| | | | | | | | |
| | | | Oil, Gas & Consumable Fuels — 0.5% | |
| | 9,229 | | | Battalion Oil Corp.(f) | | | 76,601 | |
| | 30,525 | | | Chevron Corp. | | | 2,577,836 | |
| | 500,544 | | | Lonestar Resources U.S., Inc.(b)(c)(d)(e)(f)(k) | | | 3,473,775 | |
| | 225,503 | | | Paragon Offshore Ltd., Litigation Units, Class B(e)(f) | | | 1,465,770 | |
| | 156,902 | | | Paragon Offshore Ltd., Litigation Units, Class A(b)(c)(d)(e)(f) | | | — | |
| | 758,253 | | | Whiting Petroleum Corp.(f) | | | 18,956,325 | |
| | 125,866 | | | Williams Cos., Inc. (The) | | | 2,523,613 | |
| | | | | | | | |
| | | | | | | 29,073,920 | |
| | | | | | | | |
| | | | Pharmaceuticals — 4.6% | |
| | 4,315,200 | | | Bristol-Myers Squibb Co. | | | 267,671,856 | |
| | 17,221 | | | Johnson & Johnson | | | 2,710,241 | |
| | 33,307 | | | Merck & Co., Inc. | | | 2,724,513 | |
| | | | | | | | |
| | | | | | | 273,106,610 | |
| | | | | | | | |
| | | | REITs – Diversified — 0.0% | |
| | 12,010 | | | American Tower Corp. | | | 2,695,765 | |
| | | | | | | | |
| | | | Road & Rail — 0.1% | |
| | 13,061 | | | Union Pacific Corp. | | | 2,719,561 | |
| | | | | | | | |
| | | | Software — 0.1% | |
| | 23,768 | | | iQor Holdings, Inc.(f) | | | 263,825 | |
| | 12,147 | | | Microsoft Corp. | | | 2,701,736 | |
| | | | | | | | |
| | | | | | | 2,965,561 | |
| | | | | | | | |
| | | | Specialty Retail — 0.0% | |
| | 9,831 | | | Home Depot, Inc. (The) | | | 2,611,310 | |
| | 10,161,347 | | | Onsite Rental Group Pty Ltd.(b)(c)(d)(e)(f) | | | — | |
| | | | | | | | |
| | | | | | | 2,611,310 | |
| | | | | | | | |
| | | | Technology Hardware, Storage & Peripherals — 0.1% | |
| | 20,996 | | | Apple, Inc. | | | 2,785,959 | |
| | | | | | | | |
| | | | Total Common Stocks
(Identified Cost $653,340,198) | | | 705,099,918 | |
| | | | | | | | |
| | | | | | | | |
| | Preferred Stocks — 0.8% | |
| | Convertible Preferred Stocks — 0.6% | |
| | | | Banking — 0.3% | |
| | 10,064 | | | Bank of America Corp., Series L, 7.250% | | | 15,282,989 | |
| | | | | | | | |
| | | | Communications — 0.0% | |
| | 3,704 | | | Cincinnati Bell, Inc., Series B, 6.750% | | | 183,651 | |
| | | | | | | | |
| | | | Energy — 0.0% | |
| | 172,972 | | | Chesapeake Energy Corp., 4.500%(b)(c)(d)(f) | | | — | |
| | 240,916 | | | Chesapeake Energy Corp., 5.000%(b)(c)(d)(f) | | | — | |
| | 32,522 | | | Chesapeake Energy Corp., 5.750%, 144A(b)(c)(d)(f) | | | — | |
| | 43,178 | | | Chesapeake Energy Corp., 5.750%, 144A(b)(c)(d)(f) | | | — | |
| | 6,017 | | | Chesapeake Energy Corp., 5.750%(b)(c)(d)(f) | | | — | |
| | 23,928 | | | Chesapeake Energy Corp., 5.750%(b)(c)(d)(f) | | | — | |
| | | | | | | | |
| | | | | | | — | |
| | | | | | | | |
| | | | Food & Beverage — 0.0% | |
| | 16,481 | | | Bunge Ltd., 4.875% | | | 1,792,870 | |
| | | | | | | | |
| | | | Healthcare — 0.1% | |
| | 57,041 | | | Boston Scientific Corp., Series A, 5.500% | | | 6,249,982 | |
| | | | | | | | |
| | | | Midstream — 0.2% | |
| | 242,297 | | | El Paso Energy Capital Trust I, 4.750%(c)(g) | | | 12,541,293 | |
| | | | | | | | |
| | | | Total Convertible Preferred Stocks
(Identified Cost $149,967,465) | | | 36,050,785 | |
| | | | | | | | |
| | | | | | | | |
| | Non-Convertible Preferred Stocks — 0.2% | |
| | | | Finance Companies — 0.0% | |
| | 10,425 | | | iStar, Inc., Series G, 7.650% | | | 262,216 | |
| | | | | | | | |
| | | | Home Construction — 0.0% | |
| | 208,246 | | | Hovnanian Enterprises, Inc., 7.625%(f) | | | 1,699,287 | |
| | | | | | | | |
| | | | REITs – Office Property — 0.0% | |
| | 1,596 | | | Highwoods Properties, Inc., Series A, 8.625% | | | 1,915,200 | |
| | | | | | | | |
| | | | REITs – Warehouse/Industrials — 0.2% | |
| | 116,192 | | | Prologis, Inc., Series Q, 8.540% | | | 8,017,248 | |
| | | | | | | | |
| | | | Total Non-Convertible Preferred Stocks
(Identified Cost $8,540,569) | | | 11,893,951 | |
| | | | | | | | |
| | | | | | | | |
| | | | Total Preferred Stocks
(Identified Cost $158,508,034) | | | 47,944,736 | |
| | | | | | | | |
| | | | | | | | |
| | Warrants — 0.2% | |
| | 751,946 | | | iHeartMedia, Inc., Expiration on 5/1/2039(b)(d)(f)
(Identified Cost $18,045,316) | | | 9,760,259 | |
| | | | | | | | |
| | | | | | | | |
| | Closed-End Investment Companies — 0.0% | |
| | 170,282 | | | NexPoint Strategic Opportunities Fund
(Identified Cost $10,230,310) | | | 1,791,367 | |
| | | | | | | | |
| | | | | | | | |
Principal
Amount (‡) | | | | | | |
| | Short-Term Investments — 18.3% | |
| | 1,906,507,718 | | | Central Bank of Iceland, 0.000%, (ISK)(h)(n) | | | 14,920,236 | |
| �� | 187,845,906 | | | Tri-Party Repurchase Agreement with Fixed Income Clearing Corporation, dated 12/31/2020 at 0.000% to be repurchased at $187,845,906 on 1/04/2021 collateralized by $131,367,600 U.S. Treasury Inflation Indexed Note, 0.125% due 1/15/2023 valued at $153,933,049; $36,392,700 U.S. Treasury Note, 1.500% due 1/15/2023 valued at $37,669,778 including accrued interest (Note 2 of Notes to Financial Statements) | | | 187,845,906 | |
| | 302,470,000 | | | U.S. Treasury Bills, 0.070% - 0.071%, 3/11/2021(o)(p) | | | 302,428,410 | |
| | 200,000,000 | | | U.S. Treasury Bills, 0.081%, 1/21/2021(o) | | | 199,995,750 | |
| | 100,000,000 | | | U.S. Treasury Bills, 0.091% - 0.120%, 1/28/2021(o)(p) | | | 99,996,167 | |
| | 292,125,000 | | | U.S. Treasury Bills, 0.107% - 0.111%, 4/15/2021(o)(p) | | | 292,057,385 | |
| | | | | | | | |
| | | | Total Short-Term Investments
(Identified Cost $1,097,811,230) | | | 1,097,243,854 | |
| | | | | | | | |
| | | | | | | | |
| | | | Total Investments — 98.8%
(Identified Cost $5,912,760,533) | | | 5,918,189,284 | |
| | | | Other assets less liabilities — 1.2% | | | 70,975,507 | |
| | | | | | | | |
| | | | Net Assets — 100.0% | | $ | 5,989,164,791 | |
| | | | | | | | |
See accompanying notes to financial statements.
| 68
Portfolio of Investments – as of December 31, 2020
Loomis Sayles Strategic Income Fund – (continued)
| | | | | | | | |
| | | | | | | | |
| | (‡) | | | Principal Amount stated in U.S. dollars unless otherwise noted. | |
| | (†) | | | See Note 2 of Notes to Financial Statements. | |
| | (††) | | | Amount shown represents units. One unit represents a principal amount of 25. | |
| | (a) | | | Variable rate security. The interest rate adjusts periodically based on; (i) changes in current interest rates and/or prepayments on underlying pools of assets, if applicable, (ii) reference to a base lending rate plus or minus a margin, and/or (iii) reference to a base lending rate adjusted by a multiplier and/or subject to certain floors or caps. Rate as of December 31, 2020 is disclosed. | |
| | (b) | | | Level 3 security. Value has been determined using significant unobservable inputs. See Note 3 of Notes to Financial Statements. | |
| | (c) | | | Illiquid security. (Unaudited) | |
| | (d) | | | Fair valued by the Fund’s adviser. At December 31, 2020, the value of these securities amounted to $38,774,769 or 0.6% of net assets. See Note 2 of Notes to Financial Statements. | |
| | (e) | | | Securities subject to restriction on resale. At December 31, 2020, the restricted securities held by the Fund are as follows: | |
| | | | | | | | | | | | | | | | |
| | | Acquisition
Date | | | Cost | | | Value | | | % of Net
Assets | |
| GCA2014 Holdings Ltd., Series 2014-1, Class C | | | 12/18/2014 | | | $ | 23,493,070 | | | $ | 7,909,888 | | | | 0.1% | |
| GCA2014 Holdings Ltd., Series 2014-1, Class D | | | 12/18/2014 | | | | 10,635,332 | | | | 1,437,684 | | | | Less than 0.1% | |
| GCA2014 Holdings Ltd., Series 2014-1, Class E | | | 12/18/2014 | | | | 32,732,982 | | | | — | | | | — | |
| Lonestar Resources U.S., Inc. | | | 12/01/2020 | | | | 3,473,775 | * | | | 3,473,775 | | | | 0.1% | |
| Onsite Rental Group Pty Ltd. | | | 10/26/2017 | | | | — | | | | — | | | | — | |
| Onsite Rental Group Pty Ltd., Note | | | 10/01/2017 | | | | 13,532,740 | | | | 9,862,216 | | | | 0.2% | |
| Paragon Offshore Ltd., Litigation Units, Class B | | | 7/18/2017 | | | | 22,768,653 | | | | 1,465,770 | | | | Less than 0.1% | |
| Paragon Offshore Ltd., Litigation Units, Class A | | | 7/18/2017 | | | | 1,167,146 | | | | — | | | | — | |
| Pioneer Energy Services Corp., 5.000% PIK or 5.000% Cash | | | 5/29/2020 | | | | 9,434,195 | | | | 6,330,947 | | | | 0.1% | |
| Pioneer Energy Services Corp. | | | 5/29/2020 | | | | 17,677,239 | ** | | | — | | | | — | |
| * | Represents basis assigned upon receipt in a taxable restructuring. |
| ** | Represents basis carried over in a non-taxable restructuring. |
| | | | | | |
| | | | | | |
| | (f) | | | Non-income producing security. |
| | (g) | | | Securities classified as fair valued pursuant to the Fund’s pricing policies and procedures. At December 31, 2020, the value of these securities amounted to $94,587,570 or 1.6% of net assets. See Note 2 of Notes to Financial Statements. |
| | (h) | | | Variable rate security. Rate as of December 31, 2020 is disclosed. |
| | (i) | | | The issuer is in default with respect to interest and/or principal payments. Income is not being accrued. |
| | (j) | | | Perpetual bond with no specified maturity date. |
| | (k) | | | Affiliated issuer. See Note 6i for a summary of transactions in securities of affiliated issuers. |
| | | | | | | | |
| | (l) | | | Payment-in-kind security for which the issuer, at each interest payment date, may make interest payments in cash and/or additional principal. For the period ended December 31, 2020, interest payments were made in additional principal. | |
| | (m) | | | Position is unsettled. Contract rate was not determined at December 31, 2020 and does not take effect until settlement date. Maturity date is not finalized until settlement date. | |
| | (n) | | | Security callable by issuer at any time. No specified maturity date. | |
| | (o) | | | Interest rate represents discount rate at time of purchase; not a coupon rate. | |
| | (p) | | | The Fund’s investment in U.S. Government/Agency securities is comprised of various lots with differing discount rates. These separate investments, which have the same maturity date, have been aggregated for the purpose of presentation in the Portfolio of Investments. | |
| | | | | |
| | 144A | | | All or a portion of these securities are exempt from registration under Rule 144A of the Securities Act of 1933. These securities may be resold in transactions exempt from registration, normally to qualified institutional buyers. At December 31, 2020, the value of Rule 144A holdings amounted to $933,916,119 or 15.6% of net assets. | |
| | ABS | | | Asset-Backed Securities | |
| | GMTN | | | Global Medium Term Note | |
| | LIBOR | | | London Interbank Offered Rate | |
| | MBIA | | | Municipal Bond Investors Assurance Corp. | |
| | MTN | | | Medium Term Note | |
| | PIK | | | Payment-in-Kind | |
| | REITs | | | Real Estate Investment Trusts | |
| | | | | |
| | ISK | | | Icelandic Krona | |
Industry Summary at December 31, 2020
| | | | |
Treasuries | | | 12.7 | % |
Finance Companies | | | 6.4 | |
Banking | | | 5.4 | |
Pharmaceuticals | | | 4.8 | |
Cable Satellite | | | 4.5 | |
Diversified Telecommunication Services | | | 3.8 | |
Technology | | | 3.6 | |
Aerospace & Defense | | | 3.6 | |
Automotive | | | 3.1 | |
Healthcare | | | 3.0 | |
Independent Energy | | | 2.6 | |
Other Investments, less than 2% each | | | 27.0 | |
Short-Term Investments | | | 18.3 | |
Closed-End Investment Companies | | | 0.0 | *** |
| | | | |
Total Investments | | | 98.8 | |
Other assets less liabilities | | | 1.2 | |
| | | | |
Net Assets | | | 100.0 | % |
| | | | |
See accompanying notes to financial statements.
69 |
Statements of Assets and Liabilities
December 31, 2020
| | | | | | | | | | | | | | | | |
| | | High
Income
Fund | | | Intermediate
Municipal
Bond Fund | | | International
Growth Fund | | | Investment
Grade Bond
Fund | |
ASSETS | |
Investments at cost | | $ | 109,237,345 | | | $ | 36,758,672 | | | $ | 14,828,544 | | | $ | 5,499,309,752 | |
Net unrealized appreciation | | | 2,523,561 | | | | 1,602,250 | | | | 188,535 | | | | 494,446,751 | |
| | | | | | | | | | | | | | | | |
Investments at value | | | 111,760,906 | | | | 38,360,922 | | | | 15,017,079 | | | | 5,993,756,503 | |
Cash | | | — | | | | — | | | | 192,827 | | | | 14,830,352 | |
Foreign currency at value (identified cost $0, $0, $1,570 and $0, respectively) | | | — | | | | — | | | | 1,574 | | | | — | |
Receivable for Fund shares sold | | | 316,700 | | | | 135,534 | | | | 500 | | | | 21,395,747 | |
Receivable from investment adviser (Note 6) | | | — | | | | 7,460 | | | | 29,991 | | | | — | |
Receivable for securities sold | | | 19,582 | | | | — | | | | — | | | | 104,000 | |
Dividends and interest receivable | | | 1,428,354 | | | | 338,890 | | | | 13,473 | | | | 35,215,993 | |
Tax reclaims receivable | | | — | | | | — | | | | 312 | | | | — | |
Prepaid expenses (Note 9) | | | 9 | | | | — | | | | — | | | | 344 | |
| | | | | | | | | | | | | | | | |
TOTAL ASSETS | | | 113,525,551 | | | | 38,842,806 | | | | 15,255,756 | | | | 6,065,302,939 | |
| | | | | | | | | | | | | | | | |
LIABILITIES | |
Payable for securities purchased | | | 217,949 | | | | 1,506,827 | | | | — | | | | 30,216,735 | |
Payable for Fund shares redeemed | | | 265,256 | | | | 2,418 | | | | — | | | | 6,845,243 | |
Distributions payable | | | — | | | | 12,074 | | | | — | | | | — | |
Management fees payable (Note 6) | | | 31,482 | | | | — | | | | — | | | | 1,839,588 | |
Deferred Trustees’ fees (Note 6) | | | 209,387 | | | | 68,214 | | | | 45 | | | | 1,128,346 | |
Administrative fees payable (Note 6) | | | 4,019 | | | | 1,256 | | | | 284 | | | | 204,122 | |
Payable to distributor (Note 6d) | | | 645 | | | | 95 | | | | — | | | | 40,327 | |
Audit and tax services fees payable | | | 53,437 | | | | 47,385 | | | | 33,774 | | | | 63,389 | |
Other accounts payable and accrued expenses | | | 25,349 | | | | 13,074 | | | | 1,821 | | | | 203,145 | |
| | | | | | | | | | | | | | | | |
TOTAL LIABILITIES | | | 807,524 | | | | 1,651,343 | | | | 35,924 | | | | 40,540,895 | |
| | | | | | | | | | | | | | | | |
NET ASSETS | | $ | 112,718,027 | | | $ | 37,191,463 | | | $ | 15,219,832 | | | $ | 6,024,762,044 | |
| | | | | | | | | | | | | | | | |
NET ASSETS CONSIST OF: | |
Paid-in capital | | $ | 121,158,018 | | | $ | 35,982,121 | | | $ | 15,026,195 | | | $ | 5,530,405,616 | |
Accumulated earnings (loss) | | | (8,439,991 | ) | | | 1,209,342 | | | | 193,637 | | | | 494,356,428 | |
| | | | | | | | | | | | | | | | |
NET ASSETS | | $ | 112,718,027 | | | $ | 37,191,463 | | | $ | 15,219,832 | | | $ | 6,024,762,044 | |
| | | | | | | | | | | | | | | | |
COMPUTATION OF NET ASSET VALUE AND OFFERING PRICE: | |
Class A shares: | |
Net assets | | $ | 41,547,054 | | | $ | 8,941,414 | | | $ | 1,014 | | | $ | 872,976,203 | |
| | | | | | | | | | | | | | | | |
Shares of beneficial interest | | | 9,546,291 | | | | 847,603 | | | | 100 | | | | 74,926,282 | |
| | | | | | | | | | | | | | | | |
Net asset value and redemption price per share | | $ | 4.35 | | | $ | 10.55 | | | $ | 10.13 | * | | $ | 11.65 | |
| | | | | | | | | | | | | | | | |
Offering price per share (100/[100-maximum sales charge] of net asset value) (Note 1) | | $ | 4.54 | | | $ | 10.88 | | | $ | 10.75 | | | $ | 12.17 | |
| | | | | | | | | | | | | | | | |
Class C shares: (redemption price per share is equal to net asset value less any applicable contingent deferred sales charge) (Note 1) | | | | | | | | | | | | | | | | |
Net assets | | $ | 2,932,542 | | | $ | 1,049,719 | | | $ | 1,013 | | | $ | 132,606,024 | |
| | | | | | | | | | | | | | | | |
Shares of beneficial interest | | | 670,989 | | | | 99,475 | | | | 100 | | | | 11,522,133 | |
| | | | | | | | | | | | | | | | |
Net asset value and offering price per share | | $ | 4.37 | | | $ | 10.55 | | | $ | 10.13 | | | $ | 11.51 | |
| | | | | | | | | | | | | | | | |
Class N shares: | |
Net assets | | $ | 14,782,679 | | | $ | — | | | $ | 15,206,010 | | | $ | 1,188,772,411 | |
| | | | | | | | | | | | | | | | |
Shares of beneficial interest | | | 3,394,087 | | | | — | | | | 1,501,224 | | | | 102,021,062 | |
| | | | | | | | | | | | | | | | |
Net asset value, offering and redemption price per share | | $ | 4.36 | | | $ | — | | | $ | 10.13 | | | $ | 11.65 | |
| | | | | | | | | | | | | | | | |
Class Y shares: | |
Net assets | | $ | 53,455,752 | | | $ | 27,200,330 | | | $ | 11,795 | | | $ | 3,704,947,861 | |
| | | | | | | | | | | | | | | | |
Shares of beneficial interest | | | 12,305,187 | | | | 2,574,753 | | | | 1,164 | | | | 317,756,637 | |
| | | | | | | | | | | | | | | | |
Net asset value, offering and redemption price per share | | $ | 4.34 | | | $ | 10.56 | | | $ | 10.13 | | | $ | 11.66 | |
| | | | | | | | | | | | | | | | |
Admin Class shares: | |
Net assets | | $ | — | | | $ | — | | | $ | — | | | $ | 125,459,545 | |
| | | | | | | | | | | | | | | | |
Shares of beneficial interest | | | — | | | | — | | | | — | | | | 10,799,218 | |
| | | | | | | | | | | | | | | | |
Net asset value, offering and redemption price per share | | $ | — | | | $ | — | | | $ | — | | | $ | 11.62 | |
| | | | | | | | | | | | | | | | |
| * | Net asset value calculations have been determined utilizing fractional share and penny amounts. |
See accompanying notes to financial statements.
| 70
Statements of Assets and Liabilities (continued)
December 31, 2020
| | | | |
| | |
Strategic
Alpha Fund | |
ASSETS | |
Investments at cost | | $ | 1,255,898,939 | |
Net unrealized appreciation | | | 21,734,156 | |
| | | | |
Investments at value | | | 1,277,633,095 | |
Cash | | | 2,620,307 | |
Due from brokers (Note 2) | | | 22,999,979 | |
Foreign currency at value (identified cost $1,692,995) | | | 1,759,150 | |
Receivable for Fund shares sold | | | 5,915,676 | |
Receivable for securities sold | | | 1,793,317 | |
Dividends and interest receivable | | | 8,505,171 | |
Unrealized appreciation on forward foreign currency contracts (Note 2) | | | 197,122 | |
Receivable for variation margin on futures contracts (Note 2) | | | 85,181 | |
Receivable for variation margin on centrally cleared swap agreements (Note 2) | | | 108,466 | |
Unamortized upfront premiums paid on bilateral swap agreements (Note 2) | | | 320,410 | |
Prepaid expenses (Note 9) | | | 75 | |
| | | | |
TOTAL ASSETS | | | 1,321,937,949 | |
| | | | |
LIABILITIES | |
Options written, at value (premiums received $168,133) (Note 2) | | | 159,801 | |
Payable for securities purchased | | | 1,659,759 | |
Unrealized depreciation on bilateral swap agreements (Note 2) | | | 526,239 | |
Payable for Fund shares redeemed | | | 263,135 | |
Unrealized depreciation on forward foreign currency contracts (Note 2) | | | 3,258,689 | |
Management fees payable (Note 6) | | | 651,664 | |
Deferred Trustees’ fees (Note 6) | | | 209,496 | |
Administrative fees payable (Note 6) | | | 46,922 | |
Payable to distributor (Note 6d) | | | 4,862 | |
Audit and tax services fees payable | | | 76,866 | |
Other accounts payable and accrued expenses | | | 64,167 | |
| | | | |
TOTAL LIABILITIES | | | 6,921,600 | |
| | | | |
NET ASSETS | | $ | 1,315,016,349 | |
| | | | |
NET ASSETS CONSIST OF: | |
Paid-in capital | | $ | 1,340,332,829 | |
Accumulated loss | | | (25,316,480 | ) |
| | | | |
NET ASSETS | | $ | 1,315,016,349 | |
| | | | |
COMPUTATION OF NET ASSET VALUE AND OFFERING PRICE: | |
Class A shares: | |
Net assets | | $ | 36,066,854 | |
| | | | |
Shares of beneficial interest | | | 3,456,494 | |
| | | | |
Net asset value and redemption price per share | | $ | 10.43 | |
| | | | |
Offering price per share (100/[100-maximum sales charge] of net asset value) (Note 1) | | $ | 10.89 | |
| | | | |
Class C shares: (redemption price per share is equal to net asset value less any applicable contingent deferred sales charge) (Note 1) | | | | |
Net assets | | $ | 8,961,911 | |
| | | | |
Shares of beneficial interest | | | 861,373 | |
| | | | |
Net asset value and offering price per share | | $ | 10.40 | |
| | | | |
Class N shares: | |
Net assets | | $ | 527,494,097 | |
| | | | |
Shares of beneficial interest | | | 50,669,098 | |
| | | | |
Net asset value, offering and redemption price per share | | $ | 10.41 | |
| | | | |
Class Y shares: | |
Net assets | | $ | 742,493,487 | |
| | | | |
Shares of beneficial interest | | | 71,356,694 | |
| | | | |
Net asset value, offering and redemption price per share | | $ | 10.41 | |
| | | | |
See accompanying notes to financial statements.
71 |
Statements of Assets and Liabilities (continued)
December 31, 2020
| | | | |
| | |
Strategic
Income Fund | |
ASSETS | |
Unaffiliated investments at cost | | $ | 5,882,107,417 | |
Affiliated investments at cost | | | 30,653,116 | |
Net unrealized appreciation on unaffiliated investments | | | 26,277,144 | |
Net unrealized depreciation on affiliated investments | | | (20,848,393 | ) |
| | | | |
Investments at value | | | 5,918,189,284 | |
Cash | | | 1,744,847 | |
Receivable for Fund shares sold | | | 6,328,728 | |
Receivable for securities sold | | | 35,706,023 | |
Dividends and interest receivable | | | 48,065,652 | |
Tax reclaims receivable | | | 247 | |
Prepaid expenses (Note 9) | | | 18,222 | |
| | | | |
TOTAL ASSETS | | | 6,010,053,003 | |
| | | | |
LIABILITIES | |
Payable for securities purchased | | | 4,577,589 | |
Payable for Fund shares redeemed | | | 10,467,446 | |
Management fees payable (Note 6) | | | 2,902,459 | |
Deferred Trustees’ fees (Note 6) | | | 1,920,758 | |
Administrative fees payable (Note 6) | | | 220,867 | |
Payable to distributor (Note 6d) | | | 54,289 | |
Audit and tax services fees payable | | | 49,247 | |
Other accounts payable and accrued expenses | | | 695,557 | |
| | | | |
TOTAL LIABILITIES | | | 20,888,212 | |
| | | | |
NET ASSETS | | $ | 5,989,164,791 | |
| | | | |
NET ASSETS CONSIST OF: | |
Paid-in capital | | $ | 6,204,471,225 | |
Accumulated loss | | | (215,306,434 | ) |
| | | | |
NET ASSETS | | $ | 5,989,164,791 | |
| | | | |
COMPUTATION OF NET ASSET VALUE AND OFFERING PRICE: | |
Class A shares: | |
Net assets | | $ | 1,682,561,893 | |
| | | | |
Shares of beneficial interest | | | 119,965,406 | |
| | | | |
Net asset value and redemption price per share | | $ | 14.03 | |
| | | | |
Offering price per share (100/[100-maximum sales charge] of net asset value) (Note 1) | | $ | 14.65 | |
| | | | |
Class C shares: (redemption price per share is equal to net asset value less any applicable contingent deferred sales charge) (Note 1) | | | | |
Net assets | | $ | 259,780,136 | |
| | | | |
Shares of beneficial interest | | | 18,323,287 | |
| | | | |
Net asset value and offering price per share | | $ | 14.18 | |
| | | | |
Class N shares: | |
Net assets | | $ | 247,696,592 | |
| | | | |
Shares of beneficial interest | | | 17,680,941 | |
| | | | |
Net asset value, offering and redemption price per share | | $ | 14.01 | |
| | | | |
Class Y shares: | |
Net assets | | $ | 3,693,954,001 | |
| | | | |
Shares of beneficial interest | | | 263,723,388 | |
| | | | |
Net asset value, offering and redemption price per share | | $ | 14.01 | |
| | | | |
Admin Class shares: | |
Net assets | | $ | 105,172,169 | |
| | | | |
Shares of beneficial interest | | | 7,526,348 | |
| | | | |
Net asset value, offering and redemption price per share | | $ | 13.97 | |
| | | | |
See accompanying notes to financial statements.
| 72
Statements of Operations
For the Year Ended December 31, 2020
| | | | | | | | | | | | | | | | |
| | | High
Income
Fund | | | Intermediate
Municipal
Bond Fund | | | International
Growth
Fund(a) | | | Investment
Grade Bond
Fund | |
INVESTMENT INCOME | | | | | | | | | | | | | | | | |
Interest | | $ | 6,457,564 | | | $ | 547,211 | | | $ | — | | | $ | 194,944,479 | |
Dividends | | | 263,269 | | | | 5,591 | | | | 18,033 | | | | 1,659,402 | |
Less net foreign taxes withheld | | | — | | | | — | | | | (2,678 | ) | | | — | |
| | | | | | | | | | | | | | | | |
| | | 6,720,833 | | | | 552,802 | | | | 15,355 | | | | 196,603,881 | |
| | | | | | | | | | | | | | | | |
Expenses | |
Management fees (Note 6) | | | 669,082 | | | | 92,759 | | | | 4,945 | | | | 22,550,836 | |
Service and distribution fees (Note 6) | | | 82,881 | | | | 33,912 | | | | 1 | | | | 4,251,630 | |
Administrative fees (Note 6) | | | 49,521 | | | | 10,156 | | | | 284 | | | | 2,463,304 | |
Trustees’ fees and expenses (Note 6) | | | 46,813 | | | | 24,996 | | | | 180 | | | | 362,630 | |
Transfer agent fees and expenses (Notes 6 and 8) | | | 102,304 | | | | 11,410 | | | | 36 | | | | 3,481,271 | |
Audit and tax services fees | | | 52,641 | | | | 52,788 | | | | 33,774 | | | | 63,588 | |
Custodian fees and expenses (Note 7) | | | 16,661 | | | | 5,287 | | | | 954 | | | | 168,320 | |
Legal fees (Note 9) | | | 3,172 | | | | 781 | | | | 30 | | | | 143,878 | |
Registration fees | | | 78,199 | | | | 44,138 | | | | 100 | | | | 202,137 | |
Shareholder reporting expenses | | | 26,529 | | | | 3,391 | | | | 549 | | | | 264,616 | |
Miscellaneous expenses (Notes 7 and 9) | | | 30,583 | | | | 25,403 | | | | 1,905 | | | | 189,220 | |
| | | | | | | | | | | | | | | | |
Total expenses | | | 1,158,386 | | | | 305,021 | | | | 42,758 | | | | 34,141,430 | |
Less waiver and/or expense reimbursement (Notes 6 and 7) | | | (244,500 | ) | | | (166,707 | ) | | | (36,823 | ) | | | (2,021,089 | ) |
| | | | | | | | | | | | | | | | |
Net expenses | | | 913,886 | | | | 138,314 | | | | 5,935 | | | | 32,120,341 | |
| | | | | | | | | | | | | | | | |
Net investment income | | | 5,806,947 | | | | 414,488 | | | | 9,420 | | | | 164,483,540 | |
| | | | | | | | | | | | | | | | |
NET REALIZED AND UNREALIZED GAIN (LOSS) ON INVESTMENTS, SWAP AGREEMENTS AND FOREIGN CURRENCY TRANSACTIONS | | | | | | | | | | | | | | | | |
Net realized gain (loss) on: | |
Investments | | | (4,673,658 | ) | | | 184,411 | | | | 1,756 | | | | 266,643,665 | |
Swap agreements | | | — | | | | — | | | | — | | | | 8,539,507 | |
Foreign currency transactions (Note 2c) | | | — | | | | — | | | | 6,367 | | | | 120,794 | |
Net change in unrealized appreciation (depreciation) on: | |
Investments | | | 2,338,998 | | | | 430,359 | | | | 188,535 | | | | 176,877,938 | |
Foreign currency translations (Note 2c) | | | — | | | | — | | | | 4 | | | | (514 | ) |
| | | | | | | | | | | | | | | | |
Net realized and unrealized gain (loss) on investments, swap agreements and foreign currency transactions | | | (2,334,660 | ) | | | 614,770 | | | | 196,662 | | | | 452,181,390 | |
| | | | | | | | | | | | | | | | |
NET INCREASE IN NET ASSETS RESULTING FROM OPERATIONS | | $ | 3,472,287 | | | $ | 1,029,258 | | | $ | 206,082 | | | $ | 616,664,930 | |
| | | | | | | | | | | | | | | | |
| (a) | From commencement of operations on December 15, 2020 through December 31, 2020. |
See accompanying notes to financial statements.
73 |
Statements of Operations (continued)
For the Year Ended December 31, 2020
| | | | |
| | | Strategic
Alpha Fund | |
INVESTMENT INCOME | |
Dividends | | $ | 2,304,150 | |
Interest | | | 42,573,101 | |
Less net foreign taxes withheld | | | (227 | ) |
| | | | |
| | | 44,877,024 | |
| | | | |
Expenses | |
Management fees (Note 6) | | | 7,083,082 | |
Service and distribution fees (Note 6) | | | 213,573 | |
Administrative fees (Note 6) | | | 521,998 | |
Trustees’ fees and expenses (Note 6) | | | 83,812 | |
Transfer agent fees and expenses (Notes 6 and 8) | | | 417,755 | |
Audit and tax services fees | | | 84,034 | |
Custodian fees and expenses (Note 7) | | | 68,201 | |
Legal fees (Note 9) | | | 28,767 | |
Registration fees | | | 76,959 | |
Shareholder reporting expenses | | | 36,452 | |
Miscellaneous expenses (Notes 7 and 9) | | | 84,998 | |
| | | | |
Total expenses | | | 8,699,631 | |
| | | | |
Net investment income | | | 36,177,393 | |
| | | | |
NET REALIZED AND UNREALIZED GAIN (LOSS) ON INVESTMENTS, FUTURES CONTRACTS, OPTIONS WRITTEN, SWAP AGREEMENTS, FORWARD FOREIGN CURRENCY CONTRACTS AND FOREIGN CURRENCY TRANSACTIONS | | | | |
Net realized gain (loss) on: | |
Investments | | | (14,523,238 | ) |
Futures contracts | | | 7,117,555 | |
Options written | | | (50,234 | ) |
Swap agreements | | | 8,284,641 | |
Forward foreign currency contracts (Note 2d) | | | (1,382,516 | ) |
Foreign currency transactions (Note 2c) | | | (511,098 | ) |
Net change in unrealized appreciation (depreciation) on: | |
Investments | | | 70,567,697 | |
Futures contracts | | | (19,222 | ) |
Options written | | | 1,016 | |
Swap agreements | | | 2,422,592 | |
Forward foreign currency contracts (Note 2d) | | | (1,956,477 | ) |
Foreign currency translations (Note 2c) | | | 342,563 | |
| | | | |
Net realized and unrealized gain on investments, futures contracts, options written, swap agreements, forward foreign currency contracts and foreign currency transactions | | | 70,293,279 | |
| | | | |
NET INCREASE IN NET ASSETS RESULTING FROM OPERATIONS | | $ | 106,470,672 | |
| | | | |
See accompanying notes to financial statements.
| 74
Statements of Operations (continued)
For the Period Ended December 31, 2020
| | | | | | | | |
| | | Strategic Income Fund | |
| | | Period Ended
December 31,
2020(a) | | | Year Ended
September 30,
2020 | |
INVESTMENT INCOME | |
Dividends | | $ | 9,894,395 | | | $ | 34,983,468 | |
Interest from unaffiliated investments | | | 46,785,252 | | | | 251,044,579 | |
Interest from affiliated investments (Note 6) | | | 154,917 | | | | 441,094 | |
Less net foreign taxes withheld | | | (9,115 | ) | | | (430,452 | ) |
| | | | | | | | |
| | | 56,825,449 | | | | 286,038,689 | |
| | | | | | | | |
Expenses | |
Management fees (Note 6) | | | 8,602,302 | | | | 36,847,870 | |
Service and distribution fees (Note 6) | | | 1,867,823 | | | | 9,532,359 | |
Administrative fees (Note 6) | | | 656,953 | | | | 2,869,683 | |
Trustees’ fees and expenses (Note 6) | | | 146,927 | | | | 463,045 | |
Transfer agent fees and expenses (Notes 6 and 8) | | | 1,163,199 | | | | 5,217,792 | |
Audit and tax services fees | | | 46,201 | | | | 63,555 | |
Custodian fees and expenses (Note 7) | | | 75,366 | | | | 324,017 | |
Legal fees (Note 9) | | | 17,882 | | | | 159,823 | |
Registration fees | | | 52,790 | | | | 176,399 | |
Shareholder reporting expenses | | | 96,403 | | | | 300,076 | |
Miscellaneous expenses (Notes 7 and 9) | | | 53,126 | | | | 212,464 | |
| | | | | | | | |
Total expenses | | | 12,778,972 | | | | 56,167,083 | |
| | | | | | | | |
Net investment income | | | 44,046,477 | | | | 229,871,606 | |
| | | | | | | | |
NET REALIZED AND UNREALIZED GAIN (LOSS) ON INVESTMENTS AND FOREIGN CURRENCY TRANSACTIONS | | | | | | | | |
Net realized gain (loss) on: | |
Unaffiliated investments | | | (327,676,709 | ) | | | (85,265,323 | ) |
Affiliated investments (Note 6) | | | — | | | | (13,528,848 | ) |
Foreign currency transactions (Note 2c) | | | 437,744 | | | | (1,837,713 | ) |
Net change in unrealized appreciation (depreciation) on: | |
Unaffiliated investments | | | 595,993,246 | | | | (188,843,675 | ) |
Affiliated investments (Note 6) | | | (31,212 | ) | | | (11,115,666 | ) |
Foreign currency translations (Note 2c) | | | (87,631 | ) | | | 498,421 | |
| | | | | | | | |
Net realized and unrealized gain (loss) on investments and foreign currency transactions | | | 268,635,438 | | | | (300,092,804 | ) |
| | | | | | | | |
NET INCREASE (DECREASE) IN NET ASSETS RESULTING FROM OPERATIONS | | $ | 312,681,915 | | | $ | (70,221,198 | ) |
| | | | | | | | |
| (a) | For the three month period ended December 31, 2020. See Note 1 of Notes to Financial Statements. |
See accompanying notes to financial statements.
75 |
Statements of Changes in Net Assets
| | | | | | | | | | | | | | | | |
| | | High Income Fund | | | Intermediate Municipal Bond
Fund | |
| | | Year Ended
December 31,
2020 | | | Year Ended
December 31,
2019 | | | Year Ended
December 31,
2020 | | | Year Ended
December 31,
2019 | |
FROM OPERATIONS: | |
Net investment income | | $ | 5,806,947 | | | $ | 7,362,208 | | | $ | 414,488 | | | $ | 488,192 | |
Net realized gain (loss) on investments | | | (4,673,658 | ) | | | (430,482 | ) | | | 184,411 | | | | 156,434 | |
Net change in unrealized appreciation (depreciation) on investments | | | 2,338,998 | | | | 9,756,973 | | | | 430,359 | | | | 682,883 | |
| | | | | | | | | | | | | | | | |
Net increase in net assets resulting from operations | | | 3,472,287 | | | | 16,688,699 | | | | 1,029,258 | | | | 1,327,509 | |
| | | | | | | | | | | | | | | | |
FROM DISTRIBUTIONS TO SHAREHOLDERS: | |
Class A | | | (1,244,423 | ) | | | (1,135,803 | ) | | | (151,821 | ) | | | (157,363 | ) |
Class C | | | (131,410 | ) | | | (194,240 | ) | | | (13,774 | ) | | | (23,074 | ) |
Class N | | | (739,980 | ) | | | (609,528 | ) | | | — | | | | — | |
Class Y | | | (4,149,317 | ) | | | (5,638,962 | ) | | | (249,452 | ) | | | (307,772 | ) |
| | | | | | | | | | | | | | | | |
Total distributions | | | (6,265,130 | ) | | | (7,578,533 | ) | | | (415,047 | ) | | | (488,209 | ) |
| | | | | | | | | | | | | | | | |
NET INCREASE (DECREASE) IN NET ASSETS FROM CAPITAL SHARE TRANSACTIONS (NOTE 12) | | | (31,816,114 | ) | | | 1,738,584 | | | | 17,552,248 | | | | (4,018,800 | ) |
| | | | | | | | | | | | | | | | |
Net increase (decrease) in net assets | | | (34,608,957 | ) | | | 10,848,750 | | | | 18,166,459 | | | | (3,179,500 | ) |
NET ASSETS | |
Beginning of the year | | | 147,326,984 | | | | 136,478,234 | | | | 19,025,004 | | | | 22,204,504 | |
| | | | | | | | | | | | | | | | |
End of the year | | $ | 112,718,027 | | | $ | 147,326,984 | | | $ | 37,191,463 | | | $ | 19,025,004 | |
| | | | | | | | | | | | | | | | |
See accompanying notes to financial statements.
| 76
Statements of Changes in Net Assets (continued)
| | | | | | | | | | | | |
| | | International
Growth Fund | | | Investment Grade Bond Fund | |
| | | Period Ended
December 31,
2020(a) | | | Year Ended
December 31,
2020 | | | Year Ended
December 31,
2019 | |
FROM OPERATIONS: | |
Net investment income | | $ | 9,420 | | | $ | 164,483,540 | | | $ | 180,954,803 | |
Net realized gain on investments, swap agreements and foreign currency transactions | | | 8,123 | | | | 275,303,966 | | | | 74,860,931 | |
Net change in unrealized appreciation (depreciation) on investments and foreign currency translations | | | 188,539 | | | | 176,877,424 | | | | 216,386,447 | |
| | | | | | | | | | | | |
Net increase in net assets resulting from operations | | | 206,082 | | | | 616,664,930 | | | | 472,202,181 | |
| | | | | | | | | | | | |
FROM DISTRIBUTIONS TO SHAREHOLDERS: | |
Class A | | | (1 | ) | | | (66,337,702 | ) | | | (25,364,474 | ) |
Class C | | | — | (b) | | | (10,552,630 | ) | | | (6,942,862 | ) |
Class N | | | (12,450 | ) | | | (96,560,712 | ) | | | (47,788,079 | ) |
Class Y | | | (9 | ) | | | (284,270,221 | ) | | | (111,238,434 | ) |
Admin Class | | | — | | | | (8,996,534 | ) | | | (3,581,152 | ) |
| | | | | | | | | | | | |
Total distributions | | | (12,460 | ) | | | (466,717,799 | ) | | | (194,915,001 | ) |
| | | | | | | | | | | | |
NET INCREASE (DECREASE) IN NET ASSETS FROM CAPITAL SHARE TRANSACTIONS (NOTE 12) | | | 15,026,210 | | | | 300,818,816 | | | | (31,559,822 | ) |
| | | | | | | | | | | | |
Net increase in net assets | | | 15,219,832 | | | | 450,765,947 | | | | 245,727,358 | |
NET ASSETS | |
Beginning of the year | | | — | | | | 5,573,996,097 | | | | 5,328,268,739 | |
| | | | | | | | | | | | |
End of the year | | $ | 15,219,832 | | | $ | 6,024,762,044 | | | $ | 5,573,996,097 | |
| | | | | | | | | | | | |
| (a) | From commencement of operations on December 15, 2020 through December 31, 2020. |
| (b) | Amount rounds to less than $1.00. |
See accompanying notes to financial statements.
77 |
Statements of Changes in Net Assets (continued)
| | | | | | | | |
| | | Strategic Alpha Fund | |
| | | Year Ended
December 31,
2020 | | | Year Ended
December 31,
2019 | |
FROM OPERATIONS: | |
Net investment income | | $ | 36,177,393 | | | $ | 49,850,113 | |
Net realized loss on investments, futures contracts, options written, swap agreements, forward foreign currency contracts and foreign currency transactions | | | (1,064,890 | ) | | | (8,071,488 | ) |
Net change in unrealized appreciation (depreciation) on investments, futures contracts, options written, swap agreements, forward foreign currency contracts and foreign currency translations | | | 71,358,169 | | | | 15,971,337 | |
| | | | | | | | |
Net increase in net assets resulting from operations | | | 106,470,672 | | | | 57,749,962 | |
| | | | | | | | |
FROM DISTRIBUTIONS TO SHAREHOLDERS: | |
Class A | | | (708,457 | ) | | | (1,581,199 | ) |
Class C | | | (158,470 | ) | | | (411,487 | ) |
Class N | | | (11,490,422 | ) | | | (8,768,965 | ) |
Class Y | | | (15,871,781 | ) | | | (34,262,581 | ) |
| | | | | | | | |
Total distributions | | | (28,229,130 | ) | | | (45,024,232 | ) |
| | | | | | | | |
NET DECREASE IN NET ASSETS FROM CAPITAL SHARE TRANSACTIONS (NOTE 12) | | | (63,947,948 | ) | | | (216,962,192 | ) |
| | | | | | | | |
Net increase (decrease) in net assets | | | 14,293,594 | | | | (204,236,462 | ) |
NET ASSETS | |
Beginning of the year | | | 1,300,722,755 | | | | 1,504,959,217 | |
| | | | | | | | |
End of the year | | $ | 1,315,016,349 | | | $ | 1,300,722,755 | |
| | | | | | | | |
See accompanying notes to financial statements.
| 78
Statements of Changes in Net Assets (continued)
| | | | | | | | | | | | |
| | | Strategic Income Fund | |
| | | Period Ended
December 31,
2020(a) | | | Year Ended
September 30,
2020 | | | Year Ended
September 30,
2019 | |
FROM OPERATIONS: | |
Net investment income | | $ | 44,046,477 | | | $ | 229,871,606 | | | $ | 312,461,598 | |
Net realized loss on investments and foreign currency transactions | | | (327,238,965 | ) | | | (100,631,884 | ) | | | (25,505,488 | ) |
Net change in unrealized appreciation (depreciation) on investments and foreign currency translations | | | 595,874,403 | | | | (199,460,920 | ) | | | (96,424,261 | ) |
| | | | | | | | | | | | |
Net increase (decrease) in net assets resulting from operations | | | 312,681,915 | | | | (70,221,198 | ) | | | 190,531,849 | |
| | | | | | | | | | | | |
FROM DISTRIBUTIONS TO SHAREHOLDERS: | |
Class A | | | (33,250,024 | ) | | | (60,755,051 | ) | | | (71,533,316 | ) |
Class C | | | (4,600,466 | ) | | | (12,091,933 | ) | | | (27,624,605 | ) |
Class N | | | (4,334,379 | ) | | | (7,404,708 | ) | | | (8,091,999 | ) |
Class Y | | | (75,910,796 | ) | | | (150,040,710 | ) | | | (189,621,495 | ) |
Admin Class | | | (1,932,234 | ) | | | (3,669,167 | ) | | | (4,619,879 | ) |
| | | | | | | | | | | | |
Total distributions | | | (120,027,899 | ) | | | (233,961,569 | ) | | | (301,491,294 | ) |
| | | | | | | | | | | | |
NET DECREASE IN NET ASSETS FROM CAPITAL SHARE TRANSACTIONS (NOTE 12) | | | (255,047,276 | ) | | | (797,576,770 | ) | | | (1,303,567,589 | ) |
| | | | | | | | | | | | |
Net decrease in net assets | | | (62,393,260 | ) | | | (1,101,759,537 | ) | | | (1,414,527,034 | ) |
NET ASSETS | |
Beginning of the year | | | 6,051,558,051 | | | | 7,153,317,588 | | | | 8,567,844,622 | |
| | | | | | | | | | | | |
End of the year | | $ | 5,989,164,791 | | | $ | 6,051,558,051 | | | $ | 7,153,317,588 | |
| | | | | | | | | | | | |
| (a) | For the three month period ended December 31, 2020. See Note 1 of Notes to Financial Statements. |
See accompanying notes to financial statements.
79 |
Financial Highlights
For a share outstanding throughout each period.
| | | | | | | | | | | | | | | | | | | | | | | | |
| | | High Income Fund—Class A | |
| | | Year Ended
December 31,
2020 | | | Year Ended
December 31,
2019 | | | Period Ended
December 31,
2018* | | | Year Ended
September 30,
2018 | | | Year Ended
September 30,
2017 | | | Year Ended
September 30,
2016 | |
Net asset value, beginning of the period | | $ | 4.25 | | | $ | 3.99 | | | $ | 4.25 | | | $ | 4.37 | | | $ | 4.23 | | | $ | 3.99 | |
| | | | | | | | | | | | | | | | | | | | | | | | |
INCOME (LOSS) FROM INVESTMENT OPERATIONS: | |
Net investment income(a) | | | 0.20 | | | | 0.20 | | | | 0.05 | | | | 0.20 | | | | 0.22 | | | | 0.20 | |
Net realized and unrealized gain (loss) | | | 0.12 | (b) | | | 0.27 | | | | (0.24 | ) | | | (0.14 | ) | | | 0.12 | | | | 0.21 | |
| | | | | | | | | | | | | | | | | | | | | | | | |
Total from Investment Operations | | | 0.32 | | | | 0.47 | | | | (0.19 | ) | | | 0.06 | | | | 0.34 | | | | 0.41 | |
| | | | | | | | | | | | | | | | | | | | | | | | |
LESS DISTRIBUTIONS FROM: | |
Net investment income | | | (0.22 | ) | | | (0.21 | ) | | | (0.06 | ) | | | (0.18 | ) | | | (0.20 | ) | | | (0.16 | ) |
Net realized capital gains | | | — | | | | — | | | | (0.01 | ) | | | — | | | | — | | | | (0.01 | ) |
| | | | | | | | | | | | | | | | | | | | | | | | |
Total Distributions | | | (0.22 | ) | | | (0.21 | ) | | | (0.07 | ) | | | (0.18 | ) | | | (0.20 | ) | | | (0.17 | ) |
| | | | | | | | | | | | | | | | | | | | | | | | |
Net asset value, end of the period | | $ | 4.35 | | | $ | 4.25 | | | $ | 3.99 | | | $ | 4.25 | | | $ | 4.37 | | | $ | 4.23 | |
| | | | | | | | | | | | | | | | | | | | | | | | |
Total return(c)(d) | | | 8.16 | % | | | 11.94 | % | | | (4.54 | )%(e) | | | 1.41 | % | | | 8.17 | % | | | 10.66 | % |
RATIOS TO AVERAGE NET ASSETS: | |
Net assets, end of the period (000’s) | | $ | 41,547 | | | $ | 23,199 | | | $ | 23,125 | | | $ | 26,175 | | | $ | 34,039 | | | $ | 34,820 | |
Net expenses(f) | | | 1.00 | % | | | 1.03 | %(g) | | | 1.05 | %(h) | | | 1.05 | % | | | 1.09 | %(i) | | | 1.10 | % |
Gross expenses | | | 1.22 | % | | | 1.18 | % | | | 1.27 | %(h) | | | 1.16 | % | | | 1.15 | % | | | 1.14 | % |
Net investment income | | | 4.91 | % | | | 4.84 | % | | | 5.13 | %(h) | | | 4.73 | % | | | 5.03 | % | | | 5.16 | % |
Portfolio turnover rate | | | 99 | %(j) | | | 48 | % | | | 17 | % | | | 55 | % | | | 46 | % | | | 38 | % |
| * | For the three month period ended December 31, 2018 due to change in fiscal year end. |
| (a) | Per share net investment income has been calculated using the average shares outstanding during the period. |
| (b) | The amount shown for a share outstanding does not correspond with the aggregate realized and unrealized gain (loss) on investments for the period due to the timing of sales and redemptions of fund shares in relation to fluctuating market values of investments of the Fund. |
| (c) | A sales charge for Class A shares is not reflected in total return calculations. |
| (d) | Had certain expenses not been waived/reimbursed during the period, total returns would have been lower. |
| (e) | Periods less than one year are not annualized. |
| (f) | The investment adviser agreed to waive its fees and/or reimburse a portion of the Fund’s expenses during the period. Without this waiver/reimbursement, expenses would have been higher. |
| (g) | Effective July 1, 2019, the expense limit decreased from 1.05% to 1.00%. |
| (h) | Computed on an annualized basis for periods less than one year. |
| (i) | Effective July 1, 2017, the expense limit decreased to 1.05%. |
| (j) | The variation in the Fund’s turnover rate from 2019 to 2020 was primarily due to a significant repositioning of the portfolio as a result of increased market volatility. |
See accompanying notes to financial statements.
| 80
Financial Highlights (continued)
For a share outstanding throughout each period.
| | | | | | | | | | | | | | | | | | | | | | | | |
| | | High Income Fund—Class C | |
| | | Year Ended
December 31,
2020 | | | Year Ended
December 31,
2019 | | | Period Ended
December 31,
2018* | | | Year Ended
September 30,
2018 | | | Year Ended
September 30,
2017 | | | Year Ended
September 30,
2016 | |
Net asset value, beginning of the period | | $ | 4.27 | | | $ | 4.00 | | | $ | 4.27 | | | $ | 4.38 | | | $ | 4.24 | | | $ | 4.00 | |
| | | | | | | | | | | | | | | | | | | | | | | | |
INCOME (LOSS) FROM INVESTMENT OPERATIONS: | |
Net investment income(a) | | | 0.17 | | | | 0.17 | | | | 0.05 | | | | 0.17 | | | | 0.18 | | | | 0.18 | |
Net realized and unrealized gain (loss) | | | 0.12 | (b) | | | 0.28 | | | | (0.26 | ) | | | (0.13 | ) | | | 0.12 | | | | 0.20 | |
| | | | | | | | | | | | | | | | | | | | | | | | |
Total from Investment Operations | | | 0.29 | | | | 0.45 | | | | (0.21 | ) | | | 0.04 | | | | 0.30 | | | | 0.38 | |
| | | | | | | | | | | | | | | | | | | | | | | | |
LESS DISTRIBUTIONS FROM: | |
Net investment income | | | (0.19 | ) | | | (0.18 | ) | | | (0.05 | ) | | | (0.15 | ) | | | (0.16 | ) | | | (0.13 | ) |
Net realized capital gains | | | — | | | | — | | | | (0.01 | ) | | | — | | | | — | | | | (0.01 | ) |
| | | | | | | | | | | | | | | | | | | | | | | | |
Total Distributions | | | (0.19 | ) | | | (0.18 | ) | | | (0.06 | ) | | | (0.15 | ) | | | (0.16 | ) | | | (0.14 | ) |
| | | | | | | | | | | | | | | | | | | | | | | | |
Net asset value, end of the period | | $ | 4.37 | | | $ | 4.27 | | | $ | 4.00 | | | $ | 4.27 | | | $ | 4.38 | | | $ | 4.24 | |
| | | | | | | | | | | | | | | | | | | | | | | | |
Total return(c)(d) | | | 7.30 | % | | | 11.32 | % | | | (4.95 | )%(e) | | | 0.86 | % | | | 7.33 | % | | | 9.81 | % |
RATIOS TO AVERAGE NET ASSETS: | |
Net assets, end of the period (000’s) | | $ | 2,933 | | | $ | 3,836 | | | $ | 5,351 | | | $ | 6,248 | | | $ | 11,227 | | | $ | 12,288 | |
Net expenses(f) | | | 1.75 | % | | | 1.78 | %(g) | | | 1.80 | %(h) | | | 1.80 | % | | | 1.84 | %(i) | | | 1.85 | % |
Gross expenses | | | 1.97 | % | | | 1.93 | % | | | 2.02 | %(h) | | | 1.91 | % | | | 1.90 | % | | | 1.89 | % |
Net investment income | | | 4.24 | % | | | 4.11 | % | | | 4.38 | %(h) | | | 3.99 | % | | | 4.29 | % | | | 4.43 | % |
Portfolio turnover rate | | | 99 | %(j) | | | 48 | % | | | 17 | % | | | 55 | % | | | 46 | % | | | 38 | % |
| * | For the three month period ended December 31, 2018 due to change in fiscal year end. |
| (a) | Per share net investment income has been calculated using the average shares outstanding during the period. |
| (b) | The amount shown for a share outstanding does not correspond with the aggregate realized and unrealized gain (loss) on investments for the period due to the timing of sales and redemptions of fund shares in relation to fluctuating market values of investments of the Fund. |
| (c) | A contingent deferred sales charge for Class C shares is not reflected in total return calculations. |
| (d) | Had certain expenses not been waived/reimbursed during the period, total returns would have been lower. |
| (e) | Periods less than one year are not annualized. |
| (f) | The investment adviser agreed to waive its fees and/or reimburse a portion of the Fund’s expenses during the period. Without this waiver/reimbursement, expenses would have been higher. |
| (g) | Effective July 1, 2019, the expense limit decreased from 1.80% to 1.75%. |
| (h) | Computed on an annualized basis for periods less than one year. |
| (i) | Effective July 1, 2017, the expense limit decreased to 1.80%. |
| (j) | The variation in the Fund’s turnover rate from 2019 to 2020 was primarily due to a significant repositioning of the portfolio as a result of increased market volatility. |
See accompanying notes to financial statements.
81 |
Financial Highlights (continued)
For a share outstanding throughout each period.
| | | | | | | | | | | | | | | | | | | | |
| | | High Income Fund—Class N | |
| | | Year Ended
December 31,
2020 | | | Year Ended
December 31,
2019 | | | Period Ended
December 31,
2018* | | | Year Ended
September 30,
2018 | | | Period Ended
September 30,
2017** | |
Net asset value, beginning of the period | | $ | 4.25 | | | $ | 3.99 | | | $ | 4.25 | | | $ | 4.36 | | | $ | 4.16 | |
| | | | | | | | | | | | | | | | | | | | |
INCOME (LOSS) FROM INVESTMENT OPERATIONS: | |
Net investment income(a) | | | 0.21 | | | | 0.22 | | | | 0.06 | | | | 0.20 | | | | 0.19 | |
Net realized and unrealized gain (loss) | | | 0.14 | (b) | | | 0.26 | | | | (0.25 | ) | | | (0.12 | ) | | | 0.18 | |
| | | | | | | | | | | | | | | | | | | | |
Total from Investment Operations | | | 0.35 | | | | 0.48 | | | | (0.19 | ) | | | 0.08 | | | | 0.37 | |
| | | | | | | | | | | | | | | | | | | | |
LESS DISTRIBUTIONS FROM: | |
Net investment income | | | (0.24 | ) | | | (0.22 | ) | | | (0.06 | ) | | | (0.19 | ) | | | (0.17 | ) |
Net realized capital gains | | | — | | | | — | | | | (0.01 | ) | | | — | | | | — | |
| | | | | | | | | | | | | | | | | | | | |
Total Distributions | | | (0.24 | ) | | | (0.22 | ) | | | (0.07 | ) | | | (0.19 | ) | | | (0.17 | ) |
| | | | | | | | | | | | | | | | | | | | |
Net asset value, end of the period | | $ | 4.36 | | | $ | 4.25 | | | $ | 3.99 | | | $ | 4.25 | | | $ | 4.36 | |
| | | | | | | | | | | | | | | | | | | | |
Total return(c) | | | 8.73 | %(d) | | | 12.28 | % | | | (4.47 | )%(e) | | | 1.96 | % | | | 8.99 | %(e) |
RATIOS TO AVERAGE NET ASSETS: | |
Net assets, end of the period (000’s) | | $ | 14,783 | | | $ | 11,977 | | | $ | 10,417 | | | $ | 10,338 | | | $ | 1 | |
Net expenses(f) | | | 0.70 | % | | | 0.72 | %(g) | | | 0.75 | %(h) | | | 0.75 | % | | | 0.75 | %(h)(i) |
Gross expenses | | | 0.88 | % | | | 0.82 | % | | | 0.89 | %(h) | | | 0.79 | % | | | 31.73 | %(h) |
Net investment income | | | 5.28 | % | | | 5.13 | % | | | 5.45 | %(h) | | | 4.65 | % | | | 5.19 | %(h) |
Portfolio turnover rate | | | 99 | %(j) | | | 48 | % | | | 17 | % | | | 55 | % | | | 46 | %(k) |
| * | For the three month period ended December 31, 2018 due to change in fiscal year end. |
| ** | From commencement of Class operations on November 30, 2016 through September 30, 2017. |
| (a) | Per share net investment income has been calculated using the average shares outstanding during the period. |
| (b) | The amount shown for a share outstanding does not correspond with the aggregate realized and unrealized gain(loss) on investments for the period due to the timing of sales and redemptions of fund shares in relation to fluctuating market values of investments of the Fund. |
| (c) | Had certain expenses not been waived/reimbursed during the period, total returns would have been lower. |
| (d) | Generally accepted accounting principles require certain adjustments to be made to the net assets of the Fund for financial reporting purposes only, and as such, the total returns based on the adjusted net asset values per share may differ from the total returns reported in the average annual total return table. |
| (e) | Periods less than one year are not annualized. |
| (f) | The investment adviser agreed to waive its fees and/or reimburse a portion of the Fund’s expenses during the period. Without this waiver/reimbursement, expenses would have been higher. |
| (g) | Effective July 1, 2019, the expense limit decreased from 0.75% to 0.70%. |
| (h) | Computed on an annualized basis for periods less than one year. |
| (i) | Effective July 1, 2017, the expense limit decreased to 0.75%. |
| (j) | The variation in the Fund’s turnover rate from 2019 to 2020 was primarily due to a significant repositioning of the portfolio as a result of increased market volatility. |
| (k) | Represents the Fund’s portfolio turnover rate for the year ended September 30, 2017. |
See accompanying notes to financial statements.
| 82
Financial Highlights (continued)
For a share outstanding throughout each period.
| | | | | | | | | | | | | | | | | | | | | | | | |
| | | High Income Fund—Class Y | |
| | | Year Ended
December 31,
2020 | | | Year Ended
December 31,
2019 | | | Period Ended
December 31,
2018* | | | Year Ended
September 30,
2018 | | | Year Ended
September 30,
2017 | | | Year Ended
September 30,
2016 | |
Net asset value, beginning of the period | | $ | 4.25 | | | $ | 3.98 | | | $ | 4.24 | | | $ | 4.36 | | | $ | 4.22 | | | $ | 3.98 | |
| | | | | | | | | | | | | | | | | | | | | | | | |
INCOME (LOSS) FROM INVESTMENT OPERATIONS: | |
Net investment income(a) | | | 0.22 | | | | 0.21 | | | | 0.06 | | | | 0.21 | | | | 0.23 | | | | 0.21 | |
Net realized and unrealized gain (loss) | | | 0.10 | (b) | | | 0.28 | | | | (0.25 | ) | | | (0.14 | ) | | | 0.12 | | | | 0.21 | |
| | | | | | | | | | | | | | | | | | | | | | | | |
Total from Investment Operations | | | 0.32 | | | | 0.49 | | | | (0.19 | ) | | | 0.07 | | | | 0.35 | | | | 0.42 | |
| | | | | | | | | | | | | | | | | | | | | | | | |
LESS DISTRIBUTIONS FROM: | |
Net investment income | | | (0.23 | ) | | | (0.22 | ) | | | (0.06 | ) | | | (0.19 | ) | | | (0.21 | ) | | | (0.17 | ) |
Net realized capital gains | | | — | | | | — | | | | (0.01 | ) | | | — | | | | — | | | | (0.01 | ) |
| | | | | | | | | | | | | | | | | | | | | | | | |
Total Distributions | | | (0.23 | ) | | | (0.22 | ) | | | (0.07 | ) | | | (0.19 | ) | | | (0.21 | ) | | | (0.18 | ) |
| | | | | | | | | | | | | | | | | | | | | | | | |
Net asset value, end of the period | | $ | 4.34 | | | $ | 4.25 | | | $ | 3.98 | | | $ | 4.24 | | | $ | 4.36 | | | $ | 4.22 | |
| | | | | | | | | | | | | | | | | | | | | | | | |
Total return(c) | | | 8.19 | % | | | 12.52 | % | | | (4.49 | )%(d) | | | 1.68 | % | | | 8.47 | % | | | 10.98 | % |
RATIOS TO AVERAGE NET ASSETS: | |
Net assets, end of the period (000’s) | | $ | 53,456 | | | $ | 108,315 | | | $ | 97,585 | | | $ | 127,699 | | | $ | 133,940 | | | $ | 129,169 | |
Net expenses(e) | | | 0.75 | % | | | 0.77 | %(f) | | | 0.80 | %(g) | | | 0.80 | % | | | 0.84 | %(h) | | | 0.85 | % |
Gross expenses | | | 0.98 | % | | | 0.93 | % | | | 1.02 | %(g) | | | 0.91 | % | | | 0.90 | % | | | 0.89 | % |
Net investment income | | | 5.32 | % | | | 5.07 | % | | | 5.39 | %(g) | | | 4.98 | % | | | 5.28 | % | | | 5.43 | % |
Portfolio turnover rate | | | 99 | %(i) | | | 48 | % | | | 17 | % | | | 55 | % | | | 46 | % | | | 38 | % |
| * | For the three month period ended December 31, 2018 due to change in fiscal year end. |
| (a) | Per share net investment income has been calculated using the average shares outstanding during the period. |
| (b) | The amount shown for a share outstanding does not correspond with the aggregate realized and unrealized gain (loss) on investments for the period due to the timing of sales and redemptions of fund shares in relation to fluctuating market values of investments of the Fund. |
| (c) | Had certain expenses not been waived/reimbursed during the period, total returns would have been lower. |
| (d) | Periods less than one year are not annualized. |
| (e) | The investment adviser agreed to waive its fees and/or reimburse a portion of the Fund’s expenses during the period. Without this waiver/reimbursement, expenses would have been higher. |
| (f) | Effective July 1, 2019, the expense limit decreased from 0.80% to 0.75%. |
| (g) | Computed on an annualized basis for periods less than one year. |
| (h) | Effective July 1, 2017, the expense limit decreased to 0.80%. |
| (i) | The variation in the Fund’s turnover rate from 2019 to 2020 was primarily due to a significant repositioning of the portfolio as a result of increased market volatility. |
See accompanying notes to financial statements.
83 |
Financial Highlights (continued)
For a share outstanding throughout each period.
| | | | | | | | | | | | | | | | | | | | |
| | | Intermediate Municipal Bond Fund—Class A | |
| | | Year Ended
December 31,
2020 | | | Year Ended
December 31,
2019 | | | Year Ended
December 31,
2018 | | | Year Ended
December 31,
2017 | | | Year Ended
December 31,
2016 | |
Net asset value, beginning of the period | | $ | 10.38 | | | $ | 9.97 | | | $ | 10.17 | | | $ | 9.89 | | | $ | 10.09 | |
| | | | | | | | | | | | | | | | | | | | |
INCOME (LOSS) FROM INVESTMENT OPERATIONS: | |
Net investment income(a) | | | 0.19 | | | | 0.24 | | | | 0.22 | | | | 0.19 | | | | 0.12 | |
Net realized and unrealized gain (loss) | | | 0.17 | | | | 0.41 | | | | (0.19 | ) | | | 0.28 | | | | (0.20 | ) |
| | | | | | | | | | | | | | | | | | | | |
Total from Investment Operations | | | 0.36 | | | | 0.65 | | | | 0.03 | | | | 0.47 | | | | (0.08 | ) |
| | | | | | | | | | | | | | | | | | | | |
LESS DISTRIBUTIONS FROM: | |
Net investment income | | | (0.19 | ) | | | (0.24 | ) | | | (0.23 | ) | | | (0.19 | ) | | | (0.12 | ) |
| | | | | | | | | | | | | | | | | | | | |
Net asset value, end of the period | | $ | 10.55 | | | $ | 10.38 | | | $ | 9.97 | | | $ | 10.17 | | | $ | 9.89 | |
| | | | | | | | | | | | | | | | | | | | |
Total return(b)(c) | | | 3.48 | % | | | 6.54 | % | | | 0.33 | % | | | 4.77 | % | | | (0.79 | )% |
RATIOS TO AVERAGE NET ASSETS: | |
Net assets, end of the period (000’s) | | $ | 8,941 | | | $ | 7,567 | | | $ | 6,019 | | | $ | 6,004 | | | $ | 5,474 | |
Net expenses(d) | | | 0.70 | % | | | 0.70 | % | | | 0.70 | % | | | 0.70 | % | | | 0.70 | % |
Gross expenses | | | 1.42 | % | | | 1.84 | % | | | 1.30 | % | | | 1.10 | % | | | 0.88 | % |
Net investment income | | | 1.78 | % | | | 2.31 | % | | | 2.24 | % | | | 1.87 | % | | | 1.19 | % |
Portfolio turnover rate | | | 41 | % | | | 11 | % | | | 65 | % | | | 34 | % | | | 48 | % |
| (a) | Per share net investment income has been calculated using the average shares outstanding during the period. |
| (b) | A sales charge for Class A shares is not reflected in total return calculations. |
| (c) | Had certain expenses not been waived/reimbursed during the period, total returns would have been lower. |
| (d) | The investment adviser agreed to waive its fees and/or reimburse a portion of the Fund’s expenses during the period. Without this waiver/reimbursement, expenses would have been higher. |
See accompanying notes to financial statements.
| 84
Financial Highlights (continued)
For a share outstanding throughout each period.
| | | | | | | | | | | | | | | | | | | | |
| | | Intermediate Municipal Bond Fund—Class C | |
| | | Year Ended
December 31,
2020 | | | Year Ended
December 31,
2019 | | | Year Ended
December 31,
2018 | | | Year Ended
December 31,
2017 | | | Year Ended
December 31,
2016 | |
Net asset value, beginning of the period | | $ | 10.38 | | | $ | 9.98 | | | $ | 10.18 | | | $ | 9.90 | | | $ | 10.09 | |
| | | | | | | | | | | | | | | | | | | | |
INCOME (LOSS) FROM INVESTMENT OPERATIONS: | |
Net investment income(a) | | | 0.11 | | | | 0.16 | | | | 0.15 | | | | 0.11 | | | | 0.04 | |
Net realized and unrealized gain (loss) | | | 0.17 | | | | 0.40 | | | | (0.19 | ) | | | 0.28 | | | | (0.18 | ) |
| | | | | | | | | | | | | | | | | | | | |
Total from Investment Operations | | | 0.28 | | | | 0.56 | | | | (0.04 | ) | | | 0.39 | | | | (0.14 | ) |
| | | | | | | | | | | | | | | | | | | | |
LESS DISTRIBUTIONS FROM: | |
Net investment income | | | (0.11 | ) | | | (0.16 | ) | | | (0.16 | ) | | | (0.11 | ) | | | (0.05 | ) |
| | | | | | | | | | | | | | | | | | | | |
Net asset value, end of the period | | $ | 10.55 | | | $ | 10.38 | | | $ | 9.98 | | | $ | 10.18 | | | $ | 9.90 | |
| | | | | | | | | | | | | | | | | | | | |
Total return(b)(c) | | | 2.71 | % | | | 5.64 | % | | | (0.42 | )% | | | 3.98 | % | | | (1.44 | )% |
RATIOS TO AVERAGE NET ASSETS: | |
Net assets, end of the period (000’s) | | $ | 1,050 | | | $ | 1,420 | | | $ | 1,675 | | | $ | 2,395 | | | $ | 4,015 | |
Net expenses(d) | | | 1.45 | % | | | 1.45 | % | | | 1.45 | % | | | 1.45 | % | | | 1.45 | % |
Gross expenses | | | 2.18 | % | | | 2.60 | % | | | 2.05 | % | | | 1.83 | % | | | 1.63 | % |
Net investment income | | | 1.08 | % | | | 1.57 | % | | | 1.49 | % | | | 1.10 | % | | | 0.44 | % |
Portfolio turnover rate | | | 41 | % | | | 11 | % | | | 65 | % | | | 34 | % | | | 48 | % |
| (a) | Per share net investment income has been calculated using the average shares outstanding during the period. |
| (b) | A contingent deferred sales charge for Class C shares is not reflected in total return calculations. |
| (c) | Had certain expenses not been waived/reimbursed during the period, total returns would have been lower. |
| (d) | The investment adviser agreed to waive its fees and/or reimburse a portion of the Fund’s expenses during the period. Without this waiver/reimbursement, expenses would have been higher. |
See accompanying notes to financial statements.
85 |
Financial Highlights (continued)
For a share outstanding throughout each period.
| | | | | | | | | | | | | | | | | | | | |
| | | Intermediate Municipal Bond Fund—Class Y | |
| | | Year Ended
December 31,
2020 | | | Year Ended
December 31,
2019 | | | Year Ended
December 31,
2018 | | | Year Ended
December 31,
2017 | | | Year Ended
December 31,
2016 | |
Net asset value, beginning of the period | | $ | 10.40 | | | $ | 9.99 | | | $ | 10.19 | | | $ | 9.90 | | | $ | 10.10 | |
| | | | | | | | | | | | | | | | | | | | |
INCOME (LOSS) FROM INVESTMENT OPERATIONS: | |
Net investment income(a) | | | 0.19 | | | | 0.26 | | | | 0.25 | | | | 0.21 | | | | 0.15 | |
Net realized and unrealized gain (loss) | | | 0.18 | | | | 0.41 | | | | (0.20 | ) | | | 0.29 | | | | (0.20 | ) |
| | | | | | | | | | | | | | | | | | | | |
Total from Investment Operations | | | 0.37 | | | | 0.67 | | | | 0.05 | | | | 0.50 | | | | (0.05 | ) |
| | | | | | | | | | | | | | | | | | | | |
LESS DISTRIBUTIONS FROM: | |
Net investment income | | | (0.21 | ) | | | (0.26 | ) | | | (0.25 | ) | | | (0.21 | ) | | | (0.15 | ) |
| | | | | | | | | | | | | | | | | | | | |
Net asset value, end of the period | | $ | 10.56 | | | $ | 10.40 | | | $ | 9.99 | | | $ | 10.19 | | | $ | 9.90 | |
| | | | | | | | | | | | | | | | | | | | |
Total return(b) | | | 3.63 | % | | | 6.80 | % | | | 0.58 | % | | | 5.13 | % | | | (0.55 | )% |
RATIOS TO AVERAGE NET ASSETS: | |
Net assets, end of the period (000’s) | | $ | 27,200 | | | $ | 10,039 | | | $ | 14,510 | | | $ | 28,960 | | | $ | 49,179 | |
Net expenses(c) | | | 0.45 | % | | | 0.45 | % | | | 0.45 | % | | | 0.45 | % | | | 0.45 | % |
Gross expenses | | | 1.16 | % | | | 1.60 | % | | | 1.04 | % | | | 0.83 | % | | | 0.63 | % |
Net investment income | | | 1.86 | % | | | 2.57 | % | | | 2.47 | % | | | 2.09 | % | | | 1.44 | % |
Portfolio turnover rate | | | 41 | % | | | 11 | % | | | 65 | % | | | 34 | % | | | 48 | % |
| (a) | Per share net investment income has been calculated using the average shares outstanding during the period. |
| (b) | Had certain expenses not been waived/reimbursed during the period, total returns would have been lower. |
| (c) | The investment adviser agreed to waive its fees and/or reimburse a portion of the Fund’s expenses during the period. Without this waiver/reimbursement, expenses would have been higher. |
See accompanying notes to financial statements.
| 86
Financial Highlights (continued)
For a share outstanding throughout each period.
| | | | |
| | | International Growth
Fund—Class A | |
| | | Period Ended
December 31,
2020* | |
Net asset value, beginning of the period | | $ | 10.00 | |
| | | | |
INCOME (LOSS) FROM INVESTMENT OPERATIONS: | |
Net investment income(a) | | | 0.01 | |
Net realized and unrealized gain (loss) | | | 0.13 | |
| | | | |
Total from Investment Operations | | | 0.14 | |
| | | | |
LESS DISTRIBUTIONS FROM: | |
Net investment income | | | (0.01 | ) |
| | | | |
Net asset value, end of the period | | $ | 10.13 | |
| | | | |
Total return(b)(c)(d) | | | 1.37 | % |
RATIOS TO AVERAGE NET ASSETS: | | | | |
Net assets, end of the period (000’s) | | $ | 1 | |
Net expenses(e)(f) | | | 1.20 | % |
Gross expenses(f) | | | 13.05 | % |
Net investment income(f) | | | 1.28 | % |
Portfolio turnover rate | | | 1 | % |
| * | From commencement of operations on December 15, 2020 through December 31, 2020. |
| (a) | Per share net investment income has been calculated using the average shares outstanding during the period. |
| (b) | A sales charge for Class A shares is not reflected in total return calculations. |
| (c) | Had certain expenses not been waived/reimbursed during the period, total returns would have been lower. |
| (d) | Periods less than one year are not annualized. |
| (e) | The investment adviser agreed to waive its fees and/or reimburse a portion of the Fund’s expenses during the period. Without this waiver/reimbursement, expenses would have been higher. |
| (f) | Computed on an annualized basis for periods less than one year. |
See accompanying notes to financial statements.
87 |
Financial Highlights (continued)
For a share outstanding throughout each period.
| | | | |
| | | International Growth
Fund—Class C | |
| | | Period Ended
December 31,
2020* | |
Net asset value, beginning of the period | | $ | 10.00 | |
| | | | |
INCOME (LOSS) FROM INVESTMENT OPERATIONS: | |
Net investment income(a) | | | 0.00 | (b) |
Net realized and unrealized gain (loss) | | | 0.13 | |
| | | | |
Total from Investment Operations | | | 0.13 | |
| | | | |
LESS DISTRIBUTIONS FROM: | |
Net investment income | | | (0.00 | )(b) |
| | | | |
Net asset value, end of the period | | $ | 10.13 | |
| | | | |
Total return(c)(d)(e) | | | 1.33 | % |
RATIOS TO AVERAGE NET ASSETS: | |
Net assets, end of the period (000’s) | | $ | 1 | |
Net expenses(f)(g) | | | 1.95 | % |
Gross expenses(g) | | | 13.78 | % |
Net investment(g) | | | 0.55 | % |
Portfolio turnover rate | | | 1 | % |
| * | From commencement of operations on December 15, 2020 through December 31, 2020. |
| (a) | Per share net investment income has been calculated using the average shares outstanding during the period. |
| (b) | Amount rounds to less than $0.01 per share. |
| (c) | A contingent deferred sales charge for Class C shares is not reflected in total return calculations. |
| (d) | Had certain expenses not been waived/reimbursed during the period, total returns would have been lower. |
| (e) | Periods less than one year are not annualized. |
| (f) | The investment adviser agreed to waive its fees and/or reimburse a portion of the Fund’s expenses during the period. Without this waiver/reimbursement, expenses would have been higher. |
| (g) | Computed on an annualized basis for periods less than one year. |
See accompanying notes to financial statements.
| 88
Financial Highlights (continued)
For a share outstanding throughout each period.
| | | | |
| | | International Growth
Fund—Class N | |
| | | Period Ended
December 31,
2020* | |
Net asset value, beginning of the period | | $ | 10.00 | |
| | | | |
INCOME (LOSS) FROM INVESTMENT OPERATIONS: | |
Net investment income(a) | | | 0.01 | |
Net realized and unrealized gain (loss) | | | 0.13 | |
| | | | |
Total from Investment Operations | | | 0.14 | |
| | | | |
LESS DISTRIBUTIONS FROM: | |
Net investment income | | | (0.01 | ) |
| | | | |
Net asset value, end of the period | | $ | 10.13 | |
| | | | |
Total return(b)(c) | | | 1.38 | % |
RATIOS TO AVERAGE NET ASSETS: | |
Net assets, end of the period (000’s) | | $ | 15,206 | |
Net expenses(d)(e) | | | 0.90 | % |
Gross expenses(e) | | | 6.48 | % |
Net investment income(e) | | | 1.43 | % |
Portfolio turnover rate | | | 1 | % |
| * | From commencement of operations on December 15, 2020 through December 31, 2020. |
| (a) | Per share net investment income has been calculated using the average shares outstanding during the period. |
| (b) | Had certain expenses not been waived/reimbursed during the period, total returns would have been lower. |
| (c) | Periods less than one year are not annualized. |
| (d) | The investment adviser agreed to waive its fees and/or reimburse a portion of the Fund’s expenses during the period. Without this waiver/reimbursement, expenses would have been higher. |
| (e) | Computed on an annualized basis for periods less than one year. |
See accompanying notes to financial statements.
89 |
Financial Highlights (continued)
For a share outstanding throughout each period.
| | | | |
| | | International Growth
Fund—Class Y | |
| | | Period Ended
December 31,
2020*
| |
Net asset value, beginning of the period | | $ | 10.00 | |
| | | | |
INCOME (LOSS) FROM INVESTMENT OPERATIONS: | |
Net investment income(a) | | | 0.01 | |
Net realized and unrealized gain (loss) | | | 0.13 | |
| | | | |
Total from Investment Operations | | | 0.14 | |
| | | | |
LESS DISTRIBUTIONS FROM: | |
Net investment income | | | (0.01 | ) |
| | | | |
Net asset value, end of the period | | $ | 10.13 | |
| | | | |
Total return(b)(c) | | | 1.38 | % |
RATIOS TO AVERAGE NET ASSETS: | |
Net assets, end of the period (000’s) | | $ | 12 | |
Net expenses(d)(e) | | | 0.95 | % |
Gross expenses(e) | | | 12.58 | % |
Net investment income(e) | | | 1.63 | % |
Portfolio turnover rate | | | 1 | % |
| * | From commencement of operations on December 15, 2020 through December 31, 2020. |
| (a) | Per share net investment income has been calculated using the average shares outstanding during the period. |
| (b) | Had certain expenses not been waived/reimbursed during the period, total returns would have been lower. |
| (c) | Periods less than one year are not annualized. |
| (d) | The investment adviser agreed to waive its fees and/or reimburse a portion of the Fund’s expenses during the period. Without this waiver/reimbursement, expenses would have been higher. |
| (e) | Computed on an annualized basis for periods less than one year. |
See accompanying notes to financial statements.
| 90
Financial Highlights (continued)
For a share outstanding throughout each period.
| | | | | | | | | | | | | | | | | | | | | | | | |
| | | Investment Grade Bond Fund—Class A | |
| | | Year Ended
December 31,
2020
| | | Year Ended
December 31,
2019
| | | Period Ended
December 31,
2018*
| | | Year Ended
September 30,
2018
| | | Year Ended
September 30,
2017
| | | Year Ended
September 30,
2016
| |
Net asset value, beginning of the period | | $ | 11.33 | | | $ | 10.77 | | | $ | 10.98 | | | $ | 11.30 | | | $ | 11.59 | | | $ | 11.10 | |
| | | | | | | | | | | | | | | | | | | | | | | | |
INCOME (LOSS) FROM INVESTMENT OPERATIONS: | | | | | | | | | | | | | | | | | | | | | | | | |
Net investment income(a) | | | 0.32 | | | | 0.35 | | | | 0.08 | | | | 0.30 | | | | 0.36 | | | | 0.39 | |
Net realized and unrealized gain (loss) | | | 0.94 | | | | 0.58 | | | | (0.16 | ) | | | (0.28 | ) | | | 0.05 | | | | 0.48 | |
| | | | | | | | | | | | | | | | | | | | | | | | |
Total from Investment Operations | | | 1.26 | | | | 0.93 | | | | (0.08 | ) | | | 0.02 | | | | 0.41 | | | | 0.87 | |
| | | | | | | | | | | | | | | | | | | | | | | | |
LESS DISTRIBUTIONS FROM: | | | | | | | | | | | | | | | | | | | | | | | | |
Net investment income | | | (0.32 | ) | | | (0.36 | ) | | | (0.08 | ) | | | (0.21 | ) | | | (0.26 | ) | | | (0.23 | ) |
Net realized capital gains | | | (0.62 | ) | | | (0.01 | ) | | | (0.05 | ) | | | (0.13 | ) | | | (0.44 | ) | | | (0.15 | ) |
| | | | | | | | | | | | | | | | | | | | | | | | |
Total Distributions | | | (0.94 | ) | | | (0.37 | ) | | | (0.13 | ) | | | (0.34 | ) | | | (0.70 | ) | | | (0.38 | ) |
| | | | | | | | | | | | | | | | | | | | | | | | |
Net asset value, end of the period | | $ | 11.65 | | | $ | 11.33 | | | $ | 10.77 | | | $ | 10.98 | | | $ | 11.30 | | | $ | 11.59 | |
| | | | | | | | | | | | | | | | | | | | | | | | |
Total return(b) | | | 11.41 | %(c) | | | 8.78 | %(c) | | | (0.66 | )%(c)(d) | | | 0.19 | %(c) | | | 3.88 | % | | | 8.06 | % |
RATIOS TO AVERAGE NET ASSETS: | | | | | | | | | | | | | | | | | | | | | | | | |
Net assets, end of the period (000’s) | | $ | 872,976 | | | $ | 772,485 | | | $ | 721,110 | | | $ | 777,391 | | | $ | 902,955 | | | $ | 1,130,260 | |
Net expenses | | | 0.76 | %(e)(f) | | | 0.77 | %(e)(g) | | | 0.78 | %(e)(h) | | | 0.80 | %(e)(i) | | | 0.82 | %(j) | | | 0.85 | % |
Gross expenses | | | 0.80 | % | | | 0.81 | % | | | 0.82 | %(h) | | | 0.82 | % | | | 0.82 | % | | | 0.85 | % |
Net investment income | | | 2.73 | % | | | 3.10 | % | | | 3.09 | %(h) | | | 2.73 | % | | | 3.23 | % | | | 3.49 | % |
Portfolio turnover rate | | | 70 | %(l) | | | 44 | %(k) | | | 39 | %(k) | | | 3 | % | | | 10 | % | | | 11 | % |
| * | For the three month period ended December 31, 2018 due to change in fiscal year end. |
| (a) | Per share net investment income has been calculated using the average shares outstanding during the period. |
| (b) | A sales charge for Class A shares is not reflected in total return calculations. |
| (c) | Had certain expenses not been waived/reimbursed during the period, total returns would have been lower. |
| (d) | Periods less than one year are not annualized. |
| (e) | The investment adviser agreed to waive its fees and/or reimburse a portion of the Fund’s expenses during the period. Without this waiver/reimbursement, expenses would have been higher. |
| (f) | Effective July 1, 2020, the expense limit decreased from 0.76% to 0.75%. See Note 6 of Notes to Financial Statements. |
| (g) | Effective July 1, 2019, the expense limit decreased from 0.78% to 0.76%. |
| (h) | Computed on an annualized basis for periods less than one year. |
| (i) | Effective July 1, 2018, the expense limit decreased to 0.78%. |
| (j) | Effective July 1, 2017, the expense limit decreased to 0.80%. |
| (k) | The variation in the Fund’s turnover rate from the year ended September 30, 2018 to the period ended December 31, 2018 was primarily due to changes in the investment strategy and portfolio management team of the Fund. During 2019, turnover has remained elevated due to a continued repositioning of the Fund. |
| (l) | The variation in the Fund’s turnover rate from 2019 to 2020 was primarily due to a significant repositioning of the portfolio as a result of increased market volatility. |
See accompanying notes to financial statements.
91 |
Financial Highlights (continued)
For a share outstanding throughout each period.
| | | | | | | | | | | | | | | | | | | | | | | | |
| | | Investment Grade Bond Fund—Class C | |
| | | Year Ended
December 31,
2020
| | | Year Ended
December 31,
2019
| | | Period Ended
December 31,
2018*
| | | Year Ended
September 30,
2018
| | | Year Ended
September 30,
2017
| | | Year Ended
September 30,
2016
| |
Net asset value, beginning of the period | | $ | 11.20 | | | $ | 10.65 | | | $ | 10.86 | | | $ | 11.19 | | | $ | 11.48 | | | $ | 11.00 | |
| | | | | | | | | | | | | | | | | | | | | | | | |
INCOME (LOSS) FROM INVESTMENT OPERATIONS: | | | | | | | | | | | | | | | | | | | | | | | | |
Net investment income(a) | | | 0.23 | | | | 0.26 | | | | 0.06 | | | | 0.22 | | | | 0.27 | | | | 0.30 | |
Net realized and unrealized gain (loss) | | | 0.93 | | | | 0.58 | | | | (0.16 | ) | | | (0.28 | ) | | | 0.06 | | | | 0.47 | |
| | | | | | | | | | | | | | | | | | | | | | | | |
Total from Investment Operations | | | 1.16 | | | | 0.84 | | | | (0.10 | ) | | | (0.06 | ) | | | 0.33 | | | | 0.77 | |
| | | | | | | | | | | | | | | | | | | | | | | | |
LESS DISTRIBUTIONS FROM: | | | | | | | | | | | | | | | | | | | | | | | | |
Net investment income | | | (0.23 | ) | | | (0.28 | ) | | | (0.06 | ) | | | (0.14 | ) | | | (0.18 | ) | | | (0.14 | ) |
Net realized capital gains | | | (0.62 | ) | | | (0.01 | ) | | | (0.05 | ) | | | (0.13 | ) | | | (0.44 | ) | | | (0.15 | ) |
| | | | | | | | | | | | | | | | | | | | | | | | |
Total Distributions | | | (0.85 | ) | | | (0.29 | ) | | | (0.11 | ) | | | (0.27 | ) | | | (0.62 | ) | | | (0.29 | ) |
| | | | | | | | | | | | | | | | | | | | | | | | |
Net asset value, end of the period | | $ | 11.51 | | | $ | 11.20 | | | $ | 10.65 | | | $ | 10.86 | | | $ | 11.19 | | | $ | 11.48 | |
| | | | | | | | | | | | | | | | | | | | | | | | |
Total return(b) | | | 10.61 | %(c) | | | 7.94 | %(c) | | | (0.86 | )%(c)(d) | | | (0.53 | )%(c) | | | 3.12 | % | | | 7.18 | % |
RATIOS TO AVERAGE NET ASSETS: | | | | | | | | | | | | | | | | | | | | | | | | |
Net assets, end of the period (000’s) | | $ | 132,606 | | | $ | 204,395 | | | $ | 366,068 | | | $ | 412,788 | | | $ | 689,798 | | | $ | 1,001,522 | |
Net expenses | | | 1.51 | %(e)(f) | | | 1.52 | %(e)(g) | | | 1.53 | %(e)(h) | | | 1.55 | %(e)(i) | | | 1.57 | %(j) | | | 1.60 | % |
Gross expenses | | | 1.55 | % | | | 1.56 | % | | | 1.57 | %(h) | | | 1.57 | % | | | 1.57 | % | | | 1.60 | % |
Net investment income | | | 2.01 | % | | | 2.35 | % | | | 2.34 | %(h) | | | 1.96 | % | | | 2.49 | % | | | 2.74 | % |
Portfolio turnover rate | | | 70 | %(l) | | | 44 | %(k) | | | 39 | %(k) | | | 3 | % | | | 10 | % | | | 11 | % |
| * | For the three month period ended December 31, 2018 due to change in fiscal year end. |
| (a) | Per share net investment income has been calculated using the average shares outstanding during the period. |
| (b) | A contingent deferred sales charge for Class C shares is not reflected in total return calculations. |
| (c) | Had certain expenses not been waived/reimbursed during the period, total returns would have been lower. |
| (d) | Periods less than one year are not annualized. |
| (e) | The investment adviser agreed to waive its fees and/or reimburse a portion of the Fund’s expenses during the period. Without this waiver/reimbursement, expenses would have been higher. |
| (f) | Effective July 1, 2020, the expense limit decreased from 1.51% to 1.50%. See Note 6 of Notes to Financial Statements. |
| (g) | Effective July 1, 2019, the expense limit decreased from 1.53% to 1.51%. |
| (h) | Computed on an annualized basis for periods less than one year. |
| (i) | Effective July 1, 2018, the expense limit decreased to 1.53%. |
| (j) | Effective July 1, 2017, the expense limit decreased to 1.55%. |
| (k) | The variation in the Fund’s turnover rate from the year ended September 30, 2018 to the period ended December 31, 2018 was primarily due to changes in the investment strategy and portfolio management team of the Fund. During 2019, turnover has remained elevated due to a continued repositioning of the Fund. |
| (l) | The variation in the Fund’s turnover rate from 2019 to 2020 was primarily due to a significant repositioning of the portfolio as a result of increased market volatility. |
See accompanying notes to financial statements.
| 92
Financial Highlights (continued)
For a share outstanding throughout each period.
| | | | | | | | | | | | | | | | | | | | | | | | |
| | | Investment Grade Bond Fund—Class N | |
| | | Year Ended
December 31,
2020 | | | Year Ended
December 31,
2019 | | | Period Ended
December 31,
2018* | | | Year Ended
September 30,
2018 | | | Year Ended
September 30,
2017 | | | Year Ended
September 30,
2016 | |
Net asset value, beginning of the period | | $ | 11.33 | | | $ | 10.78 | | | $ | 10.98 | | | $ | 11.30 | | | $ | 11.58 | | | $ | 11.11 | |
| | | | | | | | | | | | | | | | | | | | | | | | |
INCOME (LOSS) FROM INVESTMENT OPERATIONS: | | | | | | | | | | | | | | | | | | | | | | | | |
Net investment income(a) | | | 0.35 | | | | 0.38 | | | | 0.09 | | | | 0.34 | | | | 0.39 | | | | 0.43 | |
Net realized and unrealized gain (loss) | | | 0.94 | | | | 0.58 | | | | (0.15 | ) | | | (0.28 | ) | | | 0.07 | | | | 0.47 | |
| | | | | | | | | | | | | | | | | | | | | | | | |
Total from Investment Operations | | | 1.29 | | | | 0.96 | | | | (0.06 | ) | | | 0.06 | | | | 0.46 | | | | 0.90 | |
| | | | | | | | | | | | | | | | | | | | | | | | |
LESS DISTRIBUTIONS FROM: | | | | | | | | | | | | | | | | | | | | | | | | |
Net investment income | | | (0.35 | ) | | | (0.40 | ) | | | (0.09 | ) | | | (0.25 | ) | | | (0.30 | ) | | | (0.28 | ) |
Net realized capital gains | | | (0.62 | ) | | | (0.01 | ) | | | (0.05 | ) | | | (0.13 | ) | | | (0.44 | ) | | | (0.15 | ) |
| | | | | | | | | | | | | | | | | | | | | | | | |
Total Distributions | | | (0.97 | ) | | | (0.41 | ) | | | (0.14 | ) | | | (0.38 | ) | | | (0.74 | ) | | | (0.43 | ) |
| | | | | | | | | | | | | | | | | | | | | | | | |
Net asset value, end of the period | | $ | 11.65 | | | $ | 11.33 | | | $ | 10.78 | | | $ | 10.98 | | | $ | 11.30 | | | $ | 11.58 | |
| | | | | | | | | | | | | | | | | | | | | | | | |
Total return | | | 11.74 | %(b) | | | 9.11 | % | | | (0.58 | )%(c) | | | 0.50 | % | | | 4.34 | % | | | 8.31 | % |
RATIOS TO AVERAGE NET ASSETS: | | | | | | | | | | | | | | | | | | | | | | | | |
Net assets, end of the period (000’s) | | $ | 1,188,772 | | | $ | 1,367,172 | | | $ | 1,216,690 | | | $ | 1,251,189 | | | $ | 1,203,169 | | | $ | 47,343 | |
Net expenses | | | 0.46 | %(d)(e) | | | 0.47 | %(f) | | | 0.48 | %(g) | | | 0.47 | %(h) | | | 0.48 | %(i) | | | 0.47 | % |
Gross expenses | | | 0.47 | % | | | 0.47 | % | | | 0.48 | %(g) | | | 0.47 | % | | | 0.48 | % | | | 0.47 | % |
Net investment income | | | 3.04 | % | | | 3.40 | % | | | 3.40 | %(g) | | | 3.05 | % | | | 3.51 | % | | | 3.88 | % |
Portfolio turnover rate | | | 70 | %(k) | | | 44 | %(j) | | | 39 | %(j) | | | 3 | % | | | 10 | % | | | 11 | % |
| * | For the three month period ended December 31, 2018 due to change in fiscal year end. |
| (a) | Per share net investment income has been calculated using the average shares outstanding during the period. |
| (b) | Had certain expenses not been waived/reimbursed during the period, total returns would have been lower. |
| (c) | Periods less than one year are not annualized. |
| (d) | The investment adviser agreed to waive its fees and/or reimburse a portion of the Fund’s expenses during the period. Without this waiver/reimbursement, expenses would have been higher. |
| (e) | Effective July 1, 2020, the expense limit decreased from 0.46% to 0.45%. See Note 6 of Notes to Financial Statements. |
| (f) | Effective July 1, 2019, the expense limit decreased from 0.48% to 0.46%. |
| (g) | Computed on an annualized basis for periods less than one year. |
| (h) | Effective July 1, 2018, the expense limit decreased to 0.48%. |
| (i) | Effective July 1, 2017, the expense limit decreased to 0.50%. |
| (j) | The variation in the Fund’s turnover rate from the year ended September 30, 2018 to the period ended December 31, 2018 was primarily due to changes in the investment strategy and portfolio management team of the Fund. During 2019, turnover has remained elevated due to a continued repositioning of the Fund. |
| (k) | The variation in the Fund’s turnover rate from 2019 to 2020 was primarily due to a significant repositioning of the portfolio as a result of increased market volatility. |
See accompanying notes to financial statements.
93 |
Financial Highlights (continued)
For a share outstanding throughout each period.
| | | | | | | | | | | | | | | | | | | | | | | | |
| | | Investment Grade Bond Fund—Class Y | |
| | | Year Ended
December 31,
2020 | | | Year Ended
December 31,
2019 | | | Period Ended
December 31,
2018* | | | Year Ended
September 30,
2018 | | | Year Ended
September 30,
2017 | | | Year Ended
September 30,
2016 | |
Net asset value, beginning of the period | | $ | 11.34 | | | $ | 10.78 | | | $ | 10.99 | | | $ | 11.31 | | | $ | 11.59 | | | $ | 11.11 | |
| | | | | | | | | | | | | | | | | | | | | | | | |
INCOME (LOSS) FROM INVESTMENT OPERATIONS: | | | | | | | | | | | | | | | | | | | | | | | | |
Net investment income(a) | | | 0.35 | | | | 0.37 | | | | 0.09 | | | | 0.33 | | | | 0.39 | | | | 0.42 | |
Net realized and unrealized gain (loss) | | | 0.94 | | | | 0.59 | | | | (0.16 | ) | | | (0.28 | ) | | | 0.06 | | | | 0.47 | |
| | | | | | | | | | | | | | | | | | | | | | | | |
Total from Investment Operations | | | 1.29 | | | | 0.96 | | | | (0.07 | ) | | | 0.05 | | | | 0.45 | | | | 0.89 | |
| | | | | | | | | | | | | | | | | | | | | | | | |
LESS DISTRIBUTIONS FROM: | | | | | | | | | | | | | | | | | | | | | | | | |
Net investment income | | | (0.35 | ) | | | (0.39 | ) | | | (0.09 | ) | | | (0.24 | ) | | | (0.29 | ) | | | (0.26 | ) |
Net realized capital gains | | | (0.62 | ) | | | (0.01 | ) | | | (0.05 | ) | | | (0.13 | ) | | | (0.44 | ) | | | (0.15 | ) |
| | | | | | | | | | | | | | | | | | | | | | | | |
Total Distributions | | | (0.97 | ) | | | (0.40 | ) | | | (0.14 | ) | | | (0.37 | ) | | | (0.73 | ) | | | (0.41 | ) |
| | | | | | | | | | | | | | | | | | | | | | | | |
Net asset value, end of the period | | $ | 11.66 | | | $ | 11.34 | | | $ | 10.78 | | | $ | 10.99 | | | $ | 11.31 | | | $ | 11.59 | |
| | | | | | | | | | | | | | | | | | | | | | | | |
Total return | | | 11.68 | %(b) | | | 9.04 | %(b) | | | (0.59 | )%(b)(c) | | | 0.43 | %(b) | | | 4.24 | % | | | 8.25 | % |
RATIOS TO AVERAGE NET ASSETS: | | | | | | | | | | | | | | | | | | | | | | | | |
Net assets, end of the period (000’s) | | $ | 3,704,948 | | | $ | 3,118,505 | | | $ | 2,912,537 | | | $ | 3,001,906 | | | $ | 3,453,137 | | | $ | 4,571,167 | |
Net expenses | | | 0.51 | %(d)(e) | | | 0.52 | %(d)(f) | | | 0.53 | %(d)(g) | | | 0.55 | %(d)(h) | | | 0.57 | %(i) | | | 0.60 | % |
Gross expenses | | | 0.55 | % | | | 0.56 | % | | | 0.57 | %(g) | | | 0.57 | % | | | 0.57 | % | | | 0.60 | % |
Net investment income | | | 2.98 | % | | | 3.35 | % | | | 3.35 | %(g) | | | 2.98 | % | | | 3.48 | % | | | 3.74 | % |
Portfolio turnover rate | | | 70 | %(k) | | | 44 | %(j) | | | 39 | %(j) | | | 3 | % | | | 10 | % | | | 11 | % |
| * | For the three month period ended December 31, 2018 due to change in fiscal year end. |
| (a) | Per share net investment income has been calculated using the average shares outstanding during the period. |
| (b) | Had certain expenses not been waived/reimbursed during the period, total returns would have been lower. |
| (c) | Periods less than one year are not annualized. |
| (d) | The investment adviser agreed to waive its fees and/or reimburse a portion of the Fund’s expenses during the period. Without this waiver/reimbursement, expenses would have been higher. |
| (e) | Effective July 1, 2020, the expense limit decreased from 0.51% to 0.50%. See Note 6 of Notes to Financial Statements. |
| (f) | Effective July 1, 2019, the expense limit decreased from 0.53% to 0.51%. |
| (g) | Computed on an annualized basis for periods less than one year. |
| (h) | Effective July 1, 2018, the expense limit decreased to 0.53%. |
| (i) | Effective July 1, 2017, the expense limit decreased to 0.55%. |
| (j) | The variation in the Fund’s turnover rate from the year ended September 30, 2018 to the period ended December 31, 2018 was primarily due to changes in the investment strategy and portfolio management team of the Fund. During 2019, turnover has remained elevated due to a continued repositioning of the Fund. |
| (k) | The variation in the Fund’s turnover rate from 2019 to 2020 was primarily due to a significant repositioning of the portfolio as a result of increased market volatility. |
See accompanying notes to financial statements.
| 94
Financial Highlights (continued)
For a share outstanding throughout each period.
| | | | | | | | | | | | | | | | | | | | | | | | |
| | | Investment Grade Bond Fund—Admin Class | |
| | | Year Ended
December 31,
2020
| | | Year Ended
December 31,
2019
| | | Period Ended
December 31,
2018*
| | | Year Ended
September 30,
2018
| | | Year Ended
September 30,
2017
| | | Year Ended
September 30,
2016
| |
Net asset value, beginning of the period | | $ | 11.30 | | | $ | 10.75 | | | $ | 10.95 | | | $ | 11.28 | | | $ | 11.56 | | | $ | 11.08 | |
| | | | | | | | | | | | | | | | | | | | | | | | |
INCOME (LOSS) FROM INVESTMENT OPERATIONS: | | | | | | | | | | | | | | | | | | | | | | | | |
Net investment income(a) | | | 0.29 | | | | 0.32 | | | | 0.08 | | | | 0.28 | | | | 0.34 | | | | 0.37 | |
Net realized and unrealized gain (loss) | | | 0.94 | | | | 0.58 | | | | (0.15 | ) | | | (0.28 | ) | | | 0.06 | | | | 0.47 | |
| | | | | | | | | | | | | | | | | | | | | | | | |
Total from Investment Operations | | | 1.23 | | | | 0.90 | | | | (0.07 | ) | | | 0.00 | (b) | | | 0.40 | | | | 0.84 | |
| | | | | | | | | | | | | | | | | | | | | | | | |
LESS DISTRIBUTIONS FROM: | | | | | | | | | | | | | | | | | | | | | | | | |
Net investment income | | | (0.29 | ) | | | (0.34 | ) | | | (0.08 | ) | | | (0.20 | ) | | | (0.24 | ) | | | (0.21 | ) |
Net realized capital gains | | | (0.62 | ) | | | (0.01 | ) | | | (0.05 | ) | | | (0.13 | ) | | | (0.44 | ) | | | (0.15 | ) |
| | | | | | | | | | | | | | | | | | | | | | | | |
Total Distributions | | | (0.91 | ) | | | (0.35 | ) | | | (0.13 | ) | | | (0.33 | ) | | | (0.68 | ) | | | (0.36 | ) |
| | | | | | | | | | | | | | | | | | | | | | | | |
Net asset value, end of the period | | $ | 11.62 | | | $ | 11.30 | | | $ | 10.75 | | | $ | 10.95 | | | $ | 11.28 | | | $ | 11.56 | |
| | | | | | | | | | | | | | | | | | | | | | | | |
Total return | | | 11.17 | %(c) | | | 8.43 | %(c) | | | (0.63 | )%(c)(d) | | | (0.07 | )%(c) | | | 3.76 | %(c) | | | 7.73 | % |
RATIOS TO AVERAGE NET ASSETS: | | | | | | | | | | | | | | | | | | | | | | | | |
Net assets, end of the period (000’s) | | $ | 125,460 | | | $ | 111,439 | | | $ | 111,864 | | | $ | 115,301 | | | $ | 25,521 | | | $ | 35,294 | |
Net expenses | | | 1.01 | %(e)(f) | | | 1.02 | %(e)(g) | | | 1.03 | %(e)(h) | | | 1.02 | %(e)(i)(j) | | | 1.02 | %(e)(k)(l) | | | 1.07 | %(m) |
Gross expenses | | | 1.05 | % | | | 1.06 | % | | | 1.07 | %(h) | | | 1.05 | %(j) | | | 1.03 | %(k) | | | 1.07 | %(m) |
Net investment income | | | 2.48 | % | | | 2.85 | % | | | 2.85 | %(h) | | | 2.56 | % | | | 3.03 | % | | | 3.27 | % |
Portfolio turnover rate | | | 70 | %(o) | | | 44 | %(n) | | | 39 | %(n) | | | 3 | % | | | 10 | % | | | 11 | % |
| * | For the three month period ended December 31, 2018 due to change in fiscal year end. |
| (a) | Per share net investment income has been calculated using the average shares outstanding during the period. |
| (b) | Amount rounds to less than $0.01 per share. |
| (c) | Had certain expenses not been waived/reimbursed during the period, total returns would have been lower. |
| (d) | Periods less than one year are not annualized. |
| (e) | The investment adviser agreed to waive its fees and/or reimburse a portion of the Fund’s expenses during the period. Without this waiver/reimbursement, expenses would have been higher. |
| (f) | Effective July 1, 2020, the expense limit decreased from 1.01% to 1.00%. See Note 6 of Notes to Financial Statements. |
| (g) | Effective July 1, 2019, the expense limit decreased from 1.03% to 1.01%. |
| (h) | Computed on an annualized basis for periods less than one year. |
| (i) | Effective July 1, 2018, the expense limit decreased to 1.03%. |
| (j) | Includes refund of prior year service fee of 0.02%. |
| (k) | Includes refund of prior year service fee of 0.05%. |
| (l) | Effective July 1, 2017, the expense limit decreased to 1.05%. |
| (m) | Includes refund of prior year service fee of 0.03%. |
| (n) | The variation in the Fund’s turnover rate from the year ended September 30, 2018 to the period ended December 31, 2018 was primarily due to changes in the investment strategy and portfolio management team of the Fund. During 2019, turnover has remained elevated due to a continued repositioning of the Fund. |
| (o) | The variation in the Fund’s turnover rate from 2019 to 2020 was primarily due to a significant repositioning of the portfolio as a result of increased market volatility. |
See accompanying notes to financial statements.
95 |
Financial Highlights (continued)
For a share outstanding throughout each period.
| | | | | | | | | | | | | | | | | | | | |
| | | Strategic Alpha Fund—Class A | |
| | | Year Ended
December 31,
2020 | | | Year Ended
December 31,
2019 | | | Year Ended
December 31,
2018 | | | Year Ended
December 31,
2017 | | | Year Ended
December 31,
2016 | |
Net asset value, beginning of the period | | $ | 9.69 | | | $ | 9.62 | | | $ | 9.92 | | | $ | 9.86 | | | $ | 9.45 | |
| | | | | | | | | | | | | | | | | | | | |
INCOME (LOSS) FROM INVESTMENT OPERATIONS: | |
Net investment income(a) | | | 0.28 | | | | 0.30 | | | | 0.33 | | | | 0.32 | | | | 0.30 | |
Net realized and unrealized gain (loss) | | | 0.67 | | | | 0.04 | | | | (0.30 | ) | | | (0.01 | ) | | | 0.31 | |
| | | | | | | | | | | | | | | | | | | | |
Total from Investment Operations | | | 0.95 | | | | 0.34 | | | | 0.03 | | | | 0.31 | | | | 0.61 | |
| | | | | | | | | | | | | | | | | | | | |
LESS DISTRIBUTIONS FROM: | |
Net investment income | | | (0.21 | ) | | | (0.27 | ) | | | (0.33 | ) | | | (0.25 | ) | | | (0.20 | ) |
| | | | | | | | | | | | | | | | | | | | |
Net asset value, end of the period | | $ | 10.43 | | | $ | 9.69 | | | $ | 9.62 | | | $ | 9.92 | | | $ | 9.86 | |
| | | | | | | | | | | | | | | | | | | | |
Total return(b) | | | 9.97 | % | | | 3.58 | % | | | 0.39 | % | | | 3.22 | %(c) | | | 6.57 | % |
RATIOS TO AVERAGE NET ASSETS: | |
Net assets, end of the period (000’s) | | $ | 36,067 | | | $ | 48,815 | | | $ | 36,528 | | | $ | 28,020 | | | $ | 67,746 | |
Net expenses | | | 0.99 | % | | | 0.99 | % | | | 1.00 | %(d) | | | 1.05 | %(e)(f) | | | 1.10 | % |
Gross expenses | | | 0.99 | % | | | 0.99 | % | | | 1.00 | %(d) | | | 1.06 | % | | | 1.10 | % |
Net investment income | | | 2.81 | % | | | 3.10 | % | | | 3.29 | % | | | 3.26 | % | | | 3.14 | % |
Portfolio turnover rate | | | 498 | % | | | 414 | %(g) | | | 379 | %(g) | | | 178 | %(h) | | | 72 | % |
| (a) | Per share net investment income has been calculated using the average shares outstanding during the period. |
| (b) | A sales charge for Class A shares is not reflected in total return calculations. |
| (c) | Had certain expenses not been waived/reimbursed during the period, total returns would have been lower. |
| (d) | Includes fee/expense recovery of less than 0.01%. |
| (e) | The investment adviser agreed to waive its fees and/or reimburse a portion of the Fund’s expenses during the period. Without this waiver/reimbursement, expenses would have been higher. |
| (f) | Effective July 1, 2017, the expense limit decreased from 1.30% to 1.00%. |
| (g) | The variation in the Fund’s turnover rate from 2017 to 2018 was primarily due to a repositioning of the portfolio. During 2019, turnover has remained elevated due to a larger volume of short duration securities held by the Fund. |
| (h) | The variation in the Fund’s turnover rate from 2016 to 2017 was primarily due to a repositioning of the portfolio. |
See accompanying notes to financial statements.
| 96
Financial Highlights (continued)
For a share outstanding throughout each period.
| | | | | | | | | | | | | | | | | | | | |
| | | Strategic Alpha Fund—Class C | |
| | | Year Ended
December 31,
2020 | | | Year Ended
December 31,
2019 | | | Year Ended
December 31,
2018 | | | Year Ended
December 31,
2017 | | | Year Ended
December 31,
2016 | |
Net asset value, beginning of the period | | $ | 9.66 | | | $ | 9.58 | | | $ | 9.88 | | | $ | 9.82 | | | $ | 9.42 | |
| | | | | | | | | | | | | | | | | | | | |
INCOME (LOSS) FROM INVESTMENT OPERATIONS: | |
Net investment income(a) | | | 0.21 | | | | 0.23 | | | | 0.26 | | | | 0.25 | | | | 0.23 | |
Net realized and unrealized gain (loss) | | | 0.66 | | | | 0.04 | | | | (0.31 | ) | | | 0.00 | (b)(c) | | | 0.30 | |
| | | | | | | | | | | | | | | | | | | | |
Total from Investment Operations | | | 0.87 | | | | 0.27 | | | | (0.05 | ) | | | 0.25 | | | | 0.53 | |
| | | | | | | | | | | | | | | | | | | | |
LESS DISTRIBUTIONS FROM: | |
Net investment income | | | (0.13 | ) | | | (0.19 | ) | | | (0.25 | ) | | | (0.19 | ) | | | (0.13 | ) |
| | | | | | | | | | | | | | | | | | | | |
Net asset value, end of the period | | $ | 10.40 | | | $ | 9.66 | | | $ | 9.58 | | | $ | 9.88 | | | $ | 9.82 | |
| | | | | | | | | | | | | | | | | | | | |
Total return(d) | | | 9.12 | % | | | 2.87 | %(e) | | | (0.42 | )% | | | 2.53 | % | | | 5.70 | % |
RATIOS TO AVERAGE NET ASSETS: | |
Net assets, end of the period (000’s) | | $ | 8,962 | | | $ | 16,337 | | | $ | 26,883 | | | $ | 33,759 | | | $ | 45,674 | |
Net expenses | | | 1.74 | % | | | 1.73 | %(f) | | | 1.75 | %(g) | | | 1.81 | %(h) | | | 1.85 | % |
Gross expenses | | | 1.74 | % | | | 1.74 | % | | | 1.75 | %(g) | | | 1.81 | % | | | 1.85 | % |
Net investment income | | | 2.14 | % | | | 2.33 | % | | | 2.61 | % | | | 2.52 | % | | | 2.40 | % |
Portfolio turnover rate | | | 498 | % | | | 414 | %(i) | | | 379 | %(i) | | | 178 | %(j) | | | 72 | % |
| (a) | Per share net investment income has been calculated using the average shares outstanding during the period. |
| (b) | The amount shown for a share outstanding does not correspond with the aggregate realized and unrealized gain (loss) on investments for the period due to the timing of sales and redemptions of fund shares in relation to fluctuating market values of investments of the Fund. |
| (c) | Amount rounds to less than $0.01 per share. |
| (d) | A contingent deferred sales charge for Class C shares is not reflected in total return calculations. |
| (e) | Had certain expenses not been waived/reimbursed during the period, total returns would have been lower. |
| (f) | The administrator agreed to waive its fees and/or reimburse a portion of the Fund’s expenses during the period. Without this waiver/reimbursement, expenses would have been higher. |
| (g) | Includes fee/expense recovery of less than 0.01%. |
| (h) | Effective July 1, 2017, the expense limit decreased from 2.05% to 1.75%. |
| (i) | The variation in the Fund’s turnover rate from 2017 to 2018 was primarily due to a repositioning of the portfolio. During 2019, turnover has remained elevated due to a larger volume of short duration securities held by the Fund. |
| (j) | The variation in the Fund’s turnover rate from 2016 to 2017 was primarily due to a repositioning of the portfolio. |
See accompanying notes to financial statements.
97 |
Financial Highlights (continued)
For a share outstanding throughout each period.
| | | | | | | | | | | | | | | | |
| | | Strategic Alpha Fund—Class N | |
| | | Year Ended
December 31,
2020 | | | Year Ended
December 31,
2019 | | | Year Ended
December 31,
2018 | | | Period Ended
December 31,
2017* | |
Net asset value, beginning of the period | | $ | 9.67 | | | $ | 9.60 | | | $ | 9.90 | | | $ | 9.90 | |
| | | | | | | | | | | | | | | | |
INCOME (LOSS) FROM INVESTMENT OPERATIONS: | |
Net investment income(a) | | | 0.31 | | | | 0.33 | | | | 0.34 | | | | 0.25 | |
Net realized and unrealized gain (loss) | | | 0.67 | | | | 0.04 | | | | (0.28 | ) | | | (0.04 | ) |
| | | | | | | | | | | | | | | | |
Total from Investment Operations | | | 0.98 | | | | 0.37 | | | | 0.06 | | | | 0.21 | |
| | | | | | | | | | | | | | | | |
LESS DISTRIBUTIONS FROM: | |
Net investment income | | | (0.24 | ) | | | (0.30 | ) | | | (0.36 | ) | | | (0.21 | ) |
| | | | | | | | | | | | | | | | |
Net asset value, end of the period | | $ | 10.41 | | | $ | 9.67 | | | $ | 9.60 | | | $ | 9.90 | |
| | | | | | | | | | | | | | | | |
Total return | | | 10.36 | % | | | 3.92 | % | | | 0.68 | % | | | 2.11 | %(b)(c) |
RATIOS TO AVERAGE NET ASSETS: | |
Net assets, end of the period (000’s) | | $ | 527,494 | | | $ | 297,300 | | | $ | 255,226 | | | $ | 59,282 | |
Net expenses | | | 0.68 | % | | | 0.67 | % | | | 0.70 | %(d) | | | 0.70 | %(e)(f)(g) |
Gross expenses | | | 0.68 | % | | | 0.67 | % | | | 0.70 | %(d) | | | 0.72 | %(e) |
Net investment income | | | 3.13 | % | | | 3.39 | % | | | 3.44 | % | | | 3.83 | %(e) |
Portfolio turnover rate | | | 498 | % | | | 414 | %(h) | | | 379 | %(h) | | | 178 | %(i) |
| * | From commencement of Class operations on May 1, 2017 through December 31, 2017. |
| (a) | Per share net investment income has been calculated using the average shares outstanding during the period. |
| (b) | Periods less than one year are not annualized. |
| (c) | Had certain expenses not been waived/reimbursed during the period, total returns would have been lower. |
| (d) | Includes fee/expense recovery of 0.01%. |
| (e) | Computed on an annualized basis for periods less than one year. |
| (f) | The investment adviser agreed to waive its fees and/or reimburse a portion of the Fund’s expenses during the period. Without this waiver/reimbursement, expenses would have been higher. |
| (g) | Effective July 1, 2017, the expense limit decreased from 1.00% to 0.70%. |
| (h) | The variation in the Fund’s turnover rate from 2017 to 2018 was primarily due to a repositioning of the portfolio. During 2019, turnover has remained elevated due to a larger volume of short duration securities held by the Fund. |
| (i) | Represents the Fund’s portfolio turnover rate for the year ended December 31, 2017. |
See accompanying notes to financial statements.
| 98
Financial Highlights (continued)
For a share outstanding throughout each period.
| | | | | | | | | | | | | | | | | | | | |
| | | Strategic Alpha Fund—Class Y | |
| | | Year Ended
December 31,
2020 | | | Year Ended
December 31,
2019 | | | Year Ended
December 31,
2018 | | | Year Ended
December 31,
2017 | | | Year Ended
December 31,
2016 | |
Net asset value, beginning of the period | | $ | 9.67 | | | $ | 9.59 | | | $ | 9.90 | | | $ | 9.85 | | | $ | 9.44 | |
| | | | | | | | | | | | | | | | | | | | |
INCOME (LOSS) FROM INVESTMENT OPERATIONS: | |
Net investment income(a) | | | 0.30 | | | | 0.32 | | | | 0.35 | | | | 0.35 | | | | 0.32 | |
Net realized and unrealized gain (loss) | | | 0.68 | | | | 0.06 | | | | (0.31 | ) | | | (0.01 | ) | | | 0.32 | |
| | | | | | | | | | | | | | | | | | | | |
Total from Investment Operations | | | 0.98 | | | | 0.38 | | | | 0.04 | | | | 0.34 | | | | 0.64 | |
| | | | | | | | | | | | | | | | | | | | |
LESS DISTRIBUTIONS FROM: | |
Net investment income | | | (0.24 | ) | | | (0.30 | ) | | | (0.35 | ) | | | (0.29 | ) | | | (0.23 | ) |
| | | | | | | | | | | | | | | | | | | | |
Net asset value, end of the period | | $ | 10.41 | | | $ | 9.67 | | | $ | 9.59 | | | $ | 9.90 | | | $ | 9.85 | |
| | | | | | | | | | | | | | | | | | | | |
Total return | | | 10.19 | % | | | 3.96 | % | | | 0.53 | % | | | 3.48 | %(b) | | | 6.86 | % |
RATIOS TO AVERAGE NET ASSETS: | |
Net assets, end of the period (000’s) | | $ | 742,493 | | | $ | 938,271 | | | $ | 1,186,322 | | | $ | 1,031,537 | | | $ | 1,083,527 | |
Net expenses | | | 0.74 | % | | | 0.74 | % | | | 0.75 | %(c) | | | 0.80 | %(d)(e) | | | 0.85 | % |
Gross expenses | | | 0.74 | % | | | 0.74 | % | | | 0.75 | %(c) | | | 0.81 | % | | | 0.85 | % |
Net investment income | | | 3.05 | % | | | 3.33 | % | | | 3.51 | % | | | 3.53 | % | | | 3.39 | % |
Portfolio turnover rate | | | 498 | % | | | 414 | %(f) | | | 379 | %(f) | | | 178 | %(g) | | | 72 | % |
| (a) | Per share net investment income has been calculated using the average shares outstanding during the period. |
| (b) | Had certain expenses not been waived/reimbursed during the period, total returns would have been lower. |
| (c) | Includes fee/expense recovery of less than 0.01%. |
| (d) | The investment adviser agreed to waive its fees and/or reimburse a portion of the Fund’s expenses during the period. Without this waiver/reimbursement, expenses would have been higher. |
| (e) | Effective July 1, 2017, the expense limit decreased from 1.05% to 0.75%. |
| (f) | The variation in the Fund’s turnover rate from 2017 to 2018 was primarily due to a repositioning of the portfolio. During 2019, turnover has remained elevated due to a larger volume of short duration securities held by the Fund. |
| (g) | The variation in the Fund’s turnover rate from 2016 to 2017 was primarily due to a repositioning of the portfolio. |
See accompanying notes to financial statements.
99 |
Financial Highlights (continued)
For a share outstanding throughout each period.
| | | | | | | | | | | | | | | | | | | | | | | | |
| | | Strategic Income Fund—Class A | |
| | | Period Ended
December 31,
2020* | | | Year Ended
September 30,
2020 | | | Year Ended
September 30,
2019 | | | Year Ended
September 30,
2018 | | | Year Ended
September 30,
2017 | | | Year Ended
September 30,
2016 | |
Net asset value, beginning of the period | | $ | 13.58 | | | $ | 14.25 | | | $ | 14.39 | | | $ | 14.84 | | | $ | 14.70 | | | $ | 14.70 | |
| | | | | | | | | | | | | | | | | | | | | | | | |
INCOME (LOSS) FROM INVESTMENT OPERATIONS: | |
Net investment income(a) | | | 0.10 | | | | 0.47 | | | | 0.57 | | | | 0.52 | | | | 0.56 | | | | 0.57 | |
Net realized and unrealized gain (loss) | | | 0.63 | | | | (0.66 | ) | | | (0.16 | ) | | | (0.33 | ) | | | 0.42 | | | | 0.61 | |
| | | | | | | | | | | | | | | | | | | | | | | | |
Total from Investment Operations | | | 0.73 | | | | (0.19 | ) | | | 0.41 | | | | 0.19 | | | | 0.98 | | | | 1.18 | |
| | | | | | | | | | | | | | | | | | | | | | | | |
LESS DISTRIBUTIONS FROM: | |
Net investment income | | | (0.16 | ) | | | (0.45 | ) | | | (0.48 | ) | | | (0.57 | ) | | | (0.52 | ) | | | (0.36 | ) |
Net realized capital gains | | | (0.12 | ) | | | (0.03 | ) | | | (0.07 | ) | | | (0.07 | ) | | | (0.32 | ) | | | (0.82 | ) |
| | | | | | | | | | | | | | | | | | | | | | | | |
Total Distributions | | | (0.28 | ) | | | (0.48 | ) | | | (0.55 | ) | | | (0.64 | ) | | | (0.84 | ) | | | (1.18 | ) |
| | | | | | | | | | | | | | | | | | | | | | | | |
Net asset value, end of the period | | $ | 14.03 | | | $ | 13.58 | | | $ | 14.25 | | | $ | 14.39 | | | $ | 14.84 | | | $ | 14.70 | |
| | | | | | | | | | | | | | | | | | | | | | | | |
Total return(b) | | | 5.37 | %(c) | | | (1.39 | )% | | | 3.02 | % | | | 1.34 | % | | | 7.01 | % | | | 8.72 | % |
RATIOS TO AVERAGE NET ASSETS: | |
Net assets, end of the period (000’s) | | $ | 1,682,562 | | | $ | 1,683,547 | | | $ | 1,835,813 | | | $ | 1,986,300 | | | $ | 1,999,385 | | | $ | 2,514,770 | |
Net expenses | | | 0.97 | %(d) | | | 0.97 | %(e) | | | 0.96 | % | | | 0.96 | % | | | 0.96 | % | | | 0.96 | % |
Gross expenses | | | 0.97 | %(d) | | | 0.97 | % | | | 0.96 | % | | | 0.96 | % | | | 0.96 | % | | | 0.96 | % |
Net investment income | | | 2.78 | %(d) | | | 3.42 | % | | | 4.03 | % | | | 3.57 | % | | | 3.82 | % | | | 4.01 | % |
Portfolio turnover rate | | | 30 | %(f) | | | 30 | % | | | 13 | % | | | 6 | % | | | 11 | % | | | 17 | % |
| * | For the three month period ended December 31, 2020. See Note 1 of Notes to Financial Statements. |
| (a) | Per share net investment income has been calculated using the average shares outstanding during the period. |
| (b) | A sales charge for Class A shares is not reflected in total return calculations. |
| (c) | Periods less than one year are not annualized. |
| (d) | Computed on an annualized basis for periods less than one year. |
| (e) | Effective July 1, 2020, the expense limit decreased from 1.25% to 1.00%. |
| (f) | The variation in the Fund’s turnover rate, if annualized, from the year ended September 30, 2020 to the period ended December 31, 2020 was primarily due to the disposition and realignment of certain foreign currency-denominated positions. |
See accompanying notes to financial statements.
| 100
Financial Highlights (continued)
For a share outstanding throughout each period.
| | | | | | | | | | | | | | | | | | | | | | | | |
| | | Strategic Income Fund—Class C | |
| | | Period Ended
December 31,
2020* | | | Year Ended
September 30,
2020 | | | Year Ended
September 30,
2019 | | | Year Ended
September 30,
2018 | | | Year Ended
September 30,
2017 | | | Year Ended
September 30,
2016 | |
Net asset value, beginning of the period | | $ | 13.72 | | | $ | 14.39 | | | $ | 14.52 | | | $ | 14.97 | | | $ | 14.81 | | | $ | 14.80 | |
| | | | | | | | | | | | | | | | | | | | | | | | |
INCOME (LOSS) FROM INVESTMENT OPERATIONS: | |
Net investment income(a) | | | 0.07 | | | | 0.38 | | | | 0.47 | | | | 0.41 | | | | 0.45 | | | | 0.47 | |
Net realized and unrealized gain (loss) | | | 0.64 | | | | (0.68 | ) | | | (0.16 | ) | | | (0.33 | ) | | | 0.44 | | | | 0.61 | |
| | | | | | | | | | | | | | | | | | | | | | | | |
Total from Investment Operations | | | 0.71 | | | | (0.30 | ) | | | 0.31 | | | | 0.08 | | | | 0.89 | | | | 1.08 | |
| | | | | | | | | | | | | | | | | | | | | | | | |
LESS DISTRIBUTIONS FROM: | |
Net investment income | | | (0.13 | ) | | | (0.34 | ) | | | (0.37 | ) | | | (0.46 | ) | | | (0.41 | ) | | | (0.25 | ) |
Net realized capital gains | | | (0.12 | ) | | | (0.03 | ) | | | (0.07 | ) | | | (0.07 | ) | | | (0.32 | ) | | | (0.82 | ) |
| | | | | | | | | | | | | | | | | | | | | | | | |
Total Distributions | | | (0.25 | ) | | | (0.37 | ) | | | (0.44 | ) | | | (0.53 | ) | | | (0.73 | ) | | | (1.07 | ) |
| | | | | | | | | | | | | | | | | | | | | | | | |
Net asset value, end of the period | | $ | 14.18 | | | $ | 13.72 | | | $ | 14.39 | | | $ | 14.52 | | | $ | 14.97 | | | $ | 14.81 | |
| | | | | | | | | | | | | | | | | | | | | | | | |
Total return(b) | | | 5.17 | %(c) | | | (2.18 | )% | | | 2.27 | % | | | 0.60 | % | | | 6.20 | % | | | 7.91 | % |
RATIOS TO AVERAGE NET ASSETS: | |
Net assets, end of the period (000’s) | | $ | 259,780 | | | $ | 277,896 | | | $ | 676,602 | | | $ | 1,153,853 | | | $ | 2,248,939 | | | $ | 3,433,204 | |
Net expenses | | | 1.72 | %(d) | | | 1.72 | %(e) | | | 1.71 | % | | | 1.71 | % | | | 1.71 | % | | | 1.71 | % |
Gross expenses | | | 1.72 | %(d) | | | 1.72 | % | | | 1.71 | % | | | 1.71 | % | | | 1.71 | % | | | 1.71 | % |
Net investment income | | | 2.04 | %(d) | | | 2.75 | % | | | 3.30 | % | | | 2.79 | % | | | 3.08 | % | | | 3.26 | % |
Portfolio turnover rate | | | 30 | %(f) | | | 30 | % | | | 13 | % | | | 6 | % | | | 11 | % | | | 17 | % |
| * | For the three month period ended December 31, 2020. See Note 1 of Notes to Financial Statements. |
| (a) | Per share net investment income has been calculated using the average shares outstanding during the period. |
| (b) | A contingent deferred sales charge for Class C shares is not reflected in total return calculations. |
| (c) | Periods less than one year are not annualized. |
| (d) | Computed on an annualized basis for periods less than one year. |
| (e) | Effective July 1, 2020, the expense limit decreased from 2.00% to 1.75%. |
| (f) | The variation in the Fund’s turnover rate, if annualized, from the year ended September 30, 2020 to the period ended December 31, 2020 was primarily due to the disposition and realignment of certain foreign currency-denominated positions. |
See accompanying notes to financial statements.
101 |
Financial Highlights (continued)
For a share outstanding throughout each period.
| | | | | | | | | | | | | | | | | | | | | | | | |
| | | Strategic Income Fund—Class N | |
| | | Period Ended
December 31,
2020* | | | Year Ended
September 30,
2020 | | | Year Ended
September 30,
2019 | | | Year Ended
September 30,
2018 | | | Year Ended
September 30,
2017 | | | Year Ended
September 30,
2016 | |
Net asset value, beginning of the period | | $ | 13.57 | | | $ | 14.24 | | | $ | 14.38 | | | $ | 14.83 | | | $ | 14.69 | | | $ | 14.69 | |
| | | | | | | | | | | | | | | | | | | | | | | | |
INCOME (LOSS) FROM INVESTMENT OPERATIONS: | | | | | | | | | | | | | | | | | | | | | | | | |
Net investment income(a) | | | 0.11 | | | | 0.52 | | | | 0.61 | | | | 0.56 | | | | 0.60 | | | | 0.61 | |
Net realized and unrealized gain (loss) | | | 0.62 | | | | (0.66 | ) | | | (0.16 | ) | | | (0.32 | ) | | | 0.43 | | | | 0.62 | |
| | | | | | | | | | | | | | | | | | | | | | | | |
Total from Investment Operations | | | 0.73 | | | | (0.14 | ) | | | 0.45 | | | | 0.24 | | | | 1.03 | | | | 1.23 | |
| | | | | | | | | | | | | | | | | | | | | | | | |
LESS DISTRIBUTIONS FROM: | | | | | | | | | | | | | | | | | | | | | | | | |
Net investment income | | | (0.17 | ) | | | (0.50 | ) | | | (0.52 | ) | | | (0.62 | ) | | | (0.57 | ) | | | (0.41 | ) |
Net realized capital gains | | | (0.12 | ) | | | (0.03 | ) | | | (0.07 | ) | | | (0.07 | ) | | | (0.32 | ) | | | (0.82 | ) |
| | | | | | | | | | | | | | | | | | | | | | | | |
Total Distributions | | | (0.29 | ) | | | (0.53 | ) | | | (0.59 | ) | | | (0.69 | ) | | | (0.89 | ) | | | (1.23 | ) |
| | | | | | | | | | | | | | | | | | | | | | | | |
Net asset value, end of the period | | $ | 14.01 | | | $ | 13.57 | | | $ | 14.24 | | | $ | 14.38 | | | $ | 14.83 | | | $ | 14.69 | |
| | | | | | | | | | | | | | | | | | | | | | | | |
Total return | | | 5.39 | %(b) | | | (1.06 | )% | | | 3.37 | % | | | 1.67 | % | | | 7.38 | % | | | 9.09 | % |
RATIOS TO AVERAGE NET ASSETS: | | | | | | | | | | | | | | | | | | | | | | | | |
Net assets, end of the period (000’s) | | $ | 247,697 | | | $ | 212,804 | | | $ | 202,989 | | | $ | 176,456 | | | $ | 141,695 | | | $ | 130,637 | |
Net expenses | | | 0.65 | %(c) | | | 0.64 | %(d) | | | 0.63 | % | | | 0.63 | % | | | 0.63 | % | | | 0.63 | % |
Gross expenses | | | 0.65 | %(c) | | | 0.64 | % | | | 0.63 | % | | | 0.63 | % | | | 0.63 | % | | | 0.63 | % |
Net investment income | | | 3.13 | %(c) | | | 3.77 | % | | | 4.36 | % | | | 3.91 | % | | | 4.13 | % | | | 4.34 | % |
Portfolio turnover rate | | | 30 | %(e) | | | 30 | % | | | 13 | % | | | 6 | % | | | 11 | % | | | 17 | % |
| * | For the three month period ended December 31, 2020. See Note 1 of Notes to Financial Statements. |
| (a) | Per share net investment income has been calculated using the average shares outstanding during the period. |
| (b) | Periods less than one year are not annualized. |
| (c) | Computed on an annualized basis for periods less than one year. |
| (d) | Effective July 1, 2020, the expense limit decreased from 0.95% to 0.70%. |
| (e) | The variation in the Fund’s turnover rate, if annualized, from the year ended September 30, 2020 to the period ended December 31, 2020 was primarily due to the disposition and realignment of certain foreign currency-denominated positions. |
See accompanying notes to financial statements.
| 102
Financial Highlights (continued)
For a share outstanding throughout each period.
| | | | | | | | | | | | | | | | | | | | | | | | |
| | | Strategic Income Fund—Class Y | |
| | | Period Ended
December 31,
2020* | | | Year Ended
September 30,
2020 | | | Year Ended
September 30,
2019 | | | Year Ended
September 30,
2018 | | | Year Ended
September 30,
2017 | | | Year Ended
September 30,
2016 | |
Net asset value, beginning of the period | | $ | 13.56 | | | $ | 14.23 | | | $ | 14.38 | | | $ | 14.83 | | | $ | 14.69 | | | $ | 14.69 | |
| | | | | | | | | | | | | | | | | | | | | | | | |
INCOME (LOSS) FROM INVESTMENT OPERATIONS: | | | | | | | | | | | | | | | | | | | | | | | | |
Net investment income(a) | | | 0.11 | | | | 0.51 | | | | 0.60 | | | | 0.55 | | | | 0.59 | | | | 0.61 | |
Net realized and unrealized gain (loss) | | | 0.62 | | | | (0.66 | ) | | | (0.17 | ) | | | (0.32 | ) | | | 0.43 | | | | 0.61 | |
| | | | | | | | | | | | | | | | | | | | | | | | |
Total from Investment Operations | | | 0.73 | | | | (0.15 | ) | | | 0.43 | | | | 0.23 | | | | 1.02 | | | | 1.22 | |
| | | | | | | | | | | | | | | | | | | | | | | | |
LESS DISTRIBUTIONS FROM: | | | | | | | | | | | | | | | | | | | | | | | | |
Net investment income | | | (0.16 | ) | | | (0.49 | ) | | | (0.51 | ) | | | (0.61 | ) | | | (0.56 | ) | | | (0.40 | ) |
Net realized capital gains | | | (0.12 | ) | | | (0.03 | ) | | | (0.07 | ) | | | (0.07 | ) | | | (0.32 | ) | | | (0.82 | ) |
| | | | | | | | | | | | | | | | | | | | | | | | |
Total Distributions | | | (0.28 | ) | | | (0.52 | ) | | | (0.58 | ) | | | (0.68 | ) | | | (0.88 | ) | | | (1.22 | ) |
| | | | | | | | | | | | | | | | | | | | | | | | |
Net asset value, end of the period | | $ | 14.01 | | | $ | 13.56 | | | $ | 14.23 | | | $ | 14.38 | | | $ | 14.83 | | | $ | 14.69 | |
| | | | | | | | | | | | | | | | | | | | | | | | |
Total return | | | 5.44 | %(b) | | | (1.14 | )% | | | 3.22 | % | | | 1.66 | % | | | 7.22 | % | | | 9.00 | % |
RATIOS TO AVERAGE NET ASSETS: | | | | | | | | | | | | | | | | | | | | | | | | |
Net assets, end of the period (000’s) | | $ | 3,693,954 | | | $ | 3,774,113 | | | $ | 4,316,010 | | | $ | 5,118,016 | | | $ | 5,702,607 | | | $ | 5,350,759 | |
Net expenses | | | 0.72 | %(c) | | | 0.72 | %(d) | | | 0.71 | % | | | 0.71 | % | | | 0.71 | % | | | 0.71 | % |
Gross expenses | | | 0.72 | %(c) | | | 0.72 | % | | | 0.71 | % | | | 0.71 | % | | | 0.71 | % | | | 0.71 | % |
Net investment income | | | 3.03 | %(c) | | | 3.68 | % | | | 4.28 | % | | | 3.82 | % | | | 4.04 | % | | | 4.26 | % |
Portfolio turnover rate | | | 30 | %(e) | | | 30 | % | | | 13 | % | | | 6 | % | | | 11 | % | | | 17 | % |
| * | For the three month period ended December 31, 2020. See Note 1 of Notes to Financial Statements. |
| (a) | Per share net investment income has been calculated using the average shares outstanding during the period. |
| (b) | Periods less than one year are not annualized. |
| (c) | Computed on an annualized basis for periods less than one year. |
| (d) | Effective July 1, 2020, the expense limit decreased from 1.00% to 0.75%. |
| (e) | The variation in the Fund’s turnover rate, if annualized, from the year ended September 30, 2020 to the period ended December 31, 2020 was primarily due to the disposition and realignment of certain foreign currency-denominated positions. |
See accompanying notes to financial statements.
103 |
Financial Highlights (continued)
For a share outstanding throughout each period.
| | | | | | | | | | | | | | | | | | | | | | | | |
| | | Strategic Income Fund—Admin Class | |
| | | Period Ended
December 31,
2020* | | | Year Ended
September 30,
2020 | | | Year Ended
September 30,
2019 | | | Year Ended
September 30,
2018 | | | Year Ended
September 30,
2017 | | | Year Ended
September 30,
2016 | |
Net asset value, beginning of the period | | $ | 13.53 | | | $ | 14.20 | | | $ | 14.34 | | | $ | 14.79 | | | $ | 14.65 | | | $ | 14.66 | |
| | | | | | | | | | | | | | | | | | | | | | | | |
INCOME (LOSS) FROM INVESTMENT OPERATIONS: | |
Net investment income(a) | | | 0.09 | | | | 0.44 | | | | 0.53 | | | | 0.48 | | | | 0.52 | | | | 0.53 | |
Net realized and unrealized gain (loss) | | | 0.62 | | | | (0.66 | ) | | | (0.16 | ) | | | (0.33 | ) | | | 0.43 | | | | 0.61 | |
| | | | | | | | | | | | | | | | | | | | | | | | |
Total from Investment Operations | | | 0.71 | | | | (0.22 | ) | | | 0.37 | | | | 0.15 | | | | 0.95 | | | | 1.14 | |
| | | | | | | | | | | | | | | | | | | | | | | | |
LESS DISTRIBUTIONS FROM: | |
Net investment income | | | (0.15 | ) | | | (0.42 | ) | | | (0.44 | ) | | | (0.53 | ) | | | (0.49 | ) | | | (0.33 | ) |
Net realized capital gains | | | (0.12 | ) | | | (0.03 | ) | | | (0.07 | ) | | | (0.07 | ) | | | (0.32 | ) | | | (0.82 | ) |
| | | | | | | | | | | | | | | | | | | | | | | | |
Total Distributions | | | (0.27 | ) | | | (0.45 | ) | | | (0.51 | ) | | | (0.60 | ) | | | (0.81 | ) | | | (1.15 | ) |
| | | | | | | | | | | | | | | | | | | | | | | | |
Net asset value, end of the period | | $ | 13.97 | | | $ | 13.53 | | | $ | 14.20 | | | $ | 14.34 | | | $ | 14.79 | | | $ | 14.65 | |
| | | | | | | | | | | | | | | | | | | | | | | | |
Total return | | | 5.24 | %(b) | | | (1.64 | )% | | | 2.78 | % | | | 1.09 | % | | | 6.79 | % | | | 8.42 | % |
RATIOS TO AVERAGE NET ASSETS: | |
Net assets, end of the period (000’s) | | $ | 105,172 | | | $ | 103,197 | | | $ | 121,903 | | | $ | 133,220 | | | $ | 142,871 | | | $ | 143,275 | |
Net expenses | | | 1.22 | %(c) | | | 1.22 | %(d) | | | 1.20 | %(e) | | | 1.20 | %(e) | | | 1.19 | %(f) | | | 1.20 | %(e) |
Gross expenses | | | 1.22 | %(c) | | | 1.22 | % | | | 1.20 | %(e) | | | 1.20 | %(e) | | | 1.19 | %(f) | | | 1.20 | %(e) |
Net investment income | | | 2.53 | %(c) | | | 3.19 | % | | | 3.80 | % | | | 3.33 | % | | | 3.57 | % | | | 3.76 | % |
Portfolio turnover rate | | | 30 | %(g) | | | 30 | % | | | 13 | % | | | 6 | % | | | 11 | % | | | 17 | % |
| * | For the three month period ended December 31, 2020. See Note 1 of Notes to Financial Statements. |
| (a) | Per share net investment income has been calculated using the average shares outstanding during the period. |
| (b) | Periods less than one year are not annualized. |
| (c) | Computed on an annualized basis for periods less than one year. |
| (d) | Effective July 1, 2020, the expense limit decreased from 1.50% to 1.25%. |
| (e) | Includes refund of prior year service fee of 0.01%. |
| (f) | Includes refund of prior year service fee of 0.02%. |
| (g) | The variation in the Fund’s turnover rate, if annualized, from the year ended September 30, 2020 to the period ended December 31, 2020 was primarily due to the disposition and realignment of certain foreign currency-denominated positions. |
See accompanying notes to financial statements.
| 104
Notes to Financial Statements
December 31, 2020
1. Organization. Loomis Sayles Funds II and Natixis Funds Trust II (the “Trusts” and each a “Trust”) are each organized as a Massachusetts business trust. Each Trust is registered under the Investment Company Act of 1940, as amended (the “1940 Act”), as an open-end management investment company. Each Declaration of Trust permits the Board of Trustees to authorize the issuance of an unlimited number of shares of the Trust in multiple series. The financial statements for certain funds of the Trusts are presented in separate reports. The following funds (individually, a “Fund” and collectively, the “Funds”) are included in this report:
Loomis Sayles Funds II:
Loomis Sayles High Income Fund (the “High Income Fund”)
Loomis Sayles International Growth Fund (the “International Growth Fund”)
Loomis Sayles Investment Grade Bond Fund (the “Investment Grade Bond Fund”)
Loomis Sayles Strategic Income Fund (the “Strategic Income Fund”)
Natixis Funds Trust II:
Loomis Sayles Intermediate Municipal Bond Fund (the “Intermediate Municipal Bond Fund”)
Loomis Sayles Strategic Alpha Fund (the “Strategic Alpha Fund”)
International Growth Fund commenced operations on December 15, 2020 via contributions to the Fund by Natixis Investment Managers, LLC (“Natixis”) and affiliates of $15,003,000.
Each Fund is a diversified investment company, except for International Growth Fund and Strategic Alpha Fund, which are each a non-diversified investment company.
On December 2, 2020, the Board of Trustees approved a change to the fiscal year end of Strategic Income Fund from September 30 to December 31. Accordingly, the Fund’s financial statements and related notes include information as of and for the three month period ended December 31, 2020, and the years ended September 30, 2020, and September 30, 2019, where applicable.
Each Fund offers Class A, Class C, Class N and Class Y shares, except for Intermediate Municipal Bond Fund, which does not offer Class N shares. In addition, Investment Grade Bond Fund and Strategic Income Fund also offer Admin Class shares.
Class A shares are sold with a maximum front-end sales charge of 4.25% for each Fund, except for Intermediate Municipal Bond Fund and International Growth Fund, which are sold with a maximum front-end sales charge of 3.00% and 5.75%, respectively. Class C shares do not pay a front-end sales charge, pay higher Rule 12b-1 fees than Class A shares for ten years (at which point they automatically convert to Class A shares) and may be subject to a contingent deferred sales charge (“CDSC”) of 1.00% if those shares are redeemed within one year of acquisition, except for reinvested distributions. Class N and Class Y shares do not pay a front-end sales charge, a CDSC or Rule 12b-1 fees. Class N shares are offered with an initial minimum investment of $1,000,000. Class Y shares are offered with an initial minimum investment of $100,000. Certain categories of investors are exempted from the minimum investment amounts for Class N and Class Y as outlined in the relevant Funds’ prospectus. Admin Class shares do not pay a front-end sales charge or a CDSC, but do pay a Rule 12b-1 fee. Admin Class shares are offered exclusively through intermediaries.
Most expenses can be directly attributed to a Fund. Expenses which cannot be directly attributed to a Fund are generally apportioned based on the relative net assets of each of the funds in Natixis Funds Trust I, Natixis Funds Trust II, Natixis Funds Trust IV and Gateway Trust (“Natixis Funds Trusts”), Loomis Sayles Funds I and Loomis Sayles Funds II (“Loomis Sayles Funds Trusts”), and Natixis ETF Trust and Natixis ETF Trust II (“Natixis ETF Trusts”). Expenses of a Fund are borne pro rata by the holders of each class of shares, except that each class bears expenses unique to that class (such as the Rule 12b-1 fee applicable to Class A, Class C and Admin Class) and transfer agent fees are borne collectively for Class A, Class C, Class Y and Admin Class, and individually for Class N. In addition, each class votes as a class only with respect to its own Rule 12b-1 Plan. Shares of each class would receive their pro rata share of the net assets of a Fund if the Fund were liquidated. The Trustees approve separate distributions from net investment income on each class of shares.
2. Significant Accounting Policies. The following is a summary of significant accounting policies consistently followed by each Fund in the preparation of its financial statements. The Funds’ financial statements follow the accounting and reporting guidelines provided for investment companies and are prepared in accordance with accounting principles generally accepted in the United States of America which require the use of management estimates that affect the reported amounts and disclosures in the financial statements. Actual results could differ from those estimates. Management has evaluated the events and transactions subsequent to year-end through the date the financial statements were issued and has determined that there were no material events that would require disclosure in the Funds’ financial statements.
a. Valuation. Fund securities and other investments are valued at market value based on market quotations obtained or determined by independent pricing services recommended by the adviser or sub-adviser and approved by the Board of Trustees. Fund securities
105 |
Notes to Financial Statements (continued)
December 31, 2020
and other investments for which market quotations are not readily available are valued at fair value as determined in good faith by the adviser or sub-adviser pursuant to procedures approved by the Board of Trustees, as described below. Market value is determined as follows:
Listed equity securities (including shares of closed-end investment companies and exchange-traded funds) are valued at the last sale price quoted on the exchange where they are traded most extensively or, if there is no reported sale during the day, the closing bid quotation as reported by an independent pricing service. Securities traded on the NASDAQ Global Select Market, NASDAQ Global Market and NASDAQ Capital Market are valued at the NASDAQ Official Closing Price (“NOCP”), or if lacking an NOCP, at the most recent bid quotations on the applicable NASDAQ Market. Unlisted equity securities (except unlisted preferred equity securities) are valued at the last sale price quoted in the market where they are traded most extensively or, if there is no reported sale during the day, the closing bid quotation as reported by an independent pricing service. If there is no last sale price or closing bid quotation available, unlisted equity securities will be valued using evaluated bids furnished by an independent pricing service, if available. In some foreign markets, an official close price and a last sale price may be available from the foreign exchange or market. In those cases, the official close price is used. Debt securities and unlisted preferred equity securities are valued based on evaluated bids furnished to the Funds by an independent pricing service or bid prices obtained from broker-dealers. Senior loans and collateralized loan obligations are valued at bid prices supplied by an independent pricing service, if available. Equity linked notes are valued using broker-dealer bid prices. Broker-dealer bid prices may be used to value debt, unlisted equity securities, senior loans and collateralized loan obligations where an independent pricing service is unable to price a security or where an independent pricing service does not provide a reliable price for the security. Forward foreign currency contracts are valued utilizing interpolated rates determined based on information provided by an independent pricing service. Futures contracts are valued at the most recent settlement price on the exchange on which the adviser believes that, over time, they are traded most extensively. Centrally cleared swap agreements are valued at settlement prices of the clearing house on which the contracts were traded or prices obtained from broker-dealers. Bilateral credit default swaps are valued based on mid prices (between the bid price and the ask price) supplied by an independent pricing service. Bilateral interest rate swaps are valued based on prices supplied by an independent pricing source. Domestic exchange-traded index and single name equity option contracts (including options on exchange-traded funds) are valued at the mean of the National Best Bid and Offer quotations as determined by the Options Price Reporting Authority. Options on futures contracts are valued using the current settlement price on the exchange on which, over time, they are traded most extensively. Option contracts on foreign indices are priced at the most recent settlement price. Other exchange-traded options are valued at the average of the closing bid and ask quotations on the exchange on which, over time, they are traded most extensively. Over-the-counter (“OTC”) currency options and swaptions are valued at mid prices (between the bid and the ask price) supplied by an independent pricing service, if available. Other OTC option contracts (including currency options and swaptions not priced through an independent pricing service) are valued based on quotations obtained from broker-dealers. Shares of open-end investment companies are valued at net asset value per share.
Fund securities and other investments for which market quotations are not readily available are valued at fair value as determined in good faith by the adviser pursuant to procedures approved by the Board of Trustees. The Funds may also value securities and other investments at fair value in other circumstances such as when extraordinary events occur after the close of a foreign market but prior to the close of the New York Stock Exchange. This may include situations relating to a single issuer (such as a declaration of bankruptcy or a delisting of the issuer’s security from the primary market on which it has traded) as well as events affecting the securities markets in general (such as market disruptions or closings and significant fluctuations in U.S. and/or foreign markets). When fair valuing its securities or other investments, the Funds may, among other things, use modeling tools or other processes that may take into account factors such as securities or other market activity and/or significant events that occur after the close of the foreign market and before the time the Fund’s net asset value (“NAV”) is calculated. Fair value pricing may require subjective determinations about the value of a security, and fair values used to determine a Fund’s NAV may differ from quoted or published prices, or from prices that are used by others, for the same securities. In addition, the use of fair value pricing may not always result in adjustments to the prices of securities held by a Fund.
Illiquid securities for which market quotations are readily available and have been evaluated by the adviser are considered and classified as fair valued securities pursuant to the Funds’ pricing policies and procedures.
| 106
Notes to Financial Statements (continued)
December 31, 2020
As of December 31, 2020, securities and other investments of the funds included in net assets were fair valued as follows:
| | | | | | | | | | | | | | | | | | | | | | | | |
Fund | | Equity Securities1 | | | Percentage
of Net Assets | | | Securities
classified
as fair
valued | | | Percentage
of Net Assets | | | Securities
fair valued
by the
Fund’s
adviser | | | Percentage
of Net Assets | |
High Income Fund | | $ | — | | | | — | | | $ | 1,051,925 | | | | 0.9 | % | | $ | 715,044 | | | | 0.6 | % |
International Growth Fund | | | 9,456,143 | | | | 62.1 | % | | | — | | | | — | | | | — | | | | — | |
Investment Grade Bond Fund | | | — | | | | — | | | | 115,550,245 | | | | 1.9 | % | | | — | | | | Less than 0.1 | % |
Strategic Alpha Fund | | | 772,485 | | | | 0.1 | % | | | 7,222,747 | | | | 0.5 | % | | | 7,357,855 | | | | 0.6 | % |
Strategic Income Fund | | | — | | | | — | | | | 94,587,570 | | | | 1.6 | % | | | 38,774,769 | | | | 0.6 | % |
| 1 | Certain foreign equity securities were fair valued pursuant to procedures approved by the Board of Trustees as events occurring after the close of the foreign market were believed to materially affect the value of those securities. |
b. Investment Transactions and Related Investment Income. Investment transactions are accounted for on a trade date plus one day basis for daily NAV calculation. However, for financial reporting purposes, investment transactions are reported on trade date. Dividend income (including income reinvested) and foreign withholding tax, if applicable, is recorded on the ex-dividend date, or in the case of certain foreign securities, as soon as a Fund is notified, and interest income is recorded on an accrual basis. Interest income is increased by the accretion of discount and decreased by the amortization of premium, if applicable. For payment-in-kind securities, income received in-kind is reflected as an increase to the principal and cost basis of the securities. Periodic principal adjustments for inflation-protected securities are recorded to interest income. Negative principal adjustments (in the event of deflation) are recorded as reductions of interest income to the extent of interest income earned, not to exceed the amount of positive principal adjustments on a cumulative basis. Distributions received from investments in securities that represent a return of capital or capital gain are recorded as a reduction of cost of the investments or as a realized gain, respectively. The calendar year-end amounts of ordinary income, capital gains, and return of capital included in distributions received from the Funds’ investments in real estate investment trusts (“REITs”) are reported to the Funds after the end of the fiscal year; accordingly, the Funds estimate these amounts for accounting purposes until the characterization of REIT distributions is reported to the Funds after the end of the fiscal year. Estimates are based on the most recent REIT distribution information available. In determining net gain or loss on securities sold, the cost of securities has been determined on an identified cost basis. Investment income, non-class specific expenses and realized and unrealized gains and losses are allocated on a pro rata basis to each class based on the relative net assets of each class to the total net assets of the Fund.
c. Foreign Currency Translation. The books and records of the Funds are maintained in U.S. dollars. The values of securities, currencies and other assets and liabilities denominated in currencies other than U.S. dollars, if any, are translated into U.S. dollars based upon foreign exchange rates prevailing at the end of the period. Purchases and sales of investment securities, income and expenses are translated into U.S. dollars on the respective dates of such transactions.
Net realized foreign exchange gains or losses arise from sales of foreign currency, changes in exchange rates between the trade and settlement dates on securities transactions and the difference between the amounts of dividends, interest and foreign withholding taxes recorded on the Funds’ books and the U.S. dollar equivalent of the amounts actually received or paid. Net unrealized foreign exchange gains or losses arise from changes in the value of assets and liabilities, other than investment securities, as of the end of the fiscal period, resulting from changes in exchange rates. Net realized foreign exchange gains or losses and the net change in unrealized foreign exchange gains or losses are disclosed in the Statements of Operations. For federal income tax purposes, net realized foreign exchange gains or losses are characterized as ordinary income, and may, if the Funds have net losses, reduce the amount of income available to be distributed by the Funds.
The values of investment securities are presented at the foreign exchange rates prevailing at the end of the period for financial reporting purposes. Net realized and unrealized gains or losses on investments reported in the Statements of Operations reflect gains or losses resulting from changes in exchange rates and fluctuations which arise due to changes in market prices of investment securities. For federal income tax purposes, a portion of the net realized gain or loss on investments arising from changes in exchange rates, which is reflected in the Statements of Operations, may be characterized as ordinary income and may, if the Funds have net losses, reduce the amount of income available to be distributed by the Funds.
For the year ended (period ended for Strategic Income Fund) December 31, 2020, the amount of income available to be distributed has been reduced by the following amounts as a result of losses arising from changes in exchange rates:
| | | | |
Strategic Alpha Fund | | $ | 11,482,189 | |
Strategic Income Fund | | | 382,188,661 | |
107 |
Notes to Financial Statements (continued)
December 31, 2020
The Funds may use foreign currency exchange contracts to facilitate transactions in foreign-denominated investments. Losses may arise from changes in the value of the foreign currency or if the counterparties do not perform under the contracts’ terms.
d. Forward Foreign Currency Contracts. The Funds may enter into forward foreign currency contracts, including forward foreign cross currency contracts, to acquire exposure to foreign currencies or to hedge the Fund’s investments against currency fluctuation. A contract can also be used to offset a previous contract. These contracts involve market risk in excess of the unrealized appreciation (depreciation) reflected in the Funds’ Statements of Assets and Liabilities. The U.S. dollar value of the currencies a Fund has committed to buy or sell represents the aggregate exposure to each currency a Fund has acquired or hedged through currency contracts outstanding at period end. Gains or losses are recorded for financial statement purposes as unrealized until settlement date. Contracts are traded over-the-counter directly with a counterparty. Risks may arise upon entering into these contracts from the potential inability of counterparties to meet the terms of their contracts and from unanticipated movements in the value of a foreign currency relative to the U.S. dollar. Certain contracts may require the movement of cash and/or securities as collateral for the Fund’s or counterparty’s net obligations under the contracts.
e. Futures Contracts. The Funds may enter into futures contracts. Futures contracts are agreements between two parties to buy and sell a particular instrument or index for a specified price on a specified future date.
When a Fund enters into a futures contract, it is required to deposit with (or for the benefit of) its broker an amount of cash or short-term high-quality securities as “initial margin.” As the value of the contract changes, the value of the futures contract position increases or declines. Subsequent payments, known as “variation margin,” are made or received by a Fund, depending on the price fluctuations in the fair value of the contract and the value of cash or securities on deposit with the broker. The aggregate principal amounts of the contracts are not recorded in the financial statements. Daily fluctuations in the value of the contracts are recorded in the Statements of Assets and Liabilities as a receivable (payable) and in the Statements of Operations as unrealized appreciation (depreciation) until the contracts are closed, when they are recorded as realized gains (losses). Realized gain or loss on a futures position is equal to the difference between the value of the contract at the time it was opened and the value at the time it was closed, minus brokerage commissions. When a Fund enters into a futures contract certain risks may arise, such as illiquidity in the futures market, which may limit a Fund’s ability to close out a futures contract prior to settlement date, and unanticipated movements in the value of securities or interest rates.
Futures contracts are exchange-traded. Exchange-traded futures contracts are standardized and are settled through a clearing house with fulfillment supported by the credit of the exchange. Therefore, counterparty credit risks to the Funds are reduced; however, in the event that a counterparty enters into bankruptcy, a Fund’s claim against initial/variation margin on deposit with the counterparty may be subject to terms of a final settlement in bankruptcy court.
f. Option Contracts. Intermediate Municipal Bond Fund, International Growth Fund and Strategic Alpha Fund may enter into option contracts. When a Fund purchases an option, it pays a premium and the option is subsequently marked-to-market to reflect current value. Premiums paid for purchasing options which expire are treated as realized losses. Premiums paid for purchasing options which are exercised are added to the cost or deducted from the proceeds on the underlying instrument to determine the realized gain or loss. If the Fund enters into a closing sale transaction, the difference between the premium paid and the proceeds of the closing sale transaction is treated as a realized gain or loss. The risk associated with purchasing options is limited to the premium paid.
When a Fund writes an option, an amount equal to the net premium received (the premium less commission) is recorded as a liability and is subsequently adjusted to the current value. Net premiums received for written options which expire are treated as realized gains. Net premiums received for written options which are exercised are deducted from the cost or added to the proceeds on the underlying instrument to determine the realized gain or loss. If the Fund enters into a closing purchase transaction, the difference between the net premium received and any amount paid on effecting a closing purchase transaction, including commissions, is treated as a realized gain or, if the net premium received is less than the amount paid, as a realized loss. The Fund, as writer of a written option, bears the risk of an unfavorable change in the market value of the instrument or index underlying the written option.
Exchange-traded options contracts are standardized and are settled through a clearing house with fulfillment supported by the credit of the exchange. Therefore, counterparty credit risks to the Funds are reduced. OTC options are subject to the risk that the counterparty is unable or unwilling to meet its obligations under the option.
g. Swap Agreements. The Funds, except for International Growth Fund, may enter into credit default and interest rate swaps. A credit default swap is an agreement between two parties (the “protection buyer” and “protection seller”) to exchange the credit risk of an issuer (“reference obligation”) for a specified time period. The reference obligation may be one or more debt securities or an index of such securities. The Funds may be either the protection buyer or the protection seller. As a protection buyer, the Funds have the ability to hedge the downside risk of an issuer or group of issuers. As a protection seller, the Funds have the ability to gain exposure to an issuer or group of issuers whose bonds are unavailable or in short supply in the cash bond market, as well as realize additional income
| 108
Notes to Financial Statements (continued)
December 31, 2020
in the form of fees paid by the protection buyer. The protection buyer is obligated to pay the protection seller a stream of payments (“fees”) over the term of the contract, provided that no credit event, such as a default or a downgrade in credit rating, occurs on the reference obligation. The Funds may also pay or receive upfront premiums. If a credit event occurs, the protection seller must pay the protection buyer the difference between the agreed upon notional value and market value of the reference obligation. Market value in this case is determined by a facilitated auction whereby a minimum number of allowable broker bids, together with a specified valuation method, are used to calculate the value. The maximum potential amount of undiscounted future payments that a Fund as the protection seller could be required to make under a credit default swap agreement would be an amount equal to the notional amount of the agreement.
Implied credit spreads, represented in absolute terms, are disclosed in the Portfolio of Investments for those agreements for which the Fund is the protection seller. Implied credit spreads serve as an indicator of the current status of the payment/performance risk and represent the likelihood or risk of default for the credit derivative. The implied credit spread of a particular reference entity reflects the cost of buying/selling protection and may include upfront payments required to be made to enter into the agreement. Wider credit spreads represent a deterioration of the reference entity’s credit soundness and a greater likelihood or risk of default or other credit event occurring as defined under the terms of the agreement.
An interest rate swap is an agreement with another party to receive or pay interest (e.g., an exchange of fixed rate payments for floating rate payments) to protect themselves from interest rate fluctuations. This type of swap is an agreement that obligates two parties to exchange a series of cash flows at specified intervals based upon or calculated by reference to a specified interest rate(s) for a specified notional amount. The payment flows are usually netted against each other, with the difference being paid by one party to the other.
The notional amounts of swap agreements are not recorded in the financial statements. Swap agreements are valued daily, and fluctuations in value are recorded in the Statements of Operations as change in unrealized appreciation (depreciation) on swap agreements. Fees are accrued in accordance with the terms of the agreement and are recorded in the Statements of Assets and Liabilities as part of unrealized appreciation (depreciation) on swap agreements. When received or paid, fees are recorded in the Statements of Operations as realized gain or loss. Upfront premiums paid or received by the Funds are recorded on the Statements of Assets and Liabilities as an asset or liability, respectively, and are amortized or accreted over the term of the agreement and recorded as realized gain or loss. Payments made or received by the Funds as a result of a credit event or termination of the agreement are recorded as realized gain or loss.
Swap agreements are privately negotiated in the OTC market and may be entered into as a bilateral contract or centrally cleared (“centrally cleared swaps”). Bilateral swap agreements are traded between counterparties and, as such, are subject to the risk that a party to the agreement will not be able to meet its obligations. In a centrally cleared swap, immediately following execution of the swap agreement, the swap agreement is novated to a central counterparty (the “CCP”) and the Funds face the CCP through a broker. Upon entering into a centrally cleared swap, the Funds are required to deposit initial margin with the broker in the form of cash or securities in an amount that varies depending on the size and risk profile of the particular swap. Subsequent payments, known as “variation margin,” are made or received by the Funds based on the daily change in the value of the centrally cleared swap agreement. For centrally cleared swaps, the Funds’ counterparty credit risk is reduced as the CCP stands between the Funds and the counterparty. The Funds cover their net obligations under outstanding swap agreements by segregating or earmarking cash or securities.
h. Swaptions. The Funds, except for International Growth Fund, may enter into interest rate swaptions. An interest rate swaption gives the holder the right, but not the obligation, to enter into or cancel an interest rate swap agreement at a future date. Interest rate swaptions may be either purchased or written. The buyer of an interest rate swaption may purchase either the right to receive a fixed rate in the underlying swap (known as a “receiver swaption”) or to pay a fixed rate (known as a “payer swaption”), based on the notional amount of the swap agreement, in exchange for a floating rate. The notional amounts of swaptions are not recorded in the financial statements.
When a Fund purchases an interest rate swaption, it pays a premium and the swaption is subsequently marked-to-market to reflect current value. Premiums paid for purchasing interest rate swaptions which expire are treated as realized losses. Premiums paid for purchasing interest rate swaptions which are exercised are added to the cost or deducted from the proceeds on the underlying swap to determine the realized gain or loss. If a Fund enters into a closing sale transaction, the difference between the premium paid and the proceeds of the closing sale transaction is treated as a realized gain or loss. The risk associated with purchasing interest rate swaptions is limited to the premium paid.
When a Fund writes an interest rate swaption, an amount equal to the premium received is recorded as a liability and is subsequently adjusted to the current value. Premiums received for written interest rate swaptions which expire are treated as realized gains. Premiums received for written interest rate swaptions which are exercised are deducted from the cost or added to the proceeds on the
109 |
Notes to Financial Statements (continued)
December 31, 2020
underlying swap to determine the realized gain or loss. If a Fund enters into a closing purchase transaction, the difference between the premium received and any amount paid on effecting a closing purchase transaction, including commission, is treated as a realized gain or, if the premium received is less than the amount paid, as a realized loss. A Fund, as writer of a written interest rate swaption, bears the risk of an unfavorable change in the market value of the swap underlying the written interest rate swaption.
OTC interest rate swaptions are subject to the risk that the counterparty is unable or unwilling to meet its obligations under the swaption.
There were no swaptions held by the Funds as of December 31, 2020.
i. Due from Brokers. Transactions and positions in certain options, futures, forward foreign currency contracts and swap agreements are maintained and cleared by registered U.S. broker/dealers pursuant to customer agreements between the Funds and the various broker/dealers. The due from brokers balance in the Statements of Assets and Liabilities for Strategic Alpha Fund represents cash pledged as collateral for forward foreign currency contracts, options, bilateral swap agreements and as initial margin for futures contracts and centrally cleared swap agreements. In certain circumstances the Funds’ use of cash, securities and/or foreign currency held at brokers is restricted by regulation or broker mandated limits.
j. Federal and Foreign Income Taxes. The Trusts treat each Fund as a separate entity for federal income tax purposes. Each Fund intends to meet the requirements of the Internal Revenue Code of 1986, as amended, applicable to regulated investment companies, and to distribute to its shareholders substantially all of its net investment income and any net realized capital gains at least annually. Management has performed an analysis of each Fund’s tax positions for the open tax years as of December 31, 2020 and has concluded that no provisions for income tax are required. The Funds’ federal tax returns for the prior three fiscal years, where applicable, remain subject to examination by the Internal Revenue Service. Management is not aware of any events that are reasonably possible to occur in the next twelve months that would result in the amounts of any unrecognized tax benefits significantly increasing or decreasing for the Funds. However, management’s conclusions regarding tax positions taken may be subject to review and adjustment at a later date based on factors including, but not limited to, new tax laws and accounting regulations and interpretations thereof.
A Fund may be subject to foreign withholding taxes on investment income and taxes on capital gains on investments that are accrued and paid based upon the Fund’s understanding of the tax rules and regulations that exist in the countries in which the Fund invests. Foreign withholding taxes on dividend and interest income are reflected on the Statements of Operations as a reduction of investment income, net of amounts eligible to be reclaimed. Dividends and interest receivable on the Statements of Assets and Liabilities are net of foreign withholding taxes. Foreign withholding taxes where reclaims have been or will be filed are reflected on the Statements of Assets and Liabilities as tax reclaims receivable. Capital gains taxes paid are included in net realized gain (loss) on investments in the Statements of Operations. Accrued but unpaid capital gains taxes are reflected as foreign taxes payable on the Statements of Assets and Liabilities, if applicable, and reduce unrealized gains on investments. In the event that realized gains on investments are subsequently offset by realized losses, taxes paid on realized gains may be returned to a Fund. Such amounts, if applicable, are reflected as foreign tax rebates receivable on the Statements of Assets and Liabilities and are recorded as a realized gain when received.
k. Dividends and Distributions to Shareholders. Dividends and distributions are recorded on the ex-dividend date. The timing and characterization of certain income and capital gain distributions are determined in accordance with federal tax regulations, which may differ from accounting principles generally accepted in the United States of America. Permanent differences are primarily due to differing treatments for book and tax purposes of items such as paydown gains and losses, defaulted and/or non-income producing securities, swap adjustments, foreign currency gains and losses, distribution re-designations, deferred Trustees’ fees, non-deductible expenses, distributions in excess of income and/or capital gains, forward foreign currency contract mark-to-market, futures contract mark-to-market, net operating losses, return of capital distributions received, partnership basis adjustments, capital gain distributions received, trust preferred securities, convertible bond adjustments, corporate actions, contingent payment debt instruments and premium amortization. Permanent book and tax basis differences relating to shareholder distributions, net investment income and net realized gains will result in reclassifications to capital accounts reported on the Statements of Assets and Liabilities. Temporary differences between book and tax distributable earnings are primarily due to deferred Trustees’ fees, premium amortization, defaulted and/or non-income producing securities, swap adjustments, wash sales, foreign currency gains and losses, paydown gains and losses, distributions in excess of income and/or capital gains, forward foreign currency contract mark-to-market, futures contract mark-to-market, return of capital distributions received, net operating losses, partnership basis adjustments, capital gain distributions received, trust preferred securities, convertible bond adjustments, corporate actions, contingent payment debt instruments and straddle loss deferral adjustments. Amounts of income and capital gain available to be distributed on a tax basis are determined annually, and at other times during the Funds’ fiscal year as may be necessary to avoid knowingly declaring and paying a return of capital distribution. Distributions from net investment income and net realized short-term capital gains are reported as distributed from ordinary income for tax purposes.
| 110
Notes to Financial Statements (continued)
December 31, 2020
The tax characterization of distributions is determined on an annual basis. The tax character of distributions paid to shareholders during the years ended December 31, 2020 and 2019 (period ended December 31, 2020 and years ended September 30, 2020 and September 30, 2019 for Strategic Income Fund) were as follows:
| | | | | | | | | | | | | | | | |
| | | December 31, 2020
Distributions | |
Fund | | Ordinary
Income | | | Tax
Exempt
Income | | | Long-Term
Capital
Gains | | | Total | |
High Income Fund | | $ | 6,265,130 | | | $ | — | | | $ | — | | | $ | 6,265,130 | |
Intermediate Municipal Bond Fund | | | 791 | | | | 414,256 | | | | — | | | | 415,047 | |
International Growth Fund | | | 12,460 | | | | — | | | | — | | | | 12,460 | |
Investment Grade Bond Fund | | | 312,629,628 | | | | — | | | | 154,088,171 | | | | 466,717,799 | |
Strategic Alpha Fund | | | 28,229,130 | | | | — | | | | — | | | | 28,229,130 | |
Strategic Income Fund | | | 77,888,540 | | | | — | | | | 42,139,359 | | | | 120,027,899 | |
| |
| | | December 31, 2019
Distributions | |
Fund | | Ordinary
Income | | | Tax
Exempt
Income | | | Long-Term
Capital
Gains | | | Total | |
High Income Fund | | $ | 7,578,533 | | | $ | — | | | $ | — | | | $ | 7,578,533 | |
Intermediate Municipal Bond Fund | | | 3,751 | | | | 484,458 | | | | — | | | | 488,209 | |
International Growth Fund | | | — | | | | — | | | | — | | | | — | |
Investment Grade Bond Fund | | | 194,915,001 | | | | — | | | | — | | | | 194,915,001 | |
Strategic Alpha Fund | | | 45,024,232 | | | | — | | | | — | | | | 45,024,232 | |
| | | | | | | | | | | | | | | | | | | | | | | | |
| | | September 30, 2020
Distributions | | | September 30, 2019
Distributions | |
Fund | | Ordinary
Income | | | Long-Term
Capital
Gains | | | Total | | | Ordinary
Income | | | Long-Term
Capital
Gains | | | Total | |
Strategic Income Fund | | $ | 222,956,339 | | | $ | 11,005,230 | | | $ | 233,961,569 | | | $ | 263,812,130 | | | $ | 37,679,164 | | | $ | 301,491,294 | |
Distributions paid to shareholders from net investment income and net realized capital gains, based on accounting principles generally accepted in the United States of America, are consolidated and reported on the Statements of Changes in Net Assets as Distributions to Shareholders. Distributions paid to shareholders from net investment income and net realized capital gains expressed in per-share amounts, based on accounting principles generally accepted in the United States of America, are separately stated and reported within the Financial Highlights.
As of December 31, 2020, the components of distributable earnings on a tax basis were as follows:
| | | | | | | | | | | | | | | | | | | | | | | | |
| | | High Income
Fund | | | Intermediate
Municipal
Bond Fund | | | International
Growth
Fund | | | Investment
Grade
Bond Fund | | | Strategic
Alpha
Fund | | | Strategic
Income
Fund | |
Undistributed ordinary income | | $ | 18,741 | | | $ | — | | | $ | 5,098 | | | $ | 445,365 | | | $ | — | | | $ | — | |
Undistributed tax exempt income | | | — | | | | 19,144 | | | | — | | | | — | | | | — | | | | — | |
Undistributed long-term capital gains | | | — | | | | — | | | | — | | | | 3,011,559 | | | | — | | | | — | |
| | | | | | | | | | | | | | | | | | | | | | | | |
Total undistributed earnings | | | 18,741 | | | | 19,144 | | | | 5,098 | | | | 3,456,924 | | | | — | | | | — | |
| | | | | | | | | | | | | | | | | | | | | | | | |
111 |
Notes to Financial Statements (continued)
December 31, 2020
| | | | | | | | | | | | | | | | | | | | | | | | |
| | | High Income
Fund | | | Intermediate
Municipal
Bond Fund | | | International
Growth
Fund | | | Investment
Grade Bond
Fund | | | Strategic
Alpha Fund | | | Strategic
Income Fund | |
Capital loss carryforward: | | | | | | | | | | | | | | | | | | | | | | | | |
Short-term: | | | | | | | | | | | | | | | | | | | | | | | | |
No expiration date | | $ | — | | | $ | (343,372 | ) | | $ | — | | | $ | — | | | $ | — | | | $ | — | |
Long-term: | | | | | | | | | | | | | | | | | | | | | | | | |
No expiration date | | | (10,466,344 | ) | | | — | | | | — | | | | — | | | | (45,069,017 | ) | | | — | |
| | | | | | | | | | | | | | | | | | | | | | | | |
Late-year ordinary and post-October capital loss deferrals* | | | — | | | | — | | | | — | | | | — | | | | (3,300,526 | ) | | | (189,804,643 | ) |
| | | | | | | | | | | | | | | | | | | | | | | | |
Unrealized appreciation (depreciation) | | | 2,217,000 | | | | 1,601,784 | | | | 188,539 | | | | 492,027,849 | | | | 23,318,470 | | | | (6,921,959 | ) |
| | | | | | | | | | | | | | | | | | | | | | | | |
Total accumulated earnings (losses) | | $ | (8,230,603 | ) | | $ | 1,277,556 | | | $ | 193,637 | | | $ | 495,484,773 | | | $ | (25,051,073 | ) | | $ | (196,726,602 | ) |
| | | | | | | | | | | | | | | | | | | | | | | | |
Capital loss carryforward utilized in the current year | | $ | — | | | $ | 184,411 | | | $ | — | | | $ | — | | | $ | 5,289,686 | | | $ | 97,476,314 | |
| | | | | | | | | | | | | | | | | | | | | | | | |
| * | Under current tax law, capital losses, foreign currency losses, and losses on passive foreign investment companies and contingent payment debt instruments after October 31 or December 31, as applicable, may be deferred and treated as occurring on the first day of the following taxable year. Strategic Alpha Fund is deferring capital and foreign currency losses. Strategic Income Fund is deferring capital losses. |
As of December 31, 2020, unrealized appreciation (depreciation) as a component of distributable earnings were as follows:
| | | | | | | | | | | | | | | | | | | | | | | | |
| | | High Income
Fund | | | Intermediate
Municipal
Bond Fund | | | International
Growth Fund | | | Investment
Grade Bond
Fund | | | Strategic
Alpha Fund | | | Strategic Income Fund | |
Unrealized appreciation (depreciation) | | | | | | | | | | | | | | | | | | | | | | | | |
Investments | | $ | 2,217,000 | | | $ | 1,601,784 | | | $ | 188,535 | | | $ | 492,027,849 | | | $ | 46,743,540 | | | $ | (6,323,760 | ) |
Foreign currency translations | | | — | | | | — | | | | 4 | | | | — | | | | (23,425,070 | ) | | | (598,199 | ) |
| | | | | | | | | | | | | | | | | | | | | | | | |
Total unrealized appreciation (depreciation) | | $ | 2,217,000 | | | $ | 1,601,784 | | | $ | 188,539 | | | $ | 492,027,849 | | | $ | 23,318,470 | | | $ | (6,921,959 | ) |
| | | | | | | | | | | | | | | | | | | | | | | | |
As of December 31, 2020, the tax cost of investments (including derivatives, if applicable) and unrealized appreciation (depreciation) on a federal tax basis were as follows:
| | | | | | | | | | | | | | | | | | | | | | | | |
| | | High Income
Fund | | | Intermediate
Municipal
Bond Fund | | | International
Growth
Fund | | | Investment
Grade Bond
Fund | | | Strategic
Alpha Fund | | | Strategic Income Fund | |
Federal tax cost | | $ | 109,543,906 | | | $ | 36,759,138 | | | $ | 14,828,544 | | | $ | 5,501,728,654 | | | $ | 1,260,473,225 | | | $ | 5,925,110,534 | |
| | | | | | | | | | | | | | | | | | | | | | | | |
Gross tax appreciation | | $ | 8,068,336 | | | $ | 1,609,997 | | | $ | 372,084 | | | $ | 532,649,637 | | | $ | 86,876,118 | | | $ | 543,364,061 | |
Gross tax depreciation | | | (5,851,336 | ) | | | (8,213 | ) | | | (183,549 | ) | | | (40,621,788 | ) | | | (63,779,539 | ) | | | (550,285,311 | ) |
| | | | | | | | | | | | | | | | | | | | | | | | |
Net tax appreciation (depreciation) | | $ | 2,217,000 | | | $ | 1,601,784 | | | $ | 188,535 | | | $ | 492,027,849 | | | $ | 23,096,579 | | | $ | (6,921,250 | ) |
| | | | | | | | | | | | | | | | | | | | | | | | |
The difference between these amounts and those reported in the components of distributable earnings are primarily attributable to foreign currency mark-to-market.
l. Senior Loans. Each Fund may invest in senior loans to corporate, governmental or other borrowers. Senior loans, which include both secured and unsecured loans made by banks and other financial institutions to corporate customers, typically hold the most senior position in a borrower’s capital structure, may be secured by the borrower’s assets and have interest rates that reset frequently. Senior Loans can include term loans, revolving credit facility loans and second lien loans. A senior loan is often administered by a bank or other financial institution that acts as agent for all holders. The agent administers the terms of the senior loan, as specified in the loan agreement. Large loans may be shared or syndicated among several lenders. The Fund may enter into the primary syndicate for a loan or it may also purchase all or a portion of loans from other lenders (sometimes referred to as loan assignments), in either case becoming a direct lender. Senior loans outstanding at the end of the period , if any, are listed in each applicable Fund’s Portfolio of Investments.
m. Loan Participations. A Fund’s investments in senior loans may be in the form of participations in loans. When investing in a loan participation, the Fund has the right to receive payments of principal, interest and any fees to which it is entitled only from the party from whom the Fund has purchased the participation and only upon receipt by that party of payments from the borrower. The Fund generally has no right to enforce compliance by the borrower with the terms of the loan agreement or to vote on matters arising under
| 112
Notes to Financial Statements (continued)
December 31, 2020
the loan agreement. Thus, the Fund may be subject to credit risk from both the party from whom it purchased the loan participation and the borrower. Additionally, the Fund may have minimal control over the terms of any loan modification. Loan participations outstanding at the end of the period, if any, are listed in each applicable Fund’s Portfolio of Investments.
n. Collateralized Loan Obligations. Each Fund may invest in collateralized loan obligations (“CLOs”). A CLO is a type of asset-backed security designed to redirect the cash flows from a pool of leveraged loans to investors based on their risk preferences. Cash flows from a CLO are split into two or more portions, called tranches, varying in risk and yield. The risk of an investment in a CLO depends largely on the type of the collateralized securities and the class of the instrument in which the Fund invests. The intent of the Funds when investing in CLOs is to purchase only higher level, investment grade level select tranches. CLOs outstanding at the end of the period, if any, are listed in each applicable Fund’s Portfolio of Investments.
o. Equity Linked Notes. Strategic Alpha Fund may invest in equity linked notes. An equity linked note is a structured product that differs from a standard debt instrument where the cash payouts will be based on the return of an underlying equity. An equity linked note is typically purchased at a full nominal amount and includes a coupon with an enhanced yield relative to the dividend yield of the underlying security. At maturity the Fund will receive a redemption amount based on the final price of the underlying equity. The risk of investment in an equity linked note depends on the principal protection offered. Some equity linked notes may guarantee total principal or partial principal amounts while others may not provide any guarantee of principal. The maturity value may also be impacted to the extent of any limit on the return value as part of the note structure. Equity linked notes outstanding at the end of the period, if any, are listed in the Fund’s Portfolio of Investments.
The Fund did not hold any equity linked notes as of December 31, 2020.
p. Repurchase Agreements. Each Fund may enter into repurchase agreements, under the terms of a Master Repurchase Agreement, under which each Fund acquires securities as collateral and agrees to resell the securities at an agreed upon time and at an agreed upon price. It is each Fund’s policy that the market value of the collateral for repurchase agreements be at least equal to 102% of the repurchase price, including interest. Certain repurchase agreements are tri-party arrangements whereby the collateral is held in a segregated account for the benefit of the Fund and on behalf of the counterparty. Repurchase agreements could involve certain risks in the event of default or insolvency of the counterparty, including possible delays or restrictions upon a Fund’s ability to dispose of the underlying securities. As of December 31, 2020, each Fund, as applicable, had investments in repurchase agreements for which the value of the related collateral exceeded the value of the repurchase agreement. The gross value of repurchase agreements is included in the Statements of Assets and Liabilities for financial reporting purposes.
q. When-Issued and Delayed Delivery Transactions. The Funds may enter into when-issued or delayed delivery transactions. When-issued refers to transactions made conditionally because a security, although authorized, has not been issued. Delayed delivery refers to transactions for which delivery or payment will occur at a later date, beyond the normal settlement period. The price of when-issued and delayed delivery securities and the date when the securities will be delivered and paid for are fixed at the time the transaction is negotiated. The security and the obligation to pay for it are recorded by the Funds at the time the commitment is entered into. The value of the security may vary with market fluctuations during the time before the Funds take delivery of the security. No interest accrues to the Funds until the transaction settles.
Delayed delivery transactions include those designated as To Be Announced (“TBAs”) in the Portfolios of Investments. For TBAs, the actual security that will be delivered to fulfill the transaction is not designated at the time of the trade. The security is “to be announced” 48 hours prior to the established trade settlement date. Certain transactions require the Funds or counterparty to post cash and/or securities as collateral for the net mark-to-market exposure to the other party. The Funds cover their net obligations under outstanding delayed delivery commitments by segregating or earmarking cash or securities at the custodian.
Purchases of when-issued or delayed delivery securities may have a similar effect on the Funds’ NAV as if the Funds’ had created a degree of leverage in the portfolio. Risks may arise upon entering into such transactions from the potential inability of counterparties to meet their obligations under the transactions. Additionally, losses may arise due to changes in the value of the underlying securities.
There were no when-issued or delayed delivery securities held by the Funds as of December 31, 2020.
r. Stripped Securities. Each Fund may invest in stripped securities, which are usually structured with two or more classes that receive different proportions of the interest and principal distribution on a pool of U.S. or foreign government securities or mortgage assets. In some cases, one class will receive all of the interest (the interest-only or “IO” class), while the other class will receive all of the principal (the principal-only or “PO” class). Stripped securities commonly have greater market volatility than other types of fixed-income securities. In the case of stripped mortgage securities, if the underlying mortgage assets experience greater than anticipated prepayments of principal, a Fund may fail to recoup fully its investments in IOs.
The Funds did not hold any stripped securities as of December 31, 2020.
113 |
Notes to Financial Statements (continued)
December 31, 2020
s. Securities Lending. High Income Fund, Investment Grade Bond Fund and Strategic Income Fund have entered into an agreement with State Street Bank and Trust Company (“State Street Bank”), as agent of the Funds, to lend securities to certain designated borrowers. The loans are collateralized with cash or securities in an amount equal to at least 105% or 102% of the market value (including accrued interest) of the loaned international or domestic securities, respectively, when the loan is initiated. Thereafter, the value of the collateral must remain at least 102% of the market value (including accrued interest) of loaned securities for U.S. equities and U.S. corporate debt; at least 105% of the market value (including accrued interest) of loaned securities for non-U.S. equities; and at least 100% of the market value (including accrued interest) of loaned securities for U.S. Government securities, sovereign debt issued by non-U.S. Governments and non-U.S. corporate debt. In the event that the market value of the collateral falls below the required percentages described above, the borrower will deliver additional collateral on the next business day. As with other extensions of credit, the Funds may bear the risk of loss with respect to the investment of the collateral. The Funds invest cash collateral in short-term investments, a portion of the income from which is remitted to the borrowers and the remainder allocated between the Funds and State Street Bank as lending agent.
For the year ended (period ended for Strategic Income Fund) December 31, 2020, the Funds did not loan securities under this agreement.
t. Unfunded Loan Commitments. The Funds may enter into unfunded loan commitments, which are contractual obligations for future funding at the option of the borrower. Unfunded loan commitments represent a future obligation, in full, even though a percentage of the committed amount may not be utilized by the borrower. Unfunded loan commitments, and the obligation for future funding, are recorded as a liability on the Statements of Assets and Liabilities at par value at the time the commitment is entered into. Purchases of unfunded loan commitments may have a similar effect on the Fund’s NAV as if the Fund had created a degree of leverage in the portfolio. Market risk exists with these commitments to the same extent as if the securities were owned on a settled basis. Losses may arise due to changes in the value of the unfunded loan commitments.
As of December 31, 2020, the Funds did not have any unfunded loan commitments.
u. Indemnifications. Under the Trusts’ organizational documents, its officers and Trustees are indemnified against certain liabilities arising out of the performance of their duties to the Funds. Additionally, in the normal course of business, the Funds enter into contracts with service providers that contain general indemnification clauses. The Funds’ maximum exposure under these arrangements is unknown as this would involve future claims that may be made against the Funds that have not yet occurred. However, based on experience, the Funds expect the risk of loss to be remote.
v. New Accounting Pronouncement. In March 2020, the Financial Accounting Standards Board issued Accounting Standard Update 2020-04, Reference Rate Reform (Topic 848) (“ASU 2020-04”). In response to concerns about structural risks of interbank offered rates, and particularly the risk of cessation of the London Interbank Offered Rate (“LIBOR”), which is expected to occur no later than December 31, 2021, regulators have undertaken reference rate reform initiatives to identify alternative reference rates that are more observable or transaction based and less susceptible to manipulation. ASU 2020-04 provides temporary guidance to ease the potential burden in accounting for (or recognizing the effects of) reference rate reform on financial reporting. ASU 2020-04 is elective and applies to all entities, subject to meeting certain criteria, that have contracts that reference LIBOR or another reference rate expected to be discontinued because of reference rate reform. ASU 2020-04 amendments offer optional expedients for contract modifications that would allow an entity to account for such modifications by prospectively adjusting the effective interest rate, instead of evaluating each contract, in accordance with existing accounting standards, as to whether reference rate modifications constitute the establishment of new contracts or the continuation of existing contracts. ASU 2020-04 amendments are currently effective and an entity may elect to apply its provisions as of any date from the beginning of an interim period that includes or is subsequent to March 12, 2020. No Fund contracts have yet been impacted by reference rate reform. Management expects to apply the optional expedients when appropriate.
3. Fair Value Measurements. In accordance with accounting standards related to fair value measurements and disclosures, the Funds have categorized the inputs utilized in determining the value of each Fund’s assets or liabilities. These inputs are summarized in the three broad levels listed below:
| | • | | Level 1 – quoted prices in active markets for identical assets or liabilities; |
| | • | | Level 2 – prices determined using other significant inputs that are observable either directly, or indirectly through corroboration with observable market data (which could include quoted prices for similar assets or liabilities, interest rates, credit risk, etc.); and |
| | • | | Level 3 – prices determined using significant unobservable inputs when quoted prices or observable inputs are unavailable such as when there is little or no market activity for an asset or liability (unobservable inputs reflect each Fund’s own assumptions in determining the fair value of assets or liabilities and would be based on the best information available). |
| 114
Notes to Financial Statements (continued)
December 31, 2020
The inputs or methodology used for valuing securities are not necessarily an indication of the risk associated with investing in those securities.
The Funds’ pricing policies and procedures are recommended by the adviser and approved by the Board of Trustees. Debt securities are valued based on evaluated bids furnished to the Funds by an independent pricing service. Broker-dealer bid prices may be used if an independent pricing service either is unable to price a security or does not provide a reliable price for a security. The Funds’ adviser may use internally developed models to validate broker-dealer bid prices that are only available from a single broker or market maker. Such securities are considered and classified as fair valued. Broker-dealer bid prices for which the Funds do not have knowledge of the inputs used by the broker-dealer are categorized in Level 3. Securities for which market quotations are not readily available are valued at fair value as determined in good faith by the Funds’ adviser pursuant to procedures approved by the Board of Trustees. Fair valued securities may be categorized in Level 3.
The following is a summary of the inputs used to value the Funds’ investments as of December 31, 2020, at value:
High Income Fund
Asset Valuation Inputs
| | | | | | | | | | | | | | | | |
Description | | Level 1 | | | Level 2 | | | Level 3 | | | Total | |
Bonds and Notes | | | | | | | | | | | | | | | | |
Non-Convertible Bonds | | | | | | | | | | | | | | | | |
Home Construction | | $ | — | | | $ | 1,285,861 | | | $ | — | (b) | | $ | 1,285,861 | |
Non-Agency Commercial Mortgage-Backed Securities | | | — | | | | 1,168,385 | | | | 390,104 | (c) | | | 1,558,489 | |
All Other Non-Convertible Bonds(a) | | | — | | | | 91,362,965 | | | | — | | | | 91,362,965 | |
| | | | | | | | | | | | | | | | |
Total Non-Convertible Bonds | | | — | | | | 93,817,211 | | | | 390,104 | | | | 94,207,315 | |
| | | | | | | | | | | | | | | | |
Convertible Bonds(a) | | | — | | | | 5,282,146 | | | | — | | | | 5,282,146 | |
| | | | | | | | | | | | | | | | |
Total Bonds and Notes | | | — | | | | 99,099,357 | | | | 390,104 | | | | 99,489,461 | |
| | | | | | | | | | | | | | | | |
Collateralized Loan Obligations | | | — | | | | 488,635 | | | | — | | | | 488,635 | |
Loan Participations(a) | | | — | | | | — | | | | 161,345 | (c) | | | 161,345 | |
Preferred Stocks | | | | | | | | | | | | | | | | |
Energy | | | — | | | | — | | | | — | (b) | | | — | |
Food & Beverage | | | — | | | | 1,418,544 | | | | — | | | | 1,418,544 | |
All Other Preferred Stocks(a) | | | 768,681 | | | | — | | | | — | | | | 768,681 | |
| | | | | | | | | | | | | | | | |
Total Preferred Stocks | | | 768,681 | | | | 1,418,544 | | | | — | | | | 2,187,225 | |
| | | | | | | | | | | | | | | | |
Common Stocks | | | | | | | | | | | | | | | | |
Chemicals | | | — | | | | 157,449 | | | | — | | | | 157,449 | |
All Other Common Stocks(a) | | | 590,149 | | | | — | | | | — | | | | 590,149 | |
| | | | | | | | | | | | | | | | |
Total Common Stocks | | | 590,149 | | | | 157,449 | | | | — | | | | 747,598 | |
| | | | | | | | | | | | | | | | |
Other Investments(a) | | | — | | | | — | | | | 125,600 | (c) | | | 125,600 | |
Warrants | | | — | | | | — | | | | 37,995 | (c) | | | 37,995 | |
Short-Term Investments | | | — | | | | 8,523,047 | | | | — | | | | 8,523,047 | |
| | | | | | | | | | | | | | | | |
Total | | $ | 1,358,830 | | | $ | 109,687,032 | | | $ | 715,044 | | | $ | 111,760,906 | |
| | | | | | | | | | | | | | | | |
| (a) | Details of the major categories of the Fund’s investments are reflected within the Portfolio of Investments. |
| (b) | Includes a security fair valued at zero by the Fund’s adviser using Level 3 inputs. |
| (c) | Fair valued by the Fund’s adviser. |
Intermediate Municipal Bond Fund
Asset Valuation Inputs
| | | | | | | | | | | | | | | | |
Description | | Level 1 | | | Level 2 | | | Level 3 | | | Total | |
Bonds and Notes(a) | | $ | — | | | $ | 35,228,502 | | | $ | — | | | $ | 35,228,502 | |
Short-Term Investments | | | 1,100,000 | | | | 2,032,420 | | | | — | | | | 3,132,420 | |
| | | | | | | | | | | | | | | | |
Total | | $ | 1,100,000 | | | $ | 37,260,922 | | | $ | — | | | $ | 38,360,922 | |
| | | | | | | | | | | | | | | | |
| (a) | Details of the major categories of the Fund’s investments are reflected within the Portfolio of Investments. |
115 |
Notes to Financial Statements (continued)
December 31, 2020
International Growth Fund
Asset Valuation Inputs
| | | | | | | | | | | | | | | | |
Description | | Level 1 | | | Level 2 | | | Level 3 | | | Total | |
Common Stocks | | | | | | | | | | | | | | | | |
Australia | | $ | — | | | $ | 492,201 | | | $ | — | | | $ | 492,201 | |
Belgium | | | — | | | | 351,973 | | | | — | | | | 351,973 | |
China | | | 2,860,381 | | | | 1,968,671 | | | | — | | | | 4,829,052 | |
Denmark | | | — | | | | 360,027 | | | | — | | | | 360,027 | |
France | | | — | | | | 634,055 | | | | — | | | | 634,055 | |
Germany | | | — | | | | 450,984 | | | | — | | | | 450,984 | |
Japan | | | — | | | | 807,798 | | | | — | | | | 807,798 | |
Macau | | | — | | | | 194,613 | | | | — | | | | 194,613 | |
Netherlands | | | 352,048 | | | | 743,534 | | | | — | | | | 1,095,582 | |
Switzerland | | | — | | | | 2,338,200 | | | | — | | | | 2,338,200 | |
United Kingdom | | | 384,378 | | | | 1,114,087 | | | | — | | | | 1,498,465 | |
All Other Common Stocks(a) | | | 1,964,129 | | | | — | | | | — | | | | 1,964,129 | |
| | | | | | | | | | | | | | | | |
Total | | $ | 5,560,936 | | | $ | 9,456,143 | | | $ | — | | | $ | 15,017,079 | |
| | | | | | | | | | | | | | | | |
| (a) | Details of the major categories of the Fund’s investments are reflected within the Portfolio of Investments. |
Investment Grade Bond Fund
Asset Valuation Inputs
| | | | | | | | | | | | | | | | |
Description | | Level 1 | | | Level 2 | | | Level 3 | | | Total | |
Bonds and Notes | | | | | | | | | | | | | | | | |
Non-Convertible Bonds | | | | | | | | | | | | | | | | |
ABS Other | | $ | — | | | $ | 161,120,445 | | | $ | 21,594,566 | (b) | | $ | 182,715,011 | |
All Other Non-Convertible Bonds(a) | | | — | | | | 5,270,476,344 | | | | — | | | | 5,270,476,344 | |
| | | | | | | | | | | | | | | | |
Total Non-Convertible Bonds | | | — | | | | 5,431,596,789 | | | | 21,594,566 | | | | 5,453,191,355 | |
| | | | | | | | | | | | | | | | |
Convertible Bonds(a) | | | — | | | | 76,087,082 | | | | — | | | | 76,087,082 | |
Municipals(a) | | | — | | | | 7,862,719 | | | | — | | | | 7,862,719 | |
| | | | | | | | | | | | | | | | |
Total Bonds and Notes | | | — | | | | 5,515,546,590 | | | | 21,594,566 | | | | 5,537,141,156 | |
| | | | | | | | | | | | | | | | |
Collateralized Loan Obligations | | | — | | | | 212,435,862 | | | | 14,755,000 | (b) | | | 227,190,862 | |
Preferred Stocks | | | | | | | | | | | | | | | | |
Energy | | | — | | | | — | | | | — | (c) | | | — | |
Food & Beverage | | | — | | | | 15,108,904 | | | | — | | | | 15,108,904 | |
All Other Preferred Stocks(a) | | | 41,423,282 | | | | — | | | | — | | | | 41,423,282 | |
| | | | | | | | | | | | | | | | |
Total Preferred Stocks | | | 41,423,282 | | | | 15,108,904 | | | | — | | | | 56,532,186 | |
| | | | | | | | | | | | | | | | |
Short-Term Investments | | | — | | | | 172,892,299 | | | | — | | | | 172,892,299 | |
| | | | | | | | | | | | | | | | |
Total | | $ | 41,423,282 | | | $ | 5,915,983,655 | | | $ | 36,349,566 | | | $ | 5,993,756,503 | |
| | | | | | | | | | | | | | | | |
| (a) | Details of the major categories of the Fund’s investments are reflected within the Portfolio of Investments. |
| (b) | Valued using broker-dealer bid prices. |
| (c) | Includes a security fair valued at zero by the Fund’s adviser using level 3 inputs. |
| 116
Notes to Financial Statements (continued)
December 31, 2020
Strategic Alpha Fund
Asset Valuation Inputs
| | | | | | | | | | | | | | | | |
Description | | Level 1 | | | Level 2 | | | Level 3 | | | Total | |
Bonds and Notes | | | | | | | | | | | | | | | | |
Non-Convertible Bonds | | | | | | | | | | | | | | | | |
ABS Other | | $ | — | | | $ | 62,547,232 | | | $ | 1,475,243 | (b)(c) | | $ | 64,022,475 | |
Non-Agency Commercial Mortgage-Backed Securities | | | — | | | | 39,844,081 | | | | 4,742,511 | (d) | | | 44,586,592 | |
All Other Non-Convertible Bonds(a) | | | — | | | | 778,714,087 | | | | — | | | | 778,714,087 | |
| | | | | | | | | | | | | | | | |
Total Non-Convertible Bonds | | | — | | | | 881,105,400 | | | | 6,217,754 | | | | 887,323,154 | |
| | | | | | | | | | | | | | | | |
Convertible Bonds(a) | | | — | | | | 38,936,972 | | | | — | | | | 38,936,972 | |
| | | | | | | | | | | | | | | | |
Total Bonds and Notes | | | — | | | | 920,042,372 | | | | 6,217,754 | | | | 926,260,126 | |
| | | | | | | | | | | | | | | | |
Senior Loans(a) | | | — | | | | 6,286,668 | | | | — | | | | 6,286,668 | |
Collateralized Loan Obligations | | | — | | | | 69,994,538 | | | | — | | | | 69,994,538 | |
Loan Participations(a) | | | — | | | | — | | | | 580,841 | (d) | | | 580,841 | |
Common Stocks | | | | | | | | | | | | | | | | |
Chemicals | | | — | | | | 1,791,516 | | | | — | | | | 1,791,516 | |
Textiles, Apparel & Luxury Goods | | | 381,403 | | | | 772,485 | | | | — | | | | 1,153,888 | |
All Other Common Stocks(a) | | | 42,491,218 | | | | — | | | | — | | | | 42,491,218 | |
| | | | | | | | | | | | | | | | |
Total Common Stocks | | | 42,872,621 | | | | 2,564,001 | | | | — | | | | 45,436,622 | |
| | | | | | | | | | | | | | | | |
Preferred Stocks | | | | | | | | | | | | | | | | |
Convertible Preferred Stocks | | | | | | | | | | | | | | | | |
Energy | | | — | | | | — | | | | — | (c) | | | — | |
Food & Beverage | | | — | | | | 4,598,518 | | | | — | | | | 4,598,518 | |
All Other Convertible Preferred Stocks(a) | | | 9,037,609 | | | | — | | | | — | | | | 9,037,609 | |
| | | | | | | | | | | | | | | | |
Total Convertible Preferred Stocks | | | 9,037,609 | | | | 4,598,518 | | | | — | | | | 13,636,127 | |
| | | | | | | | | | | | | | | | |
Non-Convertible Preferred Stocks(a) | | | — | | | | 4,120,800 | | | | — | | | | 4,120,800 | |
| | | | | | | | | | | | | | | | |
Total Preferred Stocks | | | 9,037,609 | | | | 8,719,318 | | | | — | | | | 17,756,927 | |
| | | | | | | | | | | | | | | | |
Other Investments(a) | | | — | | | | — | | | | 1,130,400 | (d) | | | 1,130,400 | |
Short-Term Investments | | | — | | | | 210,186,973 | | | | — | | | | 210,186,973 | |
| | | | | | | | | | | | | | | | |
Total Investments | | | 51,910,230 | | | | 1,217,793,870 | | | | 7,928,995 | | | | 1,277,633,095 | |
| | | | | | | | | | | | | | | | |
Centrally Cleared Credit Default Swap Agreements (unrealized appreciation) | | | — | | | | 4,795,544 | | | | — | | | | 4,795,544 | |
Forward Foreign Currency Contracts (unrealized appreciation) | | | — | | | | 197,122 | | | | — | | | | 197,122 | |
| | | | | | | | | | | | | | | | |
Total | | $ | 51,910,230 | | | $ | 1,222,786,536 | | | $ | 7,928,995 | | | $ | 1,282,625,761 | |
| | | | | | | | | | | | | | | | |
|
| Liability Valuation Inputs | |
Description | | Level 1 | | | Level 2 | | | Level 3 | | | Total | |
Written Options(a) | | $ | (159,801 | ) | | $ | — | | | $ | — | | | $ | (159,801 | ) |
Bilateral Credit Default Swap Agreements (unrealized depreciation) | | | — | | | | (526,239 | ) | | | — | | | | (526,239 | ) |
Centrally Cleared Interest Rate Swap Agreements (unrealized depreciation) | | | — | | | | (2,050,576 | ) | | | — | | | | (2,050,576 | ) |
Forward Foreign Currency Contracts (unrealized depreciation) | | | — | | | | (3,258,689 | ) | | | — | | | | (3,258,689 | ) |
Futures Contracts (unrealized depreciation) | | | (22,434 | ) | | | — | | | | — | | | | (22,434 | ) |
| | | | | | | | | | | | | | | | |
Total | | $ | (182,235 | ) | | $ | (5,835,504 | ) | | $ | — | | | $ | (6,017,739 | ) |
| | | | | | | | | | | | | | | | |
| (a) | Details of the major categories of the Fund’s investments are reflected within the Portfolio of Investments. |
| (b) | Fair valued by the Fund’s adviser using a broker dealer bid price provided by a single market maker ($904,103) or valued using broker-dealer bid prices ($571,140). |
| (c) | Includes securities fair valued at zero by the Fund’s adviser using level 3 inputs. |
| (d) | Fair valued by the Fund’s adviser. |
117 |
Notes to Financial Statements (continued)
December 31, 2020
Strategic Income Fund
Asset Valuation Inputs
| | | | | | | | | | | | | | | | |
Description | | Level 1 | | | Level 2 | | | Level 3 | | | Total | |
Bonds and Notes | | | | | | | | | | | | | | | | |
Non-Convertible Bonds | | | | | | | | | | | | | | | | |
ABS Other | | $ | — | | | $ | — | | | $ | 14,217,962 | (b)(c) | | $ | 14,217,962 | |
Finance Companies | | | 2,757,913 | | | | 381,507,553 | | | | — | | | | 384,265,466 | |
All Other Non-Convertible Bonds(a) | | | — | | | | 3,280,299,165 | | | | — | | | | 3,280,299,165 | |
| | | | | | | | | | | | | | | | |
Total Non-Convertible Bonds | | | 2,757,913 | | | | 3,661,806,718 | | | | 14,217,962 | | | | 3,678,782,593 | |
| | | | | | | | | | | | | | | | |
Convertible Bonds | | | | | | | | | | | | | | | | |
Oil Field Services | | | — | | | | — | | | | 6,330,947 | (d) | | | 6,330,947 | |
All Other Convertible Bonds(a) | | | — | | | | 246,168,380 | | | | — | | | | 246,168,380 | |
| | | | | | | | | | | | | | | | |
Total Convertible Bonds | | | — | | | | 246,168,380 | | | | 6,330,947 | | | | 252,499,327 | |
| | | | | | | | | | | | | | | | |
Municipals(a) | | | — | | | | 94,446,157 | | | | — | | | | 94,446,157 | |
| | | | | | | | | | | | | | | | |
Total Bonds and Notes | | | 2,757,913 | | | | 4,002,421,255 | | | | 20,548,909 | | | | 4,025,728,077 | |
| | | | | | | | | | | | | | | | |
Senior Loans | | | | | | | | | | | | | | | | |
Construction Machinery | | | — | | | | — | | | | 9,862,216 | (d) | | | 9,862,216 | |
All Other Senior Loans(a) | | | — | | | | 20,758,857 | | | | — | | | | 20,758,857 | |
| | | | | | | | | | | | | | | | |
Total Senior Loans | | | — | | | | 20,758,857 | | | | 9,862,216 | | | | 30,621,073 | |
| | | | | | | | | | | | | | | | |
Common Stocks | | | | | | | | | | | | | | | | |
Chemicals | | | — | | | | 8,588,778 | | | | — | | | | 8,588,778 | |
Oil Field Services | | | — | | | | — | | | | — | (c) | | | — | |
Oil, Gas & Consumable Fuels | | | 24,134,375 | | | | 1,465,770 | | | | 3,473,775 | (c)(d) | | | 29,073,920 | |
Software | | | 2,701,736 | | | | 263,825 | | | | — | | | | 2,965,561 | |
Specialty Retail | | | 2,611,310 | | | | — | | | | — | (c) | | | 2,611,310 | |
All Other Common Stocks(a) | | | 661,860,349 | | | | — | | | | — | | | | 661,860,349 | |
| | | | | | | | | | | | | | | | |
Total Common Stocks | | | 691,307,770 | | | | 10,318,373 | | | | 3,473,775 | | | | 705,099,918 | |
| | | | | | | | | | | | | | | | |
Preferred Stocks | | | | | | | | | | | | | | | | |
Convertible Preferred Stocks | | | | | | | | | | | | | | | | |
Energy | | | — | | | | — | | | | — | (c) | | | — | |
Food & Beverage | | | — | | | | 1,792,870 | | | | — | | | | 1,792,870 | |
All Other Convertible Preferred Stocks(a) | | | 34,257,915 | | | | — | | | | — | | | | 34,257,915 | |
| | | | | | | | | | | | | | | | |
Total Convertible Preferred Stocks | | | 34,257,915 | | | | 1,792,870 | | | | — | | | | 36,050,785 | |
| | | | | | | | | | | | | | | | |
Non-Convertible Preferred Stocks | | | | | | | | | | | | | | | | |
REITs – Office Property | | | — | | | | 1,915,200 | | | | — | | | | 1,915,200 | |
REITs – Warehouse/Industrials | | | — | | | | 8,017,248 | | | | — | | | | 8,017,248 | |
All Other Non-Convertible Preferred Stocks(a) | | | 1,961,503 | | | | — | | | | — | | | | 1,961,503 | |
| | | | | | | | | | | | | | | | |
Total Non-Convertible Preferred Stocks | | | 1,961,503 | | | | 9,932,448 | | | | — | | | | 11,893,951 | |
| | | | | | | | | | | | | | | | |
Total Preferred Stocks | | | 36,219,418 | | | | 11,725,318 | | | | — | | | | 47,944,736 | |
| | | | | | | | | | | | | | | | |
Warrants | | | — | | | | — | | | | 9,760,259 | (d) | | | 9,760,259 | |
Closed-End Investment Companies | | | 1,791,367 | | | | — | | | | — | | | | 1,791,367 | |
Short-Term Investments | | | — | | | | 1,097,243,854 | | | | — | | | | 1,097,243,854 | |
| | | | | | | | | | | | | | | | |
Total | | $ | 732,076,468 | | | $ | 5,142,467,657 | | | $ | 43,645,159 | | | $ | 5,918,189,284 | |
| | | | | | | | | | | | | | | | |
| (a) | Details of the major categories of the Fund’s investments are reflected within the Portfolio of Investments. |
| (b) | Fair valued by the Fund’s adviser using a broker dealer bid price provided by a single market maker ($9,347,572) or valued using broker-dealer bid prices ($4,870,390). |
| (c) | Includes securities fair valued at zero by the Fund’s adviser using level 3 inputs. |
| (d) | Fair valued by the Fund’s adviser. |
| 118
Notes to Financial Statements (continued)
December 31, 2020
The following is a reconciliation of Level 3 investments for which significant unobservable inputs were used to determine fair value as of September 30, 2020, December 31, 2019 and/or December 31, 2020:
High Income Fund
Asset Valuation Inputs
| | | | | | | | | | | | | | | | | | | | | | | | | | | | | | | | | | | | | | | | |
Investments in Securities | | Balance
as of
December 31,
2019 | | | Accrued
Discounts
(Premiums) | | | Realized
Gain
(Loss) | | | Change in
Unrealized
Appreciation
(Depreciation) | | | Purchases | | | Sales | | | Transfers
into
Level 3 | | | Transfers
out of
Level 3 | | | Balance
as of
December 31,
2020 | | | Change in
Unrealized
Appreciation
(Depreciation)
from
Investments
Still Held at
December 31,
2020 | |
Bonds and Notes | | | | | | | | | | | | | | | | | | | | | | | | | | | | | | | | | | | | | | | | |
Non-Convertible Bonds | | | | | | | | | | | | | | | | | | | | | | | | | | | | | | | | | | | | | | | | |
Home Construction | | $ | — | (a) | | $ | 88,870 | | | $ | 1,050,446 | | | $ | (1,139,316 | ) | | $ | — | | | $ | — | | | $ | — | | | $ | — | | | $ | — | (a) | | $ | (1,139,316 | ) |
Non-Agency Commercial Mortgage-Backed Securities | | | 325,435 | | | | — | | | | — | | | | (258,242 | ) | | | — | | | | — | | | | 322,911 | | | | — | | | | 390,104 | | | | (258,242 | ) |
Loan Participations | | | | | | | | | | | | | | | | | | | | | | | | | | | | | | | | | | | | | | | | |
ABS Other | | | — | | | | 26 | | | | 226 | | | | (134,422 | ) | | | — | | | | (102,858 | ) | | | 398,373 | | | | — | | | | 161,345 | | | | (134,422 | ) |
Preferred Stocks | | | | | | | | | | | | | | | | | | | | | | | | | | | | | | | | | | | | | | | | |
Energy | | | 196,350 | | | | — | | | | — | | | | (196,350 | ) | | | — | | | | — | | | | — | | | | — | | | | — | (a) | | | (196,350 | ) |
Common Stocks | | | | | | | | | | | | | | | | | | | | | | | | | | | | | | | | | | | | | | | | |
Oil, Gas & Consumable Fuels | | | 52,304 | | | | — | | | | — | | | | — | | | | — | | | | — | | | | — | | | | (52,304 | ) | | | — | | | | — | |
Other Investments | | | | | | | | | | | | | | | | | | | | | | | | | | | | | | | | | | | | | | | | |
Aircraft ABS | | | 864,000 | | | | — | | | | — | | | | (738,400 | ) | | | — | | | | — | | | | — | | | | — | | | | 125,600 | | | | (738,400 | ) |
Warrants | | | — | | | | — | | | | — | | | | (920 | ) | | | 38,915 | | | | — | | | | — | | | | — | | | | 37,995 | | | | (920 | ) |
| | | | | | | | | | | | | | | | | | | | | | | | | | | | | | | | | | | | | | | | |
Total | | $ | 1,438,089 | | | $ | 88,896 | | | $ | 1,050,672 | | | $ | (2,467,650 | ) | | $ | 38,915 | | | $ | (102,858 | ) | | $ | 721,284 | | | $ | (52,304 | ) | | $ | 715,044 | | | $ | (2,467,650 | ) |
| | | | | | | | | | | | | | | | | | | | | | | | | | | | | | | | | | | | | | | | |
| (a) | Includes a security fair valued at zero using level 3 inputs. |
A debt security valued at $322,911 was transferred from Level 2 to Level 3 during the period ended December 31, 2020. At December 31, 2019, this security was valued on the basis of evaluated bids furnished to the Fund by an independent pricing service in accordance with the Fund’s valuation policies. At December 31, 2020, this security was valued at fair value as determined in good faith by the Fund’s adviser as an independent pricing service did not provide a reliable price for the security.
A debt security valued at $398,373 was transferred from Level 2 to Level 3 during the period ended December 31, 2020. At December 31, 2019, this security was valued at a bid price furnished to the Fund by an independent pricing service in accordance with the Fund’s valuation policies. At December 31, 2020, this security was valued at fair value as determined in good faith by the Fund’s adviser as an independent pricing service did not provide a reliable price for the security.
A common stock valued at $52,304 was transferred from Level 3 to Level 1 during the period ended December 31, 2020. At December 31, 2019, this security was valued at fair value as determined in good faith by the Fund’s investment adviser as an independent pricing service was unable to price the security. At December 31, 2020, this security was valued at the market price in accordance with the Fund’s valuation policies.
119 |
Notes to Financial Statements (continued)
December 31, 2020
Investment Grade Bond Fund
Asset Valuation Inputs
| | | | | | | | | | | | | | | | | | | | | | | | | | | | | | | | | | | | | | | | |
Investments in Securities | | Balance
as of
December 31,
2019 | | | Accrued
Discounts
(Premiums) | | | Realized
Gain
(Loss) | | | Change in
Unrealized
Appreciation
(Depreciation) | | | Purchases | | | Sales | | | Transfers
into
Level 3 | | | Transfers
out of
Level 3 | | | Balance
as of
December 31,
2020 | | | Change in
Unrealized
Appreciation
(Depreciation)
from
Investments
Still Held at
December 31,
2020 | |
Bonds and Notes | | | | | | | | | | | | | | | | | | | | | | | | | | | | | | | | | | | | | | | | |
Non-Convertible Bonds | | | | | | | | | | | | | | | | | | | | | | | | | | | | | | | | | | | | | | | | |
ABS Other | | $ | — | | | $ | — | | | $ | — | | | $ | (17,667,175 | ) | | $ | — | | | $ | — | | | $ | 39,261,741 | | | $ | — | | | $ | 21,594,566 | | | $ | (17,667,175 | ) |
Collateralized Loan Obligations | | | — | | | | — | | | | — | | | | — | | | | 14,755,000 | | | | — | | | | — | | | | — | | | | 14,755,000 | | | | — | |
Preferred Stocks | | | | | | | | | | | | | | | | | | | | | | | | | | | | | | | | | | | | | | | | |
Energy | | | 721,179 | | | | — | | | | — | | | | (721,179 | ) | | | — | | | | — | | | | — | | | | — | | | | — | (a) | | | (721,179 | ) |
| | | | | | | | | | | | | | | | | | | | | | | | | | | | | | | | | | | | | | | | |
Total | | $ | 721,179 | | | $ | — | | | $ | — | | | $ | (18,388,354 | ) | | $ | 14,755,000 | | | $ | — | | | $ | 39,261,741 | | | $ | — | | | $ | 36,349,566 | | | $ | (18,388,354 | ) |
| | | | | | | | | | | | | | | | | | | | | | | | | | | | | | | | | | | | | | | | |
| (a) | Includes a security fair valued at zero using level 3 inputs. |
A debt security valued at $39,261,741 was transferred from Level 2 to Level 3 during the period ended December 31, 2020. At December 31, 2019, this security was valued on the basis of evaluated bids furnished to the Fund by an independent pricing service in accordance with the Fund’s valuation policies. At December 31, 2020, this security was valued using broker-dealer bid prices based on inputs unobservable to the Fund as an independent pricing service did not provide a reliable price for the security.
Strategic Alpha Fund
Asset Valuation Inputs
| | | | | | | | | | | | | | | | | | | | | | | | | | | | | | | | | | | | | | | | |
Investments in
Securities | | Balance
as of
December 31,
2019 | | | Accrued
Discounts
(Premiums) | | | Realized
Gain
(Loss) | | | Change in
Unrealized
Appreciation
(Depreciation) | | | Purchases | | | Sales | | | Transfers
into Level 3 | | | Transfers
out of
Level 3 | | | Balance
as of
December 31,
2020 | | | Change in
Unrealized
Appreciation
(Depreciation)
from
Investments
Held at
December 31,
2020 | |
Bonds and Notes | | | | | | | | | | | | | | | | | | | | | | | | | | | | | | | | | | | | | | | | |
Non-Convertible Bonds | | | | | | | | | | | | | | | | | | | | | | | | | | | | | | | | | | | | | | | | |
ABS Home Equity | | $ | 801,522 | | | $ | — | | | $ | — | | | $ | — | | | $ | — | | | $ | — | | | $ | — | | | $ | (801,522 | ) | | $ | — | | | $ | — | |
ABS Other | | | 2,337,230 | (a) | | | — | | | | 71 | | | | (1,733,400 | ) | | | 222,417 | | | | (213,614 | ) | | | 862,539 | | | | — | | | | 1,475,243 | (a) | | | (1,733,400 | ) |
Independent Energy | | | 523,200 | (a) | | | 22,686 | | | | (1,472,185 | ) | | | 926,299 | | | | — | | | | — | | | | — | | | | — | | | | — | | | | — | |
Non-Agency Commercial Mortgage-Backed Securities | | | 2,770,066 | | | | — | | | | — | | | | (2,682,824 | ) | | | — | | | | — | | | | 4,655,269 | | | | — | | | | 4,742,511 | | | | (2,682,824 | ) |
Collateralized Loan Obligations | | | 475,000 | | | | — | | | | 238 | | | | — | | | | — | | | | (475,238 | ) | | | — | | | | — | | | | — | | | | — | |
Loan Participations | | | | | | | | | | | | | | | | | | | | | | | | | | | | | | | | | | | | | | | | |
ABS Other | | | — | | | | 137 | | | | 14,430 | | | | (497,677 | ) | | | — | | | | (3,939,608 | ) | | | 5,003,559 | | | | — | | | | 580,841 | | | | (497,677 | ) |
Common Stocks | | | | | | | | | | | | | | | | | | | | | | | | | | | | | | | | | | | | | | | | |
Oil, Gas & Consumable Fuels | | | — | (a) | | | — | | | | (439,289 | ) | | | 439,289 | | | | — | | | | — | | | | — | | | | — | | | | — | | | | — | |
| 120
Notes to Financial Statements (continued)
December 31, 2020
Strategic Alpha Fund — continued
Asset Valuation Inputs — continued
| | | | | | | | | | | | | | | | | | | | | | | | | | | | | | | | | | | | | | | | |
Investments in
Securities | | Balance
as of
December 31,
2019 | | | Accrued
Discounts
(Premiums) | | | Realized
Gain
(Loss) | | | Change in
Unrealized
Appreciation
(Depreciation) | | | Purchases | | | Sales | | | Transfers
into
Level 3 | | | Transfers
out of
Level 3 | | | Balance
as of
December 31,
2020 | | | Change in
Unrealized
Appreciation
(Depreciation)
from
Investments
Held at
December 31,
2020 | |
Preferred Stocks | | | | | | | | | | | | | | | | | | | | | | | | | | | | | | | | | | | | | | | | |
Energy | | $ | 293,900 | | | $ | — | | | $ | — | | | $ | (293,900 | ) | | $ | — | | | $ | — | | | $ | — | | | $ | — | | | $ | — | (a) | | $ | (293,900 | ) |
Other Investments | | | | | | | | | | | | | | | | | | | | | | | | | | | | | | | | | | | | | | | | |
Aircraft ABS | | | 7,776,000 | | | | — | | | | — | | | | (6,645,600 | ) | | | — | | | | — | | | | — | | | | — | | | | 1,130,400 | | | | (6,645,600 | ) |
Equity Linked Notes | | | 688,113 | | | | — | | | | 36,124 | | | | (30,859 | ) | | | — | | | | (693,378 | ) | | | — | | | | — | | | | — | | | | — | |
| | | | | | | | | | | | | | | | | | | | | | | | | | | | | | | | | | | | | | | | |
Total | | $ | 15,665,031 | | | $ | 22,823 | | | $ | (1,860,611 | ) | | $ | (10,518,672 | ) | | $ | 222,417 | | | $ | (5,321,838 | ) | | $ | 10,521,367 | | | $ | (801,522 | ) | | $ | 7,928,995 | | | $ | (11,853,401 | ) |
| | | | | | | | | | | | | | | | | | | | | | | | | | | | | | | | | | | | | | | | |
| (a) | Includes a security fair valued at zero using level 3 inputs. |
Debt securities valued at $801,522 were transferred from Level 3 to Level 2 during the period ended December 31, 2020. At December 31, 2019, these securities were valued at fair value as determined in good faith by the Fund’s investment adviser as an independent pricing service did not provide a reliable price for the securities. At December 31, 2020, these securities were valued on the basis of evaluated bids furnished to the Fund by an independent pricing service in accordance with the Fund’s valuation policies.
A debt security valued at $862,539 was transferred from Level 2 to Level 3 during the period ended December 31, 2020. At December 31, 2019, this security was valued on the basis of evaluated bids furnished to the Fund by an independent pricing service in accordance with the Fund’s valuation policies. At December 31, 2020, this security was valued using broker-dealer bid prices based on inputs unobservable to the Fund as an independent pricing service did not provide a reliable price for the security.
Debt securities valued at $9,658,828 were transferred from Level 2 to Level 3 during the period ended December 31, 2020. At December 31, 2019, these securities were valued on the basis of evaluated bids furnished to the Fund by an independent pricing service in accordance with the Fund’s valuation policies. At December 31, 2020, these securities were valued at fair value as determined in good faith by the Fund’s adviser as an independent pricing service did not provide a reliable price for the securities.
Strategic Income Fund
Asset Valuation Inputs
| | | | | | | | | | | | | | | | | | | | | | | | | | | | | | | | | | | | | | | | |
Investments in Securities | | Balance as of
September 30,
2020 | | | Accrued
Discounts
(Premiums) | | | Realized
Gain
(Loss) | | | Change in
Unrealized
Appreciation
(Depreciation) | | | Purchases | | | Sales | | | Transfers
into
Level 3 | | | Transfers
out of
Level 3 | | | Balance as of
December 31,
2020 | | | Change in
Unrealized
Appreciation
(Depreciation)
from
Investments
Still Held at
December 31,
2020 | |
Bonds and Notes | | | | | | | | | | | | | | | | | | | | | | | | | | | | | | | | | | | | | | | | |
Non-Convertible Bonds | | | | | | | | | | | | | | | | | | | | | | | | | | | | | | | | | | | | | | | | |
ABS Other | | $ | 14,229,305 | (a) | | $ | — | | | | 152 | | | $ | (29,929 | ) | | $ | 472,905 | | | $ | (454,471 | ) | | $ | — | | | $ | — | | | $ | 14,217,962 | (a) | | $ | (94,355 | ) |
Convertible Bonds | | | | | | | | | | | | | | | | | | | | | | | | | | | | | | | | | | | | | | | | |
Oil Field Services | | | 6,103,774 | | | | 29,190 | | | | — | | | | (31,212 | ) | | | 229,195 | | | | — | | | | — | | | | — | | | | 6,330,947 | | | | (31,212 | ) |
Senior Loans | | | | | | | | | | | | | | | | | | | | | | | | | | | | | | | | | | | | | | | | |
Construction Machinery | | | 11,064,036 | | | | 242,118 | | | | (918,610 | ) | | | 981,118 | | | | — | | | | (1,506,446 | ) | | | — | | | | — | | | | 9,862,216 | | | | 222,456 | |
Common Stocks | | | | | | | | | | | | | | | | | | | | | | | | | | | | | | | | | | | | | | | | |
Oil Field Services | | | — | (a) | | | — | | | | — | | | | — | | | | — | | | | — | | | | — | | | | — | | | | — | (a) | | | — | |
Oil, Gas & Consumable Fuels | | | 100,378 | (a) | | | — | | | | (2,215,133 | ) | | | 2,114,755 | | | | 3,473,775 | | | | — | | | | — | | | | — | | | | 3,473,775 | (a) | | | — | |
Specialty Retail | | | — | (a) | | | — | | | | — | | | | — | | | | — | | | | — | | | | — | | | | — | | | | — | (a) | | | — | |
121 |
Notes to Financial Statements (continued)
December 31, 2020
Strategic Income Fund — continued
Asset Valuation Inputs — continued
| | | | | | | | | | | | | | | | | | | | | | | | | | | | | | | | | | | | | | | | |
Investments in
Securities | | Balance as of
September 30,
2020 | | | Accrued
Discounts
(Premiums) | | | Realized
Gain
(Loss) | | | Change in
Unrealized
Appreciation
(Depreciation) | | | Purchases | | | Sales | | | Transfers
into
Level 3 | | | Transfers
out of
Level 3 | | | Balance as of
December 31,
2020 | | | Change in
Unrealized
Appreciation
(Depreciation)
from
Investments
Still Held at
December 31,
2020 | |
Preferred Stocks | | | | | | | | | | | | | | | | | | | | | | | | | | | | | | | | | | | | | | | | |
Convertible Preferred Stocks | | | | | | | | | | | | | | | | | | | | | | | | | | | | | | | | | | | | | | | | |
Energy | | $ | — | (a) | | $ | — | | | $ | — | | | $ | — | | | $ | — | | | $ | — | | | $ | — | | | $ | — | | | $ | — | (a) | | $ | — | |
Warrants | | | — | | | | — | | | | — | | | | 3,838,684 | | | | — | | | | — | | | | 5,921,575 | | | | — | | | | 9,760,259 | | | | 3,838,684 | |
| | | | | | | | | | | | | | | | | | | | | | | | | | | | | | | | | | | | | | | | |
Total | | $ | 31,497,493 | | | $ | 271,308 | | | $ | (3,133,591 | ) | | $ | 6,873,416 | | | $ | 4,175,875 | | | $ | (1,960,917 | ) | | $ | 5,921,575 | | | $ | — | | | $ | 43,645,159 | | | $ | 3,935,573 | |
| | | | | | | | | | | | | | | | | | | | | | | | | | | | | | | | | | | | | | | | |
| (a) | Includes a security fair valued at zero using Level 3 inputs. |
A warrant valued at $5,921,575 was transferred from Level 2 to Level 3 during the period ended December 31, 2020. At December 31, 2019, this security was valued on the basis of closing bid quotations furnished to the Fund by an independent pricing service in accordance with the Fund’s valuation policies. At December 31, 2020, this security was valued at fair value as determined in good faith by the Fund’s adviser as an independent pricing service did not provide a reliable price for the security.
4. Derivatives. Derivative instruments are defined as financial instruments whose value and performance are based on the value and performance of an underlying asset, reference rate or index. Derivative instruments that Investment Grade Bond Fund and Strategic Alpha Fund used during the period include forward foreign currency contracts, futures contracts, option contracts and swap agreements.
Investment Grade Bond Fund and Strategic Alpha Fund are subject to the risk that companies in which the Fund invests will fail financially or otherwise be unwilling or unable to meet their obligations to the Fund. The Funds may use credit default swaps, as a protection buyer, to hedge its credit exposure to issuers of bonds it holds without having to sell the bonds. The Funds may also use credit default swaps, as a protection seller, to gain investment exposure. During the year ended December 31, 2020, Strategic Alpha Fund engaged in credit default swap agreements (as a protection buyer) to hedge its credit exposure, and Investment Grade Bond Fund and Strategic Alpha Fund engaged in credit default swap agreements (as a protection seller) to gain investment exposure.
Strategic Alpha Fund is subject to the risk that changes in foreign currency exchange rates will have an unfavorable effect on the value of Fund assets denominated in foreign currencies. The Fund may enter into forward foreign currency exchange contracts for hedging purposes to protect the value of the Fund’s holdings of foreign securities. The Fund may also use forward foreign currency contracts to gain exposure to foreign currencies, regardless of whether securities denominated in such currencies are held in the Fund. During the year ended December 31, 2020, the Fund engaged in forward foreign currency contracts for hedging purposes and to gain exposure to foreign currencies.
Strategic Alpha Fund is subject to the risk that changes in interest rates will affect the value of the Fund’s investments in fixed-income securities. The Fund will be subject to increased interest rate risk to the extent that it invests in fixed-income securities with longer maturities or durations, as compared to investing in fixed-income securities with shorter maturities or durations. The Fund may use futures contracts and interest rate swap agreements to hedge against changes in interest rates and to manage duration without having to buy or sell portfolio securities. The Fund may also use futures contracts and interest rate swap agreements to gain investment exposure. During the year ended December 31, 2020, the Fund engaged in futures contracts for hedging and duration management purposes and to gain investment exposure, and interest rate swap agreements for hedging purposes and to gain investment exposure.
Strategic Alpha Fund is subject to the risk of unpredictable declines in the value of individual equity securities and periods of below-average performance in individual securities or in the equity market as a whole. The Fund may use futures contracts, purchased put options and written call options to hedge against a decline in value of an equity security that it owns. The Fund may also write put options to offset the cost of options used for hedging purposes and use futures and option contracts to gain investment exposure. During the year ended December 31, 2020, the Fund engaged in futures contracts for hedging purposes and option contracts for hedging purposes and to gain investment exposure.
| 122
Notes to Financial Statements (continued)
December 31, 2020
Transactions in derivative instruments for Investment Grade Bond Fund during the year ended December 31, 2020, as reflected within the Statements of Operations, were as follows:
| | | | |
Net Realized Gain (Loss) on: | | Swap agreements | |
Credit contracts | | $ | 8,539,507 | |
The following is a summary of derivative instruments for Strategic Alpha Fund as of December 31, 2020, as reflected within the Statements of Assets and Liabilities:
| | | | | | | | | | | | |
Assets | | Unrealized
appreciation
on forward
foreign
currency
contracts | | | Swap
agreements
at value1 | | | Total | |
Over-the-counter asset derivatives | |
Foreign exchange contracts | | $ | 197,122 | | | $ | — | | | $ | 197,122 | |
| | | | | | | | | | | | |
Exchange-traded/cleared asset derivatives | |
Credit contracts | | $ | — | | | $ | 8,223,433 | | | $ | 8,223,433 | |
| | | | | | | | | | | | |
Total asset derivatives | | $ | 197,122 | | | $ | 8,223,433 | | | $ | 8,420,555 | |
| | | | | | | | | | | | |
| | | | | | | | | | | | | | | | | | | | |
Liabilities | | Options
written
at value | | | Unrealized
depreciation
on forward
foreign
currency
contracts | | | Unrealized
depreciation
on futures
contracts2 | | | Swap
agreements
at value1 | | | Total | |
Over-the-counter liability derivatives | |
Foreign exchange contracts | | $ | — | | | $ | (3,258,689 | ) | | $ | — | | | $ | — | | | $ | (3,258,689 | ) |
Credit contracts | | | — | | | | — | | | | — | | | | (205,829 | ) | | | (205,829 | ) |
| | | | | | | | | | | | | | | | | | | | |
Total over-the counter liability derivatives | | $ | — | | | $ | (3,258,689 | ) | | $ | — | | | $ | (205,829 | ) | | $ | (3,464,518 | ) |
| | | | | | | | | | | | | | | | | | | | |
Exchange-traded/cleared liability derivatives | | | | | |
Interest rate contracts | | $ | — | | | $ | — | | | $ | (22,434 | ) | | $ | (2,049,100 | ) | | $ | (2,071,534 | ) |
Equity contracts | | | (159,801 | ) | | | — | | | | — | | | | — | | | | (159,801 | ) |
| | | | | | | | | | | | | | | | | | | | |
Total exchange-traded/cleared liability derivatives | | $ | (159,801 | ) | | $ | — | | | $ | (22,434 | ) | | $ | (2,049,100 | ) | | $ | (2,231,335 | ) |
| | | | | | | | | | | | | | | | | | | | |
Total liability derivatives | | $ | (159,801 | ) | | $ | (3,258,689 | ) | | $ | (22,434 | ) | | $ | (2,254,929 | ) | | $ | (5,695,853 | ) |
| | | | | | | | | | | | | | | | | | | | |
| 1 | Represents swap agreements, at value. Market value of swap agreements is reported in the Portfolio of Investments along with the unamortized upfront premium paid (received), if any, and unrealized appreciation (depreciation) on each individual contract. Unrealized appreciation (depreciation) and upfront premiums paid (received) for bilateral swap agreements are reported within the Statements of Assets and Liabilities. Only the current day’s variation margin on centrally cleared swap agreements is reported within the Statements of Assets and Liabilities as receivable or payable for variation margin, as applicable. |
| 2 | Represents cumulative unrealized appreciation (depreciation) on futures contracts. Only the current day’s variation margin on futures contracts is reported within the Statements of Assets and Liabilities as receivable or payable for variation margin, as applicable. |
123 |
Notes to Financial Statements (continued)
December 31, 2020
Transactions in derivative instruments for Strategic Alpha Fund during the year ended December 31, 2020, as reflected within the Statements of Operations were as follows:
| | | | | | | | | | | | | | | | | | | | |
Net Realized Gain (Loss) on: | | Investments3 | | | Futures
contracts | | | Options
written | | | Swap
agreements | | | Forward
foreign
currency
contracts | |
Interest rate contracts | | $ | — | | | $ | 5,475,650 | | | $ | — | | | $ | (317,110 | ) | | $ | — | |
Foreign exchange contracts | | | — | | | | — | | | | — | | | | — | | | | (1,382,516 | ) |
Credit contracts | | | — | | | | — | | | | — | | | | 8,601,751 | | | | — | |
Equity contracts | | | (94,053 | ) | | | 1,641,905 | | | | (50,234 | ) | | | — | | | | — | |
| | | | | | | | | | | | | | | | | | | | |
Total | | $ | (94,053 | ) | | $ | 7,117,555 | | | $ | (50,234 | ) | | $ | 8,284,641 | | | $ | (1,382,516 | ) |
| | | | | | | | | | | | | | | | | | | | |
| | | | | |
Net Change in Unrealized
Appreciation (Depreciation) on: | | Investments3 | | | Futures
contracts | | | Options
written | | | Swap
agreements | | | Forward
foreign
currency
contracts | |
Interest rate contracts | | $ | — | | | $ | (19,222 | ) | | $ | — | | | $ | (136,676 | ) | | $ | — | |
Foreign exchange contracts | | | — | | | | — | | | | — | | | | — | | | | (1,956,477 | ) |
Credit contracts | | | — | | | | — | | | | — | | | | 2,559,268 | | | | — | |
Equity contracts | | | 21,464 | | | | — | | | | 1,016 | | | | — | | | | — | |
| | | | | | | | | | | | | | | | | | | | |
Total | | $ | 21,464 | | | $ | (19,222 | ) | | $ | 1,016 | | | $ | 2,422,592 | | | $ | (1,956,477 | ) |
| | | | | | | | | | | | | | | | | | | | |
| 3 | Represents realized loss and change in unrealized appreciation (depreciation), respectively, for purchased options during the period. |
As the Funds value their derivatives at fair value and recognize changes in fair value through the Statements of Operations, they do not qualify for hedge accounting under authoritative guidance for derivative instruments. The Funds’ investments in derivatives may represent an economic hedge; however, they are considered to be non-hedge transactions for the purpose of these disclosures.
The volume of forward foreign currency contract, futures contract and swap agreement activity, as a percentage of net assets for Investment Grade Bond Fund and Strategic Alpha Fund, based on gross month-end or daily (as applicable) notional amounts outstanding during the period, including long and short positions at absolute value, was as follows for the year ended December 31, 2020:
| | | | |
Investment Grade Bond Fund | | Credit
Default
Swaps | |
Average Notional Amount Outstanding | | | 1.70 | % |
Highest Notional Amount Outstanding | | | 4.77 | % |
Lowest Notional Amount Outstanding | | | 0.00 | % |
Notional Amount Outstanding as of December 31, 2020 | | | 0.00 | % |
| | | | | | | | | | | | | | | | |
Strategic Alpha Fund | | Forwards | | | Futures | | | Credit Default Swaps | | | Interest Rate Swaps | |
Average Notional Amount Outstanding | | | 9.97 | % | | | 2.80 | % | | | 9.58 | % | | | 1.04 | % |
Highest Notional Amount Outstanding | | | 25.04 | % | | | 3.68 | % | | | 13.60 | % | | | 1.76 | % |
Lowest Notional Amount Outstanding | | | 3.57 | % | | | 1.45 | % | | | 6.52 | % | | | 0.00 | % |
Notional Amount Outstanding as of December 31, 2020 | | | 4.29 | % | | | 2.96 | % | | | 8.24 | % | | | 1.71 | % |
Unrealized gain and/or loss on open forwards, futures and swaps is recorded in the Statements of Assets and Liabilities. The aggregate notional values of forward, futures and swap contracts are not recorded in the Statements of Assets and Liabilities, and therefore are not included in the net assets.
| 124
Notes to Financial Statements (continued)
December 31, 2020
The volume of option contract activity, as a percentage of net assets for Strategic Alpha Fund, based on the month-end market values of instruments underlying purchased and written options, at absolute value, was as follows for the year ended December 31, 2020:
| | | | | | | | |
Strategic Alpha Fund | | Put Options Purchased* | | | Call Options Written* | |
Average Market Value of Underlying Instruments | | | 0.65 | % | | | 0.43 | % |
Highest Market Value of Underlying Instruments | | | 4.18 | % | | | 0.73 | % |
Lowest Market Value of Underlying Instruments | | | 0.00 | % | | | 0.23 | % |
Market Value of Underlying Instruments as of December 31, 2020 | | | 0.00 | % | | | 0.73 | % |
| * | Market value of underlying instruments is determined by multiplying option shares by the price of the option’s underlying security. |
Amounts outstanding at the end of the prior period, if applicable, are included in the average amount outstanding.
Over-the-counter derivatives, including forward foreign currency contracts and swap agreements, are entered into pursuant to International Swaps and Derivatives Association, Inc. (“ISDA”) agreements negotiated between the Funds and their counterparties. ISDA agreements typically contain, among other things, terms for the posting of collateral and master netting provisions in the event of a default or other termination event. Collateral is posted by a Fund or the counterparty to the extent of the net mark-to-market exposure to the other party of all open contracts under the agreement, subject to minimum transfer requirements. Master netting provisions allow the Funds and the counterparty, in the event of a default or other termination event, to offset amounts owed by each related to derivative contracts, including any posted collateral, to one net amount payable by either the Funds or the counterparty. The Funds’ ISDA agreements typically contain provisions that allow a counterparty to terminate open contracts early if the NAV of a Fund declines beyond a certain threshold. For financial reporting purposes, the Funds do not offset derivative assets and liabilities, and any related collateral received or pledged, on the Statements of Assets and Liabilities.
As of December 31, 2020, gross amounts of over-the-counter derivative assets and liabilities not offset in the Statements of Assets and Liabilities and the related net amounts after taking into account master netting arrangements, by counterparty, are as follows:
| | | | | | | | | | | | | | | | | | | | |
Strategic Alpha Fund | |
Counterparty | | Gross Amounts
of Assets | | | Offset
Amount | | | Net
Asset
Balance | | | Collateral
(Received)/
Pledged | | | Net
Amount | |
Morgan Stanley Capital Services, Inc. | | $ | 157,021 | | | $ | (157,021 | ) | | $ | — | | | $ | — | | | $ | — | |
Standard Chartered Bank | | | 40,101 | | | | (40,101 | ) | | | — | | | | — | | | | — | |
| | | | | | | | | | | | | | | | | | | | |
| | $ | 197,122 | | | $ | (197,122 | ) | | $ | — | | | $ | — | | | $ | — | |
| | | | | | | | | | | | | | | | | | | | |
| | | | | |
Counterparty | | Gross Amounts
of Liabilities | | | Offset
Amount | | | Net
Liability
Balance | | | Collateral
(Received)/
Pledged | | | Net
Amount | |
Bank of America, N.A. | | $ | (119,874 | ) | | $ | — | | | $ | (119,874 | ) | | $ | — | | | $ | (119,874 | ) |
Barclays Bank PLC | | | (267,504 | ) | | | — | | | | (267,504 | ) | | | 267,504 | | | | — | |
Deutsche Bank AG | | | (97,505 | ) | | | — | | | | (97,505 | ) | | | — | | | | (97,505 | ) |
HSBC Bank USA | | | (26,150 | ) | | | — | | | | (26,150 | ) | | | — | | | | (26,150 | ) |
Morgan Stanley Capital Services, Inc. | | | (2,654,246 | ) | | | 157,021 | | | | (2,497,225 | ) | | | 2,497,225 | | | | — | |
Standard Chartered Bank | | | (299,239 | ) | | | 40,101 | | | | (259,138 | ) | | | — | | | | (259,138 | ) |
| | | | | | | | | | | | | | | | | | | | |
| | $ | (3,464,518 | ) | | $ | 197,122 | | | $ | (3,267,396 | ) | | $ | 2,764,729 | | | $ | (502,667 | ) |
| | | | | | | | | | | | | | | | | | | | |
The actual collateral received or pledged, if any, may exceed the amounts shown in the table due to overcollateralization. Timing differences may exist between when contracts under the ISDA agreements are marked-to-market and when collateral moves. The ISDA agreements include tri-party control agreements under which collateral is held for the benefit of the secured party at a third party custodian, State Street Bank.
Counterparty risk is managed based on policies and procedures established by each Fund’s adviser. Such policies and procedures may include, but are not limited to, minimum counterparty credit rating requirements, monitoring of counterparty credit default swap
125 |
Notes to Financial Statements (continued)
December 31, 2020
spreads and posting of collateral. A Fund’s risk of loss from counterparty credit risk on over-the-counter derivatives is generally limited to the Fund’s aggregated unrealized gains and the amount of any collateral pledged to the counterparty, which may be offset by any collateral posted to the Fund by the counterparty. ISDA master agreements can help to manage counterparty risk by specifying collateral posting arrangements at pre-arranged exposure levels. Under these ISDA agreements, collateral is routinely transferred if the total net exposure in respect of certain transactions, net of existing collateral already in place, exceeds a specified amount (typically $250,000, depending on the counterparty). With exchange-traded derivatives, there is minimal counterparty credit risk to the Fund because the exchange’s clearing house, as counterparty to these instruments, stands between the buyer and the seller of the contract. Credit risk still exists in exchange-traded derivatives with respect to initial and variation margin that is held in a broker’s customer accounts. While brokers are required to segregate customer margin from their own assets, in the event that a broker becomes insolvent or goes into bankruptcy and at that time there is a shortfall in the aggregate amount of margin held by the broker for all its clients, U.S. bankruptcy laws will typically allocate that shortfall on a pro rata basis across all of the broker’s customers, potentially resulting in losses to the Fund. Based on balances reflected on each Fund’s Statement of Assets and Liabilities, the following table shows (i) the maximum amount of loss due to credit risk that, based on the gross fair value of the financial instrument, the Fund would incur if parties (including OTC derivative counterparties and brokers holding margin for exchange-traded derivatives) to the relevant financial instruments failed completely to perform according to the terms of the contracts and the collateral or other security, if any, for the amount due proved to be of no value to the Fund, and (ii) the amount of loss that the Fund would incur after taking into account master netting provisions pursuant to ISDA agreements, as of December 31, 2020:
| | | | | | | | |
Fund | | Maximum Amount of Loss - Gross | | | Maximum Amount of Loss - Net | |
Strategic Alpha Fund | | $ | 26,463,379 | | | $ | 23,501,528 | |
5. Purchases and Sales of Securities. For the year ended (period ended for International Growth Fund and Strategic Income Fund) December 31, 2020, purchases and sales of securities (excluding short-term investments and option/swaption contracts and including paydowns) were as follows:
| | | | | | | | | | | | | | | | |
| | | U.S. Government/Agency
Securities | | | Other Securities | |
Fund | | Purchases | | | Sales | | | Purchases | | | Sales | |
High Income Fund | | $ | — | | | $ | 719,832 | | | $ | 105,225,652 | | | $ | 144,317,795 | |
Intermediate Municipal Bond Fund | | | — | | | | — | | | | 26,855,591 | | | | 9,378,291 | |
International Growth Fund | | | — | | | | — | | | | 14,904,858 | | | | 78,069 | |
Investment Grade Bond Fund | | | 1,006,992,460 | | | | 1,417,835,771 | | | | 2,798,186,728 | | | | 2,389,546,038 | |
Strategic Alpha Fund | | | 4,144,853,650 | | | | 4,146,862,569 | | | | 923,314,599 | | | | 1,100,948,094 | |
Strategic Income Fund | | | 507,154,634 | | | | 991,690,968 | | | | 1,033,946,501 | | | | 1,798,142,188 | |
6. Management Fees and Other Transactions with Affiliates.
a. Management Fees. Loomis, Sayles & Company, L.P. (“Loomis Sayles”) serves as investment adviser to High Income Fund, International Growth Fund, Investment Grade Bond Fund, Strategic Alpha Fund and Strategic Income Fund. Loomis Sayles is a limited partnership whose sole general partner, Loomis, Sayles & Company, Inc., is indirectly owned by Natixis, which is part of Natixis Investment Managers, an international asset management group based in Paris, France.
Under the terms of the management agreements, each Fund pays a management fee at the following annual rates, calculated daily and payable monthly, based on each Fund’s average daily net assets:
| | | | | | | | | | | | | | | | | | | | | | | | |
| | | Percentage of Average Daily Net Assets | |
Fund | | First $200 million | | | Next $1.05 billion | | | Next $750 million | | | Next
$13 billion | | | Next
$10 billion | | | Over
$25 billion | |
High Income Fund | | | 0.60 | % | | | 0.60 | % | | | 0.60 | % | | | 0.60 | % | | | 0.60 | % | | | 0.60 | % |
International Growth Fund | | | 0.75 | % | | | 0.75 | % | | | 0.75 | % | | | 0.75 | % | | | 0.75 | % | | | 0.75 | % |
Investment Grade Bond Fund | | | 0.40 | % | | | 0.40 | % | | | 0.40 | % | | | 0.40 | % | | | 0.38 | % | | | 0.38 | % |
Strategic Alpha Fund | | | 0.60 | % | | | 0.60 | % | | | 0.55 | % | | | 0.55 | % | | | 0.55 | % | | | 0.55 | % |
Strategic Income Fund | | | 0.65 | % | | | 0.60 | % | | | 0.60 | % | | | 0.55 | % | | | 0.54 | % | | | 0.53 | % |
Natixis Advisors, L.P. (“Natixis Advisors”) serves as investment adviser to Intermediate Municipal Bond Fund. Natixis Advisors is a wholly-owned subsidiary of Natixis.
| 126
Notes to Financial Statements (continued)
December 31, 2020
Under the terms of the management agreement, Intermediate Municipal Bond Fund pays a management fee at the annual rate of 0.40% of the Fund’s average daily net assets, calculated daily and payable monthly.
Natixis Advisors has entered into a subadvisory agreement for the Fund with Loomis Sayles. Under the terms of the subadvisory agreement, the Fund has agreed to pay Loomis Sayles a subadvisory fee at the annual rate of 0.20% of the Fund’s average daily net assets, calculated daily and payable monthly.
Payments to Natixis Advisors are reduced by the amounts of payments to Loomis Sayles, as calculated based on the above.
Natixis Advisors and Loomis Sayles have given binding undertakings to the Funds to waive management fees and/or reimburse certain expenses to limit the Funds’ operating expenses, exclusive of acquired fund fees and expenses, brokerage expenses, interest expense, taxes, organizational and extraordinary expenses such as litigation and indemnification expenses. These undertakings are in effect until April 30, 2021 for High Income Fund, Intermediate Municipal Bond Fund and Strategic Alpha Fund, until April 30, 2022 for International Growth Fund and Investment Grade Bond Fund and until January 31, 2022 for Strategic Income Fund, may be terminated before then only with the consent of the Funds’ Board of Trustees, and are reevaluated on an annual basis. Management fees payable, as reflected on the Statements of Assets and Liabilities, is net of waivers and/or expense reimbursements, if any, pursuant to these undertakings. Waivers/reimbursements that exceed management fees payable are reflected on the Statements of Assets and Liabilities as receivable from investment adviser.
For the year ended (period ended for International Growth Fund and Strategic Income Fund) December 31, 2020, the expense limits as a percentage of average daily net assets under the expense limitation agreement were as follows:
| | | | | | | | | | | | | | | | | | | | |
| | | Expense Limit as a Percentage of
Average Daily Net Assets | |
Fund | | Class A | | | Class C | | | Class N | | | Class Y | | | Admin Class | |
High Income Fund | | | 1.00 | % | | | 1.75 | % | | | 0.70 | % | | | 0.75 | % | | | — | |
Intermediate Municipal Bond Fund | | | 0.70 | % | | | 1.45 | % | | | — | | | | 0.45 | % | | | — | |
International Growth Fund | | | 1.20 | % | | | 1.95 | % | | | 0.90 | % | | | 0.95 | % | | | — | |
Investment Grade Bond Fund | | | 0.75 | % | | | 1.50 | % | | | 0.45 | % | | | 0.50 | % | | | 1.00 | % |
Strategic Alpha Fund | | | 1.00 | % | | | 1.75 | % | | | 0.70 | % | | | 0.75 | % | | | — | |
Strategic Income Fund | | | 1.00 | % | | | 1.75 | % | | | 0.70 | % | | | 0.75 | % | | | 1.25 | % |
Prior to July 1, 2020, the expense limits as a percentage of average daily net assets under the expense limitation agreements for Investment Grade Bond Fund and Strategic Income Fund were as follows:
| | | | | | | | | | | | | | | | | | | | |
| | | Expense Limit as a Percentage of
Average Daily Net Assets | |
Fund | | Class A | | | Class C | | | Class N | | | Class Y | | | Admin Class | |
Investment Grade Bond Fund | | | 0.76 | % | | | 1.51 | % | | | 0.46 | % | | | 0.51 | % | | | 1.01 | % |
Strategic Income Fund | | | 1.25 | % | | | 2.00 | % | | | 0.95 | % | | | 1.00 | % | | | 1.50 | % |
Natixis Advisors and Loomis Sayles shall be permitted to recover expenses borne under the expense limitation agreements (whether through waiver of management fees or otherwise) on a class by class basis in later periods to the extent the annual operating expenses of a class fall below a class’ expense limits, provided, however, that a class is not obligated to pay such waived/reimbursed fees or expenses more than one year after the end of the fiscal year in which the fees or expenses were waived/reimbursed.
For the year ended (period ended for International Growth Fund and Strategic Income Fund) December 31, 2020, the management fees and waivers of management fees for each Fund were as follows:
| | | | | | | | | | | | | | | | | | | | |
| | | Gross
Management Fees | | | Contractual
Waivers of
Management Fees1 | | | Net
Management Fees | | | Percentage
of Average
Daily Net Assets | |
Fund | | Gross | | | Net | |
High Income Fund | | $ | 669,082 | | | $ | 243,461 | | | $ | 425,621 | | | | 0.60 | % | | | 0.38 | % |
Intermediate Municipal Bond Fund | | | 92,759 | | | | 92,759 | | | | — | | | | 0.40 | % | | | — | % |
International Growth Fund | | | 4,945 | | | | 4,945 | | | | — | | | | 0.75 | % | | | — | % |
Investment Grade Bond Fund | | | 22,550,836 | | | | 2,021,089 | | | | 20,529,747 | | | | 0.40 | % | | | 0.36 | % |
Strategic Alpha Fund | | | 7,083,082 | | | | — | | | | 7,083,082 | | | | 0.60 | % | | | 0.60 | % |
Strategic Income Fund | | | 8,602,302 | | | | — | | | | 8,602,302 | | | | 0.57 | % | | | 0.57 | % |
| 1 | Management fee waivers are subject to possible recovery until December 31, 2021. |
127 |
Notes to Financial Statements (continued)
December 31, 2020
For the year ended December 31, 2020, expenses have been reimbursed as follows:
| | | | |
Fund | | Reimbursement | |
Intermediate Municipal Bond Fund | | $ | 73,948 | |
International Growth Fund | | | 29,987 | |
No expenses were recovered for any of the Funds during the year ended (period ended for Strategic Income Fund) December 31, 2020 under the terms of the expense limitation agreements.
b. Service and Distribution Fees. Natixis Distribution, L.P. (“Natixis Distribution), which is a wholly-owned subsidiary of Natixis, has entered into a distribution agreement with the Trusts. Pursuant to this agreement, Natixis Distribution serves as principal underwriter of the Funds of the Trusts.
Pursuant to Rule 12b-1 under the 1940 Act, the Trusts have adopted a Service Plan relating to each Fund’s Class A shares (the “Class A Plans”), a Distribution and Service Plan relating to each Fund’s Class C shares (the “Class C Plans”), and Investment Grade Bond Fund and Strategic Income Fund have adopted a Distribution Plan relating to their Admin Class shares (the “Admin Class Plans”).
Under the Class A Plans, each Fund pays Natixis Distribution a monthly service fee at an annual rate not to exceed 0.25% of the average daily net assets attributable to the Fund’s Class A shares, as reimbursement for expenses incurred by Natixis Distribution in providing personal services to investors in Class A shares and/or the maintenance of shareholder accounts.
Under the Class C Plans, each Fund pays Natixis Distribution a monthly service fee at an annual rate not to exceed 0.25% of the average daily net assets attributable to the Fund’s Class C shares, as compensation for services provided by Natixis Distribution in providing personal services to investors in Class C shares and/or the maintenance of shareholder accounts.
Also under the Class C Plans, each Fund pays Natixis Distribution a monthly distribution fee at an annual rate of 0.75% of the average daily net assets attributable to the Fund’s Class C shares, as compensation for services provided by Natixis Distribution in connection with the marketing or sale of Class C shares.
Under the Admin Class Plans, Investment Grade Bond Fund and Strategic Income Fund pay Natixis Distribution a monthly distribution fee at an annual rate not to exceed 0.25% of the average daily net assets attributable to the Funds’ Admin Class shares, as compensation for services provided by Natixis Distribution in connection with the marketing or sale of Admin Class shares or for payments made by Natixis Distribution to securities dealers or other financial intermediaries as commissions, asset-based sales charges or other compensation with respect to the sale of Admin Class shares, or for providing personal services to investors and/or the maintenance of shareholder accounts.
In addition, the Admin Class shares of Investment Grade Bond Fund and Strategic Income Fund may pay Natixis Distribution an administrative service fee, at an annual rate not to exceed 0.25% of the average daily net assets attributable to Admin Class shares. These fees are subsequently paid to securities dealers or financial intermediaries for providing personal services and/or account maintenance for their customers who hold such shares.
For the year ended (period ended for International Growth Fund and Strategic Income Fund) December 31, 2020, the service and distribution fees for each Fund were as follows:
| | | | | | | | | | | | | | | | | | | | |
| | | Service Fees | | | Distribution Fees | |
Fund | | Class A | | | Class C | | | Admin Class | | | Class C | | | Admin Class | |
High Income Fund | | $ | 54,502 | | | $ | 7,095 | | | $ | — | | | $ | 21,284 | | | $ | — | |
Intermediate Municipal Bond Fund | | | 21,311 | | | | 3,150 | | | | — | | | | 9,451 | | | | — | |
International Growth Fund | | | — | 1 | | | — | 1 | | | — | | | | 1 | | | | — | |
Investment Grade Bond Fund | | | 2,037,993 | | | | 411,503 | | | | 283,813 | | | | 1,234,508 | | | | 283,813 | |
Strategic Alpha Fund | | | 89,110 | | | | 31,116 | | | | — | | | | 93,347 | | | | — | |
Strategic Income Fund | | | 1,063,191 | | | | 169,163 | | | | 63,990 | | | | 507,489 | | | | 63,990 | |
c. Administrative Fees. Natixis Advisors provides certain administrative services for the Funds and contracts with State Street Bank to serve as sub-administrator. Pursuant to an agreement among Natixis Funds Trusts, Loomis Sayles Funds Trusts, Natixis ETF Trusts and Natixis Advisors, each Fund pays Natixis Advisors monthly its pro rata portion of fees equal to an annual rate of 0.0540% of the first $15 billion of the average daily net assets of the Natixis Funds Trusts, Loomis Sayles Funds Trusts and Natixis ETF Trusts, 0.0500% of the next $15 billion, 0.0400% of the next $30 billion, 0.0275% of the next $30 billion and 0.0225% of such assets in excess of $90 billion, subject to an annual aggregate minimum fee for the Natixis Funds Trusts, Loomis Sayles Funds Trusts and Natixis ETF Trusts of $10 million, which is reevaluated on an annual basis.
| 128
Notes to Financial Statements (continued)
December 31, 2020
For the year ended (period ended for International Growth Fund and Strategic Income Fund) December 31, 2020, the administrative fees for each Fund were as follows:
| | | | |
Fund | | Administrative
Fees | |
High Income Fund | | $ | 49,521 | |
Intermediate Municipal Bond Fund | | | 10,156 | |
International Growth Fund | | | 284 | |
Investment Grade Bond Fund | | | 2,463,304 | |
Strategic Alpha Fund | | | 521,998 | |
Strategic Income Fund | | | 656,953 | |
d. Sub-Transfer Agent Fees. Natixis Distribution has entered into agreements, which include servicing agreements, with financial intermediaries that provide recordkeeping, processing, shareholder communications and other services to customers of the intermediaries that hold positions in the Funds and has agreed to compensate the intermediaries for providing those services. Intermediaries transact with the Funds primarily through the use of omnibus accounts on behalf of their customers who hold positions in the Funds. These services would have been provided by the Funds’ transfer agent and other service providers if the shareholders’ accounts were maintained directly at the Funds’ transfer agent. Accordingly, the Funds have agreed to reimburse Natixis Distribution for all or a portion of the servicing fees paid to these intermediaries. The reimbursement amounts (sub-transfer agent fees) paid to Natixis Distribution are subject to a current per-account equivalent fee limit approved by the Funds’ Board of Trustees, which is based on fees for similar services paid to the Funds’ transfer agent and other service providers. Class N shares do not bear such expenses.
For the year ended (period ended for Strategic Income Fund) December 31, 2020, the sub-transfer agent fees (which are reflected in transfer agent fees and expenses in the Statements of Operations) for each Fund were as follows:
| | | | |
Fund | | Sub-Transfer
Agent Fees | |
High Income Fund | | $ | 79,873 | |
Intermediate Municipal Bond Fund | | | 5,105 | |
Investment Grade Bond Fund | | | 3,297,339 | |
Strategic Alpha Fund | | | 394,176 | |
Strategic Income Fund | | | 1,100,338 | |
As of December 31, 2020, the Funds owe Natixis Distribution the following reimbursements for sub-transfer agent fees (which are reflected in the Statements of Assets and Liabilities as payable to distributor):
| | | | |
Fund | | Reimbursements
of Sub-Transfer
Agent Fees | |
High Income Fund | | $ | 645 | |
Intermediate Municipal Bond Fund | | | 95 | |
Investment Grade Bond Fund | | | 40,327 | |
Strategic Alpha Fund | | | 4,862 | |
Strategic Income Fund | | | 54,289 | |
Sub-transfer agent fees attributable to Class A, Class C, Class Y, and Admin Class are allocated on a pro rata basis to each class based on the relative net assets of each class to the total net assets of those classes.
e. Commissions. Commissions (including CDSCs) on Fund shares retained by Natixis Distribution during the year ended (period ended for International Growth Fund and Strategic Income Fund) December 31, 2020 were as follows:
| | | | |
Fund | | Commissions | |
High Income Fund | | $ | 2,357 | |
Intermediate Municipal Bond Fund | | | 1,912 | |
International Growth Fund | | | 1 | |
Investment Grade Bond Fund | | | 119,731 | |
Strategic Alpha Fund | | | 8,936 | |
Strategic Income Fund | | | 6,502 | |
129 |
Notes to Financial Statements (continued)
December 31, 2020
f. Trustees Fees and Expenses. The Trusts do not pay any compensation directly to their officers or Trustees who are directors, officers or employees of Natixis Advisors, Natixis Distribution, Natixis or their affiliates. The Chairperson of the Board of Trustees receives a retainer fee at the annual rate of $369,000. The Chairperson does not receive any meeting attendance fees for Board of Trustees meetings or committee meetings that he attends. Each Independent Trustee (other than the Chairperson) receives, in the aggregate, a retainer fee at the annual rate of $199,000. Each Independent Trustee also receives a meeting attendance fee of $10,000 for each meeting of the Board of Trustees that he or she attends in person and $5,000 for each meeting of the Board of Trustees that he or she attends telephonically. In addition, the chairperson of the Contract Review Committee, the chairperson of the Audit Committee and the chairperson of the Governance Committee each receive an additional retainer fee at the annual rate of $20,000. Each Contract Review Committee member is compensated $6,000 for each Committee meeting that he or she attends in person and $3,000 for each meeting that he or she attends telephonically. Each Audit Committee member is compensated $6,000 for each Committee meeting that he or she attends in person and $3,000 for each meeting that he or she attends telephonically. These fees are allocated among the funds in the Natixis Funds Trusts, Loomis Sayles Funds Trusts and Natixis ETF Trusts based on a formula that takes into account, among other factors, the relative net assets of each fund. Trustees are reimbursed for travel expenses in connection with attendance at meetings.
A deferred compensation plan (the “Plan”) is available to the Trustees on a voluntary basis. Deferred amounts remain in the Funds until distributed in accordance with the provisions of the Plan. The value of a participating Trustee’s deferral account is based on theoretical investments of deferred amounts, on the normal payment dates, in certain funds of the Natixis Funds Trusts, Loomis Sayles Funds Trusts and Natixis ETF Trusts as designated by the participating Trustees. Changes in the value of participants’ deferral accounts are allocated pro rata among the funds in the Natixis Funds Trusts, Loomis Sayles Funds Trusts and Natixis ETF Trusts, and are normally reflected as Trustees’ fees and expenses in the Statements of Operations. The portions of the accrued obligations allocated to the Funds under the Plan are reflected as Deferred Trustees’ fees in the Statements of Assets and Liabilities.
Certain officers and employees of Natixis Advisors and Loomis Sayles are also officers and/or Trustees of the Trusts.
g. Reimbursement of Transfer Agent Fees and Expenses. Natixis Advisors has given a binding contractual undertaking to High Income Fund and International Growth Fund to reimburse any and all transfer agency expenses for the Funds’ Class N shares. This undertaking is in effect through April 30, 2021 for High Income Fund and April 30, 2022 for International Growth Fund, and is not subject to recovery under the expense limitation agreement described above.
For the year ended December 31, 2020, Natixis Advisors reimbursed the Funds for transfer agency expenses as follows:
| | | | |
Fund | | Reimbursement
of Transfer
Agency
Expenses | |
| | | Class N | |
High Income Fund | | $ | 1,039 | |
International Growth Fund | | | 4 | |
h. Affiliated Ownership. As of December 31, 2020, Natixis and affiliates and Loomis Sayles Employees’ Profit Sharing Retirement Plan (“Retirement Plan”) held shares of the following Funds’ net assets.
| | | | | | | | |
Fund | | Natixis and
affiliates | | | Retirement
Plan | |
International Growth Fund | | | 100 | % | | | — | |
Investment Grade Bond Fund | | | — | | | | 0.12 | % |
Strategic Alpha Fund | | | — | | | | 0.22 | % |
Investment activities of affiliated shareholders could have material impacts on the Fund.
| 130
Notes to Financial Statements (continued)
December 31, 2020
i. Affiliated Transactions. As a result of a business restructuring, Strategic Income Fund received common shares of Pioneer Energy Services Corp. (the “Company”) constituting more than 5% of the voting securities of the Company. As such, the Company is considered to be an affiliate at December 31, 2020. Similarly, as a result of a business restructuring, the Fund received common shares of Lonestar Resources U.S., Inc. (the “Company”) constituting more than 5% of the voting securities of the Company. As such, the Company is considered to be an affiliate at December 31, 2020. A summary of affiliated transactions for the period ended December 31, 2020, is as follows:
| | | | | | | | | | | | | | | | | | | | | | | | | | | | | | | | |
| | | Beginning
Value | | | Purchase
Cost | | | Sales
Proceeds | | | Accrued
Discounts
(Premiums) | | | Realized
Gain
(Loss) | | | Change in
Unrealized
Gain
(Loss) | | | Ending
Value | | | Investment
Income | |
Pioneer Energy Services Corp., 5.000% PIK or 5.000% Cash | | $ | 6,103,774 | | | $ | 229,195 | * | | $ | — | | | $ | 29,190 | | | $ | — | | | $ | (31,212 | ) | | $ | 6,330,947 | | | $ | 125,727 | |
Pioneer Energy Services Corp. | | | — | | | | — | | | | — | | | | — | | | | — | | | | — | | | | — | | | | — | |
Lonestar Resources U.S., Inc. | | | — | | | | 3,473,775 | ** | | | — | | | | — | | | | — | | | | — | | | | 3,473,775 | | | | — | |
| | | | | | | | | | | | | | | | | | | | | | | | | | | | | | | | |
| | $ | 6,103,774 | | | $ | 3,702,970 | | | $ | — | | | $ | 29,190 | | | $ | — | | | $ | (31,212 | ) | | $ | 9,804,722 | | | $ | 125,727 | |
| | | | | | | | | | | | | | | | | | | | | | | | | | | | | | | | |
| * | Represents interest paid in additional principal. |
| ** | Represents basis assigned upon receipt in a taxable restructuring. |
j. Payment by Affiliates. For the year ended December 31, 2020, Loomis Sayles reimbursed Strategic Alpha Fund $52,333 in connection with a trading error.
7. Custodian Fees and Expenses. State Street Bank, custodian to the Funds, has agreed to waive the custodian fees and certain other expenses for the first 12 months of operations for International Growth Fund. For the period ended December 31, 2020, total fees waived for the Fund were $1,887.
8. Class-Specific Transfer Agent Fees and Expenses. Transfer agent fees and expenses for High Income Fund, International Growth Fund, Investment Grade Bond Fund, Strategic Alpha Fund and Strategic Income Fund attributable to Class A, Class C, Class Y and Admin Class are allocated on a pro rata basis to each class based on the relative net assets of each class to the total net assets of those classes. Transfer agent fees and expenses attributable to Class N are allocated to Class N.
Intermediate Municipal Bond Fund allocates transfer agent fees and expenses on a pro rata basis based on the relative net assets of each class to the total net assets of those classes.
For the year ended (period ended for International Growth Fund and Strategic Income Fund) December 31, 2020, the Funds incurred the following class-specific transfer agent fees and expenses (including sub-transfer agent fees, where applicable):
| | | | | | | | | | | | | | | | | | | | |
| | | Transfer Agent Fees and Expenses | |
Fund | | Class A | | | Class C | | | Class N | | | Class Y | | | Admin
Class | |
High Income Fund | | $ | 21,489 | | | $ | 2,888 | | | $ | 1,039 | | | $ | 76,888 | | | $ | — | |
International Growth Fund | | | 3 | | | | 3 | | | | 4 | | | | 26 | | | | — | |
Investment Grade Bond Fund | | | 640,456 | | | | 130,191 | | | | 5,345 | | | | 2,616,004 | | | | 89,275 | |
Strategic Alpha Fund | | | 20,283 | | | | 7,122 | | | | 1,740 | | | | 388,610 | | | | — | |
Strategic Income Fund | | | 338,601 | | | | 53,912 | | | | 752 | | | | 749,551 | | | | 20,383 | |
9. Line of Credit. Each Fund except for International Growth Fund, together with certain other funds of Natixis Funds Trusts, Loomis Sayles Funds Trusts and Natixis ETF Trusts, entered into a $400,000,000 committed unsecured line of credit provided by State Street Bank. Any one Fund may borrow up to $350,000,000 under the line of credit agreement (as long as all borrowings by all Funds in the aggregate do not exceed the $400,000,000 limit at any time), subject to each Fund’s investment restrictions and its contractual obligations under the line of credit. Interest is charged to the Funds based upon the terms set forth in the agreement. In addition, a commitment fee of 0.15% per annum, payable at the end of each calendar quarter, is accrued and apportioned among the participating funds based on their average daily unused portion of the line of credit. The Funds paid an arrangement fee, an upfront fee, and certain other legal fees in connection with the line of credit agreement, which are being amortized over a period of 364 days and are reflected in legal fees and/or miscellaneous expenses on the Statements of Operations. The unamortized balance is reflected as prepaid expenses on the Statements of Assets and Liabilities.
For the year ended December 31, 2020, none of the Funds had borrowings under this agreement.
131 |
Notes to Financial Statements (continued)
December 31, 2020
10. Risk. The Funds’ investments in foreign securities, as applicable, may be subject to greater political, economic, environmental, credit/counterparty and information risks. The Funds’ investments in foreign securities also are subject to foreign currency fluctuations and other foreign currency-related risks. Foreign securities may be subject to higher volatility than U.S. securities, varying degrees of regulation and limited liquidity.
International Growth Fund and Strategic Alpha Fund are non-diversified, which means that they are not limited under the 1940 Act to a percentage of assets that they may invest in any one issuer. Because the Funds may invest in the securities of a limited number of issuers, an investment in the Funds may involve a higher degree of risk than would be present in a diversified portfolio.
Global markets have experienced periods of high volatility triggered by the ongoing public health emergency known as coronavirus (“Covid-19”). As the situation continues, the extent and duration of the impact that the Covid-19 outbreak may have on financial markets and the economy as a whole remains highly uncertain. If the effects of the Covid-19 outbreak on financial markets and the economy continue for an extended period of time, the Funds’ future financial and investment results may be adversely affected.
11. Concentration of Ownership. From time to time, a Fund may have a concentration of one or more accounts constituting a significant percentage of shares outstanding. Investment activities by holders of such accounts could have material impacts on the Funds. As of December 31, 2020, based on management’s evaluation of the shareholder account base, the Funds had accounts representing controlling ownership of more than 5% of the Fund’s total outstanding shares. The number of such accounts, based on accounts that represent more than 5% of an individual class of shares, and the aggregate percentage of net assets represented by such holdings were as follows:
| | | | | | | | |
Fund | | Number of 5%
Account Holders | | | Percentage of
Ownership | |
High Income Fund | | | 2 | | | | 24.41 | % |
Intermediate Municipal Bond Fund | | | 3 | | | | 54.02 | % |
Investment Grade Bond Fund | | | 1 | | | | 9.47 | % |
Strategic Alpha Fund | | | 4 | | | | 49.53 | % |
Omnibus shareholder accounts for which Natixis Advisors understands that the intermediary has discretion over the underlying shareholder accounts or investment models where a shareholder account may be invested for a non-discretionary customer are included in the table above. For other omnibus accounts, the Fund does not have information on the individual shareholder accounts underlying the omnibus accounts; therefore, there could be other 5% shareholders in addition to those disclosed in the table above.
12. Capital Shares. Each Fund may issue an unlimited number of shares of beneficial interest, without par value. Transactions in capital shares were as follows:
| | | | | | | | | | | | | | | | |
| |
| Year Ended
December 31, 2020 |
| |
| Year Ended
December 31, 2019 |
|
High Income Fund | | | Shares | | | | Amount | | | | Shares | | | | Amount | |
| Class A | |
Issued from the sale of shares | | | 5,472,929 | | | $ | 23,366,332 | | | | 1,181,562 | | | $ | 4,961,757 | |
Issued in connection with the reinvestment of distributions | | | 265,043 | | | | 1,081,552 | | | | 224,427 | | | | 943,693 | |
Redeemed | | | (1,646,663 | ) | | | (6,698,230 | ) | | | (1,744,701 | ) | | | (7,332,092 | ) |
| | | | | | | | | | | | | | | | |
Net change | | | 4,091,309 | | | $ | 17,749,654 | | | | (338,712 | ) | | $ | (1,426,642 | ) |
| | | | | | | | | | | | | | | | |
| Class C | |
Issued from the sale of shares | | | 204,929 | | | $ | 851,367 | | | | 104,622 | | | $ | 442,064 | |
Issued in connection with the reinvestment of distributions | | | 27,930 | | | | 113,438 | | | | 40,123 | | | | 169,298 | |
Redeemed | | | (460,672 | ) | | | (1,851,801 | ) | | | (582,159 | ) | | | (2,454,372 | ) |
| | | | | | | | | | | | | | | | |
Net change | | | (227,813 | ) | | $ | (886,996 | ) | | | (437,414 | ) | | $ | (1,843,010 | ) |
| | | | | | | | | | | | | | | | |
| Class N | |
Issued from the sale of shares | | | 636,909 | | | $ | 2,492,319 | | | | 347,075 | | | $ | 1,464,639 | |
Issued in connection with the reinvestment of distributions | | | 182,577 | | | | 739,980 | | | | 144,891 | | | | 609,528 | |
Redeemed | | | (240,181 | ) | | | (982,234 | ) | | | (290,834 | ) | | | (1,225,972 | ) |
| | | | | | | | | | | | | | | | |
Net change | | | 579,305 | | | $ | 2,250,065 | | | | 201,132 | | | $ | 848,195 | |
| | | | | | | | | | | | | | | | |
| Class Y | |
Issued from the sale of shares | | | 8,276,302 | | | $ | 32,427,807 | | | | 5,715,875 | | | $ | 23,998,846 | |
Issued in connection with the reinvestment of distributions | | | 953,466 | | | | 3,824,624 | | | | 1,050,566 | | | | 4,412,148 | |
Redeemed | | | (22,428,758 | ) | | | (87,181,268 | ) | | | (5,779,231 | ) | | | (24,250,953 | ) |
| | | | | | | | | | | | | | | | |
Net change | | | (13,198,990 | ) | | $ | (50,928,837 | ) | | | 987,210 | | | $ | 4,160,041 | |
| | | | | | | | | | | | | | | | |
Increase (decrease) from capital share transactions | | | (8,756,189 | ) | | $ | (31,816,114 | ) | | | 412,216 | | | $ | 1,738,584 | |
| | | | | | | | | | | | | | | | |
| 132
Notes to Financial Statements (continued)
December 31, 2020
12. Capital Shares (continued).
| | | | | | | | | | | | | | | | |
| |
| Year Ended
December 31, 2020 |
| |
| Year Ended
December 31, 2019 |
|
Intermediate Municipal Bond Fund | | | Shares | | | | Amount | | | | Shares | | | | Amount | |
| Class A | |
Issued from the sale of shares | | | 269,748 | | | $ | 2,831,550 | | | | 172,592 | | | $ | 1,769,797 | |
Issued in connection with the reinvestment of distributions | | | 11,723 | | | | 121,983 | | | | 12,521 | | | | 128,813 | |
Redeemed | | | (162,733 | ) | | | (1,679,297 | ) | | | (59,824 | ) | | | (609,217 | ) |
| | | | | | | | | | | | | | | | |
Net change | | | 118,738 | | | $ | 1,274,236 | | | | 125,289 | | | $ | 1,289,393 | |
| | | | | | | | | | | | | | | | |
| Class C | |
Issued from the sale of shares | | | 47,897 | | | $ | 494,485 | | | | 43,687 | | | $ | 451,336 | |
Issued in connection with the reinvestment of distributions | | | 777 | | | | 8,083 | | | | 967 | | | | 9,940 | |
Redeemed | | | (85,913 | ) | | | (898,719 | ) | | | (75,820 | ) | | | (777,366 | ) |
| | | | | | | | | | | | | | | | |
Net change | | | (37,239 | ) | | $ | (396,151 | ) | | | (31,166 | ) | | $ | (316,090 | ) |
| | | | | | | | | | | | | | | | |
| Class Y | |
Issued from the sale of shares | | | 2,146,197 | | | $ | 22,275,909 | | | | 118,355 | | | $ | 1,214,783 | |
Issued in connection with the reinvestment of distributions | | | 19,854 | | | | 207,580 | | | | 14,927 | | | | 153,521 | |
Redeemed | | | (556,921 | ) | | | (5,809,326 | ) | | | (620,551 | ) | | | (6,360,407 | ) |
| | | | | | | | | | | | | | | | |
Net change | | | 1,609,130 | | | $ | 16,674,163 | | | | (487,269 | ) | | $ | (4,992,103 | ) |
| | | | | | | | | | | | | | | | |
Increase (decrease) from capital share transactions | | | 1,690,629 | | | $ | 17,552,248 | | | | (393,146 | ) | | $ | (4,018,800 | ) |
| | | | | | | | | | | | | | | | |
| | | | | | | | |
| |
| Period Ended
December 31, 2020(a) |
|
International Growth Fund | | | Shares | | | | Amount | |
| Class A | |
Issued from the sale of shares | | | 100 | | | $ | 1,000 | |
Issued in connection with the reinvestment of distributions | | | – | (b) | | | 1 | |
| | | | | | | | |
Net change | | | 100 | | | $ | 1,001 | |
| | | | | | | | |
| Class C | |
Issued from the sale of shares | | | 100 | | | $ | 1,000 | |
Issued in connection with the reinvestment of distributions | | | – | (b) | | | – | (c) |
| | | | | | | | |
Net change | | | 100 | | | $ | 1,000 | |
| | | | | | | | |
| Class N | |
Issued from the sale of shares | | | 1,500,000 | | | $ | 15,000,000 | |
Issued in connection with the reinvestment of distributions | | | 1,224 | | | | 12,450 | |
| | | | | | | | |
Net change | | | 1,501,224 | | | $ | 15,012,450 | |
| | | | | | | | |
| Class Y | |
Issued from the sale of shares | | | 1,163 | | | $ | 11,750 | |
Issued in connection with the reinvestment of distributions | | | 1 | | | | 9 | |
| | | | | | | | |
Net change | | | 1,164 | | | $ | 11,759 | |
| | | | | | | | |
Increase from capital share transactions | | | 1,502,588 | | | $ | 15,026,210 | |
| | | | | | | | |
| (a) | From commencement of operations on December 15, 2020 through December 31, 2020. |
| (b) | Amount rounds to less than one share. |
| (c) | Amount rounds to less than $1.00. |
133 |
Notes to Financial Statements (continued)
December 31, 2020
12. Capital Shares (continued).
| | | | | | | | | | | | | | | | |
| |
| Year Ended
December 31, 2020 |
| |
| Year Ended
December 31, 2019 |
|
Investment Grade Bond Fund | | | Shares | | | | Amount | | | | Shares | | | | Amount | |
| Class A | |
Issued from the sale of shares | | | 20,934,113 | | | $ | 243,643,227 | | | | 21,746,077 | | | $ | 242,390,732 | |
Issued in connection with the reinvestment of distributions | | | 4,472,710 | | | | 51,487,111 | | | | 1,759,350 | | | | 19,703,186 | |
Redeemed | | | (18,660,738 | ) | | | (215,501,248 | ) | | | (22,252,474 | ) | | | (248,006,281 | ) |
| | | | | | | | | | | | | | | | |
Net change | | | 6,746,085 | | | $ | 79,629,090 | | | | 1,252,953 | | | $ | 14,087,637 | |
| | | | | | | | | | | | | | | | |
| Class C | |
Issued from the sale of shares | | | 1,837,724 | | | $ | 21,073,918 | | | | 1,602,835 | | | $ | 17,702,080 | |
Issued in connection with the reinvestment of distributions | | | 812,986 | | | | 9,217,940 | | | | 469,346 | | | | 5,182,790 | |
Redeemed | | | (9,377,842 | ) | | | (108,032,709 | ) | | | (18,184,031 | ) | | | (200,209,503 | ) |
| | | | | | | | | | | | | | | | |
Net change | | | (6,727,132 | ) | | $ | (77,740,851 | ) | | | (16,111,850 | ) | | $ | (177,324,633 | ) |
| | | | | | | | | | | | | | | | |
| Class N | |
Issued from the sale of shares | | | 35,059,681 | | | $ | 407,348,565 | | | | 30,937,052 | | | $ | 345,100,891 | |
Issued in connection with the reinvestment of distributions | | | 8,107,642 | | | | 93,301,449 | | | | 4,168,997 | | | | 46,698,958 | |
Redeemed | | | (61,802,905 | ) | | | (713,421,603 | ) | | | (27,365,168 | ) | | | (305,705,875 | ) |
| | | | | | | | | | | | | | | | |
Net change | | | (18,635,582 | ) | | $ | (212,771,589 | ) | | | 7,740,881 | | | $ | 86,093,974 | |
| | | | | | | | | | | | | | | | |
| Class Y | |
Issued from the sale of shares | | | 116,069,530 | | | $ | 1,338,576,662 | | | | 75,690,305 | | | $ | 842,848,095 | |
Issued in connection with the reinvestment of distributions | | | 21,359,279 | | | | 246,149,320 | | | | 8,703,543 | | | | 97,536,256 | |
Redeemed | | | (94,728,720 | ) | | | (1,084,178,153 | ) | | | (79,477,156 | ) | | | (888,490,131 | ) |
| | | | | | | | | | | | | | | | |
Net change | | | 42,700,089 | | | $ | 500,547,829 | | | | 4,916,692 | | | $ | 51,894,220 | |
| | | | | | | | | | | | | | | | |
| Admin Class | |
Issued from the sale of shares | | | 2,273,836 | | | $ | 26,516,127 | | | | 1,693,129 | | | $ | 18,816,328 | |
Issued in connection with the reinvestment of distributions | | | 764,671 | | | | 8,774,511 | | | | 297,880 | | | | 3,326,874 | |
Redeemed | | | (2,101,154 | ) | | | (24,136,301 | ) | | | (2,538,140 | ) | | | (28,454,222 | ) |
| | | | | | | | | | | | | | | | |
Net change | | | 937,353 | | | $ | 11,154,337 | | | | (547,131 | ) | | $ | (6,311,020 | ) |
| | | | | | | | | | | | | | | | |
Increase (decrease) from capital share transactions | | | 25,020,813 | | | $ | 300,818,816 | | | | (2,748,455 | ) | | $ | (31,559,822 | ) |
| | | | | | | | | | | | | | | | |
| | | | | | | | | | | | | | | | |
| |
| Year Ended
December 31, 2020 |
| |
| Year Ended
December 31, 2019 |
|
Strategic Alpha Fund | | | Shares | | | | Amount | | | | Shares | | | | Amount | |
| Class A | |
Issued from the sale of shares | | | 1,023,731 | | | $ | 10,060,502 | | | | 4,057,576 | | | $ | 39,431,401 | |
Issued in connection with the reinvestment of distributions | | | 62,078 | | | | 605,195 | | | | 153,689 | | | | 1,492,303 | |
Redeemed | | | (2,666,522 | ) | | | (25,934,557 | ) | | | (2,971,674 | ) | | | (28,966,949 | ) |
| | | | | | | | | | | | | | | | |
Net change | | | (1,580,713 | ) | | $ | (15,268,860 | ) | | | 1,239,591 | | | $ | 11,956,755 | |
| | | | | | | | | | | | | | | | |
| Class C | |
Issued from the sale of shares | | | 126,434 | | | $ | 1,222,512 | | | | 166,733 | | | $ | 1,611,447 | |
Issued in connection with the reinvestment of distributions | | | 10,648 | | | | 103,121 | | | | 26,221 | | | | 253,548 | |
Redeemed | | | (966,909 | ) | | | (9,480,056 | ) | | | (1,308,080 | ) | | | (12,656,029 | ) |
| | | | | | | | | | | | | | | | |
Net change | | | (829,827 | ) | | $ | (8,154,423 | ) | | | (1,115,126 | ) | | $ | (10,791,034 | ) |
| | | | | | | | | | | | | | | | |
| Class N | |
Issued from the sale of shares | | | 29,423,113 | | | $ | 288,816,017 | | | | 3,995,830 | | | $ | 38,781,677 | |
Issued in connection with the reinvestment of distributions | | | 814,373 | | | | 7,933,168 | | | | 905,302 | | | | 8,768,965 | |
Redeemed | | | (10,308,071 | ) | | | (98,238,299 | ) | | | (750,043 | ) | | | (7,281,454 | ) |
| | | | | | | | | | | | | | | | |
Net change | | | 19,929,415 | | | $ | 198,510,886 | | | | 4,151,089 | | | $ | 40,269,188 | |
| | | | | | | | | | | | | | | | |
| Class Y | |
Issued from the sale of shares | | | 25,133,973 | | | $ | 249,260,831 | | | | 33,476,137 | | | $ | 325,247,908 | |
Issued in connection with the reinvestment of distributions | | | 1,488,360 | | | | 14,469,017 | | | | 2,397,834 | | | | 23,222,284 | |
Redeemed | | | (52,322,387 | ) | | | (502,765,399 | ) | | | (62,461,312 | ) | | | (606,867,293 | ) |
| | | | | | | | | | | | | | | | |
Net change | | | (25,700,054 | ) | | $ | (239,035,551 | ) | | | (26,587,341 | ) | | $ | (258,397,101 | ) |
| | | | | | | | | | | | | | | | |
Decrease from capital share transactions | | | (8,181,179 | ) | | $ | (63,947,948 | ) | | | (22,311,787 | ) | | $ | (216,962,192 | ) |
| | | | | | | | | | | | | | | | |
| 134
Notes to Financial Statements (continued)
December 31, 2020
12. Capital Shares (continued).
| | | | | | | | | | | | | | | | |
| |
| Period Ended
December 31, 2020(a) |
| |
| Year Ended
September 30, 2020 |
|
Strategic Income Fund | | | Shares | | | | Amount | | | | Shares | | | | Amount | |
| Class A | |
Issued from the sale of shares | | | 3,166,668 | | | $ | 43,973,781 | | | | 32,299,438 | | | $ | 444,080,248 | |
Issued in connection with the reinvestment of distributions | | | 1,651,138 | | | | 22,982,383 | | | | 3,167,184 | | | | 43,610,276 | |
Redeemed | | | (8,809,951 | ) | | | (122,112,304 | ) | | | (40,330,246 | ) | | | (554,003,991 | ) |
| | | | | | | | | | | | | | | | |
Net change | | | (3,992,145 | ) | | $ | (55,156,140 | ) | | | (4,863,624 | ) | | $ | (66,313,467 | ) |
| | | | | | | | | | | | | | | | |
| Class C | |
Issued from the sale of shares | | | 264,507 | | | $ | 3,697,602 | | | | 1,902,282 | | | $ | 26,312,714 | |
Issued in connection with the reinvestment of distributions | | | 294,227 | | | | 4,142,720 | | | | 600,408 | | | | 8,382,443 | |
Redeemed | | | (2,483,699 | ) | | | (34,767,841 | ) | | | (29,280,757 | ) | | | (408,234,280 | ) |
| | | | | | | | | | | | | | | | |
Net change | | | (1,924,965 | ) | | $ | (26,927,519 | ) | | | (26,778,067 | ) | | $ | (373,539,123 | ) |
| | | | | | | | | | | | | | | | |
| Class N | |
Issued from the sale of shares | | | 3,263,554 | | | $ | 45,457,643 | | | | 8,682,262 | | | $ | 119,974,137 | |
Issued in connection with the reinvestment of distributions | | | 271,195 | | | | 3,768,709 | | | | 464,321 | | | | 6,391,355 | |
Redeemed | | | (1,539,785 | ) | | | (21,376,606 | ) | | | (7,719,864 | ) | | | (106,340,515 | ) |
| | | | | | | | | | | | | | | | |
Net change | | | 1,994,964 | | | $ | 27,849,746 | | | | 1,426,719 | | | $ | 20,024,977 | |
| | | | | | | | | | | | | | | | |
| Class Y | |
Issued from the sale of shares | | | 10,433,588 | | | $ | 144,445,628 | | | | 85,620,721 | | | $ | 1,132,582,915 | |
Issued in connection with the reinvestment of distributions | | | 3,910,477 | | | | 54,349,355 | | | | 8,028,339 | | | | 110,319,204 | |
Redeemed | | | (28,856,379 | ) | | | (398,330,570 | ) | | | (118,624,705 | ) | | | (1,608,285,687 | ) |
| | | | | | | | | | | | | | | | |
Net change | | | (14,512,314 | ) | | $ | (199,535,587 | ) | | | (24,975,645 | ) | | $ | (365,383,568 | ) |
| | | | | | | | | | | | | | | | |
| Admin Class | |
Issued from the sale of shares | | | 315,634 | | | $ | 4,401,178 | | | | 1,076,312 | | | $ | 15,079,460 | |
Issued in connection with the reinvestment of distributions | | | 136,204 | | | | 1,889,249 | | | | 252,576 | | | | 3,465,330 | |
Redeemed | | | (551,434 | ) | | | (7,568,203 | ) | | | (2,287,176 | ) | | | (30,910,379 | ) |
| | | | | | | | | | | | | | | | |
Net change | | | (99,596 | ) | | $ | (1,277,776 | ) | | | (958,288 | ) | | $ | (12,365,589 | ) |
| | | | | | | | | | | | | | | | |
Decrease from capital share transactions | | | (18,534,056 | ) | | $ | (255,047,276 | ) | | | (56,148,905 | ) | | $ | (797,576,770 | ) |
| | | | | | | | | | | | | | | | |
| (a) | For the period October 1, 2020 through December 31, 2020. |
| | | | | | | | |
| |
| Year Ended
September 30, 2019 |
|
| | | | Shares | | | | Amount | |
| Class A | |
Issued from the sale of shares | | | 27,644,005 | | | $ | 388,066,928 | |
Issued in connection with the reinvestment of distributions | | | 3,733,655 | | | | 52,153,952 | |
Redeemed | | | (40,562,001 | ) | | | (568,498,683 | ) |
| | | | | | | | |
Net change | | | (9,184,341 | ) | | $ | (128,277,803 | ) |
| | | | | | | | |
| Class C | |
Issued from the sale of shares | | | 2,930,132 | | | $ | 41,347,083 | |
Issued in connection with the reinvestment of distributions | | | 1,354,833 | | | | 19,052,625 | |
Redeemed | | | (36,710,107 | ) | | | (519,364,178 | ) |
| | | | | | | | |
Net change | | | (32,425,142 | ) | | $ | (458,964,470 | ) |
| | | | | | | | |
| Class N | |
Issued from the sale of shares | | | 5,710,006 | | | $ | 80,153,591 | |
Issued in connection with the reinvestment of distributions | | | 502,914 | | | | 7,022,689 | |
Redeemed | | | (4,226,437 | ) | | | (59,477,704 | ) |
| | | | | | | | |
Net change | | | 1,986,483 | | | $ | 27,698,576 | |
| | | | | | | | |
| Class Y | |
Issued from the sale of shares | | | 60,558,641 | | | $ | 847,970,819 | |
Issued in connection with the reinvestment of distributions | | | 10,011,095 | | | | 139,677,190 | |
Redeemed | | | (123,342,737 | ) | | | (1,721,792,645 | ) |
| | | | | | | | |
Net change | | | (52,773,001 | ) | | $ | (734,144,636 | ) |
| | | | | | | | |
| Admin Class | |
Issued from the sale of shares | | | 1,029,988 | | | $ | 14,399,151 | |
Issued in connection with the reinvestment of distributions | | | 293,184 | | | | 4,080,471 | |
Redeemed | | | (2,027,234 | ) | | | (28,358,878 | ) |
| | | | | | | | |
Net change | | | (704,062 | ) | | $ | (9,879,256 | ) |
| | | | | | | | |
Decrease from capital share transactions | | | (93,100,063 | ) | | $ | (1,303,567,589 | ) |
| | | | | | | | |
135 |
Report of Independent Registered Public Accounting Firm
To the Board of Trustees of Loomis Sayles Funds II and Natixis Funds Trust II and Shareholders of Loomis Sayles High Income Fund, Loomis Sayles Intermediate Municipal Bond Fund, Loomis Sayles International Growth Fund, Loomis Sayles Investment Grade Bond Fund, Loomis Sayles Strategic Alpha Fund and Loomis Sayles Strategic Income Fund
Opinions on the Financial Statements
We have audited the accompanying statements of assets and liabilities, including the portfolios of investments, of Loomis Sayles High Income Fund, Loomis Sayles International Growth Fund, Loomis Sayles Investment Grade Bond Fund and Loomis Sayles Strategic Income Fund (four of the funds constituting Loomis Sayles Funds II) and Loomis Sayles Intermediate Municipal Bond Fund and Loomis Sayles Strategic Alpha Fund (two of the funds constituting Natixis Funds Trust II) (hereafter collectively referred to as the “Funds”) as of December 31, 2020, the related statements of operations and of changes in net assets for each of the periods indicated in the table below, including the related notes, and the financial highlights for each of the periods indicated therein (collectively referred to as the “financial statements”). In our opinion, the financial statements present fairly, in all material respects, the financial position of each of the Funds as of December 31, 2020, the results of each of their operations and the changes in each of their net assets for the periods indicated in the table below, and each of the financial highlights for each of the periods indicated therein, in conformity with accounting principles generally accepted in the United States of America.
| | | | |
Fund | | Statements of operations | | Statements of changes in net assets |
Loomis Sayles High Income Fund | | For the year ended December 31, 2020 | | For the years ended December 31, 2020 and 2019 |
Loomis Sayles Intermediate Municipal Bond Fund | | For the year ended December 31, 2020 | | For the years ended December 31, 2020 and 2019 |
Loomis Sayles International Growth Fund | | For the period from December 15, 2020 (commencement of operations) through December 31, 2020 | | For the period from December 15, 2020 (commencement of operations) through December 31, 2020 |
Loomis Sayles Investment Grade Bond Fund | | For the year ended December 31, 2020 | | For the years ended December 31, 2020 and 2019 |
Loomis Sayles Strategic Alpha Fund | | For the year ended December 31, 2020 | | For the years ended December 31, 2020 and 2019 |
Loomis Sayles Strategic Income Fund | | For the three month period ended December 31, 2020 and for the year ended September 30, 2020 | | For the three month period ended December 31, 2020 and for the years ended September 30, 2020 and 2019 |
Basis for Opinions
These financial statements are the responsibility of the Funds’ management. Our responsibility is to express an opinion on the Funds’ financial statements based on our audits. We are a public accounting firm registered with the Public Company Accounting Oversight Board (United States) (PCAOB) and are required to be independent with respect to the Funds in accordance with the U.S. federal securities laws and the applicable rules and regulations of the Securities and Exchange Commission and the PCAOB.
We conducted our audits of these financial statements in accordance with the standards of the PCAOB. Those standards require that we plan and perform the audit to obtain reasonable assurance about whether the financial statements are free of material misstatement, whether due to error or fraud.
Our audits included performing procedures to assess the risks of material misstatement of the financial statements, whether due to error or fraud, and performing procedures that respond to those risks. Such procedures included examining, on a test basis, evidence regarding the amounts and disclosures in the financial statements. Our audits also included evaluating the accounting principles used and significant estimates made by management, as well as evaluating the overall presentation of the financial statements. Our procedures included confirmation of securities owned as of December 31, 2020 by correspondence with the custodian, short-term investee manager, agent banks and brokers; when replies were not received from brokers, we performed other auditing procedures. We believe that our audits provide a reasonable basis for our opinions.
/s/PricewaterhouseCoopers LLP
Boston, Massachusetts
February 22, 2021
We have served as the auditor of one or more of the investment companies in the Natixis Investment Company Complex since at least 1995. We have not been able to determine the specific year we began serving as auditor.
| 136
2020 U.S. Tax Distribution Information to Shareholders (Unaudited)
Corporate Dividends Received Deduction. For the fiscal year ended December 31, 2020, a percentage of dividends distributed by the Funds listed below qualify for the dividends received deduction for corporate shareholders. These percentages are as follows:
| | | | |
Fund | | Qualifying
Percentage | |
High Income Fund | | | 0.50 | % |
Investment Grade Bond Fund | | | 0.33 | % |
Strategic Alpha Fund | | | 2.40 | % |
Strategic Income Fund | | | 2.96 | % |
Capital Gains Distributions. Pursuant to Internal Revenue Section 852(b), the following Funds paid distributions, which have been designated as capital gains distributions for the fiscal year ended December 31, 2020.
| | | | |
Fund | | Amount | |
Investment Grade Bond Fund | | $ | 154,088,171 | |
Strategic Income Fund | | | 42,139,359 | |
Qualified Dividend Income. For the fiscal year ended December 31, 2020, the Funds below will designate up to the maximum amount allowable pursuant to the Internal Revenue Code as qualified dividend income eligible for reduced tax rates. These lower rates range from 0% to 20% depending on an individual’s tax bracket. If the Funds pay a distribution during calendar year 2020, complete information will be reported in conjunction with Form 1099-DIV. These percentages are noted below:
| | | | |
Fund | | Qualifying
Percentage | |
High Income Fund | | | 2.49 | % |
International Growth Fund | | | 100.00 | % |
Investment Grade Bond Fund | | | 0.61 | % |
Strategic Alpha Fund | | | 3.49 | % |
Strategic Income Fund | | | 13.69 | % |
137 |
Trustee and Officer Information
The tables below provide certain information regarding the trustees and officers of Natixis Funds Trust II and Loomis Sayles Funds II (the “Trusts”). Unless otherwise indicated, the address of all persons below is 888 Boylston Street, Suite 800, Boston, MA 02199-8197. The Funds’ Statements of Additional Information include additional information about the trustees of the Trusts and are available by calling Natixis Funds at 800-225-5478.
| | | | | | | | |
Name and Year of Birth | | Position(s) Held with the Trusts, Length of Time Served and Term of Office1 | | Principal Occupation(s) During Past 5 Years | | Number of Portfolios in Fund Complex Overseen2 and Other
Directorships Held During Past 5 Years | | Experience,
Qualifications,
Attributes, Skills for Board Membership |
|
| INDEPENDENT TRUSTEES |
| | | | |
Edmond J. English
(1953) | | Trustee since 2013 Chairperson of Governance Committee and Audit Committee Member | | Executive Chairman of Bob’s Discount Furniture (retail) | | 54 Director, Burlington Stores, Inc. (retail) | | Significant experience on the Board and on the boards of other business organizations (including retail companies and a bank); executive experience (including at a retail company) |
| | | | |
Richard A. Goglia
(1951) | | Trustee since 2015 Contract Review Committee Member and Governance Committee Member | | Retired | | 54 Director of Triumph Group (aerospace industry) | | Significant experience on the Board and executive experience (including his role as vice president and treasurer of a defense company and experience at a financial services company) |
| | | | |
Wendell J. Knox
(1948) | | Trustee since 2009 Chairperson of Contract Review Committee | | Retired | | 54 Director of Abt Associates Inc. (research and consulting); Director, The Hanover Insurance Group (property and casualty insurance); formerly, Director, Eastern Bank (bank) | | Significant experience on the Board and on the boards of other business organizations (including at a bank and at a property and casualty insurance firm); executive experience (including roles as president and chief executive officer of a research and consulting company) |
| 138
Trustee and Officer Information
| | | | | | | | |
Name and Year of Birth | | Position(s) Held with the Trusts, Length of Time Served and Term of Office1 | | Principal Occupation(s) During Past 5 Years | | Number of Portfolios in Fund Complex Overseen2 and Other
Directorships Held During Past 5 Years | | Experience,
Qualifications,
Attributes, Skills for Board Membership |
|
| INDEPENDENT TRUSTEES – continued |
| | | | |
Martin T. Meehan
(1956) | | Trustee since 2012 Audit Committee Member | | President, University of Massachusetts | | 54 None | | Significant experience on the Board and on the boards of other business organizations; experience as President of the University of Massachusetts; government experience (including as a member of the U.S. House of Representatives); academic experience |
| | | | |
Maureen B. Mitchell
(1951) | | Trustee since 2017 Contract Review Committee Member and Governance Committee Member | | Retired; formerly President, Global Sales and Marketing, GE Asset Management, Inc. (financial services) | | 54 Director, Sterling Bancorp (bank) | | Experience on the Board; financial services industry and executive experience (including role as president of global sales and marketing at a financial services company) |
| | | | |
James P. Palermo
(1955) | | Trustee since 2016 Contract Review Committee Member | | Founding Partner, Breton Capital Management, LLC (private equity); Partner, STEP Partners, LLC (private equity) | | 54 Director, FutureFuel.io (chemicals and biofuels) | | Experience on the Board; financial services industry and executive experience (including roles as chief executive officer of client management and asset servicing for a banking and financial services company) |
| | | | |
Erik R. Sirri
(1958) | | Chairperson of the Board of Trustees since January 2021 Trustee since 2009 Ex Officio member of Audit Committee, Contract Review Committee and Governance Committee | | Professor of Finance at Babson College | | 54 None | | Significant experience on the Board; experience as Director of the Division of Trading and Markets at the Securities and Exchange Commission; academic experience; training as an economist |
139 |
Trustee and Officer Information
| | | | | | | | |
Name and Year of Birth | | Position(s) Held with the Trusts, Length of Time Served and Term of Office1 | | Principal Occupation(s) During Past 5 Years | | Number of Portfolios in Fund Complex Overseen2 and Other
Directorships Held During Past 5 Years | | Experience,
Qualifications,
Attributes, Skills for Board Membership |
|
| INDEPENDENT TRUSTEES – continued |
| | | | |
Peter J. Smail
(1952) | | Trustee since 2009 Audit Committee Member and Governance Committee Member | | Retired | | 54 None | | Significant experience on the Board; mutual fund industry and executive experience (including roles as president and chief executive officer for an investment adviser) |
| | | | |
Kirk A. Sykes
(1958) | | Trustee since 2019 Contract Review Committee Member | | Managing Director of Accordia Partners, LLC (real estate development); President of Primary Corporation (real estate development); Managing Principal of Merrick Capital Partners (infrastructure finance); formerly, President of Urban Strategy America Fund (real estate fund manager) | | 54 Trustee, Eastern Bank (bank); Director of Apartment Investment and Management Company (real estate investment trust); formerly Director, Ares Commercial Real Estate Corporation (real estate investment trust) | | Experience on the Board and significant experience on the boards of other business organizations (including real estate companies and banks) |
| | | | |
Cynthia L. Walker
(1956) | | Trustee since 2005 Chairperson of the Audit Committee and Governance Committee Member | | Retired; formerly, Deputy Dean for Finance and Administration, Yale University School of Medicine | | 54 None | | Significant experience on the Board; executive experience in a variety of academic organizations (including roles as dean for finance and administration) |
|
| INTERESTED TRUSTEES |
| | | | |
Kevin P. Charleston3
(1965) One Financial Center Boston, MA 02111 | | Trustee since 2015 | | President, Chief Executive Officer and Chairman of the Board of Directors, Loomis, Sayles & Company, L.P. | | 54 None | | Significant experience on the Board; continuing service as President, Chief Executive Officer and Chairman of the Board of Directors of Loomis, Sayles & Company, L.P. |
| 140
Trustee and Officer Information
| | | | | | | | |
Name and Year of Birth | | Position(s) Held with the Trusts, Length of Time Served and Term of Office1 | | Principal Occupation(s) During Past 5 Years | | Number of Portfolios in Fund Complex Overseen2 and Other
Directorships Held During Past 5 Years | | Experience,
Qualifications,
Attributes, Skills for Board Membership |
|
| INTERESTED TRUSTEES – continued |
| | | | |
David L. Giunta4
(1965) | | Trustee since 2011 President and Chief Executive Officer of Natixis Funds Trust II and President of Loomis Sayles Funds II since 2008; Chief Executive Officer of Loomis Sayles Funds II since 2015 | | President and Chief Executive Officer, Natixis Advisors, L.P., Natixis Distribution, L.P., Natixis Distribution Corporation and Chairman of the Board of Natixis Distribution Corporation | | 54 None | | Significant experience on the Board; experience as President and Chief Executive Officer of Natixis Advisors, L.P., Natixis Distribution, L.P., Natixis Distribution Corporation and Chairman of the Board of Natixis Distribution Corporation |
| 1 | Each trustee serves until retirement, resignation or removal from the Board. The current retirement age is 75. The position of Chairperson of the Board is appointed for a three-year term. |
| 2 | The trustees of the Trusts serve as trustees of a fund complex that includes all series of the Natixis Funds Trust I, Natixis Funds Trust II, Natixis Funds Trust IV, Gateway Trust, Loomis Sayles Funds I, Loomis Sayles Funds II, Natixis ETF Trust and Natixis ETF Trust II (collectively, the “Fund Complex”). |
| 3 | Mr. Charleston is deemed an “interested person” of the Trusts because he holds the following positions with an affiliated person of the Trusts: President, Chief Executive Officer and Chairman of the Board of Directors of Loomis, Sayles & Company, L.P. |
| 4 | Mr. Giunta is deemed an “interested person” of the Trusts because he holds the following positions with an affiliated person of the Trusts: President and Chief Executive Officer, Natixis Advisors, L.P., Natixis Distribution, L.P., Natixis Distribution Corporation and Chairman of the Board of Natixis Distribution Corporation. |
141 |
Trustee and Officer Information
| | | | | | |
Name and Year of Birth | | Position(s) Held with the Trusts | | Term of Office1 and Length of Time Served | | Principal Occupation(s) During Past 5 Years2 |
|
| OFFICERS OF THE TRUSTS |
| | | |
Russell L. Kane
(1969) | | Secretary, Clerk and Chief Legal Officer Chief Compliance Officer and Anti-Money Laundering Officer | | Since 2016 Since 2020 | | Executive Vice President, General Counsel, Secretary and Clerk, Natixis Distribution Corporation, Natixis Advisors, L.P. and Natixis Distribution, L.P.; formerly, Chief Compliance Officer for Mutual Funds, Senior Vice President, Deputy General Counsel, Assistant Secretary and Assistant Clerk, Natixis Distribution Corporation, Natixis Advisors, L.P. and Natixis Distribution, L.P. |
| | | |
Michael C. Kardok
(1959) | | Treasurer, Principal Financial and Accounting Officer | | Since 2004 | | Senior Vice President, Natixis Advisors, L.P. and Natixis Distribution, L.P. |
| 1 | Each officer of the Trusts serves for an indefinite term in accordance with the Trusts’ current by-laws until the date his or her successor is elected and qualified, or until he or she sooner dies, retires, is removed or becomes disqualified. |
| 2 | Each person listed above, except as noted, holds the same position(s) with the Fund Complex. Previous positions during the past five years with Natixis Distribution, L.P., Natixis Advisors, L.P. or Loomis, Sayles & Company, L.P. are omitted, if not materially different from an officer’s current position with such entity. |
| 142
Item 2. Code of Ethics.
The Registrant has adopted a code of ethics that applies to the Registrant’s principal executive officer, principal financial officer and persons performing similar functions. There have been no amendments or waivers of the Registrant’s code of ethics during the period.
Item 3. Audit Committee Financial Expert.
The Board of Trustees of the Registrant has established an audit committee. Mr. Edmond J. English, Mr. Martin T. Meehan, Mr. Peter J. Smail and Ms. Cynthia L. Walker are members of the audit committee and have been designated as “audit committee financial experts” by the Board of Trustees. Each of these individuals is also an Independent Trustee of the Registrant.
Item 4. Principal Accountant Fees and Services.
Fees billed by the Principal Accountant for services rendered to the Registrant.
The table below sets forth fees billed by the principal accountant, PricewaterhouseCoopers LLP, for the past two fiscal years for professional services rendered in connection with a) the audit of the Registrant’s annual financial statements and services provided in connection with regulatory filings; b) audit-related services (including services that are reasonably related to the performance of the audit of the Registrant’s financial statements and but not reported under “Audit Fees”); c) tax compliance, tax advice and tax planning and d) all other fees billed for professional services rendered by the principal accountant to the Registrant, other than the services reported as a part of (a) through (c) of this Item.
| | | | | | | | | | | | | | | | | | | | | | | | | | | | | | | | |
| | | Audit fees | | | Audit-related fees1 | | | Tax fees2 | | | All other fees | |
| | | 1/1/19-
12/31/19 | | | 1/1/20-
12/31/20 | | | 1/1/19-
12/31/19 | | | 1/1/20-
12/31/20 | | | 1/1/19-
12/31/19 | | | 1/1/20-
12/31/20 | | | 1/1/19-
12/31/19 | | | 1/1/20-
12/31/20 | |
| Loomis Sayles High Income Fund, Loomis Sayles International Growth Fund*, Loomis Sayles Investment Grade Bond Fund and Loomis Sayles Strategic Income Fund** | | $ | 97,986 | | | $ | 166,218 | | | $ | 1,025 | | | $ | 1,052 | | | $ | 16,208 | | | $ | 22,449 | | | $ | — | | | $ | — | |
| * | Effective December 15, 2020 |
| ** | Due to a change in the fiscal year end from 9/30 to 12/31, amounts reported for Loomis Sayles Strategic Income Fund are for the period 10/1/20-12/31/20 |
| | 1. | Audit-related fees consist of: |
2019 &2020 – performance of agreed-upon procedures related to the Registrant’s deferred compensation plan.
2019 & 2020 – Review of Registrant’s tax returns.
Aggregate fees billed to the Registrant for non-audit services during 2019 and 2020 were $17,233 and $23,501, respectively.
Fees billed by the Principal Accountant for services rendered to the Adviser and Control Affiliates.
The following table sets forth the fees billed by the Registrant’s principal accountant for non-audit services rendered to Loomis, Sayles & Company, L.P. (“Loomis Sayles”) and entities controlling, controlled by or under common control with Loomis Sayles (“Control Affiliates”) that provide ongoing services to the Registrant, for engagements that related directly to the operations and financial reporting of the Registrant for the last two fiscal years.
| | | | | | | | | | | | | | | | | | | | | | | | |
| | | 10/1/19-
12/31/19 | | | 1/1/20-
12/31/20 | | | 10/1/19-
12/31/19 | | | 1/1/20-
12/31/20 | | | 10/1/19-
12/31/19 | | | 1/1/20-
12/31/20 | |
Control Affiliates | | $ | — | | | $ | — | | | $ | — | | | $ | — | | | $ | — | | | $ | — | |
The following table sets forth the aggregate fees billed by the Registrant’s principal accountant for non-audit services rendered to Loomis Sayles and Control Affiliates that provide ongoing services to the Registrant, for the last two fiscal years, including the fees disclosed in the table above.
| | | | | | | | |
| | | 1/1/19-12/31/19 | | | 1/1/20-12/31/20 | |
Control Affiliates | | $ | 27,252 | | | $ | 1,646 | |
None of the services described above were approved pursuant to paragraph (c)(7)(i)(C) of Regulation S-X.
Audit Committee Pre Approval Policies.
Annually, the Registrant’s Audit Committee reviews the audit, audit-related, tax and other non-audit services together with the projected fees, for services proposed to be rendered to the Registrant and/or other entities for which pre-approval is required during the upcoming year. Any subsequent revisions to already pre-approved services or fees (including fee increases) and requests for pre-approval of new services would be presented for consideration quarterly as needed.
If, in the opinion of management, a proposed engagement by the Registrant’s independent accountants needs to commence before the next regularly scheduled Audit Committee meeting, any member of the Audit Committee who is an independent Board member is authorized to pre-approve the engagement, but only for engagements to provide audit, audit-related and tax services. This approval is subject to review by the full Audit Committee at its next quarterly meeting. All other engagements require the approval of all the members of the Audit Committee.
Item 5. Audit Committee of Listed Registrants.
Not applicable.
Item 6. Schedule of Investments.
Included as part of the Report to Shareholders filed as Item 1 herewith.
Item 7. Disclosure of Proxy Voting Policies and Procedures for Closed-End Management Investment Companies.
Not applicable.
Item 8. Portfolio Managers of Closed-End Management Investment Companies
Not applicable.
Item 9. Purchases of Equity Securities by Closed-End Management Investment Companies and Affiliated Purchasers.
Not applicable.
Item 10. Submission of Matters to a Vote of Securities Holders.
There were no material changes to the procedures by which shareholders may recommend nominees to the Registrant’s Board of Trustees.
Item 11. Controls and Procedures.
The Registrant’s principal executive officer and principal financial officer have concluded that the Registrant’s disclosure controls and procedures are sufficient to ensure that information required to be disclosed by the Registrant in this Form N-CSR was recorded, processed, summarized and reported within the time periods specified in the Securities and Exchange Commission’s rules and forms, based upon such officers’ evaluation of these controls and procedures as of a date within 90 days of the filing date of the report.
There were no changes in the Registrant’s internal control over financial reporting that occurred during the Registrant’s last fiscal quarter of the period covered by the report that has materially affected, or is reasonably likely to materially affect, the Registrant’s internal control over financial reporting.
Item 12. Disclosure of Securities Lending Activities for Closed-End Management Investment Companies.
Not applicable.
Item 13. Exhibits.
SIGNATURES
Pursuant to the requirements of the Securities Exchange Act of 1934 and the Investment Company Act of 1940, the Registrant has duly caused this report to be signed on its behalf by the undersigned, thereunto duly authorized.
| | |
| Loomis Sayles Funds II |
| |
| By: | | /s/ David L. Giunta |
| Name: | | David L. Giunta |
| Title: | | President and Chief Executive Officer |
| |
| Date: | | February 22, 2021 |
Pursuant to the requirements of the Securities Exchange Act of 1934 and the Investment Company Act of 1940, this report has been signed by the following persons on behalf of the Registrant and in the capacities and on the dates indicated.
| | |
| By: | | /s/ David L. Giunta |
| Name: | | David L. Giunta |
| Title: | | President and Chief Executive Officer |
| |
| Date: | | February 22, 2021 |
| |
| By: | | /s/ Michael C. Kardok |
| Name: | | Michael C. Kardok |
| Title: | | Treasurer and Principal Financial and Accounting Officer |
| |
| Date: | | February 22, 2021 |